Embed Size (px)
Citation preview
Electrochemical Investigation of the Role of Cl− on
Localized CO2 Corrosion of Mild Steel Xiu Jiang and Srdjan Nešić
Institute for Corrosion and Multiphase Technology, Department of Chemical and Biomolecular Engineering
Ohio University 342 West State Street, Athens, Ohio 45701
ABSTRACT
Electrochemical investigation of localized CO2 corrosion of X-65 mild steel in 0.1, 1.0, 10 and 20 wt% NaCl solutions at 80oC has been conducted using linear polarization resistance (LPR) and electrochemical noise (ECN) techniques. Current noise and potential noise between two nominally identical electrodes were simultaneously recorded using a ZRA (zero resistance ammeter). Chemical dissolution of corrosion product layer was accomplished by adjusting pH and saturation values with respect to FeCO3. Surface and cross-section morphologies were observed by scanning electron microscopy (SEM) and infinite focus microscopy (IFM) for 3D optical analysis. The results showed that increasing Cl− concentration had a marginal effect on the general corrosion rate, and did not accelerate the initiation of localized corrosion. Partial chemical dissolution of the corrosion product film can be related to the initiation of localized corrosion, but the localized corrosion rate did not change with increasing NaCl concentrations. It was demonstrated that the use of ECN is possible for monitoring localized corrosion for carbon steel in CO2 corrosion environments. The transients related to metastable pitting were best observed on small coupons (1 cm2).
Keywords: localized CO2 corrosion, mild steel, electrochemical noise, NaCl concentration, chemical
removal, initiation
1
Paper No.
2414
INTRODUCTION
Mild steel is used as the preferred pipeline and process equipment material in the oil and gas
extraction, production and transportation industries. However, it is not inherently resistant to internal corrosion in carbon dioxide (CO2)-containing environments1. CO2 corrosion rate can be reduced significantly when iron carbonate (FeCO3) precipitates on the surface of the steel. Precipitation will occur according to the reaction (1) when the concentrations of ferrous (Fe2+) and carbonate (CO3
2−) ions exceed the solubility limit (Ksp) which is a function of temperature and ionic strength.
Fe2+ (aq.) + CO3
2– (aq.) ↔ FeCO3 (s.) (1) Depending on the environmental conditions, CO2 corrosion of mild steel may cause general corrosion or localized corrosion, the latter in the form of pitting corrosion, mesa attack, crevice corrosion, stress corrosion cracking, etc. Localized corrosion, rather than general corrosion, is the principle cause for failure of oil and gas production and transportation equipment. Pitting corrosion has been commonly considered to have three main stages, namely: initiation, propagation and possibly repassivation. The mechanism of localized CO2 corrosion propagation is now reasonably well understood 2, and the mechanism of initiation is the subject of the present study. Any damage to the corrosion product layer by, for example, mechanical or chemical means, or their combination, may be followed by accelerated general corrosion attack3. However, it is unclear whether the damage to the corrosion product layer may initiate the localized corrosion. In addition, the effect of other risk factors, such as chloride, has not been thoroughly investigated.
Most work on CO2 corrosion has been performed at low salt concentrations, typically less than 3 wt % NaCl solutions. It has been reported that localized corrosion was accelerated by chloride ions at low chloride concentration4-5. High chloride concentrations are often present in water recovered from oil and gas wells. However, much less work was carried out at high salt concentrations, the focus of the work being the study of uniform CO2 corrosion6. Following general corrosion theory, Cl– ions are widely thought to be an aggressive “pitting agent” in aqueous solutions7. Localized corrosion in seawater is usually related to the high concentrations of chloride, but the role of chloride ions in the localized CO2 corrosion process, especially during the initiation process, is unclear. This was one of the main focus areas in the present research project.
Detection of initiation and measurement of propagation rate of localized corrosion in-situ is a formidable challenge. In this respect, the random fluctuations of the current (potential) observed under potentiostatic or galvanostatic control, often called electrochemical noise (ECN), have received considerable attention, especially in the corrosion engineering field, since the early work of Iverson8 and Tyagai.9due to the lack of any perturbation and simplicity inherent to this technique. ECN can be used to distinguish, possibly even in real-time, between uniform corrosion and localized corrosion, and perhaps also between various kinds of localized corrosion according to the shape and amplitude of the current fluctuations. In addition, it can provide detailed information about the initiation and propagation of localized corrosion10,11. However, the traditional electrochemical techniques, such as linear polarization resistance (LPR), electrochemical impedance spectroscopy (EIS), etc., cannot provide such information. The suitability of ECN for detection of localized CO2 corrosion initiation was the main focus of the present paper.
There are many factors that influence the quality of results obtained form ECN, and the size of the corroding surface specimen is one of them. The exact effect of surface area on the electrochemical
2
noise will depend on the nature of the corrosion process that is generating the noise. For general corrosion, there are a large number of corrosion events of low amplitude across the whole electrode surface area. The current noise power is proportional to the specimen area, while the potential power is inversely proportional to the specimen area. Thus, large electrodes are preferable for measuring ECN and small electrodes are preferable for measuring electrochemical potential noise for general corrosion. However, it is unclear if this conclusion can be used in localized CO2 corrosion. In addition, there is another constraint: when simulating localized corrosion of large structures, such as pipelines, by using small coupons, the occurrence of localized corrosion may be much less probable on the small coupon. Therefore, part of the work presented below focuses on this question: how does the corroding surface area affects the localized corrosion process and the electrochemical noise signal in CO2 corrosion?
EXPERIMENTAL Experimental setup
The glass cell set-up is shown in Figure 1. It contained 2 L of electrolyte, which consisted of distilled water and 0.1, 1.0, 10 and 20 wt% NaCl in different experiments. The temperature was always held at 80oC in these experiments. Prior to an experiment the solution was deaerated by bubbling CO2 gas for 1 h, and this was then continued throughout the experiment. The total pressure in the glass cell was held at 1 bar. The pH was monitored continuously with an electrode immersed in the electrolyte and adjusted frequently. In conjunction with the study of the build-up of corrosion products, the ferrous ion (Fe2+) concentration was measured twice daily by sampling of the solution and using a spectrophotometric method. When required (supersaturation with respect to FeCO3 of lower than 0.5 or higher than 2), a pump was used to circulate the solution between a sodium-based ion exchange resin in the resin hold and the glass cell. The aim was to prevent uncontrolled buildup of corrosion products in long experiments.
Five rectangular coupons (2.0×0.9×0.4 inch) and a cylinder cylindrical coupon of X-65 mild steel specimens, chemical composition given in Table 1, were inserted into the same glass cell in each experiment. Two rectangular coupons were used for electrochemical noise (ECN) measurement, the remaining three were used for scanning electron microscope (SEM) and infinite focus microscope (IFM) characterization. The cylindrical coupon was used for the LPR measurements. Prior to immersion, all the specimens were polished with 240, 400 and 600 grit SiC paper, and then rinsed with isopropyl alcohol. In order to prevent crevice corrosion, the coupons used for electrochemical noise measurement were coated with a layer of Teflon paint and then embedded in epoxy resin, leaving an area of 11.6 cm2 exposed to solution prior to measurements.
Two distinct sets of experiments were carried out for this paper. In the first set, the desired pH of 6.0 was initially obtained by addition of aqueous sodium hydrogen carbonate. Test duration was from 13 days to 27 days. The main aim was to study the role of Cl− ions in the initiation of localized corrosion. The second set of experiments involved three separate experimental steps, each is described as follows:
Step 1: Formation of a corrosion product layer. At the start of each experiment, deoxygenated aqueous sodium hydrogen carbonate was added to adjust the pH to 6.3. A supersaturation (SS) of 200, with respect to iron carbonate, was set by injection of a deoxygenated ferrous chloride solution. The steel coupons were inserted and the conditions were maintained for approximately 3.5 days, during which the supersaturation of the solution decreased as the precipitation and deposition of iron carbonate proceeded. This lead to a significant reduction of the corrosion rate of the steel coupons.
3
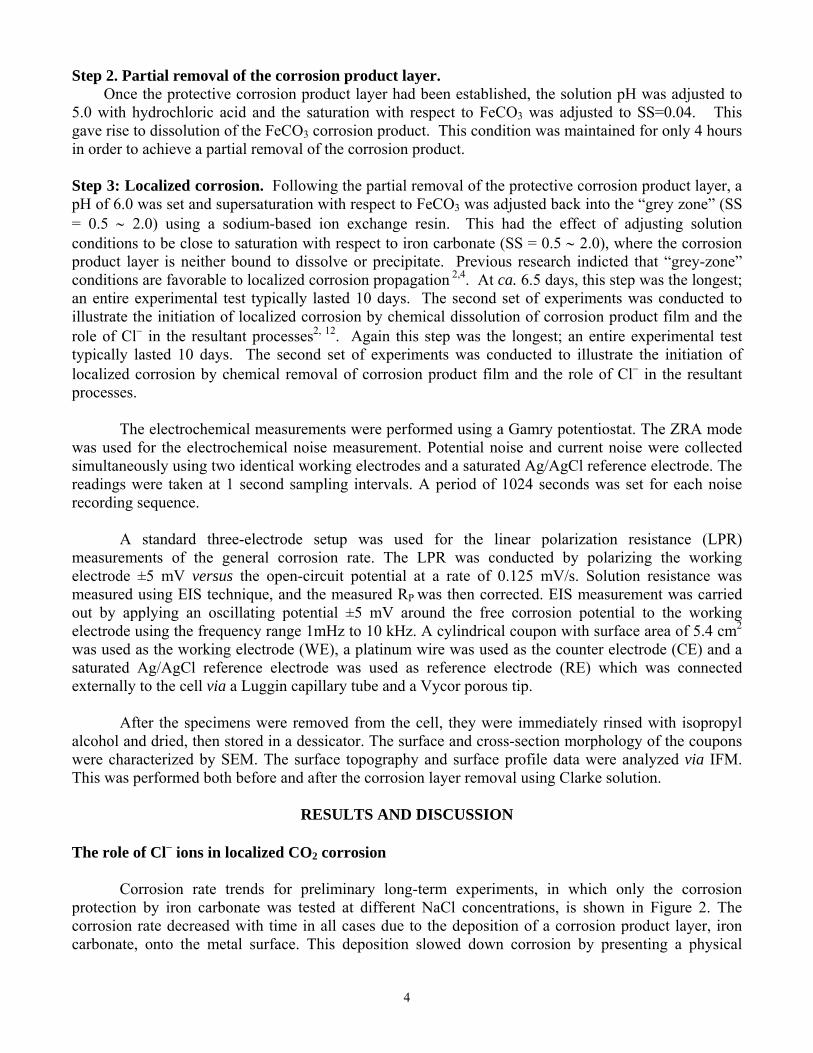
Step 2. Partial removal of the corrosion product layer. Once the protective corrosion product layer had been established, the solution pH was adjusted to 5.0 with hydrochloric acid and the saturation with respect to FeCO3 was adjusted to SS=0.04. This gave rise to dissolution of the FeCO3 corrosion product. This condition was maintained for only 4 hours in order to achieve a partial removal of the corrosion product. Step 3: Localized corrosion. Following the partial removal of the protective corrosion product layer, a pH of 6.0 was set and supersaturation with respect to FeCO3 was adjusted back into the “grey zone” (SS = 0.5 ∼ 2.0) using a sodium-based ion exchange resin. This had the effect of adjusting solution conditions to be close to saturation with respect to iron carbonate (SS = 0.5 ∼ 2.0), where the corrosion product layer is neither bound to dissolve or precipitate. Previous research indicted that “grey-zone” conditions are favorable to localized corrosion propagation 2,4. At ca. 6.5 days, this step was the longest; an entire experimental test typically lasted 10 days. The second set of experiments was conducted to illustrate the initiation of localized corrosion by chemical dissolution of corrosion product film and the role of Cl− in the resultant processes2, 12. Again this step was the longest; an entire experimental test typically lasted 10 days. The second set of experiments was conducted to illustrate the initiation of localized corrosion by chemical removal of corrosion product film and the role of Cl− in the resultant processes.
The electrochemical measurements were performed using a Gamry potentiostat. The ZRA mode was used for the electrochemical noise measurement. Potential noise and current noise were collected simultaneously using two identical working electrodes and a saturated Ag/AgCl reference electrode. The readings were taken at 1 second sampling intervals. A period of 1024 seconds was set for each noise recording sequence.
A standard three-electrode setup was used for the linear polarization resistance (LPR) measurements of the general corrosion rate. The LPR was conducted by polarizing the working electrode ±5 mV versus the open-circuit potential at a rate of 0.125 mV/s. Solution resistance was measured using EIS technique, and the measured RP was then corrected. EIS measurement was carried out by applying an oscillating potential ±5 mV around the free corrosion potential to the working electrode using the frequency range 1mHz to 10 kHz. A cylindrical coupon with surface area of 5.4 cm2 was used as the working electrode (WE), a platinum wire was used as the counter electrode (CE) and a saturated Ag/AgCl reference electrode was used as reference electrode (RE) which was connected externally to the cell via a Luggin capillary tube and a Vycor porous tip.
After the specimens were removed from the cell, they were immediately rinsed with isopropyl alcohol and dried, then stored in a dessicator. The surface and cross-section morphology of the coupons were characterized by SEM. The surface topography and surface profile data were analyzed via IFM. This was performed both before and after the corrosion layer removal using Clarke solution.
RESULTS AND DISCUSSION The role of Cl− ions in localized CO2 corrosion
Corrosion rate trends for preliminary long-term experiments, in which only the corrosion protection by iron carbonate was tested at different NaCl concentrations, is shown in Figure 2. The corrosion rate decreased with time in all cases due to the deposition of a corrosion product layer, iron carbonate, onto the metal surface. This deposition slowed down corrosion by presenting a physical
4
diffusion barrier for the species involved in the corrosion process. Work performed by Cheng et al. 11 suggested that the role of chloride ions was to increase the chance of corrosion product layer breakdown. If that was the case for the present system, the breakdown of corrosion product layer would be more likely to occur at high salt concentrations and for longer immersion time. Therefore, a 27 days immersion was used for 10 and 20 wt. % NaCl experiments. The final corrosion rates were around or below 0.1 mm/y in all cases, which is generally considered as acceptable. Therefore, it was concluded that increasing Cl− concentration had no significant effect on general CO2 corrosion rate under the conditions where protective iron carbonate layers form. This is different from the conclusions reached in Fang’s research6, where uniform corrosion rates were reported to decrease with increased NaCl concentrations, because the latter experiments were done under the conditions where protective iron carbonate layers are absent. To inspect for localized corrosion in the present work, the surface and cross-section morphology of the steel after 13 days and 27 days at different NaCl concentrations are shown in Figure 3 and Figure 4, respectively. No localized corrosion was observed on any of them. Actually, a denser corrosion product layer was formed in 10 and 20 wt. % NaCl solutions than in a 0.1 wt. % NaCl solution (see images in Figure 3 and Figure 4). This suggests that the high concentration of chloride ions did not cause or accelerate the breakdown of the iron carbonate layer as previously suspected. Therefore, it seems that is not possible to initiate localized corrosion of mild steel in CO2 environments solely by having an elevated chloride ion concentration.
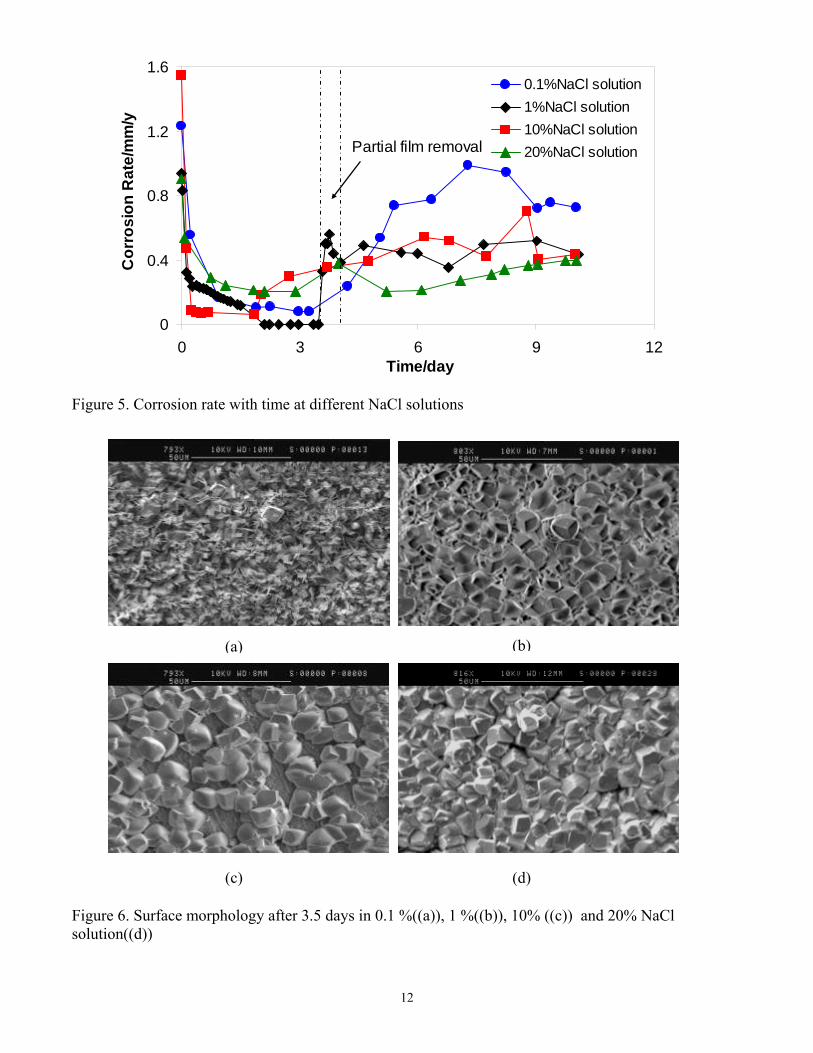
For the three-step experiments, the general corrosion rate change with time for different NaCl electrolytes is presented in Figure 5. The corrosion rate decreased with time over the first 3.5 days due to formation of protective iron carbonate. A dense corrosion product layer can be observed after 3.5 days in the SEM shown in Figure 6. Following a brief period of iron carbonate dissolution, after 3.5 days, the corrosion rate gradually increased (see Figure 5). Failure points in the carbonate layer can be seen observed in the IFM images, see
Figure 7 for the studied NaCl concentrations. This showed that the corrosion product layer was only partially removed, as was planned in order to initiate localized corrosion. Localized corrosion was confirmed in the IFM images, when the corrosion product layer was removed after a 10-day exposure, (see Figure 8). Pitting was observed across the whole range of NaCl concentrations. Maximum localized corrosion penetration rate could be calculated from the maximum pit depth detected in the IFM images. A comparison of the general corrosion rate and maximum localized corrosion rate averaged over a 10 day exposure for different NaCl solutions is presented in Figure 9. In all cases, the final general corrosion rate is around 0.5mm/y and in all cases the maximum time-averaged localized corrosion rate is around 2mm/y. Neither of them changed with increasing NaCl concentrations. One can therefore conclude that NaCl did not affect either the general corrosion rate magnitude and trend or the morphology and magnitude of localized attack. The use of electrochemical noise in the monitoring of localized CO2 corrosion
Detailed analysis for the use of electrochemical noise in localized CO2 corrosion is presented only for the experiments with 1% NaCl concentration in solution. As similar results were obtained for the other two concentrations, only a summary is presented below.
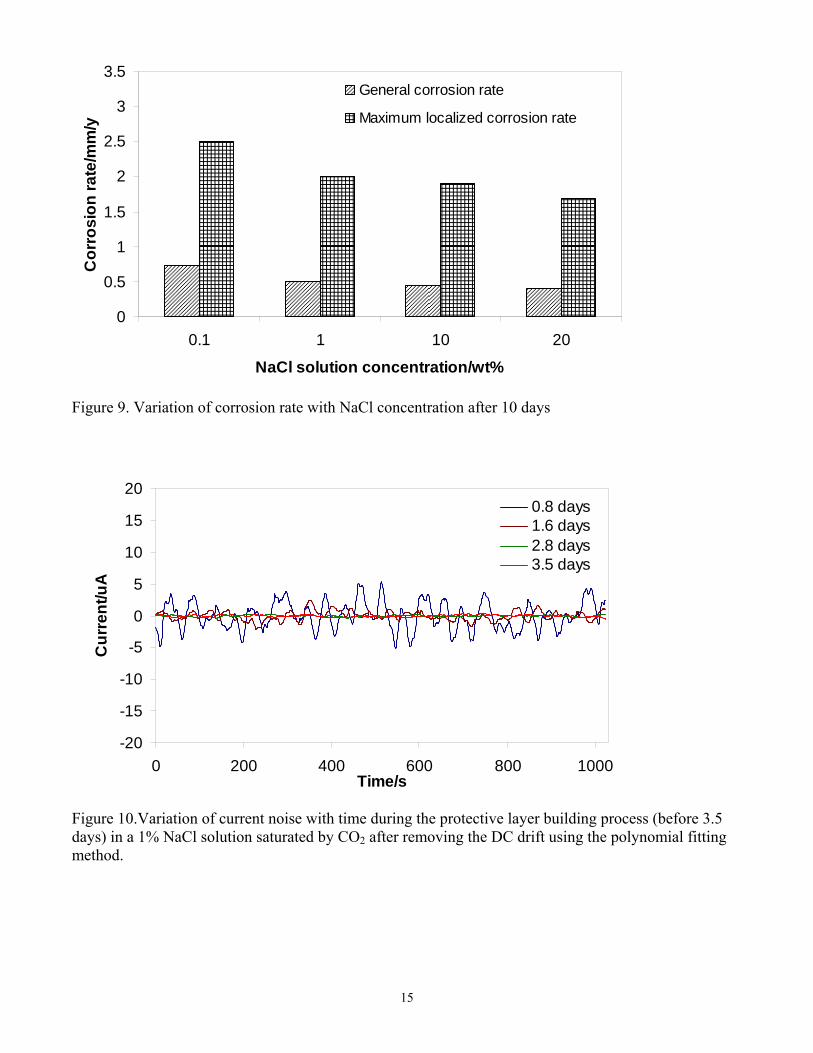
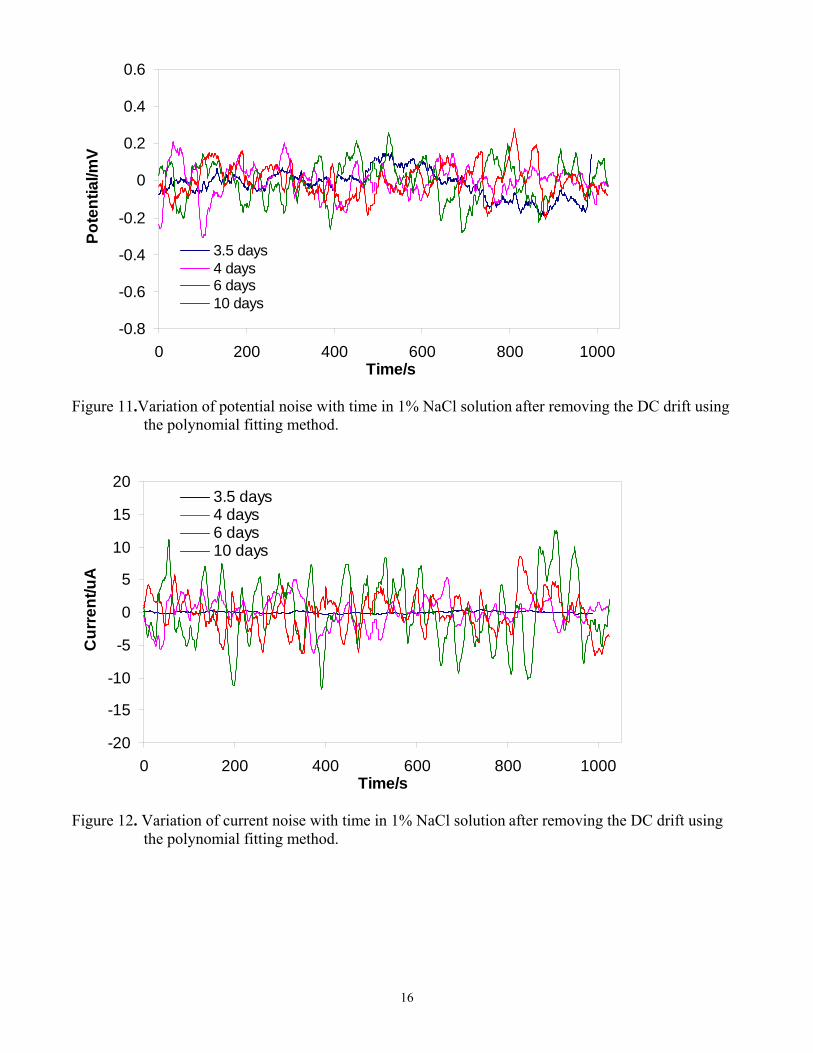
The variation of current noise with time during the film formation period (before 3.5 days) is shown in Figure 10. The current decreased with time because of the build-up of a corrosion product layer. The evolution of the potential and current noise with time is shown in Figure 11 and Figure 12, respectively. The amplitude of both potential noise and current noise increased with time. Higher levels of electrochemical corrosion activity are generally associated with higher noise levels. Current noise is usually considered to be produced by a large number of independent current “sources” or corrosion
5
“events” on the steel surface. The variance of current noise increased because the rate of the corrosion process increased as shown in Figure 5 and as the corrosion became more localized, as shown in Figure 6-Figure 8. The potential noise accompanies the current noise at the metal-solution surface impedance. Therefore, the amplitude of both potential noise and current noise increased with time. The localized corrosion is associated with larger electrochemical events; for example the amplitude was about ±12 µA during the localized corrosion period (after 9 days and 10 days exposure, see Figure 12). This was larger than the ±5 µA seen during uniform corrosion (before 3.5 days, see Figure 10). However, a typical metastable pitting transient, which consisted of a rapid current rise followed by a slow decay for carbon steel 13, was not observed in Figure 12. This was probably related to the large coupon surface area (11.6 cm2) used in our experiments. A smaller coupon surface was usually used to record electrochemical noise signals in other related studies11, 14. On large steel surfaces, many localized corrosion events can occur almost simultaneously, so that the signals from individual events overlap, and the current noise recorded was the integrated signal from all these events. To test this hypothesis, smaller surface area coupons were also used and the results are reported in the section below.
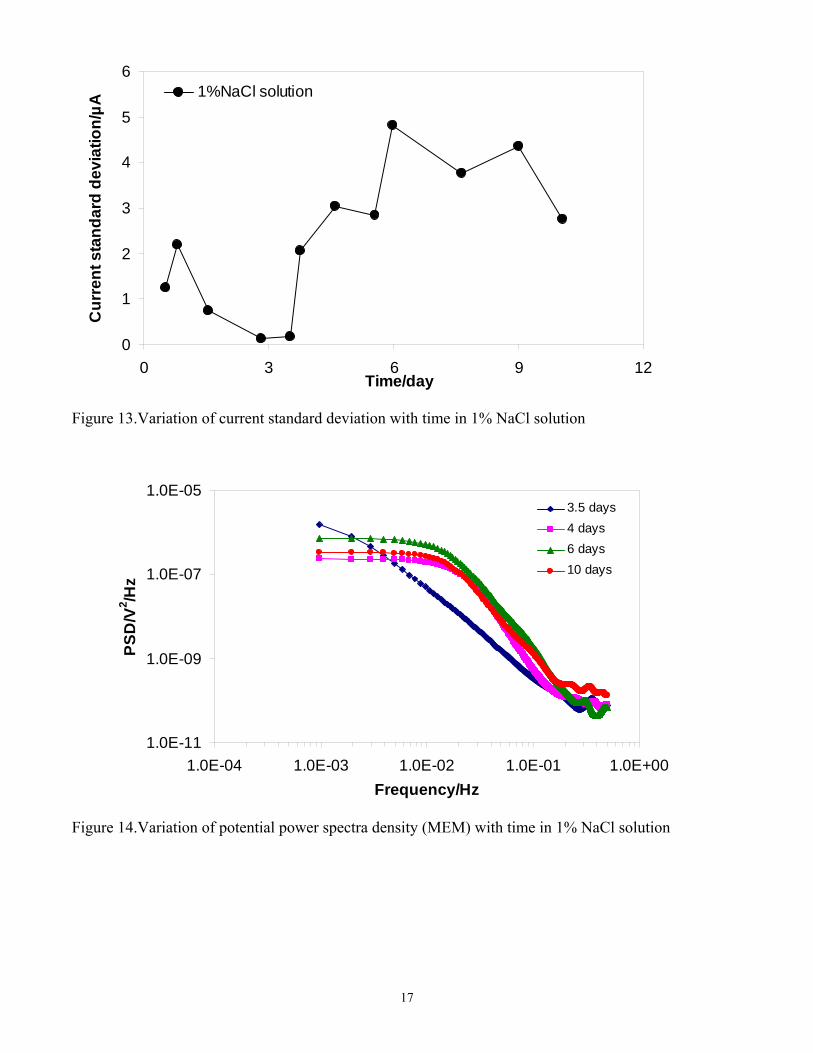
Statistical parameters are widely used in ECN analysis. In particular, the standard deviation of the potential and the standard deviation of the current are the most straightforward parameters used to describe the change in “amplitude” of a noisy signal. Current standard deviation change with time is shown in Figure 13. The current standard deviation decreased with time during the protective layer building process (before 3.5 days). However, the current standard deviation increased with time after the corrosion product layer was partially removed, indicating a higher electrochemical activity. However, LPR results shown in Figure 5 showed that the general corrosion rate did not appreciably increase (only to about 0.5 mm/y in this period). Therefore, the increased standard deviation was probably related to high localized corrosion activity.
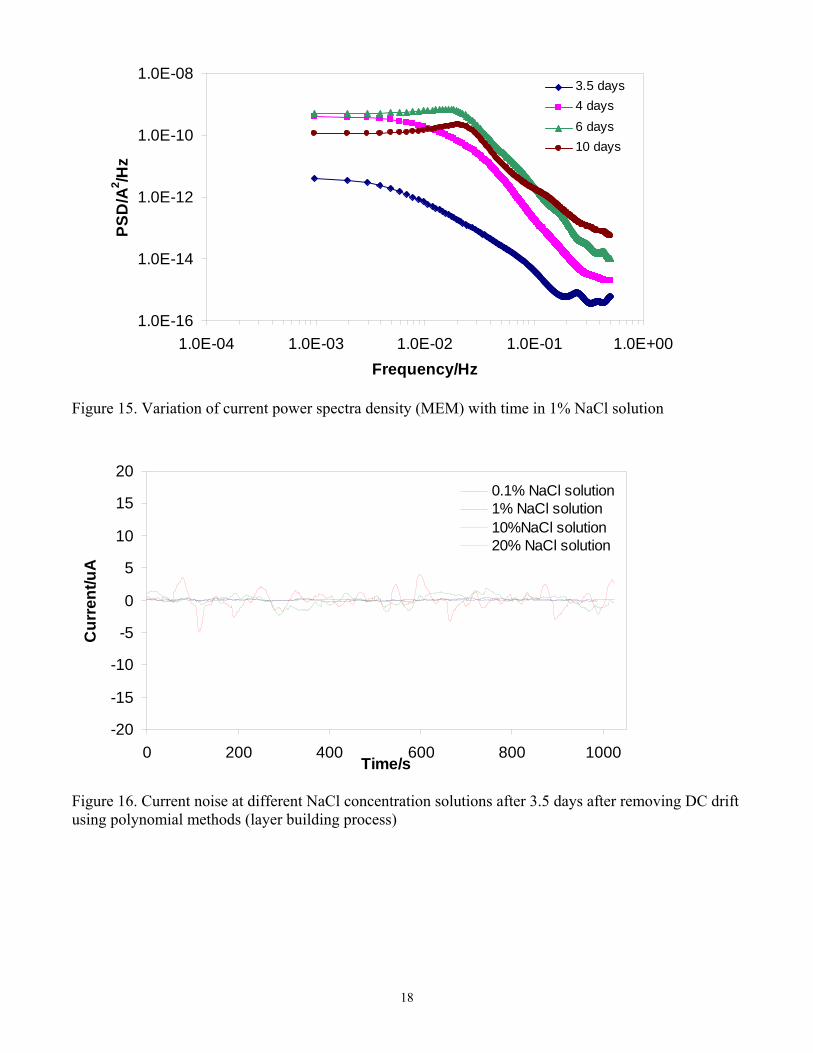
Analysis of the frequency content of electrochemical noise signals is very important for corroding systems in order to establish the validity of the measurements (particularly because a noisy signal can arise for many other reasons, such as instrument noise, environmental noise, etc 13). One simple way to do this is to look at the Power Spectrum Density (PSD) function of the signal. PSD is a variance density function that expresses how the signal power is distributed across the frequency domain. There are many methods for power spectrum estimation, but in the corrosion field the most common are the Fast Fourier Transfer (FFT) and Maximum Entropy Method (MEM). MEM spectrum was used to calculate PSD in this work. The variation of potential and current power spectra density (PSD) is shown in Figure 14 and Figure 15, respectively, for the experiment with 1% NaCl in solution. The current PSD can be distinguished for the protective layer building period (at 3.5 days), layer partial removal period (at 4 days) and the localized corrosion period (6-10 days). The increase of the level of the current PSD with time reflects the increase of the average power in the individual transients which is multiplied by the transient numbers, overall indicating a higher level of electrochemical activity.
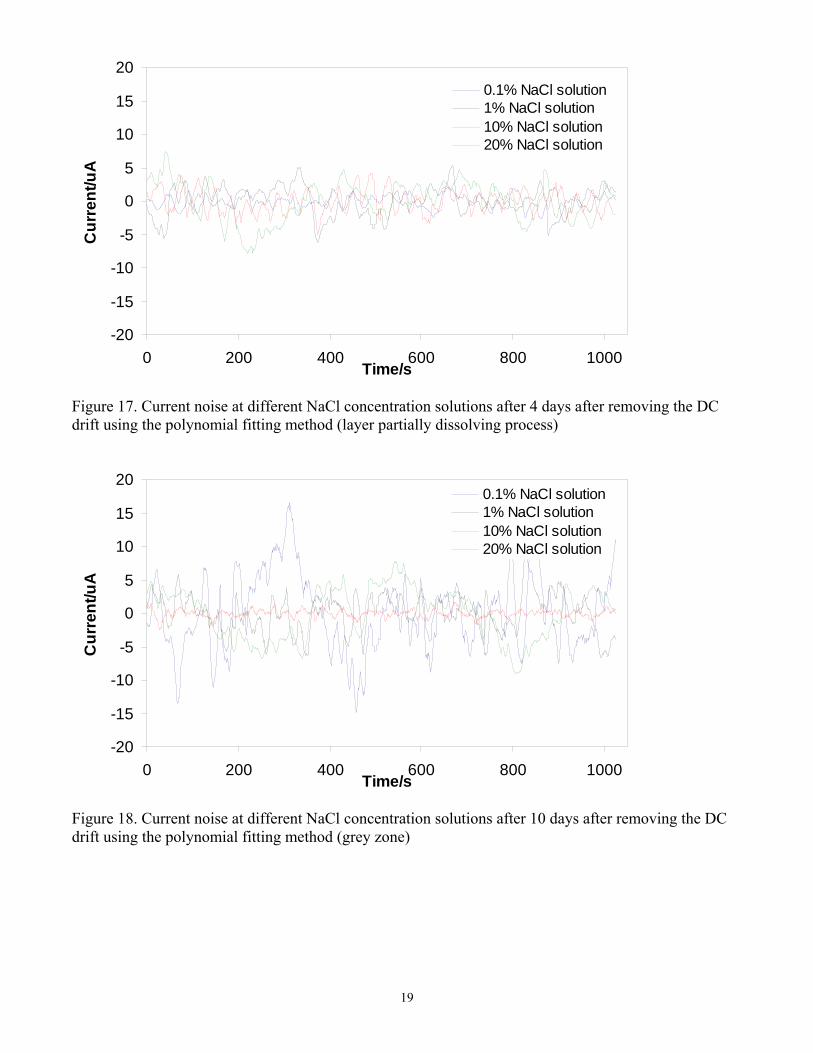
The change of current noise at different NaCl concentrations for the protective layer building period (at 3.5 days) is presented in Figure 16, displaying rather small amplitude. Current noise recorded during the layer partial removal period (at 4 days) at different NaCl concentrations is presented in Figure 17. The amplitudes of current noise became bigger as the layer dissolved. After 10 days the current noise at different NaCl concentration solutions is shown in Figure 18. Bigger amplitude of current noise was observed which was related to the localized corrosion, as indicated by the SEM and IFM results presented above. No significant difference in the noise signal between the different NaCl concentrations was observed further corroborating the conclusions reached based on the SEM and IFM results.
6
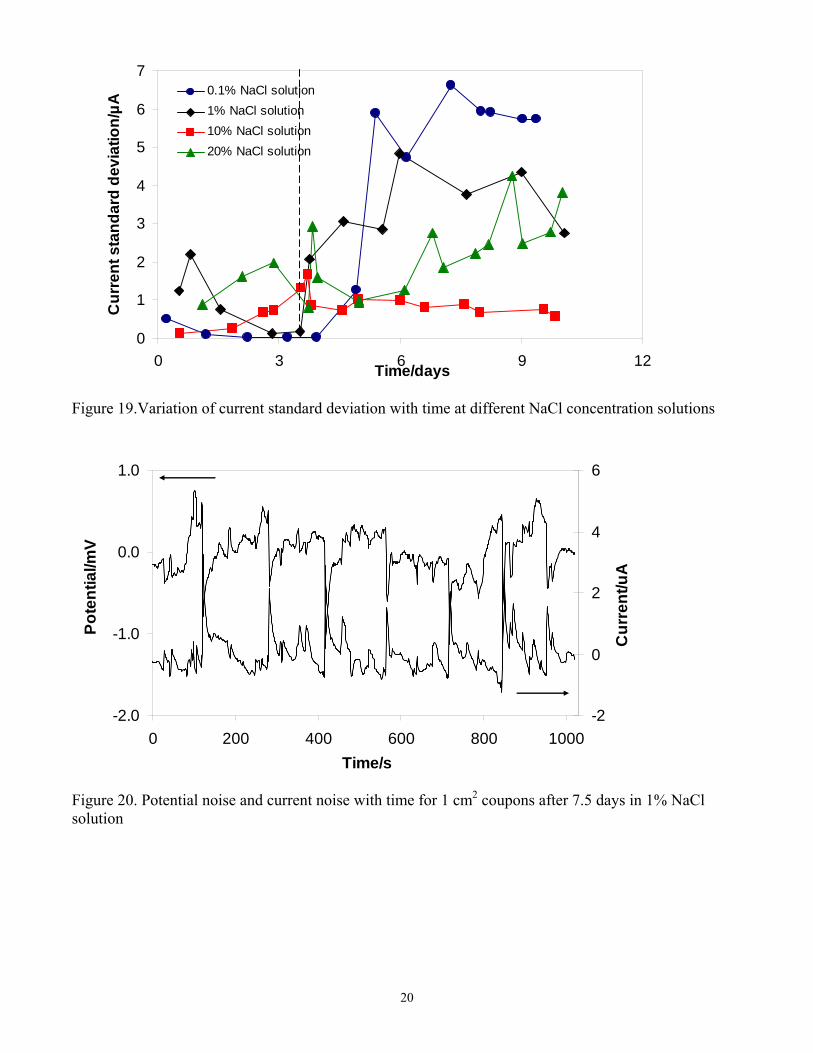
Variation of current standard deviation with time at different NaCl concentration solutions is presented in Figure 19. The current standard deviation decreased with time during the layer building process (before 3.5 days) for all the studied NaCl solutions. It then increased with time as the corrosion product layer became partially dissolved and the localized corrosion developed. There was no marked difference seen for the various salt concentrations.
Overall it could be concluded that the electrochemical noise technique was successful in providing data collected in situ for the evolution of the localized CO2 corrosion process. Larger magnitude of the current and potential fluctuations was qualitatively correlated with the onset and propagation of localized attack. However, the typical localized corrosion “signature”, normally seen in current transients, was not detected here, what was ascribed to the large size of the mild steel electrodes. This was further investigated by using smaller electrodes. Effect of electrode surface area on electrochemical noise
Two 11.6 cm2 coupons and two 1 cm2 coupons were placed in a 1% NaCl solution to investigate how the surface area influences the electrochemical noise signal. The other details of the experimental set-up are the same as described above.
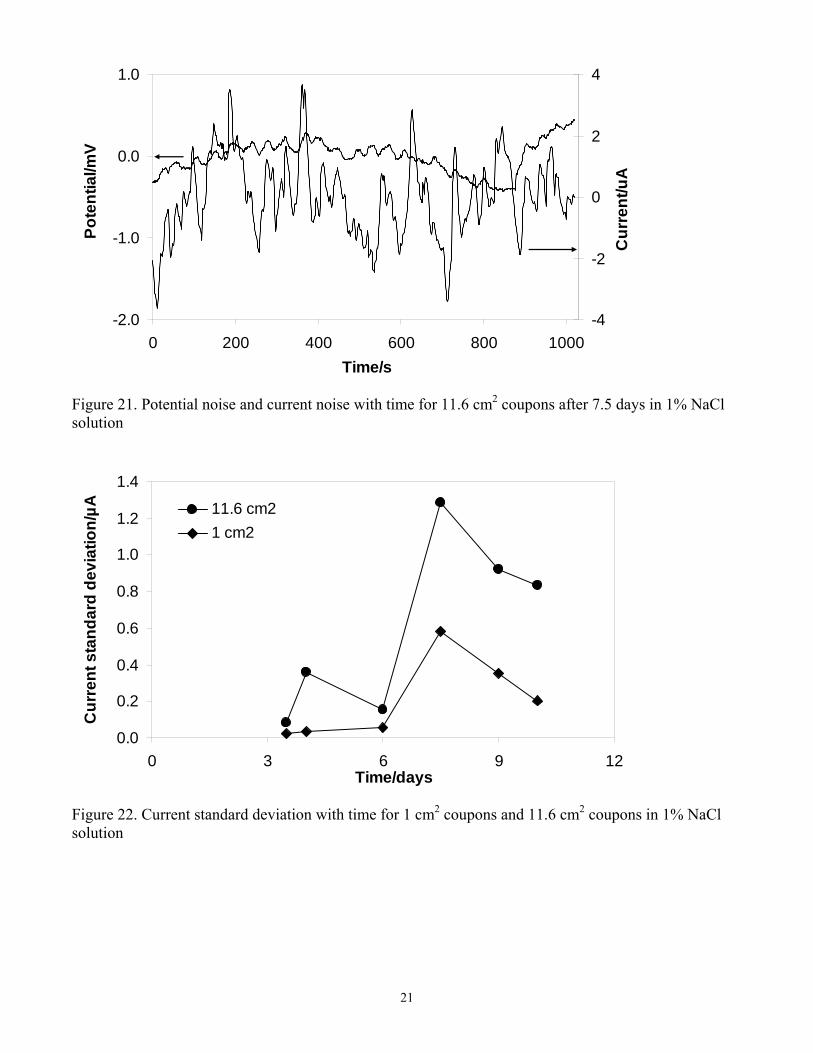
Evolution of potential noise and current noise with time for the 1 cm2 and the 11.6 cm2 coupons after 7.5 days is shown in Figure 20 and Figure 21 respectively. The signature transients related to metastable pitting for carbon steel were much easier to observe for the 1 cm2 coupons, as shown in Figure 20. Every rise in current noise was accompanied by a drop in potential noise indicating breakdown of corrosion product layer; while every drop in current noise corresponded to a rise in potential noise indicating repassivation of the surface by the corrosion product layer. This kind of transients can not be clearly observed in Figure 21 for the 11.6cm2 coupons, where overlapping of the signals in the region of recorded time occurred.15 Figure 22 presents variation of current standard deviation with time for 1 cm2 coupons and 11.6 cm2 coupons. A bigger current standard deviation for 11.6 cm2 coupons during the whole experiment duration can be observed in Figure 22. This indicates that more pits occurred on 11.6 cm2 coupons than that on 1 cm2 coupons, which was in accordance with current noise results in Figure 20 and Figure 21. In summary, the smaller electrode surface area produces transients of lesser intensity, however, it allows for a clearer identification of the current transients related to localized corrosion events.
CONCLUSIONS
• The chloride concentration had no significant effect on general CO2 corrosion rate under the conditions where protective iron carbonate layers form under static conditions.
• The chloride ions did not cause or accelerate the breakdown of the iron carbonate layer as previously suspected and therefore it was not possible to initiate localized corrosion of mild steel in CO2 environments solely by having a high chloride concentration under static conditions.
• Partial removal of the protective corrosion product layer by chemical dissolution did initiate localized CO2 corrosion. However, the high chloride concentration did not affect the morphology and magnitude of localized CO2 corrosion attack on mild steel in the presence of protective iron carbonate layers.
• The electrochemical noise technique was successful in providing in situ information about the evolution of the localized CO2 corrosion process. Transients related to metabstable pitting can be best observed on small coupons (≈1 cm2).
7
ACKNOWLEDGEMENTS
The authors acknowledge the financial support from the CC-JIP board company members. They are Baker Petrolite, BP, Champion Technologies, Chevron, Clariant, Columbia Gas Transmission, ConocoPhillips, Eni, ExxonMobil, MI Production Chemicals, Nalco, Occidental Oil Company, Petrobras, PTTEP, Saudi Aramco, Shell, Tenaris and Total.
REFERENCES
1. A.Ikeda, M.Ueda and S.Mukai, Corrosion/85, paper No.29. (Houston, TX: NACE, 1985) 2. J.B Han, Y.Yang, B.Brown, S.Nesic, “electrochemical investigation of localized corrosion on mild
steel” Corrosion/2007, paper 07323. (Houston, TX: NACE, 2007) 3. V.Ruzic, “Mechanisms of protective FeCO3 layer removal in single-phase flow-accelerated CO2
corrosion of mild steel”, PhD dissertation, The University of Queensland, 2005. 4.Y.F.Sun, K.Gorge, S.Nesic, “The effect of Cl- and acetic acid on localized CO2 corrosion in wet gas
flow” Corrosion/2003, Paper 03327. (Houston, TX: NACE, 2003) 5. X.Jiang, Y.G.Zheng, D.R.Qu, W.Ke, Corrosion Science 48(2006) 3091 6. H.T.Fang, “Low temperature and high salt concentration effects on general CO2 corrosion for carbon
steel”, MS Thesis, Ohio university, 2006. 7. M.Ergun and A.Y.Turan, Corrosion Science, 32(10) (1991) 1137 8. W.P.Iverson, , Journal of Electrochemical Society, 115(1968):617 9. Tyagai.V.A., Electrochimica Acta, 16(1971):1647. 10. F.Mansfeld, Z.sun and C.H.Hsu, Electrochimica Acta, 46(2001)3651 11. Y.F.Cheng, M.wilmott, J.L.Luo, Applied surface science 152(1999)161 12. Y.H.Sun, S.Nesic, “A parameteric study and modeling on localized CO2 corrosion in horizontal wet
gas flow” Corrosion/2004, paper 04380. (Houston, TX: NACE, 2004) 13. R.Cottis, S.Turgoose, “Electrochemical Impedance and Noise”, NACE international, 1999 14. U.Bertocci, C.Gabrielli, F.Huet, M.Keddam, and P.Rousseau, Journal of Electrochemical Society,
144(1) (1997)37 15. U.Bertocci,F.Huet,B.Jaoul,P.Rousseau, Frequency analysis of transients in EN: mathematical
relationships and computer simulations, Corrosion 56(2000):675-683.
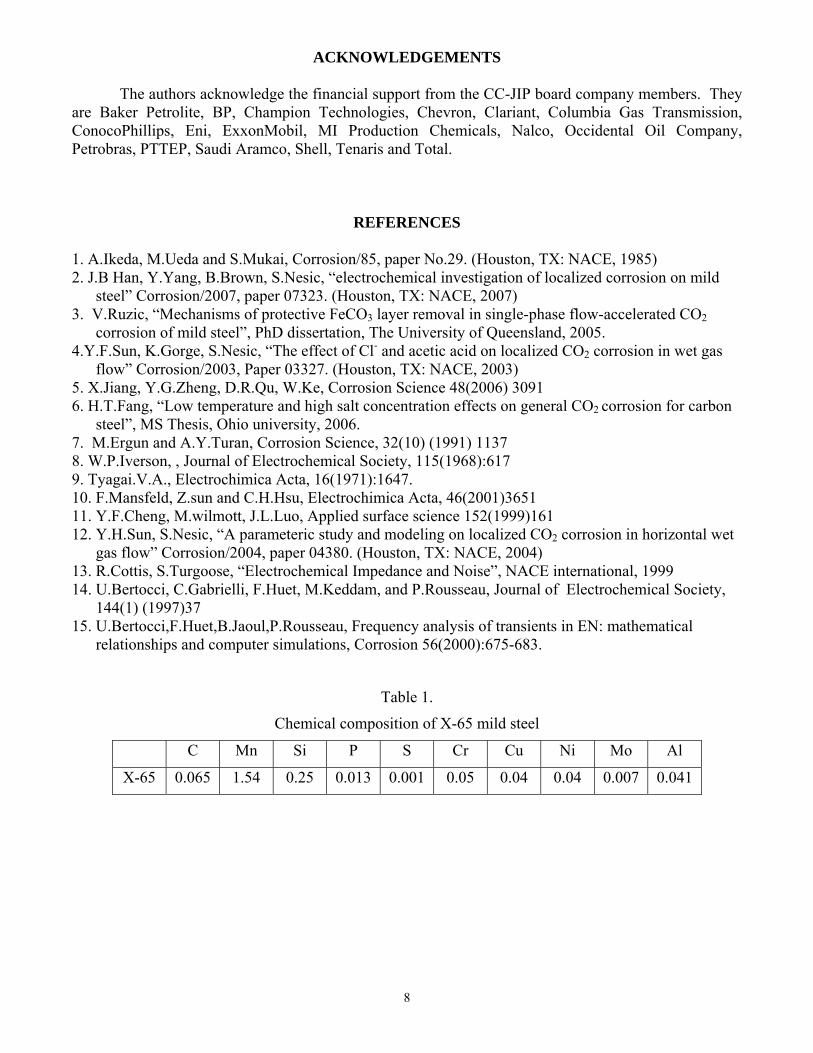
Table 1.
Chemical composition of X-65 mild steel
C Mn Si P S Cr Cu Ni Mo Al
X-65 0.065 1.54 0.25 0.013 0.001 0.05 0.04 0.04 0.007 0.041
8
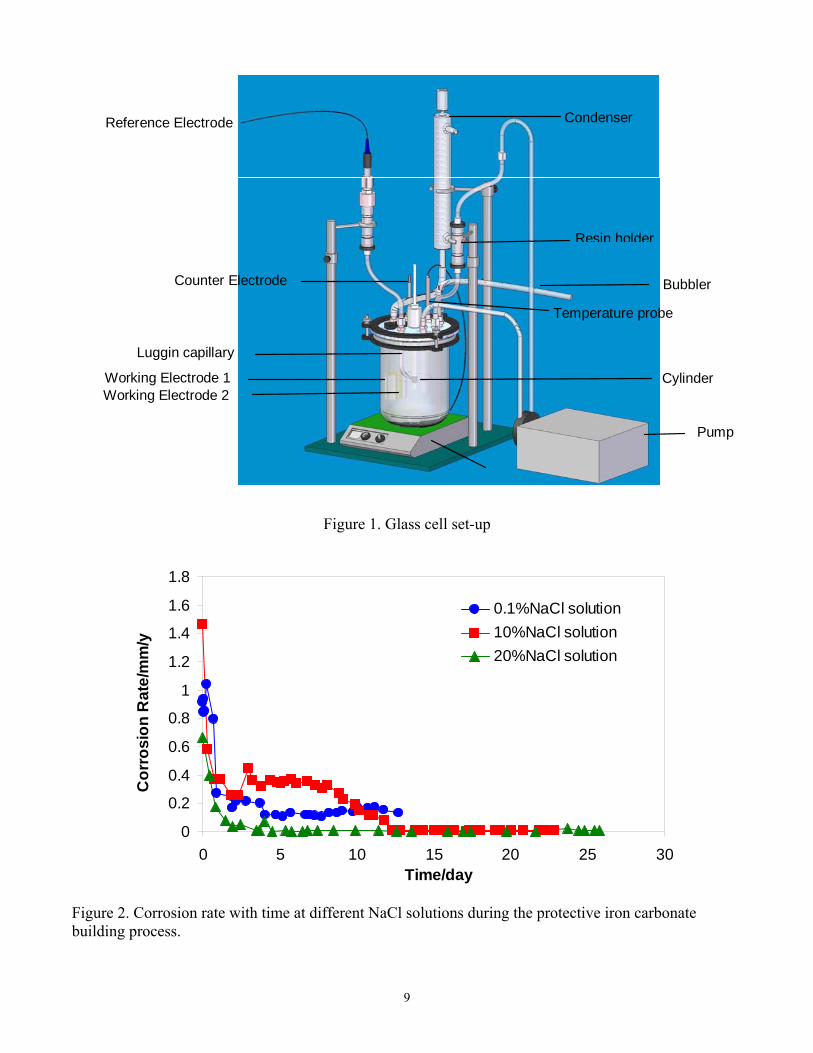
Figure 1. Glass cell set-up
0
0.2
0.4
0.6
0.8
1
1.2
1.4
1.6
1.8
0 5 10 15 20 25 30Time/day
Cor
rosi
on R
ate/
mm
/y
0.1%NaCl solution10%NaCl solution20%NaCl solution
Figure 2. Corrosion rate with time at different NaCl solutions during the protective iron carbonate building process.
Reference Electrode
Counter Electrode
Luggin capillary
Working Electrode 1 Cylinder
Temperature probe
Bubbler
Condenser
Working Electrode 2
Resin holder
Pump
9
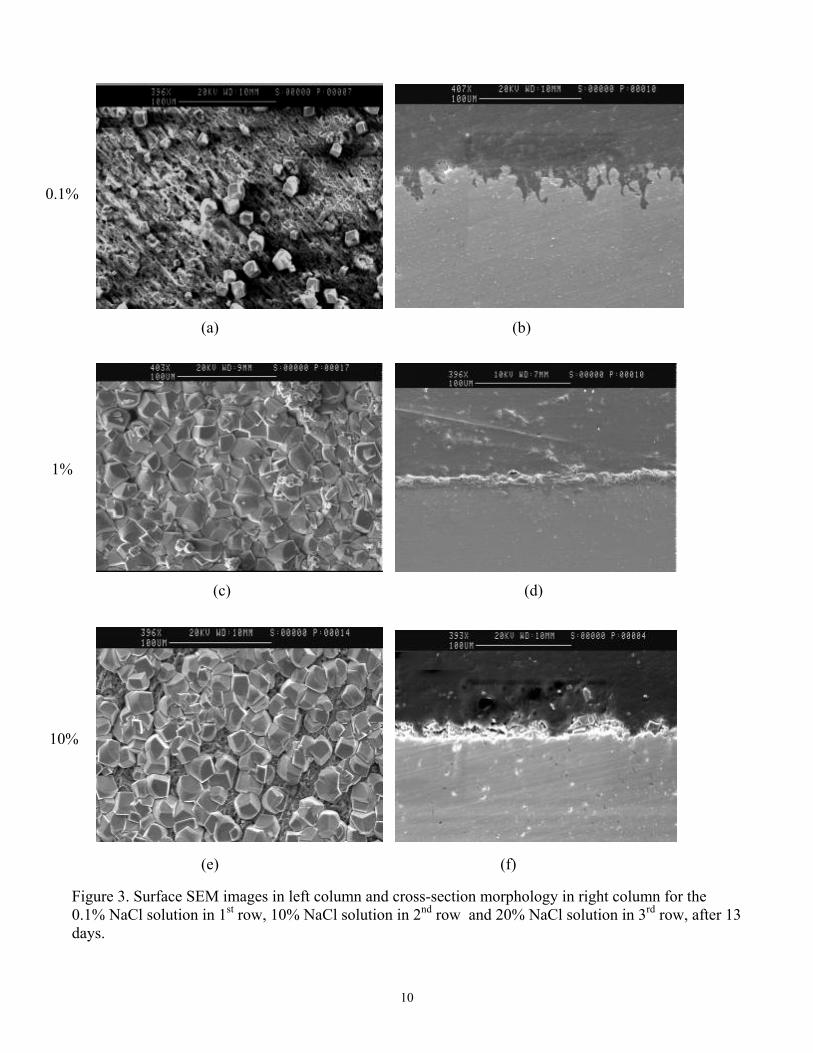
Figure 3. Surface SEM images in left column and cross-section morphology in right column for the 0.1% NaCl solution in 1st row, 10% NaCl solution in 2nd row and 20% NaCl solution in 3rd row, after 13 days.
(a) (b)
(e) (f)
(c) (d)
0.1%
1%
10%
10
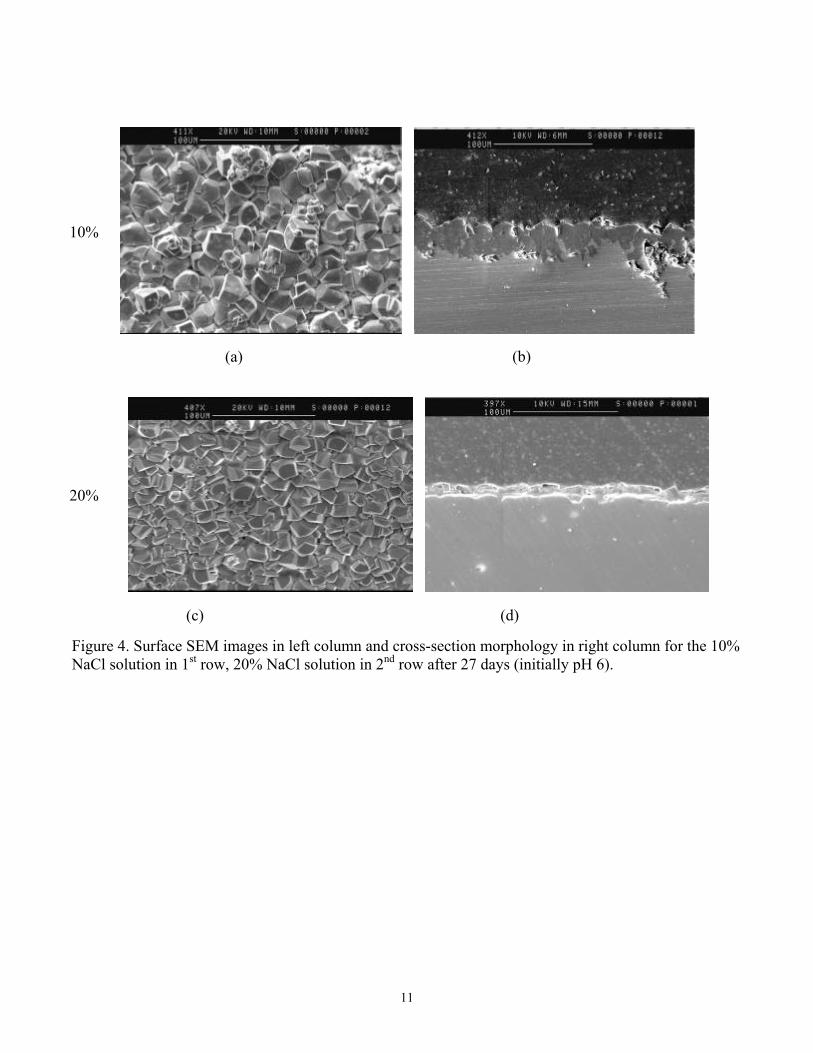
Figure 4. Surface SEM images in left column and cross-section morphology in right column for the 10% NaCl solution in 1st row, 20% NaCl solution in 2nd row after 27 days (initially pH 6).
(b)
(c) (d)
(a)
10%
20%
11
0
0.4
0.8
1.2
1.6
0 3 6 9 12Time/day
Cor
rosi
on R
ate/
mm
/y
0.1%NaCl solution1%NaCl solution10%NaCl solution20%NaCl solutionPartial film removal
Figure 5. Corrosion rate with time at different NaCl solutions
Figure 6. Surface morphology after 3.5 days in 0.1 %((a)), 1 %((b)), 10% ((c)) and 20% NaCl solution((d))
(a) (b)
(c) (d)
12
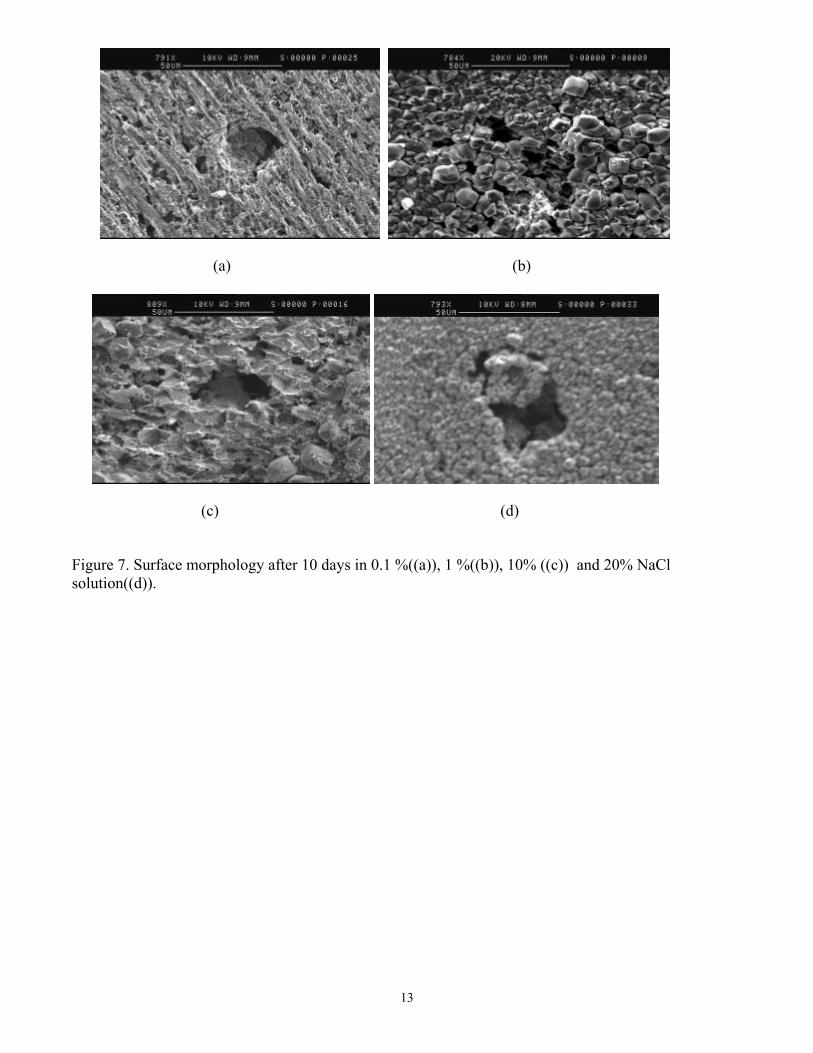
Figure 7. Surface morphology after 10 days in 0.1 %((a)), 1 %((b)), 10% ((c)) and 20% NaCl solution((d)).
(c)
(a)
(d)
(b)
13
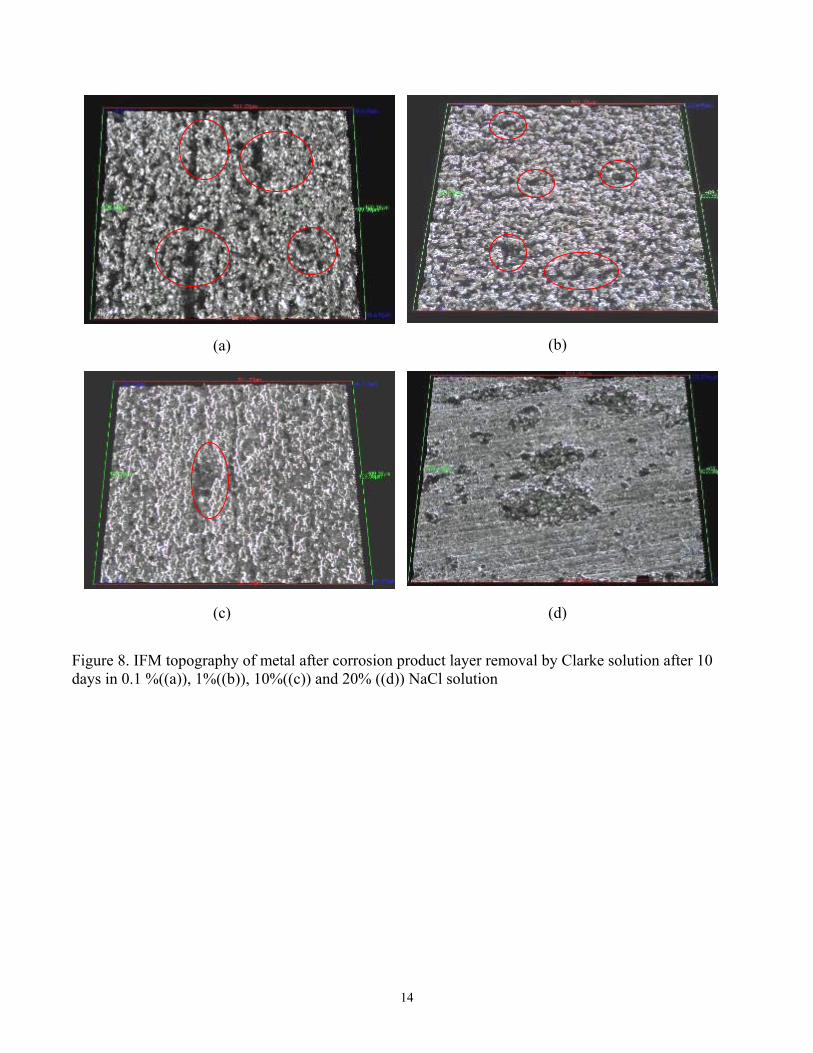
Figure 8. IFM topography of metal after corrosion product layer removal by Clarke solution after 10 days in 0.1 %((a)), 1%((b)), 10%((c)) and 20% ((d)) NaCl solution
(a) (b)
(c) (d)
14
0
0.5
1
1.5
2
2.5
3
3.5
0.1 1 10 20
NaCl solution concentration/wt%
Cor
rosi
on ra
te/m
m/y
General corrosion rate
Maximum localized corrosion rate
Figure 9. Variation of corrosion rate with NaCl concentration after 10 days
-20
-15
-10
-5
0
5
10
15
20
0 200 400 600 800 1000Time/s
Cur
rent
/uA
0.8 days1.6 days2.8 days3.5 days
Figure 10.Variation of current noise with time during the protective layer building process (before 3.5 days) in a 1% NaCl solution saturated by CO2 after removing the DC drift using the polynomial fitting method.
15
-0.8
-0.6
-0.4
-0.2
0
0.2
0.4
0.6
0 200 400 600 800 1000Time/s
Pote
ntia
l/mV
3.5 days4 days6 days10 days
Figure 11.Variation of potential noise with time in 1% NaCl solution after removing the DC drift using
the polynomial fitting method.
-20
-15
-10
-5
0
5
10
15
20
0 200 400 600 800 1000Time/s
Cur
rent
/uA
3.5 days4 days6 days10 days
Figure 12. Variation of current noise with time in 1% NaCl solution after removing the DC drift using
the polynomial fitting method.
16
0
1
2
3
4
5
6
0 3 6 9 12Time/day
Cur
rent
sta
ndar
d de
viat
ion/
µA 1%NaCl solution
Figure 13.Variation of current standard deviation with time in 1% NaCl solution
1.0E-11
1.0E-09
1.0E-07
1.0E-05
1.0E-04 1.0E-03 1.0E-02 1.0E-01 1.0E+00Frequency/Hz
PSD
/V2 /H
z
3.5 days4 days6 days10 days
Figure 14.Variation of potential power spectra density (MEM) with time in 1% NaCl solution
17
1.0E-16
1.0E-14
1.0E-12
1.0E-10
1.0E-08
1.0E-04 1.0E-03 1.0E-02 1.0E-01 1.0E+00Frequency/Hz
PSD
/A2 /H
z
3.5 days4 days6 days10 days
Figure 15. Variation of current power spectra density (MEM) with time in 1% NaCl solution
-20
-15
-10
-5
0
5
10
15
20
0 200 400 600 800 1000Time/s
Cur
rent
/uA
0.1% NaCl solution1% NaCl solution10%NaCl solution20% NaCl solution
Figure 16. Current noise at different NaCl concentration solutions after 3.5 days after removing DC drift using polynomial methods (layer building process)
18
-20
-15
-10
-5
0
5
10
15
20
0 200 400 600 800 1000Time/s
Cur
rent
/uA
0.1% NaCl solution1% NaCl solution10% NaCl solution20% NaCl solution
Figure 17. Current noise at different NaCl concentration solutions after 4 days after removing the DC drift using the polynomial fitting method (layer partially dissolving process)
-20
-15
-10
-5
0
5
10
15
20
0 200 400 600 800 1000Time/s
Cur
rent
/uA
0.1% NaCl solution1% NaCl solution10% NaCl solution20% NaCl solution
Figure 18. Current noise at different NaCl concentration solutions after 10 days after removing the DC drift using the polynomial fitting method (grey zone)
19
0
1
2
3
4
5
6
7
0 3 6 9 12Time/days
Cur
rent
sta
ndar
d de
viat
ion/
µA 0.1% NaCl solution
1% NaCl solution10% NaCl solution20% NaCl solution
Figure 19.Variation of current standard deviation with time at different NaCl concentration solutions
-2.0
-1.0
0.0
1.0
0 200 400 600 800 1000Time/s
Pote
ntia
l/mV
-2
0
2
4
6
Cur
rent
/uA
Figure 20. Potential noise and current noise with time for 1 cm2 coupons after 7.5 days in 1% NaCl solution
20
-2.0
-1.0
0.0
1.0
0 200 400 600 800 1000Time/s
Pote
ntia
l/mV
-4
-2
0
2
4
Cur
rent
/uA
Figure 21. Potential noise and current noise with time for 11.6 cm2 coupons after 7.5 days in 1% NaCl solution
0.0
0.2
0.4
0.6
0.8
1.0
1.2
1.4
0 3 6 9 12Time/days
Cur
rent
sta
ndar
d de
viat
ion/
µA
11.6 cm21 cm2
Figure 22. Current standard deviation with time for 1 cm2 coupons and 11.6 cm2 coupons in 1% NaCl solution
21