Embed Size (px)
DESCRIPTION
Presented at the ASEAN Regional Conference on Food Security, 8-10 October 2013, Penang, Malaysia
Citation preview

What’s for dinner in 2035?
ASEAN Regional Conference on Food Security
9 October 2013 Tee, E.-S. and Soon, J.M.
Changing Trends in Dietary Pattern and Implications to Food and Nutrition
Security in ASEAN
ASEAN Regional Conference on Food Security
9 October 2013 Tee, E.-S. and Soon, J.M.
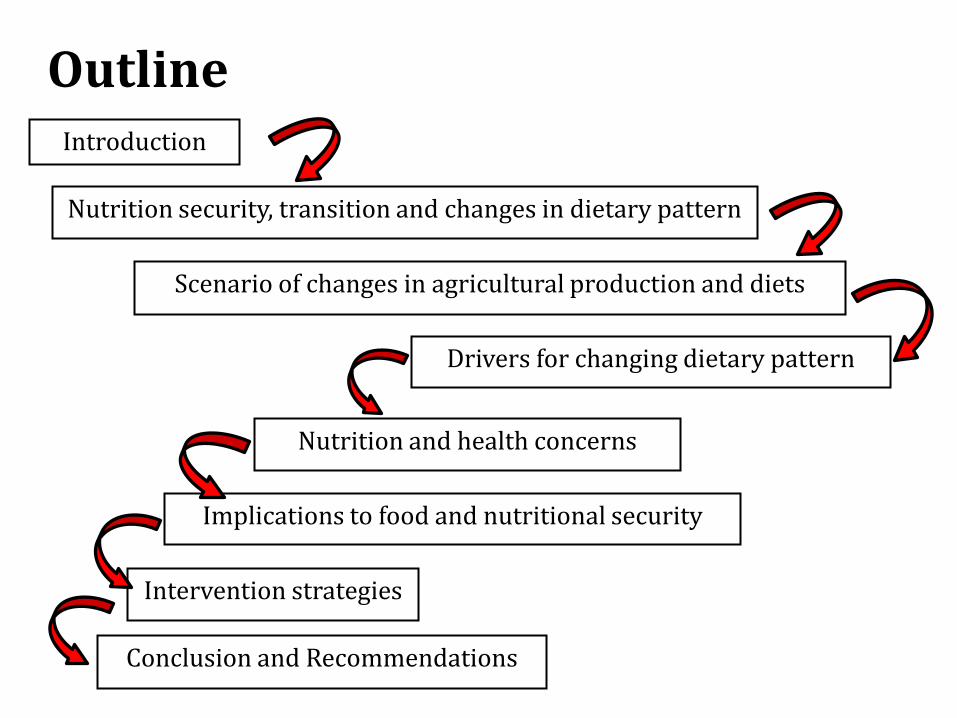
Outline Introduction
Nutrition security, transition and changes in dietary pattern
Scenario of changes in agricultural production and diets
Conclusion and Recommendations
Implications to food and nutritional security
Nutrition and health concerns
Intervention strategies
Drivers for changing dietary pattern
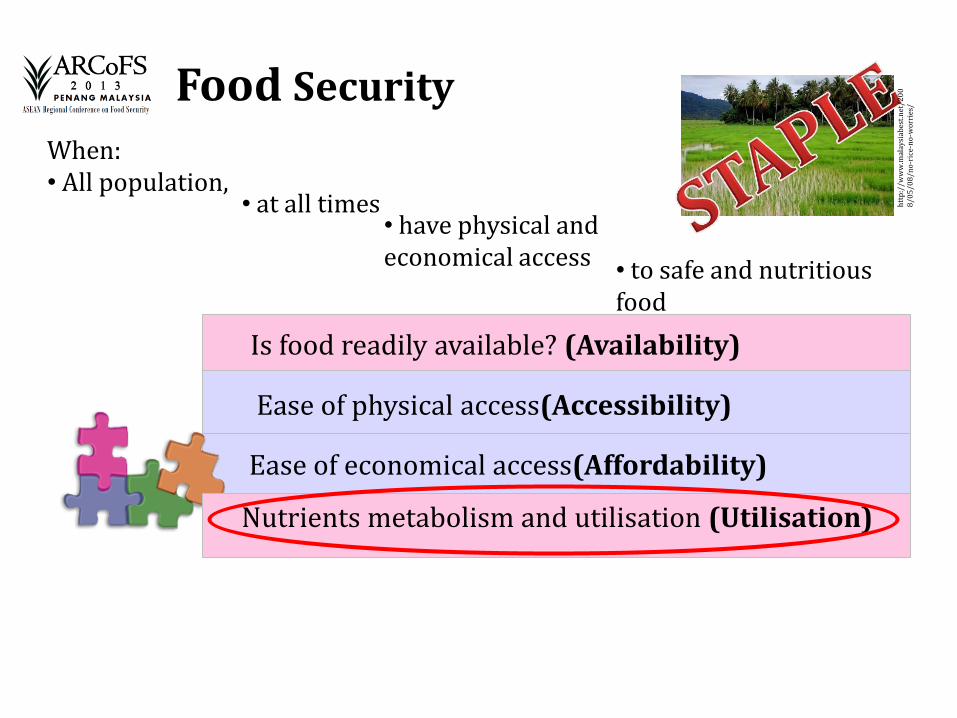
Is food readily available? (Availability)
Ease of physical access(Accessibility)
Food Security When: • All population,
• at all times • have physical and economical access
• to safe and nutritious food
htt
p:/
/ww
w.m
alay
siab
est.
net
/2
00
8/0
5/0
8/n
o-r
ice-
no
-wo
rrie
s/
Ease of economical access(Affordability)
Nutrients metabolism and utilisation (Utilisation)
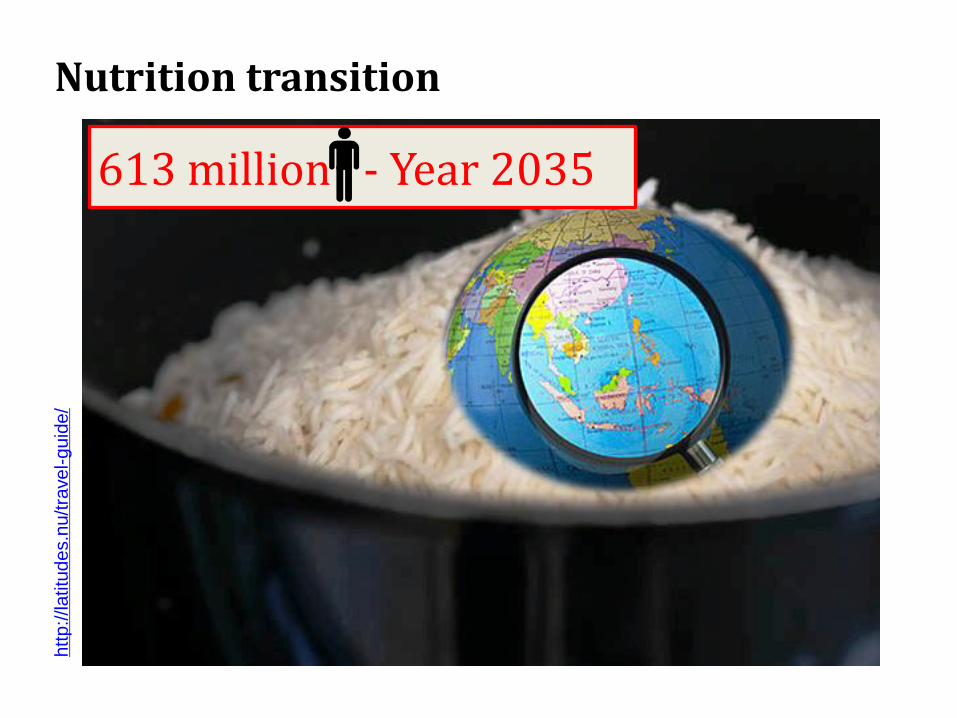
Nutrition transition h
ttp
://latitu
de
s.n
u/tra
ve
l-g
uid
e/
613 million - Year 2035
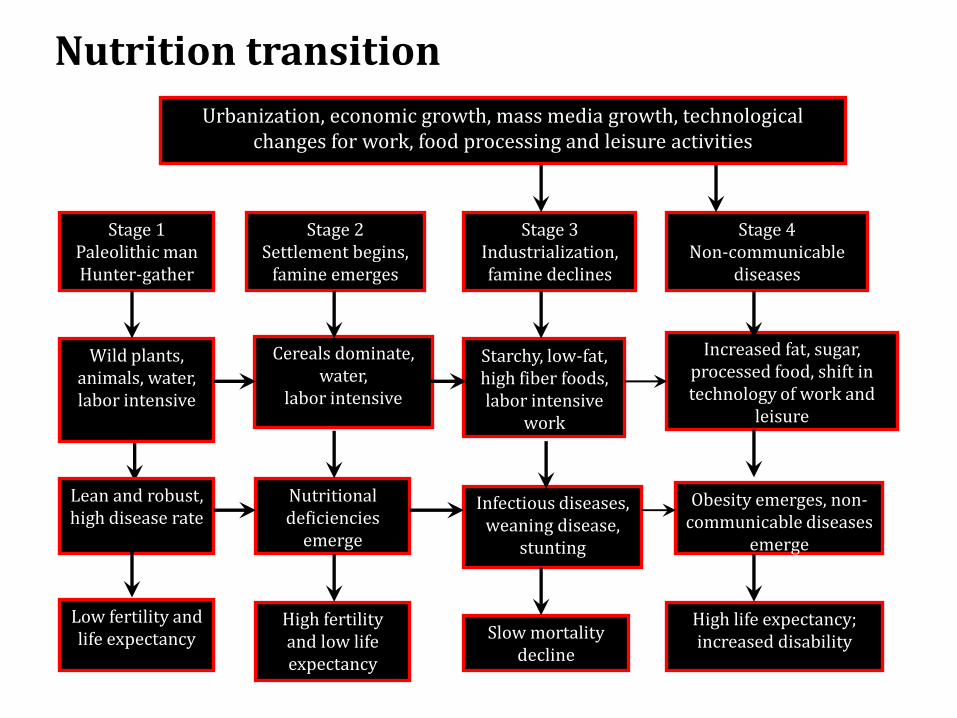
Nutrition transition
Urbanization, economic growth, mass media growth, technological changes for work, food processing and leisure activities
Stage 1 Paleolithic man Hunter-gather
Wild plants, animals, water, labor intensive
Lean and robust, high disease rate
Low fertility and life expectancy
Stage 2 Settlement begins,
famine emerges
Cereals dominate, water,
labor intensive
Nutritional deficiencies
emerge
High fertility and low life expectancy
Stage 3 Industrialization, famine declines
Starchy, low-fat, high fiber foods, labor intensive
work
Infectious diseases, weaning disease,
stunting
Slow mortality decline
Stage 4 Non-communicable
diseases
Increased fat, sugar, processed food, shift in technology of work and
leisure
Obesity emerges, non-communicable diseases
emerge
High life expectancy; increased disability
0
500
1000
1500
2000
2500
3000
3500
Lao PDR Cambodia Myanmar Philippines Indonesia Viet Nam Thailand Malaysia Brunei
Kil
aca
lori
es
/ c
ap
ita
/ d
ay
South East Asia Countries
1970 2009
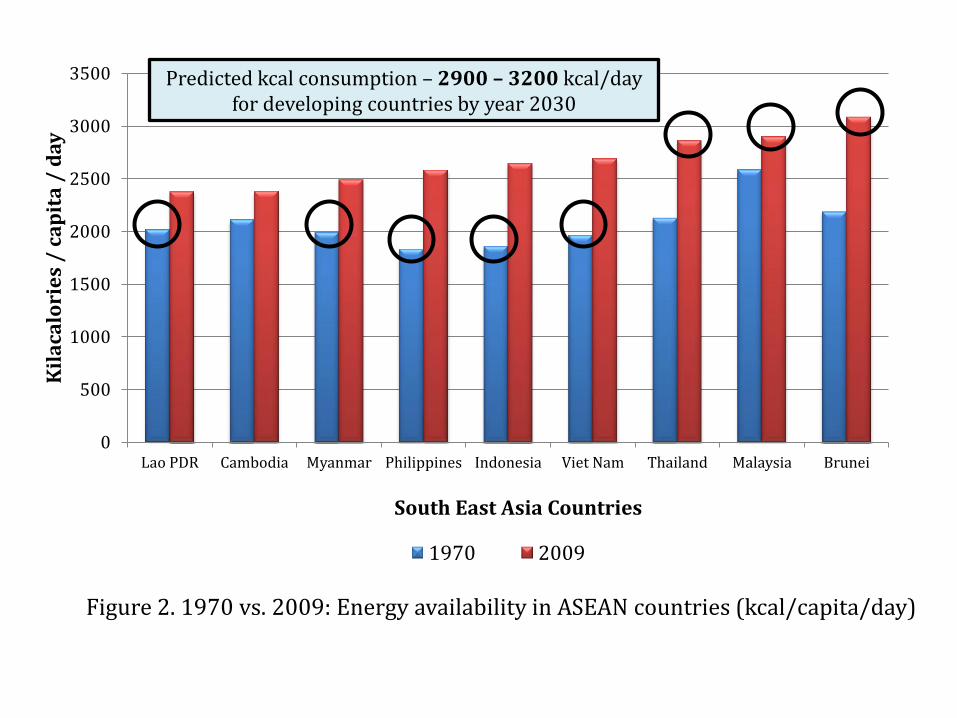
Figure 2. 1970 vs. 2009: Energy availability in ASEAN countries (kcal/capita/day)
Predicted kcal consumption – 2900 – 3200 kcal/day for developing countries by year 2030
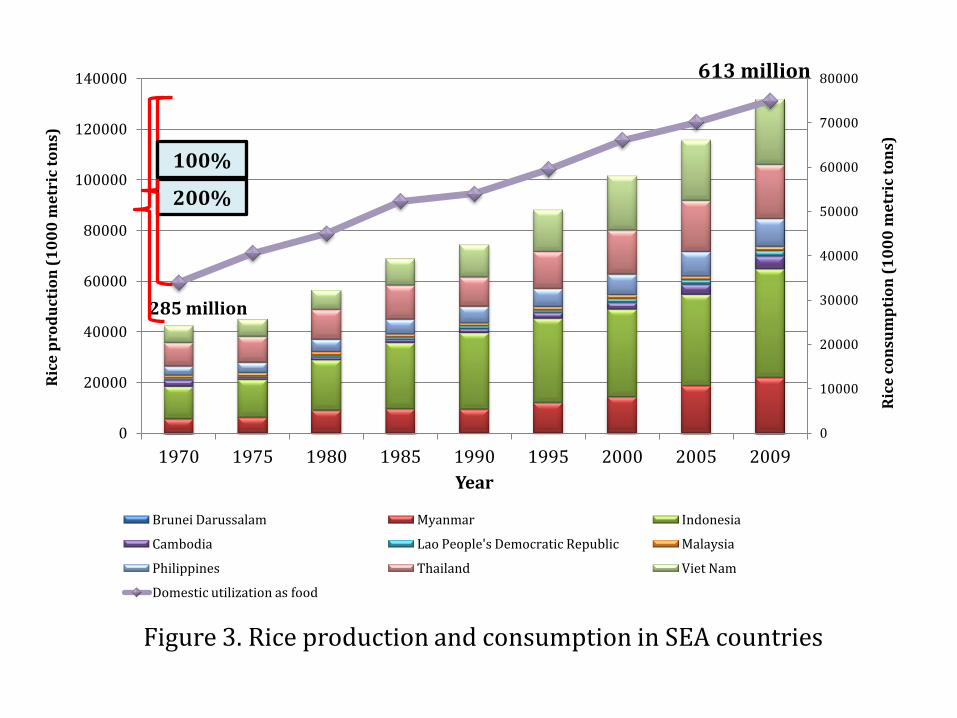
Figure 3. Rice production and consumption in SEA countries
0
10000
20000
30000
40000
50000
60000
70000
80000
0
20000
40000
60000
80000
100000
120000
140000
1970 1975 1980 1985 1990 1995 2000 2005 2009
Ric
e c
on
sum
pti
on
(1
00
0 m
etr
ic t
on
s)
Ric
e p
rod
uct
ion
(1
00
0 m
etr
ic t
on
s)
Year
Brunei Darussalam Myanmar Indonesia
Cambodia Lao People's Democratic Republic Malaysia
Philippines Thailand Viet Nam
Domestic utilization as food
285 million
613 million
200%
100%
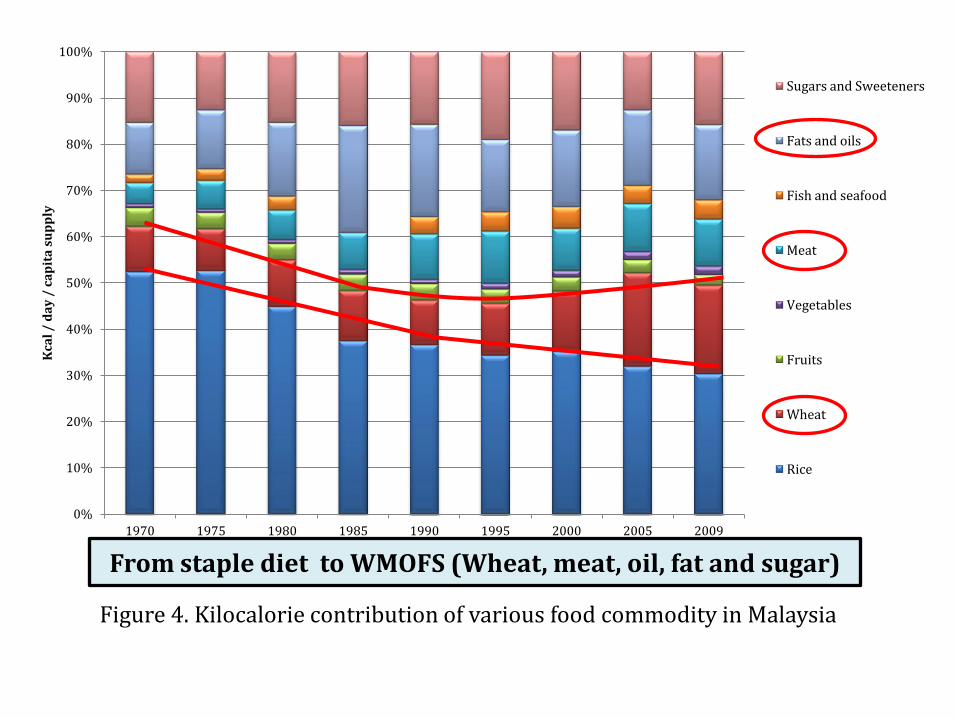
Figure 4. Kilocalorie contribution of various food commodity in Malaysia
0%
10%
20%
30%
40%
50%
60%
70%
80%
90%
100%
1970 1975 1980 1985 1990 1995 2000 2005 2009
Kca
l /
da
y /
ca
pit
a s
up
ply
Year
Sugars and Sweeteners
Fats and oils
Fish and seafood
Meat
Vegetables
Fruits
Wheat
Rice
From staple diet to WMOFS (Wheat, meat, oil, fat and sugar)
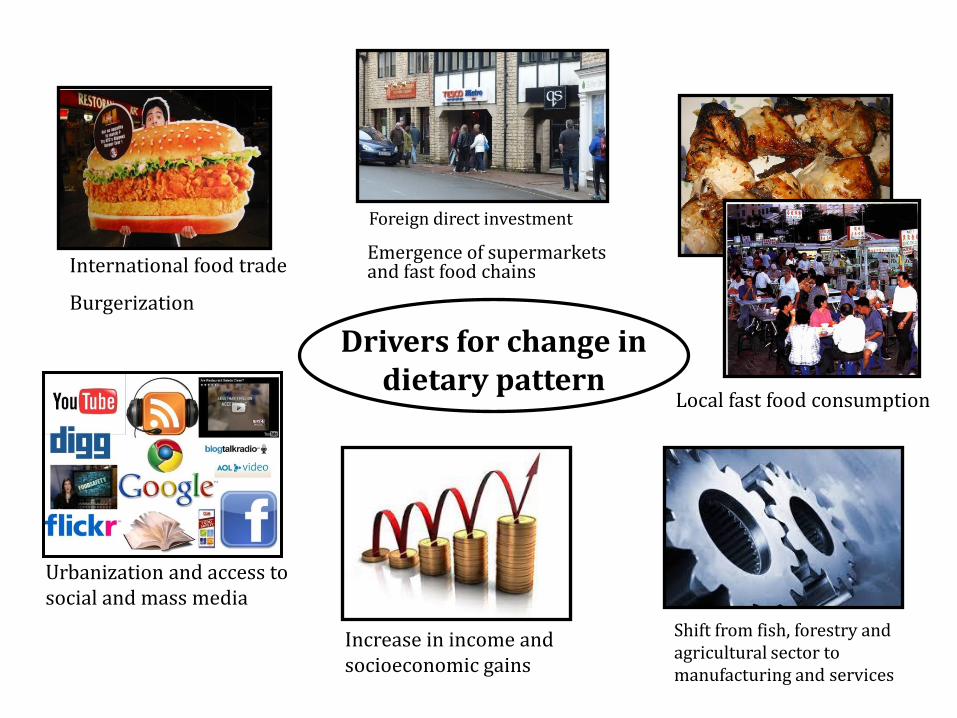
Drivers for change in dietary pattern
Burgerization
Local fast food consumption
Increase in income and socioeconomic gains
Urbanization and access to social and mass media
International food trade
Foreign direct investment
Emergence of supermarkets and fast food chains
Shift from fish, forestry and agricultural sector to manufacturing and services
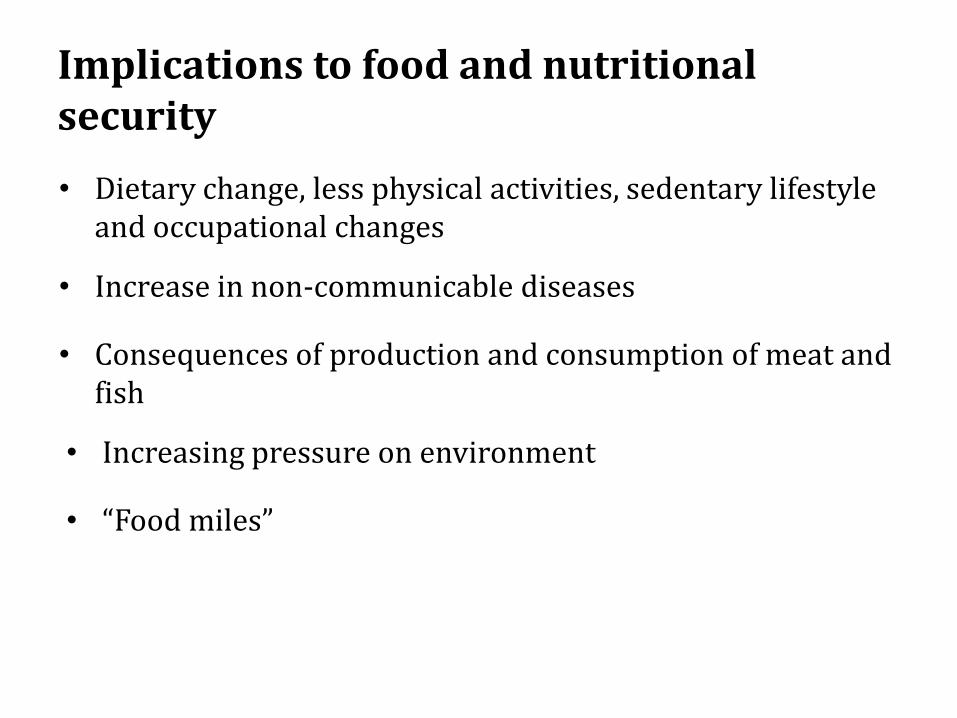
Implications to food and nutritional security
• Increase in non-communicable diseases
• Consequences of production and consumption of meat and fish
• Increasing pressure on environment
• “Food miles”
• Dietary change, less physical activities, sedentary lifestyle and occupational changes
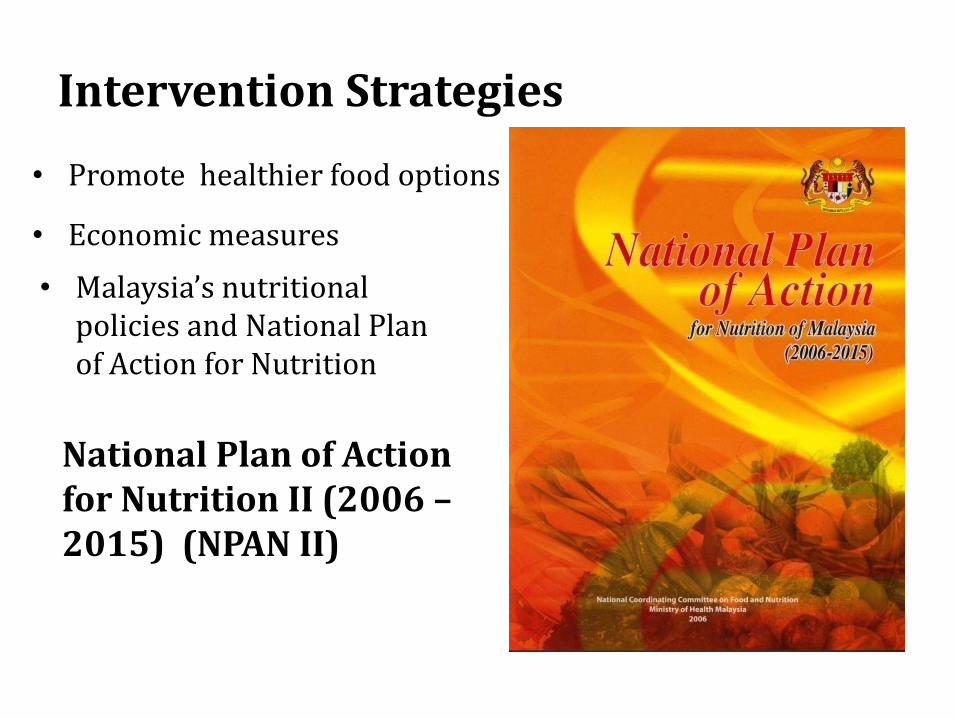
National Plan of Action for Nutrition II (2006 – 2015) (NPAN II)
• Promote healthier food options
• Economic measures
• Malaysia’s nutritional policies and National Plan of Action for Nutrition
Intervention Strategies

General Objective of NPANM II:
to achieve and maintain optimal nutritional well-being of Malaysians
Malaysia’s nutritional policies and National Plan of Action for Nutrition
To ensure effective implementation, monitoring and evaluation of the Plan of Action, strategies of the Plan are oriented into
Foundation
Enabling and
Facilitating Strategies
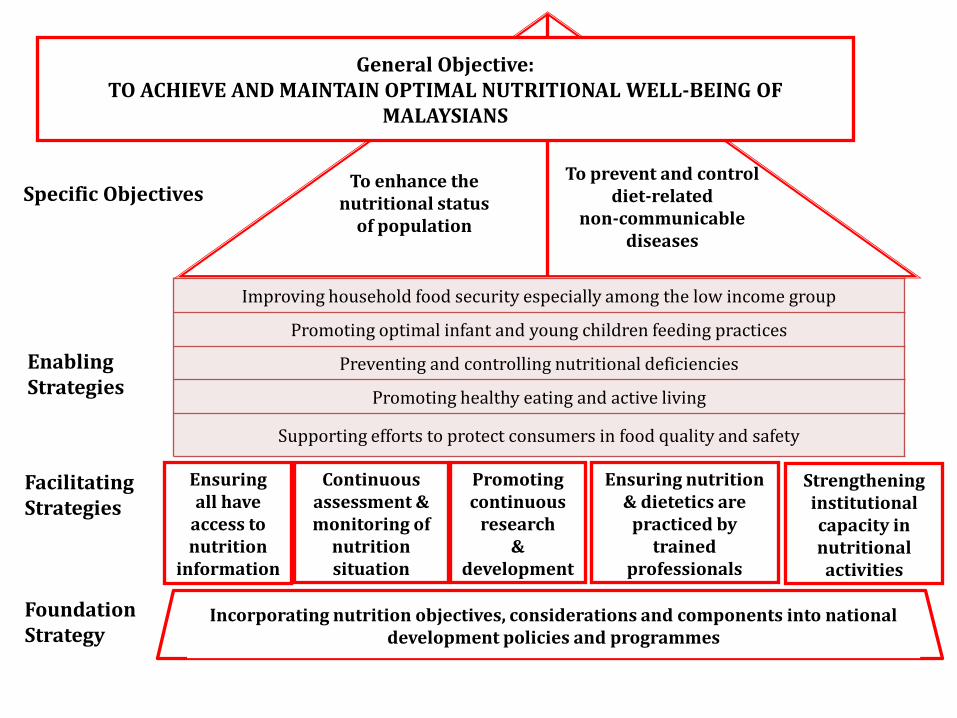
Foundation Strategy
Incorporating nutrition objectives, considerations and components into national development policies and programmes
Specific Objectives To enhance the
nutritional status of population
To prevent and control diet-related
non-communicable diseases
General Objective: TO ACHIEVE AND MAINTAIN OPTIMAL NUTRITIONAL WELL-BEING OF
MALAYSIANS
Improving household food security especially among the low income group
Promoting optimal infant and young children feeding practices
Preventing and controlling nutritional deficiencies
Promoting healthy eating and active living
Supporting efforts to protect consumers in food quality and safety
Enabling Strategies
Ensuring all have
access to nutrition
information
Continuous assessment & monitoring of
nutrition situation
Promoting continuous
research &
development
Ensuring nutrition & dietetics are
practiced by trained
professionals
Strengthening institutional capacity in nutritional
activities
Facilitating Strategies
Change in dietary pattern among ASEAN counterparts (staple to WMOFS diet)
Conclusion
Per capita energy availability has risen significantly over the years
Changes in consumption pattern and lifestyle have led to obesity and non-communicable dietary related diseases
Action plan and intervention strategies

Thank You


![EMERGING TRENDS INVESTMENT IN ASEAN · / siia & actagon / emerging trends & investment in asean [september 2016 ] page 2 table of contents introduction: asean outperforms 3 european](https://img.pdfslide.us/doc/110x75/5ecf562b0f48dd0ece1ae9ba/emerging-trends-investment-in-siia-actagon-emerging-trends-investment.jpg)