Embed Size (px)
Citation preview

2017
PANORAMA OF FOOD AND
NUTRITIONAL SECURITY IN
LATIN AMERICA AND THE CARIBBEAN

FOREWORDPROLOGUE
The Panorama of food and nutritional security in Latin America and the Caribbean 2017, published by the Food and Agriculture Organization of the United Nations (FAO) and the Pan American Health Organization (PAHO), reports for the first time on the progress made by countries in the Region towards the Sustainable Development Goals (SDGs).
The new figures shows that, after years of marked improvement, progress in the eradication of hunger and malnutrition in the Region has stalled. After over a decade of substantive advance in the reduction of hunger, the Region first experienced a downturn in the 2011-2013 period, after which an increase in both the prevalence and the number of undernourished people has been observed. If Latin America and the Caribbean do not resume the positive trend soon, the SDG 2 target of ending hunger and all forms of malnutrition by 2030 will not be met.
In addition, there is evidence of a constant and alarming rise in overweight and obesity, both risk factors for non-communicable diseases and the leading cause of morbidity and mortality in the Region, which have a serious effect on the well-being of the population, leading to consequences that force States and governments to spend huge amounts of funds that could otherwise be used for other social needs.
On the other hand, the Region has taken significant steps to eradicate child malnutrition, and to decrease the maternal, neonatal and under-five mortality rate, as well as the mortality caused by non-communicable diseases, indicating that the Region is still on a good path to meet the first two targets of SDG 3.
This f irst measurement of the progress made in the Region towards the SDGs raises a red f lag, indicating that countries must improve the quality of their policies and programmes, increase investments urgently, and involve the entire society.
Latin American and Caribbean countries have officially adopted the commitment to end hunger by 2025, v ia the comprehensive implementation of the Plan for Maternal, Infant and Young Child Nutrition, endorsed by the World Health Organization, the Plan for Food, Nutrition and Hunger Eradication of the Community of Latin American and Caribbean States (CELAC), and the Hunger-Free Latin American and Caribbean Initiative.
To a large extent, both hunger and malnutrition, as well as overweight and obesity are the consequence of food systems that have undergone fast and profound changes since the 1980s. Although these changes have brought multiple benefits to our countries, the increased consumption of ultra-processed foods has also contributed to a rise in overweight, obesity and non-communicable diseases, indicating an urgent need to design public policies that transform food systems and ensure healthy diets. The Region must advance towards policies, legal and regulatory frameworks,
| vii |

Julio A. BerdeguéRegional Representative for Latin America and the Caribbean
Food and Agriculture Organization of the United Nations (FAO)
Dr. Carissa F. EtienneDirector of the Pan American Health Organization (PAHO) Regional Director, Regional Office of the World
Health Organization (WHO) for the Americas
programmes and interventions that promote the consumption of safe, diverse and nutritious foods as well as healthy and active life styles.
In view of the Panorama 2017 edition, FAO and PAHO urge countries to transform their food systems to stop the progress of hunger and malnutrition, with a special focus on the most vulnerable people, households and territories. Only through a huge regional effort will the current trend be reversed, returning to the path that turned Latin America and the Caribbean into an example of the fight against hunger and malnutrition in all its forms for the rest of the world.
| viii |

© FAO

3
Key messagesè Undernourishment in Latin America and the Caribbean increased in the last measurement period. After several years of stagnation, in 2016 approximately 42.5 million people did not have enough food to cover their daily calorie intake needs, accounting for an increase of 2.4 million people; that means an increase of 6% of the population being undernourished compared to the previous year.
è If this trend continues, Latin America and the Caribbean will not attain the goal of ending hunger and malnutrition by 2030, set in the Sustainable Development Goals (SDGs). This imposes a sense of urgency on the actions required for overcoming both hunger and malnutrition.
è While undernutrition declines, overweight and obesity have become an important health issue for Latin America and the Caribbean. Rising rates of adult obesity are observed, while overweight affects 7% of children under 5 years of age in Latin America and the Caribbean, a percentage that is above the global average of 6%.
CHAPTER 1 PROGRESS IN
LATIN AMERICA AND THE
CARIBBEAN FOR THE
FULFILLMENT OF
SUSTAINABLE DEVELOPMENT
GOALS 2 AND 3

The 2030 Agenda envisions a fairer world, including the realization of human rights focused on equality and inclusion, favouring sustainable development in the economic, social and environmental fronts. In this context and in the framework of the United Nations, 17 Sustainable Development Goals (SDGs) and their 169 targets were approved in 2015, to overcome a set of issues currently affecting countries around the world (FAO and PAHO, 2017).
Ratify ing the SDGs implies having to consolidate a multidimensional v iew of development, where well-being is conceived as involving the attainment of a series of broad and interrelated goals rather than just the specific reduction of certain phenomena, such as poverty and hunger (UNDP, 2016). This entails a comprehensive vision and approach, as the attainment of some of the goals will also depend on the achievement and progress made in others. For instance, Goal
CHAPTER 1
PROGRESS IN LATIN AMERICA AND THE CARIBBEAN FOR THE FULFILLMENT OF SUSTAINABLE DEVELOPMENT GOALS 2 AND 3
2, End hunger, achieve food security and improved nutrition and promote sustainable agriculture undertakes to go even further than just ending hunger and malnutrition by promoting access to healthy diets. This is in turn directly linked to Goal 3, Ensure healthy lives and promote well-being for all at all ages, which is essential for improving the population’s nutrition and quality of life1.
Bearing in mind the wide variety of interconnections between goals 2 and 3, this chapter is aimed at reviewing some of the targets involved in these goals, based on the available information provided by the indicators (see Box 1) and their explicit l ink to hunger and malnutrition, thus describing the status of Latin America and the Caribbean with a view to 2030.
1 There is no doubt regarding the close links between SDGs 1, 2 and 3. The relationship between poverty and hunger has been broadly revised in previous versions of Panorama, while the relationship between SDGs 2 and 3 was analyzed in the 2016 edition of this publication.
| 2 |

PANORAMA OF FOOD AND NUTRITIONAL SECURITY IN LATIN AMERICA AND THE CARIBBEAN
One of the greatest challenges posed by the SDGs is the availability of information and establishing the methodology required for the appropriate monitoring of SDG progress and achievement. After selecting 232 indicators for monitoring the 17 SDGs, efforts are being made to review and develop methods for the collection and treatment of the information required for their reconstruction.
One of the most important commitments of the 2030 Agenda is ensuring that “no one is left behind”. This calls for enhancing understanding and knowledge about the most vulnerable groups. Therefore, SDG indicators should be broken down as far as possible, by income, sex, age, race, ethnicity, migratory status, disability and geographic location, or by other characteristics that may be required (United Nations, 2017).
At present, the disaggregated data required to identify the needs of all population groups is still scarce. This has led to a global effort aimed at improving data
integrity and increasing the availability of such information, in terms of coverage, quality and frequency. Therefore, it is necessary to consider that this process will take time, and that as we gain more knowledge and information, the adjustments and improvements required will be made. It is worth noting that the monitoring of the SDGs will be based on national and standardized data, involving a coordinated effort between national and international statistic systems (United Nations, 2016).
Indicators have been temporarily classified in three levels, based on the available methods and information:a) Level I: Indicators having an established methodology and available data.b) Level II: Indicators having an established methodology but not enough available data.c) Level III: Indicators with methodologies still under development.
Currently, about 65% of SDG indicators are levels I and II (United Nations, 2017).
BOX 1 ON SDG INDICATORS
2017PANORAMA OF FOOD AND NUTRITIONAL SECURITY IN LATIN AMERICA AND THE CARIBBEAN
| 3 |

CHAPTER 1 PROGRESS IN LATIN AMERICA AND THE CARIBBEAN FOR THE FULFILLMENT OF SUSTAINABLE DEVELOPMENT GOALS 2 AND 3
SDG 2: END HUNGER, ACHIEVE FOOD SECURITY AND IMPROVED NUTRITION AND PROMOTE SUSTAINABLE AGRICULTURE SOSTENIBLE
TABLE 1 TARGETS AND SELECTED INDICATORS FOR SDG 2
Targets Indicators
2.1 By 2030 end hunger and ensure access by all people, in particular the poor and people in vulnerable situations including infants, to safe, nutritious and sufficient food all year round.
2.1.1 Undernourishment prevalence
2.1.2 Prevalence of moderate or severe food insecurity in the population, according to the Food Insecurity Experience Scale.
2.2 By 2030, end all forms of malnutrition, including achieving by 2025, the internationally agreed targets on stunting and wasting in children under five years of age, and address the nutritional needs of adolescent girls, pregnant and lactating women, infants and the elderly.
2.2.1 Stunting prevalence (low height for age, standard deviation < -2 from the average growth patterns in children, of the World Health Organization (WHO) among children under the age of 5.
2.2.2 Malnutrition prevalence (low weight for height, standard deviation > +2 or < -2 from the average growth patterns in children, established by the WHO) among children under the age of 5, broken down by type (wasting and overweight).
SOURCE: Report by the Inter-Agency and Expert Group on SDG Indicators (IAEG-SDGs) (United Nations, 2017).
Eradicating hunger and all forms of malnutrition is closely linked to the characteristics of dietary patterns (FAO and PAHO, 2017), which in turn have implications for the structure of food systems. This section will explore goals 2.1 and 2.22, described in Table 1. Other areas that are part of SDG 2, related to food production and other relevant areas of food and nutritional security shall be developed in the second chapter of this publication3.
2 It is important to note that only 6 of the 15 indicators of SDG 2 are currently classified under Level I, and 4 of them are applicable to targets 2.1 and 2.2 (United Nations, 2017).3 For further details, review previous editions of Panorama of Food and Nutritional Security in Latin America and the Caribbean. Available at: http://www.fao.org/americas/recursos/panorama/en/.
| 4 |

2017PANORAMA OF FOOD AND NUTRITIONAL SECURITY IN LATIN AMERICA AND THE CARIBBEAN
TARGET 2.1: END HUNGERTarget 2.1 focuses on access to food (FAO, IFAD and WFP, 2016). It has two indicators: i) the prevalence of undernourishment, which was also used to monitor target 1C of the Millennium Development Goals (indicator 2.1.1), based on the estimated proportion of the population that fails to meet their minimum daily energy requirements for healthy liv ing; and ii) the prevalence of moderate or severe food insecurity, based on the Food Insecurity Experience Scale (indicator 2.1.2), referred to a person’s capacity to access food (see Box 2).
The latest estimates of undernourishment show a global increase. After over a decade of declining rates, in 2015 the number of undernourished people rose to 777 million people from 775.4 million in 2014; and 2016 showed a significant rise of 38 million people, resulting in 815 million undernourished people worldwide. Therefore, the percentage of undernourishment rose from 10.6% in 2015 to 11% in 2016 (Figure 1).
Latin America and the Caribbean is part of this trend. In 2016 a prevalence of 6.6% was observed in undernourishment, accounting for the first increase recorded since this measurement was performed (Figure 1). Therefore, 42.5 million people lack the food required to cover their daily energy needs, accounting for an increase of 2.4 million people, or an increase of 6% of the
SOURCE: FAO, IFAD, UNICEF, WFP AND WHO, 2017.NOTE: * projected values.
FIGURE 1PREVALENCE OF UNDERNOURISHMENT IN THE WORLD, LATIN AMERICA AND THE CARIBBEAN AND SUBREGIONS, ANNUAL FIGURES, 2000-2016
8.1 8.37.1 7.2 7.1 7.1 6.9 6.7 6.5
12.2
7.9
5.4 5.1 4.8 4.7 4.8 5 5.6
23.8 23.3
19.9 19.3 19.4 19.2 18.9 18.417.7
0
5
10
15
20
25
2000 2005 2010 2011 2012 2013 2014 2015 2016
Mesoamerica South America Caribbean
14.714.2
11.5 11.2 11 10.8 10.7 10.611
12
9.1
6.8 6.6 6.4 6.3 6.3 6.3 6.6
0
2
4
6
8
10
12
14
16
2000 2005 2010 2011 2012 2013 2014 2015 2016
World Latinamerica and the Caribbean
| 5 |

CHAPTER 1 PROGRESS IN LATIN AMERICA AND THE CARIBBEAN FOR THE FULFILLMENT OF SUSTAINABLE DEVELOPMENT GOALS 2 AND 3
undernourished population versus the previous year. The foregoing shows the urgency of implementing actions to reverse the trend and channel efforts with a view to eradicate hunger.
On the other hand, FAO also shows indicators for SDG 2.1 in three-year time frames, to keep transitory phenomena from increasing the indicator’s volatility (FAO, 2014). Figure 2 shows the progression of undernourishment in the region4. There has been a stagnation in the proportion of undernourished people since the triennium 2011-13; although, there is an increase in the last estimation period.
As will be shown later, a large part of this result is explained by South America, as it concentrates a larger part of the region’s population. In addition, over the last few years, Latin America and the Caribbean has faced an unfavourable economic scenario. For two consecutive years, they recorded economic downturns, influenced in part by the trajectory in primary commodity prices, which was felt differently in each subregion. Thus, South America influenced a great part of the regional performance, because several countries that are exporters of raw materials faced lower demand and lower prices. On the contrary, Mesoamerica and the Caribbean faced less exposure, given the trade connections that both subregions have with the United States. They also benefited from the low prices of some commodities as they are net primary commodity exporters (FAO, 2017). Overall, this situation increased inflation in some economies, lead to higher unemployment or job insecurity, and increased the number of people living in poverty in the last few years, raising concern regarding the impacts that this entails for food and nutrition security5 .
A subregional analysis confirms what was mentioned earlier. The plateauing decline in regional undernourishment depends greatly on the rise in undernourishment observed in South America (Figures 3 and 4). In South America, the affected population in 2014-16 is 5.1%, showing an increase of 0.3 percentage points versus the 4.8%
4 For the purposes of this document, the term “region” refers to Latin America and the Caribbean.5 For further information, see the section on access in chapter 2 of this document, and the 2016 edition of Panorama.
of the previous three-year period, resulting in 21.5 million undernourished people. Whereas, the proportion of undernourished people shows a small decline versus 2013-15, resulting in 6.7% for the triennium. However, it is important to note that between the 2010-12 and 2013-15 triennials, the proportion has remained at approximately 7%. In absolute terms, the number of undernourished people in Mesoamerica is 11.6 million. Finally, in the Caribbean, undernourishment was 18.3% in the last measurement, registering a decline versus the previous triennial. Undernourishment currently affects 7.7 million Caribbean people, showing a drop versus the previous triennium.
Country-level data confirms the heterogeneity of the region and helps to identify areas where the eradication of hunger shows greater lags (Table 2). Brazil, Cuba and Uruguay register a proportion of undernourished people under 2.5%, followed by Argentina, Barbados, Chile, Mexico, and Trinidad and Tobago; which are below or at 5%. Haiti is the country with the greatest proportion of undernourishment in the region, with nearly 47% of the population being unable to cover its minimum dietary requirements, accounting for almost 5 million undernourished Haitians, equal to more than half of the total affected people in the whole Caribbean region. Antigua and Barbuda, Bolivia and Grenada register an undernourishment rate above 20%.
The countries showing increases in the prevalence of undernourishment in the last period are Argentina, Ecuador, El Salvador, Grenada, Peru and Venezuela. Out of these countries, Venezuela is the one with the most significant increase, with 3.9 percentage points versus the previous triennium. In absolute terms, this implies an increase of 1.3 million people in Venezuela, largely explaining the higher prevalence observed in South America.
On the other hand, as may be observed in Table 2, 21 countries show a decline in the prevalence of undernourishment in the last triennium of the estimate.
As mentioned earlier, undernourishment is an estimate of energy deprivation measured in calories. Due to the new demands set by the 2030 Agenda the scope of this indicator needs to increase. Therefore, progress in hunger reduction
| 6 |

2017PANORAMA OF FOOD AND NUTRITIONAL SECURITY IN LATIN AMERICA AND THE CARIBBEAN
SOURCE: FAO, IFAD, UNICEF, WFP AND WHO, 2017. NOTE: * 2016 values are projected.
FIGURE 2EVOLUTION OF UNDERNOURISHMENT IN LATIN AMERICA AND THE CARIBBEAN, TRIENNIALS FROM 2000-02 TO 2014-16. IN PERCENTAGES (LEFT) AND MILLIONS OF PEOPLE (RIGHT)
11.410.9
10.39.7
9.18.3
7.77.3 7.1 6.8 6.6 6.4 6.4 6.3 6.4
0
2
4
6
8
10
12
14
2000-02
2001-03
2002-04
2003-05
2004-06
2005-07
2006-08
2007-09
2008-10
2009-11
2010-12
2011-13
2012-14
2013-15
2014-16
Prevalence
60.758.7
56.654.0
50.947.5
44.6 42.8 41.7 40.9 40.0 39.4 39.3 39.6 40.7
0
10
20
30
40
50
60
70
2000
-02
2001
-03
2002
-04
2003
-05
2004
-06
2005
-07
2006
-08
2007
-09
2008
-10
2009
-11
2010
-12
2011
-13
2012
-14
2013
-15
2014
-16
Millions of people
| 7 || 7 || 7 |

CHAPTER 1 PROGRESS IN LATIN AMERICA AND THE CARIBBEAN FOR THE FULFILLMENT OF SUSTAINABLE DEVELOPMENT GOALS 2 AND 3
SOURCE: FAO, IFAD, UNICEF, WFP and WHO, 2017.
SOURCE: FAO, IFAD, UNICEF, WFP and WHO, 2017.
FIGURE 3EVOLUTION OF UNDERNOURISHMENT IN LATIN AMERICA AND THE CARIBBEAN SUBREGIONS, 2000-02 TO 2014-16. IN PERCENTAGES
FIGURE 4EVOLUTION OF UNDERNOURISHMENT IN SUBREGIONS, 2000-02 TO 2014-16. IN MILLIONS OF PEOPLE
8.9
11.0
40.8
8.9
11.7
26.9
7.9
11.7
20.4
7.9
11.8
19.6
7.8
11.8
20.0
7.7
11.6
21.5
0
10
20
30
40
50
60
70
2000-02 2005-07 2010-12 2012-14 2013-15 2014-16
Caribbean Mesoamerica South America
23.722.6
19.6 19.2 18.8 18.3
7.8 7.87.1 7.0 6.9 6.7
11.5
7.1
5.1 4.8 4.8 5.1
0
5
10
15
20
25
Caribbean Mesoamerica South America
2000-02 2005-07 2010-12 2012-14 2013-15 2014-16
| 8 |

2017PANORAMA OF FOOD AND NUTRITIONAL SECURITY IN LATIN AMERICA AND THE CARIBBEAN
By decision of UN member countries, FAO is the agency in charge of indicators for target 2.1 of the SDGs: By 2030, end hunger and ensure access by all people, in particular the poor and people in vulnerable situations including infants, to safe, nutritious and sufficient food all year round. To this end, FAO has worked on a more adequate metric to account for progress in SDG 2, and particularly target 2.1, aimed at identifying the population groups affected by hunger and food insecurity inside countries, including countries where hunger has already become a minor issue.
To meet this goal, the Food Insecurity Experience Scale (FIES) supplements the prevalence of undernourishment indicator, thus allowing a better characterization of hunger. Both indicators are related but not equivalent, given that their measurement targets and methodologies are different. Therefore, they call for a joint analysis to improve the understanding of hunger and food insecurity.
The prevalence of undernourishment estimates the percentage of people who fail to cover their energy requirements for healthy living. The inputs required for this estimate are: 1) average dietary energy consumption; 2) dispersion of dietary energy consumption; and 3) the minimum consumption threshold for healthy living. FAO is permanently working on improving its estimates, leading to methodological reviews and the expansion of available information. The estimates presented this year comprise a series of innovations versus previous estimates, which include:
- Improvements in energy supply estimates.- More updated estimates to measure the dispersion of consumed energy, using information based on the national surveys available.
- Updated estimates of energy requirements, after updating height, sex and gender data, via the information gathered in demographic and health surveys.
The FIES helps to estimate the prevalence of moderate and severe levels of food insecurity, using information gathered from surveys of people over 15 years of age. Thus, the FIES offers estimates on the proportion of the population that struggles to access food. In general terms, it is to be expected that the estimated prevalence of food insecurity experience and the prevalence of undernourishment should show similar trends. However, the FIES helps to detect the presence of broader issues linked to access restrictions. To this end, the instrument has 8 questions that help to determine the severity of food insecurity. These questions gather information about the last 12 months, on whether the person surveyed has been worried about not having enough food due to lack of money or other resources; whether he/she has been forced to decrease the quality or quantity of the food consumed; or whether he/she has gone whole days without eating.
To have comparable prevalence rates among countries, a global scale of FIES is determined and the country scales are then calibrated against the global scale, thus arriving at comparable severity metrics. For the first measurement period of this indicator, an average has been estimated for Latin America and for the Mesoamerica and South America subregions. In addition, there are national estimates for seven countries in the region. In the coming years, and within the framework of the development of the 2030 agenda, it is expected that there will be greater availability of information, in order to extend the coverage of the indicator to the rest of the LAC countries.
BOX 2 INDICATORS FOR A COMPREHENSIVE ANALYSIS OF FOOD AND NUTRITIONAL SECURITY
SOURCE: FAO, IFAD, UNICEF, WFP and WHO, 2017.
| 9 |

CHAPTER 1 PROGRESS IN LATIN AMERICA AND THE CARIBBEAN FOR THE FULFILLMENT OF SUSTAINABLE DEVELOPMENT GOALS 2 AND 3
has been measured for the first time by means of the Food Insecurity Experience Scale (FIES)6. As pointed out in Box 2, these two indicators are complementary and provide a fuller picture of the hunger and food insecurity phenomena.
Figure 5 shows the estimates of the food insecurity prevalence indicator. As shown, in Mesoamerica, 5.7% of the population registers severe food insecurity for the 2014-16 triennium, accounting for 9.9 million affected people. While in South America, 5.1% of the population is afflicted by severe food insecurity, accounting for over 21 million on average for 2014-16.
6 Both estimates, the FIES and undernourishment, show strong degrees of correlation (FAO, IFAD, UNICEF, WFP and WHO, 2017). Although the two indicators account for the lack or deprivation of food, it is important to bear in mind that they involve different definitions, concepts and methodologies (see Box 2). For instance, drought and its consequences on food security may not be fully captured by the undernourishment indicator, given that the impacts of drought will be captured by the food balance sheets, if such information is available. The reason for this is that data collection does not capture such effects automatically. However, the FIES may capture short-term fluctuations in the conditions that affect access to food.
An analysis of the national estimates available shows that El Salvador and Guatemala register a proportion above 10%. Ecuador shows a prevalence of food insecurity of 6.6%, whereas Brazil, Chile, Costa Rica and Mexico register metrics under 5% on average for 2014-16.
A joint analysis of the two indicators for target 2.1 raises concern. In the first place, undernourishment has increased in the last triennials, whereas in previous triennials the decline in this indicator had stagnated or slowed down. Although there is no benchmark for severe food insecurity yet, because this is the first period it has been measured, it shows values that are in
SOURCE: FAO, IFAD, UNICEF, WFP and WHO, 2017.
FIGURE 5SEVERE FOOD INSECURITY STATUS IN LATIN AMERICA, 2014-16. IN PERCENTAGES (LEFT) AND MILLIONS OF PEOPLE (RIGHT)
5.7
5.1
0.3
3.3
3.8
4.8
6.6
10.9
12.4
0 2 4 6 8 10 12 14
Mesoamerica
South America
Brazil
Mexico
Chile
Costa Rica
Ecuador
Guatemala
El Salvador
Prevalence (%)
9.9
21.4
0.7
4.2
0.7
0.2
1.1
1.8
0.8
0 5 10 15 20 25
Mesoamerica
South America
Brazil
Mexico
Chile
Costa Rica
Ecuador
Guatemala
El Salvador
Millions of people
| 10 |

2017PANORAMA OF FOOD AND NUTRITIONAL SECURITY IN LATIN AMERICA AND THE CARIBBEAN
TABLE 2 EVOLUTION OF UNDERNOURISHMENT IN LATIN AMERICAN AND CARIBBEAN COUNTRIES, 2004-06 TO 2014-16. IN PERCENTAGES (LEFT) AND MILLIONS OF PEOPLE (RIGHT)
SOURCE: FAO, IFAD, UNICEF, WFP and WHO, 2017.
Prevalence (%) Millions of People
2004-06 2010-12 2012-14 2013-15 2014-16 2004-06 2010-12 2012-14 2013-15 2014-16
Antigua and Barbuda 31.5 27.8 27.1 27.2 26.7 <0.1 <0.1 <0.1 <0.1 <0.1 N/A
Argentina 4.7 3.9 3.6 3.4 3.6 1.9 1.6 1.5 1.5 1.6
Bahamas 10 11.9 10.7 10.3 10 <0.1 <0.1 <0.1 <0.1 <0.1 N/A
Barbados 5.9 4.9 4.6 4.5 4.4 <0.1 <0.1 <0.1 <0.1 <0.1 N/A
Belize 4.6 5.8 6.3 6.3 6.2 <0.1 <0.1 <0.1 <0.1 <0.1 N/A
Bolivia 30.3 24.6 21.9 20.8 20.2 2.8 2.5 2.3 2.2 2.2 =
Brazil 4.5 <2.5 <2.5 <2.5 <2.5 N/A 8.6 n.s. n.s. n.s. n.s. N/A
Chile 4 4.1 3.8 3.8 3.7 0.6 0.7 0.7 0.7 0.7 =
Colombia 9.7 10.9 8.8 7.7 7.1 4.2 5 4.2 3.7 3.4
Costa Rica 5.4 5.2 5.6 5.7 5.6 0.2 0.2 0.3 0.3 0.3 =
Cuba <2.5 <2.5 <2.5 <2.5 <2.5 N/A n.s. n.s. n.s. n.s. n.s. N/A
Dominica 5.7 5.6 6.1 6 5.8 <0.1 <0.1 <0.1 <0.1 <0.1 N/A
Dominican Republic 24.4 14.6 13.6 13.7 13.5 2.3 1.5 1.4 1.4 1.4 =
Ecuador 17 11.7 11.7 11.9 12.1 2.3 1.8 1.8 1.9 1.9 =
El Salvador 10.7 12.9 12.4 12.1 12.3 0.6 0.8 0.8 0.7 0.8
Grenada 27.8 25.5 25.3 25.4 25.5 <0.1 <0.1 <0.1 <0.1 <0.1 N/A
Guatemala 16 15.6 16.4 16.2 15.6 2.1 2.4 2.6 2.6 2.5
Guyana 9.1 11 9.4 8.9 8.5 <0.1 <0.1 <0.1 <0.1 <0.1 N/A
Haiti 57.1 49.6 49.4 48.2 46.8 5.3 5 5.2 5.1 5
Honduras 17.2 15.5 15.7 15.8 14.8 1.2 1.2 1.2 1.3 1.2
Jamaica 6.9 9 9.5 9.2 8.4 0.2 0.2 0.3 0.3 0.2
Mexico 5.5 4.6 4.5 4.4 4.2 6.1 5.5 5.5 5.5 5.4
Nicaragua 24.4 20 17.9 17.1 17 1.3 1.2 1.1 1 1 =
Panama 23.1 11.9 9.9 9.5 9.3 0.8 0.4 0.4 0.4 0.4 =
Paraguay 11.9 11.9 12.3 12.4 12 0.7 0.7 0.8 0.8 0.8 =
Peru 19.6 10.1 8.3 7.6 7.9 5.4 3 2.5 2.4 2.5
Saint Lucia 14.2 17.2 17.2 17 17 = <0.1 <0.1 <0.1 <0.1 <0.1 N/A
Saint Vincent and the Grenadines
9.1 6.4 6 6 6=
<0.1 <0.1 <0.1 <0.1 <0.1 N/A
Suriname 11.1 8.1 8.3 8.1 7.9 <0.1 <0.1 <0.1 <0.1 <0.1 N/A
Trinidad and Tobago
11.8 8.6 6.5 5.8 4.8 0.2 0.1 <0.1 <0.1 <0.1 N/A
Uruguay 4.3 <2.5 <2.5 <2.5 <2.5 N/A 0.1 n.s. n.s. n.s. n.s. N/A
Venezuela 10.5 3.7 6.5 9.1 13 2.8 1.1 2 2.8 4.1
Latin America and The Caribbean
9.1 6.6 6.4 6.3 6.4 50.9 40 39.3 39.6 40.7
Caribbean 23.4 19.6 19.2 18.8 18.3 9.1 7.9 7.9 7.8 7.7
Central America 8.3 7.1 7 6.9 6.7 12.3 11.7 11.8 11.8 11.6
South America 7.9 5.1 4.8 4.8 5.1 29.5 20.4 19.6 20 21.5
| 11 || 11 || 11 |
CHAPTER 1 PROGRESS IN LATIN AMERICA AND THE CARIBBEAN FOR THE FULFILLMENT OF SUSTAINABLE DEVELOPMENT GOALS 2 AND 3
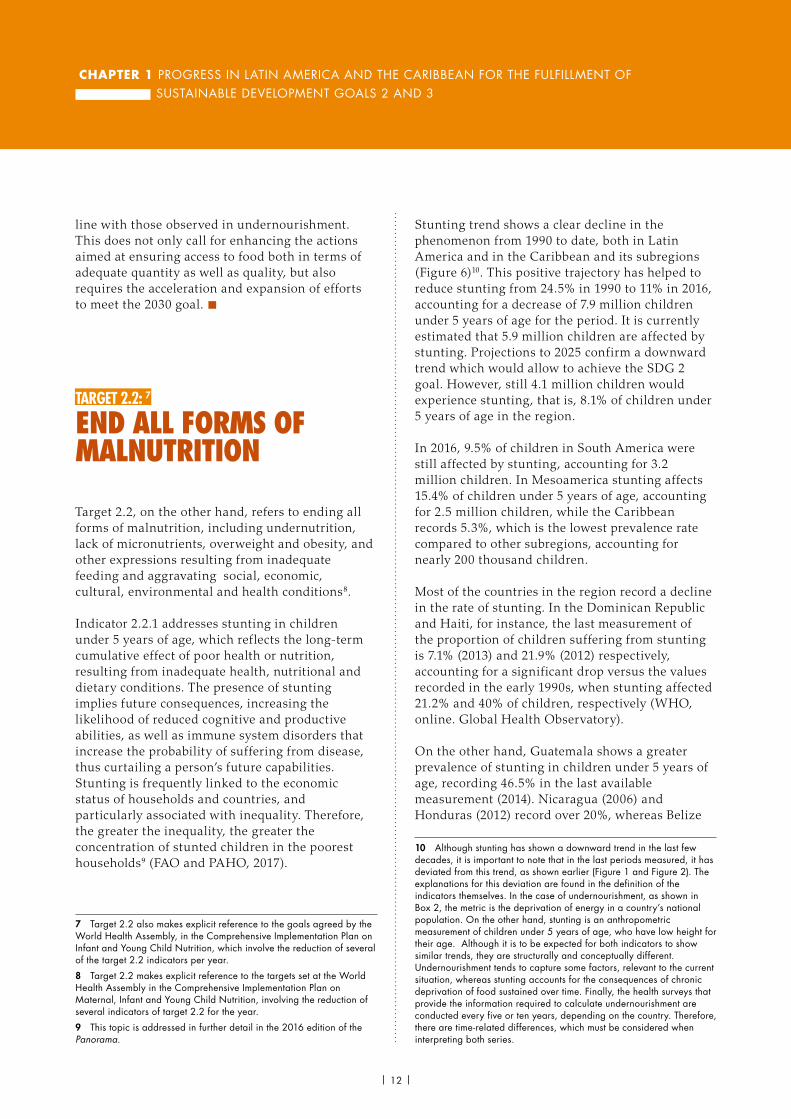
line with those observed in undernourishment. This does not only call for enhancing the actions aimed at ensuring access to food both in terms of adequate quantity as well as quality, but also requires the acceleration and expansion of efforts to meet the 2030 goal. n
TARGET 2.2: 7 END ALL FORMS OF MALNUTRITION
Target 2.2, on the other hand, refers to ending all forms of malnutrition, including undernutrition, lack of micronutrients, overweight and obesity, and other expressions resulting from inadequate feeding and aggravating social, economic, cultural, environmental and health conditions8.
Indicator 2.2.1 addresses stunting in children under 5 years of age, which reflects the long-term cumulative effect of poor health or nutrition, resulting from inadequate health, nutritional and dietary conditions. The presence of stunting implies future consequences, increasing the likelihood of reduced cognitive and productive abilities, as well as immune system disorders that increase the probability of suffering from disease, thus curtailing a person’s future capabilities. Stunting is frequently linked to the economic status of households and countries, and particularly associated with inequality. Therefore, the greater the inequality, the greater the concentration of stunted children in the poorest households9 (FAO and PAHO, 2017).
7 Target 2.2 also makes explicit reference to the goals agreed by the World Health Assembly, in the Comprehensive Implementation Plan on Infant and Young Child Nutrition, which involve the reduction of several of the target 2.2 indicators per year.8 Target 2.2 makes explicit reference to the targets set at the World Health Assembly in the Comprehensive Implementation Plan on Maternal, Infant and Young Child Nutrition, involving the reduction of several indicators of target 2.2 for the year.9 This topic is addressed in further detail in the 2016 edition of the Panorama.
Stunting trend shows a clear decline in the phenomenon from 1990 to date, both in Latin America and in the Caribbean and its subregions (Figure 6)10. This positive trajectory has helped to reduce stunting from 24.5% in 1990 to 11% in 2016, accounting for a decrease of 7.9 million children under 5 years of age for the period. It is currently estimated that 5.9 million children are affected by stunting. Projections to 2025 confirm a downward trend which would allow to achieve the SDG 2 goal. However, still 4.1 million children would experience stunting, that is, 8.1% of children under 5 years of age in the region.
In 2016, 9.5% of children in South America were still affected by stunting, accounting for 3.2 million children. In Mesoamerica stunting affects 15.4% of children under 5 years of age, accounting for 2.5 million children, while the Caribbean records 5.3%, which is the lowest prevalence rate compared to other subregions, accounting for nearly 200 thousand children.
Most of the countries in the region record a decline in the rate of stunting. In the Dominican Republic and Haiti, for instance, the last measurement of the proportion of children suffering from stunting is 7.1% (2013) and 21.9% (2012) respectively, accounting for a significant drop versus the values recorded in the early 1990s, when stunting affected 21.2% and 40% of children, respectively (WHO, online. Global Health Observatory).
On the other hand, Guatemala shows a greater prevalence of stunting in children under 5 years of age, recording 46.5% in the last available measurement (2014). Nicaragua (2006) and Honduras (2012) record over 20%, whereas Belize
10 Although stunting has shown a downward trend in the last few decades, it is important to note that in the last periods measured, it has deviated from this trend, as shown earlier (Figure 1 and Figure 2). The explanations for this deviation are found in the definition of the indicators themselves. In the case of undernourishment, as shown in Box 2, the metric is the deprivation of energy in a country’s national population. On the other hand, stunting is an anthropometric measurement of children under 5 years of age, who have low height for their age. Although it is to be expected for both indicators to show similar trends, they are structurally and conceptually different. Undernourishment tends to capture some factors, relevant to the current situation, whereas stunting accounts for the consequences of chronic deprivation of food sustained over time. Finally, the health surveys that provide the information required to calculate undernourishment are conducted every five or ten years, depending on the country. Therefore, there are time-related differences, which must be considered when interpreting both series.
| 12 |

2017PANORAMA OF FOOD AND NUTRITIONAL SECURITY IN LATIN AMERICA AND THE CARIBBEAN
SOURCE: WHO (online). Global Health Observatory (GHO) data.
FIGURE 6EVOLUTION OF STUNTING PREVALENCE IN LATIN AMERICA AND THE CARIBBEAN, BY SUBREGION. 1990 – 2025, IN PERCENTAGES
24.5
18.4
13.4
11.0
8.1
16.0
10.6
6.95.3
3.5
33.7
25.5
18.7
15.4
11.3
21.4
15.8
11.59.5
7.0
0
5
10
15
20
25
30
35
LAC Caribbean Mesoamerica South America
1990 2000 2010 2016 2025
(2011) and Panama (2008) record nearly 19%. Chile (2014), Santa Lucia (2012) and Costa Rica (2008) show the lowest rates in the region, with 1.8%, 2.5% and 5.6% respectively (Figure 7).
Indicator 2.2.2 addresses the co-existence of wasting and overweight in children under 5 years of age11. Wasting is defined as low weight for height and it accounts for inadequate or insufficient nutrient intake in the short run. Wasting may also facilitate the presence of infections or diseases, implying a significant risk of mortality when not addressed early (FAO and PAHO, 2017). On the other hand, overweight resulting from unhealthy lifestyles involving excessive intake of food and/or calorie dense foods containing high levels of sodium and fat, leads to weight gain and the accumulation of fat, which is in turn linked to some non-communicable diseases (NCDs) that will be analyzed further below (FAO and PAHO, 2017).
Figures 8 and 9 show the status of the two phenomena at a regional and country level. As may be observed, in 2016 wasting affected 1.3% of
11 It should be noted that although the indicators for SDG 2 account for several forms of malnutrition, they do not capture some manifestations such as micronutrient deficiency. Box 4 provides information on the evolution of these indicators in the region.
children in Latin America and the Caribbean, with a prevalence below the values observed worldwide. The countries most affected by this phenomenon are Barbados, Guyana, Haiti and Trinidad and Tobago, with a prevalence above 5%.
Overweight affects 7% of children under 5 years of age in Latin America and the Caribbean, in a proportion that exceeds the global value. There is a concern for the increased risk of diseases and other health and psychosocial complications in childhood and adolescence, in addition to increasing the probability that an overweight child may present this situation in adulthood, and develop some NCDs such as cardiovascular diseases, diabetes or various types of cancer, which may lead to significant consequences for their health and personal development (see Box 3). n
| 13 |

CHAPTER 1 PROGRESS IN LATIN AMERICA AND THE CARIBBEAN FOR THE FULFILLMENT OF SUSTAINABLE DEVELOPMENT GOALS 2 AND 3
FIGURE 7EVOLUTION OF STUNTING PREVALENCE IN COUNTRIES OF LATIN AMERICA AND THE CARIBBEAN, BY SUBREGION. DIFFERENT YEARS, IN PERCENTAGES (LEFT AXIS) AND THOUSANDS OF CHILDREN (RIGHT AXIS)
SOURCE: WHO (online). Global Health Observatory (GHO) data.
0
50
100
150
200
250
300
0
5
10
15
20
25
HTI(2012)
BRB(2012)
DOM(2013)
CUB(2000)
JAM(2012)
TTO(2000)
LCA(2012)
Prevalence Number of children
Caribbean
0
500
1.000
1.500
2.000
0
10
20
30
40
50
GTM(2015)
NIC(2006)
HND(2012)
BLZ(2011)
PAN(2008)
SLV(2014)
MEX(2012)
CRI(2008)
Prevalence Number of children
Mesoamerica
0
200
400
600
800
1.000
1.200
1.400
0
5
10
15
20
25
30
ECU(2012)
BOL(2012)
PER(2014)
VEN(2009)
COL(2010)
GUY(2014)
PRY(2012)
URY(2011)
SUR(2010)
ARG(2005)
BRA(2007)
CHL(2014)
Prevalence Numbre of children
South America
| 14 |

2017PANORAMA OF FOOD AND NUTRITIONAL SECURITY IN LATIN AMERICA AND THE CARIBBEAN
SOURCE: WHO (online). Global Health Observatory (GHO) data.
SOURCE: WHO (online). Global Health Observatory (GHO) data.
FIGURE 8PREVALENCE OF WASTING AMONG CHILDREN UNDER 5 YEARS OF AGE, LATIN AMERICAN, CARIBBEAN AND GLOBAL VALUES, IN 2016 (LEFT), AND IN COUNTRIES IN LATIN AMERICA AND THE CARIBBEAN, IN DIFFERENT YEARS (RIGHT).
FIGURE 9PREVALENCE OF OVERWEIGHT AMONG CHILDREN UNDER 5 YEARS OF AGE, LATIN AMERICAN, CARIBBEAN AND GLOBAL VALUES, IN 2016 (LEFT), AND IN COUNTRIES OF LATIN AMERICA AND THE CARIBBEAN (RIGHT).
0,9
1,3
1,3
3,0
7,7
0 2 4 6 8
Mesoamerica
LAC
South America
Caribbean
World
0.3
0.6
0.7
0.9
1.0
1.3
1.4
1.5
1.6
1.6
1.6
2.0
2.3
2.4
2.6
3.0
3.3
3.7
4.1
5.0
5.2
5.2
6.4
6.8
0 2 4 6 8
CHL(2014)
PER(2014)
GTM(2015)
COL(2010)
CRI(2008)
URY(2011)
HND(2012)
NIC(2006)
BRA(2007)
BOL(2012)
MEX(2012)
SLV(2014)
ECU(2012)
DOM(2013)
PRY(2012)
JAM(2012)
BLZ(2011)
LCA(2012)
VEN(2009)
SUR(2010)
HTI(2012)
TTO(2000)
GUY(2014)
BRB(2012)
6.0
6.0
6.9
7.0
7.4
0 2 4 6 8
Mesoamerica
World
Caribbean
LAC
South America
0.9
1.3
1.3
3.0
7.7
0 2 4 6 8
Mesoamerica
LAC
South America
Caribbean
World
| 15 |

CHAPTER 1 PROGRESS IN LATIN AMERICA AND THE CARIBBEAN FOR THE FULFILLMENT OF SUSTAINABLE DEVELOPMENT GOALS 2 AND 3
Obesity is a growingly widespread phenomenon in the region. According to the latest calculations, 24 countries in Latin America and the Caribbean record a proportion of obese people in values close to or above 20% of the population. For instance, in Uruguay, Antigua and Barbuda, Argentina and Trinidad and Tobago, nearly 29% of the population is obese; while Chile registers 30% and the Bahamas 32%. On the contrary, the lowest rates are observed in Haiti, with 11%, and Honduras, Bolivia, Guatemala, Paraguay, Nicaragua and Ecuador, with rates under 20%. At a regional level, obesity rates have generally increased in all countries, between 1980 and 2014, being more prevalent in women, as shown in Figure 3.1.
Overweight and obesity represent an imbalance between food intake and energy expenditure, with the subsequent body fat accumulation that poses a health risk. This phenomenon has multiple causes, including changes in eating patterns in the region, with an increased availability of ultra-processed products (with high sugar, fat and salt content) and a decline in
traditional dishes prepared with fresh and healthy foods (FAO and PAHO, 2017). Compounded by sedentary life styles, long work hours, deregulation of marketing and advertising of unhealthy food products, tax incentives and other market failures that favour products that promote weight gain, in addition to urbanization processes without planning for a more active and less motorized mobility; the foregoing creates a context that facilitates weight gain and obesity1.
Overweight and obesity have serious consequences, including a greater likelihood of developing non-communicable diseases (NCDs), which as shown in this chapter are among the leading causes of death by disease in the world. It is important to note that NCDs, such as cardiovascular disease, diabetes, hypertension and cancer are among the 10 leading causes of death in the countries in the region.
1 Source: http://www.who.int/mediacentre/factsheets/fs311/es/, revised on 15/07/2017.
BOX 3ADULT OBESITY
| 16 |

2017PANORAMA OF FOOD AND NUTRITIONAL SECURITY IN LATIN AMERICA AND THE CARIBBEAN
FIGURE 3.1 EVOLUTION OF OBESITY RATES (BMI > 30 KG/M2) AMONG THE ADULT POPULATION (OVER 18) BY GENDER AND COUNTRIES IN LATIN AMERICA AND THE CARIBBEAN, 1980-2014
6.7
16 16.117.8 17 16.6
15.5
18.7
15.2
20.7 20.9 21.1
24.6
1.52.9 3
5.62.9 3.6 3.1
4.7 3.8 4.3 3.9 4.5
8.3
0
5
10
15
20
25
30
35
40
HTI DOM VCT CUB LCA DMA GRD BRB JAM KNA TTO ATG BHS
2014 1980
Caribbean (Male)
17
28.5 29.1 29.4 30.3 30.8 3132.8 33 33.9 34.3
35.637.2
4.8
9 9.7
14.1
9.411.5
9.9
13.2 13.7 13.1 12.314.3
20.9
0
5
10
15
20
25
30
35
40
HTI DOM VCT CUB LCA DMA GRD BRB JAM KNA TTO ATG BHS
2014 1980
Caribbean (Female)
23.9 24.225.3
26.728.3 28.5
30.432.4
7.79.4
10.8 10.9 10.6 10.312.1
15.4
0
5
10
15
20
25
30
35
40
HND GTM NIC SLV BLZ CRI PAN MEX
2014 1980
Mesoamerica (Female)
2223.1 23.6 24 24.6 25.4
29.4 30.1 30.3 31.3 32.2 32.8
6.58.5 9.1 9.5
10.8 10.9
16.315.1
10.5
15.317.4
15
0
5
10
15
20
25
30
35
40
PRY BOL ECU BRA COL PER VEN ARG GUY URY SUR CHL
2014 1980
South America (Female)
12.313.4 12.6
15.7 15
19.1 19.8
23.7
3.2 3.9 4.8 4.6 4.3 5 5.47.8
0
5
10
15
20
25
30
35
40
HND GTM NIC SLV BLZ CRI PAN MEX
2014 1980
Mesoamerica (Male)
1512.4
14.517.1
15.8 15
21.9
26.7
13.9
23.5
18.6
24.8
3.6 3.8 3.9 4.7 5 5
8.6
12.5
3.4
10.5
5.7
10
0
5
10
15
20
25
30
35
40
PRY BOL ECU BRA COL PER VEN ARG GUY URY SUR CHL
2014 1980
South America (Male)
SOURCE: Global Health Observatory (GHO) (OMS, en línea).
BOX 3 (CONTINUATION)
| 17 |

CHAPTER 1 PROGRESS IN LATIN AMERICA AND THE CARIBBEAN FOR THE FULFILLMENT OF SUSTAINABLE DEVELOPMENT GOALS 2 AND 3
SDG 3: ENSURE HEALTHY LIVES AND PROMOTE WELL-BEING FOR ALL AT ALL AGES
This section provides an analysis of the targets and indicators related to maternal and child mortality and non-communicable diseases (NCDs), given their close link with SDG 2 (FAO and PAHO, 2017). Table 3 shows the targets and indicators to be considered.
Target 3.1 proposes a reduction in the maternal mortality ratio to less than 70 deaths per 100,000 live births. Globally, nearly all maternal deaths occur in low-income settings and they could be prevented (United Nations, 2016). Practically all countries in Latin America and the Caribbean have registered progress since 1990. According to the latest figures available, 17 countries of the region are already below the target value. Haiti is the country with the highest ratio, with 359 deaths per 100,000 live births; whereas, Uruguay registered 15
TABLE 3 TARGETS AND SELECTED INDICATORS FOR SDG 3
Target Indicators
3.1 By 2030, reduce the global maternal mortality ratio to less than 70 per 100,000 live births. 3.1.1 Maternal mortality ratio
3.2 By 2030, end preventable deaths of newborns and children under 5 years of age, with all countries aiming to reduce neonatal mortality to at least as low as 12 per 1000 live births and under-5 mortality to at least as low as 25 per 1000 live births.
3.2.1 Under-5 mortality rate
3.2.2 Neonatal mortality rate
3.4 By 2030, reduce by one third premature mortality from non-communicable diseases through prevention and treatment and promote mental health and well-being.
3.4.1 Mortality rate attributed to cardiovascular disease, cancer, diabetes or chronic respiratory diseases.
SOURCE: United Nations, 2017.
deaths per 100,000 live births. The rates observed for Bahamas, Guyana, Jamaica, Suriname and, to a lesser extent, Santa Lucia and Venezuela have worsened from 1990 to date (Figure 10).
Target 3.2 proposes a reduction in the deaths of neonates and children under 5 years of age, depending on the following indicators: the under-5 mortality rate (indicator 3.2.1) and the neonatal mortality rate (indicator 3.2.2). The targets to be met by 2030 are for 25 and 12 deaths per 1,000 live births, respectively. It should be noted that globally 45%12 of childhood deaths are related to malnutrition, given that children are more vulnerable to developing serious diseases. Children suffering from severe wasting are more likely to die from diseases such as diarrhea and pneumonia13.
According to the latest estimations, all the countries observed in Latin America and the Caribbean have advanced towards the reduction in the mortality rate of children under 5 years of age, compared to in 1990 (Figure 11). This trend is partially explained by the coverage of health care services and public policies implemented by countries in this area. Programs for maternal and
12 Obtained from http://www.who.int/mediacentre/factsheets/fs178/es/, revised on 07/19/2017.13 Ibid.
| 18 |

2017PANORAMA OF FOOD AND NUTRITIONAL SECURITY IN LATIN AMERICA AND THE CARIBBEAN
SOURCE: WHO (online). Global Health Observatory (GHO) data.
FIGURE 10MATERNAL MORTALITY RATIO PER 100,000 LIVE BIRTHS IN COUNTRIES OF LATIN AMERICA AND THE CARIBBEAN, 1990-2015
0
100
200
300
400
500
600
700
BRB GRD CUB VCT LCA TTO BHS JAM DOM HTI
2015 1990 Goal
Caribbean
0
100
200
300
400
500
600
700
CRI BLZ MEX SLV GTM PAN HND NIC
2015 1990 Goal
Mesoamerica
0
100
200
300
400
500
600
700
URY CHL BRA ARG COL ECU PER VEN PRY SUR BOL GUY
2015 1990 Goal
South America
| 19 |

CHAPTER 1 PROGRESS IN LATIN AMERICA AND THE CARIBBEAN FOR THE FULFILLMENT OF SUSTAINABLE DEVELOPMENT GOALS 2 AND 3
SOURCE: WHO (online). Global Health Observatory (GHO) data.
FIGURE 11UNDER-5 MORTALITY PER 1,000 LIVE BIRTHS IN COUNTRIES OF LATIN AMERICA AND THE CARIBBEAN, 1990-2015
0
20
40
60
80
100
120
140
160
ATG BHS BRB CUB DMA DOM GRD HTI JAM KNA LCA VCT TTO
2015 1990 Goal
Caribbean
0
20
40
60
80
100
120
140
160
BLZ CRI SLV GTM HND MEX NIC PAN
2015 1990 Goal
Mesoamerica
0
20
40
60
80
100
120
140
160
ARG BOL BRA CHL COL ECU GUY PRY PER SUR URY VEN
2015 1990 Goal
South America
| 20 |

2017PANORAMA OF FOOD AND NUTRITIONAL SECURITY IN LATIN AMERICA AND THE CARIBBEAN
SOURCE: WHO (online). Global Health Observatory (GHO) data.
FIGURE 12NEONATAL MORTALITY RATE PER 1,000 LIVE BIRTHS IN COUNTRIES OF LATIN AMERICA AND THE CARIBBEAN, 1990-2015
0
5
10
15
20
25
30
35
40
45
ATG BHS BRB CUB DMA DOM GRD HTI JAM KNA LCA VCT TTO
2015 1990 Goal
Caribbean
0
5
10
15
20
25
30
35
40
45
BLZ CRI SLV GTM HND MEX NIC PAN
2015 1990 Goal
Mesoamerica
0
5
10
15
20
25
30
35
40
45
ARG BOL BRA CHL COL ECU GUY PRY PER SUR URY VEN
2015 1990 Goal
South America
| 21 |
CHAPTER 1 PROGRESS IN LATIN AMERICA AND THE CARIBBEAN FOR THE FULFILLMENT OF SUSTAINABLE DEVELOPMENT GOALS 2 AND 3
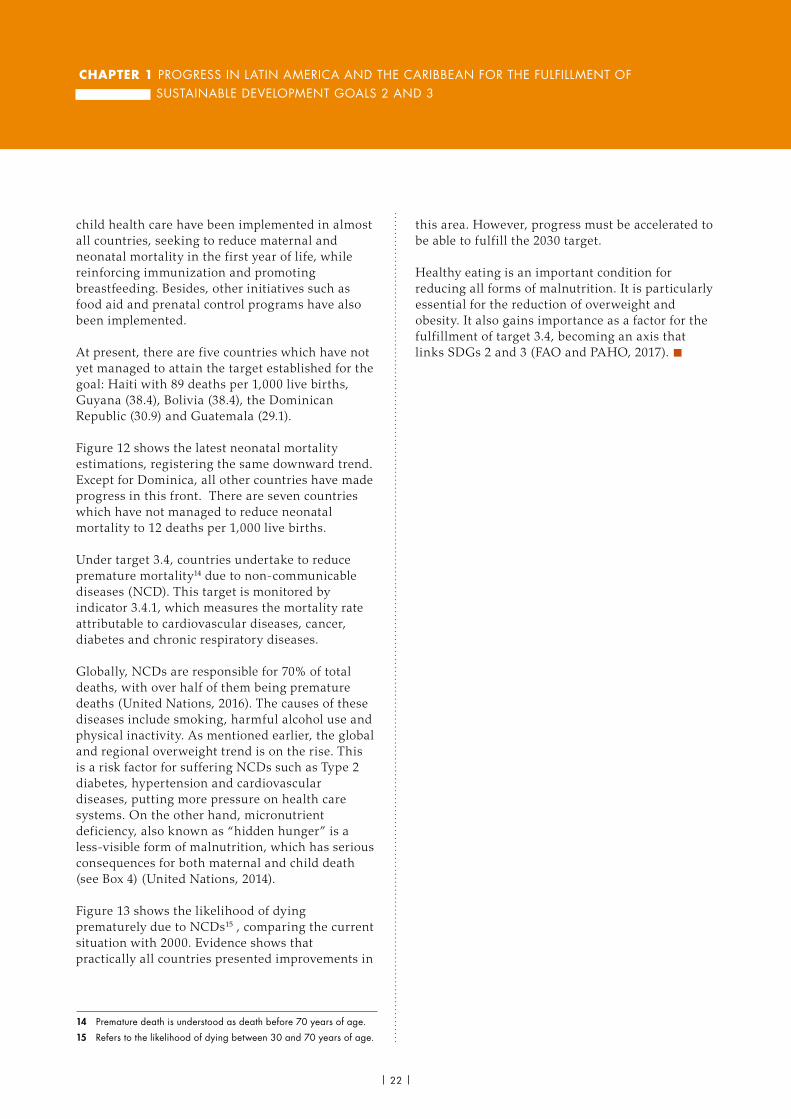
child health care have been implemented in almost all countries, seeking to reduce maternal and neonatal mortality in the first year of life, while reinforcing immunization and promoting breastfeeding. Besides, other initiatives such as food aid and prenatal control programs have also been implemented.
At present, there are five countries which have not yet managed to attain the target established for the goal: Haiti with 89 deaths per 1,000 live births, Guyana (38.4), Bolivia (38.4), the Dominican Republic (30.9) and Guatemala (29.1).
Figure 12 shows the latest neonatal mortality estimations, registering the same downward trend. Except for Dominica, all other countries have made progress in this front. There are seven countries which have not managed to reduce neonatal mortality to 12 deaths per 1,000 live births.
Under target 3.4, countries undertake to reduce premature mortality14 due to non-communicable diseases (NCD). This target is monitored by indicator 3.4.1, which measures the mortality rate attributable to cardiovascular diseases, cancer, diabetes and chronic respiratory diseases.
Globally, NCDs are responsible for 70% of total deaths, with over half of them being premature deaths (United Nations, 2016). The causes of these diseases include smoking, harmful alcohol use and physical inactivity. As mentioned earlier, the global and regional overweight trend is on the rise. This is a risk factor for suffering NCDs such as Type 2 diabetes, hypertension and cardiovascular diseases, putting more pressure on health care systems. On the other hand, micronutrient deficiency, also known as “hidden hunger” is a less-visible form of malnutrition, which has serious consequences for both maternal and child death (see Box 4) (United Nations, 2014).
Figure 13 shows the likelihood of dying prematurely due to NCDs15 , comparing the current situation with 2000. Evidence shows that practically all countries presented improvements in
14 Premature death is understood as death before 70 years of age. 15 Refers to the likelihood of dying between 30 and 70 years of age.
this area. However, progress must be accelerated to be able to fulfill the 2030 target.
Healthy eating is an important condition for reducing all forms of malnutrition. It is particularly essential for the reduction of overweight and obesity. It also gains importance as a factor for the fulfillment of target 3.4, becoming an axis that links SDGs 2 and 3 (FAO and PAHO, 2017). n
| 22 |

2017PANORAMA OF FOOD AND NUTRITIONAL SECURITY IN LATIN AMERICA AND THE CARIBBEAN
SOURCE: WHO (online). Global Health Observatory (GHO) data.
FIGURE 13LIKELIHOOD OF PREMATURE MORTALITY DUE TO NON-COMMUNICABLE DISEASES: CARDIOVASCULAR, CANCER, DIABETES AND RESPIRATORY DISEASES, BETWEEN 30 AND 70 YEARS OF AGE, 2000 AND 2015. IN PERCENTAGES
19
16
1917
21
1617
16
19 19
2725
2324
18
15
27
20
30
2625
24
0
5
10
15
20
25
30
ATG BHS BRD CUB DOM GRD HTI JAM LCA TTO VCT
Caribbean
2000 2015 Goal
26
22
14
11
15 1517
14
1715
19
1615
1416
14
0
5
10
15
20
25
30
BLZ CRI GTM HND MEX NIC PAN SLV
Mesoamerica
2000 2015 Goal
20
17
20
16
25
17
14
11
19
1517
13
28 28
1513
21
18
28
2120
17
2018
0
5
10
15
20
25
30
ARG BOL BRA CHL COL ECU GUY PER PRY SUR URY VEN
South America
2000 2015 Goal
| 23 |

CHAPTER 1 PROGRESS IN LATIN AMERICA AND THE CARIBBEAN FOR THE FULFILLMENT OF SUSTAINABLE DEVELOPMENT GOALS 2 AND 3
Micronutrient deficiency, understood as the lack of vitamins and minerals, is added to the challenges of reducing malnutrition, overweight and obesity. Known also as “hidden hunger”, it has implications for health, and physical and cognitive development, with direct effects on quality of life. One of the consequences is anemia, caused by the lack of iron or the development of some diseases, becoming one of the nutritional issues with more significant health implications, especially during pregnancy, as it is a risk factor for maternal death and low birth weight (FAO and PAHO, 2017). In the first years of life, anemia has severe effects on the psychomotor development of children,
affecting their learning capacity, increasing the risk of disease and even death. On the other hand, anemia in women of child-bearing age (15-49), increases the likelihood of maternal and child mortality, turning it into a first order public health issue (Mujica-Coopman et.al, 2015).
Between 2005 and 2015, most countries of the region have registered a decline in the proportion of women in child-bearing age with anemia, as shown in Figure 4.1.
BOX 4MICRONUTRIENT DEFICIENCY AND BREASTFEEDING
FIGURE 4.1 PREVALENCE OF ANEMIA AMONG WOMEN OF CHILD-BEARING AGE IN COUNTRIES OF LATIN AMERICA AND THE CARIBBEAN, 2005 AND 2015
0
5
10
15
20
25
30
35
40
45
50
COL LCA ECU GUY TTO PER ATG PAN GRD BRB BLZ JAM GTM VCT SLV SUR MEX BHS HND CUB BOL VEN DOM HTI CRI NIC PRY ARG URY CHL BRA
2015 1990
SOURCE: WHO (online). Global Health Observatory (GHO) data.
| 24 |

2017PANORAMA OF FOOD AND NUTRITIONAL SECURITY IN LATIN AMERICA AND THE CARIBBEAN
On the other hand, breastfeeding (Figure 4.2) is a key factor for promoting a good nutritional status in children. A series of benefits for childhood health are generated when exclusive breastfeeding is maintained until six months of age. These include the reduction in
childhood mortality resulting from disease (diarrhea and respiratory infections), prevention of overweight and some non-communicable diseases (FAO and PAHO, 2017).
FIGURE 4.2EXCLUSIVE BREASTFEEDING RATE IN CHILDREN UNDER 6 YEARS OF AGE, IN COUNTRIES OF LATIN AMERICA AND THE CARIBBEAN. DIFFERENT YEARS
32.7 33.2
64.3
42.8
32.5 33.2
4.7
53.2
23.3
31.2
39.7
23.8
14.4
31.7
21.5
68.4
47.0
2.8
0
5
10
15
20
25
30
35
40
45
50
55
60
65
70
ARG(2012)
BLZ(2016)
BOL(2012)
COL(2010)
CRI(2011)
CUB(2014)
DOM(2014)
GTM(2015)
GUY(2014)
HND(2012)
HTI(2012)
JAM(2011)
MEX(2012)
NIC(2012)
PAN(2014)
PER(2012)
SLV(2014)
SUR(2010)
SOURCE: WHO (online). Global Health Observatory (GHO) data.
BOX 4 (CONTINUATION)
| 25 |