Embed Size (px)
Citation preview
PANIMALAR ENGINEERING COLLEGE(A CHRISTIAN MINORITY INSTITUTION)JAISAKTHI EDUCATIONAL TRUST
ACCREDITED BY NATIONAL BOARD OF ACCREDITATIONBANGALORE TRUNK ROAD, VARADHARAJAPURAM,
NASARATHPET, POONAMALLEE,
CHENNAI - 600 123.
DEPARTMENT OF
ELECTRONICS & COMMUNICATION ENGINEERING
EC6511 DIGITAL SIGNAL PROCESSING LAB
LAB MANUALV SEMESTER ECE
(2017 - 2018 ODD SEMESTER)


DEPARTMENT OF ECE
VISION
To emerge as a centre of excellence in providing quality education and produce
technically competent Electronics and Communication Engineers to meet the needs of
industry and Society.
MISSION
Ml: To provide best facilities, infrastructure and environment to its students, researchers and
faculty members to meet the Challenges of Electronics and Communication Engineering
field.
M2: To provide quality education through effective teaching -learning process for their
future career, viz placement and higher education.
M3: To expose strong insight in the core domains with industry interaction.
M4: Prepare graduates adaptable to the changing requirements of the society through life
long learning.
PROGRAMME EDUCATIONAL OBJECTIVES
1. To prepare graduates to analyze, design and implement electronic circuits and systems
using the knowledge acquired from basic science and mathematics.
2. To train students with good scientific and engineering breadth so as to comprehend,
analyze, design and create novel products and solutions for real life problems.
3. To introduce the research world to the graduates so that they feel motivated for higher
studies and innovation not only in their own domain but multidisciplinary domain.
4. Prepare graduates to exhibit professionalism, ethical attitude, communication skills,
teamwork and leadership qualities in their profession and adapt to current trends by
engaging in lifelong learning.
5. To practice professionally in a collaborative, team oriented manner that embraces the
multicultural environment of today's business world.
PROGRAMME OUTCOMES
1. Engineering Knowledge: Able to apply the knowledge of Mathematics, Science,Engineering fundamentals and an Engineering specialization to the solution of complexEngineering problems.
2. Problem Analysis: Able to identify, formulate, review research literature, and analyzecomplex Engineering problems reaching substantiated conclusions using first principles ofMathematics, Natural sciences, and Engineering sciences.
3. Design / Development of solutions: Able to design solution for complex Engineering
problems and design system components or processes that meet the specified needs with
appropriate considerations for the public health and safety and the cultural, societal, and
environmental considerations.
4. Conduct investigations of complex problems: Able to use Research - based knowledgeand research methods including design of experiments, analysis and interpretation of data,
and synthesis of the information to provide valid conclusions.
5. Modern tool usage: Able to create, select and apply appropriate techniques, resources,
and modern Engineering IT tools including prediction and modeling to complexEngineering activities with an understanding of the limitations.
6. The Engineer and society: Able to apply reasoning informed by the contextual knowledge
to access societal, health, safety, legal and cultural issues and the consequentresponsibilities relevant to the professional Engineering practice.
7. Environment and sustainability: Able to understand the impact of the professionalEngineering solutions in societal and environmental context, and demonstrate theknowledge of, and need for sustainable development.
8. Ethics: Able to apply ethical principles and commit to professional ethics andresponsibilities and norms of the Engineering practice.
9. Individual and Team work: Able to function effectively as an individual, and as amember or leader in diverse teams, and in multidisciplinary settings.
10. Communication: Able to communicate effectively on complex Engineering activitieswith the Engineering community and with society at large, such as, being able tocomprehend and write effective reports and design documentation, make effectivepresentations, and give and receive clear instructions.
11. Project Management and Finance: Able to demonstrate knowledge and understandingof the engineering and management principles and apply these to one's own work, as amember and leader in a team, to manage projects and in multidisciplinary environments.
12. Life - long learning: Able to recognize the needs for, and have the preparation andability to engage in independent and life-long learning in the broadest contest of
technological change.
PROGRAMME SPECIFIC OUTCOMES
1. Graduates should demonstrate an understanding of the basic concepts in the primary areaof Electronics and Communication Engineering, including: analysis of circuits containingboth active and passive components, electronic systems, control systems, electromagneticsystems, digital systems, computer applications and communications.
2. Graduates should demonstrate the ability to utilize the mathematics and the fundamentalknowledge of Electronics and Communication Engineering to design complex systemswhich may contain both software and hardware components to meet the desired needs.
3. The graduates should be capable of excelling in Electronics and CommunicationEngineering industry/Academic/Software companies through professional careers.

ANNA UNIVERSITY, CHENNAIR - 2013 SYLLABUS
EC6511 DIGITAL SIGNAL PROCESSING LABORATORY
OBJECTIVESThe student should be made to
• To implement Linear and Circular Convolution• To implement FIR and IIR filters• To study the architecture of DSP processor• To demonstrate Finite word length effect
LIST OF EXPERIMENTS:MATLAB / EQUIVALENT SOFTWARE PACKAGE
• Generation of sequences (functional & random) & correlation• Linear and Circular Convolutions• Spectrum Analysis using DFT• FIR filter design• IIR filter design• Multirate Filters• Equalization
DSP PROCESSOR BASED IMPLEMENTATION
• Study of architecture of Digital Signal Processor• MAC operation using various addressing modes• Linear Convolution• Circular Convolution• FFT Implementation• Waveform generation• IIR and FIR Implementation• Finite Word Length Effect
i
LIST OF EXPERIMENTSMATLAB PROGRAMS
1 Generation of sequences (functional &random) Unit Impulse Sequence
• Unit Step Sequence• Ramp Sequence• Exponential Sequence• Sine Sequence• Cosine Sequence
2 Correlation3 Linear and Circular Convolutions4 Spectrum Analysis using DFT5 FIR Filter Design
• Rectangular Window• Blackman Window• Hamming Window• Hanning Window
6 IIR Filter Design7 Multirate Filters8 Equalization
PROCESSOR PROGRAMS (TMS 320 C5416 DSK)
1 Study of architecture of Digital SignalProcessor
2 Linear Convolution3 Circular Convolution4 FFT Implementation5 Waveform Generation
• Sine Wave• Cos Wave
6 IIR and FIR Implementation
COURSE OUTCOMES:
At the end of the course, the student will be able to:CO 1: Develop and experiment coding from basic mathematical operations to
complex operations like DFT and FFT.CO 2: Visualize the amplitude and phase spectrum of the signal in frequency
domain.CO 3: Simulate FIR and IIR filter using MATLAB and DSP processor.CO 4: Analyze the finite word length effect.
SYLLABI OF VARIOUS PREMIER INSTITUTIONS
IIT- KHARAGPUR
DIGITAL SIGNAL PROCESSINGVIRTUAL LAB:
1. Study of Sampling theorem, effect of undersampling.2. Study of Quantization of continuous - amplitude, discrete- time analog
signals.3. Study of different types of Companding Techniques.4. Study of properties of Linear Time- Invariant system.5. Study of Convolution: Series and Parallel system.6. Study of Discrete Fourier Transform (DFT) and its inverse.7. Study of Transform domain properties and its use8. Study of FIR filter design using window method: Lowpass and highpass
filter.9. Study of FIR filter design using window method: Bandpass and Bandstop
filter.1O.Study of Infinite Impulse Response (IIR) filter.
BRIDGING THE CURRICULUM GAP
To have more exposure in Digital Signal Processing, other than the
"Study of sampling theorem, effect of undersampling" and "Study of
properties of Linear Time- Invariant system" as included as Content
beyond Syllabus from lIT- KHARAGPUR.
Course Instructors
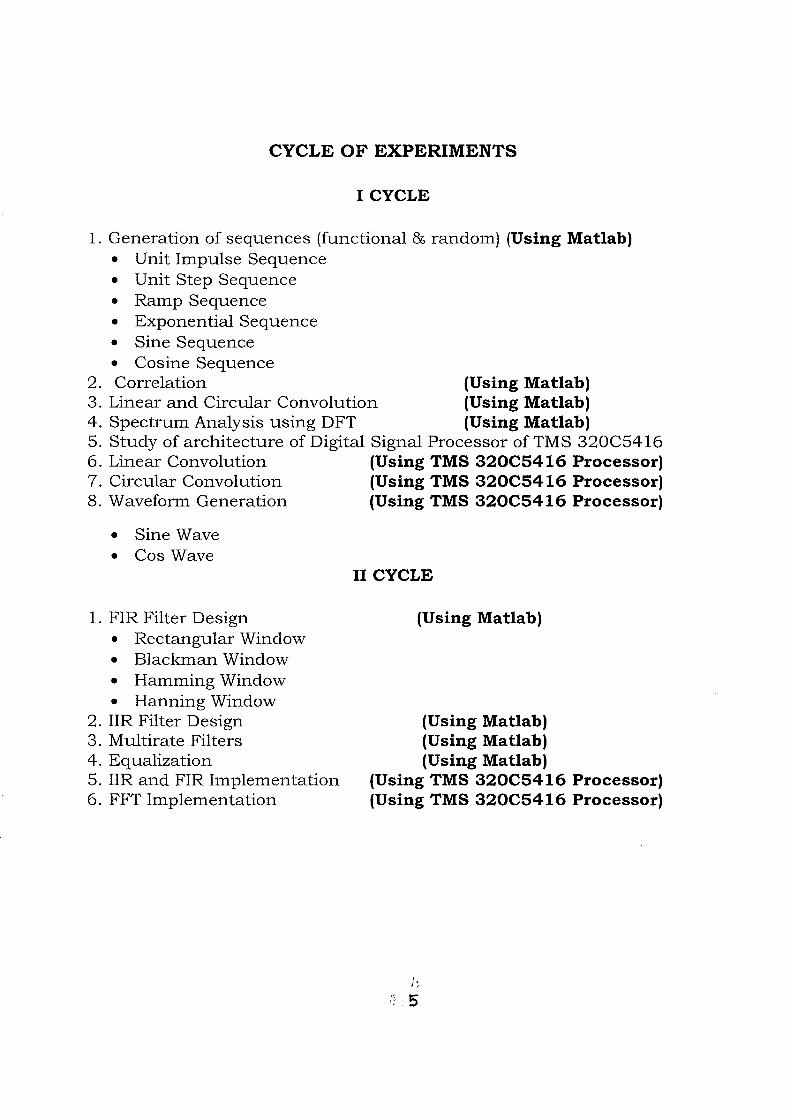
CYCLE OF EXPERIMENTS
I CYCLE
1. Generation of sequences (functional & random) (Using Matlab)• Unit Impulse Sequence• Unit Step Sequence• Ramp Sequence• Exponential Sequence• Sine Sequence• Cosine Sequence
2. Correlation (Using Matlab)3. Linear and Circular Convolution (Using Matlab)4. Spectrum Analysis using DFT (Using Matlab)5. Study of architecture of Digital Signal Processor of TMS 320C54166. Linear Convolution (Using TMS 320C5416 Processor)7. Circular Convolution (Using TMS 320C5416 Processor)8. Waveform Generation (Using TMS 320C5416 Processor)
• Sine Wave• Cos Wave
II CYCLE
1. FIR Filter Design• Rectangular Window• Blackman Window• Hamming Window• Hanning Window
2. IIR Filter Design3. Multirate Filters4. Equalization5. IIR and FIR Implementation6. FFT Implementation
(Using Matlab)
(Using Matlab)(Using Matlab)(Using Matlab)
(Using TMS 320C5416 Processor)(Using TMS 320C5416 Processor)
h:; ,5
ADDITIONAL EXPERIMENTS
1. Sampling & Effect of Aliasing
2. Calculation of FFT of a signal
3. Down Sampling and Up Sampling
4. Waveform Generation• Triangular Waveform• Saw Tooth Waveform• Square Waveform
(Usi~Matlab)
(u,tng Matlab)
~Sing Matlab)
/ (Using Matlab)
5. Sum of sinusoidal signals.
6. Wave generation.
//
//
6
(Using Matlab)(Usi g TMS 320C5416 Processor)
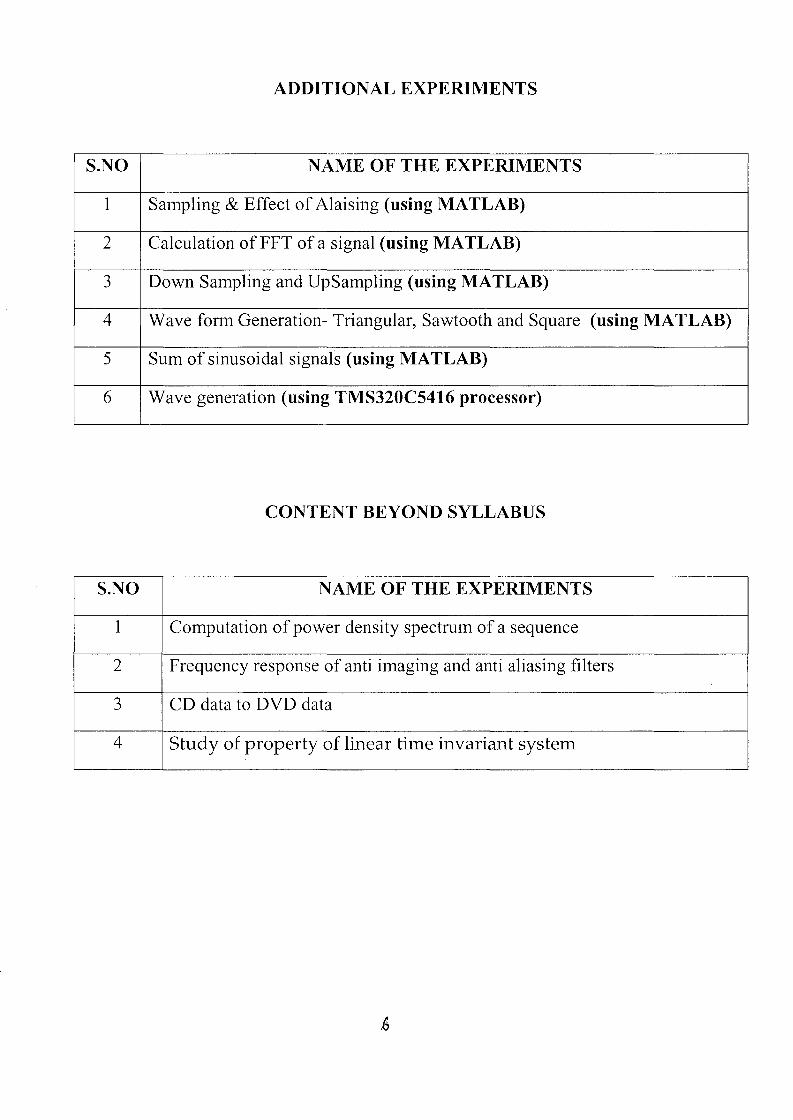
ADDITIONAL EXPERIMENTS
S.NO NAME OF THE EXPERIMENTS
1 Sampling & Effect of Alaising (using MATLAB)
2 Calculation ofFFT ofa signal (using MATLAB)
3 Down Sampling and UpSampling (using MATLAB)
4 Wave form Generation- Triangular, Sawtooth and Square (using MATLAB)
5 Sum of sinusoidal signals (using MATLAB)
6 Wave generation (using TMS320C5416 processor)
CONTENT BEYOND SYLLABUS
S.NO NAME OF THE EXPERIMENTS
1 Computation of power density spectrum of a sequence
2 Frequency response of anti imaging and anti aliasing filters
3 CD data to DVD data
4 Study of property of linear time invariant system

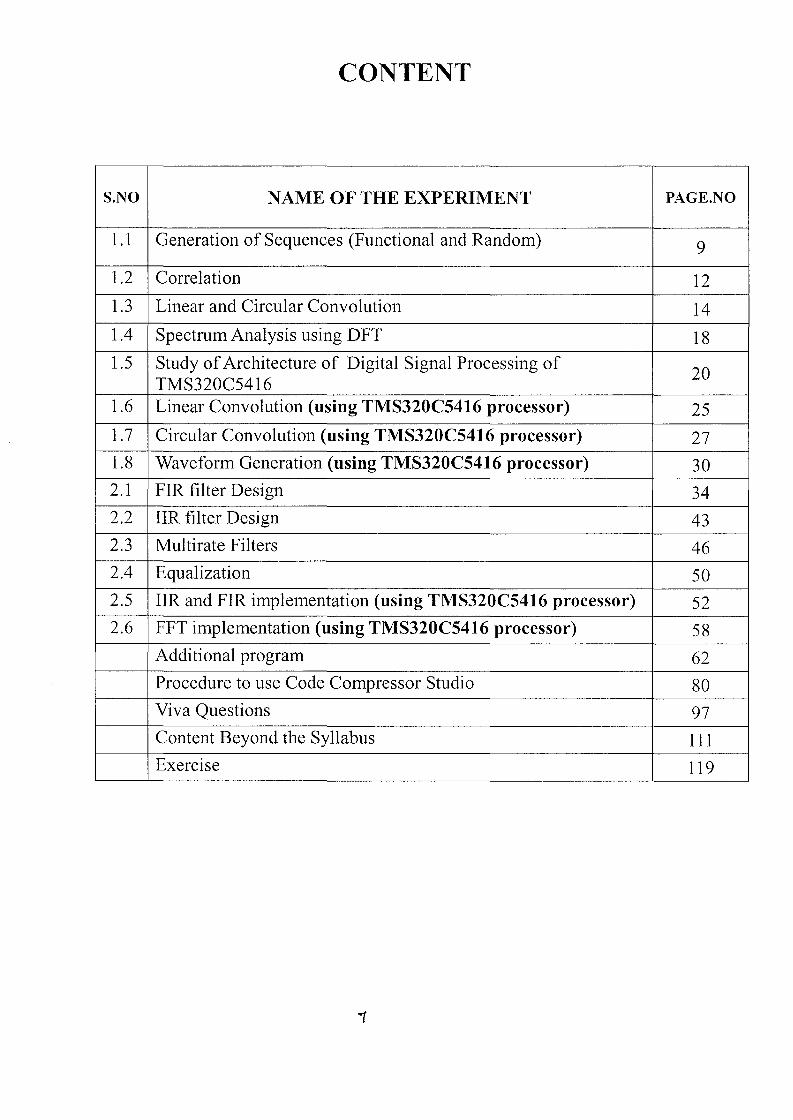
CONTENT
S.NO NAME OF THE EXPERIMENT PAGE.NO
1.1 Generation of Sequences (Functional and Random) 9
1.2 Correlation 121.3 Linear and Circular Convolution 141.4 Spectrum Analysis using DFT 181.5 Study ofArchitecture of Digital Signal Processing of
20TMS320C5416
1.6 Linear Convolution (using TMS320C5416 processor) 251.7 Circular Convolution (using TMS320C5416 processor) 271.8 Waveform Generation (using TMS320C5416 processor) 302.1 FIR filter Design 342.2 IIR filter Design 432.3 Multirate Filters 462.4 Equalization 502.5 IIR and FIR implementation (using TMS320C5416 processor) 522.6 FFT implementation (using TMS320C5416 processor) 58
Additional program 62Procedure to use Code Compressor Studi0 80Viva Questions 97Content Beyond the Syllabus 111Exercise 119


CYCLE-I

GENERATION OF SEQUENCES
EXPERIMENT NO: 1
AIM:
DATE:
To generate basic sequences such as Unit impulse, Unit step, Ramp,Exponential, Sine sequence & Cosine Sequence using MATLAB Programs.
PROGRAMS:
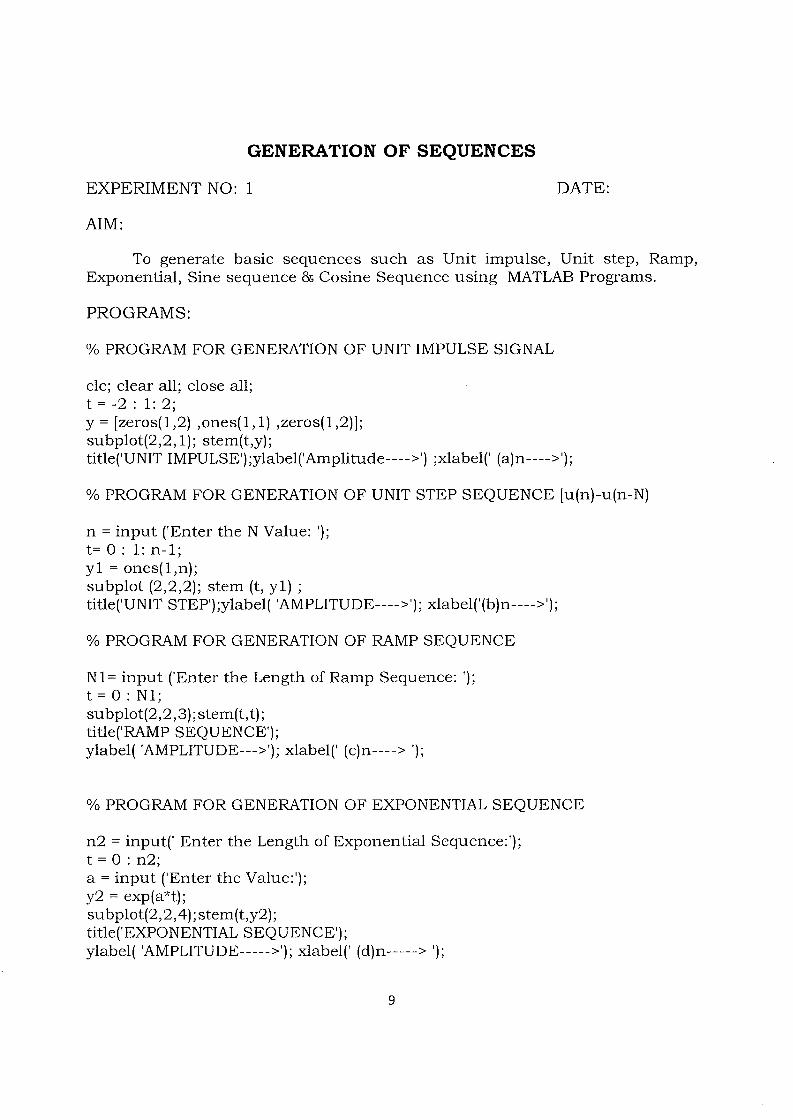
% PROGRAM FOR GENERATION OF UNIT IMPULSE SIGNAL
clc; clear all; close all;t = -2 : 1: 2;y = [zeros(1,2) ,ones(l,l) ,zeros(1,2)];subplot(2,2,1); stem(t,y);title('UNIT IMPULSE');ylabel('Amplitude---->') ;xlabel(' (a)n---->');
% PROGRAM FOR GENERATION OF UNIT STEP SEQUENCE [u(n)-u(n-N)
n = input ('Enter the N Value: ');t= 0 : 1: n-1;y1 = ones(l,n);subplot (2,2,2); stem (t, y1) ;title('UNIT STEP');ylabel( 'AMPLITUDE---->'); xlabel('(b)n---->');
% PROGRAM FOR GENERATION OF RAMP SEQUENCE
N1= input ('Enter the Length of Ramp Sequence: ');t = 0 : N1;subplot(2,2,3);stem(t,t);title('RAMP SEQUENCE');ylabel( 'AMPLITUDE--->'); xlabel(' (c)n----> ');
% PROGRAM FOR GENERATION OF EXPONENTIAL SEQUENCE
n2 = input(' Enter the Length of Exponential Sequence:');t = 0 : n2;a = input ('Enter the Value:');y2 = exp(a*t);subplot(2,2,4);stem(t,y2);title('EXPONENTIAL SEQUENCE');ylabel( 'AMPLITUDE----->'); xlabel(' (d)n-----> ');
9
% PROGRAM FOR GENERATION OF SINE SEQUENCE
t = 0 :.Ol:pi;y = sin(2 * pi* t);figure (2) ;subplot(2, 1, l);plot(t,y);title('SINE WAVE');ylabcl( 'AMPLITUDE----->'); xlabel(' (a)t----->');
% PROGRAM FOR GENERATION OF COSINE SEQUENCE
+_rl. rl1._:.L - V •• V.lo1Jl,
Y = cos(2 * pi* t);subplot(2,1,2);plot(t,y);title('COS WAVE');ylabel ( 'AMPLITUDE------>');xlabel (' (b) t----->') ;
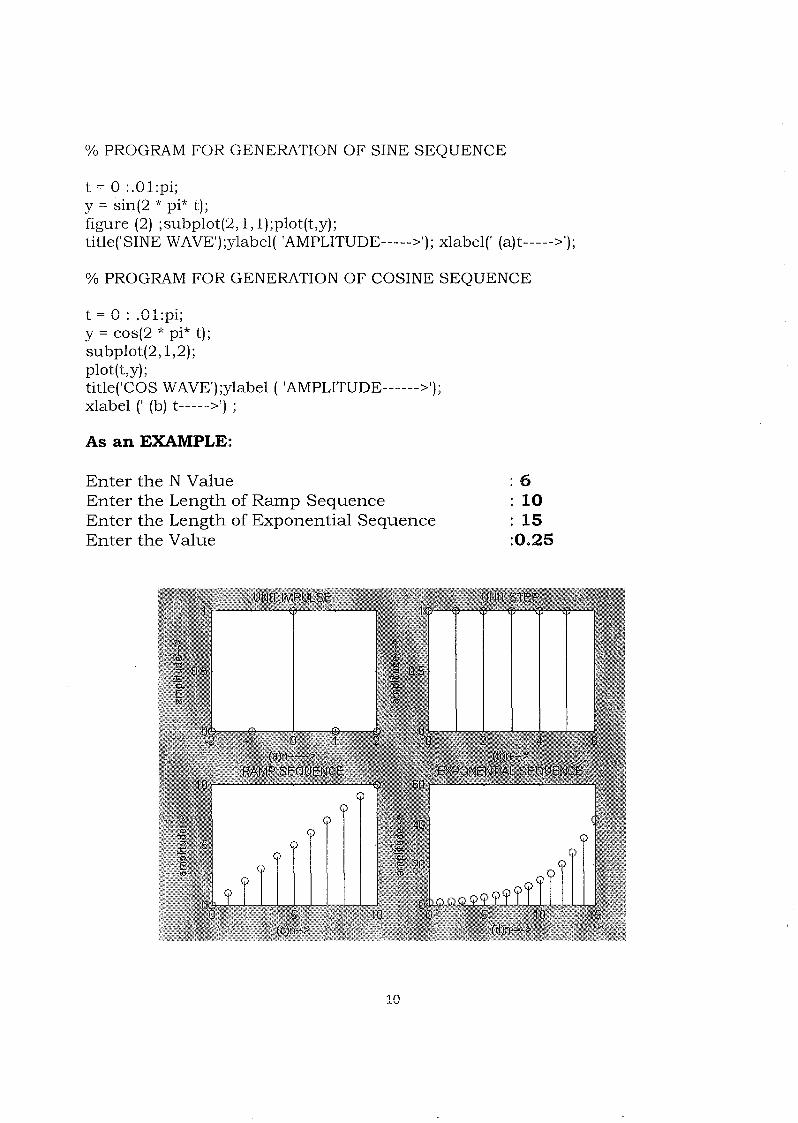
As an EXAMPLE:
Enter the N ValueEnter the Length of Ramp SequenceEnter the Length of Exponential SequenceEnter the Value
:6: 10: 15:0.25
in.LV
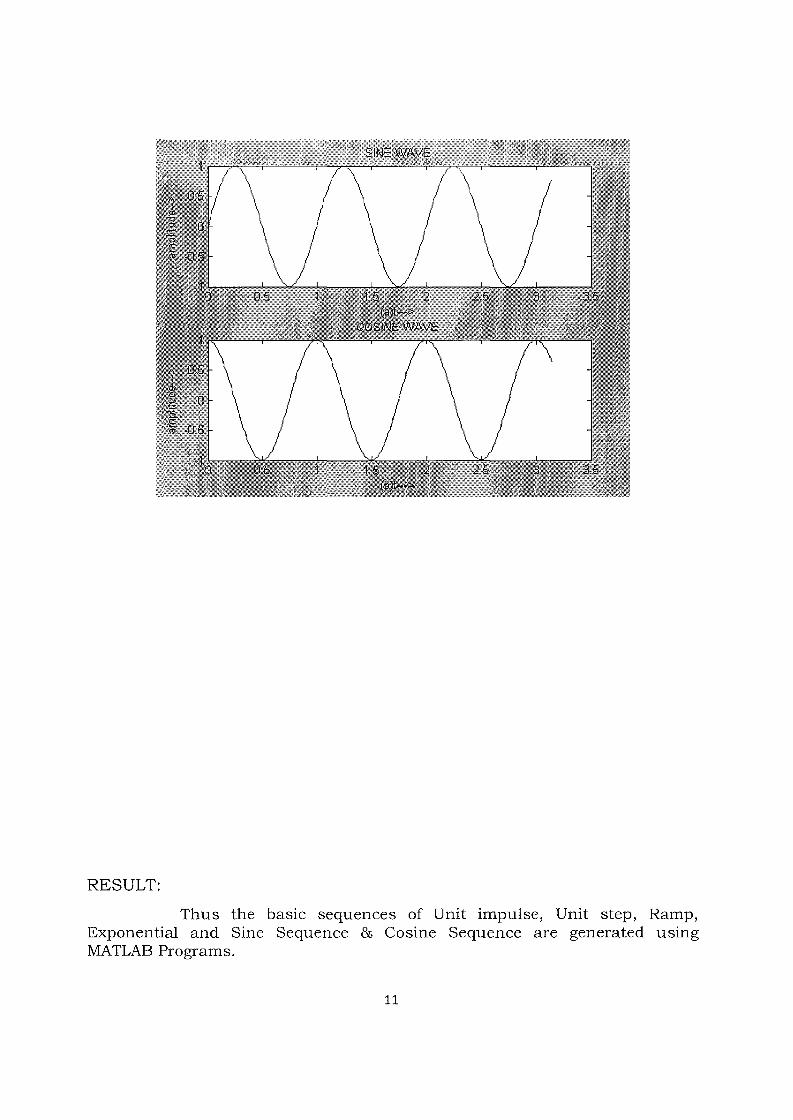
RESULT:
Thus the basic sequences of Unit impulse, Unit step, Ramp,Exponential and Sine Sequence & Cosine Sequence are generated usingMATLAB Programs.
11
EXPERIMENT NO: 2
AIM:
CORRELATIONDATE:
To implement auto-correlation and cross-correlation functions usingMATLAB.
PROGRAM:
% Cross - Correlation and Auto - Correlation of finite sequencesclc;clear all;close all;x = input ('Enter the Signal x =');y = input ('Enter the Signal y =');rxy = xcorr(x,y); % cross-correlation of x and yrxx = xcorr(x); % Auto - Correlation of xsubplot(221);stem(x) ;xlabel(Time') ;ylabel('Amplitude') ;title('x(n) ');
subplot(222);stem(y);xlabel('Time') ;ylabel('Amplitude') ;title('y(n) ');
subplot(223);stem(rxy);xlabel('Lag') ;ylabel('Amplitude') ;title('rxy(k) ');
subplot(224);stem(rxx);xlabel('Lag') ;ylabel('Amplitude') ;title('rxx(k) ');
As an EXAMPLE:
Enter the Signal x =
Enter the Signal y =[1-1231][2 1 -2 1 4 4 1]
12
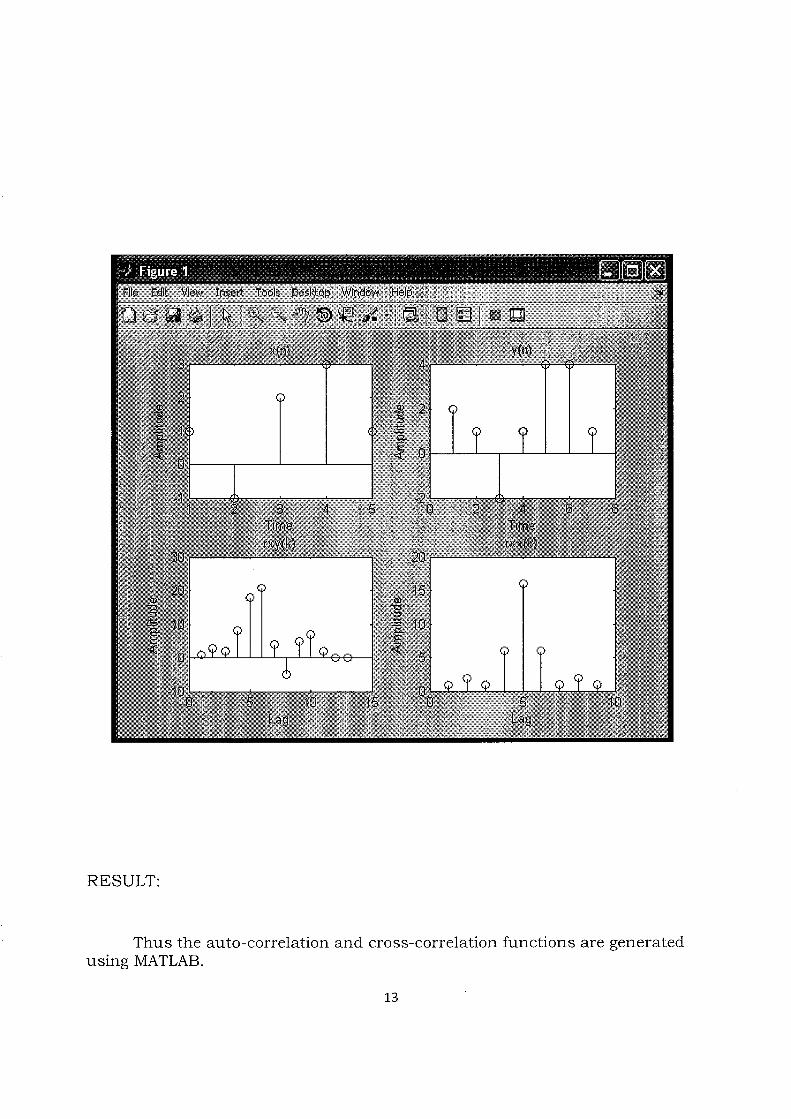
RESULT:
Thus the auto-correlation and cross-correlation functions are generatedusing MATLAB.
13
LINEAR AND CIRCULAR CONVOLUTION
EXPERIMENT NO: 3
AIM:
To perform Convolution of two discrete sequences usinga) Linear Convolution.b) Circular Convolution.
FORMULA:
yen) = 2:~=-oo [x(k)h(n - k)]
PROGRAM:
a)LINEAR CONVOLUTION
clc; clear all; close all;x =input ('Enter the First Sequence: 1 );
h = input ('Enter the Second Sequence: I);y = conv(x,h);subplot(3, 1, l);stem(x);ylabel( 'AMPLITUDE----~>');
xlabel('First Sequence---->I);subplot(3,1,2);stem(h);ylabel( 'AMPLITUDE----->');xlabel('Second Sequence----->') ;subplot(3,1,3);stem(y);ylabel( 'AMPLITUDE----->');xlabe1('Output Sequence---->');disp( 'The Resultant Signal is: ');y
1 /I......
DATE:
(b) CIRCULAR CONVOLUTION
clc;clear all;close all;
% program to perform Circular Convolution
xl = input ('Enter the First Sequence to be convoluted:');11 = length(x1);
x2 = input ('Enter the Second Sequence to be convoluted:');12 = length(x2);13 = 11 + 12 -1;
xl =[x1 ,zeros( 1,13-11)];x2= [x2,zeros(1,13-l2)];
disp('The Input Squence:');x1,x2
f = cconv(x1,x2,13);
disp('The Circular Convoluted Sequence is:');disp(f);
subplot(311);stem(x1);xlabel('Time');ylabel('Amplitude');title('First Sequence');
subplot(312);stem(x2);xlabel('Time');ylabel('Amplitude');title('First Sequence');
subplot(313);stem(f);xlabel('Time') ;ylabel('Amplitude') ;title('Circular Convoluted sequence');
15

(a)LINEAR CONVOLUTION
Enter the First Sequence
Enter the second Sequence
The Resultant signal is
y=
148 8
: [1 2]
: [1 2 4]
16

(b)CIRCULAR CONVOLUTION
xl =x2 =
II
22
o4
oo
The Circular Convoluted Sequence is:I 488
RESULT:
The Linear Convolution and Circular Convolution are implementedusing MATLAB.
17
SPECTRUM ANALYSIS USING DFT
EXPERIMENT NO: 4
AIM:
DATE:
To plot the magnitude and phase spectrum of a signal using DFT.
PROGRAM:
% Magnitude and Phase Spectrum of a reet signal
c1c;c1ear all;c1ose all;N = input ('Length of the Sequences, N=');m = floor(N18);rect = [ones(l,m) zeros(l,N-m)];subplot(311);stem(rect);
% Finding DFT
w = exp(-j*2*pi/N);n = [O:l:(N-l)]; k = [O:1:(N-l)];nk = n'*k;W = w.o nk;X = rect*W;
% Magnitude and Phase Plots
subplot(312);stem(k,abs(X( 1:N)));title(' Magnitude Spectrum') ;xlabel('Discrete Frequency');ylabel('Amplitude'); subplot(313); stem(k,angle(X( 1:N)));title('Phase Spectrum');xlabel('Discrete Frequency') ;ylabel ('Phase Angle');disp('Press any Key to Continue') ;pause;
% Unfolding the Spectrum
y = X(floor(N/2)+1:N);y = [y X(1:floor(N/2))];figure,subplot(211),stem(k,abs(Y(1 :N)));title('Magnitude Plot(Unfolded Spectrum)');xlabel('Discrete Frequency');ylabel('Amplitude');subplot(212);stem(k,angle(Y( 1:N)));title('Phase Plot (Unfolded Spectrum)');xlabel('Discrete Frequency') ;ylabel('Phase Angle');
18

Length of the Sequences, N=63Press any Key to Continue
RESULT: Thus the magnitude and phase spectrum of a signal isdetermined using DFT.
19
STUDY OF ARCHITECTURE OF DIGITAL SIGNAL PROCESSOR TMS 320C5416
EXPERIMENT NO: 5
AIM:
DATE:
To study the architecture of digital signal processor TMS 320C5416
ARCHITECTURE:
The TMS320VC5416 fixed-point, digital signal processor (DSP) (hereafterreferred to as the device unless otherwise specified) is based on an advancedmodified Harvard architecture that has one program memory bus and threedata memory buses. This processor provides an arithmetic logic unit (ALU) witha high degree of parallelism, application-specific hardware logic, on-chipmemory, and additional on-chip peripherals. The basis of the operationalflexibility and speed of this DSP is a highly specialized instruction set.
Separate program and data spaces allow simultaneous access to programinstructions and data, providing a high degree of parallelism. Two readoperations and one write operation can be performed in a single cycle.Instructions with parallel store and application-specific instructions can fullyutilize this architecture.
In addition, data can be transferred between data and program spaces.Such parallelism supports a powerful set of arithmetic, logic, and bitmanipulation operations that can all be performed in a single machine cycle.The device also includes the control mechanisms to manage interrupts,repeated operations, and function calls.
Memory
The device provides both on-chip ROM and RAM memories to aid insystem performance and integration.
Data Memory
The data memory space addresses up to 64K of 16-bit words. The deviceautomatically accesses the on-chip RAM when addressing within its bounds.When an address is generated outside the RAM bounds, the deviceautomatically generates an external access.
The advantages of operating from on-chip memory are as follows:· Higher performance because no wait states are required· Higher performance because of better flow within the pipeline of the centralarithmetic logic unit (CALU)· Lower cost than external memory· Lower power than external memory
-,1""\LV
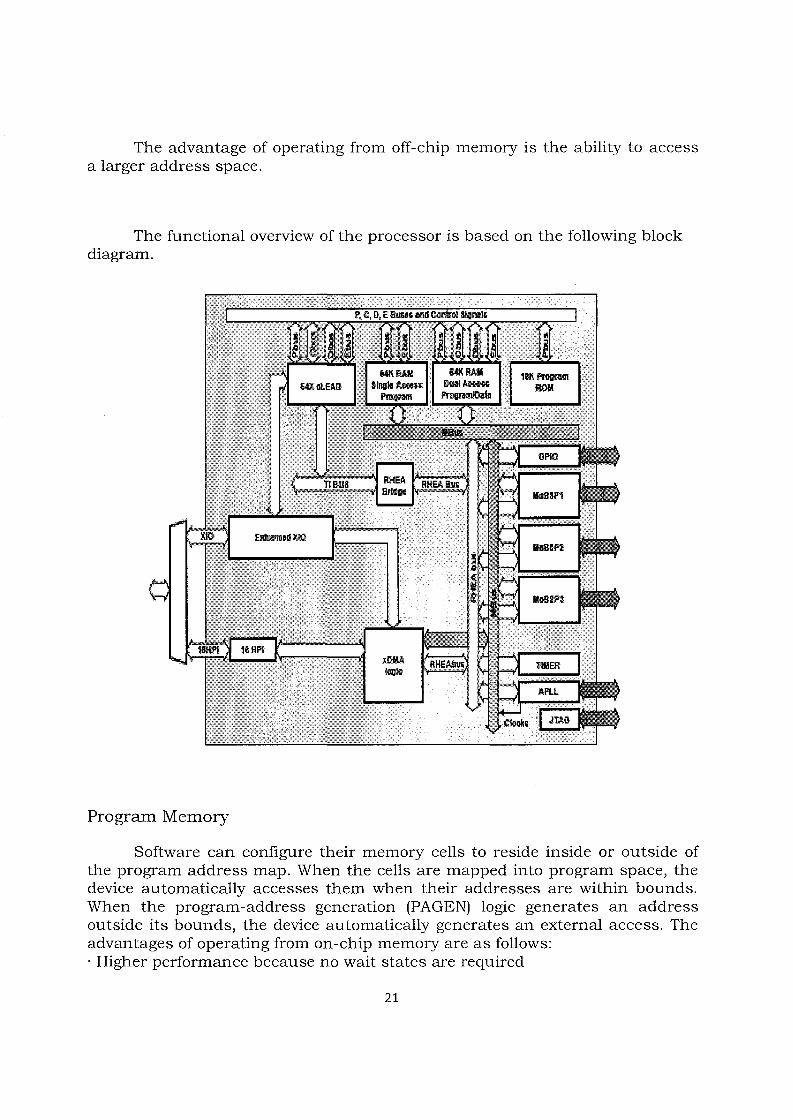
The advantage of operating from off-chip memory is the ability to accessa larger address space.
The functional overview of the processor is based on the following blockdiagram.
Program Memory
Software can configure their memory cells to reside inside or outside ofthe program address map. When the cells are mapped into program space, thedevice automatically accesses them when their addresses are within bounds.When the program-address generation (PAGEN) logic generates an addressoutside its bounds, the device automatically generates an external access. Theadvantages of operating from on-chip memory are as follows:. Higher performance because no wait states are required
21

· Lower cost than external memory· Lower power than external memory
The advantage of operating from off-chip memory is the ability to accessa larger address space.
Extended Program. Memory
The device uses a paged extended memory scheme in program space toallow access of up to 8192K of program memory. In order to implement thisscheme, the device includes several features which are also present onC548/ 549 / 541 0:· Twenty-three address lines, instead of sixteen· An extra memory-mapped register, the XPC· Six extra instructions for addressing extended program space
Program memory in the device is organized into 128 pages that are each64K in length. The value of the XPC register defines the page selection. Thisregister is memory-mapped into data space to address 00lEh. At a hardwarereset, the XPC is initialized to o.
On-Chip Peripherals
The device has the following peripherals:· Software-programmable wait-state generator· Programmable bank-switching· A host-port interface (HPI8/ 16)· Three multichannel buffered serial ports (McBSPs)· A hardware timer· A clock generator with a multiple phase-locked loop (PLL)· Enhanced external parallel interface (XI02)· A DMA controller (DMA)
Parallel I/O Ports
The device has a total of 64K I/O ports. These ports can be addressed bythe PORTR instruction or the PORTW instruction. The IS signal indicates aread/write operation through an I/O port. The device can interface easily withexternal devices through the I/O ports while requiring minimal off-chipaddress-decoding circuits.
Multichannel Buffered Serial Ports (McBSPs)
The device provides three high-speed, full-duplex, multichannel bufferedserial ports that allow direct interface to other C54x/LC54x devices, codecs,and other devices in a system. The McBSPs are based on the standard serial-
port interface found on other 54x devices. Like their predecessors, the McBSPsprovide:· Full-duplex communication· Double-buffer data registers, which allow a continuous data stream· Independent framing and clocking for receive and transmitIn addition, the McBSPs have the following capabilities:· Direct interface to:- Tl/El framers- MVIP switching compatible and ST-BUS compliant devices- IOM-2 compliant devices- AC97-compliant devices- lIS-compliant devices- Serial peripheral interface· Multichannel transmit and receive of up to 128 channels· A wide selection of data sizes, including 8, 12, 16, 20, 24, or 32 bits· m-law and A-law companding· Programmable polarity for both frame synchronization and data clocks· Programmable internal clock and frame generation.
Hardware Timer
The device features a 16-bit timing circuit with a 4-bit prescaler. Thetimer counter is decremented by one every CLKOUT cycle. Each time thecounter decrements to 0, a timer interrupt is generated. The timer can bestopped, restarted, reset, or disabled by specific status bits.
Clock Generator
The clock generator provides clocks to the device, and consists of aphase-locked loop (PLL) circuit. The clock generator requires a reference clockinput, which can be provided from an external clock source. The referenceclock input is then divided by two (DIV mode) to generate clocks for the device,or the PLL circuit can be used (PLL mode) to generate the device clock bymultiplying the reference clock frequency by a scale factor, allowing use of aclock source with a lower frequency than that of the CPU. The PLL is anadaptive circuit that, once synchronized, locks onto and tracks an input clocksignal.
DMA Controller
The device direct memory access (DMA) controller transfers data betweenpoints in the memory map without intervention by the CPU. The DMA allowsmovements of data to and from internal program/data memory, internalperipherals (such as the McBSPs), or external memory devices to occur in thebackground of CPU operation. The DMA has six independent programmablechannels, allowing six different contexts for DMA operation.
23
The DMA has the following features:· The DMA operates independently of the CPU.· The DMA has six channels. The DMA can keep track of the contexts of sixindependent block transfers.· The DMA has higher priority than the CPU for both internal and externalaccesses.· Each channel has independently programmable priorities.
Each channel's source and destination address registers can haveconfigurable indexes through memory on each read aIld write trarrsfer,respectively. The address may remain constant, be post-incremented, be postdecremented, or be adjusted by a programmable value.· Each read or write internal transfer may be initialized by selected events.· On completion of a half- or entire-block transfer, each DMA channel may sendan interrupt to the CPU.· The DMA can perform double-word internal transfers (a 32-bit transfer of two16-bit words).
RESULT:
Thus the architecture of TMS320C5416 Processor was illustrated.
24
LINEAR CONVOLUTION USING TMS 320C5416 PROCESSOR
EXPERIMENT NO: 6
AIM:
DATE:
To implement Linear Convolution using TMS 320C5416 Processor.
PROGRAM:
#include<stdio.h>#include<math.h>int y[20];
mainf]{
int m =6;int n =6;int i =0;intj;int x[15] = {1,2,3,4,5,6,0,0,0,0,0,0};int h[15] = {1,2,3,4,5,6,0,0,0,0,0,0};for (i=O;i<m+n-l;i++){
y[i] =0;forU=O;j<=i;j++)
y[i]+=x[j]*h[i-j] ;}for(i=O;i<m+n-l ;i++)printf("%d\n" ,y[i]);
}
25
410203556
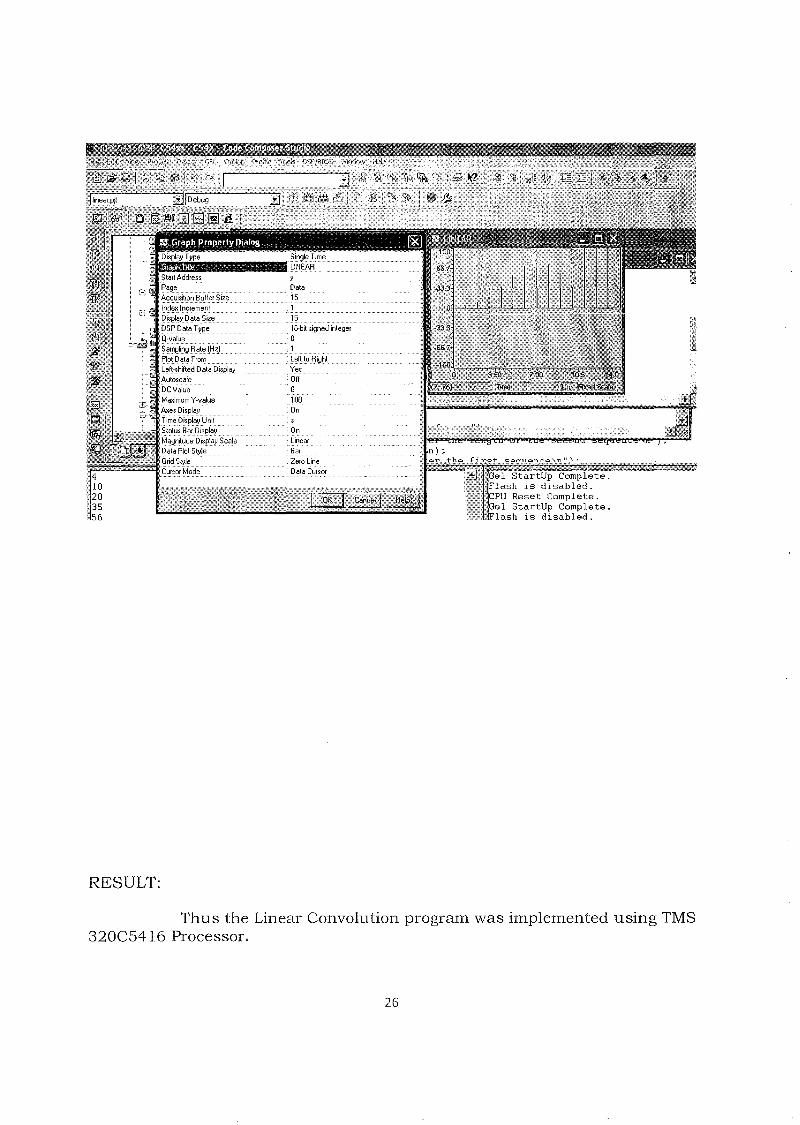
RESULT:
1 StartUp Complete.lash is disabled.PU Reset Complete.el StartUp Complete.lash is disabled.
Thus the Linear Convolution program was implemented using TMS320C5416 Processor.
26

CIRCULAR CONVOLUTION USING TMS 320C5416 PROCESSOR
EXPERIMENT NO: 7
AIM:
DATE:
To implement circular Convolution using TMS 320C5416 Processor.
PROGRAM:
#inc1ude< stdio.h>int m,n,x[30],h[30],y[30],i,j, k,x2[30],a[30];void maint]{
printf(" Enter the length of the first sequence \n");scanf("%d" ,&m);printf(" Enter the length of the second sequence \n");scanf("%d",&n);printf(" Enter the first sequence \n");for(i=O;i<m;i++)
scanf("%d" ,&x[i]);printf(" Enter the second sequence vn"];forU=O;j<n;j++)
scanf("%d" ,&hfj]);if(m-n!=O) j*If length of both sequences are not equal* j{
if(m>n) r Pad the smaller sequence with zero* j{
for(i =n;i<m;i++)h[i]=O;n=m;
}for(i=m;i<n;i++)x[i]=O;m=n;
}y[O]=O;a[O]=h[O];forG=l;j<n;j++) j*folding h(n) to h(-n)*ja[j]=h[n-j];j*Circular convolution* jfor(i=O;i<n;i++)
y[O]+=x[i]*a[i];for(k= 1;k<n;k++)
27
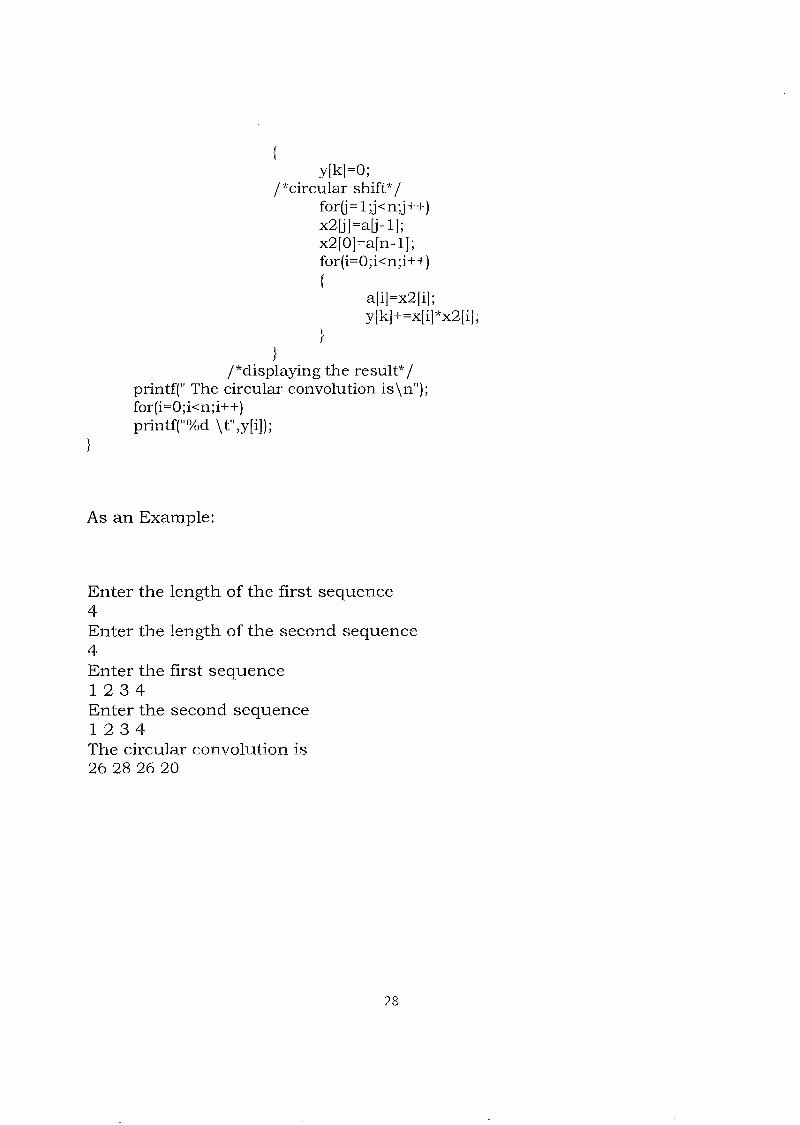
y[k]=O;j*circular shift* /
for [j> 1;j<n;j++)x2fj]=afj-l];x2[0]=a[n-l] ;for(i=O;i<n;i++){
a[i]=x2[i];y[k]+=x[i]*x2[i];
}}
j*displaying the result* /printf(" The circular convolution is \n");for(i=O;i<n;i++)printf("%d \t",y[i]);
}
As an Example:
Enter the length of the first sequence4Enter the length of the second sequence4Enter the first sequence1234Enter the second sequence1 234The circular convolution is2628 26 20
28
1 StartUp Complete.sh is disabled.
PU Reset Complete.el StartUp C~~p~ete.
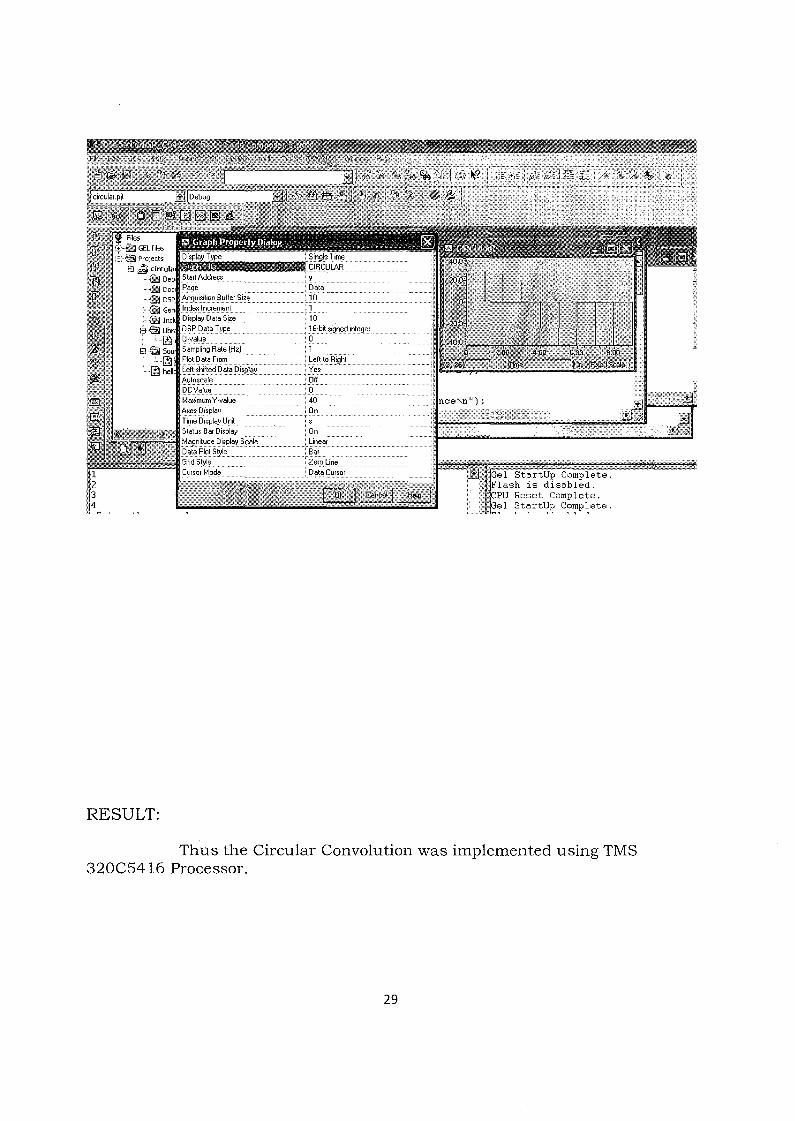
RESULT:
Thus the Circular Convolution was implemented using TMS320C5416 Processor.
29
WAVEFORM GENERATION USING TMS 320C5416
EXPERIMENT NO: 8
AIM:
DATE:
To generate sine and cosine waveform using TMS320C5416Processor.
PROGRAM:
SIN.C
# include <stdio.h># include <math.h>float a[100];maint){
int i;for(i=0;i<99;i++){
ali] = sin(2*3.14*5*ij 100);printf("%f' ,ali]);
}}
30
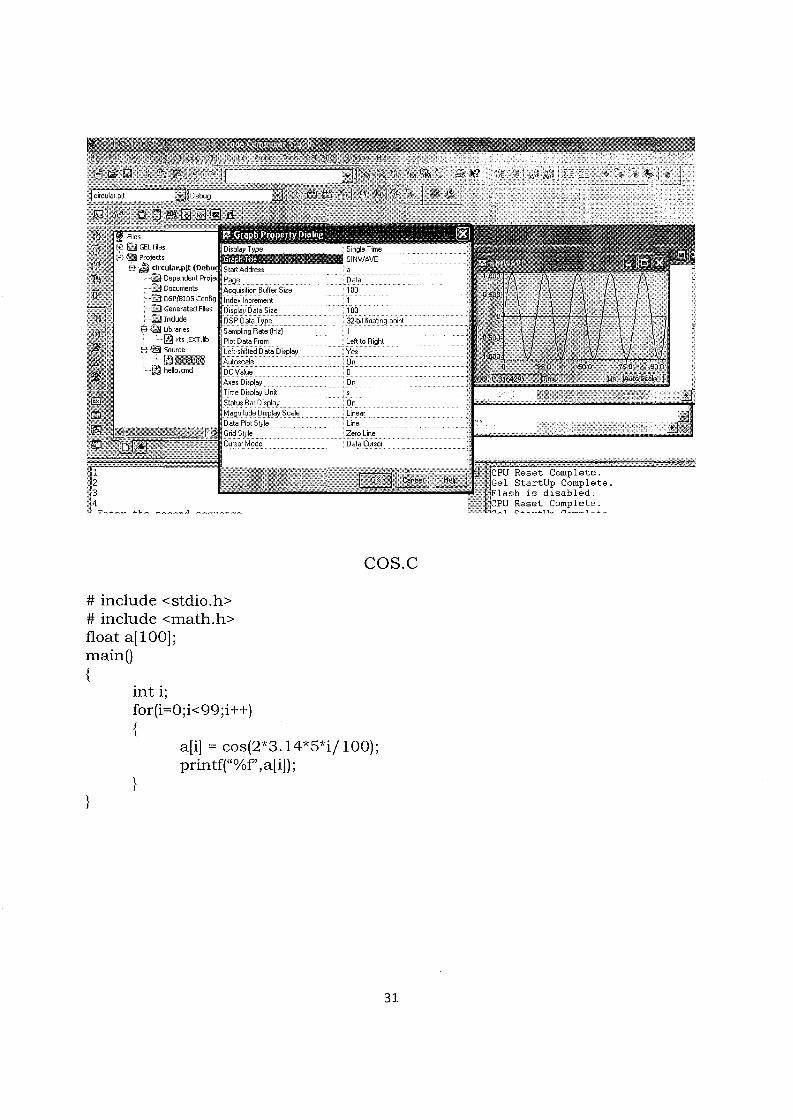
cos.c
# include <stdio.h># include <math.h>float a[lOO];main0{
int i;for(i=0;i<99;i++){
ali] = cos(2*3.l4*5*ij 100);printf("%f',ali]);
}}
31
PU Reset Complete.el StartUp Complete.lash is disabled.PU Reset Complete.~, C<.... ~~ ....TT .... {"'I.-.__ 1.-. .... .-.
the second sequence
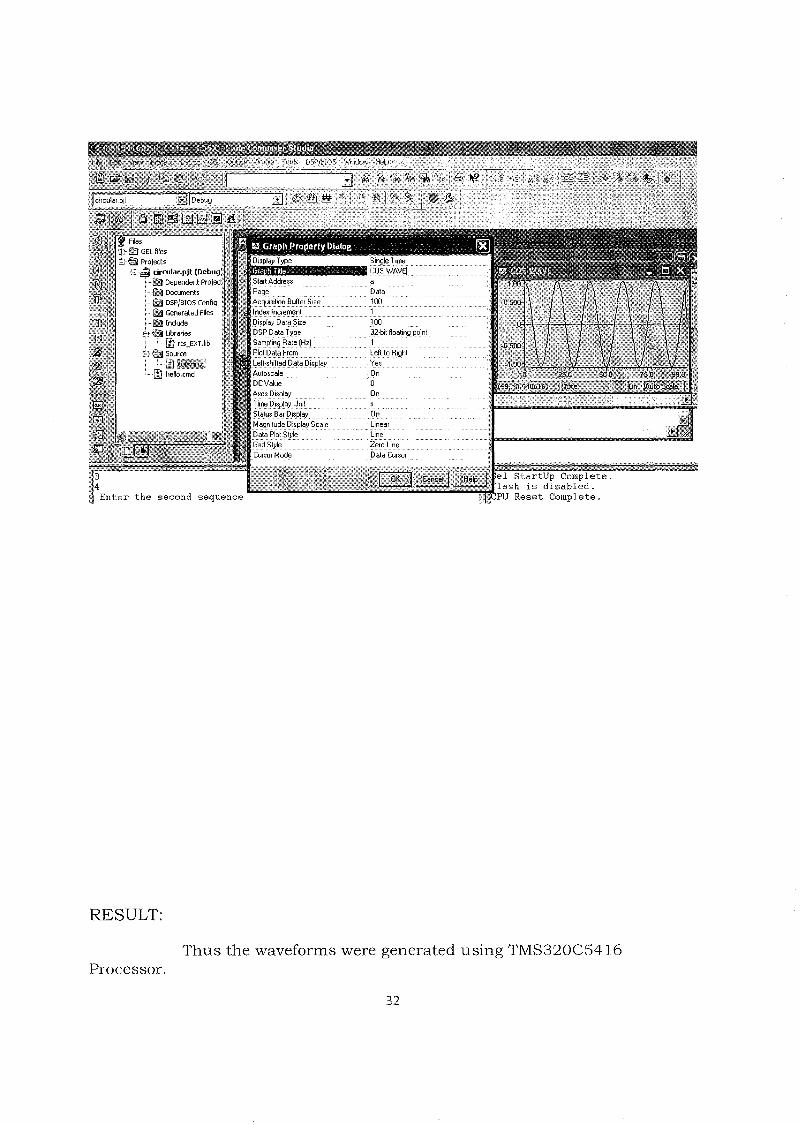
RESULT:
Thus the waveforms were generated using TMS320C5416Processor.
32

CYCLE - II
33
EXPERIMENT NO: 1
AIM:
DESIGN OF FIR FILTER
DATE:
To design FIR Low pass filter, FIR High-pass Filter, FIR Band-pass Filterusing Rectang-ular , Black man, Hamming and Hanning window Techniquesusing MATLAB.
FORMULA:
-20 log(,frp * rs - 13N = -....,....,-----0-:-.:-..-",--.,------
14. 6(fs - fp)1t
PROGRAM:
(A) RECTANGULAR WINDOW (BOXCAR)
% PROGRAM FOR THE DESIGN OF FIR LPF, HPF, BPF & BSF USINGRECTANGULAR WINDOW
dc; dose all; clear all;rp = inputl'Enter the Pass Band Ripple: I);rs = input('Enter the Stop Band Ripple: I);fp = input('Enter the Pass Band Frequency: ');fs = input('Enter the Stop Band Frequency: I);f = input('Enter the Sampling Frequency: I);wp = 2 * fpjf;ws = 2 * fsjf;num = - 20 * loglO( sqrt(rp*rs))- 13;den = 14.6 * (fs-fp)jf;n = ceil (numj den) ;nl = n+l;if (remtn.Zl-v-O] ;nl = n;n = n-l;endy = boxcar (nl) ;
34

% LOW PASS FILTER
b = firl(n,wp,y);[h,o] = freqz(b,1,256);m = 20 * log10(abs(h));subplot(2,2,1) ;plot (o/pi,m) ;title(' ***** RECTANGULAR WINDOW or BOXCAR *****');ylabel('Gain indb------>');xlabel(' (a) Normalised Frequency------->');
% HIGH PASS FILTERb = firl(n,wp,'high',y);[h,o] = freqz(b,1,256);m = 20*log10(abs(h));subplot(2,2,2) .plotto Zpi.m]:ylabel('Gain in db------>');xlabel(' (b) Normalised Frequency------->');
% BAND PASS FILTERwn = [wp ws]; b = fir1(n,wn,y);[h,o] = freqz(b,1,256);m = 20*log10(abs(h));subplot(2,2,3) ;plot (o/pi, m) ;ylabel('Gain in db------>');xlabel(' (c) Normalised Frequency------->');
% BAND STOP FILTERb = firl (n, wn, 'stop' , y) ;[h,o] = freqz(b,1,256);m = 20*log10(abs(h));subplot(2,2,4) ;plot (o/pi, m) ;ylabel('Gain in db------>');xlabel(' (d) Normalised Frequency------->');
RECTANGULAR WINDOW
Enter the Pass Band Ripple: 0.05
Enter the Stop Band Ripple: 0.04
Enter the Pass Band Frequency: 1500
Enter the Stop Band Frequency: 2000
Enter the Sampling Frequency: 8000
35
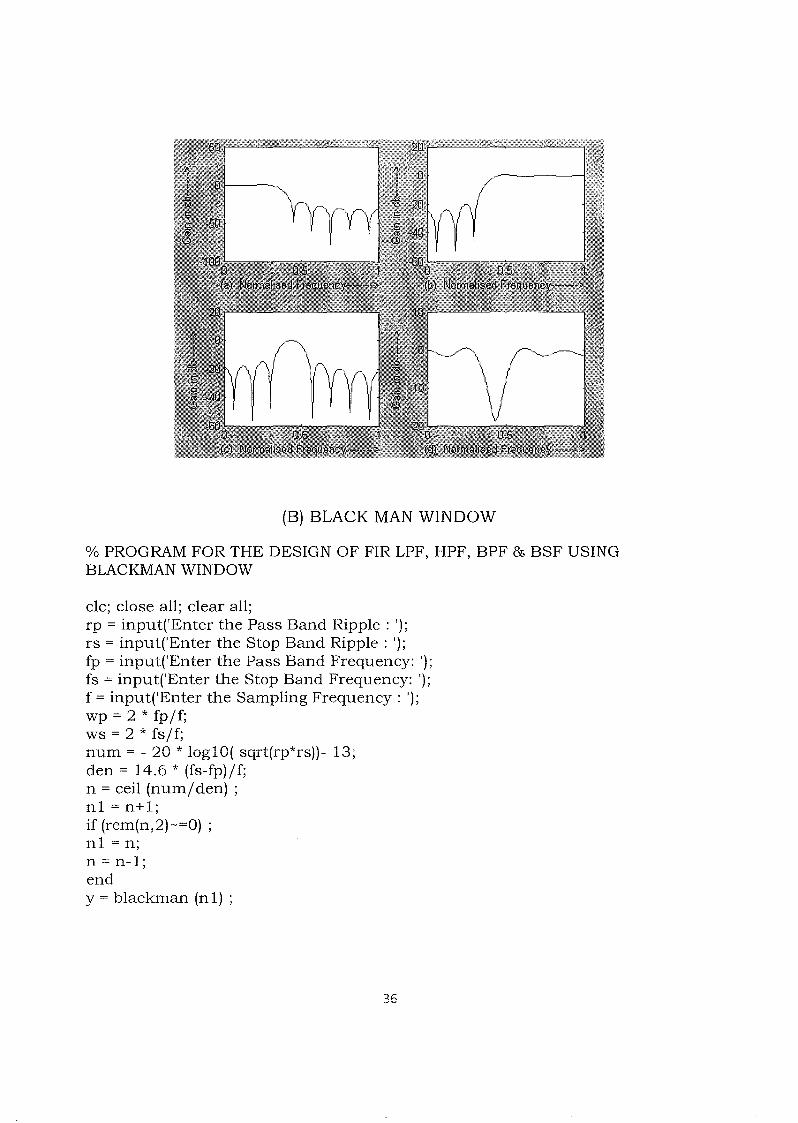
(B) BLACK MAN WINDOW
% PROGRAM FOR THE DESIGN OF FIR LPF, HPF, BPF & BSF USINGBLACKMAN WINDOW
clc; close all; clear all;rp = input('Enter the Pass Band Ripple: ');rs = input('Enter the Stop Band Ripple: ');fp = input('Enter the Pass Band Frequency: I);fs = input('Enter the Stop Band Frequency: I);f = input('Enter the Sampling Frequency: ');wp = 2 * fp /f:ws = 2 * fa/f;num = - 20 * log10( sqrt(rp*rs))- 13;den = 14.6 * (fs-fp)/f;n = ceil (nurrr/ den) ;n1 = n+l;if (rem(n,2)~=0) ;n1 = n;n = n-1;endy = blackman (n 1) ;
36
% LOW PASS FILTER
b = firl(n,wp,y);[h,o] = freqz(b,1,256);m = 20 * log10(abs(h));subplot(2,2,1) ;plot (o/pi,m) ;title(' ***** BLACKMAN WINDOW *****');ylabel('Gain indb------>');xlabel(' (a) Normalised Frequency------->');
% HIGH PASS FILTER
b = firl(n,wp,'high',y);[h,o] = freqz(b,1,256);m = 20*log10(abs(h));subplot(2,2,2) .plottoy pi.m] ;ylabel('Gain in db------>');xlabel(' (b) Normalised Frequency------->');
% BAND PASS FILTER
wn = [wp ws]; b = fir1(n,wn,y);[h,o] = freqz(b,1,256);m = 20*log10(abs(h));subplot(2,2,3) ;plot (o/pi, m) ;ylabel('Gain in db------>');xlabel(' (c) Normalised Frequency------->');
% BAND STOP FILTER
b = firl (n, wn, 'stop' , y) ;[h,o] = freqz(b,1,256);m = 20*log10(abs(h));subplot(2,2,4) ;plot [oZpi, m) ;ylabel('Gain in db------>');xlabel(' (d) Normalised Frequency------->');
BLACKMAN WINDOW
Enter the Pass Band Ripple: 0.05
Enter the Stop Band Ripple: 0.04
Enter the Pass Band Frequency: 1500
Enter the Stop Band Frequency: 2000
Enter the Sampling Frequency: 8000
37

(C) HAMMING WINDOW
% PROGRAM FOR THE DESIGN OF FIR LPF, HPF, BPF & BSF USINGHAMMING WINDOWclc; close all; clear all;rp = input('Enter the Pass Band Ripple: '];rs = input('Enter the Stop Band Ripple: ');fp = input('Enter the Pass Band Frequency: '];fs = input('Enter the Stop Band Frequency: ');f = input('Enter the Sampling Frequency: ');wp = 2 * fpjf;ws = 2 * fsjf;num = - 20 * log10( sqrt(rp*rs))- 13;den = 14.6 * (fs-fp)jf;n = ceil (numj den) ;n1 = n+1;if (rem(n,2)-=0) ;n1 = n;n = n-1;endy = hamming (n1) ;
38

% LOW PASS FILTER
b = fir1(n,wp,y);[h,o] = freqz(b,1,256);m = 20 * log10(abs(h));subplot(2,2,1) ;plot (o/pi,m) ;title(' ***** HAMMING WINDOW *****');ylabel('Gain indb------>');xlabel(' (a) Normalised Frequency-v-v-v->');
% HIGH PASS FILTER
b = firl(n,wp,'high',y);[h,o] = freqz(b,1,256);m = 20*log10(abs(h));subplot(2,2,2) .plotto Zpi.m] ;ylabel('Gain in db------>');xlabel(' (b) Normalised Frequency-v-v-s->'];
% BAND PASS FILTER
wn = [wp ws]; b = fir1(n,wn,y);[h,o] = freqz(b,1,256);m = 20*logl O(abs(h));subplot(2,2,3) ;plot (o/pi, m) ;ylabel('Gain in db------>');xlabel(' (c) Normalised Frequency------->');
% BAND STOP FILTER
b = firl (n, wn, 'stop' , y) ;[h,o] = freqz(b,1,256);m = 20*log10(abs(h));subplot(2,2,4) ;plot (o/pi, m) ;ylabel('Gain in db------>');xlabel(' (d) Normalised Frequency------->');
HAMMING WIDOW
Enter the Pass Band Ripple: 0.05
Enter the Stop Band Ripple: 0.04
Enter the Pass Band Frequency: 1500
Enter the Stop Band Frequency: 2000
Enter the Sampling Frequency: 8000
39
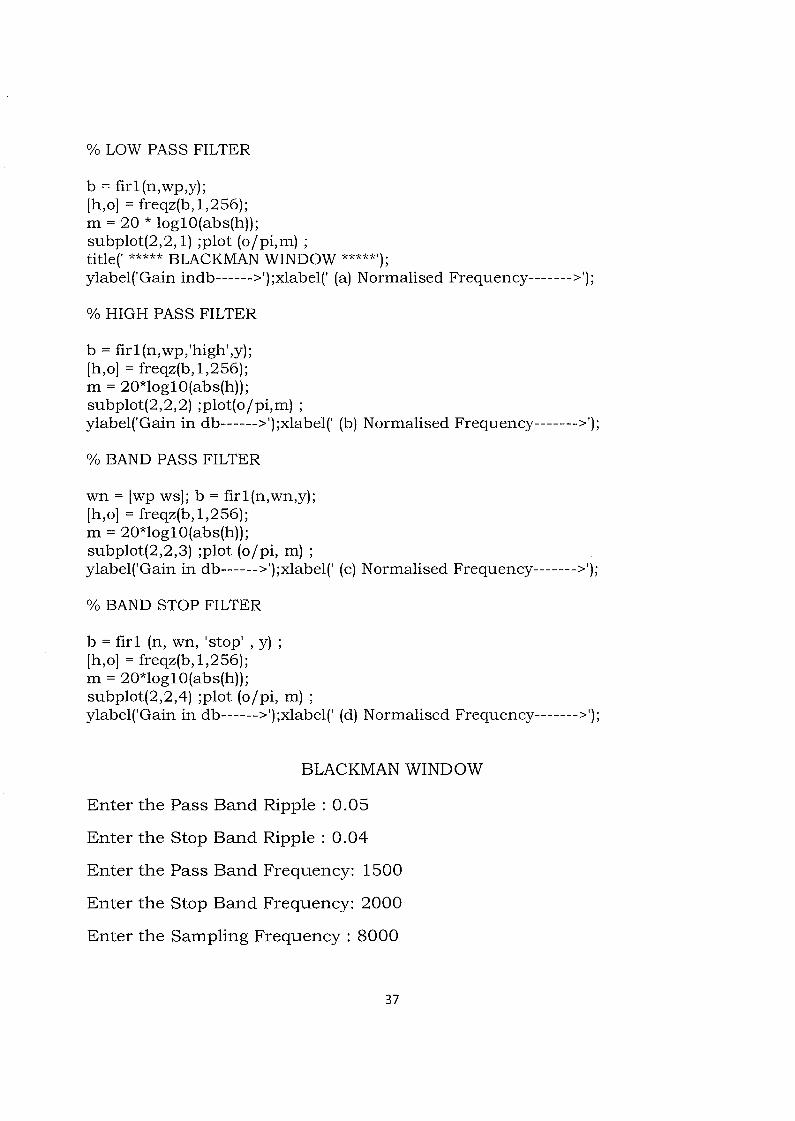
(D) HANNING WINDOW
% PROGRAM FOR THE DESIGN OF FIR LPF, HPF, BPF & BSF USINGHANNING WINDOW %clc; close all; clear all;rp = input('Enter the Pass Band Ripple: ');rs = inputl'Enter the Stop Band Ripple: ');fp = input('Enter the Pass Band Frequency: ');fs = input('Enter the Stop Band Frequency: ');f = input('Enter the Sampling Frequency: ');wp = 2 * fp/f;ws = 2 * fs/f;num = - 20 * loglO( sqrt(rp*rs))- 13;den = 14.6 * (fs-fp)/f;n = ceil (nurn/ den) ;nl = n+l;if (rem(n,2)~=O) ;nl = n;n = n-l;endy = hanning (nl) ;

% LOW PASS FILTER
b = firl(n,wp,y);[h,o] = freqz(b,1,256);m = 20 * log10(abs(h));subplot(2,2,1) ;plot (oZpi.m] ;title(' ***** HANNING WINDOW *****');ylabel('Gain indb------>');xlabel(' (a) Normalised Frequency------->');
% HIGH PASS FILTER
b = fir 1(n,wp,'high',y);[h,o] = freqz(b,1,256);m = 20*log10(abs(h));subplot(2,2,2) .plotto Zpi.m] ;ylabel('Gain in db------>');xlabel(' (b) Normalised Frequency------->');
% BAND PASS FILTER
wn = [wp ws]; b = firl(n,wn,y);[h,o] = freqz(b,1,256);m = 20*log10(abs(h));subplot(2,2,3) ;plot (o/pi, m) ;ylabel('Gain in db------>');xlabel(' (c) Normalised Frequency------->');
% BAND STOP FILTER
b = firl (n, wn, 'stop' , y) ;[h,o] = freqz(b,1,256);m = 20*log10(abs(h));subplot(2,2,4) ;plot (o/pi, m) ;ylabel('Gain in db------>');xlabel(' (d) Normalised Frequency------->');
HANNING WINDOW
Enter the Pass Band Ripple: 0.05
Enter the Stop Band Ripple: 0.04
Enter the Pass Band Frequency: 1500
Enter the Stop Band Frequency: 2000
Enter the Sampling Frequency: 8000
41
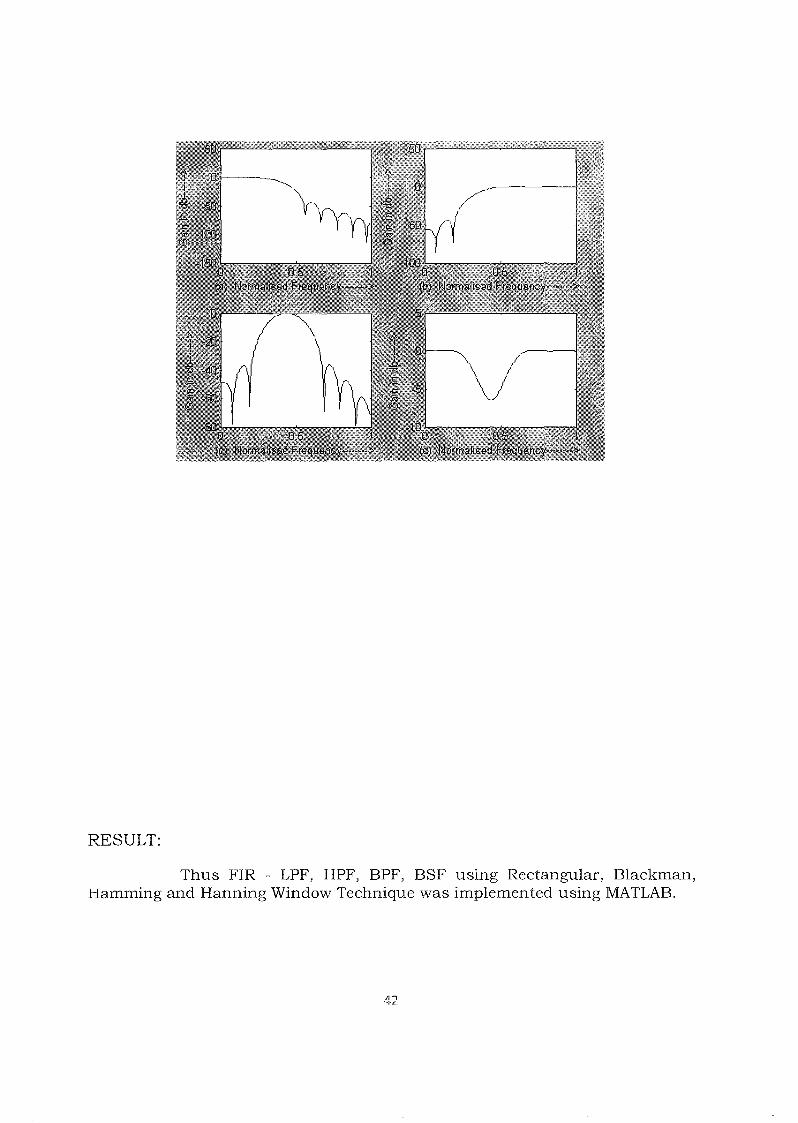
RESULT:
Thus FIR - LPF, HPF, BPF, BSF using Rectangular, Blackman,Hamming and Hanning Window Technique was implemented using MATLAB.
II')..... L
EXPERIMENT NO: 2
AIM:
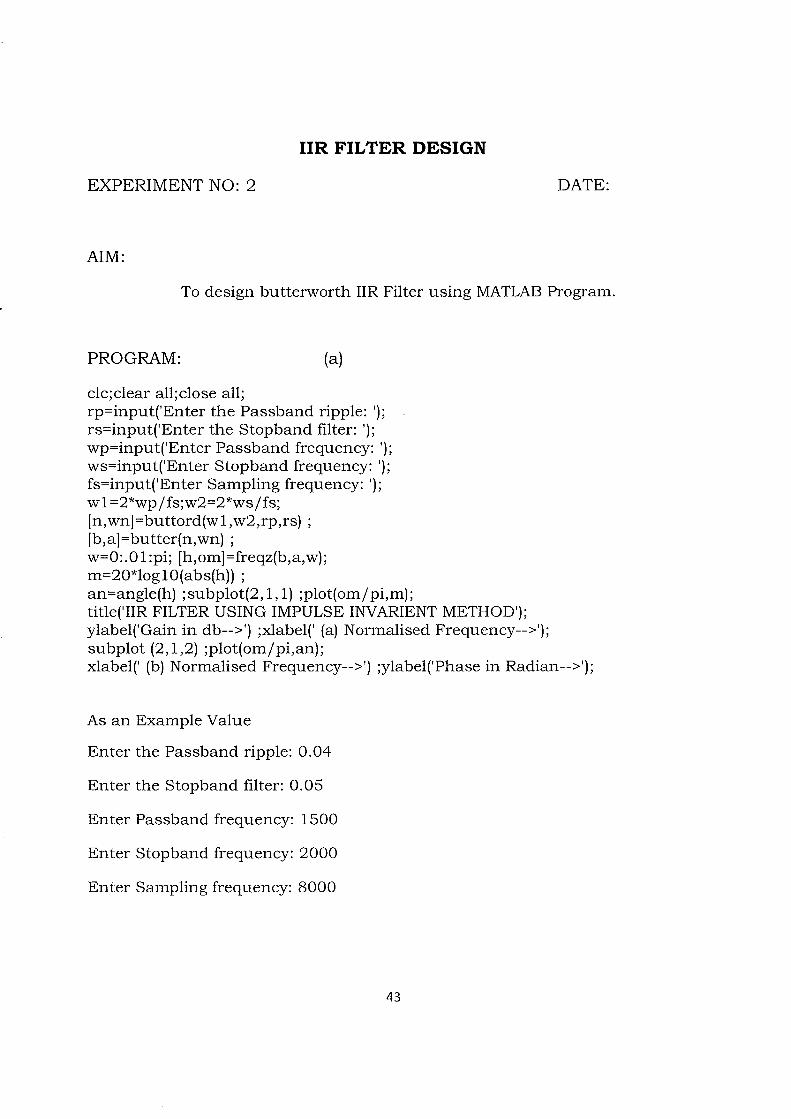
IIR FILTER DESIGN
DATE:
To design butterworth IIR Filter using MATLAB Program.
PROGRAM: (a)
c1c;c1ear all;c1ose all;rp=input('Enter the Passband ripple: ');rs=input('Enter the Stopband filter: ');wp=input('Enter Passband frequency: ');ws=input('Enter Stopband frequency: ');fs=input('Enter Sampling frequency: ');w l =2*wp j fs;w2=2*ws j fs;[n,wn]=buttord(wl,w2,rp,rs) ;[b,a]=butter(n,wn) ;w=O:.OI:pi; [h,om]=freqz(b,a,w);m=20*logI0(abs(h)) ;an=angle(h) ;subplot(2, 1, 1) ;plot(omjpi,m);title('IIR FILTER USING IMPULSE INVARIENT METHOD');ylabel('Gain in db-->') ;xlabel(' (a) Normalised Frequency-->');subplot (2,1,2) ;plot(omjpi,an);xlabel(' (b) Normalised Frequency-->') ;ylabel('Phase in Radian-->');
As an Example Value
Enter the Passband ripple: 0.04
Enter the Stopband filter: 0.05
Enter Passband frequency: 1500
Enter Stopband frequency: 2000
Enter Sampling frequency: 8000
43
PROGRAM: (b)
c1c;c1ose all;c1ear all;b = input('Enter the B value :');a = input('Enter the A value :');fs = input('Enter the Frequency:');[bz az] = bilinear(b,a,fs);[bzl azl] = impinvar(b,a,fs);disp('The Output is :');bz ,az,bzl ,azl
:4
:[1 2.8284]
: 1
Enter the B value
Enter the A value
Enter the Frequency
The Output is :
bz = 0.2929 0.5858
az = 1.0000 0.0000
bz1 = 0 0.6793
az1 = 1.0000 -0.0757
0.2929
0.1716
0.0591
RESULT:
Thus the IIR Filter was designed using Matlab.
45

MULTIRATE FILTERS
EXPERIMENT NO: 3 DATE:
AIM:
To perform interpolation and decimation using MATLAB.(A) INTERPOLATION AND DECIMATION
PROGRAM:
clc;close all;clear all;
% clears the command window% closes all the previously open window% clears previously stored values
% Generating Input Sequence% input signal frequency% sampling frequency% time range for the input sequence% input sinusoidal signal
fm = 10;Fs = 140;t = 0: 1/Fs:0.5;x = sin(2*pi*fm*t);figure(l)subplot(4, 1, 1)stem(x); % Discrete plot of the input sequence, ...
... where x-axis corresponds to the number of samplesxlabel('No. of samples'); % labelling x-axisylabel('Amplitude'); % labelling y-axistitle('input discrete sinusoidal sequence'); % giving title to the plot
% Decimation of the Input Sequence% factor by which the input sequence is decimated% resamples the sample in x with a rate (1/ M) times
M = 2;xd = decimate(x,M);the original ratesubplot(4,1,2)stem(xd) % Discrete plot of the input sequence, ...
... where x-axis corresponds to the number of samplesxlabel('No. of samples'); % labelling x-axisylabel('Amplitude'); % labelling y-axistitle('Decimated Sinusoidal Sequence'); % giving title to the plot
L = 2;xl = interp(x,L);ratesubplot(4,1,3);
% Interolation of the Input Sequence% factor by which the input sequence is interpolated% resamples the sample in x with a rate L times the original
/Ie:-r w

stem(xI); % Discrete plot of the input sequence, ...... where x-axis corresponds to the number of samples
xlabel('No. of samples'); % laeblling x-axisylabel('Amplitude'); % labelling y-axistitle('Interpolated Sinuoidal Sequence') % giving title to the plot
% Interpolation of the Decimated Signal% coefficient by which the singal is interpolated% resamples the sample in x with a rate L times the original
L = 2;xl = interp(xd,L);ratesubplot(4, 1,4)stem(xI); % Discrete plot of the input sequence, ...
... where x-axis corresponds to the number of samplesxlabel(' No. of samples'); % labelling x-axisylabel('Amplitude'); % labelling y-axistitle('Original Signal Obtained After Interpolating the Decimated Signal'); %giving title to the graph
47
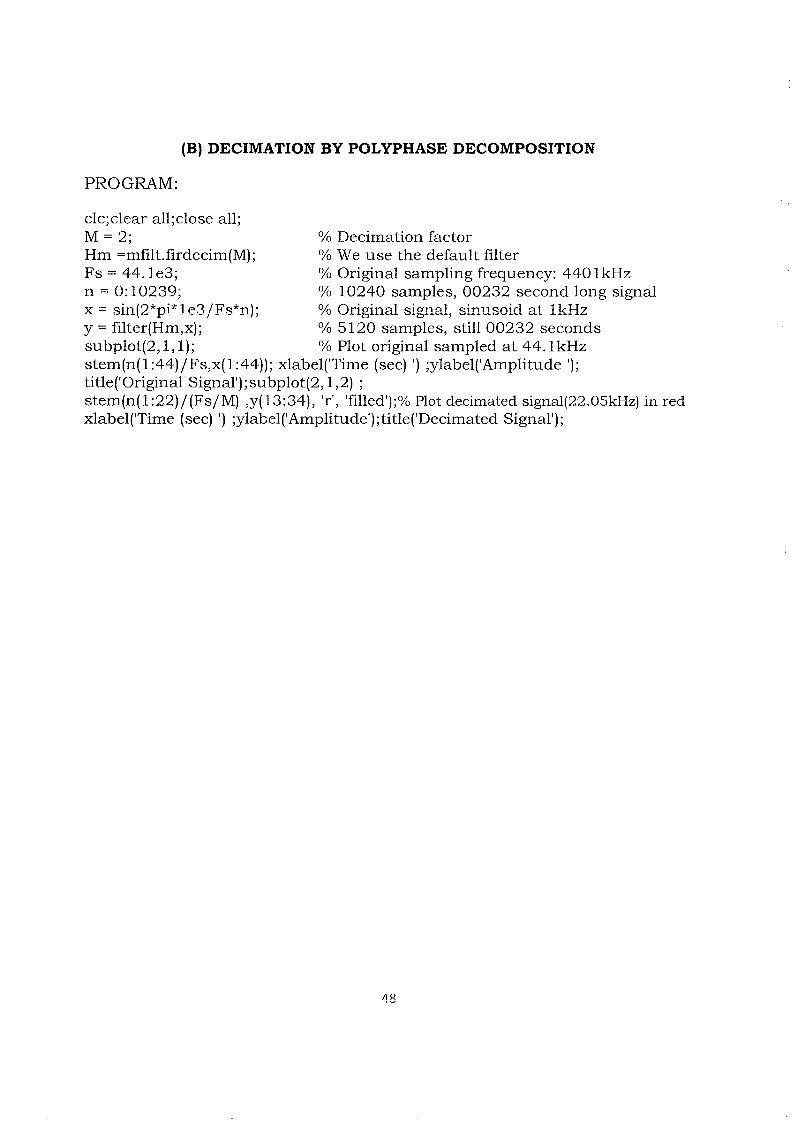
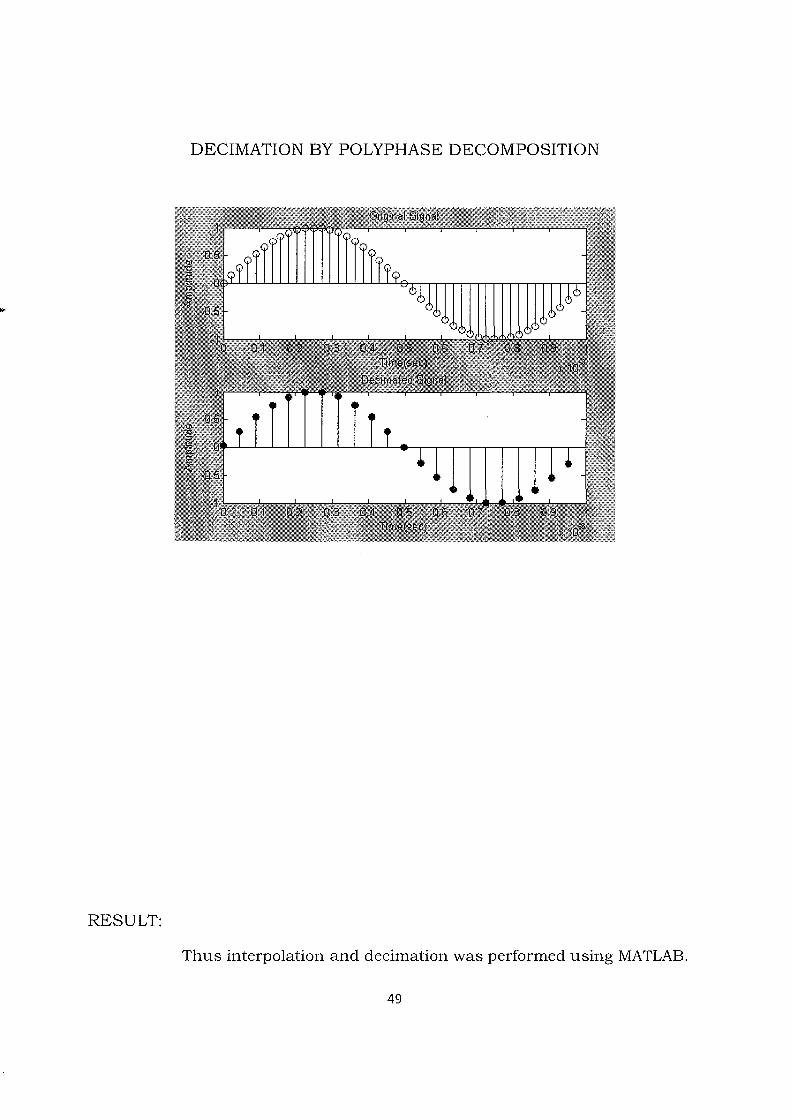
(B) DECIMATION BY POLYPHASE DECOMPOSITION
PROGRAM:
clc;clear all;close all;M = 2; % Decimation factorHm =mfilt.firdecim(M); % We use the default filterFs = 44.1e3; % Original sampling frequency: 4401kHzn = 0: 10239; % 10240 samples, 00232 second long signalx = sin(2*pi*le3jFs*n); % Original signal, sinusoid at 1kHzy = filter(Hm,x); % 5120 samples, still 00232 secondssubplot(2, 1, 1); % Plot original sampled at 44. 1kHzstem(n(1:44)jFs,x(1:44)); xlabel('Time (sec) ') ;ylabel('Amplitude ');title('Original Signal');subplot(2,1,2) ;stem(n(1:22)j(FsjM) ,y(13:34), 'r', 'filled');% Plot decimated signa1(22.05kHz) in redxlabel('Time (sec) ') ;ylabel('Amplitude');title('Decimated Signal');
48
...
RESULT:
DECIMATION BY POLYPHASE DECOMPOSITION
Thus interpolation and decimation was performed using MATLAB.
49
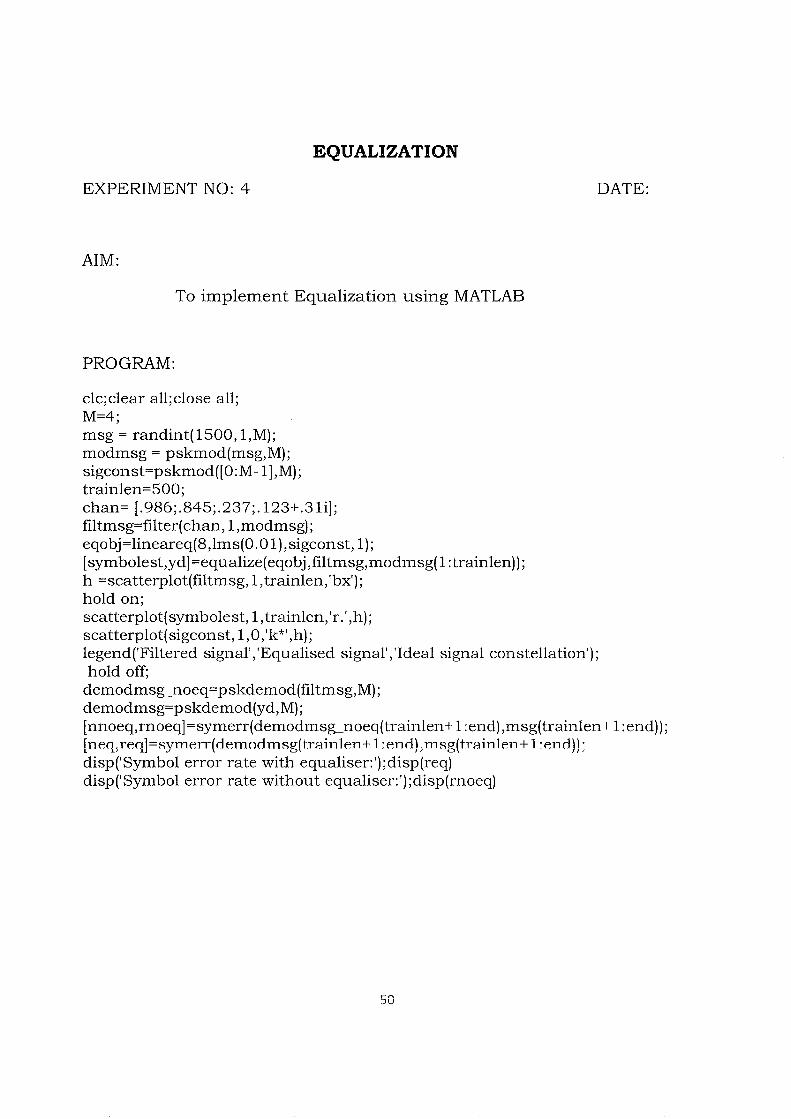
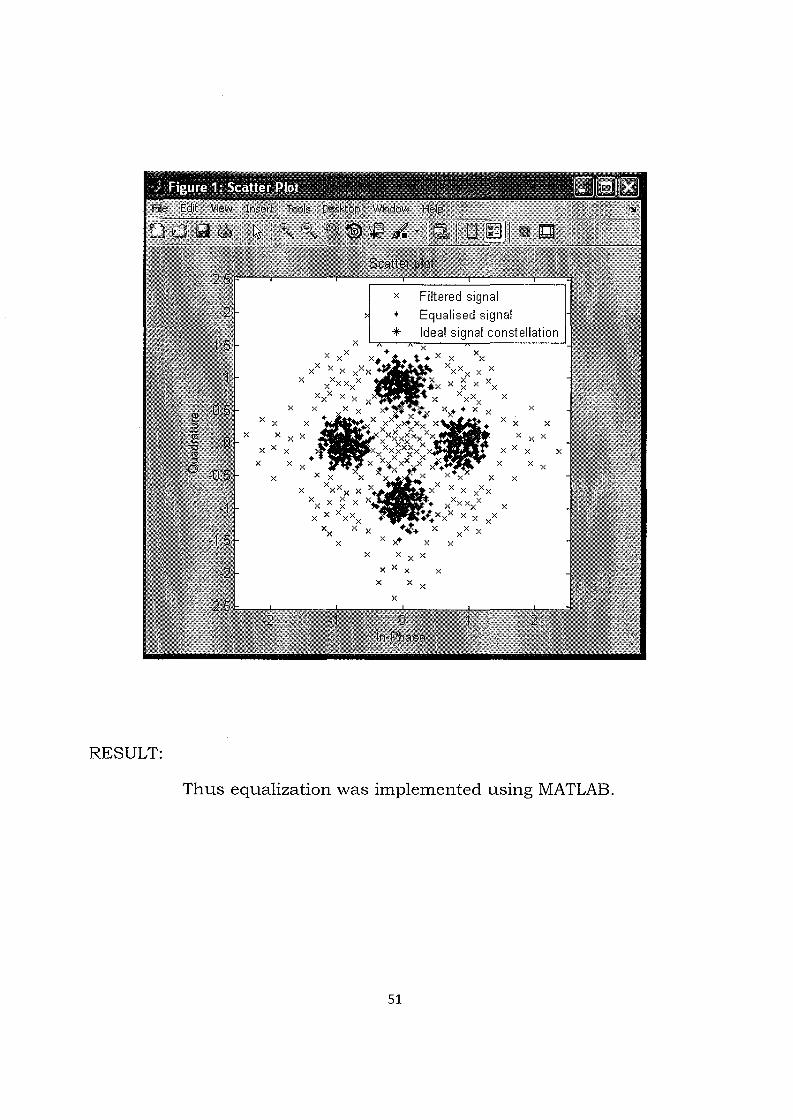
EQUALIZATION
EXPERIMENT NO: 4
AIM:
To implement Equalization using MATLAB
PROGRAM:
DATE:
c1c;c1ear all.close all;M=4;msg = randint(1500, 1,M);modmsg = pskmod(msg,M);sigconst=pskmod([O:M-1],M);trainlen=500;chan= [.986;.845;.237;.123+.3li];filtmsg=filter(chan,1,modmsg);eqobj=lineareq(8,lms(O.O 1),sigconst, 1);[symbolest,yd]=equalize(eqobj,filtmsg,modmsg(1:trainlen));h =scatterplot(filtmsg, 1,trainlen, 'bx');hold on;scatterplot(symbolest, 1,trainlen, 'r.' ,h);scatterplot(sigconst, 1,0, 'k*' ,h);legend('Filtered signal', 'Equalised signal', 'Ideal signal constellation');hold off;demodms~noeq=pskdemod(filtmsg,M) ;demodmsg=pskdemod(yd,M) ;[nnoeq,rnoeq]=symerr(demodms~noeq(trainlen+ 1:end),msg(trainlen+ 1:end));[neq,req]=symerr(demodmsg(trainlen+ 1:end),msg(trainlen+ 1:end));disp('Symbol error rate with equaliser:');disp(req)disp('Symbol error rate without equaliser:');disp(rnoeq)
50
RESULT:
Thus equalization was implemented using MATLAB.
51
IIR AND FIR IMPLEMENTATION USING TMS 320C5416
EXPERIMENT NO: 5
AIM:
To design and implement IIR (LPF jHPF) filters usingTMS320C5416 processor.
(A) IIRPROGRAM:
#include<stdio.h>#include<math.h>int i,w,wc,c,N;float H[100];float mul(float, int);void maint){
printf(" \n enter order of filter ");scanf("%d",&N);printf("\n enter the cutofffreq ");scanf("%d",&wc);printf(" \n enter the choice for IIR filter 1. LPF 2.HPF ");scanf("%d",&c);switch(c){case 1:
for(w=O;w< 100;w++){
H[w]= 1 j sqrt(l +mul((w j (float)wc),2*N));printf("H[%d]=%f\n",w,H[w]);
}break;
case 2:for(w=O;w<= 100;w++){
H[w]= 1 j sqrt(l +mul((float)wcjw,2*N));printf("H[%d]=%f\n",w,H[w]);
}break;
}}float mul(float a,int x){
DATE:
}
for(i=O;i<x-l ;i++)a*=a;return(a);
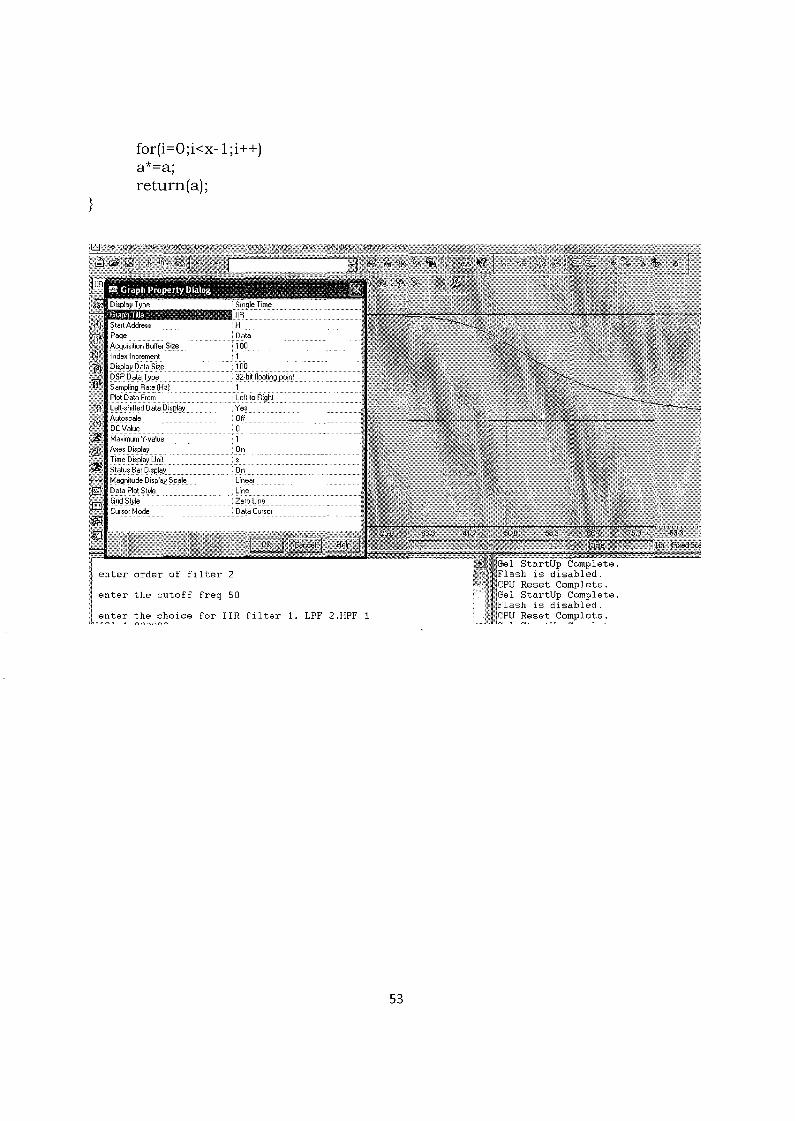
enter order of filter 2
enter the cutoff freq 50
enter the choice for IIR filter 1. LPF 2.HPF 1
53
el StartUp Complete.lash is disabled.PU Reset Complete.el StartUp Complete.lash is disabled.PU Reset Complete... ..... .. .
51!
el StartUp Complete.lash is disabled.PU Reset Complete .• , I""<.L. -,-fT.. 1"1 •..••• , _ ......
(B) FIR
PROGRAM:
To verify FIR filters.
PROGRAM:#inc1ude< stdio.h>#inc1ude<math.h>#define pi 3.1415int n,N,c;float wr[64],wt[64];void maint){
printf("\n enter no. of samples,N= :");scanf("%d",&N);printf("\n enter choice of window furiction vn l.rect \n 2. triang \n c= :");scanf("%d" ,&c);printf(" \n elements of window function are:");switch(c){
case 1:for(n=O;n<=N-1;n++){
wr[n]=l;printf(" \n wr[%d]=%f',n,wr[n]);
}break;
case 2:for(n=O;n<=N-1;n++){
wt[n]= 1-(2*(float)nj (N-1));printf("\n wt[%d]=%f',n,wt[n]);
}break;
}
}
55

wr[62]=1.000000wr [63] =1. 000000enter no. of samples,N= :64
enter choice of window function1.rect2. triangc= :1
56
el StartUp Complete.lash is disabled.PU Reset Complete.el StartUp Complete.lash is disabled.PU Reset Complete.el StartUp Complete.lash is disabled.
wt[60]~-O.9047
wt[61]~-O.9365
wt[62]~-O.968254
wt[63]=-1.000000enter no. of samples,N= :64
enter choice of window function1.rect2. triangc= :1
el StartUp Complete.lash is disabled.PU Reset Complete.el StartUp Complete.lash is disabled.PU Reset Complete.el StartUp Complete.lash is disabled.PU Reset Complete.el StartUp Complete.
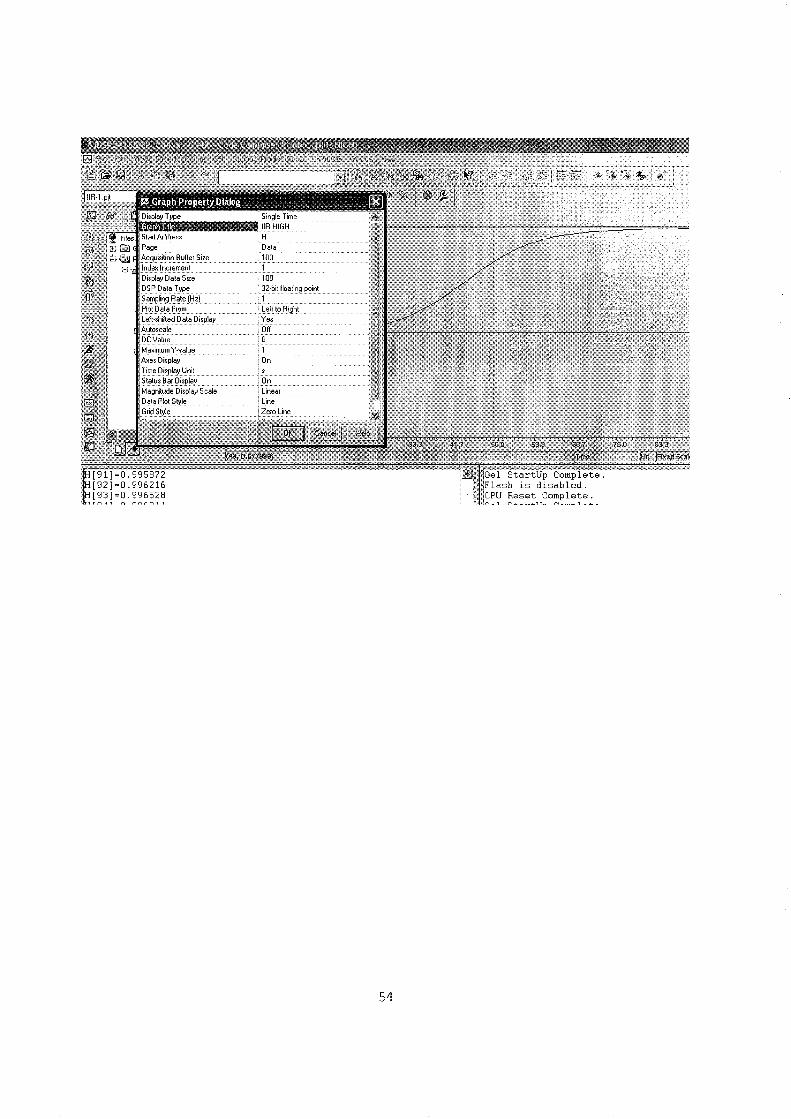
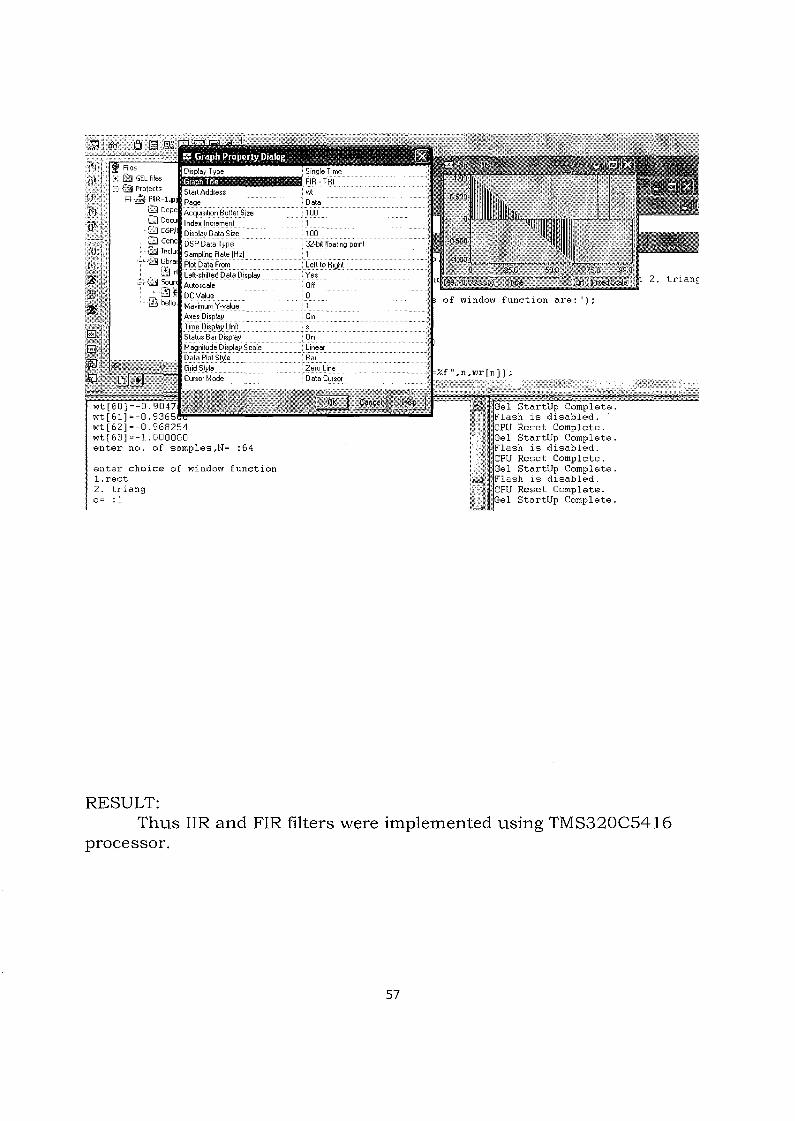
RESULT:Thus IIR and FIR filters were implemented using TMS320C5416
processor.
57
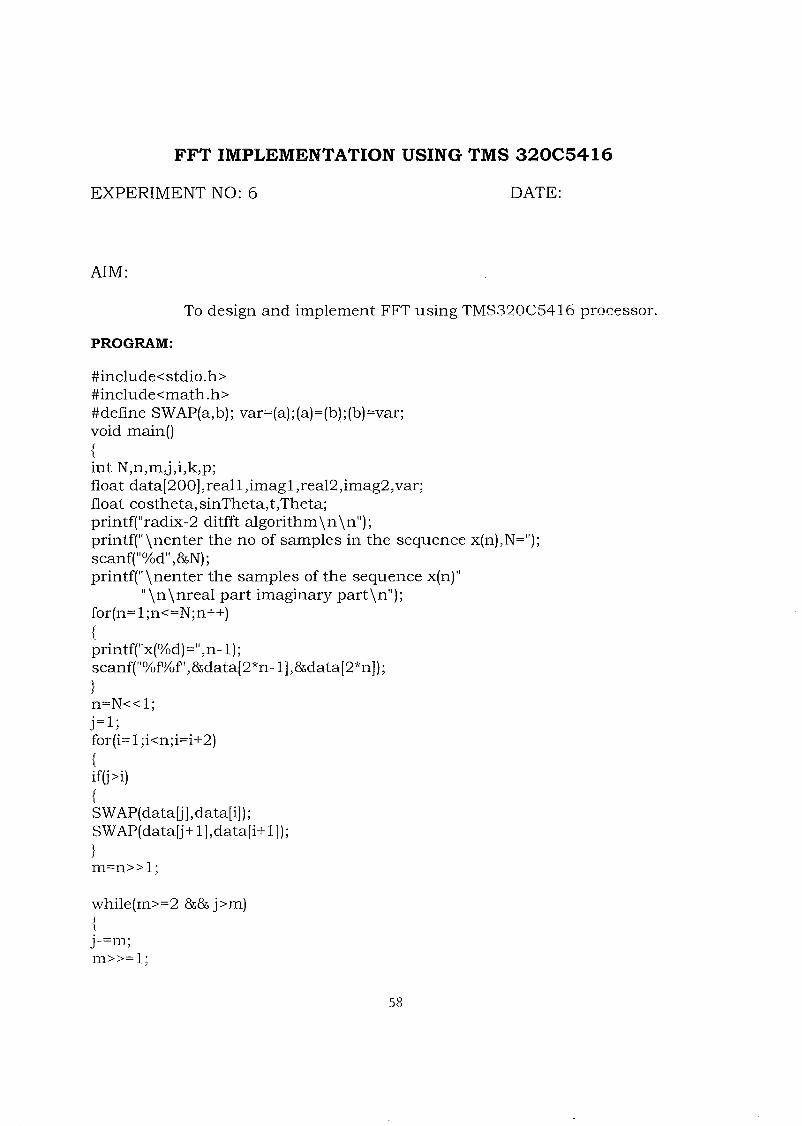
FFT IMPLEMENTATION USING TMS 320C5416
EXPERIMENT NO: 6
AIM:
DATE:
To design and implement FFT using TMS320C5416 processor.
PROGRAM:
#inc1ude<stdio.h>#inc1ude<math.h>#define SWAP(a,b); var=(a);(a)=(b);(b)=var;void maint){int N,n,m,j,i,k,p;float data[200],reall,imagl,rea12,imag2,var;float costheta, sinTheta, t,Theta;printf(" radix-2 ditfft algorithm \n \n");printf("\nenter the no of samples in the sequence x(n),N=");scanf("%d" ,&N);printfl''Vnenter the samples of the sequence x(n)"
II \n \nreal part imaginary part vn"];for(n= l;n<=N;n++){printf("x(%d)=" ,n-l);scanf("%fYof',&data[2*n-l],&data[2*n]);}n=N«I;j=l;for(i= 1;i<n;i=i+2){if(j>i){SWAP(data[j],data[i]) ;SWAP(data[j+ l],data[i+ 1]);}m=n»l;
while(m>=2 && j>m){j-=m;m»=l;
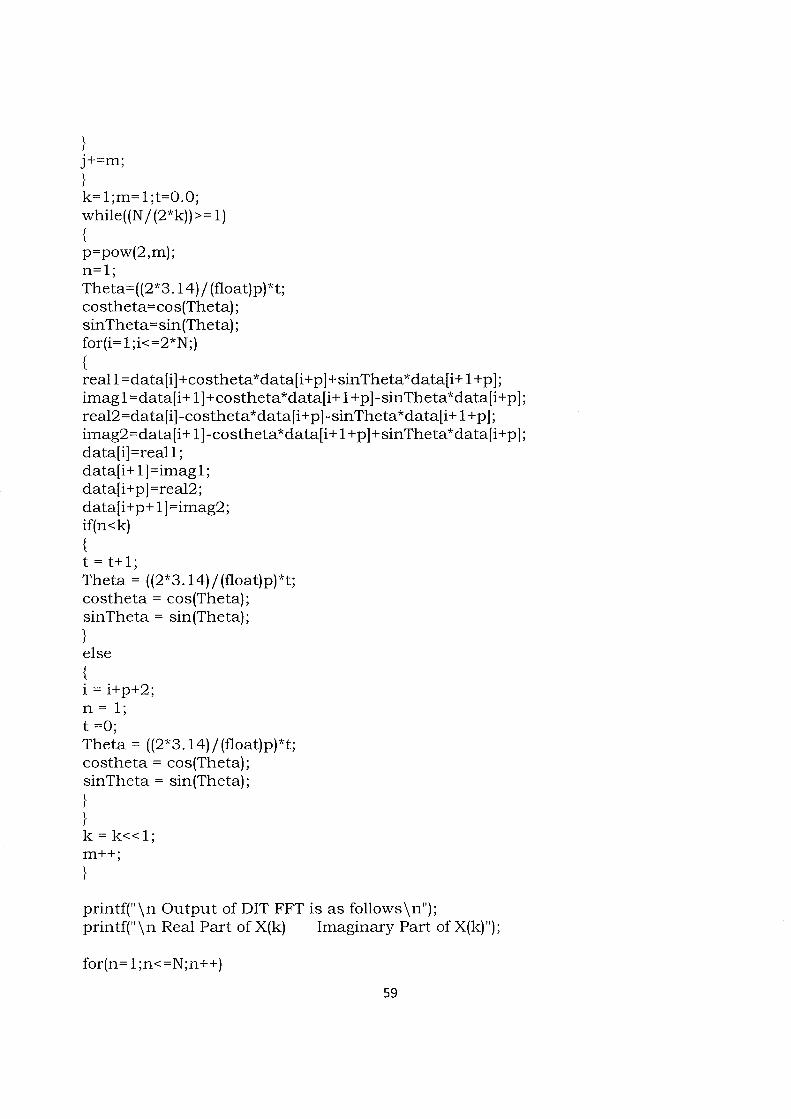
j+=m;}k= 1;m= 1;t=0.0;while((N j (2*k))>= 1){p=pow(2,m);n=1;Theta=((2*3.14) j (float)p)*t;co stheta=co s(Theta) ;sinTheta=sin(Theta);for(i= 1;i<=2*N;){real 1=data[i] +costheta*data[i+p] +sinTheta*data[i+ 1+p];imag1 =data[i+ 1]+costheta*data[i+ 1+p]-sinTheta*data[i+p];real2=data[i]-costheta*data[i+p]-sinTheta*data[i+ 1+p];imag2=data[i+ 1]-costheta*data[i+ 1+p]+sinTheta*data[i+p];datali]=real1 ;data[i+ 1]=imag1;datali+p] =real2;datali+p+ 1] =imag2;if(n<k){t = t+ 1;Theta = ((2*3.14) j (float)p)*t;costheta = cos(Theta);sinTheta = sin(Theta) ;}else{i = i+p+2;n = 1;t =0;Theta = ((2*3. 14)j(float)p)*t;costheta = cos(Theta);sinTheta = sin(Theta) ;}}k = k-c-c l ;m++;}
printf("\n Output of DIT FIT is as follows vn");printf(" \n Real Part of X(k) Imaginary Part of X(k)");
for(n= 1;n<=N;n++)
59

{printf("\n %f\t\t %f',data[2*n-l],data[2*n]);}}
RESULT:Thus the FFT were implemented using TMS320C5416
processor.
60

ADDITIONALPROGRAMS
61
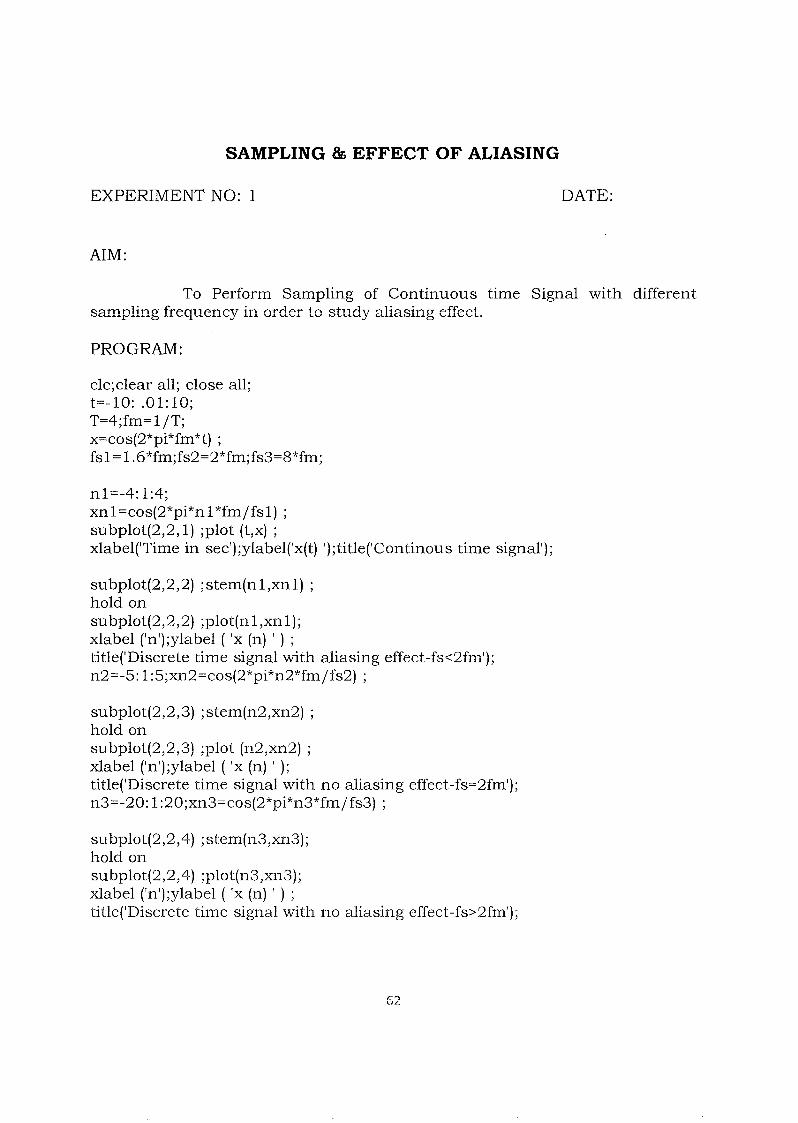
SAMPLING & EFFECT OF ALIASING
EXPERIMENT NO: 1
AIM:
DATE:
To Perform Sampling of Continuous time Signal with differentsampling frequency in order to study aliasing effect.
PROGRAM:
clc;clear all; close all;t=-10: .01:10;T=4'fm= 1IT', ,x=cos(2*pi*fm*t) ;fs1 =1.6*fm;fs2=2*fm;fs3=8*fm;
n1=-4:1:4;xn1=cos(2*pi*n1 "fmyfs I] ;subplot(2,2,1) ;plot (t,x) ;xlabel('Time in sec');ylabel('x(t) ');title('Continous time signal');
subplot(2,2,2) ;stem(n1,xn1) ;hold onsubplot(2,2,2) ;plot(n1,xn1);xlabel ('n');ylabel ( 'x (n) I ) ;
title('Discrete time signal with aliasing effect-fs<2fm');n2=-5: 1:5;xn2=cos(2*pi*n2*fm/fs2) ;
subplot(2,2,3) ;stem(n2,xn2) ;hold onsubplot(2,2,3) ;plot (n2,xn2) ;xlabel ('n');ylabel ( 'x (n) I );
title('Discrete time signal with no aliasing effect-fs=2fm');n3=-20: 1:20;xn3=cos(2*pi*n3*fm/fs3) ;
subplot(2,2,4) ;stem(n3,xn3);hold onsubplot(2,2,4) ;plot(n3,xn3);xlabel ('n');ylabel ( 'X (n) I ) ;
title('Discrete time signal with no aliasing effect-fs>2fm');
C.,VL.
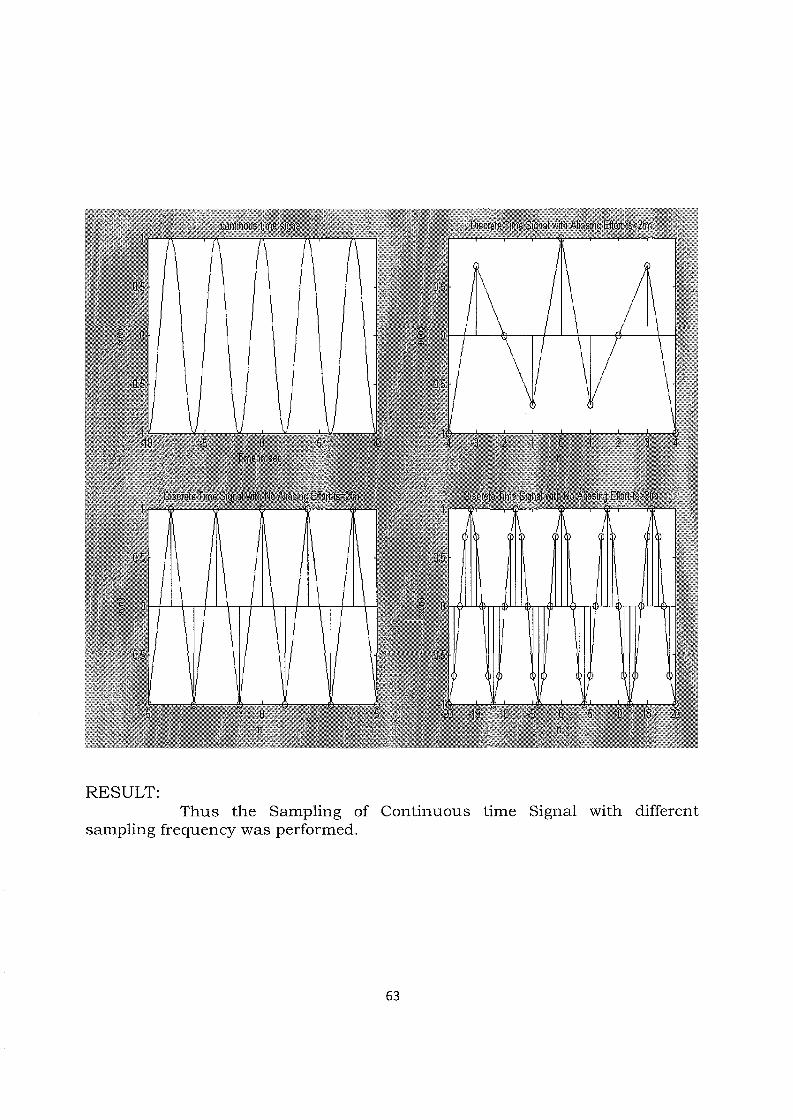
RESULT:Thus the Sampling of Continuous time Signal with different
sampling frequency was performed.
63
CALCULATION OF FFT OF A SIGNAL
EXPERIMENT NO: 2
AIM:
DATE:
To compute Discrete Fourier Transform of the input sequence using FFTFunction.
FORMULA:
N-l
y(k) = I x(n)e for 0 ~ k ~ N - 1
n=O
PROGRAM:
clc; close all; clear all;x = input ('Enter the Sequence :');n = input ('Enter the length of fft:') ;y= fft(x,n) ;subplot(3, 1, 1); stem(y) ;ylabel('Imaginary Value--->') ;xlabel('Integer 'K' Value-s>'] ;y1 = abs(y);subplot(3, 1,2) ;stem(y1) ;ylabel('Magnitude--->') ;xlabel ('k-->')y2= realty) ;y3=imag(y);y4=atan(y3.jy2); subplot(3,1,3) ; stem(y4) ;ylabel('Phase--->') ;xlabel('k--> ')disp('The FFT Sequence is: ') ;y,y1,y2,y3,y4
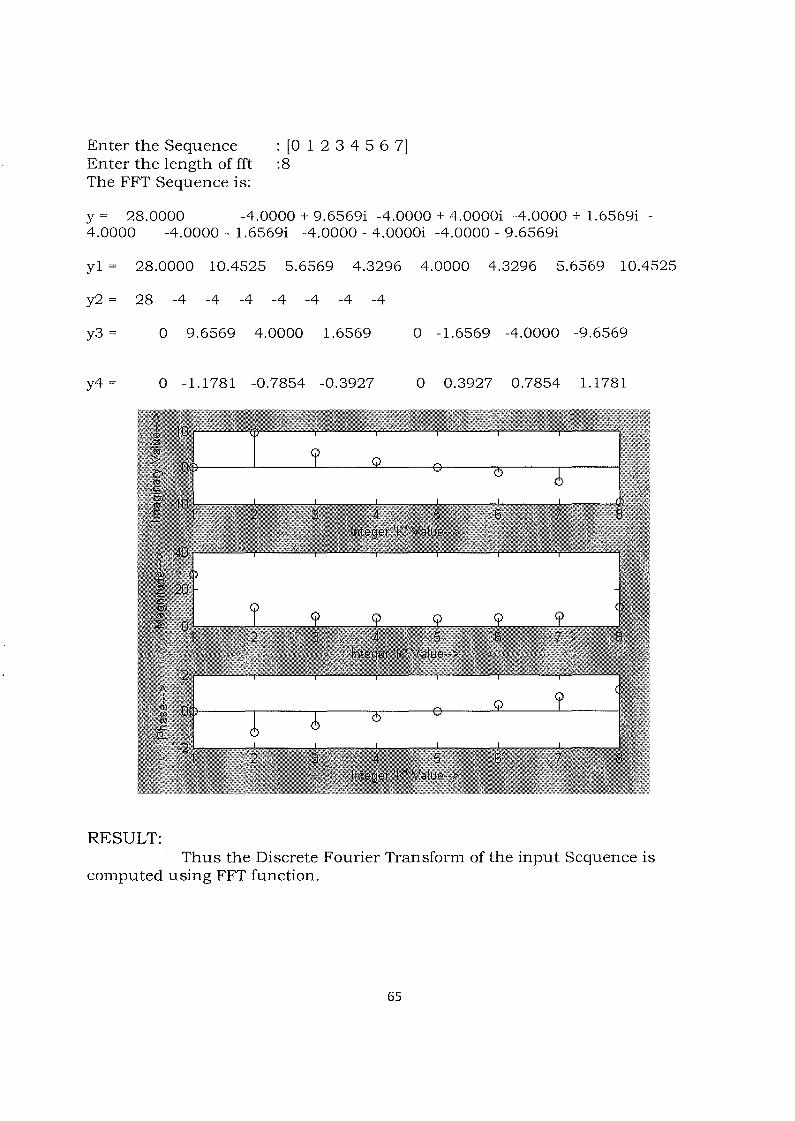
Enter the SequenceEnter the length of fftThe FFT Sequence is:
: [0 1 2 3 4 5 6 7]:8
y = 28.0000 -4.0000 + 9.6569i -4.0000 + 4.0000i -4.0000 + 1.6569i -4.0000 -4.0000 - 1.6569i -4.0000 - 4.0000i -4.0000 - 9.6569i
y1 = 28.0000 10.4525 5.6569 4.3296 4.0000 4.3296 5.6569 10.4525
y2 = 28 -4 -4 -4 -4 -4 -4 -4
y3 =
y4 =
o 9.6569 4.0000 1.6569
o -1.1781 -0.7854 -0.3927
o -1.6569 -4.0000 -9.6569
o 0.3927 0.7854 1.1781
RESULT:Thus the Discrete Fourier Transform of the input Sequence is
computed using FFT function.
65
DOWN SAMPLING AND UP SAMPLING
EXPERIMENT NO: 3
AIM:
DATE:
To implement Downsampling and Upsampling operation using MATLAB.
PROGRAM:
cle;clear all;close all;x = input('Enter the input Signal,x=');ni = input('Enter the Starting index,ni=');M = input('Enter the downsampling factor,M=');len = length(x);if(ni<=O)
n = [ni:ni+len-1];else
n = [O:ni+len-1];x = [zeros(1,ni),x];
end
m = fix(n(l)jM):fix(n(end)jM);a = 1;Y = zeros(1,length(m));for i = min(m):max(m)
y(a) = x(n==M*i);a = a+1;
endsubplot(211);stem(n,x);title('x[n]');xlabel('n') ;subplot(212);stem(m,y);title('y[m]=x[M*n]');xlabel('m') ;
rrUU
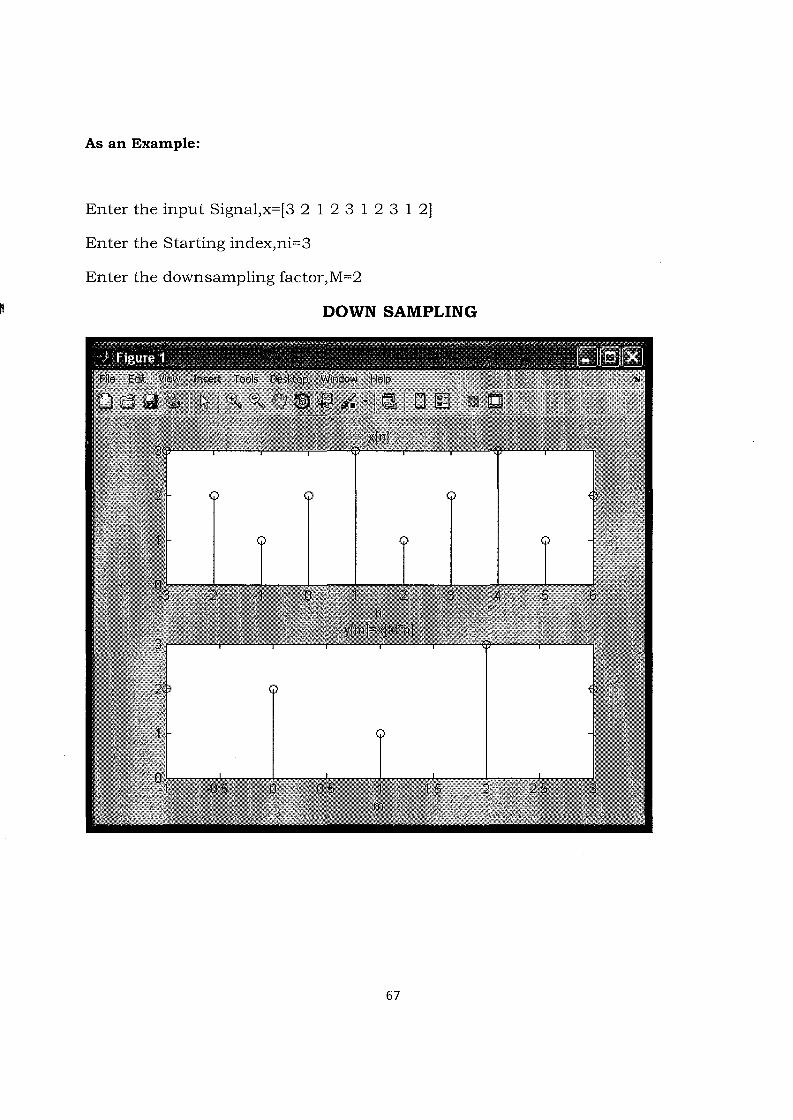
As an Example:
Enter the input Signal,x=[3 2 1 2 3 1 2 3 1 2]
Enter the Starting index,ni=3
Enter the downsampling factor,M=2
DOWN SAMPLING
67
PROGRAM:
cle;clear all;close all;x = input('Enter the input Signal,x=');ni = input('Enter the Starting index,ni=');L = input('Enter the upsampling faetor,L=');len = length(x);if(ni<=O)
n = [ni:ni+len-1];else
n = [O:ni+len-1];x = [zeros(1,ni),x];
end
m = fix(n(1)*L):fix(n(end)*L);a = 1;Y = zeros( 1,length(m));for i = min(m) :max(m)
if (ijL==fix(ijL))y(a) = x(n==ijL);
enda=a+1;
endsubplot(211);stem(n,x);title('x[n]');xlabel('n') ;subplot(212);stem(m,y);title('y[m]=x[njL]');xlabel('m') ;
As an Example:
Enter the input Signal,x=[1 3 1 2 1]
Enter the Starting index,ni=-l
Enter the upsampling faetor,L=3
covo
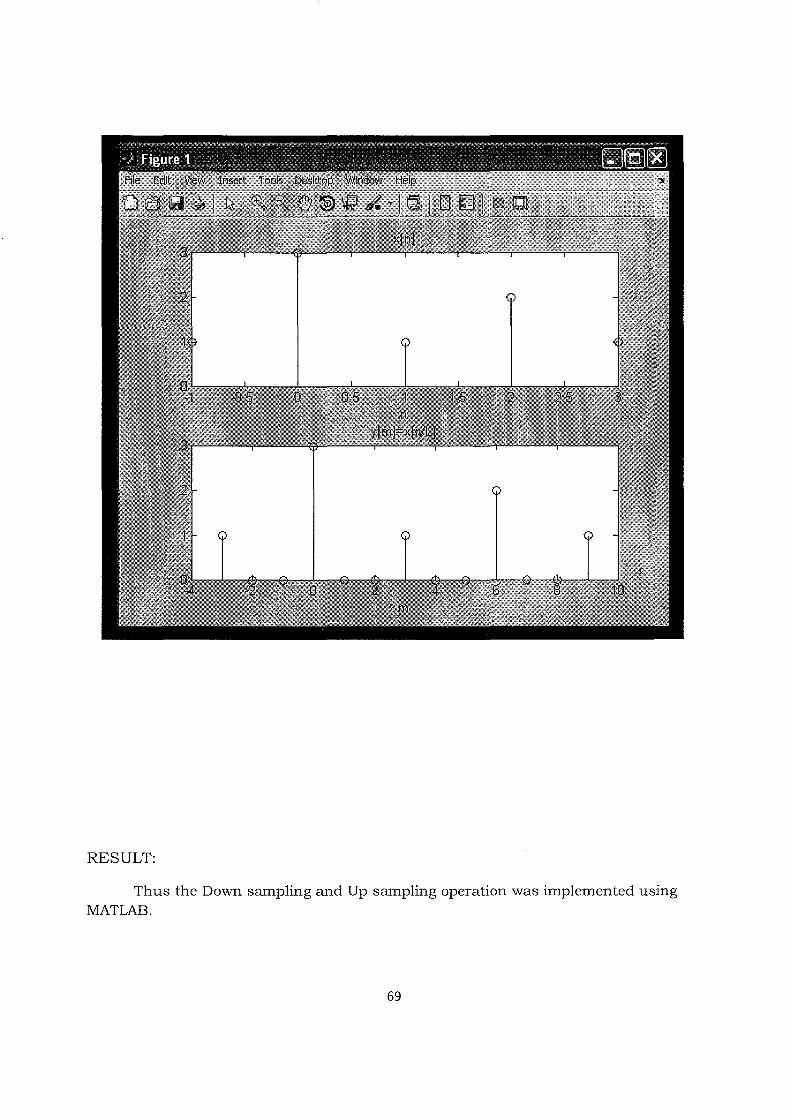
RESULT:
Thus the Down sampling and Up sampling operation was implemented usingMATLAB.
69
EXPERIMENT NO: 4
AIM:
WAVEFORM GENERATION
DATE:
To Generate Triangular, Sawtooth, and Square waveform using MATLABProgram.
PROGRAM:a) TRIANGULAR WAVEFORM
y= 0:0.5:2;for j = 0:3
x = ( 4*j) + y;plotlx.y];hold on
endfor k = 0:3
x = (4*k) - Y;plottx.y];hold on
endhold off
,r\IV
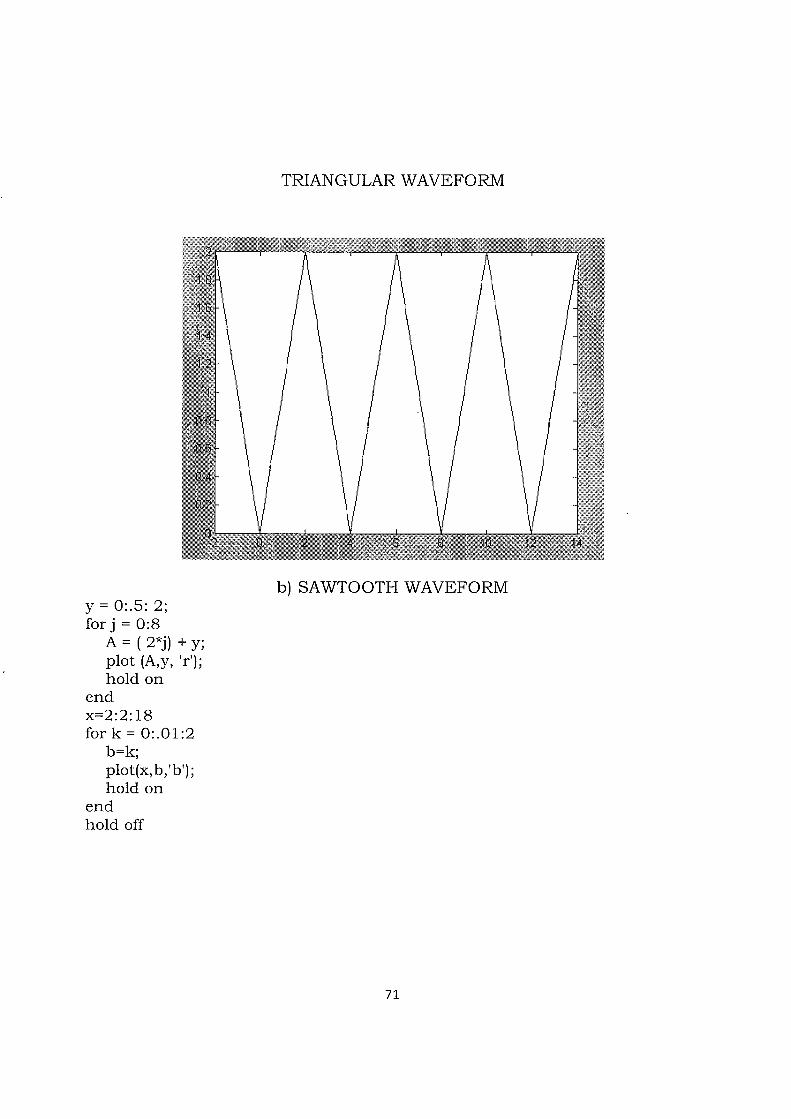
TRIANGULAR WAVEFORM
y = 0:.5: 2;for j = 0:8
A = ( 2*j) + y;plot (A,y, 'r'};hold on
endx=2:2:18for k = 0:.01:2
b=k;plot(x,b,'b');hold on
endhold off
b) SAWTOOTH WAVEFORM
71
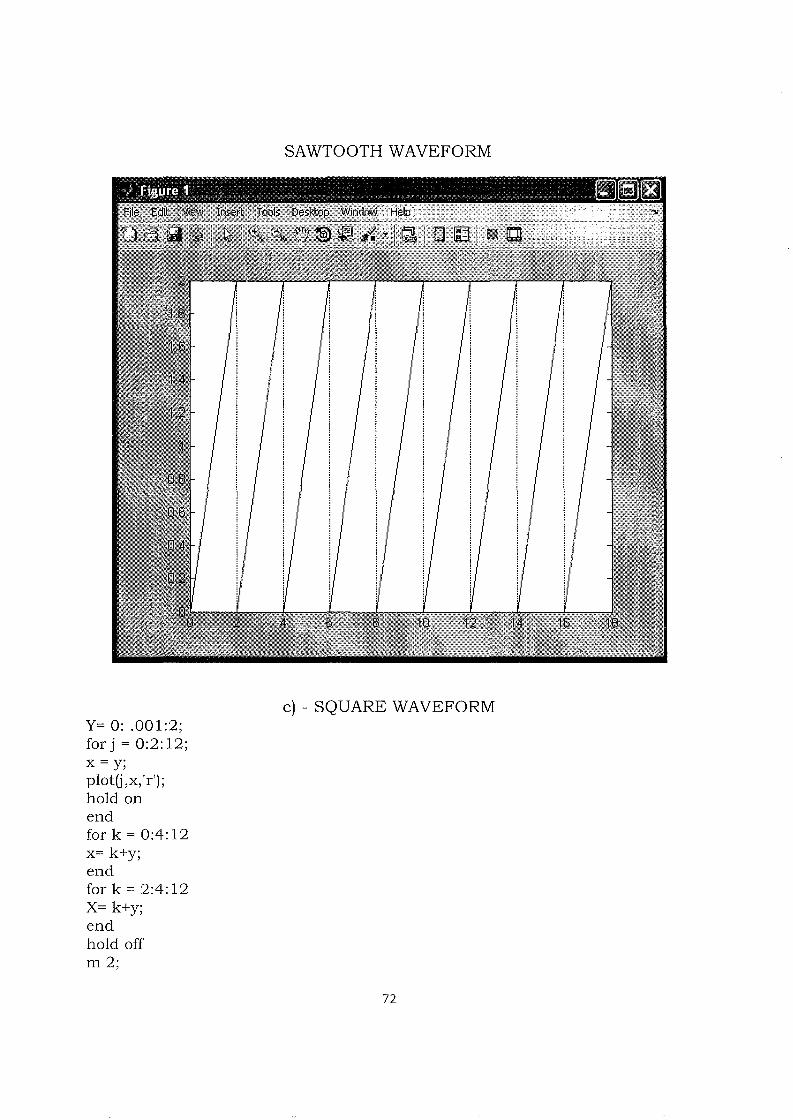
SAWTOOTH WAVEFORM
Y> 0: .001:2;for j = 0:2: 12;x = y;plottj.x.tr']:hold onendfor k = 0:4: 12x= k+y;endfor k = 2:4: 12X= k+y;endhold offm2;
c) - SQUARE WAVEFORM
7'I L

rna;axis([O 12 -0.5 2.5])RESULT:plot(x,m, 'r'); hold onplot(x,m, 'r'); hold on
SQUARE WAVEFORM
RESULT:Thus the Triangular, Sawtooth and Square waveform was
generated using MA TLAB Program.
73
SUM OF SINUSOIDAL SIGNALS
EXPERIMENT NO: 5
AIM:
To verify Sum of Sinusoidal Signals using MATLAB
PROGRAM:
% sum of sinusoidal signalsc1c;c1ear all;c1ose all;tic;
%giving linear spacest=O:.Ol :pi;% t=linspace(0,pi,20);
%generation of sine signalsyI=sin(t);y2=sin(3*t) j 3;y3=sin(5*t) j 5;y4=sin(7*t)j7;y5=sin(9*t)j9;y = sin(t) + sin(3*t)j3 + sin(5*t)j5 + sin(7*t)j7 + sin(9*t)j9;plot(t,y, t.y l ,t,y2, t,y3, t,y4, t,y5);legend('y', 'y l ','y2' ,'y3' ,'y4' ,'y5');title('generation of sum of sinusoidal signals');grid;ylabel(' ---> Amplitude') ;xlabel(' ---> t ');toc;
,A1'+
DATE:
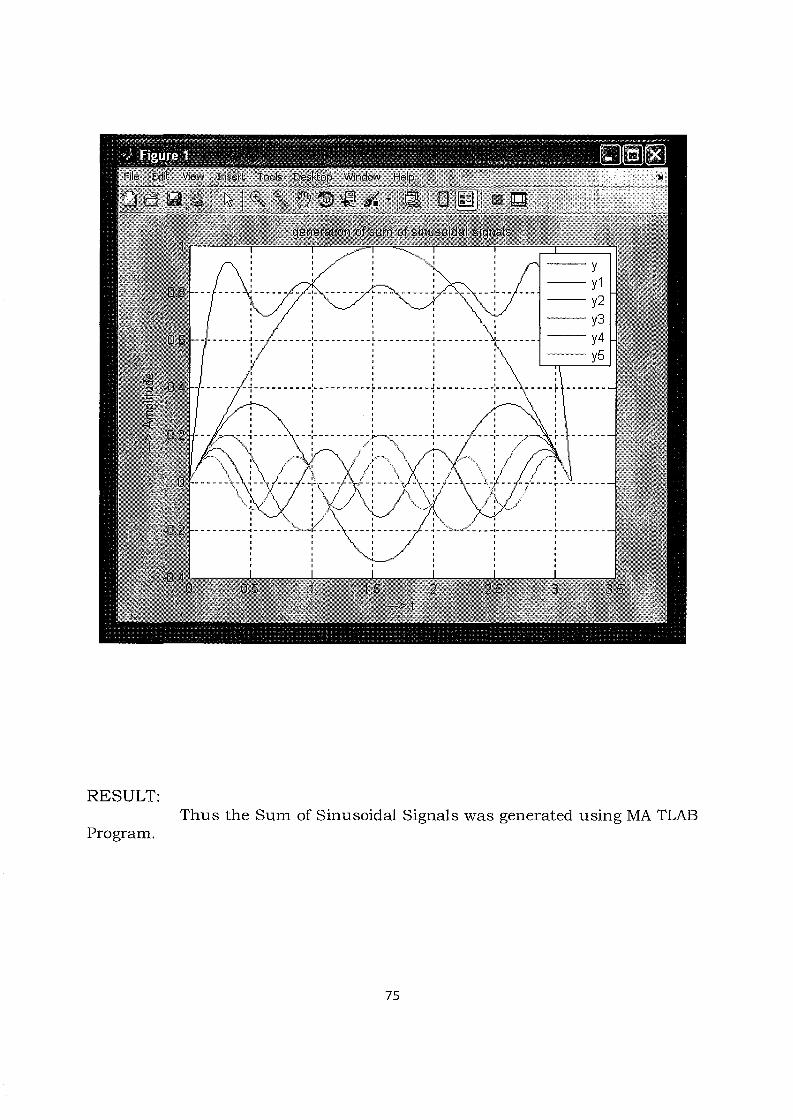
RESULT:
Program.Thus the Sum of Sinusoidal Signals was generated using MA TLAB
75
EXPERIMENT NO: 6
AIM:
WAVE GENERATION
DATE:
To Generate a Square waveform using TMS320C5416 DSP KIT
Program#include <stdio.h>#include <math.h>unsigned short a[500];void main( ){int i=O,j=O,k=O;
for(k=O;k<5;k++){for(i=O;i<50;i++){am = OxOOOOFFFF;j++;
}for(i=O;i<50;i++)
{a[j] = OxO; j++;printf("%f' ,aU]);
}}}
76

RESULTThus the Square waveform was generated.
77
lash is disablePU Reset Compleel StartUp Camplash is disablePU Reset Compleel StartUp Camplash is disable

PROCEDURE TO WORK WITHCODE COMPOSER STUDIO V3.1
-'0/0

STEP 1: Check the working condition of Processor - TMS320C5416.
STEP 2: Click start
79
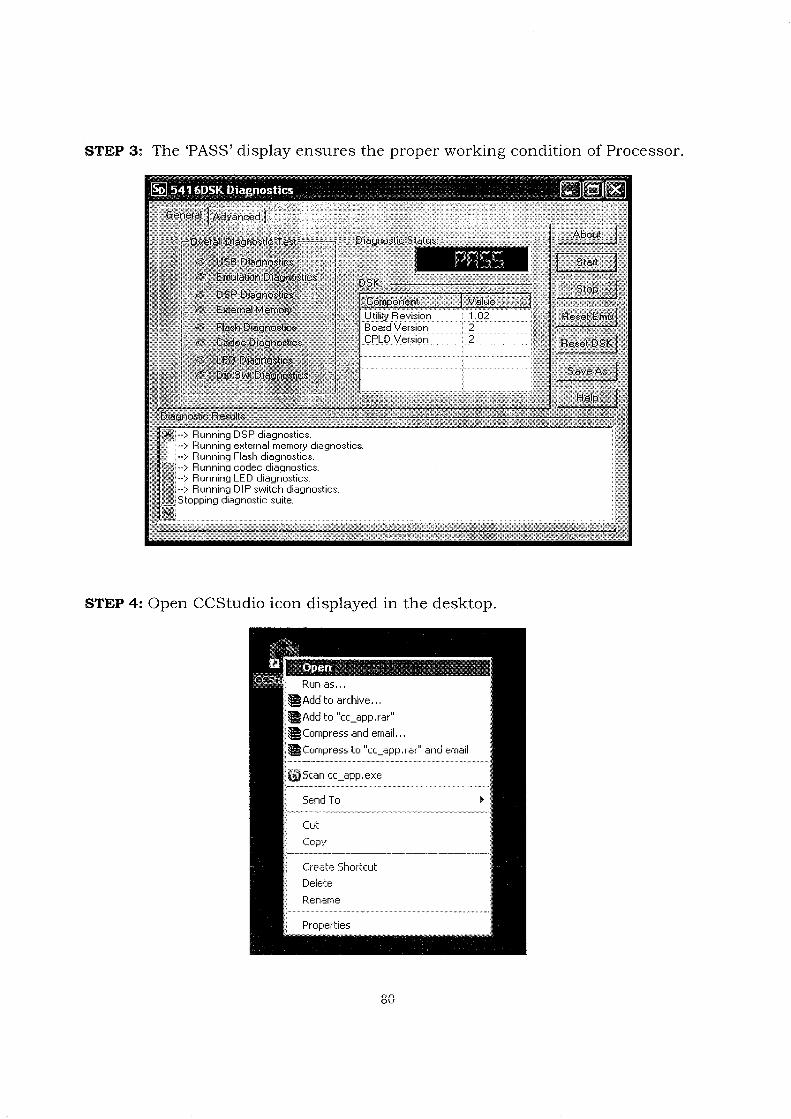
STEP 3: The 'PASS' display ensures the proper working condition of Processor.
STEP 4: Open CCStudio icon displayed in the desktop.
onau
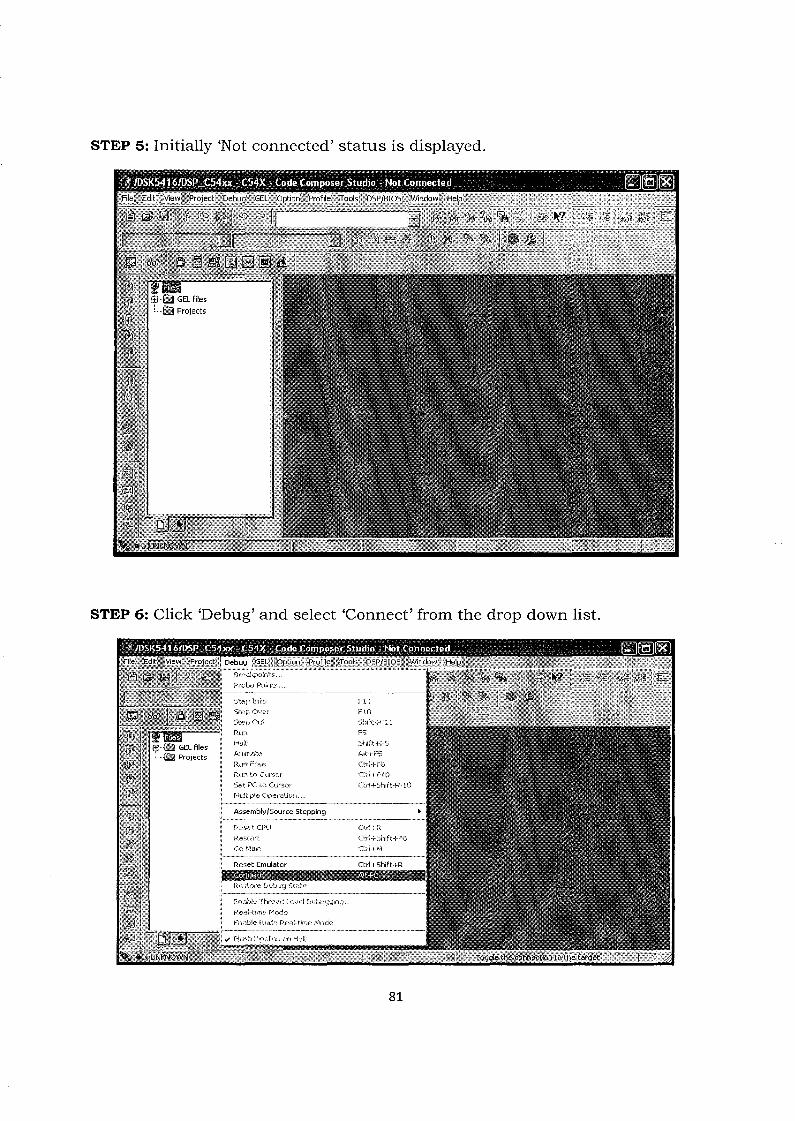
STEP 5: Initially 'Not connected' status is displayed.
STEP 6: Click 'Debug' and select 'Connect' from the drop down list.
81
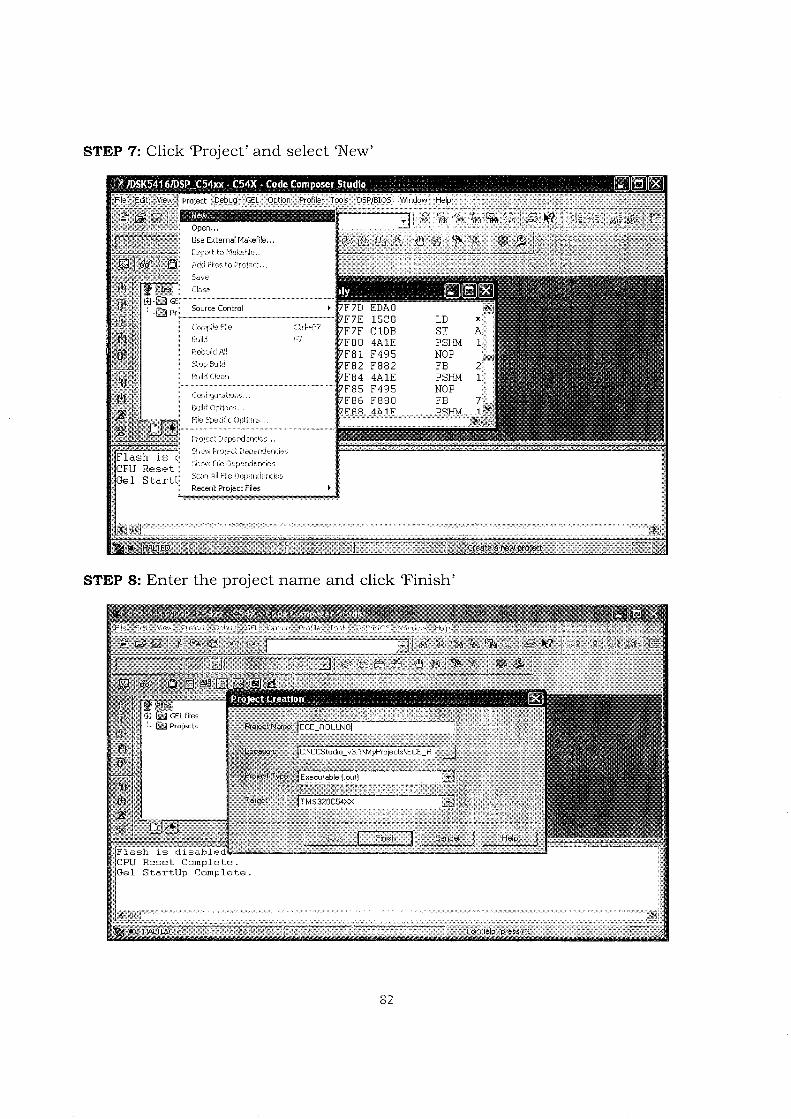
STEP 7: Click 'Project' and select 'New'
STEP 8: Enter the project name and click 'Finish'
"...,OL
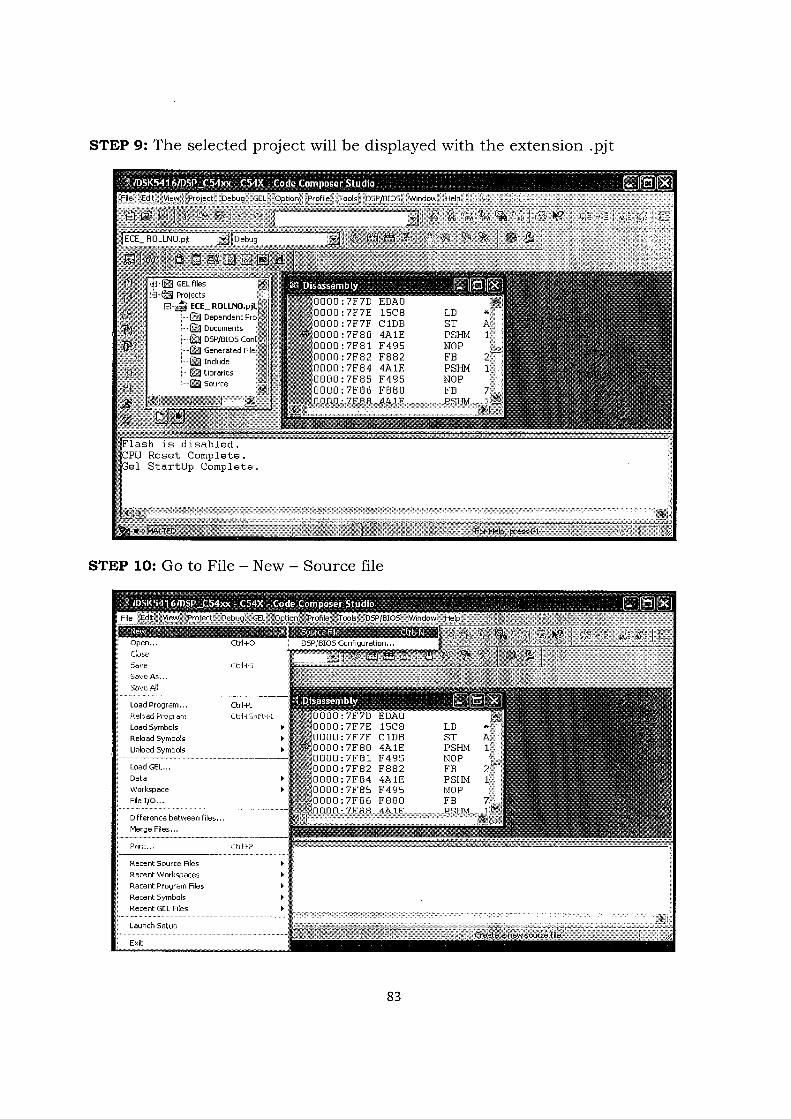
STEP 9: The selected project will be displayed with the extension .pjt
STEP 10: Go to File - New - Source file
Ctd+~::;
SGlve As, ••
Load Program... Ctrl+L
Reload Program Ctr!+Shifc+L
Load Symbols
Reload Symbols
Unload Symbols
Load GEL...
Data
Workspace
File 110...
Difference between files:".
Merge Files...
Print.,.
Recent Source Files
Recent Worl·~paces
Recent Program Files
Recent Symbols
Recent GELFiles
Launch Setup
Exit
83
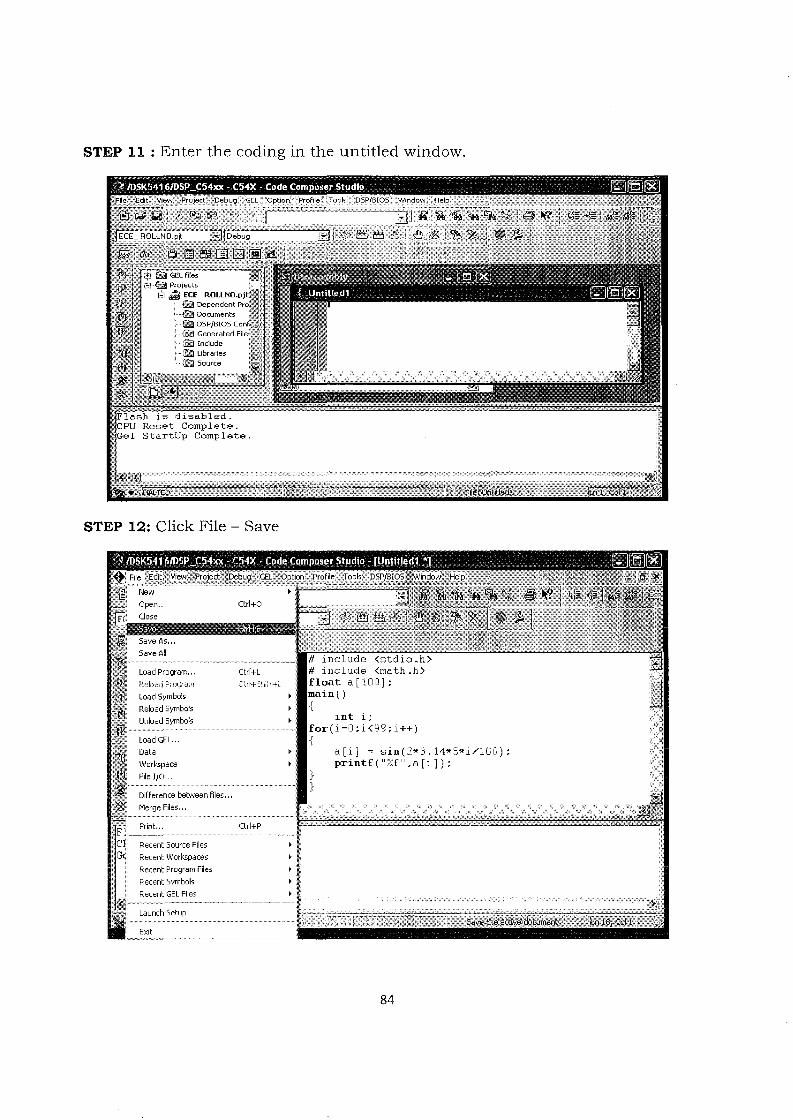
STEP 11 Enter the coding in the untitled window.
STEP 12: Click File - Save
a [i] = sin(2*3 .14*5*i/1CD);printf( "%f" ,a [i]);
}}
int i;for(i-;];i<99;i++)-[
Ctrl+P
Ctrl+CI
RecentSource Files
Recent workspeces
RecentProgram Files
Recent Symbols
Recent GEL Files
Print...
LoadProgram... Ctrl+L
Rek:ed FTDl;Jan-1 C:ri+5hif"t+L
LoadSymbols
ReloadSymbols
UnloadSymbols
LoadGEL...
Data
Workspace
File110.. ,
Difference between files...
MergeFiles,,,
, .. # include <stdio.h># include <math.h>float a[lD;]];main(){
OA0'+

STEP 13: Save the file in your project with extension .c (File name and projectname should be the same)
STEP 14: Before executing the coding, 3 files ( Source file (.c file), Library file(rts_ext) & Command file (Hello)) has to be added to the project.
Go to Project - Add files to project
85
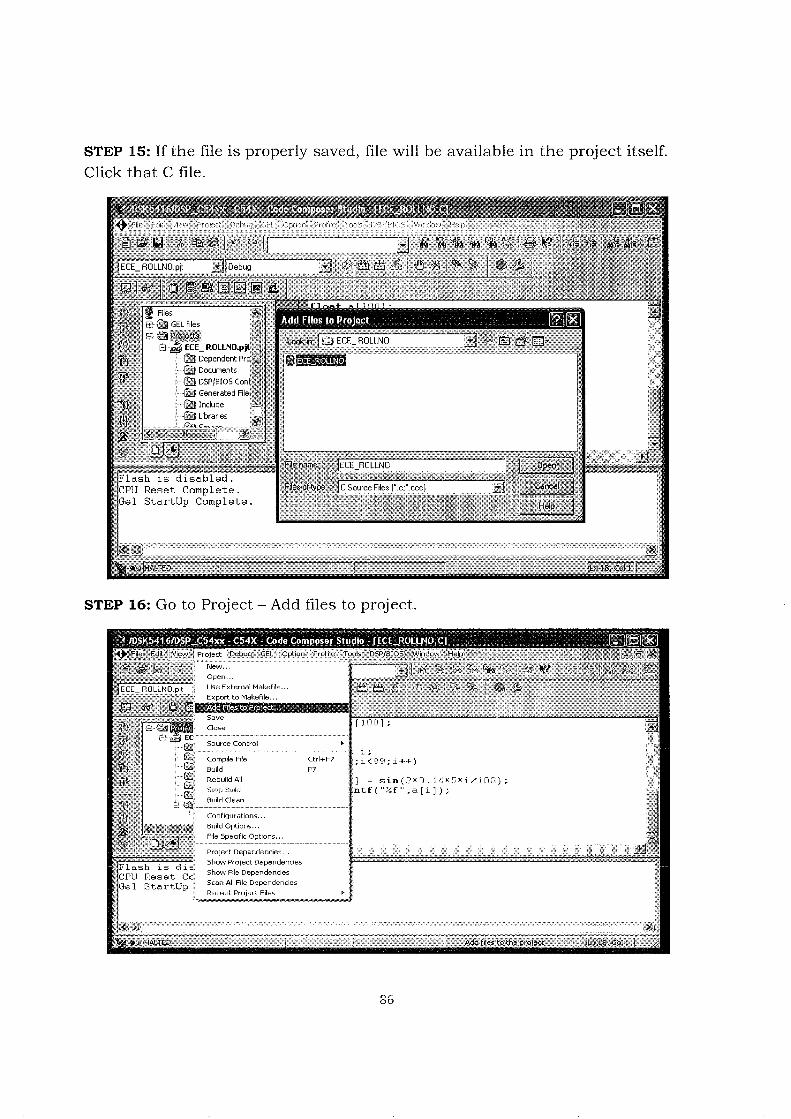
STEP 15: If the file is properly saved, file will be available in the project itself.Click that C file.
Flash is disabled.CPU Reset Complete.Gel StartUp Complete.
STEP 16: Go to Project - Add files to project.
or00
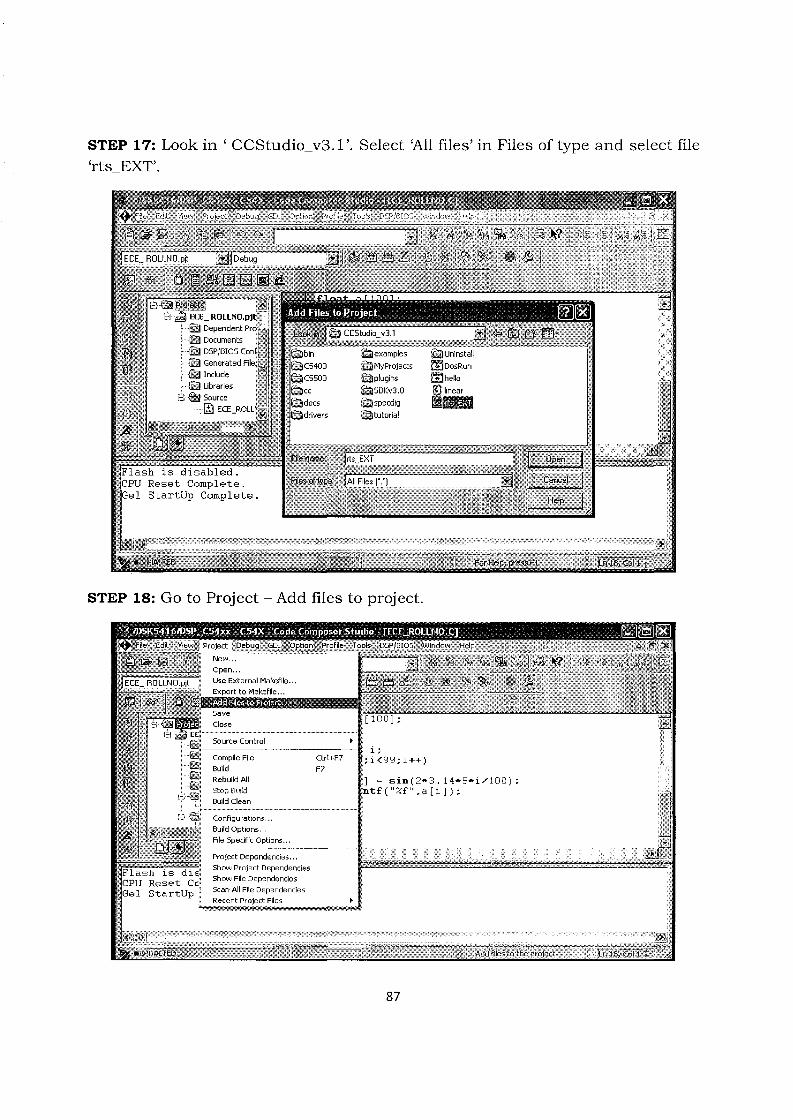
STEP 17: Look in ' CCStudio_v3.1'. Select 'All files' in Files of type and select file'rts_EXT'.
STEP 18: Go to Project - Add files to project.
87

STEP 19: Look in ' CCStudio_v3.1 '. Select 'All files' in Files of type and select file'hello'
STEP 20: Go to Project - Save
0000

STEP 21: Go to Project - Compile file. Rectify errors if present.
STEP 22: Go to Project - Build.
89
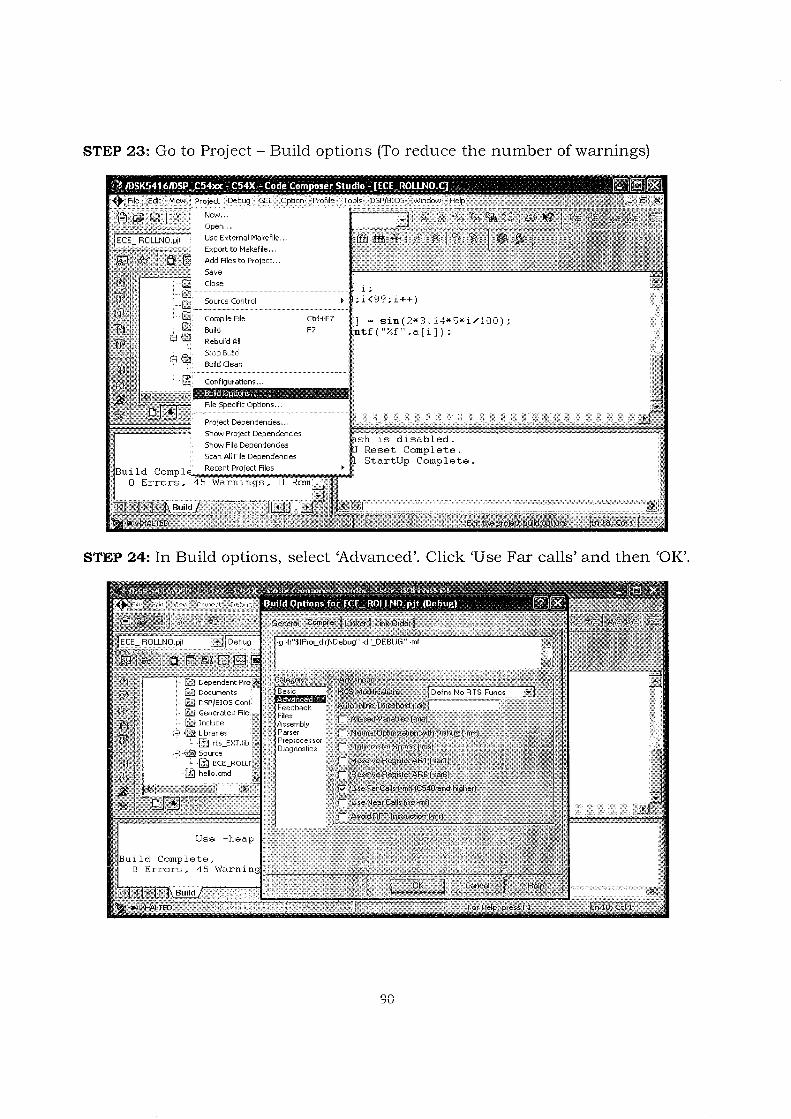
STEP 23: Go to Project - Build options (To reduce the number of warnings)
STEP 24: In Build options, select 'Advanced'. Click 'Use Far calls' and then 'OK'.
("If"\::Jv
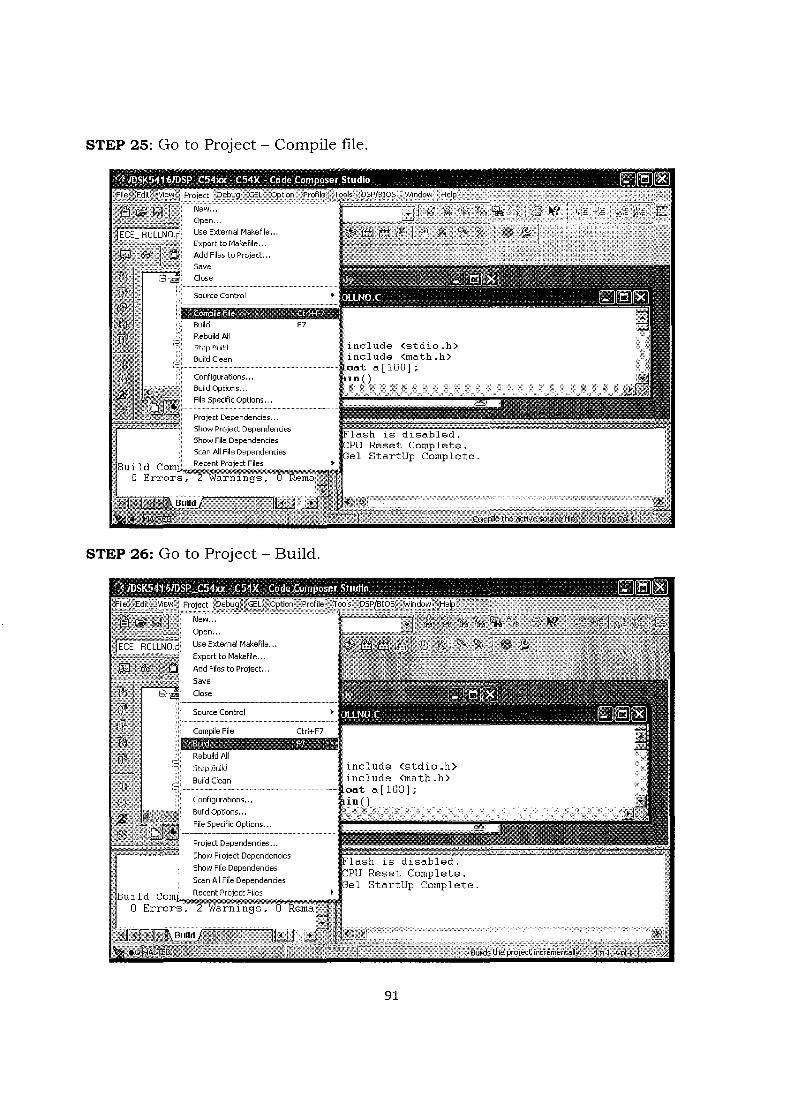
STEP 25: Go to Project - Compile file.
STEP 26: Go to Project - Build.
91
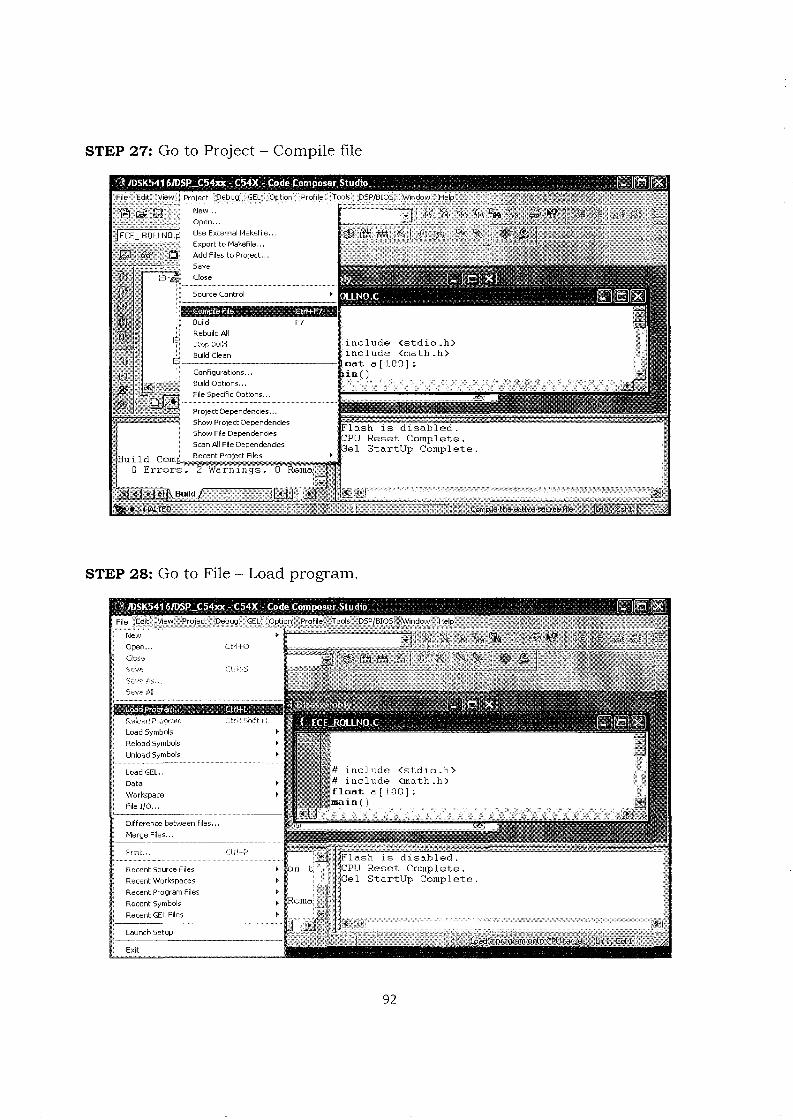
STEP 27: Go to Project - Compile file
STEP 28: Go to File - Load program.
1'---------.----
Relced p'-;jr;'f,:.l:(:
Load Symbols
Reload Symbols
Unload Symbols
Load GEL."
Data
Workspace
File 110...
Difference between files: ...
Merge Files...
Friell,.
Recent Source Files
Recent Workspaces:
Recent Program Files
Recent Symbols
Recent GELFiles
LaunchSetup
Exit
Orl+O
(:trl+~)hn.+l.
n"'}::JL
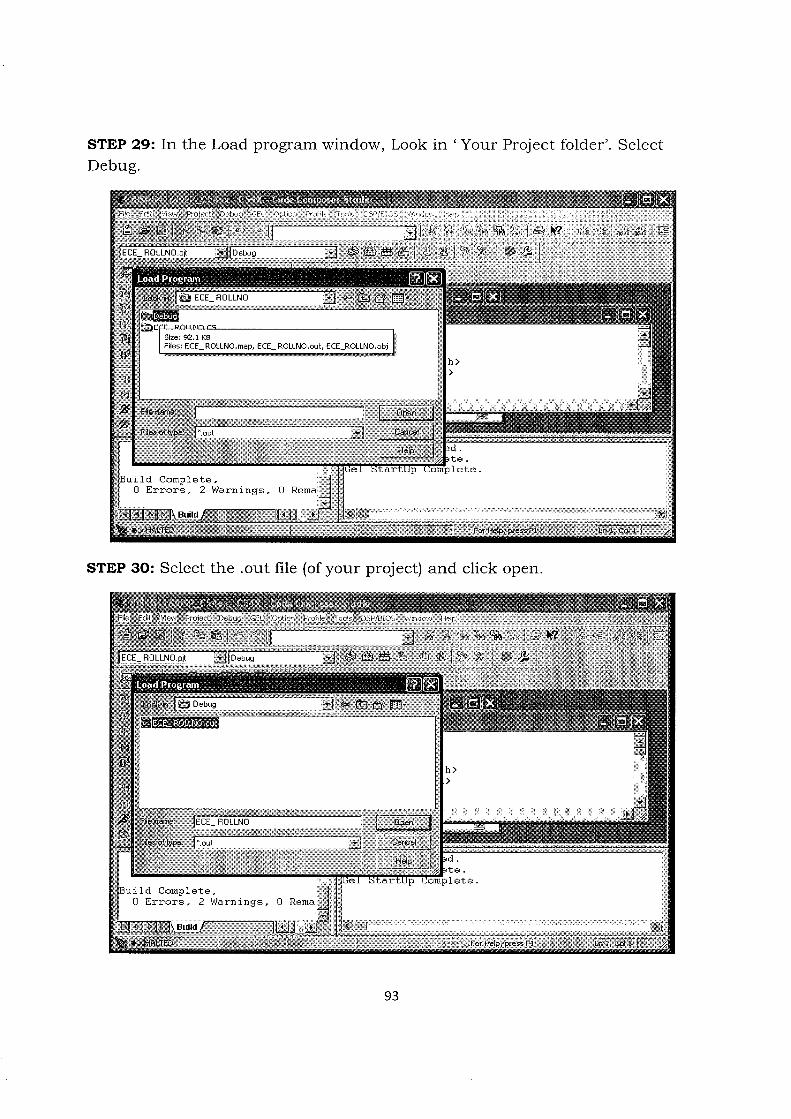
STEP 29: In the Load program window, Look in 'Your Project folder'. SelectDebug.
STEP 30: Select the .out file (of your project) and click open.
93

STEP 31: Go to Debug - Run.
STEP 32: Output is displayed in stdout window.
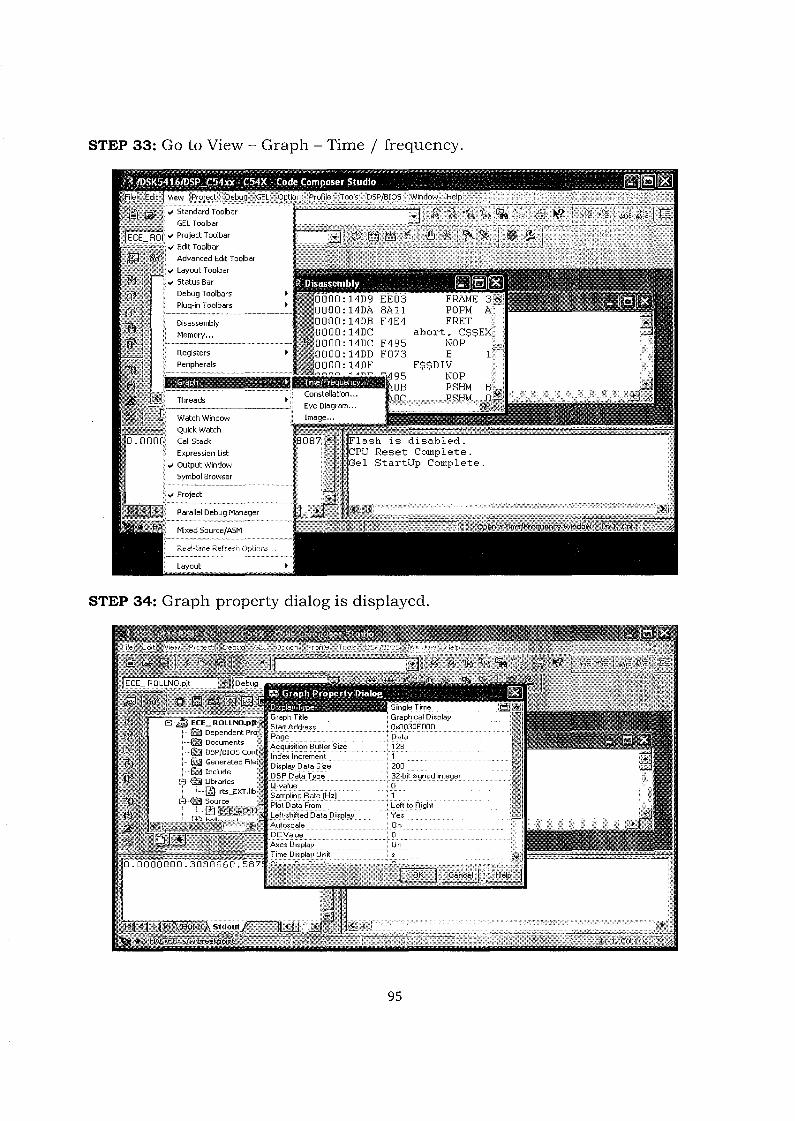
STEP 33: Go to View - Graph - Time / frequency.
vi Standard Toolbar
GELToolbar
vi Project Toolbar
vi Edit Toolbar
Advanced Edit Toolbar
vi Layout Toolbar
vi Status Bar
Debug Toolbars
Plug-in Toolbars
Disassembly
Memory...
Registers
Peripherals
Threads
Watch Window
Quick Watch
Call Stack
Expression list
vi Output Window
Symbol Browser
Parallel Debug Manager
Mixed SourcelASM
R.eal~tjme R.efresh Options.,
Layout
STEP 34: Graph property dialog is displayed.
95
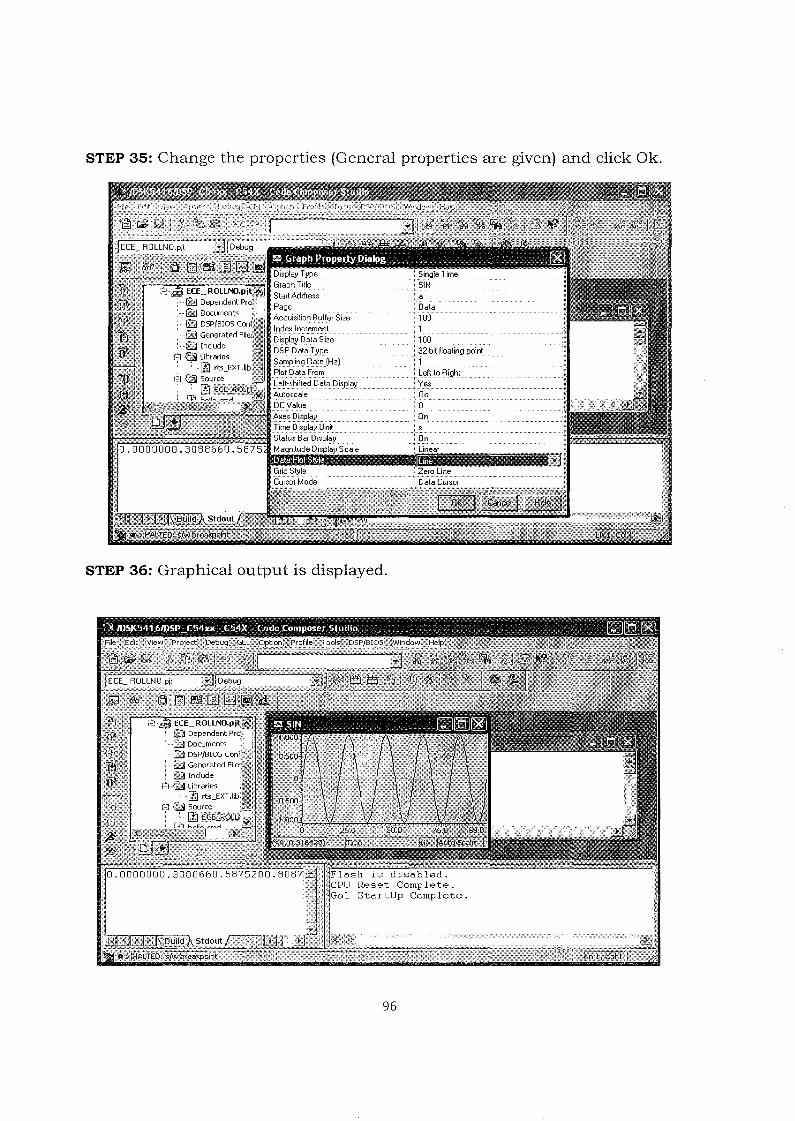
STEP 35: Change the properties (General properties are given) and click Ok.
STEP 36: Graphical output is displayed.
96

EC6511
VIVA QUESTIONS
97

EC 6511 - VIVA QUESTION BANK
1. What is a Continuous and discrete time signal?Continuous time signal:
A signal x(t) is said to be continuous if it is defined for all time t. Continuoustime signal arise naturally when a physical waveform such as acoustics wave orlight wave is converted into a electrical signal. This is affected by means oftransducer. (Example: Microphone, photocell)
Discrete time Signal:A discrete time signal is defined only at discrete instant of time. The independentvariable has discrete values only, which are uniformly spaced. A discrete timesignal is often derived from the continuous time signal by sampling it at auniform rate.
2. Give the classification of signals?~ Continuous- time and discrete time signals~ Even and ODD signals.~ Periodic and Non Periodic Signals.~ Deterministic and Random Signals.~ Energy and Power Signal.
3. What are the types of Systems?~ Continuous- time and discrete time Systems.~ Linear and Non-Linear systems.~ Casual and Non- Causal Systems.~ Time varying and time in - varying systems.~ Distributive parameters and Lumped parameters systems.~ Stable and tJn- Stable systems.
4. What are even and odd signals?Even Signal: Continuous time signal x(t) is said to be even ifit satisfies the condition.
X(t)=x(-t) for all values oft.Odd SigIHH; ..... The signal x(t) is said to be odd if it satisfies the condition.
. X( -t)=x(t) for all t.Inother words even signal is symmetric about the time origin or the vertical axis,butodd signals are anti-symmetric about the vertical axis.
5. What are deterministic and random signals?Deterministic signal: Deterministic signal is a signal about which there is no certainty
with respect to its value at any time. Accordingly we find thatdeterministic signals may be modeled as completely specifiedfunctions of time.
Random signal: Random signal is a signal about which there is uncertainty beforeits actual occurrence. Such signal may be viewed as group ofsignals with each signal in the ensemble having differentwaveforms. (e.g) The noise developed in a television or radioamplifier is an example for random signal.

6. What are energy and power signal?Energy signal: Signal is referred as an energy signal, if and only if the total energy of
the signal satisfies the condition O<E<_ . The total energy of the continuous time signal x(t) is given as E=limTJ2(t)dt, integration limit from - T/2 to +TIl.
Power signal: Signal is said to be powered signal if it satisfies the condition O<p<_.The average power of a continuous time signal is given by
P=limt_11T_x2(t)dt, integration limit is from -T/2 to +T/2.
7. What are the operations performed on a signal?Operations performed on dependent variables:Amplitude scaling y(t)=c x(t), where c IS the scaling factor, x(t) IS thecontinuous time signal.Addition y(t)=x I (t)+x2(t)Multiplication y(t)=x I (t)x2(t)Differentiation y(t)=d/dt x(t)Integration y(t)=_x(t)dtOperations performed on independent variables.
» Time shifting» Amplitude scaling» Time reversal
8. What are elementary signals and name them?The elementary signals serve as a buildingblock fOrthe construction of more complex
signals. They are also important in their own right, in that they may be used to model manyphysical signals that occur in nature. They are five elementary signals. They are as follows.
» Unit step function» Unit impulse function» Ramp function» Exponential ,function>- Sinusoidal function
9. What are the pr().p~rtiesofasystem?Stability: A system is said to be stable if the input x(t) satisfies the condition (t) Mx<and the 6mp\<llsatisfiesthe condition y(t)_My<Jor all 1.
Memory it A"sy::;tgi)1 is said to be memory if the output signal depends on the present andthy past inp;I\l!~;"" ••InveI1jbility~A system is said to be invertible if the input of the system can be recovered'fr,om tne systein-output.THneinvariartce : A system is said to be time invariant if a time delay or advance of theinputsJg;nal leads to an identical time shift in the output signal.Linearity : A system is said to be linear if it satisfies the super position principle
(i.e) R(axl (t)+bx2(t))=ax1(t)+bx2(t)
10. What is memory system and memory less system?A system is said to be memory system if its output signal at any time depends on the
past values of the input signal. Circuit with inductors, capacitors are examples ofmemory system.
A system is said to be memory less system if the output at any time depends on thepresent values of the input signal. An electronic circuit with resistors is an example formemory less system.
99
11. What is an invertible system?A system is said to be invertible system if the input of the system can be recovered form
the system output. The set of operations needed to recover the input as the second systemconnected in cascade with the given system such that the output signal of the second systemis equal to the input signal applied to the system.
H. I {y(t)}-H. 1{lI{x(t)}}
12. What are time invariant systems?A system is said to be time invariant system if a time delay or advance of the input signal
leads to an identical shift in the output signal. This implies that a time invariant systemresponds identically no matter when the input signal is applied. It also satisfies thecondition
R{x(n-k)}=y(n-k)
13. Is a discrete time signal described by the input output relation y[n]= rnx[n] timeinvariant.
A signal is said to be time invariant ifR{x[n-k]}= y[n-k]R{x[n-k]}=R(x[n]) / x[nLx[n-k]= rnx[n-k]-------(I)Y[n-k]=y[n]/n_n-k = rn-kx [n-k] --------------"----(2)Equations (ILEquation (2).
Hence the signal is time variant.
14. Show that the discrete time system.described by the input-output relationshipy[n]=nx[n] is linear?For a sys to be linear R{alxl [n]+bIx2[n]}=alylln]+b ly2[n]L.H.S: R{a Ixl [n]+b Ix2[n]}==R{x[n]}lx[nLalxI[n]+b Ix2[n]=al nx I [n]+b I nx2[n]----(I)R.B.S: a 1yl [n ]+b Iy2[n ]=a1 nxl[h]+blnx2[ri]--------------(2)
Equation (I )=Eq:u.ation (2)Hence the system is linear.;;
is. What is SISOSystcm and MIM<.;);System?A Control systef!1withsil1gle input and single output id referred to as single input single
output system. When-the number of plant inputs or the number of plant outputs is morethan onetp:,y..~ystem is referred to as multiple input output system. In both the case, thecontroller rpaybeil1 the form of a digital computer or microprocessor in which we canspeak of thedigital COntrol system.
16. What is the output of the system with system function HI and Hz when connected inCascade and parallel?
When.the system with input x(t) is connected in cascade with the system HI and H, theoutput of the system is
Y (t) = H2 {HI {x (t)}}
When the system is connected in parallel the output of the system is given by
Y (t) = HI x, (t) + {H2 x(t).
100
17. What do you mean by periodic and non- Periodic Signals?A Signal is said to be periodic ifX( n +N) = x(n), Where N is the time Signal.A signal is said to be Non- Periodic if x(n+N)- x(n).
18. Determine the convolution sum of two sequences x(n) = {3,2,1,2} and hen) = { 1,2,1,2}.Yen) = {3,8,8,12,9,4,4}.
19. Find the convolution of the signalsx(n) In -2,0,2
2 n =-1oelse where.
Yen) { 1,1,0,1,-2,0,-1}
20. Determine the solution of the difference equation
Yen) = 516 y(n-I )-1/6y(n-2) +x(n) for x(n) =2n u(n)Yen) = -(112)"u(n) + 2/3( 1/3)nu(n) +8/52" u(n)
21. Determine the response yen) , n>=O of the system'idescribed by the second orderdifference equation.
) when the jnplJt:is x(n) = (-I)n u(n) and the initial
Yen) = (7/9
yen) - 4y(n-l) + 4y(n-2) = x(n)condition are y(-l) = y(-2)= 1.
22. Differentiate DTT andDF;T . ...DTFT output is continuous-in time where as DFT output is Discrete in time.
'-<'- "'P,' ""', .•
23. Differentiate bo~~~~I1J)IT;:~ndDIF algorithm.DIT - Time Isd©,cithatei;l;~<jljnput is bit reversed format output in natural order.DIF - Frequency is-decimatedand input is natural order output is bit reversed order.
24. How many stag~~,i~ there for 8 point D FT?8
any nt!1ltiplication terms are required for doing DFT by expressional methodethod?
":1: ,;., Expression -n2 FFT N/2 log N.
26. Distinguish IIR and FIR filters.
FIR IIRImpulse response is finite. Impulse Response is infinite.They have perfect linear phase. They do not have perfect linear
phase.Non recursive RecursiveGreater flexibility to control the shape of magnitude Less response.response
101

27. Distinguish Analog and Digital filters.
t' •
,~~~_.~~-~~-~..~-----~-~---~--~~-------~--- --~~._~~---~----~
Analog DigitalConstructed using active or passive Consists of elements like adder, subtractor andComponents and it is described by a delay units and it is described by a differencedifferential equation. equation.Frequency response can be changed by Frequency response can be changed bychanging the components. changing the filter co-efficients.It processes and Generates analog output It processes and Generates digital output.Output varies due to extern"! conditi nQ NAt if' '11Pnrprl h" p tprn ! conditi n~
28. Write the expression for order of Butterworth filter?The expression isN == log (~£ y, logt l/k) 'io'
29. Write the expression for the order of chebyshev filter?N == cosh-I (-----ie) 1 cosh-I (Ilk).
30. Write the various frequency transformations in analog domain?LPF to LPF: S - SI CLPF to HPF: S ClS~
LPF to BPF : S S2xlxu/s (xu-xl)LPF to BSE: S s(xu -xl)? s2 == slxu .X==
31. Write the steps in designing chebyshev filter?>- Find the order ofthe1l1ter.>- Find the value ofmajoraTld minor axis.>- Calculate the P()!es.>- Find the deaominator function.using the above poles.>- The numerator-polynomial value depends on the value of n.
ifn is()@@iPl,lts~Ointhe denominator polynomial.lfn is eVen:'pUts*Oand divide it by (l+e2)l/2
32. Writedo~vn the steps for designing butter worth filter?» Frornthegi venspecifications find the order of the filter.
Findthe transfer function from the value ofN.Find cFindthe transfer function ha(s) for the above value of c by su s by that value.
33. eq uation for finding the poles in chebyshev filter?Sk=acos¢k+jbsin¢k, where ¢k=(2+(2k-1 )/2n)
34. State the steps to design digital IIR filter using bilinear methodSubstitute s by 21T(z-l/z+ I), where T=2Utan(w/2» in h(s) to get h(z).
35. What is warping effect?For smaller values of w there exists linear relationship between wand but for
larger values of w the relationship is nonlinear. This introduces distortion in thefrequency axis. This effect compresses the magnitude and phase response. This effectis called warping effect.
102

36. Write a note on pre warping?The effect of the non linear compression at high frequencies can be compensated.
When the desired magnitude response is piecewise constant over frequency, thiscompression can be compensated by introducing a suitable rescaling or pre warping thecritical frequencies.
37. Give the bilinear transform equation between s plane and z plane?
S=2/T (z-l/z+ 1)
38. Why impulse invariant method is not preferred in the design of IlR filters otherthan low pass filter?
In this method the mapping from s plane to z plane is many to one. Thus there arean infinite number of poles that map to the same location in the z plane, producing analiasing effect. It is inappropriate in designing high pass filters. Therefore this methodis not much preferred. . .
39. By impulse invariant method obtain the digital filter transfer function and thedifferential equation of the analog filter h(s)=l/s+l
H(z)= I/l-e-TZ-IY/x(s)=l/s+1Cross multiplying and taking inverselaplace weget,D/dt(y(t)+y(t))=x(t)
40. What is meant by impulse invariant method?In this method of digitizingan analog filter, the impulse response of the resulting
digital filter is a sampleg version of the impulse response of the analog filter. For e.g. ifthe transfer function is of'the form, l/s-p, then H (z)=1I1-e-pTZ-1
41. What do Y9uunderstand by-backward difference?One of thesimpJest methods of converting analog to digital filter IS to
approximate the differential equation by an equivalent difference equation.¢I;<:lJ(Y(t)/t)=nT=(y( nT)- y(nT-T))/T
42. What are the properties of chebyshev filter?~ The magnitude response of the chebyshev filter exhibits ripple either in the stop
band::or the pass band.~ The poles of this filter lies on the ellipse.
43. Give the butter worth filter transfer function and its magnitude characteristicsfor different orders of filter.
The transfer function of the butter worth filter is given byHG_) = 1I1+jC/_c) N
44. Give the magnitude function of Butter worth filter.The magnitude function of Butter worth filter is
I hG~1 = 1/(1+(j_c)2N] 1/2, N=I,2,3,4, ...
103
45.
46.
47.
48.
49.
50.
51.
52.
53.
Give the equation for the order N, major, minor axis of an ellipse in case ofchebyshev filter?
The order is given by N=cosh-I«(IO.I_p)-I/IO.I_s-I)I/2)/cosh-l_s/_pA=(lll IN-ll-IIN)/2QpB=.Qp(lll IN+ll-1 IN)/2
Give an expression for poles and zeroes of a chebyshev type2 filters?The Zeroes of chebyshev type2 filter SK=Ls/sinK _K, K=I. ..NThe poles of this filter xK+jyK
xK= s K/s2+ K2- - -yK=_s_K/_s2+_K2_K= a cos_K
How can you design a digital filter from analog filter?Digital filter can be designed from analog filter using the following methods.
).> Approximation of derivatives).> Impulse invariant method).> Bilinear transformation.
Write down bilinear transformation?S=2/T(Z-I/Z+ I)
List the butter 'Worth polynomial for val'iousorders.N Denominator polynomial
).> S+ I).> S2+O.707s+1).> (s+ I)(s2+s+1)).> (s20. 7653s+l)(s2+L~4s+1)).> (s+ 1)(s2.+0.6183s+1)(s2+1.618s+1)).> (s2+1 .93s'+I';)(s2+0:707s+1)(s2+0.5s+ I)).> (s+ I)(&2+ 1.8d~~+ 1)(s2+1.24s+1)(s2+0.48s+ I)
Differenti~t¢'BiitferW()rth i~~ Chebyshev filter.Butterworthdamping factor 1.44 chebyshev 1.06Butterworthflatresponse damped response.
What is filter?Filter is a frequency selective device which amplify particular range offrequencies and attenuate particular range of frequencies.
What are the types of digital filter according to their impulse response?. IIR (Infinite Impulse Response) filterFIR (Finite Impulse Response) filter.
How phase distortion and delay distortion are introduced?The phase distortion is introduced when the phase characteristics of a filter is
nonlinear within the desired frequency band. The delay distortion is introduced whenthe delay is not constant within the desired frequency band.
104
54. What is mean by FIR filter?The filter designed by selecting finite number of samples of impulse response
hen) obtained from inverse fourier transform of desired frequency H(W) are calledFIR filters.
55. Write the steps involved in FIR filter design?>- Choose the desired frequency response Ho(W)> Take the inverse fourier transform and obtain Ho(n)>- Convert the infinite duration sequence Ho(n) to hen).> Take Z transform ofh(n) to get H(Z)
56. What are the advantages of FIR filter?>- Linear phase FI filter can be easily designed.> Efficient realization of FIR filter exists as both recursive and non
recursi ve structures.> FIR filter realized non recursively stable.>- The round off noise can be made small in non recursive realization of
FIR filter.
57. What are the disadvantages of FIR filter?The duration of impulse response should be large to realize sharp cutoff filters.
The non integral delay can lead to problems in some signal processing appl ications.
58. What is the necessary and suffict~ntcondition for the linear phase characteristicof a FIR filter? .... ....
The phase function.should bea lirie:trfunction of w, which inturn requiresconstant group delay and;~hjseq~la.}( ..
59. List the well known design technjque for linear phase FIR filter design?
> Fourier series method and window method.>-Freql1ency;sfU11IJling method.>- Optimal filterdesign method.
60. Define IIR filter?The filter designed by considering all the infinite samples of impulse responsecalled IIR filter.
what kind of application, the anti symmetrical impulse response can be
anti symmetrical impulse response can be used to design Hilbert transformsand differentiators.
62. For what kind of application, the symmetrical impulse response can be used?
> The impulse response, which is symmetric having odd number ofsamples can be used to design all types of filters, i.e low pass, high pass,band pass and band reject.
>- The symmetric impulse response having even number of samples can beused to design low pass and band pass filter.
105

63. What is the reason that FIR filter is always stable?FIR filter is always stable because all its poles are at the origin.
64. What condition on the FIR sequence h (n) are to be imposed n order that thisfilter can be called a linear phase filter?
The conditions are> Symmetric condition h(n)= h(N-l-n)> Anti symmetric condition h(n)= -h(N-I-n)
65. Under what conditions a finite duration sequence h(n) will yield constant groupdelay in its frequency response characteristics and not the phase delay?
If the impulse response is anti symmetrical, satisfying the conditionH(n)=-h(N-I-n)
The frequency response of FIR filter will have constant group delay andthe phase delay.
66. State the conditions for a digital filter to be causal and stable?> A digital filteris causal if its impulse response h( n)=O for n<O.> A digital filter is stable if its impulse response is absolutely summable,
i.e co-n=-oo Ihen) I< 00
67. What are the properties of FIR filter?> FIR filter is always stable.> A realizable filter canalways be obtained.> FIR filter has a linearphase resP'?flse.
68. When cascade from reallzatlon.Ispreferred in FIR filters?The cascade from realization is preferred when complex zeros with absolute
magnitude less than one,
69. What are thc<iisadvantageso'f'Fourier series method?In desigl1ingFIRfilter using Fourier series method the infinite duration impulse
is truncated at n=+_(N-1/2).Direct truncation of the series will lead to fixed percentageovershoots and undershoots before and after an approximated discontinuity in thefrequencyresponse.
7.0. ,¥,hat is Gibbs phenomenon? Or what are Gibbs oscillations?One possible way of finding an FIR filter that approximates II(ejcD) would be to
:t~uncate the infinite Fourier series at n=+_(N-1/2). Abrupt truncation of the series will1e3.,9)0 oscillation both in pass band and is stop band. This phenomenon is known asGibbs phenomenon.
71. What are the desirable characteristics of the windows?The desirable characteristics of the window are
» The central lobe of the frequency response of the window shouldcontain most of the energyand should be narrow.
> The highest side lobe level of the frequency response should besmall.
» The sides of the frequency response should decrease in energyrapidly as cD tends to n
106

72. Compare Hamming window with Kaiser Window.Hamming window with Kaiser Window
>- The main lobe width is equal to 8rJfN and the peak side lobe level is 41dB.
>- The low pass FlR filter designed will have first side lobe peak of -53 dB>- The main lobe width, the peak side lobe level can be varied by varying
the parameter c and N>- The side lobe peak can be varied by varying the parameter ci.
73. What is the necessary and sufficient condition for linear phase characteristics inFIR filter?
The necessary and sufficient condition for linear phase characteristics in FIRfilter is the impulse response hen) of the system should have the symmetry.property, i.e,
H(n)=h(N-I-n)Where N is the duration of the sequence
74. What are the advantages of Kaiser Window?>- It provides flexibility for the designer to select the side lobe level and N.>- It has the attractive property that the side lobe level can be varied
continuously from the low value in the Blackman window to the highvalue in the rectangle window.
75. What is the principle of designiqg FIR filterusingfrequency sampling method?In frequency sampling methodrhe desired magnitude response is sampled and a
linear phase response is specified. The samples of desired frequency response aredefined as OFT coefficienjs, The filtercoefficients are then determined as the 10FT ofthis set of samples.
76. For what type off1ltersfl'~quencysampling method is suitable?Frequency samplingsnethodis attractive for narrow band frequency selective filterswhere onIYi~}[<;yv ?fthc:samplesof the frequency response are non-zero.
77. What is meantby autocorrelation?The autocorrelation of a sequence is the correlation of a sequence with it shifted
version, and-this indicates how fast the signal changes.
0$.l)~fine white noise?no A stationary random process is said to be white noise if its power density. ';'ci~pectrum is constant .Hence the white noise has flat frequency response spectrum.
.... Sx(w)=_x2,-_w_
79. What do you understand by a fixed-point number?In fixed point arithmetic the position of the binary point is fixed. The bit to the
right represents the fractional part of the number and those to the left represent theinteger part. For example, the binary number 01.1100 has the value 1.75 in decimal.
80. What is the objective of spectrum estimation?The main objective of spectrum estimation is the determination of the power
spectral density of a random process. The estimated PSO provides information aboutthe structure of the random process which can be used for modeling, prediction orfiltering of the deserved process.
107

81. List out the addressing modes supported by C5X processor?» Direct addressingT Indirect addressing» Immediate addressing» Dedicated- register addressing» Memory- mapped register addressing» Circular addressing
82. What is meant by block floating point representation? What are its advantages?In block point arithmetic the set of signals to be handled is divided into blocks
Each block has the same value for the exponent. The arithmetic operations with in theblock uses fixed point arithmetic and only one exponent per block is stored thus savingmemory. This representation of numbers is more suitable in certain FFT flow graphand in digital audio applications.
83. What are the advantages of floating point arithmetic?» Large dynamic range.» Overflow in floating point representation is unlike.
84. What are the three quantization errors to finite word length registers in digitalfilters?
» Input quantization error» Coefficient quantization error» Product quantization error
85. How the multiplication and addition are carried out in Iloating point arithmetic?In floating point arithmetic, multiplication is carried out as follows. Let
tl=MI*2cl and f2=rYI2*2c2. Then n=f1*f2=(Ml*M2) 2(c1+c2). That is, mantissa ismultiplied using fixed-point arithmetic and the exponents are added. The sum of twofloating-point numbers is carried out by shifting the bits of the mantissa of the smallernumber to the right until the exponents of the two numbers are equal and then addingthe mantissas.
86. Whatdoyou understand by input quantization error?tn digital signal processing, the continuous time input signals are converted into
digital using a b-bit ACD. The representation of continuous signal amplitude by a fixeddigit produce an error, which is known as input quantization error.
87. List the on-chip peripherals in 5X.The C5X DSP on-chip peripherals available are as follows.
» Clock Generator» Hardware Timer>- Software-Programmable Wait-State Generators>- Parallel I/O Ports» Host Port Interface(HPI)» Serial Port>- Buffered Serial Port(BSP)>- Time -Division Multiplexed (TOM) Serial Port» User Maskable Interrupts
108
88. What is the relationship between truncation error e and the bits b forrepresenting a decimal into binary?
For a 2's complement representation, the error due to truncation for both positiveand negative values of x is O>=xt-x>-2-b where b is the number of bits and xt is thetruncated value of x. The equation holds good for both sign magnitude, I 's complementif x>O. If x<O, then for sign magnitude and for ls complement the truncation errorsatisfies
89. What is meant by rounding? Discuss its effect on all types of numberrepresentation?
Rounding a number to b bits is accomplished by choosing the-rounded result asthe b bit number closest to the original number un rounded. Or fixed point arithmetic,the error made by rounding a number to b bits satisfy the inecjUality~2-b 2-b---<=xt<=-----2 2 for all three types of number systems, i.e., 2's complement, I'scomplement and sign magnitude. For floating point numberthe error made by roundinga number to b bits satisfy the inequality -2-b<=E<=2-b where E~xbx-----x
90. What is meant by AID conversion noise?A DSP contains a device, AID converter tn3ct o perates on the analog input x(t) to
produce xq (t) which is binary sequence of as and ISi..At first the signal x(t) is sampledat regular intervals to produce a sequenceX-(D) is of infinite precision. Each sample x(n)is expressed in terms of a finite num&~Fbf.1:>its giv¢I1 the sequence xq(n). Thedifference signal e(n)=xq (n)-x(n)is called IVDcohve:rsion noise.
91. What is the effect of quantization.on;pple IOl1a,Jion?Quantization of coeffis.ients iridq,flf!:i.! filters lead to slight changes in their value.
This change in value offili&r'.2()~1i'fi~ient n10ClifY the pole zero locations. Sometimes thepole locations will bec~a,nged'iQs&ha way that the system may drive into instability.
..'., ..... ,. .,';
.,'.- -.-- .
92. Which realization isless s~!»~itive~to the process of <1 uantization?CascaG.eform."
93. What is meant by quantization step size?liet us assurrrea sinusoidal signal varying between + I and -I having a dynamic
range 2:fFtttef\DCused to convert the sinusoidal signal employs b+ I bits includingsign bit, the nUffi'ber of levels sq=2 = 2-b/2b+ I where q is known as quantization stepsize.
94. How would you relate the steady-state noise power due to quantization and the bbits representing the binary sequence?
Steady state noise power where b is the number of bits excluding sign bit.
95. What is overflow oscillation?The addition of two fixed -point arithmetic numbers because overflow the sum
exceeds the word size available to store the sum. This overflow caused by adder makethe filter output to oscillate between maximum amplitude limits. Such limit cycles havebeen referred to as over flow oscillations.
109

96. What are the methods used to prevent overflow?There are two methods used to prevent overflow.
>- Saturation arithmetic>- Scaling
97. What are the two kinds of limit cycle behavior in DSP?>- Zero input limit cycle oscillations>- Overflow limit cycle oscillations
98. What is meant by "dead band" of the filter?The limit cycle occur as a result of quantization effect in multiplication. The
amplitudes of the output during a limit cycle are confined to a range of values calledthe dead band of the filter.
99. Explain briefly the need for scaling in the digital filter implementation.To prevent overflow, the signal level at certain points in the digital filter must be
scaled so that no overflow occurs in the adder.
100. What are the different buses ofTMS320C5Xand their functions?The C5X architecture has four buses and their functions are as follows:
Program bus (PB): It carries the instruction code and immediate operands fromprogram memory space to the CPU.Program address bus (PAB): It provides addressesto program memory space for bothreads and writes.Data read bus (DB): It interconnects various elements of the CPU to data memoryspace.Data read address bus (DAB): It provides the address to access the data memoryspace.
110

CONTENT BEYOND
SYLLABUS

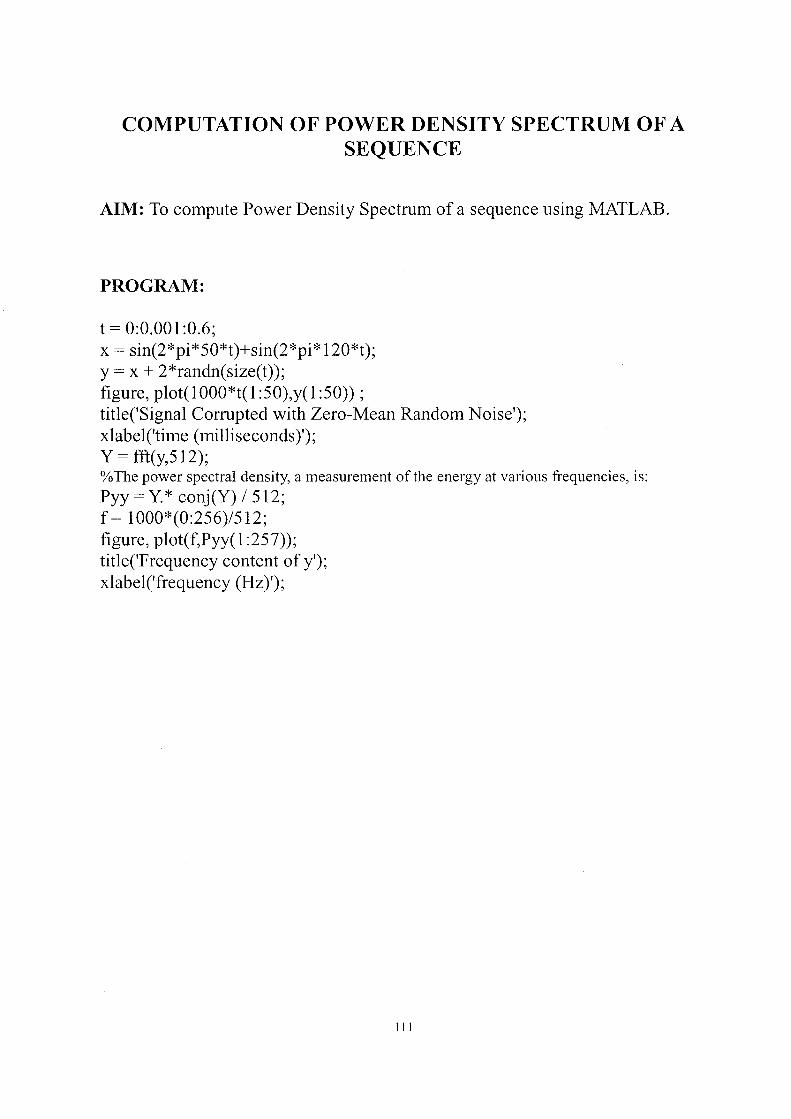
COMPUTATION OF POWER DENSITY SPECTRUM OF ASEQUENCE
AIM: To compute Power Density Spectrum of a sequence using MATLAB.
PROGRAM:
t = 0:0.001 :0.6;x = sin(2*pi*50*t)+sin(2*pi*120*t);y = x + 2*randn(size(t));figure, plot(1 OOO*t(1 :50),y(1 :50)) ;title('Signa1 Corrupted with Zero-Mean Random Noise');xlabel('time (milliseconds)');Y = fft(y,512);%The power spectral density, a measurement of the energy at various frequencies, is:Pyy = Y.* conj(Y) / 512;f = 1000*(0:256)/512;figure, plot(f,Pyy(1 :257));title('Frequency content of y');xlabel('frequency (Hz)');
I I I

OUTPUT:
50o 20 30 40tirne (rrulli s e c ortdss)
Corr'UptEld with z.ero-rvre.an Ranlclom Noise
-3
-4
RESULT:Hence the Power Density Spectrum of a given sequence using
MATLAB is computed successfully,
112

FREQUENCY RESPONSE OF ANTI IMAGING AND ANTIALIASING FILTERS
AIM: To observe the frequency responses of anti imaging and anti aliasingfilters.
PROGRAM FOR ANTI IMAGING FILTER
clear all;n=O:1:1023;x=l/4*sinc((1/4)*(n-512))/'2i=1:1024;y=[zeros( 1,2048)];y(2*i)=x;f=-2: 1/512:2;h 1=freqz(x, 1,2*pi*f);h2=freqz(y,1 ,2*pi*f);subplot(3,1, 1);plot(f,abs(h 1));xlabelr'frequency');ylabelf'magnitude');titlet'frcquecny response of input sequence');subplot(3,1,2);plot(f,abs(h2));xlabelt'frequency');ylabelr'magn itude');titlef'frequency reponse of up sampled input sequence I);p=firl (127,.3);xf=filter(p,1,y);h4=freqz(xf,1,2*pi *f);subplot(3, 1,3);plot(f,abs(h4));titler'trcqucncy response of output of an anti imanaging filter');xlabelf'frcquency');ylabelt'magn itude');
113
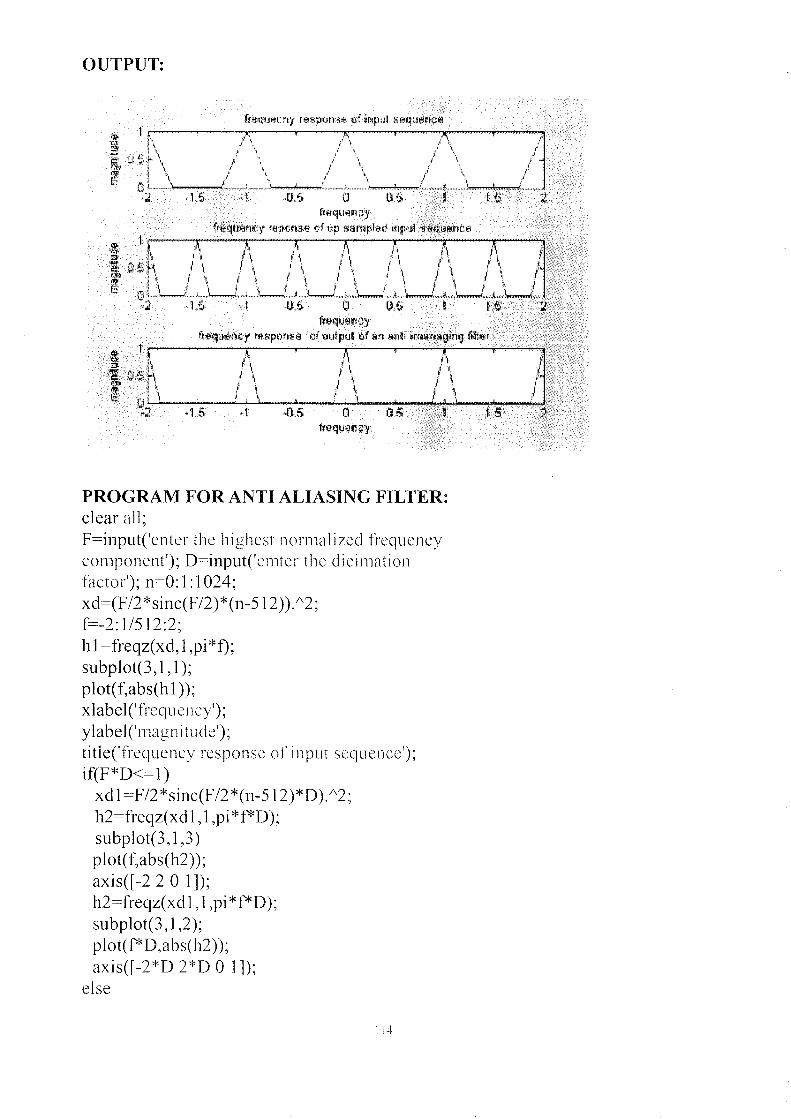
OUTPUT:
PROGRAM FOR ANTI ALIASING FILTER:clear all;F=input('enter the highest normalized frequencycomponent'); D=input('emter the dicimationfactor'); n=O:1:1024;xd=(F/2*sinc(F/2)*(n-512))/'2;[=-2: 1/512:2;h l =freqz(xd, 1,pi*f);subp1ot(3,1 ,1);plot(f,abs(h 1));xlabel(' frequency');ylabel('magn itude');title('frequency response of input sequence');if(F*D<=l)
xd 1=F/2*sinc(F/2 *(n-512)*D)/'2;h2=freqz(xd 1,1,pi *f*D);subplot(3,1,3)plot(f,abs(h2));axis([-2 2 0 1]);h2=freqz(xd 1,I ,pi *f*D);subplot(3,1,2);plot( f*D,abs(h2));axiscr-2*D 2*D 0 1]);
else
114
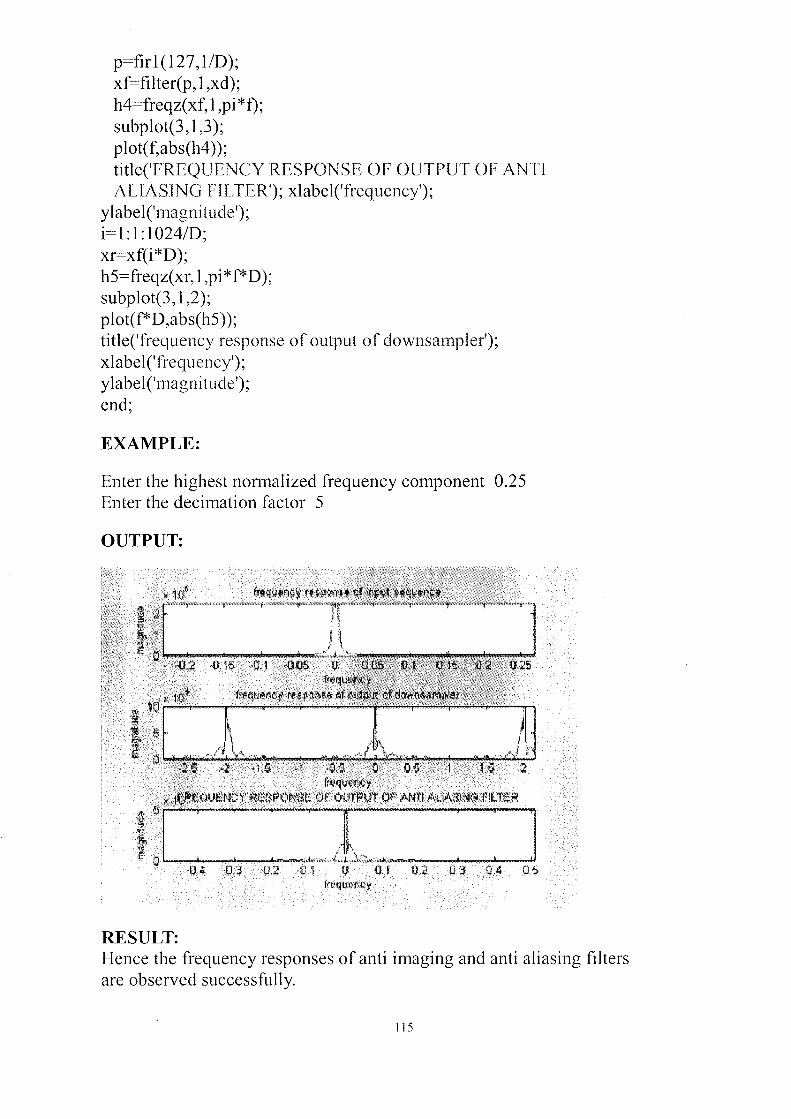
p=firl (127, liD);xf=filter(p,l,xd);h4=freqz(xf,1 ,pi *1);subplot(3,1,3 );plot(f,abs(h4));titleCFREQUENCY RESPONSE OF OUTPUT OF ANTIALIASING FILTER'); xlabelr'frequency');
ylabelt'magnitude');i= 1:1:1024/D;xr=xf(i*D);h5=freqz(xr,1,pi*f*D);subplot(3,1,2);plot(f*D,abs(h5));titler'frequency response of output of downsampler');xlabelCfrequen cy');ylabelr'magnitude');end',
EXAMPLE:
Enter the highest normalized frequency component 0.25Enter the decimation factor 5
OUTPUT:
RESULT:Hence the frequency responses of anti imaging and anti aliasing filtersare observed successfully.
115
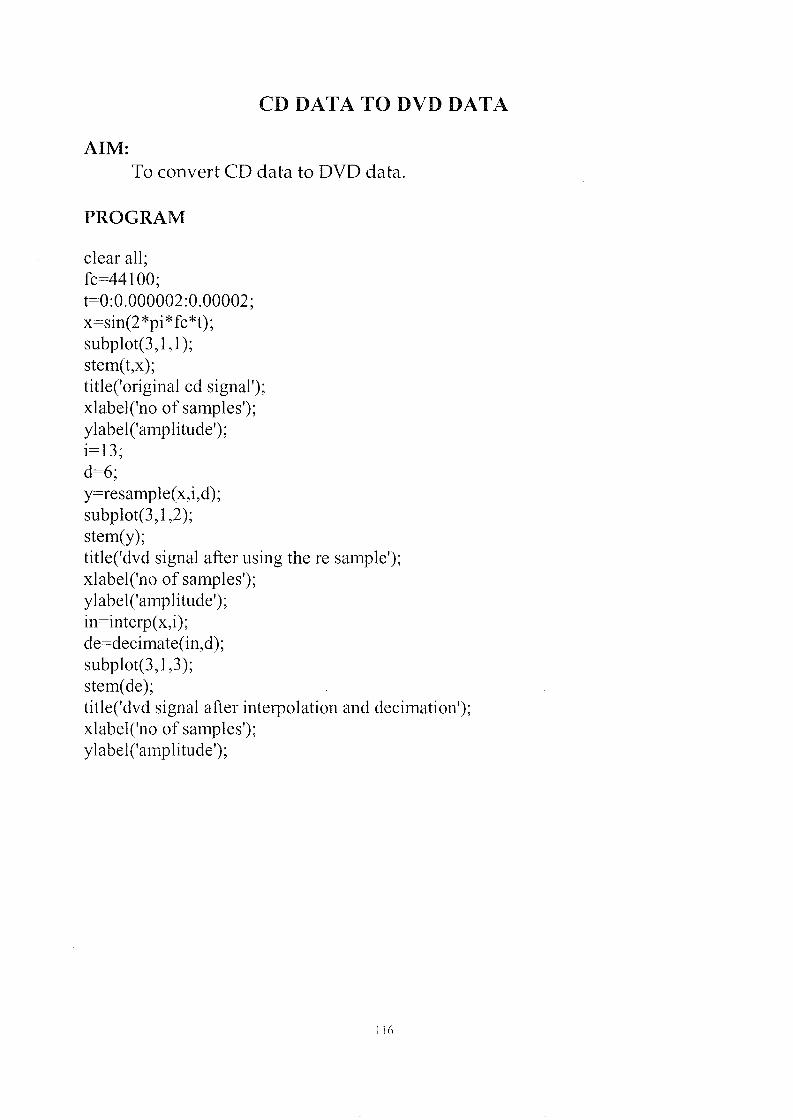
CD DATA TO DVD DATA
AIM:To convert CD data to DVD data.
PROGRAM
clear all;fc=441 00',t=0:0.000002:0.00002;x=sin(2 *pi*fc*t);subplot(3,1, 1);stem(t,x);title('original cd signal');xlabel('no of samples');ylabel('amplitude');i=13',d=6',y=resample(x,i,d);subplot(3,1,2);stem(y);title('dvd signal after using the re sample');xlabel('no of samples');ylabel('amplitude');in=interp(x,i);de=decimate(in,d);subplot(3,1,3);stem(de);title('dvd signal after interpolation and decimation');xlabel('no of samples');ylabel('amplitude');
116
2
OUTPUT:
original cd signal
1 1.5no of samples
dvd signal after using the re sample
l~[ 09~9Q&;i11Ii1Tdo 5 10 15 20 25
no of samples
dvd signal after interpolation and decimation
0)1
1
~"G.:"'" ~] 0 (vj) 9Q~
~_'1]J)(~ ~o 5 '10 '15 20 25
no of samples
RESULT:Hence the CD data is converted into DVD data successfully.
117

STUDY OF PROPERTY OF LINEAR TIMEINVARIANT SYSTEM
AIM:To study the stability property of a LTI svstem.
PROGRAM
clc;clear all;close all;b=input('enter the denominator coefficient of the filter');k=poly(b);knew=fliplr(k);s=all(abs(knew));if(s==l)disp('" stable system'");elsedisp('"Non stable system'");end
OUTPUT
enter the denominator coefficient of the filter [1 -1 0.5],stable system'
RESULT
Hence the stability property of a LTI system is studiedsuccessfully.
J IX
EXERCISE


Exercise:l
1. Write a MATLAB program to generate of Sine sequence in Discrete form.
2. Write a MATLAB program to generate of Cosine sequence in Discrete form.
3. Write a MATLAB program to 'perform addition of two Sinusoidal sequence
in Discrete form.
4. Write a MATLAB program to perform addition of two Cosinusoidal
sequence in Discrete form.
5. Write a MATLAB program to generate of Sine sequence with period 5 in
Discrete form.
6. Write a MATLAB program to generate of Sine sequence with period 10 in
Discrete form.
7. Write a MATLAB program to perform growing exponential signal in complex
form.
8. Write a MATLAB program to perform decaying exponential signal in
complex form.
9. Write a MATLAB program to generate decaying exponential signal.
10.Write a MATLAB program to perform basic mathematical operation called
addition on signals.
l1.Write a MATLAB program to perform basic mathematical operation called
subtraction on signals.
12.Write a MATLAB program to perform basic mathematical operation named
multiplication on signals.
13.Write a MATLAB program to perform scaling (amplitude and time scaling)
on Discrete time signals.
14.Write a MATLAB program to perform folding on Discrete time signals.
ls.Write a MATLAB program to perform shifting of Discrete time signals by
Right shift (or advance).
16.Write a MATLAB program to perform shifting of Discrete time signals by left
shift (or delay).


Exercise :2
1. Write a MATLAB program to perform circular convolution of the given
Discrete time sequence xl{n} and x2{n}.
xl{n}=l for 1<n<10
x2{n}=1 for 2<n<10
2. Write a MATLAB program to perform circular convolution of the discrete
time sequence
xl{n}={O,l,O,l}
x2{n}={l,2,l,2}
1.2.0


Exercise :3
1. Write a MATLAB program to perform 8 point OFT of the discrete time
sequence x(n)={2,l,2,l,l,2,l,2} and sketch the magnitude and phase
spectrum.
2. Write a MATLAB program to perform inverse OFT. Use the output of
exercise 1 as input.
3. Write a MATLAB program to perform 4 point OFT of the discrete time
sequence x(n)={l,l,2,3} using FFT and sketch the magnitude and phase
spectrum.
12\


Exercise :4
1. Write a MATLAB program to design a Butterworth Analog Low Pass Filter.
2. Write a MATLAB program to design a Butterworth Digital! Analog High Pass
Filter.
3. Write a MATLAB program to design a Butterworth Digital! Analog Band
pass filter.
4. Write a MATLAB program to design a Butterworth Digital! Analog Band
Stop Filter.
5. Write a MATLAB program to design a Chebyshev Analogi Digital Low Pass
Filter.
6. Write a MATLAB program to design a Chebyshev Analogi Digital High Pass
Filter.
7. Write a MATLAB program to design a Chebyshev Analogi Digital Band Pass
Filter.
8. Write a MATLAB program to design a Chebyshev Analogi Digital Band Stop
Filter.
9. Write a MATLAB program to convert analog filter in to digital filter using
Impulse Invariant transformation. Consider numerator coefficient and
denominator coefficient of analog filter as [1,2] and [1,5,11,15]
respectively.
10.Write a MATLAB program to convert analog filter in to digital filter using
Bilinear transformation. Consider numerator coefficient and denominator
coefficient of analog filter as [2] and [1,3,2] respectively.

Exercise :5
1. Write a MATLAB program to downsample the signal x(n) by sampling rate
reduction factor i) 3 ii) 4.
2. Write a MATLAB program to upsample the signal x(n) by sampling rate
multiplication factor i) 3 ii) 4.
3. Write a MATLAB program to illustrate the effect of downsampling in
frequency domain of a signal for sampling rate reduction factor
i) 2 ii) 3 iii) 4.
4. Write a MATLAB program to illustrate the effect of upsampling in frequency
domain of a signal for sampling rate multiplication factor
i) 2 ii) 3 iii) 4.