Embed Size (px)
Citation preview
Panhandle and South Texas Stability and System Strength
Assessment
March 28, 2018
Report Submitted to: Electric Reliability Council of Texas, Inc.
Prepared By: Anuradha Dissanayaka
Jake Wiebe Andrew Isaacs
March 28, 2018 Panhandle and South Texas Stability and System Strength Assessment
Page 2
Table of Contents
1.0 Executive Summary .................................................................................................................................. 4 1.1 Background ........................................................................................................................................................ 4 1.2 Objectives .......................................................................................................................................................... 4 1.3 Recommendations and Observations ................................................................................................................. 4
1.3.1 Dynamic performance in Panhandle .............................................................................................................. 4 1.3.2 Dynamic performance in South Texas system ................................................................................................ 4 1.3.3 Weighted Short Circuit Ratio (WSCR) ............................................................................................................. 5 1.3.4 Panhandle Voltage Regulation ....................................................................................................................... 6 1.3.5 South Texas Voltage Regulation ..................................................................................................................... 6 1.3.6 Simulation Tool Adequacy ............................................................................................................................. 6 1.3.7 Sensitivity of System Strength to Load (Panhandle) ........................................................................................ 7 1.3.8 Sensitivity of System Strength to Load (South Texas System) .......................................................................... 7 1.3.9 Additional Recommendations ........................................................................................................................ 8
1.4 Acknowledgements ............................................................................................................................................ 8
2.0 Assumptions and Methodology ................................................................................................................ 9 2.1 PSCAD and E-Tran Software ............................................................................................................................... 9 2.2 PSCAD Parallel System Model ............................................................................................................................. 9
2.2.1 E-Tran Plus PSCAD Parallel Processing ............................................................................................................ 9 2.3 Wind plants (Panhandle) .................................................................................................................................. 15 2.4 Wind plants (South Texas) ................................................................................................................................ 16 2.5 PSCAD System Model ....................................................................................................................................... 17
2.5.1 E-Tran Plus components .............................................................................................................................. 172.5.2 Transmission Line modeling ......................................................................................................................... 17 2.5.3 South Texas dynamic reactive device models ............................................................................................... 18 2.5.4 Series Capacitor Models .............................................................................................................................. 18 2.5.5 Tesla SVC model .......................................................................................................................................... 18 2.5.6 Alibates and Tule Canyon Synchronous Condenser Models .......................................................................... 18
2.6 Study Cases and Contingencies (Panhandle) ..................................................................................................... 19 2.7 Study Cases and Contingencies (South Texas) ................................................................................................... 19 2.8 AC System Representation (Panhandle) ............................................................................................................ 19 2.9 AC System Representation (South Texas).......................................................................................................... 19 2.10 Performance Criteria ........................................................................................................................................ 19
2.10.1 Capability to ride through disturbances ....................................................................................................... 19 2.10.2 Post-fault steady state voltages ................................................................................................................... 20 2.10.3 Stable coordination of dynamic controllers .................................................................................................. 20 2.10.4 Sufficient contribution to network voltage support ...................................................................................... 20 2.10.5 Frequency and Power ramp rate .................................................................................................................. 21
2.11 Additional Assumptions ................................................................................................................................... 21
3.0 Dynamic Performance Studies (Panhandle) ............................................................................................ 22 3.1 Summary of Dynamic Performance Study Results ............................................................................................. 22
3.1.1 Panhandle 70% generation case (PH70) ....................................................................................................... 22 3.1.2 Panhandle 100% generation case (PH100) ................................................................................................... 22 3.1.3 Panhandle 100% generation case with Peak Lubbock Load (PH100LPL) ........................................................ 23 3.1.4 Panhandle 70% generation with prior outage case (PH70ALSW)................................................................... 23 3.1.5 Panhandle 70% generation with prior outage case (PH70RLGR) ................................................................... 23 3.1.6 Panhandle 61% generation with prior outage case (PH61TC)........................................................................ 23
March 28, 2018 Panhandle and South Texas Stability and System Strength Assessment
Page 3
3.2 Discussion of Dynamic Issues ........................................................................................................................... 24 3.2.1 Planning Margins for WSCR ......................................................................................................................... 24 3.2.2 Low system strength issues and voltage collapse ......................................................................................... 24 3.2.3 Instantaneous trip just after the fault .......................................................................................................... 24
4.0 Dynamic Performance Studies (South Texas) .......................................................................................... 26 4.1 Summary of Dynamic Performance Study Results ............................................................................................. 26 4.2 Discussion of Dynamic Issues ........................................................................................................................... 27
4.2.1 Ride-Through Performance .......................................................................................................................... 27 4.2.2 Oscillations due to tuning of generic dynamic reactive device models .......................................................... 28 4.2.3 Loads modeled as dynamic loads impact on the results................................................................................ 31 4.2.4 PSCAD wind turbine model inadequacies ..................................................................................................... 32 4.2.5 Instabilities relating to Series Capacitors ...................................................................................................... 32 4.2.6 Oscillations .................................................................................................................................................. 32
5.0 Parametric SCR Reduction Analysis (Panhandle) ..................................................................................... 33 5.1 Summary of SCR Reduction Analysis ................................................................................................................. 33 5.2 SCR Test System Development ......................................................................................................................... 33
5.2.1 Large signal stability of the Panhandle system with reducing SCR ................................................................. 35 5.3 Results of Parametric SCR Reduction Analysis ................................................................................................... 35
5.3.1 Large signal stability .................................................................................................................................... 35 5.3.2 Conclusions of SCR Ramp Tests .................................................................................................................... 35
6.0 Parametric SCR Reduction Analysis (South Texas) ................................................................................... 37 6.1 Summary of WSCR Reductions Analysis ............................................................................................................ 37
March 28, 2018 Panhandle and South Texas Stability and System Strength Assessment
Page 4
1.0 Executive Summary
1.1 Background A detailed PSCAD analysis1 was conducted in 2016 in the Panhandle Region evaluating the integration of a large amount of wind generation capacity. The study identified system challenges, including dynamic stability and low system strength limitations. The study also proposed some potential upgrade options and tested a new wide-area system strength metric called “Weighted Short Circuit Ratio” (WSCR). Since the completion of the 2016 study, a significant amount of new wind generation projects have satisfied ERCOT Planning Guide 6.9 requirements in both the Panhandle region and in the South region. Electranix has carried out a new analysis to validate and further explore past work under updated system conditions, as well as testing certain recommendations from the prior Electranix report.
1.2 Objectives The objectives of this study are as follows:
a) Evaluate dynamic performance of selected planned scenarios in both the Panhandle and the SouthTexas systems.
b) Review the WSCR-based planning and operating thresholds proposed by ERCOT in the Panhandle, andpropose adjustments if necessary.
c) Determine applicability of WSCR or similar metrics for real-time operations in the South Texas system.d) Provide recommendations on area-wide voltage regulation strategies in the Panhandle.e) Explore the impact of load distribution on low system strength grid issues, as well as exploring the
impact the level of detail in load modelling can have on wide-area studies of this nature.f) Transfer study tools and knowledge to ERCOT engineers.
1.3 Recommendations and Observations The following are summaries of the recommendations and results from this analysis. Care should be taken in extrapolating these results and conclusions beyond the scope of work covered in this effort.
1.3.1 Dynamic performance in Panhandle The cases chosen for detailed study in the Panhandle region represented transmission faults and outages during high wind scenarios, based around the WSCR metric threshold of 1.5 prior to outages occurring. In general, these cases and outages performed acceptably. However, several issues were noted, including failure of individual wind plants to recover from faults and line outages. In general these were constrained to local events, and did not result in wide-spread loss of generation. The failure of these individual plants to ride-through close-in contingencies should be further examined and mitigated if possible.
1.3.2 Dynamic performance in South Texas system The cases chosen for detailed study in the South Texas network represented transmission faults and outages occurring while the network was stressed by high wind output and no thermal generation committed in the South Texas System. These cases demonstrated numerous dynamic performance issues, including the following:
- Individual wind plants failed to recover and tripped following most contingencies. The cause of trippingvaries between event transients (insufficient FRT capability), control oscillations, and insufficient voltage
1 System Strength Assessment of the Panhandle System PSCAD Study – February 2016, Available at: http://www.ercot.com/content/news/presentations/2016/Panhandle%20System%20Strength%20Study%20Feb%2023%202016%20(Public).pdf
March 28, 2018 Panhandle and South Texas Stability and System Strength Assessment
Page 5
support. In some cases, loss of wind generation was spread across a wide region and amounted to significant portions of the total amount of South Texas generation.
- Voltage control following contingencies was poor in the region. This is due to slow or absent wind plantvoltage controllers in many of the PSCAD models. Additionally, dynamic reactive device models in theregion were approximated and used generic control parameters and topologies.
- The presence of series capacitors introduces risk of instability, particularly when wind plants are leftradially connected through the capacitors following a fault.
- Many of the issues observed were highly dependent on model assumptions or depended on old or poorquality vendor models.
Based on this analysis the future scenarios as studied are currently prone to risk of uncontrolled tripping and unstable oscillations. Anticipating more renewable generation will be added in the South Texas region, model quality improvement are highly recommended and a follow up study should be conducted soon to verify and mitigate the issues identified in this study.
1.3.3 Weighted Short Circuit Ratio (WSCR) The WSCR level of 1.5 in the Panhandle (representing a 70% dispatch of existing and planned resources) has been reviewed and confirmed to be acceptable. A WSCR level of 1.0 (representing 100% dispatch of planned resources) was also tested using detailed models and has been shown to provide insufficient strength for the renewable connections to operate reliably. Additional sensitivity testing was performed to evaluate several intermediate conditions (for example prior outage conditions), and these tests indicate that there may be intermediate WSCR levels (eg. 1.4) which can operate stably, although these would require further analysis to determine. It should be noted that any potential for lowering the WSCR limit (increasing Panhandle output) may be offset by wind expansion beyond the Panhandle boundary.
Prior work evaluating WSCR metrics in the Panhandle was based on a very high concentration of wind connecting to a new dedicated 345 kV transmission buildout. As heavy wind penetration continues to expand further into the main Texas network (encompassing more complex network topologies and load regions), precise definition of WSCR boundaries will become more difficult to determine. Further expansion beyond what was modeled in this study could have an impact on WSCR metrics and should be assessed for reliability impacts.
Since WSCR is based on relatively simplistic assumptions pertaining to system strength provided by conventional synchronous machines, it becomes less and less useful as the balance of generation swings towards renewables. If WSCR is no longer applicable at some future point, regular off-line PSCAD studies may be a necessity.
The WSCR metric was also evaluated in the South Texas system. It was determined that this metric has several limitations when applied in a region such as the South Texas system, including:
- Susceptibility to variations in load.- Difficulty in defining boundaries for WSCR calculations as the wind generation disperses over a large
area.- Uncertainty in simulation due to poor model quality.- Presence of series capacitors present complicating technical challenges.
For the current time, it is not recommended to use WSCR in defining real-time operating limits for the South Texas System. These limits should be set using conventional transient stability and voltage stability analysis tools, and checked periodically using detailed EMT simulation tools.

March 28, 2018 Panhandle and South Texas Stability and System Strength Assessment
Page 6
1.3.4 Panhandle Voltage Regulation Detailed wind plant controllers were available for 80 % of the Panhandle resources as a result of prior recommendations. The speed of 85 % of these controllers was fast enough to provide voltage support in the first few seconds following an event. As a result of this support, several critical contingencies were able to maintain adequate voltage profiles throughout the Panhandle and provide improved performance over earlier studies. It was noted that some wind plants provided significantly more voltage control support than others.
The planned VAR support devices in the Panhandle (Tesla, Tule Canyon, and Alibates) reach maximum limits for several contingencies, indicating low reactive power margin and potential reactive power deficiency in the system. This can be improved by ensuring the remaining wind plants implement fast dynamic voltage control.
Since the wind resources in the Panhandle are the primary source of dynamic reactive power, it is recommended that a significant amount of plant level voltage support be provided in less than 3 seconds where feasible in the Panhandle. Additional coordination is required for plants which are controlling voltage in regions electrically close to each other. The purpose of this coordination is to avoid negative interaction between controllers or instability which was observed in some cases in these studies. The precise coordination required may vary according to the specific connection topology, but may include droop (at a minimum), or centralized “multi-plant controllers” where a large number of devices in close proximity require too much droop to maintain effective voltage control.
1.3.5 South Texas Voltage Regulation For more than half of the 22 wind plants in this study a plant level voltage controller model was not provided despite ERCOT’s request for this information. These wind plants were simulated in constant Q control, with the Q setpoint taken from the powerflow models.
The region has 7 existing and planned dynamic reactive devices. These are fast devices which are required to support power transfers to load, and maintain a steady post-fault voltage profile so that the wind generation can ride-through events. Generic PSCAD models were used to represent these dynamic reactive devices at this time. It was found that the specific tuning of these dynamic reactive devices is important in determining:
a. Post fault voltage profile control, which in turn impacts wind plant ride-through.b. Introduction of system wide undamped oscillations at sub-synchronous frequencies. The magnitude
and frequency of these oscillations is dependent on tuning of the dynamic reactive devices in manycases.
Since the wind resources in South Texas are one of the primary sources of dynamic reactive power, it is recommended that plant level voltage support be fast (substantial response in less than 3 seconds if feasible) for all wind plants. As in the Panhandle, additional coordination is required for plants which are controlling voltage in regions electrically close to each other.
1.3.6 Simulation Tool Adequacy As the WSCR drops below 1.5 in the Panhandle, the need for more detailed EMT models becomes more important. It is recommended that periodic studies be done in the Panhandle region with detailed EMT models to validate PSS/E studies and further develop and test WSCR planning guidelines.

March 28, 2018 Panhandle and South Texas Stability and System Strength Assessment
Page 7
In the South Texas system, it is recommended to continue using PSS/E for reliability analysis and setting of operating restrictions. However, it is recommended to perform regular PSCAD studies to confirm these results.
The reasons for this confirmation is: a. Inability of PSS/E to represent SSCI and other transient phenomena relating to series capacitors
(including instability and series capacitor related ride-through failures)b. The possibility of insufficient detail in PSS/e to always predict ride-through failures or control
interactions as the system is weakened and transfers increase.c. Transient effects in the system can have a large influence on ride-through behaviour, and effects of
surge arresters, series capacitor protection, transformer saturation, and frequency dependenttransmission lines can bear on these transient effects. These effects are always important for ride-through, but can be exacerbated (ie. ride-through made more difficult) as the grid strength weakens.
In both the South Texas and the Panhandle systems, the PSCAD model was extremely extensive and used the best available models for generator and voltage support equipment. However, the complexity of observed issues in the South Texas System revealed inadequacies and approximations in the available data, and revealed that a higher level of accuracy may be required to correctly predict system behaviour. Further PSCAD model improvement and PSCAD studies are recommended in the South Texas system.
1.3.7 Sensitivity of System Strength to Load (Panhandle) It is understood that conventional power transfer limitations and voltage stability constraints are often related to “weak grid” issues. It has been observed that the presence of load in the vicinity of generation can offset these conventional limitations, and can also relieve some of the difficulties associated with low system strength.
In the Panhandle, there is very little local load, so this relationship between local load and system strength is less important. However, it was found that connection into the Lubbock load area, adding additional circuits (and so increasing SCMVA), as well as reducing transfers out of the area improves performance of the Panhandle wind region. Due to the effect of increased transfer capability, the damping effect of load, and the increased short circuit strength, an increase in wind dispatch under the “Lubbock Connected” scenario to 100% is likely possible, but care should be taken to evaluate VAR adequacy for this scenario.
Increasing the level of detail in load models (adding a component of induction motor load) was found to have a small positive impact on stability in the Panhandle region. It is recommended to use detailed load models, including a component of induction motor load if applicable, for any future PSCAD effort in the Panhandle region if the Lubbock system integrates into ERCOT.
1.3.8 Sensitivity of System Strength to Load (South Texas System) In the South Texas System, loads are integrated much more tightly than in the Panhandle, and variation in load can cause very different operating conditions for the region. This, combined with the complexity of the various issues observed in the South Texas System made determining the precise impact of load difficult. In general, it can be said that:
a. Addition of load offsets the flows in the HV lines during high wind, and has a positive impact on regionstability.
b. Sensitivity analysis was performed to evaluate the impact of variation in load type on performanceunder stressed conditions. Replacing simple load models with complex models (including inductionmotor components) improves damping on subsynchronous oscillations, but makes fast voltage control

March 28, 2018 Panhandle and South Texas Stability and System Strength Assessment
Page 8
(and plant ride-through) more challenging, since induction motor load requires fast dynamic VARs to aid with voltage recovery when a fault is cleared.
Because of the influence of load type on simulation outcomes, it is recommended to use an appropriate component of induction load in models for any future PSCAD effort in the South Texas System region.
1.3.9 Additional Recommendations The following are additional recommendations that stem from this work:
a. In the South Texas system particularly, but also in general, the presence of fast dynamic VAR controllingdevices can be a very strong influence on stability. If properly tuned, they can provide strong dampingfor SSO modes and other modes of instability in the system. Conversely, if poorly tuned they canintroduce new modes of instability or exacerbate existing issues. This was made clear by the presenceof generic dynamic reactive device models in the South Texas model, which caused undampedoscillations to appear at sub-synchronous frequencies for many contingencies. It is recommended toensure all new dynamic reactive devices are specified such that they provide damping at sub-synchronous frequencies, and are studied to ensure no negative modes are excited when added to thesystem.
b. In addition to the generic dynamic reactive devices, several inadequacies were identified with the windplants in the South Texas system. Due to the complexity of the issues in this region, it isrecommended that these model adequacy concerns be resolved prior to new study being undertaken.Future interconnections should be required to submit PSCAD models that are able to demonstrateminimum adequacy requirements2.
1.4 Acknowledgements Electranix gratefully acknowledges Shun Hsien (Fred) Huang, Yunzhi Cheng, and John Schmall from Transmission System Planning at ERCOT for their valuable assistance and participation in these studies.
2 “Recommended PSCAD model requirements” Rev. 5, Dated February 15, 2018 is available at: http://www.electranix.com/publication/technical-memo-pscad-model-requirements/
March 28, 2018 Panhandle and South Texas Stability and System Strength Assessment
Page 9
2.0 Assumptions and Methodology
2.1 PSCAD and E-Tran Software The studies in this report were done using the PSCAD/EMTDC program (V4.6.2 and V4.5.3). The E-Tran program (V4.2.1) was used to translate PSS/E.raw loadflow cases into PSCAD. E-Tran V4.2.1 has parallel processing simulation features.
Detailed models such as transmission lines, fault logic, wind turbines, synchronous condensers and SVCs are maintained in PSCAD “substitution libraries” and are automatically imported into the PSCAD case (and initialized) by E-Tran - this process is automated and therefore can be quickly performed for different loadflow cases. Separate substitution libraries were created for each wind turbine manufacturer, Tesla SVCs and various network models to keep the libraries as simple as possible, as there are a large number of wind plants associated with this project. This eases case conversion and data handling.
2.2 PSCAD Parallel System Model
2.2.1 E-Tran Plus PSCAD Parallel Processing
2.2.1.1 Details of E-Tran Plus Parallel Processing capabilities The use of multiple PSCAD detailed power electronic-based simulation models (such as wind plants) introduces numerous possible problems:
- Slow simulations: Power electronic models are inherently slow due to switching of IGBT/diode models.Source-based or interface based models can be used (which avoid the switching) however are lessaccurate and can be numerically unstable (particularly in weak systems). The simulation time steprequirements of some models can also be very small (as low as 1-5 µs as compared to the normal 50 µstime step required for system modeling) which requires the entire simulation to be performed with theminimum required step size.
- Compiling/linking issues: Binary .obj/.lib code from many suppliers needs to be linked into oneexecutable .exe – each vendor supplies models compiled with various Fortran or C compilers, andcompatibility problems can occur (known affectionately as “Fortran Hell”).
- Confidentiality problems: Models from the suppliers often are based on actual code from the realhardware (just compiled into PSCAD) – they are extremely sensitive to NDA (non-disclosure agreements)and do not want the code/models to become generally available (for fear of reverse-engineering orprobing of the controls to determine capabilities).
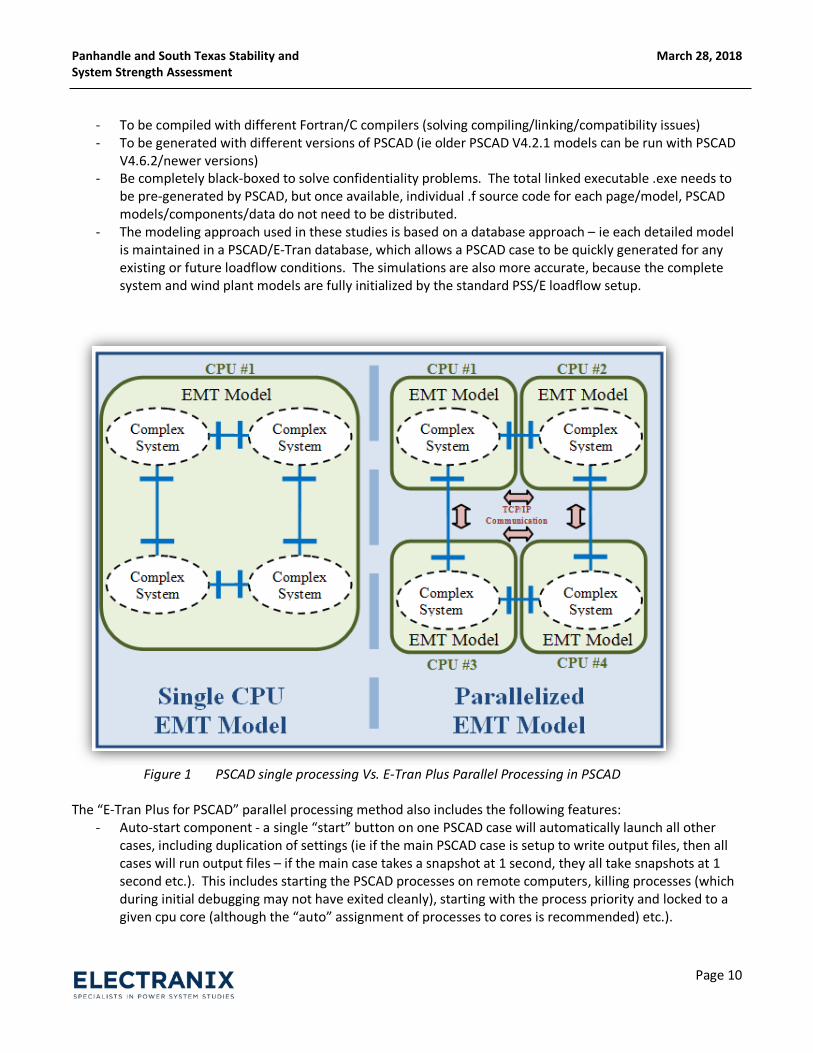
To resolve these issues, the modeling approach used in these studies uses parallel processing using a commercially available PSCAD add-on program called “E-Tran Plus for PSCAD” as shown in Figure 1 (see reference paper entitled “Parallel Processing and Hybrid Simulation for HVDC/VSC PSCAD Studies”, ACDC conference 2012).
The speed of simulation issues are solved by placing each wind plant onto its own CPU/CORE (either on one computer or on other computers connected to the LAN). Each wind plant is modeled on its own CPU/processor (through a Bergeron line model) – this allows each wind plant PSCAD model to:
- Use a different time step (so the entire simulation is not slowed down if one model needs a small timestep)
March 28, 2018 Panhandle and South Texas Stability and System Strength Assessment
Page 10
- To be compiled with different Fortran/C compilers (solving compiling/linking/compatibility issues)- To be generated with different versions of PSCAD (ie older PSCAD V4.2.1 models can be run with PSCAD
V4.6.2/newer versions)- Be completely black-boxed to solve confidentiality problems. The total linked executable .exe needs to
be pre-generated by PSCAD, but once available, individual .f source code for each page/model, PSCADmodels/components/data do not need to be distributed.
- The modeling approach used in these studies is based on a database approach – ie each detailed modelis maintained in a PSCAD/E-Tran database, which allows a PSCAD case to be quickly generated for anyexisting or future loadflow conditions. The simulations are also more accurate, because the completesystem and wind plant models are fully initialized by the standard PSS/E loadflow setup.
Figure 1 PSCAD single processing Vs. E-Tran Plus Parallel Processing in PSCAD
The “E-Tran Plus for PSCAD” parallel processing method also includes the following features: - Auto-start component - a single “start” button on one PSCAD case will automatically launch all other
cases, including duplication of settings (ie if the main PSCAD case is setup to write output files, then allcases will run output files – if the main case takes a snapshot at 1 second, they all take snapshots at 1second etc.). This includes starting the PSCAD processes on remote computers, killing processes (whichduring initial debugging may not have exited cleanly), starting with the process priority and locked to agiven cpu core (although the “auto” assignment of processes to cores is recommended) etc.).
March 28, 2018 Panhandle and South Texas Stability and System Strength Assessment
Page 11
- Communication/plotting between PSCAD cases (an array of any size can be assigned to transfervariables from one case to another – this is useful if real/physical communication is required (say a linerelay at one side communicates with the other via fiber) or simply for plotting (so the main simulationcan plot quantities from the entire set of simulations).
- Compatibility with the multiple run features of PSCAD.
The communication method used between processes is based on standard TCP/IP networking protocols, using custom code (included in E-Tran Plus products) written with low-level (ie no overhead) interfaces and absolute minimum latency requirements (ie a standard LAN gigabit switch is sufficient).
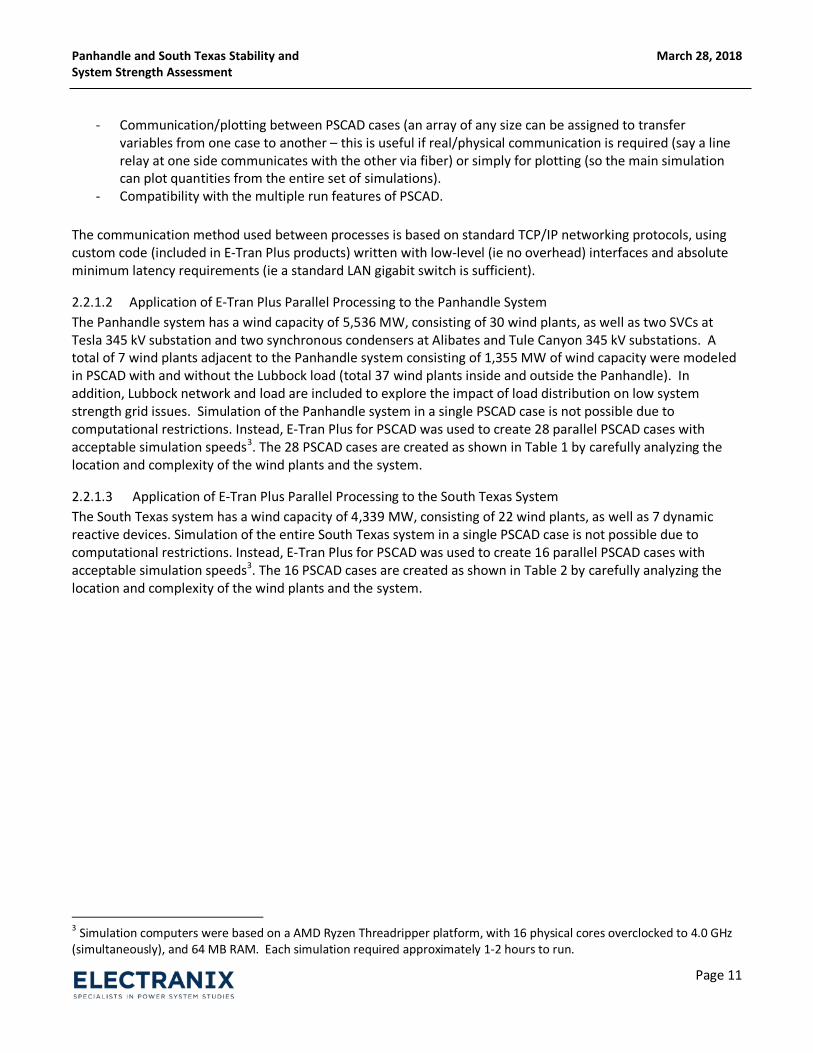
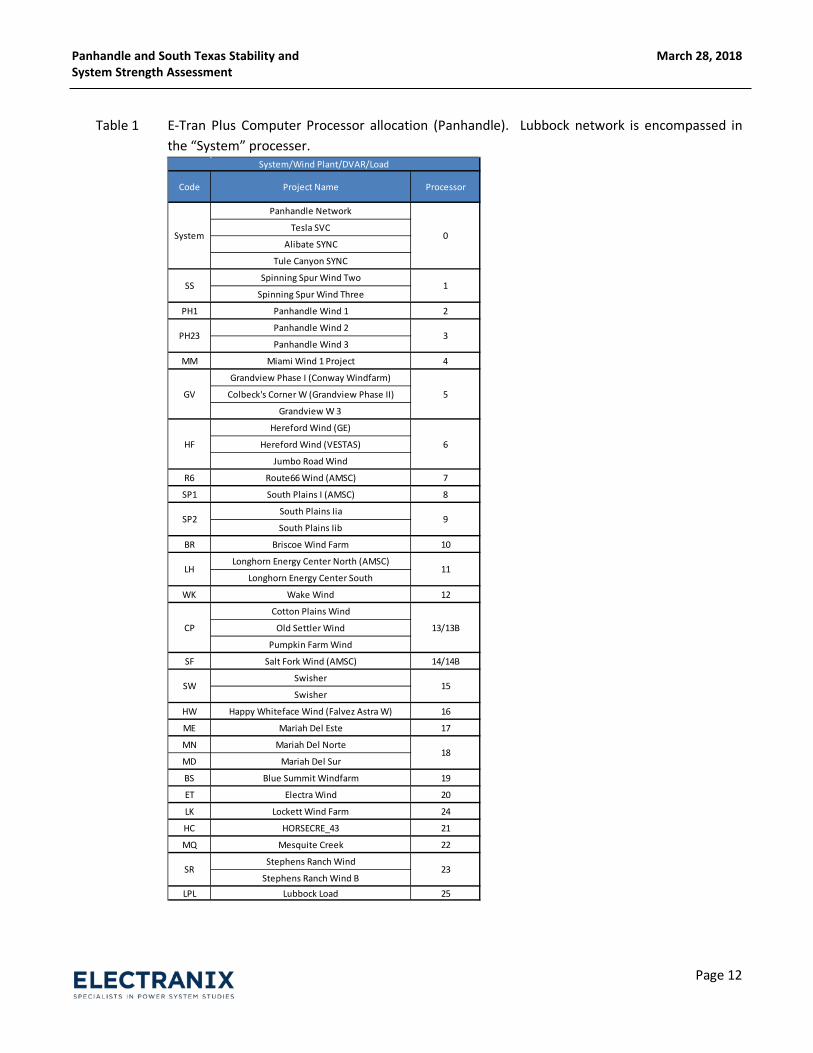
2.2.1.2 Application of E-Tran Plus Parallel Processing to the Panhandle System The Panhandle system has a wind capacity of 5,536 MW, consisting of 30 wind plants, as well as two SVCs at Tesla 345 kV substation and two synchronous condensers at Alibates and Tule Canyon 345 kV substations. A total of 7 wind plants adjacent to the Panhandle system consisting of 1,355 MW of wind capacity were modeled in PSCAD with and without the Lubbock load (total 37 wind plants inside and outside the Panhandle). In addition, Lubbock network and load are included to explore the impact of load distribution on low system strength grid issues. Simulation of the Panhandle system in a single PSCAD case is not possible due to computational restrictions. Instead, E-Tran Plus for PSCAD was used to create 28 parallel PSCAD cases with acceptable simulation speeds3. The 28 PSCAD cases are created as shown in Table 1 by carefully analyzing the location and complexity of the wind plants and the system.
2.2.1.3 Application of E-Tran Plus Parallel Processing to the South Texas System The South Texas system has a wind capacity of 4,339 MW, consisting of 22 wind plants, as well as 7 dynamic reactive devices. Simulation of the entire South Texas system in a single PSCAD case is not possible due to computational restrictions. Instead, E-Tran Plus for PSCAD was used to create 16 parallel PSCAD cases with acceptable simulation speeds3. The 16 PSCAD cases are created as shown in Table 2 by carefully analyzing the location and complexity of the wind plants and the system.
3 Simulation computers were based on a AMD Ryzen Threadripper platform, with 16 physical cores overclocked to 4.0 GHz (simultaneously), and 64 MB RAM. Each simulation required approximately 1-2 hours to run.
March 28, 2018 Panhandle and South Texas Stability and System Strength Assessment
Page 12
Table 1 E-Tran Plus Computer Processor allocation (Panhandle). Lubbock network is encompassed inthe “System” processer.
Panhandle Network
Tesla SVC
Alibate SYNC
Tule Canyon SYNC
Spinning Spur Wind Two
Spinning Spur Wind Three
PH1 Panhandle Wind 1 2
Panhandle Wind 2
Panhandle Wind 3
MM Miami Wind 1 Project 4
Grandview Phase I (Conway Windfarm)
Colbeck's Corner W (Grandview Phase II)
Grandview W 3
Hereford Wind (GE)
Hereford Wind (VESTAS)
Jumbo Road Wind
R6 Route66 Wind (AMSC) 7
SP1 South Plains I (AMSC) 8
South Plains Iia
South Plains Iib
BR Briscoe Wind Farm 10
Longhorn Energy Center North (AMSC)
Longhorn Energy Center South
WK Wake Wind 12
Cotton Plains Wind
Old Settler Wind
Pumpkin Farm Wind
SF Salt Fork Wind (AMSC) 14/14B
Swisher
Swisher
HW Happy Whiteface Wind (Falvez Astra W) 16
ME Mariah Del Este 17
MN Mariah Del Norte
MD Mariah Del Sur
BS Blue Summit Windfarm 19
ET Electra Wind 20
LK Lockett Wind Farm 24
HC HORSECRE_43 21
MQ Mesquite Creek 22
Stephens Ranch Wind
Stephens Ranch Wind BLPL Lubbock Load 25
Code Processor
6
SP2 9
CP
LH
HF
SW 15
11
SR 23
18
13/13B
System/Wind Plant/DVAR/Load
3PH23
5GV
Project Name
System 0
SS 1
March 28, 2018 Panhandle and South Texas Stability and System Strength Assessment
Page 13
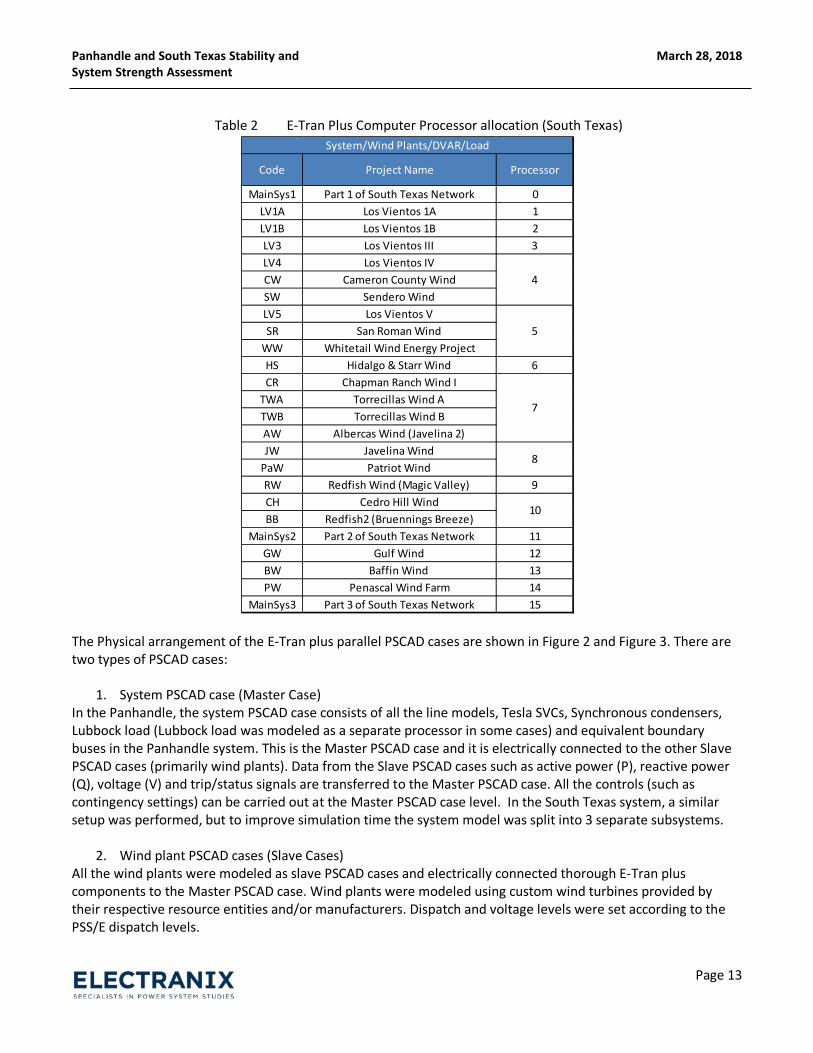
Table 2 E-Tran Plus Computer Processor allocation (South Texas)
The Physical arrangement of the E-Tran plus parallel PSCAD cases are shown in Figure 2 and Figure 3. There are two types of PSCAD cases:
1. System PSCAD case (Master Case)In the Panhandle, the system PSCAD case consists of all the line models, Tesla SVCs, Synchronous condensers, Lubbock load (Lubbock load was modeled as a separate processor in some cases) and equivalent boundary buses in the Panhandle system. This is the Master PSCAD case and it is electrically connected to the other Slave PSCAD cases (primarily wind plants). Data from the Slave PSCAD cases such as active power (P), reactive power (Q), voltage (V) and trip/status signals are transferred to the Master PSCAD case. All the controls (such as contingency settings) can be carried out at the Master PSCAD case level. In the South Texas system, a similar setup was performed, but to improve simulation time the system model was split into 3 separate subsystems.
2. Wind plant PSCAD cases (Slave Cases)All the wind plants were modeled as slave PSCAD cases and electrically connected thorough E-Tran plus components to the Master PSCAD case. Wind plants were modeled using custom wind turbines provided by their respective resource entities and/or manufacturers. Dispatch and voltage levels were set according to the PSS/E dispatch levels.
Code Project Name Processor
MainSys1 Part 1 of South Texas Network 0LV1A Los Vientos 1A 1LV1B Los Vientos 1B 2LV3 Los Vientos III 3LV4 Los Vientos IVCW Cameron County WindSW Sendero WindLV5 Los Vientos VSR San Roman Wind
WW Whitetail Wind Energy ProjectHS Hidalgo & Starr Wind 6CR Chapman Ranch Wind I
TWA Torrecillas Wind ATWB Torrecillas Wind BAW Albercas Wind (Javelina 2)JW Javelina Wind
PaW Patriot Wind RW Redfish Wind (Magic Valley) 9CH Cedro Hill WindBB Redfish2 (Bruennings Breeze)
MainSys2 Part 2 of South Texas Network 11GW Gulf Wind 12BW Baffin Wind 13PW Penascal Wind Farm 14
MainSys3 Part 3 of South Texas Network 15
System/Wind Plants/DVAR/Load
5
7
8
10
4
March 28, 2018 Panhandle and South Texas Stability and System Strength Assessment
Page 14
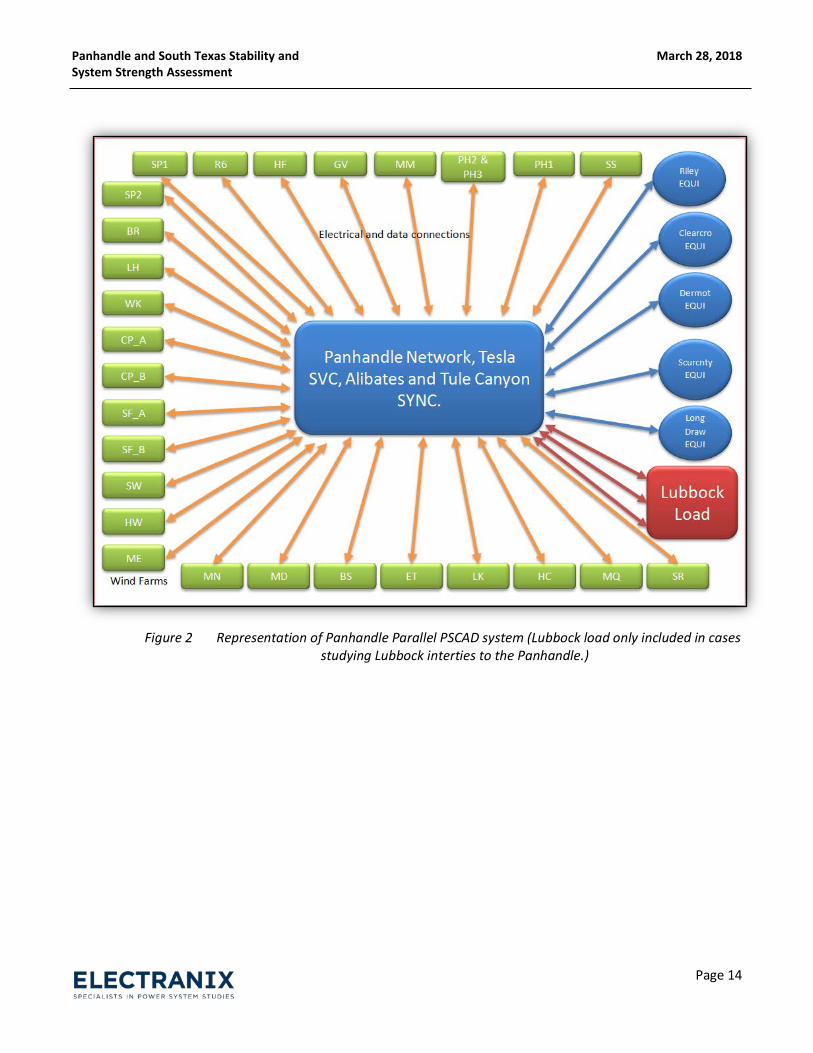
Figure 2 Representation of Panhandle Parallel PSCAD system (Lubbock load only included in cases studying Lubbock interties to the Panhandle.)
March 28, 2018 Panhandle and South Texas Stability and System Strength Assessment
Page 15
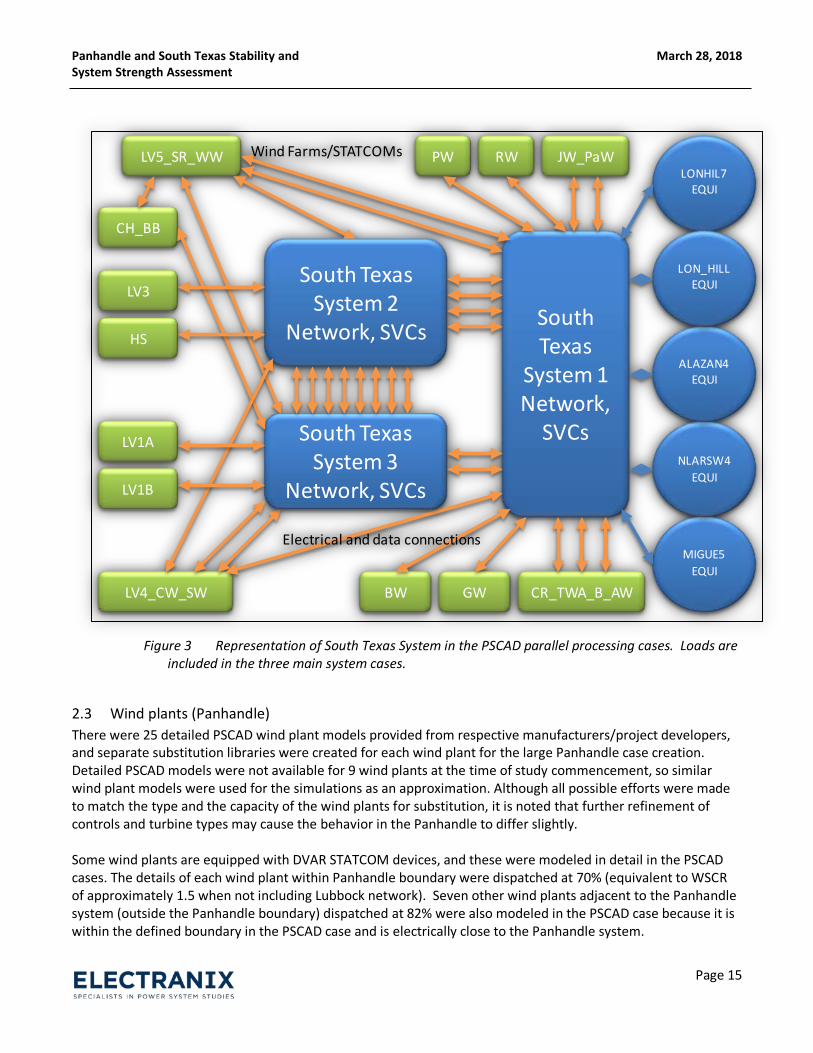
Figure 3 Representation of South Texas System in the PSCAD parallel processing cases. Loads are included in the three main system cases.
2.3 Wind plants (Panhandle) There were 25 detailed PSCAD wind plant models provided from respective manufacturers/project developers, and separate substitution libraries were created for each wind plant for the large Panhandle case creation. Detailed PSCAD models were not available for 9 wind plants at the time of study commencement, so similar wind plant models were used for the simulations as an approximation. Although all possible efforts were made to match the type and the capacity of the wind plants for substitution, it is noted that further refinement of controls and turbine types may cause the behavior in the Panhandle to differ slightly.
Some wind plants are equipped with DVAR STATCOM devices, and these were modeled in detail in the PSCAD cases. The details of each wind plant within Panhandle boundary were dispatched at 70% (equivalent to WSCR of approximately 1.5 when not including Lubbock network). Seven other wind plants adjacent to the Panhandle system (outside the Panhandle boundary) dispatched at 82% were also modeled in the PSCAD case because it is within the defined boundary in the PSCAD case and is electrically close to the Panhandle system.
South Texas
System 1 Network,
SVCs
LONHIL7 EQUI
MIGUE5EQUI
NLARSW4EQUI
LV5_SR_WW RW
LV3
HS
CH_BB
CR_TWA_B_AW
LV1B
JW_PaWPW
GWBWLV4_CW_SW
Electrical and data connections
Wind Farms/STATCOMs
ALAZAN4 EQUI
LON_HILLEQUISouth Texas
System 2 Network, SVCs
South Texas System 3
Network, SVCs
LV1A

March 28, 2018 Panhandle and South Texas Stability and System Strength Assessment
Page 16
Detailed PSCAD models of the wind plant were inserted into each PSCAD case. Detailed DVAR PSCAD models were substituted and switching capacitors and inductors were modeled inside the detailed DVAR models as applicable. The DVARs were set to operate with a droop and dead bands, and include 300% overload capability for a 2 second period. The DVAR devices switch shunt capacitors or inductors according to VAR requirements, with 3 to 5 second time delays, as provided in the models. The DVARs were set to keep their dynamic reactive power output at minimum level during normal operation by switching shunt devices to maintain maximum dynamic range during contingency conditions.
The 345 kV transmission line from wind plants to the Panhandle system was replaced by the E-Tran Plus parallel communication component to enable parallel processing in PSCAD. This component consists of a Bergeron line model with parallel communication capability to other PSCAD cases.
With respect to optional controllers such as SSCI damping controllers, plants were modeled as provided by the manufacturer, except for certain wind turbines, which failed to ride through faults when the optional SSCI protection was turned on. This SSCI protection was turned off to allow the study to proceed.
Detailed plant controllers were available for 80% of the Panhandle resources as a result of prior recommendations. The speed of 85% of these controllers was fast enough to provide voltage support in the first few seconds following an event (Most of the wind plants with fast PPCs reach 90% of reactive power order within approximately 2 seconds).
2.4 Wind plants (South Texas) There were 20 detailed PSCAD wind plant models provided from respective manufacturers/project developers, and separate substitution libraries were created for each wind plant for the South Texas system. Detailed PSCAD models were not available for two wind plants at the time of study commencement, so similar wind plant models were used for the simulations as an approximation. Although all possible efforts were made to match the type and the capacity of the wind plants for substitution, it is noted that further refinement of controls and turbine types may cause the behavior in the South Texas System to differ slightly.
Some wind plants are equipped with DVAR STATCOM/DSTATCOM devices, and these were modeled in detail in the PSCAD cases as in the Panhandle.
A substitution library was built for each wind plant separately and the detailed PSCAD models of the wind plant was later substituted into separate PSCAD cases. All the wind plants and including the South Texas system were split up on 16 different PSCAD cases. Since the step up transformers are usually modeled inside the manufacturer's wind turbine models, all the components towards the low voltage side from the step up transformer are typically substituted from the detailed model.
SSCI damping controllers features if explicitly included were mostly enabled as provided with the PSCAD models.
For more than half of the 22 wind plants in this study a PPC/voltage controller was not provided. Due to model issues and simulation efficiency, additional assumptions and adjustments were made during the model development of the South Texas system.
March 28, 2018 Panhandle and South Texas Stability and System Strength Assessment
Page 17
2.5 PSCAD System Model The PSCAD system model includes fault automation and case parallelization,
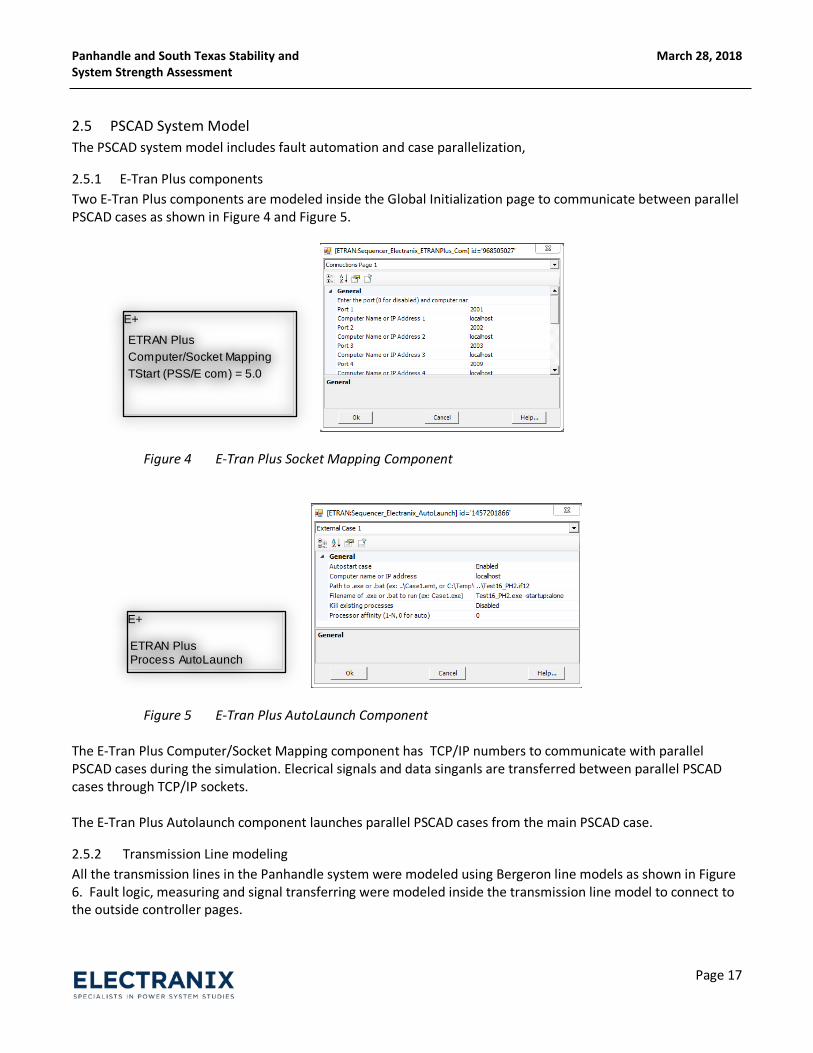
2.5.1 E-Tran Plus components Two E-Tran Plus components are modeled inside the Global Initialization page to communicate between parallel PSCAD cases as shown in Figure 4 and Figure 5.
Figure 4 E-Tran Plus Socket Mapping Component
Figure 5 E-Tran Plus AutoLaunch Component
The E-Tran Plus Computer/Socket Mapping component has TCP/IP numbers to communicate with parallel PSCAD cases during the simulation. Elecrical signals and data singanls are transferred between parallel PSCAD cases through TCP/IP sockets.
The E-Tran Plus Autolaunch component launches parallel PSCAD cases from the main PSCAD case.
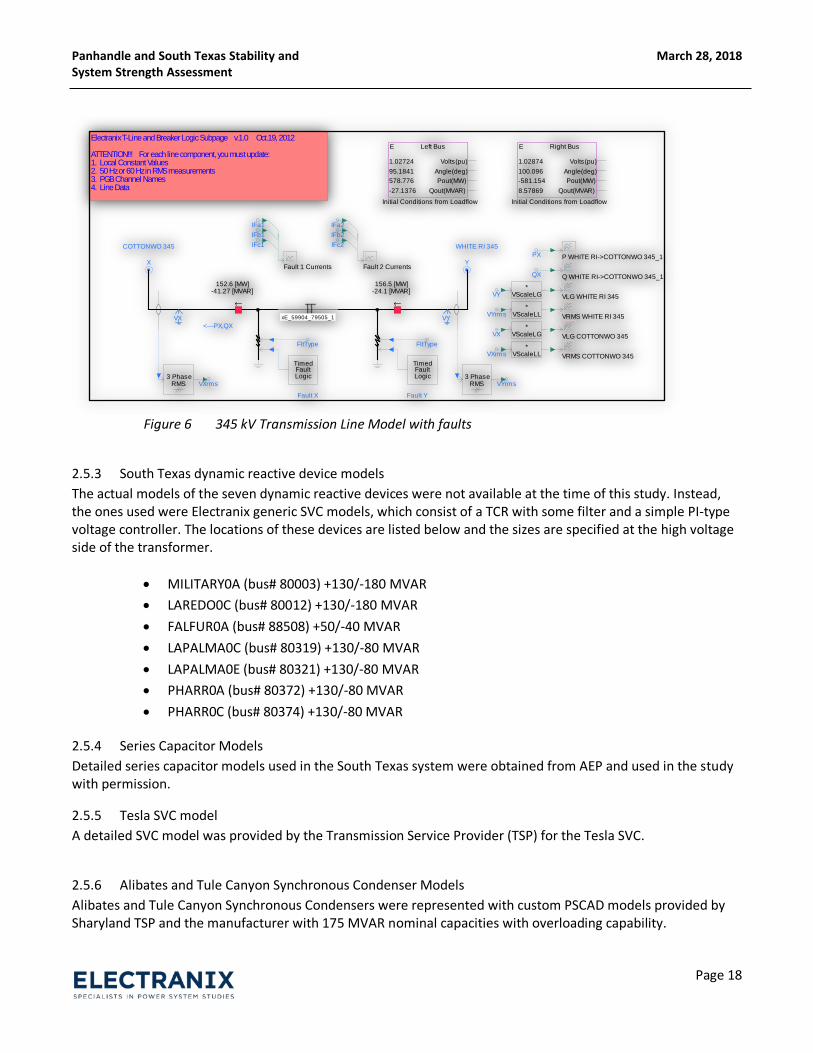
2.5.2 Transmission Line modeling All the transmission lines in the Panhandle system were modeled using Bergeron line models as shown in Figure 6. Fault logic, measuring and signal transferring were modeled inside the transmission line model to connect tothe outside controller pages.
E+
ETRAN PlusComputer/Socket MappingTStart (PSS/E com) = 5.0
E+
ETRAN PlusProcess AutoLaunch
March 28, 2018 Panhandle and South Texas Stability and System Strength Assessment
Page 18
Figure 6 345 kV Transmission Line Model with faults
2.5.3 South Texas dynamic reactive device models The actual models of the seven dynamic reactive devices were not available at the time of this study. Instead, the ones used were Electranix generic SVC models, which consist of a TCR with some filter and a simple PI-type voltage controller. The locations of these devices are listed below and the sizes are specified at the high voltage side of the transformer.
• MILITARY0A (bus# 80003) +130/-180 MVAR• LAREDO0C (bus# 80012) +130/-180 MVAR• FALFUR0A (bus# 88508) +50/-40 MVAR• LAPALMA0C (bus# 80319) +130/-80 MVAR• LAPALMA0E (bus# 80321) +130/-80 MVAR• PHARR0A (bus# 80372) +130/-80 MVAR• PHARR0C (bus# 80374) +130/-80 MVAR
2.5.4 Series Capacitor Models Detailed series capacitor models used in the South Texas system were obtained from AEP and used in the study with permission.
2.5.5 Tesla SVC model A detailed SVC model was provided by the Transmission Service Provider (TSP) for the Tesla SVC.
2.5.6 Alibates and Tule Canyon Synchronous Condenser Models Alibates and Tule Canyon Synchronous Condensers were represented with custom PSCAD models provided by Sharyland TSP and the manufacturer with 175 MVAR nominal capacities with overloading capability.
P WHITE RI->COTTONWO 345_1PX
Q WHITE RI->COTTONWO 345_1QX
X Y
-41.27 [MVAR]152.6 [MW]
FltType
TimedFaultLogic
IFa1IFb1IFc1
Fault 1 Currents
FltType
TimedFaultLogic
IFa2IFb2IFc2
Fault 2 Currents
Fault YFault X
VLG COTTONWO 345
VY
VY<---PX,QX
VX
VLG WHITE RI 345
VX
-24.1 [MVAR]156.5 [MW]
3 PhaseRMS
3 PhaseRMS
VRMS WHITE RI 345
VRMS COTTONWO 345
COTTONWO 345 WHITE RI 345
VYrms
VYrms
VXrms
VXrms
*VScaleLG
*VScaleLL
*VScaleLG
*VScaleLL
xE_59904_79505_1
Angle(deg)Pout(MW)
Qout(MVAR)
95.1841578.776-27.1376
Initial Conditions from Loadflow
Left BusE
Volts(pu)1.02724Angle(deg)Pout(MW)
Qout(MVAR)
100.096-581.1548.57869
Initial Conditions from Loadflow
Right BusE
Volts(pu)1.02874
Electranix T-Line and Breaker Logic Subpage v.1.0 Oct.19, 2012
ATTENTION!!! For each line component, you must update:1. Local Constant Values2. 50 Hz or 60 Hz in RMS measurements3. PGB Channel Names4. Line Data
March 28, 2018 Panhandle and South Texas Stability and System Strength Assessment
Page 19
2.6 Study Cases and Contingencies (Panhandle) ERCOT provided six study cases with 5,536 MW Panhandle wind capacity dispatched as follows:
1. PH70 Case : Panhandle wind plants dispatched at 70%2. PH100 Case : Panhandle wind plants dispatched at 100%3. PH100LPL Case : Panhandle wind plants dispatched at 100% with Lubbock network and load connection4. PH70ALSW Case : Panhandle wind plants dispatched at 70% with a prior outage of the ALIBATES to AJ
SWOPE line (N-1-1 prior outage)5. PH70ALGR Case : Panhandle wind plants dispatched at 70% with a prior outage of the ALIBATES to
RAILHEAD/GRAY line (N-1-1 prior outage)6. PH61TC Case : Panhandle wind plants dispatched at 61% with a prior outage of the TULE CANYON
Substation
A total of eighteen contingencies, including double circuits three phase fault and single line to ground fault with breaker failure, were provided by ERCOT for the Panhandle study.
2.7 Study Cases and Contingencies (South Texas) ERCOT provided one study case with 4,339 MW wind capacity with all the wind plants dispatched at 100% in the South Texas system. A total of twelve contingencies, including single circuit and double circuit three phase faults, were provided by ERCOT for the South Texas case. Conventional synchronous machines in the South Texas system were all turned off in all cases.
2.8 AC System Representation (Panhandle) All the buses inside the Panhandle system were modeled in PSCAD. Riley, Clear Crossing, Dermot, Long Draw and Scurry County 345 kV buses were selected as boundary buses and were modeled with passive network equivalents in the PSCAD model. A total of 435 buses were kept in the PSCAD network.
2.9 AC System Representation (South Texas) All of the buses in the South Texas system up to and including buses MIGUEL5, LONHILL7A, NLARSW4A, LON_HILL4A, and ALAZAN4A were modeled in PSCAD. These five buses were selected as boundary buses and were modeled as a passive NxN network equivalent in the PSCAD model. In addition, several sub-transmission 69 kV lines with very little powerflow were disconnected to allow a simpler interface to the passive boundary system. A total of 469 buses were kept in the PSCAD network.
To split up the South Texas system on multiple processors, the electrical length of the line from ALBERTARDSB8 to DOEDYNSUB8 was increased slightly so that it was long enough to be a Bergeron line model.
2.10 Performance Criteria The following general wind plant performance requirements were applied in these studies to evaluate whether performance was acceptable4.
2.10.1 Capability to ride through disturbances Capability to ride through disturbances, or fault ride-through requirements as commonly referred in the grid codes, normally state in some fashion that:
4 For a more detailed discussion of weak system performance requirements, see Technical Brochure – Cigre B4.62 Chapter 3

March 28, 2018 Panhandle and South Texas Stability and System Strength Assessment
Page 20
1. The Wind Power Plant (WPP) should not be tripped in the event of normally cleared system faults. Faultride through is a requirement where wind generators are required to stay connected to the grid duringand after the clearance of a system fault. Following the clearance of the fault, the WPP should be able toprovide real and reactive power to the grid. This will assist to maintain angle and voltage stability of thesystem.
This requirement may be more critical in weak systems because of the following reasons:o Local reactive power support to maintain system voltages is more critical in weak systems.o Active power deficiencies as a result of WPP tripping can be easily compensated by other
generators in strong interconnections. Thus, fault ride through can be more critical in weaksystems (In case of generation tripping, power electronics based generation such as nearby windplants can ramp up power faster to compensate in strong systems compared to weak systems,since reactive power is more difficult to control in weak systems, and changes in active powercause more severe voltage fluctuations)
o Tripping of a significant generator is more likely to result in undesirable poorly damped poweroscillations in weak system compared to a strong system.
2. The wind plant should be able to control active and reactive power injection during the fault recovery. Atypical requirement of a weak grid during fault recovery is curtailment of power and boosting of reactivepower injection to support voltage. Power electronics based wind generation has this inherentcapability. This is achieved through fast control of active and reactive currents.
2.10.2 Post-fault steady state voltages If the system is too weak and has insufficient voltage support, the system may experience post fault steady state voltage violations before the power plant voltage controller is able come into action (which may take 20 to 30 seconds depending on the time constants of these plant level controllers). This may lead to low post fault voltage values, and some wind plants may enter fault ride through modes multiple times before the plant controller can respond.
2.10.3 Stable coordination of dynamic controllers Generators are expected to operate in a stable fashion, and to avoid interfering with the controls of neighboring equipment. Modern power electronics based wind generators are equipped with numerous control systems performing numerous control functions. These control functions can interact with nearby power electronic based dynamic devices with comparable control system time constants. This can lead to detrimental dynamic oscillations. The potential of such oscillations is greater when the devices are connected to a weak grid.
Generators are also expected to operate in a stable fashion during varying system conditions, including following outages which may significantly weaken the connection strength.
2.10.4 Sufficient contribution to network voltage support Generators are expected to contribute to the support of the bulk electric system. This includes reactive power available to regulate voltage (fast and slow support), as well as frequency control in some cases. ERCOT requires all Generation Resources to provide reactive support per ERCOT Protocol 3.15. The reactive support from wind plants in this analysis is based on the provided model and data from Resource Entities, and it is clear from this analysis that the extent to which the generators contribute to this support is critical in overall performance.

March 28, 2018 Panhandle and South Texas Stability and System Strength Assessment
Page 21
2.10.5 Frequency and Power ramp rate There is currently no specific requirement for active power ramp rates in the ERCOT system. The active power ramp rates of the wind plants are very important for weak system performance. If the ramp rates are too low, the system may experience frequency violations as energy is not supplied during the post fault period. If the ramp rates are too high, the system may experience voltage violations in weak system conditions, and the ability of the plant controllers to remain stable is reduced as the system is weakened.
The wind plants in the Panhandle system have different active power ramp rates, ranging from as low as 0.2 sec to others as high as 2.0 sec. Drastically varying the mix of ramp rates in the Panhandle system may impact the results of this study.
2.11 Additional Assumptions Additional assumptions were made for parallel simulation.
1. The PSCAD simulation was run for up to 18 seconds of simulation time in order to get a steady state flatrun. This is due to the presence of many dynamic devices (wind plants, DVARs and SVCs) which ramp upduring the first few seconds. Infinite source models were connected during the first five seconds of thesimulation to support ramp up of all the wind turbines at the same time.
2. This study was carried out in order to gain an understanding of the weak system issues. No Sub-synchronous oscillation issues were specifically studied. The selection of boundary buses excludes someseries compensated lines (outside the Panhandle system) from the main PSCAD system case.
3. Line arresters and MOVs of the series capacitors were not modeled in this simulation.4. Transmission lines were modeled as Bergeron line models.5. The performance of the system may differ if the wind capacity is increased with same dispatch levels
due to reactive power performance of the additional wind turbines added to the system.6. Approximately 80% of the wind plant models in the Panhandle system reflect a Wind Power Plant
Controller (WPPC). The remainder of the wind plants were simulated in constant Q control.7. Less than 50% of the wind plant models in the South Texas system reflect a WPPC. The remainder of the
wind plants were simulated in constant Q control, except one plant which was in constant power factorcontrol.
8. Most the PSCAD simulations were run with a 20 µs simulation time step and several of the wind turbinemodels were run with a 10 µs simulation time step. The PSCAD multiple run and snapshot features werenot used in the simulations as some models do not support these features.
9. Transformer saturation was enabled using typical saturation characteristics in the Panhandle and theSouth Texas system.

March 28, 2018 Panhandle and South Texas Stability and System Strength Assessment
Page 22
3.0 Dynamic Performance Studies (Panhandle)
3.1 Summary of Dynamic Performance Study Results Several system scenarios were studied in the Panhandle area with different dispatch levels with 5,536 MW wind capacity. These cases include system intact cases and prior line and substation outage cases and Lubbock load connection cases. A summary of key results for the Panhandle weak system study is shown in Table 3.
Table 3 Summary of Panhandle Results by Case
Case Study Case
Panhandle Wind
Capacity (MW)
Panhandle Wind
Dispatch (MW)
Results
Maximum wind tripped for any
contingency (MW)
1 PH70 5,536 3,780 Wind Trips* ≈ 256 2 PH100 5,536 5,536 Fail ** ≈ 1,165 3 PH100LPL 5,536 5,536 Wind Trips* ≈ 248 4 PH70ALSW 5,536 3,780 Wind Trips* ≈ 94 5 PH70RLGR 5,536 3,780 Wind Trips* ≈ 192 6 PH61TC 5,536 3,385 Fail ** ≈ 714
(*) Localized tripping not resulting in wide area system impact. (**) System collapse or widespread instability.
The high level summary of the study case results can further be described as follows:
3.1.1 Panhandle 70% generation case (PH70) • Tesla SVC, Tule Canyon and Alibates synchronous condenser reach maximum limits for several
contingencies during voltage sags, indicating a lack of reactive power margin in the system. Anyreactive power deficiency can be alleviated using following steps:
1. Improve PSCAD models to include PPC modeling for wind plants that didn’t provide suchfunction in the submitted models.
2. Coordinate and improve the response times of wind plants to help any reactive powerdeficiency just after the fault by easing pressure on SVC and SYNCs.
3. Optimize reactive power contribution from each wind plant at common POI.• Protection of the Tule Canyon and Alibates SYNCs are not modeled. Active power swings as
much as -150 MW were observed and capability of actual equipment should be verified.• The Panhandle system has the capability to handle 70% wind generation with modeled
operating conditions. The generation level may be increased if voltage support is improved, butthis should be verified by a detailed study.
3.1.2 Panhandle 100% generation case (PH100) • Tesla SVC, Tule Canyon and Alibates synchronous condenser reach maximum reactive output for
most of the contingencies indicating a lack of reactive power margin in the system. Samemeasures as indicated for 70% case can be implemented to overcome these issues.

March 28, 2018 Panhandle and South Texas Stability and System Strength Assessment
Page 23
• For critical contingencies, oscillations in system quantities coupled with voltage collapse wasobserved with up to 1,165 MW of wind tripping.
• Most of the wind plant tripping, voltage collapse and poor ride through behaviour are due to thelow system strength as well as not enough voltage support in the system. It is not recommendedto operate with 100% generation without additional system improvements.
3.1.3 Panhandle 100% generation case with Peak Lubbock Load (PH100LPL) • The Lubbock load (594 MW + 83 MVAr) is connected to the Panhandle system by three
transmission lines. The Lubbock load connection helps to improve the performance of thesystem following ways:
1. The new lines add an extra transmission path to flow power through and out of thePanhandle during contingency conditions while providing additional short circuitcapacity in the Panhandle.
2. The Lubbock load absorbs 594 MW of Panhandle generation while easing transfer flowsthrough and out of the Panhandle.
3. System load adds more damping to the system and helps to damp out transients frompower electronic devices.
• Improved system performance in both system strength and voltage was observed due toconnection of the Lubbock load while continuing to show minimal reactive power capacitymargin in the system. No voltage collapse or wind plant mode cycling was observed.
• The Tesla SVC, Tule Canyon and Alibates synchronous condensers hit maximum limits for severalcontingencies during voltage sags indicating potential reactive power deficiency (or lack ofmargin) in the system.
• The sensitivity of the Lubbock loads were checked with both ZIP and CLOD models. The CLODmodel marginally improves the transient response of the system due to the increased inertiaand damping provided by induction motor loads.
• The Panhandle system is capable to handle 100% wind generation with the Lubbock loadconnection with modeled operating conditions. Note: Since Lubbock load was high in this case,further analysis may be needed to evaluate performance under light load conditions.
3.1.4 Panhandle 70% generation with prior outage case (PH70ALSW) • The Tesla SVC, Tule Canyon synchronous condenser hit maximum limits for several
contingencies indicating low reactive power margin in the system.
3.1.5 Panhandle 70% generation with prior outage case (PH70RLGR) • The Tesla SVC, Tule Canyon and Alibates synchronous condensers hit maximum limits for several
contingencies indicating low reactive power margin in the system. Steady state post faultvoltages as low as 0.94 pu were observed for several contingencies.
3.1.6 Panhandle 61% generation with prior outage case (PH61TC) • The Tesla SVC hits maximum inductive limits for several contingencies indicating low inductive
reactive power margin in the system.
March 28, 2018 Panhandle and South Texas Stability and System Strength Assessment
Page 24
• Oscillatory behaviour coupled with voltage collapse was observed with up to 714 MW windtripping. Mode cycling was observed for most of the wind plants for certain contingencies. Thesystem does not have enough strength or voltage support to handle all contingencies for thisstudy scenario.
3.2 Discussion of Dynamic Issues
3.2.1 Planning Margins for WSCR The 3,780 MW generation cases (corresponding with 70% capacity, and a WSCR of 1.5) do not show critical low system strength signs or voltage violations issues, other than isolated wind plant tripping and reaching reactive power limits of SVCs and synchronous condensers. Adding PPC capability to all the wind plants, decreasing response time, proper coordination of PPCs and adding additional reactive power capability if required will improve the post fault voltage profile of the system. This will potentially allow an increase in the dispatch level and should be supported by a detailed study.
The improved performance observed with fast PPCs is an important result compared to the last round of studies, as it demonstrates the unique characteristics of wind and the importance of dynamic voltage control planning. It is possible for wind plants to support the voltage across a system, but these controllers may not be configured to operate in the fast timeframes required to prevent voltage collapse in the few seconds following a fault, and the controllers may not be available if the wind plants are out of service, or the wind is not blowing. A mix of network based voltage support and wind power plant voltage support is desirable, and special care is required in conventional planning to ensure sufficient VARs are available in the immediate post-fault timeframes as well as the extended simulation timeframes typically examined in powerflow studies.
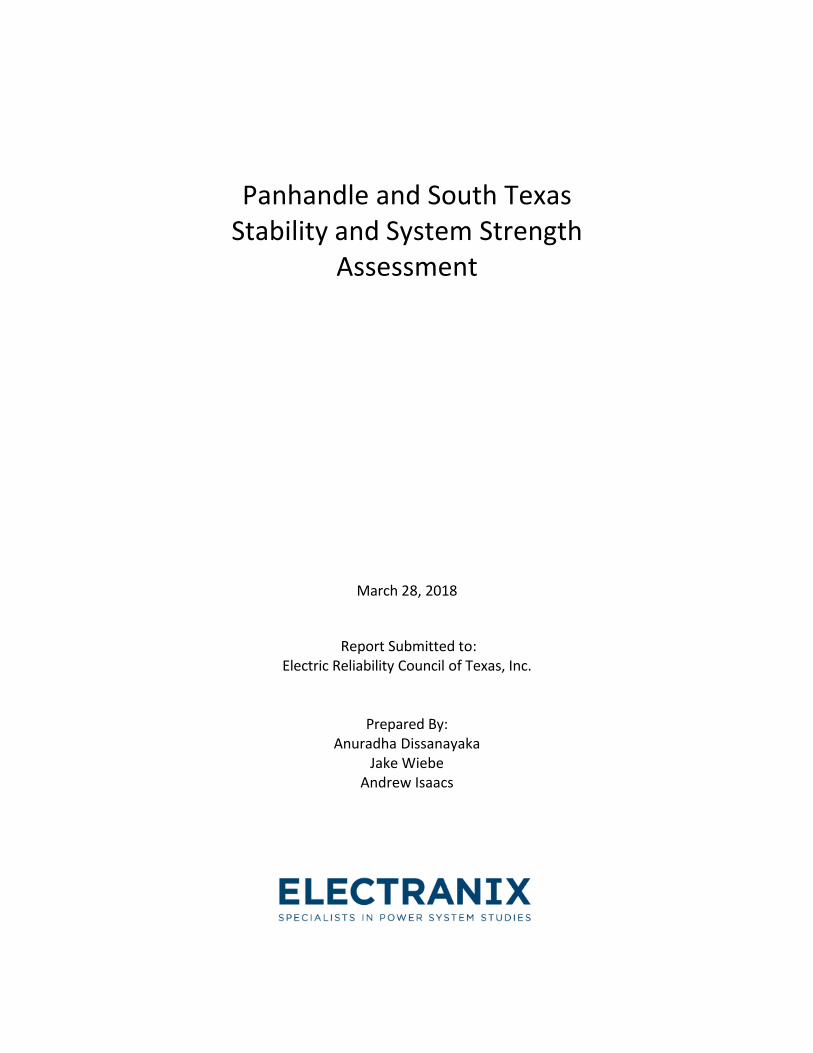
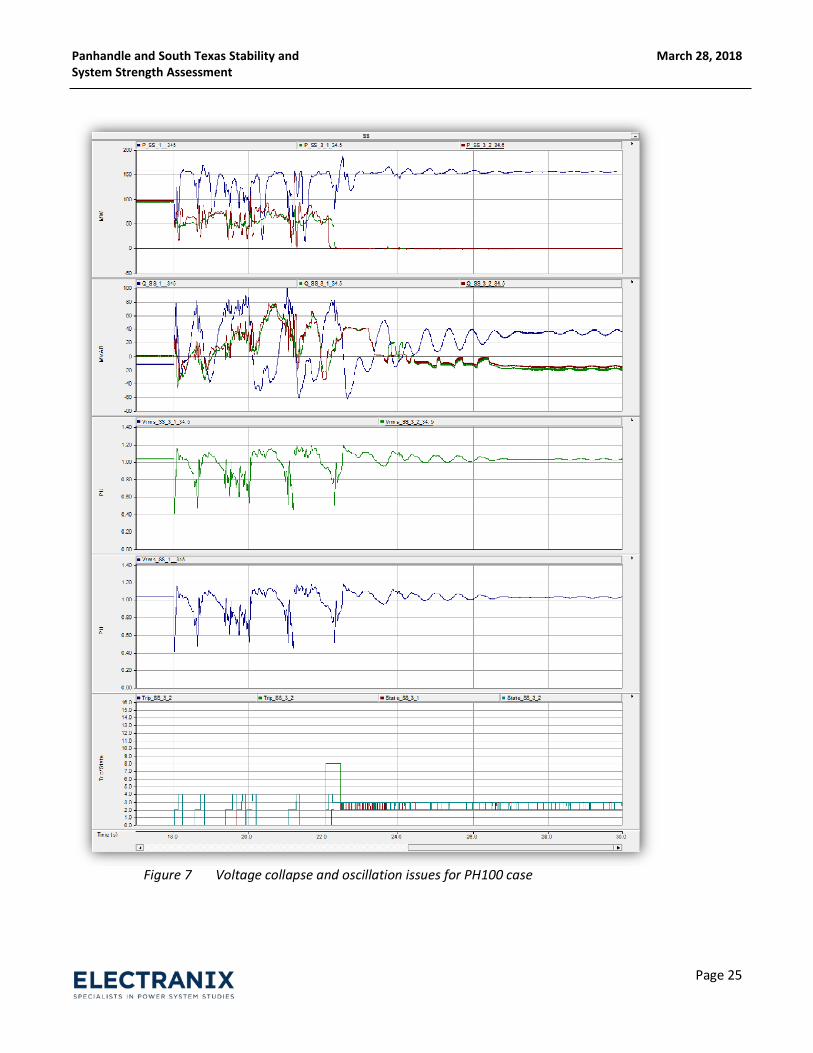
3.2.2 Low system strength issues and voltage collapse Voltage collapse coupled with system wide oscillations were identified for the PH100 case as shown in Figure 7. These same issues were identified in the PH61TC case (Tule Canyon substation outage case). The system does not have enough voltage support or system strength under the studied outage condition or for the 100% generation case.
3.2.3 Instantaneous trip just after the fault Wind plant tripping was observed for several faults in the PH70 case. These tripping events are mainly due to Temporary Over Voltage (TOV) conditions just after the fault clears and subsequent internal DC overvoltage and over current issues. This tripping does not have system wide impact. Careful tuning of control parameters on a plant-by-plant basis could be effective in improving voltage controller response and avoiding plant tripping.
March 28, 2018 Panhandle and South Texas Stability and System Strength Assessment
Page 25
Figure 7 Voltage collapse and oscillation issues for PH100 case
March 28, 2018 Panhandle and South Texas Stability and System Strength Assessment
Page 26
4.0 Dynamic Performance Studies (South Texas)
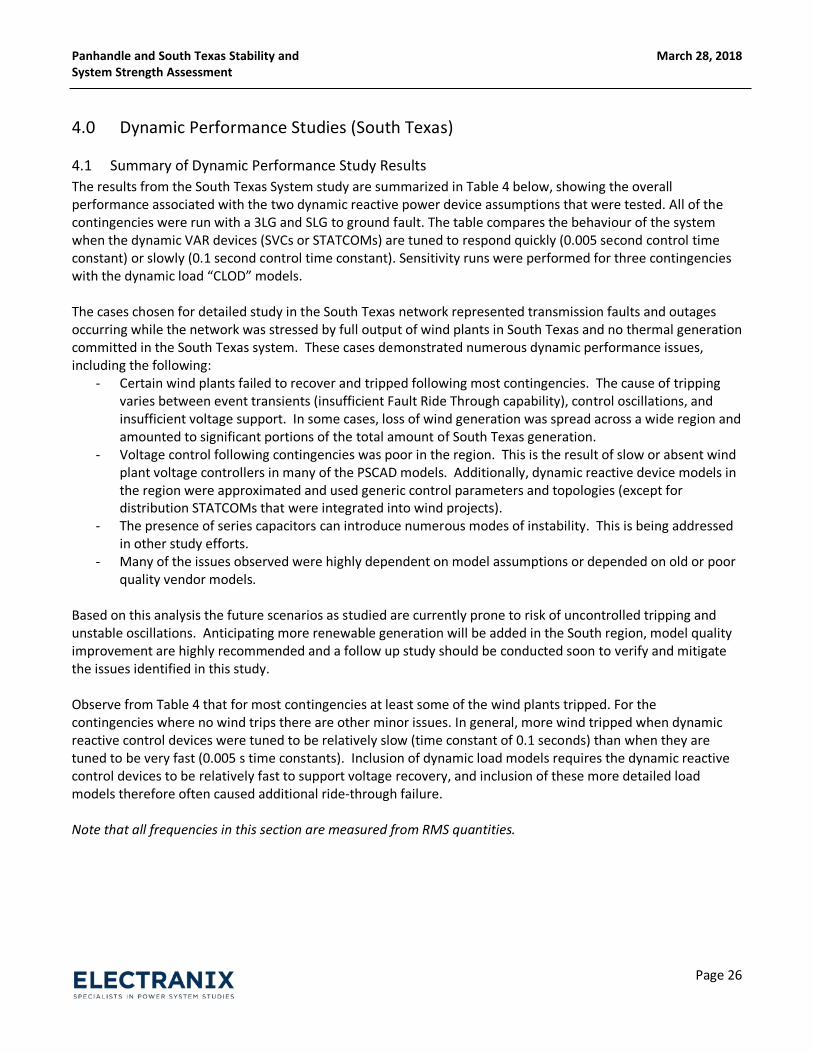
4.1 Summary of Dynamic Performance Study Results The results from the South Texas System study are summarized in Table 4 below, showing the overall performance associated with the two dynamic reactive power device assumptions that were tested. All of the contingencies were run with a 3LG and SLG to ground fault. The table compares the behaviour of the system when the dynamic VAR devices (SVCs or STATCOMs) are tuned to respond quickly (0.005 second control time constant) or slowly (0.1 second control time constant). Sensitivity runs were performed for three contingencies with the dynamic load “CLOD” models.
The cases chosen for detailed study in the South Texas network represented transmission faults and outages occurring while the network was stressed by full output of wind plants in South Texas and no thermal generation committed in the South Texas system. These cases demonstrated numerous dynamic performance issues, including the following:
- Certain wind plants failed to recover and tripped following most contingencies. The cause of trippingvaries between event transients (insufficient Fault Ride Through capability), control oscillations, andinsufficient voltage support. In some cases, loss of wind generation was spread across a wide region andamounted to significant portions of the total amount of South Texas generation.
- Voltage control following contingencies was poor in the region. This is the result of slow or absent windplant voltage controllers in many of the PSCAD models. Additionally, dynamic reactive device models inthe region were approximated and used generic control parameters and topologies (except fordistribution STATCOMs that were integrated into wind projects).
- The presence of series capacitors can introduce numerous modes of instability. This is being addressedin other study efforts.
- Many of the issues observed were highly dependent on model assumptions or depended on old or poorquality vendor models.
Based on this analysis the future scenarios as studied are currently prone to risk of uncontrolled tripping and unstable oscillations. Anticipating more renewable generation will be added in the South region, model quality improvement are highly recommended and a follow up study should be conducted soon to verify and mitigate the issues identified in this study.
Observe from Table 4 that for most contingencies at least some of the wind plants tripped. For the contingencies where no wind trips there are other minor issues. In general, more wind tripped when dynamic reactive control devices were tuned to be relatively slow (time constant of 0.1 seconds) than when they are tuned to be very fast (0.005 s time constants). Inclusion of dynamic load models requires the dynamic reactive control devices to be relatively fast to support voltage recovery, and inclusion of these more detailed load models therefore often caused additional ride-through failure.
Note that all frequencies in this section are measured from RMS quantities.
March 28, 2018 Panhandle and South Texas Stability and System Strength Assessment
Page 27
Table 4 A summary from the analysis of the PSCAD traces.
4.2 Discussion of Dynamic Issues
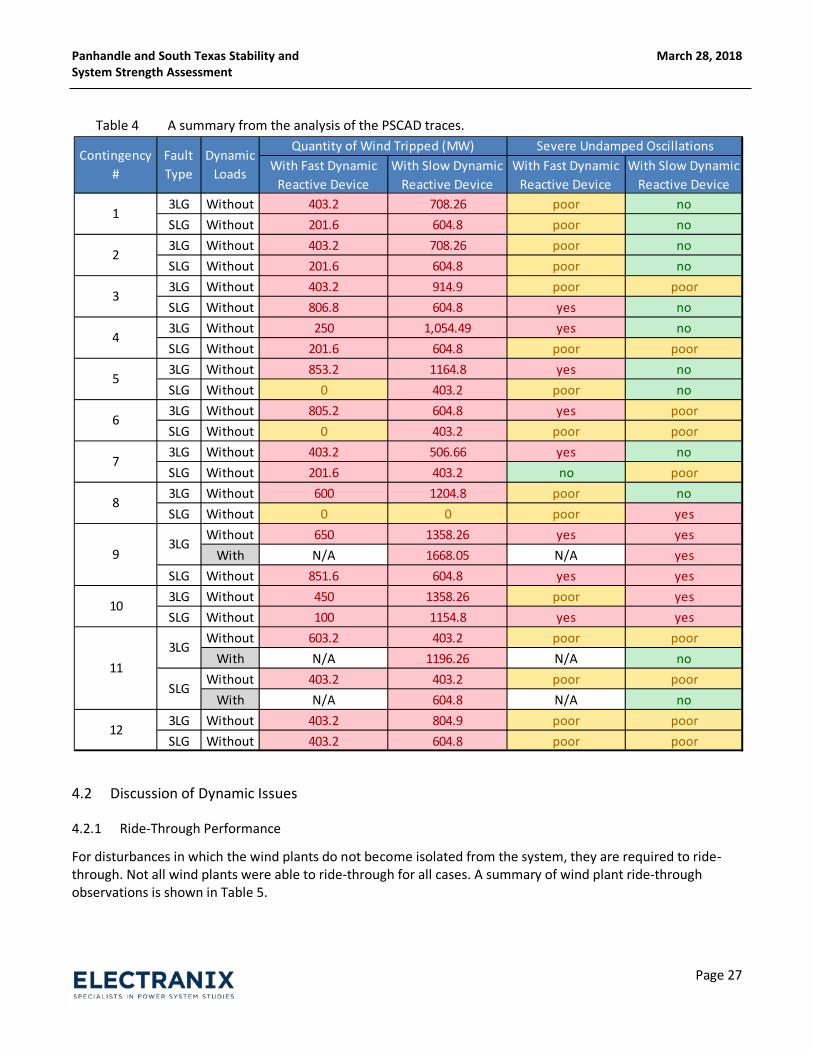
4.2.1 Ride-Through Performance
For disturbances in which the wind plants do not become isolated from the system, they are required to ride-through. Not all wind plants were able to ride-through for all cases. A summary of wind plant ride-through observations is shown in Table 5.
3LG Without 403.2 708.26 poor noSLG Without 201.6 604.8 poor no3LG Without 403.2 708.26 poor noSLG Without 201.6 604.8 poor no3LG Without 403.2 914.9 poor poorSLG Without 806.8 604.8 yes no3LG Without 250 1,054.49 yes noSLG Without 201.6 604.8 poor poor3LG Without 853.2 1164.8 yes noSLG Without 0 403.2 poor no3LG Without 805.2 604.8 yes poorSLG Without 0 403.2 poor poor3LG Without 403.2 506.66 yes noSLG Without 201.6 403.2 no poor3LG Without 600 1204.8 poor noSLG Without 0 0 poor yes
Without 650 1358.26 yes yesWith N/A 1668.05 N/A yes
SLG Without 851.6 604.8 yes yes3LG Without 450 1358.26 poor yesSLG Without 100 1154.8 yes yes
Without 603.2 403.2 poor poorWith N/A 1196.26 N/A no
Without 403.2 403.2 poor poorWith N/A 604.8 N/A no
3LG Without 403.2 804.9 poor poorSLG Without 403.2 604.8 poor poor
12
4
5
6
7
8
93LG
113LG
SLG
With Fast Dynamic Reactive Device
10
1
2
3
Contingency #
Fault Type
Dynamic Loads With Slow Dynamic
Reactive DeviceWith Fast Dynamic
Reactive DeviceWith Slow Dynamic
Reactive Device
Quantity of Wind Tripped (MW) Severe Undamped Oscillations
March 28, 2018 Panhandle and South Texas Stability and System Strength Assessment
Page 28
Table 5 Summary of wind plant ride-through observations with the fast dynamic reactive devices.
4.2.2 Oscillations due to tuning of generic dynamic reactive device models
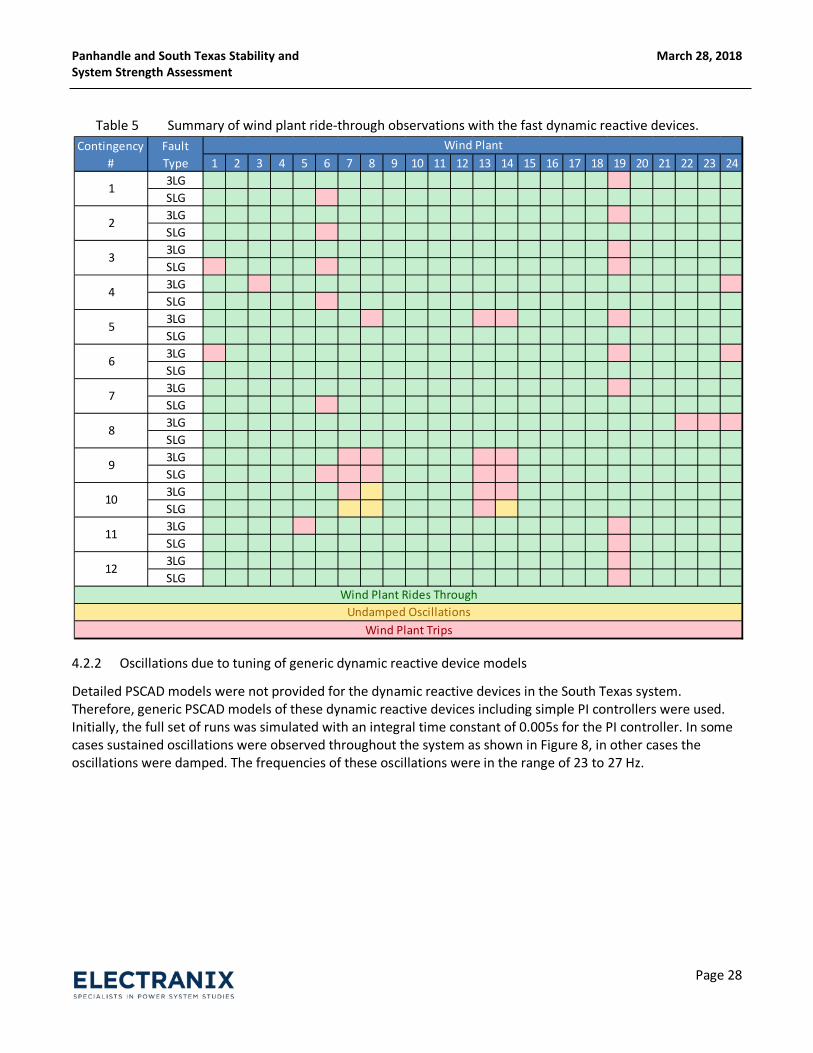
Detailed PSCAD models were not provided for the dynamic reactive devices in the South Texas system. Therefore, generic PSCAD models of these dynamic reactive devices including simple PI controllers were used. Initially, the full set of runs was simulated with an integral time constant of 0.005s for the PI controller. In some cases sustained oscillations were observed throughout the system as shown in Figure 8, in other cases the oscillations were damped. The frequencies of these oscillations were in the range of 23 to 27 Hz.
1 2 3 4 5 6 7 8 9 10 11 12 13 14 15 16 17 18 19 20 21 22 23 243LGSLG3LGSLG3LGSLG3LGSLG3LGSLG3LGSLG3LGSLG3LGSLG3LGSLG3LGSLG3LGSLG3LGSLG
Contingency #
Fault Type
Wind Plant
1
2
3
4
5
6
7
Wind Plant Rides ThroughUndamped Oscillations
Wind Plant Trips
8
9
10
11
12
March 28, 2018 Panhandle and South Texas Stability and System Strength Assessment
Page 29
Figure 8 PSCAD traces showing the sustained oscillations at 27 Hz, with the fast generic dynamic reactive device.
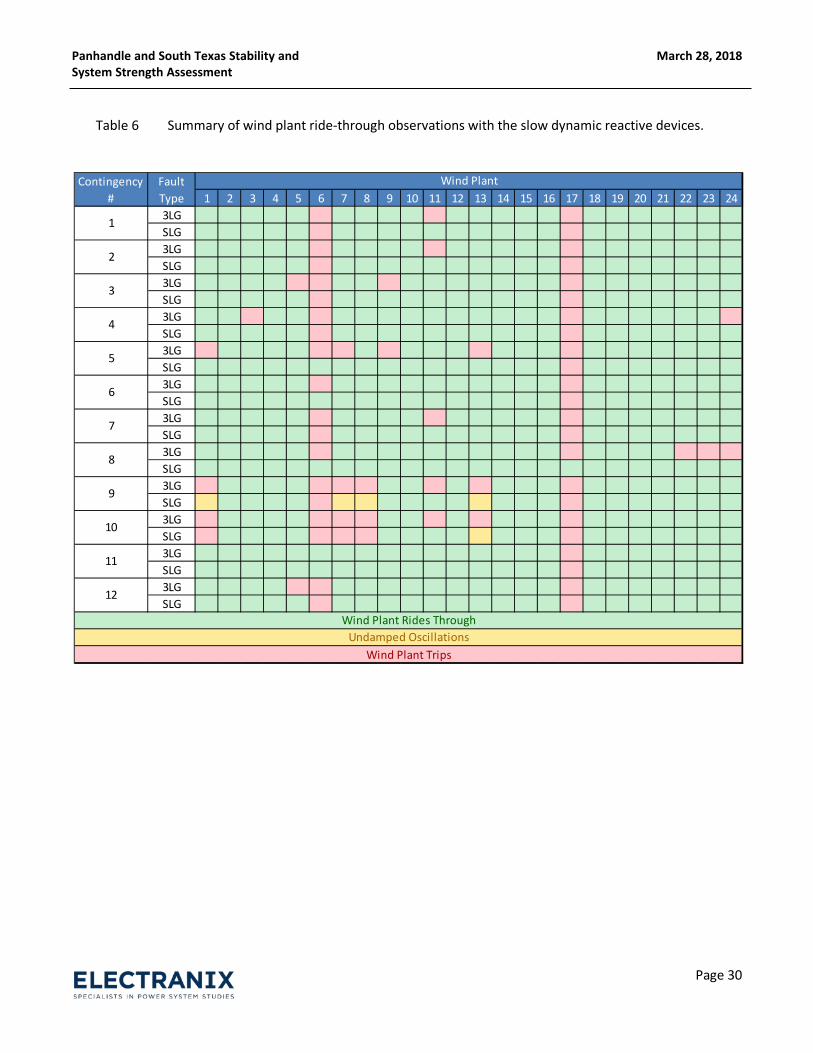
To show that the oscillations were influenced by dynamic reactive device tuning, these devices were slowed down. To do this the integral time constant was reduced for the next set of runs to 0.1s for the PI controller. In addition, a real pole was added to the measurement with a time constant of 0.1 seconds. For this set of runs, there were fewer cases with oscillations. Where observed, the oscillations were measured at 4 Hz as shown in Figure 9. However, since the voltage control with slow dynamic devices is less responsive, more wind plants trip in this set of runs than with the fast dynamic reactive devices (these wind plants trip due to poorly controlled voltage near their terminals). This is evident when comparing Table 5 with Table 6.
March 28, 2018 Panhandle and South Texas Stability and System Strength Assessment
Page 30
Table 6 Summary of wind plant ride-through observations with the slow dynamic reactive devices.
1 2 3 4 5 6 7 8 9 10 11 12 13 14 15 16 17 18 19 20 21 22 23 243LGSLG3LGSLG3LGSLG3LGSLG3LGSLG3LGSLG3LGSLG3LGSLG3LGSLG3LGSLG3LGSLG3LGSLG
Contingency #
Fault Type
Wind Plant
1
2
3
4
5
6
7
Wind Plant Rides ThroughUndamped Oscillations
Wind Plant Trips
8
9
10
11
12
March 28, 2018 Panhandle and South Texas Stability and System Strength Assessment
Page 31
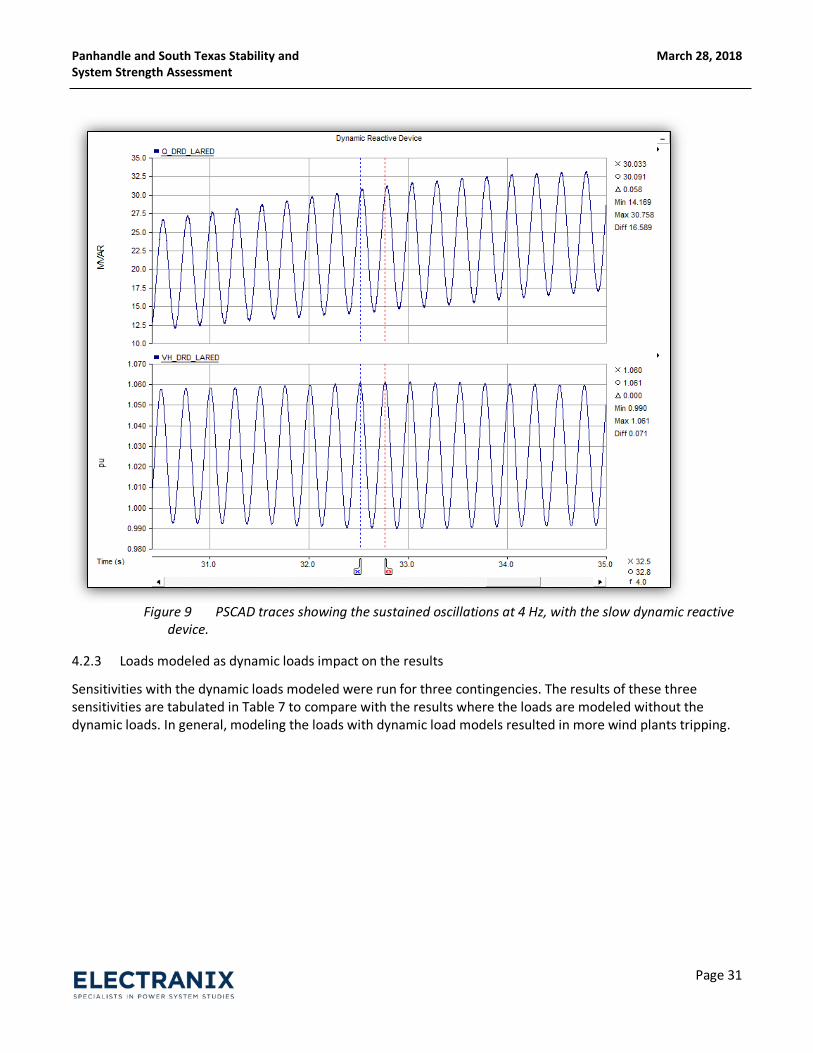
Figure 9 PSCAD traces showing the sustained oscillations at 4 Hz, with the slow dynamic reactive device.
4.2.3 Loads modeled as dynamic loads impact on the results
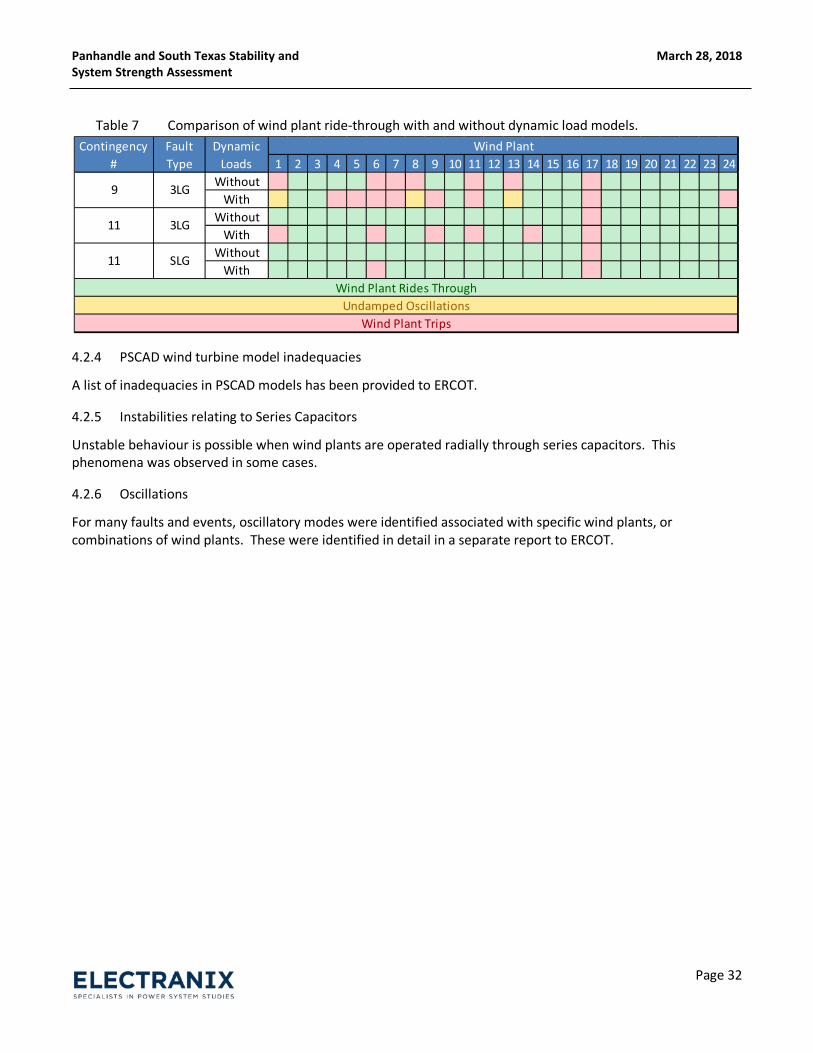
Sensitivities with the dynamic loads modeled were run for three contingencies. The results of these three sensitivities are tabulated in Table 7 to compare with the results where the loads are modeled without the dynamic loads. In general, modeling the loads with dynamic load models resulted in more wind plants tripping.
March 28, 2018 Panhandle and South Texas Stability and System Strength Assessment
Page 32
Table 7 Comparison of wind plant ride-through with and without dynamic load models.
4.2.4 PSCAD wind turbine model inadequacies
A list of inadequacies in PSCAD models has been provided to ERCOT.
4.2.5 Instabilities relating to Series Capacitors
Unstable behaviour is possible when wind plants are operated radially through series capacitors. This phenomena was observed in some cases.
4.2.6 Oscillations
For many faults and events, oscillatory modes were identified associated with specific wind plants, or combinations of wind plants. These were identified in detail in a separate report to ERCOT.
1 2 3 4 5 6 7 8 9 10 11 12 13 14 15 16 17 18 19 20 21 22 23 24Without
WithWithout
WithWithout
With
Contingency #
Fault Type
Dynamic Loads
Wind Plant
9 3LG
Undamped OscillationsWind Plant Trips
11 3LG
11 SLG
Wind Plant Rides Through
March 28, 2018 Panhandle and South Texas Stability and System Strength Assessment
Page 33
5.0 Parametric SCR Reduction Analysis (Panhandle)
5.1 Summary of SCR Reduction Analysis A test system was developed to examine the behavior of the Panhandle system (with no Lubbock connection) by parametrically reducing the short circuit strength (increasing impedance) of the passive network equivalents at the boundary buses (Riley, Clear Crossing, Dermot, Long Draw and Scurry County 345 kV) for the case with no Lubbock connection. The PSCAD model of the Panhandle system (including detailed wind plants) was used for these tests. This analysis was designed to provide a basic screening-level understanding of the stability limits of the Panhandle as the relative strength of the supporting ERCOT network was reduced.
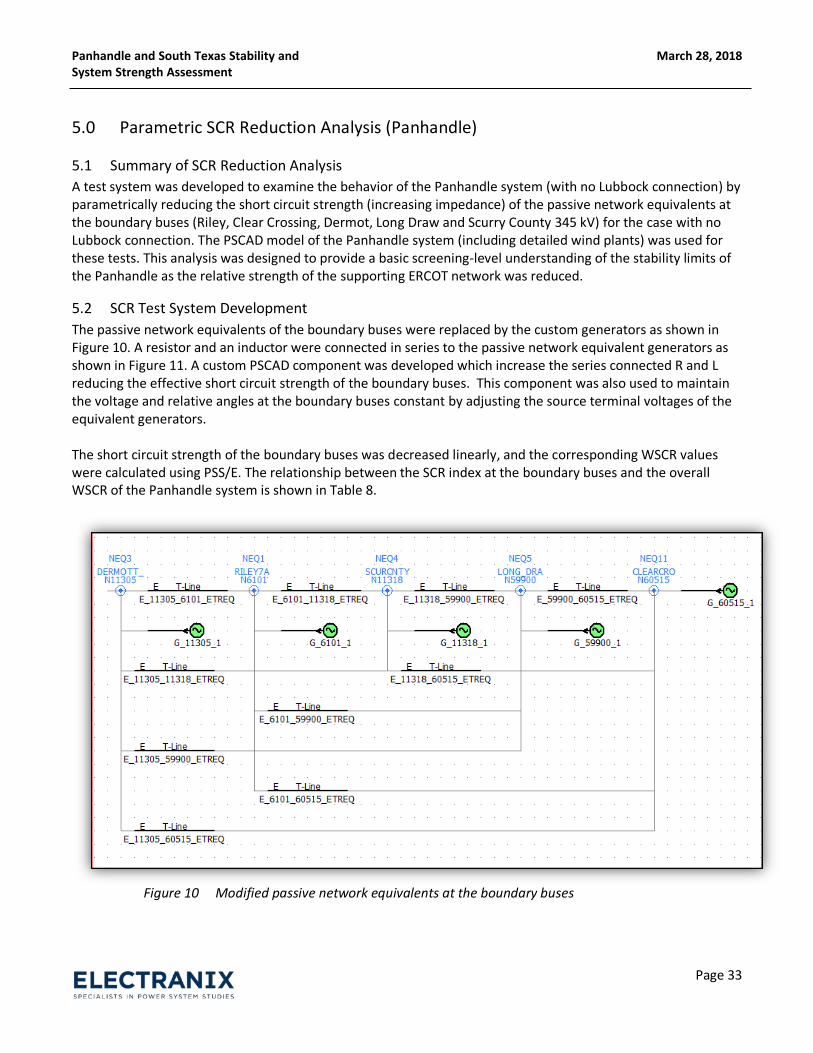
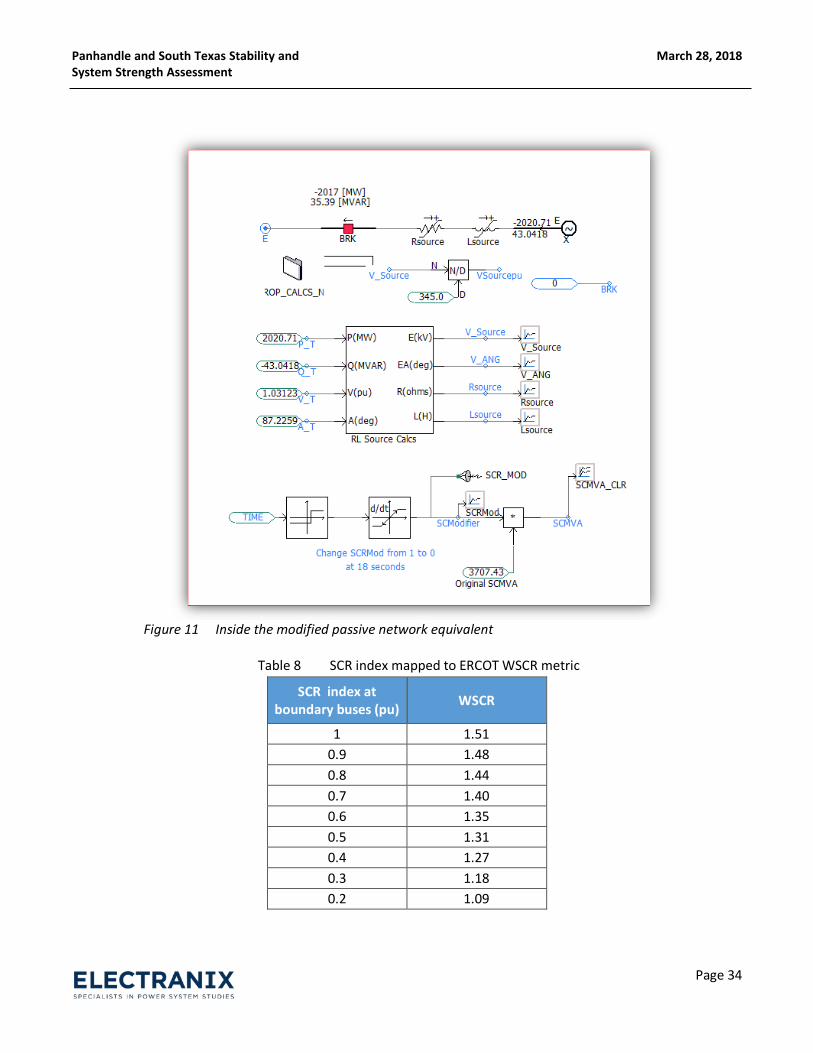
5.2 SCR Test System Development The passive network equivalents of the boundary buses were replaced by the custom generators as shown in Figure 10. A resistor and an inductor were connected in series to the passive network equivalent generators as shown in Figure 11. A custom PSCAD component was developed which increase the series connected R and L reducing the effective short circuit strength of the boundary buses. This component was also used to maintain the voltage and relative angles at the boundary buses constant by adjusting the source terminal voltages of the equivalent generators.
The short circuit strength of the boundary buses was decreased linearly, and the corresponding WSCR values were calculated using PSS/E. The relationship between the SCR index at the boundary buses and the overall WSCR of the Panhandle system is shown in Table 8.
Figure 10 Modified passive network equivalents at the boundary buses
March 28, 2018 Panhandle and South Texas Stability and System Strength Assessment
Page 34
Figure 11 Inside the modified passive network equivalent
Table 8 SCR index mapped to ERCOT WSCR metric
SCR index at boundary buses (pu) WSCR
1 1.51 0.9 1.48 0.8 1.44 0.7 1.40 0.6 1.35 0.5 1.31 0.4 1.27 0.3 1.18 0.2 1.09
March 28, 2018 Panhandle and South Texas Stability and System Strength Assessment
Page 35
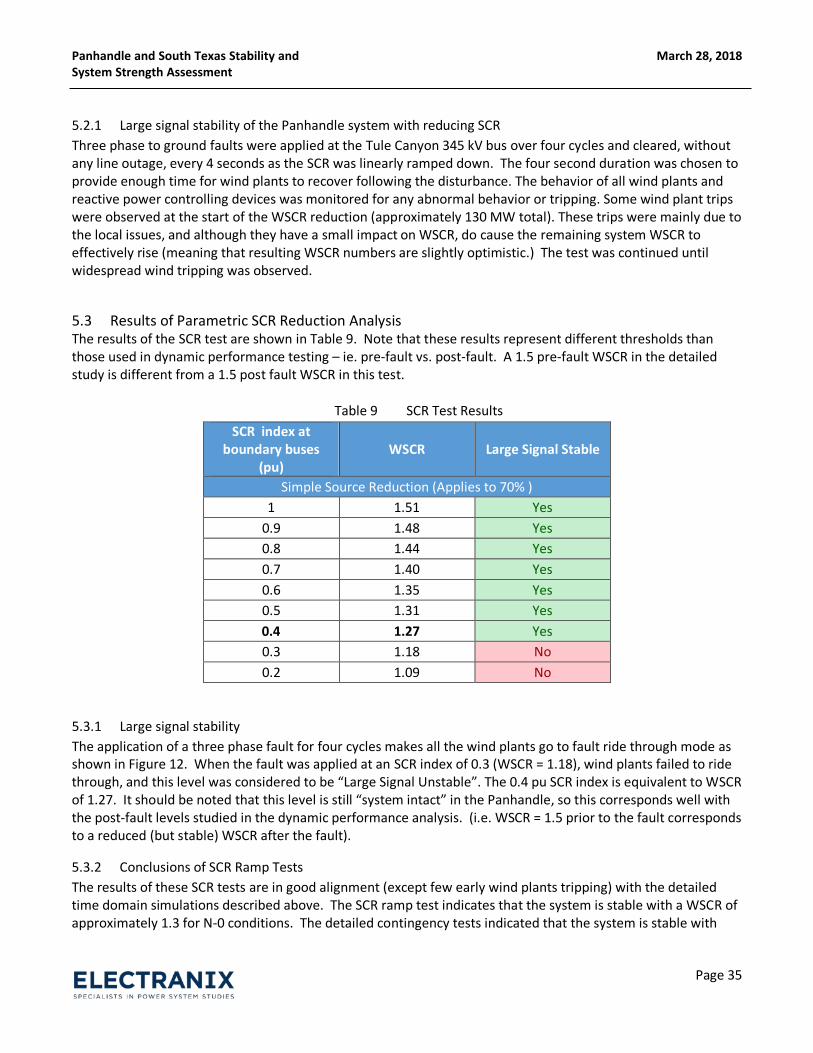
5.2.1 Large signal stability of the Panhandle system with reducing SCR Three phase to ground faults were applied at the Tule Canyon 345 kV bus over four cycles and cleared, without any line outage, every 4 seconds as the SCR was linearly ramped down. The four second duration was chosen to provide enough time for wind plants to recover following the disturbance. The behavior of all wind plants and reactive power controlling devices was monitored for any abnormal behavior or tripping. Some wind plant trips were observed at the start of the WSCR reduction (approximately 130 MW total). These trips were mainly due to the local issues, and although they have a small impact on WSCR, do cause the remaining system WSCR to effectively rise (meaning that resulting WSCR numbers are slightly optimistic.) The test was continued until widespread wind tripping was observed.
5.3 Results of Parametric SCR Reduction Analysis The results of the SCR test are shown in Table 9. Note that these results represent different thresholds than those used in dynamic performance testing – ie. pre-fault vs. post-fault. A 1.5 pre-fault WSCR in the detailed study is different from a 1.5 post fault WSCR in this test.
Table 9 SCR Test Results SCR index at
boundary buses (pu)
WSCR Large Signal Stable
Simple Source Reduction (Applies to 70% ) 1 1.51 Yes
0.9 1.48 Yes 0.8 1.44 Yes 0.7 1.40 Yes 0.6 1.35 Yes 0.5 1.31 Yes 0.4 1.27 Yes 0.3 1.18 No 0.2 1.09 No
5.3.1 Large signal stability The application of a three phase fault for four cycles makes all the wind plants go to fault ride through mode as shown in Figure 12. When the fault was applied at an SCR index of 0.3 (WSCR = 1.18), wind plants failed to ride through, and this level was considered to be “Large Signal Unstable”. The 0.4 pu SCR index is equivalent to WSCR of 1.27. It should be noted that this level is still “system intact” in the Panhandle, so this corresponds well with the post-fault levels studied in the dynamic performance analysis. (i.e. WSCR = 1.5 prior to the fault corresponds to a reduced (but stable) WSCR after the fault).
5.3.2 Conclusions of SCR Ramp Tests The results of these SCR tests are in good alignment (except few early wind plants tripping) with the detailed time domain simulations described above. The SCR ramp test indicates that the system is stable with a WSCR of approximately 1.3 for N-0 conditions. The detailed contingency tests indicated that the system is stable with
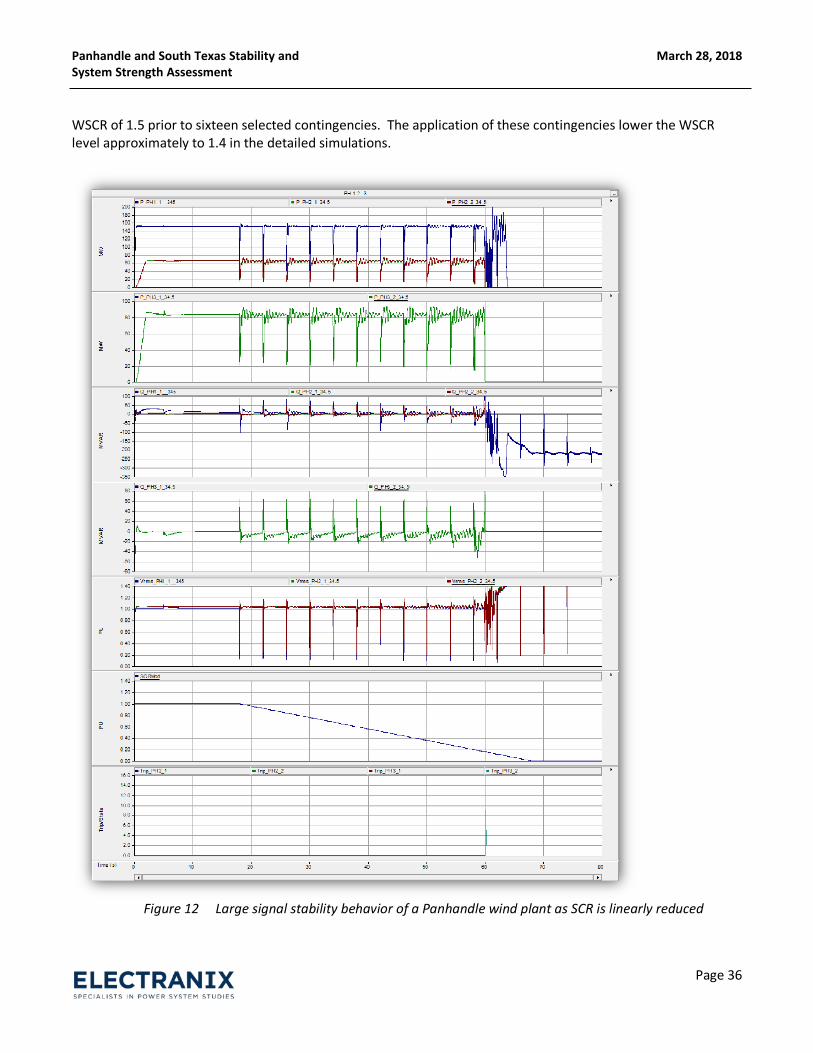
March 28, 2018 Panhandle and South Texas Stability and System Strength Assessment
Page 36
WSCR of 1.5 prior to sixteen selected contingencies. The application of these contingencies lower the WSCR level approximately to 1.4 in the detailed simulations.
Figure 12 Large signal stability behavior of a Panhandle wind plant as SCR is linearly reduced

March 28, 2018 Panhandle and South Texas Stability and System Strength Assessment
Page 37
6.0 Parametric SCR Reduction Analysis (South Texas) A detailed WSCR parametric ramp test was also performed in the South System, similar to that in the Panhandle, but is not reported here in detail. This system examined the behavior of the South Texas System by parametrically reducing the short circuit strength (increasing impedance) of the passive network equivalents at the boundary buses (MIGUEL5, LONHILL7A, NLARSW4A, LON_HILL4A, and ALAZAN4A 345/138 kV). The PSCAD model of the South Texas System (including detailed wind plants) was used for these tests. This analysis was designed to provide a basic screening-level understanding of the stability limits of the South Texas system as the relative strength of the supporting ERCOT network was reduced.
6.1 Summary of WSCR Reductions Analysis It was determined that the WSCR metric has several limitations when applied in a region such as the South System, including:
- Susceptibility to variations in load- Difficulty in defining boundaries for WSCR calculations as the wind generation disperses over a large
area.- Uncertainty in simulation due to poor model quality- Presence of series capacitors present complicating technical challenges
These limitations were evident in both the detailed study and in the parametric ramp tests. For the current time, it is not recommended to use WSCR in defining real-time operating limits for the South Texas System. These limits should be set using conventional transient stability and voltage stability analysis tools, and checked periodically using detailed EMT simulation tools.