Embed Size (px)
Citation preview
EVOLVING SHEAR STRENGTH, STABILITY AND SNOWPACK PROPERTIES IN STORM SNOW Catherine Brown1* and Bruce Jamieson1, 2
1Dept. of Geology and Geophysics, University of Calgary 2Dept. of Civil Engineering, University of Calgary
ABSTRACT: There is a lack of measurements on the rapidly changing mechanical and physical properties of non-persistent instabilities in storm snow. Given the importance of these weak layers in creating snowpack instabilities on which natural avalanches can release, there is a need to better understand and quantify the evolution of layer properties. After identifying unstable layers with a tilt-board test, we measured changes in layer shear strength over time with a shear frame test. We performed up to 13 sets of 12 shear frame test arrays for seven separate storm snow weak layers at the Mt. Fidelity study plot in the Columbia Mountains of British Columbia, Canada. This resulted in over 430 shear frame tests, with sampling up to twice daily, in the winter of 2006. Snowpack properties, including overlying load, densities, temperature gradient and crystal types, of the weak layer and adjacent layers were measured, along with ambient weather conditions. Observations show higher density layers with smaller crystals above and below the weak layer, and weak layers tended to have a lower density and consist of large, precipitation particles. We measured an average rate of strengthening in non-persistent layer of 143 Pa/d. Results indicate a strong correlation between strengthening in weak layers and the stress induced by overlying load. Keywords: non-persistent weak layers, storm snow, shear strength, stability indices 1. INTRODUCTION
Natural (spontaneous) avalanches often release on storm snow instabilities in the upper portion of the snowpack. These instabilities are non-persistent weak layers that can stabilize within a few days of deposition and tend to not show any long-term avalanche activity. These layers are of concern to avalanche forecasters primarily during the storm cycle in which they were deposited. The rapid evolution of these storm snow weak layers may be due to factors such as initial snow crystal type (precipitation particles) and density, and pressure from additional loading by precipitated or wind-deposited snow. Natural avalanches tend to be of concern for avalanche forecasters protecting infrastructure, such as transportation corridors and communities; human-triggered avalanches, often releasing on non-persistent weak layers, are the main concern for backcountry recreationists (Jamieson and Geldsetzer, 1996). Persistent weak layers of depth hoar, surface hoar and faceted crystals can take weeks to months to stabilize and in some cases layers formed in early winter are of concern for the reminder of the avalanche season.
The shear strength of a weak layer relates
to the stability of the overlying slab (McClung and Schaerer, 1993) and thus some forecasting programs concerned with natural avalanche releases use this strength measurement along with a measure of the overburden stress, or overlying load, as a predictive tool for slab stability in nearby avalanche start zones (e.g. Schleiss and Schleiss, 1970). A measure of shear strength from a shear frame test may not be available to forecasters, due to factors like availability of staff and access to start zones or representative study plots. Therefore a method of estimating the shear strength from snowpack and weather conditions would be advantageous for daily avalanche forecasting.
Measurement of shear strength and snowpack properties in non-persistent weak layers requires a different approach to sampling than methods applied in the past to persistent weak layers (Zeidler, 2004). In an attempt to develop a model to forecast storm snow avalanches, Zeidler (2004) recognized that there is a need for a better data set to characterize the strength changes in these layers. Zeidler suggests observations that capture the stabilization of the failure layer, which in this study requires a sampling frequency of multiple times daily during and following storm periods.
Working towards a better understanding of new snow avalanche formation, Schweizer et al. (2003) recognized the importance of increased
*Corresponding author address: Catherine Brown, Dept. of Geology and Geophysics, University of Calgary, 2500 University Dr. NW, Calgary, Alberta, CANADA T2N 1N4. E-mail: [email protected]
knowledge of storm snow slab and interface properties. During the winter of 2006 we performed over 430 measurements of shear strength in seven separate storm snow weak layers and sampled snowpack properties, building a data set that can be utilized to characterize the shear strength changes. In this paper, we relate these results to the characteristics of weak layers and the adjacent snowpack, and report on the factors correlated with the varying rates of shear strength change. 2. METHODS
Shear strength of storm snow weak layers was measured along with weather and snowpack properties to define the characteristics relevant to natural avalanching (Table 1.).
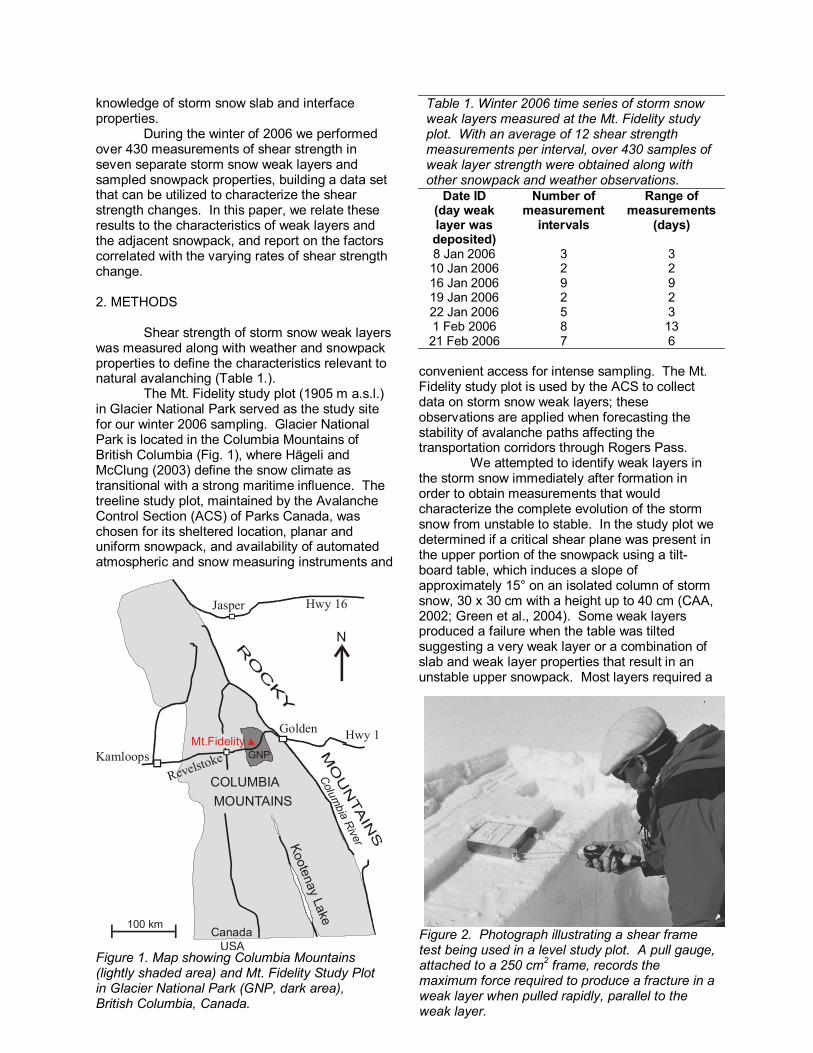
The Mt. Fidelity study plot (1905 m a.s.l.) in Glacier National Park served as the study site for our winter 2006 sampling. Glacier National Park is located in the Columbia Mountains of British Columbia (Fig. 1), where Hägeli and McClung (2003) define the snow climate as transitional with a strong maritime influence. The treeline study plot, maintained by the Avalanche Control Section (ACS) of Parks Canada, was chosen for its sheltered location, planar and uniform snowpack, and availability of automated atmospheric and snow measuring instruments and
convenient access for intense sampling. The Mt. Fidelity study plot is used by the ACS to collect data on storm snow weak layers; these observations are applied when forecasting the stability of avalanche paths affecting the transportation corridors through Rogers Pass.
We attempted to identify weak layers in the storm snow immediately after formation in order to obtain measurements that would characterize the complete evolution of the storm snow from unstable to stable. In the study plot we determined if a critical shear plane was present in the upper portion of the snowpack using a tilt-board table, which induces a slope of approximately 15° on an isolated column of storm snow, 30 x 30 cm with a height up to 40 cm (CAA, 2002; Green et al., 2004). Some weak layers produced a failure when the table was tilted suggesting a very weak layer or a combination of slab and weak layer properties that result in an unstable upper snowpack. Most layers required a
GNPKamloopsRevelstoke
Golden
Columbia River
Jasper
Hwy 1
Hwy 16
Kootenay Lake
N
CanadaUSA
Mt.Fidelity
COLUMBIAMOUNTAINS
100 km
Figure 1. Map showing Columbia Mountains (lightly shaded area) and Mt. Fidelity Study Plot in Glacier National Park (GNP, dark area), British Columbia, Canada.
Table 1. Winter 2006 time series of storm snow weak layers measured at the Mt. Fidelity study plot. With an average of 12 shear strength measurements per interval, over 430 samples of weak layer strength were obtained along with other snowpack and weather observations.
Date ID (day weak layer was deposited)
Number of measurement
intervals
Range of measurements
(days)
8 Jan 2006 3 3 10 Jan 2006 2 2 16 Jan 2006 9 9 19 Jan 2006 2 2 22 Jan 2006 5 3 1 Feb 2006 8 13 21 Feb 2006 7 6
Figure 2. Photograph illustrating a shear frame test being used in a level study plot. A pull gauge, attached to a 250 cm2 frame, records the maximum force required to produce a fracture in a weak layer when pulled rapidly, parallel to the weak layer.
dynamic load to be applied to the underside of the table in order to produce a fracture. We photographed the weak layer and adjacent layers and located the weak layer found during the tilt board test on the snow pit wall.
We used the shear frame test to obtain a measure of shear strength of the weak layers in the snowpack (Fig. 2). We removed the overlying snow, leaving enough to place the shear frame (250 or 100 cm2) parallel with the weak layer and a few millimetres above it (Sommerfeld, 1984). Once in place, the shear frame was immediately pulled with an attached force gauge to produce a brittle fracture within one second. We recorded the maximum force required to produce a fracture with the force gauge, and then calculated the shear strength by dividing the force by the shear frame area and adjusting for the size effect (Sommerfeld, 1980; Föhn, 1987). For this to be a valid measure of shear strength, we assumed that the layer is failing only in shear.
We performed approximately 12 shear frame tests per layer at each observation to obtain an average measure of shear strength. Shear strength and other snowpack characteristics were measured up to two times per day starting immediately after deposition and continuing until clean shears (shear frame test produced a planar shear only in the weak layer) were no longer measurable and the layer was no longer of concern for natural avalanching.
We sampled overlying load with a coring tube (cross-sectional area of 28.3 cm2) inserted vertically from the surface to the depth of the weak layer. We calculated a measure of shear stress or load applied to the weak layer using Eq. (1),
σxz = ρgH (1)
where σxz is the shear stress in the weak layer, ρ is the average density of the overlying snow slab, g is the acceleration due to gravity, and H is the thickness of the slab measured vertically.
We completed a standard snow profile (CAA, 2002) from the snow surface to one layer below the weak layer of interest. In addition to standard profile observations of hand hardness and crystal form of each layer, temperatures 5 cm above and 5 cm below the weak layer were measured to characterize the temperature gradient across the weak layer. Custom built samplers enabled density measurements for layers as thin as 1 cm. We also performed two sets of compression tests with each profile.
3. RESULTS 3.1 Layer density
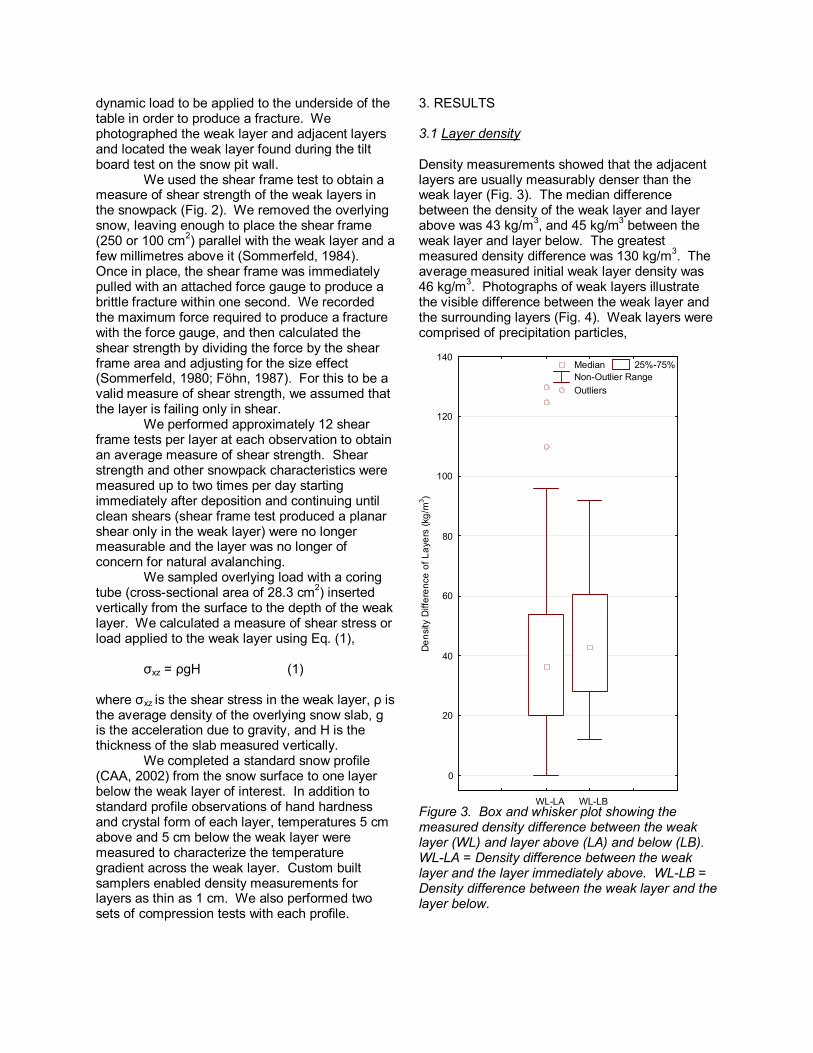
Density measurements showed that the adjacent layers are usually measurably denser than the weak layer (Fig. 3). The median difference between the density of the weak layer and layer above was 43 kg/m3, and 45 kg/m3 between the weak layer and layer below. The greatest measured density difference was 130 kg/m3. The average measured initial weak layer density was 46 kg/m3. Photographs of weak layers illustrate the visible difference between the weak layer and the surrounding layers (Fig. 4). Weak layers were comprised of precipitation particles,
WL-LA WL-LB
0
20
40
60
80
100
120
140
Den
sity
Diff
eren
ceof
Laye
rs(k
g/m
3 )
Median 25%-75% Non-Outlier Range Outliers
Figure 3. Box and whisker plot showing the measured density difference between the weak layer (WL) and layer above (LA) and below (LB). WL-LA = Density difference between the weak layer and the layer immediately above. WL-LB = Density difference between the weak layer and the layer below.
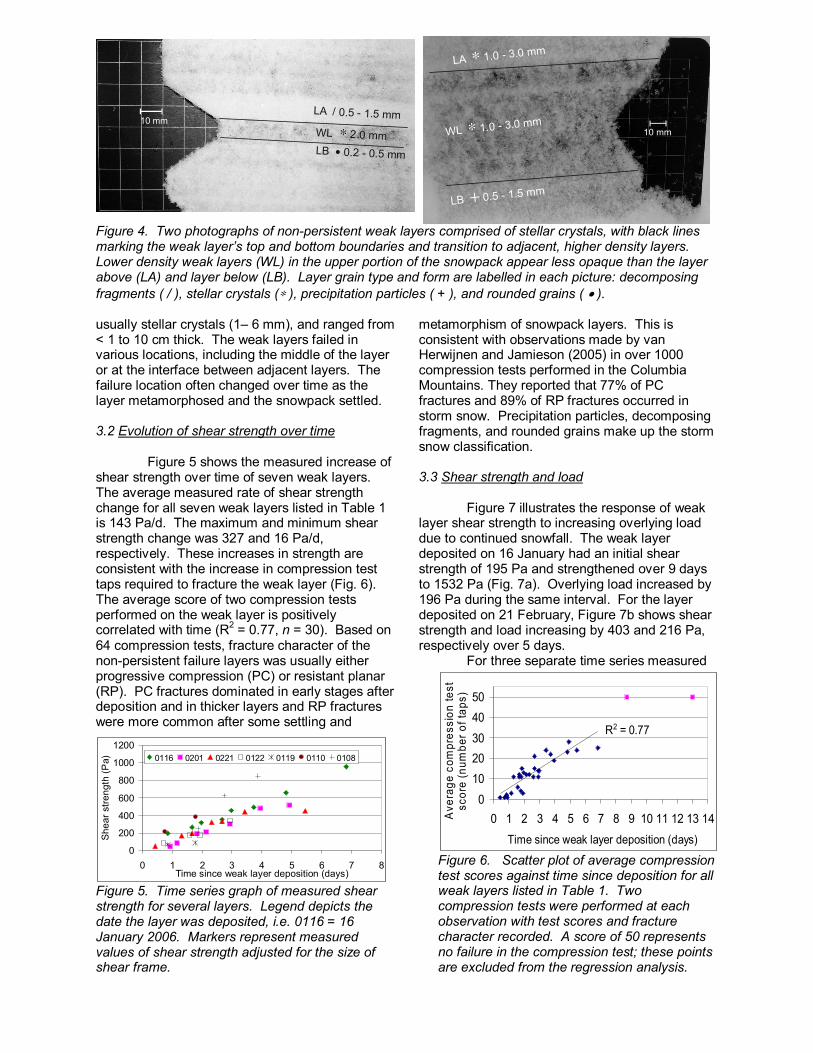
usually stellar crystals (1– 6 mm), and ranged from < 1 to 10 cm thick. The weak layers failed in various locations, including the middle of the layer or at the interface between adjacent layers. The failure location often changed over time as the layer metamorphosed and the snowpack settled. 3.2 Evolution of shear strength over time
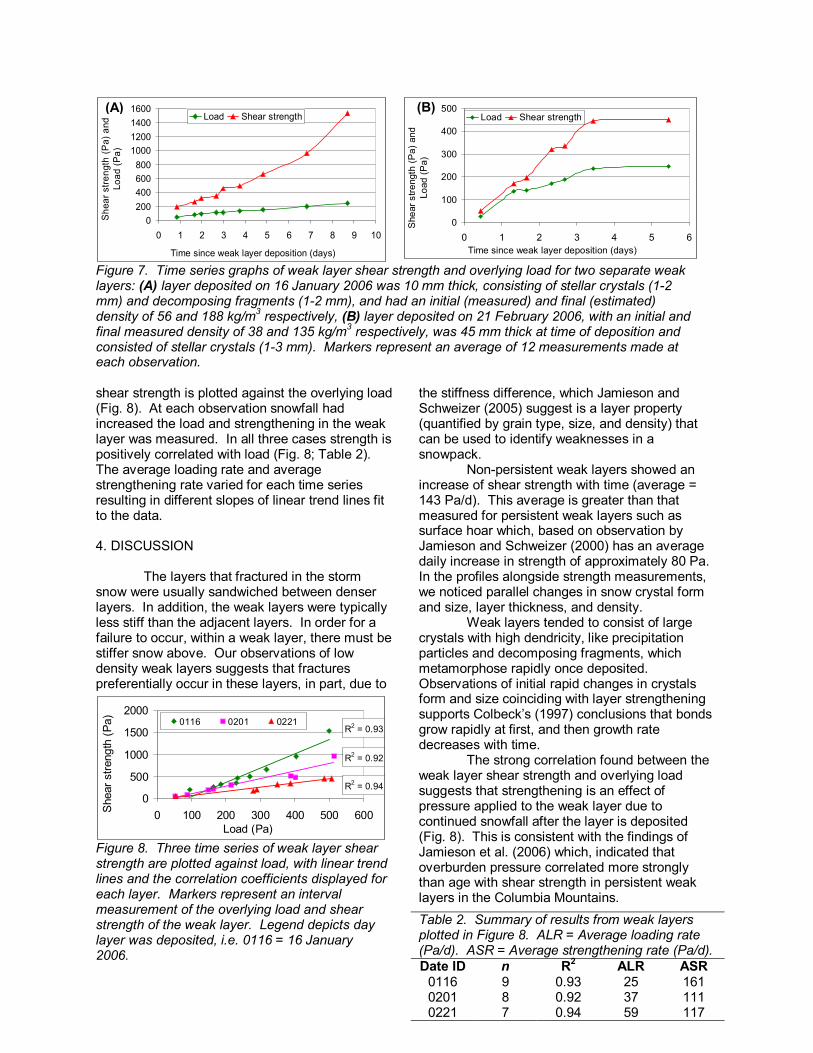
Figure 5 shows the measured increase of shear strength over time of seven weak layers. The average measured rate of shear strength change for all seven weak layers listed in Table 1 is 143 Pa/d. The maximum and minimum shear strength change was 327 and 16 Pa/d, respectively. These increases in strength are consistent with the increase in compression test taps required to fracture the weak layer (Fig. 6). The average score of two compression tests performed on the weak layer is positively correlated with time (R2 = 0.77, n = 30). Based on 64 compression tests, fracture character of the non-persistent failure layers was usually either progressive compression (PC) or resistant planar (RP). PC fractures dominated in early stages after deposition and in thicker layers and RP fractures were more common after some settling and
metamorphism of snowpack layers. This is consistent with observations made by van Herwijnen and Jamieson (2005) in over 1000 compression tests performed in the Columbia Mountains. They reported that 77% of PC fractures and 89% of RP fractures occurred in storm snow. Precipitation particles, decomposing fragments, and rounded grains make up the storm snow classification.
3.3 Shear strength and load
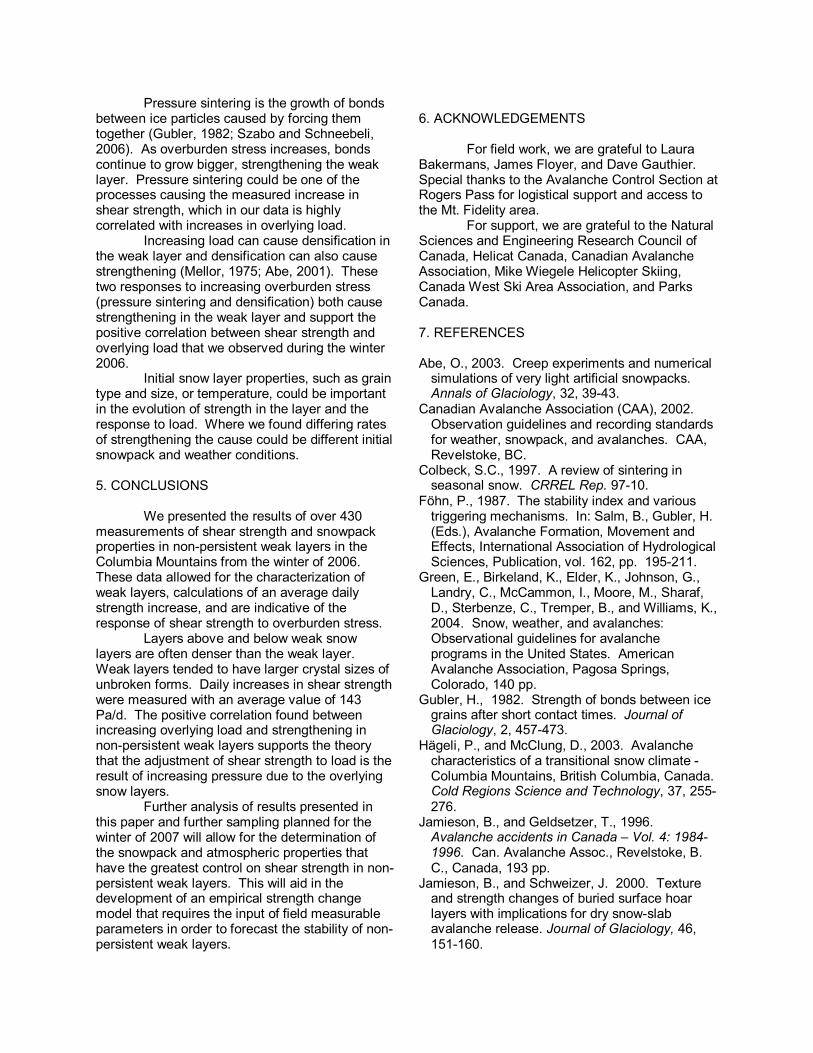
Figure 7 illustrates the response of weak layer shear strength to increasing overlying load due to continued snowfall. The weak layer deposited on 16 January had an initial shear strength of 195 Pa and strengthened over 9 days to 1532 Pa (Fig. 7a). Overlying load increased by 196 Pa during the same interval. For the layer deposited on 21 February, Figure 7b shows shear strength and load increasing by 403 and 216 Pa, respectively over 5 days. For three separate time series measured
10 mm10 mm
LA / 0.5 - 1.5 mmWL 2.0 mm ∗LB 0.2 - 0.5 mm•
LA 1.0 - 3.0 mm∗
WL 1.0 - 3.0 mm∗
LB 0.5 - 1.5 mm+
Figure 4. Two photographs of non-persistent weak layers comprised of stellar crystals, with black lines marking the weak layer’s top and bottom boundaries and transition to adjacent, higher density layers. Lower density weak layers (WL) in the upper portion of the snowpack appear less opaque than the layer above (LA) and layer below (LB). Layer grain type and form are labelled in each picture: decomposing fragments ( / ), stellar crystals (∗ ), precipitation particles ( + ), and rounded grains ( • ).
0
200
400
600
800
1000
1200
0 1 2 3 4 5 6 7 8Time since weak layer deposition (days)
Shea
r stre
ngth
(Pa) 0116 0201 0221 0122 0119 0110 0108
Figure 5. Time series graph of measured shear strength for several layers. Legend depicts the date the layer was deposited, i.e. 0116 = 16 January 2006. Markers represent measured values of shear strength adjusted for the size of shear frame.
R2 = 0.77
01020304050
0 1 2 3 4 5 6 7 8 9 10 11 12 13 14Time since weak layer deposition (days)
Ave
rage
com
pres
sion
test
sc
ore
(num
ber o
f tap
s)
Figure 6. Scatter plot of average compression test scores against time since deposition for all weak layers listed in Table 1. Two compression tests were performed at each observation with test scores and fracture character recorded. A score of 50 represents no failure in the compression test; these points are excluded from the regression analysis.
shear strength is plotted against the overlying load (Fig. 8). At each observation snowfall had increased the load and strengthening in the weak layer was measured. In all three cases strength is positively correlated with load (Fig. 8; Table 2). The average loading rate and average strengthening rate varied for each time series resulting in different slopes of linear trend lines fit to the data. 4. DISCUSSION
The layers that fractured in the storm snow were usually sandwiched between denser layers. In addition, the weak layers were typically less stiff than the adjacent layers. In order for a failure to occur, within a weak layer, there must be stiffer snow above. Our observations of low density weak layers suggests that fractures preferentially occur in these layers, in part, due to
the stiffness difference, which Jamieson and Schweizer (2005) suggest is a layer property (quantified by grain type, size, and density) that can be used to identify weaknesses in a snowpack. Non-persistent weak layers showed an increase of shear strength with time (average = 143 Pa/d). This average is greater than that measured for persistent weak layers such as surface hoar which, based on observation by Jamieson and Schweizer (2000) has an average daily increase in strength of approximately 80 Pa. In the profiles alongside strength measurements, we noticed parallel changes in snow crystal form and size, layer thickness, and density.
Weak layers tended to consist of large crystals with high dendricity, like precipitation particles and decomposing fragments, which metamorphose rapidly once deposited. Observations of initial rapid changes in crystals form and size coinciding with layer strengthening supports Colbeck’s (1997) conclusions that bonds grow rapidly at first, and then growth rate decreases with time. The strong correlation found between the weak layer shear strength and overlying load suggests that strengthening is an effect of pressure applied to the weak layer due to continued snowfall after the layer is deposited (Fig. 8). This is consistent with the findings of Jamieson et al. (2006) which, indicated that overburden pressure correlated more strongly than age with shear strength in persistent weak layers in the Columbia Mountains.
0200400600800
1000120014001600
0 1 2 3 4 5 6 7 8 9 10
Time since weak layer deposition (days)
She
ar s
treng
th (P
a) a
nd
Load
(Pa)
Load Shear strength
0
100
200
300
400
500
0 1 2 3 4 5 6Time since weak layer deposition (days)
She
ar s
treng
th (P
a) a
nd
Load
(Pa)
Load Shear strength
Figure 7. Time series graphs of weak layer shear strength and overlying load for two separate weak layers: (A) layer deposited on 16 January 2006 was 10 mm thick, consisting of stellar crystals (1-2 mm) and decomposing fragments (1-2 mm), and had an initial (measured) and final (estimated) density of 56 and 188 kg/m3 respectively, (B) layer deposited on 21 February 2006, with an initial and final measured density of 38 and 135 kg/m3 respectively, was 45 mm thick at time of deposition and consisted of stellar crystals (1-3 mm). Markers represent an average of 12 measurements made at each observation.
R2 = 0.93
R2 = 0.92
R2 = 0.940
500
1000
1500
2000
0 100 200 300 400 500 600Load (Pa)
She
ar s
treng
th (P
a) 0116 0201 0221
Figure 8. Three time series of weak layer shear strength are plotted against load, with linear trend lines and the correlation coefficients displayed for each layer. Markers represent an interval measurement of the overlying load and shear strength of the weak layer. Legend depicts day layer was deposited, i.e. 0116 = 16 January 2006.
Table 2. Summary of results from weak layers plotted in Figure 8. ALR = Average loading rate (Pa/d). ASR = Average strengthening rate (Pa/d). Date ID n R2 ALR ASR
0116 9 0.93 25 161 0201 8 0.92 37 111 0221 7 0.94 59 117
(A) (B)
Pressure sintering is the growth of bonds between ice particles caused by forcing them together (Gubler, 1982; Szabo and Schneebeli, 2006). As overburden stress increases, bonds continue to grow bigger, strengthening the weak layer. Pressure sintering could be one of the processes causing the measured increase in shear strength, which in our data is highly correlated with increases in overlying load. Increasing load can cause densification in the weak layer and densification can also cause strengthening (Mellor, 1975; Abe, 2001). These two responses to increasing overburden stress (pressure sintering and densification) both cause strengthening in the weak layer and support the positive correlation between shear strength and overlying load that we observed during the winter 2006. Initial snow layer properties, such as grain type and size, or temperature, could be important in the evolution of strength in the layer and the response to load. Where we found differing rates of strengthening the cause could be different initial snowpack and weather conditions. 5. CONCLUSIONS
We presented the results of over 430 measurements of shear strength and snowpack properties in non-persistent weak layers in the Columbia Mountains from the winter of 2006. These data allowed for the characterization of weak layers, calculations of an average daily strength increase, and are indicative of the response of shear strength to overburden stress. Layers above and below weak snow layers are often denser than the weak layer. Weak layers tended to have larger crystal sizes of unbroken forms. Daily increases in shear strength were measured with an average value of 143 Pa/d. The positive correlation found between increasing overlying load and strengthening in non-persistent weak layers supports the theory that the adjustment of shear strength to load is the result of increasing pressure due to the overlying snow layers.
Further analysis of results presented in this paper and further sampling planned for the winter of 2007 will allow for the determination of the snowpack and atmospheric properties that have the greatest control on shear strength in non-persistent weak layers. This will aid in the development of an empirical strength change model that requires the input of field measurable parameters in order to forecast the stability of non-persistent weak layers.
6. ACKNOWLEDGEMENTS
For field work, we are grateful to Laura Bakermans, James Floyer, and Dave Gauthier. Special thanks to the Avalanche Control Section at Rogers Pass for logistical support and access to the Mt. Fidelity area.
For support, we are grateful to the Natural Sciences and Engineering Research Council of Canada, Helicat Canada, Canadian Avalanche Association, Mike Wiegele Helicopter Skiing, Canada West Ski Area Association, and Parks Canada.
7. REFERENCES Abe, O., 2003. Creep experiments and numerical
simulations of very light artificial snowpacks. Annals of Glaciology, 32, 39-43.
Canadian Avalanche Association (CAA), 2002. Observation guidelines and recording standards for weather, snowpack, and avalanches. CAA, Revelstoke, BC.
Colbeck, S.C., 1997. A review of sintering in seasonal snow. CRREL Rep. 97-10.
Föhn, P., 1987. The stability index and various triggering mechanisms. In: Salm, B., Gubler, H. (Eds.), Avalanche Formation, Movement and Effects, International Association of Hydrological Sciences, Publication, vol. 162, pp. 195-211.
Green, E., Birkeland, K., Elder, K., Johnson, G., Landry, C., McCammon, I., Moore, M., Sharaf, D., Sterbenze, C., Tremper, B., and Williams, K., 2004. Snow, weather, and avalanches: Observational guidelines for avalanche programs in the United States. American Avalanche Association, Pagosa Springs, Colorado, 140 pp.
Gubler, H., 1982. Strength of bonds between ice grains after short contact times. Journal of Glaciology, 2, 457-473.
Hägeli, P., and McClung, D., 2003. Avalanche characteristics of a transitional snow climate - Columbia Mountains, British Columbia, Canada. Cold Regions Science and Technology, 37, 255-276.
Jamieson, B., and Geldsetzer, T., 1996. Avalanche accidents in Canada – Vol. 4: 1984-1996. Can. Avalanche Assoc., Revelstoke, B. C., Canada, 193 pp.
Jamieson, B., and Schweizer, J. 2000. Texture and strength changes of buried surface hoar layers with implications for dry snow-slab avalanche release. Journal of Glaciology, 46, 151-160.
Jamieson, B., and Schweizer, J., 2005. Using a checklist to assess manual snow profiles. (yellow flags) Avalanche News 72, Canadian Avalanche Association, Revelstoke, BC., 57-61.
Jamieson, B., Zeidler, A., and Brown, C., 2006. Spatial extrapolation of slab stability indices for snow avalanche forecasting. European Geosciences Union General Assembly, 2-7 April 2006 in Vienna. Natural Hazards Section NH7.02: Snow avalanche formation, avalanche dynamics and risk assessment. Geophysical Research Abstracts, Vol. 8, 09663.
McClung, D., and Schaerer, P., 1993. The Avalanche Handbook. The Mountaineers, Seattle, Wash., 271 pp.
Mellor, M., 1975. A review of basic snow mechanics. Snow Mechanics Symposium, Proceedings of the Grindelwald Symposium, April, 1974, International Association of Hydrological Sciences, Washington, D.C., Pub. No. 114, 1975, 251-291.
Szabo, D., and Schneebeli, M., 2006. Sub-second sintering of ice. Geophysical Research Abstracts 8, 06327.
Schleiss, V., and Schleiss, W., 1970. Avalanche hazard evaluation and forecast, Rogers Pass, Glacier National Park. In: Ice Engineering and Avalanche Hazard Forecasting and Control, National Research Council of Canada, Technical Memorandum 98, 115-121,
Schweizer, J., Jamieson, B., and Schneebeli, M., 2003. Snow avalanche formation. Reviews of Geophysics, 41, 1016.
Sommerfeld, R., 1980. Statistical models of snow strength. Journal of Glaciology, 26, 217-223.
Sommerfeld, R., 1984. Instructions for using the 250 cm2 shear frame to evaluate the strength of a buried snow surface. USDA Forest Service Research Note RM-446, pp.1-6.
van Herwijnen, A.F.G., and Jamieson, B., 2005. Fracture character in compression tests. Proceedings of the 2004 International Snow Science Workshop in Jackson Hole, Wyoming. USDA Forest Service, Fort Collins, CO, 182-191.
Zeidler, A., 2004. Forecasting skier-triggered avalanches in the Columbia Mountains of Canada. PhD thesis. Dept. of Civil Engineering, University of Calgary, 264pp.


![Weekly Report Drought Monitor / Snowpack Update€¦ · Weekly Report - Snowpack / Drought Monitor Update Date: 29 December 2011 [End of Year Edition] SNOTEL SNOWPACK AND PRECIPITATION](https://img.pdfslide.us/doc/110x75/5f14161a6565b54157769b36/weekly-report-drought-monitor-snowpack-update-weekly-report-snowpack-drought.jpg)