Embed Size (px)
Citation preview

Hydrological and Environmental Engineering
Pakenham East Precinct Structure Plan
Deep Creek Corridor Proposals
5 October 2014
Report by: Valerie Mag BE Civil (Hons), M Eng Sci
Stormy Water Solutions
Ph 9511 5911, M 0412 436 021
Contents
1. INTRODUCTION ......................................................................................................................... 1
2. CURRENT PSP PROPOSALS IN RELATION TO DEEP CREEK ........................................ 2
3. HYDROLOGICAL MODELLING - DEEP CREEK ................................................................ 3
4. HEC RAS MODELLING - EXISTING CONDITIONS ............................................................ 5
4.1 DEEP CREEK RETARDING BASIN TO RYAN ROAD .................................................................... 5
4.2 EXISTING RYAN ROAD CULVERT SYSTEM ............................................................................... 8
4.3 RYAN ROAD TO PRINCES HIGHWAY ........................................................................................ 9
4.4 EXISTING PRINCES HIGHWAY CULVERT SYSTEM .................................................................. 11
4.5 UPSTREAM OF PRINCES HIGHWAY ......................................................................................... 11
5. DEEP CREEK CORRIDOR PSP IMPLICATIONS ............................................................... 16
6. HEC RAS MODELLING - INCORPORATING DEEP CREEK CORRIDOR WORKS .... 20
6.1 DEEP CREEK RETARDING BASIN TO RYAN ROAD .................................................................. 20
6.2 UPGRADED RYAN ROAD CULVERT SYSTEM .......................................................................... 20
6.3 RYAN ROAD TO PRINCES HIGHWAY ...................................................................................... 21
6.4 EXISTING PRINCES HIGHWAY CULVERT SYSTEM .................................................................. 22
6.5 UPSTREAM OF PRINCES HIGHWAY ......................................................................................... 22
7. CONCLUSIONS AND FURTHER WORK REQUIRED ........................................................ 23
APPENDIX A RORB MODEL CONTROL VECTOR .............................................................. 24
APPENDIX B - RYAN ROAD CULVERT ANALYSIS (EXISTING CONDITIONS) ................ 25
APPENDIX C – PRINCES HIGHWAY CULVERT ANALYSIS (EXISTING CONDITIONS) . 27
APPENDIX D - RYAN ROAD CULVERT ANALYSIS (FUTURE CONDITIONS) .................... 29
1
1. Introduction
In March 2013, Stormy Water Solutions produced a report entitled “Pakenham East Precinct
Structure Plan, Proposed Drainage Strategy, Draft Report”. This 2013 report considered the
major drainage, flooding and water quality management issues within the Pakenham East
Precinct Structure Plan (PSP) area to define potential land take requirements required by
major drainage assets.
As part of the 2013 work Stormy Water Solutions developed various strategy options for
consideration. In this way, council could incorporate various scenarios in relation to drainage
requirements and ultimately adopt a PSP formulation which optimises all PSP objectives, not
just the drainage requirements.
Melbourne Water Corporation (MWC) subsequently commented on the draft report and
options. Of particular concern was the corridor proposed for Deep Creek. The current PSP
Proposals generally show:
a 50 metre reserve on the west of Deep Creek and a 100 m reserve of the east of
Deep Creek downstream of Princes Highway, and
100 m reserve of the east of Deep Creek upstream of Princes Highway
An assumption that any future development west of Deep Creek upstream of Princes
Highway would require a 50 m reserve to be consistent with the above. However, in
the interim, the UFZ line (which is consistent with the declared flood plain line) could
be assumed.
The two major issues identified by MWC in relation to the Deep Creek Corridor were:
By setting the development line on either side of Deep Creek, as per Councils 2013
proposal, flows will be restricted and future development will be required to be filled to
MWC standards to ensure adequate flood protection. This may result in a small
increase in flood levels, and
The PSP plan did not appear to address the breakaway flow from Deep Creek
towards the south-east, where flows outfall at the Princes Freeway. Melbourne Water
suggested that this could be addressed by either:
a) Upgrading (/ increase the capacity of) Deep Creek downstream of Ryan
Road, including upgrading the bridge; or
b) Set aside land in the FUS plan to allow for breakaway flows to extend down
to the proposed retarding basin at the Princes Freeway.
This report addresses the above two issues to clearly show that the Deep Creek Corridor
proposals are sufficient to allow future works to address the above concerns. This report also
proposals some downstream works (in line with (a) above) to ensure current flood protection
provisions downstream of Ryan Road are not compromised.
2
2. Current PSP Proposals in Relation to Deep Creek
It is proposed to retain Deep Creek and its riparian zone in their current form. However,
ongoing waterway management will occur in line with current and existing ecological and
landscape requirements.
In line with current PSP proposals, the Deep Creek corridor is proposed to incorporate:
a 50 metre reserve on the west of Deep Creek and a 100 m reserve of the east of
Deep Creek downstream of Princes Highway, and
100 m reserve of the east of Deep Creek upstream of Princes Highway
An assumption that any future development west of Deep Creek upstream of Princes
Highway would require a 50 m reserve to be consistent with the above. However, in
the interim, the UFZ line (which is consistent with the declared flood plain line) could
be assumed.
The proposed reserve encompasses the entire Deep creek riparian vegetation and the
existing Deep Creek Road (upstream of the Highway).
Any future development must incorporate filling to required MWC standards adjacent to the
creek to ensure adequate flood protection. At this stage fill requirements are assumed to be
600 mm above the flood levels determined given ultimate reserve requirements. Fill
requirements may vary in the order of between 600 to 1200 mm adjacent to Deep Creek. It is
proposed to grade the fill down to natural surface level over (say) 100 metres, creating, in
effect, a very wide, flat levee adjacent to the creek.
The Deep Creek Princess Highway Culvert has enough capacity to convey the future and
existing 100 Year ARI flow (See Appendix B).
This report expands the above proposals and identifies additional corridor works required to
address the issues highlighted in Section 1 above.
3
3. Hydrological Modelling - Deep Creek
Hydrological Modelling using the RORB model was developed for this study by SWS to
estimate flood flows within Deep Creek. MWC have advised that the flood plain was declared
assuming a 100 Year ARI flow of 43 m3/s. The RORB model was developed to:
Confirm this flow assumption,
Account for flow reductions in upstream reaches, and
Account for catchment development as per PSP proposals.
The analysis below only considers the 100 Year ARI storm events. Consideration of this event
will provide realistic site delineation of the Deep Creek Corridor extent. Appendix A details the
RORB model control vector. As detailed subareas H and I incorporate a fraction impervious of
0.6 to account for future development in these areas (accounting for future council reserves
and the existing UFZ north of Princes highway and west of Deep Creek.
The regional parameter set developed by Melbourne Water for the South East region of
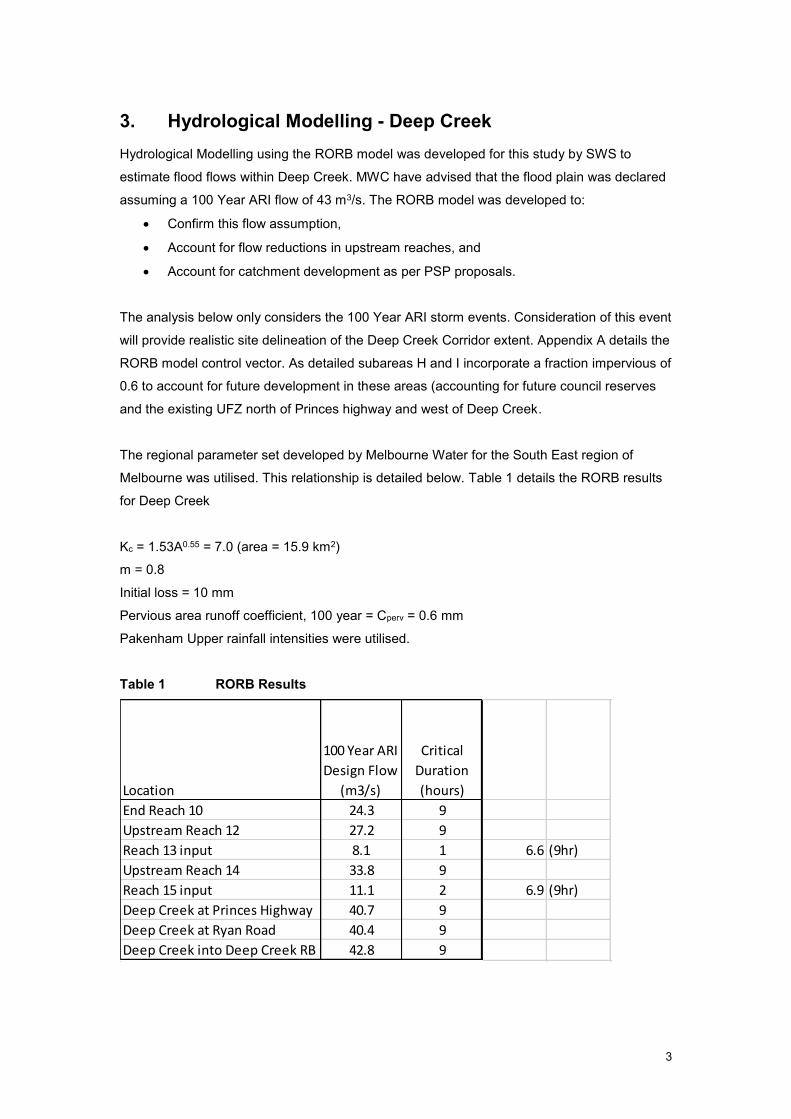
Melbourne was utilised. This relationship is detailed below. Table 1 details the RORB results
for Deep Creek
Kc = 1.53A0.55 = 7.0 (area = 15.9 km2) m = 0.8
Initial loss = 10 mm
Pervious area runoff coefficient, 100 year = Cperv = 0.6 mm
Pakenham Upper rainfall intensities were utilised.
Table 1 RORB Results
Location
100 Year ARI
Design Flow
(m3/s)
Critical
Duration
(hours)
End Reach 10 24.3 9
Upstream Reach 12 27.2 9
Reach 13 input 8.1 1 6.6 (9hr)
Upstream Reach 14 33.8 9
Reach 15 input 11.1 2 6.9 (9hr)
Deep Creek at Princes Highway 40.7 9
Deep Creek at Ryan Road 40.4 9
Deep Creek into Deep Creek RB 42.8 9
4
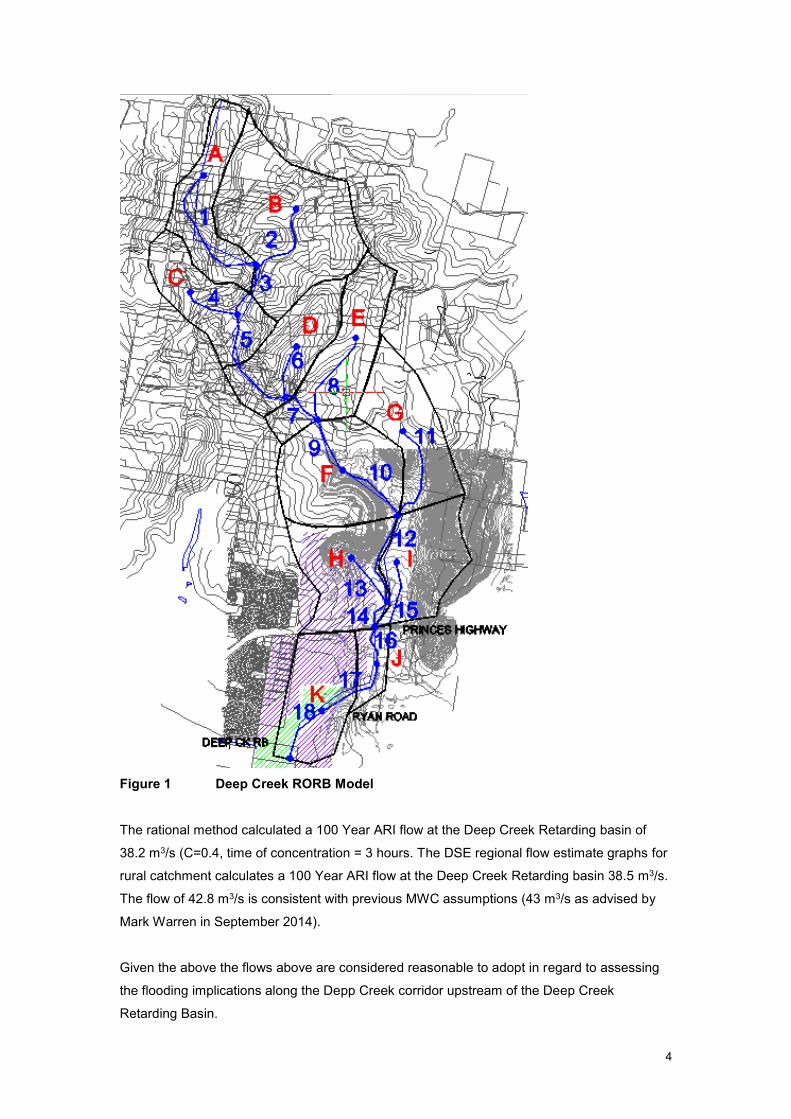
Figure 1 Deep Creek RORB Model
The rational method calculated a 100 Year ARI flow at the Deep Creek Retarding basin of
38.2 m3/s (C=0.4, time of concentration = 3 hours. The DSE regional flow estimate graphs for
rural catchment calculates a 100 Year ARI flow at the Deep Creek Retarding basin 38.5 m3/s.
The flow of 42.8 m3/s is consistent with previous MWC assumptions (43 m3/s as advised by
Mark Warren in September 2014).
Given the above the flows above are considered reasonable to adopt in regard to assessing
the flooding implications along the Depp Creek corridor upstream of the Deep Creek
Retarding Basin.

5
4. Hec Ras Modelling - Existing Conditions
4.1 Deep Creek Retarding Basin to Ryan Road
The Hec Ras model described below was used to assess existing flood levels downstream of
Ryan Road. This was done so that a “base” case could be determined to assess any potential
PSP implications downstream of Ryan Road.
This model was constructed utilising:
The design flow detailed above 43 m3/s,
A starting water level of 23.2 m AHD which is the declared flood level at Section 0),
0.5 metre Lidar information provided by Council,
DVA drawing set 1606/1 which detailed flood mitigation works (1989) downstream of
Ryan Road,
Manning n of 0.05 for flood plain areas associated with paddocks or the golf course,
Mannings n values of 0.05 to 0.06 for cleared drainage lines, and
Mannings n values of 0.09 for drainage paths incorporating in stream vegetation.
Examination of the Lidar information suggested that the northern levee bank works directly
downstream of Ryan Road were not included in the 1989 design plan set. The declared flood
plain plans suggest the levee works were actually completed about 1992. As noted on one of
the MWC declared flood plain plans, the aim of these works was to provide 100 year
protection to the low density properties located north of Deep Creek, directly downstream of
Ryan Road. However, other information suggests a capacity less than the 100 year flow (35
m3/s as per the levee design plans).
Given the above, the cross section in this area of the creek were derived using a combination
of the 1989 design plan information and the recent Lidar survey information.
The above is considered accurate enough to:
Assess if existing flood levels are consistent with the declared flood levels, and
To assess the impact of upstream PSP proposals along this section of creek.
However, actual flood levels should be determined at the functional design stage of the
project given detailed site survey information.
In addition to the above a flow of 18 m3/s was also run through the model. This was done to
clearly show that the declared flood levels were based, conservatively, assumed that the total
6
design flow of 43 m3/s and did not account for any breakaway flow to the south upstream of
Ryan Road. This is considered a reasonable assumption as:
The email advice from Keith Boniface of Melbourne Water dated 1/2/13 stating “ the
breakaway flow at the south end adjacent to Ryan Road, I think, has been eliminated
or at least reduced in subsequent works”,
hand written notes on the MWC declared flood level plan indicate some filling
upstream of Ryan Road and construction of a house on Canty Land may limit
breakaway flow south, and
A large proportion of any breakaway south may actually be directed west to Ryan
Road due to the relatively hydraulic smoothness of Canty Lane as opposed to the
surrounding land types.
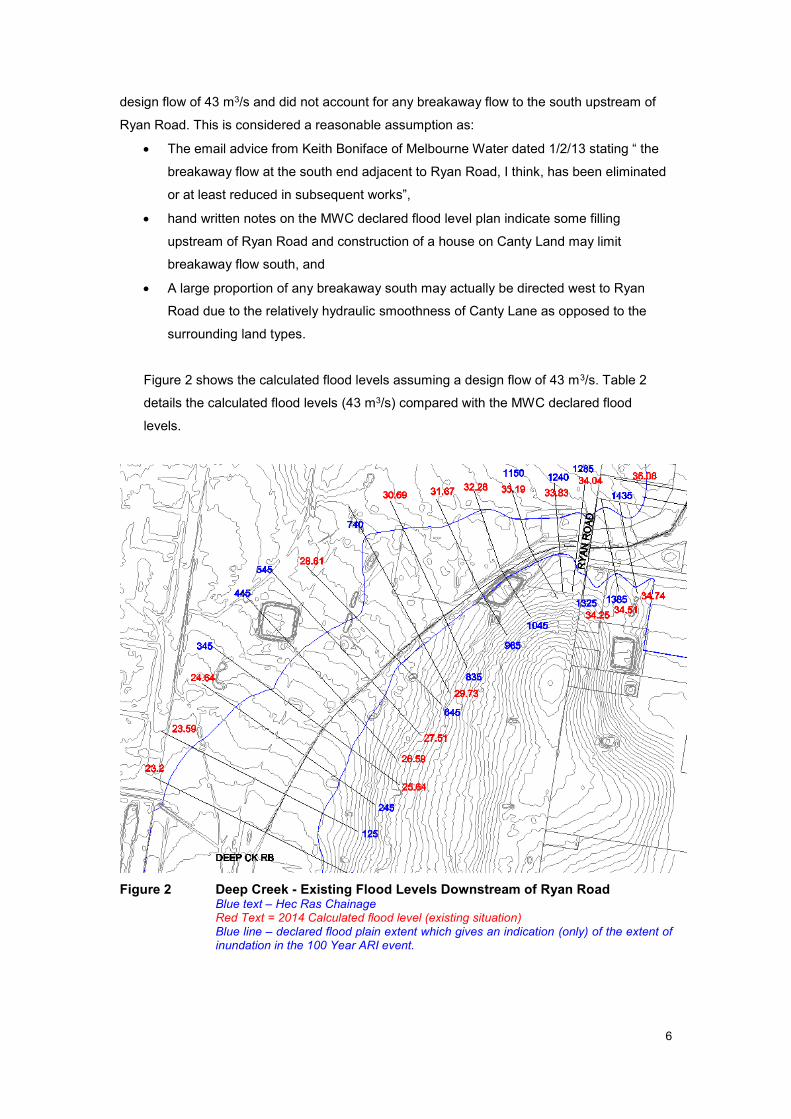
Figure 2 shows the calculated flood levels assuming a design flow of 43 m3/s. Table 2
details the calculated flood levels (43 m3/s) compared with the MWC declared flood
levels.
Figure 2 Deep Creek - Existing Flood Levels Downstream of Ryan Road Blue text – Hec Ras Chainage Red Text = 2014 Calculated flood level (existing situation)
Blue line – declared flood plain extent which gives an indication (only) of the extent of inundation in the 100 Year ARI event.
7
Table 2 Hec Ras Results (43 m3/s) compared with Declared Flood Plain Levels
Chainage (m) Declared Flood Level Assumed 100 year Flow 100 Year Level
Change between Declared
Level and 2014 Calculated
Level (mm)
(m AHD)* (m3/s) (m AHD)
1285 33.7 43 34.04 340
1240 33.26 43 33.83 570
1150 33.19 43 33.19 0
1045 32.63 43 32.28 -350
965 31.68 43 31.67 -10
835 30.85 43 30.69 -160
740 29.75 43 29.73 -20
645 28.61 43 28.61 0
545 27.62 43 27.51 -110
445 26.71 43 26.59 -120
345 25.6 43 25.64 40
245 24.61 43 24.64 30
125 23.5 43 23.59 90
0 23.2 43 23.2 0
The results indicate that the expected 100 Year ARI flood levels are generally at or below the
declared flood plain levels.
Flood levels are probably lower between chainages 835 and 1045 due to the declared flood
levels possibly not accounting for the constructed on line pond in this area (the pond was
constructed in 1989, and the survey used to define the flood plain for the flood plain
declaration was completed in 1978).
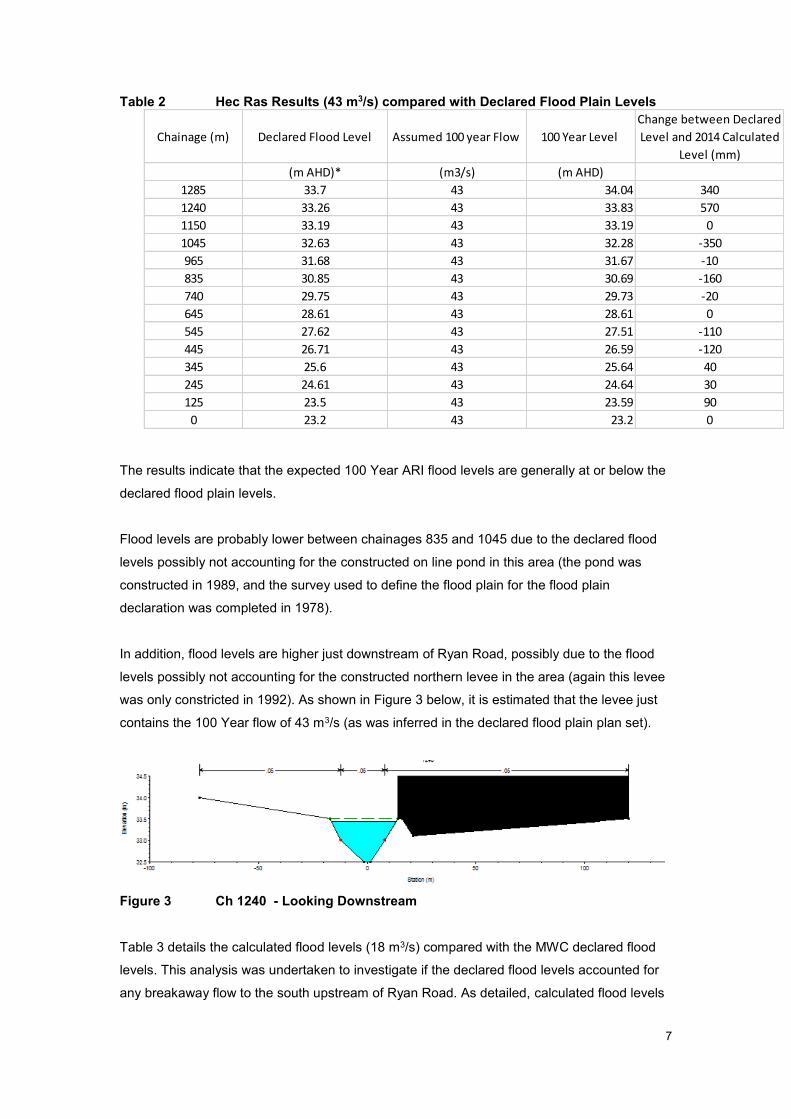
In addition, flood levels are higher just downstream of Ryan Road, possibly due to the flood
levels possibly not accounting for the constructed northern levee in the area (again this levee
was only constricted in 1992). As shown in Figure 3 below, it is estimated that the levee just
contains the 100 Year flow of 43 m3/s (as was inferred in the declared flood plain plan set).
Figure 3 Ch 1240 - Looking Downstream
Table 3 details the calculated flood levels (18 m3/s) compared with the MWC declared flood
levels. This analysis was undertaken to investigate if the declared flood levels accounted for
any breakaway flow to the south upstream of Ryan Road. As detailed, calculated flood levels

8
are generally much lower than the declared flood levels, indicating that MWC, conservatively,
assumed no breakaway flow when setting flood levels in this area in the past. This is
considered a prudent assumption the issues highlighted above.
Table 3 Hec Ras Results (18 m3/s) compared with Declared Flood Plain Levels
Chainage (m) Declared Flood Level Assumed 100 year Flow 100 Year Level
Change between Declared
Level and 2014 Calculated
Level (mm)
(m AHD)* (m3/s) (m AHD)
1285 33.7 18 33.63 -70
1240 33.26 18 33.45 190
1150 33.19 18 32.72 -470
1045 32.63 18 31.73 -900
965 31.68 18 31.5 -180
835 30.85 18 30.46 -390
740 29.75 18 29.63 -120
645 28.61 18 28.48 -130
545 27.62 18 27.38 -240
445 26.71 18 26.47 -240
345 25.6 18 25.55 -50
245 24.61 18 24.53 -80
125 23.5 18 23.51 10
0 23.2 18 23.2 0
The results do show that fill and flood levels downstream of Ryan Road do account for a
design flow in this area of 43 m3/s, not 18 m3/s. As such, the PSP proposals in regard to
assuming minimal breakaway flows to the south upstream of Ryan Road should not impact on
flood protection provisions in this area.
It is considered that enough work has been completed for Council to move forward in
confidence in regard to the PSP proposals in regard to reserve and overland flow path
provisions upstream of Ryan Road. However, detailed design of the Deep Creek Reserve
Corridor upstream of Ryan Road (see Section 5 below) should include detailed survey and
updated modelling of the channel and levee downstream of Ryan Road to confirm the above
results.
4.2 Existing Ryan Road Culvert System
The declared flood level directly upstream of Ryan Road is 34.2 m AHD.
A culvert and weir flow analysis (Appendix B) calculated a 100 Year flood level (assuming a
design flow of 43 m3/s) of 34.25 m AHD (15 m3/s in the culvert system and 28 m3/s over the
road). If 18 m3/s design flow is assumed a 100 Year ARI flood level of 34.1 m AHD (11 m3/s in
the culvert system and 7 m3/s over the road).
9
Again, the results do show that fill and flood levels directly upstream of Ryan Road do
account for a design flow in this area of 43 m3/s, not 18 m3/s.
However the results do indicate that there is an argument to upgrade the Ryan Road culvert
system given the development which has occurred in the area over the last 25 years and the
potential development in the PSP area. Flow over the road of 28m3/s may be justified in a
rural context, but possibly not when the population using the road drastically increases.
4.3 Ryan Road to Princes Highway
The Hec Ras model described below was used to assess existing flood levels between Ryan
Road and Princes Highway. Again, this was done so that a “base” case could determine to
assess any potential PSP implications between Ryan Road and Princes Highway.
This model was constructed utilising:
The design flows detailed in Section 3,
A starting water level of 34.25 m AHD which is the flood level calculate in Section 4.2
above at Section 1325),
0.5 metre Lidar information provided by Council, and
Manning n of 0.05 for flood plain areas associated with paddocks,
Mannings n values of 0.09 to 0.15 for to account for the vegetation in and adjacent to
Deep Creek in this section of waterway.
The above is considered accurate enough to:
Assess if existing flood levels are consistent with the declared flood levels, and
To assess the impact of upstream PSP proposals along this section of creek.
Actual flood levels should be determined at the functional design stage of the project given
detailed site survey information.
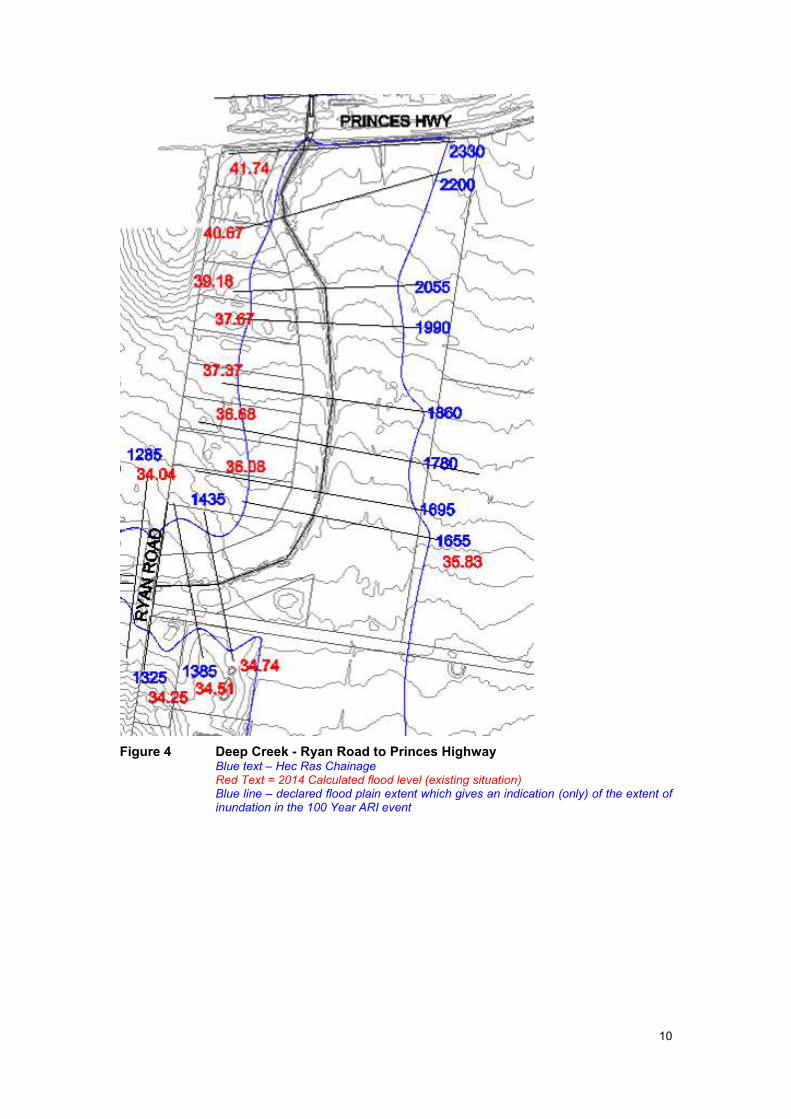
Figure 4 shows the calculated flood levels. Table 4 details the calculated flood levels
compared with the MWC declared flood levels. Examination of the cross sections indicated
that, although there are informal levees either side of Deep Creek, in this section of waterway,
in the 100 Year event the system acts as one united cross section.
10
Figure 4 Deep Creek - Ryan Road to Princes Highway Blue text – Hec Ras Chainage
Red Text = 2014 Calculated flood level (existing situation) Blue line – declared flood plain extent which gives an indication (only) of the extent of inundation in the 100 Year ARI event
11
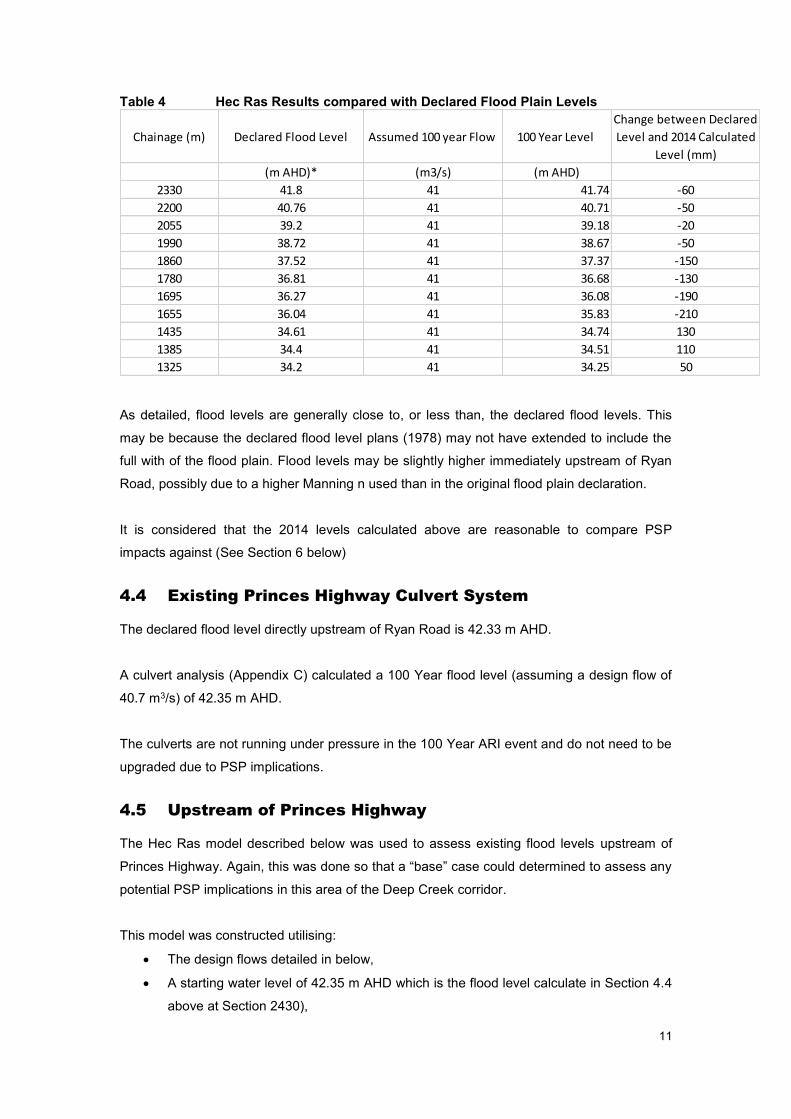
Table 4 Hec Ras Results compared with Declared Flood Plain Levels
Chainage (m) Declared Flood Level Assumed 100 year Flow 100 Year Level
Change between Declared
Level and 2014 Calculated
Level (mm)
(m AHD)* (m3/s) (m AHD)
2330 41.8 41 41.74 -60
2200 40.76 41 40.71 -50
2055 39.2 41 39.18 -20
1990 38.72 41 38.67 -50
1860 37.52 41 37.37 -150
1780 36.81 41 36.68 -130
1695 36.27 41 36.08 -190
1655 36.04 41 35.83 -210
1435 34.61 41 34.74 130
1385 34.4 41 34.51 110
1325 34.2 41 34.25 50
As detailed, flood levels are generally close to, or less than, the declared flood levels. This
may be because the declared flood level plans (1978) may not have extended to include the
full with of the flood plain. Flood levels may be slightly higher immediately upstream of Ryan
Road, possibly due to a higher Manning n used than in the original flood plain declaration.
It is considered that the 2014 levels calculated above are reasonable to compare PSP
impacts against (See Section 6 below)
4.4 Existing Princes Highway Culvert System
The declared flood level directly upstream of Ryan Road is 42.33 m AHD.
A culvert analysis (Appendix C) calculated a 100 Year flood level (assuming a design flow of
40.7 m3/s) of 42.35 m AHD.
The culverts are not running under pressure in the 100 Year ARI event and do not need to be
upgraded due to PSP implications.
4.5 Upstream of Princes Highway
The Hec Ras model described below was used to assess existing flood levels upstream of
Princes Highway. Again, this was done so that a “base” case could determined to assess any
potential PSP implications in this area of the Deep Creek corridor.
This model was constructed utilising:
The design flows detailed in below,
A starting water level of 42.35 m AHD which is the flood level calculate in Section 4.4
above at Section 2430),
12
0.5 metre Lidar information provided by Council, and
Manning n values as detailed in Figure 6 below.
Again, the above is considered accurate enough to assess if existing flood levels are
consistent with the declared flood levels and to assess the impact of upstream PSP proposals
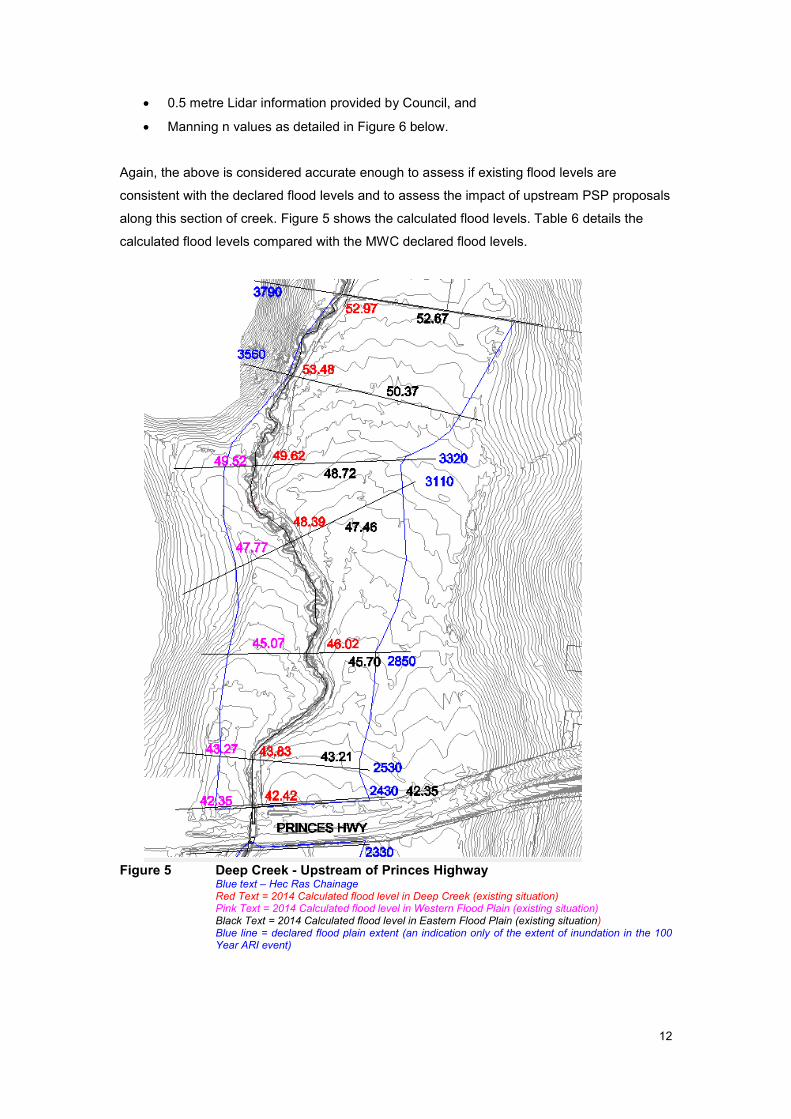
along this section of creek. Figure 5 shows the calculated flood levels. Table 6 details the
calculated flood levels compared with the MWC declared flood levels.
Figure 5 Deep Creek - Upstream of Princes Highway
Blue text – Hec Ras Chainage Red Text = 2014 Calculated flood level in Deep Creek (existing situation)
Pink Text = 2014 Calculated flood level in Western Flood Plain (existing situation) Black Text = 2014 Calculated flood level in Eastern Flood Plain (existing situation) Blue line = declared flood plain extent (an indication only of the extent of inundation in the 100 Year ARI event)

13
Figure 6 Deep Creek - Typical Cross Section Upstream of Princes Highway (3110)
As detailed below, it is clear that upstream of Princes Highway, the flows in Deep Creek, the
eastern and Western floodplains act independently. That is, once flow enters the eastern or
western flood plain, it cannot re-enter Deep Creek. Also, once flow leaves Deep Creek (by
flowing over its adjacent levees or Deep Creek Road) it cannot re-enter the creek. The only
Cross Section where flows combine is directly upstream of Princes Highway due to the table
drain interaction.
Given this aspect of the flow process, three Hec Ras models were created as detailed for the
channel, eastern and western floodplains. An iterative process determined how much flow
could be contained within Deep Creek and where flow would be contained within the relevant
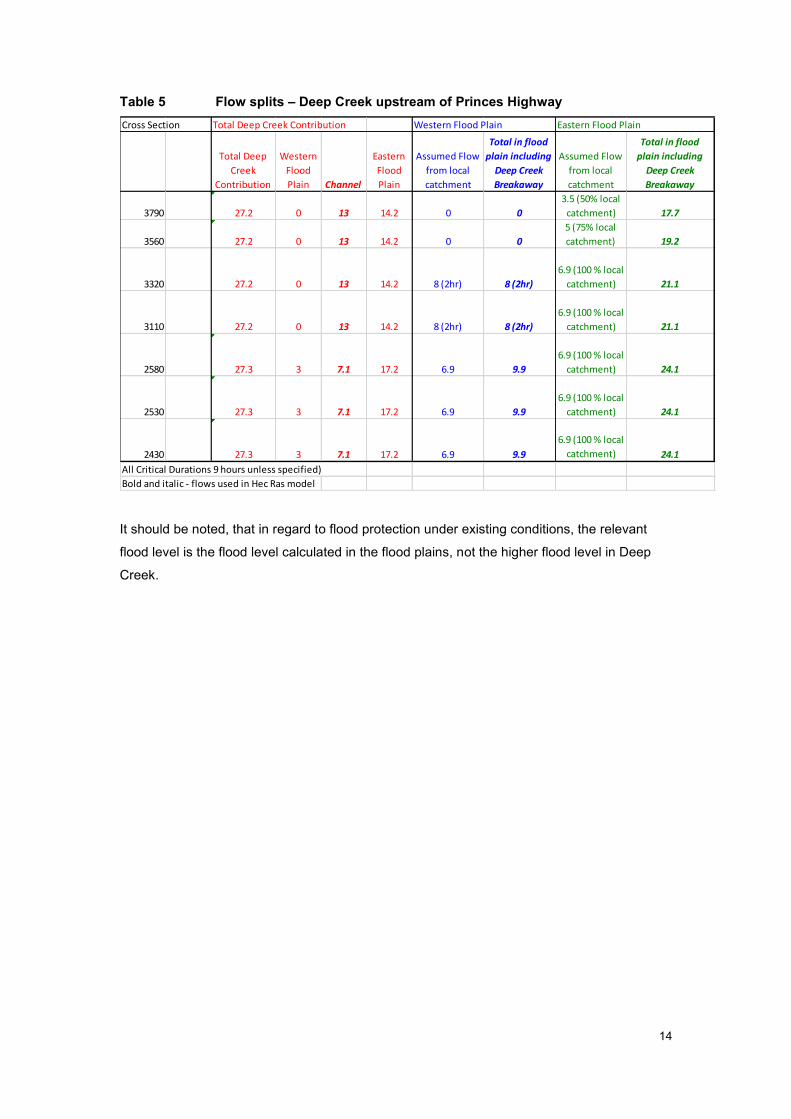
flood plain. Flow splits are detailed below. Largely flows were for the 9 hour duration storm.
However, higher flows than the 9 hour storm were used for the upper cross sections in the
western flood plain due flows from the local catchment being higher than the 9 hour deep
creek input at this location. This may explain the higher flood level produced at change 3320
in the western flood plain.
14
Table 5 Flow splits – Deep Creek upstream of Princes Highway
Cross Section Total Deep Creek Contribution Western Flood Plain Eastern Flood Plain
Total Deep
Creek
Contribution
Western
Flood
Plain Channel
Eastern
Flood
Plain
Assumed Flow
from local
catchment
Total in flood
plain including
Deep Creek
Breakaway
Assumed Flow
from local
catchment
Total in flood
plain including
Deep Creek
Breakaway
3790 27.2 0 13 14.2 0 0
3.5 (50% local
catchment) 17.7
3560 27.2 0 13 14.2 0 0
5 (75% local
catchment) 19.2
3320 27.2 0 13 14.2 8 (2hr) 8 (2hr)
6.9 (100 % local
catchment) 21.1
3110 27.2 0 13 14.2 8 (2hr) 8 (2hr)
6.9 (100 % local
catchment) 21.1
2580 27.3 3 7.1 17.2 6.9 9.9
6.9 (100 % local
catchment) 24.1
2530 27.3 3 7.1 17.2 6.9 9.9
6.9 (100 % local
catchment) 24.1
2430 27.3 3 7.1 17.2 6.9 9.9
6.9 (100 % local
catchment) 24.1
All Critical Durations 9 hours unless specified)
Bold and italic - flows used in Hec Ras model
It should be noted, that in regard to flood protection under existing conditions, the relevant
flood level is the flood level calculated in the flood plains, not the higher flood level in Deep
Creek.

15
Table 6 Hec Ras Results compared with Declared Flood Plain Levels
Deep Creek Channel and Riparian Zone
Chainage (m) Declared Flood Level Assumed 100 year Flow 100 Year Level
Change between Declared
Level and 2014 Calculated
Level (mm)
(m AHD) (m3/s) (m AHD)
3790 52.64 13 52.97 330
3560 50.28 13 51.48 1200
3320 48.73 13 49.62 890
3110 47.62 13 48.39 770
2850 45.39 7.1 46.02 630
2530 43.47 7.1 43.83 360
2430 42.33 7.1 42.42 90
Eastern Flood Plain
Chainage (m) Declared Flood Level Assumed 100 year Flow 100 Year Level
Change between Declared
Level and 2014 Calculated
Level (mm)
(m AHD) (m3/s) (m AHD)
3790 52.64 17.7 52.67 30
3560 50.28 19.2 50.37 90
3320 48.73 21.1 48.72 -10
3110 47.62 21.1 47.46 -160
2850 45.39 24.1 45.7 310
2530 43.47 24.1 43.21 -260
2430 42.33 24.1 42.35 20
Western Flood Plain
Chainage (m) Declared Flood Level Assumed 100 year Flow 100 Year Level
Change between Declared
Level and 2014 Calculated
Level (mm)
(m AHD) (m3/s) (m AHD)
3790 N/A 0
3560 N/A 0
3320 48.73 8 49.52 790
3110 47.62 8 47.77 150
2850 45.39 9.9 45.07 -320
2530 43.47 9.9 43.27 -200
2430 42.33 9.9 42.35 20
As detailed, flood levels in both the eastern and western flood plains are generally close to or
less than the declared flood levels. Discrepancies would be due to the original analysis
assuming all three systems act as one and possibly, variances in Mannings n assumptions
It is considered that the 2014 levels calculated above are reasonable to compare PSP
impacts against (See Section 6 below)
16
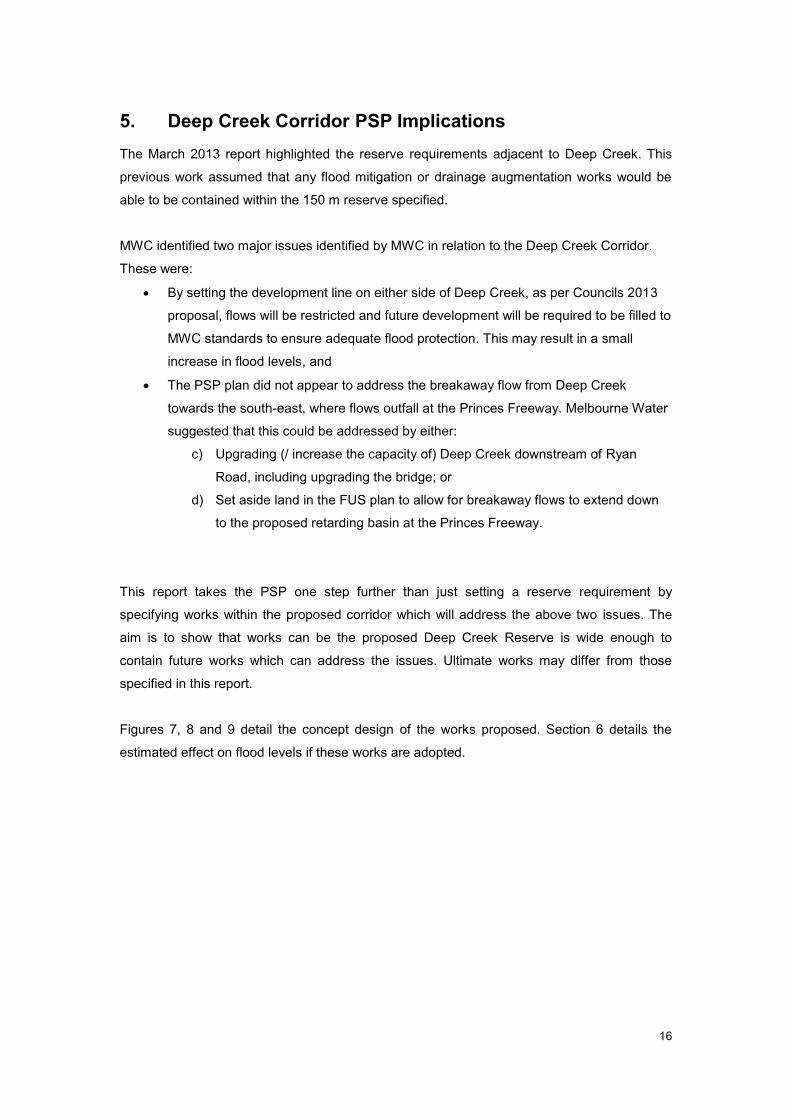
5. Deep Creek Corridor PSP Implications
The March 2013 report highlighted the reserve requirements adjacent to Deep Creek. This
previous work assumed that any flood mitigation or drainage augmentation works would be
able to be contained within the 150 m reserve specified.
MWC identified two major issues identified by MWC in relation to the Deep Creek Corridor.
These were:
By setting the development line on either side of Deep Creek, as per Councils 2013
proposal, flows will be restricted and future development will be required to be filled to
MWC standards to ensure adequate flood protection. This may result in a small
increase in flood levels, and
The PSP plan did not appear to address the breakaway flow from Deep Creek
towards the south-east, where flows outfall at the Princes Freeway. Melbourne Water
suggested that this could be addressed by either:
c) Upgrading (/ increase the capacity of) Deep Creek downstream of Ryan
Road, including upgrading the bridge; or
d) Set aside land in the FUS plan to allow for breakaway flows to extend down
to the proposed retarding basin at the Princes Freeway.
This report takes the PSP one step further than just setting a reserve requirement by
specifying works within the proposed corridor which will address the above two issues. The
aim is to show that works can be the proposed Deep Creek Reserve is wide enough to
contain future works which can address the issues. Ultimate works may differ from those
specified in this report.
Figures 7, 8 and 9 detail the concept design of the works proposed. Section 6 details the
estimated effect on flood levels if these works are adopted.
17
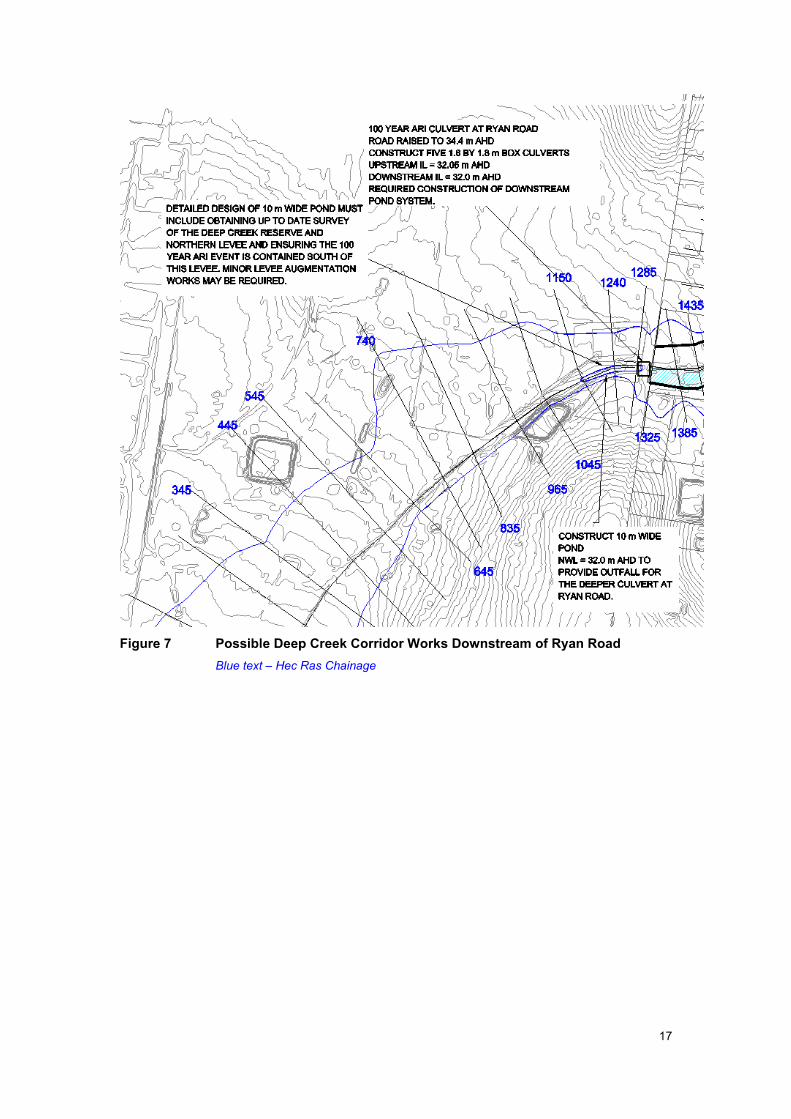
Figure 7 Possible Deep Creek Corridor Works Downstream of Ryan Road
Blue text – Hec Ras Chainage

18
Figure 8 Possible Deep Creek Corridor Works - Ryan Road to Princes Highway
Blue text – Hec Ras Chainage
19
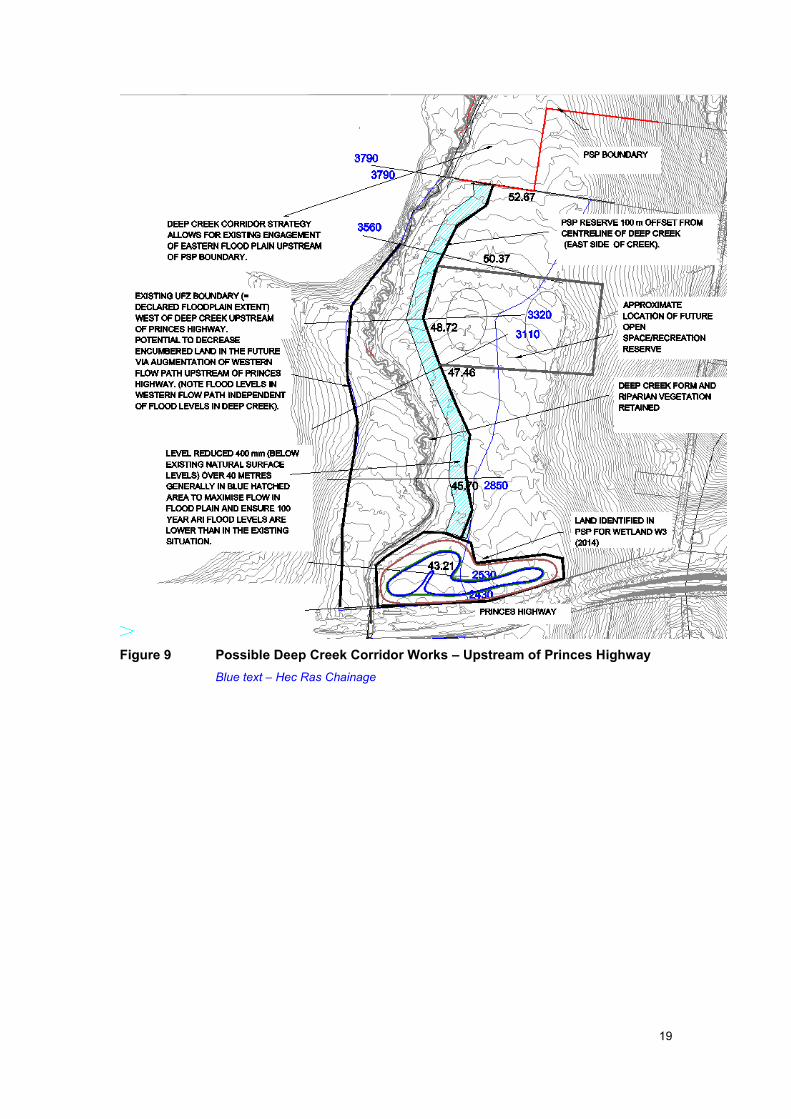
Figure 9 Possible Deep Creek Corridor Works – Upstream of Princes Highway
Blue text – Hec Ras Chainage
20
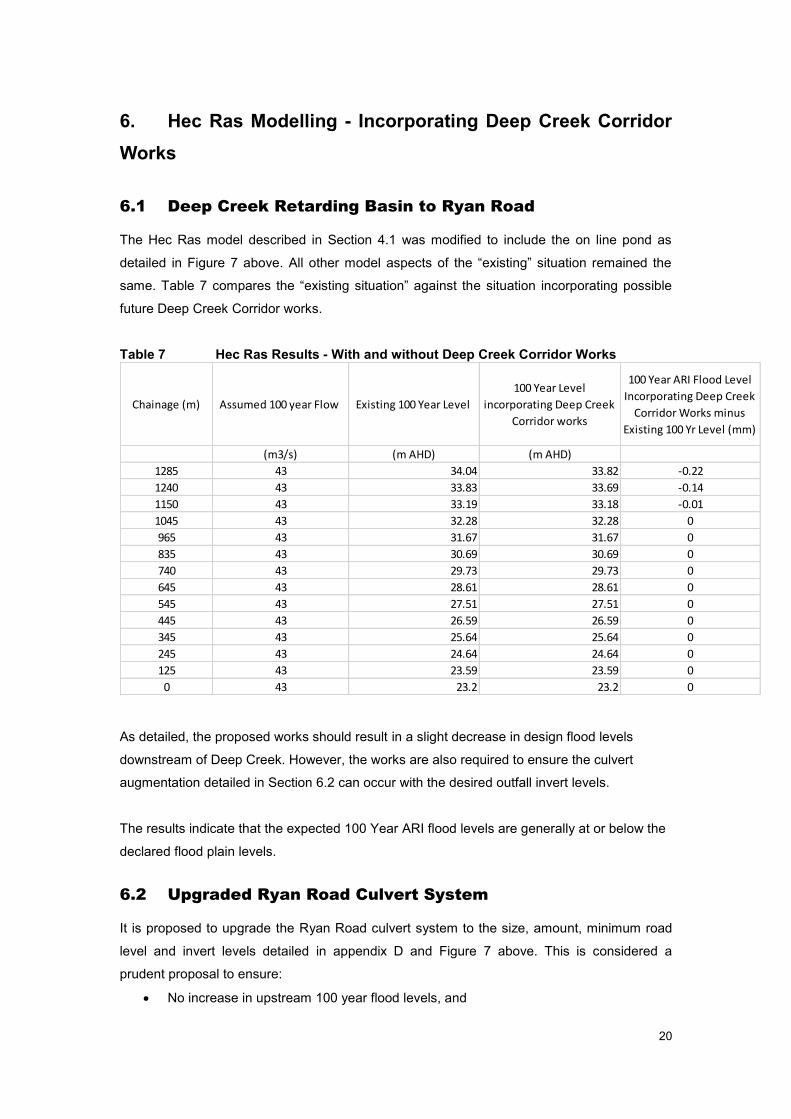
6. Hec Ras Modelling - Incorporating Deep Creek Corridor
Works
6.1 Deep Creek Retarding Basin to Ryan Road
The Hec Ras model described in Section 4.1 was modified to include the on line pond as
detailed in Figure 7 above. All other model aspects of the “existing” situation remained the
same. Table 7 compares the “existing situation” against the situation incorporating possible
future Deep Creek Corridor works.
Table 7 Hec Ras Results - With and without Deep Creek Corridor Works
Chainage (m) Assumed 100 year Flow Existing 100 Year Level
100 Year Level
incorporating Deep Creek
Corridor works
100 Year ARI Flood Level
Incorporating Deep Creek
Corridor Works minus
Existing 100 Yr Level (mm)
(m3/s) (m AHD) (m AHD)
1285 43 34.04 33.82 -0.22
1240 43 33.83 33.69 -0.14
1150 43 33.19 33.18 -0.01
1045 43 32.28 32.28 0
965 43 31.67 31.67 0
835 43 30.69 30.69 0
740 43 29.73 29.73 0
645 43 28.61 28.61 0
545 43 27.51 27.51 0
445 43 26.59 26.59 0
345 43 25.64 25.64 0
245 43 24.64 24.64 0
125 43 23.59 23.59 0
0 43 23.2 23.2 0
As detailed, the proposed works should result in a slight decrease in design flood levels
downstream of Deep Creek. However, the works are also required to ensure the culvert
augmentation detailed in Section 6.2 can occur with the desired outfall invert levels.
The results indicate that the expected 100 Year ARI flood levels are generally at or below the
declared flood plain levels.
6.2 Upgraded Ryan Road Culvert System
It is proposed to upgrade the Ryan Road culvert system to the size, amount, minimum road
level and invert levels detailed in appendix D and Figure 7 above. This is considered a
prudent proposal to ensure:
No increase in upstream 100 year flood levels, and

21
100 Year ARI protection for the Ryan Road carriageway (to new minimum road
levels) given the increased population in the area using the road in the future.
6.3 Ryan Road to Princes Highway
The Hec Ras model described in Section 4.3 was modified to include:
An assumed constriction of all flows to the reserve boundaries as detailed in Figure 8
above, and
The flood plain augmentation works as detailed in figure 8 above.
Note this is a conservative analysis as the assumed reserve line west of Deep Creek may not
incorporate fill if the low density use of this land does not change in the future.
Table 8 compares the “existing situation” against the situation incorporating possible future
Deep Creek Corridor works.
Table 8 Hec Ras Results - With and without Deep Creek Corridor Works
Chainage (m) 100 year Flow Existing 100 Year Level
100 Year Level
incorporating Deep Creek
Corridor works
100 Year ARI Flood Level
Incorporating Deep Creek
Corridor Works minus
Existing 100 Yr Level (mm)
(m3/s) (m AHD) (m AHD)
2330 41 41.74 41.73 -0.01
2200 41 40.71 40.78 0.07
2055 41 39.18 39.07 -0.11
1990 41 38.67 38.56 -0.11
1860 41 37.37 37.38 0.01
1780 41 36.68 36.64 -0.04
1695 41 36.08 36.04 -0.04
1655 41 35.83 35.76 -0.07
1435 41 34.74 34.68 -0.06
1385 41 34.51 34.54 0.03
1325 41 34.25 34.25 0
As detailed, the proposed works should result in a slight decrease in design flood levels in this
section of waterway.
The 100 Year ARI flow will be contained to the reserve and directed west to the Deep Creek
Retarding Basin. However, the updated PSP plan should allow for an overland flow path
provision (e.g. road reserve or equivalent) to account for flows in excess of the 100 year flow
possibly breaking away to the south upstream of Ryan Road.
22
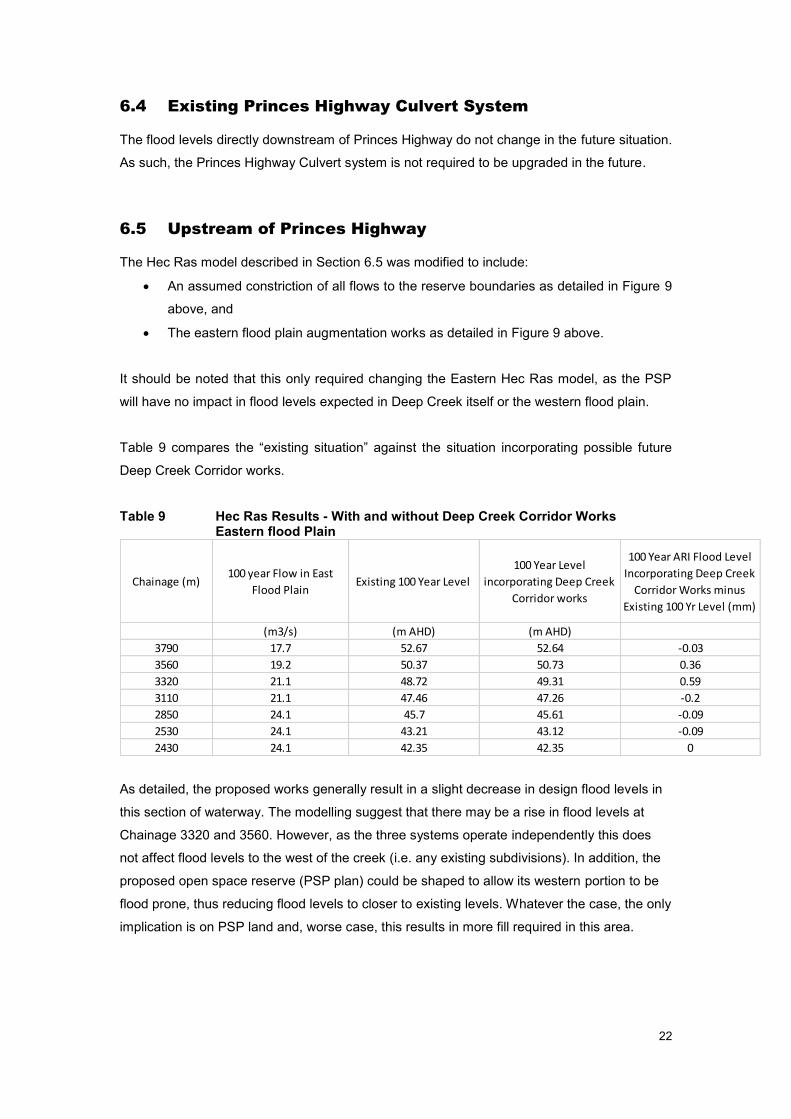
6.4 Existing Princes Highway Culvert System
The flood levels directly downstream of Princes Highway do not change in the future situation.
As such, the Princes Highway Culvert system is not required to be upgraded in the future.
6.5 Upstream of Princes Highway
The Hec Ras model described in Section 6.5 was modified to include:
An assumed constriction of all flows to the reserve boundaries as detailed in Figure 9
above, and
The eastern flood plain augmentation works as detailed in Figure 9 above.
It should be noted that this only required changing the Eastern Hec Ras model, as the PSP
will have no impact in flood levels expected in Deep Creek itself or the western flood plain.
Table 9 compares the “existing situation” against the situation incorporating possible future
Deep Creek Corridor works.
Table 9 Hec Ras Results - With and without Deep Creek Corridor Works Eastern flood Plain
Chainage (m)100 year Flow in East
Flood PlainExisting 100 Year Level
100 Year Level
incorporating Deep Creek
Corridor works
100 Year ARI Flood Level
Incorporating Deep Creek
Corridor Works minus
Existing 100 Yr Level (mm)
(m3/s) (m AHD) (m AHD)
3790 17.7 52.67 52.64 -0.03
3560 19.2 50.37 50.73 0.36
3320 21.1 48.72 49.31 0.59
3110 21.1 47.46 47.26 -0.2
2850 24.1 45.7 45.61 -0.09
2530 24.1 43.21 43.12 -0.09
2430 24.1 42.35 42.35 0
As detailed, the proposed works generally result in a slight decrease in design flood levels in
this section of waterway. The modelling suggest that there may be a rise in flood levels at
Chainage 3320 and 3560. However, as the three systems operate independently this does
not affect flood levels to the west of the creek (i.e. any existing subdivisions). In addition, the
proposed open space reserve (PSP plan) could be shaped to allow its western portion to be
flood prone, thus reducing flood levels to closer to existing levels. Whatever the case, the only
implication is on PSP land and, worse case, this results in more fill required in this area.
23
7. Conclusions and Further Work Required
The above work concludes that the PSP reserve areas adjacent to Deep Creek are adequate
to address the MWC concerns highlighted in Section 1 above.
Further work required going forward in the design process includes, but is not limited to:
Ensuring the design of any future subdivision relies on detailed flood plain survey
information, and updated flood levels at this time to set adequate fill levels adjacent to
the reserve and ensure the design of future reserve augmentation works meets the
intent of the design as detailed in this report,
Update the PSP plan to allow for an overland flow path provision (e.g. road reserve or
equivalent) to account for flows in excess of the 100 year flow possibly breaking away
to the south upstream of Ryan Road (although the Deep Creek corridor will have a
100 Year Capacity),
Confirming that the ecological and cultural heritage constraints and opportunities
have been fully captured by the proposals,
Liaising with downstream affected landowners,
It is requested that MWC agree in principle to the PSP Deep Creek Reserve line given the
result presented in this report.

24
APPENDIX A RORB Model Control Vector
C DEEP CREEK TO UPSTREAM OF PAKENHAM CREEK C STORMY WATER SOLUTIONS C SEPTEMBER 2014 C EXISTING CATCHMENT WITH ALLOWANCE C FOR DEVELOPMENT DSOUTH OF ELEC EASEMENT C CONSERVATIVLY NO RB'S C C DEEP_2014_oct 2014.CAT C 0 1,1,1.9,-99, A 3 1,1,1.1,-99, B 4 5,1,0.7,-99 3 1,1,0.7,-99, C 4 5,1,1.5,-99, 3 1,1,0.7,-99, D 4 5,1,0.5,-99, 3 1,1,1.3,-99, E 4 5,1,0.7,-99, 2,1,1,-99, F 7 End 10 3 1,2,1.3,2,-99, G 4 7 upstream end 12 5,2,1.2,1.5,-99, 3 1,2,0.75,0.3,-99, H 4 7 upstream end 14 5,2,0.4,1.3,-99, 3 1,2,1,0.3,-99, I 4 7 DEEP CK AT PRINCES HWY 5,1,0.5,-99, 2,2,1,2,-99, J 7 RYANS ROAD 2,2,0.8,2,-99, 7 DEEP CK UPSTREAM OF PAKENHAM CK 0 1.24,2.83,1.26,1.26,1.52,1.91,1.45,1.44,1.28,0.37,1.35,-99, 1,0.05,0.05,0.05,0.05,0.05,0.2,0.1,0.6,0.6,0.3,0.1,-99,
25
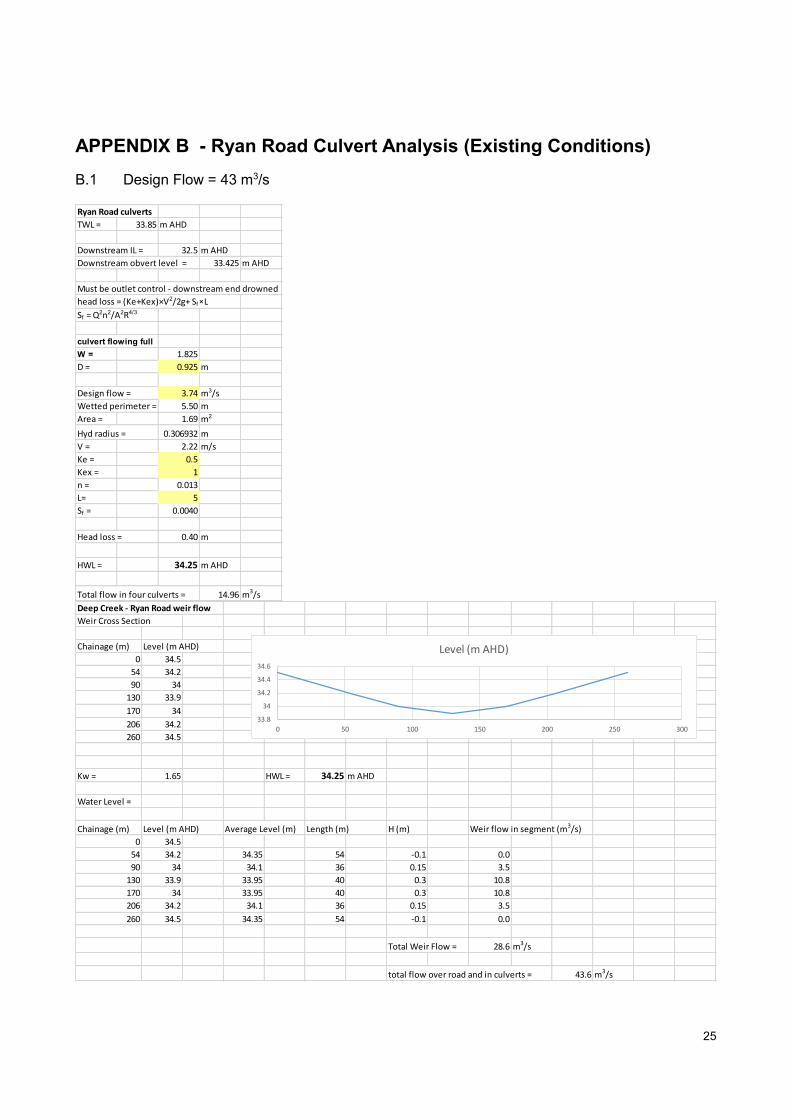
APPENDIX B - Ryan Road Culvert Analysis (Existing Conditions)
B.1 Design Flow = 43 m3/s Ryan Road culverts
TWL = 33.85 m AHD
Downstream IL = 32.5 m AHD
Downstream obvert level = 33.425 m AHD
Must be outlet control - downstream end drowned
head loss = (Ke+Kex)×V2/2g+ Sf×L
Sf = Q2n2/A2R4/3
culvert flowing full
W = 1.825
D = 0.925 m
Design flow = 3.74 m3/s
Wetted perimeter = 5.50 m
Area = 1.69 m2
Hyd radius = 0.306932 m
V = 2.22 m/s
Ke = 0.5
Kex = 1
n = 0.013
L= 5
Sf = 0.0040
Head loss = 0.40 m
HWL = 34.25 m AHD
Total flow in four culverts = 14.96 m3/s Deep Creek - Ryan Road weir flow
Weir Cross Section
Chainage (m) Level (m AHD)
0 34.5
54 34.2
90 34
130 33.9
170 34
206 34.2
260 34.5
Kw = 1.65 HWL = 34.25 m AHD
Water Level =
Chainage (m) Level (m AHD) Average Level (m) Length (m) H (m) Weir flow in segment (m3/s)
0 34.5
54 34.2 34.35 54 -0.1 0.0
90 34 34.1 36 0.15 3.5
130 33.9 33.95 40 0.3 10.8
170 34 33.95 40 0.3 10.8
206 34.2 34.1 36 0.15 3.5
260 34.5 34.35 54 -0.1 0.0
Total Weir Flow = 28.6 m3/s
total flow over road and in culverts = 43.6 m3/s
33.8
34
34.2
34.4
34.6
0 50 100 150 200 250 300
Level (m AHD)
26
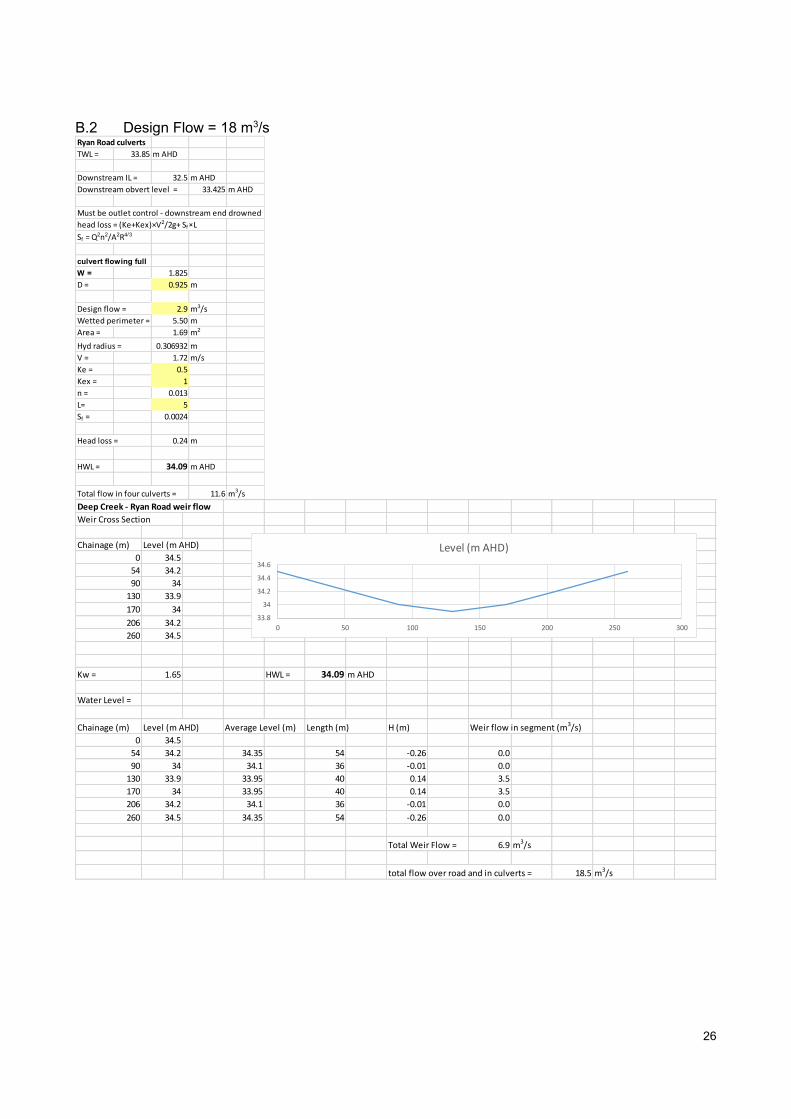
B.2 Design Flow = 18 m3/s Ryan Road culverts
TWL = 33.85 m AHD
Downstream IL = 32.5 m AHD
Downstream obvert level = 33.425 m AHD
Must be outlet control - downstream end drowned
head loss = (Ke+Kex)×V2/2g+ Sf×L
Sf = Q2n2/A2R4/3
culvert flowing full
W = 1.825
D = 0.925 m
Design flow = 2.9 m3/s
Wetted perimeter = 5.50 m
Area = 1.69 m2
Hyd radius = 0.306932 m
V = 1.72 m/s
Ke = 0.5
Kex = 1
n = 0.013
L= 5
Sf = 0.0024
Head loss = 0.24 m
HWL = 34.09 m AHD
Total flow in four culverts = 11.6 m3/s Deep Creek - Ryan Road weir flow
Weir Cross Section
Chainage (m) Level (m AHD)
0 34.5
54 34.2
90 34
130 33.9
170 34
206 34.2
260 34.5
Kw = 1.65 HWL = 34.09 m AHD
Water Level =
Chainage (m) Level (m AHD) Average Level (m) Length (m) H (m) Weir flow in segment (m3/s)
0 34.5
54 34.2 34.35 54 -0.26 0.0
90 34 34.1 36 -0.01 0.0
130 33.9 33.95 40 0.14 3.5
170 34 33.95 40 0.14 3.5
206 34.2 34.1 36 -0.01 0.0
260 34.5 34.35 54 -0.26 0.0
Total Weir Flow = 6.9 m3/s
total flow over road and in culverts = 18.5 m3/s
33.8
34
34.2
34.4
34.6
0 50 100 150 200 250 300
Level (m AHD)
27
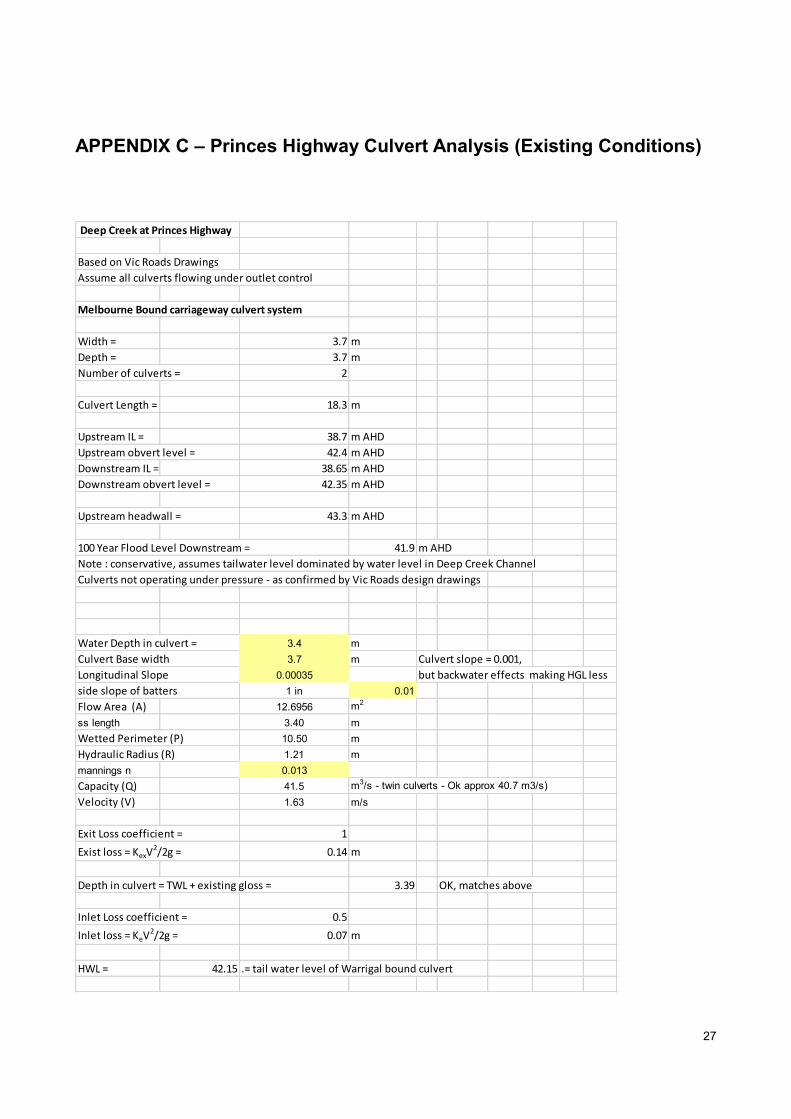
APPENDIX C – Princes Highway Culvert Analysis (Existing Conditions)
Deep Creek at Princes Highway
Based on Vic Roads Drawings
Assume all culverts flowing under outlet control
Melbourne Bound carriageway culvert system
Width = 3.7 m
Depth = 3.7 m
Number of culverts = 2
Culvert Length = 18.3 m
Upstream IL = 38.7 m AHD
Upstream obvert level = 42.4 m AHD
Downstream IL = 38.65 m AHD
Downstream obvert level = 42.35 m AHD
Upstream headwall = 43.3 m AHD
100 Year Flood Level Downstream = 41.9 m AHD
Note : conservative, assumes tailwater level dominated by water level in Deep Creek Channel
Culverts not operating under pressure - as confirmed by Vic Roads design drawings
Water Depth in culvert = 3.4 m
Culvert Base width 3.7 m Culvert slope = 0.001,
Longitudinal Slope 0.00035 but backwater effects making HGL less
side slope of batters 1 in 0.01
Flow Area (A) 12.6956 m2
ss length 3.40 m
Wetted Perimeter (P) 10.50 m
Hydraulic Radius (R) 1.21 m
mannings n 0.013
Capacity (Q) 41.5 m3/s - twin culverts - Ok approx 40.7 m3/s)
Velocity (V) 1.63 m/s
Exit Loss coefficient = 1
Exist loss = KexV2/2g = 0.14 m
Depth in culvert = TWL + existing gloss = 3.39 OK, matches above
Inlet Loss coefficient = 0.5
Inlet loss = KeV2/2g = 0.07 m
HWL = 42.15 .= tail water level of Warrigal bound culvert

28
Warrigal Bound carriageway culvert system
Width = 3.7 m
Depth = 3.7 m
Number of culverts = 2
Culvert Length = 13.1 m
Upstream IL = 38.8 m AHD
Upstream obvert level = 42.5 m AHD
Downstream IL = 38.8 m AHD
Downstream obvert level = 42.5 m AHD
Upstream headwall = 43.15 m AHD
100 Year Flood Level Downstream = 42.15 m AHD
Culverts not operating under pressure - as confirmed by Vic Roads design drawings
Water Depth in culvert = 3.45 m
Culvert Base width 3.7 m Culvert slope = 0.001,
Longitudinal Slope 0.00033 but backwater effects making HGL less
side slope of batters 1 in 0.01
Flow Area (A) 12.884025 m2
ss length 3.45 m
Wetted Perimeter (P) 10.60 m
Hydraulic Radius (R) 1.22 m
mannings n 0.013
Capacity (Q) 41.0 m3/s - twin culverts - Ok approx 40.7 m3/s)
Velocity (V) 1.59 m/s
Exit Loss coefficient = 1
Exist loss = KexV2/2g = 0.13 m
Depth in culvert = TWL + existing gloss = 3.48 OK, matches above
Inlet Loss coefficient = 0.5
Inlet loss = KeV2/2g = 0.06 m
HWL = 42.35 .= tail water level of Warrigal bound culvert
Confirmed , culverts not running under pressure.
29
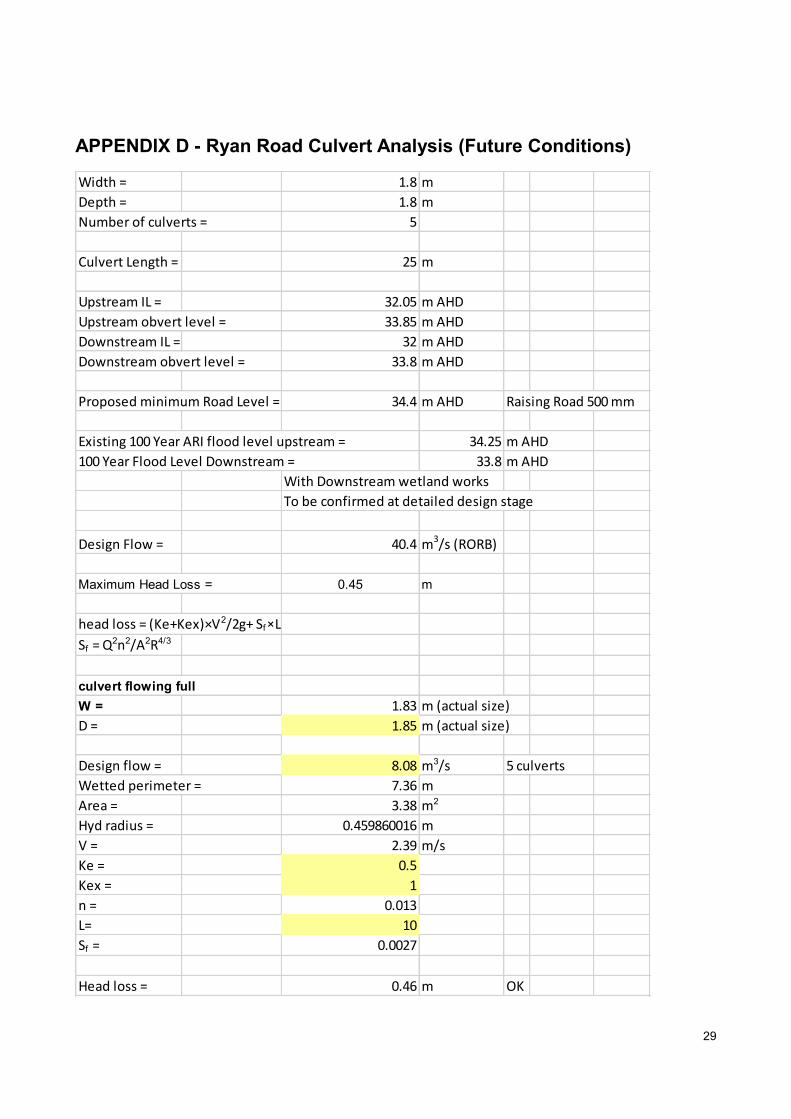
APPENDIX D - Ryan Road Culvert Analysis (Future Conditions)
Width = 1.8 m
Depth = 1.8 m
Number of culverts = 5
Culvert Length = 25 m
Upstream IL = 32.05 m AHD
Upstream obvert level = 33.85 m AHD
Downstream IL = 32 m AHD
Downstream obvert level = 33.8 m AHD
Proposed minimum Road Level = 34.4 m AHD Raising Road 500 mm
Existing 100 Year ARI flood level upstream = 34.25 m AHD
100 Year Flood Level Downstream = 33.8 m AHD
With Downstream wetland works
To be confirmed at detailed design stage
Design Flow = 40.4 m3/s (RORB)
Maximum Head Loss = 0.45 m
head loss = (Ke+Kex)×V2/2g+ Sf×L
Sf = Q2n2/A2R4/3
culvert flowing full
W = 1.83 m (actual size)
D = 1.85 m (actual size)
Design flow = 8.08 m3/s 5 culverts
Wetted perimeter = 7.36 m
Area = 3.38 m2
Hyd radius = 0.459860016 m
V = 2.39 m/s
Ke = 0.5
Kex = 1
n = 0.013
L= 10
Sf = 0.0027
Head loss = 0.46 m OK