Embed Size (px)
Citation preview
Pairing Energy Storage with Solar
Tilak Gopalarathnam
LG Technology Center of America
2019 Energy Storage Technologies and Applications Conference, Riverside, California
Contents
• Lithium-ion battery products • The need for peaker plants • PV + Storage peaker plant operation • PVS peaker plant architectures • Economics of PVS plants • PVS charging strategies • LCOE comparison • Summary
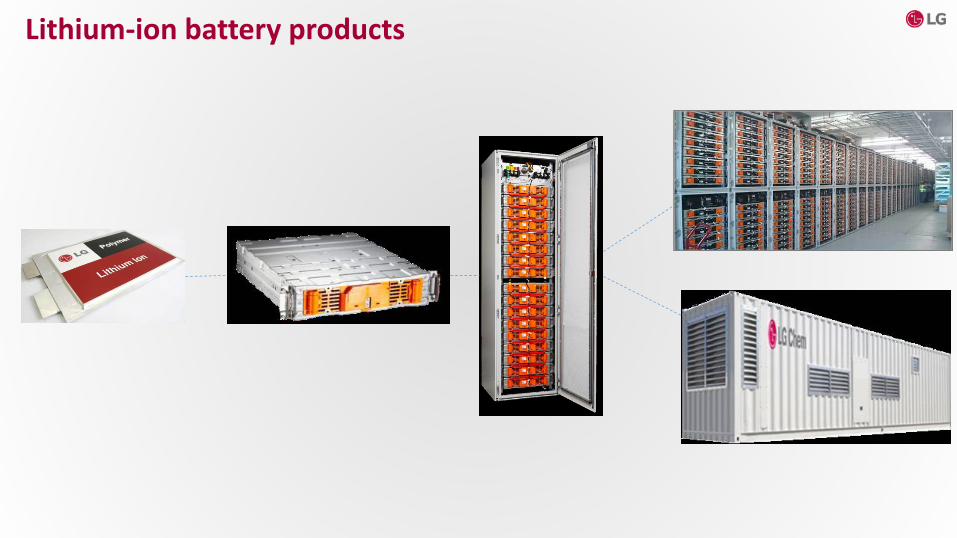
Lithium-ion battery products
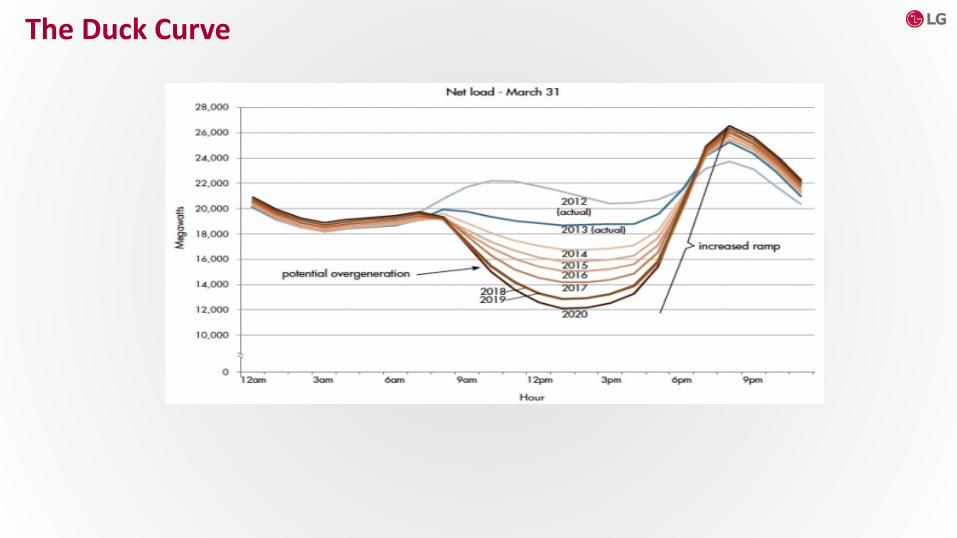
The Duck Curve

Desired peaker plant output

PVS Peaker Plant Operation
0100002000030000400005000060000
1 2 3 4 5 6 7 8 9 10 11 12 13 14 15 16 17 18 19 20 21 22 23 24
PV
PVS
• Illustrative PVS plant • 50MW PV / 50MW peak period export • Located in the Southwestern US • Profiles on sunny Spring day
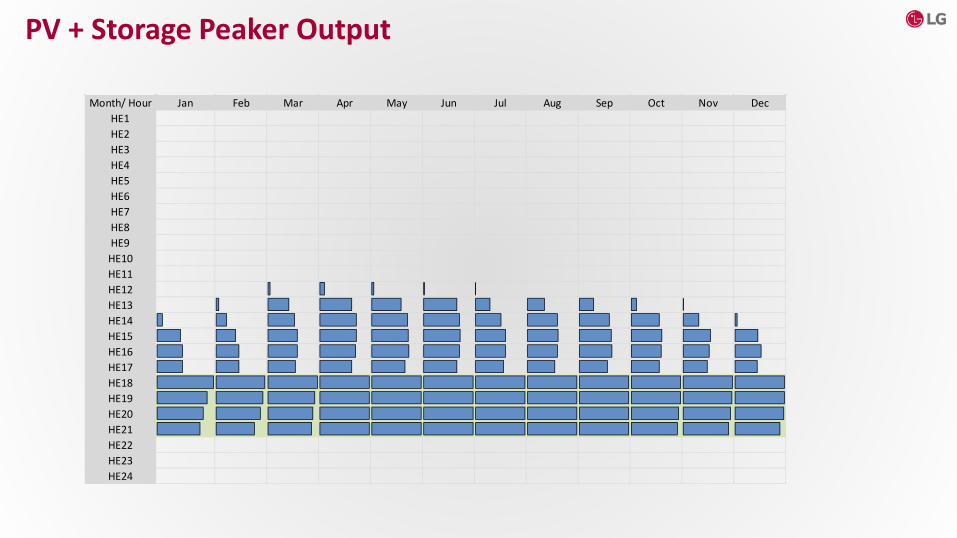
PV + Storage Peaker Output
Month/ Hour Jan Feb Mar Apr May Jun Jul Aug Sep Oct Nov DecHE1HE2HE3HE4HE5HE6HE7HE8HE9HE10HE11HE12HE13HE14HE15HE16HE17HE18HE19HE20HE21HE22HE23HE24
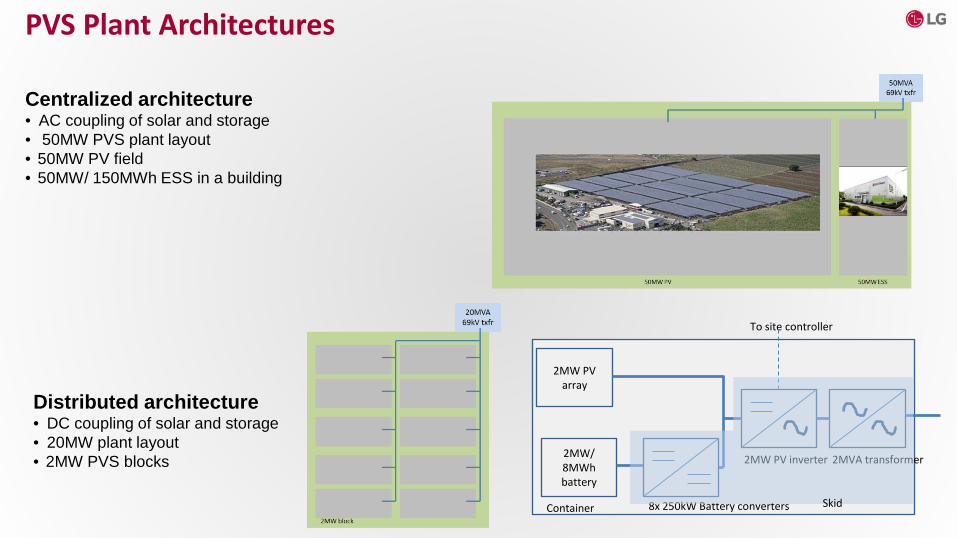
Centralized architecture • AC coupling of solar and storage • 50MW PVS plant layout • 50MW PV field • 50MW/ 150MWh ESS in a building
Distributed architecture • DC coupling of solar and storage • 20MW plant layout • 2MW PVS blocks
PVS Plant Architectures
2MW PV array
2MW PV inverter 2MW/ 8MWh battery
8x 250kW Battery converters
2MVA transformer
To site controller
Skid Container
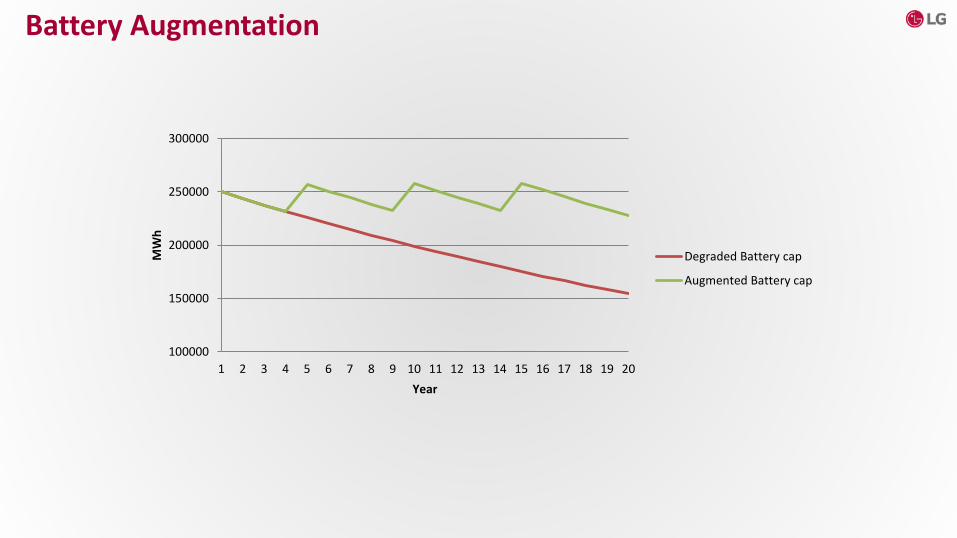
Battery Augmentation
100000
150000
200000
250000
300000
1 2 3 4 5 6 7 8 9 10 11 12 13 14 15 16 17 18 19 20
MW
h
Year
Degraded Battery cap
Augmented Battery cap
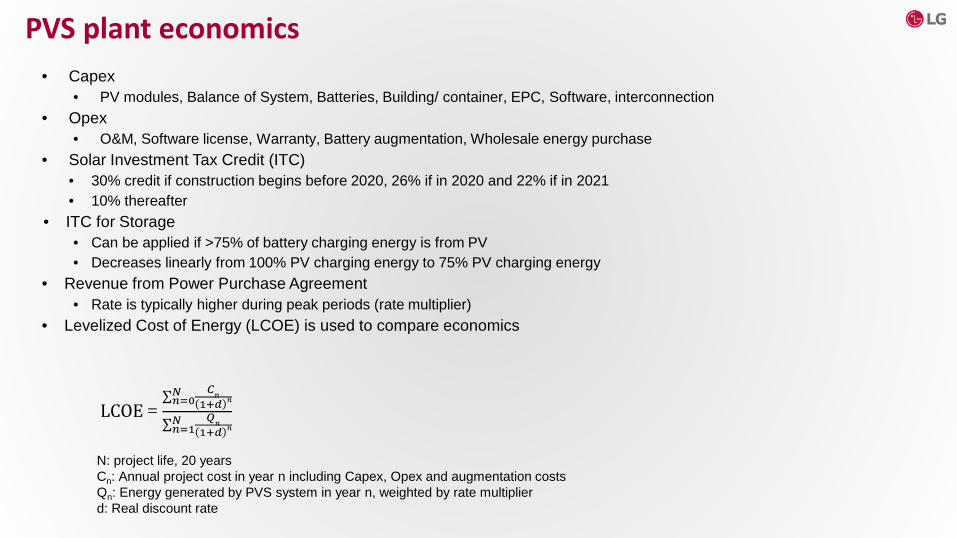
• Capex • PV modules, Balance of System, Batteries, Building/ container, EPC, Software, interconnection
• Opex • O&M, Software license, Warranty, Battery augmentation, Wholesale energy purchase
• Solar Investment Tax Credit (ITC) • 30% credit if construction begins before 2020, 26% if in 2020 and 22% if in 2021 • 10% thereafter
• ITC for Storage • Can be applied if >75% of battery charging energy is from PV • Decreases linearly from 100% PV charging energy to 75% PV charging energy
• Revenue from Power Purchase Agreement • Rate is typically higher during peak periods (rate multiplier)
• Levelized Cost of Energy (LCOE) is used to compare economics
PVS plant economics
LCOE = ∑ 𝐶𝑛
1+𝑑 𝑛𝑁𝑛=0
∑ 𝑄𝑛1+𝑑 𝑛
𝑁𝑛=1
N: project life, 20 years Cn: Annual project cost in year n including Capex, Opex and augmentation costs Qn: Energy generated by PVS system in year n, weighted by rate multiplier d: Real discount rate
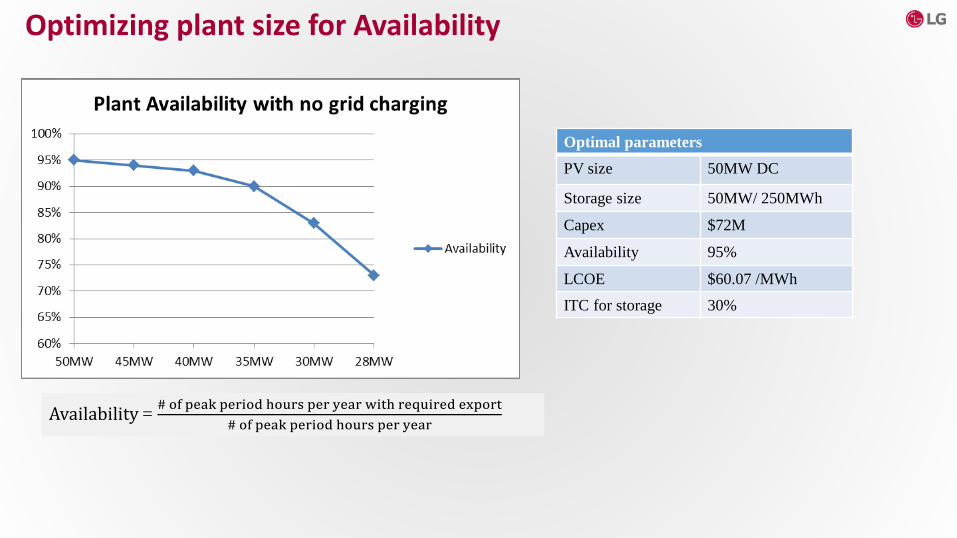
Optimizing plant size for Availability
Optimal parameters PV size 50MW DC
Storage size 50MW/ 250MWh
Capex $72M
Availability 95%
LCOE $60.07 /MWh
ITC for storage 30%
Availability = # of peak period hours per year with required export# of peak period hours per year
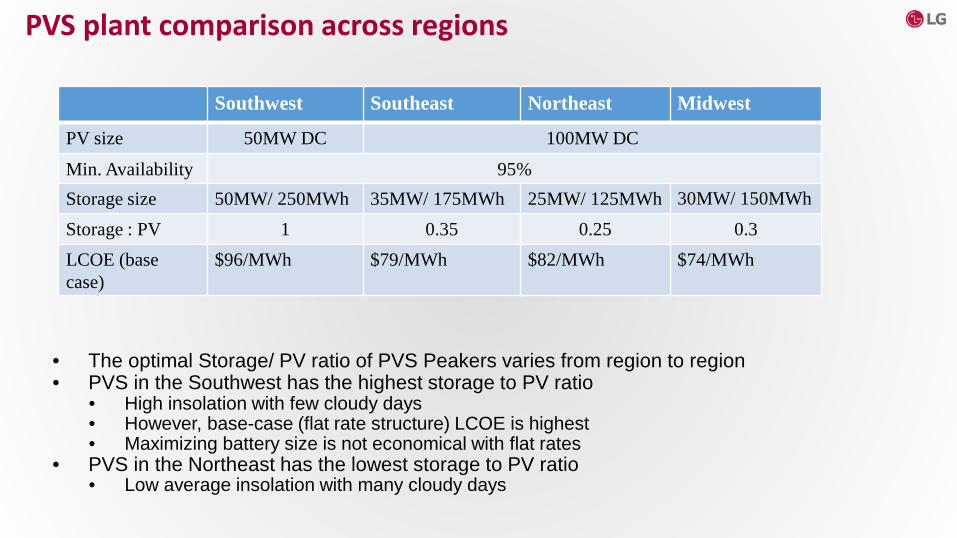
Southwest Southeast Northeast Midwest
PV size 50MW DC 100MW DC
Min. Availability 95% Storage size 50MW/ 250MWh 35MW/ 175MWh 25MW/ 125MWh 30MW/ 150MWh
Storage : PV 1 0.35 0.25 0.3 LCOE (base case)
$96/MWh $79/MWh $82/MWh $74/MWh
PVS plant comparison across regions
• The optimal Storage/ PV ratio of PVS Peakers varies from region to region • PVS in the Southwest has the highest storage to PV ratio
• High insolation with few cloudy days • However, base-case (flat rate structure) LCOE is highest • Maximizing battery size is not economical with flat rates
• PVS in the Northeast has the lowest storage to PV ratio • Low average insolation with many cloudy days

• Impact of rate multiplier • As the relative value of peak energy increases, LCOE of all plants decrease • But PVS in the Southwest shows the biggest improvement • For a multiplier of 3 and above, the Southwest PVS plant shows the best performance
• Competitive with Gas Combustion Turbine • At multiplier of 3 and above, PVS in all regions is competitive with Gas CT (2020 pricing)
Rate Multiplier = Peak Energy ValueNon−peak Energy Value
LCOE comparison

Month/ Hour Jan Feb Mar Apr May Jun Jul Aug Sep Oct Nov DecHE1HE2HE3HE4HE5HE6HE7HE8HE9HE10HE11HE12HE13HE14HE15HE16HE17HE18HE19HE20HE21HE22HE23HE24
PVS with grid charging enabled
Optimal plant parameters (Grid charging) PV size 30MW DC
Storage size 50MW/ 240MWh
Capex $60.2M
Availability 100%
LCOE $45.9 /MWh
ITC for storage 26%

• With partial grid charging • Optimal plant size is similar to the case of 30% ITC • Capex can be lowered by decreasing PV size • Lower ITC eligibility on storage
Optimizing charging strategy
• Optimized PVS peakers are competitive with gas peakers now (with the solar ITC) • PVS peakers should be optimized for LCOE considering both PV size and battery capacity
• The optimal Storage/ PV ratio of PVS Peakers varies from region to region • Distributed architecture of PVS plants can be competitive with centralized architecture even
for large capacity • Minimum required Availability will factor into PV sizing if grid charging is not initially enabled • Lower LCOE and Capex can be obtained by enabling grid charging while increasing
availability to 100%
Summary