Embed Size (px)
Citation preview

Painting the Data for Fun and Profit
William Ballenthin
Consultant
Mandiant
2
Agenda
• Introduction
• Exploring the Attacker Lifecycle
• Visually Reviewing Binary Files
• Making Sense of Malware Variants
• Q&A
33
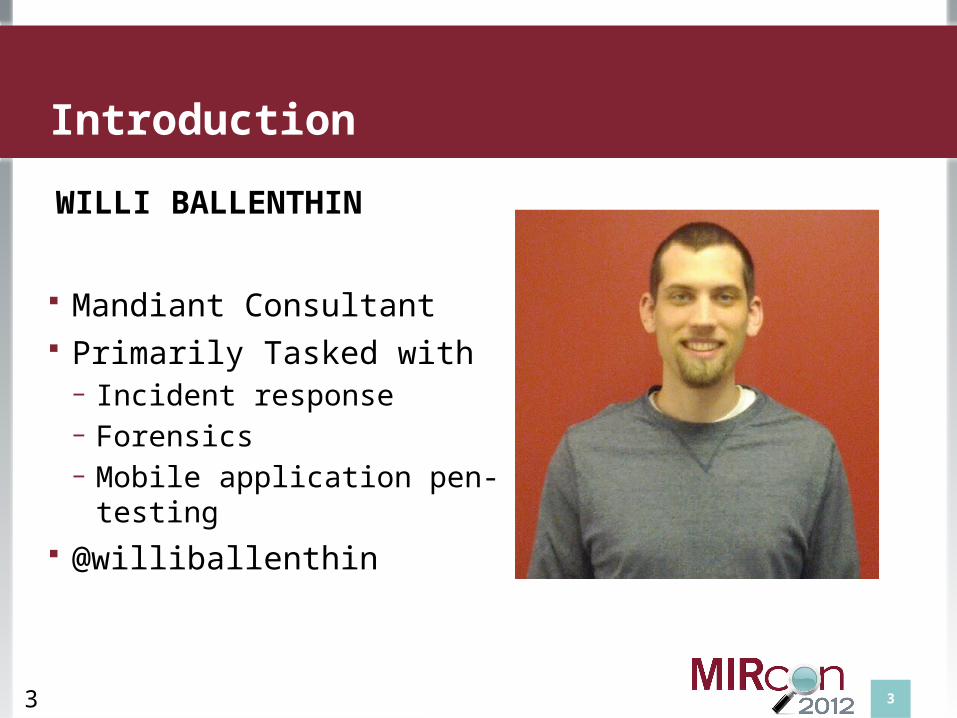
WILLI BALLENTHIN
Mandiant Consultant Primarily Tasked with
− Incident response− Forensics− Mobile application pen-testing
@williballenthin
Introduction

4
EXPLORING THE ATTACKER LIFECYCLE
5
Exploring the Attacker Lifecycle
• Problem Domaino During an IR, we collection many events, itemso They're all related on a macro scaleo And, if you're lucky, you're only dealing with one
adversary...
• How can we digest the "big picture" of a compromise while still retaining access to the details?
• Timelines are an accepted approach, but are they scalable?
6
Motivating Example
• We're in the middle of an IR with ~5,000 hosts
• There are a few adversaries in the environment
• Fortunately, we have a number of tools available
7
Potential Solutions
• Bodyfile/CSV/Excelo Handles a few hundred thousand entrieso View is usually a simple grido Data formatting?
• SIEMo Collects all the data, so its ready to goo Interface may be a bit... cumbersome

8
Potential Solutions
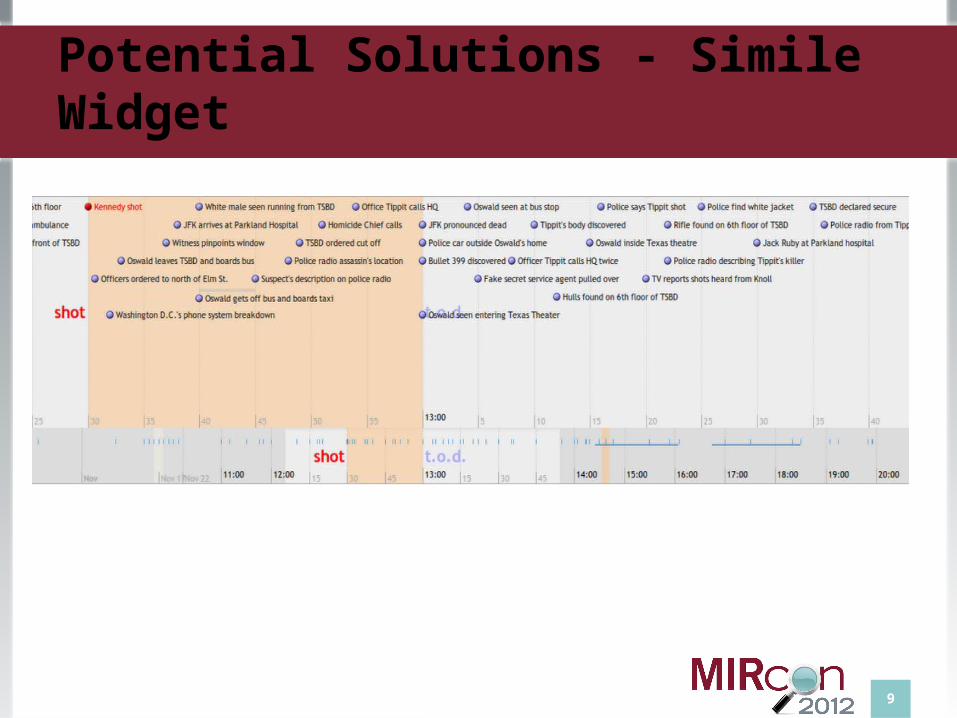
• Simile Widgeto Interactive HTML + JavaScript widget o MIT libraries, http://www.simile-widgets.org/timeline/o Tons of fun to play with!o Does not scale to 10s of thousands of itemso HTML page generation is required
9
Potential Solutions - Simile Widget
10
Enter: TimeFlow
11
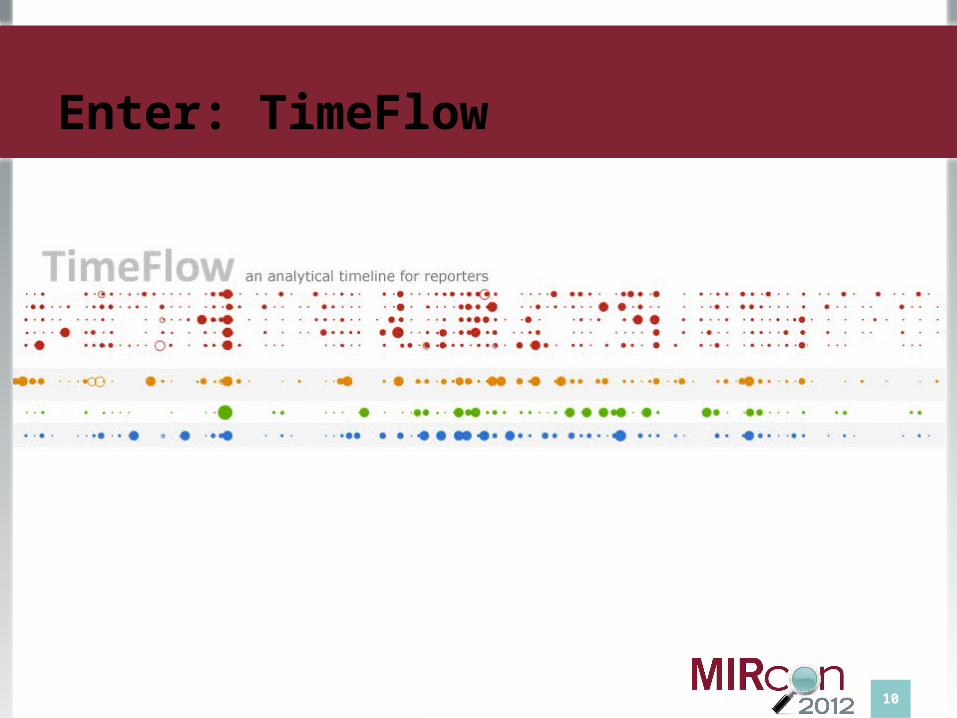
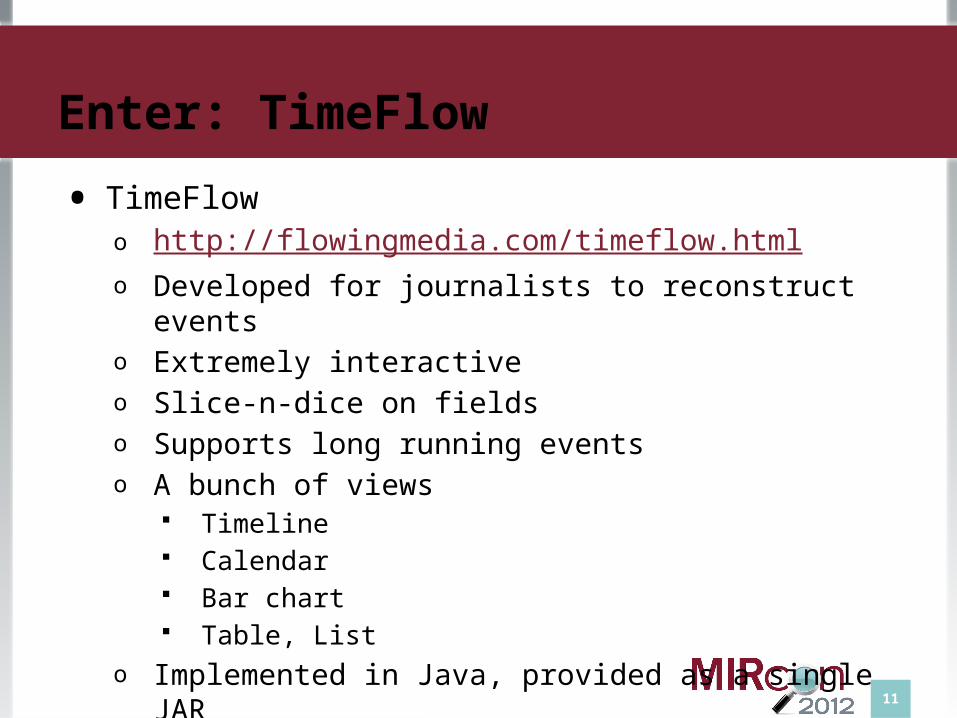
Enter: TimeFlow
• TimeFlowo http://flowingmedia.com/timeflow.htmlo Developed for journalists to reconstruct eventso Extremely interactiveo Slice-n-dice on fieldso Supports long running eventso A bunch of views
Timeline Calendar Bar chart Table, List
o Implemented in Java, provided as a single JAR
12
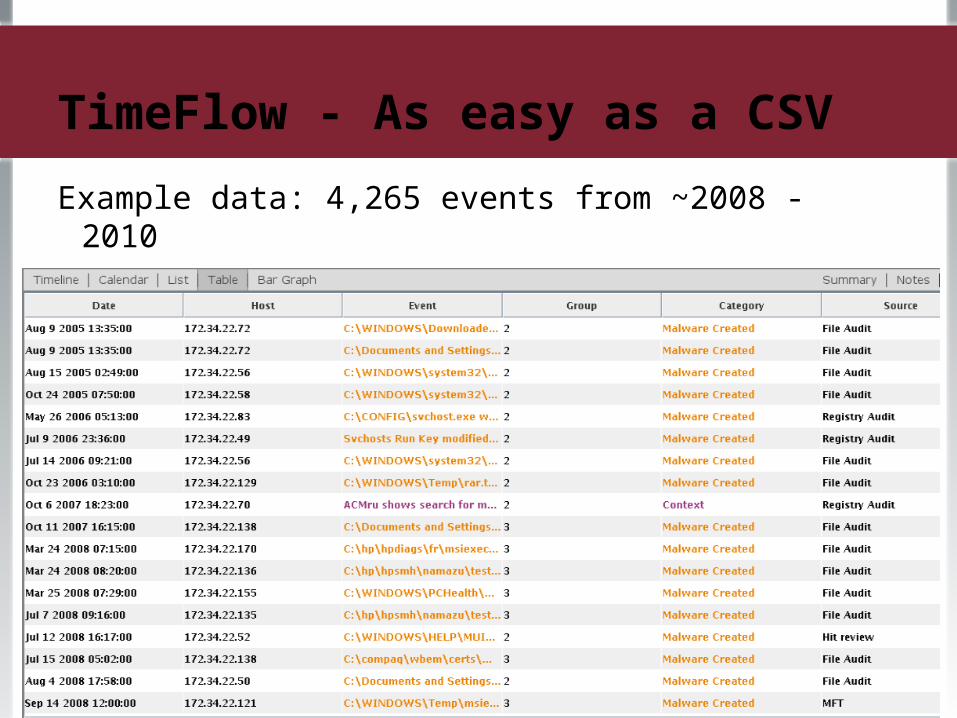
TimeFlow - As easy as a CSV
Example data: 4,265 events from ~2008 - 2010
13
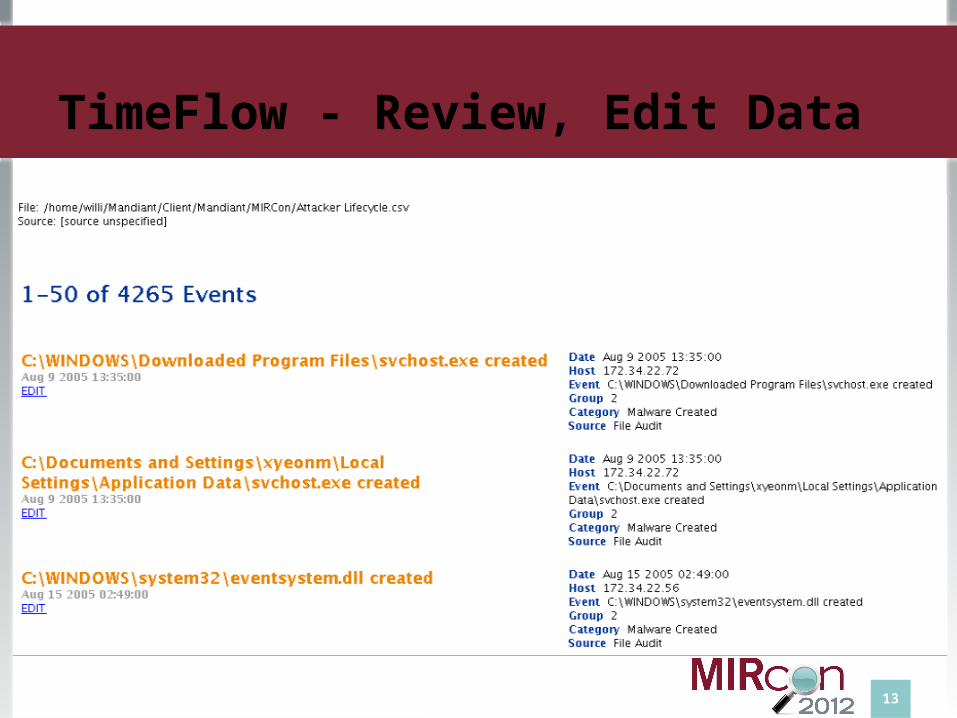
TimeFlow - Review, Edit Data
14
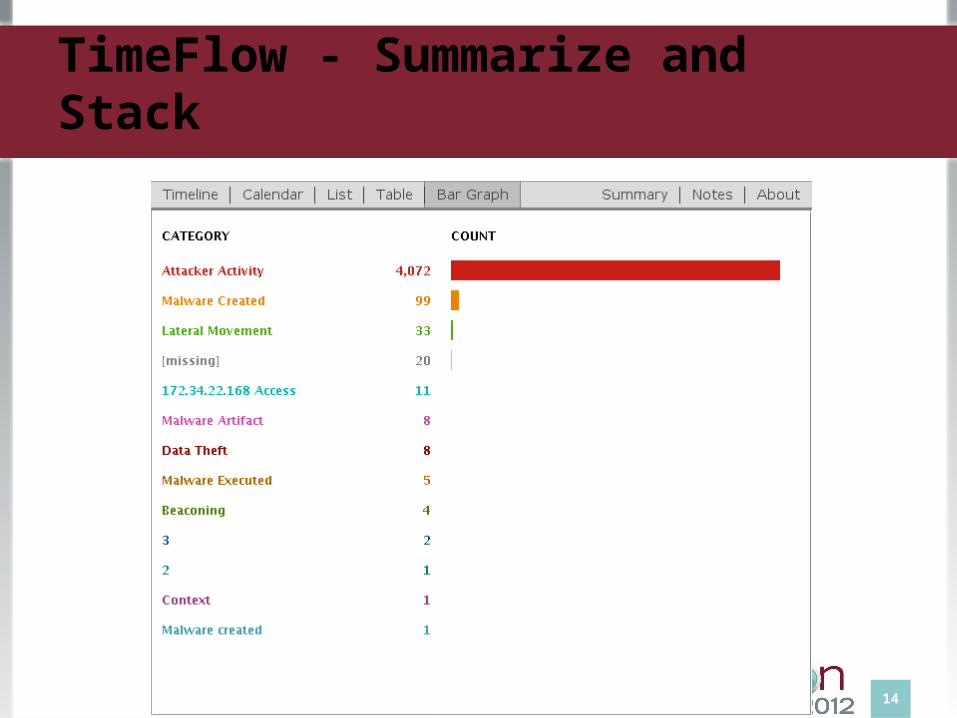
TimeFlow - Summarize and Stack
15
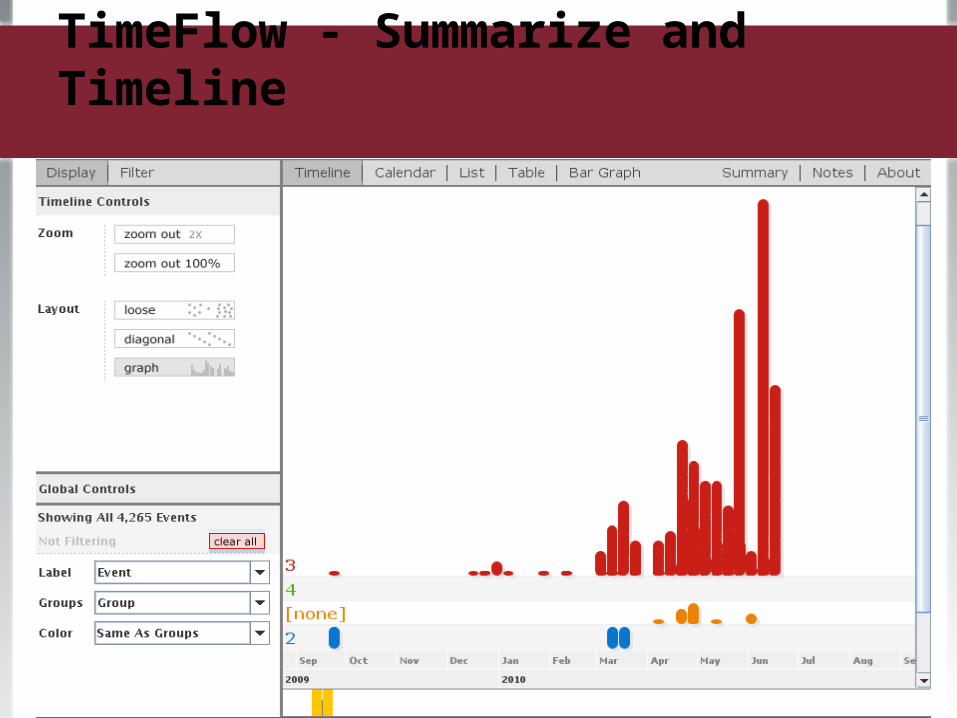
TimeFlow - Summarize and Timeline
16
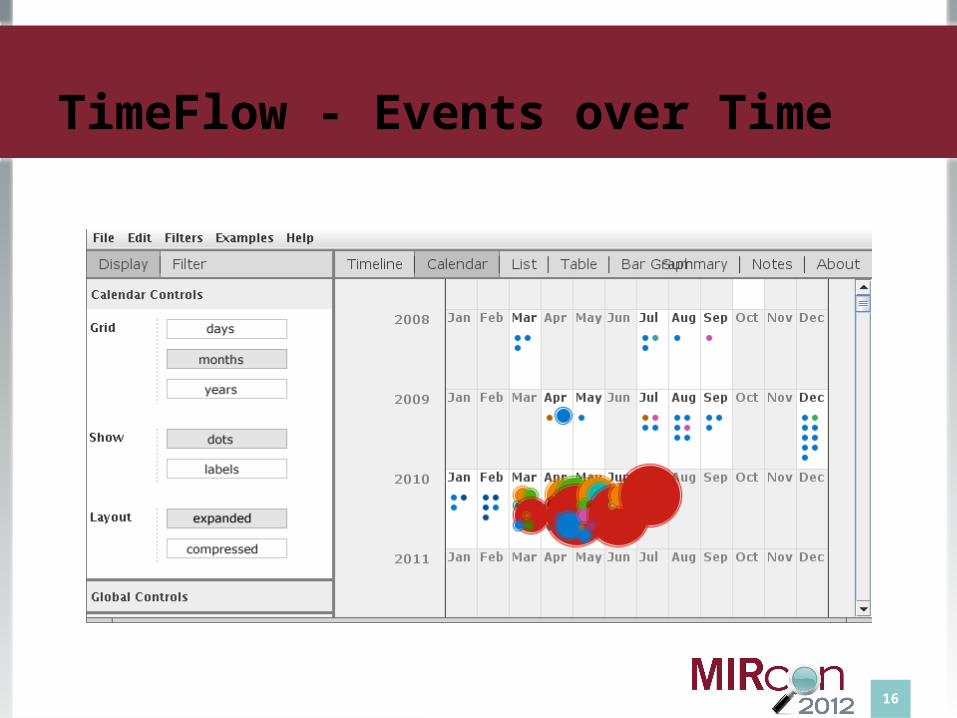
TimeFlow - Events over Time
17
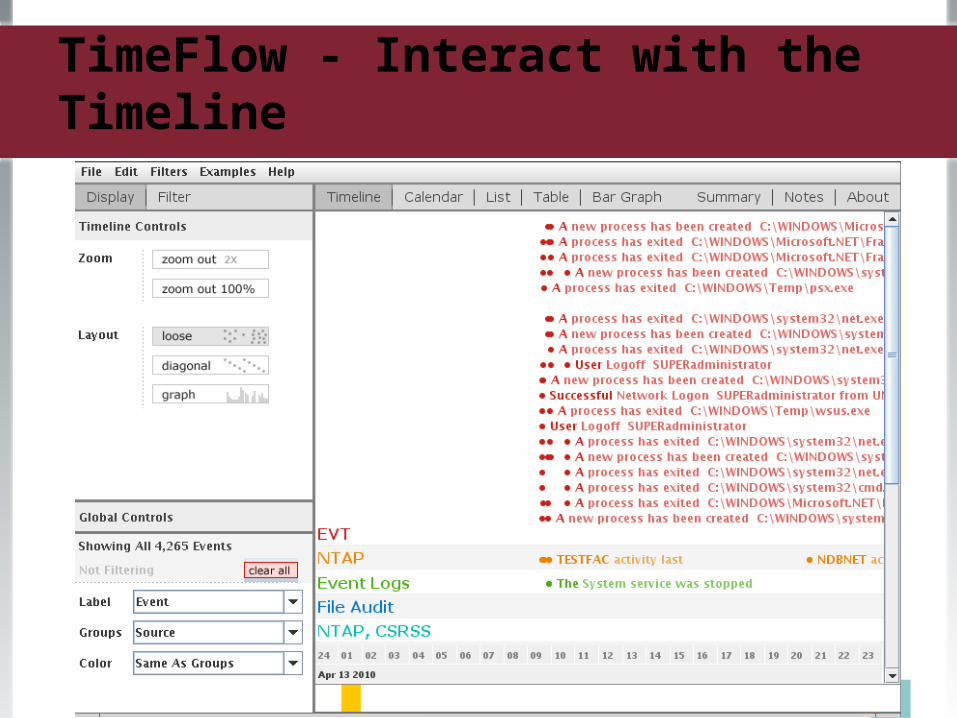
TimeFlow - Interact with the Timeline

18
VISUALLY REVIEWING BINARY FILES
19
Visually Reviewing Binary Files
• Problem Domaino We treat files as (file names + arbitrary data)o But, what do files look like?
A step above hex encodingso Hashes, even SSDeep, have little meaning
• Once we start looking at files, can we compare them?
20
Motivating Example
• We have two completely unknown files recovered during disk forensics
• Do they have a similar structure?o Sure, we can use traditional techniques, like `file`, but
this doesn't capture embedded structures
21
Potential Solutions
• `file` - guess the file type based on headers and file structure
• `diff` - compare text and show differences
• Hex editor "compare files..."
• Distance function from part 3
• Domain-specific toolso e.g. `objdump` for executable files
22
Let's try to draw the files
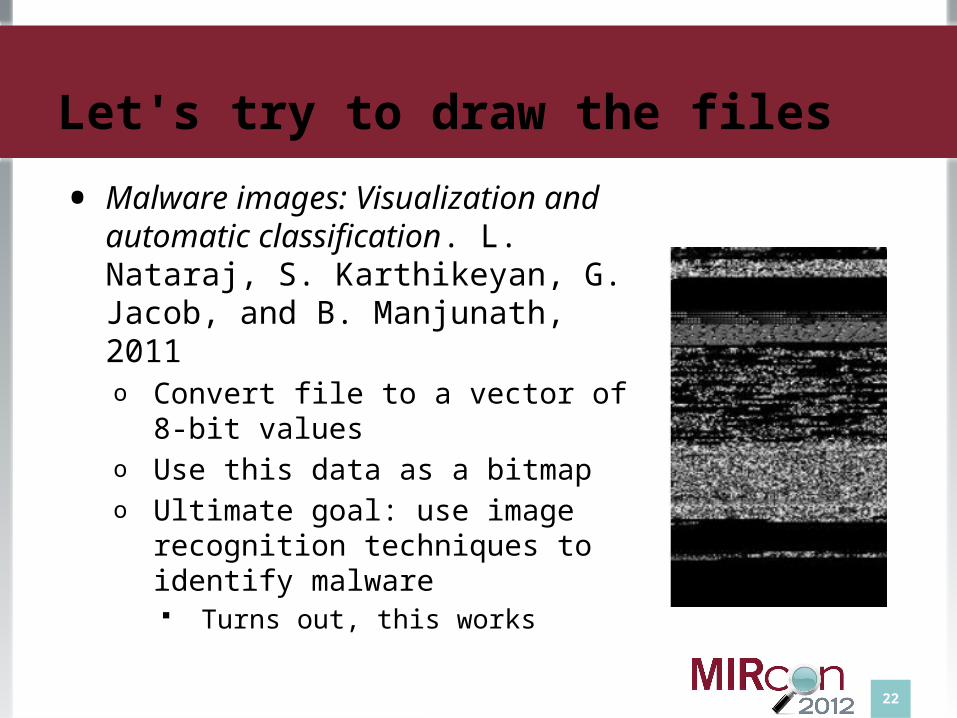
• Malware images: Visualization and automatic classification. L. Nataraj, S. Karthikeyan, G. Jacob, and B. Manjunath, 2011o Convert file to a vector of 8-bit valueso Use this data as a bitmapo Ultimate goal: use image recognition
techniques to identify malware Turns out, this works
23
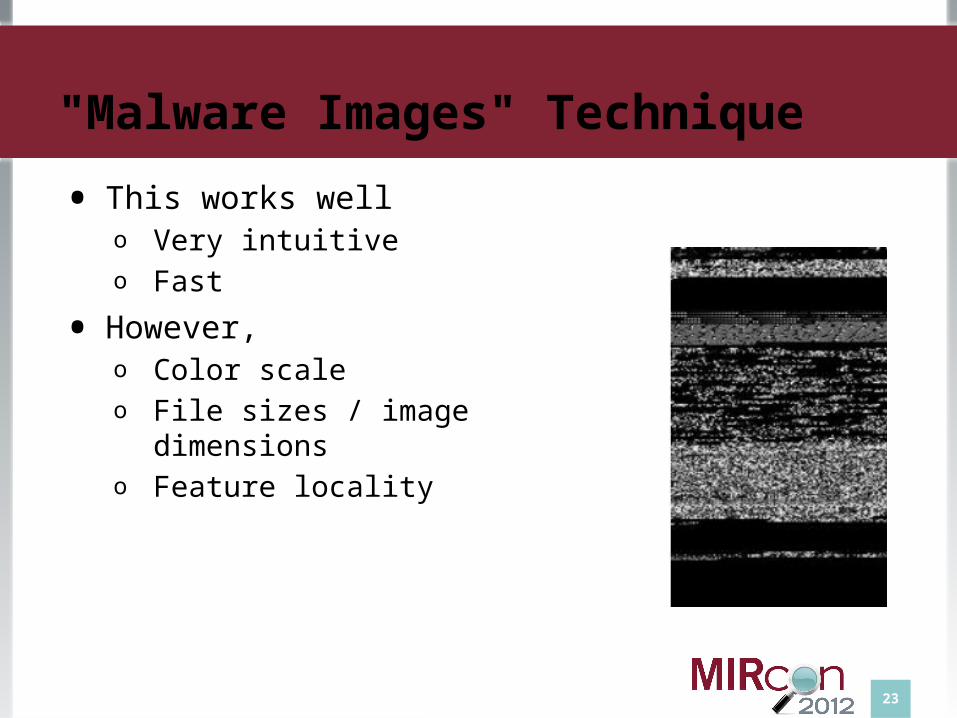
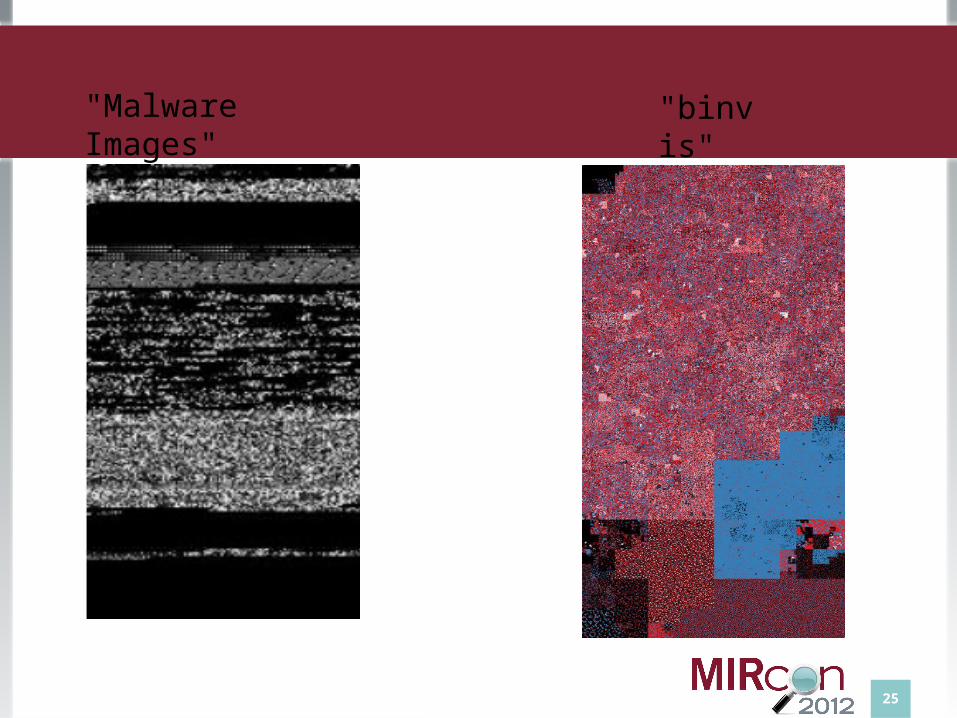
"Malware Images" Technique
• This works wello Very intuitiveo Fast
• However, o Color scaleo File sizes / image dimensionso Feature locality
24
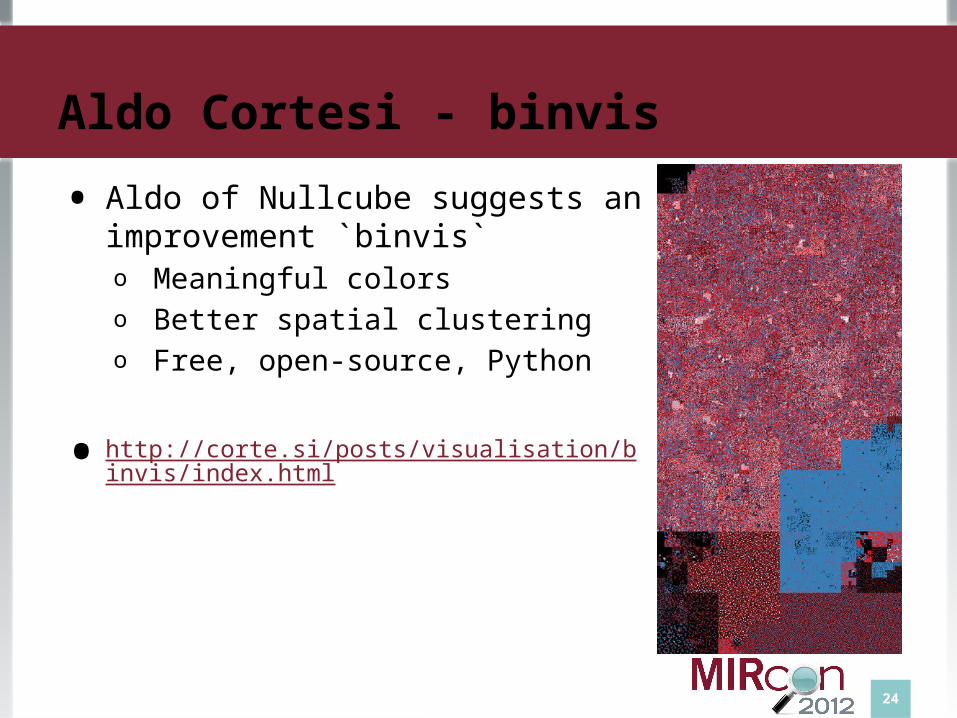
Aldo Cortesi - binvis
• Aldo of Nullcube suggests an improvement `binvis`o Meaningful colorso Better spatial clusteringo Free, open-source, Python
• http://corte.si/posts/visualisation/binvis/index.html
25
"Malware Images" "binvis"
26
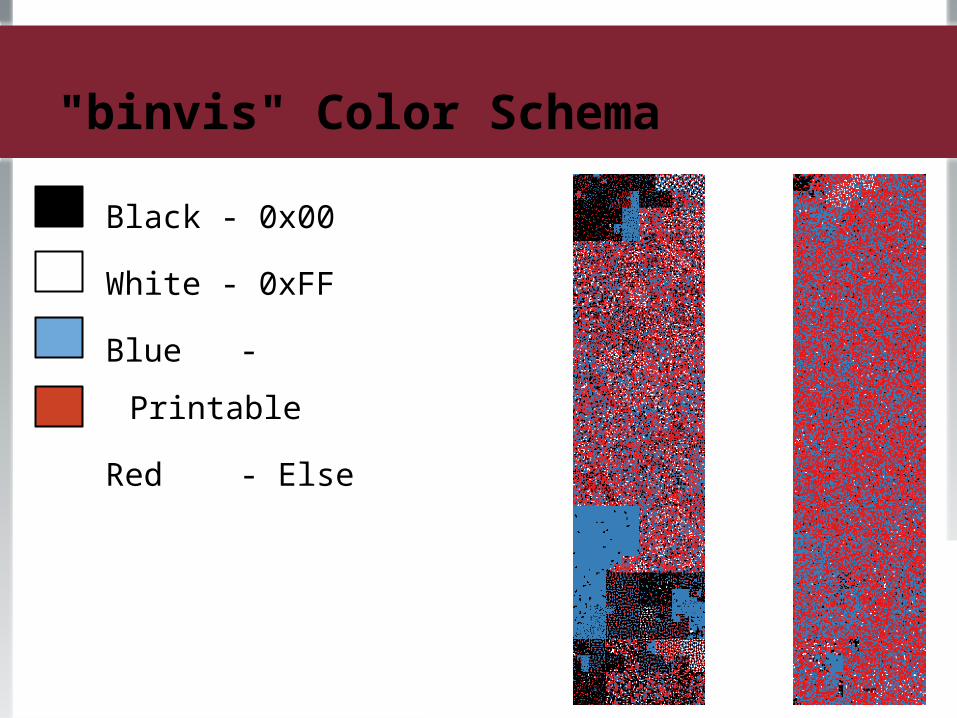
"binvis" Color Schema
Black - 0x00
White - 0xFF
Blue - Printable
Red - Else
27
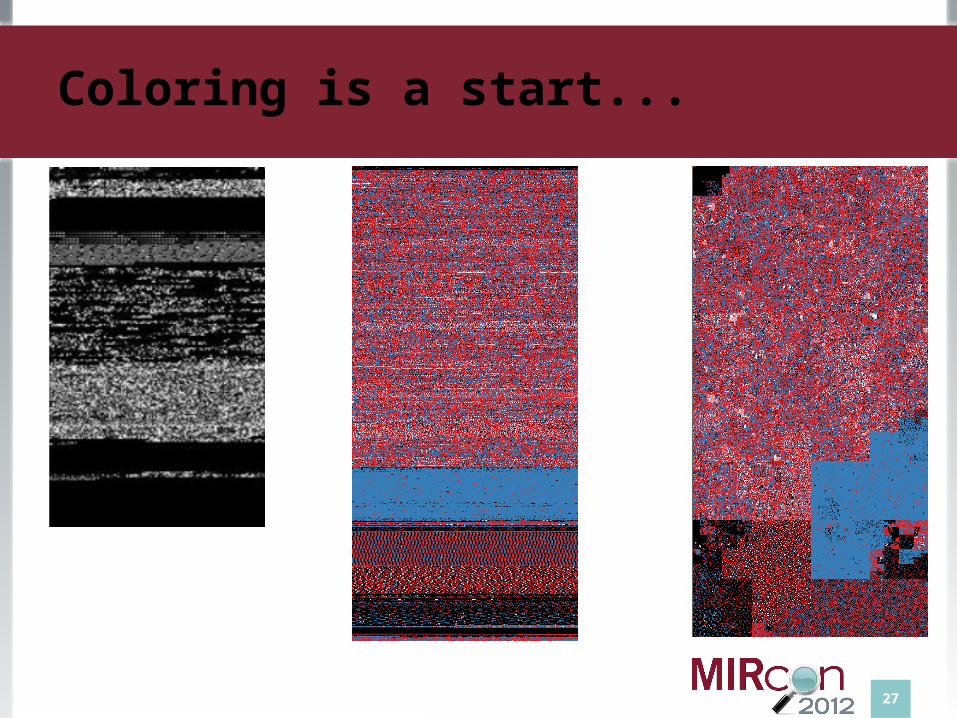
Coloring is a start...

28
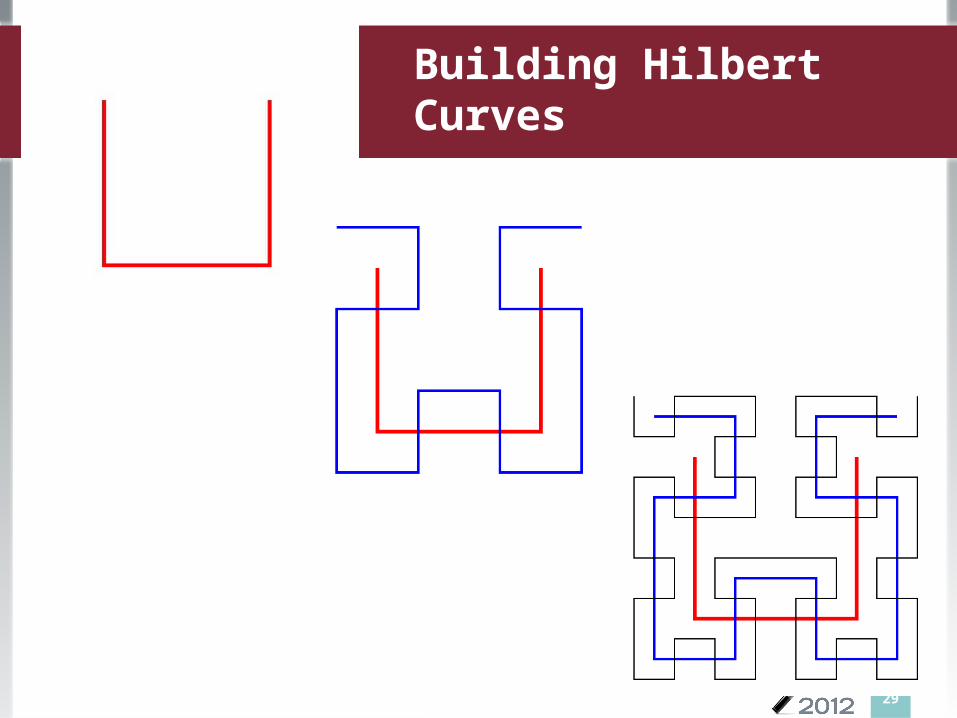
Some mathematics: Hilbert Curves
• Space filling curveso Intuitively, draw line along all points in a region without
crossingo Why? Georg Cantor: the infinite points on a unit line has
the same cardinality as the infinite points in the unit square
• Hilbert curveo David Hilbert in 1891o Mapping preserves (some) locality from 1D to 2Do Close association with fractals, so plots are
approximations
29
Building Hilbert Curves
30
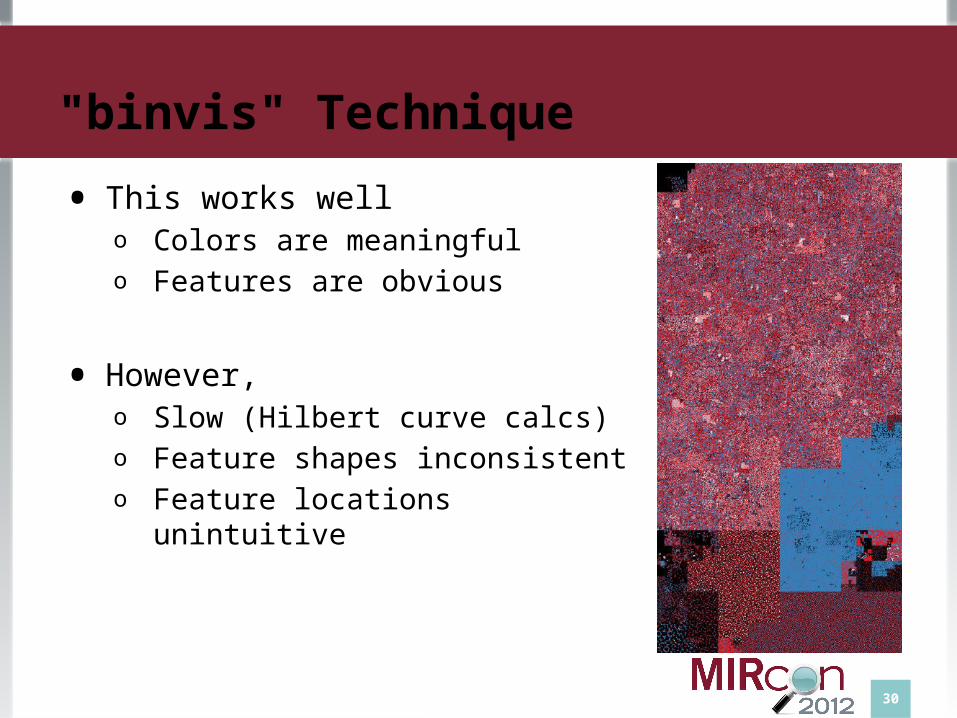
"binvis" Technique
• This works wello Colors are meaningfulo Features are obvious
• However, o Slow (Hilbert curve calcs)o Feature shapes inconsistento Feature locations unintuitive
31
MAKING SENSE OF MALWARE VARIANTS
32
Making Sense of Malware Variants
• Problem Domaino Malware is not uniqueo Variants are grouped into families
zbot/Zeus Trojan Poison Ivy RAT Gh0st RAT
• How do we identify families?o Differences in settings
C2 domains or IPso Differences in capabilities
Gh0st extended to inject shellcodeo Differences in bugs
New versions of Poison Ivy
33
Motivating Example
• A client gives us 500 malwarez and asks for a report on each oneo We know many share the same author, intento Let's just find the families, pick representative samples,
and reverse those, instead
• Resulto Client is happy and richero We spend less time in front of IDA
34
Data Sources
• Binary file similarities (static)o Entropyo Fuzzy hashing - ssdeep
• Malware analysis sandboxes (dynamic)o Cuckoo sandbox, Mandiant Threat Analyzer
• PE file similarities (static)o objdump
• Disassembly-based graph theory comparisons (static)o bindiff
• Anti-virus signatures
• Malware analyst brains (expensive)
35
Clustering
• Explorative data mining
• From a bunch of samples, produce groups of similar things
• Here, require only a distance function to identify nearest neighborso Distance function: a metric between two samples that
describes how similar (or different) they areo Compose a distance function from a set of weighted
metrics
D(x,y) = a0 * d0(x,y) + a1 * d1(x,y) + ... aN * dN(x,y)
36
Distance Function Ideas - Static Analysis
• Find the range of the function and normalizeo e.g. Entropy, scale to 1.0 by dividing by 8.0
o Other numeric functions, you may scale by the standard
deviation
o Categorical distance metric - use a points-based function 10 points * number of shared imports, max. 10
20 points if both are a DLL
etc.
37
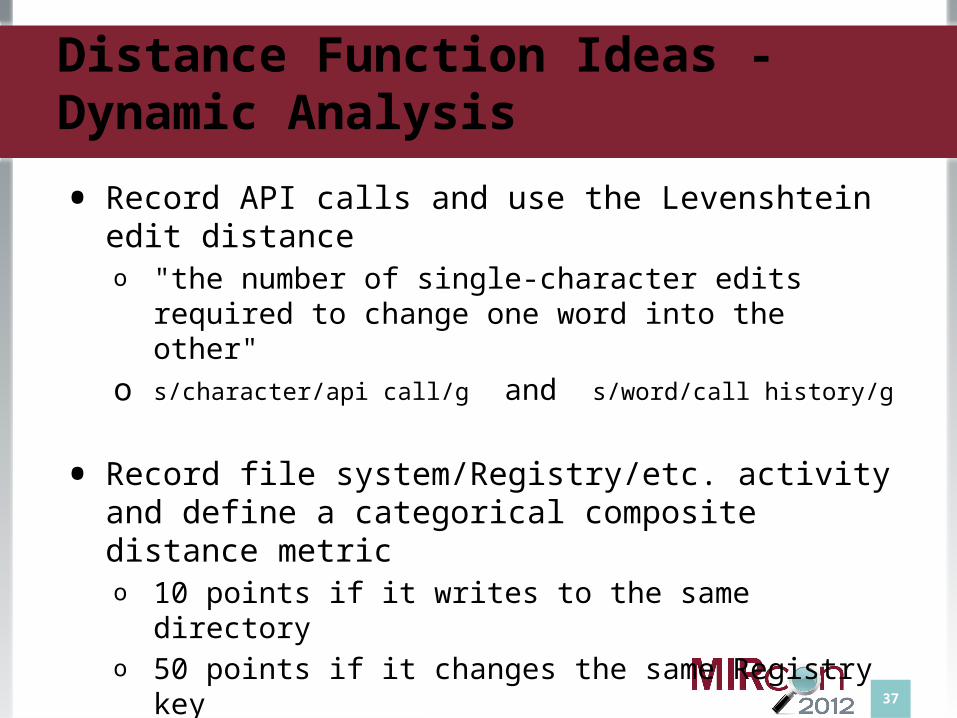
Distance Function Ideas - Dynamic Analysis
• Record API calls and use the Levenshtein edit distanceo "the number of single-character edits required to change
one word into the other"o s/character/api call/g and s/word/call history/g
• Record file system/Registry/etc. activity and define a categorical composite distance metrico 10 points if it writes to the same directoryo 50 points if it changes the same Registry key
38
Let's find some families
• We'll use a force-directed layout when graphing nodeso aka. minimize a global energy functiono akka. pretend each spring is a bowling ball and there's
springs among all the ballso Graphviz
http://www.graphviz.org/ 'neato', 'fdp', and 'sfdp' layout algorithms
o Gephi https://gephi.org/ "an interactive visualization and exploration platform for
networks and complex systems"
39
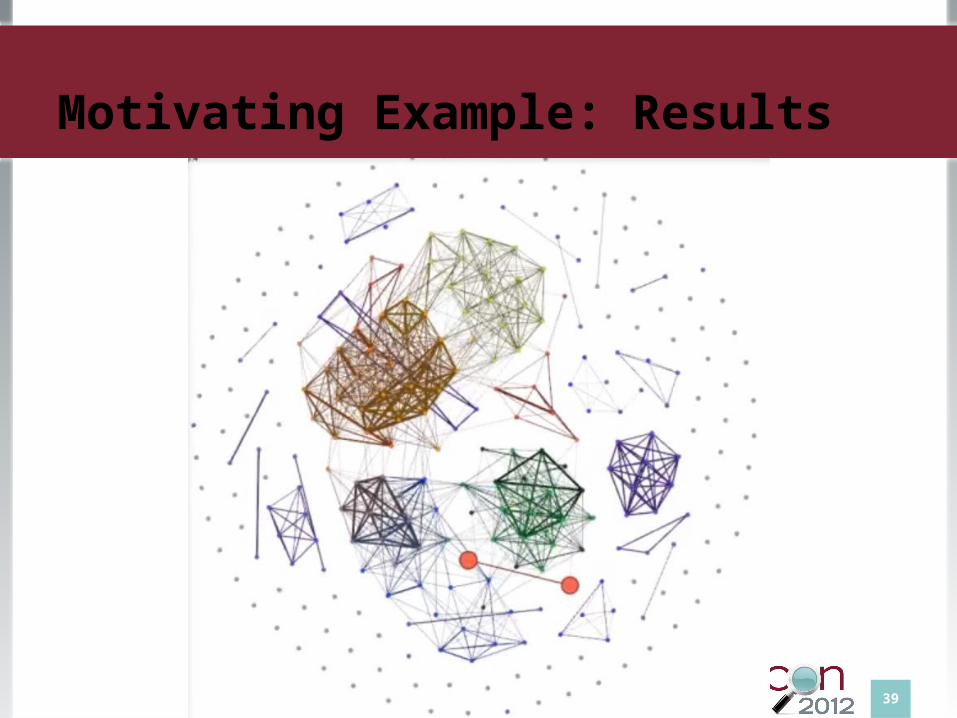
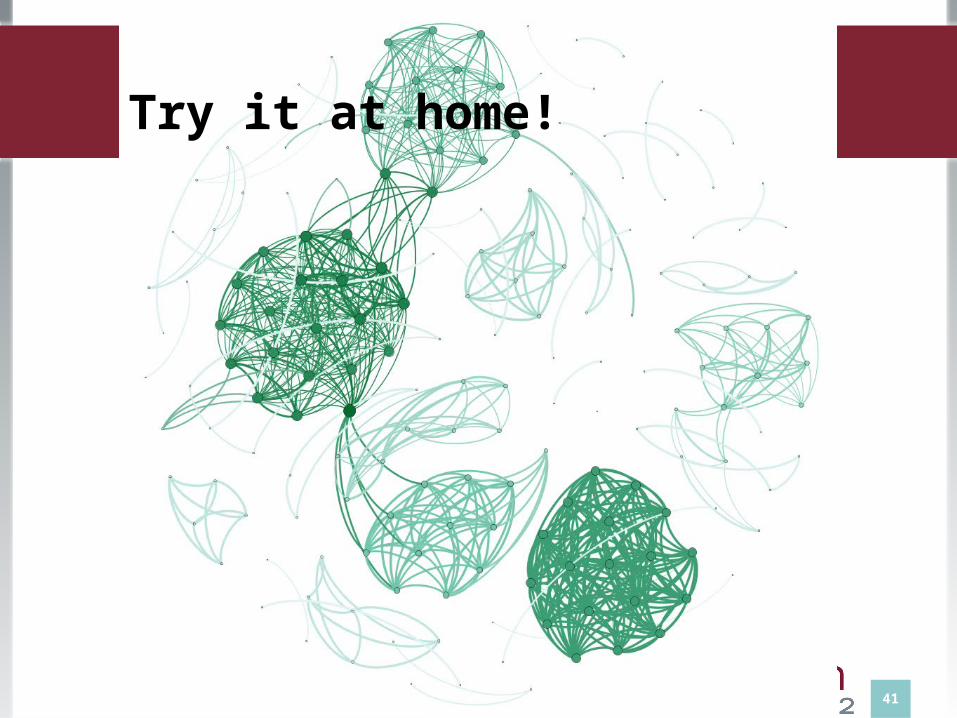
Motivating Example: Results
40
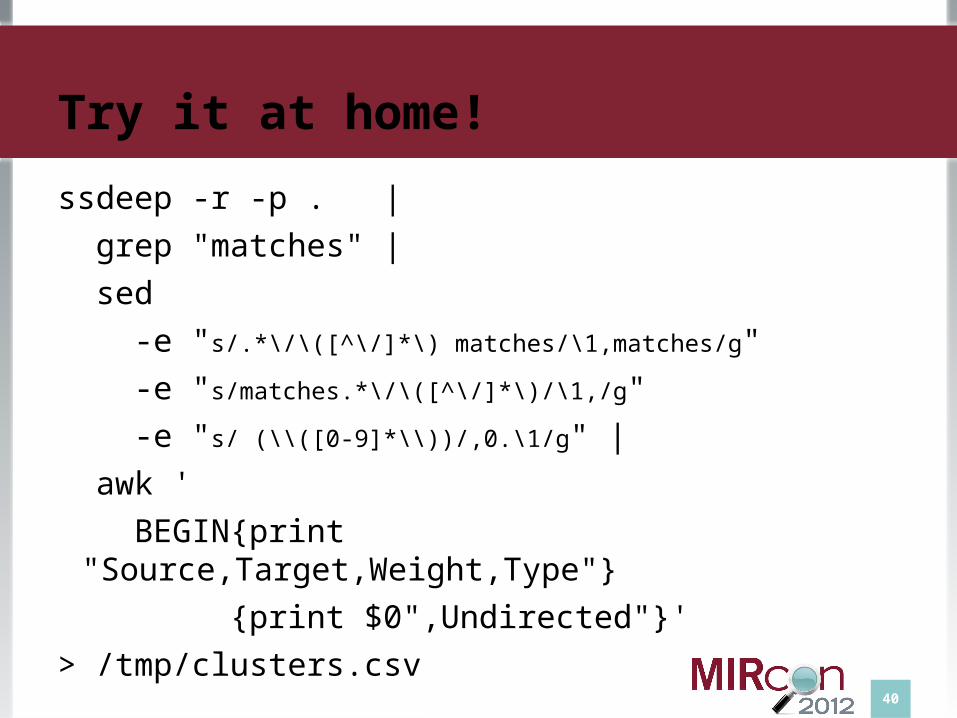
Try it at home!
ssdeep -r -p . |
grep "matches" |
sed
-e "s/.*\/\([^\/]*\) matches/\1,matches/g"
-e "s/matches.*\/\([^\/]*\)/\1,/g"
-e "s/ (\\([0-9]*\\))/,0.\1/g" |
awk '
BEGIN{print "Source,Target,Weight,Type"}
{print $0",Undirected"}'
> /tmp/clusters.csv
41
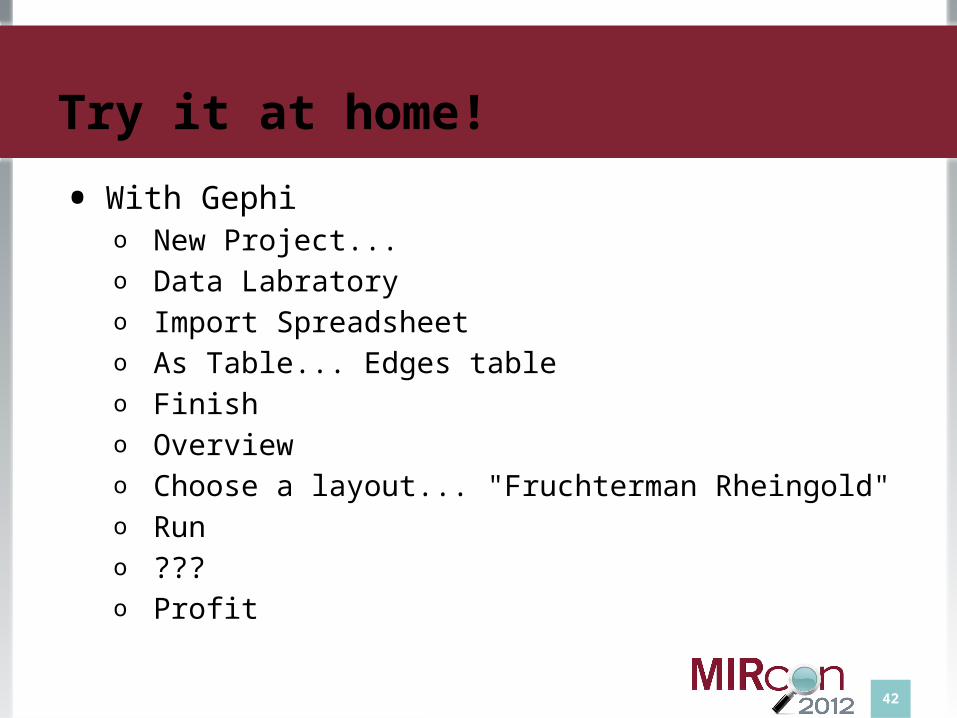
Try it at home!
42
Try it at home!
• With Gephi o New Project...o Data Labratoryo Import Spreadsheeto As Table... Edges tableo Finisho Overviewo Choose a layout... "Fruchterman Rheingold"o Runo ???o Profit

43
Q&A
44
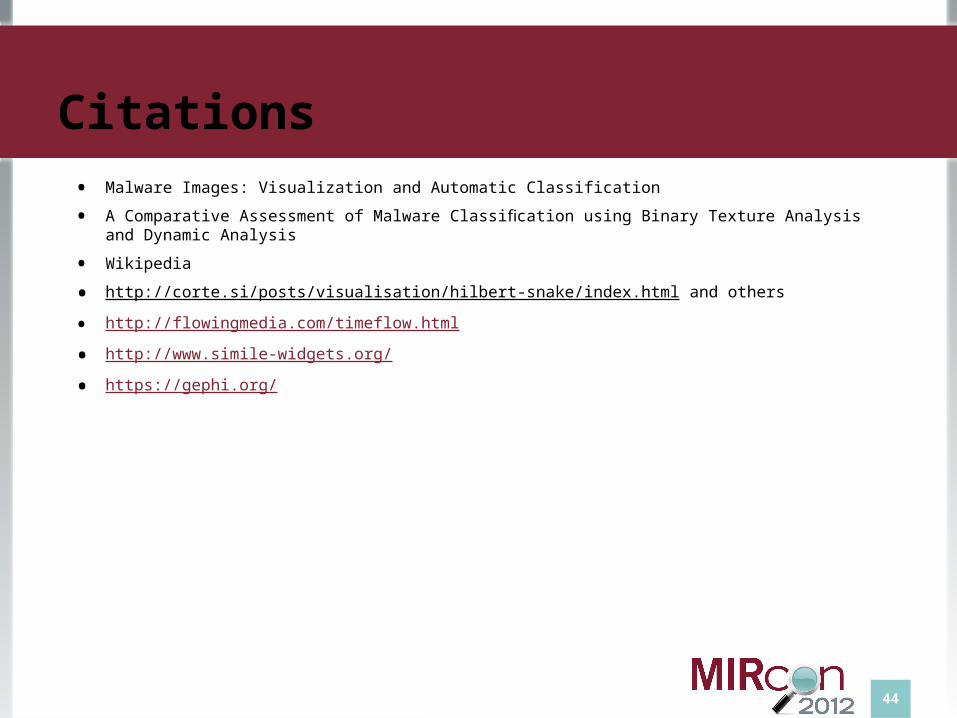
Citations• Malware Images: Visualization and Automatic Classification
• A Comparative Assessment of Malware Classification using Binary Texture Analysis and Dynamic Analysis
• Wikipedia
• http://corte.si/posts/visualisation/hilbert-snake/index.html and others
• http://flowingmedia.com/timeflow.html
• http://www.simile-widgets.org/
• https://gephi.org/