Embed Size (px)
Citation preview
This file is part of the following reference:
Page, Rayner Luke (2006) Ground detection sensor for cane harvester base-cutter height control. Masters
(Research) thesis, James Cook University.
Access to this file is available from:
http://eprints.jcu.edu.au/2123
Ground Detection Sensor for Cane Harvester Base-Cutter
Height Control
Thesis submitted by
Rayner Luke PAGE BEng(Hons) Qld
in November 2006
for the degree of Masters of Engineering Science (Research) in the School of Engineering
James Cook University
Abstract
The harvesting of sugar cane is the first stage in the commercial milling of sugar
cane to produce sugar and plays a major role in determining the overall
efficiency of the sugar production process. In Australia, where virtually all sugar
cane is harvested using mechanical harvesters, efficient operation of the
harvester is essential to reduce operating costs. One area of harvesting that has,
on numerous occasions, been identified as an impediment to improved harvester
efficiency is the adjustment of the base cutter height. Improper setting during
harvesting has a number of serious consequences for sugar production including
reduced production, crop damage, additional harvester running costs and
inefficient transportation and milling of the sugar cane due to the introduction of
dirt.
The overall aim of this thesis was to develop a ground detection sensor based on
microwave radar technology that could sense ground level in front of a working
sugar cane harvester. The eventual purpose of such a device would be to
automatically control the cutting height to the optimum level and thus
improving the efficiency of the harvesting, farming and milling processes.
The measurement technique investigated is based upon the use of a radio
transmitter and receiver positioned on either side of the row of sugar cane. The
principle of this design is that a receiver close to ground level would experience
more attenuation from the soil than a receiver positioned well above ground
level. Thus, it was suggested that changes in the received signal strength with
respect to the height above ground level could be used to detect changes in the
height of the ground.
The project evolved in two main stages. Initially, work concentrated on verifying
the sensing principle in the laboratory and later in the field. Testing verified the
proposed measurement procedure with the following major conclusions. Firstly,
for best results a radio signal of 2-3GHz polarised horizontal to the ground was
most suitable. This signal provided the best compromise between being
insensitive to the presence of the sugar cane while still allowing practical sized
antennas to be employed. Secondly, field-testing showed that the sugar cane
stalks do affect the ideal sensor response with the orientation and condition
(density, leaf matter, etc) of the sugar cane having a noticeable influence on the
measurements. These results suggested that a practical sensor would need to
incorporate automatic compensation for the variations in the sugar cane and that
some averaging or signal processing would have to be applied to remove the
underlying trends.
The second stage of the project involved building a prototype sensor and testing
it on a working sugar cane harvester. The prototype worked by measuring the
received amplitude of a 2.4GHz, horizontally polarised microwave radio signal
that was transmitted from one side of the sugar cane row to the other. For this
application, multiple receivers are stacked vertically to measure the full height
profile instantaneously. The idea of using multiple receivers with some
positioned well above the ground level, was to compensate for the changing
density of the sugar cane. The transmitter and receiver antennas were based on
rectangular microstrip patch antenna arrays. The low profile of these patch
antennas meant that they were ideal for flush mounting on the harvesters’ crop
divider walls. Dedicated transmitter and receiver electronics was also needed to
generate and detect the microwave radio signals used by this system. A full
control system and data logger was developed for this application.
The prototype sensor that was developed was trialled on an Austoft harvester
over a one week period in the Burnett region. Theses tests were used to confirm
that the sensor would work and that it could survive the harsh conditions
experienced during harvesting.
Overall, the aim of this thesis was to test the potential of the microwave ground
height detection sensor for automated control of the base cutter height on sugar
cane harvester and to develop a plan to use this technology in a commercial base
cutter height control system.

Statement Of Access
I, the undersigned, author of this work, understand that James Cook University
will make this thesis available for use within the University Library and, via the
Australian Digital Theses network, for use elsewhere.
I understand that, as an unpublished work, a thesis has significant protection
under the Copyright Act and;
I wish the following restrictions to be placed on this work :
All users consulting this thesis will have to sign the following statement:
“In consulting this thesis, I agree not to copy or closely paraphrase it in whole or
in part without the written consent of the author; and to make proper public
written acknowledgment for any assistance which I have obtained from it.”
Beyond this, I do not wish to place any further restriction on access to this work.
Rayner Page
/ /

Electronic Copy
I, the undersigned, the author of this work, declare that the electronic copy of
this thesis provided to the James Cook University Library is an accurate copy of
the print thesis submitted, within the limits of the technology available.
Rayner Page
/ /

Statement Of Sources
Declaration
I declare that this thesis is my own work and has not been submitted in any form
for another degree or diploma at any university or other institution of tertiary
education. Information derived from the published or unpublished work of
others has been acknowledged in the text and a list of references is given.
Rayner Page
/ /
Acknowledgements
I would like to thank my wife Rebecca for the support over the years that it has
taken to write this thesis. I spent many hours locked away in the study where I
was supplied with endless cups of coffee and hot chocolate, for this I am very
grateful, so thank you. My appreciation also goes to the numerous people who
proof read this in its entirety, you all know who you are.
This work would not have been possible without the financial support of the
Sugar Research and Development Corporation and the assistance of numerous
people from different organizations. The people named below are gratefully
acknowledged for their assistance during and through out the duration of this
project.
Dr. Graham Woods. (James Cook University, Townsville)
Dr. Matt Schembri. (Sugar Research Institute, Mackay)
Mr. John Ellis. (James Cook University, Townsville)
Mr. John Renehan. (James Cook University, Townsville)
Mr. John Becker. (James Cook University, Townsville)
Mr. Mal Baker. (Case Pty Ltd, Bundaberg)
Mr. Ian Stanton. (Case Pty Ltd, Bundaberg)
Mr. Graham Yates. (Case Pty Ltd, Bundaberg)
Mr. John Irving. (Irving Farm Services, Ingham)
Publications arising from this work
1. WOODS, G.S., MASKELL, D.L. and RUXTON, A. “Microwave Ground Level Detection Sensor” 1999 Asia Pacific Microwave Conference, Singapore, 30 November - 3 December 1999, pp. 531-534.
2. PAGE, R.L. and WOODS, G.S. “Sensing of Ground Level through Sugar Cane
using Microwave Techniques”, Workshop on Applications of Radio Science (WARS’00), La Trobe University, 27th – 29th April, 2000.
3. WOODS, G.S. and PAGE, R.L. “Automated base cutter height control” JCU Sugar
Technology 2000, Conference 8th November 2000. 4. WOODS, G.S., PAGE, R.L. and MASKELL, D.L. “Ground Height Detection Sensor
for Control of Harvesting Equipment” 2002 Asia Pacific Microwave Conference, Kyoto, Japan, 19-22 November, 2002.
Table Of Contents
Chapter 1: Background............................................................................................. 15 1.1 Introduction .................................................................................................... 15 1.2 Growing Sugar Cane ..................................................................................... 17 1.3 Problems with Inefficient Base cutter Height Control.............................. 19
1.3.1 Benefits to the Farming Sector ............................................................. 20 1.3.2 Benefits to the Harvesting Sector......................................................... 22 1.3.3 Benefits to the Refining Sector ............................................................. 26
1.4 Background..................................................................................................... 28 1.5 Sensing Techniques........................................................................................ 29
1.5.1 Mechanical Contact Sensors ................................................................. 34 1.5.2 Hydraulic Pressure Sensors.................................................................. 36 1.5.3 Ultrasonic Sensors.................................................................................. 37 1.5.4 Microwave Sensors ................................................................................ 38 1.5.5 Other sensors .......................................................................................... 39
1.6 Aim................................................................................................................... 40 Chapter 2: Laboratory Testing................................................................................. 42
2.1 Introduction .................................................................................................... 42 2.2 Simulation Results ......................................................................................... 43
2.2.1 Knife Edge Diffraction Model .............................................................. 43 2.2.2 Electromagnetic Field Simulation........................................................ 47
2.3 Laboratory Measurements............................................................................ 56 2.4 Conclusion ...................................................................................................... 67
Chapter 3: Field Testing............................................................................................ 69 3.1 Introduction .................................................................................................... 69 3.2 Field Test System ........................................................................................... 69 3.3 Summary ......................................................................................................... 87
Chapter 4: Prototype Ground Detection Sensor ................................................... 89 4.1 Introduction .................................................................................................... 89 4.2 Prototype Ground Detection Sensor Design.............................................. 89 4.3 Detector Testing Results ............................................................................... 95 4.4 Installation on Harvester .............................................................................. 96 4.5 Summary ....................................................................................................... 100
Chapter 5: Harvester Testing................................................................................. 103 5.1 Introduction .................................................................................................. 103 5.2 Harvester Trial.............................................................................................. 103 5.3 Conclusions................................................................................................... 109
Chapter 6: Conclusion ............................................................................................ 111 6.1 Conclusion .................................................................................................... 111 6.2 Future Work.................................................................................................. 113

Table of Figures
Figure 1.1: Sugar cane paddock before planting of sugar cane............................... 18
Figure 1.2: Photograph of the front of a sugar cane harvester. ............................... 23
Figure 1.3: Photograph of the row dividers and base cutter of a harvester. ......... 23
Figure 1.4: Close-up photograph of the base cutter of a harvester. ........................ 24
Figure 1.5: Trend of extraneous matter at mill over time......................................... 25
Figure 1.6: The typical view of from the cabin of a harvester during operation. . 30
Figure 1.7: Close-up photograph of the operator’s view to the ground below. ... 31
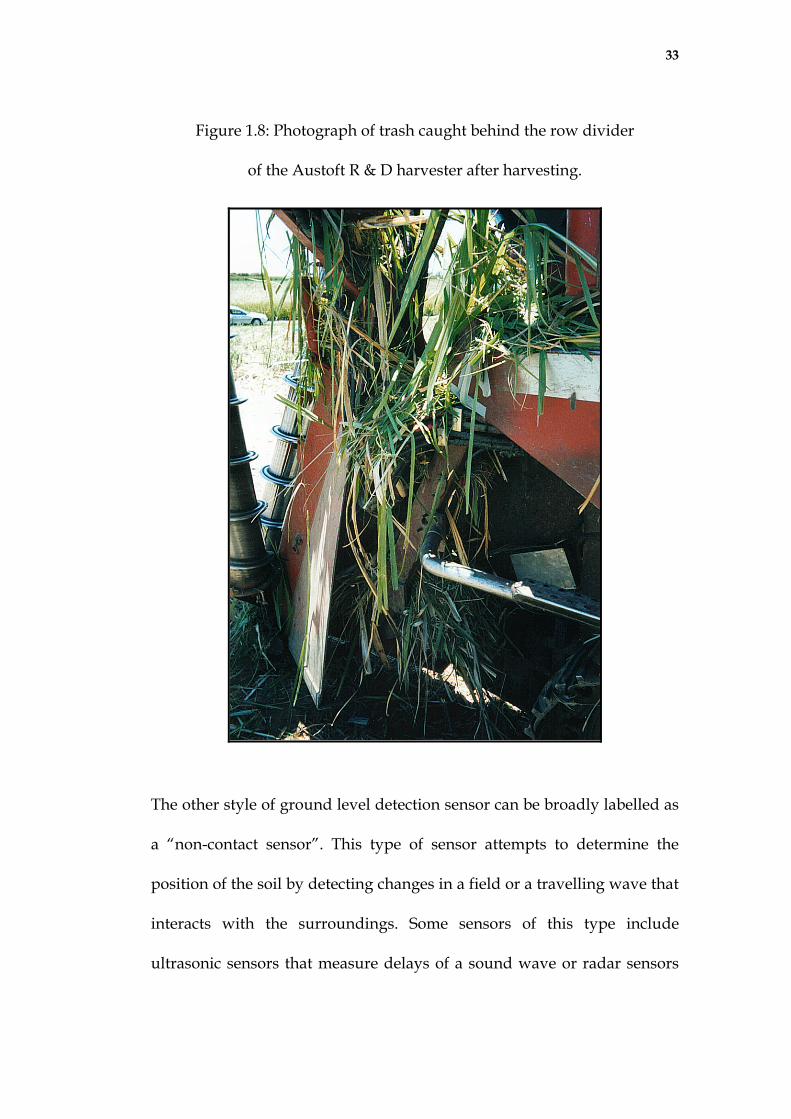
Figure 1.8: Photograph of trash caught behind the row divider............................. 33
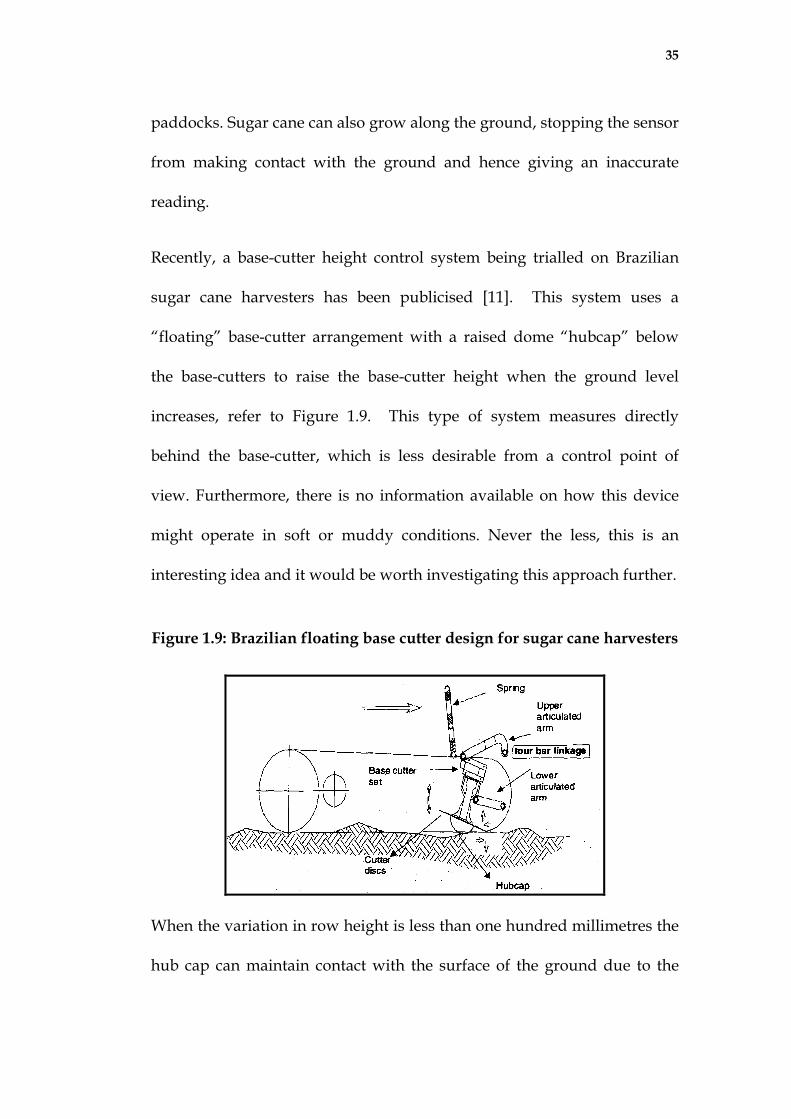
Figure 1.9: Brazilian floating base cutter design for sugar cane harvesters .......... 35
Figure 2.1: Transmission configuration of the microwave ground detection
sensor ....................................................................................................................... 43
Figure 2.2: Knife-edge diffraction model of the sugar cane row............................. 45
Figure 2.3: Predicted signal loss around ground....................................................... 46
Figure 2.4: Configuration of the Real Time FDTD model used to simulate the
effect of the sugar cane row profile. .................................................................... 48
Figure 2.5: Results of the Real Time FDTD model that was .................................... 50
Figure 2.6: Real Time model of field amplitude in dB vs height. ........................... 51
Figure 2.7: Configuration of the Real Time FDTD model that ................................ 53
Figure 2.8: Results of the Real Time FDTD model that ............................................ 54
Figure 2.9: Electromagnetic field strength measured along a ................................. 55

Figure 2.10: 3D S-Band Plot for Sample #1................................................................. 59
Figure 2.11: 3D C-Band Plot for Sample #1................................................................ 59
Figure 2.12: 3D X-Band Plot for Sample #1 ................................................................ 60
Figure 2.13: 3D S-Band Plot for Sample #2................................................................. 60
Figure 2.14: 3D C-Band Plot for Sample #2................................................................ 61
Figure 2.15: 3D X-Band Plot for Sample #2 ................................................................ 61
Figure 2.16: 3D S-Band Plot for Sample #3................................................................. 62
Figure 2.17: 3D C-Band Plot for Sample #3................................................................ 62
Figure 2.18: 3D X-Band Plot for Sample #3 ................................................................ 63
Figure 2.19: 2D S-Band Plot for all Samples ............................................................... 63
Figure 2.20: 2D C-Band Plot for all Samples .............................................................. 64
Figure 2.21: 2D X-Band Plot for all Samples .............................................................. 64
Figure 3.1: Schematic of the portable field testing unit ............................................ 70
Figure 3.2: Portable testing unit showing the worm drive mounts....................... 72
Figure 3.3: Photograph of the control box showing the YIG microwave .............. 73
Figure 3.4: Portable FTU 3-D Results, location #1, Trebone .................................... 77
Figure 3.5: Portable FTU 2-D Results, location #1, Trebone .................................... 77
Figure 3.6: Portable FTU 3-D Results, location #2, Trebone .................................... 78
Figure 3.7: Portable FTU 2-D Results, location #2, Trebone .................................... 78
Figure 3.8: Portable FTU 3-D Results, location #4, Trebone ................................... 79
Figure 3.9: Portable FTU 2-D Results, location #4, Trebone ................................... 79
Figure 3.10: Portable FTU 3-D Results, location #5, Trebone .................................. 80
Figure 3.11: Portable FTU 2-D Results, location #5, Trebone ................................. 80
Figure 3.12: Portable FTU 3-D Results, location #8, Trebone .................................. 81
Figure 3.13: Portable FTU 2-D Results, location #8, Trebone .................................. 81
Figure 3.14: Portable FTU 3-D Results, location #9, Trebone .................................. 82
Figure 3.15: Portable FTU 2-D Results, location #9, Trebone .................................. 82
Figure 3.16: Portable FTU 3-D Results, location #11, Trebone ................................ 83
Figure 3.17: Portable FTU 2-D Results, location #11, Trebone ................................ 83
Figure 3.18: Portable FTU 3-D Results, location #12, Trebone ................................ 84
Figure 3.19: Portable FTU 2-D Results, location #12, Trebone ................................ 84
Figure 3.20: Portable FTU 3-D Results, location #15, Trebone ................................ 85
Figure 3.21: Portable FTU 2-D Results, location #15, Trebone ................................ 85
Figure 3.22: Portable FTU 3-D Results, location #16, Trebone ................................ 86
Figure 3.23: Portable FTU 2-D Results, location #16, Trebone ................................ 86
Figure 3.24: Photograph of the back of a high clearance......................................... 88
Figure 4.1: Ground Detection Sensor configuration using a receiver array......... 90
Figure 4.2: Prototype ground detection sensor configuration schematic .............. 90
Figure 4.3: Receiver calibration for Antenna #6 ....................................................... 94
Figure 4.4: Measurement system response under controlled conditions .............. 96
Figure 4.5: Photograph of the surface of the receiver antenna................................ 98
Figure 4.6: Installation of the antenna on a sugar cane harvester........................... 98
Figure 4.7: A photograph of the trash caught behind............................................. 100
Figure 4.8: Photograph of the “black box” of the prototype sensor. .................... 101

Figure 4.9: Photograph of the “black box" mounted............................................... 102
Figure 5.1: The effects of digital filtering to smooth the sensor output ............... 107
Figure 5.2: Measured amplitude trends on all twelve............................................ 109

15
Chapter 1: Background
1.1
Introduction
Sugar cane is the main agricultural crop grown in Queensland producing almost
ninety-five percent of all the raw sugar produced in Australia. In 2000-2001, 4.14
million tons of raw sugar was produced from around thirty million tons of
harvested sugar cane [1]. Sugar is the second largest export crop for Australia
and is estimated to be worth in excess of A$1 billion to the Australian economy1.
Australia produces four percent of the world’s raw sugar but exports the
majority of this, which totals twelve percent of the world’s raw sugar trade each
year. Ninety-nine percent of the sugar exported by Australia is supplied directly
by the Queensland sugar industry.
Sugar is grown in Australia in the following three regions, Queensland, New
South Wales and Western Australia, with each respectively producing
approximately 94.2 percent, 5.1 percent and 0.7 percent of Australia’s harvested
sugar each year. After the harvesting process the sugar cane is refined into raw
sugar at one of Australia’s thirty sugar mills; there are twenty-six raw sugar mills
located in Queensland, three in New South Wales and one in Western Australia
1 This figure is based upon the 1999/2000 Australian season.

16
[2]. Australia also produces refined sugar from four sugar refineries; two are
located in Queensland, one in New South Wales and one in Victoria.
Queensland directly exports eighty-five percent of the raw sugar produced and
refines the other fifteen percent. New South Wales refines all raw sugar
produced, while all of the raw sugar produced in Western Australia is directly
exported.
The deregulated world sugar market is perceived as a volatile market and it is
essential for the Australian sugar industry to remain competitive by optimising
the efficiency and profits of all aspects of the production process. The high
labour costs for the Australian workforce, when compared to other countries,
directly affects the profitability of the industry and as such, automated processes
are often required to achieve high efficiency and produce higher quality product
to increase these profits.
The harvesting and transport of sugar cane has been identified as having a major
influence on the efficiency of the whole industry [3]. In particular, inaccurate
setting of the base cutter height and the subsequent collection of particulate
contamination with the harvested sugar cane is known to be one of the factors
contributing to the inefficiencies in the production of sugar. Previous studies
have indicated that increased cutting accuracy will lead to reduced costs for the
sugar refining mills as well as increased sugar quality for farmers [4]. By
achieving precision control over this single parameter, farmers, millers and
17
harvesting contractors could expect to obtain greater returns due to the reduced
operating costs and higher production rates. It is therefore not surprising that
the automatic control of the harvester base cutter depending on the ground
height has been a long-time goal of the Australian sugar industry.
1.2 Growing Sugar Cane
All of the raw sugar produced in Australia is refined from sugar cane. Sugar beet
is the only other commercial source for sugar, but is generally only used in the
temperate parts of the world [17]. Seventy percent of the world’s sugar is
produced form sugar cane, while the remaining thirty percent is produced from
the sugar beet.
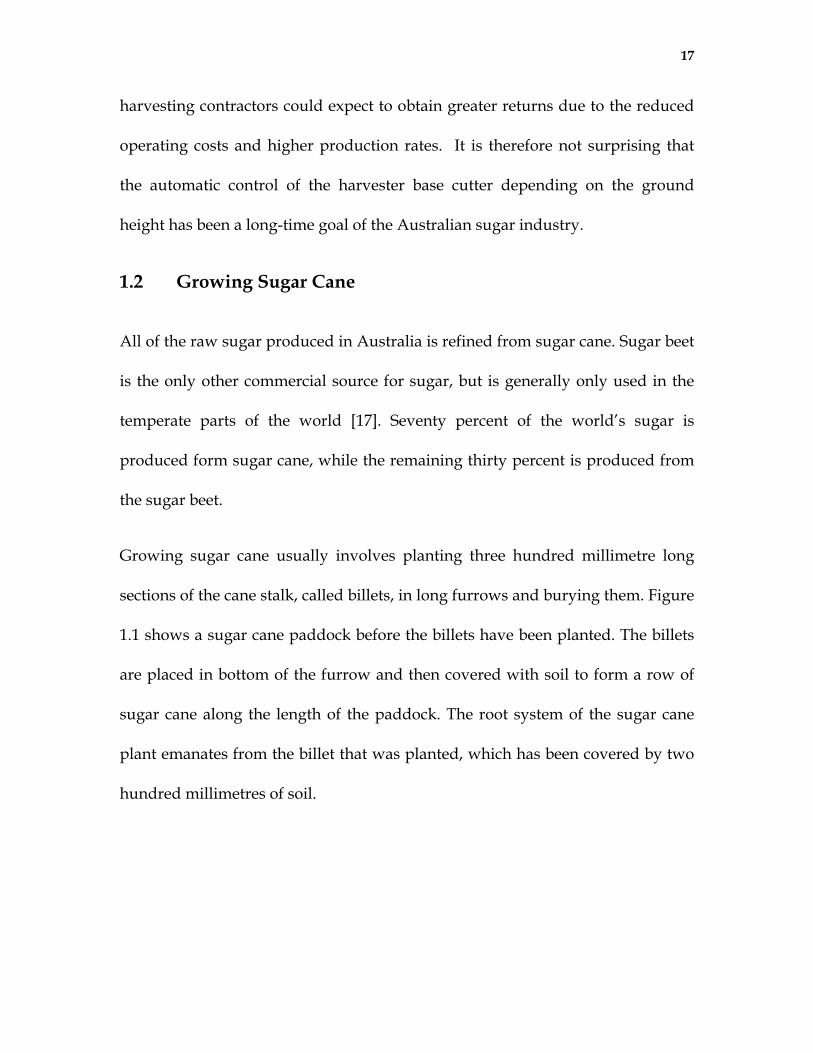
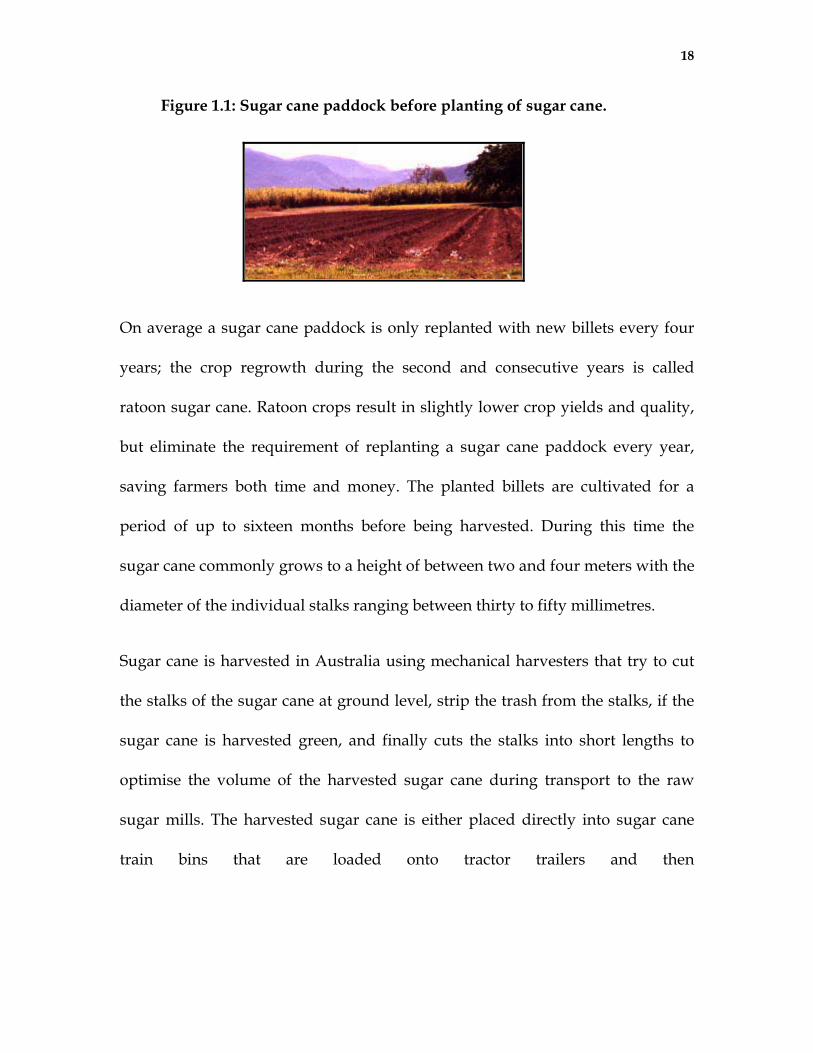
Growing sugar cane usually involves planting three hundred millimetre long
sections of the cane stalk, called billets, in long furrows and burying them. Figure
1.1 shows a sugar cane paddock before the billets have been planted. The billets
are placed in bottom of the furrow and then covered with soil to form a row of
sugar cane along the length of the paddock. The root system of the sugar cane
plant emanates from the billet that was planted, which has been covered by two
hundred millimetres of soil.
18
Figure 1.1: Sugar cane paddock before planting of sugar cane.
On average a sugar cane paddock is only replanted with new billets every four
years; the crop regrowth during the second and consecutive years is called
ratoon sugar cane. Ratoon crops result in slightly lower crop yields and quality,
but eliminate the requirement of replanting a sugar cane paddock every year,
saving farmers both time and money. The planted billets are cultivated for a
period of up to sixteen months before being harvested. During this time the
sugar cane commonly grows to a height of between two and four meters with the
diameter of the individual stalks ranging between thirty to fifty millimetres.
Sugar cane is harvested in Australia using mechanical harvesters that try to cut
the stalks of the sugar cane at ground level, strip the trash from the stalks, if the
sugar cane is harvested green, and finally cuts the stalks into short lengths to
optimise the volume of the harvested sugar cane during transport to the raw
sugar mills. The harvested sugar cane is either placed directly into sugar cane
train bins that are loaded onto tractor trailers and then
19
transported to the mills or more commonly nowadays the tractors use custom
trailers that hold large quantities of harvested sugar cane that is then tipped into
the sugar cane train bins. This increases productivity by minimising the required
number of tractors and drivers.
After the harvesting process, the cut sugar cane is transported by either rail or
road to a sugar mill for processing into raw sugar. Raw sugar is pale brown in
colour and must be further refined, at a sugar refinery, before the pure white
substance that most people are familiar with is produced. Just over eighty
percent of the raw sugar produced by Australian mills is exported and sold on
the world sugar market [1].
1.3 Problems with Inefficient Base cutter Height Control
Inefficient harvesting methods affect all three major sectors of the Australian
sugar industry. The three sectors are: -
• The farming sector, which produce the sugar cane,
• The harvesting sector, which harvest the sugar cane and
• The milling sector, which transport and process the sugar cane.
The effects of inefficient height control upon these sectors, including estimates of
additional expenses from dirt in the sugar cane supply, are described below. It
should be noted however, that the costs estimates provided here are based on the
20
extrapolation of old data and assume reductions in dirt levels will provide
proportional decreases in operating costs. Obviously, these assumptions will not
be completely valid but certainly the figures quoted do give some indication to
the magnitude of the problem.
1.3.1 Benefits to the Farming Sector
The process of mechanical harvesting can cause problems if the sugar cane is cut
either too high or too low with respect to the ground level during the harvesting
process. When the sugar cane stalks are cut too high, they may shatter
introducing diseases into the plant causing a loss of production in subsequent
years. On the other hand, if the sugar cane stalks are cut too low, the stool, or the
root system may be damaged leading to similar results. In either case, instead of
being able to achieve four seasons’ growth from the same plant, earlier
replanting may be required. It has been shown that during the raw sugar refining
process, the Commercial Cane Sugar (CCS) level is degraded in proportion to the
percentage of dirt in the harvested sugar cane [4]. The lowered CCS level
signifies that a reduced quantity of raw sugar is produced per ton of cane. The
reduction of the CCS level affects the farmers directly as the price paid to the
producer is directly related to the CCS level of the sugar cane sold to the mill.
21
The current extraneous matter content of sugar cane that has been
mechanically harvested is, on average, 1.7 percent per tonne. The Bureau
of Sugar Experimental Stations (BSES) has calculated that the CCS level of
sugar cane is reduced by 0.18 for each percent of extraneous matter
present in the harvested sugar cane [5]. It has also been shown by Hankel
that optimal harvesting results in less that 0.5 percent extraneous matter
per tonne of cane harvested. As such, it can be calculated that by
optimising the harvesting process through base cutter height control the
CCS level would be increased by approximately 0.22. This increase in the
CCS level would in turn increase the return per tonne of sugar cane by
A$0.45II; equivalent to a total increase in revenue exceeding A$15 million
per year for the farming sectorIII.
Ultimately the use of automatic base cutter height control would optimise
the return per tonne by maximising the CCS levels. Correct base cutter
control will also result in less damage to ratoon cane and therefore
increased ratoon yield in subsequent years. Less disruption to the row
profile would most probably also lead to a reduction of soil erosion.
II Based upon a CCS level of 11.00.
III Assuming 35 million tonnes of sugar cane is harvested per year. The costs were
calculated based upon prices paid to farmers in the year 2000 season.
22
1.3.2 Benefits to the Harvesting Sector
Over the years, sugar cane harvesting has changed dramatically. One of
the biggest changes has been the introduction of the mechanical harvester.
The first mechanised harvester was invented and patented just over one
hundred years ago, but only became popular in Australia during the
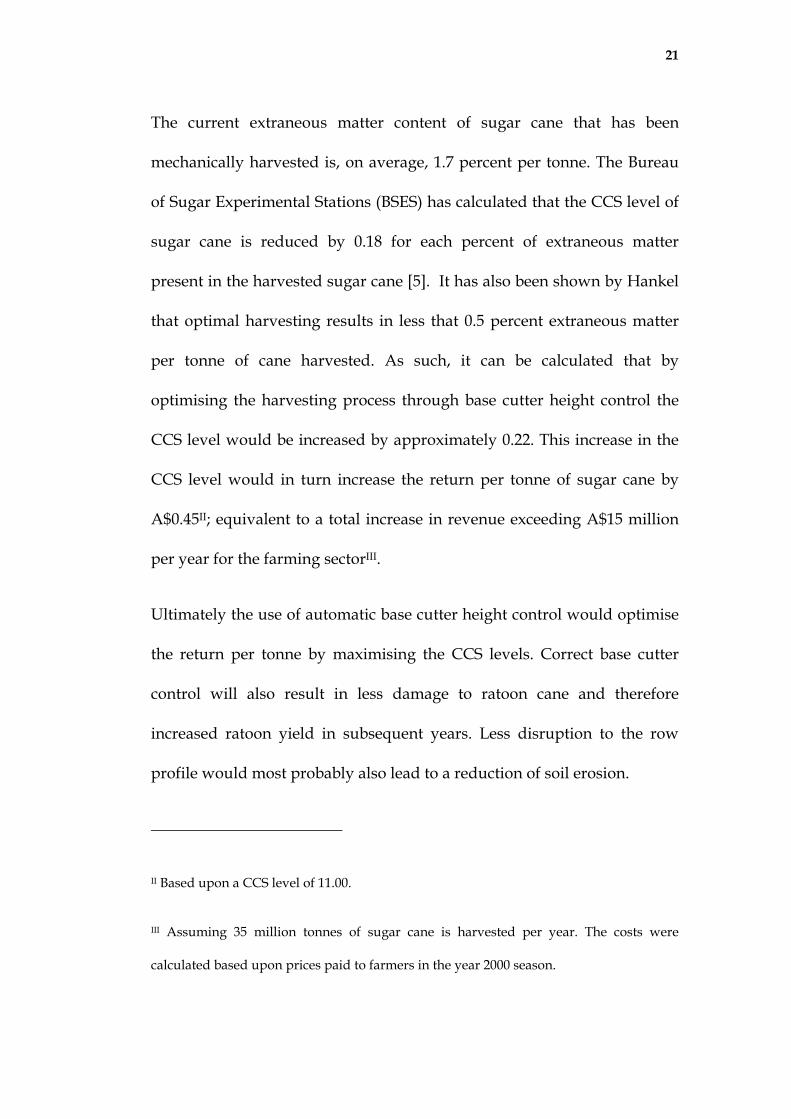
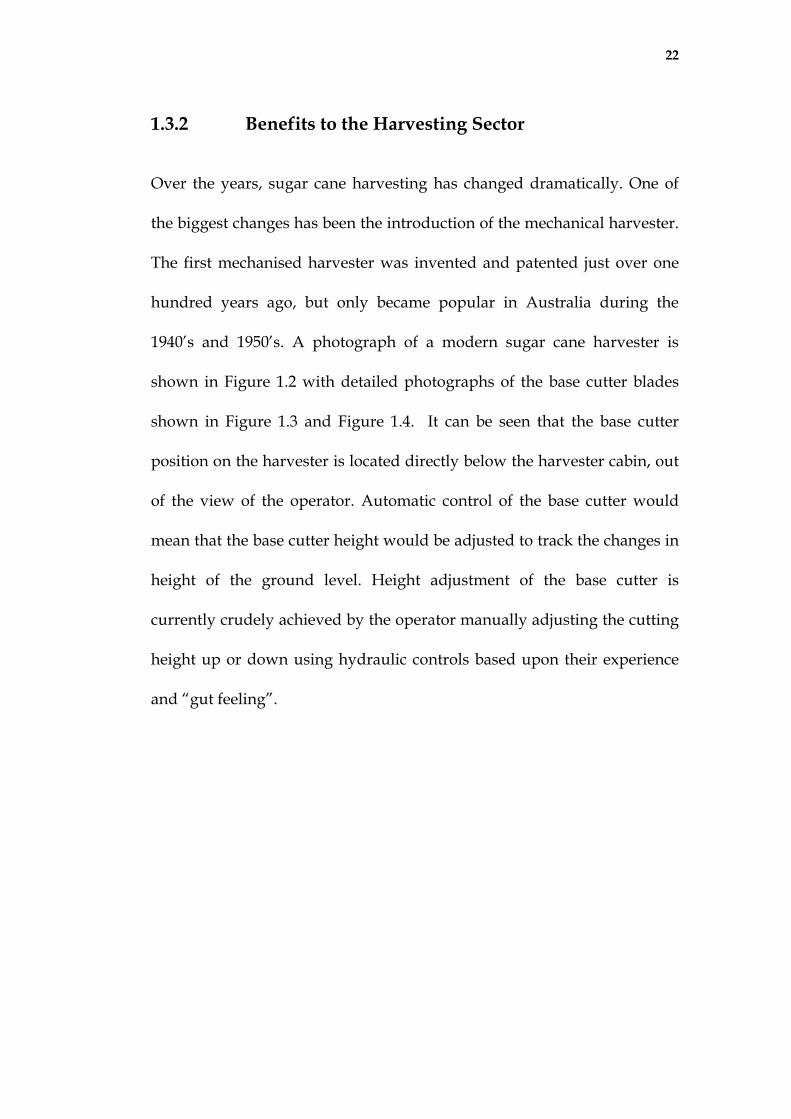
1940’s and 1950’s. A photograph of a modern sugar cane harvester is
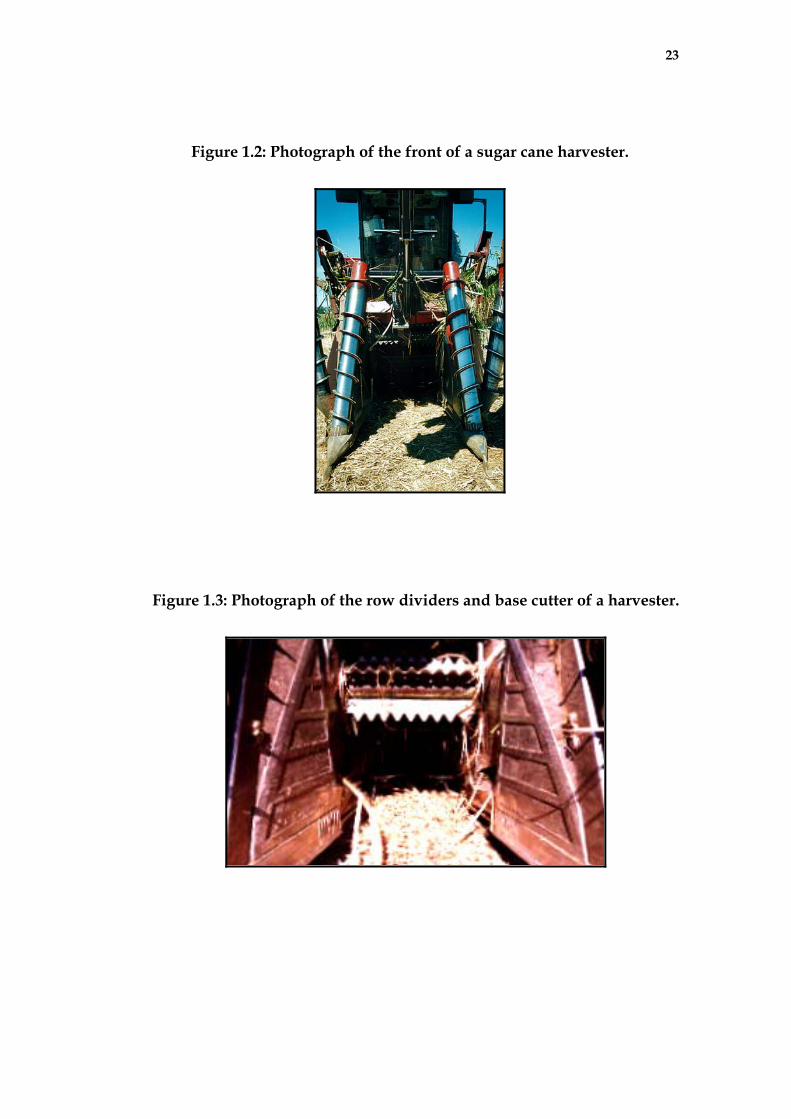
shown in Figure 1.2 with detailed photographs of the base cutter blades
shown in Figure 1.3 and Figure 1.4. It can be seen that the base cutter
position on the harvester is located directly below the harvester cabin, out
of the view of the operator. Automatic control of the base cutter would
mean that the base cutter height would be adjusted to track the changes in
height of the ground level. Height adjustment of the base cutter is
currently crudely achieved by the operator manually adjusting the cutting
height up or down using hydraulic controls based upon their experience
and “gut feeling”.
23
Figure 1.2: Photograph of the front of a sugar cane harvester.
Figure 1.3: Photograph of the row dividers and base cutter of a harvester.
24
Figure 1.4: Close-up photograph of the base cutter of a harvester.
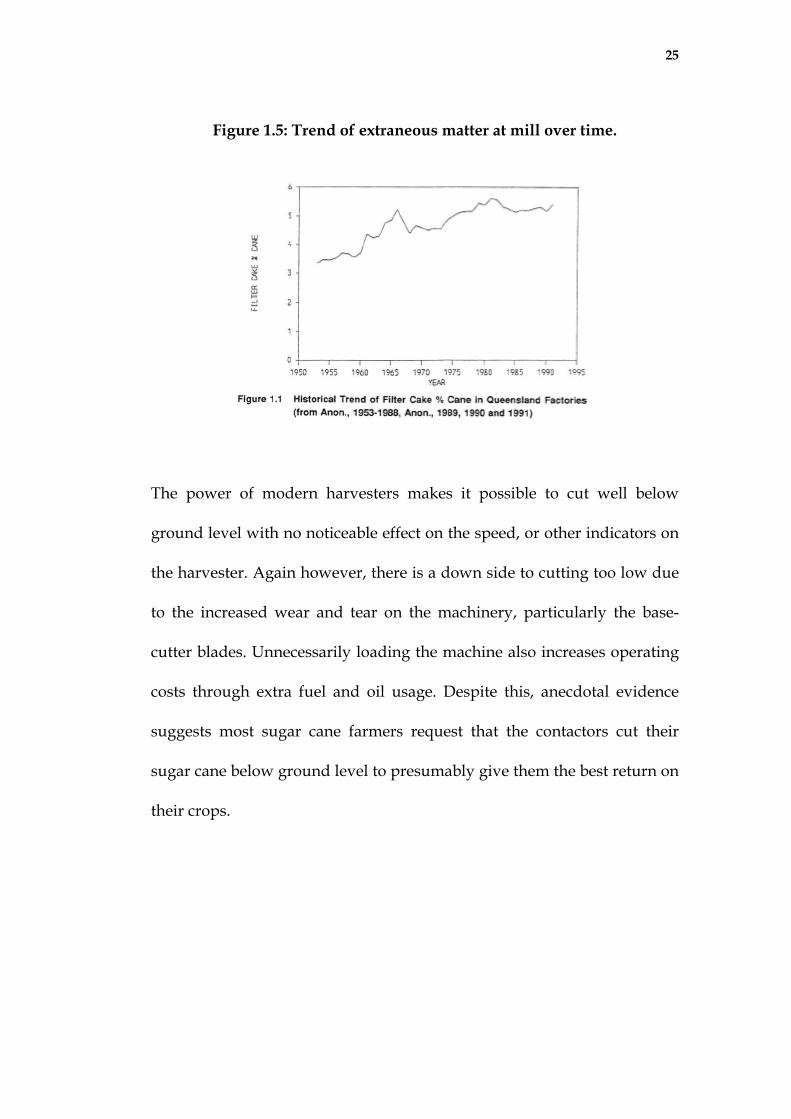
Since the introduction of the mechanical harvester there has been a steady
increase in the level of extraneous matter in the harvested sugar cane that
is transported to the mills [6]. Figure 1.5 was obtained from Anon (1953-
1991) Annual synopsis of chemical control figures, (Bureau of Sugar
Experimental Stations) and shows the trend that extraneous matter has
increased over time as has the horsepower of the sugar cane harvesters.
25
Figure 1.5: Trend of extraneous matter at mill over time.
The power of modern harvesters makes it possible to cut well below
ground level with no noticeable effect on the speed, or other indicators on
the harvester. Again however, there is a down side to cutting too low due
to the increased wear and tear on the machinery, particularly the base-
cutter blades. Unnecessarily loading the machine also increases operating
costs through extra fuel and oil usage. Despite this, anecdotal evidence
suggests most sugar cane farmers request that the contactors cut their
sugar cane below ground level to presumably give them the best return on
their crops.
26
The cost savings estimated by Neves et al for the reduced wear on the
base-cutter blades was US$4400.00 per seasonIV. This figure assumes that
the harvester operates for twenty-four hours per day. Amending this
figure to eight hours per day over a two hundred day season, provides an
estimate that Australian harvester operators could expect cost savings of
the order of US$1400.00 per season by using a moderately effective base-
cutter height control system.
Automatic control of the base-cutter height should lead to reduced wear
for the cutting blades and less maintenance and running costs for the
harvester. However, the full improvement will only be possible if farmers
and harvester operators can be convinced of the benefits of proper height
settings.
1.3.3 Benefits to the Refining Sector
With up to 40 million tonnes of sugar cane being processed each year in
Australia, even a small reduction in milling costs will translate into
significant savings to the sugar industry. In 1986, Mason and Garson
performed an investigation into the extra costs associated with the milling
of sugar cane contaminated with extraneous matter [7]. It was concluded
that the cost to the sugar industry was A$0.62 per tonne of sugar cane to
IV IV Based upon a two hundred day harvesting season.
27
maintain the milling facilities due to the extraneous matter. Assuming that
inflation has increased at a rate of three percent each year over the past
fifteen years, the cost today should be approximately A$1.06 per tonne for
maintenance of the mill.
Assuming the current average amount of soil in harvested sugar cane is
around 1.7 percent [6], it can be estimated that by reducing this level to
around 0.5 percent by optimising the cutting height, a total saving of
approximately A$0.74 per tonne to the sugar milling community could be
expected. This figure corresponds to an estimated reduction in running
costs to the milling sector of up to A$29 million each year.
These figures are based solely on the maintenance costs to the milling
sector. In practice, in addition to these costs, there is extra expenditure
associated with the transportation of the extra material to and from the
mill, reduced sugar quality and quantity, and extra wear on milling
facilities. These factors mean that the actual costs to the milling sector are
much greater than those estimated above.
The microwave ground level detection sensor investigated in this
application was primarily designed for base-cutter height control.
However, there are a number of different systems on board a harvester
where ground height measurements may be usefully employed to better
control the harvesters operation. Some of these other applications include
28
the row divider height control as well as positioning the harvester
centrally in respect to the sugar cane row. Although the described sensor
might be useful in these situations, these applications were not explicitly
examined in this project.
1.4 Background
Ever since the introduction of the mechanical harvester, there has been a
steady increase in the level of dirt in the harvested sugar cane that is
transported to the mills [6]. One factor that has contributed to this rise is
the increased power of modern harvesters. With a more powerful
machine, it becomes easier to cut at a lower level because the operator
does not experience any adverse side effects such as reduced speed of
operation when cutting below ground level. Harvester operators are
therefore more inclined to err towards cutting on the low side to satisfy
the farmers desire to maximise their crop yield. Another reason for
increased dirt levels seems to be the common perception amongst the
farming community that cutting lower improves profits through a greater
mass of material being harvested. This view remains common despite
recent studies showing that the trade off in adding more dirt to the
harvested sugar cane will often result in reduced profits due to a lowering
of the CCS levels [8].
29
The current opinion on the introduction of automatic base-cutter height
control to the harvester is that this system will probably be similar to a
car’s cruise control system. That is, the operator will be free to set the base-
cutter height to the level that he (or the farmer) desires and the control
system will simply try to maintain the set position of the base-cutter
height from the ground. Obviously then, improvements in the reduction
of dirt in harvested sugar cane will depend largely on the proper use of
this technology and thus whether operators and farmers can be convinced
of the benefits of trying to reduce soil levels in harvested sugar cane.
However, these concerns were not the focus of this project. One immediate
benefit of an automatic base-cutter height control system though will be
that the problem of continuously adjusting the base-cutter height to track
small changes in ground height can be overcome. An automatic system
will make it possible for the operator to use a “set and forget” approach
confident in the knowledge that the base-cutter height will be adjusted to
follow the contour of the sugar cane row at the specified cutting height.
1.5 Sensing Techniques
Currently, Australian sugar cane harvesters use no form of automatic
base-cutter height adjustment. The harvester operator is required to
manually adjust the base-cutter level from within the cabin. However, due
to the positioning of the base cutters directly below the harvester cabin,
the operator is unable to directly observe the cutting height. It seems that
30
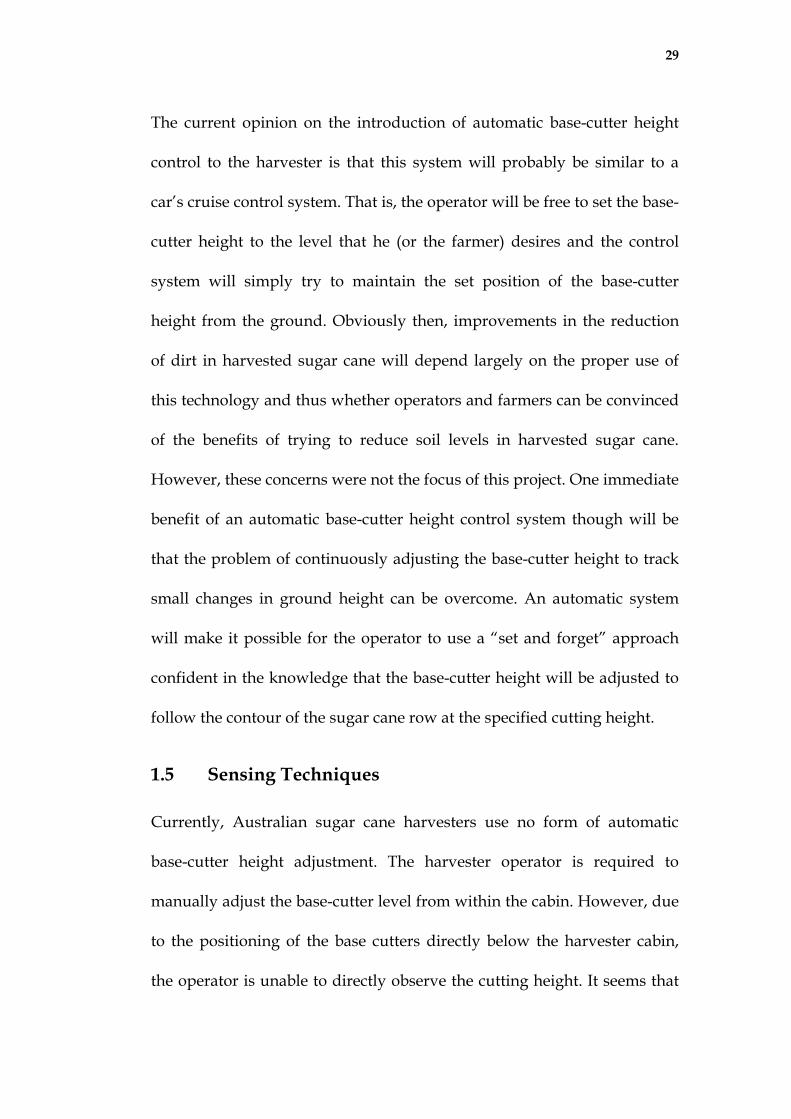
most operators therefore adjust the base-cutter based on “experience”,
though some claim they make adjustments using a combination of a visual
inspection of the row profile behind the harvester and/or by observing the
pressure reading of the base cutter's hydraulic motor. In any case, it is
clearly very difficult to accurately determine the base-cutter height setting
from inside the harvester cabin, and thus the setting is rarely optimal. The
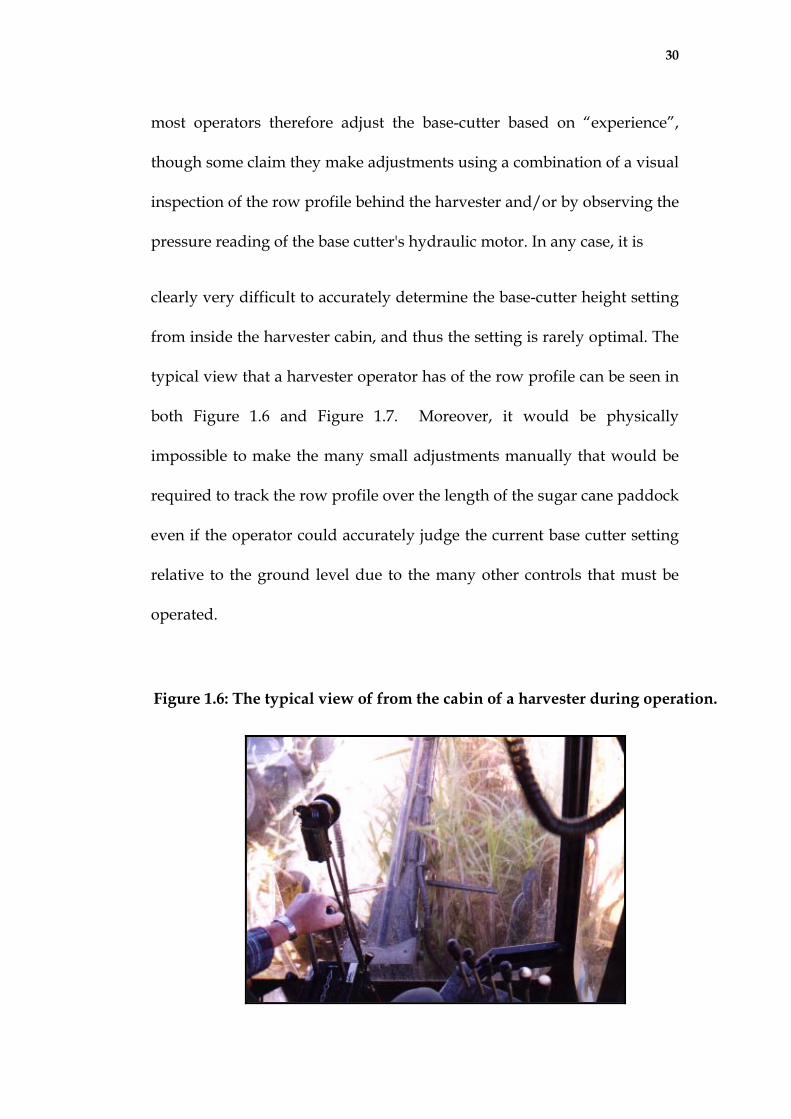
typical view that a harvester operator has of the row profile can be seen in
both Figure 1.6 and Figure 1.7. Moreover, it would be physically
impossible to make the many small adjustments manually that would be
required to track the row profile over the length of the sugar cane paddock
even if the operator could accurately judge the current base cutter setting
relative to the ground level due to the many other controls that must be
operated.
Figure 1.6: The typical view of from the cabin of a harvester during operation.
31
Figure 1.7: Close-up photograph of the operator’s view to the ground below.
There have been a number of proposals over the past twenty years or so of
methods to control the base-cutter height on mechanical harvesters. It
appears that most of these approaches have had limited success due to the
difficult measurement environment involved. From a control point of
view it is highly desirable to measure the ground height in front of the
base-cutter so that the base-cutter height can be adjusted to suit the
required ground height profile. However, when sensing the ground height
in front of the base-cutter, a sensor has to contend with the presence of the
sugar cane. The sugar cane stalk and leaf can obscure a sensors “view” of
the soil or may cause fouling and even damage to the sensor. Measuring
ground height behind the base-cutter has the advantage that most of the
sugar cane has been removed and the sensor will have a clearer view of
32
the soil. On the other hand, when measuring behind the base-cutter, the
passing of the base-cutter nearly always disturbs the soil making it near
impossible to get an accurate reading of the ground level. Furthermore,
the lag between cutting the sugar cane and measuring the actual ground
height, means the control system is continuously playing “catch up” and
hence will not perform as well as a forward looking system.
There are two distinct classes of devices that have been tested for base-
cutter height control. One style of device that has been tried in many
different forms can be broadly termed a “mechanical contact sensor”. This
type of sensor might use a skid or wheel to gauge the ground height [9].
Generally, this type of sensor suffers from fouling by the sugar cane, leaf
matter and mud that can be found around the base cutter region on the
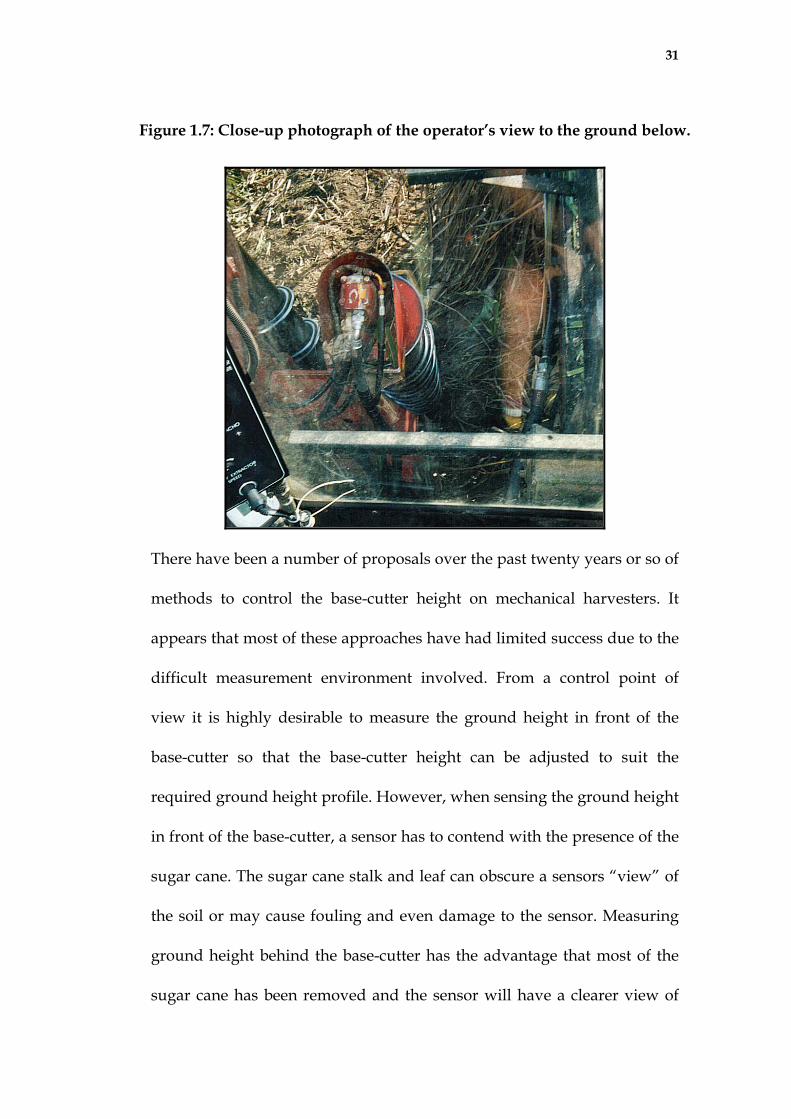
harvester. Figure 1.8 shows the amount of sugar cane trash that gets
caught in behind the harvester’s row dividers.
33
Figure 1.8: Photograph of trash caught behind the row divider
of the Austoft R & D harvester after harvesting.
The other style of ground level detection sensor can be broadly labelled as
a “non-contact sensor”. This type of sensor attempts to determine the
position of the soil by detecting changes in a field or a travelling wave that
interacts with the surroundings. Some sensors of this type include
ultrasonic sensors that measure delays of a sound wave or radar sensors
34
that detect variations in a travelling electromagnetic (EM) wave. The main
advantages of the non-contact type sensors is that the measurement device
does not disturb the ground level and there is less chance of fouling, as the
sensor does not physically contact the soil or the sugar cane. For similar
reasons, non-contact sensors also tend to require less maintenance to
ensure reliable operation.
1.5.1 Mechanical Contact Sensors
Simplicity is quite often the best approach to practical problems, and
measuring the ground height using a skid or wheel at first seems the most
practical and logical concept of all. These systems use angle sensors and
other techniques to measure a distance or angle created by the mechanical
sensing device to calculate the location of the ground.
However, to date most of these types of sensors have had little success.
Mechanical sensors in front of the base-cutters are usually unsuitable due
to interference from trash, mud, and even the sugar cane itself [10]. Trash
and debris is often caught in the device causing jamming of the
mechanical movement rendering the sensor useless. In some devices the
skid or wheel uses a spring to maintain contact with the soil, but when
operating in soft or muddy paddock conditions, the spring drives the
sensing device into the soil, breaking or damaging it in the process. This
problem is worse in areas where flood irrigation creates soft or muddy
35
paddocks. Sugar cane can also grow along the ground, stopping the sensor
from making contact with the ground and hence giving an inaccurate
reading.
Recently, a base-cutter height control system being trialled on Brazilian
sugar cane harvesters has been publicised [11]. This system uses a
“floating” base-cutter arrangement with a raised dome “hubcap” below
the base-cutters to raise the base-cutter height when the ground level
increases, refer to Figure 1.9. This type of system measures directly
behind the base-cutter, which is less desirable from a control point of
view. Furthermore, there is no information available on how this device
might operate in soft or muddy conditions. Never the less, this is an
interesting idea and it would be worth investigating this approach further.
Figure 1.9: Brazilian floating base cutter design for sugar cane harvesters
When the variation in row height is less than one hundred millimetres the
hub cap can maintain contact with the surface of the ground due to the
36
suspension system that is used to adjust the base-cutter to follow the
contour of the row, thus reducing the extraneous matter content of the
harvested sugar cane by approximately half [11]. It should be noted that
these tests were conducted during a period where very little rain occurred
biasing the results towards dry soil conditions. It is probable that as with
past mechanical measurement devices that this device would not be
suitable for the entirety of a typical Australian harvesting season and in
particular might not be useful in the very wet regions.
The Brazilian test results have proven that the benefits of using an
automated control system would improve the efficiency of the harvesting
process. If the base-cutter height is maintained at close to the top of the
row, then extraneous matter included in the harvested sugar cane could be
halved resulting in significant cost savings for harvester operators.
1.5.2 Hydraulic Pressure Sensors
This technique involves monitoring the pressure across the hydraulically
driven base-cutter motor. In theory, the pressure should vary as the base-
cutter starts to cut more deeply through the more dense soil [10]. The
base-cutter essentially becomes the mechanical contact sensor in this
approach. Unfortunately, more recent studies [4] have shown that the
base-cutter pressure does not vary in a predictable manner. In particular,
the base-cutter pressure was found to vary non-linearly with both the
37
cutting height and the harvester’s travel speed, making it difficult to use
this method with any confidence. At best, it seems this technique will only
be useful as a crude indication of when the base-cutter is working well
below the ground level.
1.5.3 Ultrasonic Sensors
In this approach, an ultrasonic signal is transmitted and subsequently
reflected by the ground. The time difference between sending a signal and
receiving the reflection is measured and used to determine the distance
that the signal travelled. The Sugar Research Institute (SRI) has been
investigating the use of ultrasonic detection for base-cutter height control
for a number of years [6]. Their investigations have shown that if the
sugar cane is cut green or only partially burnt, then the trash surrounding
the stool often blocks the ultrasonic signal. Since most sugar cane is now
harvested green, there seems little possibility of using an ultrasonic sensor
in front of the base-cutter. Investigators at SRI have had better success
using ultrasonic technology when installed in a position not prone to
blockage from sugar cane trash. Using ultrasonic sensors for base-cutter
control would only be a feasible option if the sensors were located behind
the base-cutter, which is not the optimal solution.
38
1.5.4 Microwave Sensors
Microwaves, being an electromagnetic wave, will penetrate most materials
(except conductors) to differing degrees. A microwave ground height
detection sensor for use on board a sugar cane harvester is therefore an
attractive concept as such a device may be suitable for positioning in front
of the harvester base-cutter. There have been previous investigations into
the feasibility of utilising microwave radar technology for ground height
measurement applications [12]. Shin, Dodd and Han examined the
potential for using a dual-frequency radar measurement technique at a
frequency of around 1GHz. However, this work was all conducted in the
laboratory and no conclusive results were obtained.
More recently, Ruxton conducted preliminary studies as to whether a
microwave detection system could be used to measure the ground height
for the base-cutter control application [13]. Ruxton’s laboratory
experiments showed that a microwave radar system that measured
reflections from the ground using the radar ranging technique was not
suitable due to the strong interference from reflections off of the sugar
cane. However, it was shown that a “transmission style” sensor might be
appropriate for this measurement application. A microwave sensing
technique was proposed where the attenuation of a signal transmitted just
above the ground was measured. In this configuration, it was found that
the signals were reasonably insensitive to the presence of the sugar cane
39
and that the attenuation of the signal increased significantly as the height
of the antennas approached ground level. Further investigations into this
sensing approach were conducted in 1999 by Page to determine the
optimum transmission frequency and antenna characteristics for the
newly developed microwave sensing technique [14]. This work led to the
operational specifications of transmission frequency, antenna beamwidth,
polarisation and equipment configuration for the microwave detection
system that has been further developed in this thesis.
The development of the transmission style microwave sensing technique
has been well documented [15],[16]. SRDC funded a research grant
between July 1999 and July 2002 for the purpose of developing this
sensing technique towards the goal of developing a commercially viable
sensor.
1.5.5 Other sensors
There are undoubtedly other sensor types that could be considered for this
application. Obviously though it is most feasible to investigate the
simplest, cheapest and safest approaches first.
Another approach that possibly has not been tried as yet for this
application is a nuclear sensor. The radioactive decay of a nuclear material
can be measured through virtually any material, including metals. By
measuring the energy of the radioactive particles that escape from a source
40
in different directions, it is possible to judge the density of the medium
through which the particles have travelled. It should therefore be possible
to determine when the particles pass through only sugar cane and when
the transmission path includes a proportion of denser material such as the
soil. In this way, the distance to the ground could be measured in front of
the base-cutter. The main advantage (and disadvantage too) of a nuclear
sensor is that the radioactive particles will penetrate virtually any
material, making this type of sensor suitable in even the most difficult
measurement applications. Obviously, when using a radioactive material
there are always some health and safety concerns that would make this
sensing technique a last resort.
1.6 Aim
The aims of this study were to:
1) To determine the optimum operating frequency range and
polarization state of a microwave sensor to measure ground level
through sugar cane.
2) To test various sensor configurations for this application in order to
find the optimum arrangement.
3) Build a prototype microwave ground level detection system, which
could operate in the harvesting environment, and was suitable for
41
future development towards control of the base-cutter height and
other sugar cane harvester operations.
To achieve these objectives the first step taken was to verify that the
microwave transmission sensor approach was suitable for the base-cutter
height control application. This was to be conducted through a series of
laboratory and field tests. These preliminary investigations were also used
to determine the best configuration of the sensor for use on a sugar cane
harvester.
The second stage was concerned with the building of a prototype sensor
and testing on an operational sugar cane harvester. While it would have
been nice to have produced a functional sensing system for commercial
use on board a sugar cane harvester to control the base-cutter height, this
would have been an unachievable task, and was not an aim of this study.
What was to be achieved was to ensure the suitability of a microwave
ground level detection sensor for this application. The control of the base-
cutter height based upon an output from the new sensor and testing the
effectiveness of the control system is a topic for future work.
42
Chapter 2: Laboratory Testing
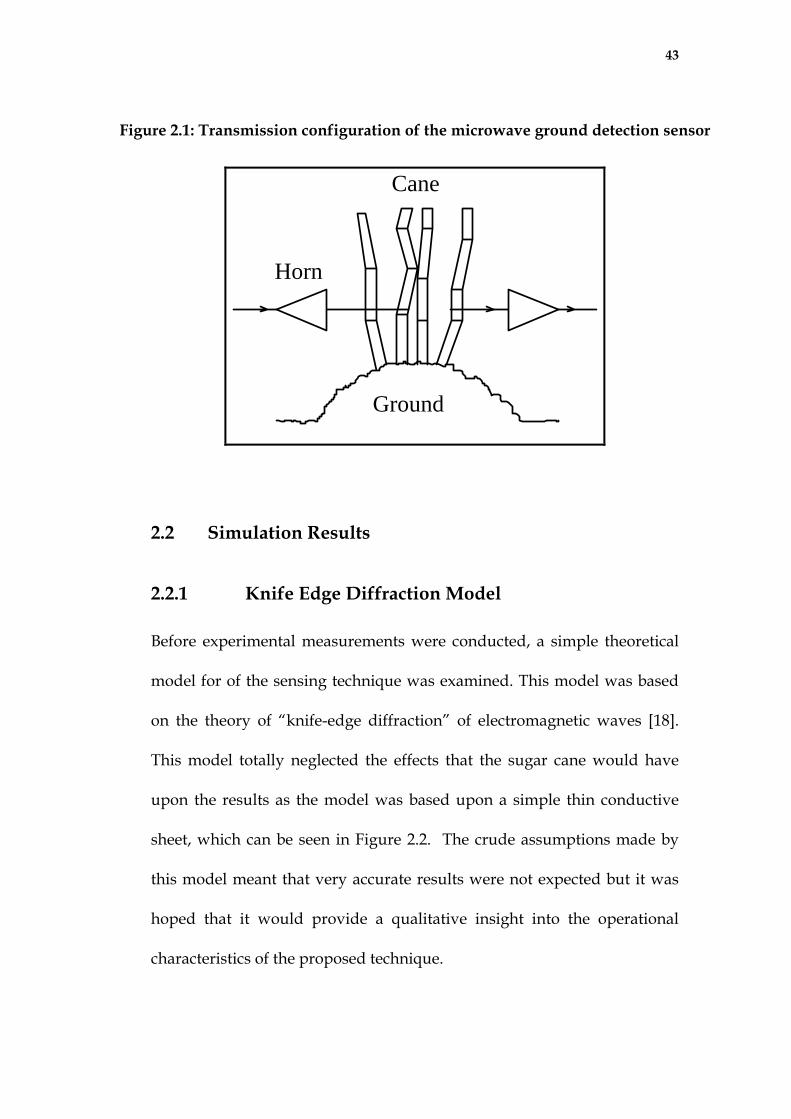
2.1 Introduction
The first stage of this project was concerned with testing the sensing
technique in the laboratory. The work conducted by Ruxton [13] and Page
[14], had shown that the only viable measurement approach was a
transmission style configuration, refer to Figure 2.1. This project therefore
started with this configuration and worked towards determining the
optimal transmission frequency, signal polarisation and antenna
specifications for the application of sugar cane harvester base-cutter height
control. The development of the sensor was primarily focused upon
finding the best system specifications so that the sensor would optimally
respond to the presence of the soil while being insensitive to the presence
of the sugar cane. Previous work was relevant to this objective and some
earlier results are recapped.
Before the results of these tests are reported though, this section includes a
description of a computer simulation of the proposed measurement
system. Although not a stated aim of this project, this work was
considered useful to give a better understanding of the measurement
principle and what system parameters would effect the operation of the
sensor.
43
Figure 2.1: Transmission configuration of the microwave ground detection sensor
Ground
Cane
Horn
2.2 Simulation Results
2.2.1 Knife Edge Diffraction Model
Before experimental measurements were conducted, a simple theoretical
model for of the sensing technique was examined. This model was based
on the theory of “knife-edge diffraction” of electromagnetic waves [18].
This model totally neglected the effects that the sugar cane would have
upon the results as the model was based upon a simple thin conductive
sheet, which can be seen in Figure 2.2. The crude assumptions made by
this model meant that very accurate results were not expected but it was
hoped that it would provide a qualitative insight into the operational
characteristics of the proposed technique.
44
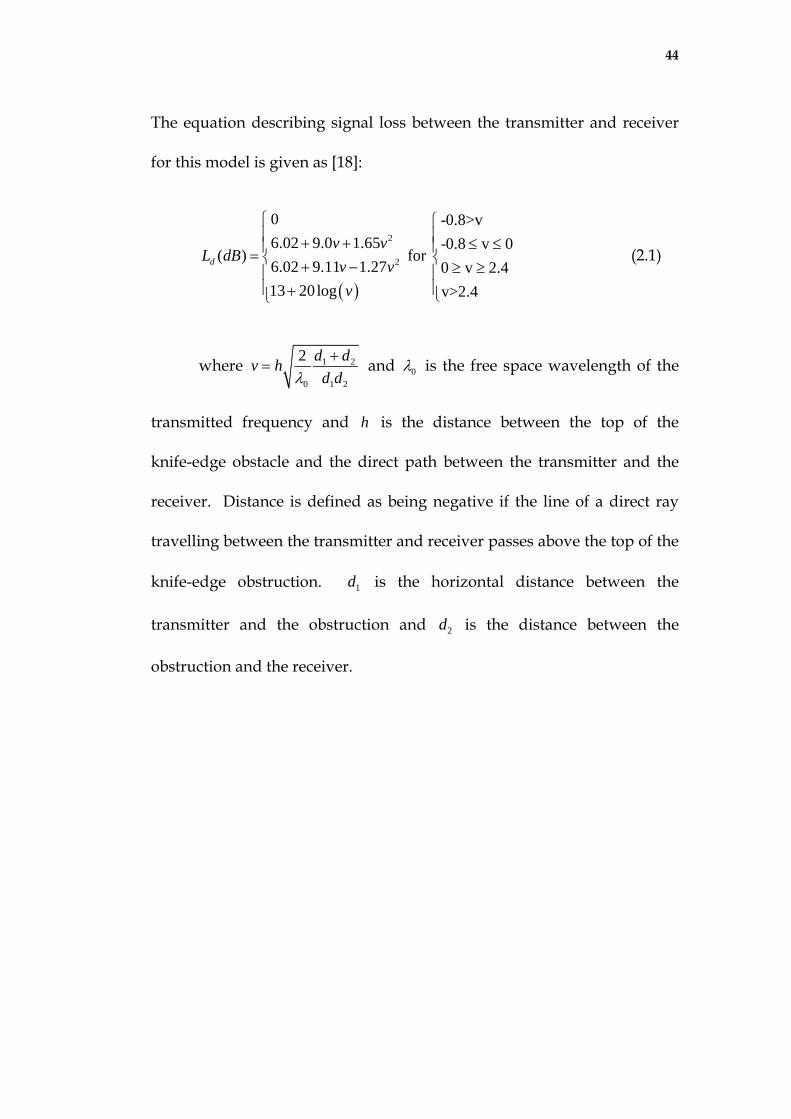
The equation describing signal loss between the transmitter and receiver
for this model is given as [18]:
( )
2
2
0 -0.8>v6.02 9.0 1.65 -0.8 v 0
( ) for 6.02 9.11 1.27 0 v 2.413 20log v>2.4
d
v vL dB
v vv
⎧ ⎧⎪ ⎪+ + ≤ ≤⎪ ⎪= ⎨ ⎨+ − ≥ ≥⎪ ⎪⎪ ⎪+ ⎩⎩
(2.1)
where 1 2
0 1 2
2 d dv hd dλ+
= and 0λ is the free space wavelength of the
transmitted frequency and is the distance between the top of the
knife-edge obstacle and the direct path between the transmitter and the
receiver. Distance is defined as being negative if the line of a direct ray
travelling between the transmitter and receiver passes above the top of the
knife-edge obstruction. is the horizontal distance between the
transmitter and the obstruction and is the distance between the
obstruction and the receiver.
h
1d
2d
45
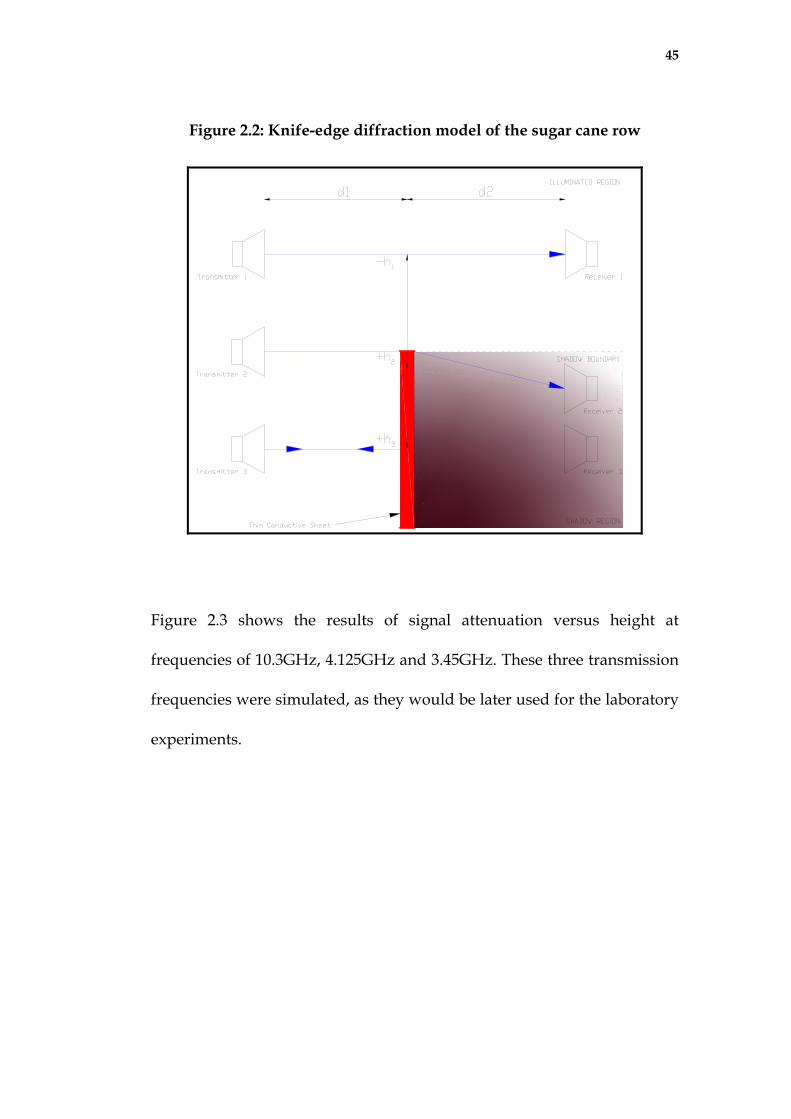
Figure 2.2: Knife-edge diffraction model of the sugar cane row
Figure 2.3 shows the results of signal attenuation versus height at
frequencies of 10.3GHz, 4.125GHz and 3.45GHz. These three transmission
frequencies were simulated, as they would be later used for the laboratory
experiments.
46
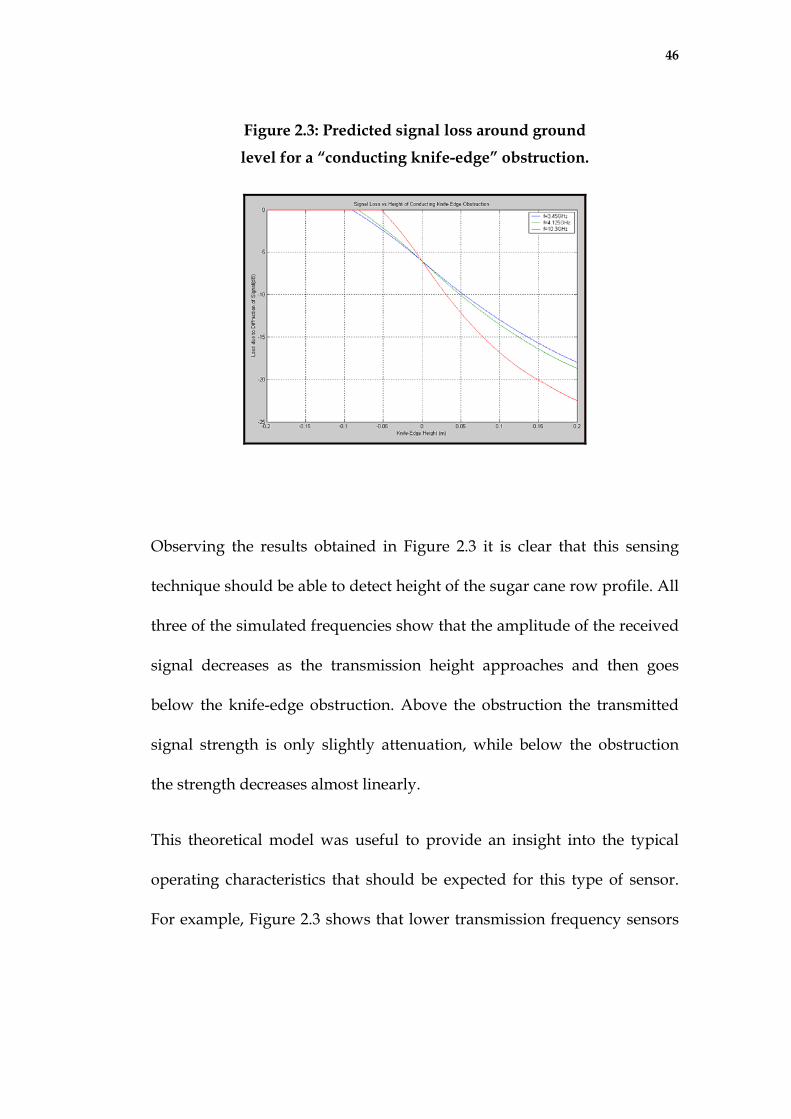
Figure 2.3: Predicted signal loss around ground
level for a “conducting knife-edge” obstruction.
Observing the results obtained in Figure 2.3 it is clear that this sensing
technique should be able to detect height of the sugar cane row profile. All
three of the simulated frequencies show that the amplitude of the received
signal decreases as the transmission height approaches and then goes
below the knife-edge obstruction. Above the obstruction the transmitted
signal strength is only slightly attenuation, while below the obstruction
the strength decreases almost linearly.
This theoretical model was useful to provide an insight into the typical
operating characteristics that should be expected for this type of sensor.
For example, Figure 2.3 shows that lower transmission frequency sensors
47
will provide a greater measurement range, while higher frequency signals
will be more sensitive to change in the height of the obstruction.
The microwave transmission properties can thus be used to select the
optimal operating frequency of the sensor providing the following
features for the sensor:
a) The physical characteristics of the sensor hardware can be
influenced by the selected frequency as there are size constraints for
the mounting of the sensor on a sugar cane harvester, and
b) The developed sensor must ensure that a useful output is provided
for the automated control of the base-cutter height of, a sugar cane
harvester.
2.2.2 Electromagnetic Field Simulation
The knife-edge diffraction theory that was simulated above assumes that
the obstruction is a thin, highly conductive material. In this particular
application the obstruction is a combination of the sugar cane root mound
and the row of soil. Neither the root mound nor the soil are “thin” or have
the properties of a highly conductive material. There may therefore be
some question about the validity of this model for this situation. To give a
better appreciation of how the ground height detection sensor might
respond in the actual measurement conditions to be encountered in a
sugar cane paddock, an electromagnetic field simulation was also
48
performed. An electromagnetic field was modelled using a full-wave, two-
dimensional, electromagnetic simulator program called “Real Time” [19].
This simulation program is based on the Finite-Difference Time-Domain
(FDTD) technique and illustrates the propagation of electromagnetic
waves including reflection and diffraction effects.
The first test performed with the field simulation software was a repeat of
the diffraction test mentioned above but assuming a “real” row profile
and characteristics. The configuration of the model that was simulated is
shown in Figure 2.4.
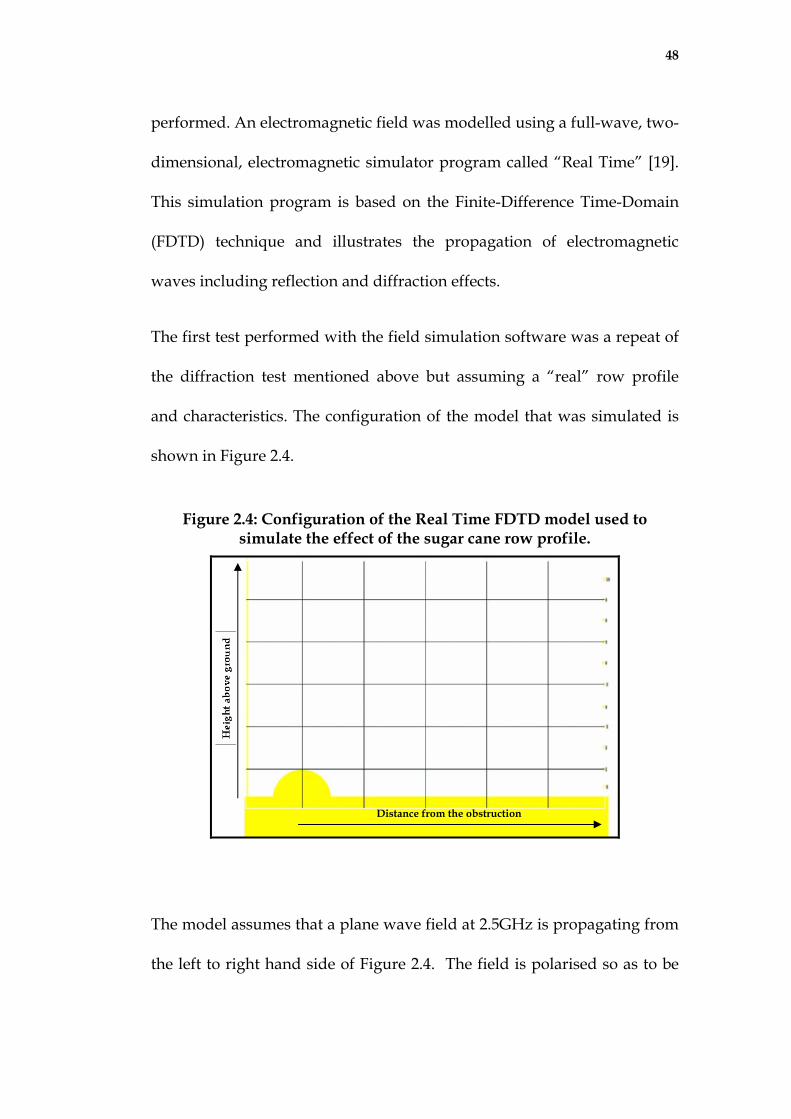
Figure 2.4: Configuration of the Real Time FDTD model used to simulate the effect of the sugar cane row profile.
Distance from the obstruction
The model assumes that a plane wave field at 2.5GHz is propagating from
the left to right hand side of Figure 2.4. The field is polarised so as to be
49
out of the page or horizontal to the ground as recommended by Page’s
previous results. The position of the ground and the sugar cane root
mound are shown in yellow in this figure. The soil was assumed to have a
dielectric constant of 8.00 and a conductivity of 0.0011 [22]. These values
were chosen to represent what might be classified as “moist soil”. The grid
lines shown in Figure 2.4 are 100mm apart and thus the row height was
assumed to be fairly low, less than 100mm high, however in practice it can
often be twice this height. The effect of the ground on the propagating
electromagnetic field was measured at the extreme right of the model
using test probes located at different heights. The probes were positioned
500mm from the centre of the row to replicate the spacing of the sensors
when mounted on a sugar cane harvester. The measurement probes where
positioned 50mm apart with the first probe 20mm above the ground level.
This placed the top probe just over 500mm above the ground level.
The field intensity at the end of the simulation period for the model is
shown in Figure 2.5. The regions of dark red and blue show areas where
the electromagnetic field is the strongest while the colour white represents
where the field strength is zero. The red and blue colours show the
different polarity of the field being either positive or negative. The cyclic
intensity of the field as it propagates from the left to right hand side is thus
clearly seen as the alternating of the red and blue bands. During the
simulation, these bands can be seen to progress from left to right hand
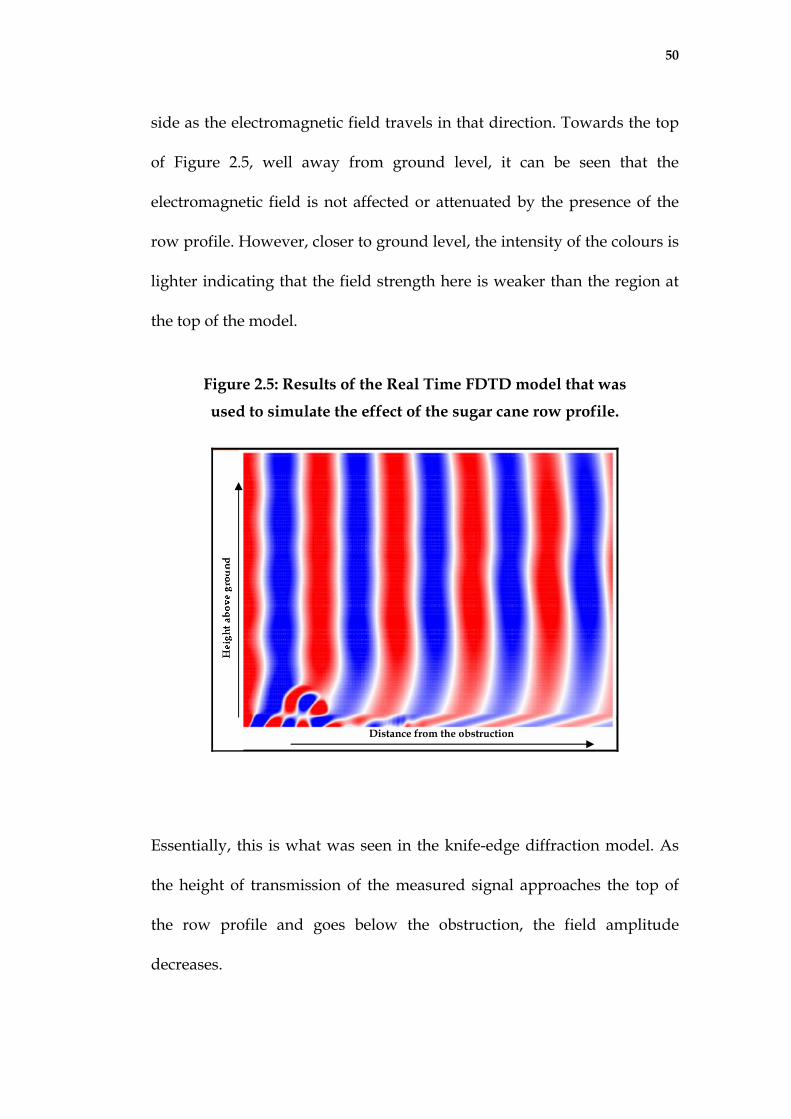
50
side as the electromagnetic field travels in that direction. Towards the top
of Figure 2.5, well away from ground level, it can be seen that the
electromagnetic field is not affected or attenuated by the presence of the
row profile. However, closer to ground level, the intensity of the colours is
lighter indicating that the field strength here is weaker than the region at
the top of the model.
Figure 2.5: Results of the Real Time FDTD model that was
used to simulate the effect of the sugar cane row profile.
Essentially, this is what was s
the height of transmission of
the row profile and goes b
decreases.
Distance from the obstruction
een in the knife-edge diffraction model. As
the measured signal approaches the top of
elow the obstruction, the field amplitude
51
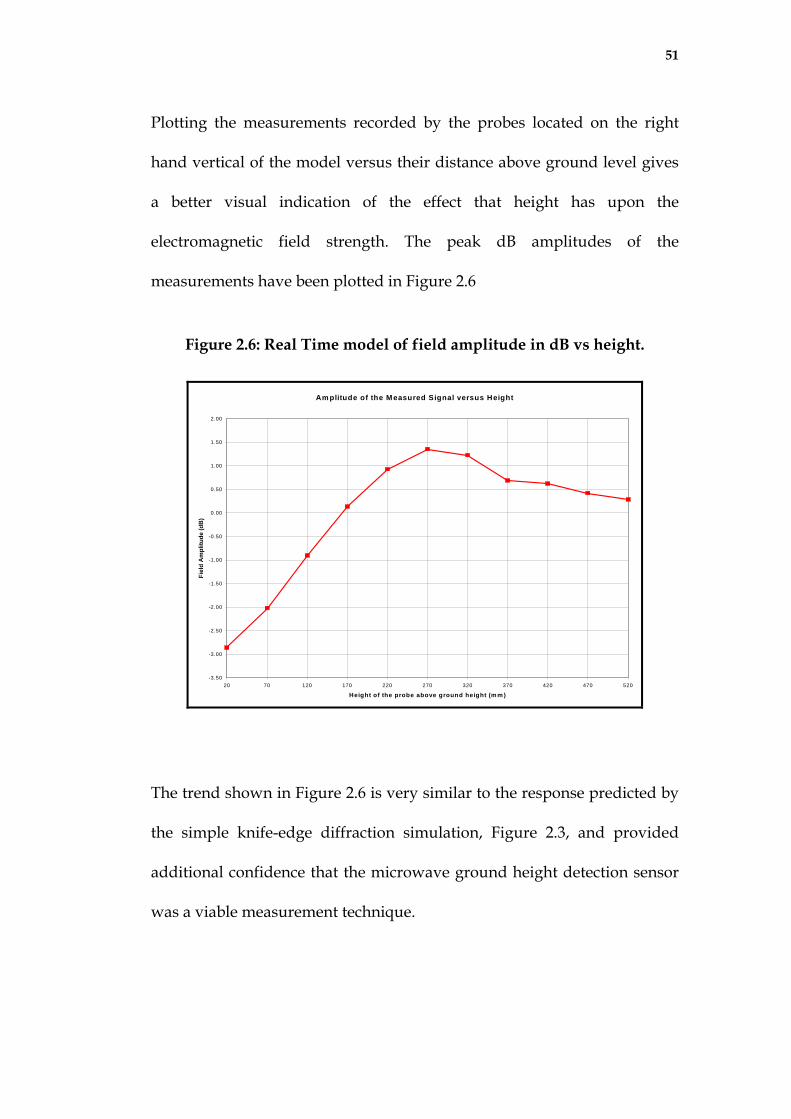
Plotting the measurements recorded by the probes located on the right
hand vertical of the model versus their distance above ground level gives
a better visual indication of the effect that height has upon the
electromagnetic field strength. The peak dB amplitudes of the
measurements have been plotted in Figure 2.6
Figure 2.6: Real Time model of field amplitude in dB vs height.
Am plitude of the Measured Signal versus Height
-3.50
-3.00
-2.50
-2.00
-1.50
-1.00
-0.50
0.00
0.50
1.00
1.50
2.00
20 70 120 170 220 270 320 370 420 470 520
Height of the probe above ground height (m m )
Fiel
d A
mpl
itude
(dB
)
The trend shown in Figure 2.6 is very similar to the response predicted by
the simple knife-edge diffraction simulation, Figure 2.3, and provided
additional confidence that the microwave ground height detection sensor
was a viable measurement technique.
52
In both of the two simulations, the presence of the sugar cane was
neglected when predicting the amplitudes of the electromagnetic fields
that would be measured around ground height in this application. In
practice though, the sugar cane will have an effect on the measured field
strength. Unfortunately, the orientation, size and density of the sugar cane
plant will vary significantly throughout a sugar cane paddock and hence a
typical model would be difficult to simulate. Furthermore, the
electromagnetic field simulation software that was available for this
project, only allowed for 2-dimensional structures to be modelled, and
therefore could not take into account both affects of the ground and the
sugar cane at the same time.
In order to get an idea of the effect of the sugar cane, it was decided to run
a simulation of the model in the horizontal plane rather than the vertical
plane; this was modelled and is shown in Figure 2.7. Thus, rather than
simulating the field amplitude variation due to the height that the signal
was positioned above ground level, the variation of the electromagnetic
field at a set height along the length of a row of sugar cane was modelled.
53
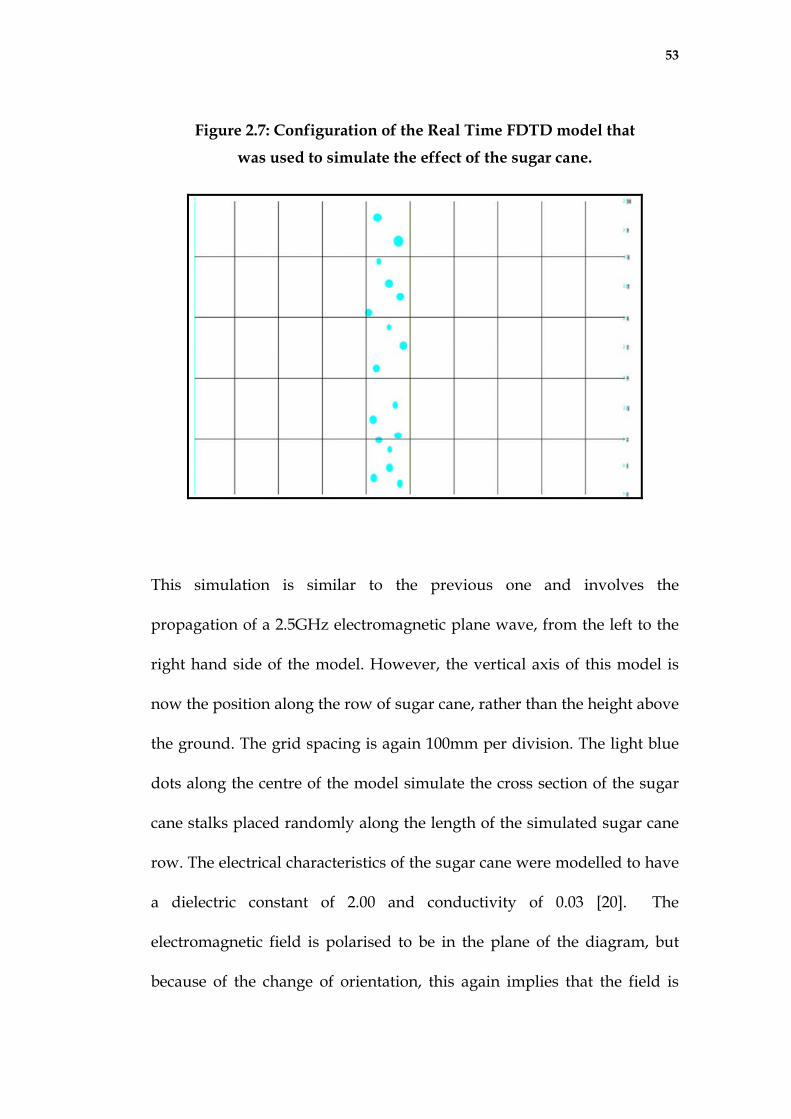
Figure 2.7: Configuration of the Real Time FDTD model that
was used to simulate the effect of the sugar cane.
This simulation is similar to the previous one and involves the
propagation of a 2.5GHz electromagnetic plane wave, from the left to the
right hand side of the model. However, the vertical axis of this model is
now the position along the row of sugar cane, rather than the height above
the ground. The grid spacing is again 100mm per division. The light blue
dots along the centre of the model simulate the cross section of the sugar
cane stalks placed randomly along the length of the simulated sugar cane
row. The electrical characteristics of the sugar cane were modelled to have
a dielectric constant of 2.00 and conductivity of 0.03 [20]. The
electromagnetic field is polarised to be in the plane of the diagram, but
because of the change of orientation, this again implies that the field is
54
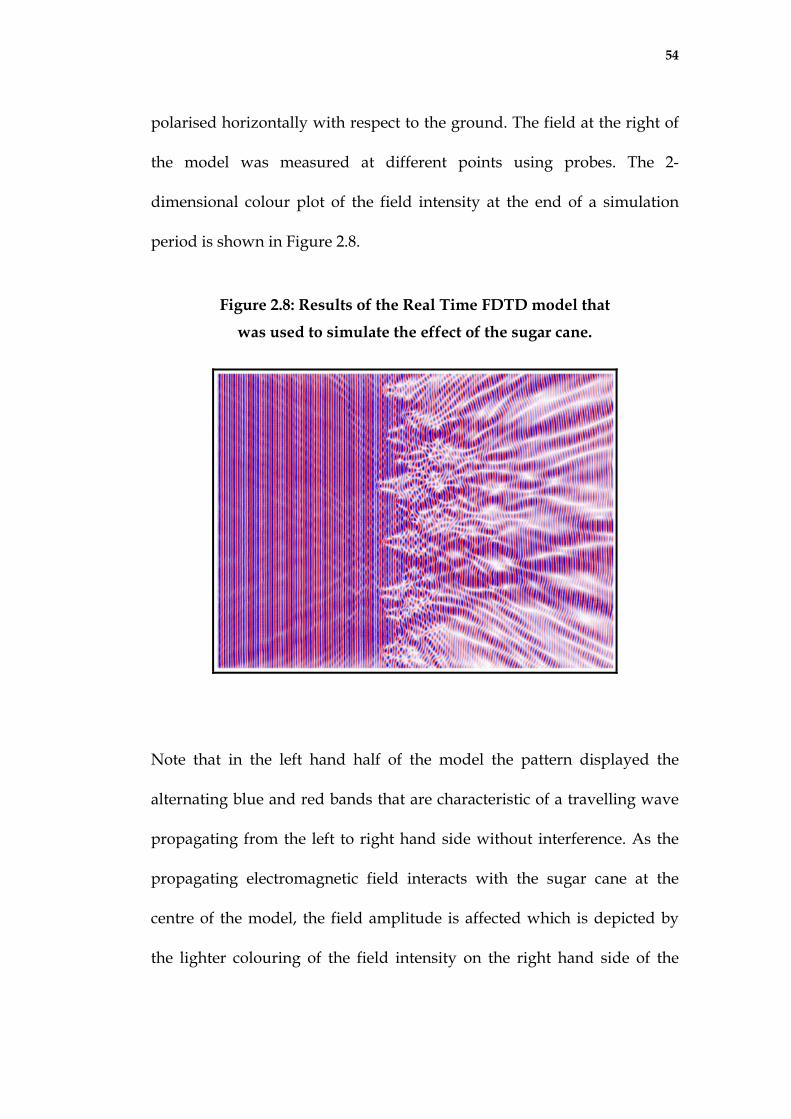
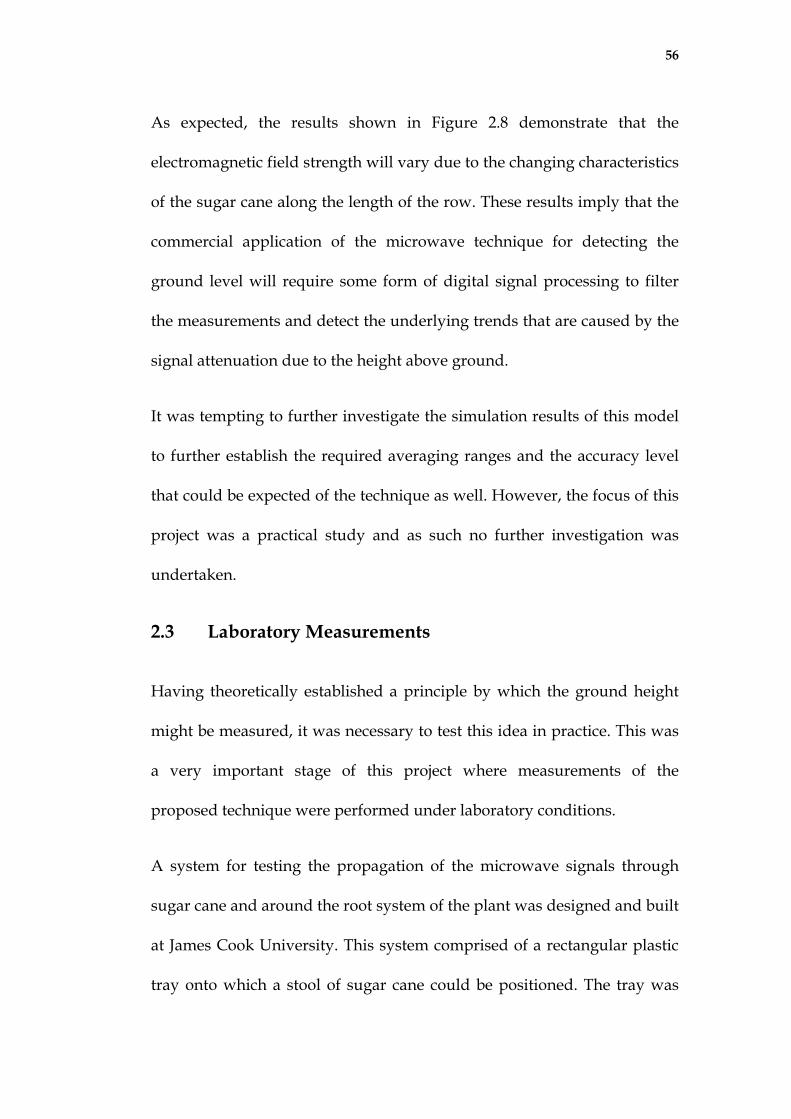
polarised horizontally with respect to the ground. The field at the right of
the model was measured at different points using probes. The 2-
dimensional colour plot of the field intensity at the end of a simulation
period is shown in Figure 2.8.
Figure 2.8: Results of the Real Time FDTD model that
was used to simulate the effect of the sugar cane.
Note that in the left hand half of the model the pattern displayed the
alternating blue and red bands that are characteristic of a travelling wave
propagating from the left to right hand side without interference. As the
propagating electromagnetic field interacts with the sugar cane at the
centre of the model, the field amplitude is affected which is depicted by
the lighter colouring of the field intensity on the right hand side of the
55
model. There is also a distinct streaking pattern of the field intensity in the
right hand half of the model as the field strength is affected by the multi-
path propagation of the transmitted electromagnetic waveform through
the sugar cane. The multi-path signals are combined on the right hand
side of the model either in or out of phase producing constructive or
destructive interference. The significance of these results is that the
simulation shows that the sugar cane will attenuate the transmitted
electromagnetic field, however, this attenuation level will not be constant
along the length of the row. This is clearly shown by plotting the dB
values of the field amplitude that is measured by the probes in the model.
The results can be seen in Figure 2.9.
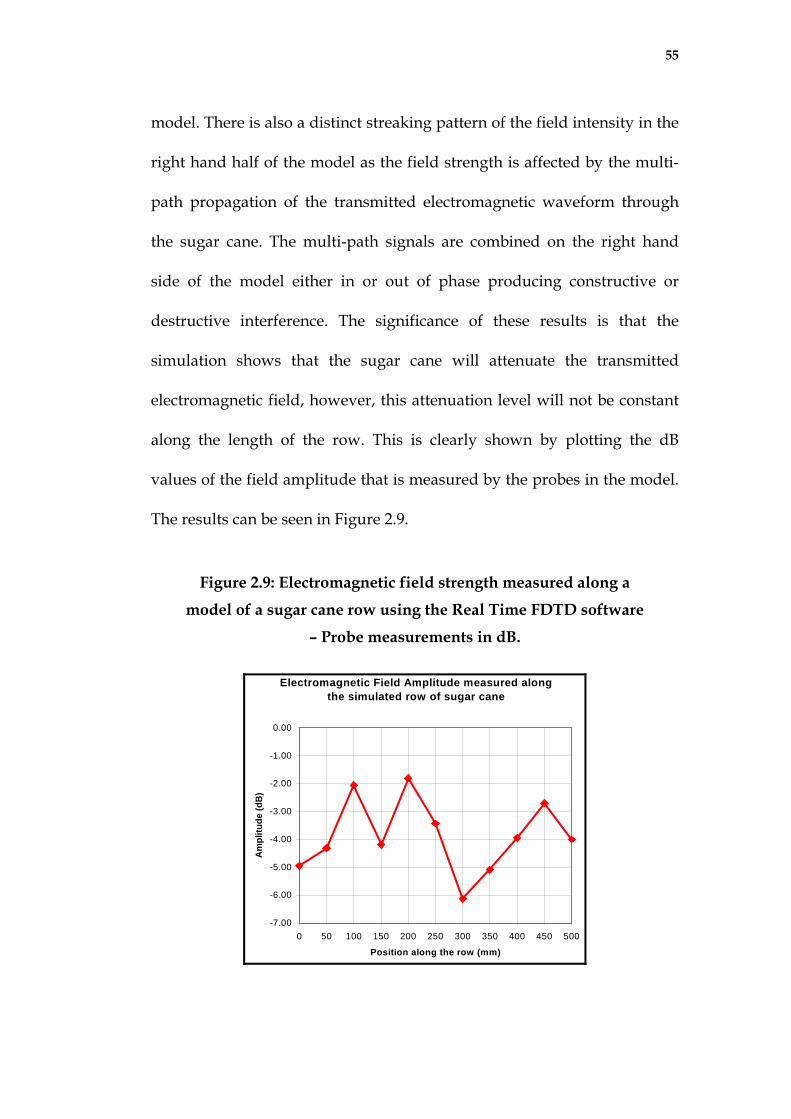
Figure 2.9: Electromagnetic field strength measured along a
model of a sugar cane row using the Real Time FDTD software
– Probe measurements in dB.
Electromagnetic Field Amplitude measured along the simulated row of sugar cane
-7.00
-6.00
-5.00
-4.00
-3.00
-2.00
-1.00
0.00
0 50 100 150 200 250 300 350 400 450 500
Position along the row (mm)
Am
plitu
de (d
B)
56
As expected, the results shown in Figure 2.8 demonstrate that the
electromagnetic field strength will vary due to the changing characteristics
of the sugar cane along the length of the row. These results imply that the
commercial application of the microwave technique for detecting the
ground level will require some form of digital signal processing to filter
the measurements and detect the underlying trends that are caused by the
signal attenuation due to the height above ground.
It was tempting to further investigate the simulation results of this model
to further establish the required averaging ranges and the accuracy level
that could be expected of the technique as well. However, the focus of this
project was a practical study and as such no further investigation was
undertaken.
2.3 Laboratory Measurements
Having theoretically established a principle by which the ground height
might be measured, it was necessary to test this idea in practice. This was
a very important stage of this project where measurements of the
proposed technique were performed under laboratory conditions.
A system for testing the propagation of the microwave signals through
sugar cane and around the root system of the plant was designed and built
at James Cook University. This system comprised of a rectangular plastic
tray onto which a stool of sugar cane could be positioned. The tray was
57
braced and supported by ropes so that the tray and the stool of sugar cane
could be manually raised and lowered using a block and tackle pulley
arrangement. To measure the attenuation of the microwave test signal
with respect to ground height, two microwave horn antennas were
statically mounted on either side of the sugar cane stool while it was
raised and lowered. A vector network analyser (Hewlett Packard model
8722A) was connected via radio frequency cables to the horn antennas.
With each set of antennas connected the transmitted signal was referenced
with no obstruction between the transmitter and the receiver to eliminate
the effect of the different gains of the three antennas. The amplitude of the
signal transmitted was then measured through the sugar cane at various
heights above the row sample. Measurements were logged and were
analysed at a later date.
Using the test system described above, the amplitude of the received
signal was measured as it was transmitted at different heights above
ground level. Tests were performed on three different sugar cane samples
using three different frequency band signals; S-Band (2.6-3.95GHz), C-
Band (3.3-4.9GHz) and X-Band (8.2-12.4GHz). In all cases the transmitted
signal was polarised horizontally to the groundV.
V Ruxton established in a preliminary study that this was the preferred polarisation state
to minimise interference from vertical cane stalks.
58
The three sugar cane samples that were tested originated from two
different areas; one sample was from the Burdekin region and two
samples from the Herbert region. The sample from the Burdekin (Sample
#1) was striped of trash to simulate burnt sugar cane. The Burdekin
samples were quite thick (the diameter of the stalks was between 25mm
and 30mm) but the sample was also quite old and was almost dead. The
two Herbert stools were both alive but were somewhat different; one
sample (Sample #2) possessed reasonably thick stalks (diameters between
20mm and 25mm) and had a lot of trash while the second sample (Sample
#3) was thinner (diameters between 15mm and 20mm) and also had
noticeably less trash.
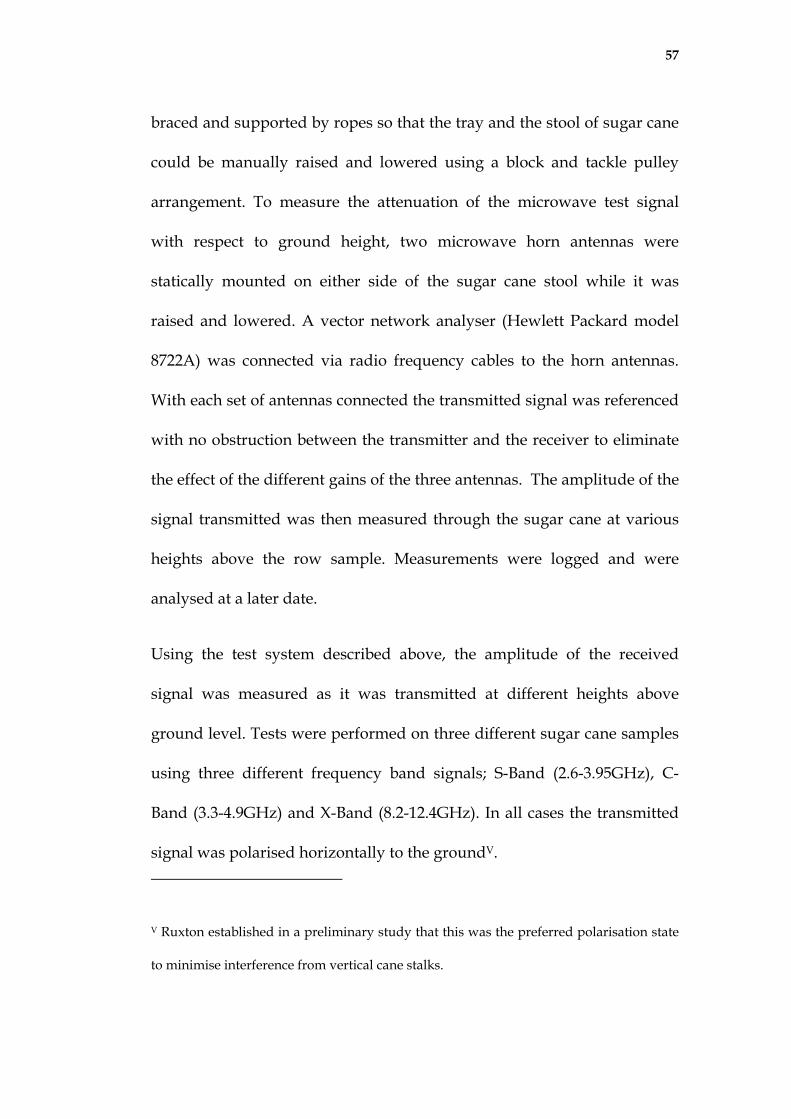
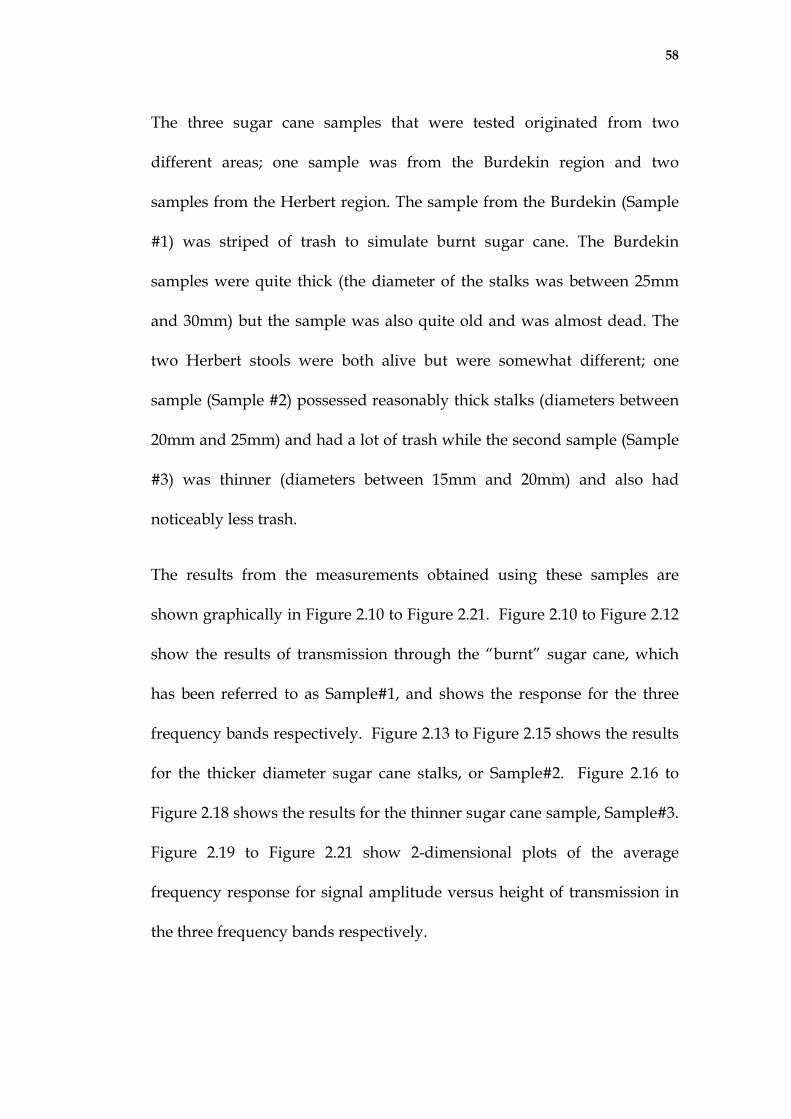
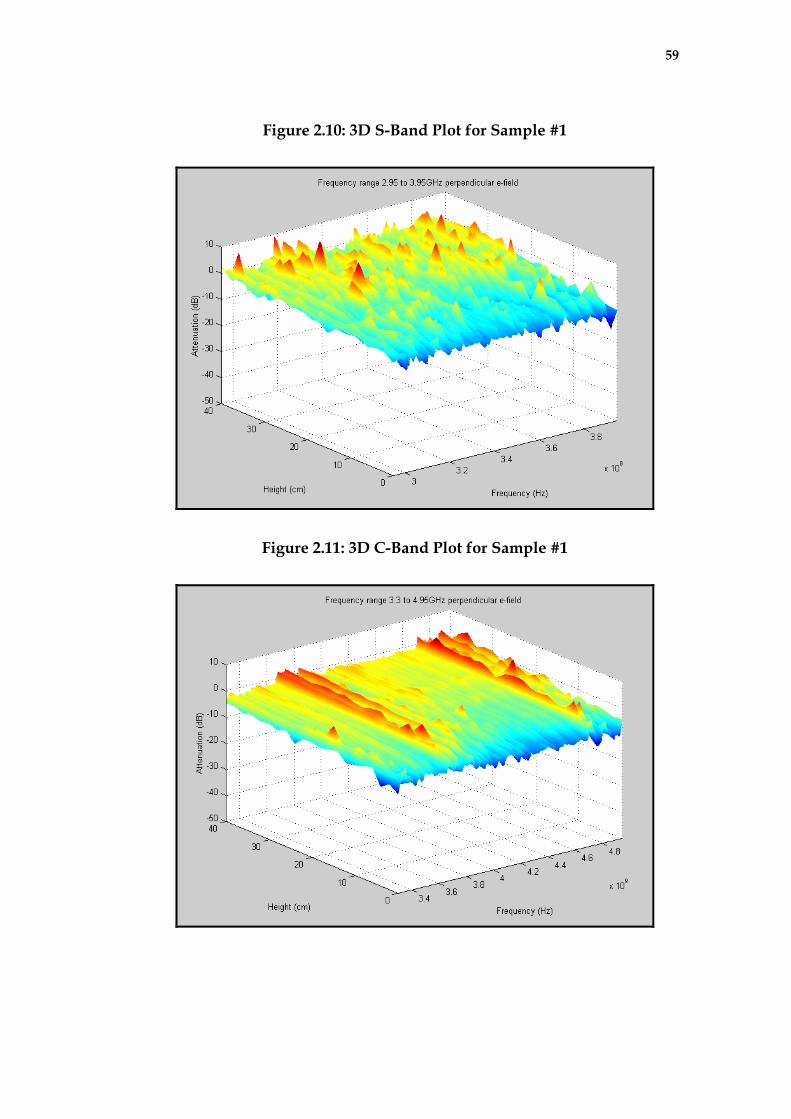
The results from the measurements obtained using these samples are
shown graphically in Figure 2.10 to Figure 2.21. Figure 2.10 to Figure 2.12
show the results of transmission through the “burnt” sugar cane, which
has been referred to as Sample#1, and shows the response for the three
frequency bands respectively. Figure 2.13 to Figure 2.15 shows the results
for the thicker diameter sugar cane stalks, or Sample#2. Figure 2.16 to
Figure 2.18 shows the results for the thinner sugar cane sample, Sample#3.
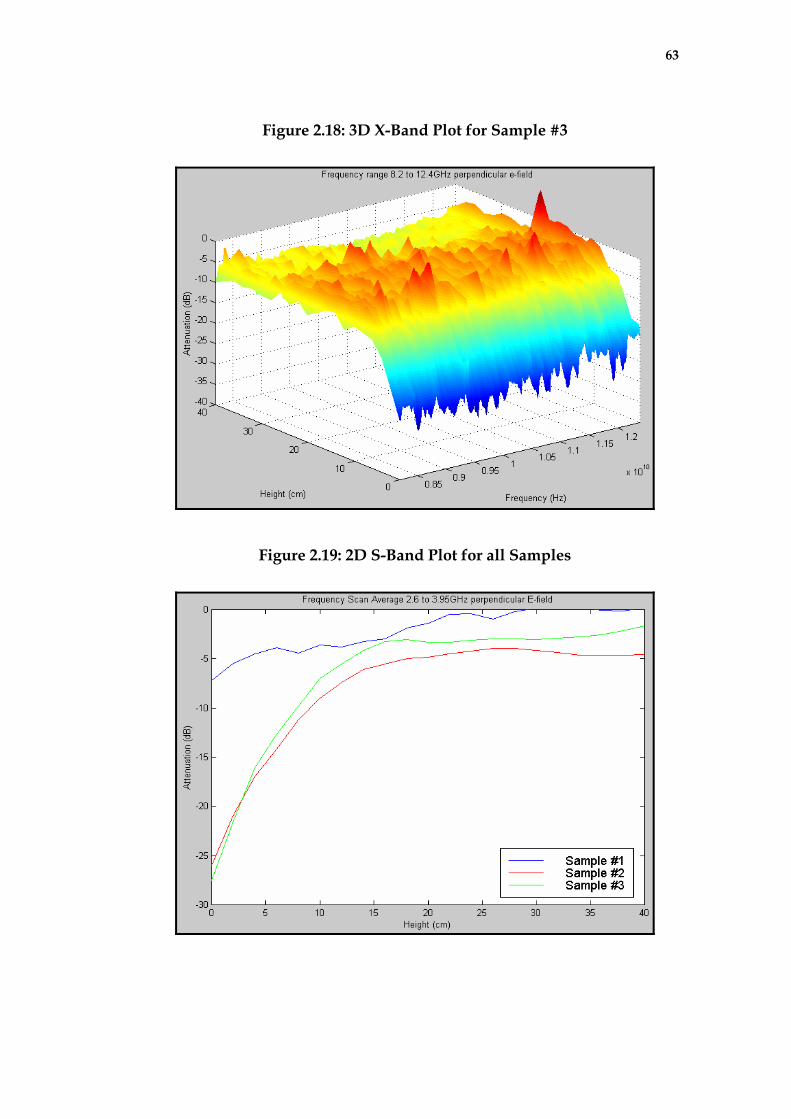
Figure 2.19 to Figure 2.21 show 2-dimensional plots of the average
frequency response for signal amplitude versus height of transmission in
the three frequency bands respectively.
59
Figure 2.10: 3D S-Band Plot for Sample #1
Figure 2.11: 3D C-Band Plot for Sample #1
60
Figure 2.12: 3D X-Band Plot for Sample #1
Figure 2.13: 3D S-Band Plot for Sample #2
61
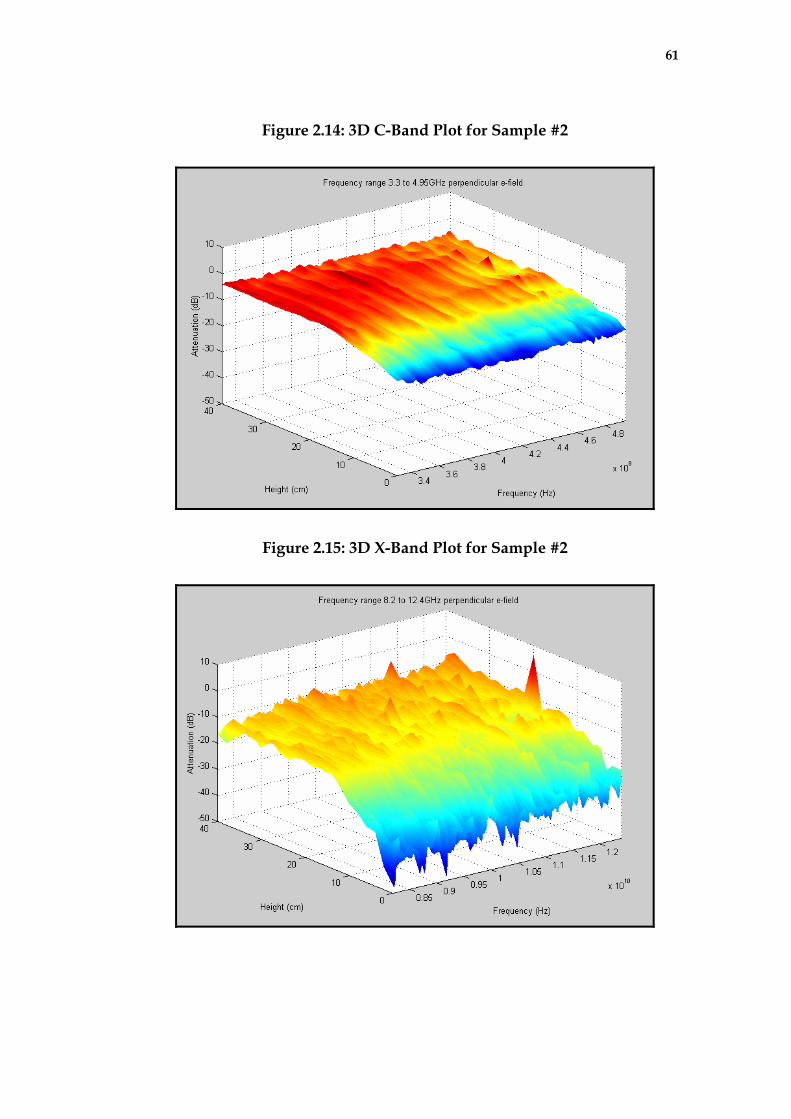
Figure 2.14: 3D C-Band Plot for Sample #2
Figure 2.15: 3D X-Band Plot for Sample #2
62
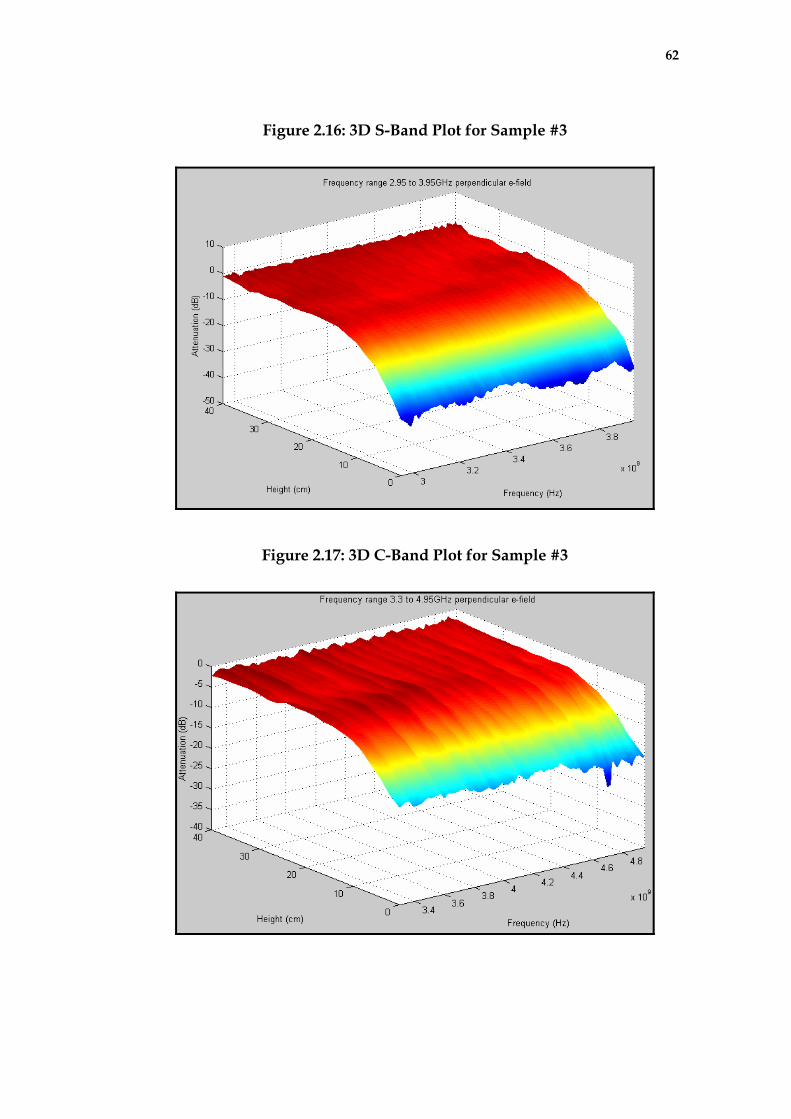
Figure 2.16: 3D S-Band Plot for Sample #3
Figure 2.17: 3D C-Band Plot for Sample #3
63
Figure 2.18: 3D X-Band Plot for Sample #3
Figure 2.19: 2D S-Band Plot for all Samples
64
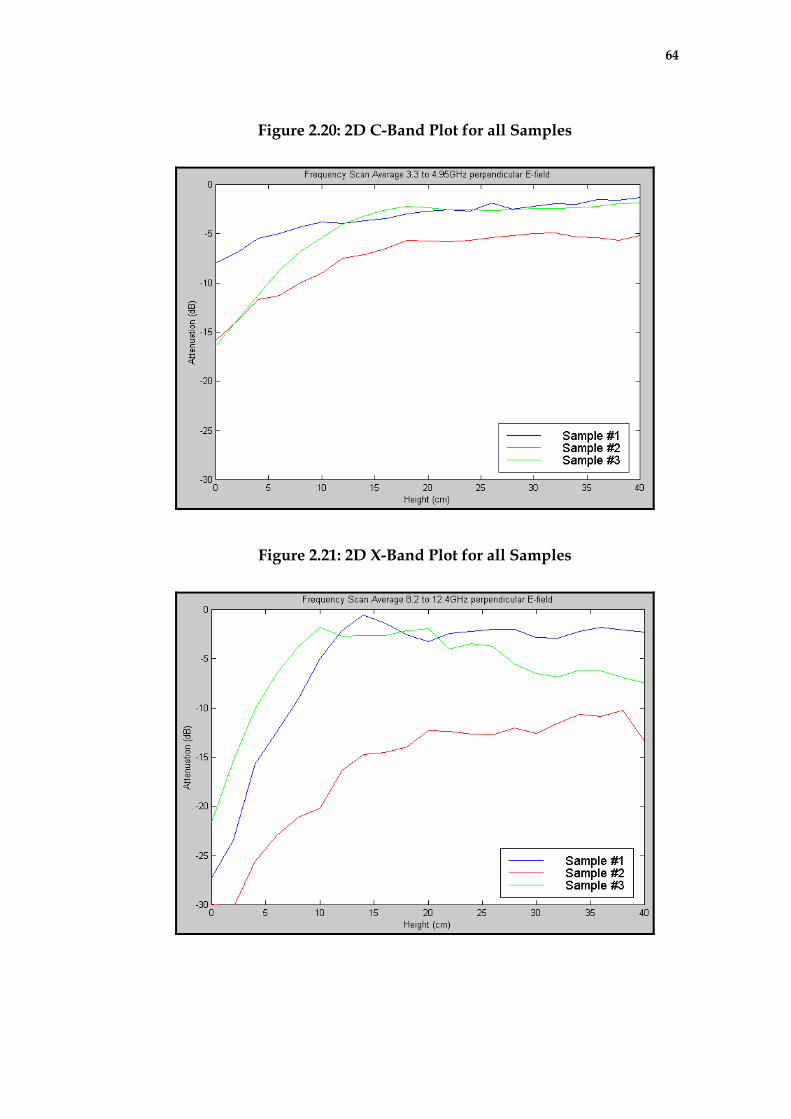
Figure 2.20: 2D C-Band Plot for all Samples
Figure 2.21: 2D X-Band Plot for all Samples
65
These last three graphs show that sugar cane diameter and trash levels
effect the attenuation of the transmitted signal. It should also be noted that
the antenna used for the C-Band measurements (Operating frequency of
3.3-4.9GHz in Figure 2.11, Figure 2.14 and Figure 2.17) was significantly
more directive compared to those employed in the other two bands. The
gain for the C-Band antenna was 18dB whereas the S-Band antenna had a
gain of 10dB and the gain of the X-Band antenna was 16.4dBVI.
The main conclusions drawn from both the experimental measurements
and the theoretically predicted results are:
• The lower the frequency of the measurement signal, the “smoother”
the measured amplitude variations are. The most probable reason
for this observation is that lower frequency signals are less sensitive
to multi-path interference caused by reflections as the measurement
signal is transmitted through the sugar cane. From this point of
view, lower frequency measurement signals would be
advantageous.
• When comparing the results in Figure 2.12, Figure 2.15 and Figure
2.18, it can be clearly seen that sugar cane attenuates higher
VI The sharp peaks visible in the measured results of to were later
discovered to be bad data points due to an intermittent fault in a cable assembly.
Figure 2.10 Figure 2.18
66
frequency signals more than lower frequency signals. This is most
clearly seen when comparing the measured attenuation at the
maximum height above ground level, especially when comparing
the measured results for the green sugar cane where the higher
frequency signal measurements exhibit attenuation of between 10
to 15dB, where in comparison, the lower frequency measurement
signal exhibit less than 5dB attenuation at the same height. The
sugar cane therefore affects the lower frequency signal much less,
again indicating that this frequency range would be the preferred
choice for a microwave based ground level sensor.
Another characteristic that was noticed at this stage was the effect that
the directivity of the antenna had upon the response of the sensor. This
effect is easily identified when comparing the experimental results of
the C-Band and S-Band measurements. The frequencies of the
transmitted signals for these measurements overlapped slightly but
were measured using two antennas with quite different antenna gains.
The antenna used for the measurements in the S-Band had a gain value
of 10.1dB, while the antenna used in the C-Band was much more
directional with a gain value of 18dB. Comparing these results leads to
the conclusion that the highly directional antenna is less sensitive to
the ground level. This result is understandable when it is noted that
both of the antennas were always used with the centre of the
67
transmitted signal positioned above ground level during these tests.
Under such conditions, only a small area of the Fresnel zone of the
signal will be obstructed by the row profile and thus less attenuation
would be expected when comparing a high gain antenna to one with a
much lower gain. This observation indicates that a lower gain antenna
would be better suited to the proposed measurement application.
It can be summarised that the laboratory results indicate that the
microwave ground level detection technique should be further
investigated with the design optimised to operate at a low, horizontally
polarised transmission frequency signal with reasonably low gain
antennas.
2.4 Conclusion
By performing simulations and laboratory results of the proposed
measurement technique it was determined that further development of
the technique was required to be able to eventually produce a
commercially available ground level measurement system suitable for use
on a sugar cane harvesters. Both the theoretical and laboratory results
indicated that the technique was fundamentally sound and the sensor
would respond to changes in the height of the ground and that it was also
fairly insensitive to the affects of signal attenuation due to the sugar cane.
The following chapters of this report describe the practical measurements

68
made with prototype sensors both in the field using portable test
equipment and on-board a sugar cane harvester during operation.
69
Chapter 3: Field Testing
3.1
3.2
Introduction
The laboratory results, outlined in the previous chapter, verified the
fundamental principle of the proposed microwave ground level sensing
technique and helped to define the main configuration parameters of a
device that was expected to be able to be used on a sugar cane harvester.
However, it was evident that the operational environment where the
sensors would be positioned on a real sugar cane harvester could be
significantly different to the simulated test conditions that were
established in the laboratory. For this reason it was decided to perform
some tests in the field using an experimental set-up. The purpose of these
tests were to establish what effect real sugar cane and any other
obstructions would have on the operation of the ground level sensor.
Field Test System
To test the proposed measurement technique in the field a portable testing
unit was built. The block diagram schematic of the system that was
developed for these field tests is shown in Figure 3.1.
70
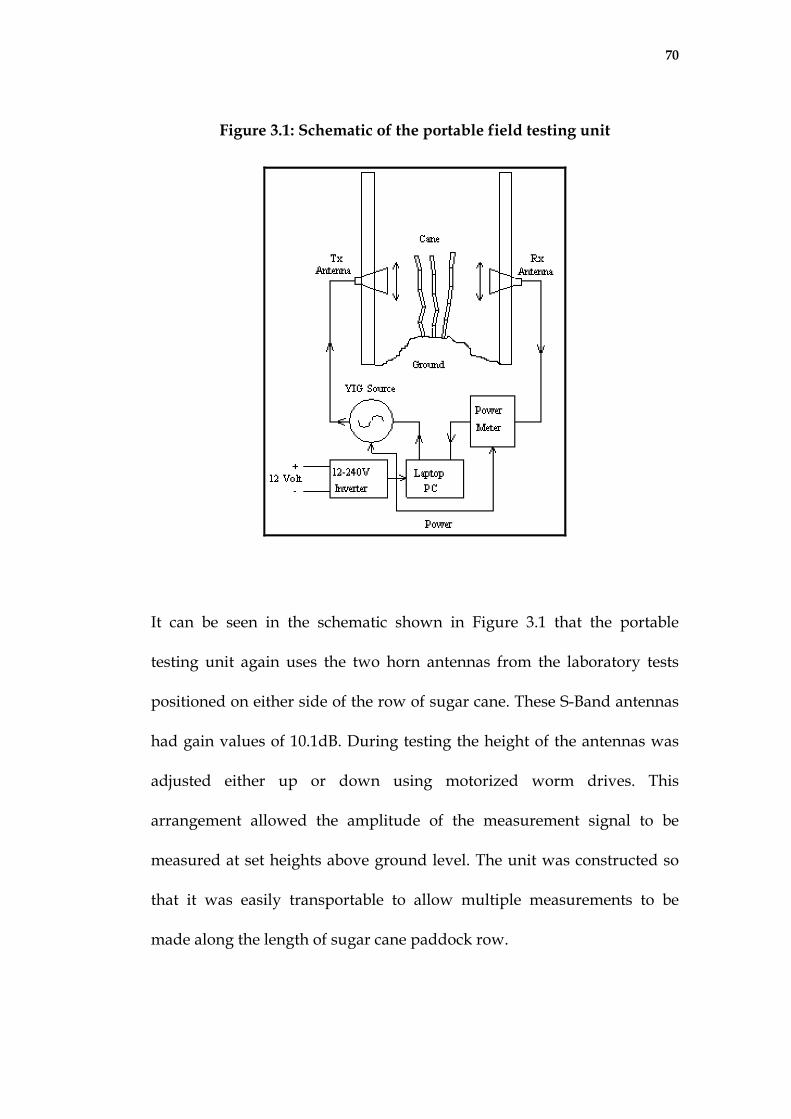
Figure 3.1: Schematic of the portable field testing unit
It can be seen in the schematic shown in Figure 3.1 that the portable
testing unit again uses the two horn antennas from the laboratory tests
positioned on either side of the row of sugar cane. These S-Band antennas
had gain values of 10.1dB. During testing the height of the antennas was
adjusted either up or down using motorized worm drives. This
arrangement allowed the amplitude of the measurement signal to be
measured at set heights above ground level. The unit was constructed so
that it was easily transportable to allow multiple measurements to be
made along the length of sugar cane paddock row.
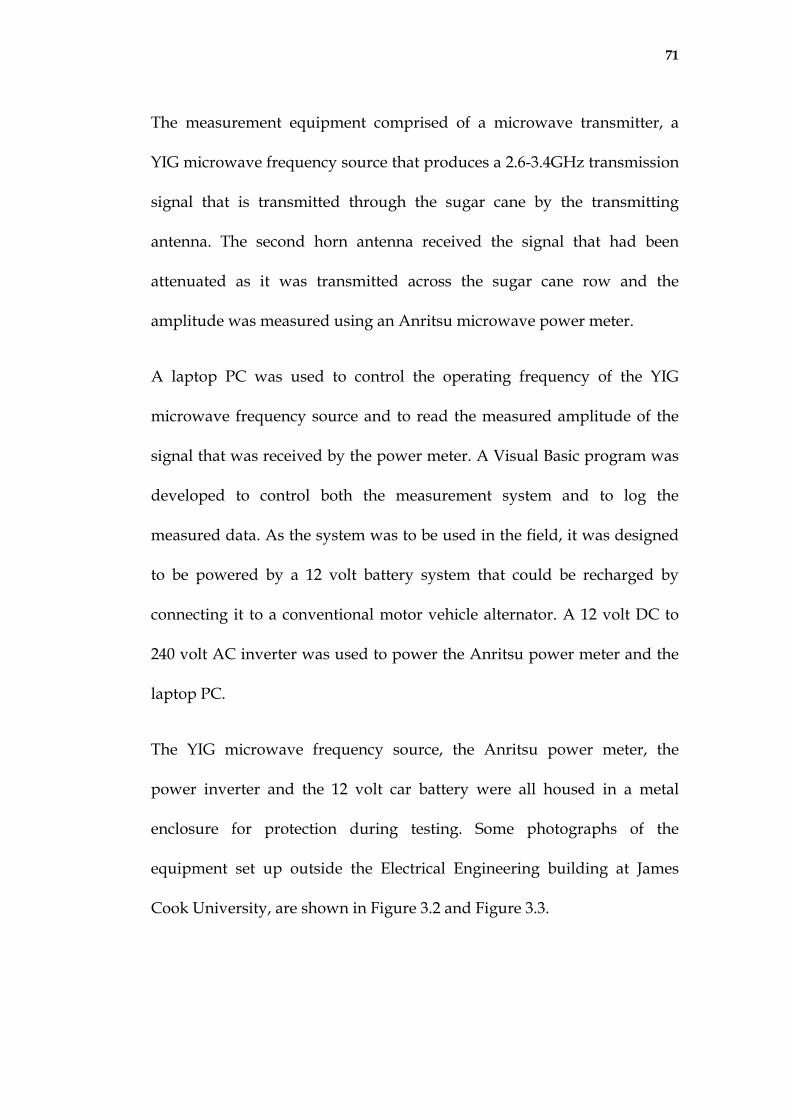
71
The measurement equipment comprised of a microwave transmitter, a
YIG microwave frequency source that produces a 2.6-3.4GHz transmission
signal that is transmitted through the sugar cane by the transmitting
antenna. The second horn antenna received the signal that had been
attenuated as it was transmitted across the sugar cane row and the
amplitude was measured using an Anritsu microwave power meter.
A laptop PC was used to control the operating frequency of the YIG
microwave frequency source and to read the measured amplitude of the
signal that was received by the power meter. A Visual Basic program was
developed to control both the measurement system and to log the
measured data. As the system was to be used in the field, it was designed
to be powered by a 12 volt battery system that could be recharged by
connecting it to a conventional motor vehicle alternator. A 12 volt DC to
240 volt AC inverter was used to power the Anritsu power meter and the
laptop PC.
The YIG microwave frequency source, the Anritsu power meter, the
power inverter and the 12 volt car battery were all housed in a metal
enclosure for protection during testing. Some photographs of the
equipment set up outside the Electrical Engineering building at James
Cook University, are shown in Figure 3.2 and Figure 3.3.
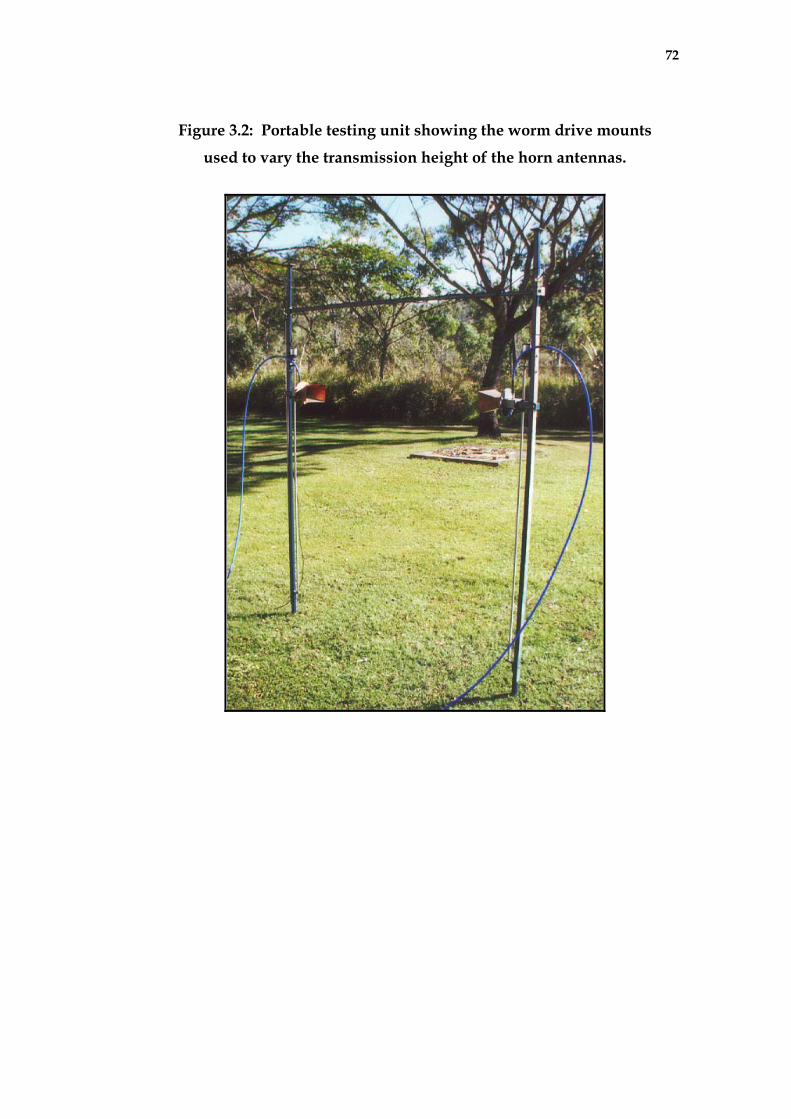
72
Figure 3.2: Portable testing unit showing the worm drive mounts
used to vary the transmission height of the horn antennas.
73
Figure 3.3: Photograph of the control box showing the YIG microwave
source, Anritsu power meter, power inverter and 12 volt battery
The measurements recorded using the portable test equipment were later
analysed using Matlab™ scripts. The measured responses were plotted to
produce a visualise display of the field test data, some of these 3-
dimensional plots are shown in Figure 3.4 to Figure 3.23. These plots
show the typical variety of results that were measured using the portable
field testing equipment. The 3-D graphs show the signal attenuation
versus the height of transmission above ground level versus the frequency
of transmission for the frequencies of 2.6-3.4GHz (the height measurement
of zero is defined as the top of the root mound of the sugar cane plant and
is theoretically the optimum cutting height of the base-cutters). The 2-D
graphs show the average frequency response of the signal attenuation
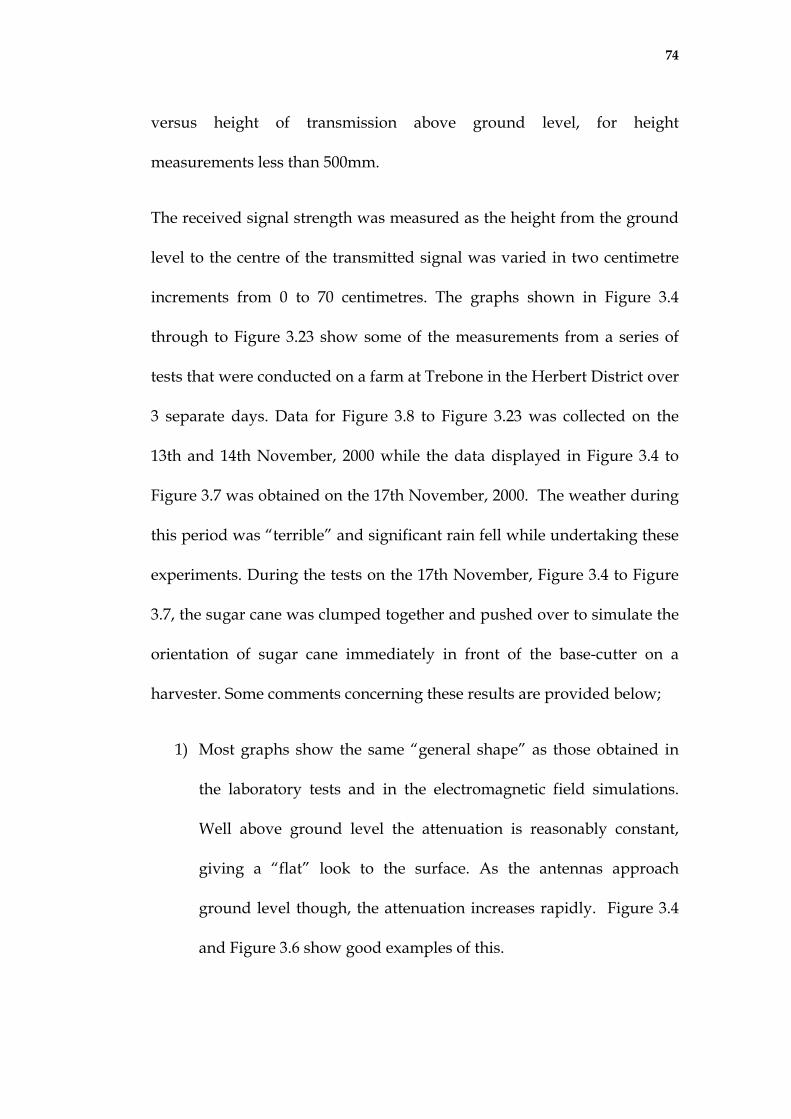
74
versus height of transmission above ground level, for height
measurements less than 500mm.
The received signal strength was measured as the height from the ground
level to the centre of the transmitted signal was varied in two centimetre
increments from 0 to 70 centimetres. The graphs shown in Figure 3.4
through to Figure 3.23 show some of the measurements from a series of
tests that were conducted on a farm at Trebone in the Herbert District over
3 separate days. Data for Figure 3.8 to Figure 3.23 was collected on the
13th and 14th November, 2000 while the data displayed in Figure 3.4 to
Figure 3.7 was obtained on the 17th November, 2000. The weather during
this period was “terrible” and significant rain fell while undertaking these
experiments. During the tests on the 17th November, Figure 3.4 to Figure
3.7, the sugar cane was clumped together and pushed over to simulate the
orientation of sugar cane immediately in front of the base-cutter on a
harvester. Some comments concerning these results are provided below;
1) Most graphs show the same “general shape” as those obtained in
the laboratory tests and in the electromagnetic field simulations.
Well above ground level the attenuation is reasonably constant,
giving a “flat” look to the surface. As the antennas approach
ground level though, the attenuation increases rapidly. Figure 3.4
and Figure 3.6 show good examples of this.
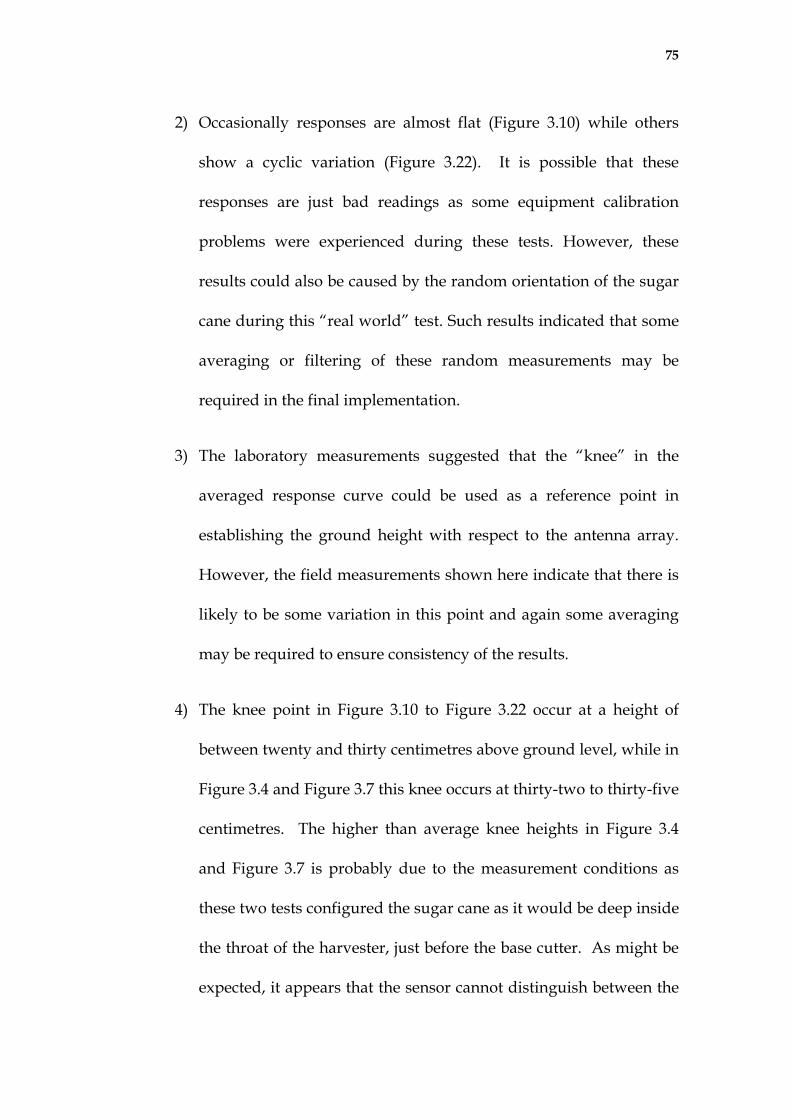
75
2) Occasionally responses are almost flat (Figure 3.10) while others
show a cyclic variation (Figure 3.22). It is possible that these
responses are just bad readings as some equipment calibration
problems were experienced during these tests. However, these
results could also be caused by the random orientation of the sugar
cane during this “real world” test. Such results indicated that some
averaging or filtering of these random measurements may be
required in the final implementation.
3) The laboratory measurements suggested that the “knee” in the
averaged response curve could be used as a reference point in
establishing the ground height with respect to the antenna array.
However, the field measurements shown here indicate that there is
likely to be some variation in this point and again some averaging
may be required to ensure consistency of the results.
4) The knee point in Figure 3.10 to Figure 3.22 occur at a height of
between twenty and thirty centimetres above ground level, while in
Figure 3.4 and Figure 3.7 this knee occurs at thirty-two to thirty-five
centimetres. The higher than average knee heights in Figure 3.4
and Figure 3.7 is probably due to the measurement conditions as
these two tests configured the sugar cane as it would be deep inside
the throat of the harvester, just before the base cutter. As might be
expected, it appears that the sensor cannot distinguish between the
76
row profile and a tightly packed bundle of sugar cane that would
have similar properties to that of a solid mass. Therefore, due to
the configuration of the sugar cane the knee point appears higher
with respect to the real ground level as it has been artificially
raised. Based upon these findings the following observations and
recommendations were made:
a) Tightly packed sugar cane produces the same measurements
as the row profile and therefore the positioning of the sensor
on the harvester will need to be considered carefully so as to
best measure the required parameter.
b) To measure the full height profile instantaneously, an array
of antennas set at different heights that can be individually
switched to a common receiver, will need to be developed..
c) Some filtering or averaging of results will need to be
implemented in the commercial product to reject random
fluctuations due to the random orientation of the sugar cane.
d) The current field test system is slow to use and does not
provide a continuous set of results along the full length of
the sugar cane row. Further tests should be made with an
antenna array mounted on a sugar cane harvester.
77
Figure 3.4: Portable FTU 3-D Results, location #1, Trebone
Figure 3.5: Portable FTU 2-D Results, location #1, Trebone
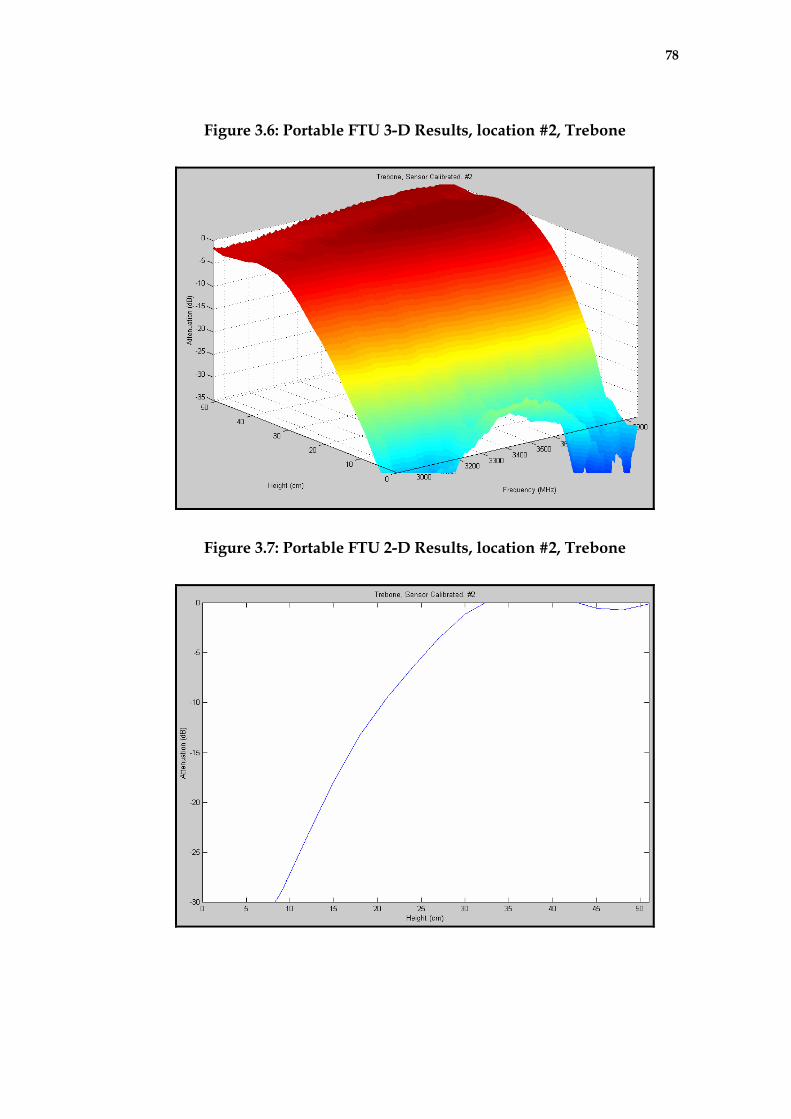
78
Figure 3.6: Portable FTU 3-D Results, location #2, Trebone
Figure 3.7: Portable FTU 2-D Results, location #2, Trebone
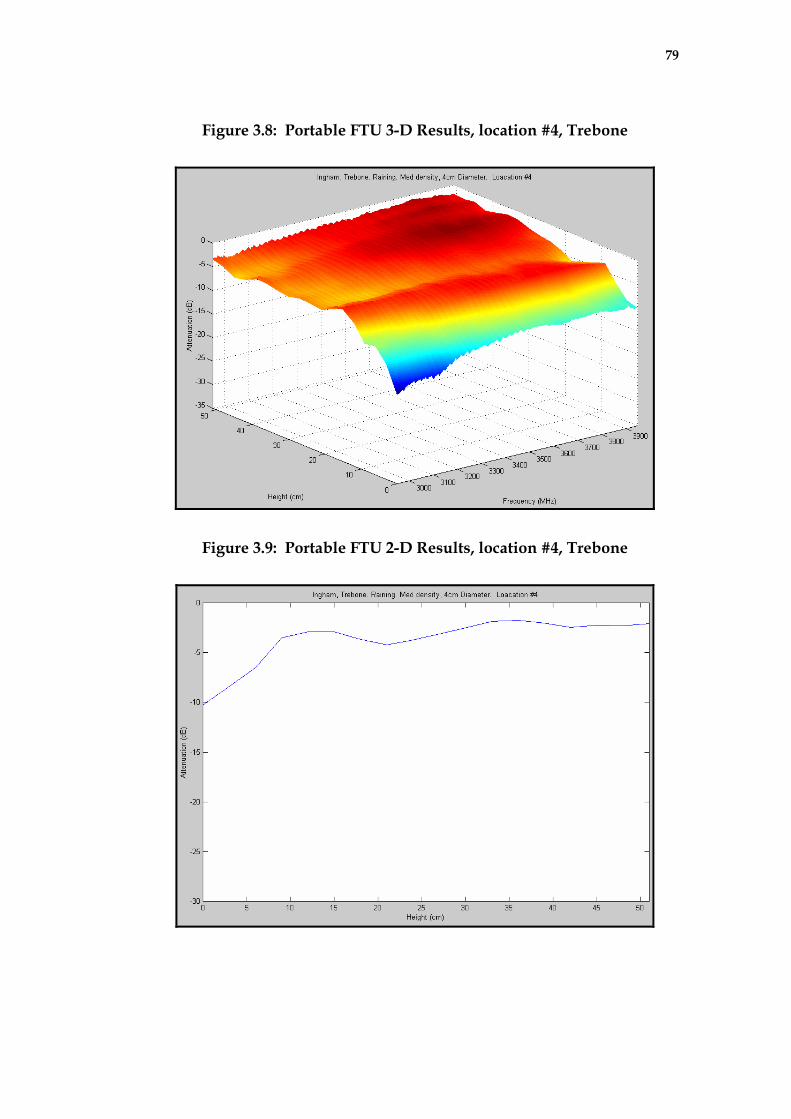
79
Figure 3.8: Portable FTU 3-D Results, location #4, Trebone
Figure 3.9: Portable FTU 2-D Results, location #4, Trebone
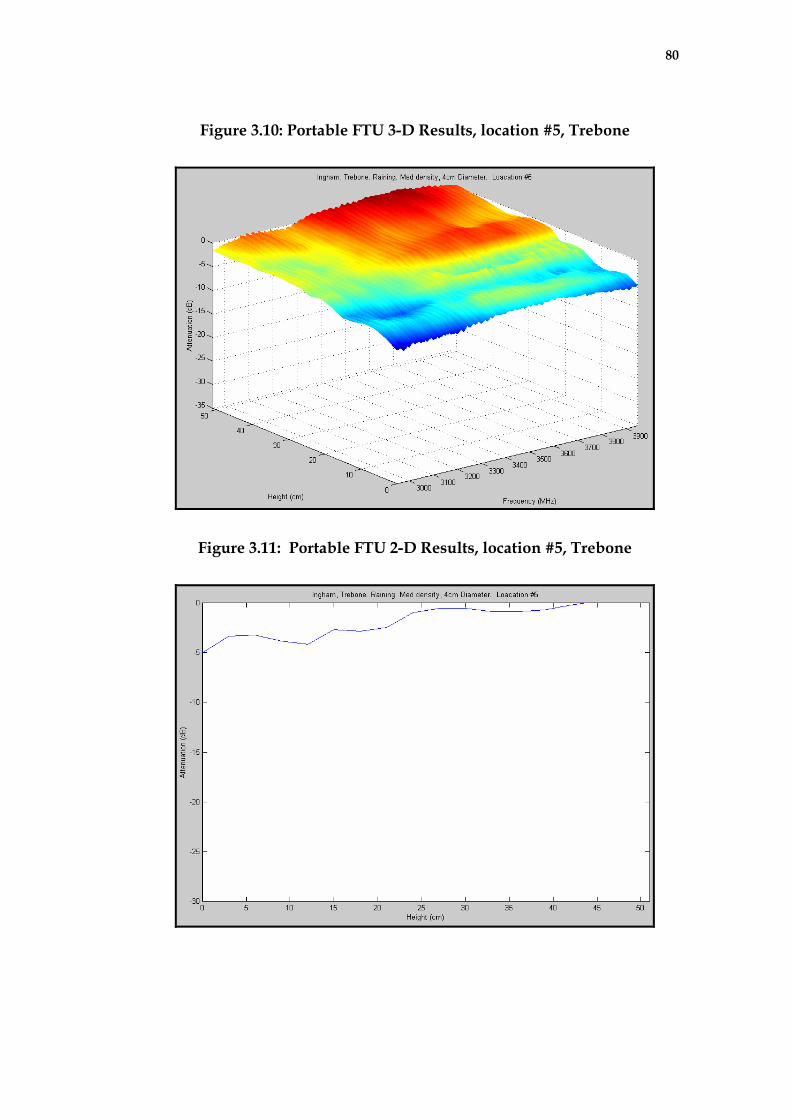
80
Figure 3.10: Portable FTU 3-D Results, location #5, Trebone
Figure 3.11: Portable FTU 2-D Results, location #5, Trebone
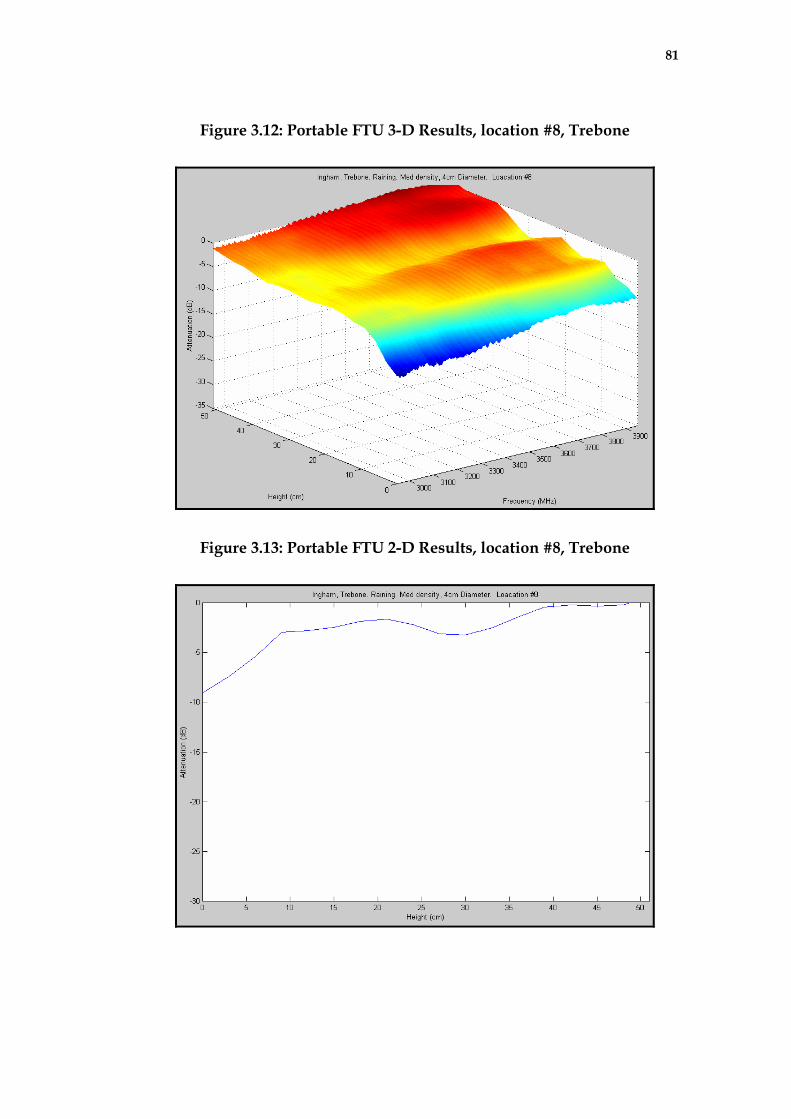
81
Figure 3.12: Portable FTU 3-D Results, location #8, Trebone
Figure 3.13: Portable FTU 2-D Results, location #8, Trebone
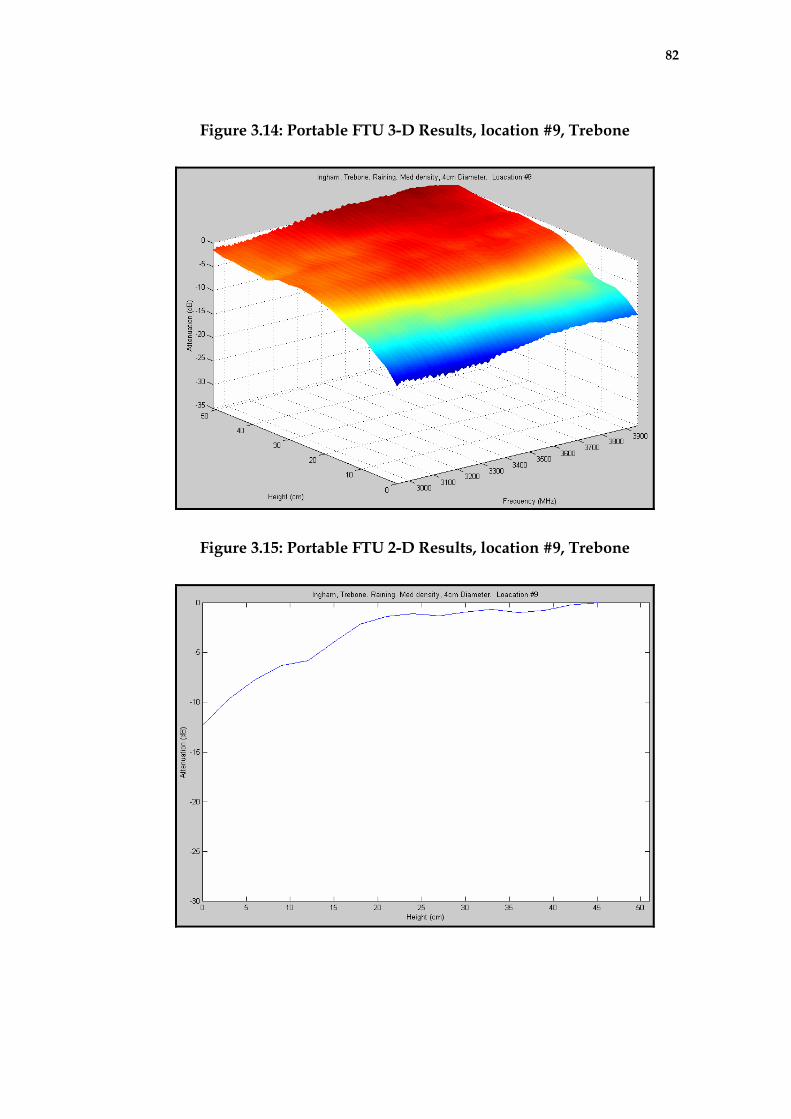
82
Figure 3.14: Portable FTU 3-D Results, location #9, Trebone
Figure 3.15: Portable FTU 2-D Results, location #9, Trebone
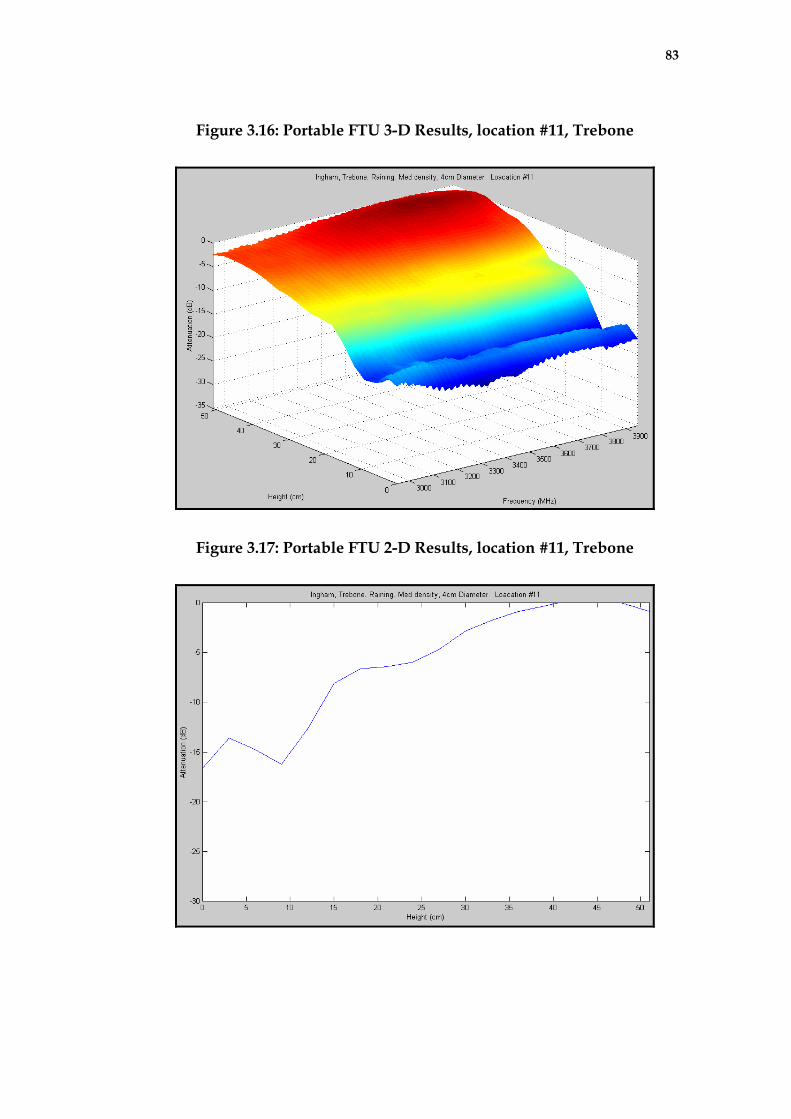
83
Figure 3.16: Portable FTU 3-D Results, location #11, Trebone
Figure 3.17: Portable FTU 2-D Results, location #11, Trebone
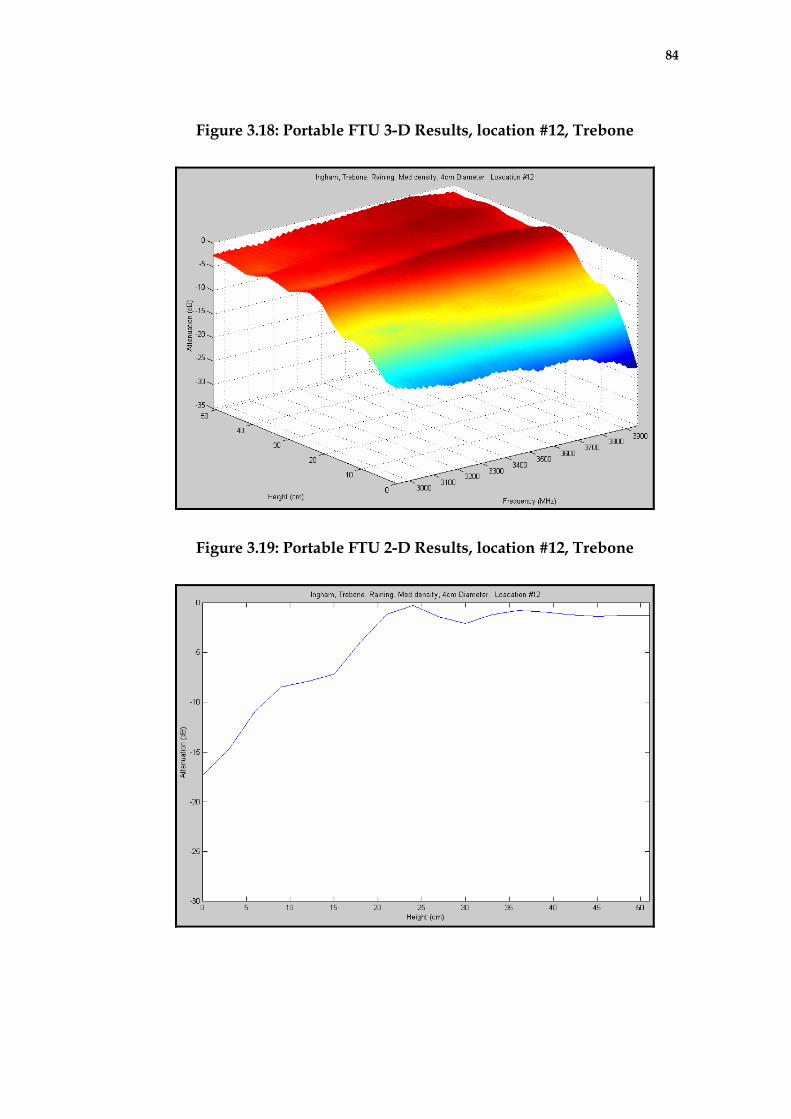
84
Figure 3.18: Portable FTU 3-D Results, location #12, Trebone
Figure 3.19: Portable FTU 2-D Results, location #12, Trebone
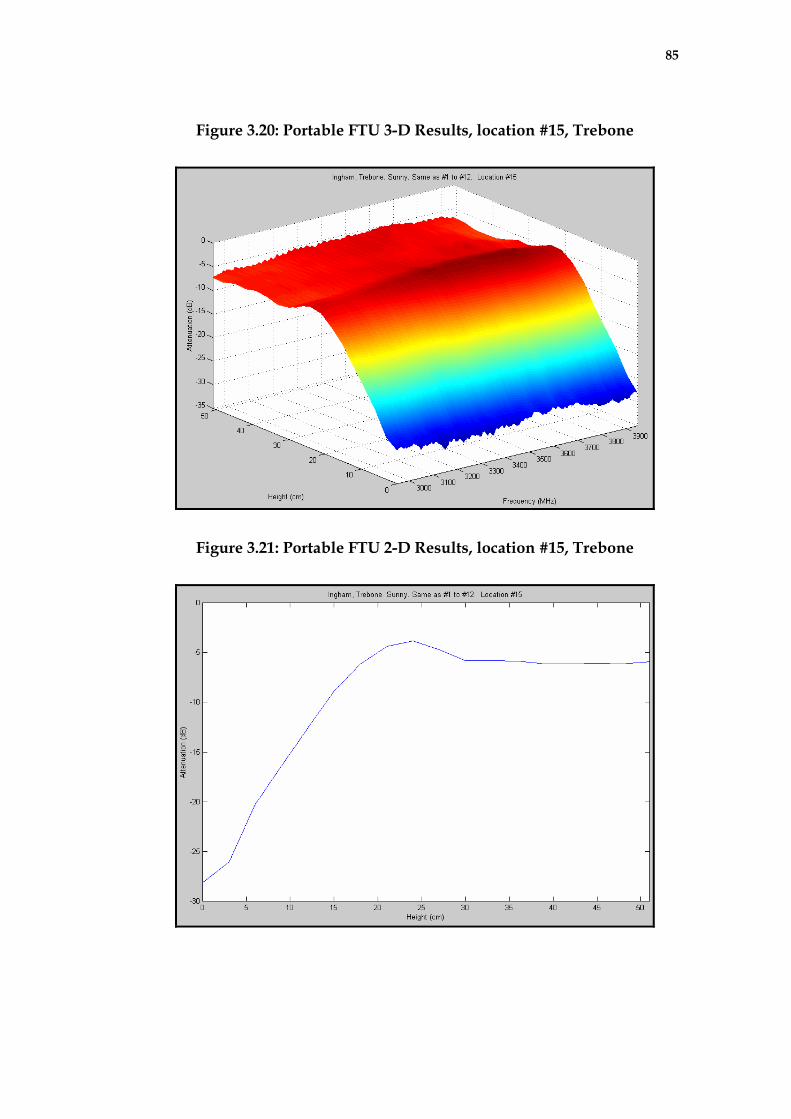
85
Figure 3.20: Portable FTU 3-D Results, location #15, Trebone
Figure 3.21: Portable FTU 2-D Results, location #15, Trebone
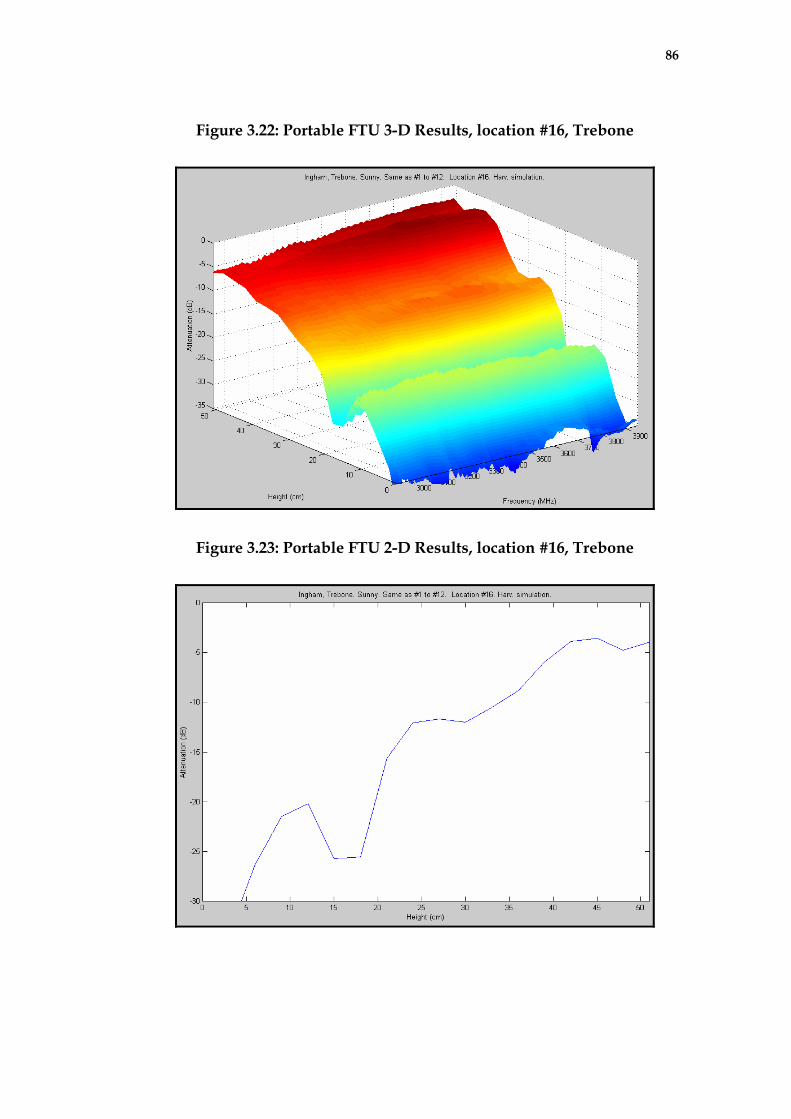
86
Figure 3.22: Portable FTU 3-D Results, location #16, Trebone
Figure 3.23: Portable FTU 2-D Results, location #16, Trebone
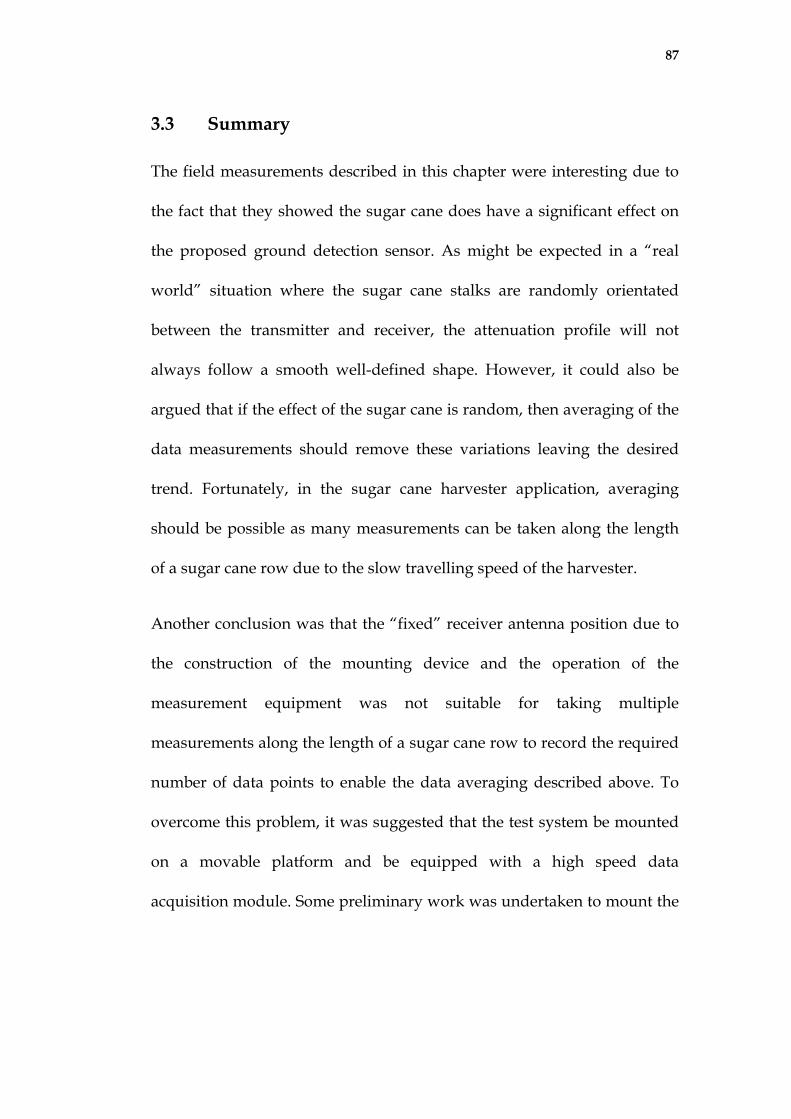
87
3.3 Summary
The field measurements described in this chapter were interesting due to
the fact that they showed the sugar cane does have a significant effect on
the proposed ground detection sensor. As might be expected in a “real
world” situation where the sugar cane stalks are randomly orientated
between the transmitter and receiver, the attenuation profile will not
always follow a smooth well-defined shape. However, it could also be
argued that if the effect of the sugar cane is random, then averaging of the
data measurements should remove these variations leaving the desired
trend. Fortunately, in the sugar cane harvester application, averaging
should be possible as many measurements can be taken along the length
of a sugar cane row due to the slow travelling speed of the harvester.
Another conclusion was that the “fixed” receiver antenna position due to
the construction of the mounting device and the operation of the
measurement equipment was not suitable for taking multiple
measurements along the length of a sugar cane row to record the required
number of data points to enable the data averaging described above. To
overcome this problem, it was suggested that the test system be mounted
on a movable platform and be equipped with a high speed data
acquisition module. Some preliminary work was undertaken to mount the
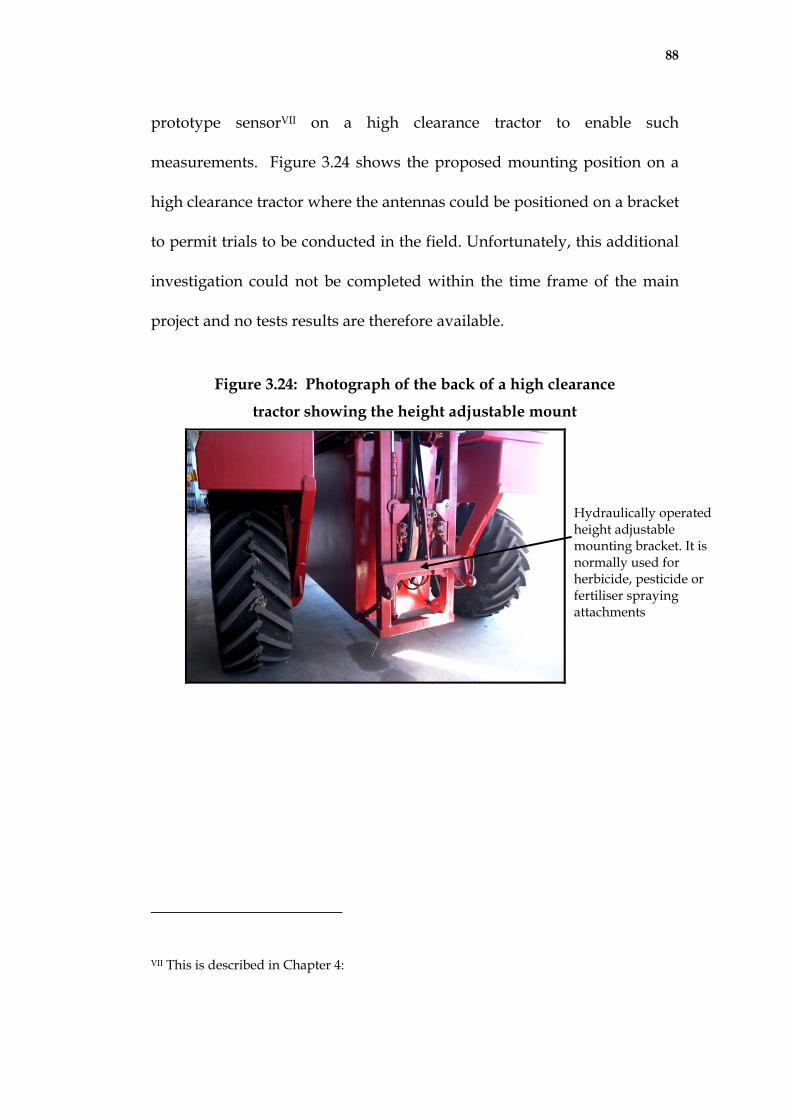
88
prototype sensorVII on a high clearance tractor to enable such
measurements. Figure 3.24 shows the proposed mounting position on a
high clearance tractor where the antennas could be positioned on a bracket
to permit trials to be conducted in the field. Unfortunately, this additional
investigation could not be completed within the time frame of the main
project and no tests results are therefore available.
Figure 3.24: Photograph of the back of a high clearance
tractor showing the height adjustable mount
Hydraulically operated height adjustable mounting bracket. It is normally used for herbicide, pesticide or fertiliser spraying attachments
VII This is described in Chapter 4:
89
Chapter 4: Prototype Ground Detection Sensor
4.1
4.2
Introduction
Based upon the success of both the laboratory experiments and the field
trials the construction of a prototype ground detection sensor for testing
on board a sugar cane harvester was developed. The preliminary work
had identified the main specifications and features that were required to
ensure the successful development of a suitable sensor. This chapter
details the design, calibration and laboratory testing that was conducted
while building the prototype ground detection sensor that was later
trialled on an operation sugar cane harvester.
Prototype Ground Detection Sensor Design
The findings of the tests and simulations that had been previously
undertaken concluded that the optimal method for detecting ground level,
if a microwave sensor was used, is to instantaneously measure the signal
attenuation versus height profile and identify any changes of the “knee
point” in this response.
The concept diagram of a transmitter/receiver system to achieve this
measurement is shown in Figure 4.1. This design consists of a single
antenna being used to transmit the signal on one side of the sugar cane
row and a multi-element receiver array on the other side. The elements of
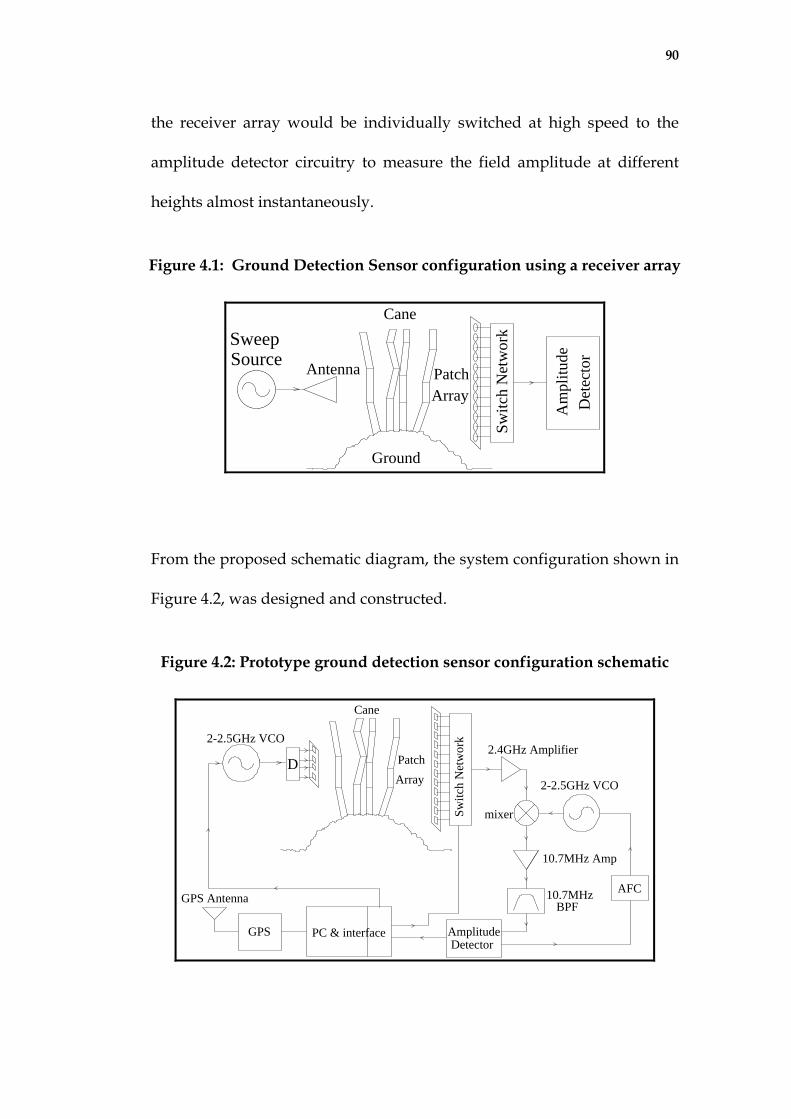
90
the receiver array would be individually switched at high speed to the
amplitude detector circuitry to measure the field amplitude at different
heights almost instantaneously.
Figure 4.1: Ground Detection Sensor configuration using a receiver array
Cane
Ground
SourceSweep
PatchArray
Switc
h N
etw
ork
Am
plitu
deD
etec
tor
Antenna
From the proposed schematic diagram, the system configuration shown in
Figure 4.2, was designed and constructed.
Figure 4.2: Prototype ground detection sensor configuration schematic
PatchArray
Switc
h N
etw
ork
2.4GHz Amplifier
mixer
2-2.5GHz VCO
10.7MHzBPF
AFC
Cane
PC & interfaceGPS
GPS Antenna
AmplitudeDetector
2-2.5GHz VCO
D
10.7MHz Amp
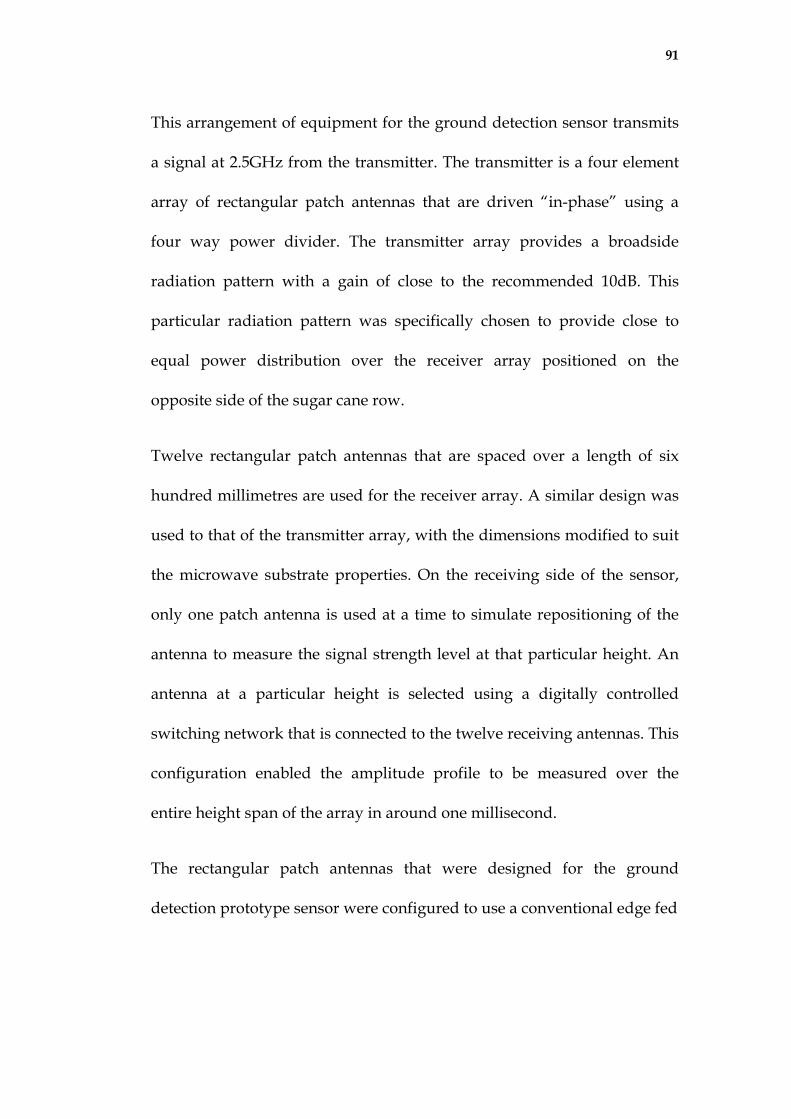
91
This arrangement of equipment for the ground detection sensor transmits
a signal at 2.5GHz from the transmitter. The transmitter is a four element
array of rectangular patch antennas that are driven “in-phase” using a
four way power divider. The transmitter array provides a broadside
radiation pattern with a gain of close to the recommended 10dB. This
particular radiation pattern was specifically chosen to provide close to
equal power distribution over the receiver array positioned on the
opposite side of the sugar cane row.
Twelve rectangular patch antennas that are spaced over a length of six
hundred millimetres are used for the receiver array. A similar design was
used to that of the transmitter array, with the dimensions modified to suit
the microwave substrate properties. On the receiving side of the sensor,
only one patch antenna is used at a time to simulate repositioning of the
antenna to measure the signal strength level at that particular height. An
antenna at a particular height is selected using a digitally controlled
switching network that is connected to the twelve receiving antennas. This
configuration enabled the amplitude profile to be measured over the
entire height span of the array in around one millisecond.
The rectangular patch antennas that were designed for the ground
detection prototype sensor were configured to use a conventional edge fed
92
arrangement [21] that was matched to 50 Ohms. The receiver antennae
were manufactured on a thick substrate with a low dielectric constantVIII in
order to provide a usable frequency bandwidth of 120MHz. This is
considered to be a wide bandwidth for a patch antenna design which is
usually only 1-2% of the operational frequency. The wide frequency band
was designed to provide tolerance to frequency inaccuracies and drift in
the rest of the electronic circuitry as well as providing the option of
allowing a small amount of frequency scanning, if this was found to be
necessary. The low profile patch antenna configuration was also identified
as being an ideal design to allow the antenna to be mounted flush along
the inside walls of the sugar cane harvester row dividers.
The remainder of the ground detection sensor consists of specific
electronic circuits to both generate the 2.5GHz test signal and to measure
the amplitude of the received signal including the automatic frequency
control (AFC) used to mix the received signal down to 10.7MHz. The
transmitter used a Minicircuits voltage controlled oscillator integrated
circuit, while the amplitude detector is based upon a conventional
heterodyne radio receiver circuit. The amplitude detection is achieved
using a Motorola MC13055 FM demodulator integrated circuit. This
VIII εr = 4. 5 and h = 6. 4mm
93
device features an analogue voltage output that is proportional to the
input signal power level and the associated interface circuitry allows the
receiving antenna to be frequency locked to the incoming measurement
signal.
Calibration of this device for signal level measurement showed that the
receiver had a dynamic range of 30 to 40dB with a typical accuracy of
±2dB. Before operation of the prototype sensor, each channel of the
receiver was individually calibrated to normalise the received signal to
compensate for the different levels of signal losses in the antennas,
switching network and cables.
Three measurements were taken at each power level injected into the
system and 5th order polynomials were used to create an operating
equation between voltage level received and the actual power level. A
typical calibration curve for one of the twelve channels of the prototype
sensor is shown in Figure 4.3. It can be seen that by taking the mean of
the three measurements and calculating a 5th order polynomial to fit the
data points clearly gives the best line of best fit.
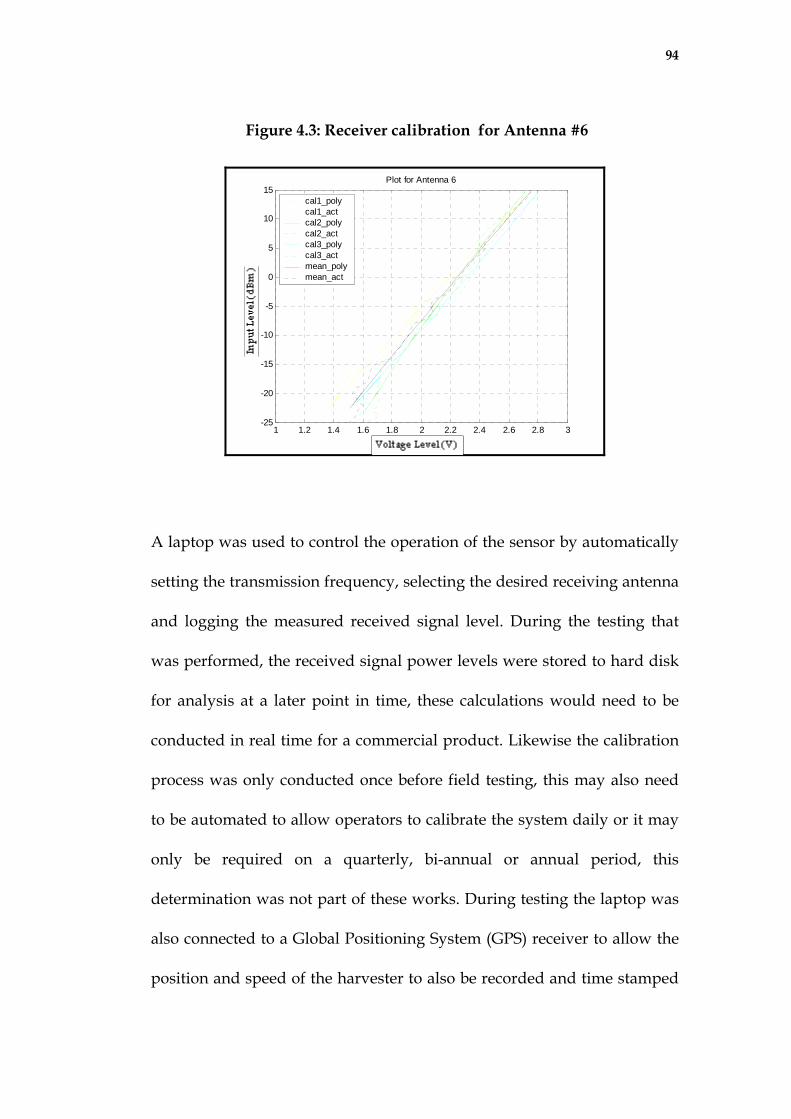
94
Figure 4.3: Receiver calibration for Antenna #6
1 1.2 1.4 1.6 1.8 2 2.2 2.4 2.6 2.8 3-25
-20
-15
-10
-5
0
5
10
15
Voltage Level (V)
Inpu
t Lev
el (d
B)
Plot for Antenna 6
cal1_polycal1_actcal2_polycal2_actcal3_polycal3_actmean_polymean_act
A laptop was used to control the operation of the sensor by automatically
setting the transmission frequency, selecting the desired receiving antenna
and logging the measured received signal level. During the testing that
was performed, the received signal power levels were stored to hard disk
for analysis at a later point in time, these calculations would need to be
conducted in real time for a commercial product. Likewise the calibration
process was only conducted once before field testing, this may also need
to be automated to allow operators to calibrate the system daily or it may
only be required on a quarterly, bi-annual or annual period, this
determination was not part of these works. During testing the laptop was
also connected to a Global Positioning System (GPS) receiver to allow the
position and speed of the harvester to also be recorded and time stamped
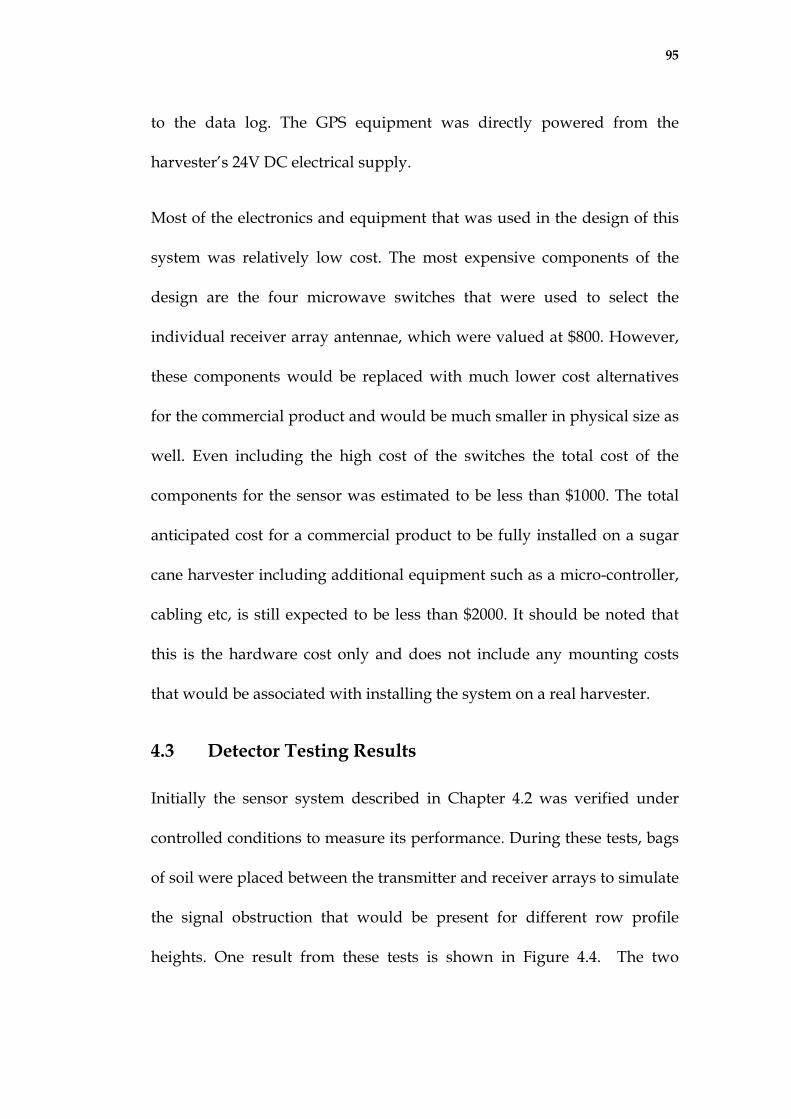
95
to the data log. The GPS equipment was directly powered from the
harvester’s 24V DC electrical supply.
Most of the electronics and equipment that was used in the design of this
system was relatively low cost. The most expensive components of the
design are the four microwave switches that were used to select the
individual receiver array antennae, which were valued at $800. However,
these components would be replaced with much lower cost alternatives
for the commercial product and would be much smaller in physical size as
well. Even including the high cost of the switches the total cost of the
components for the sensor was estimated to be less than $1000. The total
anticipated cost for a commercial product to be fully installed on a sugar
cane harvester including additional equipment such as a micro-controller,
cabling etc, is still expected to be less than $2000. It should be noted that
this is the hardware cost only and does not include any mounting costs
that would be associated with installing the system on a real harvester.
4.3 Detector Testing Results
Initially the sensor system described in Chapter 4.2 was verified under
controlled conditions to measure its performance. During these tests, bags
of soil were placed between the transmitter and receiver arrays to simulate
the signal obstruction that would be present for different row profile
heights. One result from these tests is shown in Figure 4.4. The two
96
responses shown were measured with a simulated row profile height
obstruction of 0 and 12 centimetres, which was measured from the centre
of the lowest receiver array element. The results shown in Figure 4.4 are
very similar to the predicted response plotted in Figure 2.3. The measured
amplitude profiles do show small amounts of variation but the general
trend is that the signal levels on the antenna elements closest to the row
profile are proportionately less than the higher positioned antenna. It can
also be concluded that the change in the height of the row profile moved
the “knee” of the measure response and changed the rate of signal
attenuation for the antenna positioned closer to the ground.
Figure 4.4: Measurement system response under controlled conditions
Attenuation Profiles
-30
-25
-20
-15
-10
-5
0
1 3 5 7 9 11Element Number
Atte
nuat
ion
(dB
)
Ground Height 0cm
Ground Height 12cm
4.4 Installation on Harvester
To test the prototype design on a harvester, the transmitter and receiver
antennas were mounted flush against the inside of the row dividers walls.
97
The surface of the patch antennas were left unprotected with only a
slightly raised metal deflector welded in front of the patches to try to stop
the sugar cane from damaging the antennas. Although the antennas did
not sustain any significant damage during the course of the testing
procedure of this project, (refer to Figure 4.5), a commercial product
would required that the antenna was covered with a fibreglass skin or
similar product to prevent mechanical damage caused by the sugar cane
impacting the surface of the antenna to ensure long term operation.
A photograph of both the transmitter and the receiving antenna arrays
mounted on the Austoft research and development harvester is shown in
Figure 4.6. This figure shows three photographs of the sensor viewed
from the front of the harvester as well as the two antenna arrays shown
separately.
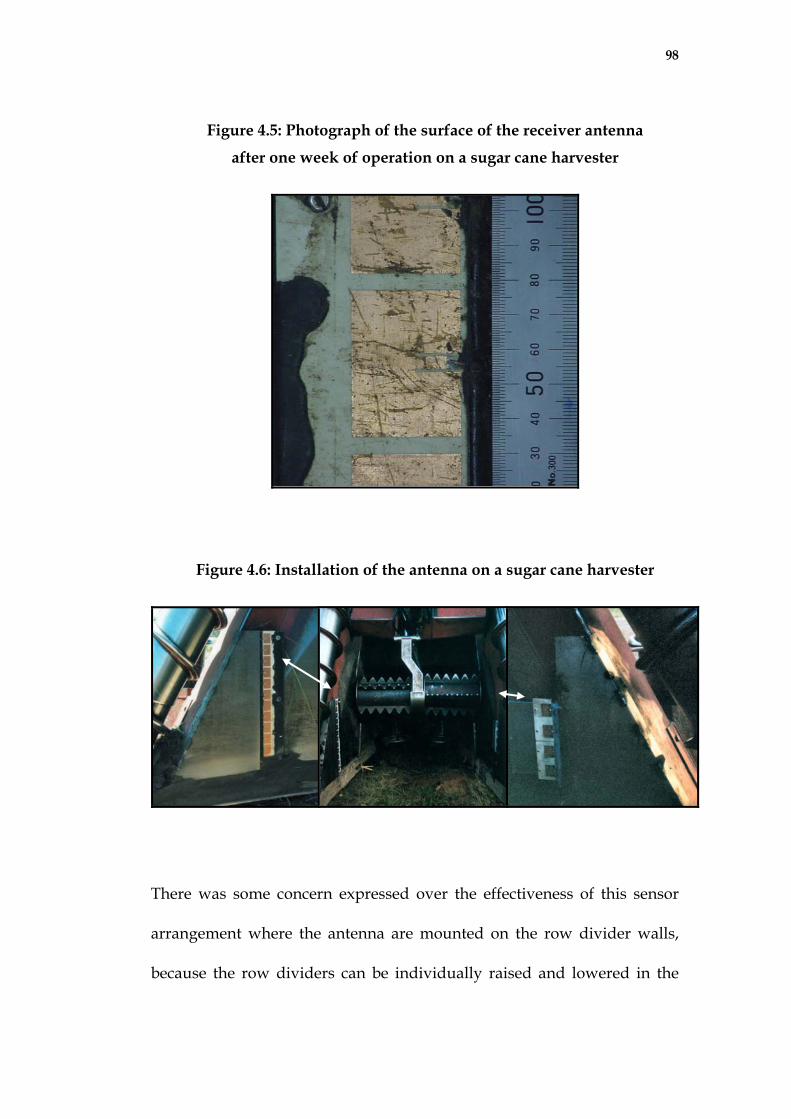
98
Figure 4.5: Photograph of the surface of the receiver antenna
after one week of operation on a sugar cane harvester
Figure 4.6: Installation of the antenna on a sugar cane harvester
There was some concern expressed over the effectiveness of this sensor
arrangement where the antenna are mounted on the row divider walls,
because the row dividers can be individually raised and lowered in the
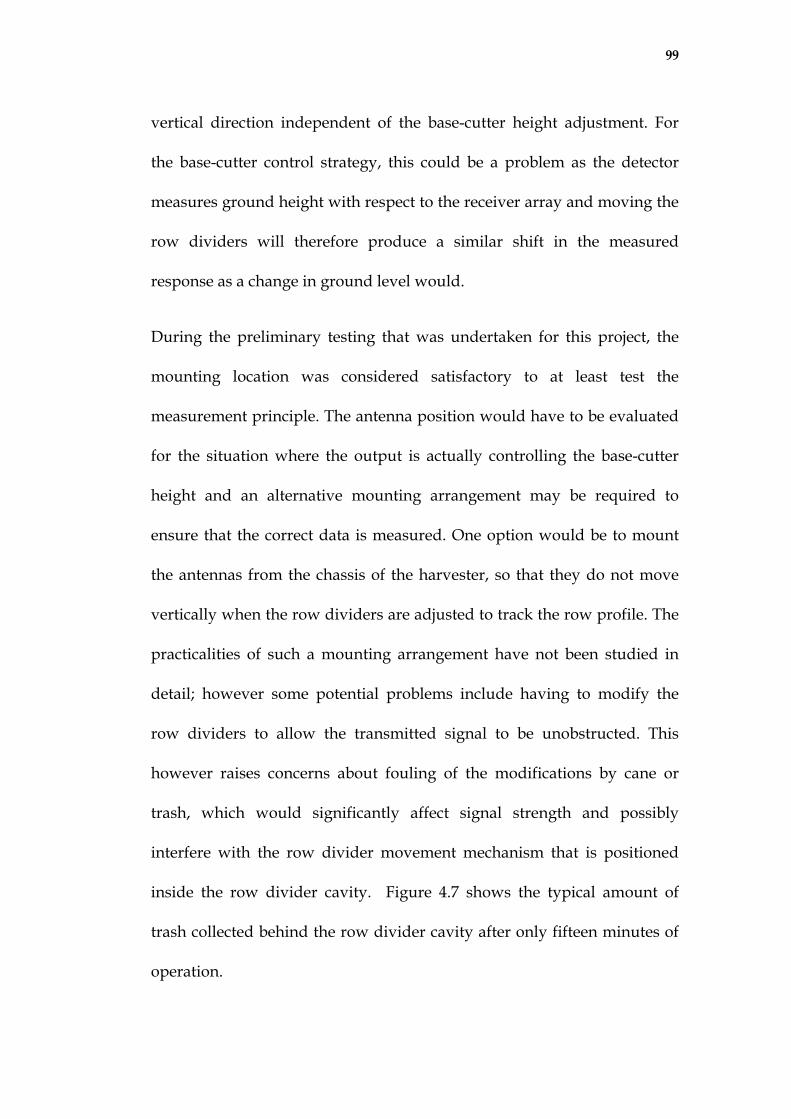
99
vertical direction independent of the base-cutter height adjustment. For
the base-cutter control strategy, this could be a problem as the detector
measures ground height with respect to the receiver array and moving the
row dividers will therefore produce a similar shift in the measured
response as a change in ground level would.
During the preliminary testing that was undertaken for this project, the
mounting location was considered satisfactory to at least test the
measurement principle. The antenna position would have to be evaluated
for the situation where the output is actually controlling the base-cutter
height and an alternative mounting arrangement may be required to
ensure that the correct data is measured. One option would be to mount
the antennas from the chassis of the harvester, so that they do not move
vertically when the row dividers are adjusted to track the row profile. The
practicalities of such a mounting arrangement have not been studied in
detail; however some potential problems include having to modify the
row dividers to allow the transmitted signal to be unobstructed. This
however raises concerns about fouling of the modifications by cane or
trash, which would significantly affect signal strength and possibly
interfere with the row divider movement mechanism that is positioned
inside the row divider cavity. Figure 4.7 shows the typical amount of
trash collected behind the row divider cavity after only fifteen minutes of
operation.
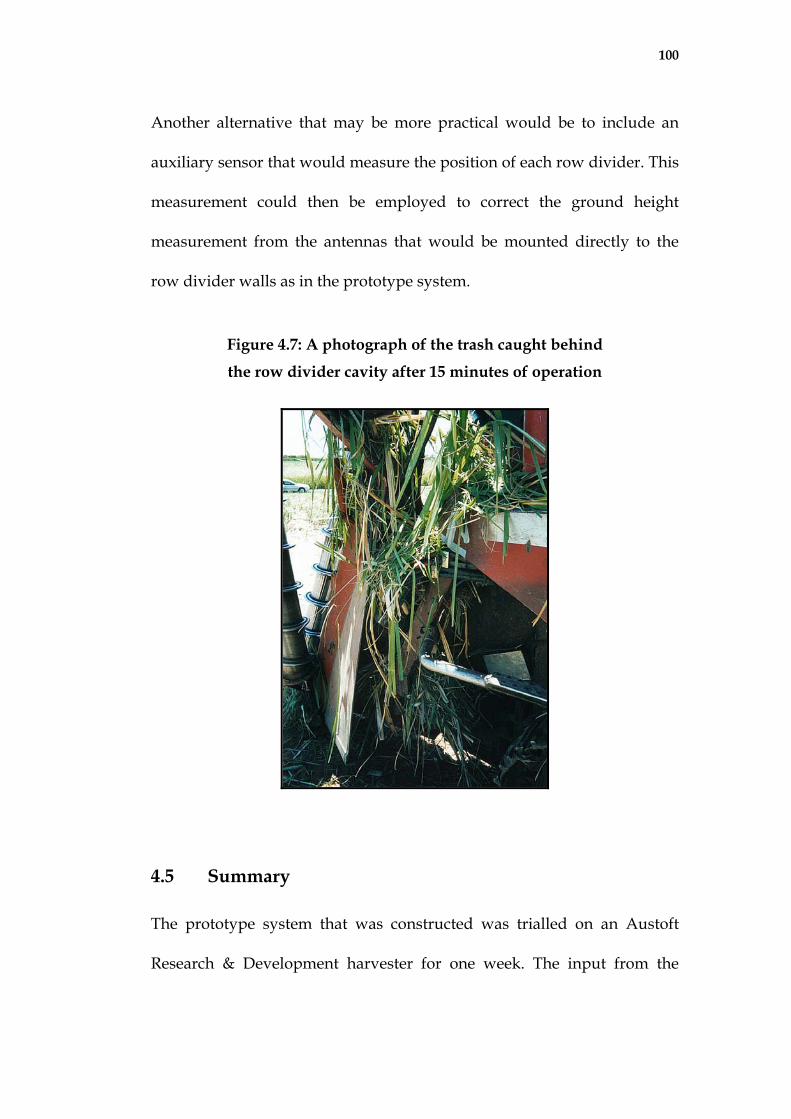
100
Another alternative that may be more practical would be to include an
auxiliary sensor that would measure the position of each row divider. This
measurement could then be employed to correct the ground height
measurement from the antennas that would be mounted directly to the
row divider walls as in the prototype system.
Figure 4.7: A photograph of the trash caught behind
the row divider cavity after 15 minutes of operation
4.5 Summary
The prototype system that was constructed was trialled on an Austoft
Research & Development harvester for one week. The input from the
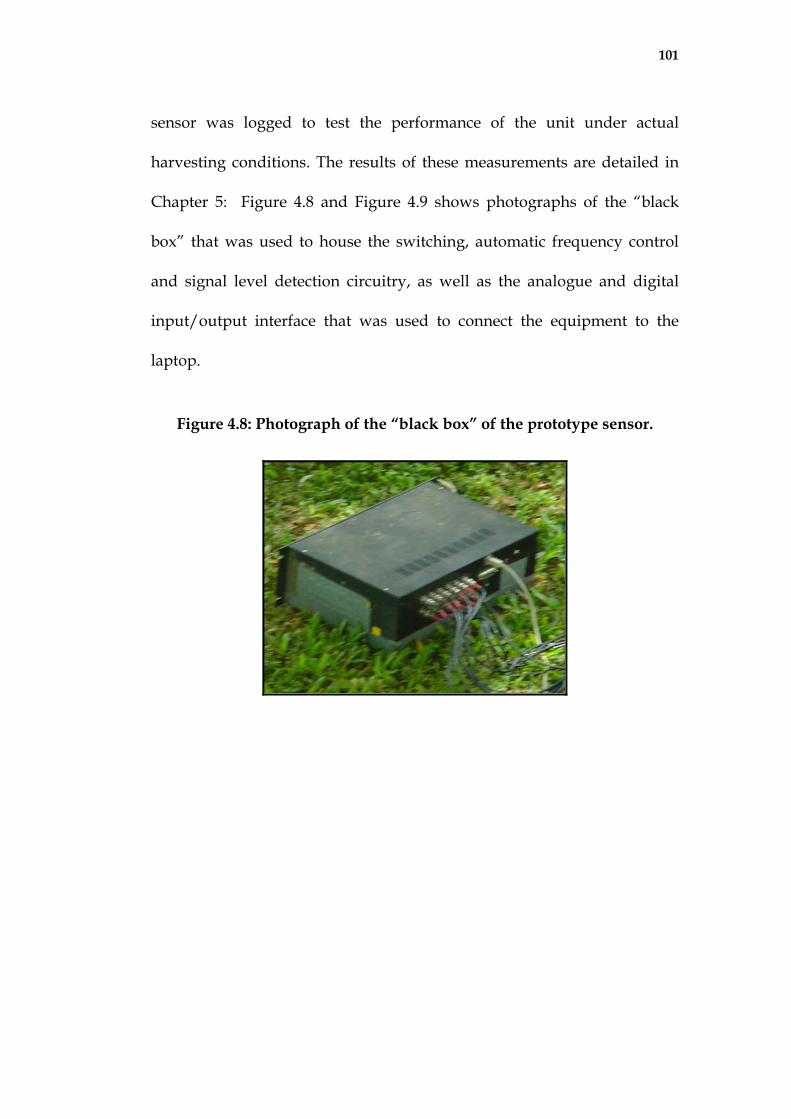
101
sensor was logged to test the performance of the unit under actual
harvesting conditions. The results of these measurements are detailed in
Chapter 5: Figure 4.8 and Figure 4.9 shows photographs of the “black
box” that was used to house the switching, automatic frequency control
and signal level detection circuitry, as well as the analogue and digital
input/output interface that was used to connect the equipment to the
laptop.
Figure 4.8: Photograph of the “black box” of the prototype sensor.
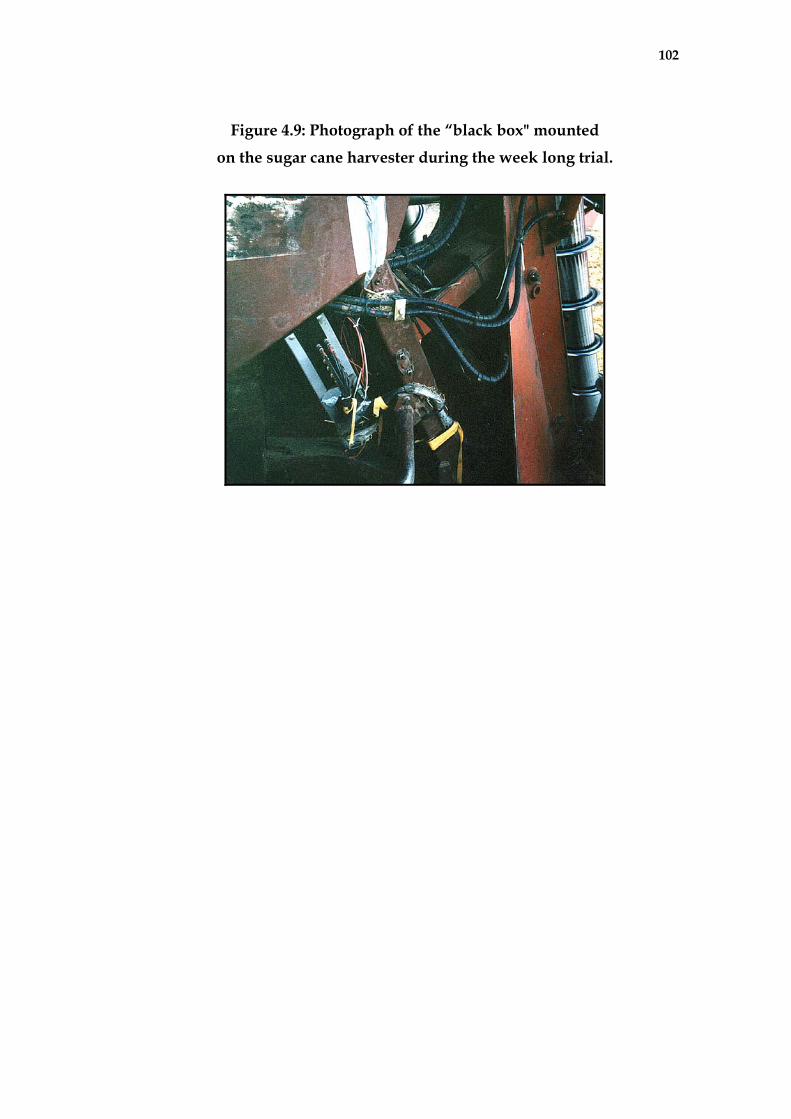
102
Figure 4.9: Photograph of the “black box" mounted
on the sugar cane harvester during the week long trial.
103
Chapter 5: Harvester Testing
5.1
5.2
Introduction
The suitability of the prototype ground detection sensor was tested
onboard a sugar cane harvester during normal harvesting operation. The
primary objective of this test was to verify if the sensor did in fact respond
to the ground height as required by this application. However, this test
also had a more fundamental aim of checking whether or not the
equipment that had been selected would actually work in and survive the
harsh conditions onboard a sugar cane harvester during operation.
Harvester Trial
The prototype configuration that was described in Chapter 4: was
installed on the Austoft Pty. Ltd. research and development harvester in
Bundaberg and was trialled during the period from the 24th to the 28th of
September 2001. The harvester was used to cut various varieties of green
sugar cane that had been planted in a “dual-row” BSES trial for all of the
measurements that were recorded during this period. The varieties of
sugar cane that were harvested during the trial period including the
following five types:
• Q170
• Q151
104
• Q141
• Q138
• Q124
Some general observations were drawn from the data that was measured
during this trial and are listed below:
1) Strong received signal strength levels were recorded at the receiver
even while harvesting. This indicated that the selected 2.5GHz
frequency of the radio signal was penetrating the higher than
expected amounts of sugar cane in the throat of the harvester and is
therefore suitable for this application.
2) The measurement system was operated continuously while the
harvester was operated for one week without any major problems.
The position of the antennas on the inside of the row divider walls
meant there was only small amounts of dirt build up on the
antenna arrays, apart from a slight coating on the lowest few
elements of the receiver array. Surprisingly, given the exposed
location of both the transmitter and receiver array the mechanical
damage to the antennas was also minor consisting mainly of slight
scratching of the copper surface. It should be noted that metal
guards were installed in front of the antennas to protect them from
105
the sugar cane that was scraping along the face of the row dividers.
It seemed that any dirt or damage of the antennas did not have any
noticeable effect on the signal levels that were measured.
3) During the week long trial, the location and speed of the harvester
was also recorded as a time stamp for the received signal strength
levels. The purpose of recording the location of the harvester was to
correlate the data that was recorded by the ground detection sensor
to several hand recorded measured results that would have been
taken at specific positions in the paddock. Unfortunately, in
practice it proved difficult to correlate the measured GPS position
data with the actual base-cutter height setting that had been used
during harvesting at a specific position in the sugar cane paddock.
One problem was the limited accuracy of the GPS data which
meant it was only possible to distinguish ten metre intervals at best.
This was not sufficient to accurately pinpoint a single row in the
paddock. Furthermore, since the sugar cane was harvested green,
the blanket of trash coverage that had been left over after
harvesting made it very difficult to determine if the base-cutter had
been adjusted too high or too low. The usefulness of the recorded
position data was therefore very limited.
4) As it was not possible to correlate an independent measurement of
the ground height to a particular position along a sugar cane row, it
106
was impossible to determine the absolute accuracy of the
measurement technique from the tests conducted. A further
complication that was noted earlier was that the two row-dividers
can be moved independently of each other and the base-cutter
height. This meant that the sensor would most probably detect a
change in ground height due to an adjustment of the row divider
settings. Again, this meant that the configuration used for this test
did not allow the response of the sensor to be directly compared
with the ground height under harvesting conditions.
Given the obvious shortcomings of the harvester testing identified above,
the data collected was processed to observe the operation of the sensor. A
typical example the time plot of the amplitude measurement for one
channel of the receiver as the harvester travelled along the sugar cane
paddock row is shown in Figure 5.1. It can be clearly seen from this data
that the raw data measurements, which are shown in green, contain a
significant amount of “noise”. It was noted during the laboratory
simulations and the field-testing that was performed using the portable
test unit that there would be “random fluctuations” in the measured
signal strength levels due to the orientation of the sugar cane along a row
which would appear as a “random fluctuation” upon the measured signal.
It was therefore decided to filter or smooth the “raw” data in order to
better observe any underlying trends that may have been present. The
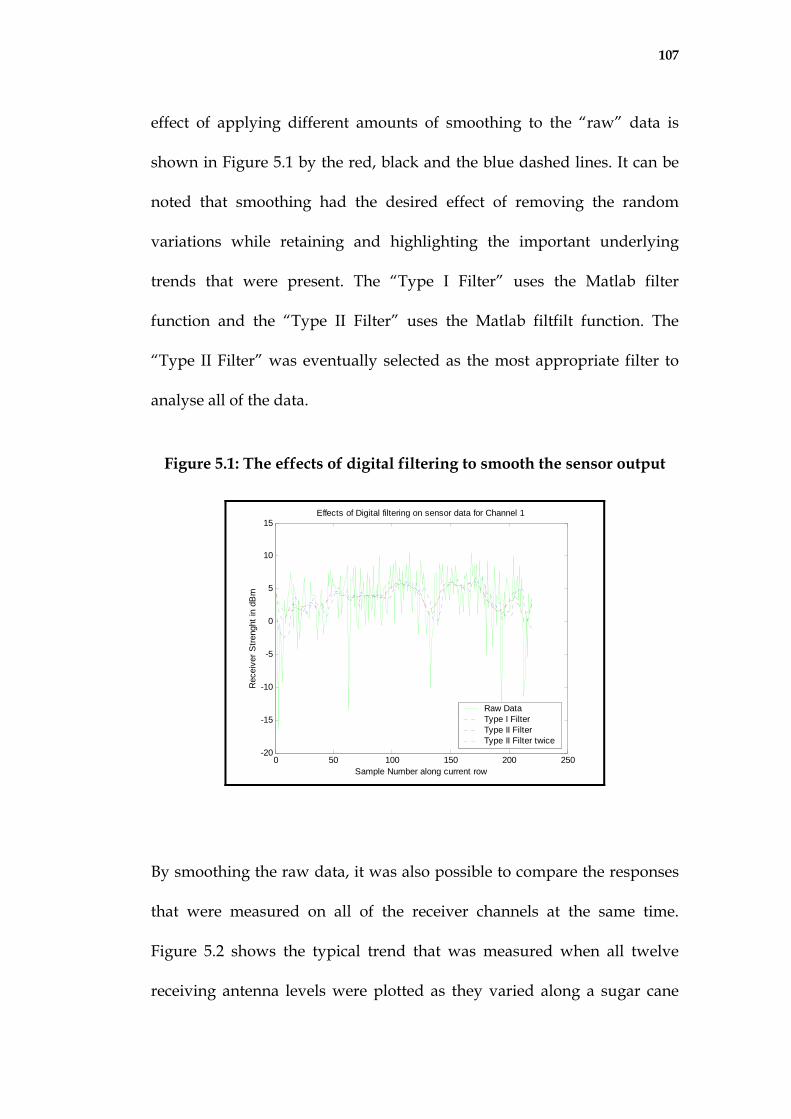
107
effect of applying different amounts of smoothing to the “raw” data is
shown in Figure 5.1 by the red, black and the blue dashed lines. It can be
noted that smoothing had the desired effect of removing the random
variations while retaining and highlighting the important underlying
trends that were present. The “Type I Filter” uses the Matlab filter
function and the “Type II Filter” uses the Matlab filtfilt function. The
“Type II Filter” was eventually selected as the most appropriate filter to
analyse all of the data.
Figure 5.1: The effects of digital filtering to smooth the sensor output
0 50 100 150 200 250-20
-15
-10
-5
0
5
10
15
Sample Number along current row
Rec
eive
r Stre
nght
in d
Bm
Effects of Digital filtering on sensor data for Channel 1
Raw DataType I FilterType II FilterType II Filter twice
By smoothing the raw data, it was also possible to compare the responses
that were measured on all of the receiver channels at the same time.
Figure 5.2 shows the typical trend that was measured when all twelve
receiving antenna levels were plotted as they varied along a sugar cane
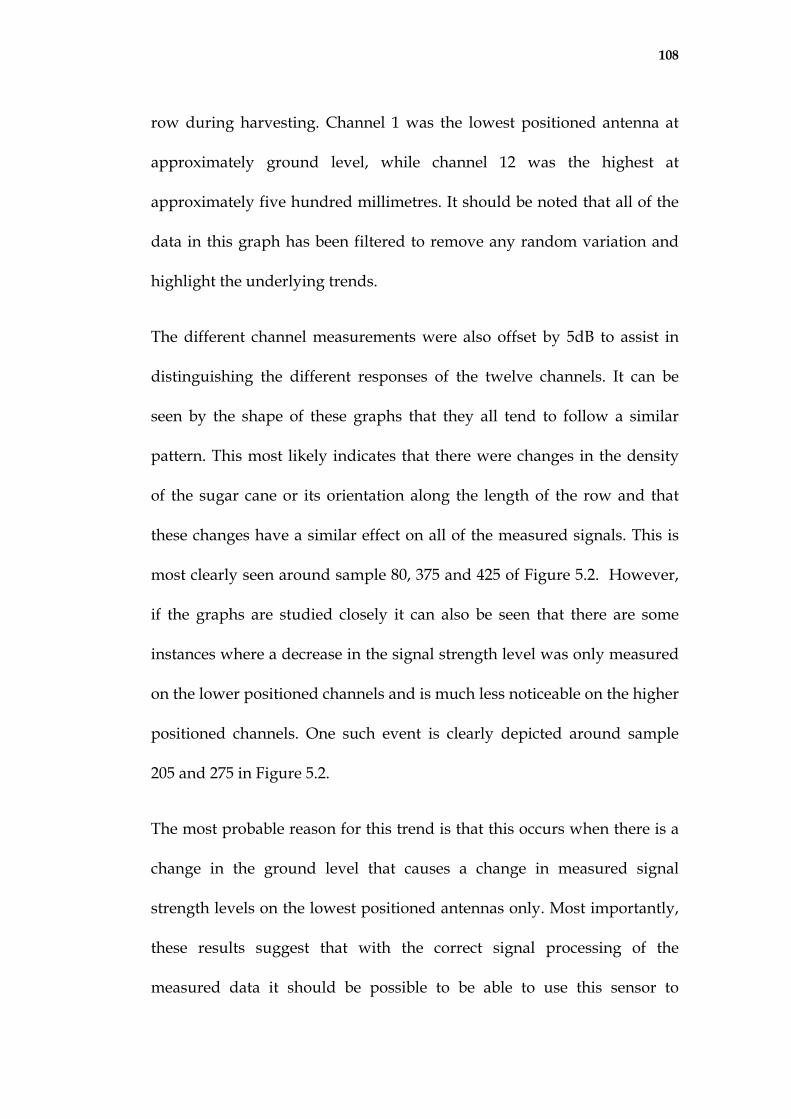
108
row during harvesting. Channel 1 was the lowest positioned antenna at
approximately ground level, while channel 12 was the highest at
approximately five hundred millimetres. It should be noted that all of the
data in this graph has been filtered to remove any random variation and
highlight the underlying trends.
The different channel measurements were also offset by 5dB to assist in
distinguishing the different responses of the twelve channels. It can be
seen by the shape of these graphs that they all tend to follow a similar
pattern. This most likely indicates that there were changes in the density
of the sugar cane or its orientation along the length of the row and that
these changes have a similar effect on all of the measured signals. This is
most clearly seen around sample 80, 375 and 425 of Figure 5.2. However,
if the graphs are studied closely it can also be seen that there are some
instances where a decrease in the signal strength level was only measured
on the lower positioned channels and is much less noticeable on the higher
positioned channels. One such event is clearly depicted around sample
205 and 275 in Figure 5.2.
The most probable reason for this trend is that this occurs when there is a
change in the ground level that causes a change in measured signal
strength levels on the lowest positioned antennas only. Most importantly,
these results suggest that with the correct signal processing of the
measured data it should be possible to be able to use this sensor to
109
measure the effect of ground height through sugar cane using a non-
contact measurement technique.
Figure 5.2: Measured amplitude trends on all twelve
channels of the ground detection sensor receiver
0 50 100 150 200 250 300 350 400 450 500-70
-60
-50
-40
-30
-20
-10
0
10
Sample Number along current row
Comparison of Antenna Array Readings
Rec
eive
r Stre
nght
in d
Bm
Other parts of the trial data were also processed in a similar way. The
trends observed in these tests were similar to those mentioned above and
have not been included in this report.
5.3 Conclusions
The testing that was performed using the microwave ground detection
sensor configuration that was developed for this project showed that the
measurement technique was suitable for measuring ground level even on
an operating sugar cane harvester. Obviously, a device that was
110
permanently installed on a harvester would need to be designed to be
much more robust when compared to the prototype system that was used
to conduct the measurements gathered for this project. However, the basic
measurement principle seems to work appropriately and provide data
that could be used to determine the actual ground height using a non-
contact measurement technique. These results indicate that with the
proper signal processing, the sensor could be used to measure ground
height and could therefore be used to control the base-cutter height on a
harvester during operation.
Further tests need to be carried out to address the issue of not being able
to identify the absolute accuracy of the sensor in the field. Ideally these
tests should incorporate an independent measurement of the ground
height before or after the sensor is used. This type of measurement would
then allow the best method of signal processing and an appropriate
control strategy to be developed.
111
Chapter 6: Conclusion
6.1 Conclusion
This project was successful in achieving what it set out to do, which was to
test the suitability of a new microwave ground detection measurement
technique that could be developed to automatically control the base-cutter
height of a sugar cane harvester. Initially laboratory tests and the later
electromagnetic field simulations were utilised to both verify and
determine the level of signal obstruction that was caused by the row
profile when a microwave frequency signal was transmitted from one side
of a sugar cane row to the other.
The simulations and the experiments both led to similar conclusions that
the closer to the top of the row profile the receiver was positioned, the
greater the level of signal attenuation that could be expected. These tests
laid the fundamental foundations for this project by establishing not only
the basic sensing technique but also the preferred operating frequency, the
optimum signal polarisation and the antenna gains that were later used in
the field trials and for the design of the prototype equipment. The
experimental testing that was conducted in the field further extended
upon this work and highlighted that the sugar cane density and stalk
orientation had a marked influence on the measurements and there was a
requirement to average the data that was measured. A sensor able to make
112
measurements on a cane harvester was then designed and developed. The
prototype that was constructed used low profile microwave patch antenna
arrays for both the transmitter and receiver antennas. These antennas
proved ideal for mounting on the inside of the row divider walls of a
sugar cane harvester. The receiver array incorporated a switching network
that allowed individual elements of the receiver array to be connected to
the amplitude level detection circuitry. Thus by scanning one antenna at a
time over the length of the receiver array, the received signal height
profile was able to be sampled. This allowed an instantaneous signal
strength profile versus height to be obtained with no mechanical moving
parts. Dedicated electronic circuits were built to generate and detect the
microwave frequency signals as required by the prototype sensor. A
laptop was utilised to provide the required control and data logging
features.
The prototype sensor was built and installed on a sugar cane harvester.
The sensor was operated under actual harvesting conditions to guarantee
that the technique was not flawed and that the design of the equipment
suited the conditions likely to be experienced on a working harvester.
While the interpretation of the results obtained during these tests could
not be verified by using an independent height measurement of the
ground height, the trial did provide evidence that the proposed technique
113
would work as designed. Importantly, all of the equipment used in the
prototype unit survived the
extremely harsh conditions that they were subjected to while the harvester
was in operation.
After smoothing the measured data using digital signal processing the
results that were collected looked very promising. It could be clearly seen
that the lower elements in the receiver array measured a lower signal level
than the higher antennas and that the level seemed to respond to changes
in ground height. This demonstrated that the sensor was working as
expected and would be suitable to track changes in the ground level along
the length of the row of sugar cane.
It was estimated that the hardware cost of installing a commercial version
of the prototype sensor on a harvester would be less than A$2000.
However, with economies of scale and some redesign of the system, the
cost would probably be much less than this amount, and even as low as
A$1000.
6.2 Future Work
This project has successfully laid the foundations for using the microwave
ground detection technique and developed equipment suitable for
measuring the signal response on an operational harvester. However,
further work will be required to get this product to the stage where it can

114
be used to control the base-cutter height on a harvester, and hence be
developed into a commercial product.
It will be essential to know the accuracy, repeatability and response time
of the sensor in determining over what time frame the measurements are
required to be averaged before the base-cutter setting should be adjusted.
It is anticipated that this will involve a relatively low gain control system.
To provide this type of information it will be necessary to perform further
field tests using the prototype sensor. It is strongly recommended that this
testing be performed with the sensor mounted on a high clearance tractor.
The use of a high clearance tractor rather than a sugar cane harvester will
allow multiple measurements of the same profile to be performed so that a
comparison could be made as to the repeatability of the sensors response.
The response measured by the sensor could then be converted to a height
value and verified/calibrated by using an independent measurement
technique such as the surveying of the sugar can row profile. Furthermore,
by using a high clearance tractor greater flexibility is allowed when
performing measurements as the speed of the tractor can be increased,
decreased and even stopped so that specific situations can be investigated.
Towards the end of the project it was planned to perform some
measurements using a high clearance tractor that would be hired from
Irving Farm Services in Ingham. A mounting bracket to attach the antenna
115
arrays to a hydraulically adjusted bracket on the back of the high clearance
tractor was built and some time was spent learning how to operate this
machinery. However, due to time constraints imposed by this project and
the priority to perform the measurements on a harvester, this additional
testing was not performed as a supplement to the original project.
When the dynamic operational characteristics of the ground detection
sensor are known, the next stage in the development of this project would
be to install the sensor and a control system on a harvester and allow it to
control the base-cutter height. One measure of such a test would be to
compare the amount of extraneous matter that was collected with and
without the automatic control of the base-cutter height being used. As this
type of testing may involve significant modification to a sugar cane
harvester, it is strongly suggested that this stage of the development of the
commercial product be performed as a joint venture with a commercial
harvester manufacturer such as Case IH/Austoft.
As with any radio transmitting device a commercially available unit will
have to comply with the Australian Communications Authority
regulations and either operate at a license free frequency and transmission
level or a license may be required by the harvester operator to operate the
equipment. The ongoing cost of such a license is typically only AUD$30
and is considered to be a small cost to the operator.

116
References
[1] Canegrowers Web Site : http://www.canegrowers.com.au
[2] Sugar Research and Development Corporation (SRDC) “Research and
Development Plan 1999 – 2004”, The Sugar Industry, 1999, p.9.
[3] Sugar Research and Development Corporation (SRDC) “Annual Report 2000-
2001”, Program 4 : Cane Harvest and Transport, 2001, p.27.
[4] Hankel, C.R., Fuelling, T.G. and Ridge, D.R. “The effect of harvester base
cutter height setting on dirt in the cane supply and cane left in the field”
Proc. 1st Australian Society of Sugar Cane Technology, 1979, p.19-25.
[5] Communication with Ash Benson of BSES during March 2000. Contact Phone
Number: (07) 47825455.
[6] Garson, C.A. “Base cutter height control” Sugar Research and Development
Corporation (SRDC) Project BS26S – Optimising Rejection of Dirt by Cane
Harvesters, Final Report, SRI July 1992.
[7] Mason, V. and Garson, C.A. “Some maintenance related costs associated with
dirt in the cane supply” Sugar Research Institute Technical Circular No. 93,
1986.
[8] Kent, G. and Robertson, L. “Cleaner cane harvesting” Sugar Research and
Development Corporation (SRDC) Report, http://www.srdc.gov.au.
[9] Wright, M.E. and Simoneaux, J.J. “Automatic Height Control of a Sugarcane
Harvester Basecutter” Journal of Society of Automotive Engineers, 1998, pp.
7-14.
117
[10] Musumeci, P.C. “Automatic control of base cutter height sensing on sugar
cane harvesters” M. Eng. Sc. Thesis, Dept. Electrical and Electronic
Engineering, James Cook University of North Queensland, 1983.
[11] Neves, J.L.M., Marchi, A.S., Pizzinato, A.A.S. and Menegasso, L.R.
“Comparative Testing of a Floating and a Conventional Fixed Base Cutter”
Proc. Int. Soc. Sugar Cane Technol., 24: 257-262, 2001.
[12] Shin, B, Dodd, R.B. and Han, Y.J.: “Soil Surface Detection using Dual-
Frequency Continuous-Wave Radar” American Society of Agricultural
Engineers (ASAE), Paper No. 91-3540, Chicago, Illinois, Dec. 17-20, 1991.
[13] Ruxton, A.B. “Soil detection radar using microwaves, A feasibility study”
Bachelor of Engineering Thesis in Computer Systems Engineering, School of
Engineering, James Cook University, 1998.
[14] Page, R.L. “Soil detection radar using microwave technology” Bachelor of
Engineering Thesis in Electrical and Electronic Engineering, School of
Engineering, James Cook University, 1999.
[15] Woods, G.S., Maskell, D.L. and Ruxton, A. “Microwave Soil Level Detection
Sensor” 1999 Asia Pacific Microwave Conference, Singapore, 30 November - 3
December 1999, pp.531-534.
[16] Woods, G.S., Page, R.L. and Maskell, D.L. “Soil Height Detection Sensor for
Control of Harvesting Equipment” 2002 Asia Pacific Microwave Conference,
19-22 November, 2002.
[17] Weeden, B.R. “Potential of Sugar Beet on the Atherton Tableland” Rural
Industries Research & Development Corporation Project DAQ-211A,
http://www.rirdc.gov.au
118
[18] Hernando, J.M., Pérez-Fontán, F. (1999). Introduction to Mobile
Communications Engineering. Artech House, Norwood.
[19] Tsai, H. S. “Real Time : A two-dimensional electromagnetic field simulator”
CRC Press, 2000.
[20] Nyfors, E. and Vainikainen, P. “Industrial Microwave Sensors” Artech
House, 1989.
[21] Balanis, C.A. (1938). Antenna theory : analysis and design / Constantine A.
Balanis. – 2nd ed., Hamilton Printing, United States of America.
[22] Hippel, A.R. “Dielectric materials and applications” MIT Press, Cambridge,
Mass., 1954, pp301-370