Embed Size (px)
Citation preview

Volume 2
E & B PAVING, INC. PAGE i of iv
I-65 SE INDIANA PROJECT
SUMMARY & ORDER OF PROPOSAL CONTENTS
Technical Proposal – Volumes 1 and 2
Technical Proposal Component Form (if any)ITP Section
Cross-Reference
Volume 1A. Executive Summary
Executive Summary (Exclude price information)
No forms are provided
Exhibit B, Section 3.1
B. Proposer Information, Certifications and Documents Proposal Letter Form A Exhibit B, Section 3.2.1Authorization Documents No forms are
providedExhibit B, Section 3.2.1
Identification of Proposer and Equity Members
Form B-1 Exhibit B, Section 3.2.2
Information About Proposer Organization Form B-2 Exhibit B, Section 3.2.2Information About Major Participants and Identified Contractors
Form B-3 Exhibit B, Section 3.2.2
Letter accepting joint and several liability, if applicable
No forms are provided
Exhibit B, Section 3.2.2
Responsible Proposer and Major Participant Questionnaire
Form C Exhibit B, Section 3.2.3
Industrial Safety Record for Proposer, Equity Members and Major Participants
Form D (as applicable)
Exhibit B, Section 3.2.4
Personnel Work Assignment Form and Commitment of Availability
Form E Exhibit B, Section 3.2.5
Letter(s) Regarding Pre-Proposal Submittals
No forms are provided
Exhibit B, Section 3.2.6
Non-Collusion Affidavit Form F Exhibit B, Section 3.2.7
DBE Certification Form GNo forms are provided for the DBE Performance Plan or Job Training Plan
Exhibit B, Section 3.2.8
Exhibit E
SUMMARY AND ORDER OF PROPOSAL CONTENTS
Indiana Department of TransportationI-65 Southeast Indiana ProjectMarch 10, 2017
Exhibit E
Page 1 of 4
Request for ProposalsITP Exhibits
ADDENDUM #3
Exhibit E

Volume 2
E & B PAVING, INC. PAGE ii of iv
I-65 SE INDIANA PROJECT
Technical Proposal – Volumes 1 and 2
Technical Proposal Component Form (if any)ITP Section
Cross-ReferenceSurety/Financial Institution Information No forms are
providedExhibit B, Section 3.2.9
Conflict of Interest Disclosure Form H Exhibit B, Section 3.2.10
Certification regarding Buy America Form R Exhibit B, Section 3.2.11
Certification regarding Equal Employment Opportunity
Form S Exhibit B, Section 3.2.12
Use of Contract Funds for Lobbying Certification
Form T Exhibit B, Section 3.2.13
Debarment and Suspension Certification Form U Exhibit B, Section 3.2.14
Insurance No forms are provided
Exhibit B, Section 3.2.15
Confidential Contents Index No forms are provided
Exhibit B, Section 3.2.16
C. Proposal Stipend Agreement Form O Exhibit B, Section 3.3
D. Proposal Security (Proposal Bond) Proposal Security Form J (if in the form
of a bond); no forms provided for certified check
Exhibit B, Section 3.4
Volume 2 E. Scope Package(s) Form K Exhibit B, Section 4.0F. Preliminary Performance Plans
Preliminary Project Management Plan No forms are provided
Exhibit B, Section 5.1
Preliminary Project Baseline Schedule for Design and Construction
No forms areprovided
Exhibit B, Section 5.1.2
Completion Deadlines Form L Exhibit B, Section 5.1.2Preliminary Design-Build Plan No forms are
providedExhibit B, Section 5.2
SUMMARY & ORDER OF PROPOSAL CONTENTS
Indiana Department of TransportationI-65 Southeast Indiana ProjectMarch 10, 2017
Exhibit E
Page 2 of 4
Request for ProposalsITP Exhibits
ADDENDUM #3
Exhibit E

Volume 2
E & B PAVING, INC. PAGE iii of iv
I-65 SE INDIANA PROJECT
Technical Proposal – Volumes 1 and 2
Technical Proposal Component Form (if any)ITP Section
Cross-Reference
G. Volume 1 AppendicesCopies of Organizational Documents No forms are
providedExhibit B, Section 3.2.2
Proposer Teaming Agreement or KeyTerms
No forms areprovided
Exhibit B, Section 3.2.2
Executed Contracts or TermSheets/Heads of Terms
No forms areprovided
Exhibit B, Section 3.2.2
H. Volume 2 AppendicesKey Personnel Resumes No forms are
providedExhibit B, Section 3.2.5
Technical/Design Drawings, Graphs andData
No forms areprovided
Exhibit B, Section 5.2
SUMMARY & ORDER OF PROPOSAL CONTENTSSUMMARY & ORDER OF PROPOSAL CONTENTS
Indiana Department of TransportationI-65 Southeast Indiana ProjectMarch 10, 2017
Exhibit E
Page 3 of 4
Request for ProposalsITP Exhibits
ADDENDUM #3
Exhibit E

Volume 2
E & B PAVING, INC. PAGE iv of iv
I-65 SE INDIANA PROJECT
Price Proposal – Volume 3
Proposers shall follow the order of the Price Proposal Checklist in their submissions. A referenced copy of this document shall be submitted with the Price Proposal.
Price Proposal Component Form (if any)ITP Section
Cross-Reference
Price Form Form I Exhibit C, Section 2.0
Summary Cost Table Form Form M Exhibit C, Section 2.0
Scope Package Form K Exhibit C, Section 4.0
SUMMARY & ORDER OF PROPOSAL CONTENTS
Indiana Department of TransportationI-65 Southeast Indiana ProjectMarch 10, 2017
Exhibit E
Page 4 of 4
Request for ProposalsITP Exhibits
ADDENDUM #3
Exhibit E

Volume 2
E & B PAVING, INC. PAGE i of iv
I-65 SE INDIANA PROJECT
SUMMARY & ORDER OF PROPOSAL CONTENTS
Technical Proposal – Volumes 1 and 2
Technical Proposal Component Form (if any)ITP Section
Cross-Reference
Volume 1A. Executive Summary
Executive Summary (Exclude price information)
No forms are provided
Exhibit B, Section 3.1
B. Proposer Information, Certifications and Documents Proposal Letter Form A Exhibit B, Section 3.2.1Authorization Documents No forms are
providedExhibit B, Section 3.2.1
Identification of Proposer and Equity Members
Form B-1 Exhibit B, Section 3.2.2
Information About Proposer Organization Form B-2 Exhibit B, Section 3.2.2Information About Major Participants and Identified Contractors
Form B-3 Exhibit B, Section 3.2.2
Letter accepting joint and several liability, if applicable
No forms are provided
Exhibit B, Section 3.2.2
Responsible Proposer and Major Participant Questionnaire
Form C Exhibit B, Section 3.2.3
Industrial Safety Record for Proposer, Equity Members and Major Participants
Form D (as applicable)
Exhibit B, Section 3.2.4
Personnel Work Assignment Form and Commitment of Availability
Form E Exhibit B, Section 3.2.5
Letter(s) Regarding Pre-Proposal Submittals
No forms are provided
Exhibit B, Section 3.2.6
Non-Collusion Affidavit Form F Exhibit B, Section 3.2.7
DBE Certification Form GNo forms are provided for the DBE Performance Plan or Job Training Plan
Exhibit B, Section 3.2.8
Exhibit E
SUMMARY AND ORDER OF PROPOSAL CONTENTS
Indiana Department of TransportationI-65 Southeast Indiana ProjectMarch 10, 2017
Exhibit E
Page 1 of 4
Request for ProposalsITP Exhibits
ADDENDUM #3
Exhibit E

Volume 2
E & B PAVING, INC. PAGE ii of iv
I-65 SE INDIANA PROJECT
Technical Proposal – Volumes 1 and 2
Technical Proposal Component Form (if any)ITP Section
Cross-ReferenceSurety/Financial Institution Information No forms are
providedExhibit B, Section 3.2.9
Conflict of Interest Disclosure Form H Exhibit B, Section 3.2.10
Certification regarding Buy America Form R Exhibit B, Section 3.2.11
Certification regarding Equal Employment Opportunity
Form S Exhibit B, Section 3.2.12
Use of Contract Funds for Lobbying Certification
Form T Exhibit B, Section 3.2.13
Debarment and Suspension Certification Form U Exhibit B, Section 3.2.14
Insurance No forms are provided
Exhibit B, Section 3.2.15
Confidential Contents Index No forms are provided
Exhibit B, Section 3.2.16
C. Proposal Stipend Agreement Form O Exhibit B, Section 3.3
D. Proposal Security (Proposal Bond) Proposal Security Form J (if in the form
of a bond); no forms provided for certified check
Exhibit B, Section 3.4
Volume 2 E. Scope Package(s) Form K Exhibit B, Section 4.0F. Preliminary Performance Plans
Preliminary Project Management Plan No forms are provided
Exhibit B, Section 5.1
Preliminary Project Baseline Schedule for Design and Construction
No forms areprovided
Exhibit B, Section 5.1.2
Completion Deadlines Form L Exhibit B, Section 5.1.2Preliminary Design-Build Plan No forms are
providedExhibit B, Section 5.2
SUMMARY & ORDER OF PROPOSAL CONTENTS
Indiana Department of TransportationI-65 Southeast Indiana ProjectMarch 10, 2017
Exhibit E
Page 2 of 4
Request for ProposalsITP Exhibits
ADDENDUM #3
Exhibit E

Volume 2
E & B PAVING, INC. PAGE iii of iv
I-65 SE INDIANA PROJECT
Technical Proposal – Volumes 1 and 2
Technical Proposal Component Form (if any)ITP Section
Cross-Reference
G. Volume 1 AppendicesCopies of Organizational Documents No forms are
providedExhibit B, Section 3.2.2
Proposer Teaming Agreement or KeyTerms
No forms areprovided
Exhibit B, Section 3.2.2
Executed Contracts or TermSheets/Heads of Terms
No forms areprovided
Exhibit B, Section 3.2.2
H. Volume 2 AppendicesKey Personnel Resumes No forms are
providedExhibit B, Section 3.2.5
Technical/Design Drawings, Graphs andData
No forms areprovided
Exhibit B, Section 5.2
SUMMARY & ORDER OF PROPOSAL CONTENTSSUMMARY & ORDER OF PROPOSAL CONTENTS
Indiana Department of TransportationI-65 Southeast Indiana ProjectMarch 10, 2017
Exhibit E
Page 3 of 4
Request for ProposalsITP Exhibits
ADDENDUM #3
Exhibit E

Volume 2
E & B PAVING, INC. PAGE iv of iv
I-65 SE INDIANA PROJECT
Price Proposal – Volume 3
Proposers shall follow the order of the Price Proposal Checklist in their submissions. A referenced copy of this document shall be submitted with the Price Proposal.
Price Proposal Component Form (if any)ITP Section
Cross-Reference
Price Form Form I Exhibit C, Section 2.0
Summary Cost Table Form Form M Exhibit C, Section 2.0
Scope Package Form K Exhibit C, Section 4.0
SUMMARY & ORDER OF PROPOSAL CONTENTS
Indiana Department of TransportationI-65 Southeast Indiana ProjectMarch 10, 2017
Exhibit E
Page 4 of 4
Request for ProposalsITP Exhibits
ADDENDUM #3
Exhibit E

11
I-65 SOUTHEAST INDIANA PROJECT
E & B Paving, Inc. KEY PERSONNEL RESUMES
I-69 Design Build I-64 to SR 68Scott was project manager on this project which included two overpass bridges and several box structures. He coordinated with Indiana State Police and INDOT when this segment of I-69 was opened in phases moving traffic from SR 57 to I-69. This project involved moving 450,000 cys of dirt, and placing 107,700 sys of PCCP and 9,000 tons of HMA on 123,260 sys of Subgrade Treatment. Scott coordinated with the design build team and INDOT to implement a scope change and cost reduction incentive which saved the project approximately $100,000.I-69 Design Build Norfolk Southern Railroad to Patoka RiverScott was the project manager on this project which included several bridges and two overpasses structures. He was responsible for coordinating with the design build team and INDOT to implement changes to project drainage and replacing a bridge with a three sided box over Buck Creek. The project included 1.3 million cys of common excavation and placing 125,000 ton of HMA on 214,000 sys of Subgrade Treatment.
Scott O’Neil, PEProject Manager and Public Involvement Manager
Education: Rose-Hulman Institute of Technology (1993)BS Civil Engineering (1993)
Years Relevant Experience: 23 Licenses/Certifications:
• Professional Engineer (PE 10809522)• OSHA 30 Certified• CPR and First Aid Certified• INDOT Level 1 Storm Water Manager Certified
Availability: 100%
Scott will be the Project Manager and the Public Involvement Manager. He will be designated as the single point of contact for purposes of overall administration of the project. Scott will be authorized to act with respect to contractual matters and for resolving any issues that arise during progress of the work. He will also be responsible for identifying public information issues and for formulating and implementing strategies to address issues relative to the public, public resource agencies, emergency service providers, businesses, media and other interested parties. Scott will work with INDOT to respond to the communication needs of the project with availability by telephone and email, and he will be available as needed during critical construction activities and emergencies.
Scott has 23 years of relative experience with the majority of the last 8 years being spent managing projects on I-69 between Evansville and Bloomington. Since graduating from Rose-Hulman Institute of Technology, he has been employed by INDOT, a consulting engineering firm, and now a contractor. Scott has been in his current position for the last 9 years. He is a good communicator and able to find common ground and present perspectives clearly to resolve project issues fairly. Scott is currently the industry side Co-Chairman for the ICI/INDOT Southern Region Joint Cooperative Committee which has allowed him to gain an appreciation of INDOT positions on current issues.
Relevant Experience
I-69 Design Build I-64 to SR 68

22
I-65 SOUTHEAST INDIANA PROJECT
E & B Paving, Inc. KEY PERSONNEL RESUMES
I-65 Ohio River Bridge Section 3Franz managed the HMA paving operations coordinating with bridge construction. He was able to place approximately 300,000 tons of HMA while accommodating the construction of the new Lincoln Bridge and several other bridge structures. Taking into account mix designs, pavement types, and typical sections, this project had 38 different HMA mix designs, and Franz was always able to stay organized to optimize efficiency and meet deadlines and exceed expectations.
I-65 Design Build Sellersburg to MemphisThis project is ongoing and scheduled for completion in 2018. This project is very similar to the currently proposed project, and Franz is demonstrating his ability to excel in the design build environment. Franz is able to manage the tight schedules, and traffic configurations while coordinating with bridge construction to stay on track. This project is approximately 8 miles long and scheduled for 385,000 ton of HMA on 496,500 sys of Subgrade Treatment Type 1-B. Franz’s duties will be transitioned to make him available for this project.
Franz HardestyConstruction Manager
Education: New Albany High School
Years Relevant Experience: 21Licenses/Certifications:
• OSHA 30 Certified• Traffic Control Superintendent Certified• INDOT HMA Field Supervisor Certified• CPR and First Aid Certified
Availability: 100%
Franz will be the Construction Manager responsible for oversight and management of all construction and field activities.
Over the last 21 years Franz has been involved with numerous high profile highway projects in Indiana and Kentucky. Franz has been the recipient of NAPA awards for several projects in Kentucky, and he has managed several projects on I-65 and I-265 in Indiana with great success. Franz is a great communicator allowing him to manage multiple crews and operations with extreme effectiveness. He thrives on the challenge of fast track projects and takes great personal pride in exceeding expectations.
Relevant Experience
Ohio River BridgeSection 3

33
I-65 SOUTHEAST INDIANA PROJECT
E & B Paving, Inc. KEY PERSONNEL RESUMES
I-69 Patoka River to PetersburgSteve was the construction superintendent on this 8 mile new corridor project from the Patoka River to the SR 61 Interchange. Steve supervised and helped coordinate all field operation. This project included several bridges and overpasses and moving approximately 3 million cys of dirt/rock while 226,000 sys of PCCP and 87,000 tons of HMA were placed on 405,000 sys of Subgrade Treatment. Steve played a critical role in a successful project being delivered on time.
I-69 Section 4 Segment 6 and 7Steve was the construction superintendent on the south section of segment 6 of this project. Steve successfully implemented a Cost Reduction Incentive which altered the grade at the SR 445 interchange and supervised and helped coordinate all field activities. This project included several bridges and overpasses and approximately 5 million cys of unclassified excavation. 215,800 cys of PCCP and 45,000 ton of HMA were placed on 365,000 cys of Subgrade Treatment. Steve was instrumental in this project finishing on time.
Steve ParrConstruction Superintendent
Education: Crawford County High SchoolYears Relevant Experience: 21 Licenses/Certifications:
• IOSHA 30 Certified • Traffic Control Superintendent Certified• CPR and First Aid Certified• INDOT Level 1 Storm Water Manager Certified• Hazardous Waste Operations and Emergency Response
Certified - HAZWOPEAvailability: 100%
Steve will be the Construction Superintendent responsible for supervising all construction and field activities. Steve will report to the Construction Manager Franz Hardesty.
Steve has been in the heavy highway construction industry for 21 years working on various projects in Southern Indiana. Most notably Steve has supervised crews at the I-65 Sellersburg Interchange, I-65 Hamburg and US 60 Interchanges, and at the I-64 Lynnville area resurface. Steve has spent the majority of his time for the last six years on I-69 new corridor construction between Evansville and Bloomington supervising multiple crews on multiple operations. He is highly organized and multitasks well. Steve has excelled and demonstrated this skill when supervising mass excavation, riprap placement, and structure installation simultaneously. Additionally, he is efficient coordinating concurrent operations including subgrade, subbase, and paving.
Relevant Experience
I-69 Section 4Segment 6 and 7

44
I-65 SOUTHEAST INDIANA PROJECT
E & B Paving, Inc. KEY PERSONNEL RESUMES
I-65 Added Travel Lanes, Southport Road to Main Street (Greenwood)United Road Design ManagerBrian led the overall development of the United Roadway Design Services. He successfully delivered the first Major Moves 2020 project on an extremely aggressive schedule. The added travel lane project also traversed three interchanges at Southport Road, County Line Road, and Main Street.
Operation Indy Commute, I-69 from I-465 to SR 37Lead Project EngineerAdded travel lanes and interchange modification including a new flyover ramp from I-69 to SR 37 to minimize “weaving” and reduce bottleneck on one of the most heavily used sections of roadway in the state. Prepared lane closure waiver, traffic management plan, Level One Design Exceptions, and multi-phase maintenance of traffic plans to minimize impact on daily traffic. Designed horizontal alignments, vertical profiles, super-elevations, spot grading, surface drainage, underdrains, erosion control, guardrail, signing, and pavement markings. Prepared quantity calculations and cost estimate.
Indianapolis Cultural Trail, City of IndianapolisProject ManagerBrian developed and oversaw the design of projects constructing nearly 6.5 miles of new shared use paths and sidewalks in and around downtown Indianapolis highlighting adjacent cultural districts, incorporating art into public spaces, and emphasizing green and context sensitive design. Detailed grading plans to reconstruct the urban streets and sidewalks within the limits of the existing conditions consisted of over 13,000 individual spot elevations. The project was a collaborative effort by the City of Indianapolis Department of Public Works and Central Indiana Community Foundation. The $40M construction cost has improved the city’s infrastructure using a combination of private funding and Federal grant money.
Brian Pierson, PELead Engineer
Education: Valparaiso University (2003)BS Civil Engineering
Years Relevant Experience: 13Licenses/Certifications:
• Indiana Professional Engineer No. PE10809010
Availability: 75%Brian Pierson will be the Lead Engineer and primary point of contact for design services. He has been involved in numerous facets of projects including I-65 Added Travel Lanes from Southport Road to Main Street in Greenwood, where he led the road design services. Brian specializes in managing high profile accelerated projects of significant importance. He takes pride in exceeding clients’ expectations for project delivery and providing excellent communication through the project development process.
Relevant Experience
Operation IndyCommute
Indianapolis Cultural Trail

55
I-65 SOUTHEAST INDIANA PROJECT
E & B Paving, Inc. KEY PERSONNEL RESUMES
I-69 Section 4Lambda was responsible for a variety of different assignments during the evolution of the I-69 Section 4 Project. Each task provided her with valuable experience working in extreme terrain and new corridor construction. Weekly Erosion and Sediment Control Reports, Rain Event Reports, analysis of failed features, evaluation of drainage areas, and inspections of offsite waste/borrow areas were some of her responsibilities. She was able to work professionally and coordinate with INDOT, contractors, and regulatory agencies to achieve environmental compliance.
Lambda MortStorm Water Quality Control Manager
Education: Purdue University (1986)BS Natural Resources and Environmental Science
Years Relevant Experience: 24 Licenses/Certifications:
• CESSWI• INDOT Level 1 Storm Water Manager Certified• CPR and First Aid Certified
Availability: 75%
Lambda will be the Storm Water Quality Manager responsible for installation, inspection, maintenance, and removal of all required storm water quality management measures. She will be focusing on the implementation of our Storm Water Quality Control Plan.
Lambda is the owner of Mort Environmental LLC and has made application for her DBE status. She is a highly recommended former INDOT employee with extensive experience and expertise in inspecting construction projects for environmental compliance. Lambda has shown excellent communication skills while being a part of the I-69 Section 4 Environmental Team. She successfully worked with regulatory agencies, contractors, consultants, and INDOT personnel to implement solutions in extremely challenging conditions.
Relevant Experience
I-69 Section 4

66
I-65 SOUTHEAST INDIANA PROJECT
E & B Paving, Inc. KEY PERSONNEL RESUMES
I-69 Sections 2/3, Gibson, Pike, Daviess, & Greene CountyDeputy Project ManagerOversaw multiple Design Teams including the utility coordination manager and lead the Practical Design Workshop on this 55-mile long corridor. Design was started and completed in just 14 months. Delivery included both Design/Build and traditional Design/Bid/Build. Although Chris manages the Transportation Department, he dedicated the majority of his time to make this project successful. During the delivery, Chris was responsible for the Quality Control of United’s design.
I-74 Ronald Reagan Parkway, US 136 & Hendricks CR 600 NProject ManagerChris served as the Project Manager and was teamed with Kenny Franklin on his first project assignment as an INDOT Project Manager. Chris worked with Kenny to deliver a new interchange as a Fast-Track project with design completed for letting in six months. He led the accelerated design while obtaining the necessary permits and completed the utility coordination. During the delivery, Chris was responsible for the Quality Control of the design and assurance that all procedures were followed.
Chris Hammond, PEDesign Quality Manager
Education: Rose Hulman Institute of Technology (1992)BS Civil Engineering
Years Relevant Experience: 24Licenses/Certifications:
• Indiana Professional Engineer No. PE19800239• INDOT Certified Utility Coordinator
Availability: 50%
Chris will be the Design Quality Manager of all design work performed for the project. He will ensure that all quality control procedures are followed and assure and certify compliance. Chris has completed such services on multiple high profile interstate projects over the last ten year. Currently, he provides such services for three different design teams including our Lead Engineer’s team.
Chris is a great leader and communicator. These intangible skills, coupled with his sound technical expertise in all aspects of Road Design, have propelled him to be the Road Department Manager at United, where he daily guides, directs, and mentors the engineers and CAD designers. He is passionate about quality and reviews every document—from a complex set of Final Plans to a Transmittal Letter—that leaves the United Road Department. Chris has a special interest in Utility Coordination, where he has been certified through INDOT and serves as one of the presenters at the INDOT Certification Training sessions.
Relevant Experience
I-69 2/3 Gibson,Pike Daviess, & Greene
I-74 Ronald Reagan Parkway

77
I-65 SOUTHEAST INDIANA PROJECT
E & B Paving, Inc. KEY PERSONNEL RESUMES
I-65 Design Build Sellersburg to MemphisThe project has significant similarities to I-65 Southeast project. The project is being completed through a Design-Build process and is adding travel lanes to the existing four lane interstate. Lori is demonstrating her traffic control expertise and is coordinating the Construction Worksite Traffic Supervisor. Lori is able to manage the tight schedules, and complex traffic configurations in the congested high speed traffic of I-65. This project is approximately 8 miles long and has 385,000 ton of HMA on 496,500 sys of Subgrade Treatment Type 1-B.
I-65 Resurface Scottsburg to HenryvilleThis project included extensive pavement patching and placing 50,000 tons of HMA. Temporary median crossovers were utilized to replace bridge decks and multiple traffic control setups were required to accommodate the patching operations. Lori managed the traffic control and was critical to the success of this 10 mile long project.
Lori PellemanMaintenance of Traffic Manager
Education: Indiana University, New Albany, INBS Computer Science
Years Relevant Experience: 16 Licenses/Certifications:
• OSHA 30 Certified • Traffic Control Superintendent Certified• Flagger Certified• CPR and First Aid Certified• INDOT Level 1 Storm Water Manager Certified
Availability: 100%
Lori will be the Maintenance of Traffic MOT Manager responsible for coordinating all MOT activities with INDOT. Lori will implement traffic management strategies, and provide MOT reports to INDOT with each change in traffic phasing. These reports shall include expected queue lengths/delays and a summary of expected operations and MOT durations. Lori will be continually available during construction until final acceptance and removal of all temporary traffic control. Lori will supervise the Construction Worksite Traffic Supervisor and she will report to the Construction Superintendent, Steve Parr.
Lori has 16 years of experience in highway construction and a computer science degree from Indiana University. Lori has always gravitated toward the more challenging aspects of the trade. With her technical background she excels at checking grade and verifying critical setups are completed correctly. She has specialized in traffic control for the last couple of years on various projects on I-65, I-264, I-71, and I-64 in Southern Indiana and Kentucky. Lori’s responsibilities on other projects will be transitioned to other qualified staff to be the Maintenance of Traffic Manager on I-65 Southeast, if successful.
Relevant Experience
88
I-65 SOUTHEAST INDIANA PROJECT
E & B Paving, Inc. KEY PERSONNEL RESUMES
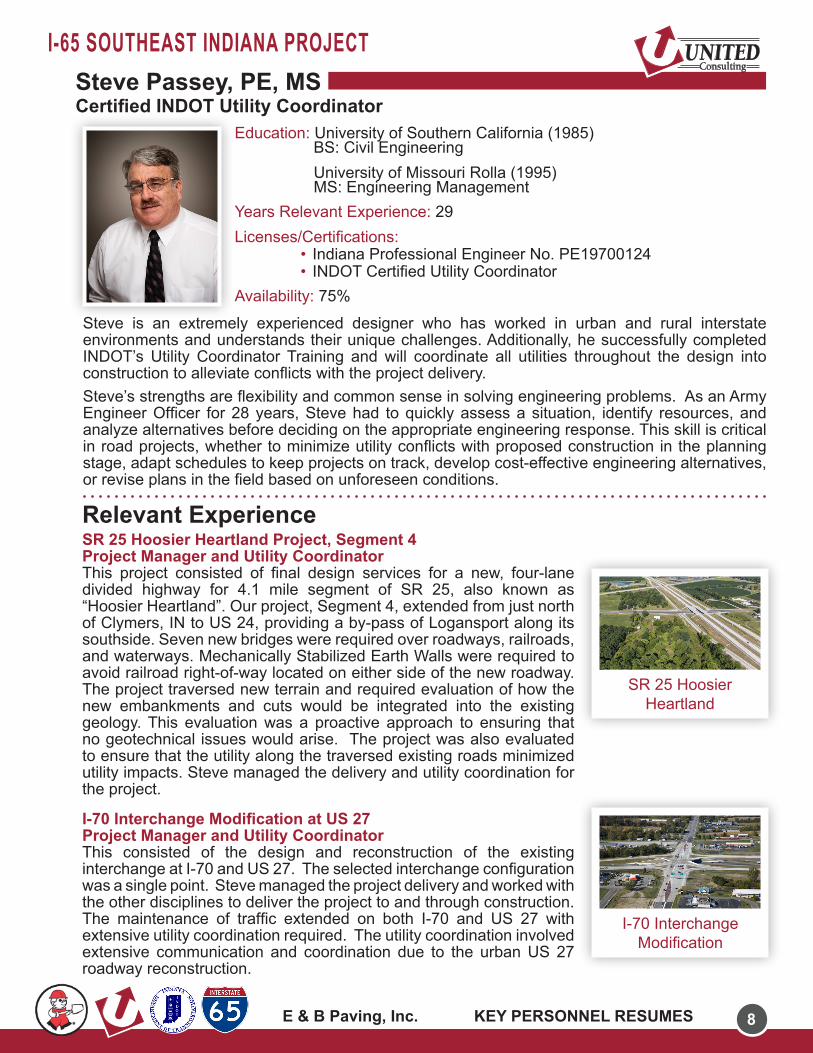
SR 25 Hoosier Heartland Project, Segment 4Project Manager and Utility CoordinatorThis project consisted of final design services for a new, four-lane divided highway for 4.1 mile segment of SR 25, also known as “Hoosier Heartland”. Our project, Segment 4, extended from just north of Clymers, IN to US 24, providing a by-pass of Logansport along its southside. Seven new bridges were required over roadways, railroads, and waterways. Mechanically Stabilized Earth Walls were required to avoid railroad right-of-way located on either side of the new roadway. The project traversed new terrain and required evaluation of how the new embankments and cuts would be integrated into the existing geology. This evaluation was a proactive approach to ensuring that no geotechnical issues would arise. The project was also evaluated to ensure that the utility along the traversed existing roads minimized utility impacts. Steve managed the delivery and utility coordination for the project.
I-70 Interchange Modification at US 27Project Manager and Utility CoordinatorThis consisted of the design and reconstruction of the existing interchange at I-70 and US 27. The selected interchange configuration was a single point. Steve managed the project delivery and worked with the other disciplines to deliver the project to and through construction. The maintenance of traffic extended on both I-70 and US 27 with extensive utility coordination required. The utility coordination involved extensive communication and coordination due to the urban US 27 roadway reconstruction.
Steve Passey, PE, MSCertified INDOT Utility Coordinator
Education: University of Southern California (1985)BS: Civil EngineeringUniversity of Missouri Rolla (1995)MS: Engineering Management
Years Relevant Experience: 29Licenses/Certifications:
• Indiana Professional Engineer No. PE19700124• INDOT Certified Utility Coordinator
Availability: 75%
Steve is an extremely experienced designer who has worked in urban and rural interstate environments and understands their unique challenges. Additionally, he successfully completed INDOT’s Utility Coordinator Training and will coordinate all utilities throughout the design into construction to alleviate conflicts with the project delivery. Steve’s strengths are flexibility and common sense in solving engineering problems. As an Army Engineer Officer for 28 years, Steve had to quickly assess a situation, identify resources, and analyze alternatives before deciding on the appropriate engineering response. This skill is critical in road projects, whether to minimize utility conflicts with proposed construction in the planning stage, adapt schedules to keep projects on track, develop cost-effective engineering alternatives, or revise plans in the field based on unforeseen conditions.
Relevant Experience
SR 25 HoosierHeartland
I-70 InterchangeModification

99
I-65 SOUTHEAST INDIANA PROJECT
E & B Paving, Inc. KEY PERSONNEL RESUMES
I-69 Patoka River to PetersburgJeff was a foreman on this 8 mile new corridor project from the Patoka River to the SR 61 Interchange. This project included several bridges and overpasses and moving approximately 3 million cys of soil and rock while 226,000 sys of PCCP and 87,000 tons of HMA were placed on 405,000 sys of Subgrade Treatment. Jeff played a critical role in the success of this project in moving soil and maintaining environmental compliance.
I-69 Section 4 Segment 6 and 7Jeff was a foreman on Segment 6 for this project. This project included several bridges and overpasses and approximately 5 million cys of unclassified excavation. 215,800 cys of PCCP and 45,000 ton of HMA were placed on 365,000 cys of Subgrade Treatment. Jeff was able to navigate the extreme terrain to implement the Storm Water Pollution Prevention Plan.
Jeff WoodardEnvironmental Compliance Manager
Education: New Albany High School 1977Studied at the University of Alabama
Years Relevant Experience: 29 Licenses/Certifications:
• INDOT Level 1 Storm Water Manager Certified• OSHA 30 Certified• CPR and First Aid Certified
Availability: 100%
Jeff will be the Environmental Compliance Manager. Reporting directly to the Project Manager, he will be responsible for implementing all the designed features to satisfy the environmental and construction commitments identified in the final approved environmental documents and permits. Jeff will be committed to this project 100% of the time and work closely with the Storm Water Quality Manager to ensure permitting compliance. Jeff will supervise at least one crew whose highest priority will be environmental feature installation and maintenance and have the authority to increase resources if necessary to achieve permit compliance. Jeff will be INDOT’s primary contact for compliance issues.
Jeff has worked in heavy highway construction since 1989. He has expertise in everything from finishing concrete to checking grade, and has the ability to supervise his crew while communicating with INDOT representatives. He has implemented Storm Water Pollution Prevention Plans, knows the Indiana Storm Water Quality manual, and installed features shown on erosion control plans. Jeff’s application of these skills has been demonstrated on large earthwork projects with extensive riprap and large pipe structures.
Relevant Experience
I-69 Section 4Segment 6 and 7

Design Inputs
Age (year) Heavy Trucks (cumulative)
2019 (initial) 4612025 (6 years) 1,211,8602032 (13 years) 2,714,290
TrafficDesign Structure
Layer type Material Type Thickness (in.):
Flexible Seymour 9.5mm PG70-22 1.5
Flexible Existing HMA 2.5PCC JPCP Default 8.0Subgrade A-4 14.0Subgrade A-4 Semi-infinite
Volumetric at Construction:Effective binder content (%) 11.6
Air voids (%) 8.0
Distress TypeDistress @ Specified
Reliability Reliability (%) Criterion Satisfied?
Target Predicted Target AchievedTerminal IRI (in./mile) 160.00 118.71 90.00 99.83 Pass
Permanent deformation - total pavement (in.) 0.75 0.26 90.00 100.00 Pass
Total Cracking (Reflective + Alligator) (percent) 100 5.56 - - Pass
AC thermal cracking (ft/mile) 500.00 217.40 90.00 100.00 Pass
JPCP transverse cracking (percent slabs) 10.00 4.39 90.00 99.83 Pass
AC bottom-up fatigue cracking (percent) 10.00 1.45 90.00 100.00 Pass
AC top-down fatigue cracking (ft/mile) 2000.00 304.59 90.00 100.00 Pass
Permanent deformation - AC only (in.) 0.40 0.26 90.00 99.99 Pass
Distress Prediction Summary
AC over JPCPDesign Type:13 yearsDesign Life:
September, 2019Traffic opening:Pavement construction: July, 2019
May, 1960Existing construction: Climate Data Sources (Lat/Lon)
39.144, -86.61739.71, -86.27238.228, -85.664
Design Outputs
SR 11 RampsFile Name: C:\My ME Design\Projects\MK16-465 SE BV\170313 TP-App No 3\SR 11 Ramps.dgpx
Report generated on: 4/24/2017 2:24 PM Page 1 of 25
by: on: 10/10/2016 9:24 AM on: 10/10/2016 9:24 AM
by: Created Approved

Distress Charts
SR 11 RampsFile Name: C:\My ME Design\Projects\MK16-465 SE BV\170313 TP-App No 3\SR 11 Ramps.dgpx
Report generated on: 4/24/2017 2:24 PM Page 2 of 25
by: on: 10/10/2016 9:24 AM on: 10/10/2016 9:24 AM
by: Created Approved

Traffic Volume Monthly Adjustment Factors
Class 4 Class 5 Class 6 Class 7 Class 8 Class 9 Class 10 Class 11 Class 12 Class 13
Graphical Representation of Traffic Inputs
Traffic Inputs
Operational speed (mph) 55.0
Percent of trucks in design direction (%): 100.0100.01 Percent of trucks in design lane (%):Number of lanes in design direction:
461Initial two-way AADTT:
SR 11 RampsFile Name: C:\My ME Design\Projects\MK16-465 SE BV\170313 TP-App No 3\SR 11 Ramps.dgpx
Report generated on: 4/24/2017 2:24 PM Page 3 of 25
by: on: 10/10/2016 9:24 AM on: 10/10/2016 9:24 AM
by: Created Approved

Traffic WanderMean wheel location (in.)
Traffic wander standard deviation (in.)Design lane width (ft)
18
1012
Axle ConfigurationAverage axle width (ft) 8.5
Dual tire spacing (in.)Tire pressure (psi)
12120
Average Axle SpacingTandem axle spacing (in.)Tridem axle spacing (in.)Quad axle spacing (in.)
51.6
49.2
49.2
Wheelbase
ShortAxle Type
Value Type Medium Long
1512Average spacing of axles (ft) 18
Percent of Trucks (%) 33 3433
Number of Axles per Truck
Vehicle Class
Single Axle
Tandem Axle
Tridem Axle
Quad Axle
Class 4 1.7 0.29 0 0Class 5 2 0 0 0Class 6 1 1 0 0Class 7 1.18 0.18 0.63 0.18Class 8 2.21 0.78 0 0Class 9 1.48 1.75 0 0
Class 10 1.08 0.99 0.94 0.03Class 11 4.43 0.03 0.16 0Class 12 3.29 1.09 0.17 0Class 13 2.7 1.22 0.43 0.24
Axle Configuration
Volume Monthly Adjustment Factors Level 3: Default MAF
Month Vehicle Class4 5 6 7 8 9 10 11 12 13
January 0.7 0.9 0.6 0.7 0.5 0.7 0.5 0.4 0.8 0.7February 0.9 1.2 0.7 0.7 0.7 0.8 0.9 1.2 1.3 1.0March 0.9 1.0 0.8 0.7 0.8 1.0 1.3 1.4 1.1 1.4April 1.0 1.0 1.2 1.4 1.0 1.1 1.0 0.9 0.5 2.4May 1.1 1.0 1.2 1.5 1.1 1.0 1.2 0.9 0.7 0.6June 1.2 1.0 1.2 1.3 1.3 1.1 1.3 1.1 2.0 1.4July 0.9 1.0 1.1 1.3 1.3 1.0 1.0 0.9 0.9 0.7August 1.3 1.0 1.2 1.1 1.3 1.1 0.8 1.1 1.0 1.3September 1.2 1.1 1.1 1.0 1.3 1.1 1.4 1.7 1.3 1.1October 1.1 1.0 1.1 1.1 1.1 1.1 1.2 0.9 1.1 0.3November 1.0 1.1 0.9 0.7 0.9 1.1 0.8 0.8 0.7 0.5December 0.7 0.8 0.9 0.7 0.7 1.0 0.8 0.7 0.7 0.5
Distributions by Vehicle Class
Growth Factor
Rate (%) Function4% Linear4% Linear4% Linear4% Linear4% Linear4% Linear4% Linear4% Linear4% Linear4% Linear
Vehicle ClassAADTT
Distribution (%) (Level 3)
Class 4 1.1%Class 5 37.3%Class 6 5.2%Class 7 2.4%Class 8 5.3%Class 9 46.9%Class 10 0.7%Class 11 0.6%Class 12 0.2%Class 13 0.3%
Truck Distribution by Hour
Hour Distribution (%)
12 AM 1.3%1 AM 1.1%2 AM 1%3 AM 1.1%4 AM 1.6%5 AM 2.7%6 AM 4.4%7 AM 5.7%8 AM 6.3%9 AM 6.4%10 AM 6.6%11 AM 6.8%
Hour Distribution (%)
12 PM 6.8%1 PM 6.8%2 PM 7%3 PM 6.8%4 PM 6.5%5 PM 5.4%6 PM 4.2%7 PM 3.2%8 PM 2.6%9 PM 2.2%10 PM 1.9%11 PM 1.6%Total 100%
Tabular Representation of Traffic Inputs
SR 11 RampsFile Name: C:\My ME Design\Projects\MK16-465 SE BV\170313 TP-App No 3\SR 11 Ramps.dgpx
Report generated on: 4/24/2017 2:24 PM Page 4 of 25
by: on: 10/10/2016 9:24 AM on: 10/10/2016 9:24 AM
by: Created Approved

AADTT (Average Annual Daily Truck Traffic) Growth* Traffic cap is not enforced
SR 11 RampsFile Name: C:\My ME Design\Projects\MK16-465 SE BV\170313 TP-App No 3\SR 11 Ramps.dgpx
Report generated on: 4/24/2017 2:24 PM Page 5 of 25
by: on: 10/10/2016 9:24 AM on: 10/10/2016 9:24 AM
by: Created Approved

Climate Inputs
Climate Data Sources:
Climate Station Cities: Location (lat lon elevation(ft))39.14400 -86.61700 842BLOOMINGTON, IN
39.71000 -86.27200 790INDIANAPOLIS, INLOUISVILLE, KY 38.22800 -85.66400 517
Monthly Climate Summary:
Annual Statistics:
Mean annual air temperature (ºF) 54.41Mean annual precipitation (in.) 42.59Freezing index (ºF - days) 409.02Average annual number of freeze/thaw cycles: 61.76 Water table depth
(ft)5.00
SR 11 RampsFile Name: C:\My ME Design\Projects\MK16-465 SE BV\170313 TP-App No 3\SR 11 Ramps.dgpx
Report generated on: 4/24/2017 2:24 PM Page 6 of 25
by: on: 10/10/2016 9:24 AM on: 10/10/2016 9:24 AM
by: Created Approved

< -13º F
Hourly Air Temperature Distribution by Month:
-13º F to -4º F -4º F to 5º F 5º F to 14º F 14º F to 23º F 23º F to 32º F 32º F to 41º F 41º F to 50º F
59º F to 68º F50º F to 59º F 68º F to 77º F 77º F to 86º F 86º F to 95º F 95º F to 104º F 104º F to 113º F
> 113º F
SR 11 RampsFile Name: C:\My ME Design\Projects\MK16-465 SE BV\170313 TP-App No 3\SR 11 Ramps.dgpx
Report generated on: 4/24/2017 2:24 PM Page 7 of 25
by: on: 10/10/2016 9:24 AM on: 10/10/2016 9:24 AM
by: Created Approved

HMA Design Properties
Layer Name Layer Type Interface Friction
Layer 1 Flexible : Seymour 9.5mm PG70-22 Flexible (1) 1.00
Layer 2 Flexible : Existing HMA Flexible (1) 1.00Layer 3 PCC : JPCP Default PCC (0) 1.00Layer 4 Subgrade : A-4 Subgrade (5) 1.00Layer 5 Subgrade : A-4 Subgrade (5) -
Use Multilayer Rutting Model FalseUsing G* based model (not nationally calibrated) False
Is NCHRP 1-37A HMA Rutting Model Coefficients True
Endurance Limit - Use Reflective Cracking True
JPCP Design Properties
PCC-Base Contact FrictionPCC-Base full friction contact TrueMonths until friction loss 600.00
Structure - ICM PropertiesPCC surface shortwave absorptivity 0.85
Erodibility index 2
Widened SlabIs slab widened ? FalseSlab width (ft) 12.00
PCC joint spacing (ft)Is joint spacing random ? FalseJoint spacing (ft) 18.00
Sealant type Preformed
Doweled JointsIs joint doweled ? TrueDowel diameter (in.) 1.00Dowel spacing (in.) 12.00
Permanent curl/warp effective temperature difference (ºF) -10.00
Tied ShouldersTied shoulders FalseLoad transfer efficiency (%) -
Design Properties
JPCP Rehabilitation Properties
Modulus Subgrade ReactionIs modulus of subgrade reaction measured? FalseMonth modulus of subgrade reaction measured - Dynamic modulus of subgrade reaction (psi/in.) -
Slabs distressed/replaced before restoration (%) 0.00Slabs repaired/replaced after restoration (%) 0.00
SR 11 RampsFile Name: C:\My ME Design\Projects\MK16-465 SE BV\170313 TP-App No 3\SR 11 Ramps.dgpx
Report generated on: 4/24/2017 2:24 PM Page 8 of 25
by: on: 10/10/2016 9:24 AM on: 10/10/2016 9:24 AM
by: Created Approved

Thermal Cracking (Input Level: 3)
Indirect tensile strength at 14 ºF (psi) 444.45Creep Compliance (1/psi)
Loading time (sec) -4 ºF1 5.31e-0071 7.97e-0072 5.86e-0072 9.35e-0075 6.68e-0075 1.15e-00610 7.38e-007
-4 ºF5.31e-0071.10e-0065.86e-0071.42e-0066.68e-0071.98e-0067.38e-007
14 ºF7.97e-0071.10e-0069.35e-0071.42e-0061.15e-0061.98e-0061.35e-006
Thermal ContractionIs thermal contraction calculated? True
Mix coefficient of thermal contraction (in./in./ºF) - Aggregate coefficient of thermal contraction (in./in./ºF) 6.1e-006
Voids in Mineral Aggregate (%) 19.6
SR 11 RampsFile Name: C:\My ME Design\Projects\MK16-465 SE BV\170313 TP-App No 3\SR 11 Ramps.dgpx
Report generated on: 4/24/2017 2:24 PM Page 9 of 25
by: on: 10/10/2016 9:24 AM on: 10/10/2016 9:24 AM
by: Created Approved
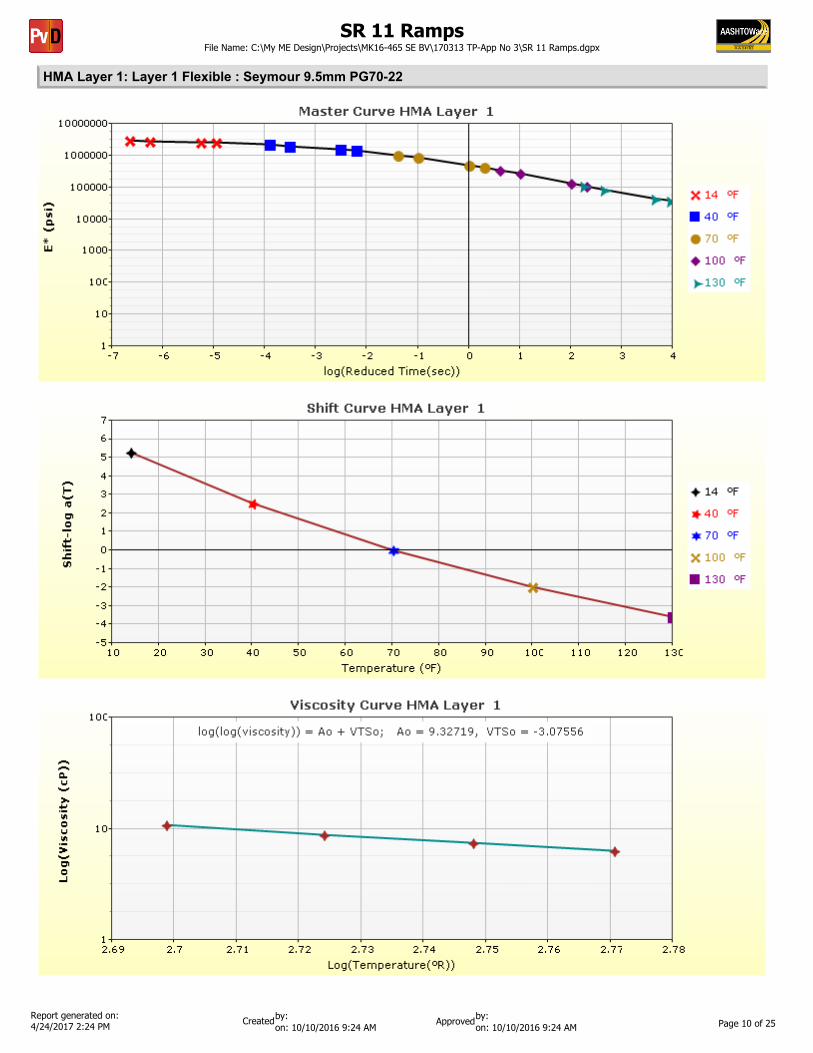
HMA Layer 1: Layer 1 Flexible : Seymour 9.5mm PG70-22
SR 11 RampsFile Name: C:\My ME Design\Projects\MK16-465 SE BV\170313 TP-App No 3\SR 11 Ramps.dgpx
Report generated on: 4/24/2017 2:24 PM Page 10 of 25
by: on: 10/10/2016 9:24 AM on: 10/10/2016 9:24 AM
by: Created Approved

HMA Layer 2: Layer 2 Flexible : Existing HMA
SR 11 RampsFile Name: C:\My ME Design\Projects\MK16-465 SE BV\170313 TP-App No 3\SR 11 Ramps.dgpx
Report generated on: 4/24/2017 2:24 PM Page 11 of 25
by: on: 10/10/2016 9:24 AM on: 10/10/2016 9:24 AM
by: Created Approved

Analysis Output Charts
SR 11 RampsFile Name: C:\My ME Design\Projects\MK16-465 SE BV\170313 TP-App No 3\SR 11 Ramps.dgpx
Report generated on: 4/24/2017 2:24 PM Page 12 of 25
by: on: 10/10/2016 9:24 AM on: 10/10/2016 9:24 AM
by: Created Approved

SR 11 RampsFile Name: C:\My ME Design\Projects\MK16-465 SE BV\170313 TP-App No 3\SR 11 Ramps.dgpx
Report generated on: 4/24/2017 2:24 PM Page 13 of 25
by: on: 10/10/2016 9:24 AM on: 10/10/2016 9:24 AM
by: Created Approved

SR 11 RampsFile Name: C:\My ME Design\Projects\MK16-465 SE BV\170313 TP-App No 3\SR 11 Ramps.dgpx
Report generated on: 4/24/2017 2:24 PM Page 14 of 25
by: on: 10/10/2016 9:24 AM on: 10/10/2016 9:24 AM
by: Created Approved

SR 11 RampsFile Name: C:\My ME Design\Projects\MK16-465 SE BV\170313 TP-App No 3\SR 11 Ramps.dgpx
Report generated on: 4/24/2017 2:24 PM Page 15 of 25
by: on: 10/10/2016 9:24 AM on: 10/10/2016 9:24 AM
by: Created Approved

SR 11 RampsFile Name: C:\My ME Design\Projects\MK16-465 SE BV\170313 TP-App No 3\SR 11 Ramps.dgpx
Report generated on: 4/24/2017 2:24 PM Page 16 of 25
by: on: 10/10/2016 9:24 AM on: 10/10/2016 9:24 AM
by: Created Approved

SR 11 RampsFile Name: C:\My ME Design\Projects\MK16-465 SE BV\170313 TP-App No 3\SR 11 Ramps.dgpx
Report generated on: 4/24/2017 2:24 PM Page 17 of 25
by: on: 10/10/2016 9:24 AM on: 10/10/2016 9:24 AM
by: Created Approved

Layer InformationLayer 1 Flexible : Seymour 9.5mm PG70-22
Asphalt Binder
Temperature (ºF) Binder Gstar (Pa) Phase angle (deg)40 22069340.66 33.7655 9518271.99 44.3970 2836317.75 52.8785 765738.66 59.68100 209102.28 65.17115 60602.87 69.62130 19021.84 73.24
T ( ºF) 0.1 Hz10 193254640 150767670 262246100 55053130 24989
25 Hz32981952093353882731323256131550
1 Hz2355005169177748801212397346973
10 Hz2642382186407973333224664196996
Asphalt Dynamic Modulus (Input Level: 1)
AsphaltThickness (in.) 1.5Unit weight (pcf) 142.6Poisson's ratio Is Calculated? False
Ratio 0.35Parameter A - Parameter B -
General Info
Name ValueReference temperature (ºF) 70Effective binder content (%) 11.61Air voids (%) 8Thermal conductivity (BTU/hr-ft-ºF) 0.63Heat capacity (BTU/lb-ºF) 0.31
Field ValueDisplay name/identifier Seymour 9.5mm PG70-22
Description of object HMA
AuthorDate Created 1/1/2011 12:00:00 AMApproverDate approved 1/1/2011 12:00:00 AMStateDistrictCountyHighwayDirection of TravelFrom station (miles)To station (miles)ProvinceUser defined field 2User defined field 3Revision Number 0
Identifiers
SR 11 RampsFile Name: C:\My ME Design\Projects\MK16-465 SE BV\170313 TP-App No 3\SR 11 Ramps.dgpx
Report generated on: 4/24/2017 2:24 PM Page 18 of 25
by: on: 10/10/2016 9:24 AM on: 10/10/2016 9:24 AM
by: Created Approved

Layer 2 Flexible : Existing HMA
Parameter ValueGrade Viscosity GradeBinder Type AC 20A 10.7709VTS -3.6017
Asphalt Binder
Gradation Percent Passing3/4-inch sieve 973/8-inch sieve 69No.4 sieve 43No.200 sieve 2
Asphalt Dynamic Modulus (Input Level: 3)
AsphaltThickness (in.) 2.5Unit weight (pcf) 143.8Poisson's ratio Is Calculated? False
Ratio 0.35Parameter A - Parameter B -
General Info
Name ValueReference temperature (ºF) 70Effective binder content (%) 10Air voids (%) 6Thermal conductivity (BTU/hr-ft-ºF) 0.63Heat capacity (BTU/lb-ºF) 0.31
Field ValueDisplay name/identifier Existing HMA
Description of object Existing HMA
AuthorDate Created 1/1/2011 12:00:00 AMApproverDate approved 1/1/2011 12:00:00 AMStateDistrictCountyHighwayDirection of TravelFrom station (miles)To station (miles)ProvinceUser defined field 2User defined field 3Revision Number 0
Identifiers
SR 11 RampsFile Name: C:\My ME Design\Projects\MK16-465 SE BV\170313 TP-App No 3\SR 11 Ramps.dgpx
Report generated on: 4/24/2017 2:24 PM Page 19 of 25
by: on: 10/10/2016 9:24 AM on: 10/10/2016 9:24 AM
by: Created Approved

Layer 3 PCC : JPCP Default
PCCThickness (in.) 8.0Unit weight (pcf) 150.0Poisson's ratio 0.2
MixCement type Type I (1)Cementitious material content (lb/yd^3) 600Water to cement ratio 0.42Aggregate type Dolomite (2)PCC zero-stress temperature (ºF)
Calculated Internally? TrueUser Value - Calculated Value 108.5
Ultimate shrinkage (microstrain)
Calculated Internally? TrueUser Value - Calculated Value 632.3
Reversible shrinkage (%) 50Time to develop 50% of ultimate shrinkage (days) 35
Curing method Curing Compound
Field ValueDisplay name/identifier JPCP Default
Description of object
AuthorDate Created 4/24/2017 2:12:27 PMApproverDate approved 4/24/2017 2:12:27 PMStateDistrictCountyHighwayDirection of TravelFrom station (miles)To station (miles)ProvinceUser defined field 2User defined field 3Revision Number 0
Identifiers
28-Day PCC modulus of rupture (psi) 690.028-Day PCC elastic modulus (psi) -
PCC strength and modulus (Input Level: 3)
ThermalPCC coefficient of thermal expansion (in./in./ºF x 10^-6) 5.5
PCC thermal conductivity (BTU/hr-ft-ºF) 1.25PCC heat capacity (BTU/lb-ºF) 0.28
SR 11 RampsFile Name: C:\My ME Design\Projects\MK16-465 SE BV\170313 TP-App No 3\SR 11 Ramps.dgpx
Report generated on: 4/24/2017 2:24 PM Page 20 of 25
by: on: 10/10/2016 9:24 AM on: 10/10/2016 9:24 AM
by: Created Approved

Layer 4 Subgrade : A-4
Liquid LimitPlasticity Index 5.0
21.0
Sieve Size % Passing0.001mm0.002mm0.020mm#200 60.6#100#80 73.9#60#50#40 82.7#30#20#16#10 89.9#8#4 93.03/8-in. 95.61/2-in. 96.73/4-in. 98.01-in. 98.71 1/2-in. 99.42-in. 99.62 1/2-in.3-in.3 1/2-in. 99.8
Is User Defined? Falseaf 68.8377bf 0.9983cf 0.4757hr 500.0000
Sieve
Is User Defined? Value
Maximum dry unit weight (pcf) False 119
Saturated hydraulic conductivity (ft/hr) False 7.589e-06
Specific gravity of solids False 2.7Optimum gravimetric water content (%) False 11.8
User-defined Soil Water Characteristic Curve (SWCC)
TrueIs layer compacted?
UnboundLayer thickness (in.) 14.0Poisson's ratio 0.35Coefficient of lateral earth pressure (k0) 0.5
Resilient Modulus (psi)4000.0
Modulus (Input Level: 2)
Analysis Type: Annual representative valuesMethod: Resilient Modulus (psi)
Use Correction factor for NDT modulus? - NDT Correction Factor: -
Field ValueDisplay name/identifier A-4
Description of object Default material
Author AASHTODate Created 1/1/2011 12:00:00 AMApproverDate approved 1/1/2011 12:00:00 AMStateDistrictCountyHighwayDirection of TravelFrom station (miles)To station (miles)ProvinceUser defined field 2User defined field 3Revision Number 0
Identifiers
SR 11 RampsFile Name: C:\My ME Design\Projects\MK16-465 SE BV\170313 TP-App No 3\SR 11 Ramps.dgpx
Report generated on: 4/24/2017 2:24 PM Page 21 of 25
by: on: 10/10/2016 9:24 AM on: 10/10/2016 9:24 AM
by: Created Approved

Layer 5 Subgrade : A-4
Liquid LimitPlasticity Index 5.0
21.0
Sieve Size % Passing0.001mm0.002mm0.020mm#200 60.6#100#80 73.9#60#50#40 82.7#30#20#16#10 89.9#8#4 93.03/8-in. 95.61/2-in. 96.73/4-in. 98.01-in. 98.71 1/2-in. 99.42-in. 99.62 1/2-in.3-in.3 1/2-in. 99.8
Is User Defined? Falseaf 68.8377bf 0.9983cf 0.4757hr 500.0000
Sieve
Is User Defined? Value
Maximum dry unit weight (pcf) False 118.4
Saturated hydraulic conductivity (ft/hr) False 8.325e-06
Specific gravity of solids False 2.7Optimum gravimetric water content (%) False 11.8
User-defined Soil Water Characteristic Curve (SWCC)
FalseIs layer compacted?
UnboundLayer thickness (in.) Semi-infinitePoisson's ratio 0.35Coefficient of lateral earth pressure (k0) 0.5
Resilient Modulus (psi)4000.0
Modulus (Input Level: 2)
Analysis Type: Annual representative valuesMethod: Resilient Modulus (psi)
Use Correction factor for NDT modulus? - NDT Correction Factor: -
Field ValueDisplay name/identifier A-4
Description of object Default material
Author AASHTODate Created 1/1/2011 12:00:00 AMApproverDate approved 1/1/2011 12:00:00 AMStateDistrictCountyHighwayDirection of TravelFrom station (miles)To station (miles)ProvinceUser defined field 2User defined field 3Revision Number 0
Identifiers
SR 11 RampsFile Name: C:\My ME Design\Projects\MK16-465 SE BV\170313 TP-App No 3\SR 11 Ramps.dgpx
Report generated on: 4/24/2017 2:24 PM Page 22 of 25
by: on: 10/10/2016 9:24 AM on: 10/10/2016 9:24 AM
by: Created Approved
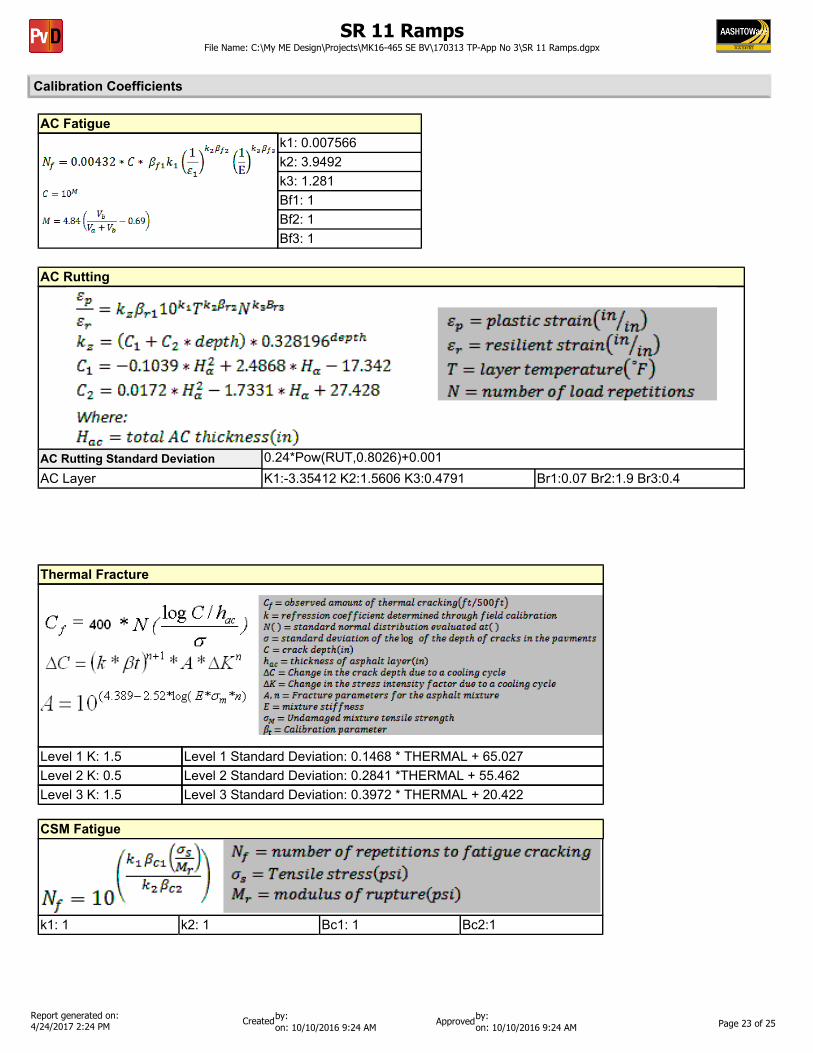
Calibration Coefficients
k1: 0.007566k2: 3.9492k3: 1.281Bf1: 1Bf2: 1Bf3: 1
AC Fatigue
AC Layer K1:-3.35412 K2:1.5606 K3:0.4791 Br1:0.07 Br2:1.9 Br3:0.40.24*Pow(RUT,0.8026)+0.001
AC Rutting
AC Rutting Standard Deviation
Level 1 K: 1.5Level 2 K: 0.5Level 3 K: 1.5
Level 1 Standard Deviation: 0.1468 * THERMAL + 65.027Level 2 Standard Deviation: 0.2841 *THERMAL + 55.462 Level 3 Standard Deviation: 0.3972 * THERMAL + 20.422
Thermal Fracture
k1: 1 k2: 1 Bc1: 1 Bc2:1
CSM Fatigue
SR 11 RampsFile Name: C:\My ME Design\Projects\MK16-465 SE BV\170313 TP-App No 3\SR 11 Ramps.dgpx
Report generated on: 4/24/2017 2:24 PM Page 23 of 25
by: on: 10/10/2016 9:24 AM on: 10/10/2016 9:24 AM
by: Created Approved

Subgrade Rutting
Granular Finek1: 2.03 Bs1: 1 k1: 1.35 Bs1: 0.12Standard Deviation (BASERUT)0.1477*Pow(BASERUT,0.6711)+0.001
Standard Deviation (BASERUT)0.1235*Pow(SUBRUT,0.5012)+0.001
c1: 7 c2: 3.5
200 + 2300/(1+exp(1.072-2.1654*LOG10(TOP+0.0001)))
AC Cracking
1.13+13/(1+exp(7.57-15.5*LOG10(BOTTOM+0.0001)))
AC Top Down Cracking AC Bottom Up Cracking
c3: 0 c4: 1000 c3: 6000c2: 1c1: 1AC Cracking Top Standard Deviation AC Cracking Bottom Standard Deviation
C1: 1 C2: 1
CSM Cracking
C4: 1000C3: 0
CTB*11CSM Standard Deviation
IRI Flexible over PCC
C3: 0.0014 C4: 0.00825C1: 40.8 C2: 0.575
PCC CrackingCracking Coefficients
C1: 2 C2: 1.22 C5: -1.98C4: 1
Pow(5.3116*CRACK,0.3903) + 2.99PCC Reliability Cracking Standard Deviation
Fatigue Coefficients
SR 11 RampsFile Name: C:\My ME Design\Projects\MK16-465 SE BV\170313 TP-App No 3\SR 11 Ramps.dgpx
Report generated on: 4/24/2017 2:24 PM Page 24 of 25
by: on: 10/10/2016 9:24 AM on: 10/10/2016 9:24 AM
by: Created Approved

C: 1 D: 1
Reflective Cracking
SR 11 RampsFile Name: C:\My ME Design\Projects\MK16-465 SE BV\170313 TP-App No 3\SR 11 Ramps.dgpx
Report generated on: 4/24/2017 2:24 PM Page 25 of 25
by: on: 10/10/2016 9:24 AM on: 10/10/2016 9:24 AM
by: Created Approved
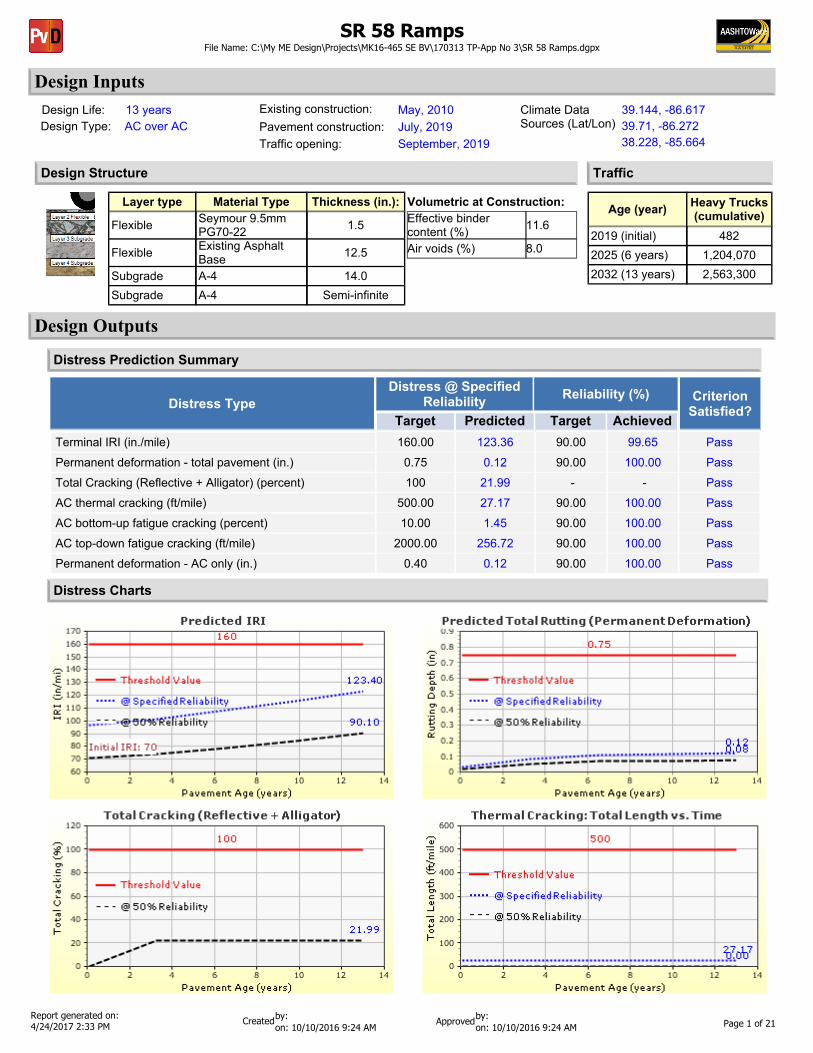
Design Inputs
Age (year) Heavy Trucks (cumulative)
2019 (initial) 4822025 (6 years) 1,204,0702032 (13 years) 2,563,300
TrafficDesign Structure
Layer type Material Type Thickness (in.):
Flexible Seymour 9.5mm PG70-22 1.5
Flexible Existing Asphalt Base 12.5
Subgrade A-4 14.0Subgrade A-4 Semi-infinite
Volumetric at Construction:Effective binder content (%) 11.6
Air voids (%) 8.0
Distress TypeDistress @ Specified
Reliability Reliability (%) Criterion Satisfied?
Target Predicted Target AchievedTerminal IRI (in./mile) 160.00 123.36 90.00 99.65 Pass
Permanent deformation - total pavement (in.) 0.75 0.12 90.00 100.00 Pass
Total Cracking (Reflective + Alligator) (percent) 100 21.99 - - Pass
AC thermal cracking (ft/mile) 500.00 27.17 90.00 100.00 Pass
AC bottom-up fatigue cracking (percent) 10.00 1.45 90.00 100.00 Pass
AC top-down fatigue cracking (ft/mile) 2000.00 256.72 90.00 100.00 Pass
Permanent deformation - AC only (in.) 0.40 0.12 90.00 100.00 Pass
Distress Prediction Summary
Distress Charts
AC over ACDesign Type:13 yearsDesign Life:
September, 2019Traffic opening:Pavement construction: July, 2019
May, 2010Existing construction: Climate Data Sources (Lat/Lon)
39.144, -86.61739.71, -86.27238.228, -85.664
Design Outputs
SR 58 RampsFile Name: C:\My ME Design\Projects\MK16-465 SE BV\170313 TP-App No 3\SR 58 Ramps.dgpx
Report generated on: 4/24/2017 2:33 PM Page 1 of 21
by: on: 10/10/2016 9:24 AM on: 10/10/2016 9:24 AM
by: Created Approved

Traffic Volume Monthly Adjustment Factors
Class 4 Class 5 Class 6 Class 7 Class 8 Class 9 Class 10 Class 11 Class 12 Class 13
Graphical Representation of Traffic Inputs
Traffic Inputs
Operational speed (mph) 55.0
Percent of trucks in design direction (%): 100.0100.01 Percent of trucks in design lane (%):Number of lanes in design direction:
482Initial two-way AADTT:
SR 58 RampsFile Name: C:\My ME Design\Projects\MK16-465 SE BV\170313 TP-App No 3\SR 58 Ramps.dgpx
Report generated on: 4/24/2017 2:33 PM Page 2 of 21
by: on: 10/10/2016 9:24 AM on: 10/10/2016 9:24 AM
by: Created Approved

Traffic WanderMean wheel location (in.)
Traffic wander standard deviation (in.)Design lane width (ft)
18
1012
Axle ConfigurationAverage axle width (ft) 8.5
Dual tire spacing (in.)Tire pressure (psi)
12120
Average Axle SpacingTandem axle spacing (in.)Tridem axle spacing (in.)Quad axle spacing (in.)
51.6
49.2
49.2
Wheelbase does not apply
Number of Axles per Truck
Vehicle Class
Single Axle
Tandem Axle
Tridem Axle
Quad Axle
Class 4 1.7 0.29 0 0Class 5 2 0 0 0Class 6 1 1 0 0Class 7 1.18 0.18 0.63 0.18Class 8 2.21 0.78 0 0Class 9 1.48 1.75 0 0
Class 10 1.08 0.99 0.94 0.03Class 11 4.43 0.03 0.16 0Class 12 3.29 1.09 0.17 0Class 13 2.7 1.22 0.43 0.24
Axle Configuration
Volume Monthly Adjustment Factors Level 3: Default MAF
Month Vehicle Class4 5 6 7 8 9 10 11 12 13
January 0.7 0.9 0.6 0.7 0.5 0.7 0.5 0.4 0.8 0.7February 0.9 1.2 0.7 0.7 0.7 0.8 0.9 1.2 1.3 1.0March 0.9 1.0 0.8 0.7 0.8 1.0 1.3 1.4 1.1 1.4April 1.0 1.0 1.2 1.4 1.0 1.1 1.0 0.9 0.5 2.4May 1.1 1.0 1.2 1.5 1.1 1.0 1.2 0.9 0.7 0.6June 1.2 1.0 1.2 1.3 1.3 1.1 1.3 1.1 2.0 1.4July 0.9 1.0 1.1 1.3 1.3 1.0 1.0 0.9 0.9 0.7August 1.3 1.0 1.2 1.1 1.3 1.1 0.8 1.1 1.0 1.3September 1.2 1.1 1.1 1.0 1.3 1.1 1.4 1.7 1.3 1.1October 1.1 1.0 1.1 1.1 1.1 1.1 1.2 0.9 1.1 0.3November 1.0 1.1 0.9 0.7 0.9 1.1 0.8 0.8 0.7 0.5December 0.7 0.8 0.9 0.7 0.7 1.0 0.8 0.7 0.7 0.5
Distributions by Vehicle Class
Growth Factor
Rate (%) Function2% Linear2% Linear2% Linear2% Linear2% Linear2% Linear2% Linear2% Linear2% Linear2% Linear
Vehicle ClassAADTT
Distribution (%) (Level 3)
Class 4 1.1%Class 5 37.3%Class 6 5.2%Class 7 2.4%Class 8 5.3%Class 9 46.9%Class 10 0.7%Class 11 0.6%Class 12 0.2%Class 13 0.3%
Truck Distribution by Hour does not apply
Tabular Representation of Traffic Inputs
SR 58 RampsFile Name: C:\My ME Design\Projects\MK16-465 SE BV\170313 TP-App No 3\SR 58 Ramps.dgpx
Report generated on: 4/24/2017 2:33 PM Page 3 of 21
by: on: 10/10/2016 9:24 AM on: 10/10/2016 9:24 AM
by: Created Approved

AADTT (Average Annual Daily Truck Traffic) Growth* Traffic cap is not enforced
SR 58 RampsFile Name: C:\My ME Design\Projects\MK16-465 SE BV\170313 TP-App No 3\SR 58 Ramps.dgpx
Report generated on: 4/24/2017 2:33 PM Page 4 of 21
by: on: 10/10/2016 9:24 AM on: 10/10/2016 9:24 AM
by: Created Approved

Climate Inputs
Climate Data Sources:
Climate Station Cities: Location (lat lon elevation(ft))39.14400 -86.61700 842BLOOMINGTON, IN
39.71000 -86.27200 790INDIANAPOLIS, INLOUISVILLE, KY 38.22800 -85.66400 517
Monthly Climate Summary:
Annual Statistics:
Mean annual air temperature (ºF) 54.41Mean annual precipitation (in.) 42.59Freezing index (ºF - days) 409.02Average annual number of freeze/thaw cycles: 61.76 Water table depth
(ft)5.00
SR 58 RampsFile Name: C:\My ME Design\Projects\MK16-465 SE BV\170313 TP-App No 3\SR 58 Ramps.dgpx
Report generated on: 4/24/2017 2:33 PM Page 5 of 21
by: on: 10/10/2016 9:24 AM on: 10/10/2016 9:24 AM
by: Created Approved

< -13º F
Hourly Air Temperature Distribution by Month:
-13º F to -4º F -4º F to 5º F 5º F to 14º F 14º F to 23º F 23º F to 32º F 32º F to 41º F 41º F to 50º F
59º F to 68º F50º F to 59º F 68º F to 77º F 77º F to 86º F 86º F to 95º F 95º F to 104º F 104º F to 113º F
> 113º F
SR 58 RampsFile Name: C:\My ME Design\Projects\MK16-465 SE BV\170313 TP-App No 3\SR 58 Ramps.dgpx
Report generated on: 4/24/2017 2:33 PM Page 6 of 21
by: on: 10/10/2016 9:24 AM on: 10/10/2016 9:24 AM
by: Created Approved

HMA Design Properties
HMA Rehabilitation (Input Level: 3)
Milled thickness (in.) - Fatigue cracking (%) - Pavement rating GoodTotal rut depth (in.) 0.10
Layer Name Layer Type Interface Friction
Layer 1 Flexible : Seymour 9.5mm PG70-22 Flexible (1) 1.00
Layer 2 Flexible : Existing Asphalt Base(existing) Flexible (1) 1.00
Layer 3 Subgrade : A-4 Subgrade (5) 1.00Layer 4 Subgrade : A-4 Subgrade (5) -
Use Multilayer Rutting Model FalseUsing G* based model (not nationally calibrated) False
Is NCHRP 1-37A HMA Rutting Model Coefficients True
Endurance Limit - Use Reflective Cracking True
Structure - ICM PropertiesAC surface shortwave absorptivity 0.85
Design Properties
SR 58 RampsFile Name: C:\My ME Design\Projects\MK16-465 SE BV\170313 TP-App No 3\SR 58 Ramps.dgpx
Report generated on: 4/24/2017 2:33 PM Page 7 of 21
by: on: 10/10/2016 9:24 AM on: 10/10/2016 9:24 AM
by: Created Approved

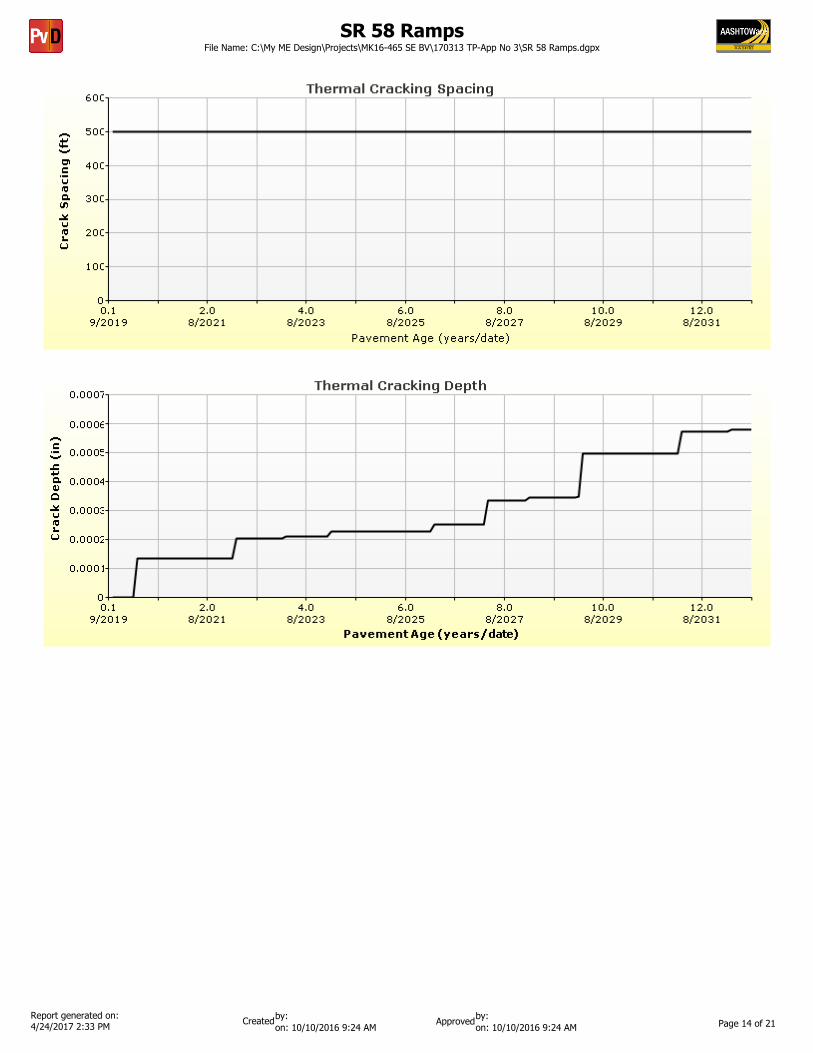
Thermal Cracking (Input Level: 3)
Indirect tensile strength at 14 ºF (psi) 444.45Creep Compliance (1/psi)
Loading time (sec) -4 ºF1 5.31e-0071 7.97e-0072 5.86e-0072 9.35e-0075 6.68e-0075 1.15e-00610 7.38e-007
-4 ºF5.31e-0071.10e-0065.86e-0071.42e-0066.68e-0071.98e-0067.38e-007
14 ºF7.97e-0071.10e-0069.35e-0071.42e-0061.15e-0061.98e-0061.35e-006
Thermal ContractionIs thermal contraction calculated? True
Mix coefficient of thermal contraction (in./in./ºF) - Aggregate coefficient of thermal contraction (in./in./ºF) 6.1e-006
Voids in Mineral Aggregate (%) 19.6
SR 58 RampsFile Name: C:\My ME Design\Projects\MK16-465 SE BV\170313 TP-App No 3\SR 58 Ramps.dgpx
Report generated on: 4/24/2017 2:33 PM Page 8 of 21
by: on: 10/10/2016 9:24 AM on: 10/10/2016 9:24 AM
by: Created Approved

HMA Layer 1: Layer 1 Flexible : Seymour 9.5mm PG70-22
SR 58 RampsFile Name: C:\My ME Design\Projects\MK16-465 SE BV\170313 TP-App No 3\SR 58 Ramps.dgpx
Report generated on: 4/24/2017 2:33 PM Page 9 of 21
by: on: 10/10/2016 9:24 AM on: 10/10/2016 9:24 AM
by: Created Approved
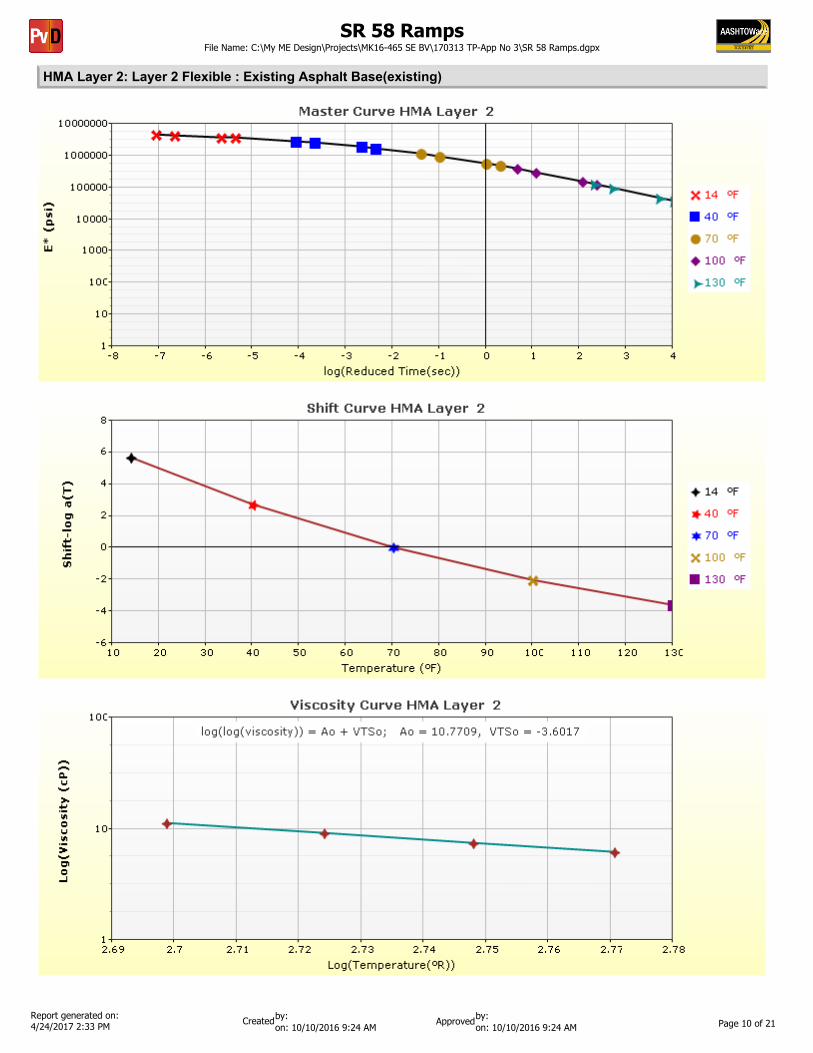
HMA Layer 2: Layer 2 Flexible : Existing Asphalt Base(existing)
SR 58 RampsFile Name: C:\My ME Design\Projects\MK16-465 SE BV\170313 TP-App No 3\SR 58 Ramps.dgpx
Report generated on: 4/24/2017 2:33 PM Page 10 of 21
by: on: 10/10/2016 9:24 AM on: 10/10/2016 9:24 AM
by: Created Approved

Analysis Output Charts
SR 58 RampsFile Name: C:\My ME Design\Projects\MK16-465 SE BV\170313 TP-App No 3\SR 58 Ramps.dgpx
Report generated on: 4/24/2017 2:33 PM Page 11 of 21
by: on: 10/10/2016 9:24 AM on: 10/10/2016 9:24 AM
by: Created Approved

SR 58 RampsFile Name: C:\My ME Design\Projects\MK16-465 SE BV\170313 TP-App No 3\SR 58 Ramps.dgpx
Report generated on: 4/24/2017 2:33 PM Page 12 of 21
by: on: 10/10/2016 9:24 AM on: 10/10/2016 9:24 AM
by: Created Approved

SR 58 RampsFile Name: C:\My ME Design\Projects\MK16-465 SE BV\170313 TP-App No 3\SR 58 Ramps.dgpx
Report generated on: 4/24/2017 2:33 PM Page 13 of 21
by: on: 10/10/2016 9:24 AM on: 10/10/2016 9:24 AM
by: Created Approved
SR 58 RampsFile Name: C:\My ME Design\Projects\MK16-465 SE BV\170313 TP-App No 3\SR 58 Ramps.dgpx
Report generated on: 4/24/2017 2:33 PM Page 14 of 21
by: on: 10/10/2016 9:24 AM on: 10/10/2016 9:24 AM
by: Created Approved

SR 58 RampsFile Name: C:\My ME Design\Projects\MK16-465 SE BV\170313 TP-App No 3\SR 58 Ramps.dgpx
Report generated on: 4/24/2017 2:33 PM Page 15 of 21
by: on: 10/10/2016 9:24 AM on: 10/10/2016 9:24 AM
by: Created Approved

Layer InformationLayer 1 Flexible : Seymour 9.5mm PG70-22
Asphalt Binder
Temperature (ºF) Binder Gstar (Pa) Phase angle (deg)40 22069340.66 33.7655 9518271.99 44.3970 2836317.75 52.8785 765738.66 59.68100 209102.28 65.17115 60602.87 69.62130 19021.84 73.24
T ( ºF) 0.1 Hz10 193254640 150767670 262246100 55053130 24989
25 Hz32981952093353882731323256131550
1 Hz2355005169177748801212397346973
10 Hz2642382186407973333224664196996
Asphalt Dynamic Modulus (Input Level: 1)
AsphaltThickness (in.) 1.5Unit weight (pcf) 142.6Poisson's ratio Is Calculated? False
Ratio 0.35Parameter A - Parameter B -
General Info
Name ValueReference temperature (ºF) 70Effective binder content (%) 11.61Air voids (%) 8Thermal conductivity (BTU/hr-ft-ºF) 0.63Heat capacity (BTU/lb-ºF) 0.31
Field ValueDisplay name/identifier Seymour 9.5mm PG70-22
Description of object HMA
AuthorDate Created 1/1/2011 12:00:00 AMApproverDate approved 1/1/2011 12:00:00 AMStateDistrictCountyHighwayDirection of TravelFrom station (miles)To station (miles)ProvinceUser defined field 2User defined field 3Revision Number 0
Identifiers
SR 58 RampsFile Name: C:\My ME Design\Projects\MK16-465 SE BV\170313 TP-App No 3\SR 58 Ramps.dgpx
Report generated on: 4/24/2017 2:33 PM Page 16 of 21
by: on: 10/10/2016 9:24 AM on: 10/10/2016 9:24 AM
by: Created Approved

Layer 2 Flexible : Existing Asphalt Base(existing)
Parameter ValueGrade Viscosity GradeBinder Type AC 20A 10.7709VTS -3.6017
Asphalt Binder
Gradation Percent Passing3/4-inch sieve 803/8-inch sieve 45No.4 sieve 35No.200 sieve 2
Asphalt Dynamic Modulus (Input Level: 3)
AsphaltThickness (in.) 12.5Unit weight (pcf) 144.4Poisson's ratio Is Calculated? False
Ratio 0.35Parameter A - Parameter B -
General Info
Name ValueReference temperature (ºF) 70Effective binder content (%) 9Air voids (%) 6Thermal conductivity (BTU/hr-ft-ºF) 0.63Heat capacity (BTU/lb-ºF) 0.31
Field ValueDisplay name/identifier Existing Asphalt Base
Description of object Existing HMA
AuthorDate Created 1/1/2011 12:00:00 AMApproverDate approved 1/1/2011 12:00:00 AMStateDistrictCountyHighwayDirection of TravelFrom station (miles)To station (miles)ProvinceUser defined field 2User defined field 3Revision Number 0
Identifiers
SR 58 RampsFile Name: C:\My ME Design\Projects\MK16-465 SE BV\170313 TP-App No 3\SR 58 Ramps.dgpx
Report generated on: 4/24/2017 2:33 PM Page 17 of 21
by: on: 10/10/2016 9:24 AM on: 10/10/2016 9:24 AM
by: Created Approved

Layer 3 Subgrade : A-4
Liquid LimitPlasticity Index 5.0
21.0
Sieve Size % Passing0.001mm0.002mm0.020mm#200 60.6#100#80 73.9#60#50#40 82.7#30#20#16#10 89.9#8#4 93.03/8-in. 95.61/2-in. 96.73/4-in. 98.01-in. 98.71 1/2-in. 99.42-in. 99.62 1/2-in.3-in.3 1/2-in. 99.8
Is User Defined? Falseaf 68.8377bf 0.9983cf 0.4757hr 500.0000
Sieve
Is User Defined? Value
Maximum dry unit weight (pcf) False 119
Saturated hydraulic conductivity (ft/hr) False 7.589e-06
Specific gravity of solids False 2.7Optimum gravimetric water content (%) False 11.8
User-defined Soil Water Characteristic Curve (SWCC)
TrueIs layer compacted?
UnboundLayer thickness (in.) 14.0Poisson's ratio 0.35Coefficient of lateral earth pressure (k0) 0.5
Resilient Modulus (psi)6000.0
Modulus (Input Level: 2)
Analysis Type: Annual representative valuesMethod: Resilient Modulus (psi)
Use Correction factor for NDT modulus? - NDT Correction Factor: -
Field ValueDisplay name/identifier A-4
Description of object Default material
Author AASHTODate Created 1/1/2011 12:00:00 AMApproverDate approved 1/1/2011 12:00:00 AMStateDistrictCountyHighwayDirection of TravelFrom station (miles)To station (miles)ProvinceUser defined field 2User defined field 3Revision Number 0
Identifiers
SR 58 RampsFile Name: C:\My ME Design\Projects\MK16-465 SE BV\170313 TP-App No 3\SR 58 Ramps.dgpx
Report generated on: 4/24/2017 2:33 PM Page 18 of 21
by: on: 10/10/2016 9:24 AM on: 10/10/2016 9:24 AM
by: Created Approved
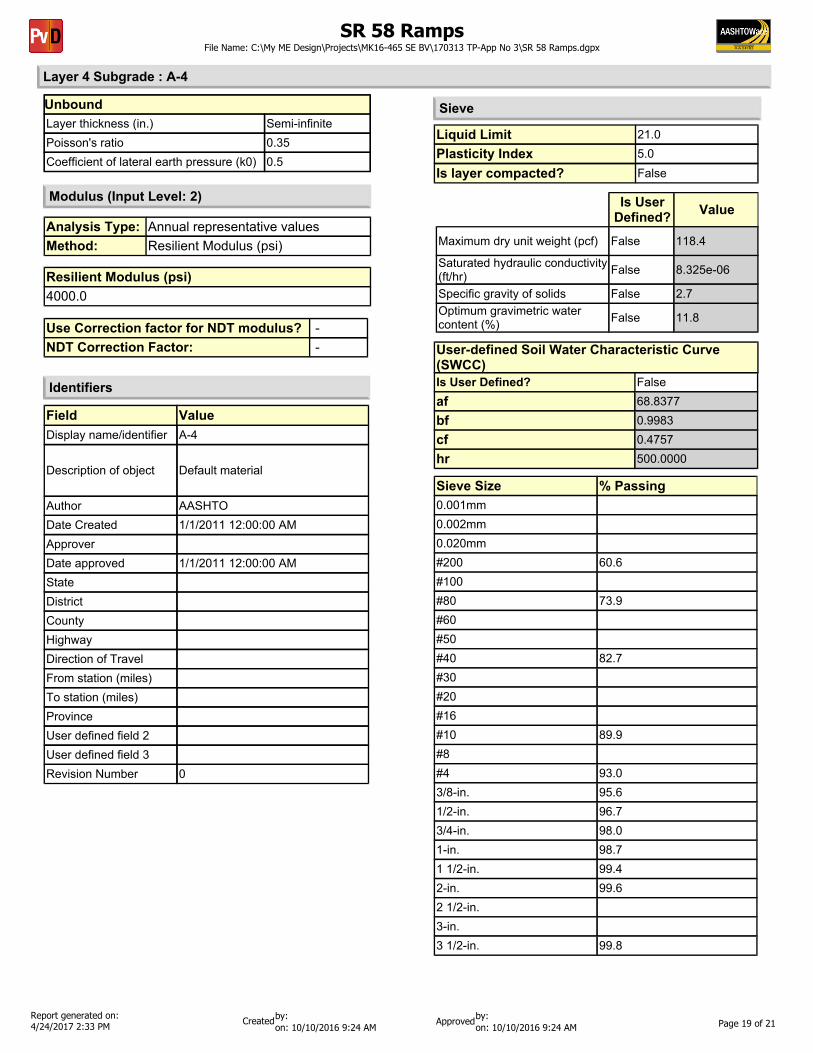
Layer 4 Subgrade : A-4
Liquid LimitPlasticity Index 5.0
21.0
Sieve Size % Passing0.001mm0.002mm0.020mm#200 60.6#100#80 73.9#60#50#40 82.7#30#20#16#10 89.9#8#4 93.03/8-in. 95.61/2-in. 96.73/4-in. 98.01-in. 98.71 1/2-in. 99.42-in. 99.62 1/2-in.3-in.3 1/2-in. 99.8
Is User Defined? Falseaf 68.8377bf 0.9983cf 0.4757hr 500.0000
Sieve
Is User Defined? Value
Maximum dry unit weight (pcf) False 118.4
Saturated hydraulic conductivity (ft/hr) False 8.325e-06
Specific gravity of solids False 2.7Optimum gravimetric water content (%) False 11.8
User-defined Soil Water Characteristic Curve (SWCC)
FalseIs layer compacted?
UnboundLayer thickness (in.) Semi-infinitePoisson's ratio 0.35Coefficient of lateral earth pressure (k0) 0.5
Resilient Modulus (psi)4000.0
Modulus (Input Level: 2)
Analysis Type: Annual representative valuesMethod: Resilient Modulus (psi)
Use Correction factor for NDT modulus? - NDT Correction Factor: -
Field ValueDisplay name/identifier A-4
Description of object Default material
Author AASHTODate Created 1/1/2011 12:00:00 AMApproverDate approved 1/1/2011 12:00:00 AMStateDistrictCountyHighwayDirection of TravelFrom station (miles)To station (miles)ProvinceUser defined field 2User defined field 3Revision Number 0
Identifiers
SR 58 RampsFile Name: C:\My ME Design\Projects\MK16-465 SE BV\170313 TP-App No 3\SR 58 Ramps.dgpx
Report generated on: 4/24/2017 2:33 PM Page 19 of 21
by: on: 10/10/2016 9:24 AM on: 10/10/2016 9:24 AM
by: Created Approved

Calibration Coefficients
k1: 0.007566k2: 3.9492k3: 1.281Bf1: 1Bf2: 1Bf3: 1
AC Fatigue
AC Layer K1:-3.35412 K2:1.5606 K3:0.4791 Br1:0.07 Br2:1.9 Br3:0.40.24*Pow(RUT,0.8026)+0.001
AC Rutting
AC Rutting Standard Deviation
Level 1 K: 1.5Level 2 K: 0.5Level 3 K: 1.5
Level 1 Standard Deviation: 0.1468 * THERMAL + 65.027Level 2 Standard Deviation: 0.2841 *THERMAL + 55.462 Level 3 Standard Deviation: 0.3972 * THERMAL + 20.422
Thermal Fracture
k1: 1 k2: 1 Bc1: 1 Bc2:1
CSM Fatigue
SR 58 RampsFile Name: C:\My ME Design\Projects\MK16-465 SE BV\170313 TP-App No 3\SR 58 Ramps.dgpx
Report generated on: 4/24/2017 2:33 PM Page 20 of 21
by: on: 10/10/2016 9:24 AM on: 10/10/2016 9:24 AM
by: Created Approved

Subgrade Rutting
Granular Finek1: 2.03 Bs1: 1 k1: 1.35 Bs1: 0.12Standard Deviation (BASERUT)0.1477*Pow(BASERUT,0.6711)+0.001
Standard Deviation (BASERUT)0.1235*Pow(SUBRUT,0.5012)+0.001
c1: 7 c2: 3.5
200 + 2300/(1+exp(1.072-2.1654*LOG10(TOP+0.0001)))
AC Cracking
1.13+13/(1+exp(7.57-15.5*LOG10(BOTTOM+0.0001)))
AC Top Down Cracking AC Bottom Up Cracking
c3: 0 c4: 1000 c3: 6000c2: 1c1: 1AC Cracking Top Standard Deviation AC Cracking Bottom Standard Deviation
C1: 1 C2: 1
CSM Cracking
C4: 1000C3: 0
CTB*11CSM Standard Deviation
IRI Flexible Pavements
C3: 0.008 C4: 0.015C1: 40 C2: 0.4
C: 1 D: 1
Reflective Cracking
SR 58 RampsFile Name: C:\My ME Design\Projects\MK16-465 SE BV\170313 TP-App No 3\SR 58 Ramps.dgpx
Report generated on: 4/24/2017 2:33 PM Page 21 of 21
by: on: 10/10/2016 9:24 AM on: 10/10/2016 9:24 AM
by: Created Approved

Design Inputs
Age (year) Heavy Trucks (cumulative)
2019 (initial) 5682029 (10 years) 1,196,7702039 (20 years) 2,655,690
TrafficDesign Structure
Layer type Material Type Thickness (in.):
Flexible Seymour 9.5mm PG70-22 1.5
Flexible Seymour 19.0mm PG70-22 3.0
Flexible Seymour 25.0mm PG64-22 5.5
Subgrade A-4 14.0Subgrade A-4 Semi-infinite
Volumetric at Construction:Effective binder content (%) 11.6
Air voids (%) 8.0
Distress TypeDistress @ Specified
Reliability Reliability (%) Criterion Satisfied?
Target Predicted Target AchievedTerminal IRI (in./mile) 200.00 132.13 75.00 99.79 Pass
Permanent deformation - total pavement (in.) 0.75 0.26 75.00 100.00 Pass
AC bottom-up fatigue cracking (percent) 35.00 1.96 75.00 100.00 Pass
AC thermal cracking (ft/mile) 500.00 14.77 75.00 100.00 Pass
AC top-down fatigue cracking (ft/mile) 2000.00 185.05 75.00 100.00 Pass
Permanent deformation - AC only (in.) 0.40 0.19 75.00 100.00 Pass
Distress Prediction Summary
Distress Charts
Flexible PavementDesign Type:20 yearsDesign Life:
September, 2019Traffic opening:Pavement construction: July, 2019
May, 2019Base construction: Climate Data Sources (Lat/Lon)
39.144, -86.61739.71, -86.27238.228, -85.664
Design Outputs
SR 58File Name: C:\My ME Design\Projects\MK16-465 SE BV\170313 TP-App No 3\SR 58.dgpx
Report generated on: 4/17/2017 2:16 PM Page 1 of 23
by: on: 10/10/2016 9:24 AM on: 10/10/2016 9:24 AM
by: Created Approved

Traffic Volume Monthly Adjustment Factors
Class 4 Class 5 Class 6 Class 7 Class 8 Class 9 Class 10 Class 11 Class 12 Class 13
Graphical Representation of Traffic Inputs
Traffic Inputs
Operational speed (mph) 45.0
Percent of trucks in design direction (%): 52.0100.01 Percent of trucks in design lane (%):Number of lanes in design direction:
568Initial two-way AADTT:
SR 58File Name: C:\My ME Design\Projects\MK16-465 SE BV\170313 TP-App No 3\SR 58.dgpx
Report generated on: 4/17/2017 2:16 PM Page 2 of 23
by: on: 10/10/2016 9:24 AM on: 10/10/2016 9:24 AM
by: Created Approved

Traffic WanderMean wheel location (in.)
Traffic wander standard deviation (in.)Design lane width (ft)
18
1012
Axle ConfigurationAverage axle width (ft) 8.5
Dual tire spacing (in.)Tire pressure (psi)
12120
Average Axle SpacingTandem axle spacing (in.)Tridem axle spacing (in.)Quad axle spacing (in.)
51.6
49.2
49.2
Wheelbase does not apply
Number of Axles per Truck
Vehicle Class
Single Axle
Tandem Axle
Tridem Axle
Quad Axle
Class 4 1.7 0.29 0 0Class 5 2 0 0 0Class 6 1 1 0 0Class 7 1.18 0.18 0.63 0.18Class 8 2.21 0.78 0 0Class 9 1.48 1.75 0 0
Class 10 1.08 0.99 0.94 0.03Class 11 4.43 0.03 0.16 0Class 12 3.29 1.09 0.17 0Class 13 2.7 1.22 0.43 0.24
Axle Configuration
Volume Monthly Adjustment Factors Level 3: Default MAF
Month Vehicle Class4 5 6 7 8 9 10 11 12 13
January 0.7 0.9 0.6 0.7 0.5 0.7 0.5 0.4 0.8 0.7February 0.9 1.2 0.7 0.7 0.7 0.8 0.9 1.2 1.3 1.0March 0.9 1.0 0.8 0.7 0.8 1.0 1.3 1.4 1.1 1.4April 1.0 1.0 1.2 1.4 1.0 1.1 1.0 0.9 0.5 2.4May 1.1 1.0 1.2 1.5 1.1 1.0 1.2 0.9 0.7 0.6June 1.2 1.0 1.2 1.3 1.3 1.1 1.3 1.1 2.0 1.4July 0.9 1.0 1.1 1.3 1.3 1.0 1.0 0.9 0.9 0.7August 1.3 1.0 1.2 1.1 1.3 1.1 0.8 1.1 1.0 1.3September 1.2 1.1 1.1 1.0 1.3 1.1 1.4 1.7 1.3 1.1October 1.1 1.0 1.1 1.1 1.1 1.1 1.2 0.9 1.1 0.3November 1.0 1.1 0.9 0.7 0.9 1.1 0.8 0.8 0.7 0.5December 0.7 0.8 0.9 0.7 0.7 1.0 0.8 0.7 0.7 0.5
Distributions by Vehicle Class
Growth Factor
Rate (%) Function2.43% Linear2.43% Linear2.43% Linear2.43% Linear2.43% Linear2.43% Linear2.43% Linear2.43% Linear2.43% Linear2.43% Linear
Vehicle ClassAADTT
Distribution (%) (Level 3)
Class 4 1.1%Class 5 37.3%Class 6 5.2%Class 7 2.4%Class 8 5.3%Class 9 46.9%Class 10 0.7%Class 11 0.6%Class 12 0.2%Class 13 0.3%
Truck Distribution by Hour does not apply
Tabular Representation of Traffic Inputs
SR 58File Name: C:\My ME Design\Projects\MK16-465 SE BV\170313 TP-App No 3\SR 58.dgpx
Report generated on: 4/17/2017 2:16 PM Page 3 of 23
by: on: 10/10/2016 9:24 AM on: 10/10/2016 9:24 AM
by: Created Approved
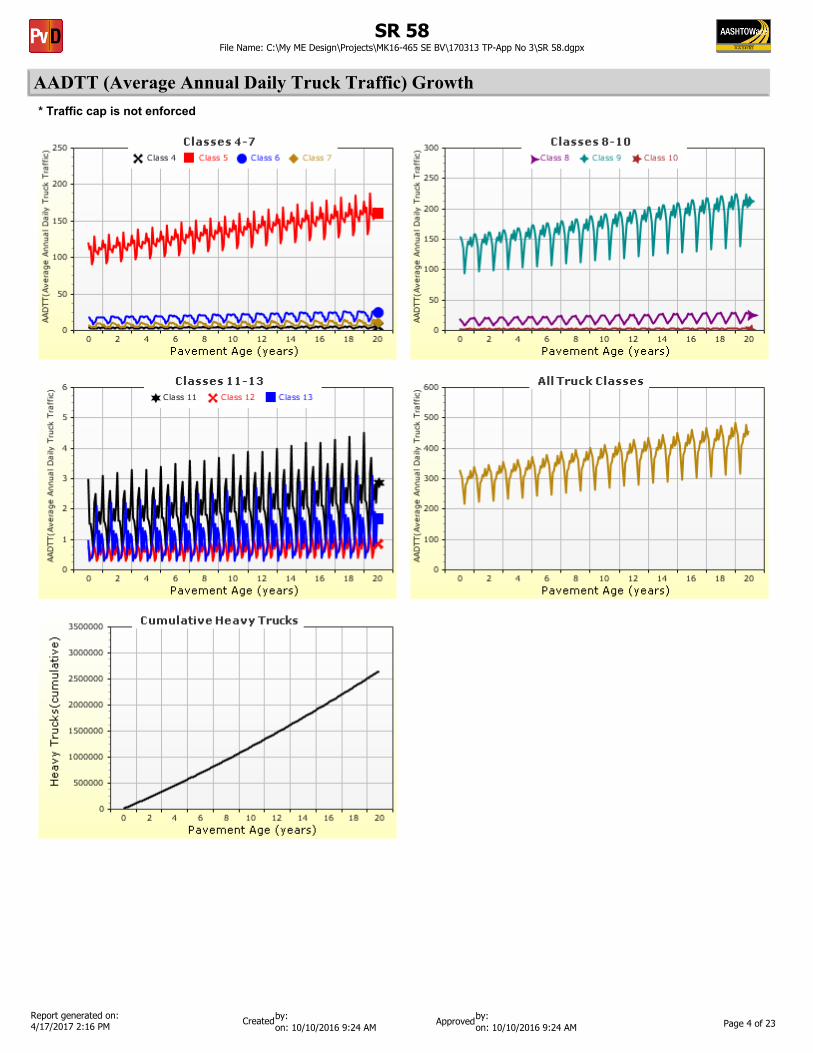
AADTT (Average Annual Daily Truck Traffic) Growth* Traffic cap is not enforced
SR 58File Name: C:\My ME Design\Projects\MK16-465 SE BV\170313 TP-App No 3\SR 58.dgpx
Report generated on: 4/17/2017 2:16 PM Page 4 of 23
by: on: 10/10/2016 9:24 AM on: 10/10/2016 9:24 AM
by: Created Approved

Climate Inputs
Climate Data Sources:
Climate Station Cities: Location (lat lon elevation(ft))39.14400 -86.61700 842BLOOMINGTON, IN
39.71000 -86.27200 790INDIANAPOLIS, INLOUISVILLE, KY 38.22800 -85.66400 517
Monthly Climate Summary:
Annual Statistics:
Mean annual air temperature (ºF) 54.34Mean annual precipitation (in.) 43.19Freezing index (ºF - days) 406.02Average annual number of freeze/thaw cycles: 60.23 Water table depth
(ft)5.00
SR 58File Name: C:\My ME Design\Projects\MK16-465 SE BV\170313 TP-App No 3\SR 58.dgpx
Report generated on: 4/17/2017 2:16 PM Page 5 of 23
by: on: 10/10/2016 9:24 AM on: 10/10/2016 9:24 AM
by: Created Approved

< -13º F
Hourly Air Temperature Distribution by Month:
-13º F to -4º F -4º F to 5º F 5º F to 14º F 14º F to 23º F 23º F to 32º F 32º F to 41º F 41º F to 50º F
59º F to 68º F50º F to 59º F 68º F to 77º F 77º F to 86º F 86º F to 95º F 95º F to 104º F 104º F to 113º F
> 113º F
SR 58File Name: C:\My ME Design\Projects\MK16-465 SE BV\170313 TP-App No 3\SR 58.dgpx
Report generated on: 4/17/2017 2:16 PM Page 6 of 23
by: on: 10/10/2016 9:24 AM on: 10/10/2016 9:24 AM
by: Created Approved
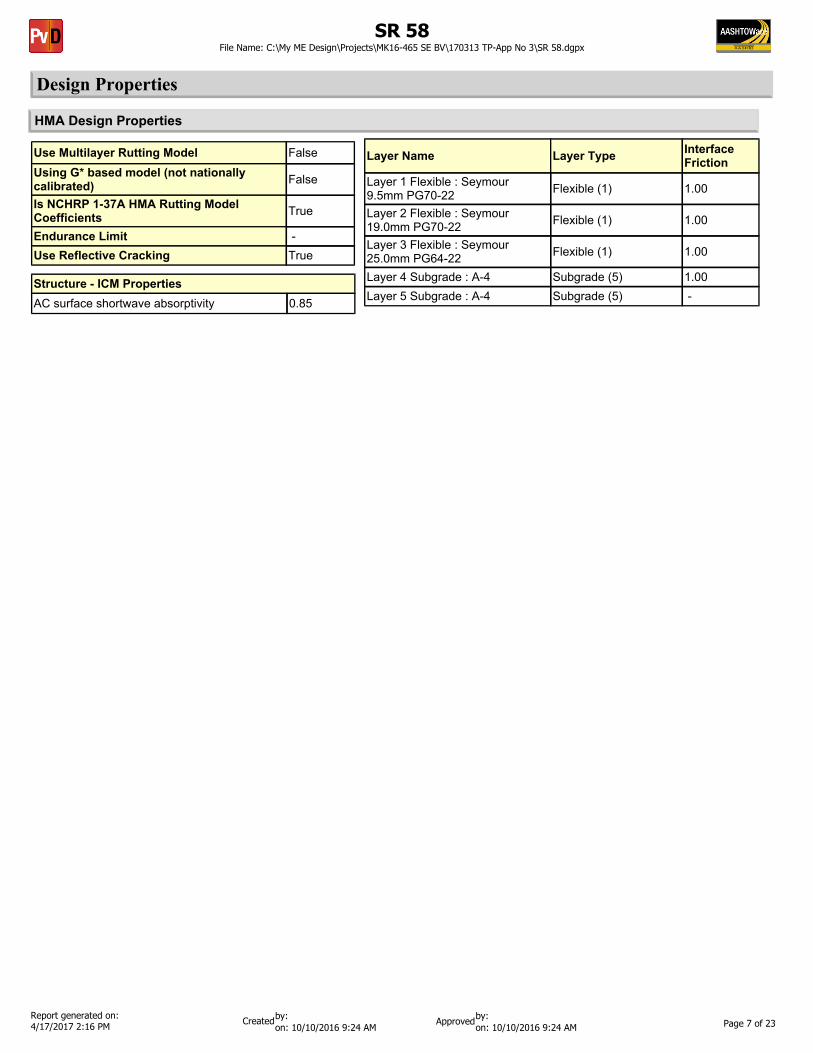
HMA Design Properties
Layer Name Layer Type Interface Friction
Layer 1 Flexible : Seymour 9.5mm PG70-22 Flexible (1) 1.00
Layer 2 Flexible : Seymour 19.0mm PG70-22 Flexible (1) 1.00
Layer 3 Flexible : Seymour 25.0mm PG64-22 Flexible (1) 1.00
Layer 4 Subgrade : A-4 Subgrade (5) 1.00Layer 5 Subgrade : A-4 Subgrade (5) -
Use Multilayer Rutting Model FalseUsing G* based model (not nationally calibrated) False
Is NCHRP 1-37A HMA Rutting Model Coefficients True
Endurance Limit - Use Reflective Cracking True
Structure - ICM PropertiesAC surface shortwave absorptivity 0.85
Design Properties
SR 58File Name: C:\My ME Design\Projects\MK16-465 SE BV\170313 TP-App No 3\SR 58.dgpx
Report generated on: 4/17/2017 2:16 PM Page 7 of 23
by: on: 10/10/2016 9:24 AM on: 10/10/2016 9:24 AM
by: Created Approved

Thermal Cracking (Input Level: 3)
Indirect tensile strength at 14 ºF (psi) 444.45Creep Compliance (1/psi)
Loading time (sec) -4 ºF1 5.31e-0071 7.97e-0072 5.86e-0072 9.35e-0075 6.68e-0075 1.15e-00610 7.38e-007
-4 ºF5.31e-0071.10e-0065.86e-0071.42e-0066.68e-0071.98e-0067.38e-007
14 ºF7.97e-0071.10e-0069.35e-0071.42e-0061.15e-0061.98e-0061.35e-006
Thermal ContractionIs thermal contraction calculated? True
Mix coefficient of thermal contraction (in./in./ºF) - Aggregate coefficient of thermal contraction (in./in./ºF) 6.1e-006
Voids in Mineral Aggregate (%) 19.6
SR 58File Name: C:\My ME Design\Projects\MK16-465 SE BV\170313 TP-App No 3\SR 58.dgpx
Report generated on: 4/17/2017 2:16 PM Page 8 of 23
by: on: 10/10/2016 9:24 AM on: 10/10/2016 9:24 AM
by: Created Approved

HMA Layer 1: Layer 1 Flexible : Seymour 9.5mm PG70-22
SR 58File Name: C:\My ME Design\Projects\MK16-465 SE BV\170313 TP-App No 3\SR 58.dgpx
Report generated on: 4/17/2017 2:16 PM Page 9 of 23
by: on: 10/10/2016 9:24 AM on: 10/10/2016 9:24 AM
by: Created Approved

HMA Layer 2: Layer 2 Flexible : Seymour 19.0mm PG70-22
SR 58File Name: C:\My ME Design\Projects\MK16-465 SE BV\170313 TP-App No 3\SR 58.dgpx
Report generated on: 4/17/2017 2:16 PM Page 10 of 23
by: on: 10/10/2016 9:24 AM on: 10/10/2016 9:24 AM
by: Created Approved

HMA Layer 3: Layer 3 Flexible : Seymour 25.0mm PG64-22
SR 58File Name: C:\My ME Design\Projects\MK16-465 SE BV\170313 TP-App No 3\SR 58.dgpx
Report generated on: 4/17/2017 2:16 PM Page 11 of 23
by: on: 10/10/2016 9:24 AM on: 10/10/2016 9:24 AM
by: Created Approved

Analysis Output Charts
SR 58File Name: C:\My ME Design\Projects\MK16-465 SE BV\170313 TP-App No 3\SR 58.dgpx
Report generated on: 4/17/2017 2:16 PM Page 12 of 23
by: on: 10/10/2016 9:24 AM on: 10/10/2016 9:24 AM
by: Created Approved

SR 58File Name: C:\My ME Design\Projects\MK16-465 SE BV\170313 TP-App No 3\SR 58.dgpx
Report generated on: 4/17/2017 2:16 PM Page 13 of 23
by: on: 10/10/2016 9:24 AM on: 10/10/2016 9:24 AM
by: Created Approved

SR 58File Name: C:\My ME Design\Projects\MK16-465 SE BV\170313 TP-App No 3\SR 58.dgpx
Report generated on: 4/17/2017 2:16 PM Page 14 of 23
by: on: 10/10/2016 9:24 AM on: 10/10/2016 9:24 AM
by: Created Approved
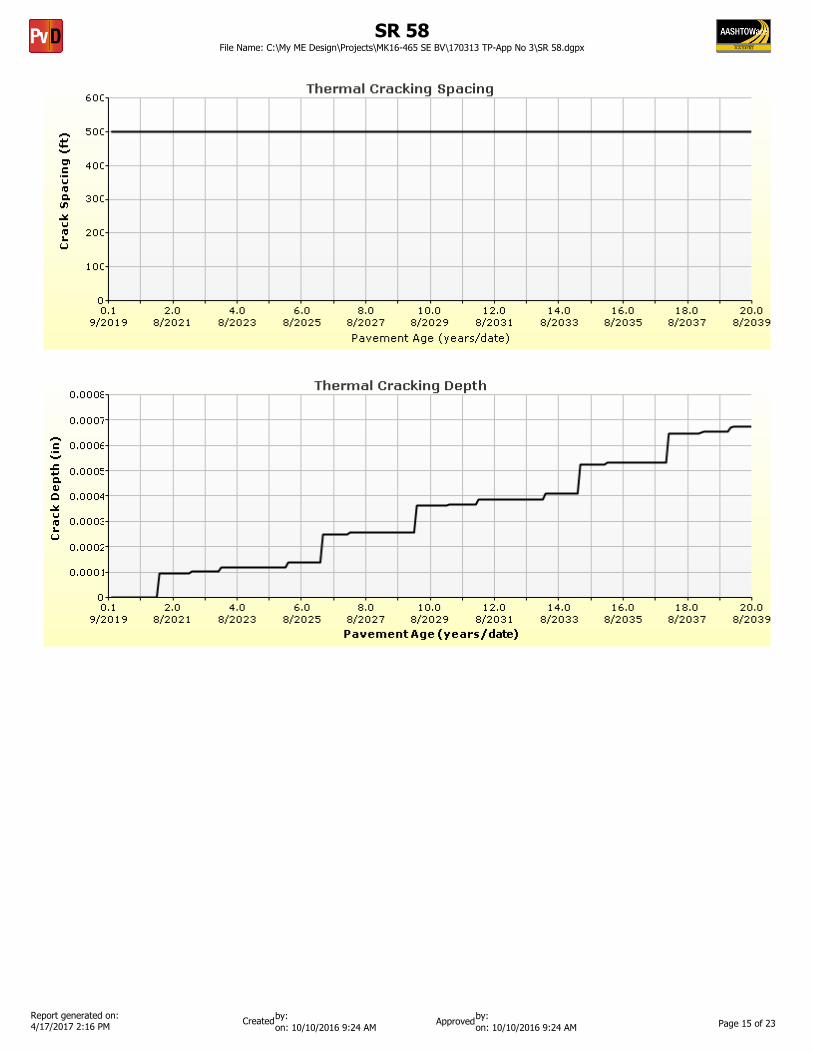
SR 58File Name: C:\My ME Design\Projects\MK16-465 SE BV\170313 TP-App No 3\SR 58.dgpx
Report generated on: 4/17/2017 2:16 PM Page 15 of 23
by: on: 10/10/2016 9:24 AM on: 10/10/2016 9:24 AM
by: Created Approved

SR 58File Name: C:\My ME Design\Projects\MK16-465 SE BV\170313 TP-App No 3\SR 58.dgpx
Report generated on: 4/17/2017 2:16 PM Page 16 of 23
by: on: 10/10/2016 9:24 AM on: 10/10/2016 9:24 AM
by: Created Approved

Layer InformationLayer 1 Flexible : Seymour 9.5mm PG70-22
Asphalt Binder
Temperature (ºF) Binder Gstar (Pa) Phase angle (deg)40 22069340.66 33.7655 9518271.99 44.3970 2836317.75 52.8785 765738.66 59.68100 209102.28 65.17115 60602.87 69.62130 19021.84 73.24
T ( ºF) 0.1 Hz10 193254640 150767670 262246100 55053130 24989
25 Hz32981952093353882731323256131550
1 Hz2355005169177748801212397346973
10 Hz2642382186407973333224664196996
Asphalt Dynamic Modulus (Input Level: 1)
AsphaltThickness (in.) 1.5Unit weight (pcf) 142.6Poisson's ratio Is Calculated? False
Ratio 0.35Parameter A - Parameter B -
General Info
Name ValueReference temperature (ºF) 70Effective binder content (%) 11.61Air voids (%) 8Thermal conductivity (BTU/hr-ft-ºF) 0.63Heat capacity (BTU/lb-ºF) 0.31
Field ValueDisplay name/identifier Seymour 9.5mm PG70-22
Description of object HMA
AuthorDate Created 1/1/2011 12:00:00 AMApproverDate approved 1/1/2011 12:00:00 AMStateDistrictCountyHighwayDirection of TravelFrom station (miles)To station (miles)ProvinceUser defined field 2User defined field 3Revision Number 0
Identifiers
SR 58File Name: C:\My ME Design\Projects\MK16-465 SE BV\170313 TP-App No 3\SR 58.dgpx
Report generated on: 4/17/2017 2:16 PM Page 17 of 23
by: on: 10/10/2016 9:24 AM on: 10/10/2016 9:24 AM
by: Created Approved

Layer 2 Flexible : Seymour 19.0mm PG70-22
Asphalt Binder
Temperature (ºF) Binder Gstar (Pa) Phase angle (deg)40 22069340.66 33.7655 9518271.99 44.3970 2836317.75 52.8785 765738.66 59.68100 209102.28 65.17115 60602.87 69.62130 19021.84 73.24
T ( ºF) 0.1 Hz10 296303040 228693470 368909100 72377130 31704
25 Hz500000032202801308064458741179591
1 Hz3640294257860870501016883461317
10 Hz420028328529711078041345974130686
Asphalt Dynamic Modulus (Input Level: 1)
AsphaltThickness (in.) 3.0Unit weight (pcf) 143.8Poisson's ratio Is Calculated? False
Ratio 0.35Parameter A - Parameter B -
General Info
Name ValueReference temperature (ºF) 70Effective binder content (%) 9.53Air voids (%) 8Thermal conductivity (BTU/hr-ft-ºF) 0.63Heat capacity (BTU/lb-ºF) 0.31
Field ValueDisplay name/identifier Seymour 19.0mm PG70-22
Description of object HMA
AuthorDate Created 1/1/2011 12:00:00 AMApproverDate approved 1/1/2011 12:00:00 AMStateDistrictCountyHighwayDirection of TravelFrom station (miles)To station (miles)ProvinceUser defined field 2User defined field 3Revision Number 0
Identifiers
SR 58File Name: C:\My ME Design\Projects\MK16-465 SE BV\170313 TP-App No 3\SR 58.dgpx
Report generated on: 4/17/2017 2:16 PM Page 18 of 23
by: on: 10/10/2016 9:24 AM on: 10/10/2016 9:24 AM
by: Created Approved

Layer 3 Flexible : Seymour 25.0mm PG64-22
Asphalt Binder
Temperature (ºF) Binder Gstar (Pa) Phase angle (deg)40 25339156.98 34.8555 9930922.35 46.670 2585999.72 55.7985 613653.8 63100 149927.8 68.71115 39662.01 73.23130 11579.02 76.83
T ( ºF) 0.1 Hz10 255782240 169555970 223799100 47413130 24261
25 Hz425857829192901158926381718142860
1 Hz3112035217866653234511948645157
10 Hz34330582555866929105277451101209
Asphalt Dynamic Modulus (Input Level: 1)
AsphaltThickness (in.) 5.5Unit weight (pcf) 144.4Poisson's ratio Is Calculated? False
Ratio 0.35Parameter A - Parameter B -
General Info
Name ValueReference temperature (ºF) 70Effective binder content (%) 8.69Air voids (%) 8Thermal conductivity (BTU/hr-ft-ºF) 0.63Heat capacity (BTU/lb-ºF) 0.31
Field ValueDisplay name/identifier Seymour 25.0mm PG64-22
Description of object HMA
AuthorDate Created 1/1/2011 12:00:00 AMApproverDate approved 1/1/2011 12:00:00 AMStateDistrictCountyHighwayDirection of TravelFrom station (miles)To station (miles)ProvinceUser defined field 2User defined field 3Revision Number 0
Identifiers
SR 58File Name: C:\My ME Design\Projects\MK16-465 SE BV\170313 TP-App No 3\SR 58.dgpx
Report generated on: 4/17/2017 2:16 PM Page 19 of 23
by: on: 10/10/2016 9:24 AM on: 10/10/2016 9:24 AM
by: Created Approved
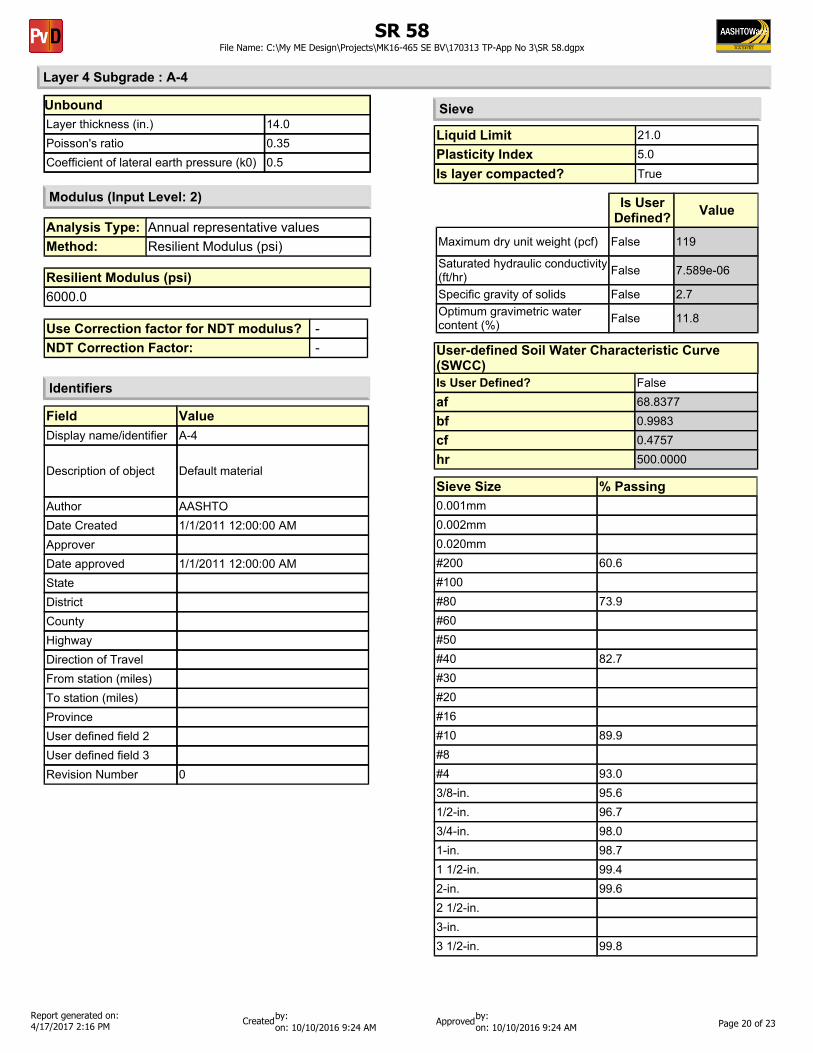
Layer 4 Subgrade : A-4
Liquid LimitPlasticity Index 5.0
21.0
Sieve Size % Passing0.001mm0.002mm0.020mm#200 60.6#100#80 73.9#60#50#40 82.7#30#20#16#10 89.9#8#4 93.03/8-in. 95.61/2-in. 96.73/4-in. 98.01-in. 98.71 1/2-in. 99.42-in. 99.62 1/2-in.3-in.3 1/2-in. 99.8
Is User Defined? Falseaf 68.8377bf 0.9983cf 0.4757hr 500.0000
Sieve
Is User Defined? Value
Maximum dry unit weight (pcf) False 119
Saturated hydraulic conductivity (ft/hr) False 7.589e-06
Specific gravity of solids False 2.7Optimum gravimetric water content (%) False 11.8
User-defined Soil Water Characteristic Curve (SWCC)
TrueIs layer compacted?
UnboundLayer thickness (in.) 14.0Poisson's ratio 0.35Coefficient of lateral earth pressure (k0) 0.5
Resilient Modulus (psi)6000.0
Modulus (Input Level: 2)
Analysis Type: Annual representative valuesMethod: Resilient Modulus (psi)
Use Correction factor for NDT modulus? - NDT Correction Factor: -
Field ValueDisplay name/identifier A-4
Description of object Default material
Author AASHTODate Created 1/1/2011 12:00:00 AMApproverDate approved 1/1/2011 12:00:00 AMStateDistrictCountyHighwayDirection of TravelFrom station (miles)To station (miles)ProvinceUser defined field 2User defined field 3Revision Number 0
Identifiers
SR 58File Name: C:\My ME Design\Projects\MK16-465 SE BV\170313 TP-App No 3\SR 58.dgpx
Report generated on: 4/17/2017 2:16 PM Page 20 of 23
by: on: 10/10/2016 9:24 AM on: 10/10/2016 9:24 AM
by: Created Approved

Layer 5 Subgrade : A-4
Liquid LimitPlasticity Index 5.0
21.0
Sieve Size % Passing0.001mm0.002mm0.020mm#200 60.6#100#80 73.9#60#50#40 82.7#30#20#16#10 89.9#8#4 93.03/8-in. 95.61/2-in. 96.73/4-in. 98.01-in. 98.71 1/2-in. 99.42-in. 99.62 1/2-in.3-in.3 1/2-in. 99.8
Is User Defined? Falseaf 68.8377bf 0.9983cf 0.4757hr 500.0000
Sieve
Is User Defined? Value
Maximum dry unit weight (pcf) False 118.4
Saturated hydraulic conductivity (ft/hr) False 8.325e-06
Specific gravity of solids False 2.7Optimum gravimetric water content (%) False 11.8
User-defined Soil Water Characteristic Curve (SWCC)
FalseIs layer compacted?
UnboundLayer thickness (in.) Semi-infinitePoisson's ratio 0.35Coefficient of lateral earth pressure (k0) 0.5
Resilient Modulus (psi)4000.0
Modulus (Input Level: 2)
Analysis Type: Annual representative valuesMethod: Resilient Modulus (psi)
Use Correction factor for NDT modulus? - NDT Correction Factor: -
Field ValueDisplay name/identifier A-4
Description of object Default material
Author AASHTODate Created 1/1/2011 12:00:00 AMApproverDate approved 1/1/2011 12:00:00 AMStateDistrictCountyHighwayDirection of TravelFrom station (miles)To station (miles)ProvinceUser defined field 2User defined field 3Revision Number 0
Identifiers
SR 58File Name: C:\My ME Design\Projects\MK16-465 SE BV\170313 TP-App No 3\SR 58.dgpx
Report generated on: 4/17/2017 2:16 PM Page 21 of 23
by: on: 10/10/2016 9:24 AM on: 10/10/2016 9:24 AM
by: Created Approved

Calibration Coefficients
k1: 0.007566k2: 3.9492k3: 1.281Bf1: 1Bf2: 1Bf3: 1
AC Fatigue
AC Layer K1:-3.35412 K2:1.5606 K3:0.4791 Br1:0.07 Br2:1.9 Br3:0.40.24*Pow(RUT,0.8026)+0.001
AC Rutting
AC Rutting Standard Deviation
Level 1 K: 1.5Level 2 K: 0.5Level 3 K: 1.5
Level 1 Standard Deviation: 0.1468 * THERMAL + 65.027Level 2 Standard Deviation: 0.2841 *THERMAL + 55.462 Level 3 Standard Deviation: 0.3972 * THERMAL + 20.422
Thermal Fracture
k1: 1 k2: 1 Bc1: 1 Bc2:1
CSM Fatigue
SR 58File Name: C:\My ME Design\Projects\MK16-465 SE BV\170313 TP-App No 3\SR 58.dgpx
Report generated on: 4/17/2017 2:16 PM Page 22 of 23
by: on: 10/10/2016 9:24 AM on: 10/10/2016 9:24 AM
by: Created Approved

Subgrade Rutting
Granular Finek1: 2.03 Bs1: 0.12 k1: 1.35 Bs1: 0.12Standard Deviation (BASERUT)0.1477*Pow(BASERUT,0.6711)+0.001
Standard Deviation (BASERUT)0.1235*Pow(SUBRUT,0.5012)+0.001
c1: 7 c2: 3.5
200 + 2300/(1+exp(1.072-2.1654*LOG10(TOP+0.0001)))
AC Cracking
1.13+13/(1+exp(7.57-15.5*LOG10(BOTTOM+0.0001)))
AC Top Down Cracking AC Bottom Up Cracking
c3: 0 c4: 1000 c3: 6000c2: 1c1: 1AC Cracking Top Standard Deviation AC Cracking Bottom Standard Deviation
C1: 1 C2: 1
CSM Cracking
C4: 1000C3: 0
CTB*1CSM Standard Deviation
IRI Flexible Pavements
C3: 0.008 C4: 0.015C1: 40 C2: 0.4
SR 58File Name: C:\My ME Design\Projects\MK16-465 SE BV\170313 TP-App No 3\SR 58.dgpx
Report generated on: 4/17/2017 2:16 PM Page 23 of 23
by: on: 10/10/2016 9:24 AM on: 10/10/2016 9:24 AM
by: Created Approved

Design Inputs
Age (year) Heavy Trucks (cumulative)
2019 (initial) 13,2932032 (13 years) 33,324,5002045 (26 years) 71,157,400
TrafficDesign Structure
Layer type Material Type Thickness (in.):PCC JPCP 12.0
NonStabilized Unbound Drainage Layer 3.0
Subgrade A-4 14.0Subgrade A-4 Semi-infinite
Joint Design:Joint spacing (ft) 15.0Dowel diameter (in.) 1.50Slab width (ft) 14.0 (w)
Distress TypeDistress @ Specified
Reliability Reliability (%) Criterion Satisfied?
Target Predicted Target AchievedTerminal IRI (in./mile) 160.00 138.93 90.00 97.27 Pass
Mean joint faulting (in.) 0.15 0.07 90.00 100.00 Pass
JPCP transverse cracking (percent slabs) 10.00 3.83 90.00 99.96 Pass
Distress Prediction Summary
Distress Charts
Jointed Plain Concrete Pavement (JPCP)
Design Type:26 yearsDesign Life:
September, 2019Traffic opening:Pavement construction: July, 2019
- Existing construction: Climate Data Sources (Lat/Lon)
39.144, -86.61739.71, -86.27238.228, -85.664
Design Outputs
PCCP Run(IRI) - 12File Name: C:\My ME Design\Projects\MK16-465 SE BV\170313 TP-App No 3\PCCP Run(IRI) - 12.dgpx
Report generated on: 4/25/2017 3:17 PM Page 1 of 15
by: on: 8/12/2016 12:16 PM on: 8/12/2016 12:16 PM
by: Created Approved

Traffic Volume Monthly Adjustment Factors
Class 4 Class 5 Class 6 Class 7 Class 8 Class 9 Class 10 Class 11 Class 12 Class 13
Graphical Representation of Traffic Inputs
Traffic Inputs
Operational speed (mph) 70.0
Percent of trucks in design direction (%): 55.090.02 Percent of trucks in design lane (%):Number of lanes in design direction:
13,293Initial two-way AADTT:
PCCP Run(IRI) - 12File Name: C:\My ME Design\Projects\MK16-465 SE BV\170313 TP-App No 3\PCCP Run(IRI) - 12.dgpx
Report generated on: 4/25/2017 3:17 PM Page 2 of 15
by: on: 8/12/2016 12:16 PM on: 8/12/2016 12:16 PM
by: Created Approved

Traffic WanderMean wheel location (in.)
Traffic wander standard deviation (in.)Design lane width (ft)
18
1012
Axle ConfigurationAverage axle width (ft) 8.5
Dual tire spacing (in.)Tire pressure (psi)
12120
Average Axle SpacingTandem axle spacing (in.)Tridem axle spacing (in.)Quad axle spacing (in.)
51.6
49.2
49.2
Wheelbase
ShortAxle Type
Value Type Medium Long
1512Average spacing of axles (ft) 18
Percent of Trucks (%) 33 3433
Number of Axles per Truck
Vehicle Class
Single Axle
Tandem Axle
Tridem Axle
Quad Axle
Class 4 1.57 0.32 0 0Class 5 1.87 0 0 0Class 6 1 0.93 0 0Class 7 1.27 0.38 0.83 0.2Class 8 2.08 0.77 0 0Class 9 1.3 1.73 0 0
Class 10 1.05 1.02 0.88 0.01Class 11 4.45 0.06 0.03 0Class 12 3.63 0.96 0.03 0Class 13 2.82 1.07 0.48 0.13
Axle Configuration
Volume Monthly Adjustment Factors Level 3: Default MAF
Month Vehicle Class4 5 6 7 8 9 10 11 12 13
January 0.6 0.9 0.9 1.2 0.7 0.8 0.7 0.8 0.7 1.1February 0.9 0.9 1.0 0.6 0.9 0.9 0.9 0.9 1.0 1.4March 1.0 0.9 1.2 0.6 1.0 1.0 1.0 1.0 0.9 0.6April 1.1 1.0 1.1 0.9 0.9 1.0 1.0 1.0 0.9 0.9May 1.1 1.0 1.1 1.0 0.9 0.9 0.9 0.9 0.9 0.5June 1.1 1.3 1.0 1.1 1.1 1.1 1.1 1.0 1.1 1.0July 1.0 1.3 1.0 1.0 1.1 1.0 1.0 1.0 1.0 0.7August 1.1 1.2 1.0 1.2 1.2 1.1 1.1 1.1 1.0 0.8September 1.2 0.9 1.0 1.1 1.2 1.1 1.3 1.1 1.1 1.0October 1.0 0.8 1.0 1.2 1.0 1.1 1.1 1.1 1.0 1.0November 1.0 0.9 1.0 1.2 1.0 1.1 1.1 1.1 1.1 0.9December 0.9 1.0 0.9 0.9 0.9 1.0 0.8 1.3 1.4 2.2
Distributions by Vehicle Class
Growth Factor
Rate (%) Function1.11% Linear1.11% Linear1.11% Linear1.11% Linear1.11% Linear1.11% Linear1.11% Linear1.11% Linear1.11% Linear1.11% Linear
Vehicle ClassAADTT
Distribution (%) (Level 3)
Class 4 1.3%Class 5 22.5%Class 6 3.6%Class 7 0.7%Class 8 3.3%Class 9 64.4%Class 10 1.1%Class 11 2.1%Class 12 0.6%Class 13 0.4%
Truck Distribution by Hour
Hour Distribution (%)
12 AM 2.2%1 AM 1.9%2 AM 1.9%3 AM 2%4 AM 2.3%5 AM 2.8%6 AM 3.5%7 AM 4.2%8 AM 4.8%9 AM 5.2%10 AM 5.5%11 AM 5.6%
Hour Distribution (%)
12 PM 5.7%1 PM 5.8%2 PM 5.9%3 PM 6%4 PM 5.9%5 PM 5.7%6 PM 5.1%7 PM 4.5%8 PM 4.1%9 PM 3.6%10 PM 3.2%11 PM 2.6%Total 100%
Tabular Representation of Traffic Inputs
PCCP Run(IRI) - 12File Name: C:\My ME Design\Projects\MK16-465 SE BV\170313 TP-App No 3\PCCP Run(IRI) - 12.dgpx
Report generated on: 4/25/2017 3:17 PM Page 3 of 15
by: on: 8/12/2016 12:16 PM on: 8/12/2016 12:16 PM
by: Created Approved

AADTT (Average Annual Daily Truck Traffic) Growth* Traffic cap is not enforced
PCCP Run(IRI) - 12File Name: C:\My ME Design\Projects\MK16-465 SE BV\170313 TP-App No 3\PCCP Run(IRI) - 12.dgpx
Report generated on: 4/25/2017 3:17 PM Page 4 of 15
by: on: 8/12/2016 12:16 PM on: 8/12/2016 12:16 PM
by: Created Approved

Climate Inputs
Climate Data Sources:
Climate Station Cities: Location (lat lon elevation(ft))39.14400 -86.61700 842BLOOMINGTON, IN
39.71000 -86.27200 790INDIANAPOLIS, INLOUISVILLE, KY 38.22800 -85.66400 517
Monthly Climate Summary:
Annual Statistics:
Mean annual air temperature (ºF) 54.14Mean annual precipitation (in.) 43.47Freezing index (ºF - days) 426.14Average annual number of freeze/thaw cycles: 61.76 Water table depth
(ft)5.00
PCCP Run(IRI) - 12File Name: C:\My ME Design\Projects\MK16-465 SE BV\170313 TP-App No 3\PCCP Run(IRI) - 12.dgpx
Report generated on: 4/25/2017 3:17 PM Page 5 of 15
by: on: 8/12/2016 12:16 PM on: 8/12/2016 12:16 PM
by: Created Approved

< -13º F
Hourly Air Temperature Distribution by Month:
-13º F to -4º F -4º F to 5º F 5º F to 14º F 14º F to 23º F 23º F to 32º F 32º F to 41º F 41º F to 50º F
59º F to 68º F50º F to 59º F 68º F to 77º F 77º F to 86º F 86º F to 95º F 95º F to 104º F 104º F to 113º F
> 113º F
PCCP Run(IRI) - 12File Name: C:\My ME Design\Projects\MK16-465 SE BV\170313 TP-App No 3\PCCP Run(IRI) - 12.dgpx
Report generated on: 4/25/2017 3:17 PM Page 6 of 15
by: on: 8/12/2016 12:16 PM on: 8/12/2016 12:16 PM
by: Created Approved

JPCP Design Properties
PCC-Base Contact FrictionPCC-Base full friction contact TrueMonths until friction loss 600.00
Structure - ICM PropertiesPCC surface shortwave absorptivity 0.85
Erodibility index 2
Widened SlabIs slab widened ? TrueSlab width (ft) 14.00
PCC joint spacing (ft)Is joint spacing random ? FalseJoint spacing (ft) 15.00
Sealant typeOther(Including No Sealant... Liquid... Silicone)
Doweled JointsIs joint doweled ? TrueDowel diameter (in.) 1.50Dowel spacing (in.) 12.00
Permanent curl/warp effective temperature difference (ºF) -10.00
Tied ShouldersTied shoulders FalseLoad transfer efficiency (%) -
Design Properties
PCCP Run(IRI) - 12File Name: C:\My ME Design\Projects\MK16-465 SE BV\170313 TP-App No 3\PCCP Run(IRI) - 12.dgpx
Report generated on: 4/25/2017 3:17 PM Page 7 of 15
by: on: 8/12/2016 12:16 PM on: 8/12/2016 12:16 PM
by: Created Approved

Analysis Output Charts
PCCP Run(IRI) - 12File Name: C:\My ME Design\Projects\MK16-465 SE BV\170313 TP-App No 3\PCCP Run(IRI) - 12.dgpx
Report generated on: 4/25/2017 3:17 PM Page 8 of 15
by: on: 8/12/2016 12:16 PM on: 8/12/2016 12:16 PM
by: Created Approved

PCCP Run(IRI) - 12File Name: C:\My ME Design\Projects\MK16-465 SE BV\170313 TP-App No 3\PCCP Run(IRI) - 12.dgpx
Report generated on: 4/25/2017 3:17 PM Page 9 of 15
by: on: 8/12/2016 12:16 PM on: 8/12/2016 12:16 PM
by: Created Approved

PCCP Run(IRI) - 12File Name: C:\My ME Design\Projects\MK16-465 SE BV\170313 TP-App No 3\PCCP Run(IRI) - 12.dgpx
Report generated on: 4/25/2017 3:17 PM Page 10 of 15
by: on: 8/12/2016 12:16 PM on: 8/12/2016 12:16 PM
by: Created Approved

Layer InformationLayer 1 PCC : JPCP
PCCThickness (in.) 12.0Unit weight (pcf) 145.0Poisson's ratio 0.2
MixCement type Type I (1)Cementitious material content (lb/yd^3) 510Water to cement ratio 0.42Aggregate type Limestone (1)PCC zero-stress temperature (ºF)
Calculated Internally? TrueUser Value - Calculated Value 103.5
Ultimate shrinkage (microstrain)
Calculated Internally? FalseUser Value 483.0Calculated Value -
Reversible shrinkage (%) 50Time to develop 50% of ultimate shrinkage (days) 35
Curing method Curing Compound
Field ValueDisplay name/identifier JPCP
Description of object
AuthorDate Created 12/18/2012 2:32:19 PMApproverDate approved 12/18/2012 2:32:19 PMStateDistrictCountyHighwayDirection of TravelFrom station (miles)To station (miles)ProvinceUser defined field 2User defined field 3Revision Number 0
Identifiers
28-Day PCC modulus of rupture (psi) 700.028-Day PCC elastic modulus (psi) -
PCC strength and modulus (Input Level: 3)
ThermalPCC coefficient of thermal expansion (in./in./ºF x 10^-6) 4.7
PCC thermal conductivity (BTU/hr-ft-ºF) 1.25PCC heat capacity (BTU/lb-ºF) 0.28
PCCP Run(IRI) - 12File Name: C:\My ME Design\Projects\MK16-465 SE BV\170313 TP-App No 3\PCCP Run(IRI) - 12.dgpx
Report generated on: 4/25/2017 3:17 PM Page 11 of 15
by: on: 8/12/2016 12:16 PM on: 8/12/2016 12:16 PM
by: Created Approved

Layer 2 Non-stabilized Base : Unbound Drainage Layer
Liquid LimitPlasticity Index 1.0
6.0
Sieve Size % Passing0.001mm0.002mm0.020mm#200 8.7#100#80 12.9#60#50#40 20.0#30#20#16#10 33.8#8#4 44.73/8-in. 57.21/2-in. 63.13/4-in. 72.71-in. 78.81 1/2-in. 85.82-in. 91.62 1/2-in.3-in.3 1/2-in. 97.6
Is User Defined? Falseaf 7.2555bf 1.3328cf 0.8242hr 117.4000
Sieve
Is User Defined? Value
Maximum dry unit weight (pcf) False 127.2
Saturated hydraulic conductivity (ft/hr) False 5.054e-02
Specific gravity of solids False 2.7Optimum gravimetric water content (%) False 7.4
User-defined Soil Water Characteristic Curve (SWCC)
FalseIs layer compacted?
UnboundLayer thickness (in.) 3.0Poisson's ratio 0.35Coefficient of lateral earth pressure (k0) 0.5
Resilient Modulus (psi)25000.0
Modulus (Input Level: 2)
Analysis Type: Annual representative valuesMethod: Resilient Modulus (psi)
Use Correction factor for NDT modulus? - NDT Correction Factor: -
Field ValueDisplay name/identifier Unbound Drainage Layer
Description of object No. 8 Layer of Subbase for PCCP
Author Matt TaylorDate Created 1/31/2013 12:00:00 AMApproverDate approved 1/1/2011 12:00:00 AMStateDistrictCountyHighwayDirection of TravelFrom station (miles)To station (miles)ProvinceUser defined field 2User defined field 3Revision Number 0
Identifiers
PCCP Run(IRI) - 12File Name: C:\My ME Design\Projects\MK16-465 SE BV\170313 TP-App No 3\PCCP Run(IRI) - 12.dgpx
Report generated on: 4/25/2017 3:17 PM Page 12 of 15
by: on: 8/12/2016 12:16 PM on: 8/12/2016 12:16 PM
by: Created Approved

Layer 3 Subgrade : A-4
Liquid LimitPlasticity Index 5.0
21.0
Sieve Size % Passing0.001mm0.002mm0.020mm#200 60.6#100#80 73.9#60#50#40 82.7#30#20#16#10 89.9#8#4 93.03/8-in. 95.61/2-in. 96.73/4-in. 98.01-in. 98.71 1/2-in. 99.42-in. 99.62 1/2-in.3-in.3 1/2-in. 99.8
Is User Defined? Falseaf 68.8377bf 0.9983cf 0.4757hr 500.0000
Sieve
Is User Defined? Value
Maximum dry unit weight (pcf) False 119
Saturated hydraulic conductivity (ft/hr) False 7.589e-06
Specific gravity of solids False 2.7Optimum gravimetric water content (%) False 11.8
User-defined Soil Water Characteristic Curve (SWCC)
TrueIs layer compacted?
UnboundLayer thickness (in.) 14.0Poisson's ratio 0.35Coefficient of lateral earth pressure (k0) 0.5
Resilient Modulus (psi)6000.0
Modulus (Input Level: 2)
Analysis Type: Annual representative valuesMethod: Resilient Modulus (psi)
Use Correction factor for NDT modulus? - NDT Correction Factor: -
Field ValueDisplay name/identifier A-4
Description of object Default material
Author AASHTODate Created 1/1/2011 12:00:00 AMApproverDate approved 1/1/2011 12:00:00 AMStateDistrictCountyHighwayDirection of TravelFrom station (miles)To station (miles)ProvinceUser defined field 2User defined field 3Revision Number 0
Identifiers
PCCP Run(IRI) - 12File Name: C:\My ME Design\Projects\MK16-465 SE BV\170313 TP-App No 3\PCCP Run(IRI) - 12.dgpx
Report generated on: 4/25/2017 3:17 PM Page 13 of 15
by: on: 8/12/2016 12:16 PM on: 8/12/2016 12:16 PM
by: Created Approved

Layer 4 Subgrade : A-4
Liquid LimitPlasticity Index 5.0
21.0
Sieve Size % Passing0.001mm0.002mm0.020mm#200 60.6#100#80 73.9#60#50#40 82.7#30#20#16#10 89.9#8#4 93.03/8-in. 95.61/2-in. 96.73/4-in. 98.01-in. 98.71 1/2-in. 99.42-in. 99.62 1/2-in.3-in.3 1/2-in. 99.8
Is User Defined? Falseaf 68.8377bf 0.9983cf 0.4757hr 500.0000
Sieve
Is User Defined? Value
Maximum dry unit weight (pcf) False 118.4
Saturated hydraulic conductivity (ft/hr) False 8.325e-06
Specific gravity of solids False 2.7Optimum gravimetric water content (%) False 11.8
User-defined Soil Water Characteristic Curve (SWCC)
FalseIs layer compacted?
UnboundLayer thickness (in.) Semi-infinitePoisson's ratio 0.35Coefficient of lateral earth pressure (k0) 0.5
Resilient Modulus (psi)4000.0
Modulus (Input Level: 2)
Analysis Type: Annual representative valuesMethod: Resilient Modulus (psi)
Use Correction factor for NDT modulus? - NDT Correction Factor: -
Field ValueDisplay name/identifier A-4
Description of object Default material
Author AASHTODate Created 1/1/2011 12:00:00 AMApproverDate approved 1/1/2011 12:00:00 AMStateDistrictCountyHighwayDirection of TravelFrom station (miles)To station (miles)ProvinceUser defined field 2User defined field 3Revision Number 0
Identifiers
PCCP Run(IRI) - 12File Name: C:\My ME Design\Projects\MK16-465 SE BV\170313 TP-App No 3\PCCP Run(IRI) - 12.dgpx
Report generated on: 4/25/2017 3:17 PM Page 14 of 15
by: on: 8/12/2016 12:16 PM on: 8/12/2016 12:16 PM
by: Created Approved

Calibration Coefficients
IRI-jpcpC1: 0.8203 C2: 0.4417C3: 1.4929 C4: 25.24
5.4
Reliability Standard Deviation
C1: 1.0184 C2: 0.91656
Pow(0.0097*FAULT,0.5178)+0.014
PCC Faulting
C3: 0.0021848 C4: 0.000883739
C7: 1.83312C6: 0.4C5: 250 C8: 400PCC Reliability Faulting Standard Deviation
PCC CrackingCracking Coefficients
C1: 2 C2: 1.22 C5: -1.98C4: 1
Pow(5.3116*CRACK,0.3903) + 2.99PCC Reliability Cracking Standard Deviation
Fatigue Coefficients
PCCP Run(IRI) - 12File Name: C:\My ME Design\Projects\MK16-465 SE BV\170313 TP-App No 3\PCCP Run(IRI) - 12.dgpx
Report generated on: 4/25/2017 3:17 PM Page 15 of 15
by: on: 8/12/2016 12:16 PM on: 8/12/2016 12:16 PM
by: Created Approved

Design Inputs
Age (year) Heavy Trucks (cumulative)
2019 (initial) 13,2932068 (49 years) 149,137,0002117 (98 years) 362,326,000
TrafficDesign Structure
Layer type Material Type Thickness (in.):PCC JPCP 12.0
NonStabilized Unbound Drainage Layer 3.0
Subgrade A-4 14.0Subgrade A-4 Semi-infinite
Joint Design:Joint spacing (ft) 15.0Dowel diameter (in.) 1.50Slab width (ft) 14.0 (w)
Distress TypeDistress @ Specified
Reliability Reliability (%) Criterion Satisfied?
Target Predicted Target AchievedTerminal IRI (in./mile) 160.00 246.10 90.00 34.79 Fail
Mean joint faulting (in.) 0.15 0.13 90.00 95.50 Pass
JPCP transverse cracking (percent slabs) 10.00 4.25 90.00 99.87 Pass
Distress Prediction Summary
Distress Charts
Jointed Plain Concrete Pavement (JPCP)
Design Type:98 yearsDesign Life:
September, 2019Traffic opening:Pavement construction: July, 2019
- Existing construction: Climate Data Sources (Lat/Lon)
39.144, -86.61739.71, -86.27238.228, -85.664
Design Outputs
PCCP Run(Structural) - 12File Name: C:\My ME Design\Projects\MK16-465 SE BV\170313 TP-App No 3\PCCP Run(Structural) - 12.dgpx
Report generated on: 4/25/2017 3:20 PM Page 1 of 15
by: on: 8/12/2016 12:16 PM on: 8/12/2016 12:16 PM
by: Created Approved

Traffic Volume Monthly Adjustment Factors
Class 4 Class 5 Class 6 Class 7 Class 8 Class 9 Class 10 Class 11 Class 12 Class 13
Graphical Representation of Traffic Inputs
Traffic Inputs
Operational speed (mph) 70.0
Percent of trucks in design direction (%): 55.090.02 Percent of trucks in design lane (%):Number of lanes in design direction:
13,293Initial two-way AADTT:
PCCP Run(Structural) - 12File Name: C:\My ME Design\Projects\MK16-465 SE BV\170313 TP-App No 3\PCCP Run(Structural) - 12.dgpx
Report generated on: 4/25/2017 3:20 PM Page 2 of 15
by: on: 8/12/2016 12:16 PM on: 8/12/2016 12:16 PM
by: Created Approved

Traffic WanderMean wheel location (in.)
Traffic wander standard deviation (in.)Design lane width (ft)
18
1012
Axle ConfigurationAverage axle width (ft) 8.5
Dual tire spacing (in.)Tire pressure (psi)
12120
Average Axle SpacingTandem axle spacing (in.)Tridem axle spacing (in.)Quad axle spacing (in.)
51.6
49.2
49.2
Wheelbase
ShortAxle Type
Value Type Medium Long
1512Average spacing of axles (ft) 18
Percent of Trucks (%) 33 3433
Number of Axles per Truck
Vehicle Class
Single Axle
Tandem Axle
Tridem Axle
Quad Axle
Class 4 1.57 0.32 0 0Class 5 1.87 0 0 0Class 6 1 0.93 0 0Class 7 1.27 0.38 0.83 0.2Class 8 2.08 0.77 0 0Class 9 1.3 1.73 0 0
Class 10 1.05 1.02 0.88 0.01Class 11 4.45 0.06 0.03 0Class 12 3.63 0.96 0.03 0Class 13 2.82 1.07 0.48 0.13
Axle Configuration
Volume Monthly Adjustment Factors Level 3: Default MAF
Month Vehicle Class4 5 6 7 8 9 10 11 12 13
January 0.6 0.9 0.9 1.2 0.7 0.8 0.7 0.8 0.7 1.1February 0.9 0.9 1.0 0.6 0.9 0.9 0.9 0.9 1.0 1.4March 1.0 0.9 1.2 0.6 1.0 1.0 1.0 1.0 0.9 0.6April 1.1 1.0 1.1 0.9 0.9 1.0 1.0 1.0 0.9 0.9May 1.1 1.0 1.1 1.0 0.9 0.9 0.9 0.9 0.9 0.5June 1.1 1.3 1.0 1.1 1.1 1.1 1.1 1.0 1.1 1.0July 1.0 1.3 1.0 1.0 1.1 1.0 1.0 1.0 1.0 0.7August 1.1 1.2 1.0 1.2 1.2 1.1 1.1 1.1 1.0 0.8September 1.2 0.9 1.0 1.1 1.2 1.1 1.3 1.1 1.1 1.0October 1.0 0.8 1.0 1.2 1.0 1.1 1.1 1.1 1.0 1.0November 1.0 0.9 1.0 1.2 1.0 1.1 1.1 1.1 1.1 0.9December 0.9 1.0 0.9 0.9 0.9 1.0 0.8 1.3 1.4 2.2
Distributions by Vehicle Class
Growth Factor
Rate (%) Function1.11% Linear1.11% Linear1.11% Linear1.11% Linear1.11% Linear1.11% Linear1.11% Linear1.11% Linear1.11% Linear1.11% Linear
Vehicle ClassAADTT
Distribution (%) (Level 3)
Class 4 1.3%Class 5 22.5%Class 6 3.6%Class 7 0.7%Class 8 3.3%Class 9 64.4%Class 10 1.1%Class 11 2.1%Class 12 0.6%Class 13 0.4%
Truck Distribution by Hour
Hour Distribution (%)
12 AM 2.2%1 AM 1.9%2 AM 1.9%3 AM 2%4 AM 2.3%5 AM 2.8%6 AM 3.5%7 AM 4.2%8 AM 4.8%9 AM 5.2%10 AM 5.5%11 AM 5.6%
Hour Distribution (%)
12 PM 5.7%1 PM 5.8%2 PM 5.9%3 PM 6%4 PM 5.9%5 PM 5.7%6 PM 5.1%7 PM 4.5%8 PM 4.1%9 PM 3.6%10 PM 3.2%11 PM 2.6%Total 100%
Tabular Representation of Traffic Inputs
PCCP Run(Structural) - 12File Name: C:\My ME Design\Projects\MK16-465 SE BV\170313 TP-App No 3\PCCP Run(Structural) - 12.dgpx
Report generated on: 4/25/2017 3:20 PM Page 3 of 15
by: on: 8/12/2016 12:16 PM on: 8/12/2016 12:16 PM
by: Created Approved

AADTT (Average Annual Daily Truck Traffic) Growth* Traffic cap is not enforced
PCCP Run(Structural) - 12File Name: C:\My ME Design\Projects\MK16-465 SE BV\170313 TP-App No 3\PCCP Run(Structural) - 12.dgpx
Report generated on: 4/25/2017 3:20 PM Page 4 of 15
by: on: 8/12/2016 12:16 PM on: 8/12/2016 12:16 PM
by: Created Approved

Climate Inputs
Climate Data Sources:
Climate Station Cities: Location (lat lon elevation(ft))39.14400 -86.61700 842BLOOMINGTON, IN
39.71000 -86.27200 790INDIANAPOLIS, INLOUISVILLE, KY 38.22800 -85.66400 517
Monthly Climate Summary:
Annual Statistics:
Mean annual air temperature (ºF) 54.14Mean annual precipitation (in.) 43.47Freezing index (ºF - days) 426.14Average annual number of freeze/thaw cycles: 61.76 Water table depth
(ft)5.00
PCCP Run(Structural) - 12File Name: C:\My ME Design\Projects\MK16-465 SE BV\170313 TP-App No 3\PCCP Run(Structural) - 12.dgpx
Report generated on: 4/25/2017 3:20 PM Page 5 of 15
by: on: 8/12/2016 12:16 PM on: 8/12/2016 12:16 PM
by: Created Approved
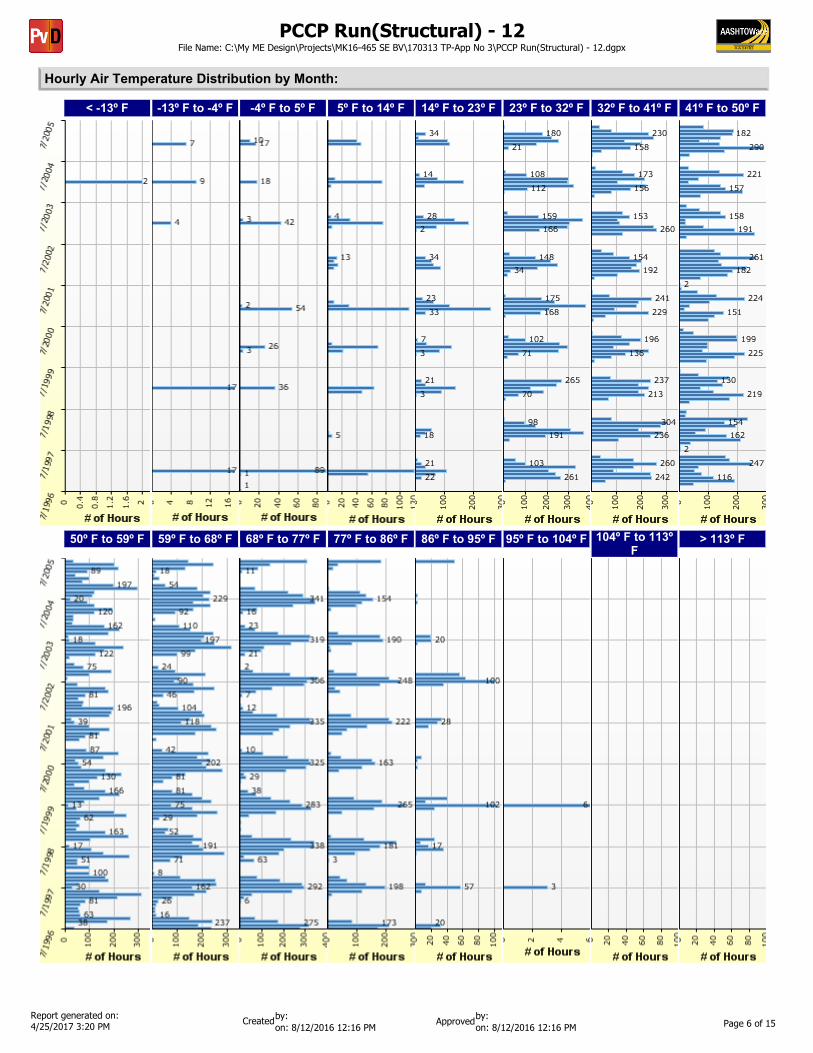
< -13º F
Hourly Air Temperature Distribution by Month:
-13º F to -4º F -4º F to 5º F 5º F to 14º F 14º F to 23º F 23º F to 32º F 32º F to 41º F 41º F to 50º F
59º F to 68º F50º F to 59º F 68º F to 77º F 77º F to 86º F 86º F to 95º F 95º F to 104º F 104º F to 113º F
> 113º F
PCCP Run(Structural) - 12File Name: C:\My ME Design\Projects\MK16-465 SE BV\170313 TP-App No 3\PCCP Run(Structural) - 12.dgpx
Report generated on: 4/25/2017 3:20 PM Page 6 of 15
by: on: 8/12/2016 12:16 PM on: 8/12/2016 12:16 PM
by: Created Approved
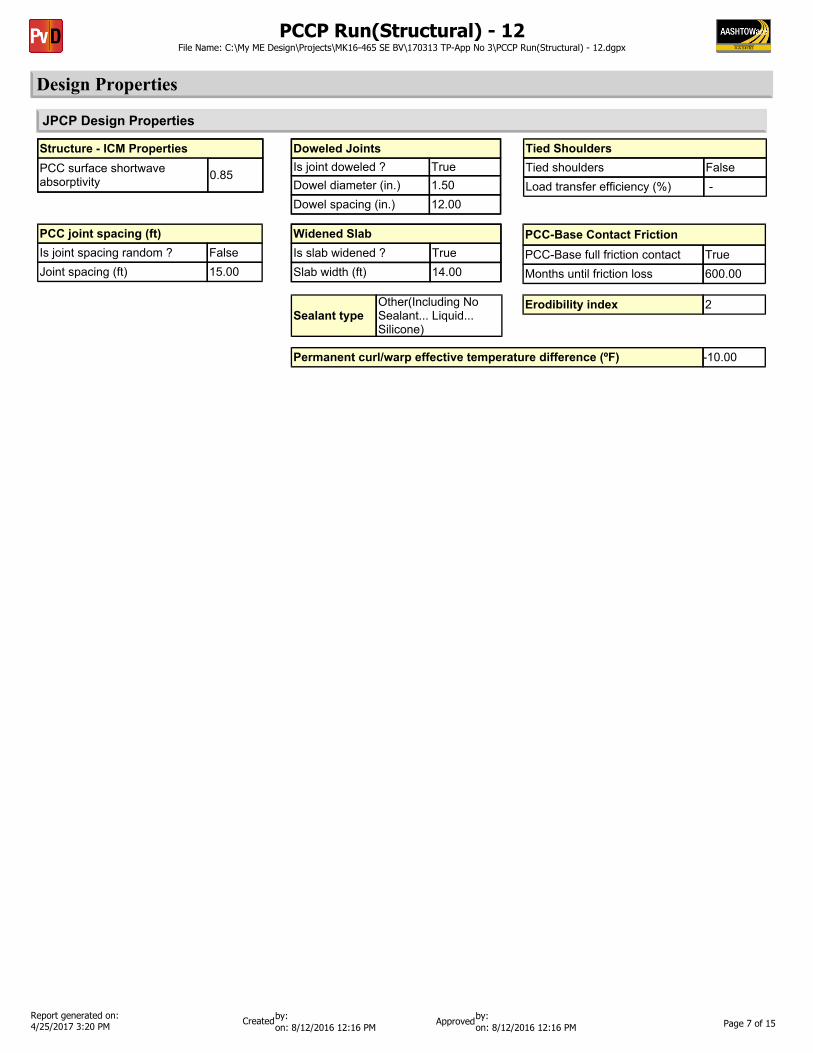
JPCP Design Properties
PCC-Base Contact FrictionPCC-Base full friction contact TrueMonths until friction loss 600.00
Structure - ICM PropertiesPCC surface shortwave absorptivity 0.85
Erodibility index 2
Widened SlabIs slab widened ? TrueSlab width (ft) 14.00
PCC joint spacing (ft)Is joint spacing random ? FalseJoint spacing (ft) 15.00
Sealant typeOther(Including No Sealant... Liquid... Silicone)
Doweled JointsIs joint doweled ? TrueDowel diameter (in.) 1.50Dowel spacing (in.) 12.00
Permanent curl/warp effective temperature difference (ºF) -10.00
Tied ShouldersTied shoulders FalseLoad transfer efficiency (%) -
Design Properties
PCCP Run(Structural) - 12File Name: C:\My ME Design\Projects\MK16-465 SE BV\170313 TP-App No 3\PCCP Run(Structural) - 12.dgpx
Report generated on: 4/25/2017 3:20 PM Page 7 of 15
by: on: 8/12/2016 12:16 PM on: 8/12/2016 12:16 PM
by: Created Approved

Analysis Output Charts
PCCP Run(Structural) - 12File Name: C:\My ME Design\Projects\MK16-465 SE BV\170313 TP-App No 3\PCCP Run(Structural) - 12.dgpx
Report generated on: 4/25/2017 3:20 PM Page 8 of 15
by: on: 8/12/2016 12:16 PM on: 8/12/2016 12:16 PM
by: Created Approved

PCCP Run(Structural) - 12File Name: C:\My ME Design\Projects\MK16-465 SE BV\170313 TP-App No 3\PCCP Run(Structural) - 12.dgpx
Report generated on: 4/25/2017 3:20 PM Page 9 of 15
by: on: 8/12/2016 12:16 PM on: 8/12/2016 12:16 PM
by: Created Approved
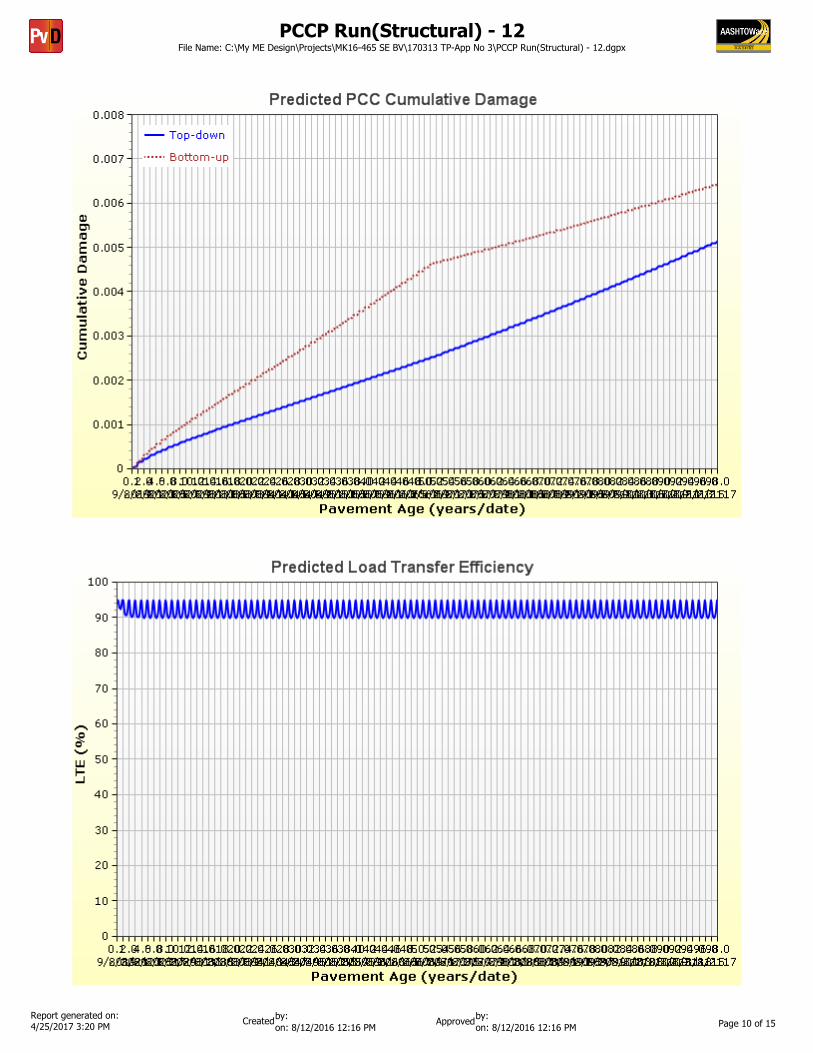
PCCP Run(Structural) - 12File Name: C:\My ME Design\Projects\MK16-465 SE BV\170313 TP-App No 3\PCCP Run(Structural) - 12.dgpx
Report generated on: 4/25/2017 3:20 PM Page 10 of 15
by: on: 8/12/2016 12:16 PM on: 8/12/2016 12:16 PM
by: Created Approved
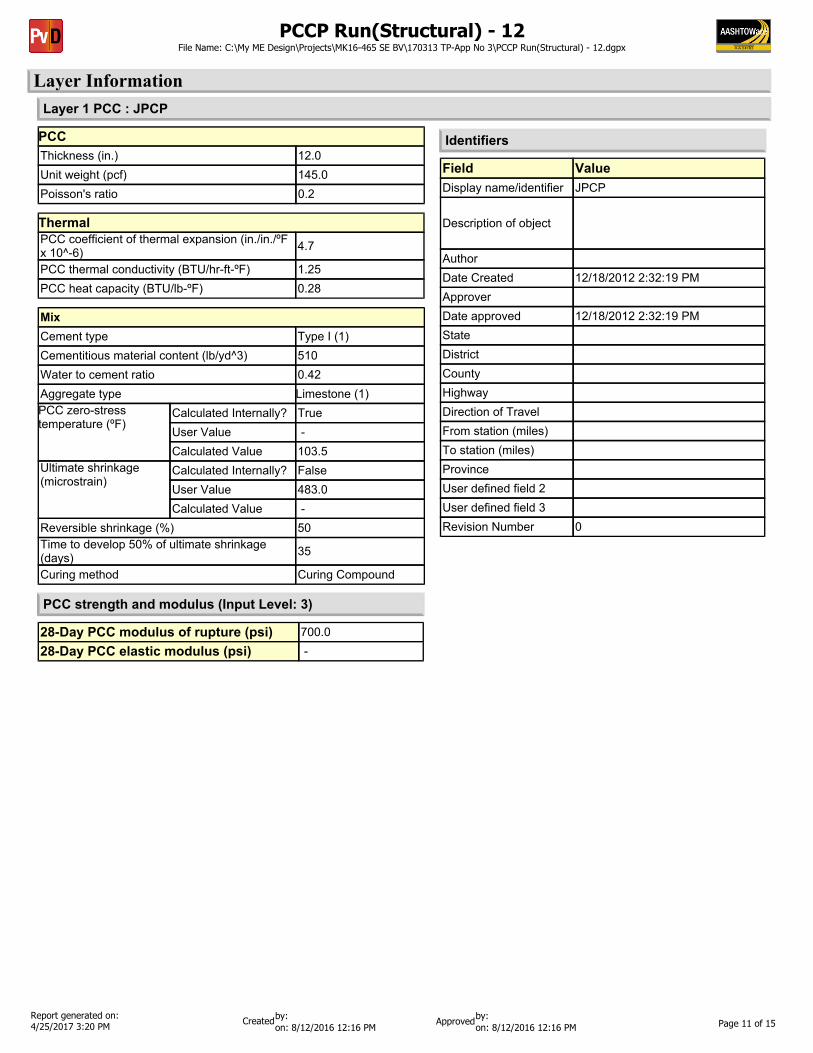
Layer InformationLayer 1 PCC : JPCP
PCCThickness (in.) 12.0Unit weight (pcf) 145.0Poisson's ratio 0.2
MixCement type Type I (1)Cementitious material content (lb/yd^3) 510Water to cement ratio 0.42Aggregate type Limestone (1)PCC zero-stress temperature (ºF)
Calculated Internally? TrueUser Value - Calculated Value 103.5
Ultimate shrinkage (microstrain)
Calculated Internally? FalseUser Value 483.0Calculated Value -
Reversible shrinkage (%) 50Time to develop 50% of ultimate shrinkage (days) 35
Curing method Curing Compound
Field ValueDisplay name/identifier JPCP
Description of object
AuthorDate Created 12/18/2012 2:32:19 PMApproverDate approved 12/18/2012 2:32:19 PMStateDistrictCountyHighwayDirection of TravelFrom station (miles)To station (miles)ProvinceUser defined field 2User defined field 3Revision Number 0
Identifiers
28-Day PCC modulus of rupture (psi) 700.028-Day PCC elastic modulus (psi) -
PCC strength and modulus (Input Level: 3)
ThermalPCC coefficient of thermal expansion (in./in./ºF x 10^-6) 4.7
PCC thermal conductivity (BTU/hr-ft-ºF) 1.25PCC heat capacity (BTU/lb-ºF) 0.28
PCCP Run(Structural) - 12File Name: C:\My ME Design\Projects\MK16-465 SE BV\170313 TP-App No 3\PCCP Run(Structural) - 12.dgpx
Report generated on: 4/25/2017 3:20 PM Page 11 of 15
by: on: 8/12/2016 12:16 PM on: 8/12/2016 12:16 PM
by: Created Approved

Layer 2 Non-stabilized Base : Unbound Drainage Layer
Liquid LimitPlasticity Index 1.0
6.0
Sieve Size % Passing0.001mm0.002mm0.020mm#200 8.7#100#80 12.9#60#50#40 20.0#30#20#16#10 33.8#8#4 44.73/8-in. 57.21/2-in. 63.13/4-in. 72.71-in. 78.81 1/2-in. 85.82-in. 91.62 1/2-in.3-in.3 1/2-in. 97.6
Is User Defined? Falseaf 7.2555bf 1.3328cf 0.8242hr 117.4000
Sieve
Is User Defined? Value
Maximum dry unit weight (pcf) False 127.2
Saturated hydraulic conductivity (ft/hr) False 5.054e-02
Specific gravity of solids False 2.7Optimum gravimetric water content (%) False 7.4
User-defined Soil Water Characteristic Curve (SWCC)
FalseIs layer compacted?
UnboundLayer thickness (in.) 3.0Poisson's ratio 0.35Coefficient of lateral earth pressure (k0) 0.5
Resilient Modulus (psi)25000.0
Modulus (Input Level: 2)
Analysis Type: Annual representative valuesMethod: Resilient Modulus (psi)
Use Correction factor for NDT modulus? - NDT Correction Factor: -
Field ValueDisplay name/identifier Unbound Drainage Layer
Description of object No. 8 Layer of Subbase for PCCP
Author Matt TaylorDate Created 1/31/2013 12:00:00 AMApproverDate approved 1/1/2011 12:00:00 AMStateDistrictCountyHighwayDirection of TravelFrom station (miles)To station (miles)ProvinceUser defined field 2User defined field 3Revision Number 0
Identifiers
PCCP Run(Structural) - 12File Name: C:\My ME Design\Projects\MK16-465 SE BV\170313 TP-App No 3\PCCP Run(Structural) - 12.dgpx
Report generated on: 4/25/2017 3:20 PM Page 12 of 15
by: on: 8/12/2016 12:16 PM on: 8/12/2016 12:16 PM
by: Created Approved

Layer 3 Subgrade : A-4
Liquid LimitPlasticity Index 5.0
21.0
Sieve Size % Passing0.001mm0.002mm0.020mm#200 60.6#100#80 73.9#60#50#40 82.7#30#20#16#10 89.9#8#4 93.03/8-in. 95.61/2-in. 96.73/4-in. 98.01-in. 98.71 1/2-in. 99.42-in. 99.62 1/2-in.3-in.3 1/2-in. 99.8
Is User Defined? Falseaf 68.8377bf 0.9983cf 0.4757hr 500.0000
Sieve
Is User Defined? Value
Maximum dry unit weight (pcf) False 119
Saturated hydraulic conductivity (ft/hr) False 7.589e-06
Specific gravity of solids False 2.7Optimum gravimetric water content (%) False 11.8
User-defined Soil Water Characteristic Curve (SWCC)
TrueIs layer compacted?
UnboundLayer thickness (in.) 14.0Poisson's ratio 0.35Coefficient of lateral earth pressure (k0) 0.5
Resilient Modulus (psi)6000.0
Modulus (Input Level: 2)
Analysis Type: Annual representative valuesMethod: Resilient Modulus (psi)
Use Correction factor for NDT modulus? - NDT Correction Factor: -
Field ValueDisplay name/identifier A-4
Description of object Default material
Author AASHTODate Created 1/1/2011 12:00:00 AMApproverDate approved 1/1/2011 12:00:00 AMStateDistrictCountyHighwayDirection of TravelFrom station (miles)To station (miles)ProvinceUser defined field 2User defined field 3Revision Number 0
Identifiers
PCCP Run(Structural) - 12File Name: C:\My ME Design\Projects\MK16-465 SE BV\170313 TP-App No 3\PCCP Run(Structural) - 12.dgpx
Report generated on: 4/25/2017 3:20 PM Page 13 of 15
by: on: 8/12/2016 12:16 PM on: 8/12/2016 12:16 PM
by: Created Approved

Layer 4 Subgrade : A-4
Liquid LimitPlasticity Index 5.0
21.0
Sieve Size % Passing0.001mm0.002mm0.020mm#200 60.6#100#80 73.9#60#50#40 82.7#30#20#16#10 89.9#8#4 93.03/8-in. 95.61/2-in. 96.73/4-in. 98.01-in. 98.71 1/2-in. 99.42-in. 99.62 1/2-in.3-in.3 1/2-in. 99.8
Is User Defined? Falseaf 68.8377bf 0.9983cf 0.4757hr 500.0000
Sieve
Is User Defined? Value
Maximum dry unit weight (pcf) False 118.4
Saturated hydraulic conductivity (ft/hr) False 8.325e-06
Specific gravity of solids False 2.7Optimum gravimetric water content (%) False 11.8
User-defined Soil Water Characteristic Curve (SWCC)
FalseIs layer compacted?
UnboundLayer thickness (in.) Semi-infinitePoisson's ratio 0.35Coefficient of lateral earth pressure (k0) 0.5
Resilient Modulus (psi)4000.0
Modulus (Input Level: 2)
Analysis Type: Annual representative valuesMethod: Resilient Modulus (psi)
Use Correction factor for NDT modulus? - NDT Correction Factor: -
Field ValueDisplay name/identifier A-4
Description of object Default material
Author AASHTODate Created 1/1/2011 12:00:00 AMApproverDate approved 1/1/2011 12:00:00 AMStateDistrictCountyHighwayDirection of TravelFrom station (miles)To station (miles)ProvinceUser defined field 2User defined field 3Revision Number 0
Identifiers
PCCP Run(Structural) - 12File Name: C:\My ME Design\Projects\MK16-465 SE BV\170313 TP-App No 3\PCCP Run(Structural) - 12.dgpx
Report generated on: 4/25/2017 3:20 PM Page 14 of 15
by: on: 8/12/2016 12:16 PM on: 8/12/2016 12:16 PM
by: Created Approved

Calibration Coefficients
IRI-jpcpC1: 0.8203 C2: 0.4417C3: 1.4929 C4: 25.24
5.4
Reliability Standard Deviation
C1: 1.0184 C2: 0.91656
Pow(0.0097*FAULT,0.5178)+0.014
PCC Faulting
C3: 0.0021848 C4: 0.000883739
C7: 1.83312C6: 0.4C5: 250 C8: 400PCC Reliability Faulting Standard Deviation
PCC CrackingCracking Coefficients
C1: 2 C2: 1.22 C5: -1.98C4: 1
Pow(5.3116*CRACK,0.3903) + 2.99PCC Reliability Cracking Standard Deviation
Fatigue Coefficients
PCCP Run(Structural) - 12File Name: C:\My ME Design\Projects\MK16-465 SE BV\170313 TP-App No 3\PCCP Run(Structural) - 12.dgpx
Report generated on: 4/25/2017 3:20 PM Page 15 of 15
by: on: 8/12/2016 12:16 PM on: 8/12/2016 12:16 PM
by: Created Approved

Design Inputs
Age (year) Heavy Trucks (cumulative)
2019 (initial) 13,2932020 (1 years) 2,403,3602021 (2 years) 4,833,390
TrafficDesign Structure
Layer type Material Type Thickness (in.):
Flexible Seymour 19.0mm PG70-22 4.0
Flexible Seymour 19.0mm PG64-22 5.5
NonStabilized A-1-a 6.0Subgrade A-4 Semi-infinite
Volumetric at Construction:Effective binder content (%) 9.5
Air voids (%) 8.0
Distress TypeDistress @ Specified
Reliability Reliability (%) Criterion Satisfied?
Target Predicted Target AchievedTerminal IRI (in./mile) 160.00 119.05 95.00 99.97 Pass
Permanent deformation - total pavement (in.) 0.75 0.33 95.00 100.00 Pass
AC bottom-up fatigue cracking (percent) 10.00 8.83 95.00 97.30 Pass
AC thermal cracking (ft/mile) 500.00 34.59 95.00 100.00 Pass
AC top-down fatigue cracking (ft/mile) 2000.00 638.55 95.00 100.00 Pass
Permanent deformation - AC only (in.) 0.40 0.24 95.00 100.00 Pass
Distress Prediction Summary
Distress Charts
Flexible PavementDesign Type:2 yearsDesign Life:
September, 2019Traffic opening:Pavement construction: July, 2019
May, 2019Base construction: Climate Data Sources (Lat/Lon)
39.144, -86.61739.71, -86.27238.228, -85.664
Design Outputs
MOTFile Name: C:\My ME Design\Projects\MK16-465 SE BV\170313 TP-App No 3\MOT.dgpx
Report generated on: 4/7/2017 10:54 AM Page 1 of 21
by: on: 10/10/2016 9:24 AM on: 10/10/2016 9:24 AM
by: Created Approved

Traffic Volume Monthly Adjustment Factors
Class 4 Class 5 Class 6 Class 7 Class 8 Class 9 Class 10 Class 11 Class 12 Class 13
Graphical Representation of Traffic Inputs
Traffic Inputs
Operational speed (mph) 70.0
Percent of trucks in design direction (%): 55.090.03 Percent of trucks in design lane (%):Number of lanes in design direction:
13,293Initial two-way AADTT:
MOTFile Name: C:\My ME Design\Projects\MK16-465 SE BV\170313 TP-App No 3\MOT.dgpx
Report generated on: 4/7/2017 10:54 AM Page 2 of 21
by: on: 10/10/2016 9:24 AM on: 10/10/2016 9:24 AM
by: Created Approved

Traffic WanderMean wheel location (in.)
Traffic wander standard deviation (in.)Design lane width (ft)
18
1012
Axle ConfigurationAverage axle width (ft) 8.5
Dual tire spacing (in.)Tire pressure (psi)
12120
Average Axle SpacingTandem axle spacing (in.)Tridem axle spacing (in.)Quad axle spacing (in.)
51.6
49.2
49.2
Wheelbase does not apply
Number of Axles per Truck
Vehicle Class
Single Axle
Tandem Axle
Tridem Axle
Quad Axle
Class 4 1.57 0.32 0 0Class 5 1.87 0 0 0Class 6 1 0.93 0 0Class 7 1.27 0.38 0.83 0.2Class 8 2.08 0.77 0 0Class 9 1.3 1.73 0 0
Class 10 1.05 1.02 0.88 0.01Class 11 4.45 0.06 0.03 0Class 12 3.63 0.96 0.03 0Class 13 2.82 1.07 0.48 0.13
Axle Configuration
Volume Monthly Adjustment Factors Level 3: Default MAF
Month Vehicle Class4 5 6 7 8 9 10 11 12 13
January 0.6 0.9 0.9 1.2 0.7 0.8 0.7 0.8 0.7 1.1February 0.9 0.9 1.0 0.6 0.9 0.9 0.9 0.9 1.0 1.4March 1.0 0.9 1.2 0.6 1.0 1.0 1.0 1.0 0.9 0.6April 1.1 1.0 1.1 0.9 0.9 1.0 1.0 1.0 0.9 0.9May 1.1 1.0 1.1 1.0 0.9 0.9 0.9 0.9 0.9 0.5June 1.1 1.3 1.0 1.1 1.1 1.1 1.1 1.0 1.1 1.0July 1.0 1.3 1.0 1.0 1.1 1.0 1.0 1.0 1.0 0.7August 1.1 1.2 1.0 1.2 1.2 1.1 1.1 1.1 1.0 0.8September 1.2 0.9 1.0 1.1 1.2 1.1 1.3 1.1 1.1 1.0October 1.0 0.8 1.0 1.2 1.0 1.1 1.1 1.1 1.0 1.0November 1.0 0.9 1.0 1.2 1.0 1.1 1.1 1.1 1.1 0.9December 0.9 1.0 0.9 0.9 0.9 1.0 0.8 1.3 1.4 2.2
Distributions by Vehicle Class
Growth Factor
Rate (%) Function1.11% Linear1.11% Linear1.11% Linear1.11% Linear1.11% Linear1.11% Linear1.11% Linear1.11% Linear1.11% Linear1.11% Linear
Vehicle ClassAADTT
Distribution (%) (Level 3)
Class 4 1.3%Class 5 22.5%Class 6 3.6%Class 7 0.7%Class 8 3.3%Class 9 64.4%Class 10 1.1%Class 11 2.1%Class 12 0.6%Class 13 0.4%
Truck Distribution by Hour does not apply
Tabular Representation of Traffic Inputs
MOTFile Name: C:\My ME Design\Projects\MK16-465 SE BV\170313 TP-App No 3\MOT.dgpx
Report generated on: 4/7/2017 10:54 AM Page 3 of 21
by: on: 10/10/2016 9:24 AM on: 10/10/2016 9:24 AM
by: Created Approved

AADTT (Average Annual Daily Truck Traffic) Growth* Traffic cap is not enforced
MOTFile Name: C:\My ME Design\Projects\MK16-465 SE BV\170313 TP-App No 3\MOT.dgpx
Report generated on: 4/7/2017 10:54 AM Page 4 of 21
by: on: 10/10/2016 9:24 AM on: 10/10/2016 9:24 AM
by: Created Approved
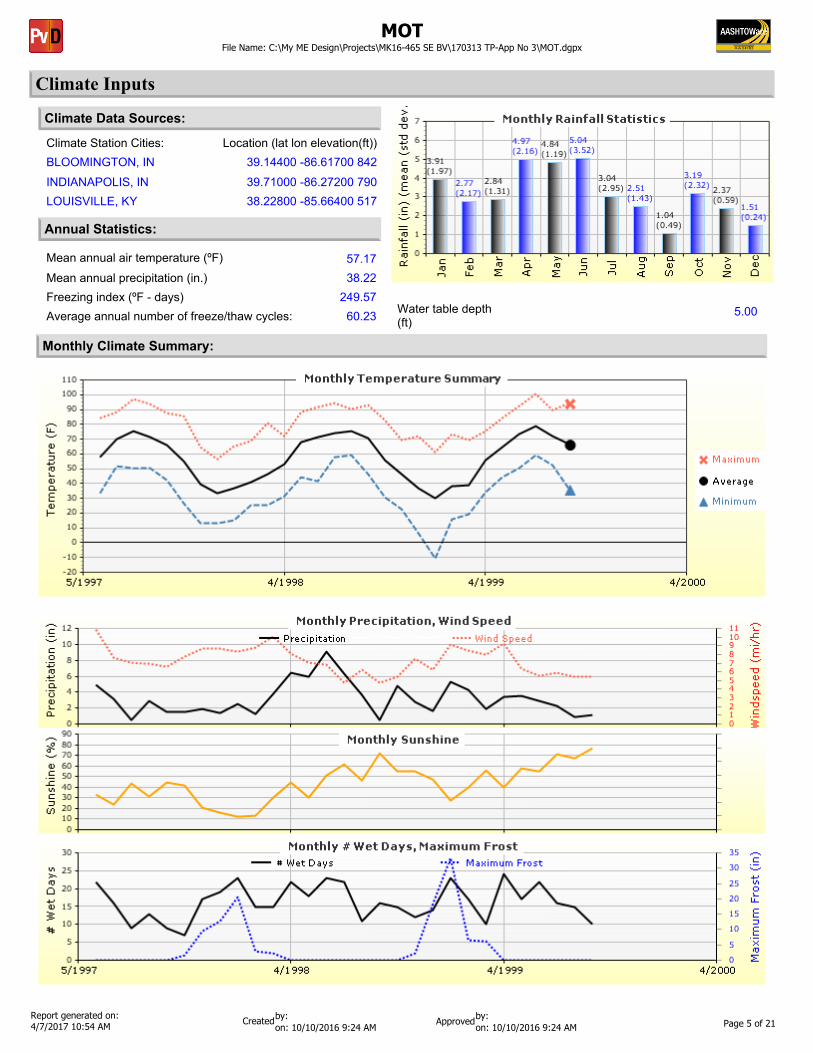
Climate Inputs
Climate Data Sources:
Climate Station Cities: Location (lat lon elevation(ft))39.14400 -86.61700 842BLOOMINGTON, IN
39.71000 -86.27200 790INDIANAPOLIS, INLOUISVILLE, KY 38.22800 -85.66400 517
Monthly Climate Summary:
Annual Statistics:
Mean annual air temperature (ºF) 57.17Mean annual precipitation (in.) 38.22Freezing index (ºF - days) 249.57Average annual number of freeze/thaw cycles: 60.23 Water table depth
(ft)5.00
MOTFile Name: C:\My ME Design\Projects\MK16-465 SE BV\170313 TP-App No 3\MOT.dgpx
Report generated on: 4/7/2017 10:54 AM Page 5 of 21
by: on: 10/10/2016 9:24 AM on: 10/10/2016 9:24 AM
by: Created Approved
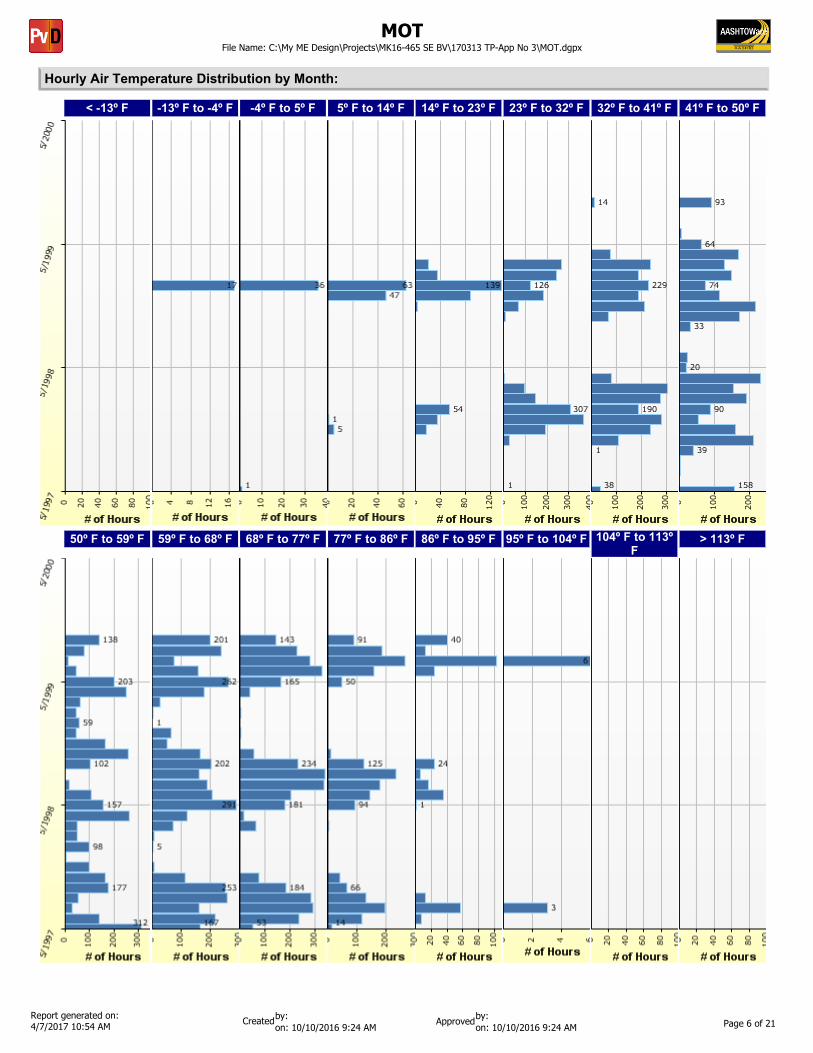
< -13º F
Hourly Air Temperature Distribution by Month:
-13º F to -4º F -4º F to 5º F 5º F to 14º F 14º F to 23º F 23º F to 32º F 32º F to 41º F 41º F to 50º F
59º F to 68º F50º F to 59º F 68º F to 77º F 77º F to 86º F 86º F to 95º F 95º F to 104º F 104º F to 113º F
> 113º F
MOTFile Name: C:\My ME Design\Projects\MK16-465 SE BV\170313 TP-App No 3\MOT.dgpx
Report generated on: 4/7/2017 10:54 AM Page 6 of 21
by: on: 10/10/2016 9:24 AM on: 10/10/2016 9:24 AM
by: Created Approved

HMA Design Properties
Layer Name Layer Type Interface Friction
Layer 1 Flexible : Seymour 19.0mm PG70-22 Flexible (1) 1.00
Layer 2 Flexible : Seymour 19.0mm PG64-22 Flexible (1) 1.00
Layer 3 Non-stabilized Base : A-1-a Non-stabilized Base (4) 1.00
Layer 4 Subgrade : A-4 Subgrade (5) -
Use Multilayer Rutting Model FalseUsing G* based model (not nationally calibrated) False
Is NCHRP 1-37A HMA Rutting Model Coefficients True
Endurance Limit - Use Reflective Cracking True
Structure - ICM PropertiesAC surface shortwave absorptivity 0.85
Design Properties
MOTFile Name: C:\My ME Design\Projects\MK16-465 SE BV\170313 TP-App No 3\MOT.dgpx
Report generated on: 4/7/2017 10:54 AM Page 7 of 21
by: on: 10/10/2016 9:24 AM on: 10/10/2016 9:24 AM
by: Created Approved

Thermal Cracking (Input Level: 3)
Indirect tensile strength at 14 ºF (psi) 579.02Creep Compliance (1/psi)
Loading time (sec) -4 ºF1 3.61e-0071 5.92e-0072 3.99e-0072 6.94e-0075 4.55e-0075 8.57e-00710 5.03e-007
-4 ºF3.61e-0078.53e-0073.99e-0071.10e-0064.55e-0071.54e-0065.03e-007
14 ºF5.92e-0078.53e-0076.94e-0071.10e-0068.57e-0071.54e-0061.00e-006
Thermal ContractionIs thermal contraction calculated? True
Mix coefficient of thermal contraction (in./in./ºF) - Aggregate coefficient of thermal contraction (in./in./ºF) 6.1e-006
Voids in Mineral Aggregate (%) 17.5
MOTFile Name: C:\My ME Design\Projects\MK16-465 SE BV\170313 TP-App No 3\MOT.dgpx
Report generated on: 4/7/2017 10:54 AM Page 8 of 21
by: on: 10/10/2016 9:24 AM on: 10/10/2016 9:24 AM
by: Created Approved

HMA Layer 1: Layer 1 Flexible : Seymour 19.0mm PG70-22
MOTFile Name: C:\My ME Design\Projects\MK16-465 SE BV\170313 TP-App No 3\MOT.dgpx
Report generated on: 4/7/2017 10:54 AM Page 9 of 21
by: on: 10/10/2016 9:24 AM on: 10/10/2016 9:24 AM
by: Created Approved

HMA Layer 2: Layer 2 Flexible : Seymour 19.0mm PG64-22
MOTFile Name: C:\My ME Design\Projects\MK16-465 SE BV\170313 TP-App No 3\MOT.dgpx
Report generated on: 4/7/2017 10:54 AM Page 10 of 21
by: on: 10/10/2016 9:24 AM on: 10/10/2016 9:24 AM
by: Created Approved
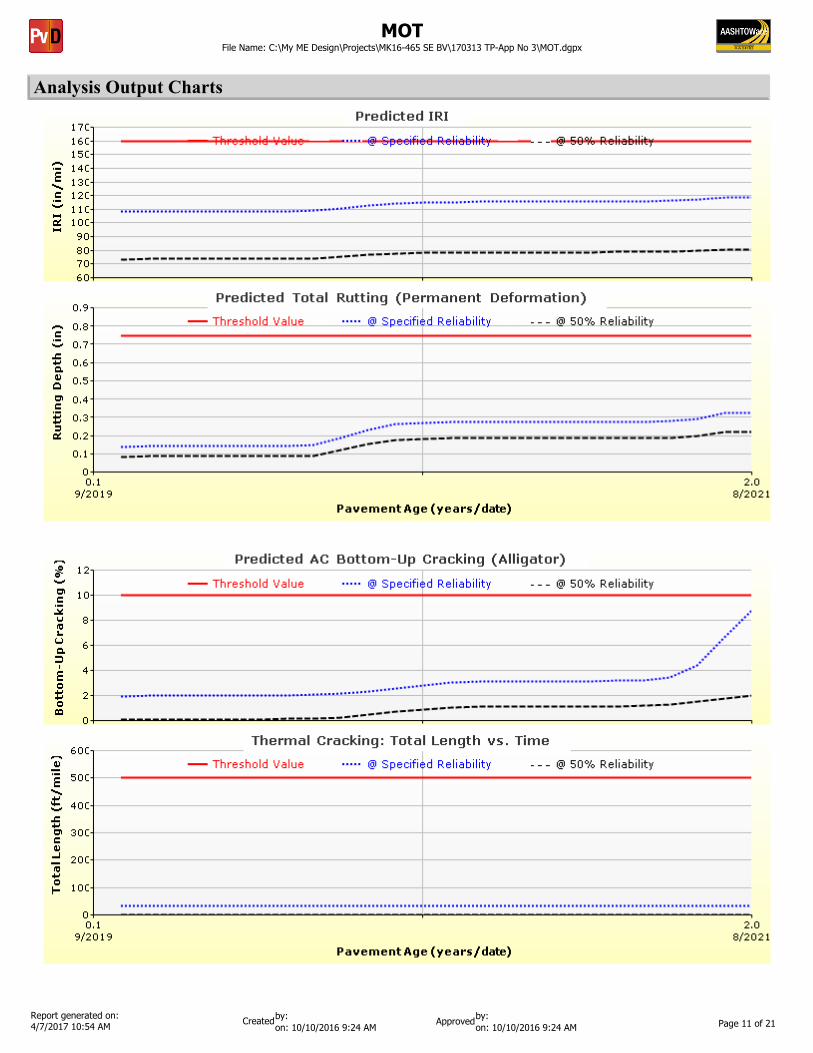
Analysis Output Charts
MOTFile Name: C:\My ME Design\Projects\MK16-465 SE BV\170313 TP-App No 3\MOT.dgpx
Report generated on: 4/7/2017 10:54 AM Page 11 of 21
by: on: 10/10/2016 9:24 AM on: 10/10/2016 9:24 AM
by: Created Approved

MOTFile Name: C:\My ME Design\Projects\MK16-465 SE BV\170313 TP-App No 3\MOT.dgpx
Report generated on: 4/7/2017 10:54 AM Page 12 of 21
by: on: 10/10/2016 9:24 AM on: 10/10/2016 9:24 AM
by: Created Approved

MOTFile Name: C:\My ME Design\Projects\MK16-465 SE BV\170313 TP-App No 3\MOT.dgpx
Report generated on: 4/7/2017 10:54 AM Page 13 of 21
by: on: 10/10/2016 9:24 AM on: 10/10/2016 9:24 AM
by: Created Approved

MOTFile Name: C:\My ME Design\Projects\MK16-465 SE BV\170313 TP-App No 3\MOT.dgpx
Report generated on: 4/7/2017 10:54 AM Page 14 of 21
by: on: 10/10/2016 9:24 AM on: 10/10/2016 9:24 AM
by: Created Approved

MOTFile Name: C:\My ME Design\Projects\MK16-465 SE BV\170313 TP-App No 3\MOT.dgpx
Report generated on: 4/7/2017 10:54 AM Page 15 of 21
by: on: 10/10/2016 9:24 AM on: 10/10/2016 9:24 AM
by: Created Approved

Layer InformationLayer 1 Flexible : Seymour 19.0mm PG70-22
Asphalt Binder
Temperature (ºF) Binder Gstar (Pa) Phase angle (deg)40 22069340.66 33.7655 9518271.99 44.3970 2836317.75 52.8785 765738.66 59.68100 209102.28 65.17115 60602.87 69.62130 19021.84 73.24
T ( ºF) 0.1 Hz10 296303040 228693470 368909100 72377130 31704
25 Hz500000032202801308064458741179591
1 Hz3640294257860870501016883461317
10 Hz420028328529711078041345974130686
Asphalt Dynamic Modulus (Input Level: 1)
AsphaltThickness (in.) 4.0Unit weight (pcf) 143.8Poisson's ratio Is Calculated? False
Ratio 0.35Parameter A - Parameter B -
General Info
Name ValueReference temperature (ºF) 70Effective binder content (%) 9.53Air voids (%) 8Thermal conductivity (BTU/hr-ft-ºF) 0.63Heat capacity (BTU/lb-ºF) 0.31
Field ValueDisplay name/identifier Seymour 19.0mm PG70-22
Description of object HMA
AuthorDate Created 1/1/2011 12:00:00 AMApproverDate approved 1/1/2011 12:00:00 AMStateDistrictCountyHighwayDirection of TravelFrom station (miles)To station (miles)ProvinceUser defined field 2User defined field 3Revision Number 0
Identifiers
MOTFile Name: C:\My ME Design\Projects\MK16-465 SE BV\170313 TP-App No 3\MOT.dgpx
Report generated on: 4/7/2017 10:54 AM Page 16 of 21
by: on: 10/10/2016 9:24 AM on: 10/10/2016 9:24 AM
by: Created Approved

Layer 2 Flexible : Seymour 19.0mm PG64-22
Asphalt Binder
Temperature (ºF) Binder Gstar (Pa) Phase angle (deg)40 25339156.98 34.8555 9930922.35 46.670 2585999.72 55.7985 613653.8 63100 149927.8 68.71115 39662.01 73.23130 11579.02 76.83
T ( ºF) 0.1 Hz10 306842440 201903870 256999100 52936130 26742
25 Hz500000035101851370481442511162720
1 Hz3745817260587562084313566750370
10 Hz414701130657291094369319812114566
Asphalt Dynamic Modulus (Input Level: 1)
AsphaltThickness (in.) 5.5Unit weight (pcf) 143.8Poisson's ratio Is Calculated? False
Ratio 0.35Parameter A - Parameter B -
General Info
Name ValueReference temperature (ºF) 70Effective binder content (%) 9.53Air voids (%) 8Thermal conductivity (BTU/hr-ft-ºF) 0.63Heat capacity (BTU/lb-ºF) 0.31
Field ValueDisplay name/identifier Seymour 19.0mm PG64-22
Description of object HMA
AuthorDate Created 1/1/2011 12:00:00 AMApproverDate approved 1/1/2011 12:00:00 AMStateDistrictCountyHighwayDirection of TravelFrom station (miles)To station (miles)ProvinceUser defined field 2User defined field 3Revision Number 0
Identifiers
MOTFile Name: C:\My ME Design\Projects\MK16-465 SE BV\170313 TP-App No 3\MOT.dgpx
Report generated on: 4/7/2017 10:54 AM Page 17 of 21
by: on: 10/10/2016 9:24 AM on: 10/10/2016 9:24 AM
by: Created Approved

Layer 3 Non-stabilized Base : A-1-a
Liquid LimitPlasticity Index 1.0
6.0
Sieve Size % Passing0.001mm0.002mm0.020mm#200 8.7#100#80 12.9#60#50#40 20.0#30#20#16#10 33.8#8#4 44.73/8-in. 57.21/2-in. 63.13/4-in. 72.71-in. 78.81 1/2-in. 85.82-in. 91.62 1/2-in.3-in.3 1/2-in. 97.6
Is User Defined? Falseaf 7.2555bf 1.3328cf 0.8242hr 117.4000
Sieve
Is User Defined? Value
Maximum dry unit weight (pcf) False 127.2
Saturated hydraulic conductivity (ft/hr) False 5.054e-02
Specific gravity of solids False 2.7Optimum gravimetric water content (%) False 7.4
User-defined Soil Water Characteristic Curve (SWCC)
FalseIs layer compacted?
UnboundLayer thickness (in.) 6.0Poisson's ratio 0.35Coefficient of lateral earth pressure (k0) 0.5
Resilient Modulus (psi)6000.0
Modulus (Input Level: 2)
Analysis Type: Annual representative valuesMethod: Resilient Modulus (psi)
Use Correction factor for NDT modulus? - NDT Correction Factor: -
Field ValueDisplay name/identifier A-1-a
Description of object Subgrade Treatment, Type III
Author AASHTODate Created 1/1/2011 12:00:00 AMApproverDate approved 1/1/2011 12:00:00 AMStateDistrictCountyHighwayDirection of TravelFrom station (miles)To station (miles)ProvinceUser defined field 2User defined field 3Revision Number 0
Identifiers
MOTFile Name: C:\My ME Design\Projects\MK16-465 SE BV\170313 TP-App No 3\MOT.dgpx
Report generated on: 4/7/2017 10:54 AM Page 18 of 21
by: on: 10/10/2016 9:24 AM on: 10/10/2016 9:24 AM
by: Created Approved

Layer 4 Subgrade : A-4
Liquid LimitPlasticity Index 5.0
21.0
Sieve Size % Passing0.001mm0.002mm0.020mm#200 60.6#100#80 73.9#60#50#40 82.7#30#20#16#10 89.9#8#4 93.03/8-in. 95.61/2-in. 96.73/4-in. 98.01-in. 98.71 1/2-in. 99.42-in. 99.62 1/2-in.3-in.3 1/2-in. 99.8
Is User Defined? Falseaf 68.8377bf 0.9983cf 0.4757hr 500.0000
Sieve
Is User Defined? Value
Maximum dry unit weight (pcf) False 118.4
Saturated hydraulic conductivity (ft/hr) False 8.325e-06
Specific gravity of solids False 2.7Optimum gravimetric water content (%) False 11.8
User-defined Soil Water Characteristic Curve (SWCC)
FalseIs layer compacted?
UnboundLayer thickness (in.) Semi-infinitePoisson's ratio 0.35Coefficient of lateral earth pressure (k0) 0.5
Resilient Modulus (psi)4000.0
Modulus (Input Level: 2)
Analysis Type: Annual representative valuesMethod: Resilient Modulus (psi)
Use Correction factor for NDT modulus? - NDT Correction Factor: -
Field ValueDisplay name/identifier A-4
Description of object Default material
Author AASHTODate Created 1/1/2011 12:00:00 AMApproverDate approved 1/1/2011 12:00:00 AMStateDistrictCountyHighwayDirection of TravelFrom station (miles)To station (miles)ProvinceUser defined field 2User defined field 3Revision Number 0
Identifiers
MOTFile Name: C:\My ME Design\Projects\MK16-465 SE BV\170313 TP-App No 3\MOT.dgpx
Report generated on: 4/7/2017 10:54 AM Page 19 of 21
by: on: 10/10/2016 9:24 AM on: 10/10/2016 9:24 AM
by: Created Approved
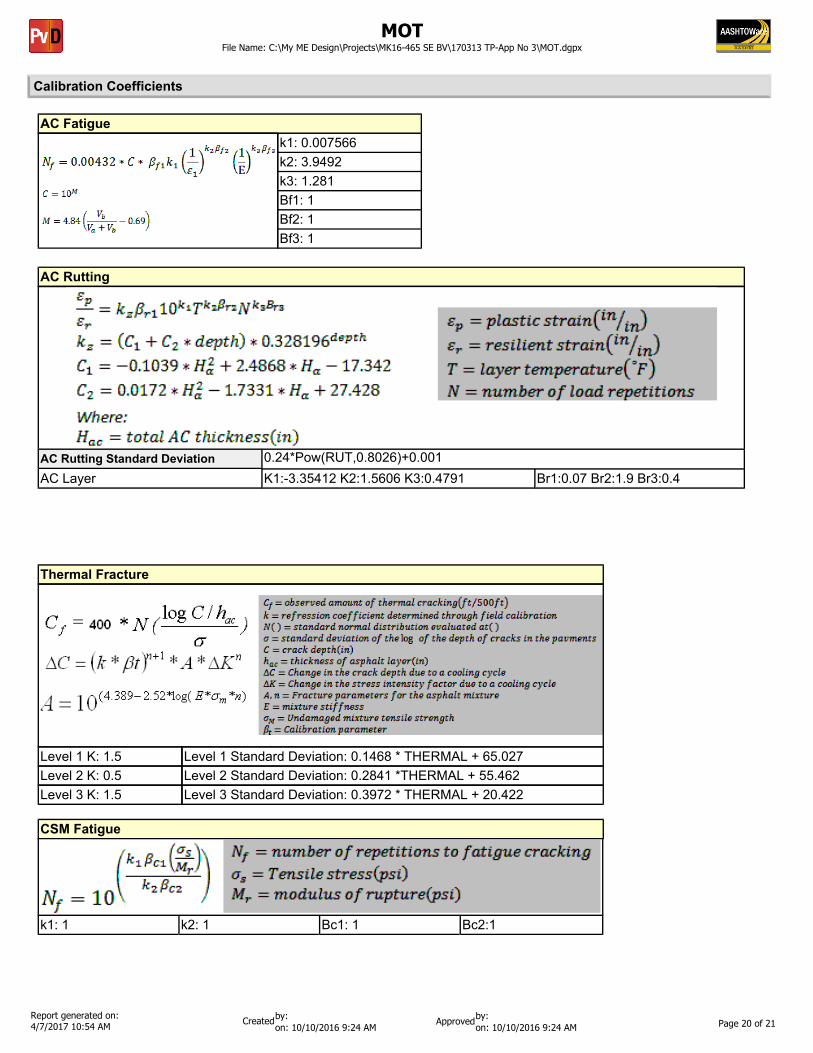
Calibration Coefficients
k1: 0.007566k2: 3.9492k3: 1.281Bf1: 1Bf2: 1Bf3: 1
AC Fatigue
AC Layer K1:-3.35412 K2:1.5606 K3:0.4791 Br1:0.07 Br2:1.9 Br3:0.40.24*Pow(RUT,0.8026)+0.001
AC Rutting
AC Rutting Standard Deviation
Level 1 K: 1.5Level 2 K: 0.5Level 3 K: 1.5
Level 1 Standard Deviation: 0.1468 * THERMAL + 65.027Level 2 Standard Deviation: 0.2841 *THERMAL + 55.462 Level 3 Standard Deviation: 0.3972 * THERMAL + 20.422
Thermal Fracture
k1: 1 k2: 1 Bc1: 1 Bc2:1
CSM Fatigue
MOTFile Name: C:\My ME Design\Projects\MK16-465 SE BV\170313 TP-App No 3\MOT.dgpx
Report generated on: 4/7/2017 10:54 AM Page 20 of 21
by: on: 10/10/2016 9:24 AM on: 10/10/2016 9:24 AM
by: Created Approved

Subgrade Rutting
Granular Finek1: 2.03 Bs1: 0.12 k1: 1.35 Bs1: 0.12Standard Deviation (BASERUT)0.1477*Pow(BASERUT,0.6711)+0.001
Standard Deviation (BASERUT)0.1235*Pow(SUBRUT,0.5012)+0.001
c1: 7 c2: 3.5
200 + 2300/(1+exp(1.072-2.1654*LOG10(TOP+0.0001)))
AC Cracking
1.13+13/(1+exp(7.57-15.5*LOG10(BOTTOM+0.0001)))
AC Top Down Cracking AC Bottom Up Cracking
c3: 0 c4: 1000 c3: 6000c2: 1c1: 1AC Cracking Top Standard Deviation AC Cracking Bottom Standard Deviation
C1: 1 C2: 1
CSM Cracking
C4: 1000C3: 0
CTB*1CSM Standard Deviation
IRI Flexible Pavements
C3: 0.008 C4: 0.015C1: 40 C2: 0.4
MOTFile Name: C:\My ME Design\Projects\MK16-465 SE BV\170313 TP-App No 3\MOT.dgpx
Report generated on: 4/7/2017 10:54 AM Page 21 of 21
by: on: 10/10/2016 9:24 AM on: 10/10/2016 9:24 AM
by: Created Approved


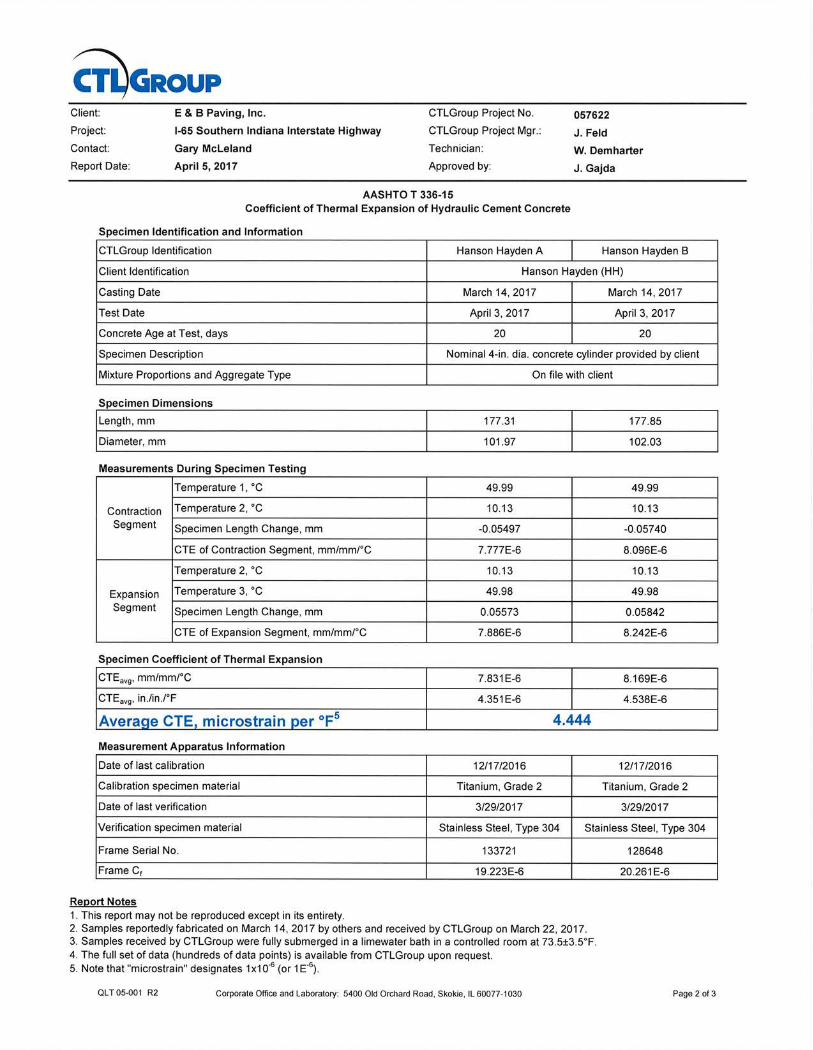


INDOT DES NO: INDOT Contract NO: R-28940Project Description: INDOT Letting Date: 4/27/17Utility Coordinator: Ready for Contract Date: INDOT Oversight Agen Design Consultant: United ConsultingINDOT Project Manage
Utility Coordinator
AT&T Indiana; Troy Bishop
Communications
Copper and Fiber Optic
UTIL 1.35Along SR 58 near
I-65, AT&T appears to be
outside the R/W. Easement?
Need confirmation of
locations
Need to widen SR58 at I-65
ramps and place new signals in addition to new signal at SR 58
and International Dr
We anticipate designing the signal to avoid impacting utility
facilities
$0
AT&T knows they are in a drainage and utility easement on E side of I-65, and are checking their records to see if they are in an easement along SR 58. They have fiber optic and copper on the N side of SR 58 at International Dr. They also state they have aerial and underground facilities along International, but UC cannot find aerial lines in 2014 dated streetview.
AT&T Indiana; Troy Bishop
Communications Fiber Optic
UTIL 1.35Fiber Optic line
between Indy and Louisville in
easement on E side US31
Need confirmation of locations and
easement information
Need to change flasher to temp
signal at SR 250 and US31
Use existing poles, no impact
expected$0
The fiber optic line is a connection between Louisville and Indy, size and depth unknown, easement info unknown, hopefully easement is east of existing pole on NE corner
Bartholomew County REMC;
Marvin Book [email protected]
Power 12.5kV
12.5 kV Aerial facilities cross I-65 725' north of
SR58. Should be little to no impact, other than OSHA
clearance for voltage.
2946+00Line "A"
Need clearance above I-65.
Height of electric wire over I-65 combined with required buffer around wire is a safety/constructa
bility issue
Profile will be reviewed, and
adjusted if necessary, in this location to avoid
impacting facilities; warning signs will need to be placed near wires for safety
$0 This is a constructability and safety issue.
Bartholomew County REMC;
Marvin Book [email protected]
Power 12.5kV??
12.5 kV? Aerial facilities along the north side of SR
58. Will likely conflict with signal pole locations at
International Dr.
Signal needed at SR 58 and
International Dr. Electric facilities
are likely too close to road to
set poles
Need to set poles for a new signal
at SR 58 and International Dr.
Place signal poles less than 5 feet from edge of
pavement and risk poles being
hit by turning movements of
trucks
N Unknown Yes, per INDOT
Poles may be at, or very close to, the R/W line. Any moving of the lines away from the road would result in the need for either the purchase of R/W or obtaining an easement. Having the line go underground may be another option, but there is already gas (E and S sides), 2 water lines (N and W sides), sewer (N side), at least 2 telecom lines (N and W sides), and an UG power line (SE to NW)at this intersection. In addition, if these overhead lines are considered transmission, the REMC may not be able to de-energize the lines and window for relocation could be very difficult to coordinate with.
0501212I-65 Pavement Replacement and Pavement RehabilitationGreg BrozBill ReadWhitney Carlin
Utility Type Material and Size
This color denotes a constructability issueThis color denotes that a conflict is likelyThis color denotes that a conflict is probable This color denotes that there is a small conflict chance or more info needed to determine
Description Of Design Conflict
With Utility
Phone No: 317-895-2585
Utility Relocatio
n Plan
Start Offset
End Station
Utility Relocatio
n Reimburs
able
Design Around
Estimated Cost*
Start Station
Estimated Utility
Relocation Cost
Design Around Alternative description*
Utility Name & Contact Person
Project Design and Utility SummaryReporting Period:
End Offset
Utility Investigation Level Needed
Designer's Justification To
Impact The Utility
Project Team CollaborationUtility CoordinatorDesigner (collaboration with Utility Coordinator as needed)
Additional Information/Recommended Resolution
Page 1 of 8

Utility Coordinator
Utility Type Material and Size
Description Of Design Conflict
With Utility
Utility Relocatio
n Plan
Start Offset
End Station
Utility Relocatio
n Reimburs
able
Design Around
Estimated Cost*
Start Station
Estimated Utility
Relocation Cost
Design Around Alternative description*
Utility Name & Contact Person
End Offset
Utility Investigation Level Needed
Designer's Justification To
Impact The Utility
Project Team CollaborationUtility CoordinatorDesigner (collaboration with Utility Coordinator as needed)
Additional Information/Recommended Resolution
Bartholomew County REMC;
Marvin Book [email protected]
Power 7.2kV 7.2 kV line UG "at 700S"
Approx.2795+00Line "A"
Not located; need depths
Need to set drainage
structures, and may need to re-grade ditches
No assessment can be made at
this time
There is already a water line located in the area and if there is a need for median drainage, or changes to the grade of the ditch lines, there is concern that the line could be hit since both depth and location are unknown.
Bartholomew County REMC;
Marvin Book [email protected]
Power 7.2kV 7.2 kV Aerial Facilities at 800S
2735+00Line "A"
"low" voltage, but also possible low
clearance
Height of electric wire over I-65 combined with required buffer around wire is a safety/constructa
bility issue
Profile will be reviewed, and
adjusted if necessary, in this location to avoid
impacting facilities; warning signs will need to be placed near wires for safety
$0 This is a constructability and safety issue.
Bartholomew County REMC;
Marvin Book [email protected]
Power 7.2kV
7.2 kV Aerial Facilities 1000' north of 1100N
(Jack./Barth. Co line) 2566+4
0Line "A"
"low" voltage, but also possible low
clearance
Height of electric wire over I-65 combined with required buffer around wire is a safety/constructa
bility issue
Profile will be reviewed, and
adjusted if necessary, in this location to avoid
impacting facilities; warning signs will need to be placed near wires for safety
$0 This is a constructability and safety issue.
Bartholomew County REMC;
Marvin Book [email protected]
Power
UG facilities under and across
SR 58 and International Dr. from SE quad to NW quad also appears that
there is UG feed from pole on NE quad to switch
gear in NW quad
Not located; need depths
Need to set poles for a new signal
at SR 58 and International Dr.
We anticipate designing the signal to avoid impacting utility
facilities
$0 N Unknown Yes, per INDOT
Underground power lines run from the SE corner to the NW corner according to Bartholomew Co REMC maps. The survey did not pick up this or several other utilities, but based on other utility information it is very probable that UG power crosses a gas line in the SE corner of the intersection. Placement of a pole in this corner without relocation will be very difficult. See 3c for explanation of this area.
Page 2 of 8

Utility Coordinator
Utility Type Material and Size
Description Of Design Conflict
With Utility
Utility Relocatio
n Plan
Start Offset
End Station
Utility Relocatio
n Reimburs
able
Design Around
Estimated Cost*
Start Station
Estimated Utility
Relocation Cost
Design Around Alternative description*
Utility Name & Contact Person
End Offset
Utility Investigation Level Needed
Designer's Justification To
Impact The Utility
Project Team CollaborationUtility CoordinatorDesigner (collaboration with Utility Coordinator as needed)
Additional Information/Recommended Resolution
Columbus City UtilitiesEd Bergsieker
Water & Sewer ??
UTIL 1.34Water line
crosses SR 58 on west side of
International Dr. Sewer line
crosses under SR58 300 ft east of International Dr. Water line also parallel to
SR 58 along the north side.
Need to determine depths
and actual locations
Need to set poles for a new signal
at SR 58 and International Dr.
We anticipate designing the signal to avoid impacting utility
facilities
$0
Survey did not pick up sanitary sewer near intersection. Sewer may be out of the way, but any water line relocation on the north side would have to consider the proper buffer (>10') between a water supply line and a sanitary sewer line running parallel to each other. See 3c for explanation of this area. City is also planning on replacing/improving the water line along the north side of SR 58 (since we don't have proper survey information, I am going to assume this means there are 2 water lines ; 1 for SW Barth. CO and 1 for Columbus). Utility "would like to have a designated corridor for our water main improvements"
Comcast;Tom Davis
Communications ??
Comcast crosses under I-65
between Bode and 760E north of SR 11. This may become an issue when drainage is
directed away from RR that is
north of this location
2502+50Line "A"
TH33 5.53', TH36 7.12'
required to direct drainage away from RR R/W
Proposed ditch elevations must maintain cover over existing
facilities
Comcast;Tom Davis
Communications ??
Comcast has several lines at
International and SR 58.
W side of International & N
side of SR58
Need to determine depths
and actual locations
Need to set poles for a new signal
at SR 58 and International Dr.
We anticipate designing the signal to avoid impacting utility
facilities
$0
This CATV was not picked up in the survey; but utility map shows them to be on the N and W sides of the intersection. Actual locations and depths unknown. See 3c for explanation of this area.
Duke Energy - Distribution
Gabe GibsonPower 12.5kV
12.5kV Aerial Facilities on east and west side of I-
65 north of US 50. 2214+5
0Line "A"
Possible low clearance
Height of electric wire over I-65 combined with required buffer around wire is a safety/constructa
bility issue
Profile will be reviewed, and
adjusted if necessary, in this location to avoid
impacting facilities; warning signs will need to be placed near wires for safety
$0 This is a constructability and safety issue.
Page 3 of 8
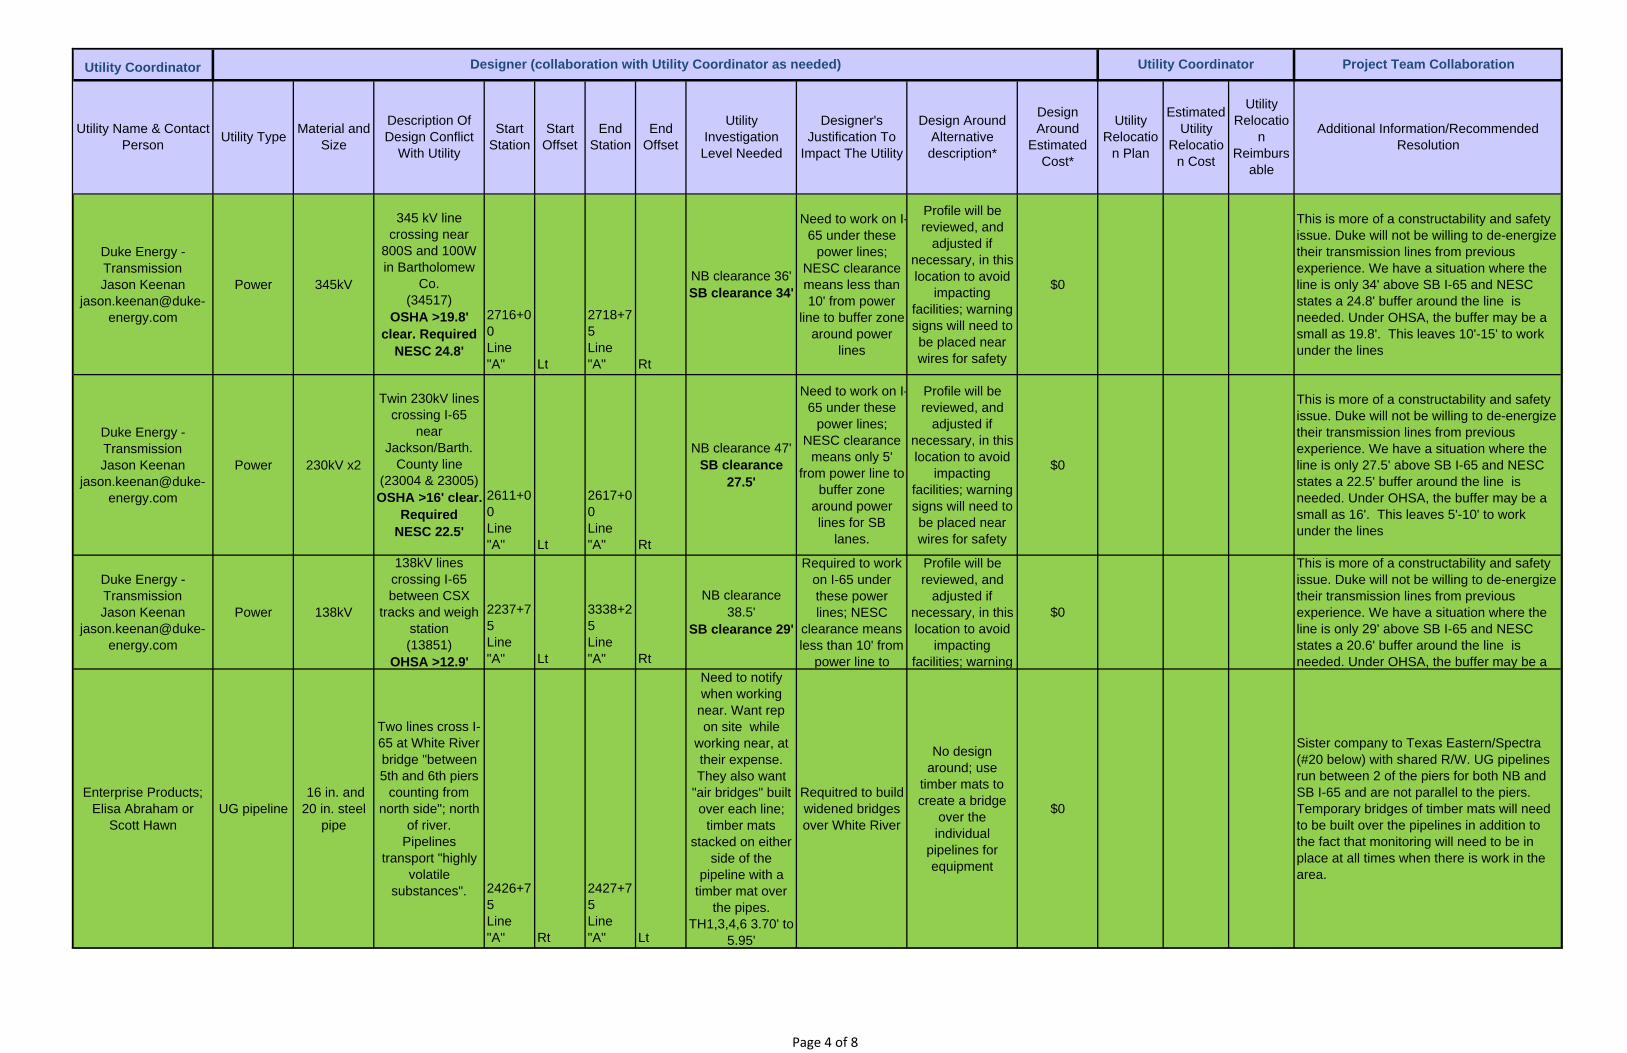
Utility Coordinator
Utility Type Material and Size
Description Of Design Conflict
With Utility
Utility Relocatio
n Plan
Start Offset
End Station
Utility Relocatio
n Reimburs
able
Design Around
Estimated Cost*
Start Station
Estimated Utility
Relocation Cost
Design Around Alternative description*
Utility Name & Contact Person
End Offset
Utility Investigation Level Needed
Designer's Justification To
Impact The Utility
Project Team CollaborationUtility CoordinatorDesigner (collaboration with Utility Coordinator as needed)
Additional Information/Recommended Resolution
Duke Energy - TransmissionJason Keenan
Power 345kV
345 kV line crossing near
800S and 100W in Bartholomew
Co. (34517)
OSHA >19.8' clear. Required
NESC 24.8'
2716+00Line "A" Lt
2718+75Line "A" Rt
NB clearance 36'SB clearance 34'
Need to work on I-65 under these
power lines; NESC clearance means less than 10' from power
line to buffer zone around power
lines
Profile will be reviewed, and
adjusted if necessary, in this location to avoid
impacting facilities; warning signs will need to be placed near wires for safety
$0
This is more of a constructability and safety issue. Duke will not be willing to de-energize their transmission lines from previous experience. We have a situation where the line is only 34' above SB I-65 and NESC states a 24.8' buffer around the line is needed. Under OHSA, the buffer may be a small as 19.8'. This leaves 10'-15' to work under the lines
Duke Energy - TransmissionJason Keenan
Power 230kV x2
Twin 230kV lines crossing I-65
near Jackson/Barth.
County line(23004 & 23005)OSHA >16' clear.
RequiredNESC 22.5'
2611+00Line "A" Lt
2617+00Line "A" Rt
NB clearance 47'SB clearance
27.5'
Need to work on I-65 under these
power lines; NESC clearance
means only 5' from power line to
buffer zone around power lines for SB
lanes.
Profile will be reviewed, and
adjusted if necessary, in this location to avoid
impacting facilities; warning signs will need to be placed near wires for safety
$0
This is more of a constructability and safety issue. Duke will not be willing to de-energize their transmission lines from previous experience. We have a situation where the line is only 27.5' above SB I-65 and NESC states a 22.5' buffer around the line is needed. Under OHSA, the buffer may be a small as 16'. This leaves 5'-10' to work under the lines
Duke Energy - TransmissionJason Keenan
Power 138kV
138kV lines crossing I-65 between CSX
tracks and weigh station(13851)
OHSA >12.9'
2237+75Line "A" Lt
3338+25Line "A" Rt
NB clearance 38.5'
SB clearance 29'
Required to work on I-65 under these power lines; NESC
clearance means less than 10' from
power line to
Profile will be reviewed, and
adjusted if necessary, in this location to avoid
impacting facilities; warning
$0
This is more of a constructability and safety issue. Duke will not be willing to de-energize their transmission lines from previous experience. We have a situation where the line is only 29' above SB I-65 and NESC states a 20.6' buffer around the line is needed. Under OHSA, the buffer may be a
Enterprise Products; Elisa Abraham or
Scott HawnUG pipeline
16 in. and 20 in. steel
pipe
Two lines cross I-65 at White River bridge "between 5th and 6th piers
counting from north side"; north
of river.Pipelines
transport "highly volatile
substances". 2426+75Line "A" Rt
2427+75Line "A" Lt
Need to notify when working
near. Want rep on site while
working near, at their expense. They also want
"air bridges" built over each line;
timber mats stacked on either
side of the pipeline with a
timber mat over the pipes.
TH1,3,4,6 3.70' to 5.95'
Requitred to build widened bridges over White River
No design around; use
timber mats to create a bridge
over the individual
pipelines for equipment
$0
Sister company to Texas Eastern/Spectra (#20 below) with shared R/W. UG pipelines run between 2 of the piers for both NB and SB I-65 and are not parallel to the piers. Temporary bridges of timber mats will need to be built over the pipelines in addition to the fact that monitoring will need to be in place at all times when there is work in the area.
Page 4 of 8

Utility Coordinator
Utility Type Material and Size
Description Of Design Conflict
With Utility
Utility Relocatio
n Plan
Start Offset
End Station
Utility Relocatio
n Reimburs
able
Design Around
Estimated Cost*
Start Station
Estimated Utility
Relocation Cost
Design Around Alternative description*
Utility Name & Contact Person
End Offset
Utility Investigation Level Needed
Designer's Justification To
Impact The Utility
Project Team CollaborationUtility CoordinatorDesigner (collaboration with Utility Coordinator as needed)
Additional Information/Recommended Resolution
Frontier Communications;
Mark Gibson
Communications UG Copper
They suspect UG copper is on east
side of 800E. Inactive per FTR
2503+50Line "A"
Inactive line located on west side of 800E;
Frontier admits old plans are inaccurate, so
inactive line likely theirs
required to direct drainage away from RR R/W
Frontier has repeatedly stated this is abandoned and is not on their
current maps. Should be ok to
remove
$0 Contact Frontier and confirm removal of inactive/abandoned line is acceptable.
Frontier Communications;
Mark Gibson
Communications
Copper and fiber optic lines; both UG and aerial
UG copper and F.O. at 1100N
2556+25Line "A"
UG at 1100 N is possibly shallow
(TH27 3.65', TH30 4.08')
for possible changes to proposed drainage
Profile will be adjusted as necessary to
maintain clearance
$0
Frontier Communications;
Mark Gibson
Communications
Copper and fiber optic lines; both UG and aerial
UTIL 1.31 UG fiber on W side of US31
Aerial fiber S side SR250
Copper facilities in the area of
US31 & SR250
need depths and locations if the existing signal equipment at
SR250 and US31 cannot handle
temp signal heads
Need to change flasher to temp
signal at SR 250 and US31
Use existing poles, no impact
expected$0
This only becomes an issue if the existing poles and foundations will not be able to handle a switch from a flasher to a temp signal. UG fiber optic along the W side, and copper lines that are in the area but no information about whether or not they are UG or aerial.
Jackson County REMC;
Mark SmallwoodPower
Single phase 7.2
kV3 phase
15kV
Five aerial crossings;
single phase @ 700N
single phase @ 800N
single phase @ 925N
3 phase 3100ft S of SR11 (this
clearance over I-65 between 24'
and 25')3 phase 3900ft N
of SR11
2281+902341+752378+552460+502531+50allLine "A"
work within 20' of poles needs
REMC approval. 3 phase crossing S of SR 11 could
be impacted
Height of electric wire over I-65 combined with required buffer around wire is a safety/constructa
bility issue
Profile will be reviewed, and
adjusted if necessary, in this location to avoid
impacting facilities; warning signs will need to be placed near wires for safety
$0 This is a constructability and safety issue.
Jackson County REMC;
Mark SmallwoodPower
Likely Single phase 7.2
kV3 phase
15kV
Aerial trans. and dist. facilities on west side of US
31 and south side of SR250
need to confirm voltages and clearances.
Need to change flasher to temp
signal at SR 250 and US31
Use existing poles, no impact
expected$0
This only becomes an issue if the existing poles and foundations will not be able to handle a switch from a flasher to a temp signal. Aerial power lines are on the W and S sides of the intersection.
Page 5 of 8

Utility Coordinator
Utility Type Material and Size
Description Of Design Conflict
With Utility
Utility Relocatio
n Plan
Start Offset
End Station
Utility Relocatio
n Reimburs
able
Design Around
Estimated Cost*
Start Station
Estimated Utility
Relocation Cost
Design Around Alternative description*
Utility Name & Contact Person
End Offset
Utility Investigation Level Needed
Designer's Justification To
Impact The Utility
Project Team CollaborationUtility CoordinatorDesigner (collaboration with Utility Coordinator as needed)
Additional Information/Recommended Resolution
Jackson County Water Utility; Larry McIntosh manager@jacksoncou
ntywater.com
Water 6 in. & 3 in.
UTIL 1.336" on W side of
US313" on N side of
SR250
need depths and locations if the existing signal equipment at
SR250 and US31 cannot handle
temp signal heads
Need to change flasher to temp
signal at SR 250 and US31
Use existing poles, no impact
expected$0
This only becomes an issue if the existing poles and foundations will not be able to handle a switch from a flasher to a temp signal. Water lines are on the N and W sides of the intersection.
Smithville Communications;Joseph Bryniarski
Communications
fiber, in 1.25 in. duct plus empty duct
Crossing under SR 58 on west
side of International Dr
Need to determine
depths; location appears to be only telecom picked up in survey, only
possible conflict if loops need to be
placed for EB SR58
placing loop wire to run to the
control cabinetWireless pucks
Southwestern Bartholomew Water
Corp.; Alan Ross [email protected]
Water 3 in. PVC
Water main along the north side of
SR 58 at International Dr.
need depths and locations since all
notes prior to Add. #4 stated
they were not in the project.
Need to set poles for a new signal
at SR 58 and International Dr.
We anticipate designing the signal to avoid impacting utility
facilities
$0
This water company was not known about until after mid-March 2017. They state they are on the N side of SR 58. This utility was not picked up in the survey. Water line they comment on is likely different from the Columbus City Utility water line, meaning there are 2 water lines and a sanitary sewer line on N side of SR 58. See 3c for explanation of this area.
Texas Eastern Gas Pipeline (Spectra
Energy);Doug Wessel
pdwessel@spectraenergy
UG Pipeline 24 in. Steel
Similar location to Enterprise
products; north of East Fork White
River
2426+75Line "A" Rt
2427+75Line "A" Lt
Need to notify when working
near. Want rep on site while
working near, at their expense. They also want
"air bridges" built over each line;
timber mats stacked on either
side of the pipeline with a
timber mat over the pipes. They
are will be adding another pipeline
by fall 2018TH2&5 1.22'(#5)
Required to build widened bridges over White River
no design around; use
timber mats to create a bridge
over the individual
pipelines for equipment
$0
Sister company to Enterprise at #11; pipelines are in a shared R/W with Enterprise. They will be adding another line in the middle of the 3 existing lines before the end of 2018. They will require the same timber mat temp bridging over their pipelines and monitoring that Enterprise is asking for.
Page 6 of 8

Utility Coordinator
Utility Type Material and Size
Description Of Design Conflict
With Utility
Utility Relocatio
n Plan
Start Offset
End Station
Utility Relocatio
n Reimburs
able
Design Around
Estimated Cost*
Start Station
Estimated Utility
Relocation Cost
Design Around Alternative description*
Utility Name & Contact Person
End Offset
Utility Investigation Level Needed
Designer's Justification To
Impact The Utility
Project Team CollaborationUtility CoordinatorDesigner (collaboration with Utility Coordinator as needed)
Additional Information/Recommended Resolution
Vectren Energy;Sandra Buening and
Holly Columbia Gas 8" Steel
12"steel
Two HIGH PRESSURE lines
on N side of SR11. With a 3rd line that is retired
in place. This may become an
issue when drainage is
directed away from RR that is
north of this location
2499+90Line "A"
2503+25Line "A"
Pothole depths for retired line are shallow, as is 8"
line to north. Need to notify when working
nearTH34 2.23', TH35
4.27'TH31 4.81', TH37
4.86'TH32 2.93', TH38
3.28'
required to direct drainage away from RR R/W
Proposed ditch elevations must maintain cover over existing
facilities
Vectren Energy;Sandra Buening and
Holly Columbia Gas 6", 4", 2"
plastic
6" line N of SR58, E side of
International4" line S of SR58,
E side of International
2" line S side of SR58
Need to determine depths
and actual locations
Need to set poles for a new signal
at SR 58 and International Dr.
We anticipate designing the signal to avoid impacting utility
facilities
$0
Gas lines on the south and east sides of the intersection of SR58 and International. Gas markers were picked up in the survey, but no line was surveyed, so no indication of accuracy of the gas markers in relation to the physical gas line. Gas lines very likely to cross UG power in SE corner. See 3c & 3g for explanation of this area.
"Unknown lines" Power 4 in. metal
unknown owner, but based on
plans for weigh stations, they appear to be NEW power
feeds between weigh stations
2260+55Line "A"
2260+75Line "A"
TH39&40 (3.13' and 2.61') found
in median
added travel lanes
Profile will be adjusted as necessary to
maintain clearance
$0 These are new power feeds and must be preserved, but they are encased in a 4 inch steel casing.
Hoosier Energy; Tim Emmel Power ?
Per UTIL 1.30, they cross over I-
65 S of SR 58.2929+90Line "A"
Need to know what the voltage
is as well as clearance over I-
65
Height of electric wire over I-65 combined with required buffer around wire is a safety/constructa
bility issue
Profile will be reviewed, and
adjusted if necessary, in this location to avoid
impacting facilities; warning signs will need to be placed near wires for safety
$0 This is a constructability and safety issue.
Page 7 of 8

Utility Coordinator
Utility Type Material and Size
Description Of Design Conflict
With Utility
Utility Relocatio
n Plan
Start Offset
End Station
Utility Relocatio
n Reimburs
able
Design Around
Estimated Cost*
Start Station
Estimated Utility
Relocation Cost
Design Around Alternative description*
Utility Name & Contact Person
End Offset
Utility Investigation Level Needed
Designer's Justification To
Impact The Utility
Project Team CollaborationUtility CoordinatorDesigner (collaboration with Utility Coordinator as needed)
Additional Information/Recommended Resolution
Midwest Natural Gas Corporation;
Phil Ross
Gas 3" PE x2and 2" PE
3" on E side US31
3" N side of SR250 E of US312" S side SR250 across and W of
US31
need depths and locations if the existing signal equipment at
SR250 and US31 cannot handle
temp signal heads
Need to change flasher to temp
signal at SR 250 and US31
Use existing poles, no impact
expected$0
This only becomes an issue if the existing poles and foundations will not be able to handle a switch from a flasher to a temp signal. Gas lines are on the E and S sides of the intersection.
Zayo Bandwidth;Dan Jones
Communications Fiber optic
UG facilities along W side of US31 around
SR250
need depths and locations if the existing signal equipment at
SR250 and US31 cannot handle
temp signal heads
Need to change flasher to temp
signal at SR 250 and US31
Use existing poles, no impact
expected$0
This only becomes an issue if the existing poles and foundations will not be able to handle a switch from a flasher to a temp signal. UG fiber optic along the W side, which is similar to Frontier (12f).
*Design around alternative and estimated construction cost level of detail should match the current plan development stage and level of known information of the conflict (i.e. initial assessment estimated costs should be similar to an engineering assessment estimation; SUE QL-A provided for Utility - higher level of known information, design alternative and estimate should be more refined. Notes:
Direct coordination with the Utility Coordinator, Project Manager, and the rest of the project team will be the key to developing project specific needs and expectations.
Page 8 of 8
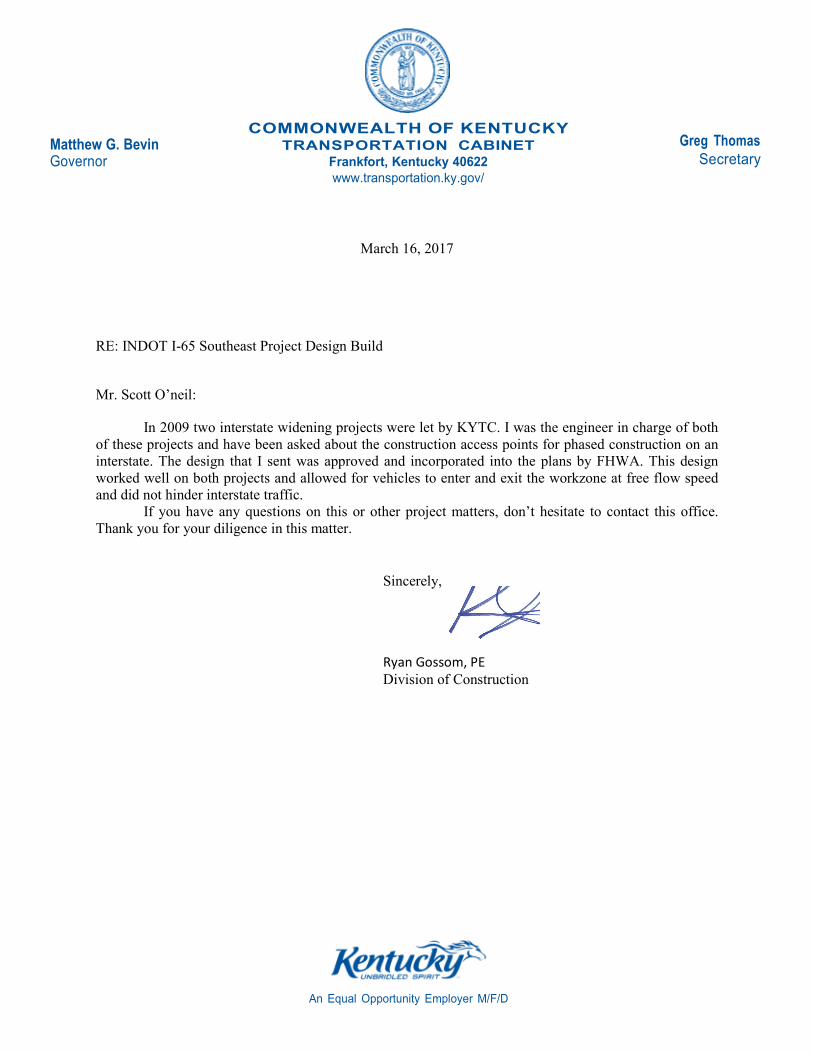
An Equal Opportunity Employer M/F/D
Matthew G. Bevin Governor
COMMONWEALTH OF KENTUCKY TRANSPORTATION CABINET
Frankfort, Kentucky 40622
www.transportation.ky.gov/
Greg Thomas
Secretary
March 16, 2017
RE: INDOT I-65 Southeast Project Design Build
Mr. Scott O’neil:
In 2009 two interstate widening projects were let by KYTC. I was the engineer in charge of both
of these projects and have been asked about the construction access points for phased construction on an
interstate. The design that I sent was approved and incorporated into the plans by FHWA. This design
worked well on both projects and allowed for vehicles to enter and exit the workzone at free flow speed
and did not hinder interstate traffic.
If you have any questions on this or other project matters, don’t hesitate to contact this office.
Thank you for your diligence in this matter.
Sincerely,
Ryan Gossom, PE
Division of Construction