Embed Size (px)
Citation preview

PAGE
a


Building a Knowledge Base onPopulation Ageing in India
The Status of Elderly in Himachal Pradesh, 2011
December 2014

CONTRIBUTORS
Sanjay Kumar
Moneer Alam
Pratima Yadav
Sikander Kumar
Sumit Mazumdar
Isha Chaudhry

PAGE
iii
ACKNOWLEDGEMENTRecently, United Nations Population Fund and its collaborating institutions – Institute for Social
and Economic Change (Bangalore), Institute of Economic Growth (Delhi) and Tata Institute of Social
Sciences (Mumbai) – have successfully conducted an in-depth survey on ‘Building a Knowledge
Base on Population Ageing in India (BKPAI)’. The survey was conducted in seven major states of the
country, selected on the basis of speedier ageing and relatively higher proportions of the elderly in
the population. The successful completion of this survey was largely due to the seminal contributions
made by various institutions and individuals including the former UNFPA Representative, Mr. Nesim
Tumkaya and current Representative, Ms. Frederika Meijer. The guidance and dynamic leadership
provided by Ms. Meijer led to the completion of the survey towards the end of 2011. The Directors of
the collaborating institutions have provided extensive support throughout the period of this survey
and its subsequent data analysis, which was published in the form of a comprehensive report, Report
on the Status of Elderly in Select States of India, 2011, in November 2012.
Both during the release ceremony of the report and thereafter, it was strongly felt by the Technical
Advisory Committee (TAC) of the project and many other experts that a separate state level report
be brought out for each of the seven states included in the report published in 2012. These experts
have also advised that the reports be widely disseminated at state level so as to initiate a dialogue
not only with civil society organizations but also with the state government and its officials. This
volume is largely in response to those suggestions.
The authors are grateful for the overall guidance and technical directions provided by the BKPAI
Coordinators. We also express our sincere gratitude to Professor P.M. Kulkarni for providing the
technical support that led to the finalization of this report. Our entire team – authors, contributors
and researchers – benefitted from the critical insights of a number of luminaries, experts, social
scientists and members of our Technical Advisory Committee including Professors K. Srinivasan,
S. Irudaya Rajan, Arvind Pandey and Tulsi Patel. We would also like to thank all the participants of the
state report finalization workshop organized jointly by the partner institutions at Manesar (Haryana).
Several informed individuals and faculty members of Himachal Pradesh University, including
Mr. Rakesh Singh (Assistant Professor, Department of Higher Education) and Dr. (Mrs). Niranjana
Bhandari (Field Investigator, Population Research Centre, Himachal Pradesh University, Shimla),
have helped immensely by providing substantial data and other relevant information, particularly
on social security policies of the Himachal Pradesh Government. We extend our sincere thanks to
all of them.
We gratefully acknowledge the dedicated support of our partner institutions and their staff. In
particular, we would like to thank Professor Manoj Panda (Director, Institute of Economic Growth)
for his unconditional support all through this study. We are also very grateful to Ms. Preeti Dhillon, a
consultant at UNFPA, for her valuable support in verifying the data.

PAGE
iv
We owe a debt of gratitude to Mr. Navin Joneja and Mrs. Marie Joneja of Mensa Design Pvt. Ltd. for
their patience and excellent editorial support.
As always, the UNFPA team has been extremely generous and provided us every support in making
this work possible. Our special thanks are due to all of them.
The responsibility for any errors or omissions, however, is ours alone and not that of the individuals
or institutions that have so generously supported us.
Authors
December 2014
PAGE
v
ACRONYMSADL Activities of Daily Living
AIIMS All India Institute of Medical Science
APL Above Poverty Line
AYUSH Ayurveda, Yoga and Naturopathy, Unani, Siddha and Homeopathy
BCM Business Correspondent Model
BKPAI Building a Knowledge Base on Population Ageing in India
BPL Below Poverty Line
CHCs Community Health Centres
COPD Chronic Obstructive Pulmonary Disease
DC District Commissioner
DCC Day Care Centres
DEO District Election Officer
DK Don’t Know
DWO District Welfare Officer
EBT Electronic Benefit Transfer
FM Frequency Modulation
GHQ General Health Questionnaire
GoHP Government of Himachal Pradesh
HCE Health Care for the Elderly
HH Household
HR Human Resource
HRTC Himachal Road Transport Corporation
ID Identity Card
IADL Instrumental Activities of Daily Living
ICF International Classification of Functioning, Disability and Health
ICSSR Indian Council of Social Science Research
IEG Institute of Economic Growth
IGNDPS Indira Gandhi National Disability Pension Scheme
IGNOAPS Indira Gandhi National Old Age Pension Scheme
IGNWPS Indira Gandhi National Widow Pension Scheme
IIPS International Institute for Population Sciences
IPOP Integrated Programme for Older Persons
ISEC Institute for Social and Economic Change
IIT Indian Institute of Technology
IT Information Technology
LPG Liquefied Petroleum Gas
MECU Mobile Elder Care Units
MGNREGA Mahatma Gandhi National Rural Employment Guarantee Act
MIPAA Madrid International Plan of Action on Ageing
PAGE
vi
MoSJE Ministry of Social Justice and Empowerment
MPCE Monthly Per Capita Consumer Expenditure
NA Not Available
NCDs Non-communicable Diseases
NFBS National Family Benefit Scheme
NFHS National Family Health Survey
NGO Non Governmental Organization
NLM National Literacy Mission
NPHCE National Programme for Health Care of the Elderly
NPOP National Policy on Older Persons
NSAP National Social Assistance Plan
NSSO National Sample Survey Organisation
OAH Old Age Home
OAPS Old Age Pension Scheme
OBC Other Backward Classes
OPD Out Patient Department
PHCs Primary Health Centres
PLA Personal Ledger Account
PO Post Office
PPS Probability Proportional to Population Size
PRI Panchayati Raj Institution
PRC Population Research Centre
PSU Primary Sampling Unit
RBI Reserve Bank of India
RSBY Rashtriya Swasthya Bima Yojana
SAVE School Action for Value Education
SBI State Bank of India
SC Scheduled Caste
SES Socio-economic Status
SHGs Self-Help Groups
SRH Self-Rated Health
SRS Sample Registration System
ST Scheduled Tribe
SUBI Subjective Well-being Inventory
SWB Subjective Well-being
TAC Technical Advisory Committee
TISS Tata Institute of Social Sciences
TWO Tehsil Welfare Officer
UHC Universal Health Coverage
UCO United Commercial Bank
UNFPA United Nations Population Fund
WHO World Health Organization

PAGE
vii
CONTENTS
Acknowledgement iii
Acronyms v
1. Background 1
About the State 2
2. Sample Households and Elderly Population 4
2.1 Household Characteristics 5
2.2 Profile of the Elderly 7
3. Work, Income and Assets 10
3.1 Work Participation Rate and Work Intensity 10
3.2 Need for Current Work 11
3.3 Reasons for Not Working 13
3.4 Work Benefits 13
3.5 Personal Income of the Elderly 14
3.6 Economic Contribution of Elderly to the Family 16
3.7 Economic Dependence 17
3.8 Asset Ownership 18
4. Living Arrangements and Family Relations 21
4.1 Type of Living Arrangement and Reasons for Living Alone 21
4.2 Level of Satisfaction with Present Living Arrangement 23
4.3 Preferred Living Arrangements 24
4.4 Family Interaction and Monetary Transactions 24
4.5 Engagement in Family Activities and Decision-making 26
4.6 Social Engagement 27
4.7 Elderly Abuse 28

PAGE
viii
5. Health and Subjective Well-being 31
5.1 Self-rated Health, Functionality and Well-being 31
5.2 Morbidity, Health Care Access and Financing 39
6. Social Security 49
6.1 Introduction 49
6.2 Overview of Social Security Schemes 50
6.3 Awareness of Major Social Security Schemes 57
6.4 Coverage and Financing of Major Social Security Schemes 58
6.5 Emerging Issues of Social Security Schemes for the Elderly 64
6.6 Summary of Findings and Policy Directions 66
7. Way Forward 68
7.1 Improving the Economic and Social Welfare of Senior Citizens 68
7.2 Creation of Supportive Environment and Improvement in Provisions for Physical Security 69
7.3 Elderly Targeted Public and Private Services 71
Appendices 73
Appendix I: Administrative requirements and procedure for availing benefits of pension schemes 74
Appendix II: List of old age homes in Himachal Pradesh 76
Appendix III: Tables 77
References 108
Details of Contributors 115

PAGE
ix
List of Tables
3.1: Percentage of elderly by asset ownership according to place of residence and sex, Himachal Pradesh 2011 19
4.1: Percentage of elderly by participation in various activities according to place of residence and sex, Himachal Pradesh 2011 26
4.2: Per cent distribution of elderly by the frequency of attending any public meetings in the 12 months preceding the survey by place of residence and sex, Himachal Pradesh 2011 27
4.3: Per cent distribution of elderly attending religious programmes or services (excluding weddings and funerals) in the 12 months preceding the survey by place of residence and sex, Himachal Pradesh 2011 28
4.4: Per cent distribution of elderly by experience of abuse after turning 60 and in the month preceding the survey according to place of residence and sex, Himachal Pradesh 2011 28
5.1: Percentage of elderly classified based on GHQ-12 and SUBI according to select background characteristics, Himachal Pradesh 2011 37
5.2: Average expenditure (in last episode) on hospitalization by type of hospitals according to major heads, Himachal Pradesh 2011 46
6.1: Major Social Security Schemes for the Elderly in Himachal Pradesh 51
6.2: Old age homes and the organizations managing them 55
6.3: Number of beneficiaries, outlay and expenditure of major social security schemes, Himachal Pradesh Government 59
6.4: Per cent distribution of elderly awareness and registration under Rashtriya Swasthya Bima Yojana by place of residence and sex, Himachal Pradesh 2011 63
List of Boxes
6.1: Challenges of social security utilization in Himachal Pradesh 53
6.2: RSBY in Himachal Pradesh: A snapshot 63
6.3: Non-governmental initiatives 66

PAGE
x
Appendix Tables 77
2.1: Per cent distribution of elderly households by select household and housing characteristics according to place of residence, BKPAI Survey and Census, Himachal Pradesh 2011 77
2.2: Percentage of elderly households with various possessions, loan and support system according to place of residence, BKPAI survey and census, Himachal Pradesh 2011 78
2.3: Per cent distribution of elderly by select background characteristics, Himachal Pradesh 2011 80
3.1: Percentage of elderly currently working or ever worked according to place of residence and sex, Himachal Pradesh 2011 81
3.2: Percentage of elderly according to their work status and intensity of work by background characteristics, Himachal Pradesh 2011 81
3.3: Per cent distribution of currently working elderly by type of occupation and sector of employment according to place of residence and sex, Himachal Pradesh 2011 82
3.4: Per cent distribution of currently working elderly by the need to work according to background characteristics, Himachal Pradesh 2011 83
3.5: Percentage of elderly receiving work benefits by background characteristics, Himachal Pradesh 2011 84
3.6: Per cent distribution of elderly by annual personal income according to place of residence and sex, Himachal Pradesh 2011 85
3.7: Percentage of elderly by sources of current personal income according to place of residence and sex, Himachal Pradesh 2011 85
3.8: Per cent distribution of elderly by their perceived magnitude of contribution towards household expenditure according to place of residence and sex, Himachal Pradesh 2011 86
3.9: Per cent distribution of elderly by their financial dependency status and main source of economic support according to place of residence and sex, Himachal Pradesh 2011 86
4.1: Per cent distribution of elderly by type of living arrangement according to select background characteristics, Himachal Pradesh 2011 87
4.2: Per cent distribution of elderly by preferred living arrangement in old age according to present living arrangement and sex, Himachal Pradesh 2011 88
4.3: Per cent distribution of elderly having no meeting and no communication with their non co-residing children according to background characteristics, Himachal Pradesh 2011 88
4.4: Percentage of elderly by participation in various activities according to age groups, Himachal Pradesh 2011 89

PAGE
xi
4.5: Per cent distribution of elderly by their main reason for not going out more, according to place of residence and sex, Himachal Pradesh 2011 89
4.6: Per cent distribution of elderly by experience of abuse after turning 60 and in the month preceding the survey according to select background characteristics, Himachal Pradesh 2011 90
5.1: Percentage of elderly by self rated health status according to place of residence and sex, Himachal Pradesh 2011 91
5.2: Percentage of elderly by self rated health according to select background characteristics, Himachal Pradesh 2011 92
5.3: Percentage of elderly needing full/partial assistance in ADL activities according to place of residence and sex, Himachal Pradesh 2011 93
5.4: Percentage of elderly by IADL limitations according to place of residence and sex, Himachal Pradesh 2011 93
5.5: Percentage of elderly by ADL and IADL limitations according to background characteristics, Himachal Pradesh 2011 94
5.6: Percentage of elderly by full/partial locomotor disability according to place of residence and sex, Himachal Pradesh 2011 94
5.7: Percentage of elderly by full/partial locomotor disability according to background characteristics, Himachal Pradesh 2011 95
5.8: Percentage of elderly using disability aids according to sex and place of residence, Himachal Pradesh 2011 96
5.9: Percentage of elderly classified based on General Health Questionnaire (GHQ-12) and 9 items Subjective Well-being Inventory (SUBI) according to place of residence and sex, Himachal Pradesh 2011 96
5.10: Percentage of elderly classified based on 9 items in SUBI according to age and sex, Himachal Pradesh 2011 96
5.11: Percentage of elderly by ability to immediate recall of words (out of ten words) according to place of residence and sex, Himachal Pradesh 2011 97
5.12: Percentage of elderly by personal health habits or risky health behaviours according to place of residence and sex, Himachal Pradesh 2011 97
5.13: Percentage of elderly undergoing routine medical check-ups with the frequency and presently under medical care, according to place of residence and sex, Himachal Pradesh 2011 98
5.14: Percentage of elderly reporting any acute morbidity according to place of residence and sex, Himachal Pradesh 2011 98
5.15: Percentage of the elderly reporting any acute morbidity according to select background characteristics (per 1000 elderly), Himachal Pradesh 2011 98

PAGE
xii
5.16: Per 1000 distribution of acute morbidities (last episode) pattern among elderly by sex and place of residence, Himachal Pradesh 2011 99
5.17: Percentage of acute morbidity (last episode) for which treatment was sought accordingly to place of residence and sex, Himachal Pradesh 2011 99
5.18: Per cent distribution of elderly by source of treatment for the last episode of acute morbidity according to place of residence and sex, Himachal Pradesh 2011 100
5.19: Per cent distribution of elderly seeking treatment for last episode of acute morbidity according to select background characteristics, Himachal Pradesh 2011 100
5.20: Average expenditure made for treatment of acute morbidities (last episode) according to major heads and source of treatment, Himachal Pradesh 2011 101
5.21: Per cent distribution of elderly by source of payment for last episode of acute morbidity according to sex, Himachal Pradesh 2011 101
5.22: Prevalence rate (per 1,000) of chronic morbidities according to place of residence and sex, Himachal Pradesh 2011 101
5.23: Prevalence rate (per 1,000) of common chronic morbidities according to select background characteristics, Himachal Pradesh 2011 102
5.24: Percentage of elderly seeking treatment for common chronic ailments during last 3 months according to sex and place of residence, Himachal Pradesh 2011 103
5.25: Per cent distribution of elderly by reason for not seeking any treatment for common chronic morbidities, Himachal Pradesh 2011 103
5.26: Per cent distribution of elderly by source of payment for treatment of common chronic morbidities according to sex, Himachal Pradesh 2011 103
5.27: Per cent distribution of diseases as the reason for hospitalization (last episode) among elderly according to sex and place of residence, Himachal Pradesh 2011 104
5.28: Per cent distribution of elderly by source of hospitalization care (last episode) according to place of residence and sex, Himachal Pradesh 2011 104
5.29: Per cent distribution of elderly by source of payment for last hospitalization episode according to place of residence and sex, Himachal Pradesh 2011 105
6.1: Percentage of elderly aware of national social security schemes according to place of residence, sex, BPL and APL households, Himachal Pradesh 2011 105
6.2: Percentage of elderly utilising national social security schemes according to place of residence, sex and BPL and APL households, Himachal Pradesh 2011 106
6.3: Per cent distribution of elderly by awareness and utilization of special government facilities/schemes according to place of residence and sex, Himachal Pradesh 2011 107

PAGE
xiii
List of Figures
2.1A: Population aged 60 years and above, 2001 and 2011 4
2.1B: District-wise population 60 years and above in Himachal, 2001 and 2011 5
2.2: Monthly per capita consumption expenditure according to place of residence, Himachal Pradesh 2011 6
2.3: Sex ratio, Himachal Pradesh 2011 7
2.4: Elderly by marital status according to sex, Himachal Pradesh 2011 8
3.1: Currently working elderly by age and sex, Himachal Pradesh 2011 10
3.2: Main workers and those working more than four hours a day among elderly workers, Himachal Pradesh 2011 11
3.3: Elderly working due to compulsion by place of residence and sex, Himachal Pradesh 2011 12
3.4: Elderly working due to compulsion by age, caste/tribe and wealth quintile, Himachal Pradesh 2011 12
3.5: Five major reasons for currently not working by sex, Himachal Pradesh 2011 13
3.6: Elderly by work benefits received according to sex, Himachal Pradesh 2011 14
3.7: Elderly by annual personal income according to sex, Himachal Pradesh 2011 15
3.8: Elderly with no income by wealth quintile and sex, Himachal Pradesh 2011 15
3.9: Elderly by sources of current personal income according to sex, Himachal Pradesh 2011 16
3.10: Elderly contributing to household expenditure by place of residence and sex, Himachal Pradesh 2011 17
3.11: Elderly by their perceived magnitude of contribution towards household expenditure according to sex, Himachal Pradesh 2011 17
3.12: Elderly by their financial dependency status and main source of economic support according to sex, Himachal Pradesh 2011 18
4.1: Living arrangement of the elderly by sex, Himachal Pradesh 2011 21
4.2: Elderly women living alone in seven select states of India, 2011 22
4.3: Main reasons for living alone or with spouse only by place of residence and sex, Himachal Pradesh 2011 22
4.4: Elderly comfortable or satisfied with present living arrangement by place of residence and sex, Himachal Pradesh 2011 23
4.5: Elderly who perceive that they live with their children by age and marital status, Himachal Pradesh 2011 23

PAGE
xiv
4.6: Preferred living arrangement by sex, Himachal Pradesh 2011 24
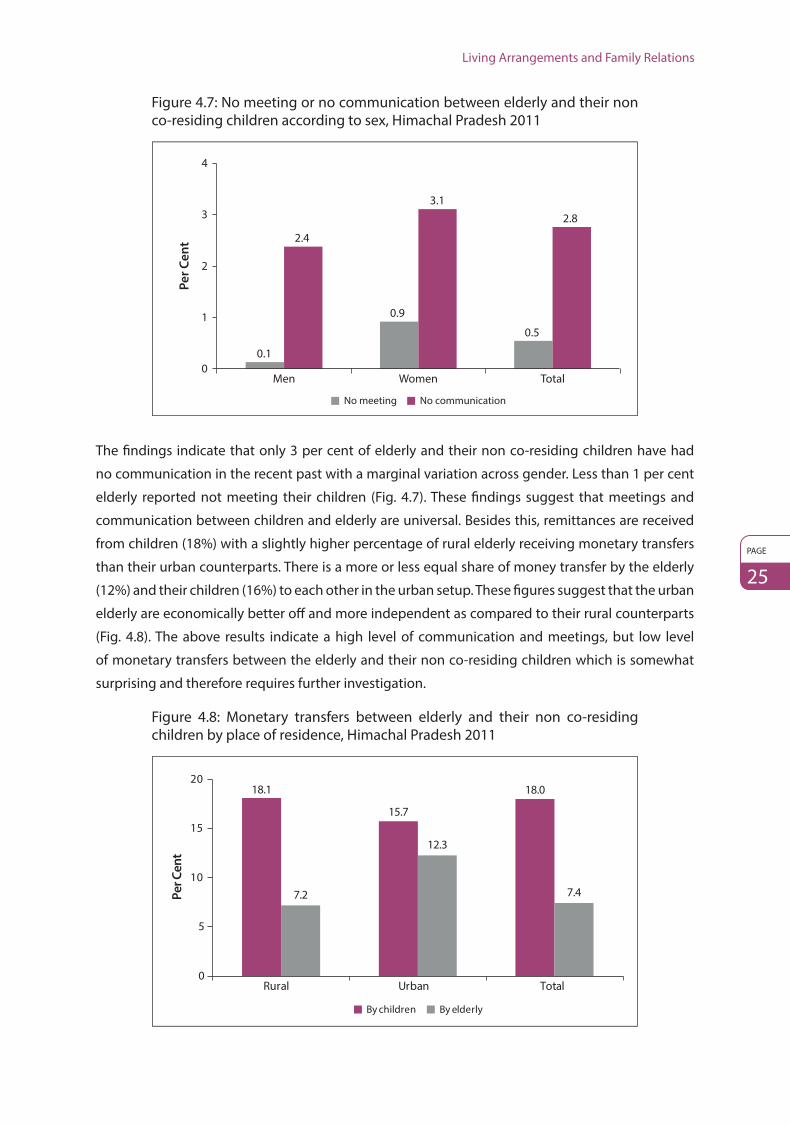
4.7: No meeting or no communication between elderly and their non co-residing children according to sex, Himachal Pradesh 2011 25
4.8: Monetary transfers between elderly and their non co-residing children by place of residence, Himachal Pradesh 2011 25
4.9: Elderly reporting no role in various decision-making activities according to sex, Himachal Pradesh 2011 27
4.10: Forms and sources of abuse faced by the elderly after age 60, Himachal Pradesh 2011 29
4.11: Perpetrator of abuse or quarrel among elderly who reported any abuse in the month preceding the survey by place of residence and sex, Himachal Pradesh 2011 29
5.1: Self-rated current health status by age and sex, Himachal Pradesh 2011 32
5.2: Self-rated current health status by marital status, caste/tribe and wealth quintile, Himachal Pradesh 2011 32
5.3: Elderly needing full/partial assistance for at least one ADL by sex and place of residence, Himachal Pradesh 2011 33
5.4: Elderly needing full/partial assistance by ADL domains according to age groups, Himachal Pradesh 2011 33
5.5: Elderly who cannot perform any IADL activity according to sex, place of residence and age, Himachal Pradesh 2011 34
5.6: Elderly by type of disability and age, Himachal Pradesh 2011 35
5.7: Elderly using disability aids according to age and sex, Himachal Pradesh 2011 35
5.8: Mean number of words immediately recalled by the elderly according to select background characteristics, Himachal Pradesh 2011 38
5.9: Current risky health habits among elderly by age group, Himachal Pradesh 2011 38
5.10: Prevalence rate of acute morbidity per 1000 elderly according to select background characteristics, Himachal Pradesh 2011 40
5.11: Elderly seeking treatment for acute morbidity (last episode) according to place of residence, sex and age, Himachal Pradesh, 2011 40
5.12: Average expenditure on treatment of last episode of acute morbidity by type of facility and select background characteristics, Himachal Pradesh 2011 41
5.13: Prevalence of seven common chronic ailments among per 1000 elderly by sex, age and place of residence, Himachal Pradesh 2011 43
5.14: Elderly by source of treatment of common chronic morbidities, Himachal Pradesh 2011 44
5.15: Average monthly expenditure on treatment of common chronic morbidities by source of treatment, Himachal Pradesh 2011 44
PAGE
xv
5.16: Elderly hospitalized one year preceding the survey according to select background characteristics, Himachal Pradesh 2011 45
5.17: Persons accompanying elderly during hospital stay (last episode) by sex, Himachal Pradesh 2011 46
5.18: Average expenditure on hospitalization (last episode) by wealth quintile, caste/tribe and APL/BPL household category, Himachal Pradesh 2011 47
6.1: Elderly by preferred support system in old age according to sex and BPL/APL households, Himachal Pradesh 2011 50
6.2: Elderly aware of national social security schemes according to sex and APL/BPL household category, Himachal Pradesh 2011 57
6.3: Elderly utilizing national social security schemes according to sex for BPL households, Himachal Pradesh 2011 60
6.4: Elderly utilizing national social security schemes by wealth quintile and caste/ tribe, Himachal Pradesh 2011 60
6.5: Elderly utilizing facilities/schemes by lowest and highest wealth quintile, Himachal Pradesh 2011 61
6.6: Elderly covered by health insurance policies by sex, Himachal Pradesh 2011 62

PAGE
1
1. BackgroundPopulation ageing is an inevitable consequence of the demographic transition experienced by all
countries across the world. Declining fertility and increasing longevity have resulted in an increasing
proportion of elderly persons aged 60 years and above, concomitant with the demographic
transition process traversed by most of the now developed countries. India has 104 million elderly
persons (8.6% of the population is comprised of 60+ population, Census 2011) and the number
is expected to increase to 296.6 million, constituting about 20 per cent of the total population
by 2050 (United Nations, 2013). An overwhelming majority of the elderly live in rural areas and
there is an increasing proportion of oldest-old age category with feminization of ageing being
more pronounced at this age. Nearly three out of five single older women are very poor and about
two-thirds of them are completely economically dependent.
Given the nature of demographic transition, such a huge increase in the population of the elderly
is bound to create several societal issues, magnified by sheer volume. The demographic changes,
and more importantly, the fertility transition, have occurred without adequate changes in the living
standard of the people. As a result, a majority of the people aged 60 and above are socially and
economically poorer. In addition, there is also extreme heterogeneity in the demographic transition
across states in India resulting in vast differences in the implications of demographic change across
social, economic and spatial groups. Therefore, it is important to focus immediate attention on
creating a cohesive environment and decent living for the elderly, particularly elderly women, in
the country.
The Government of India deserves recognition for its foresight in drafting the National Policy on
Older Persons (NPOP) in 1999, way ahead of the Madrid International Plan of Action on Ageing
(MIPAA), when less than 7 per cent of the population was aged 60 years and above. Being a signatory
to the MIPAA, it is committed to ensure that people are able to age and live with dignity from a
human rights perspective. Hence, the Government initiated and implemented several programmes
and has also revised and updated the 1999 policy that is awaiting final vetting. The United Nations
Population Fund (UNFPA) globally and in India, has a specific focus on policy and research in emerging
population issues, of which population ageing is one. Thus, the policies and the programmes for
ageing require an evidence base for policy and programming and understanding of various aspects
of the elderly, given the rapid changes in the social and economic structures.
During the VII cycle of cooperation with the Government of India (2008-12), the UNFPA Country
Office embarked on a research project, ‘Building a Knowledge Base on Population Ageing in India

BKPAI: Himachal Pradesh
PAGE
2
(BKPAI)’, with two main components: (i) research using secondary data; and (ii) collecting primary
data through sample surveys on socio-economic status, health and living conditions of the elderly
that can be used for further research, advocacy and policy dialogue. This project was coordinated
by the Population Research Centre (PRC) at the Institute for Social and Economic Change (ISEC),
Bangalore and the Institute of Economic Growth (IEG), Delhi. Collaboration with the Tata Institute of
Social Sciences (TISS), Mumbai was initiated at a later stage for developing an enabling environment
through advocacy and networking with stakeholders. In order to fill the knowledge gaps identified
by these papers, a primary survey was carried out in seven states – Himachal Pradesh, Kerala,
Maharashtra, Odisha, Punjab, Tamil Nadu and West Bengal – having a higher percentage of
population in the age group 60 years and above compared to the national average.
In this study, the sample for each state was fixed at 1280 elderly households. The sample size was
80 Primary Sampling Units (PSU) equally distributed between rural and urban areas and selected
using the Probability Proportion to the Population Size (PPS). The details about the survey like
sampling procedures, survey protocols, questionnaire contents and definitions and computations
of different indicators are available in the report, “Report on the Status of Elderly in Select States
of India, 2011” and its subsequent volume, “Report on the Status of Elderly in Select States of India,
2011 – Sample Design, Survey Instruments and Estimates of Sampling Errors”.
The present report is the outcome of the survey carried out in Himachal Pradesh from June to
September 2011. The report consists of seven sections, where the first section provides a brief
introduction; the second section discusses the profile of elderly households and individual
respondents; the third section is on work, income and asset holdings among the elderly; section
four covers the living arrangements and family relations; section five provides information on
the health status of the elderly including subjective and mental health, morbidity – acute and
chronic – and hospitalization, access to health care and financing; section six covers social security
in old age; and the last section is devoted to way forward.
About the State
Himachal Pradesh was designated as a Union Territory on 26 January 1950 and became the
eighteenth major state of the Indian Republic on 25 January 1971 (Government of Himachal
Pradesh). The state’s name is derived from the Sanskrit word Hima which means ‘snow’ and the
literal meaning is “in the lap of the Himalayas”. Himachal Pradesh is located in the northern part of
the country and its neighbouring states include Jammu and Kashmir in the north, Punjab in the
west and southwest, Uttarakhand in the east and Haryana in the southeast. The state has a land area
of over 55,673 sq. kilometres and had a total population of 6.9 million as per Census 2011. Nearly
90 per cent of the state’s inhabitants reside in rural areas and the sex ratio in the state is 972 females
per 1000 males (Census 2011).
Background
PAGE
3
Over the last few decades, the fertility-mortality parameters of Himachal Pradesh have declined
steadily and life expectancy in the state has also increased considerably, following a pattern
comparable to many other demographically better performing states in the country. The average
life expectancy at birth is 70 years and at the age of 60-65 years it is 20 years. The sex-wise life
expectancy at 60-65 is given as 17.9 years for males and 20.9 years for females. This clearly shows
that the state may suffer from feminization of ageing in the coming years (SRS, 2012).
PAGE
4
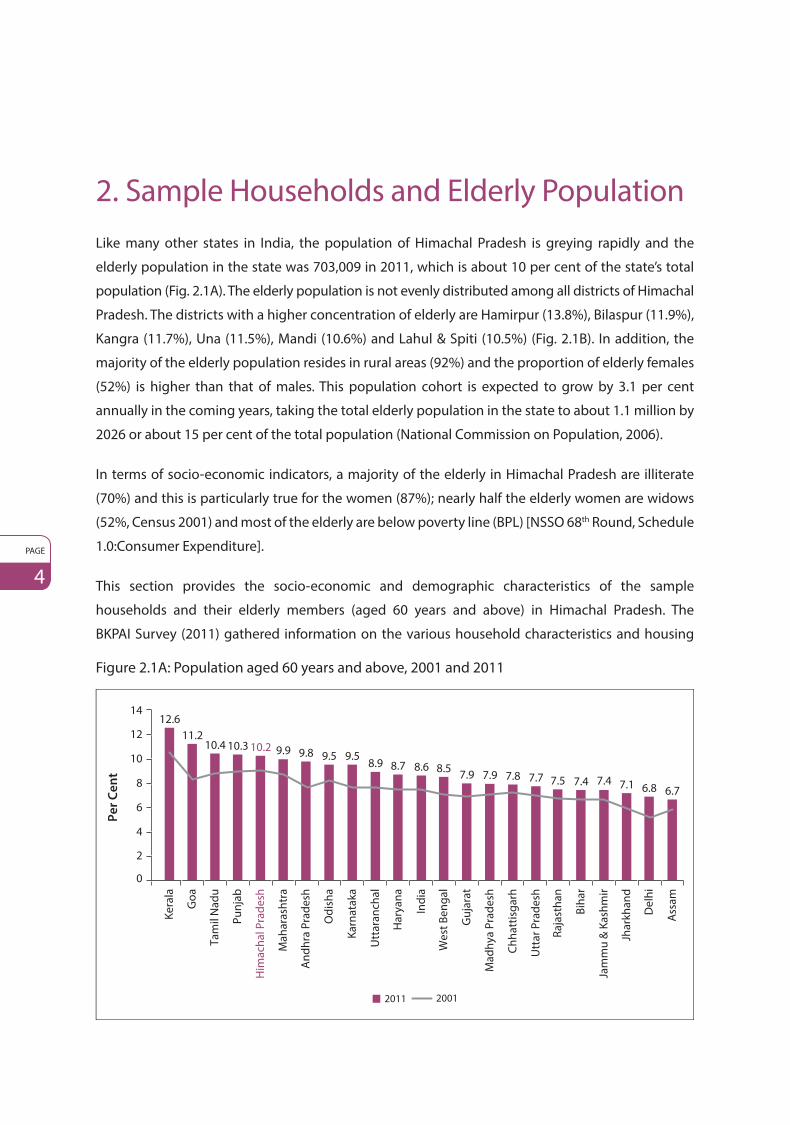
2. Sample Households and Elderly PopulationLike many other states in India, the population of Himachal Pradesh is greying rapidly and the
elderly population in the state was 703,009 in 2011, which is about 10 per cent of the state’s total
population (Fig. 2.1A). The elderly population is not evenly distributed among all districts of Himachal
Pradesh. The districts with a higher concentration of elderly are Hamirpur (13.8%), Bilaspur (11.9%),
Kangra (11.7%), Una (11.5%), Mandi (10.6%) and Lahul & Spiti (10.5%) (Fig. 2.1B). In addition, the
majority of the elderly population resides in rural areas (92%) and the proportion of elderly females
(52%) is higher than that of males. This population cohort is expected to grow by 3.1 per cent
annually in the coming years, taking the total elderly population in the state to about 1.1 million by
2026 or about 15 per cent of the total population (National Commission on Population, 2006).
In terms of socio-economic indicators, a majority of the elderly in Himachal Pradesh are illiterate
(70%) and this is particularly true for the women (87%); nearly half the elderly women are widows
(52%, Census 2001) and most of the elderly are below poverty line (BPL) [NSSO 68th Round, Schedule
1.0:Consumer Expenditure].
This section provides the socio-economic and demographic characteristics of the sample
households and their elderly members (aged 60 years and above) in Himachal Pradesh. The
BKPAI Survey (2011) gathered information on the various household characteristics and housing
Figure 2.1A: Population aged 60 years and above, 2001 and 2011
12.611.2
10.4 10.3 10.2 9.9 9.8 9.5 9.58.9 8.7 8.6 8.5 7.9 7.9 7.8 7.7 7.5 7.4 7.4 7.1 6.8 6.7
2
0
4
6
8
10
12
14
Kera
la
Goa
Tam
il N
adu
Punj
ab
Him
acha
l Pra
desh
Mah
aras
htra
And
hra
Prad
esh
Odi
sha
Karn
atak
a
Utt
aran
chal
Har
yana
Indi
a
Wes
t Ben
gal
Guj
arat
Mad
hya
Prad
esh
Chha
ttis
garh
Utt
ar P
rade
sh
Raja
stha
n
Biha
r
Jam
mu
& K
ashm
ir
Jhar
khan
d
Del
hi
Ass
am
2011 2001
Pe
r C
en
t

Sample Households and Elderly Population
PAGE
5
Figure 2.1B: District-wise population 60 years and above in Himachal, 2001 and 2011
Ham
irpur
Bila
spur
Kang
ra
Una
Man
di
Lahu
l & S
piti
Kinn
aur
Shim
la
Kullu
Cham
ba
Sola
n
Sirm
aur
13.8
11.9 11.7 11.510.6 10.5
9.78.9 8.5 8.0 8.0 7.9
0
2
4
6
8
10
12
14
16
2011 2001
conditions which provide the context for studying the condition of the elderly population in the
state. Overall 1,252 households were selected for the interview with 1,542 elderly individuals. The
survey covered 1,175 households which had at least one elderly person and a total of 1,482 elderly
people were interviewed. The response rate was 93.9 per cent for households and 96.1 per cent
for elderly individuals.
2.1 Household Characteristics
Of the 1,175 elderly households surveyed, there was an almost equal proportion in rural and urban
areas – 52 and 48 per cent respectively. Appendix Table A 2.1 shows that while an average household
comprised of five (mean = 5.0) members, households with six or more members also existed and
their number was found to be higher in rural (42%) than in urban (34%) areas. Information on the
size of the elderly households and overall population is similar to the results of the Census 2011
(Mean hh size = 4.6), indicating that the joint family norm still exists in Himachal Pradesh. Overall,
62 per cent of the households were headed by elderly males and 17 per cent by elderly females.
Scheduled Castes (SC) constituted 20 per cent of households and 65 per cent were other (general)
castes; 94 per cent of the households were Hindu. Appendix Table A 2.1 also shows that 57 per cent
of households had pucca houses, with more than four fifths (83%) of such households being in
urban areas. About 59 per cent of the houses have more than four rooms. Nearly 84 per cent of the
households have access to piped drinking water, and about one tenth (9%) gets its drinking water
from bore wells. Notably, 20 per cent of the households overall and just over one fifth (21%) in rural
areas have no access to toilet facilities. Only 74 per cent of the households have flush toilets. Over
70 per cent of the rural households and nearly 17 per cent of urban households use fuels other than
LPG/natural gas as their major cooking fuel (Appendix Table A 2.1).
BKPAI: Himachal Pradesh
PAGE
6
Households Possessions, Loan and Household Support System
To assess the living standards of the households, the survey collected information on household
ownership of 24 different types of consumer goods as well as possession of a bank account.
A majority of the elderly households (more than 90%) were found to have electricity, mattresses,
pressure cookers and cots/beds. More than 70 per cent were using modern gadgets like electric
fans, colour televisions and mobile phones. Households also possessed sewing machines (56%) and
clocks (66%). In addition, around 88 per cent of households reported having an account in a bank
or post office. By contrast, less than 30 per cent of the households held assets such as refrigerators,
bicycles and motorcycles or scooters. Computers and internet were not common among the
sampled households.
The Wealth Index, which is an indicator of the economic status of households, is consistent with
expenditure and income measures (Rutstein, 1999). This index was constructed using information
on household assets and housing characteristics. In Himachal Pradesh, 28 per cent of the elderly
households belong to the two lowest wealth quintiles. In urban areas, 47 per cent of the households
are in the highest quintile while in rural areas, they account for only 12 per cent (Appendix Table A 2.2).
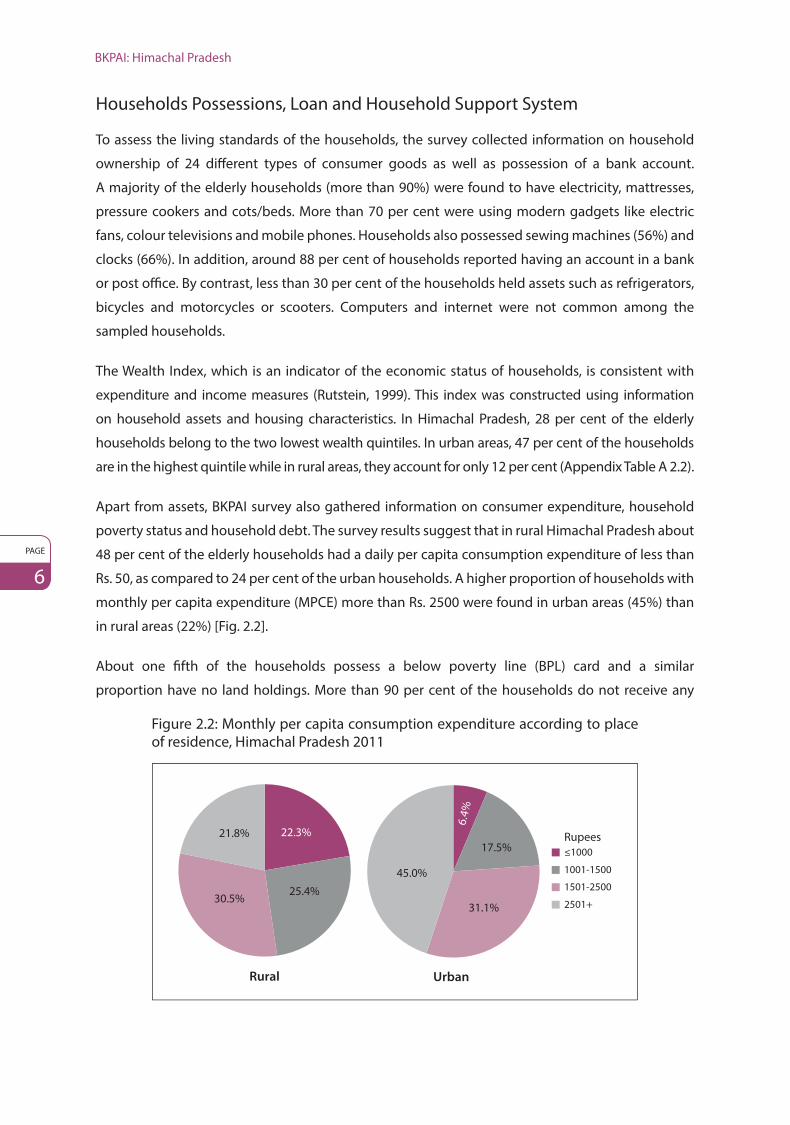
Apart from assets, BKPAI survey also gathered information on consumer expenditure, household
poverty status and household debt. The survey results suggest that in rural Himachal Pradesh about
48 per cent of the elderly households had a daily per capita consumption expenditure of less than
Rs. 50, as compared to 24 per cent of the urban households. A higher proportion of households with
monthly per capita expenditure (MPCE) more than Rs. 2500 were found in urban areas (45%) than
in rural areas (22%) [Fig. 2.2].
About one fifth of the households possess a below poverty line (BPL) card and a similar
proportion have no land holdings. More than 90 per cent of the households do not receive any
Figure 2.2: Monthly per capita consumption expenditure according to place of residence, Himachal Pradesh 2011
Rural Urban
≤1000Rupees
1001-1500
1501-2500
2501+
22.3%
25.4%30.5%
21.8%17.5%
31.1%
45.0%
6.4%

Sample Households and Elderly Population
PAGE
7
remittances from India or abroad (BKPAI Survey data, 2011). Nevertheless, over 80 per cent of the
households currently do not have any outstanding loans and a possible explanation could be the
introduction of loan waivers by the Government of India in the year 2009 (Budget 2008-09, GOI).
2.2 Profile of the Elderly
This section presents the demographic and socio-economic characteristics of the elderly
respondents interviewed in the survey, which includes age distribution, marital status, educational
qualifications and migration. Elderly age-wise distribution is more concentrated among the young
old (60-69 years) who account for 50 per cent of the total surveyed elderly, while 17 per cent of
them belong to the oldest old (80+ years) category (Appendix Table A 2.3). Overall, there are more
women than men in the age group 60 years and above and the sex ratio among the elderly is 1036
women per thousand men. Similarly, in the age group 70-79 years, elderly women outnumber men.
However, the sex ratio is reversed for the age groups 60-69 and 80+ years (Fig. 2.3). Nevertheless,
Census 2011 results suggests that feminization of ageing is very much in evidence at state level.
The distribution of elderly by completed years of education reveals a high level of illiteracy (58%),
which is worse among elderly women (82%). As far as educational attainment is concerned, about
41 per cent of the elderly men have more than eight years of formal education as compared to only
8 per cent of the women (Appendix Table A 2.3).
The current marital status of the elderly in the state indicates that 51 per cent of the women
are widowed as compared to only 12 per cent of men (Fig. 2.4). The findings clearly indicate the
vulnerability of elderly women. The survey also captured the extent of re-marriage among the
elderly during their lifetime. Overall, 3.3 per cent of the elderly are re-married. However, there are
Figure 2.3: Sex ratio, Himachal Pradesh 2011
60-69 70-79 80+ Total
Age Group
Fe
ma
les
pe
r 1
00
0 M
ale
s
903
1362
9331036
0
200
400
600
800
1000
1200
1400
1600

BKPAI: Himachal Pradesh
PAGE
8
Figure 2.4: Elderly by marital status according to sex, Himachal Pradesh 2011
WomenMen
Currently married
Widowed
Never married
Others
1.1%
11.8%
1.3% 0.3%
50.9% 47.2%
85.8%
1.6%
significant gender differentials as well as rural-urban differences in the re-marriage rate. The rate
of re-marriage among elderly people is slightly higher in rural than in urban areas and is also
higher among elderly men than elderly women, but overall the percentage is less than 5 per cent
(Appendix Table A 2.3).
The survey analysed the percentage of elderly staying with at least one child as well as elderly with
at least one child living away from them. The findings indicate that 71 per cent of the elderly are
staying with their children. In other words, slightly more than one fourth of elderly is not living with
any of their children (BKPAI Survey data, 2011). However, recent studies suggest that the proportion
of elderly staying with their children is declining over time (Jadhav et al., 2013).
The review of available literature suggests that elderly migration is not very high (Prasad, 2011).
Similarly, the survey results also suggest that about 56 per cent of the elderly migrated before
completing 60 years of age and the proportion is higher in the case of women (90%). By contrast,
nearly three-quarters of elderly men reported zero migration in their lifetime (Appendix Table A 2.3).
To summarize, more than 40 per cent of the rural elderly (44%) resides in a kachcha or semi kachcha
house and about a fifth of the total households do not have a toilet facility. This is true for virtually all
rural households. About 20 per cent of households have no access to piped drinking water. Wood is
the most widely used cooking fuel among rural households (67%). There was near universal access
to electricity (98%) by both rural and urban elderly households. One fifth of the rural households
(20%) did not own any agricultural land. Overall, 28 per cent of the elderly belonged to the two
lowest wealth quintiles and only one out of 10 belonged to the highest wealth quintile. Significant
variation was observed in the MPCE across rural and urban areas – 45 per cent of the elderly
households had an MPCE of Rs. 2500+ in urban areas, as compared to 22 per cent in rural areas.

Sample Households and Elderly Population
PAGE
9
Nearly a quarter of rural households (22%) had an MPCE of less than Rs. 1000. Seventeen per cent of
the elderly households had an outstanding loan and 8 per cent of such loans were sought to meet
the health expenditure of the elderly, which is lower than the seven state average (13%).
Nearly half the elderly (51%) are in the age group 60-69 years, confirming ageing as a recent
phenomenon requiring immediate attention. Similar to the findings of the seven state report, there
is feminization of ageing in Himachal Pradesh, with the sex ratio being 1036 females per 1000 males
in the 60+ age group. Almost half the elderly females are widows and the lifetime migration among
the elderly women is very high (93%) as compared to men (26%). However, migration after reaching
age 60 is just 5.7 per cent for men and 2.7 per cent for women. The remarriage rate is marginally
higher in rural locales (3%) than in urban locales (2%). Nearly three fifths of the elderly population
(58%) surveyed in the state had no formal education.

PAGE
10
3. Work, Income and AssetsIn developing countries like India, the labour force participation of the elderly, and particularly
of women, is often driven by poverty (Bhalotra and Umana-Aponte, 2010; Bhalla and Kaur, 2011).
The major reasons for working till extreme old age are poverty and low level of literacy (Alam and Yadav,
2013). India’s occupational structure is dominated by informal sector employment where there
is neither a retirement age nor a pension (Unni and Raveendran, 2007). Moreover, social security
schemes are at a nascent stage (Economic Times, 23 September 2013).
The BKPAI Survey gathered information relating to the work participation of the elderly, the type
of work, the need for work, as well as the retirement benefits that accrue to retirees in Himachal
Pradesh. It also asked the elderly who were not working, the reasons for the same. This section
presents the analysis of the work participation of the elderly and related details.
3.1 Work Participation Rate and Work Intensity
Elderly work force participation in Himachal Pradesh is about 20 per cent, slightly lower than the
seven state combined proportion (24%). However, recent NSS data has revealed that more than
35 per cent of the elderly are working and women workforce participation rate has increased over
a period of time at the all India level (Alam and Yadav, 2013). The work participation rate among
elderly men is considerably higher (38%) than their female counterparts (3%). However, there is not
much variation in case of place of residence (Appendix Table A 3.1). The work participation among
the elderly decreases with the advancement of age – almost half (48%) the young old and about
one fifth (21%) of the oldest old men are currently working (Fig. 3.1).
Figure 3.1: Currently working elderly by age and sex, Himachal Pradesh 2011
60-69 70-79 80+
Age Group
Men Women
Pe
r C
en
t
47.5
30.0
20.9
4.4 2.5 2.6
0
10
20
30
40
50

Work, Income and Assets
PAGE
11
Figure 3.2: Main workers and those working more than four hours a day among elderly workers, Himachal Pradesh 2011
91.4 92.0 91.497.5
80.6
96.0
20
40
60
80
100
120P
er
Ce
nt
Main worker (more than 6 months)
More than 4 hours a day
Men Women Total
0
Nine out of 10 elderly are main workers (defined as those working for more than 6 months in a
year) among both men and women. A higher proportion of main workers is found in the two
lowest wealth quintiles. Work intensity (defined as working for more than 4 hours a day) is higher
among elderly belonging to lower social classes, either living with spouse or other family members
(Appendix Table A 3.2). This highlights the fact that the work participation of the elderly is driven by
economic necessity (Fig. 3.2).
The occupational structure also clearly indicates that a majority of the currently working elderly are
engaged in unskilled and informal occupations like cultivators (41%), agricultural labourers (21%),
other work (30%) and only 1 per cent is working as technicians/professionals. About two thirds
(64%) of the elderly are self-employed and the remaining 36 per cent are in the non-agricultural
sector. Employment in farming or cultivation is more common among the rural elderly (43%) while
the majority of the urban elderly (61%) are employed in other activities (mining, construction,
transportation etc.) (Appendix Table A 3.3).
3.2 Need for Current Work
In order to further investigate the need and motivation for participating in the labour market by the
elderly, the survey asked a few specific questions. The responses were categorized under ‘working
by choice’ and ‘working due to economic or other compulsions’. Among the working elderly in
Himachal Pradesh, a higher percentage reported working due to economic or other compulsions
(59%) as compared to those working by choice (41%) (Appendix Table A 3.4). However, it is worth
noting that compared to the findings of the seven states, a higher proportion of elderly in Himachal
Pradesh (second highest after Kerala), reported working out of choice. The findings on need for
work by background characteristics indicate that more elderly males are working out of compulsion

BKPAI: Himachal Pradesh
PAGE
12
Figure 3.3: Elderly working due to compulsion by place of residence and sex, Himachal Pradesh 2011
Rural Urban Men Women
Place of Residence Sex
Pe
r C
en
t59.0
58.5
59.5
54.0
51
52
53
54
55
56
57
58
59
60
as compared to their female counterparts. Such differentials are not visible by place of residence in
Himachal Pradesh (Fig. 3.3).
Further, the motivation for work was cross-classified by wealth quintile and it was found that
90 per cent of the lowest and 72 per cent of the second lowest wealth quintile elderly are working
because of financial need. This proportion is low (38%) among higher wealth quintile categories.
Similarly, around 70 per cent of SCs/STs have reported economic compulsions for currently working
as compared to around 59 per cent for other castes. However, it appears that age does not make
much difference between working by choice or compulsion in the state. In fact, the compulsion
factor is slightly lower for the older old as compared to the young old. Perhaps, as age advances and
work becomes routine, the elderly consider it a part of their lives (Fig. 3.4).
Figure 3.4: Elderly working due to compulsion by age, caste/tribe and wealth quintile, Himachal Pradesh 2011
60.8
57.6
49.7
69.1
42.1
58.5
90.2
72.1
64.6
40.2
38.4
0 20 40 60 80 100
60-69
70-79
80+
Lowest
Second
Middle
Fourth
Highest
Ca
ste
/T
rib
e
SC/ST
OBC
Others
Ag
e G
rou
pW
ea
lth
Qu
inti
le
Per Cent

Work, Income and Assets
PAGE
13
3.3 Reasons for Not Working
The survey also asked all the elderly who had worked in the past but were not currently working,
the reasons for the same. The most important reason is retirement from previous employment
(42%), followed by being too old to work (22%) and health problems (22%). In all of the cases
cited above, there is not much variation across gender (Fig. 3.5). By contrast, the findings of
the seven state survey cited health problems as the main reason for not working in old age
(Alam et al., 2012).
Figure 3.5: Five major reasons for currently not working by sex, Himachal Pradesh 2011
Pe
r C
en
t
Men Women
Functionallydisabled
Others0
5
10
15
20
25
30
35
40
45
50
Retired Too old to work
Health problems
My family/spouse does not want
me to work
42.1
22.3 22.2
43.5
22.720.4
4.10.0
3.20.0
6.2
13.4
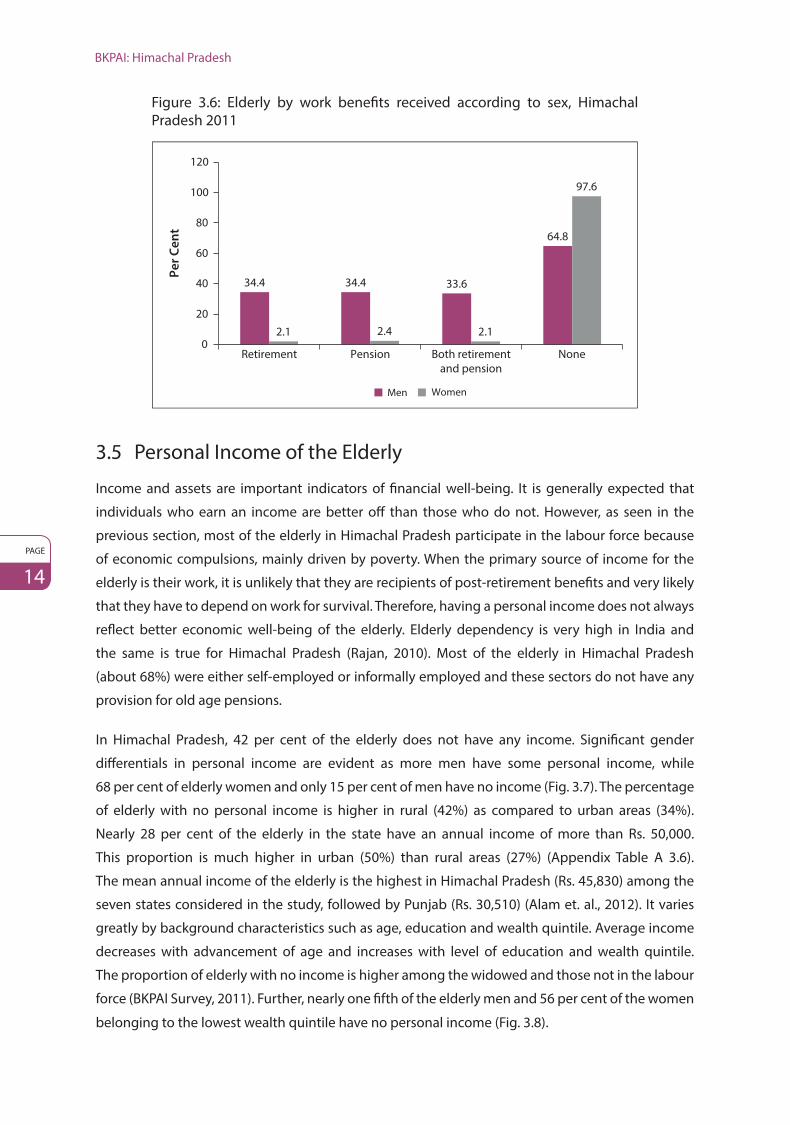
3.4 Work Benefits
A majority of the elderly in Himachal Pradesh (98 per cent of women and 65 per cent of men)
have reported not receiving any work-related benefits such as prescribed ages for retirement and
pensions. Elderly women are not receiving any retirement benefits due to their low workforce
participation in working age (NSSO 68th Employment and Unemployment Data). About 34 per cent
of the males were receiving retirement or pension benefits and a nearly equal proportion (33.6%)
received both (Fig. 3.6). Benefits such as retirement, pension and insurance are rare, largely due to
the elderly being employed outside the formal sector (A.K. Sengupta Report, 2007). While
35 per cent of urban elderly received retirement and pension benefits, only 17 per cent rural elderly
had access to such benefits. Receipt of work benefits was more common among the highly educated
(51%) elderly, followed by those belonging to the highest wealth quintile (39%). However, only
3 per cent of the elderly belonging to the lowest wealth quintile received any employment related
benefits (Appendix Table A 3.5).
BKPAI: Himachal Pradesh
PAGE
14
Figure 3.6: Elderly by work benefits received according to sex, Himachal Pradesh 2011
Pe
r C
en
t
Retirement Pension Both retirementand pension
None
Men Women
0
20
40
60
80
100
120
34.4 34.4 33.6
64.8
2.1 2.4 2.1
97.6
3.5 Personal Income of the Elderly
Income and assets are important indicators of financial well-being. It is generally expected that
individuals who earn an income are better off than those who do not. However, as seen in the
previous section, most of the elderly in Himachal Pradesh participate in the labour force because
of economic compulsions, mainly driven by poverty. When the primary source of income for the
elderly is their work, it is unlikely that they are recipients of post-retirement benefits and very likely
that they have to depend on work for survival. Therefore, having a personal income does not always
reflect better economic well-being of the elderly. Elderly dependency is very high in India and
the same is true for Himachal Pradesh (Rajan, 2010). Most of the elderly in Himachal Pradesh
(about 68%) were either self-employed or informally employed and these sectors do not have any
provision for old age pensions.
In Himachal Pradesh, 42 per cent of the elderly does not have any income. Significant gender
differentials in personal income are evident as more men have some personal income, while
68 per cent of elderly women and only 15 per cent of men have no income (Fig. 3.7). The percentage
of elderly with no personal income is higher in rural (42%) as compared to urban areas (34%).
Nearly 28 per cent of the elderly in the state have an annual income of more than Rs. 50,000.
This proportion is much higher in urban (50%) than rural areas (27%) (Appendix Table A 3.6).
The mean annual income of the elderly is the highest in Himachal Pradesh (Rs. 45,830) among the
seven states considered in the study, followed by Punjab (Rs. 30,510) (Alam et. al., 2012). It varies
greatly by background characteristics such as age, education and wealth quintile. Average income
decreases with advancement of age and increases with level of education and wealth quintile.
The proportion of elderly with no income is higher among the widowed and those not in the labour
force (BKPAI Survey, 2011). Further, nearly one fifth of the elderly men and 56 per cent of the women
belonging to the lowest wealth quintile have no personal income (Fig. 3.8).

Work, Income and Assets
PAGE
15
Figure 3.7: Elderly by annual personal income according to sex, Himachal Pradesh 2011
Men Women
No income
≤12000
12001-24000
24001-50000
50001+
Rupees14.6%
11.8%
18.5%
48.1%
6.7% 68.2%14.1%
6.2%3.1%
8.4%
Figure 3.8: Elderly with no income by wealth quintile and sex, Himachal Pradesh 2011
19.913.7 15.8 15.8
9.4
55.760.9
68.176.5
68.8
Pe
r C
en
t
Lowest Second Middle Fourth Highest
Wealth Quintile
Men Women
0
10
20
30
40
50
60
70
80
90
As individuals reach their retirement age, it is generally expected that their income will mainly flow
from pensions and assets such as rents, interest on savings, and dividends paid on investments.
Sources of income can be divided into two general categories: factor income and transfer income
(Root and Tropman, 1984). Factor income includes all earnings from wages or salary as well as asset
income (e.g. rent, interest on savings, and dividends paid on investments). Transfer income includes
benefits from government programmes as well as private pensions and annuities. The survey found
that both factor income and transfer income are important sources of income reported by elderly
men, while women are more likely to report transfer income (Fig. 3.9).
It is possible that an elderly person has multiple sources of income. In Himachal Pradesh, 13 per cent
reported that they received incomes from social pension, while 22 per cent received agricultural

BKPAI: Himachal Pradesh
PAGE
16
Figure 3.9: Elderly by sources of current personal income according to sex, Himachal Pradesh 2011
Pe
r C
en
t
Salary/Wages Employer’s pension
(government or other)
Social pension (old age/ widow)
Agricultural/Farm income
Others
Men Women
No income0
10
20
30
40
50
60
70
80
9.7
34.4
10.7
41.3
10.214.6
1.4 2.4
15.5
4.38.9
68.2
or farm income, 20 per cent received employer’s pension, about 6 per cent received income from
salary and wages and approximately 10 per cent drew income from other sources including income
from rent, interest and petty business (Appendix Table A 3.7). Sources of income vary for elderly men
and women and by place of residence. In general, the major source of income reported by elderly
women was social pension (nearly 16%) while for elderly men it was agricultural or farm income
(41%). While elderly women in both rural and urban areas reported social or other sources as a major
source of income, employer’s pension appears to be a major source for urban women. Elderly men
in rural areas reported income from agriculture or farming (43%) and urban men reported income
from employer’s pension (49%) (Appendix Table A 3.7).
3.6 Economic Contribution of Elderly to the Family
One-fifth of the elderly work in their old age to support themselves and their family. In order to
understand the economic contribution of elderly to the household, the BKPAI Survey asked a
series of questions. Elderly men and women who reported having a personal income were asked
whether they contributed financially to the total expenditure of the household and if they do,
what is the magnitude of their contribution, and the purpose for which it is mostly used. Overall,
53 per cent of the elderly in Himachal Pradesh reported that they contributed their personal income
towards the expenditure of the household with a higher percentage of elderly men (81%) than
women (26%) doing so (Fig. 3.10). The financial contribution by the elderly was higher in urban
areas (63%) as compared to rural areas (52%). Nearly 38 per cent of the elderly men and only
13 per cent of the elderly women in urban areas perceived that they contribute to more than
80 per cent of the total household expenditure (Fig. 3.11). The findings are more are less similar for
elderly men and women in rural areas (Appendix Table A 3.8).

Work, Income and Assets
PAGE
17
Figure 3.10: Elderly contributing to household expenditure by place of residence and sex, Himachal Pradesh 2011
Rural Urban Total
Men Women Total
Place of Residence
Pe
r C
en
t
81.085.9
81.3
25.1
38.3
25.8
52.5
63.153.0
0102030405060708090
100
Figure 3.11: Elderly by their perceived magnitude of contribution towards household expenditure according to sex, Himachal Pradesh 2011
Men Women
No income/No contribution
<40%
40-60%
60-80%
80+
Don’t Know/No Answer
19.1%
25.9%
32.6%
4.4%
68.2%4.8%
5.3%
7.6%
8.1%
6.0%
14.6%
3.4%
3.7 Economic Dependence
Vulnerability among the older population can also be understood by examining their levels of
economic dependence on others. If the income earned is sufficient to partially fulfil their basic
needs, they will be dependent on others only partially. On the other hand, if the elderly do not have
any income or the income earned is not sufficient to fulfil their basic needs, they will be completely
dependent. In Himachal Pradesh, 44 per cent of the elderly are completely dependent, the
percentage being slightly lower in urban areas (36%). Gender differentials are evident with women
significantly worse off than men in terms of economic dependence. Sixty nine per cent of the women
are completely dependent on other family members for their basic needs as against 18 per cent
of men. However, the percentage that is partially dependent is higher among men (28%) than
women (15%) (Appendix Table A 3.9).

BKPAI: Himachal Pradesh
PAGE
18
Figure 3.12: Elderly by their financial dependency status and main source of economic support according to sex, Himachal Pradesh 2011
0 20 40 60 80
Son
Spouse
Daughter
Others
Not dependent on anyone
Not dependent
Partially dependent
Fully dependent
So
urc
e o
f
Eco
no
mic
Su
pp
ort
Fin
an
cia
l
De
pe
nd
en
ce
Per Cent
Men Women
42.230.2
36.86.3
0.72.4
4.87.0
15.654.1
15.654.1
15.428.1
69.017.8
In the Indian context, family still plays a major role in providing economic support to the elderly.
In the BKPAI Survey the respondents were asked to rank their financial support system. Himachal
Pradesh followed a pattern similar to the other states included in the survey: sons were main
support providers (36%) followed by spouses (22%), daughters (1.5%) and others (6%) such as son/
daughter-in-law, grandchildren, other relatives and friends. There are variations in the support
system for the elderly, as old age dependence on sons in urban areas is lower (26%) than in rural areas
(37%) (Appendix Table A 3.9). Gender differentials are seen in economic support being provided
by sons – 42 per cent of the elderly women receive economic support from their sons as
compared to 30 per cent of elderly men (Fig. 3.12). While daughters inherit parents’ land and
property in some instances (mostly in tribal areas), they are still not considered breadwinners by
elderly parents.
3.8 Asset Ownership
The ownership of assets is an important indicator of the financial well-being of individuals. Assets
such as land, housing and cash can provide a source of income for the elderly through rent,
interest, dividends, etc. This source of income is advantageous since it can provide an income
without involving much labour, which is desirable as the elderly are physically more vulnerable.
The survey asked about the assets personally owned by the elderly, which they can fall back
on in times of need and provide them a financially dignified life, unlike assets belonging to
the household.
Among all the elderly surveyed, 16 per cent reported that they do not own any land, housing,
jewellery or gold, or any other form of savings. Not surprisingly, more women (27%) than men (4%)

Work, Income and Assets
PAGE
19
Table 3.1: Percentage of elderly by asset ownership according to place of residence and sex, Himachal Pradesh 2011
Type of AssetsRural Urban Total
Men Women Total Men Women Total Men Women Total
Inherited land 58.7 20.3 39.1 26.3 9.5 18.2 57.0 19.8 38.0
Self acquired land 26.3 12.4 19.2 15.5 7.3 11.6 25.7 12.2 18.8
Inherited house(s) 40.4 19.4 29.7 38.4 14.4 26.9 40.3 19.1 29.5
Self acquired house(s)
63.4 31.9 47.3 62.1 35.2 49.2 63.3 32.1 47.4
Housing plot(s) 2.8 0.9 1.8 8.3 0.7 4.7 3.1 0.9 2.0
Inherited gold or jewellery
14.7 9.0 11.8 8.9 11.6 10.2 14.4 9.2 11.7
Self acquired gold or jewellery
20.9 30.6 25.8 34.5 39.7 37.0 21.6 31.0 26.4
Savings in bank, post office, cash
65.6 30.6 47.7 68.6 34.7 52.3 65.8 30.8 48.0
Savings in bonds, shares, mutual funds
1.2 0.9 1.0 6.7 1.9 4.4 1.5 0.9 1.2
Life insurance 0.0 0.0 0.0 1.3 0.4 0.9 0.1 0.0 0.0
Don’t own any asset 3.0 27.0 15.3 11.2 31.4 20.9 3.5 27.2 15.6
Number of Elderly 387 400 787 365 330 695 752 730 1,482
face such a situation. The urban elderly are better off than their rural counterparts in terms of self
acquired house, jewellery, saving deposits and savings in bonds. However, in rural areas, a larger
proportion of the elderly possess inherited or self-acquired lands. Overall, ownership of assets
is higher among men than women, except for self-acquired jewellery. These findings clearly
reveal that ownership of current assets is relatively lower among the elderly living in rural areas
and women in particular (Table 3.1).
In general, a higher level of work participation by the elderly is desirable only if it is by choice and
not due to economic or any other compulsion. However, the current rate and pattern of work
participation in Himachal Pradesh clearly indicates the link between current work participation and
poverty and illiteracy. The survey found that the reasons for work for the majority of the elderly
are economic or other compulsions (59%). Further the survey also found that work participation of
the elderly continues even beyond the age of 80 years, a strong indication of lack of any social and
economic support. The survey shows significant gender differentials in the labour market. Although
the work participation rate is lower among females, it appears that those who are working have
no choice but to do so, as a large proportion of women reported that the work participation is
primarily driven by economic and other compulsions. Women living alone or with spouses have
a higher incidence of work participation compared to those living with others. The majority of
the elderly who are participating in the labour market are working for more than four hours a
day (96%). The occupational structure of the currently working elderly shows that significant

BKPAI: Himachal Pradesh
PAGE
20
numbers are employed in unskilled and low paid jobs. Pension or retirement benefits are not
available to the majority (82%). A negligible proportion of women receive retirement benefits (2%)
as compared to 34 per cent among men. This is despite the fact that a large majority of the elderly
women are widows.
Over 40 per cent of elderly reported that they have no income, reflecting the dire need for
government intervention and improving the monetary support provided to the elderly in the state.
Nearly one fourth of the elderly have reported agricultural income as the major source of income
followed by employer’s pension. One third of the elderly men and 20 per cent of the elderly overall
perceive that they contribute more than 80 per cent of the household expenditure. This reaffirms
the fact that the elderly are not a burden on the household and make a significant contribution to
the household. Forty four per cent of the elderly have reported complete economic dependence on
family, citing their son as the major source of economic support. Moreover, 16 per cent of the elderly
have reported that they do not own any assets. Findings from this section highlight the economic
vulnerability of the elderly, especially the women, which requires policies and programmes by the
government in order to address it.
PAGE
21
4. Living Arrangements and Family RelationsIn India, care of the elderly and their well-being is considered to be the sole responsibility of the
families, especially of the sons. They are expected to provide all necessary support – financial,
physical, emotional and health care – to their elderly parents. However, with increasing urbanization
and employment-related migration within and outside the country, increasing participation of
women in the labour force and changing family patterns, care of the elderly has been neglected or
minimized. Also fertility transition is contributing to smaller family size (SRS Statistical Report, 2013).
The implications of all these shifts for living arrangements are complex. With weak public pension
and social security systems as well as changing household structures, planning for the elderly,
especially in terms of living arrangements, assumes increasingly greater importance.
In this section the following issues have been covered: type of living arrangements of the elderly,
reasons for living alone, satisfaction levels with their current living arrangements, family interaction
and monetary transactions by the elderly and their children, engagement in family activities and
decision-making and finally social engagement of the elderly.
4.1 Type of Living Arrangement and Reasons for Living Alone
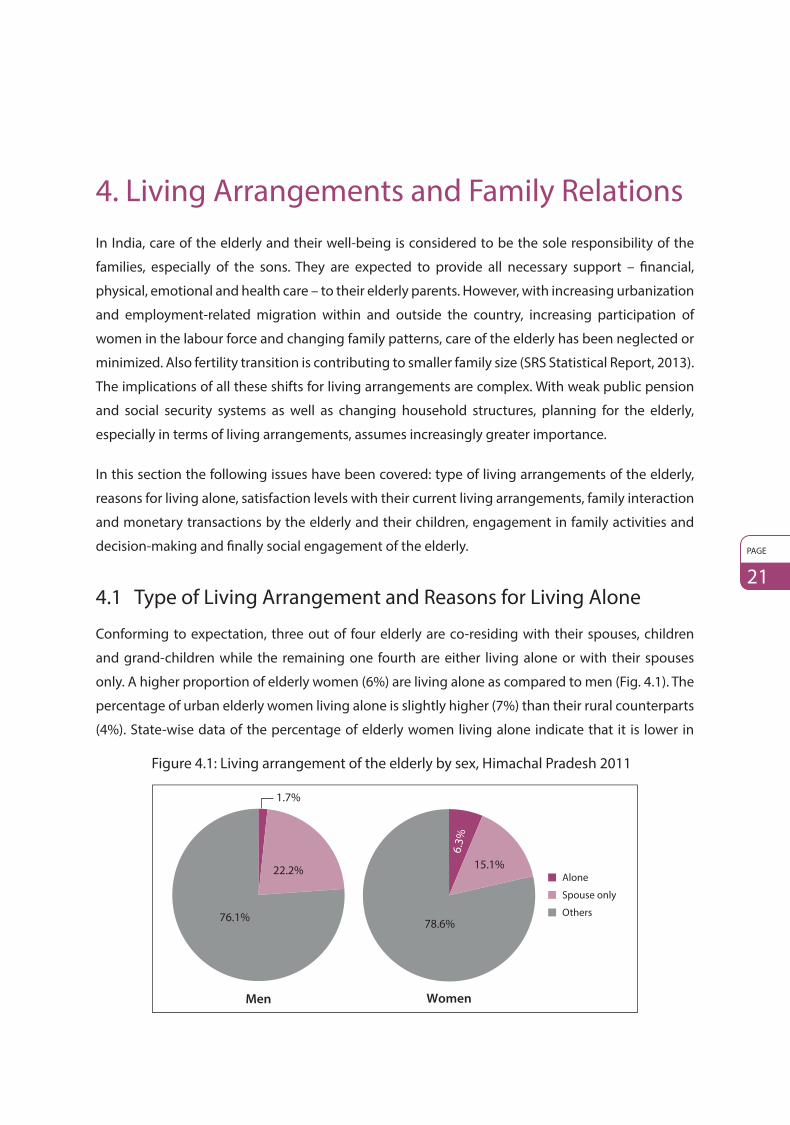
Conforming to expectation, three out of four elderly are co-residing with their spouses, children
and grand-children while the remaining one fourth are either living alone or with their spouses
only. A higher proportion of elderly women (6%) are living alone as compared to men (Fig. 4.1). The
percentage of urban elderly women living alone is slightly higher (7%) than their rural counterparts
(4%). State-wise data of the percentage of elderly women living alone indicate that it is lower in
Figure 4.1: Living arrangement of the elderly by sex, Himachal Pradesh 2011
Men Women
Alone
Others
Spouse only
1.7%
22.2%
76.1%
6.3%
15.1%
78.6%

BKPAI: Himachal Pradesh
PAGE
22
Figure 4.2: Elderly women living alone in seven select states of India, 2011
6.3
3.2
10.5
4.9
10.1
5.4
26.4
9.6
0 5 10 15 20 25 30
Himachal Pradesh
Punjab
West Bengal
Odisha
Maharashtra
Kerala
Tamil Nadu
Total
Per Cent
Himachal Pradesh compared to Tamil Nadu, West Bengal and Maharashtra (Fig. 4.2). Further analysis
of the background characteristics of those living alone reveals that they are widowed, less educated
and are from the lowest wealth quintile. Hence, it is important that programmes focus on the
vulnerability of these segments of the elderly, particularly women (Appendix Table A 4.1).
The main reason for living alone (Fig. 4.3) is not having children or children living elsewhere, which
is strikingly more prevalent in urban areas with 80 per cent of men and 82 per cent of women citing
this reason as compared to 57 per cent men and 52 per cent women in rural areas. Preference to
be independent and family conflict are the other two main factors responsible for the elderly living
alone in Himachal Pradesh with more rural elderly citing the former (25% for both men and women)
(Fig. 4.3). These results suggest that government responsibility increases in the cases of children
having migrated, family conflict and possibly there is a growing demand for day care centres as well
as community services to engage the elderly in a socially healthy environment.
Figure 4.3: Main reasons for living alone or with spouse only by place of residence and sex, Himachal Pradesh 2011
Men Women Men Women Rural Urban
No children/Children awayFamily conflict
Prefer to be independent
Others
0102030405060708090
57.051.9
79.6 81.7
15.7 19.4
1.36.8
24.5 25.117.0
10.12.8 3.7 2.1 1.4
Pe
r C
en
t

Living Arrangements and Family Relations
PAGE
23
4.2 Level of Satisfaction with Present Living Arrangement
For the overall well-being of an individual, it is essential to feel comfortable and satisfied with the
current living arrangement. The BKPAI Survey sought the views of the elderly respondents about
their satisfaction level with their present living arrangement. The findings reveal that more than
95 per cent of the elderly are comfortable and satisfied with their present living arrangement and
this is true across gender and place of residence (Fig. 4.4). These results suggest that there would
be less physiological and mental health problems among the elderly, which is borne out by the fact
that the elderly in Himachal Pradesh suffer from less mental health problems as compared to the
elderly in other states like West Bengal and Kerala (Alam et. al., 2012).
The elderly were questioned regarding how they perceive themselves: whether they are living with
their children or vice versa. Differences emerge in this perception by age and marital status (Fig. 4.5).
Figure 4.4: Elderly comfortable or satisfied with present living arrangement by place of residence and sex, Himachal Pradesh 2011
Per Cent
Total MenWomen
96.8
96.2
96.7
96.5
96.1
96.5
96.7
96.1
96.6
0.0 20.0 40.0 60.0 80.0 100.0
Rural
Urban
Total
Figure 4.5: Elderly who perceive that they live with their children by age and marital status, Himachal Pradesh 2011
Age Group Marital Status
Men Women
60-69 70-79 80+ Currentlymarried
Widowed Others
Pe
r C
en
t
16.1
28.0 29.9
18.4
39.3
0.6
28.837.0 36.6
32.5 32.7
60.5
0
10
20
30
40
50
60
70
BKPAI: Himachal Pradesh
PAGE
24
About 16 per cent of elderly men aged 60-69 years think that they are living with their children
compared to about 30 per cent men aged 80 years and above. This shift is clear across age categories
of women as well, 29 per cent of women in the younger age group and 37 per cent of older women
think that they are living with their children. Analysis shows that 18 per cent of married men think
that they are living with their children as compared to 39 per cent of the widowers. However,
the differences are not as striking among elderly women across marital status. Thus, increasing
age and widowhood are critical indicators for a shift in such perception of living dependency for
the elderly.
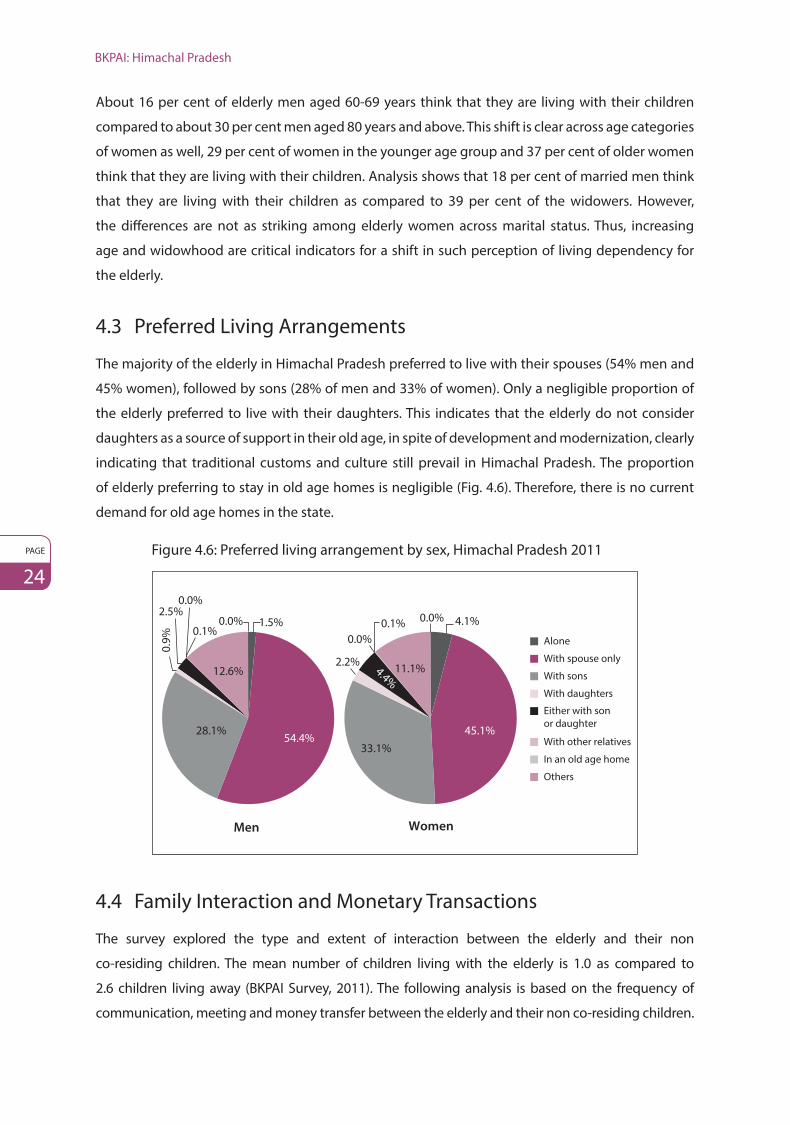
4.3 Preferred Living Arrangements
The majority of the elderly in Himachal Pradesh preferred to live with their spouses (54% men and
45% women), followed by sons (28% of men and 33% of women). Only a negligible proportion of
the elderly preferred to live with their daughters. This indicates that the elderly do not consider
daughters as a source of support in their old age, in spite of development and modernization, clearly
indicating that traditional customs and culture still prevail in Himachal Pradesh. The proportion
of elderly preferring to stay in old age homes is negligible (Fig. 4.6). Therefore, there is no current
demand for old age homes in the state.
Figure 4.6: Preferred living arrangement by sex, Himachal Pradesh 2011
Alone
With spouse only
With daughters
Either with son or daughter
Others
With sons
With other relatives
In an old age home
Men Women
1.5%
54.4%28.1%
0.9%
2.5%0.0%
0.1%
12.6%
0.0% 4.1%
45.1%33.1%
2.2%
0.0%0.1% 0.0%
11.1%4.4%
4.4 Family Interaction and Monetary Transactions
The survey explored the type and extent of interaction between the elderly and their non
co-residing children. The mean number of children living with the elderly is 1.0 as compared to
2.6 children living away (BKPAI Survey, 2011). The following analysis is based on the frequency of
communication, meeting and money transfer between the elderly and their non co-residing children.
Living Arrangements and Family Relations
PAGE
25
Figure 4.7: No meeting or no communication between elderly and their non co-residing children according to sex, Himachal Pradesh 2011
Men Women
Pe
r C
en
t
Total
No meeting No communication
0.1
0.9
0.5
2.4
3.1
2.8
0
1
2
3
4
The findings indicate that only 3 per cent of elderly and their non co-residing children have had
no communication in the recent past with a marginal variation across gender. Less than 1 per cent
elderly reported not meeting their children (Fig. 4.7). These findings suggest that meetings and
communication between children and elderly are universal. Besides this, remittances are received
from children (18%) with a slightly higher percentage of rural elderly receiving monetary transfers
than their urban counterparts. There is a more or less equal share of money transfer by the elderly
(12%) and their children (16%) to each other in the urban setup. These figures suggest that the urban
elderly are economically better off and more independent as compared to their rural counterparts
(Fig. 4.8). The above results indicate a high level of communication and meetings, but low level
of monetary transfers between the elderly and their non co-residing children which is somewhat
surprising and therefore requires further investigation.
Figure 4.8: Monetary transfers between elderly and their non co-residing children by place of residence, Himachal Pradesh 2011
Pe
r C
en
t
Rural Urban Total
By children By elderly
18.1
15.7
18.0
7.2
12.3
7.4
0
5
10
15
20
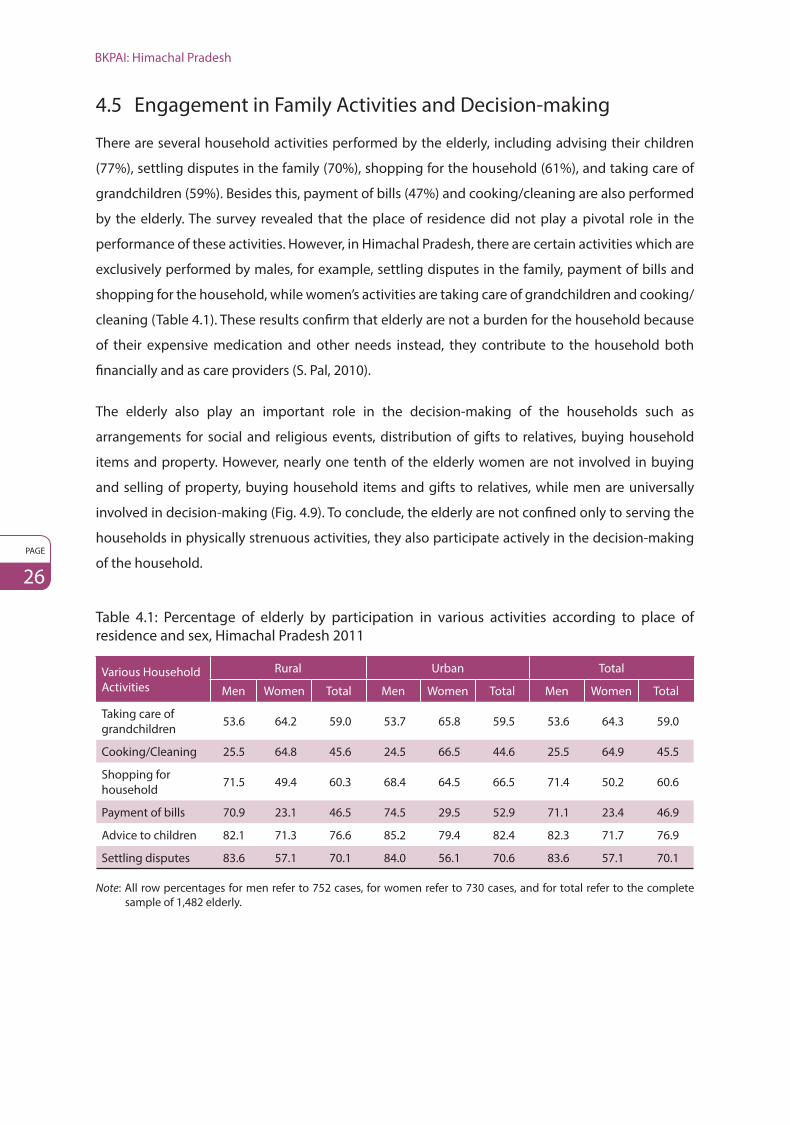
BKPAI: Himachal Pradesh
PAGE
26
4.5 Engagement in Family Activities and Decision-making
There are several household activities performed by the elderly, including advising their children
(77%), settling disputes in the family (70%), shopping for the household (61%), and taking care of
grandchildren (59%). Besides this, payment of bills (47%) and cooking/cleaning are also performed
by the elderly. The survey revealed that the place of residence did not play a pivotal role in the
performance of these activities. However, in Himachal Pradesh, there are certain activities which are
exclusively performed by males, for example, settling disputes in the family, payment of bills and
shopping for the household, while women’s activities are taking care of grandchildren and cooking/
cleaning (Table 4.1). These results confirm that elderly are not a burden for the household because
of their expensive medication and other needs instead, they contribute to the household both
financially and as care providers (S. Pal, 2010).
The elderly also play an important role in the decision-making of the households such as
arrangements for social and religious events, distribution of gifts to relatives, buying household
items and property. However, nearly one tenth of the elderly women are not involved in buying
and selling of property, buying household items and gifts to relatives, while men are universally
involved in decision-making (Fig. 4.9). To conclude, the elderly are not confined only to serving the
households in physically strenuous activities, they also participate actively in the decision-making
of the household.
Table 4.1: Percentage of elderly by participation in various activities according to place of residence and sex, Himachal Pradesh 2011
Various Household Activities
Rural Urban Total
Men Women Total Men Women Total Men Women Total
Taking care of grandchildren 53.6 64.2 59.0 53.7 65.8 59.5 53.6 64.3 59.0
Cooking/Cleaning 25.5 64.8 45.6 24.5 66.5 44.6 25.5 64.9 45.5
Shopping for household 71.5 49.4 60.3 68.4 64.5 66.5 71.4 50.2 60.6
Payment of bills 70.9 23.1 46.5 74.5 29.5 52.9 71.1 23.4 46.9
Advice to children 82.1 71.3 76.6 85.2 79.4 82.4 82.3 71.7 76.9
Settling disputes 83.6 57.1 70.1 84.0 56.1 70.6 83.6 57.1 70.1
Note: All row percentages for men refer to 752 cases, for women refer to 730 cases, and for total refer to the complete sample of 1,482 elderly.

Living Arrangements and Family Relations
PAGE
27
Figure 4.9: Elderly reporting no role in various decision-making activities according to sex, Himachal Pradesh 2011
Buying and selling property
Buying household items
Gifts to relatives
Arrangement of social andreligious events
Women Men
Per Cent
0 5 10 15
3.2
2.0
2.0
1.8
12.7
11.4
11.1
7.7
4.6 Social Engagement
The social engagement of the elderly was assessed through a set of questions seeking to know
whether they participated in any meetings, community gatherings and social or religious functions
and the frequency of such attendance was recorded. As seen from Table 4.2, nearly fifty per cent of
the elderly (47%) in Himachal Pradesh have never attended any such meeting in the year preceding
the survey. This is comparatively lower than the seven state combined average (73%). This may be
because Himachal Pradesh is a hilly state and moving around is difficult, especially for the elderly.
Notably, a slightly higher proportion of the elderly in rural areas have attended such meetings; on
an average nearly two in every three elderly men attended meetings. Only 3 per cent of the elderly
reported going out quite frequently.
However, a different pattern emerges when attendance at religious programmes and services,
excluding marriages and funerals is considered (Table 4.3). About 53 per cent males and 45 per cent
females have attended such events at least once or twice during the past year. Attending such
Table 4.2: Per cent distribution of elderly by the frequency of attending any public meetings in the 12 months preceding the survey by place of residence and sex, Himachal Pradesh 2011
Frequency of Attendance in Meetings
Rural Urban Total
Men Women Total Men Women Total Men Women Total
Never 34.9 58.8 47.1 45.0 58.2 51.3 35.5 58.7 47.3
Rarely 34.4 24.8 29.5 35.9 34.4 35.2 34.4 25.2 29.8
Occasionally 25.4 15.3 20.3 15.1 7.1 11.3 24.9 14.9 19.8
Frequently 5.3 1.2 3.2 4.1 0.3 2.3 5.2 1.1 3.2
Total 100.0 100.0 100.0 100.0 100.0 100.0 100.0 100.0 100.0
Number of Elderly 387 400 787 365 330 695 752 730 1,482

BKPAI: Himachal Pradesh
PAGE
28
Table 4.3: Per cent distribution of elderly attending religious programmes or services (excluding weddings and funerals) in the 12 months preceding the survey by place of residence and sex, Himachal Pradesh 2011
Frequency of Attendance in Religious Programmes
Rural Urban Total
Men Women Total Men Women Total Men Women Total
Never 22.4 37.5 30.1 20.8 35.0 27.6 22.3 37.4 30.0
Once or twice per year 52.8 45.2 48.9 58.3 49.2 53.9 53.1 45.4 49.2
Once or twice per month 17.1 13.4 15.2 11.2 8.4 9.9 16.8 13.1 14.9
Once or twice per week 7.4 4.0 5.6 7.8 5.4 6.6 7.4 4.0 5.7
Daily 0.3 0.0 0.2 2.0 2.0 2.0 0.4 0.1 0.3
Total 100.0 100.0 100.0 100.0 100.0 100.0 100.0 100.0 100.0
Number of Elderly 387 400 787 365 330 695 752 730 1,482
events was found to be slightly higher for urban men (58%) than their rural counterparts (53%) and
a similar pattern was observed for urban women (49%) as compared to rural women (45%).
The survey also investigated the satisfaction of the elderly with their current social and religious
participation. About 78 per cent expressed their satisfaction with current level of outings, while
18 per cent would not like to go out and the remaining 3 per cent expressed their desire to go
more often (BKPAI Survey, 2011). In addition, elderly respondents were also asked the reason for
not going out more. The two major reasons were health complications (56%) and lack of finances
to attend the social gatherings (29%). Some of the problems are urban centric (like safety and not
having anyone to accompany them); however the rural elderly reported more financial hardship
(30%) (Appendix Table A 4.5).
4.7 Elderly Abuse
While misbehaviour with the elderly is not new, their ill treatment has only recently been recognized
as a form of abuse in its own right (UNFPA and HelpAge International, 2012). Abuse is one of the
cruellest and most heinous acts by humans towards the elderly. In India, 31 per cent of the elderly
have faced some form of abuse as per the findings of survey conducted in the 20 major cities in the
country (HelpAge India, 2012) while in Himachal Pradesh, 12 per cent of the elderly have experienced
abuse and this is more likely to happen in rural areas (Table 4.4). This is higher than other states like
Kerala (3%) and Tamil Nadu (2%).
Table 4.4: Per cent distribution of elderly by experience of abuse after turning 60 and in the month preceding the survey according to place of residence and sex, Himachal Pradesh 2011
Experienced Abuse
Rural Urban Total
Men Women Total Men Women Total Men Women Total
Yes, after age 60 12.6 11.5 12.0 7.4 7.5 7.5 12.3 11.3 11.8
Yes, last month 1.5 2.2 1.9 1.1 0.6 0.9 1.5 2.1 1.8
Number of Elderly 387 400 787 365 330 695 752 730 1,482

Living Arrangements and Family Relations
PAGE
29
Figure 4.10: Forms and sources of abuse faced by the elderly after age 60, Himachal Pradesh 2011
95.4 97.5 89.4 89.7 94.3 94.7 94.9 93.2 95.8 93.4
1.80.8
2.44.3
3.0 2.5 1.93.4
1.93.4
2.4 0.8
5.0 2.1
1.5 0.7 1.4 0.91.4
1.1
0.5 1.03.1 3.9
1.2 2.1 1.8 2.60.9 2.1
84
86
88
90
92
94
96
98
100
Men Women Men Women Men Women Men Women Men Women
Pe
r C
en
t
Physical Verbal Economic Disrespect Neglect
No Within family Outside family Both within and outside family
Figure 4.10 shows the different forms and sources of abuse faced by the elderly. Except for verbal
abuse, the main source of abuse was within the family: women were more likely to be abused verbally
within the family and men outside the family. Economic dependence in later ages remains one
of the major reasons for elderly abuse or disrespect, which is generally meted out by relatives
and family members including daughters-in-law and sons. This remains true for both rural and
urban areas (Fig. 4.11).
Figure 4.11: Perpetrator of abuse or quarrel among elderly who reported any abuse in the month preceding the survey by place of residence and sex, Himachal Pradesh 2011
Spouse Son Daughter Son-in-law Daughter-in-law Relatives Neighbours
Rural Urban Men Women
Place of Residence Sex
Pe
r C
en
t
33.9
21.9
42.4
27.6
10.9
0.0 0.0
18.0
31.333.3
25.1
35.735.7 35.1
31.7
38.4
0.0
13.2
0.8 0.00
5
10
15
20
25
30
35
40
45

BKPAI: Himachal Pradesh
PAGE
30
To summarize, the living arrangements of the elderly in Himachal Pradesh are consistent with
the findings of the seven state study. The majority of the elderly are presently staying with their
spouses, children and grandchildren. However, the proportion of women living alone is the fourth
highest among the states covered by the BKPAI Survey which reflects the dismal condition of elderly
women in the state. The predominant reasons for the elderly living alone are migration of children,
followed by preference to be independent and family conflicts. Further, 97 per cent of the elderly
have reported that they are satisfied with their present living arrangement, with elderly men being
marginally more satisfied than elderly women. Meetings and communication between the elderly
and their children are universal. However, low level of monetary transfers between the elderly
and their non co-residing children appears surprising and therefore requires further investigation.
While the elderly participate actively in routine household activities, their role in decision-making is
restricted, especially for elderly women. The social engagement of the elderly in attending religious
programmes or public meetings is severely restricted and this is mainly due to concerns for their
safety and security along with companionship in urban areas, while financial constraints are the
primary reason in rural areas. The major issue emerging in this section is elderly abuse. About
12 per cent of the elderly had experienced abuse in Himachal Pradesh which is about the same
as the seven state average. Further investigation is required to ensure provisions are made for the
physical security of the elderly in the state.

PAGE
31
5. Health and Subjective Well-being The three major components of elderly well-being are: income security, health and social protection.
Health is a state of complete physical, mental and social well-being and not merely the absence of
disease or infirmity (WHO, 1948) and in the case of the elderly it becomes even more important since
with advancing age, the human body deteriorates in several ways and hence becomes immobile,
frail and suffers from various types of diseases and disorders. Therefore, health should be given a
higher priority in general and more so in the case of the elderly.
This section is divided into two broad sub-sections: (i) self-rated health, functionality and well-being
and (ii) morbidity, health care access and finance.
5.1 Self-rated Health, Functionality and Well-being
There are three major components of this sub-section–part one deals with the self-assessment
of the elderly about their current and relative health, the second part examines functional health
which includes activity of daily living (ADL), instrumental activities of daily living (IADL), loco-motor
disability and the last part examines the mental and psychological health, cognition and risky health
behaviours of the elderly.
5.1.1 Self-rated Health
The elderly were asked three questions related to their perceived health, i.e., how they rated their
health currently, how they rated it compared to the previous year and how they compared it with
that of their peers. Current health was measured on a point scale basis: (i) excellent (ii) very good
(iii) good (iv) fair and (v) poor. Similarly, compared health scales were: (i) better (ii) same (iii) worse
(iv) don’t know and (v) no response (Lorig et al., 1996).
Excellent or very good current health was perceived to be higher among men (31%) and urban
elderly (35%) than women (23%) and rural (26%) elderly. However, this perception declines with
higher age (20%), widowhood (18%), illiteracy (23%), elderly who have never worked (23%), low
wealth quintile (19%) and elderly living alone (17%) (Figs. 5.1 & 5.2 and Appendix Tables A 5.1 & 5.2).
Surprisingly, 70 per cent of the older population has reported more or less the same health status as
the previous year across gender and place of residence. One fifth of the elderly felt their health had
worsened and 7 per cent reported better health than the previous year. These percentages differ
with gender and place of residence (Appendix Tables A 5.1 and 5.2).

BKPAI: Himachal Pradesh
PAGE
32
Figure 5.1: Self-rated current health status by age and sex, Himachal Pradesh 2011
30.724.3
32.826.8 29.0
10.2
30.728.7 26.5
26.4
16.121.6
38.647.0
40.746.7
55.0
68.2
Good Fair/PoorExcellent/Very good
Men Women Men Women Men Women
60-69 70-79 80+
Pe
r C
en
t
Age Group
010
20
30
40
50
60
70
80
Figure 5.2: Self-rated current health status by marital status, caste/tribe and wealth quintile, Himachal Pradesh 2011
Lowest HighestSC/ST OBC OthersCurrently married
Widowed Others
Pe
r C
en
t
Wealth QuintileCaste/TribeMarital Status
Good Fair/PoorExcellent/Very good
0
10
20
30
40
50
60
70
30.7
18.4
36.2
24.8 28
.6
27.4
18.6
33.0
26.7
28.0
13.6 21
.7
36.7
26.9
24.0 29
.4
42.6
53.6
50.2 53
.5
34.7
45.8
57.3
37.6
There is a clear distinction in self-rated elderly health across gender and place of residence as
compared to their peers. Women (23%) and rural elderly (20%) have reported worse health but
the rest have differed with them and opined that their health is the same or even better as their
peers. It was also found that background characteristics do have a direct impact on elderly health
when compared with their peers specially education, current work status and living with spouse
and children (Appendix Tables A 5.1 and 5.2).
5.1.2 Functionality
There are three types of physical impairment among the elderly (i) activities of daily living (ADL),
(ii) instrumental activities of daily living (IADL) and (iii) locomotor disability. In literature, ADL
consists of the six most basic day-to-day activities like bathing, dressing, using the toilet, mobility,

Health and Subjective Well-being
PAGE
33
Figure 5.3: Elderly needing full/partial assistance for at least one ADL by sex and place of residence, Himachal Pradesh 2011
Men Women Rural Urban Total
Pe
r C
en
t
Sex Place of Residence
5.3
10.2
7.9
5.9
7.8
0
2
4
6
8
10
12
Figure 5.4: Elderly needing full/partial assistance by ADL domains according to age groups, Himachal Pradesh 2011
Bathing Dressing Toilet Mobility Continence Feeding
Pe
r C
en
t
60-69 70-79 80+
2.3 2.21.3 1.5 1.6 1.0
7.6
5.24.4
5.3
2.0 1.5
17.6
13.3 13.0
10.4
7.9
5.1
0
2
4
6
8
10
12
14
16
18
20
continence and feeding, and these activities have been measured on the basis of level of assistance
required, that is, full or partial (Katz et al., 1963; Katz, 1983).
The BKPAI Survey findings suggest that 8 per cent of the elderly requires assistance for at least one
ADL. Bathing (7%) appears to be the most difficult while feeding (2%) is the least challenging ADL in
old age. Moreover, it is slightly higher among the rural elderly (8%) and women (10%) as compared
to their urban (6%) and male (5%) counterparts. It is worth noting that only 1 per cent of the elderly
surveyed requires full assistance in all the above mentioned activities (Appendix Table A 5.3 and
Fig. 5.3), however, one fifth of the elderly require assistance in at least one ADL after crossing age
80 – bathing (18%), dressing and toilet activities (13% each) and mobility (10%) (Figs. 5.3 & 5.4 and
Appendix Tables A 5.3 & 5.5).

BKPAI: Himachal Pradesh
PAGE
34
Figure 5.5: Elderly who cannot perform any IADL activity according to sex, place of residence and age, Himachal Pradesh 2011
2.3
6.1
4.4
2.8
4.3
2.4
4.6
9.5P
er
Ce
nt
0Men Women Rural Urban Total
Sex Place of Residence Age Group
60-69 70-79 80+
123456789
10
The IADL activities include the ability to use the phone, shopping, food preparation, housekeeping,
laundry, transportation, medication and handling of finances. The Lawton and Brody (1969) Index
has been used for the analysis. On the basis of the IADL scale, more than 90 per cent of the elderly
required assistance for at least one activity without much variation across gender. However, the
rural (92%) and older old (97%) are more vulnerable than the urban (78%) and younger old
(88%). There are certain activities exclusively performed by women in Indian households like the
preparation of meals, housekeeping, and laundry, while shopping and handling finances are taken
care of by the men. Overall, only 8 per cent of the elderly can perform all the IADL activities and
they belong to the highest wealth quintile (20%), are living alone (26%), urban (22%) and young old
(12%) (Appendix Tables A 5.4 and 5.5). The inability to perform IADL activities increases with age,
especially among women. Overall 4 per cent of the elderly cannot perform any IADL activity (Fig. 5.5).
Besides functional limitations, there is another important aspect of physical health of the elderly:
locomotor disability. The survey asked respondents about any difficulty regarding vision, hearing,
walking, chewing, speaking and memory. For these aspects of disability they were questioned about
the use of aids (except for speaking and memory), sources of financing for such aids and extent of
help available through the use of such aids.
Locomotor disabilities were reported in terms of full and partial impairments. The four major
locomotor disabilities (full and partial) were vision (49%), chewing (33%), walking (23%) and hearing
(22%), prevalent especially among elderly women (Appendix Table A 5.6). The major issue of concern
is the high proportion of full disability in vision (12%), chewing (10%) and walking (5%) among the
elderly in the state. The extent of such disabilities increases with age (Fig. 5.6). The rural elderly
suffer from higher locomotor disabilities (except vision) than their urban counterparts and there is
not much variation across caste. But wealth status plays an important role in locomotor disabilities,
showing that a higher proportion of lower wealth quintile elderly reported locomotor disabilities
than the higher wealth quintile groups (Appendix Table A 5.7).

Health and Subjective Well-being
PAGE
35
Figure 5.6: Elderly by type of disability and age, Himachal Pradesh 2011
46.5
16.2 15.5
24.4
2.4
20.3
46.2
23.0 24.9
36.2
2.6
20.4
60.5
39.743.8
51.6
6.6
24.5
0
10
20
30
40
50
60
70
Vision Hearing Walking Chewing Speaking Memory
Pe
r C
en
t
60-69 70-79 80+
Figure 5.7: Elderly using disability aids according to age and sex, Himachal Pradesh 2011
29.424.9
29.5
24
33.1
40.1
0.5 0.7 2.50.4 1.5
4.24.47.5
18.8
10.4
23.621.7
6.69.2 8.5 8.2
3.0 3.2
0
5
10
15
20
25
30
35
40
45
Pe
r C
en
t
Men Women Men Women Men Women
60-69 70-79Age Group
80+
Spectacles/Lenses Hearing aids Walking sticks Dentures
The utilization of medical aids for locomotor disability is abysmally low in Himachal Pradesh–
nearly 99 per cent of the elderly do not have hearing aids, 89 per cent do not use walking sticks,
dentures are not available for 93 per cent of the elderly and 71 per cent are living without spectacles
or eye lenses. Utilization of aids is higher in urban areas and among the male elderly than their
counterparts. Utilization increases with age except for dentures (Appendix Table A 5.8 and Fig. 5.7).
Non-accessibility of medical gadgets or equipment as well as financial constraints could be possible
reasons for under-utilization of disability aids.
5.1.3 Mental Health and Cognitive Ability
Besides functional impairments and disabilities, mental health conditions are an important cause
of morbidity and mortality and are significant contributors to the burden of disease among the
elderly. In the present study, a number of standardized scales and questions were used to assess

BKPAI: Himachal Pradesh
PAGE
36
the general mental health conditions among the elderly respondents. These included the 12-item
General Health Questionnaires (GHQ) and the nine-item Subjective Well-being Inventory (SUBI).
The following section presents a few notable findings from the data collected through these
instruments.
General Health Questionnaire
The GHQ is a self-administered screening questionnaire, designed for use in a consulting setting and
aimed at detecting individuals with a diagnosable psychiatric disorder (Goldberg and Hillier, 1979).
The 12-GHQ items are: able to concentrate, loss of sleep due to worry, playing a useful part, capable
of making decisions, feel constantly under strain, could not overcome difficulties, able to enjoy
day-to-day activities, able to face problems, feel unhappy and depressed, loss of confidence, consider
self worthless and feel reasonably happy. Each item assesses the severity of a mental problem of
the individual in daily life. The GHQ items are rated on a four-point scale: (i) less than usual/not at
all/better than usual, (ii) no more than usual/same as usual, (iii) rather more than usual/less than
usual, and (iv) much more than usual which gives a total score between 12 and 36 depending
on the scoring method selected. The most common scoring methods are bimodal (0-0-1-1) and
Likert scoring (0-1-2-3) and for this study the latter has been used. A higher score indicates a
greater degree of psychological distress.
Subjective Well-being Inventory
The SUBI is designed to measure “feelings of well-being or ill-being as experienced by an individual
or a group of individuals in various day-to-day life concerns” (Sell and Nagpal, 1992). An important
aspect of mental health and psychological well-being, empirical assessment of Subjective Well-being
(SWB) involves evaluation of one’s life in terms of overall life satisfaction as well as one’s experience
of pleasant and unpleasant emotions (Moore et al., 2005). Originally proposed by Sell and Nagpal
(1992), the SUBI consists of a 40-item questionnaire including both positive and negative aspects,
with each item having three response options. In the present study, a nine-item SUBI has been used.
The three responses on each item are scored (1, 2, 3), with lower scores indicating greater well-
being. The scores on each item are added to arrive at the total score. The score, thus, varies from 9 to
27. The lower the score, the better is the mental health status.
While on the SUBI scale “all negative responses” implies serious health conditions, the GHQ is
indicative of psychological distress reflecting mental health of individuals if scores are greater than
12 on the Likert scale. The GHQ results reveal that about 36 per cent of the elderly are suffering from
psychological distress and the proportion is higher among women, widows and the rural elderly as
compared to their counterparts. Psychological distress increases with age – 27 per cent of young
old (60-69 years) and 52 per cent of the oldest old (above 80 years) reported distress – and declines
with wealth status as 49 per cent of those belonging to the lowest wealth quintile have reported
such distress against 28 per cent belonging to the highest wealth quintile (Table 5.1). Despite this,
psychological distress and mental health is not considered a major ailment in India and there is no
medication available. This is true for Himachal Pradesh as well.

Health and Subjective Well-being
PAGE
37
Table 5.1: Percentage of elderly classified based on GHQ-12 and SUBI according to select background characteristics, Himachal Pradesh 2011
Background Characteristics GHQ Score above Threshold Level (>12) SUBI (All Negative)
Age Group (Years)
60-69 27.2 1.9
70-79 40.8 2.3
80+ 52.1 4.3
Sex
Men 30.2 1.5
Women 41.2 3.3
Residence
Rural 36.3 2.5
Urban 26.9 1.7
Marital Status
Currently married 33.5 2.0
Widowed 40.6 2.7
Others 37.2 11.6
Wealth Quintile
Lowest 49.2 8.4
Highest 28.4 2.6
Total 35.8 2.4
In Himachal Pradesh, the mean SUBI score is 18, which is less than the seven state average of 19,
and there is not much variation by place of residence (Appendix Table A 5.9). Nevertheless, when
classified by age, old reported a high percentage of all negative or at least one negative SUBI
than the young old. This was also the case for women. Moreover, women above 80 years (7%),
divorced/separated/never married (12%) and poorest (8.4%) elderly fall under the subjective
ill-being category in Himachal Pradesh (Table 5.1). Only 3 per cent of the young old have reported all
positive responses to SUBI questions and 30 per cent have reported at least one negative response
(Appendix Table A 5.10).
Cognitive Ability
In addition to the GHQ and SUBI scale-based assessments of mental health conditions and subjective
well-being, a brief exercise was conducted during the survey to measure the degree of cognitive
ability among the elderly respondents. A list of 10 commonly used words (bus, house, chair, banana,
sun, bird, cat, sari, rice and monkey) was read out to the respondents and they were asked to recall
the words. The order of the words recalled was kept flexible. The number of words recalled as well
as the time taken for the recall was recorded. Results of the survey suggest that the urban, male,
young old and richer elderly are able to recall more words than other socio-economic groups. They
are able to recall 50 per cent of the words. However, there is not much variation between married
or widowed as their word recall score is more or less the same. The elderly have a poor memory
overall since more than three-quarters of the elderly recalled less than 50 per cent of the total words
(Fig. 5.8). Overall, less than 1 per cent of the elderly could recall more than 8 out of 10 words while
23 per cent could recall between six and eight words (Appendix Table A 5.11).

BKPAI: Himachal Pradesh
PAGE
38
Figure 5.8: Mean number of words immediately recalled by the elderly according to select background characteristics, Himachal Pradesh 2011
4.4
4.3
5.2
4.93.9
4.7
4.1
3.7
4.63.9
4.5
3.5
5.2
0 1 2 3 4 5 6
Rural
Urban
Men
Women
60-69
70-79
80+
Currently married
Widowed
Others
Lowest
Highest
Total
Re
sid
-
en
ceS
ex
Ag
e
Gro
up
Ma
rita
l
Sta
tus
Wea
lth
Qu
inti
le
Mean
5.1.4 Risky Health Behaviours
The elderly are most often engaged in three types of risky health behaviour – smoking, alcohol
consumption and chewing tobacco – all of which are more common in the case of men (WHO, 2005).
Similar results were also furnished by this survey, where 40 per cent of the elderly men are currently
smoking as against 4 per cent of women. While alcohol consumption and chewing tobacco is almost
nil for elderly women, it is 16 per cent and 3 per cent respectively for the men. Nearly half the elderly
men (47%) have reported engaging in at least one any of the three risky health behaviours currently
(Appendix Table A 5.12). While consumption of alcohol declines with increasing age there is no such
correlation for smoking and chewing tobacco (Fig. 5.9).
Figure 5.9: Current risky health habits among elderly by age group, Himachal Pradesh 2011
Smoking Alcohol consumption Chewing tobacco
Pe
r C
en
t
24.7
11.0
1.5
16.3
4.2
1.3
23.2
3.7 3.5
0
5
10
15
20
25
30
60-69 70-79 80+

Health and Subjective Well-being
PAGE
39
5.1.5 Medical Check-ups
This survey also tried to assess the health literacy and preventive care among the elderly population
by questioning them about the frequency of undergoing medical check-ups. One fifth of elderly
males (20%) and a slightly higher percentage of elderly females (23%) undergo routine medical
check-ups in the state, however only 13 per cent of all elderly people go for weekly or fortnightly
medical check-ups (Appendix Table A 5.13).This suggests that preventive health care and health
literacy is low in Himachal Pradesh and this needs to be improved through government policy
and programmes.
5.2 Morbidity, Health Care Access and Financing
This sub-section discusses non-communicable medically diagnosed diseases and hospitalization
among the elderly. In addition, any self-reported illnesses in the previous 15 days were also
considered. This section also focuses on elderly health-seeking behaviour, family care giving, health
expenditure, sources of health financing etc.
5.2.1 Acute Morbidity
The prevalence rate of acute morbidity among the elderly is about 108 per thousand in Himachal
Pradesh without much variation by gender and it is higher among the rural elderly (110 per 1000)
than their urban counterparts (78 per 1000) (Fig. 5.10). Notably, acute morbidity in Himachal Pradesh
is less than the seven state average of 13 per cent. However, it has been reported higher (28%)
in the NSS Health Survey 2004 and there is a marginal variation between rural illness (28%)
and urban (31%).
The incidence of acute morbidity increases with age (166 per 1000 in the age group 80+ years
compared to 81 per 1000 in the age group 60–69 years). Both SC and ST elderly reported higher
prevalence of acute morbidity (145 per 1000) compared to the general category (106 per 1000).
There is a negative association between a better standard of living and poor health status–
prevalence of acute morbidity among the elderly belonging to the highest wealth quintile
(164 per 1000) is found to be higher than the lowest wealth quintile (152 per 1000). Across marital
status, the highest incidence is found among the elderly who are divorced/separated (294 per
1000) (Fig. 5.10). However, it was observed that the elderly who live with their children and other
family members reported a comparatively lower prevalence of acute illnesses (102 per 1000) than
those living alone (193 per 1000) or with their spouse only (116 per 1000) (Appendix Table A 5.15).
The most often reported diseases are fever (417 per 1000), asthma (54 per 1000), blood pressure
(46 per 1000) and others (331 per 1000) which includes body pain, cataract, typhoid, ulcer etc.
The reporting of fever is almost double in rural areas (425 per 1000) as compared to urban areas
(220 per 1000) (Appendix Table A 5.16).

BKPAI: Himachal Pradesh
PAGE
40
Figure 5.10: Prevalence rate of acute morbidity per 1000 elderly according to select background characteristics, Himachal Pradesh 2011
Prevalence per 1000
145
47
106
152
164
96
121
294
81
121
166
106
110
110
78
108
0 100 200 300 400
ST/SC
OBC
Others
Lowest
Highest
Currently married
Widowed
Others^
60-69
70-79
80+
Men
Women
Rural
UrbanC
ast
e/
Tri
be
We
alt
h
Qu
inti
le
Ma
rita
l
Sta
tus
Ag
e
Gro
up
Se
xR
esid
-
ence
Total
Note: ^Based on 25-49 unweighted cases
With respect to the treatment of acute ailments, a high proportion of elderly (87%) in Himachal
Pradesh have received treatment but this is lower than the seven state average (91%). Moreover,
treatment sought was marginally higher among men and urban elderly than their counterparts
and it was lowest for the elderly aged above 80 years (Fig. 5.11 and Appendix Table A 5.17). Widely
cited reasons for not getting treatment are “no medical facility available in the neighbourhood”
and “financial reasons” among rural elderly.
Figure 5.11: Elderly seeking treatment for acute morbidity (last episode) according to place of residence, sex and age, Himachal Pradesh, 2011
87.8 85.396.3
88.894.2 90.4
70.3
86.7
0
20
40
60
80
100
Men Women Men Women 60-69 70-79 80+
Rural Urban Age Group
Total
Pe
r C
en
t

Health and Subjective Well-being
PAGE
41
As far as sources of treatment are concerned, about two thirds of the elderly sought treatment
from ‘government health facilities’ in both rural and urban areas. Private dispensaries (33.7%) are
the second preferred source for treatment for acute morbidity. This is in contrast to the treatment
seeking behaviour in the seven states report which is more inclined towards private physicians.
Only 4 per cent of rural elderly men are found to have visited “other” sources for treatment, showing
insignificant preference for unqualified practitioners (Appendix Table A 5.18). Propensity to seek
private physicians increases considerably with higher wealth quintile. This may imply that the
elderly prefer better quality medical care options provided by private hospitals if they can afford
them (Appendix Table A 5.19).
Surprisingly, the average expenditure incurred on treatment of acute morbidity was found to
be higher for government health facilities (Rs. 1,914). However, a comparison on treatment cost
of public and private health care facilities may not be feasible because of limited observations in
case of the latter. Similarly, a high mean expenditure was observed in rural areas (Rs. 1,453). It is
interesting to observe that the mean expenditure incurred for the treatment of acute ailments was
high for males (Rs. 2,278). This may be due to the fact that a considerably higher proportion of
males sought treatment from private physicians. Despite the government subsidy on consultancy,
diagnostic tests and free medicines in government hospitals they are still expensive (Fig. 5.12).
Figure 5.12: Average expenditure on treatment of last episode of acute morbidity by type of facility and select background characteristics, Himachal Pradesh 2011
Rupees
1591
2346
153
1389
212
2562
2278
1211
1453
5053
1914
750
0 1000 2000 3000 4000 5000 6000
SC/ST
OBC
Others^
Lowest*
Highest*
Men^
Women*
Rural^
Urban*
Govt. Health Facility^
Private Physician
Total
Ca
ste
/Tri
be
We
alt
h
Qu
inti
leS
ex
Re
si-
de
nce
He
alt
h
Fa
cili
ty
Note: ^Based on 25-49 unweighted cases; *Based on fewer than 25 unweighted cases

BKPAI: Himachal Pradesh
PAGE
42
The major component of expenditure on the treatment of acute morbidity is diagnostic tests (39.4%)
followed by medicines (26%) and others (23%). This may be because most of the government
hospitals are not well equipped with modern medical technology for diagnostic tests and lack
adequate supply of prescribed medicines. Therefore, most of the patients avail these facilities from
private healthcare providers (Appendix Table A 5.20).
The major source of financing the treatment of the last episode of acute morbidity among the
elderly in Himachal Pradesh is the spouse (60%) followed by self (26%) and lastly children (14%)
(Appendix Table A 5.21). This is in contrast to the findings of the seven state study, where children
were considered to be the major source of financial support for the medical expenses of their elderly
parents, followed by self and spouse.
5.2.2 Chronic Morbidity
The BKPAI Survey gathered information on the elderly suffering from 20 major chronic ailments,
also known as non-communicable diseases (NCDs).These are arthritis, cerebral stroke, heart disease,
diabetes, chronic lung disease, asthma, depression, high blood pressure, Alzheimer’s disease, cancer,
dementia, liver diseases, osteoporosis, renal disease, cataract, loss of all natural teeth, accidental
injury, injury due to a fall, skin disease and paralysis. These chronic diseases were diagnosed by
medical practitioners like doctors or nurses, without actually seeing the prescription. This section
focuses on the following issues of the NCDs: (i) duration of illness, (ii) status of medication in the
last three months, (iii) source of treatment, (iv) medical expenses, (v) source of finance and lastly
(vi) reason for not seeking any treatment.
Nearly two thirds of the elderly (653 per 1000) were suffering from at least one chronic disease
and prevalence was higher among women (719 per 1000) and the rural elderly (656 per 1000)
as compared to their counterparts. Further, there are seven common diseases which have been
reported by a majority of the elderly, namely, arthritis (390 per 1000), loss of natural teeth (152 per
1000), high blood pressure (147 per 1000), cataract (105 per 1000), asthma (95 per 1000), diabetes
(59 per 1000) and osteoporosis (56 per 1000) (Fig. 5.13 and Appendix Table A 5.22). The incidence of
arthritis is reported to be lower in the seven state study (293 per 1000) (Alam et al., 2012).
The prevalence of all these diseases is reported to be higher for elderly women than men except
asthma and diabetes. In addition, the prevalence of all common chronic diseases is higher among
the rural elderly barring high blood pressure (223 per 1000) and diabetes (108 per 1000) which may
be because of the skill intensive and sedentary nature of work in urban areas. The incidence of all
the seven common chronic ailments increases with advancing age. For example, from young old
(60-69 years) to oldest old (80+ years) the increase is 20 per cent for arthritis, 16 per cent for cataract,
12 per cent for loss of teeth, 8 per cent for Asthma and 7 per cent for Osteoporosis (Fig. 5.13).
When classified according to marital status, widows and others reported more NCDs than their
counterparts (Appendix Table A 5.23).

Health and Subjective Well-being
PAGE
43
Figure 5.13: Prevalence of seven common chronic ailments among per 1000 elderly by sex, age and place of residence, Himachal Pradesh 2011
390
278
498
397
267
318
436
519
152
138 16
6
155
93 107
177
243
147
135
159
143
223
140
145 17
3
105
108
101
106
77
39
158
203
95
124
67
97
60
83 82
158
59 65 53 56
108
73 57
19
56 47 65 58
13
36
60
108
0
100
200
300
400
500
600
Total Male Female Rural Urban 60-69 70-79 80+
Pre
va
len
ce
pe
r 1
00
0
Arthritis Loss of all natural teeth High blood pressure Cataract Asthma Diabetes Osteoporosis
Sex Place of Residence Age Group
There is wide variation with respect to the treatment of the NCDs. For example, more than
90 per cent of the elderly got treatment for high blood pressure and diabetes while over 70 per cent
got treatment for arthritis and asthma and 62 per cent for cataract. However, only about 17 per cent
of elderly suffering from osteoporosis and loss of natural teeth received medical treatment and aids
(Appendix Table A 5.24). Similar variations were observed for the reasons for not seeking treatment
as 74 per cent did not receive medical help for osteoporosis either because their condition had
improved or the ailment was not considered serious. Financial or other reasons (20% each) were
the major hurdles in accessing medical treatment for the arthritis patients (Appendix Table A 5.25).
Health facilities were also selected according to the diseases; however the inclination is more
towards government health facilities. To illustrate, over 50 per cent of the elderly had visited the
government health centre for treatment of arthritis, cataract, asthma and osteoporosis though
private physicians were preferred for loss of natural teeth (67%) and diabetes (56%). Yet both types
of health facilities were availed of by the elderly in almost equal proportions in case of high blood
pressure (about 47%) (Fig. 5.14). These findings suggest that, apart from the quality of the medical
care facility, the elderly or their families select the health facilities on emergency and non-emergency
grounds (Normand et al., 2013).
The average monthly expenditure for cataract treatment in a government hospital is Rs. 1,065 and
Rs. 2,865 in private hospitals (Fig. 5.15). The difference in the cost might be due to subsidies provided
at the government hospitals for similar services. However, as has been stated earlier, the elderly
in Himachal Pradesh mostly prefer government facilities for the treatment of chronic ailments.
Nevertheless, the expenditure in private health facilities is lower than government hospitals for the
treatment of diabetes, asthma and arthritis by 66 per cent,13 per cent and 15 per cent respectively.

BKPAI: Himachal Pradesh
PAGE
44
Figure 5.14: Elderly by source of treatment of common chronic morbidities, Himachal Pradesh 2011
Government hospital Private hospital Others
54.1
26.4
47.1
58.355.0
43.6
59.6
42.3
66.9
47.8
37.743.1
55.8
34.1
3.66.7 5.2 4.1 1.9 0.7
6.3
0
10
20
30
40
50
60
70
80
Arthritis Loss of all natural teeth
High blood
pressure
Cataract Asthma Diabetes Osteo-porosis
Pe
r C
en
t
Figure 5.15: Average monthly expenditure on treatment of common chronic morbidities by source of treatment, Himachal Pradesh 2011
Government hospital Private hospital Others
Ru
pe
es
842562
1065 10081222
733
1340^
596
2685^
895^736
* * * * * * * * * *0
500
1000
1500
2000
2500
3000
Arthritis Highblood
pressure
Cataract Asthma Diabetes Osteo-porosis
Loss of all natural teeth
Note: ^Based on 25-49 unweighted cases *Percentage not shown; based on fewer than 25 unweighted cases
Unlike the treatment of acute ailments, health care expenses for chronic morbidities are mostly
borne by the elderly men themselves with some support from their children, while in the case
of elderly women, health care expenditure is mostly financed by children and spouses for the
treatment. This is true for all the seven common chronic ailments (Appendix Table A 5.26), similar to
the findings for seven states together.
5.2.3 Hospitalization
A more reliable approach to ascertain the severity of ailments – either self-reported based on
symptoms, or based on the respondents’ reports on being informed about such ailments by

Health and Subjective Well-being
PAGE
45
Figure 5.16: Elderly hospitalized one year preceding the survey according to select background characteristics, Himachal Pradesh 2011
10.610.1 10.4
8
10.6 10.39.5
3.7
12.9
6.8
0
2
4
6
8
10
12
14
Men Women Rural Urban 60-69 70-79 80+ Lowest HighestMiddle
10.3
Total
Sex Place ofResidence
Age Group Wealth Quintile
Pe
r C
en
t
medical personnel – is to examine the extent of hospitalization or in-patient stay in health facilities.
This sub-section provides information related to elderly hospitalization in the last 365 days or past
12 months. As in the case of acute morbidity, it presents information on the hospitalization rate,
type of hospital facility availed, support and care givers, health care expenses and source of finance.
Overall, the hospitalization rate is 10 per cent across gender and age groups, however, the urban
elderly have reported lower hospitalization rates (8%) than the rural elderly (10%). Hospitalization
rate among the elderly varies from 7 per cent for the highest wealth quintile to 13 per cent for the
middle quintile and to 4 per cent for the lowest quintile (Fig. 5.16).
The most common ailments requiring hospitalization among the elderly are heart disease and
chest pain (13%), typhoid, malaria and fever (11%), abdominal ailments (8%), renal and kidney
disease (7%), injury due to accidents (6%), asthma, spinal and neurological disorders and diarrhoea
(5% each). Surprisingly, 14 per cent of the elderly were not even aware of the nature of disease
when they were hospitalized (Appendix Table A 5.27). In addition, there is variation in disease
patterns by gender and place of residence. On an average, an elderly person stayed in hospital for
10 days though women reported staying less (7 days) than men (13 days). Almost three fourths of
the elderly seek treatment in a government hospital and this share is higher among rural (74%) and
elderly men (79%) (Appendix Table A 5.28) indicating a shift from private to public hospitals in case
of hospitalization unlike in the case of acute morbidity. The possible explanation may be the cost of
hospitalization because, in general, government facilities are cheaper than private ones.
In India, the family is the first source of care for the elderly, especially hospital care. In Himachal
Pradesh the son and spouse bear the care giving responsibilities during hospitalization. Elderly men
are mostly accompanied by their spouses (51%) and sons (37%), while the order is reversed for
women (Fig. 5.17).
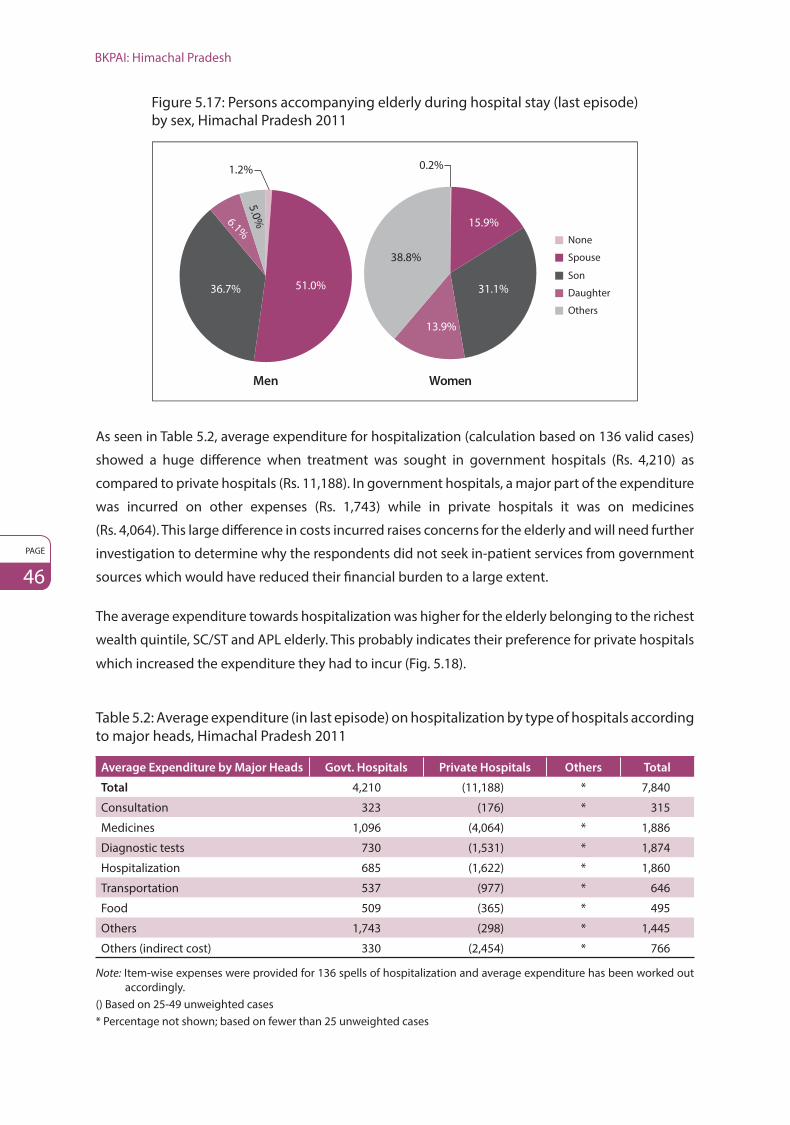
BKPAI: Himachal Pradesh
PAGE
46
Figure 5.17: Persons accompanying elderly during hospital stay (last episode) by sex, Himachal Pradesh 2011
Men Women
None
Spouse
Son
Daughter
Others
1.2%
51.0%36.7%
6.1%
5.0%
0.2%
15.9%
31.1%
13.9%
38.8%
As seen in Table 5.2, average expenditure for hospitalization (calculation based on 136 valid cases)
showed a huge difference when treatment was sought in government hospitals (Rs. 4,210) as
compared to private hospitals (Rs. 11,188). In government hospitals, a major part of the expenditure
was incurred on other expenses (Rs. 1,743) while in private hospitals it was on medicines
(Rs. 4,064). This large difference in costs incurred raises concerns for the elderly and will need further
investigation to determine why the respondents did not seek in-patient services from government
sources which would have reduced their financial burden to a large extent.
The average expenditure towards hospitalization was higher for the elderly belonging to the richest
wealth quintile, SC/ST and APL elderly. This probably indicates their preference for private hospitals
which increased the expenditure they had to incur (Fig. 5.18).
Table 5.2: Average expenditure (in last episode) on hospitalization by type of hospitals according to major heads, Himachal Pradesh 2011
Average Expenditure by Major Heads Govt. Hospitals Private Hospitals Others Total
Total 4,210 (11,188) * 7,840
Consultation 323 (176) * 315
Medicines 1,096 (4,064) * 1,886
Diagnostic tests 730 (1,531) * 1,874
Hospitalization 685 (1,622) * 1,860
Transportation 537 (977) * 646
Food 509 (365) * 495
Others 1,743 (298) * 1,445
Others (indirect cost) 330 (2,454) * 766
Note: Item-wise expenses were provided for 136 spells of hospitalization and average expenditure has been worked out accordingly.
() Based on 25-49 unweighted cases* Percentage not shown; based on fewer than 25 unweighted cases

Health and Subjective Well-being
PAGE
47
Figure 5.18: Average expenditure on hospitalization (last episode) by wealth quintile, caste/tribe and APL/BPL household category, Himachal Pradesh 2011
Ru
pe
es
28239
79145129
8861
5472
0
5000
10000
15000
20000
25000
30000
Highest* SC/ST* Other APL BPL*
Wealth Quintile
Caste/ Tribe APL/BPL Category
Note: Percentages are not shown for lowest wealth quintile and OBC category; based on fewer than 25 unweighted cases
*Based on 25-49 unweighted cases
Hospital expenses were mostly borne by the children (69%) and were particularly high for women
(81%). This suggests that mothers are still very close to their children and are mostly taken care of
by them. However, the source of finance varies for men. Men rely less on their children (56%), more
on self (23%) and least on their spouse (15%). The place of residence also has an impact on health
care financing. The hospitalization expenses of the rural elderly were borne by children (69%),
themselves and spouses (each 13%), while the financial sources for hospitalization of the urban
elderly are children (51%), own income or savings (39%) and spouse (10%) (Appendix Table A 5.29).
To summarize, the Health Section examined self-rated health, functionality and locomotor
disability, cognitive ability, risky health behaviour, levels of acute and chronic morbidity and their
treatment. Half of the elderly in Himachal Pradesh reported their current health as very good/good
but deteriorating health can be observed with increasing age, widowhood, illiteracy, living alone
and belonging to lower economic strata. A significant proportion of the elderly in the state faces
strong functional limitations in the performance of various daily activities (ADL and IADL) which
requires suitable attention. There are three major physical disabilities, which have been reported by
the elderly, namely, vision, chewing and walking. The utilization of disability aids is low in Himachal
Pradesh. The non-availability of medical care nearby and finance may be some reasons for this. Risky
health behaviours are also found to be considerably higher as compared to the national average,
especially smoking and alcohol consumption.
In Himachal Pradesh, a notable proportion of the elderly have reported psychological distress
which was evident from the GHQ responses. This needs to be further studied from the perspective
of social epidemiology to understand the dimensions and determinants of mental health aspects
among the elderly. This area has been studied periodically, and the BKPAI results indicate the need
for in-depth study of the issues. Better awareness and reporting ‘thresholds’ about health conditions
BKPAI: Himachal Pradesh
PAGE
48
may be responsible for the reported levels to a certain extent, as also noted for the hospitalization
and chronic morbidity levels. The indications, however, are less ambiguous about health-related
well-being, covering all the relevant health dimensions, which continues to be lower among
the lower socio-economic status (SES) population groups, calling for more intensive, targeted
interventions (Alam et al., 2014b).
The burden of acute morbidity is found to be marginally lower than the seven states combined
and fever is one of the most cited illnesses in the state. Treatment at government health facilities
for acute morbidity is expensive. Despite subsidies on various health expenditure components
government health facilities are still not cost effective. The major component of health expenditure
in government facilities is diagnostic tests which suggest that many of the public facilities are short
of diagnostic equipment. The spouse is a pivotal source of financing for elderly women, while almost
a third of elderly men finance their own health expenditure. Arthritis, high blood pressure, asthma,
diabetes and osteoporosis are the most common chronic ailments in both urban and rural locations.
The cost of treatment is higher for all these NCDs. This is particularly true for diabetes and asthma.
Contrary to the observation on hospitalization, most health care expenses for chronic morbidities
are borne by the elderly men themselves with some support from their children, while the major
sources of finance for women are their children and spouses. In-patient reporting is more or less
similar to the national average and main reasons for hospitalization are heart diseases, typhoid,
malaria and fever, abdominal ailments and renal and kidney diseases. Most of the elderly are
hospitalized in government hospitals and cost could be one reason for this choice. These findings
call for initiatives to be taken by the Government of Himachal Pradesh to ensure better quality of
services in the government hospitals and regulation of drug prices and diagnostic tests.
PAGE
49
6. Social Security
6.1 Introduction
India has traditionally followed the practice of “joint family system” where several generations
co-exist under the same roof. Himachal Pradesh has followed a similar pattern, where looking after
elderly parents is first and foremost the responsibility of children. There are two distinct social
norms in the state: (i) In tribal areas (districts like Kinnaur, Kullu and Lahaul & Spiti), daughters are
equally responsible for looking after their aged parents and they also inherit their parents’ land
and property and (ii) in the plains (districts like Kangra, Hamirpur and Mandi), the son is solely
responsible for taking care of the old parents. Care giving to the elderly was considered a moral
obligation and there was no noise about issues like elderly abuse.1 Further, social pressure to
care for the elderly (especially the unemployed and with no income) has always existed in the
state. However, owing to rapid migration and urbanization, the joint family system has gradually
disintegrated and the challenges (i.e., abuse, NCDs, demand for old age homes etc.) faced by
the elderly have been highlighted in the last few years. As families are shying away from the
responsibility of taking care of the aged members, it becomes necessary for the government
to step in and provide security like income, health and shelter to them. The estimated numbers of
the rapidly growing elderly population underlines the urgent need for monitoring the existing and
proposed social security measures in the state for the welfare of its elderly population. Social security
benefits are important instruments for addressing various economic, physical and psychological
vulnerabilities suffered by the elderly.
It is therefore essential to understand which stakeholders – children, government and elderly
themselves – are liable for undertaking the responsibility of the elderly. The BKPAI Survey tried to
ascertain from the ageing population of Himachal Pradesh the type of support system they prefer.
As seen in Figure 6.1, nearly 55 per cent of the elderly in the BPL and APL households think that
their children should support them in their old age and the proportion is slightly higher for the
BPL elderly women (67%). More than a quarter of the elderly belonging to APL households prefer
being independent in their old age. Overall, only 15 per cent of the elderly in the state thinks that
the government should be taking care of them and the percentage is slightly higher for the BPL
elderly (17%).The proportion of the elderly who prefer government support in their old age is very
low due to the lack of awareness among elderly regarding the government’s responsibility towards
the elderly welfare.
1 This observation was drawn on the basis of a discussion with some of the Indian Economic Service Officers from the Himachal Pradesh.

BKPAI: Himachal Pradesh
PAGE
50
Figure 6.1: Elderly by preferred support system in old age according to sex and BPL/APL households, Himachal Pradesh 2011
WomenMen
Per Cent
58.4
28.1
13.5
57.3
26.0
16.8
55.9
29.2
14.9
67.4
15.5
17.1
0 20 40 60 80
Children should support
Adult should be independent
Government should support
Children should support
Adult should be independent
Government should supportE
lde
rly
Be
lon
gin
g t
o
AP
L H
ou
seh
old
s
Eld
erl
y
Be
lon
gin
g t
o
BP
L H
ou
seh
old
s
It is interesting to note that a policy on older persons has been in existence in the state since 1969
and it was strictly adhered to for the welfare of the elderly. A state level advisory committee was set
up, comprising representatives of all the departments/public agencies having interface with senior
citizens and national/international NGOs working in the area of old age welfare. The Department of
Social Justice and Empowerment was the nodal department for coordinating all matters pertaining
to the implementation of the State Policy for Older Persons. The department still holds a nodal
position for the welfare of the elderly. A separate cell at three levels (Secretariat, Directorate and
District) with adequate staff was created in the department which is responsible for preparing a plan
of action for the implementation and monitoring of different schemes for the elderly. In addition,
PRIs were encouraged to participate in the implementation of different schemes for the elderly
and address their local level issues. The details of existing policies for elderly welfare, the eligibility
criteria and other information are given in the next section.
6.2 Overview of Social Security Schemes
The social security schemes for the elderly in Himachal Pradesh are initiated either by the central
or state government. There are a few schemes which are meant exclusively for senior citizens while
some schemes, though not meant exclusively for the elderly, benefit them as well. Table 6.1 gives a
brief overview of the currently existing schemes and their eligibility criteria.
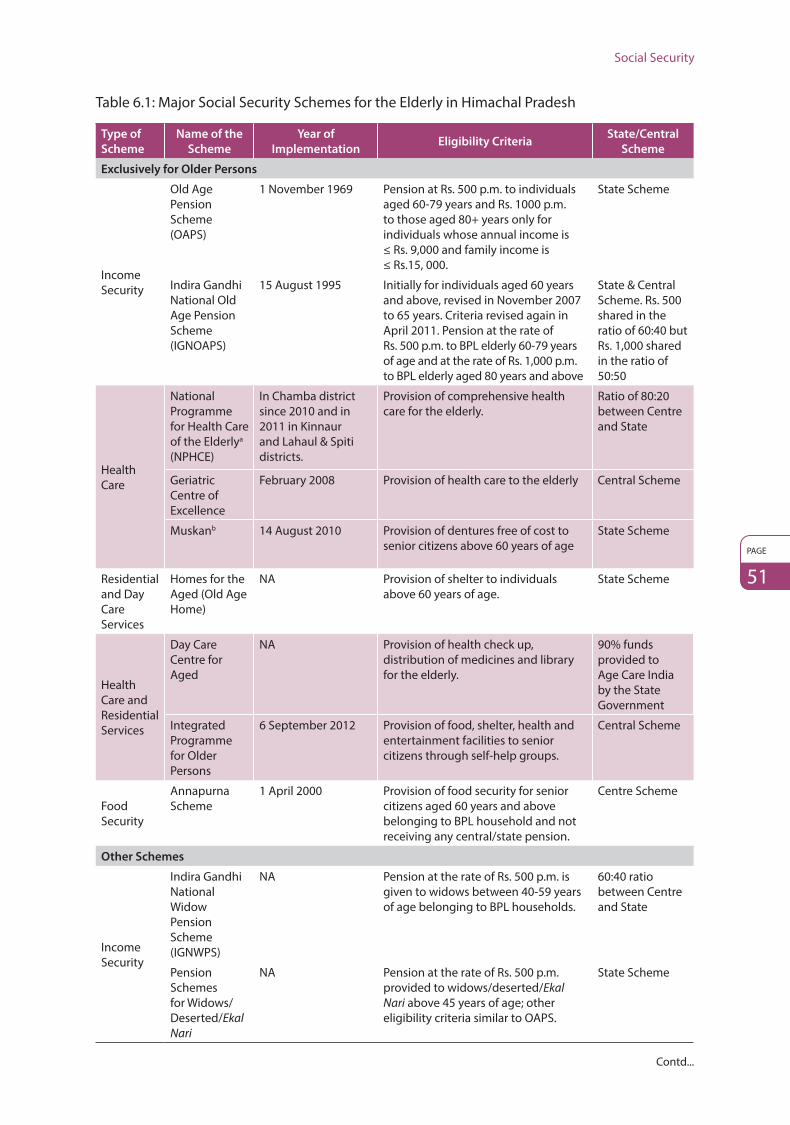
Social Security
PAGE
51
Table 6.1: Major Social Security Schemes for the Elderly in Himachal Pradesh
Type of
Scheme
Name of the
Scheme
Year of
ImplementationEligibility Criteria
State/Central
Scheme
Exclusively for Older Persons
Income Security
Old Age Pension Scheme (OAPS)
1 November 1969 Pension at Rs. 500 p.m. to individuals aged 60-79 years and Rs. 1000 p.m. to those aged 80+ years only for individuals whose annual income is ≤ Rs. 9,000 and family income is ≤ Rs.15, 000.
State Scheme
Indira Gandhi National Old Age Pension Scheme (IGNOAPS)
15 August 1995 Initially for individuals aged 60 years and above, revised in November 2007 to 65 years. Criteria revised again in April 2011. Pension at the rate of Rs. 500 p.m. to BPL elderly 60-79 years of age and at the rate of Rs. 1,000 p.m. to BPL elderly aged 80 years and above
State & Central Scheme. Rs. 500 shared in the ratio of 60:40 but Rs. 1,000 shared in the ratio of 50:50
Health Care
National Programme for Health Care of the Elderlya (NPHCE)
In Chamba district since 2010 and in 2011 in Kinnaur and Lahaul & Spiti districts.
Provision of comprehensive health care for the elderly.
Ratio of 80:20 between Centre and State
Geriatric Centre of Excellence
February 2008 Provision of health care to the elderly Central Scheme
Muskanb 14 August 2010 Provision of dentures free of cost to senior citizens above 60 years of age
State Scheme
Residential and Day Care Services
Homes for the Aged (Old Age Home)
NA Provision of shelter to individuals above 60 years of age.
State Scheme
Health Care and Residential Services
Day Care Centre for Aged
NA Provision of health check up, distribution of medicines and library for the elderly.
90% funds provided to Age Care India by the State Government
Integrated Programme for Older Persons
6 September 2012 Provision of food, shelter, health and entertainment facilities to senior citizens through self-help groups.
Central Scheme
Food Security
Annapurna Scheme
1 April 2000 Provision of food security for senior citizens aged 60 years and above belonging to BPL household and not receiving any central/state pension.
Centre Scheme
Other Schemes
Income Security
Indira Gandhi National Widow Pension Scheme (IGNWPS)
NA Pension at the rate of Rs. 500 p.m. is given to widows between 40-59 years of age belonging to BPL households.
60:40 ratio between Centre and State
Pension Schemes for Widows/Deserted/Ekal Nari
NA Pension at the rate of Rs. 500 p.m. provided to widows/deserted/Ekal Nari above 45 years of age; other eligibility criteria similar to OAPS.
State Scheme
Contd...

BKPAI: Himachal Pradesh
PAGE
52
Type of
Scheme
Name of the
Scheme
Year of
ImplementationEligibility Criteria
State/Central
Scheme
Income Security
Disability Relief Allowance
NA Pension at the rate of Rs. 500 p.m. to persons with at least 40% disability as per OAPS eligibility. Pension to persons with above 70% disability without any income, criteria subject to condition that applicant should not be employed in government/semi-government service/board/corporation and should not be availing any other pension.
State Scheme
Health Care
Rashtriya Swasthya Bima Yojana (RSBY)c
In Shimla and Kangra districts since 1 April 2008 and in the entire state since 1 March 2010.
RSBY is to provide protection to BPL households from financial liabilities. Beneficiaries entitled to hospitalization coverage up to Rs. 30,000. Pre-existing conditions are covered from day one and there is no age limit. Coverage extends to five members of the family. Beneficiaries need to pay only Rs. 30 as registration fee while government pays the premium to the insurer.
Central Scheme with cost sharing in 75:25 ratio between Centre and State
Other Schemes
Electronic Benefit Transfer Scheme (EBT)
1 July 2013 Distribution of social security pension to the elderly through EBT
State Scheme
Senior Citizen Identity Cards (ID)
Software based ID cards since April 2007
To enable senior citizens to avail the benefits of various schemes for the elderly
State Scheme
Source: Department of Social Justice and Empowerment, Government of Himachal Pradesh, Shimla a Department of Health and Family Welfare, Shimla b Department of Dental Services, Shimla c H.P. Swasthya Bima Yojana Society, Shimla
6.2.1 Income Security among the Elderly
Himachal Pradesh is the first state in the country to enact legislation for the maintenance of aged
parents through the Himachal Pradesh Maintenance of Parents and Dependents Act, 2001, prior to
the national level Maintenance and Welfare of Parents and Senior Citizens Act, 2007. According to
the Act, elderly parents can claim an amount of Rs. 5000 per month if they are not being properly
looked after by their children (Government of Himachal Pradesh, 2013).
The pension under OAPS has increased from Rs. 25 in 1969 to Rs. 500 in 2013,2 but even this amount
is insufficient to provide income security to the elderly owing to current double digit inflation. It is
difficult to link pension to other economic specifications since it is not an economic measure, but is
more in the nature of providing succour. However, if the pension amounts are indexed to inflation
in the future it would make the revision process free from political footprints and accord greater
resilience to the scheme along with ease of implementation (Hill Post, 25 September 2008).
2 Source: Directorate of Social Justice and Empowerment, Shimla, Himachal Pradesh.
Social Security
PAGE
53
Box 6.1: Challenges of social security utilization in Himachal Pradesh
In a review of the social security schemes in 10 states carried out by IIT Delhi and ICSSR, the
National Old Age Pension Scheme, the Himachal Pradesh Old Age Pension Scheme and Widow
Pension Scheme were studied in Himachal Pradesh. It was found that all the subject pensioners
reported getting the money on time every quarter. However, elderly encounter two major
challenges. First, they all complained that the pension amount was very low and insufficient to
cover their expenses. The major expense was for medicines, so they require some cash in hand
to meet contingencies. Second, in some districts like Sirmaur, pensioners have to go to the post
office themselves to get the pension, while in other districts like Kullu, the elderly receive their
pension at home through the postman (IIT Delhi and ICSSR, 2013).
The basic difference between the OAPS and the IGNOAPS is that OAPS is a state sponsored scheme
and based on income criteria whereas in the case of IGNOAPS, all BPL families are eligible to receive
its benefits. Senior citizens cannot receive pensions from both OAPS and IGNOAPS. IGNOAPS is
considered a universal scheme only for the BPL households. The central government only provides
the grant and the state distributes the benefits between the OAPS and IGNOAPS through a common
software programme. Initially, the software traces all the BPL households which fall under IGNOAPS
and those which have been left out and fall under OAPS income criteria, are provided pension
benefits by the state.
The administrative requirements and procedures for availing the benefits of these income security
schemes are given in Flow Chart 6.1 and a detailed description is provided in Appendix I.
Integrated Programme for Older Persons (IPOP)
This scheme aims at providing food, shelter, health and entertainment facilities to the senior citizens
through self-help groups. Registered help groups, charitable hospitals, Panchayati Raj Institutions
(PRIs) and local bodies are eligible for receiving these grants. Under the scheme, senior citizens
get access to old age homes, multi-purpose help centres, day care centres, mobile care unit
helplines etc., and their maintenance is financed in the ratio 90:10 by the Ministry of Social Justice
and Empowerment, Government of India and Department of Social Justice and Empowerment,
Government of Himachal Pradesh.
Annapurna Scheme
The Annapurna Scheme was implemented by the Food and Civil Supplies Corporation and aims
at providing food to meet the needs of the senior citizens aged 65 years and above who, though
eligible, have remained uncovered under the national or state old age pension schemes. Under this
scheme, 10 kilograms of food grains per month are provided free of cost to the beneficiaries.

BKPAI: Himachal Pradesh
PAGE
54
Flow
Cha
rt 6
.1: A
dmin
istr
ativ
e re
quire
men
ts a
nd p
roce
dure
s to
ava
il be
nefit
s fr
om s
ocia
l sec
urity
sch
emes
in H
imac
hal P
rade
sh
Applicant Village Level Tehsil Welfare
Officer (TWO)
District Welfare Office
(DWO)
DC External
Actor
STO
PST
ART
Pariw
ar R
epor
t
Obt
ain
appl
icat
ion
form
fr
om T
WO
/ Pan
chay
at/
Ang
anw
adi C
entr
e
Panc
haya
t rec
eive
s th
e ap
plic
atio
n fo
rm w
ith a
ttac
hed
docu
men
ts a
nd d
iscu
ssio
n ta
ke p
lace
at G
ram
Sab
ha
Rece
ives
the
appl
icat
ion
form
with
the
docu
men
ts
afte
r Pan
chay
at/ G
ram
Sab
ha
disc
ussi
on a
nd a
ppro
val
DEO
/ Dea
ling
Ass
ista
nt re
ceiv
es
the
appl
icat
ion
and
revi
ews
the
deta
ils
as g
iven
in
appl
icat
ion
form
w
ith a
ttac
hed
docu
men
ts
Dea
ling
As-
sist
ant m
akes
th
e re
quire
d en
trie
s in
the
e-Ka
lyan
sof
twar
e ap
plic
atio
n as
pe
r app
licat
ion
form
for n
ext
appr
oval
App
licat
ion
reac
hes
the
Su-
perin
tend
ent/
Su
perv
isor
for
verifi
catio
n.
The
hard
copy
of
the
form
is
verifi
ed w
ith
the
onlin
e fo
rm
Dea
ling
Ass
ista
nt
rece
ives
the
appl
icat
ion
for
final
app
rova
l; ve
rifica
tion
of
the
hard
cop
y of
th
e ap
plic
atio
n is
ca
rrie
d ou
t with
the
onlin
e ap
plic
atio
n
Dea
ling
Ass
ista
nt
appr
oves
the
appl
icat
ion
form
an
d se
nds
to D
C fo
r app
rova
l and
D
C offi
ce v
erifi
es
the
appl
icat
ion
in
hard
cop
y w
ith th
e on
line
form
Dea
ling
Ass
is-
tant
is
upda
ted
Verifi
catio
n of
the
appl
icat
ion
form
is c
ompl
eted
and
a
verifi
catio
n re
port
is p
repa
red
and
subm
itted
to D
WO
for
appr
oval
TWO
reco
rds
the
deta
ils
of th
e ap
plic
ant a
s pe
r the
ca
tego
ry in
the
form
at fo
r ci
rcul
atio
n an
d ap
prov
al
Fund
s ar
e tr
ansf
erre
d to
th
e ap
plic
ant t
hrou
gh
mon
ey o
rder
or d
irect
ly
into
ban
k ac
coun
t
DC
appr
oves
the
pens
ion
case
s (in
lot)
ba
sed
on th
e ap
prov
al fr
om D
WO
App
lican
t’s b
ank
acco
unt d
etai
ls o
r pos
t offi
ce d
etai
ls a
re m
appe
d fo
r fun
d tr
ansf
er
Rece
ipt n
ote
is
reco
rded
for P
LA
Verifi
catio
n of
the
appl
ican
t is c
ompl
eted
as
per
cat
egor
y an
d de
tails
men
tione
d in
th
e fo
rm
Cate
gory
-wis
e re
cord
is
sen
t to
Panc
haya
t
Filli
ng-u
p th
e pe
nsio
n ap
plic
atio
n fo
rm a
long
with
sup
port
ing
docu
men
t and
sub
mit
to P
anch
ayat
App
lican
t rec
eive
s th
e pe
nsio
n as
per
the
cate
gory
app
lied
for
App
lica-
tion
form
is
ver
i-fie
d?
Doc
u-m
ents
ve
rified
Doc
u-m
ents
ve
rified
Doc
umen
t Ve
rifica
tion?
No
No
No
No
Yes
Yes
Yes
Yes
Sour
ce: D
epar
tmen
t of S
ocia
l Jus
tice
and
Empo
wer
men
t, G
over
nmen
t of H
imac
hal P
rade
sh, S
DA
Com
plex
, Shi
mla
-9

Social Security
PAGE
55
6.2.2 Health Care for the Elderly
The National Policy for Older Persons (NPOP) aims at establishing a geriatric ward for elderly
patients in the district level hospitals and expansion of treatment facilities for chronic, terminal
and degenerative diseases. It includes strengthening of Primary Health Centres (PHCs), Community
Health Centres (CHCs) and mobile clinics. It also involves the training of geriatric care providers.3
A major health care scheme, the National Programme for Health Care of the Elderly (NPHCE),
has been initiated by the Government of India for senior citizens. This scheme was launched in 100
identified districts of 21 states during the 11th Five Year Plan in the year 2010-11. It aims at providing
comprehensive health care facilities to the elderly all over the country. Eight regional medical
institutions in different regions of the country have also been setup. The Regional Geriatric Centre
for NPHCE for Himachal Pradesh is in Delhi (All India Institute of Medical Sciences, AIIMS).
This scheme is operational in three districts of Himachal Pradesh: Chamba, Lahaul & Spiti and
Kinnaur. The Regional Geriatric Centre is required to have a geriatric OPD and a 30-bed geriatric
ward for the elderly, provide training of health personnel in geriatric health care and undertake
advanced and demand driven research while the District Geriatric Units are required to have a
dedicated geriatric OPD and 10-bed geriatric ward for the elderly patients.
6.2.3 Residential and Day Care Services for the Elderly
There are nine old age homes4 in the state of Himachal Pradesh. Individuals aged 60 years or above
are eligible to reside in these old age homes. The central government gives up to 90 per cent grant to
the NGOs for establishing such institutions. Currently, there are five main organizations responsible
for the operation and maintenance of these old age homes in Himachal Pradesh as shown in
Table 6.2.
To know more about old age homes such as year of establishment, current operational status and
address, refer Appendix II.
Table 6.2: Old age homes and the organizations managing them
Name of the Old Age Home Organization
1. Old Age Home, Basantpur, Shimla Himachal Pradesh State Social Welfare Board, Shimla
2. Home for the Aged, Garli (Kangra) Himachal Pradesh Child Welfare Council, Shimla
3. Bridh Ashram, Bhangrotu, Mandi Balh Valley Kalyan Sabha, Mandi
4. Baru Sahab, Sirmaur Kalgidhar Society, Sirmaur
5. The Suket Senior Citizens Home, Mandi International Trust, Mandi
3 Operational Guidelines (2011): National Programme for Health Care of the Elderly. Directorate General of Health Services, Ministry of Health and Family Welfare, Government of India. http://mohfw.nic.in/WriteReadData/l892s/2612656526Operational_Guidelines_NPHCE_final.pdf
4 http://www.archive.india.gov.in/outerwin.php?id=http://www.pagindia.com/OldAgeHomes.pdf

BKPAI: Himachal Pradesh
PAGE
56
Other Schemes
Besides the social security and welfare schemes in Himachal Pradesh mentioned above, there are
other measures being taken by the state government to address the growing needs of the elderly in
the state5 and they are as given below.
i. Senior citizens who are domiciles of Himachal Pradesh are issued identity cards so as to facilitate
them in availing the benefits of the state sponsored policies and programmes. This identity card
can be obtained by submitting an application along with a copy of the birth certificate from the
Lok Mitra Kendra at the Panchayat level or from the office of the concerned Tehsil Welfare Officer
(TWO)/District Welfare Officer (DWO).
ii. The Government of India has issued a list of directives dated 21 October, 2011 wherein banks
were advised to prepare new roadmaps for the disbursement of several welfare schemes like
social security pension, national old age pension etc., through the banking channel, leveraging
of the Electronic Benefit Transfer (EBT) for financial intermediation. The RBI has issued operational
guidelines to select one Leader Bank and other participating banks while implementing the
EBT scheme at the district level. At present, the responsibility for distribution of social security
pension through EBT has been entrusted to UCO Bank in four districts and Punjab National
Bank in seven districts in Himachal Pradesh. So far the distribution of social security pension has
been established only in one district, Una, through the Business Correspondent Model (BCM)
implemented by State Bank of India (Economic Survey of Himachal Pradesh 2011-126).
iii. The Himachal Pradesh State Electricity Board has provided the elderly the facility of paying
electricity bills through cheques.
iv. Senior citizens can avail concessions on the booking of train tickets on Indian Railways. According
to this scheme, elderly males above 60 years of age can avail 40 per cent discount on the basic
fare of train tickets7 while females above 58 years of age can avail a 50 per cent discount.
This rule has been applicable since June 2011 and is valid across the country.8
v. As per a recent notification issued by the Transport Department on 10 October 2013, the
validity of senior citizen smart cards which were earlier made at a cost of Rs. 50 for a period of
one year has been extended up to five years on Himachal Pradesh Road Transport Corporation
(HRTC) buses. Senior citizens are being provided 20 per cent concession on fares under
this scheme. Two seats are reserved for senior citizens on HRTC buses (numbers 25 and 26).
There is also a provision for a separate queue for senior citizens for buying tickets at all the
counters of HRTC.
5 Information and Public Relations Department, Government of Himachal Pradesh. http://himachalpr.gov.in/features/Feature-40E11.htm6 http://himachal.gov.in/finance/BudPrev.htm7 http://www.indianrail.gov.in/reservation_Rules.html8 www.indianrail.gov.in
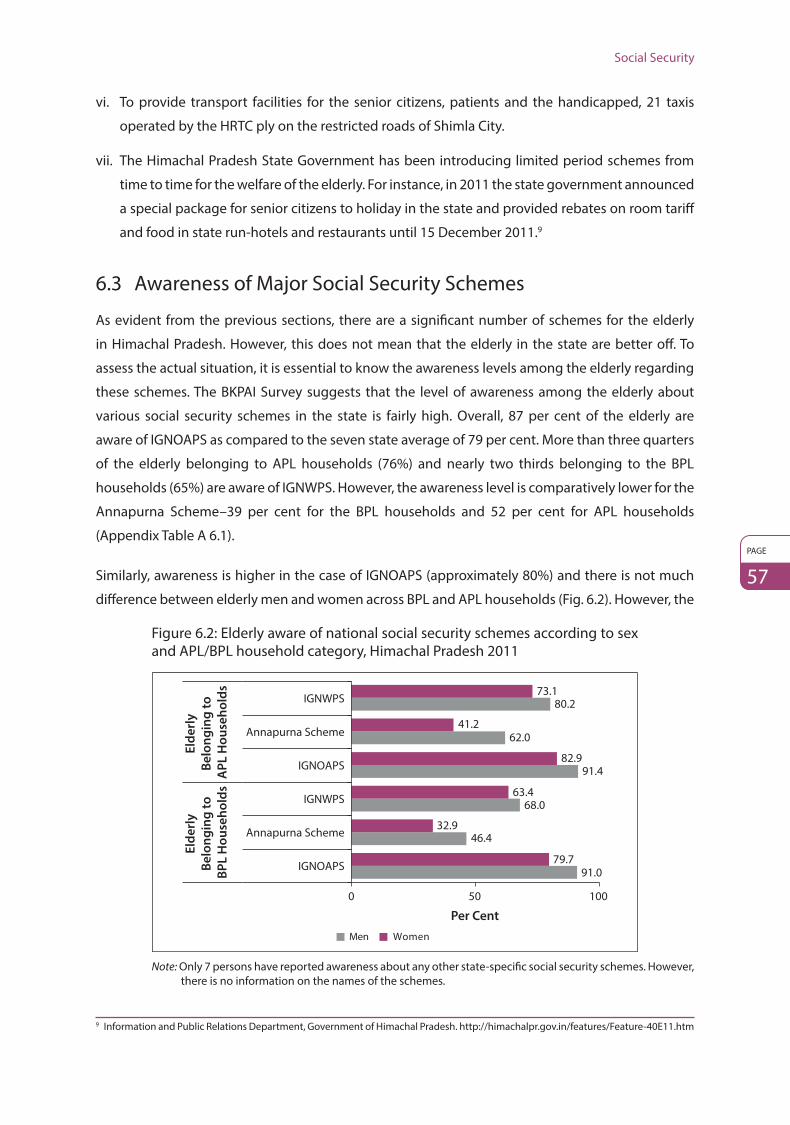
Social Security
PAGE
57
9 Information and Public Relations Department, Government of Himachal Pradesh. http://himachalpr.gov.in/features/Feature-40E11.htm
vi. To provide transport facilities for the senior citizens, patients and the handicapped, 21 taxis
operated by the HRTC ply on the restricted roads of Shimla City.
vii. The Himachal Pradesh State Government has been introducing limited period schemes from
time to time for the welfare of the elderly. For instance, in 2011 the state government announced
a special package for senior citizens to holiday in the state and provided rebates on room tariff
and food in state run-hotels and restaurants until 15 December 2011.9
6.3 Awareness of Major Social Security Schemes
As evident from the previous sections, there are a significant number of schemes for the elderly
in Himachal Pradesh. However, this does not mean that the elderly in the state are better off. To
assess the actual situation, it is essential to know the awareness levels among the elderly regarding
these schemes. The BKPAI Survey suggests that the level of awareness among the elderly about
various social security schemes in the state is fairly high. Overall, 87 per cent of the elderly are
aware of IGNOAPS as compared to the seven state average of 79 per cent. More than three quarters
of the elderly belonging to APL households (76%) and nearly two thirds belonging to the BPL
households (65%) are aware of IGNWPS. However, the awareness level is comparatively lower for the
Annapurna Scheme–39 per cent for the BPL households and 52 per cent for APL households
(Appendix Table A 6.1).
Similarly, awareness is higher in the case of IGNOAPS (approximately 80%) and there is not much
difference between elderly men and women across BPL and APL households (Fig. 6.2). However, the
Figure 6.2: Elderly aware of national social security schemes according to sex and APL/BPL household category, Himachal Pradesh 2011
Per Cent
WomenMen
91.0
46.4
68.0
91.4
62.0
80.2
79.7
32.9
63.4
82.9
41.2
73.1
0 50 100
IGNOAPS
Annapurna Scheme
IGNWPS
IGNOAPS
Annapurna Scheme
IGNWPS
Eld
erl
y
Be
lon
gin
g t
o
BP
L H
ou
seh
old
s
Eld
erl
y
Be
lon
gin
g t
o
AP
L H
ou
seh
old
s
Note: Only 7 persons have reported awareness about any other state-specific social security schemes. However, there is no information on the names of the schemes.

BKPAI: Himachal Pradesh
PAGE
58
other two schemes differ highly across gender and poverty status and awareness is lower among
the BPL elderly as compared to their APL counterparts. Elderly men are more aware about these
schemes than women. One possible explanation could be that men are responsible for the meeting
the financial needs of the household while women tend to look after the household chores and
hence, are less aware about the availability of government sponsored financial and social schemes.
This observation highlights the need for better outreach of financial and social help for the
BPL households. The state government should organize awareness campaigns particularly for the
BPL households and women, so that they become conscious of their socio-economic rights.
6.4 Coverage and Financing of Major Social Security Schemes
The penetration of social security schemes in respect of beneficiaries covered and the financial
outlay is given in the Table 6.3. As can be seen from Table 6.3, the biggest share of budget outlay
is diverted towards OAPS followed by IGNOAPS. Moreover, the total expenditure on social security
schemes for the elderly is less than the proposed budget outlay by the government. This raises
serious questions about the efficiency in the utilization of funds provided for the social welfare of
senior citizens. However, the percentage of elderly benefitting from such schemes has been rising
marginally every year in case of OAPS. The NPHCE is a relatively new scheme in the state so it is
difficult to comment on the success of the scheme due to the non-availability of data.
The preceding paragraph described the government outlay and expenditure for the social security
schemes in the state. The BKPAI Survey also gathered data on the utilization of the social security
schemes – IGNOAPS, IGNWPS, Annapurna and other state specific schemes. While utilization of
social security schemes like IGNOAPS and IGNWPS in Himachal Pradesh is the second highest after
Odisha in the states surveyed, it is still low. Utilization is higher for the BPL elderly than APL. Nearly
a quarter of the BPL elderly utilizes IGNOAPS and over one third utilizes IGNWPS across urban and
rural areas. However, these schemes are meant only for BPL households and widows respectively,
therefore there is a huge gap between actual and proposed utilization. There is an urgent need
for further analysis to understand the reasons for such low utilization of the government schemes
by the BPL elderly. Surprisingly, it has also been utilized by many non-targeted APL elderly. The
Annapurna Scheme is utilized by only 7 per cent of BPL elderly (Appendix Table A6.2). IGNOAPS is
the most utilized scheme by BPL elderly men while among women, IGNWPS is the most utilized
scheme (Fig. 6.3).
Attempts have been made to authenticate the results by measuring the utilization of social security
schemes on the basis of the wealth status of the elderly. The findings suggest that IGNOAPS is the
most widely utilized scheme, with about 34 per cent of the elderly belonging to lowest wealth
quintile, nearly one fifth of SC/ST and 8 per cent of the OBC elderly utilizing it, followed by IGNWPS.
As far as the Annapurna Scheme is concerned, there is negligible utilization by the SC/STs and lower
and middle wealth quintile elderly in Himachal Pradesh (Fig. 6.4).
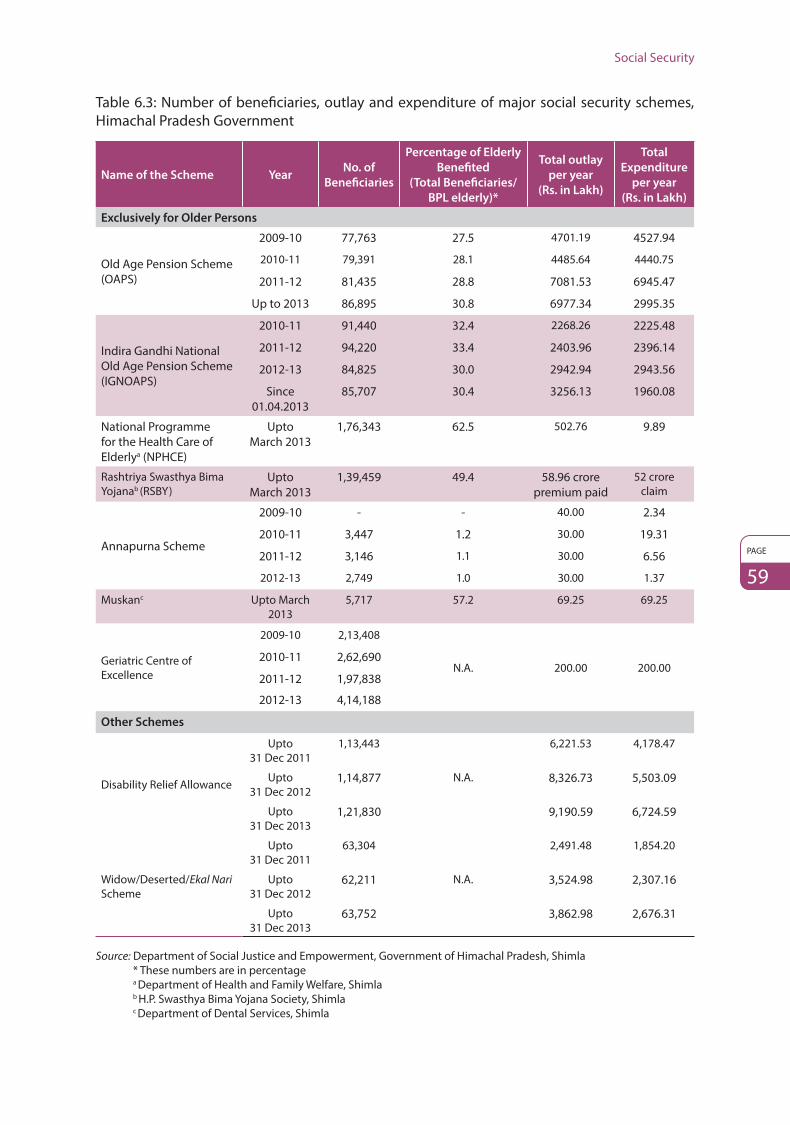
Social Security
PAGE
59
Table 6.3: Number of beneficiaries, outlay and expenditure of major social security schemes, Himachal Pradesh Government
Name of the Scheme YearNo. of
Beneficiaries
Percentage of Elderly
Benefited
(Total Beneficiaries/
BPL elderly)*
Total outlay
per year
(Rs. in Lakh)
Total
Expenditure
per year
(Rs. in Lakh)
Exclusively for Older Persons
Old Age Pension Scheme (OAPS)
2009-10 77,763 27.5 4701.19 4527.94
2010-11 79,391 28.1 4485.64 4440.75
2011-12 81,435 28.8 7081.53 6945.47
Up to 2013 86,895 30.8 6977.34 2995.35
Indira Gandhi National Old Age Pension Scheme (IGNOAPS)
2010-11 91,440 32.4 2268.26 2225.48
2011-12 94,220 33.4 2403.96 2396.14
2012-13 84,825 30.0 2942.94 2943.56
Since 01.04.2013
85,707 30.4 3256.13 1960.08
National Programme for the Health Care of Elderlya (NPHCE)
Upto March 2013
1,76,343 62.5 502.76 9.89
Rashtriya Swasthya Bima Yojanab (RSBY)
Upto March 2013
1,39,459 49.4 58.96 crore premium paid
52 crore claim
Annapurna Scheme
2009-10 - - 40.00 2.34
2010-11 3,447 1.2 30.00 19.31
2011-12 3,146 1.1 30.00 6.56
2012-13 2,749 1.0 30.00 1.37
Muskanc Upto March 2013
5,717 57.2 69.25 69.25
Geriatric Centre of Excellence
2009-10 2,13,408
N.A. 200.00 200.002010-11 2,62,690
2011-12 1,97,838
2012-13 4,14,188
Other Schemes
Disability Relief Allowance
Upto 31 Dec 2011
1,13,443 6,221.53 4,178.47
Upto 31 Dec 2012
1,14,877 N.A. 8,326.73 5,503.09
Upto 31 Dec 2013
1,21,830 9,190.59 6,724.59
Widow/Deserted/Ekal Nari Scheme
Upto 31 Dec 2011
63,304 2,491.48 1,854.20
Upto 31 Dec 2012
62,211 N.A. 3,524.98 2,307.16
Upto 31 Dec 2013
63,752 3,862.98 2,676.31
Source: Department of Social Justice and Empowerment, Government of Himachal Pradesh, Shimla * These numbers are in percentage a Department of Health and Family Welfare, Shimla b H.P. Swasthya Bima Yojana Society, Shimla c Department of Dental Services, Shimla
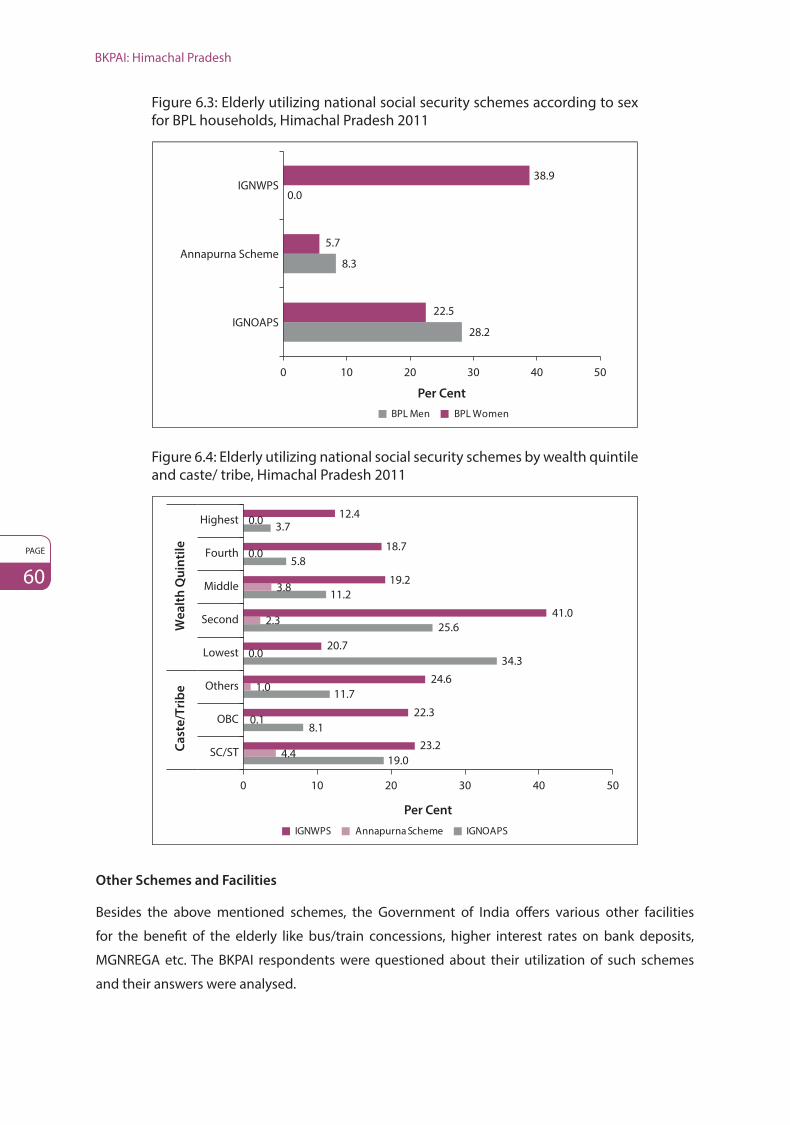
BKPAI: Himachal Pradesh
PAGE
60
Figure 6.3: Elderly utilizing national social security schemes according to sex for BPL households, Himachal Pradesh 2011
BPL WomenBPL Men
Per Cent
28.2
8.3
0.0
22.5
5.7
38.9
0 10 20 30 40 50
IGNOAPS
Annapurna Scheme
IGNWPS
Figure 6.4: Elderly utilizing national social security schemes by wealth quintile and caste/ tribe, Himachal Pradesh 2011
IGNWPS Annapurna Scheme IGNOAPS
Per Cent
19.0
8.1
11.7
34.3
25.6
11.2
5.8
3.7
4.4
0.1
1.0
0.0
2.3
3.8
0.0
0.0
23.2
22.3
24.6
20.7
41.0
19.2
18.7
12.4
0 10 20 30 40 50
SC/ST
OBC
Others
Lowest
Second
Middle
Fourth
Highest
Ca
ste
/Tri
be
We
alt
h Q
uin
tile
Other Schemes and Facilities
Besides the above mentioned schemes, the Government of India offers various other facilities
for the benefit of the elderly like bus/train concessions, higher interest rates on bank deposits,
MGNREGA etc. The BKPAI respondents were questioned about their utilization of such schemes
and their answers were analysed.

Social Security
PAGE
61
Figure 6.5: Elderly utilizing facilities/schemes by lowest and highest wealth quintile, Himachal Pradesh 2011
Train ticket concession
Bus seat reservation
Income taxbenefits
MGNREGA
Lowest Highest
Preferencefor
telephoneconnection
Higherinterest fordeposits inbanks/Post
offices
Pe
r C
en
t
0.1 0.0 0.0
5.7
0.0
10.711.0
3.10.7
18.6
6.6
1.4
0
5
10
15
20
According to the BKPAI data, the various schemes and facilities are utilized mainly by the highest
wealth quintiles, while a tenth of the elderly in the lowest wealth quintile utilizes MNREGA. Nearly
one fifth of the elderly from the highest wealth quintile enjoys higher interest rates on bank deposits
while 11 per cent enjoy concessions on train fares. Income tax benefit was availed by economically
better off elderly even though the percentage is small (Fig. 6.5).
From the above, it can be inferred that these schemes provide more benefits to the wealthy rather
than the poor. This implies that there is a need to promote the schemes which have a direct impact
and benefit the elderly poor more than the others.
Health Insurance Schemes
Health insurance coverage is very low across the country with less than 2 per cent of the total
population covered under any health insurance scheme. The situation is worse for the elderly
as less than 1 per cent of them have health insurance while they suffer from severe chronic
illnesses and face several episodes of hospitalization in old age (NSSO 60th Round, 2004). The
BKPAI Survey tried to ascertain the coverage of the elderly population under the government
and private health insurance schemes. Overall, less than 2 per cent of the elderly men and a
negligible percentage of women had a health insurance and less than 1 per cent was covered
under government assisted health insurance schemes (Fig. 6.6). There is a need for Universal Health
Coverage (UHC) exclusively for the elderly in Himachal Pradesh, although the RSBY which has
been implemented in the state since 2008 covers five members of a household and the average
household size in Himachal Pradesh is five (Census, 2011). This scheme will be elaborated further
in the following section.
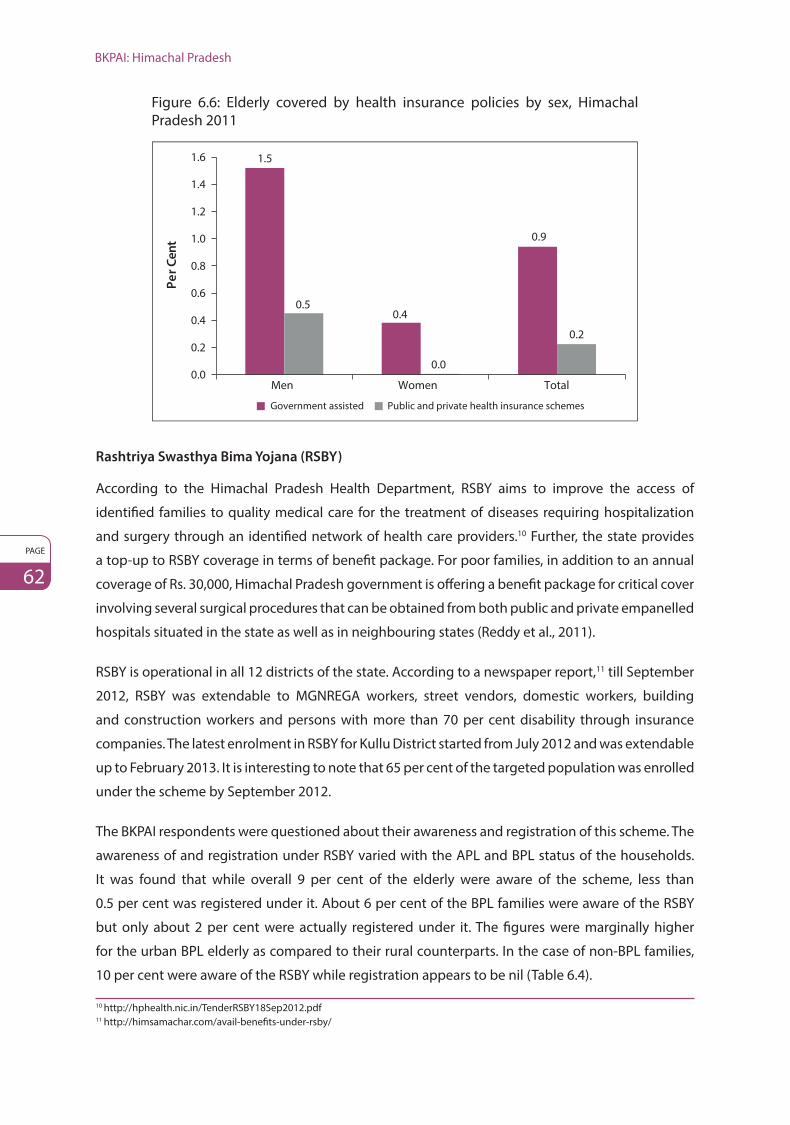
BKPAI: Himachal Pradesh
PAGE
62
Figure 6.6: Elderly covered by health insurance policies by sex, Himachal Pradesh 2011
Pe
r C
en
t
Government assisted Public and private health insurance schemes
1.5
0.4
0.9
0.5
0.0
0.2
0.0
0.2
0.4
0.6
0.8
1.0
1.2
1.4
1.6
Men Women Total
Rashtriya Swasthya Bima Yojana (RSBY)
According to the Himachal Pradesh Health Department, RSBY aims to improve the access of
identified families to quality medical care for the treatment of diseases requiring hospitalization
and surgery through an identified network of health care providers.10 Further, the state provides
a top-up to RSBY coverage in terms of benefit package. For poor families, in addition to an annual
coverage of Rs. 30,000, Himachal Pradesh government is offering a benefit package for critical cover
involving several surgical procedures that can be obtained from both public and private empanelled
hospitals situated in the state as well as in neighbouring states (Reddy et al., 2011).
RSBY is operational in all 12 districts of the state. According to a newspaper report,11 till September
2012, RSBY was extendable to MGNREGA workers, street vendors, domestic workers, building
and construction workers and persons with more than 70 per cent disability through insurance
companies. The latest enrolment in RSBY for Kullu District started from July 2012 and was extendable
up to February 2013. It is interesting to note that 65 per cent of the targeted population was enrolled
under the scheme by September 2012.
The BKPAI respondents were questioned about their awareness and registration of this scheme. The
awareness of and registration under RSBY varied with the APL and BPL status of the households.
It was found that while overall 9 per cent of the elderly were aware of the scheme, less than
0.5 per cent was registered under it. About 6 per cent of the BPL families were aware of the RSBY
but only about 2 per cent were actually registered under it. The figures were marginally higher
for the urban BPL elderly as compared to their rural counterparts. In the case of non-BPL families,
10 per cent were aware of the RSBY while registration appears to be nil (Table 6.4).
10 http://hphealth.nic.in/TenderRSBY18Sep2012.pdf11 http://himsamachar.com/avail-benefits-under-rsby/
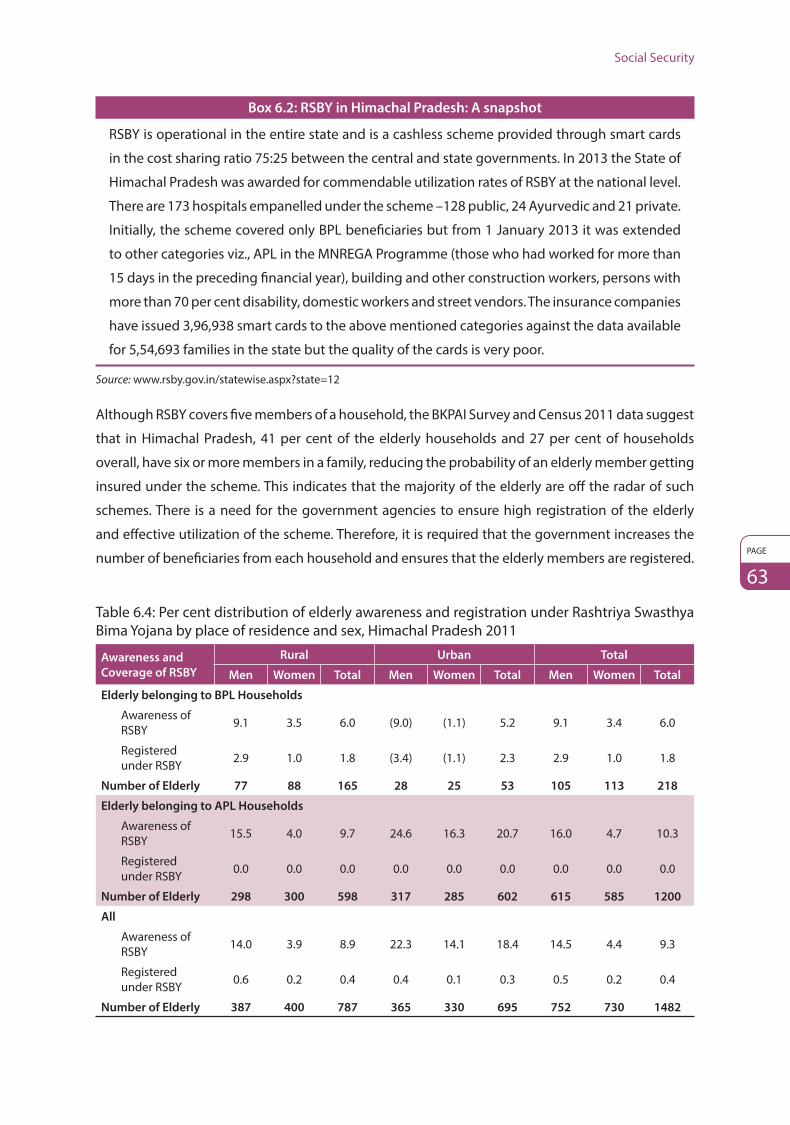
Social Security
PAGE
63
Box 6.2: RSBY in Himachal Pradesh: A snapshot
RSBY is operational in the entire state and is a cashless scheme provided through smart cards
in the cost sharing ratio 75:25 between the central and state governments. In 2013 the State of
Himachal Pradesh was awarded for commendable utilization rates of RSBY at the national level.
There are 173 hospitals empanelled under the scheme –128 public, 24 Ayurvedic and 21 private.
Initially, the scheme covered only BPL beneficiaries but from 1 January 2013 it was extended
to other categories viz., APL in the MNREGA Programme (those who had worked for more than
15 days in the preceding financial year), building and other construction workers, persons with
more than 70 per cent disability, domestic workers and street vendors. The insurance companies
have issued 3,96,938 smart cards to the above mentioned categories against the data available
for 5,54,693 families in the state but the quality of the cards is very poor.
Source: www.rsby.gov.in/statewise.aspx?state=12
Although RSBY covers five members of a household, the BKPAI Survey and Census 2011 data suggest
that in Himachal Pradesh, 41 per cent of the elderly households and 27 per cent of households
overall, have six or more members in a family, reducing the probability of an elderly member getting
insured under the scheme. This indicates that the majority of the elderly are off the radar of such
schemes. There is a need for the government agencies to ensure high registration of the elderly
and effective utilization of the scheme. Therefore, it is required that the government increases the
number of beneficiaries from each household and ensures that the elderly members are registered.
Table 6.4: Per cent distribution of elderly awareness and registration under Rashtriya Swasthya Bima Yojana by place of residence and sex, Himachal Pradesh 2011
Awareness and
Coverage of RSBY
Rural Urban Total
Men Women Total Men Women Total Men Women Total
Elderly belonging to BPL Households
Awareness of RSBY 9.1 3.5 6.0 (9.0) (1.1) 5.2 9.1 3.4 6.0
Registered under RSBY 2.9 1.0 1.8 (3.4) (1.1) 2.3 2.9 1.0 1.8
Number of Elderly 77 88 165 28 25 53 105 113 218
Elderly belonging to APL Households
Awareness of RSBY 15.5 4.0 9.7 24.6 16.3 20.7 16.0 4.7 10.3
Registered under RSBY 0.0 0.0 0.0 0.0 0.0 0.0 0.0 0.0 0.0
Number of Elderly 298 300 598 317 285 602 615 585 1200
All
Awareness of RSBY 14.0 3.9 8.9 22.3 14.1 18.4 14.5 4.4 9.3
Registered under RSBY 0.6 0.2 0.4 0.4 0.1 0.3 0.5 0.2 0.4
Number of Elderly 387 400 787 365 330 695 752 730 1482

BKPAI: Himachal Pradesh
PAGE
64
The RSBY will cover all contractual employees as well as other part-time employees, street vendors
and persons working in the unorganized sector in coming years. A premium of Rs. 398 per annum
with a health risk coverage of Rs. 30,000 and Rs. 1.75 lakh for critical care have been proposed by the
Department of Health and Family Welfare, Himachal Pradesh.12
6.5 Emerging Issues of Social Security Schemes for the Elderly
i. Pension Amount
The elderly have complained about receiving low amounts of pension. Therefore, either the budget
provision for the pension amounts should increase or the eligible age for receiving the pension
should be raised from 60 years to 65 years to reduce the extra burden of paying pension to the
people in the age group of 60-65 years. This is because the majority of the elderly in this cohort
are physically fit and can participate in the labour force (BKPAI Survey data, 2011, Employment &
Unemployment Survey, 2011-12 ).
ii. Health Care
The climatic condition of Himachal Pradesh makes it difficult for the elderly to receive medical
care on an immediate basis. This calls for the establishment of dispensaries by the state
government every few kilometres to increase access to the health care facility by the elderly.
This will reduce over-the-counter medication by the elderly which in turn will reduce morbidity.
The NPHCE programme is unsuccessful in the state because the existing staff members are
overworked, trained staff is not available, infrastructural facilities are lacking, etc. Hence it is
necessary to recruit more skilled manpower and also provide basic infrastructure to run this
programme successfully.
The RSBY is performing well in the state but the quality of smart cards issued by the concerned
agency is very poor. In addition, the address of the smart card holders is often not given
properly on the card with the result that the cards are not accepted by the operating system
(computer),creating problems for both the beneficiaries and the health officials. Thus there is a
need to improve the quality of smart cards for the proper functioning of this scheme.
iii. Residential and Day Care Services
It has been observed during the combined meetings of the Social Justice and Empowerment
Department, Government of Himachal Pradesh and the central government that several new
proposals under the Integrated Programme for Older Persons (IPOP) were suggested for the State of
12 http://www.rsby.gov.in/statewise.aspx?state=12

Social Security
PAGE
65
13 http://socialjustice.nic.in/annualreports.php
Himachal Pradesh.13 For example, a day care centre for the elderly in Solan and a Volunteers Bureau
for older persons in Shimla were proposed in 2012. However, both the proposals were rejected
due to incomplete administrative and registration formalities. Similarly, six such grant proposals
were declined by the central government in 2013 in the districts of Shimla, Solan and Mandi. The
state government’s intervention is required in the formulation of such proposals so that the Centre
approves the grants in future.
iv. Effective utilization of social security schemes
A discrepancy was observed between the funds allocated for elderly care and the actual
expenditure incurred under the schemes (Table 6.3). The government should address the issue
and should carefully target the elderly population so that they receive the maximum benefits
from the social welfare schemes. It has been noticed that although BPL households are aware
about the social security schemes, the proportion of households actually registered is very low,
and negligible in a few cases. The government should try to assess the reason for such a scenario
and should target the inclusion of these households in the welfare schemes.
A major problem was observed with the EBT scheme. Initially, the pension was sent through
money order and the postman handed over the pension to the beneficiaries at their doorstep.
However, under EBT the pension is transferred to the accounts of the beneficiaries and they
have to rely on someone else to withdraw their pension from the bank. This situation may have
arisen as a result of not following the EBT guidelines correctly. Hence, the state government
needs to address EBT issues urgently.
v. Administrative hurdles
Administrative procedures are so lengthy and complicated that it is difficult for an illiterate
elderly to fulfil all the paper work formalities and the majority (58%) of the elderly in Himachal
Pradesh are illiterate (BKPAI Survey, 2011).
All the BPL elderly are entitled to receive pension monthly from the government through proper
channels. However, the elderly often receive their pensions once in three months.
Only a single instalment of Rupees 2 crore was received out of a sanctioned grant of Rupees 5
crore for the Geriatric Centre of Excellence, which has been completely spent. A request for the
next installment has been made, but it has not been released by the central government.
Although the Himachal Road Transport Corporation (HRTC) has deployed taxis for the elderly
in Shimla, the taxis are very poorly operated. The police has been authorized to challan these
taxis if they violate any rules. It has been observed that the private partners have to pay a
lump sum of Rs. 52,000 to HRTC, so they have no option but to carry ordinary passengers and
tourists instead of the elderly.

BKPAI: Himachal Pradesh
PAGE
66
Box 6.3: Non-governmental initiatives
HelpAge India has been continually providing various facilities for the elderly in Himachal
Pradesh: a helpline number facility in Shimla; School Action for Value Education (SAVE) activities,
Mobile Elder Care Units (MECU) in Solan; short stay homes for the elderly and organizing mobile
camps in Solan and Sirmaur. However, such initiatives have not received much attention from
the state or central government (HelpAge India, September 2012). Similar efforts should be
introduced by the state government to address the growing needs of the elderly because it is
not clear to what extent an autonomous organization is able to meet the needs of the rapidly
increasing elderly population in the state.
There is no specific (co-ordinating) department dealing with the problems of the elderly in the
state. In addition, the funds are distributed by the government to different departments and
to various non-government organizations (NGOs) working in the state. This results in a lack of
coordination among the different departments of the state government and causes bottlenecks
in the actual utilization of elderly related schemes. Also, data pertaining to the different aspects
of the elderly are with different departments and as a result many data related gaps exit.
6.6 Summary of Findings and Policy Directions
Since most of the elderly prefer to live with their children, it is important to encourage the idea of a
joint family system. Adult children should be encouraged to reside with their elderly parents. Media
(print, audio and visual) should highlight the inter-generational bonding in families and mutual
benefits from each other.
Day care centres should be promoted in the state and should be set up near the localities dominated
by the elderly keeping in mind the demand and supply logic. This will ensure that elderly are taken
care of and have a cordial social life. This will also reduce the extent of elderly abuse and will provide
physical security to them.
It has been noticed that although BPL elderly are aware of the social security schemes, the proportion
of older persons actually registered is very low, and negligible in some cases. The government
should try to assess the reason for such a scenario and should target the inclusion of these persons
in the welfare schemes.
Social security programmes are mostly implemented in partnership with the central and state
governments. For the state government, the major security cover is provided through the Old Age
Pension Scheme, Pension for Divorcee/Deserted/Ekal Nari and Disability Relief Allowance Scheme.
A robust social security cover would entail dynamic thinking, regular planning and take into account
the social, cultural and economic realities of the target groups. This can be done by leveraging

Social Security
PAGE
67
technology for better delivery mechanism and cost reduction, factoring in a strong gender orientation,
addressing the issues of adequacy and delays, regular monitoring and evaluation, expansion of security
benefits, diversification of disadvantages, etc. In view of the growing population of elderly and
increasing life expectancy, the constraints of the State, emerging from fiscal capacity and prudence,
institutional competence, political commitment, legal framework, need to be examined in detail for
evolving effective social security coverage.
PAGE
68
7. Way ForwardThis report describes the status of the elderly in Himachal Pradesh by analysing five key dimensions
of their life encompassing (i) livelihood and employment, (ii) income and assets, (iii) living
arrangements and family relationships, (iv) health status, health seeking behaviour and health care
payments, and (v) provision of social security schemes. Barring the last –social security schemes –
many of these issues were examined using the data obtained from the BKPAI Survey as described at
the beginning of the report. The section on state-specific welfare schemes for the elderly drew inputs
from several state reports, one-on-one discussions with officials of the concerned departments,
state based NGOs and other knowledgeable persons. All this has provided some important areas for
consideration by the state welfare officials in terms of the way ahead to further improve the quality
of the elderly population in the state in the coming years.
7.1 Improving the Economic and Social Welfare of Senior Citizens
As seen from the discussion in Section 3 on work, income and asset ownership among the elderly
in Himachal Pradesh, it is evident that economic compulsions driven by poverty are the major
reasons for elderly persons continuing to work even at older ages. Although the results indicate
that a majority of the elderly earn some income, it is clear that such earnings fall short of their
economic needs. For females, and particularly for the widows and those belonging to no or low asset
households, income earned from all sources including pensions is mostly inadequate. Therefore,
improving the economic lives of the elderly and extending the benefits of social protection through
well-designed safety nets lie at the core of social welfare programmes for the elderly.
Due to factors like economic compulsions characterized by low asset bases of households and
overall poverty, a significant proportion of the elderly from the poorer socio-economic groups
continue to work in less remunerative, informal occupations. Hence a well-targeted social security
scheme – primarily through old-age pensions – or engaging physically able elderly workers with
appropriately rewarding jobs such as under the MGNREGA or in alternative vocations through the
NLM (National Literacy Mission) is essential and may be one of the possible ways to move ahead.
Appropriate measures need to be considered for late-life economic returns for the elderly by
linking them with suitable economic activity such as through Self-Help Groups (SHGs), while
simultaneously addressing their special needs, such as health and disability through integrated
programmes. As a priority measure, the elderly from BPL families or those without any familial
support should be accorded highest importance and catered to through available resources and

Way Forward
PAGE
69
state schemes. Full coverage of all eligible persons on the BPL list must be immediately ensured.
Wide publicity of criteria to become eligible for BPL households must be given by various means
including local newspapers and FM channels to enhance awareness and ensure increased coverage.
Simultaneously, a strict monitoring mechanism needs to be laid down to ensure timely payment.
As a number of vulnerable people remain uncovered at present, schemes that deal with socially
vulnerable groups like the aged should be extended beyond the BPL list to cover all families except
those that are excluded as per the criteria adopted by the Expert Group Report on BPL Identification
Methodology during the 11th Five Year Plan. The central government should make funds available
for this purpose. All IT initiatives should also be made available as a means to redress grievances.
Recent efforts made by the IT Department, Government of Himachal Pradesh, in electronic/mobile
governance are laudable.
7.2 Creation of Supportive Environment and Improvement in Provisions for Physical Security
Supporting the persistence of strong social norms which accord special status to the elderly in
Himachal Pradesh, the survey further emphasizes the important role played by the elderly in both
familial and social matters. These range from grandparenting to helping in inculcating traditional
values among the younger boys and girls, resolving various family disputes and conflicts. These
roles played by the elderly and their contributions need to be effectively communicated to the
younger generation and society at large through short stories, various media portals, local drama
clubs, religious gatherings, and video games where the elderly may be shown as arbitrators in a
brawl or dispute, etc. Social media may play a role here by displaying sentiments against elderly
abuse and age linked discrimination.
7.2.1 Improving the Health Status of Elderly
As seen in Section 2, the BKPAI Survey findings indicate that nearly 8 per cent of the outstanding
loans were taken by the elderly households to finance elderly medical care. This implies that one
tenth of the outstanding loans were required to meet the health expenditure of the elderly, showing
the vulnerable health conditions of elderly persons in the state.
The elderly in Himachal Pradesh are seen to have the worst health conditions, both in terms of acute
illnesses or chronic health conditions as well as functional limitations. Especially when compared
to their peers in Punjab and Tamil Nadu, the elderly in Himachal Pradesh appear to be performing
much worse. To illustrate, functional limitations, involving both basic and more comprehensive
instrumental activities of daily living, have been observed to be increasing with age, specially in
rural areas. This calls for special attention to be given to the health system to gear up to respond
to this largely unmet need and the growing demand for geriatric services. Subjective well-being of
the elderly in Himachal Pradesh is not as poor as in West Bengal and Odisha, however one third of
BKPAI: Himachal Pradesh
PAGE
70
the state suffer from various psychosocial or other health complications. Therefore, there is need
to examine this issue with more in-depth studies to bring about greater understanding about
the underlying factors behind the deficits in subjective health assessments of older people or its
correlates so that interventions can be broad-based by involving curative as well as preventive or
health promotional aspects. This report clearly reveals an urgent need to integrate geriatric health
services into the primary health care system in the country with adequate physical infrastructure
(such as creation of age friendly healthcare facilities in hospitals, nursing homes and other places, viz.
ramps, sheds, etc.) and create, through proper training and medical education, a health workforce in
the specific areas of elderly care.
Regarding mental health services, as noted earlier, the need of the hour is to undertake
comprehensive studies on the psychosocial aspects of mental health as well as explore possible
policy interventions integrated with the primary health care system – such as geriatric counsellors –
to address health issues among the elderly.
7.2.2 Measures for Improvement in RSBY
The response to RSBY in Himachal Pradesh is encouraging and the state has been recognized for
its high utilization rates (see Box 6.2). However, the data obtained from the BKPAI Survey does not
support this argument, particularly in the case of the elderly population. It is therefore suggested
that a suitable mechanism be evolved to make the scheme more effective. There are a few inbuilt
mechanisms in RSBY with room for improvement. These are:
The inclusion of intermediaries such as NGOs in assisting BPL households. The intermediaries
will be paid for the services they render in reaching out to the beneficiaries.
RSBY envisages a robust monitoring and evaluation system. An elaborate backend data
management system is proposed.
The basic design of the scheme may be modified to include the elderly members of the
household as insured members under the scheme.
7.2.3 Districts with Faster Ageing Need to Concentrate on Geriatric Planning
Himachal Pradesh has some districts and regions with a very high share of elderly population. These
districts include Hamirpur (13.8%), Una (11.5%), Bilaspur (11.9%), Kangra (11.7%), Mandi (10.6) and
Lahaul & Spiti (10.5%) (Census 2011). The state government may consider identifying these fast
greying districts for more focused and elaborate planning for elderly care.

Way Forward
PAGE
71
7.3 Elderly Targeted Public and Private Services
With accelerating growth of 60+ cohorts across the country in general and Himachal Pradesh in
particular, elderly targeted services – health, income security, measures against physical and other
forms of abuse etc. – require serious attention by political parties. With the emerging realization
that the elderly constitute a large vote bank (15% of the total voters) [Census 2011], there may be
a growing assertion from pro-elderly NGOs and organizations seeking favour for older adults from
future governments. Similarly, in the coming years, the elderly may act as an economic power to
boost demand for various businesses including manufacturers, service providers, bankers, insurers
and retailers. Businesses therefore need to plan for age-friendly services to tap the potential of this
important and growing market segment. In the future, the elderly may be many times better off
economically than their current counterparts with considerably more purchasing power.


Appendices
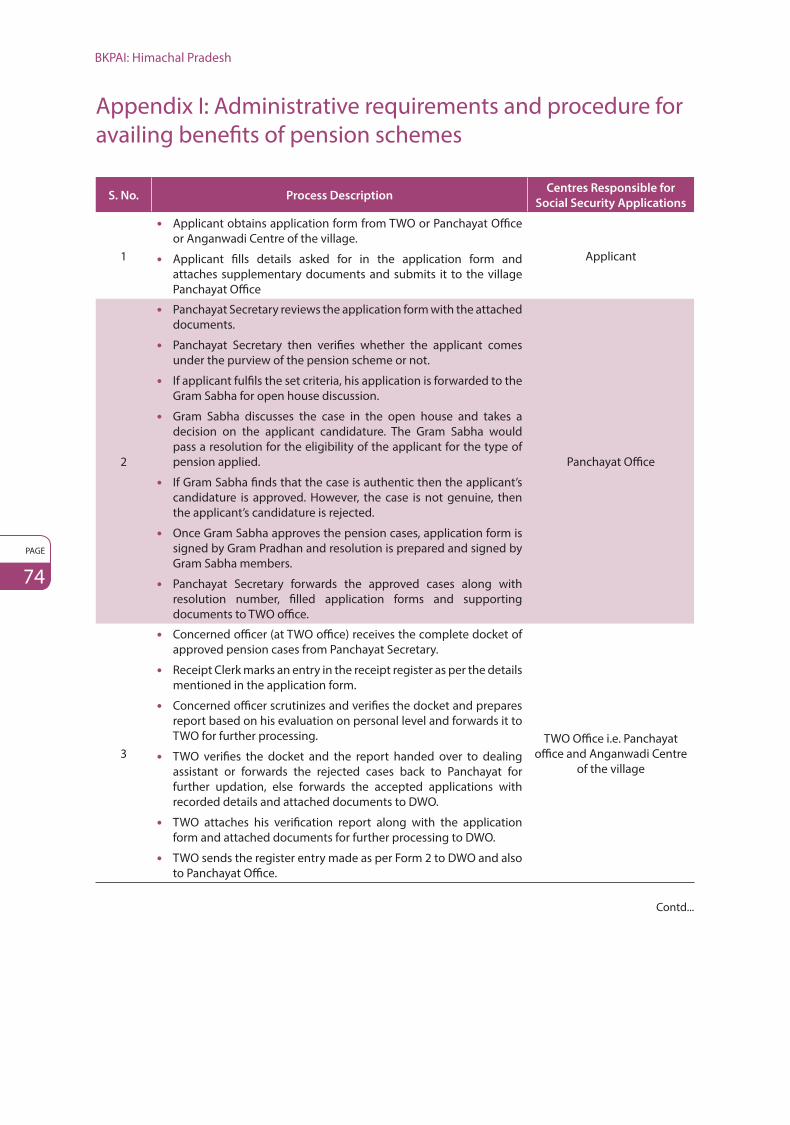
BKPAI: Himachal Pradesh
PAGE
74
Appendix I: Administrative requirements and procedure for availing benefits of pension schemes
S. No. Process DescriptionCentres Responsible for
Social Security Applications
1
Applicant obtains application form from TWO or Panchayat Office or Anganwadi Centre of the village.
Applicant fills details asked for in the application form and attaches supplementary documents and submits it to the village Panchayat Office
Applicant
2
Panchayat Secretary reviews the application form with the attached documents.
Panchayat Secretary then verifies whether the applicant comes under the purview of the pension scheme or not.
If applicant fulfils the set criteria, his application is forwarded to the Gram Sabha for open house discussion.
Gram Sabha discusses the case in the open house and takes a decision on the applicant candidature. The Gram Sabha would pass a resolution for the eligibility of the applicant for the type of pension applied.
If Gram Sabha finds that the case is authentic then the applicant’s candidature is approved. However, the case is not genuine, then the applicant’s candidature is rejected.
Once Gram Sabha approves the pension cases, application form is signed by Gram Pradhan and resolution is prepared and signed by Gram Sabha members.
Panchayat Secretary forwards the approved cases along with resolution number, filled application forms and supporting documents to TWO office.
Panchayat Office
3
Concerned officer (at TWO office) receives the complete docket of approved pension cases from Panchayat Secretary.
Receipt Clerk marks an entry in the receipt register as per the details mentioned in the application form.
Concerned officer scrutinizes and verifies the docket and prepares report based on his evaluation on personal level and forwards it to TWO for further processing.
TWO verifies the docket and the report handed over to dealing assistant or forwards the rejected cases back to Panchayat for further updation, else forwards the accepted applications with recorded details and attached documents to DWO.
TWO attaches his verification report along with the application form and attached documents for further processing to DWO.
TWO sends the register entry made as per Form 2 to DWO and also to Panchayat Office.
TWO Office i.e. Panchayat office and Anganwadi Centre
of the village
Contd...

Appendices
PAGE
75
S. No. Process DescriptionCentres Responsible for
Social Security Applications
4
The dealing assistant at DWO receives the pension cases along with verification report and entry register as per Form 2
The dealing assistant reviews the application form along with the attached documents and verification report from TWO for the type of pension applied.
• If the application is not satisfactory it is sent back to TWO for updation with comments.
• If the details mentioned in the application form are satisfactory then required entries are made in the e-Kalyan Software as per the details mentioned in the application form.
Superintendent/Supervisor reviews the application form along with the attached documents and verification report from TWO for the type of pension applied for and matches the details with the e-Kalyan Software application.
• If the application is not satisfactory it is sent back to DEO/Dealing Assistant for updation with comments.
• If the details mentioned in the application form and the e-Kalyan Software are satisfactory then application is sent for final approval from the DWO.
DWO personally reviews and verifies the list of pension applications. Final approval is given by DWO based on attached documents and verification report as submitted by TWO, DWO and also approves the application in the software.
DWO Office
5DC checks the list of pension fund cases under various categories and reviews the fund availability after which gives approval for fund availability for different categories of pension schemes.
DC
6They have to monitor the pension disbursement as the government guidelines wherein they have to keep an eye on the funds allocated under different categories of Pension Schemes.
DWO, TWO
7 Pension is transferred either to the applicant’s account or is sent by money order through the local post office as per the application form. Bank/Post Office
8
Applicant receives the amount in their bank account or by Money Order on quarterly basis.
Once the fund is received and the receipt is submitted at the DWO, DWO makes the entries in the PLA account in order to keep the track of payment.
DWO would communicate to the TWO the receipt of the pension fund by the applicant as per the format, this is done to keep a track of the pension payments.
Applicant
DWO
DWO
9 All the payment records would be maintained at the office of DWO DWO
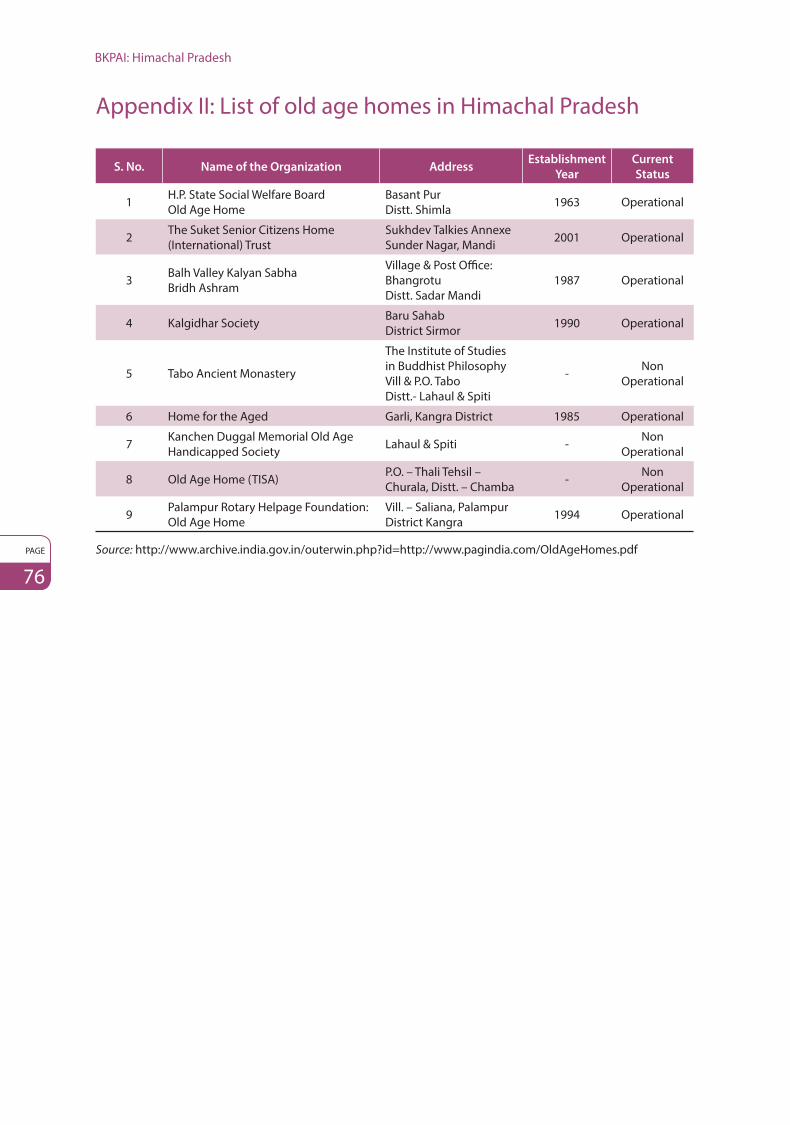
BKPAI: Himachal Pradesh
PAGE
76
Appendix II: List of old age homes in Himachal Pradesh
S. No. Name of the Organization AddressEstablishment
Year
Current
Status
1 H.P. State Social Welfare Board Old Age Home
Basant Pur Distt. Shimla 1963 Operational
2 The Suket Senior Citizens Home (International) Trust
Sukhdev Talkies Annexe Sunder Nagar, Mandi 2001 Operational
3 Balh Valley Kalyan Sabha Bridh Ashram
Village & Post Office: Bhangrotu Distt. Sadar Mandi
1987 Operational
4 Kalgidhar Society Baru Sahab District Sirmor 1990 Operational
5 Tabo Ancient Monastery
The Institute of Studies in Buddhist Philosophy Vill & P.O. Tabo Distt.- Lahaul & Spiti
- Non Operational
6 Home for the Aged Garli, Kangra District 1985 Operational
7 Kanchen Duggal Memorial Old Age Handicapped Society Lahaul & Spiti - Non
Operational
8 Old Age Home (TISA) P.O. – Thali Tehsil – Churala, Distt. – Chamba - Non
Operational
9 Palampur Rotary Helpage Foundation: Old Age Home
Vill. – Saliana, Palampur District Kangra 1994 Operational
Source: http://www.archive.india.gov.in/outerwin.php?id=http://www.pagindia.com/OldAgeHomes.pdf
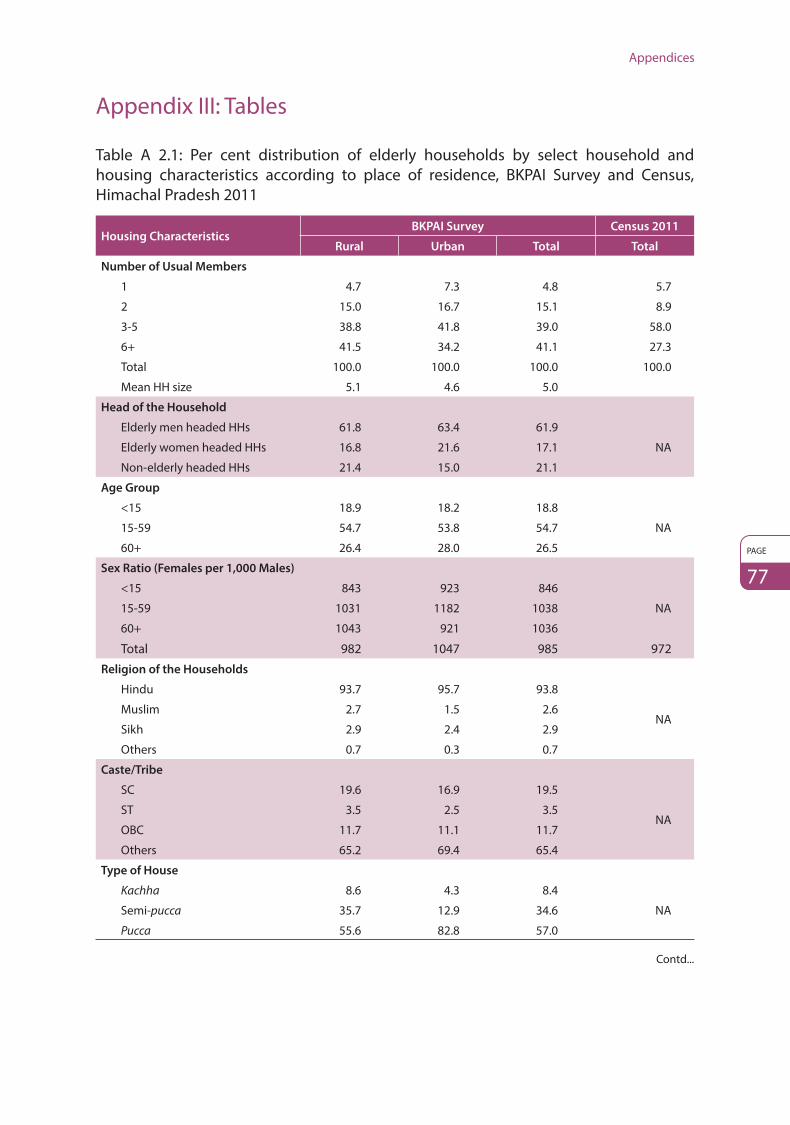
Appendices
PAGE
77
Contd...
Appendix III: Tables
Table A 2.1: Per cent distribution of elderly households by select household and housing characteristics according to place of residence, BKPAI Survey and Census, Himachal Pradesh 2011
Housing CharacteristicsBKPAI Survey Census 2011
Rural Urban Total Total
Number of Usual Members
1 4.7 7.3 4.8 5.7
2 15.0 16.7 15.1 8.9
3-5 38.8 41.8 39.0 58.0
6+ 41.5 34.2 41.1 27.3
Total 100.0 100.0 100.0 100.0
Mean HH size 5.1 4.6 5.0
Head of the Household
Elderly men headed HHs 61.8 63.4 61.9
NAElderly women headed HHs 16.8 21.6 17.1
Non-elderly headed HHs 21.4 15.0 21.1
Age Group
<15 18.9 18.2 18.8
NA15-59 54.7 53.8 54.7
60+ 26.4 28.0 26.5
Sex Ratio (Females per 1,000 Males)
<15 843 923 846
NA15-59 1031 1182 1038
60+ 1043 921 1036
Total 982 1047 985 972
Religion of the Households
Hindu 93.7 95.7 93.8
NAMuslim 2.7 1.5 2.6
Sikh 2.9 2.4 2.9
Others 0.7 0.3 0.7
Caste/Tribe
SC 19.6 16.9 19.5
NAST 3.5 2.5 3.5
OBC 11.7 11.1 11.7
Others 65.2 69.4 65.4
Type of House
Kachha 8.6 4.3 8.4
NASemi-pucca 35.7 12.9 34.6
Pucca 55.6 82.8 57.0

BKPAI: Himachal Pradesh
PAGE
78
Housing CharacteristicsBKPAI Survey Census 2011
Rural Urban Total Total
No. of Rooms
1 4.4 3.4 4.3 19.5
2 13.8 7.7 13.5 28.7
3 22.9 25.4 23.0 17.2
4+ 58.9 63.5 59.2 33.4
Source of Drinking Water
Own piped water 31.6 37.0 31.989.5
Public piped water 52.1 57.0 52.4
Own well/borewell 5.0 2.7 4.86.3
Public well/borewell 4.3 0.9 4.1
Others 7.1 2.4 6.9 4.2
Toilet Facility
Public latrine 0.8 0.8 0.8 1.2
Septic tank/Flush system 73.3 86.0 73.9 60.7
Pit latrine 5.0 6.0 5.0 8.1
No facility/Uses open 21.0 7.3 20.3 29.7
Cooking Fuel
Electricity 0.1 0.1 0.1 0.1
LPG/Natural gas 25.2 82.9 28.1 38.6
Biogas 0.5 1.3 0.6 0.1
Kerosene 0.5 1.7 0.6 2.1
Coal/Lignite 0.6 0.0 0.50.0
Charcoal 2.7 0.6 2.6
Wood 67.2 11.5 64.4 57.5
Straw/Shrubs/Grass 2.2 1.5 2.21.1
Agricultural crop waste 0.1 0.1 0.1
Dung cakes 0.0 0.0 0.0 0.2
Others 0.9 0.3 0.8 0.0
Total 100.0 100.0 100.0 100.0
No. of Elderly HH 608 567 1175 14,76,541
NA: Data not available
Table A 2.2: Percentage of elderly households with various possessions, loan and support system according to place of residence, BKPAI survey and census, Himachal Pradesh 2011
Household PossessionsBKPAI Census 2011
Rural Urban Total Total
Households Goods
Electricity 98.0 99.9 98.1 98.1
Mattress 96.6 98.6 96.7
NAPressure cooker 93.8 97.7 94.0
Chair 89.5 97.7 89.9
Contd...

Appendices
PAGE
79
Household PossessionsBKPAI Census 2011
Rural Urban Total Total
Cot or bed 98.5 99.7 98.6
NATable 78.0 92.4 78.7
Electric fan 75.9 88.7 76.6
Radio or Transistor 22.0 23.4 22.0 25.7
Black and white television 10.0 10.2 10.074.4
Colour television 69.8 87.6 70.7
Sewing machine 55.4 67.6 56.0 NA
Mobile phone 76.6 89.8 77.3 61.5
Any landline phone 25.9 44.8 26.9 7.4
Computer 2.8 19.2 3.6 5.6
Internet facility 2.2 16.1 2.9 2.8
Refrigerator 27.6 49.9 28.7
NA
Watch or wall/Alarm clock 65.6 79.7 66.3
Water pump 3.7 7.9 4.0
Thresher 1.9 0.3 1.9
Tractor 2.3 0.7 2.2
Bicycle 29.0 38.5 29.5 9.5
Motorcycle or Scooter 23.2 40.0 24.0 15.5
Animal-drawn cart 2.6 4.6 2.7 NA
Car/Jeep 7.6 16.8 8.1 8.3
Account in bank/Post office 88.3 89.9 88.4 89.1
The Possessing of Cards
APL 75.0 84.0 75.5
NA
BPL 19.4 9.3 18.9
Antyodaya 2.5 2.3 2.5
Not in possession of any card 2.4 4.5 2.5
Don’t know/No response 0.7 0.0 0.7
Own Any Agriculture Land
No land 20.1 69.3 22.6
NA
Only irrigated land 31.2 13.0 30.2
Only non-irrigated land 41.0 15.7 39.8
Both 7.7 2.0 7.4
Don’t Know/No response NA NA NA
Monthly Per Capita Consumption Expenditure (MPCE in Rs.)
≤1000 22.3 6.4 21.5
NA
1001-1500 25.3 17.5 24.9
1501-2500 30.5 31.1 30.5
2501+ 21.8 44.9 22.9
Don’t Know/No response NA NA NA
Wealth Quintile
Lowest 6.0 1.2 5.8
NA
Second 22.8 7.1 22.0
Middle 31.4 14.5 30.5
Fourth 28.1 30.0 28.2
Highest 11.7 47.3 13.5
Contd...
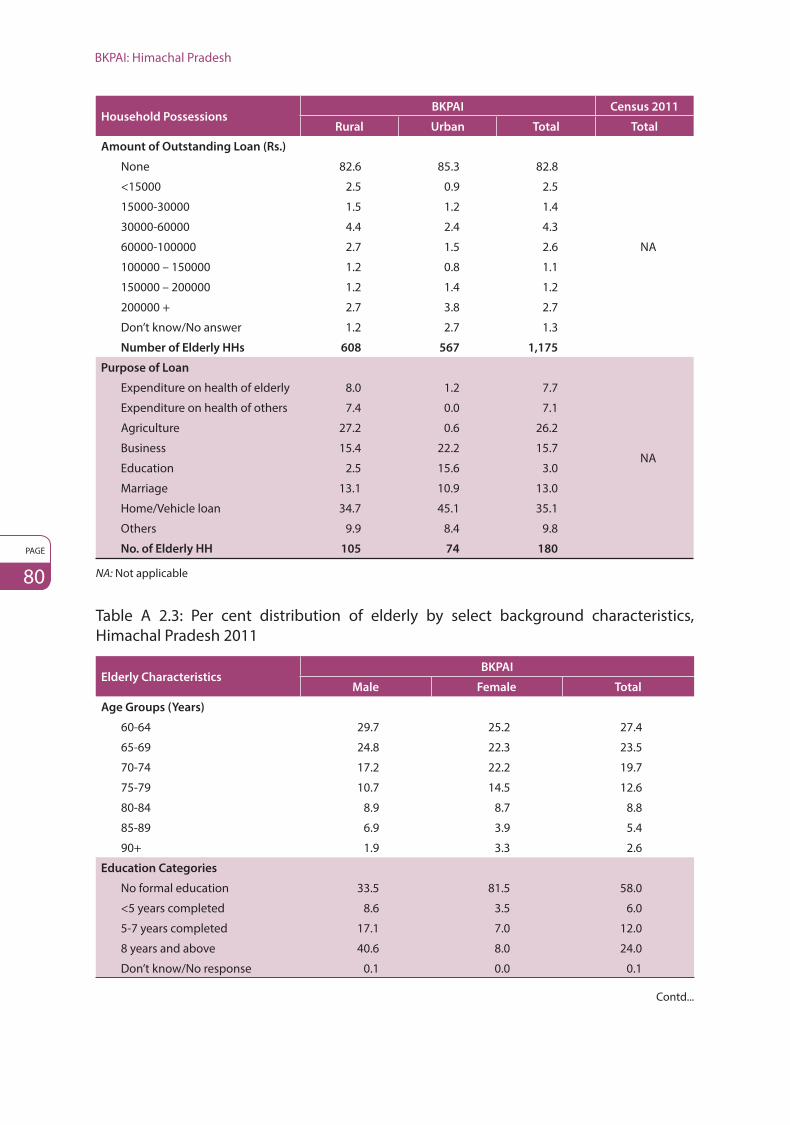
BKPAI: Himachal Pradesh
PAGE
80
Household PossessionsBKPAI Census 2011
Rural Urban Total Total
Amount of Outstanding Loan (Rs.)
None 82.6 85.3 82.8
NA
<15000 2.5 0.9 2.5
15000-30000 1.5 1.2 1.4
30000-60000 4.4 2.4 4.3
60000-100000 2.7 1.5 2.6
100000 – 150000 1.2 0.8 1.1
150000 – 200000 1.2 1.4 1.2
200000 + 2.7 3.8 2.7
Don’t know/No answer 1.2 2.7 1.3
Number of Elderly HHs 608 567 1,175
Purpose of Loan
Expenditure on health of elderly 8.0 1.2 7.7
NA
Expenditure on health of others 7.4 0.0 7.1
Agriculture 27.2 0.6 26.2
Business 15.4 22.2 15.7
Education 2.5 15.6 3.0
Marriage 13.1 10.9 13.0
Home/Vehicle loan 34.7 45.1 35.1
Others 9.9 8.4 9.8
No. of Elderly HH 105 74 180
NA: Not applicable
Table A 2.3: Per cent distribution of elderly by select background characteristics, Himachal Pradesh 2011
Elderly Characteristics BKPAI
Male Female Total
Age Groups (Years)
60-64 29.7 25.2 27.4
65-69 24.8 22.3 23.5
70-74 17.2 22.2 19.7
75-79 10.7 14.5 12.6
80-84 8.9 8.7 8.8
85-89 6.9 3.9 5.4
90+ 1.9 3.3 2.6
Education Categories
No formal education 33.5 81.5 58.0
<5 years completed 8.6 3.5 6.0
5-7 years completed 17.1 7.0 12.0
8 years and above 40.6 8.0 24.0
Don’t know/No response 0.1 0.0 0.1
Contd...

Appendices
PAGE
81
Elderly Characteristics BKPAI
Male Female Total
Marital Status
Never married 1.1 0.3 NA
Currently married 85.8 47.2 66.2
Widowed 11.8 50.9 31.7
Others 1.3 1.6 2.1
Don’t Know/No response NA NA NA
Mean no. of children 4.0 4.2 4.1
Re-marriage among Ever Married
Rural 4.1 2.6 3.4
Urban 2.5 0.8 1.7
Total 4.0 2.6 3.3
Migration Status
Migrated before 60 years of age 20.4 90.1 55.9
Migrated after 60 years of age 5.7 2.7 4.2
Did not migrate 73.8 4.4 38.5
Don’t know/No response 0.1 2.8 1.5
No. of Elderly 752 730 1,482
Table A 3.1: Percentage of elderly currently working or ever worked according to place of residence and sex, Himachal Pradesh 2011
Work StatusRural Urban Total
Men Women Total Men Women Total Men Women Total
Currently working 38.2 3.5 20.5 32.3 2.7 18.1 37.9 3.4 20.4
Ever worked 99.4 7.8 52.7 98.6 19.2 60.5 99.4 8.4 53.1
Number of elderly 387 400 787 365 330 695 752 730 1,482
Table A 3.2: Percentage of elderly according to their work status and intensity of work by background characteristics, Himachal Pradesh 2011
Background
Characteristics
Currently
Working
Number of
Elderly
Main Worker
(More Than
6 Months Per Year)
More Than
Four Hours
a Day
Number of
Currently
Working Elderly
Age Groups (Years) 60-69 27.1 844 94.0 95.4 20670-79 14.1 441 89.4 96.5 6080+ 12.0 197 * * 17
Sex
Men 37.9 752 91.4 97.5 258Women 3.4 730 (92.0) (80.6) 25
Residence
Rural 20.5 787 91.2 96.0 157Urban 18.1 695 96.2 96.8 126
Marital Status
Currently married 25.4 962 90.2 97.2 229Widowed 8.7 481 (96.6) (87.8) 45Others (37.9) 39 * * 9
Contd...

BKPAI: Himachal Pradesh
PAGE
82
Background
Characteristics
Currently
Working
Number of
Elderly
Main Worker
(More Than
6 Months Per Year)
More Than
Four Hours
a Day
Number of
Currently
Working Elderly
Education Categories
None 11.2 667 89.1 97.6 72
1-4 years 39.7 68 * * 23
5-7 years 33.2 176 (96.7) (99.8) 46
8+ years 31.4 569 93.6 91.5 142
Religion
Hindu 20.5 1404 90.8 95.8 271
Muslim (23.7) 26 * * 8
Sikh (17.4) 42 * * 4
Others * 10 * * 0
Caste/Tribe
SC/ST 20.9 315 91.6 99.1 61
OBC 21.0 138 (94.6) (100.0) 33
Others 20.1 1029 90.8 94.2 189
Wealth Quintile
Lowest 25.8 70 * * 19
Second 24.4 206 94.7 96.9 50
Middle 20.3 313 93.5 96.4 68
Fourth 17.0 438 91.6 99.7 70
Highest 18.9 455 75.5 84.8 76
Living Arrangement
Living alone 26.0 76 * * 22
Living with spouse 25.9 227 89.5 95.4 54
Living with all others 18.8 1,179 91.5 97.1 207
Total 20.4 1,482 91.4 96.0 283
Note: () Based on 25-49 unweighted cases.*Percentage not shown; based on fewer than 25 unweighted cases.
Table A 3.3: Per cent distribution of currently working elderly by type of occupation and sector of employment according to place of residence and sex, Himachal Pradesh 2011
Employment StatusRural Urban Total
Men Women Total Men Women Total Men Women Total
Type of Occupation
Technicians/Professionals 1.2 * 1.1 7.0 * 6.6 1.5 (0.0) 1.4
Office/Clerical 5.9 * 5.4 13.8 * 13.6 6.3 (0.4) 5.8
Cultivators 42.3 * 42.7 11.6 * 10.7 40.9 (45.2) 41.3
Petty traders/Workers 0.0 * 0.0 0.1 * 0.1 0.0 (0.0) 0.0
Agricultural labourer 22.5 * 22.0 7.5 * 7.0 21.8 (16.3) 21.3
Other work 28.1 * 28.8 58.4 * 60.5 29.5 (38.1) 30.2Don’t Know/No response 0.0 * 0.0 1.7 * 1.6 0.1 (0.0) 0.1
Contd...

Appendices
PAGE
83
Employment StatusRural Urban Total
Men Women Total Men Women Total Men Women Total
Sector of Employment
Public sector 4.9 * 4.4 7.6 * 7.9 5.0 (0.5) 4.6
Private organization 1.4 * 1.3 11.9 * 11.4 1.9 (0.2) 1.8
Self-employed 64.4 * 64.1 62.0 * 63.1 64.3 (60.8) 64.0
Informal employment 29.0 * 27.8 13.3 * 12.4 28.3 (14.5) 27.1
Others 0.3 * 2.4 5.2 * 5.2 0.5 (24.0) 2.5
Number of Elderly
Currently Working144 13 157 114 12 126 258 25 283
Note: () Based on 25-49 unweighted cases.*Percentage not shown; based on fewer than 25 unweighted cases.
Table A 3.4: Per cent distribution of currently working elderly by the need to work according to background characteristics, Himachal Pradesh 2011
Background
CharacteristicsBy Choice
Economic/
Other CompulsionTotal Number of Elderly
Age Group (Years)
60-69 39.2 60.8 100.0 206
70-79 42.4 57.6 100.0 60
80+ * * * 17
Sex
Men 40.6 59.5 100.0 258
Women (46.0) (54.0) (100.0) 25
Residence
Rural 41.0 59.0 100.0 157
Urban 41.5 58.5 100.0 126
Marital Status
Currently married 42.7 57.3 100.0 229
Widowed (38.0) (62.0) (100.0) 45
Others * * * 9
Education Categories
None 26.9 73.1 100.0 72
1-4 years * * * 23
5-7 years (41.7) (58.3) (100.0) 46
8+ years 51.4 48.6 100.0 142
Religion
Hindu 42.0 58.0 100.0 229
Muslim (26.4) (73.6) (100.0) 45
Sikh * * * 9
Caste/Tribe
SC/ST 30.9 69.1 100.0 61
OBC (57.9) (42.1) (100.0) 33
Others 41.6 58.5 100.0 189
Contd...

BKPAI: Himachal Pradesh
PAGE
84
Background
CharacteristicsBy Choice
Economic/
Other CompulsionTotal Number of Elderly
Wealth Quintile
Lowest * * * 19
Second 27.9 72.1 100.0 50
Middle 35.4 64.6 100.0 68
Fourth 59.9 40.2 100.0 70
Highest 61.6 38.4 100.0 76
Living Arrangement
Living alone * * * 22
Living with spouse 51.3 48.7 100.0 54
Living with all others 39.1 60.9 100.0 207
Total 41.0 59.0 100.0 283
Note: () Based on 25-49 unweighted cases.*Percentage not shown; based on fewer than 25 unweighted cases.
Table A 3.5: Percentage of elderly receiving work benefits by background characteristics, Himachal Pradesh 2011
Background
CharacteristicsRetirement Pension
Retirement and
Pension BothNone
Number of
Elderly
Age Group (Years)
60-69 24.5 24.7 23.7 74.5 844
70-79 13.5 13.7 13.5 86.3 441
80+ 6.7 6.7 6.7 93.3 197
Sex
Men 34.4 34.4 33.6 64.8 752
Women 2.1 2.4 2.1 97.6 730
Residence
Rural 17.0 17.2 16.6 82.3 787
Urban 34.6 34.7 34.3 65.0 695
Marital Status
Currently married 23.8 24.1 23.2 75.3 962
Widowed 5.5 5.5 5.5 94.5 481
Others (20.2) (20.2) (20.2) (79.8) 39
Education Categories
None 3.2 3.1 3.1 96.8 667
1-4 years 19.3 19.3 19.3 80.7 68
5-7 years 19.5 19.5 19.5 80.5 176
8+ years 52.4 53.5 51.0 45.1 569
Religion
Hindu 18.9 19.2 18.6 80.4 1404
Muslim (0.7) (0.7) (0.7) (99.3) 26
Sikh 4.5 4.5 4.5 95.5 42
Others * * * * 10
Contd...
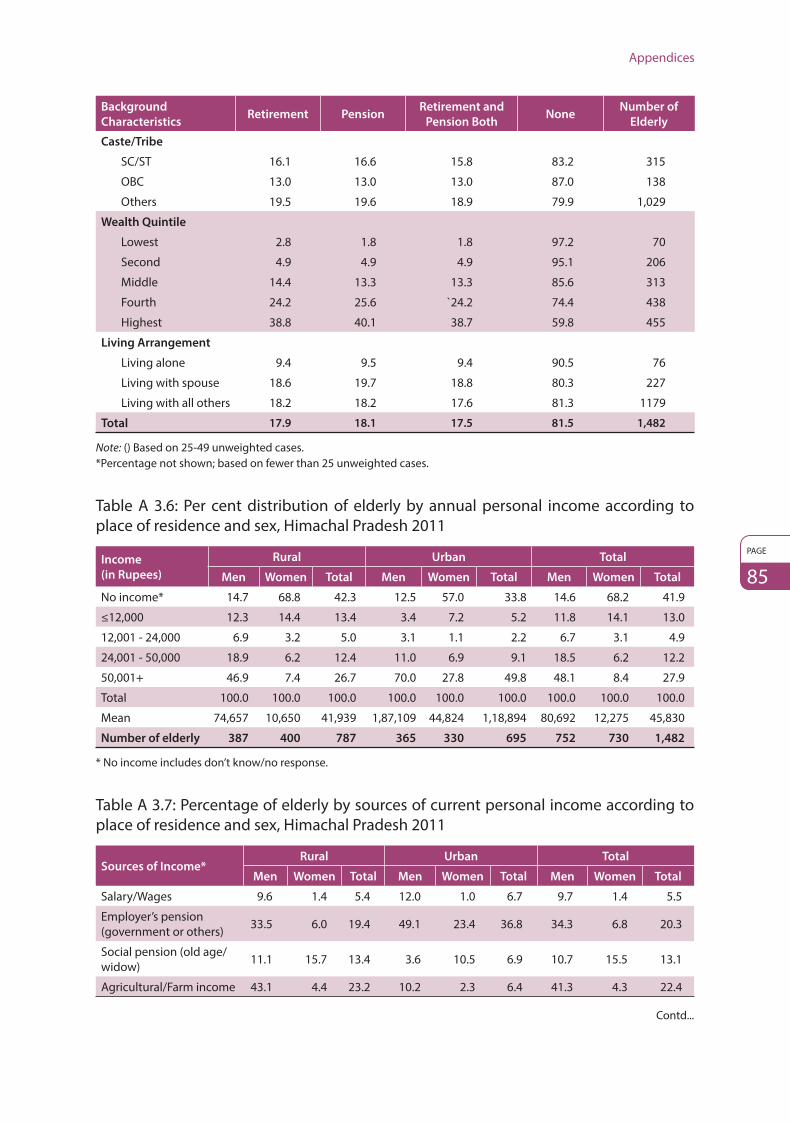
Appendices
PAGE
85
Background
CharacteristicsRetirement Pension
Retirement and
Pension BothNone
Number of
Elderly
Caste/Tribe
SC/ST 16.1 16.6 15.8 83.2 315
OBC 13.0 13.0 13.0 87.0 138
Others 19.5 19.6 18.9 79.9 1,029
Wealth Quintile
Lowest 2.8 1.8 1.8 97.2 70
Second 4.9 4.9 4.9 95.1 206
Middle 14.4 13.3 13.3 85.6 313
Fourth 24.2 25.6 `24.2 74.4 438
Highest 38.8 40.1 38.7 59.8 455
Living Arrangement
Living alone 9.4 9.5 9.4 90.5 76
Living with spouse 18.6 19.7 18.8 80.3 227
Living with all others 18.2 18.2 17.6 81.3 1179
Total 17.9 18.1 17.5 81.5 1,482
Note: () Based on 25-49 unweighted cases.*Percentage not shown; based on fewer than 25 unweighted cases.
Table A 3.6: Per cent distribution of elderly by annual personal income according to place of residence and sex, Himachal Pradesh 2011
Income
(in Rupees)
Rural Urban Total
Men Women Total Men Women Total Men Women Total
No income* 14.7 68.8 42.3 12.5 57.0 33.8 14.6 68.2 41.9
≤12,000 12.3 14.4 13.4 3.4 7.2 5.2 11.8 14.1 13.0
12,001 - 24,000 6.9 3.2 5.0 3.1 1.1 2.2 6.7 3.1 4.9
24,001 - 50,000 18.9 6.2 12.4 11.0 6.9 9.1 18.5 6.2 12.2
50,001+ 46.9 7.4 26.7 70.0 27.8 49.8 48.1 8.4 27.9
Total 100.0 100.0 100.0 100.0 100.0 100.0 100.0 100.0 100.0
Mean 74,657 10,650 41,939 1,87,109 44,824 1,18,894 80,692 12,275 45,830
Number of elderly 387 400 787 365 330 695 752 730 1,482
* No income includes don’t know/no response.
Table A 3.7: Percentage of elderly by sources of current personal income according to place of residence and sex, Himachal Pradesh 2011
Sources of Income*Rural Urban Total
Men Women Total Men Women Total Men Women Total
Salary/Wages 9.6 1.4 5.4 12.0 1.0 6.7 9.7 1.4 5.5
Employer’s pension (government or others) 33.5 6.0 19.4 49.1 23.4 36.8 34.3 6.8 20.3
Social pension (old age/widow) 11.1 15.7 13.4 3.6 10.5 6.9 10.7 15.5 13.1
Agricultural/Farm income 43.1 4.4 23.2 10.2 2.3 6.4 41.3 4.3 22.4
Contd...

BKPAI: Himachal Pradesh
PAGE
86
Sources of Income*Rural Urban Total
Men Women Total Men Women Total Men Women Total
Other sources of income 8.8 8.5 8.7 33.7 15.7 25.1 10.2 8.9 9.5
No income 14.7 69.1 42.6 12.5 56.4 33.5 14.6 68.2 42.1
Number of elderly 375 392 767 356 320 676 731 712 1,443
* Multiple sources of income.
Table A 3.8: Per cent distribution of elderly by their perceived magnitude of contribution towards household expenditure according to place of residence and sex, Himachal Pradesh 2011
Proportion of
Contribution
Rural Urban Total
Men Women Total Men Women Total Men Women Total
No income/No contribution 14.7 68.8 42.3 12.5 57.0 33.8 14.6 68.2 41.9
<40% 3.2 4.8 4.0 6.8 3.8 5.4 3.4 4.8 4.1
40-60% 18.8 4.9 11.7 23.7 14.0 19.1 19.1 5.3 12.1
60-80% 26.4 7.6 16.8 17.7 7.7 12.9 25.9 7.6 16.6
80+ 32.4 7.8 19.8 37.5 12.7 25.6 32.6 8.1 20.1
Don’t know/No response 4.5 6.1 5.3 1.8 4.7 3.2 4.4 6.0 5.2
Total 100.0 100.0 100.0 100.0 100.0 100.0 100.0 100.0 100.0
Number of Elderly 387 400 787 365 330 695 752 730 1,482
Table A 3.9: Per cent distribution of elderly by their financial dependency status and main source of economic support according to place of residence and sex, Himachal Pradesh 2011
Financial
Dependence and
Economic Support
Rural Urban Total
Men Women Total Men Women Total Men Women Total
Financial Dependence
Fully dependent 18.0 69.5 44.3 14.3 59.0 35.7 17.8 69.0 43.9
Partially dependent 28.7 15.7 22.1 16.2 8.7 12.6 28.1 15.4 21.6
Not dependent 53.2 14.7 33.6 69.6 32.3 51.7 54.1 15.6 34.5
Don’t know/No response NA NA NA NA NA NA NA NA NA
Total 100.0 100.0 100.0 100.0 100.0 100.0 100.0 100.0 100.0
Source of Economic Support
Son 30.8 42.7 36.9 20.1 32.3 25.9 30.2 42.2 36.3
Spouse 6.3 37.2 22.1 5.1 28.6 16.4 6.3 36.8 21.8
Daughter 2.5 0.6 1.5 1.4 2.3 1.8 2.4 0.7 1.5
Others 7.2 4.8 6.0 3.9 4.6 4.2 7.0 4.8 5.9
Not dependent on anyone 53.2 14.7 33.6 69.6 32.3 51.7 54.1 15.6 34.5
Total 100.0 100.0 100.0 100.0 100.0 100.0 100.0 100.0 100.0
Number of Elderly 387 400 787 365 330 695 752 730 1,482
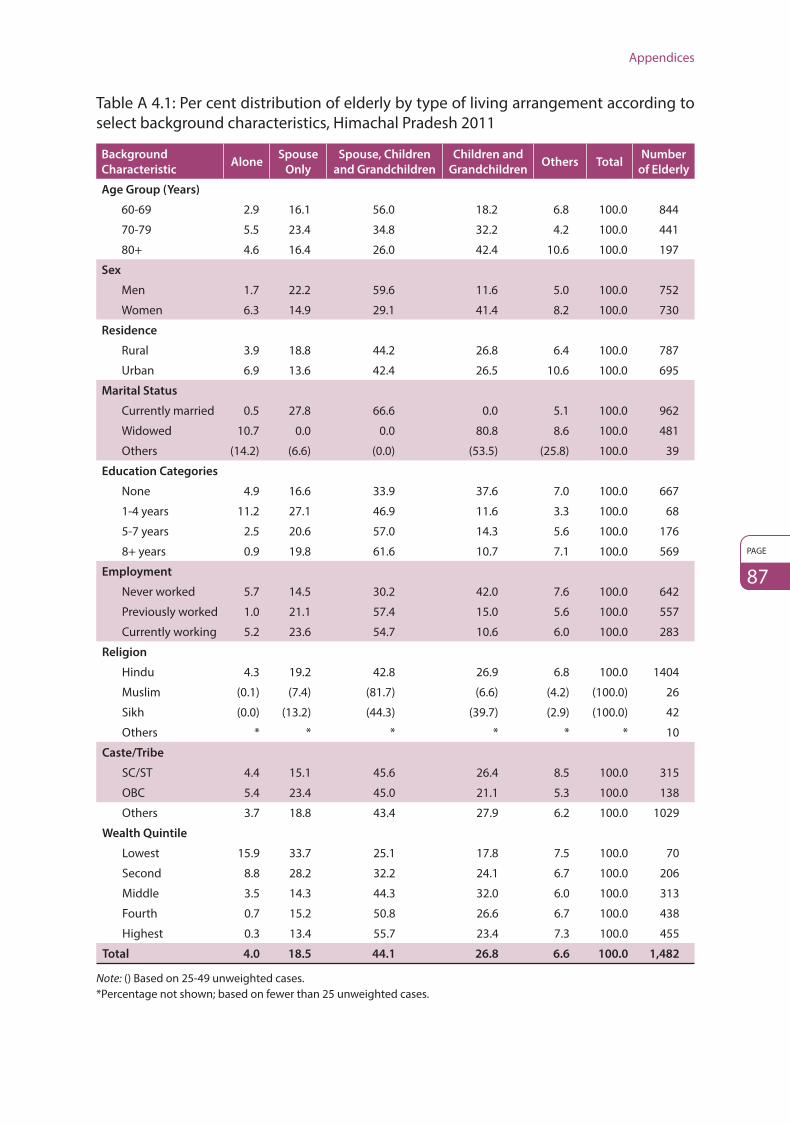
Appendices
PAGE
87
Table A 4.1: Per cent distribution of elderly by type of living arrangement according to select background characteristics, Himachal Pradesh 2011
Background
CharacteristicAlone
Spouse
Only
Spouse, Children
and Grandchildren
Children and
GrandchildrenOthers Total
Number
of Elderly
Age Group (Years)
60-69 2.9 16.1 56.0 18.2 6.8 100.0 844
70-79 5.5 23.4 34.8 32.2 4.2 100.0 441
80+ 4.6 16.4 26.0 42.4 10.6 100.0 197
Sex
Men 1.7 22.2 59.6 11.6 5.0 100.0 752
Women 6.3 14.9 29.1 41.4 8.2 100.0 730
Residence
Rural 3.9 18.8 44.2 26.8 6.4 100.0 787
Urban 6.9 13.6 42.4 26.5 10.6 100.0 695
Marital Status
Currently married 0.5 27.8 66.6 0.0 5.1 100.0 962
Widowed 10.7 0.0 0.0 80.8 8.6 100.0 481
Others (14.2) (6.6) (0.0) (53.5) (25.8) 100.0 39
Education Categories
None 4.9 16.6 33.9 37.6 7.0 100.0 667
1-4 years 11.2 27.1 46.9 11.6 3.3 100.0 68
5-7 years 2.5 20.6 57.0 14.3 5.6 100.0 176
8+ years 0.9 19.8 61.6 10.7 7.1 100.0 569
Employment
Never worked 5.7 14.5 30.2 42.0 7.6 100.0 642
Previously worked 1.0 21.1 57.4 15.0 5.6 100.0 557
Currently working 5.2 23.6 54.7 10.6 6.0 100.0 283
Religion
Hindu 4.3 19.2 42.8 26.9 6.8 100.0 1404
Muslim (0.1) (7.4) (81.7) (6.6) (4.2) (100.0) 26
Sikh (0.0) (13.2) (44.3) (39.7) (2.9) (100.0) 42
Others * * * * * * 10
Caste/Tribe
SC/ST 4.4 15.1 45.6 26.4 8.5 100.0 315
OBC 5.4 23.4 45.0 21.1 5.3 100.0 138
Others 3.7 18.8 43.4 27.9 6.2 100.0 1029
Wealth Quintile
Lowest 15.9 33.7 25.1 17.8 7.5 100.0 70
Second 8.8 28.2 32.2 24.1 6.7 100.0 206
Middle 3.5 14.3 44.3 32.0 6.0 100.0 313
Fourth 0.7 15.2 50.8 26.6 6.7 100.0 438
Highest 0.3 13.4 55.7 23.4 7.3 100.0 455
Total 4.0 18.5 44.1 26.8 6.6 100.0 1,482
Note: () Based on 25-49 unweighted cases.*Percentage not shown; based on fewer than 25 unweighted cases.
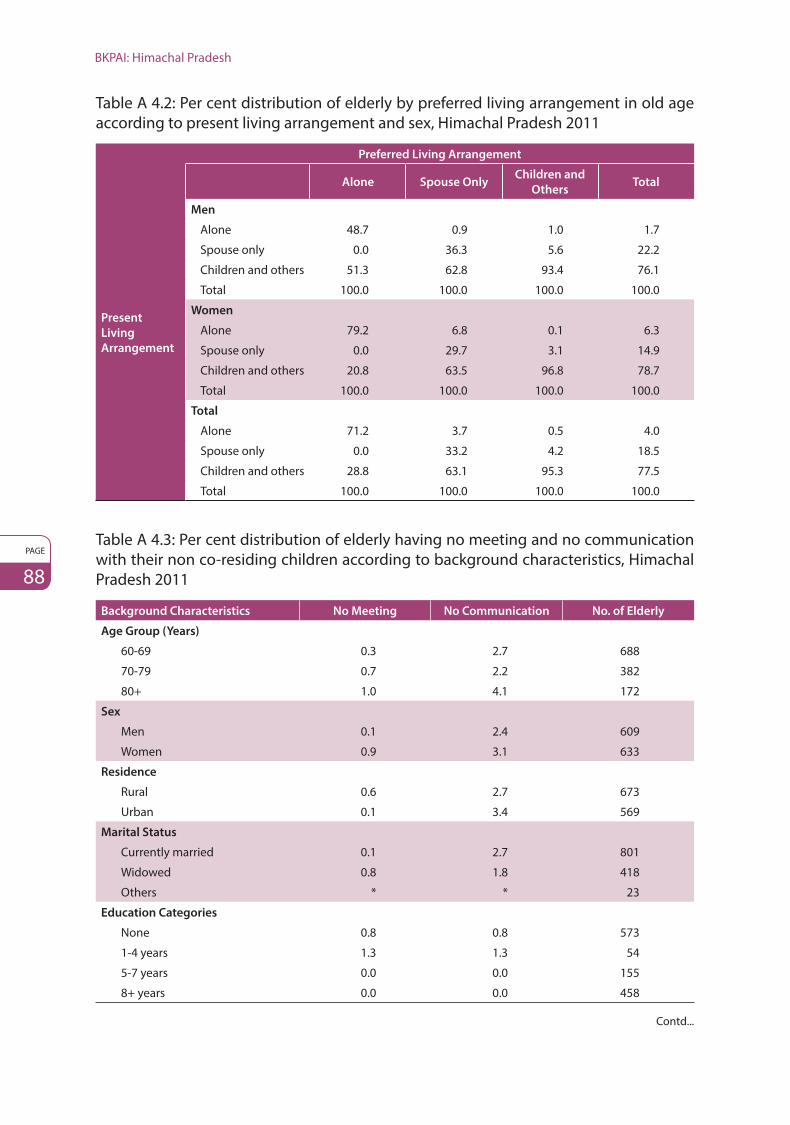
BKPAI: Himachal Pradesh
PAGE
88
Table A 4.2: Per cent distribution of elderly by preferred living arrangement in old age according to present living arrangement and sex, Himachal Pradesh 2011
Preferred Living Arrangement
Present
Living
Arrangement
Alone Spouse OnlyChildren and
OthersTotal
Men
Alone 48.7 0.9 1.0 1.7
Spouse only 0.0 36.3 5.6 22.2
Children and others 51.3 62.8 93.4 76.1
Total 100.0 100.0 100.0 100.0
Women
Alone 79.2 6.8 0.1 6.3
Spouse only 0.0 29.7 3.1 14.9
Children and others 20.8 63.5 96.8 78.7
Total 100.0 100.0 100.0 100.0
Total
Alone 71.2 3.7 0.5 4.0
Spouse only 0.0 33.2 4.2 18.5
Children and others 28.8 63.1 95.3 77.5
Total 100.0 100.0 100.0 100.0
Table A 4.3: Per cent distribution of elderly having no meeting and no communication with their non co-residing children according to background characteristics, Himachal Pradesh 2011
Background Characteristics No Meeting No Communication No. of Elderly
Age Group (Years)
60-69 0.3 2.7 688
70-79 0.7 2.2 382
80+ 1.0 4.1 172
Sex
Men 0.1 2.4 609
Women 0.9 3.1 633
Residence
Rural 0.6 2.7 673
Urban 0.1 3.4 569
Marital Status
Currently married 0.1 2.7 801
Widowed 0.8 1.8 418
Others * * 23
Education Categories
None 0.8 0.8 573
1-4 years 1.3 1.3 54
5-7 years 0.0 0.0 155
8+ years 0.0 0.0 458
Contd...

Appendices
PAGE
89
Background Characteristics No Meeting No Communication No. of Elderly
Religion
Hindu 0.6 0.6 1,175
Muslim (0.0) (0.0) 25
Sikh (0.0) (0.0) 35
Others * * 7
Caste/Tribe
SC/ST 1.3 1.3 259
OBC 0.0 0.0 118
Others 0.4 0.4 865
Wealth Quintile
Lowest 0.0 0.0 53
Second 0.3 0.3 169
Middle 0.7 0.7 270
Fourth 0.9 0.9 366
Highest 0.0 0.0 384
Total 0.5 2.8 1,242
Note: () Based on 25-49 unweighted cases.*Percentage not shown; based on fewer than 25 unweighted cases.
Table A 4.4: Percentage of elderly by participation in various activities according to age groups, Himachal Pradesh 2011
Participation in Various
Activities
Age Group (Years)Total
60-69 70-79 80+
Taking care of grandchildren 59.5 60.2 55.4 59.0
Cooking/Cleaning 50.7 47.5 26.2 45.5
Shopping for household 69.4 60.5 34.0 60.6
Payment of bills 57.5 38.9 30.0 46.9
Advice to children 83.6 69.0 71.7 76.9
Settling disputes 77.2 63.7 61.0 70.1
Table A 4.5: Per cent distribution of elderly by their main reason for not going out more, according to place of residence and sex, Himachal Pradesh 2011
Main Reason for Not
Going Out More
Rural Urban Total
Men Women Total Men Women Total Men Women Total
Health problems * * (55.9) * * * * * (55.9)
Safety concerns * * (7.0) * * * * * (7.4)
Financial problems * * (29.7) * * * * * (28.8)
Nobody to accompany * * (7.5) * * * * * (8.0)
Don’t know/No response
* * (NA) * * * * * (NA)
Total * * (100.0) * * * * * (100.0)
Number of Elderly 13 13 26 9 8 17 22 21 43
Note: () Based on 25-49 unweighted cases.*Percentage not shown; based on fewer than 25 unweighted cases.

BKPAI: Himachal Pradesh
PAGE
90
Table A 4.6: Per cent distribution of elderly by experience of abuse after turning 60 and in the month preceding the survey according to select background characteristics, Himachal Pradesh 2011
Background CharacteristicsExperience of Abuse
Number of ElderlyAbuse After Age 60 In Last One Month
Age Group (Years)
60-69 11.3 2.2 844
70-79 12.3 1.6 441
80+ 12.3 1.2 197
Sex
Men 12.3 1.5 752
Women 11.3 2.1 730
Residence
Rural 12.0 1.9 787
Urban 7.5 0.9 695
Marital Status
Currently married 12.0 1.3 962
Widowed 10.9 1.9 481
Others (19.4) (15.2) 39
Education Categories
None 11.4 2.0 667
1-4 years 11.7 2.1 68
5-7 years 18.2 2.7 176
8+ years 9.6 0.9 569
Employment
Never worked 9.7 1.9 642
Previously worked 13.1 1.8 557
Currently working 14.6 1.6 283
Religion
Hindu 11.6 1.7 1,404
Muslim (27.2) (6.6) 26
Sikh (3.4) (0.0) 42
Others * * 10
Caste/Tribe
SC/ST 13.7 1.6 315
OBC 9.3 0.0 138
Others 11.6 2.2 1,029
Wealth Quintile
Lowest 18.6 3.5 70
Second 19.6 3.0 206
Middle 10.0 2.5 313
Fourth 8.6 0.7 438
Highest 7.4 0.0 455
Contd...

Appendices
PAGE
91
Background CharacteristicsExperience of Abuse
Number of ElderlyAbuse After Age 60 In Last One Month
Living Arrangement
Alone 16.7 3.2 75
Spouse only 17.6 2.7 223
Spouse, children and grandchildren 10.5 1.1 649
Children and grandchildren 11.2 2.5 402
Others 3.9 0.2 133
Total 11.8 1.8 1,482
Note: () Based on 25-49 unweighted cases.*Percentage not shown; based on fewer than 25 unweighted cases.
Table A 5.1: Percentage of elderly by self rated health status according to place of residence and sex, Himachal Pradesh 2011
Self Rated HealthRural Urban Total
Men Women Total Men Women Total Men Women Total
Current Health
Excellent 4.3 2.1 3.2 8.3 2.8 5.7 4.5 2.1 3.3
Very good 26.1 20.7 23.3 32.9 25.1 29.2 26.5 20.9 23.6
Good 26.9 26.3 26.6 27.4 35.1 31.1 26.9 26.7 26.8
Fair 28.2 34.6 31.5 23.3 28.3 25.7 27.9 34.3 31.2
Poor 14.6 16.3 15.5 8.1 8.7 8.4 14.2 15.9 15.1
Don’t Know/No response NA NA NA NA NA NA NA NA NA
Total 100.0 100.0 100.0 100.0 100.0 100.0 100.0 100.0 100.0
Current Health Compared to One Year Before
Better 8.1 4.6 6.4 11.1 7.2 9.2 8.3 4.8 6.5
Same 71.8 70.1 70.9 70.5 68.3 69.4 71.8 70.0 70.9
Worse 19.8 23.3 21.6 17.9 23.6 20.6 19.7 23.3 21.5
Don’t Know/No response 0.3 2.0 1.2 0.5 0.9 0.7 0.3 2.0 1.1
Total 100.0 100.0 100.0 100.0 100.0 100.0 100.0 100.0 100.0
Current Health Compared to People of Same Age
Better 20.6 11.3 15.8 22.7 15.4 19.2 20.7 11.5 16.0
Same 61.3 63.0 62.2 64.1 64.6 64.3 61.4 63.1 62.3
Worse 15.9 23.5 19.8 12.6 18.9 15.6 15.7 23.3 19.5
Don’t know/No response 2.3 2.2 2.3 0.6 1.1 0.8 2.2 2.2 2.2
Total 100.0 100.0 100.0 100.0 100.0 100.0 100.0 100.0 100.0
Number of Elderly 387 400 787 365 330 695 752 730 1,482
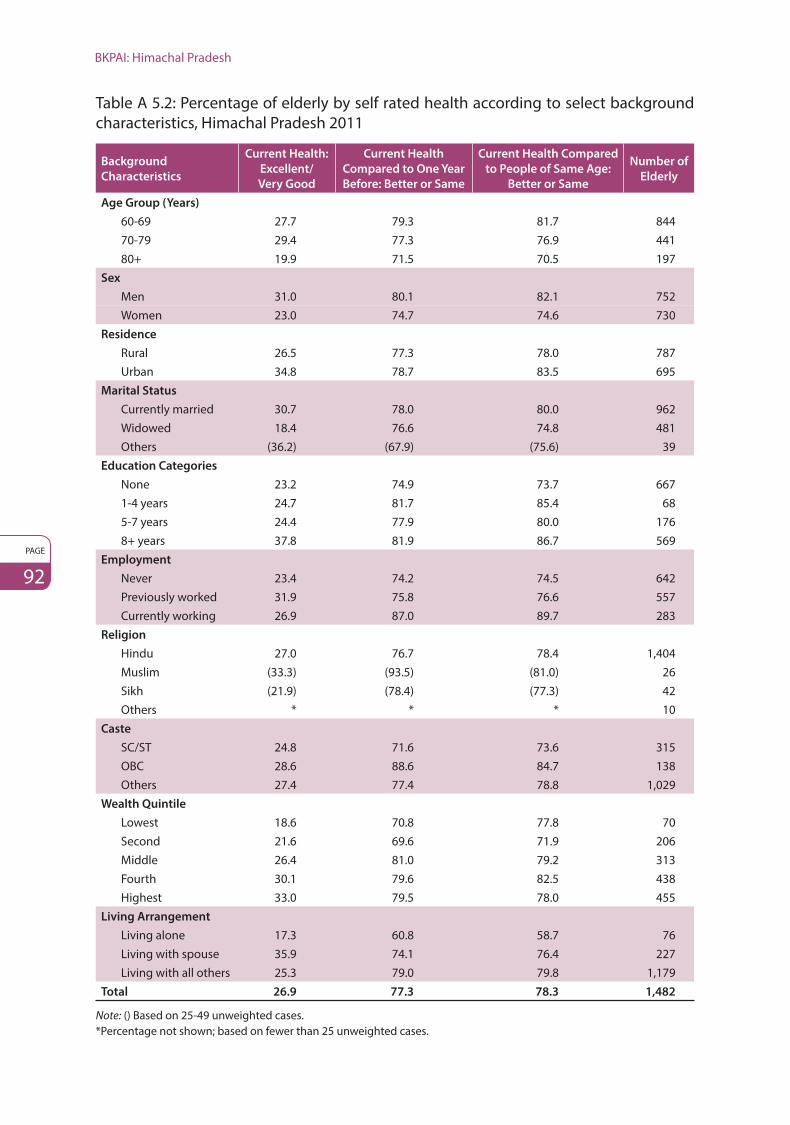
BKPAI: Himachal Pradesh
PAGE
92
Table A 5.2: Percentage of elderly by self rated health according to select background characteristics, Himachal Pradesh 2011
Background
Characteristics
Current Health:
Excellent/
Very Good
Current Health
Compared to One Year
Before: Better or Same
Current Health Compared
to People of Same Age:
Better or Same
Number of
Elderly
Age Group (Years)
60-69 27.7 79.3 81.7 84470-79 29.4 77.3 76.9 44180+ 19.9 71.5 70.5 197
Sex Men 31.0 80.1 82.1 752Women 23.0 74.7 74.6 730
Residence Rural 26.5 77.3 78.0 787Urban 34.8 78.7 83.5 695
Marital Status Currently married 30.7 78.0 80.0 962Widowed 18.4 76.6 74.8 481Others (36.2) (67.9) (75.6) 39
Education Categories None 23.2 74.9 73.7 6671-4 years 24.7 81.7 85.4 685-7 years 24.4 77.9 80.0 1768+ years 37.8 81.9 86.7 569
Employment Never 23.4 74.2 74.5 642Previously worked 31.9 75.8 76.6 557Currently working 26.9 87.0 89.7 283
Religion Hindu 27.0 76.7 78.4 1,404Muslim (33.3) (93.5) (81.0) 26Sikh (21.9) (78.4) (77.3) 42Others * * * 10
Caste SC/ST 24.8 71.6 73.6 315OBC 28.6 88.6 84.7 138Others 27.4 77.4 78.8 1,029
Wealth Quintile Lowest 18.6 70.8 77.8 70Second 21.6 69.6 71.9 206Middle 26.4 81.0 79.2 313Fourth 30.1 79.6 82.5 438Highest 33.0 79.5 78.0 455
Living Arrangement Living alone 17.3 60.8 58.7 76Living with spouse 35.9 74.1 76.4 227Living with all others 25.3 79.0 79.8 1,179
Total 26.9 77.3 78.3 1,482
Note: () Based on 25-49 unweighted cases.*Percentage not shown; based on fewer than 25 unweighted cases.

Appendices
PAGE
93
Table A 5.3: Percentage of elderly needing full/partial assistance in ADL activities according to place of residence and sex, Himachal Pradesh 2011
Type of ADLRural Urban Total
Men Women Total Men Women Total Men Women Total
Bathing 4.6 8.7 6.7 2.5 6.3 4.4 4.5 8.6 6.6
Dressing 3.9 6.3 5.1 1.9 4.3 3.1 3.8 6.2 5.0
Toilet 3.7 4.9 4.3 2.6 3.8 3.2 3.7 4.8 4.3
Mobility 3.1 5.4 4.3 3.9 2.2 3.1 3.1 5.2 4.2
Continence 1.6 4.1 2.9 1.1 1.3 1.2 1.6 3.9 2.8
Feeding 1.0 2.7 1.9 0.8 1.0 0.9 1.0 2.6 1.8
Needs at least one assistance
5.3 10.4 7.9 4.6 7.3 5.9 5.3 10.2 7.8
Needs full assistance 0.7 1.6 1.1 0.7 0.6 0.6 0.7 1.5 1.1
Number of Elderly 387 400 787 365 330 695 752 730 1,482
Table A 5.4: Percentage of elderly by IADL limitations according to place of residence and sex, Himachal Pradesh 2011
Type of IADL
Activity
Rural Urban Total
Men Women Total Men Women Total Men Women Total
Use of phone 13.4 29.4 21.6 5.9 15.6 10.5 13.0 28.7 21.0
Shopping 49.5 80.1 65.1 29.6 55.9 42.2 48.4 78.9 64.0
Preparation of meals 79.5 62.2 70.6 57.6 45.5 51.8 78.3 61.4 69.7
Housekeeping tasks 20.5 17.9 19.1 15.5 10.4 13.1 20.2 17.5 18.8
Laundry 70.9 37.8 54.0 69.0 28.4 49.5 70.8 37.4 53.8
Travel independently 22.4 36.3 29.5 12.7 26.0 19.1 21.8 35.8 29.0
Dispensing own medicines 43.5 66.3 55.1 21.1 40.9 30.6 42.3 65.1 53.9
Handling finances 15.0 33.9 24.6 8.8 25.3 16.7 14.7 33.5 24.2
Can perform none 2.4 6.2 4.4 1.4 4.3 2.8 2.3 6.1 4.3
1-3 20.9 29.0 25.0 9.7 15.2 12.4 20.3 28.4 24.4
4-5 34.2 30.1 32.1 24.1 23.8 24.0 33.7 29.8 31.7
6-7 35.6 26.4 30.9 47.3 30.4 39.2 36.2 26.6 31.3
Can perform all 6.9 8.2 7.6 17.5 26.3 21.7 7.5 9.1 8.3
Number of Elderly 387 400 787 365 330 695 752 730 1,482

BKPAI: Himachal Pradesh
PAGE
94
Table A 5.5: Percentage of elderly by ADL and IADL limitations according to background characteristics, Himachal Pradesh 2011
Background
Characteristics
ADL IADL
Number
of
Elderly
Needs
Assistance
in At
Least One
Activity
Needs
Assistance
in At Least
Three
Activities
Need
Assistance
in All
Activities
Can
Perform
No
Activity
Can
Perform
All
Activities
Can
Perform
1-3
Activities
Can
Perform
4-7
Activities
Age Group (Years)
60-69 3.1 1.5 0.5 2.4 12.0 13.4 72.3 844
70-79 8.3 5.2 0.4 4.6 5.3 27.7 62.5 441
80+ 21.1 12.9 4.2 9.5 2.9 51.4 36.1 197
Sex
Men 5.3 3.7 0.7 2.3 7.5 20.3 69.9 752
Women 10.2 5.5 1.5 6.1 9.1 28.4 56.5 730
Residence
Rural 7.9 4.7 1.1 4.4 7.6 25.0 63.0 787
Urban 5.9 2.6 0.6 2.8 21.7 12.4 63.2 695
Marital Status
Currently married 5.8 3.7 0.7 2.4 8.8 19.5 69.4 962
Widowed 11.8 6.4 2.1 7.3 6.8 34.4 51.5 481
Others (9.2) (9.2) (0.00) (18.8) (14.0) (28.0) (39.2) 39
Wealth Quintile
Lowest 7.0 1.8 1.0 0.8 2.6 35.4 61.2 70
Second 7.8 3.5 0.6 6.9 5.0 24.9 63.2 206
Middle 9.2 6.6 1.7 4.5 6.8 28.6 60.2 313
Fourth 6.6 3.6 0.8 3.4 7.8 21.8 67.0 438
Highest 7.7 5.7 1.5 2.8 19.9 15.9 61.3 455
Living Arrangement
Alone 4.4 4.4 0.0 0.0 25.6 6.5 68.0 76
Spouse only 2.1 1.9 0.0 0.5 7.3 14.7 77.5 227
Children and others 9.3 5.3 1.4 5.4 7.6 27.7 59.3 1,179
Total 7.8 4.6 1.1 4.3 8.3 24.4 63.0 1,482
Note: () Based on 25-49 unweighted cases.
Table A 5.6: Percentage of elderly by full/partial locomotor disability according to place of residence and sex, Himachal Pradesh 2011
Type of Loco-
motor Disability
Rural Urban Total
Men Women Total Men Women Total Men Women Total
Vision
Full 9.7 12.8 11.3 14.2 17.8 15.9 9.9 13.1 11.5
Partial 36.4 37.9 37.1 37.8 39.7 38.7 36.5 38.0 37.2
Hearing
Full 3.2 1.8 2.5 0.9 2.7 1.7 3.1 1.9 2.5
Partial 17.7 22.6 20.2 13.4 12.4 12.9 17.5 22.1 19.8
Contd...

Appendices
PAGE
95
Type of Loco-
motor Disability
Rural Urban Total
Men Women Total Men Women Total Men Women Total
Walking
Full 5.7 4.4 5.0 3.5 2.7 3.1 5.5 4.3 4.9
Partial 16.6 20.9 18.8 7.3 14.2 10.6 16.1 20.6 18.4
Chewing
Full 10.2 10.7 10.4 10.6 8.7 9.7 10.2 10.6 10.4
Partial 22.4 22.9 22.7 12.1 22.1 16.9 21.8 22.9 22.4
Speaking
Full 0.4 0.5 0.4 0.1 0.9 0.5 0.4 0.5 0.4
Partial 3.4 2.2 2.8 1.5 2.1 1.8 3.3 2.2 2.8
Memory
Full 0.8 0.8 0.8 0.0 0.4 0.2 0.8 0.7 0.8
Partial 17.8 23.1 20.5 13.8 16.8 15.2 17.6 22.8 20.3
Number of Elderly 387 400 787 365 330 695 752 730 1,482
Table A 5.7: Percentage of elderly by full/partial locomotor disability according to background characteristics, Himachal Pradesh 2011
Background
CharacteristicsVision Hearing Walking Chewing Speaking Memory
Number of
Elderly
Age Group (Years)
60-69 46.5 16.2 15.5 24.4 2.4 20.3 844
70-79 46.2 23.0 24.9 36.2 2.6 20.4 441
80+ 60.5 39.7 43.8 51.6 6.6 24.5 197
Sex
Men 46.4 20.6 21.6 32.0 3.7 18.4 752
Women 51.0 24.0 24.9 33.5 2.7 23.6 730
Residence
Rural 48.4 22.7 23.8 33.1 3.2 21.3 787
Urban 54.6 14.7 13.7 26.6 2.3 15.4 695
Marital Status
Currently married 46.0 20.1 19.7 30.8 3.1 19.8 962
Widowed 53.9 25.9 30.8 37.0 3.4 23.2 481
Others (58.0) (37.7) (22.3) (30.8) (4.0) (25.3) 39
Caste/Tribe
SC/ST 45.9 27.7 24.0 33.5 2.8 22.9 315
OBC 40.3 14.4 21.7 27.8 3.1 8.9 138
Others 51.3 21.9 23.3 33.4 3.4 22.5 1,029
Wealth Quintile
Lowest 52.8 30.4 27.9 53.5 2.6 33.5 70
Second 46.9 23.9 22.1 31.0 1.9 17.7 206
Middle 44.7 26.0 27.3 33.9 4.0 22.0 313
Fourth 52.6 17.8 22.6 33.6 3.1 23.6 438
Highest 50.9 18.3 16.1 23.4 3.9 14.2 455
Note: () Based on 25-49 unweighted cases.

BKPAI: Himachal Pradesh
PAGE
96
Table A 5.8: Percentage of elderly using disability aids according to sex and place of residence, Himachal Pradesh 2011
Form of AssistanceSex Residence
TotalNumber of
ElderlyMen Women Rural Urban
Spectacles/Lenses 30.1 27.0 27.7 42.9 28.5 795
Hearing aids 1.2 1.2 1.2 1.6 1.2 286
Walking sticks 11.8 10.8 11.6 6.1 11.3 298
Denture 6.5 7.8 7.0 10.3 7.2 470
Table A 5.9: Percentage of elderly classified based on General Health Questionnaire (GHQ-12) and 9 items Subjective Well-being Inventory (SUBI) according to place of residence and sex, Himachal Pradesh 2011
Mental Health StatusRural Urban Total
Men Women Total Men Women Total Men Women Total
GHQ-12 (Score 0-36)
Scores below the threshold level of ≤12 69.3 58.4 63.7 78.6 67.0 73.1 69.8 58.8 64.2
Mean score 11.5 13.5 12.5 10.2 11.9 11.0 11.5 13.4 12.4
Number of elderly 387 400 787 365 330 695 752 730 1,482
Subjective Well-being Inventory (SUBI-9 items) (Score 9-27)
Mean score 17.7 18.4 18.1 17.1 18.0 17.6 17.7 18.4 18.1
Number of elderly 387 400 787 365 330 695 752 730 1,482
Note: GHQ 12 varies from a score of 0-36 and lower the score the better is the mental health. The threshold score of 12 or below indicate good mental health status. For SUBI the score varies from 9 to 27 and lower the mean score indicate better the mental health status.
Table A 5.10: Percentage of elderly classified based on 9 items in SUBI according to age and sex, Himachal Pradesh 2011
SUBI-9 Items
(Well-Being/
Ill-Being)
Age Group (Years)
60-69 70-79 80 and Above
Men Women Total Men Women Total Men Women Total
At least one negative 27.8 32.5 30.1 38.0 42.4 40.6 49.9 51.7 50.8
All negative 1.4 2.5 1.9 1.3 2.9 2.3 2.1 6.6 4.3
All positive 3.8 2.3 3.0 2.0 1.1 1.5 2.2 0.1 1.2
Mean score 17.3 17.9 17.6 17.7 18.5 18.1 18.9 19.8 19.3
Number of elderly 443 401 844 208 233 441 101 96 197

Appendices
PAGE
97
Table A 5.11: Percentage of elderly by ability to immediate recall of words (out of ten words) according to place of residence and sex, Himachal Pradesh 2011
Number of
Words
Rural Urban Total
Men Women Total Men Women Total Men Women Total
None to 2 7.3 18.9 13.2 4.5 8.8 6.5 7.2 18.4 12.9
3 to 5 58.9 68.2 63.6 43.9 58.3 50.8 58.1 67.7 63.0
6 to 8 33.0 12.3 22.4 48.9 32.3 40.9 33.8 13.3 23.4
More than 8 0.8 0.6 0.7 2.7 0.7 1.7 0.9 0.6 0.8
Total 100.0 100.0 100.0 100.0 100.0 100.0 100.0 100.0 100.0
Mean number of immediately recalled words
4.8 3.8 4.3 5.5 4.8 5.2 4.9 3.9 4.4
Number of
Elderly387 400 787 365 330 695 752 730 1,482
Table A 5.12: Percentage of elderly by personal health habits or risky health behaviours according to place of residence and sex, Himachal Pradesh 2011
Type of SubstanceRural Urban Total
Men Women Total Men Women Total Men Women Total
Current Use
Smoking 41.7 3.8 22.4 16.6 3.1 10.1 40.4 3.8 21.7
Alcohol consumption 15.9 0.0 7.8 7.3 0.0 3.8 15.5 0.0 7.6
Chewing tobacco 3.4 0.3 1.8 2.0 1.1 1.5 3.3 0.3 1.8
Any of the three risk behaviours
48.4 4.1 25.8 22.2 3.6 13.3 47.0 4.1 25.1
Ever Use
Smoking 43.6 6.1 24.5 18.9 3.6 11.5 42.3 6.0 23.8
Alcohol consumption 20.2 0.0 9.9 9.2 0.0 4.8 19.6 0.0 9.6
Chewing tobacco 4.5 0.3 2.3 2.0 1.1 1.5 4.3 0.3 2.3
Number of Elderly 387 400 787 365 330 695 752 730 1,482
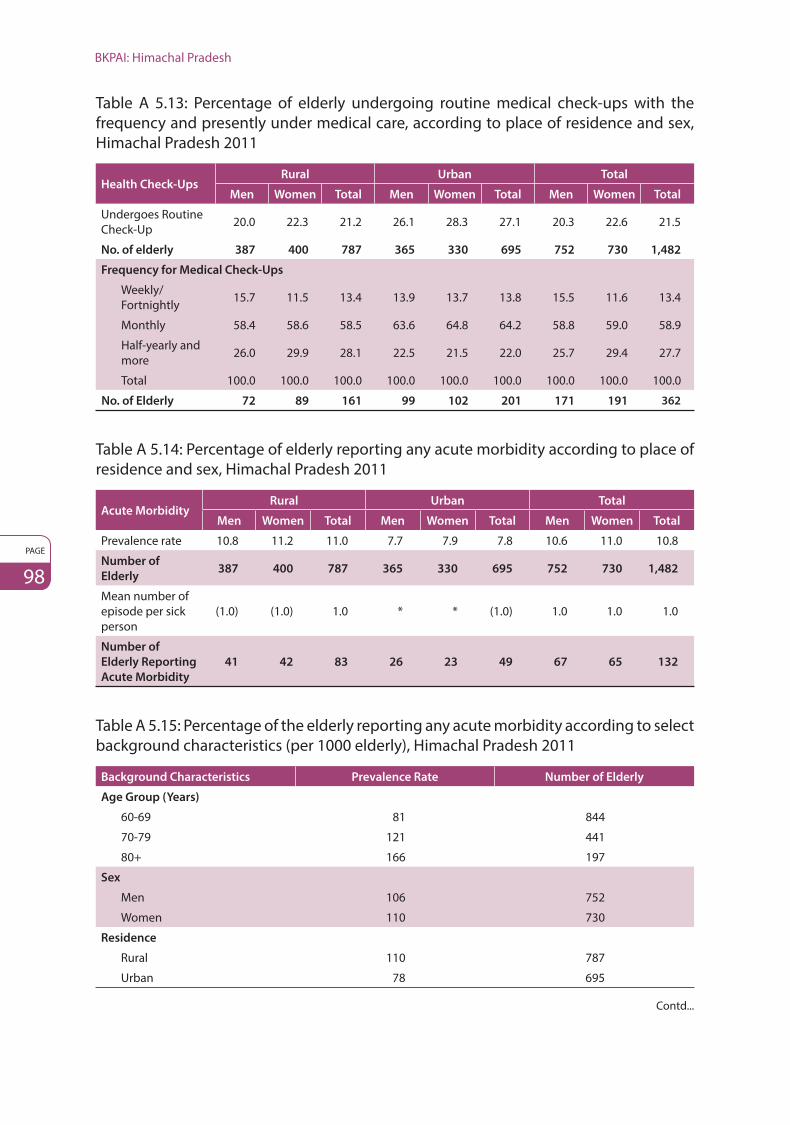
BKPAI: Himachal Pradesh
PAGE
98
Table A 5.13: Percentage of elderly undergoing routine medical check-ups with the frequency and presently under medical care, according to place of residence and sex, Himachal Pradesh 2011
Health Check-UpsRural Urban Total
Men Women Total Men Women Total Men Women Total
Undergoes Routine Check-Up 20.0 22.3 21.2 26.1 28.3 27.1 20.3 22.6 21.5
No. of elderly 387 400 787 365 330 695 752 730 1,482
Frequency for Medical Check-Ups
Weekly/Fortnightly 15.7 11.5 13.4 13.9 13.7 13.8 15.5 11.6 13.4
Monthly 58.4 58.6 58.5 63.6 64.8 64.2 58.8 59.0 58.9
Half-yearly and more 26.0 29.9 28.1 22.5 21.5 22.0 25.7 29.4 27.7
Total 100.0 100.0 100.0 100.0 100.0 100.0 100.0 100.0 100.0
No. of Elderly 72 89 161 99 102 201 171 191 362
Table A 5.14: Percentage of elderly reporting any acute morbidity according to place of residence and sex, Himachal Pradesh 2011
Acute MorbidityRural Urban Total
Men Women Total Men Women Total Men Women Total
Prevalence rate 10.8 11.2 11.0 7.7 7.9 7.8 10.6 11.0 10.8
Number of
Elderly387 400 787 365 330 695 752 730 1,482
Mean number of episode per sick person
(1.0) (1.0) 1.0 * * (1.0) 1.0 1.0 1.0
Number of
Elderly Reporting
Acute Morbidity
41 42 83 26 23 49 67 65 132
Table A 5.15: Percentage of the elderly reporting any acute morbidity according to select background characteristics (per 1000 elderly), Himachal Pradesh 2011
Background Characteristics Prevalence Rate Number of Elderly
Age Group (Years)
60-69 81 844
70-79 121 441
80+ 166 197
Sex
Men 106 752
Women 110 730
Residence
Rural 110 787
Urban 78 695
Contd...

Appendices
PAGE
99
Background Characteristics Prevalence Rate Number of Elderly
Marital Status
Currently married 96 962Widowed 121 481Others (294) 39
Caste/Tribe
SC/ST 145 315OBC 47 138Others 106 1,029
Wealth Quintile
Lowest 152 70Second 110 206Middle 109 313Fourth 72 438Highest 164 455
Living Arrangement
Alone 193 76Spouse only 116 227Children and others 102 1,179
Total 108 1,482
Note: () Based on 25-49 unweighted cases.
Table A 5.16: Per 1000 distribution of acute morbidities (last episode) pattern among elderly by sex and place of residence, Himachal Pradesh 2011
Type of Morbidity Sex Residence
TotalMen Women Rural Urban
Fever 360 470 425 220 417
Asthma 76 34 55 38 54
High blood pressure 39 52 45 66 46
Leg problem 15 58 36 67 37
Cough and cold 08 47 28 49 28
Sugar/Diabetes 12 28 21 13 20
Gastric 00 31 17 00 16
Diarrohea 24 00 12 00 12
Headache 02 11 06 27 7
Others 432 238 325 486 331
Don’t know/No response 34 31 32 34 32
Number of Elderly 67 65 83 49 132
Note: Others include body pain, cataract, typhoid, ulcer etc.
Table A 5.17: Percentage of acute morbidity (last episode) for which treatment was sought accordingly to place of residence and sex, Himachal Pradesh 2011
Residence Men Women Total Number of Episodes
Rural 87.8 85.3 86.5 83
Urban 96.3 88.8 92.6 49
Total 88.1 85.4 86.7 132
Number of Episodes 67 65 132

BKPAI: Himachal Pradesh
PAGE
100
Table A 5.18: Per cent distribution of elderly by source of treatment for acute morbidity (last episode) according to place of residence and sex, Himachal Pradesh 2011
Source of
Treatment
Rural Urban Total
Men Women Total Men Women Total Men Women Total
Government health facilities (61.3) (67.0) 64.2 (72.2) * (67.8) 61.8 66.8 64.3
Private physicians (34.5) (33.0) 33.7 (27.8) * (32.3) 34.2 33.2 33.7
AYUSH hospital/Clinic (0.0) (0.0) 0.0 (0.0) * (0.0) 0.0 0.0 0.0
Others (4.3) (0.0) 2.1 (0.0) * (0.0) 4.1 0.0 2.0
Total (100.0) (100.0) 100.0 (100.0) * (100.0) 100.0 100.0 100.0
Number of elderly
who sought
treatment
36 36 72 25 20 45 61 56 117
Note: () Based on 25-49 unweighted cases.*Percentage not shown; based on fewer than 25 unweighted cases.
Table A 5.19: Per cent distribution of elderly seeking treatment for acute morbidity (last episode) according to select background characteristics, Himachal Pradesh 2011
Background
Characteristics
Source of Treatment
Government
Health Facilities
Private
Physicians
AYUSH
Hospital/ClinicOthers Total
Number of
Elderly
Age Group (Years)
60-69 59.2 36.0 0.0 4.8 100.0 64
70-79 (61.5) (38.5) (0.0) (0.0) (100.0) 33
80+ * * * * * 20
Sex
Men 61.8 34.2 0.0 4.1 100.0 61
Women 66.8 33.2 0.0 0.0 100.0 56
Residence
Rural 64.2 33.7 0.0 2.1 100.0 72
Urban (67.8) (32.3) (0.0) (0.0) (100.0) 45
Caste/Tribe
SC/ST (57.6) (37.8) (0.0) (4.6) (100.0) 34
OBC * * * * * 7
Others 66.9 32.3 0.0 0.8 100.0 76
Wealth Quintile
Lowest * * * * * 8
Second * * * * * 18
Middle (67.2) (32.8) (0.0) (0.0) (100.0) 27
Fourth (73.4) (23.9) (0.0) (2.7) (100.0) 26
Highest (53.7) (46.3) (0.0) (0.0) (100.0) 38
Total 64.3 33.7 0.0 2.0 10.0 117
Note: () Based on 25-49 unweighted cases.*Percentage not shown; based on fewer than 25 unweighted cases.

Appendices
PAGE
101
Table A 5.20: Average expenditure made for treatment of acute morbidities (last episode)according to major heads and source of treatment, Himachal Pradesh 2011
Average
Expenditure by
Major Heads
For Last 15 Days Expenditure
Government
Health Facility
Private
PhysiciansOthers Total No. of Episodes
Total average expenses 1914 0 1591 53
% Distribution by item of expenses (based on the valid cases for which component wise details were available)
Consultation 2.8 NA 2.8 53
Medicines 24.8 NA 25.6 53
Diagnostic tests 39.9 NA 39.4 53
Transportation 8.9 NA 9.2 53
Others 23.6 NA 22.9 53
Note: Out of 132 episodes of acute morbidity, treatment was sought only for 117 cases and 64 were hospitalized hence their details of these patients are included in the discussion on hospitalization. Therefore the item wise expenses on the treatment of acute morbidities were only for 53 cases; hence percentages have been calculated only for these cases.
*Percentage not shown; based on fewer than 25 unweighted cases.
Table A 5.21: Per cent distribution of elderly by source of payment for last episode of acute morbidity according to sex, Himachal Pradesh 2011
Source of Payment Men Women Total
Self 33.3 * 25.8
Spouse 52.8 * 59.6
Children 13.8 * 14.3
Relatives/Friends/Insurance/Others 0.1 * 0.4
Total 100.0 * 100.0
Number of elderly who sought treatment 29 24 53
* Percentage not shown; based on fewer than 25 unweighted cases.
Table A 5.22: Prevalence rate (per 1,000) of chronic morbidities according to place of residence and sex, Himachal Pradesh 2011
Chronic AilmentsRural Urban Total
Men Women Total Men Women Total Men Women Total
Arthritis 283 505 397 182 359 267 278 498 390
Loss of all natural teeth 140 170 155 97 89 93 138 166 152
High blood pressure 132 154 143 188 262 223 135 159 147
Cataract 111 102 106 65 91 77 108 101 105
Asthma 127 68 97 64 56 60 124 67 95
Diabetes 63 50 56 105 112 108 65 53 59
Osteoporosis 49 67 58 7 20 13 47 65 56
Renal Diseases 47 19 33 31 21 26 46 19 32
Heart disease 37 25 31 51 61 56 38 27 32
Injury due to fall 20 26 23 21 19 20 20 25 23
Contd...

BKPAI: Himachal Pradesh
PAGE
102
Chronic AilmentsRural Urban Total
Men Women Total Men Women Total Men Women Total
Alzheimer’s disease 20 20 20 5 13 9 19 20 19
Paralysis 22 15 18 16 17 16 22 15 18
Skin disease 22 13 18 19 14 16 22 13 18
Accidental injury 11 17 14 5 9 7 11 16 13
Depression 12 10 11 13 20 17 12 11 11
Liver diseases 12 10 11 24 14 19 13 10 11
Chronic lung disease 14 8 11 8 1 5 14 7 11
Cerebral stroke 6 11 8 11 13 12 6 11 9
Dementia 6 3 5 0 2 1 5 3 4
Cancer 6 3 4 2 7 5 5 3 4
No chronic ailments 412 280 344 467 322 398 415 282 347
One or more chronic ailments 588 721 656 533 678 602 585 719 653
Average number of chronic ailments per elderly
1.1 1.3 1.2 0.9 1.2 1.1 1.1 1.3 1.2
Number of Elderly 387 400 787 365 330 695 752 730 1,482
Table A 5.23: Prevalence rate (per 1,000) of common chronic morbidities according to select background characteristics, Himachal Pradesh 2011
Background
CharacteristicsArthritis
Loss
of All
Natural
Teeth
High
Blood
Pressure
Cataract Asthma Diabetes Osteoporosis
At
Least
One
Number
of
Elderly
Age Group
(Years)
60-69 318 107 140 39 83 73 36 592 844
70-79 436 177 145 158 82 57 60 676 441
80+ 519 243 173 203 158 19 108 794 197
Sex
Men 278 138 135 108 124 65 47 585 752
Women 498 166 159 101 67 53 65 718 730
Residence
Rural 397 155 143 106 97 56 58 656 787
Urban 267 93 223 77 60 108 13 602 695
Marital Status
Currently married 355 141 142 92 95 61 54 615 962
Widowed 453 168 157 131 94 57 63 721 481
Others (540) (259) (144) (109) (108) (32) (0) (809) 39
Note: () Based on 25-49 unweighted cases.

Appendices
PAGE
103
Table A 5.24: Percentage of elderly seeking treatment for common chronic ailments during last 3 months according to sex and place of residence, Himachal Pradesh 2011
Chronic MorbiditiesSex Residence
TotalNumber of
ElderlyMen Women Rural Urban
Arthritis 68.8 73.8 71.9 76.7 72.1 501
Loss of all natural teeth 20.5 14.7 16.1 52.6 17.3 180
High blood pressure 91.4 93.5 92.5 93.5 92.6 272
Cataract 49.0 75.8 61.2 88.6 62.2 143
Asthma 76.5 69.2 73.7 80.3 73.9 116
Diabetes 84.7 97.8 89.8 99.2 90.7 123
Osteoporosis 16.5 19.5 18.2 27.2 18.3 53
Table A 5.25: Per cent distribution of elderly by reason for not seeking any treatment for common chronic morbidities, Himachal Pradesh 2011
Chronic
Morbidities
Reasons for Not Receiving Any Treatment
Condition
Improved
No Medical
Facility Available
in Neighborhood
Facilities
Available but
Lack of Faith
Long
Waiting
Time
Financial
Reasons
Ailment Not
Considered
Serious
Others Total
Number
of
Elderly
Arthritis 24.9 6.2 3.5 4.9 20.2 19.1 21.2 100.0 141
Loss of all natural teeth 30.7 7.0 2.5 1.7 14.6 13.2 30.1 100.0 129
High blood pressure (37.8) (0.0) (17.6) (0.3) (5.5) (25.1) (13.8) (100.0) 25
Cataract (52.6) (7.8) (1.2) (0.1) (18.4) (17.7) (2.3) (100.0) 44
Asthma * * * * * * * * 24
Diabetes * * * * * * * * 6
Osteoporosis (48.9) (7.7) (5.7) (0.0) (14.8) (23.0) (0.0) (100.0) 39
Note: () Based on 25-49 unweighted cases.*Percentage not shown; based on fewer than 25 unweighted cases.
Table A 5.26: Per cent distribution of elderly by source of payment for treatment of common chronic morbidities according to sex, Himachal Pradesh 2011
Source of
Payment
Arthritis
Loss of
All Natural
Teeth
High
Blood
Pressure
Cataract Asthma DiabetesOsteopo-
rosis
Men Women Men Women Men Women Men Women Men Women Men Women Men Women
Self 52.2 24.8 * * 68.6 28.1 (43.6) (11.4) 58.9 (22.5) 52.3 29.1 * *
Spouse 6.9 32.5 * * 5.4 24.8 (6.0) (20.6) 2.3 (16.3) 1.0 29.2 * *
Children 39.0 41.8 * * 26.1 47.0 (50.5) (68.1) 38.9 (60.5) 46.7 41.0 * *
Others** 1.9 0.9 * * 0.0 0.2 (0.0) (0.0) 0.0 (0.7) 0.0 0.6 * *
Total 100.0 100.0 * * 100.0 100.0 (100.0) (100.0) 100.0 (100.0) 100.0 100.0 * *
number
of elderly120 227 20 18 96 144 37 44 51 35 59 53 5 8
Note: () Based on 25-49 unweighted cases.*Percentage not shown; based on fewer than 25 unweighted cases.**Includes relatives, friends, insurance and others.

BKPAI: Himachal Pradesh
PAGE
104
Table A 5.27: Per cent distribution of diseases as the reason for hospitalization (last episode) among elderly according to sex and place of residence, Himachal Pradesh 2011
Type of Morbidity Sex Residence
TotalMen Women Rural Urban
Heart disease and chest pain 19.6 5.3 12.4 15.0 12.5
Typhoid, malaria and fever 12.6 9.4 11.2 5.9 11.0
Abdomen ailment 5.4 13.3 9.6 0.0 9.3
Renal and kidney disease 11.6 3.0 7.3 8.9 7.3
Accidental injury 6.0 6.2 6.2 3.6 6.1
Asthma 6.0 4.4 5.3 3.8 5.2
Spinal and neurological disorders 2.6 7.8 5.4 0.8 5.2
Diarrhoea 6.0 3.8 4.9 4.1 4.9
High blood pressure 1.6 5.7 3.5 6.2 3.6
Cataract and other eye surgery 4.1 3.0 3.2 11.4 3.5
Cancer and tumour 2.8 3.8 3.4 0.0 3.3
Joint disorders 0.0 5.0 2.6 0.0 2.5
Lung diseases 0.2 3.8 1.9 2.6 2.0
Gastric 0.0 3.6 1.8 1.7 1.8
Uterus disease 1.8 0.0 0.9 0.1 0.9
Diabetes 1.5 0.2 0.6 8.6 0.9
Liver disease 0.4 0.0 0.0 5.0 0.2
Hernia 0.3 0.1 0.0 4.8 0.2
Dementia/alzheimer’s 0.0 0.2 0.0 2.9 0.1
Paralysis, cerebral stroke and thrombus
0.1 0.1 0.0 2.0 0.1
Others 6.2 5.0 7.6 9.3 7.7
Don’t know/No response 14.8 16.4 14.0 3.4 13.6
Total 100.0 100.0 100.0 100.0 100.0
Number of Elderly 82 54 77 59 136
Table A 5.28: Per cent distribution of elderly by source of hospitalization care (last episode) according to place of residence and sex, Himachal Pradesh 2011
Type of Hospitals Rural Urban Total
Men Women Total Men Women Total Men Women Total
Government (78.6) (69.0) 73.7 (79.7) * 67.4 78.6 68.3 73.5
Private (14.9) (27.2) 21.1 (16.5) * 27.8 14.9 27.8 21.3
AYUSH/Clinic (0.0) (0.0) 0.0 (0.0) * 0.0 0.0 0.0 0.0
Others** (6.6) (3.9) 5.2 (3.8) * 4.8 6.5 3.9 5.2
Total 100.0 (100.0) 100.0 (100.0) * 100.0 100.0 100.0 100.0
Mean length of stay 11.9 (7.3) 9.6 (22.5) * 18.5 12.5 7.4 10.0
Number of
Hospitalization Cases42 35 77 40 19 59 82 54 136
Note: () Based on 25-49 unweighted cases.*Percentage not shown; based on fewer than 25 unweighted cases.**Others include charitable/missionary, NGO-run hospital, and others.
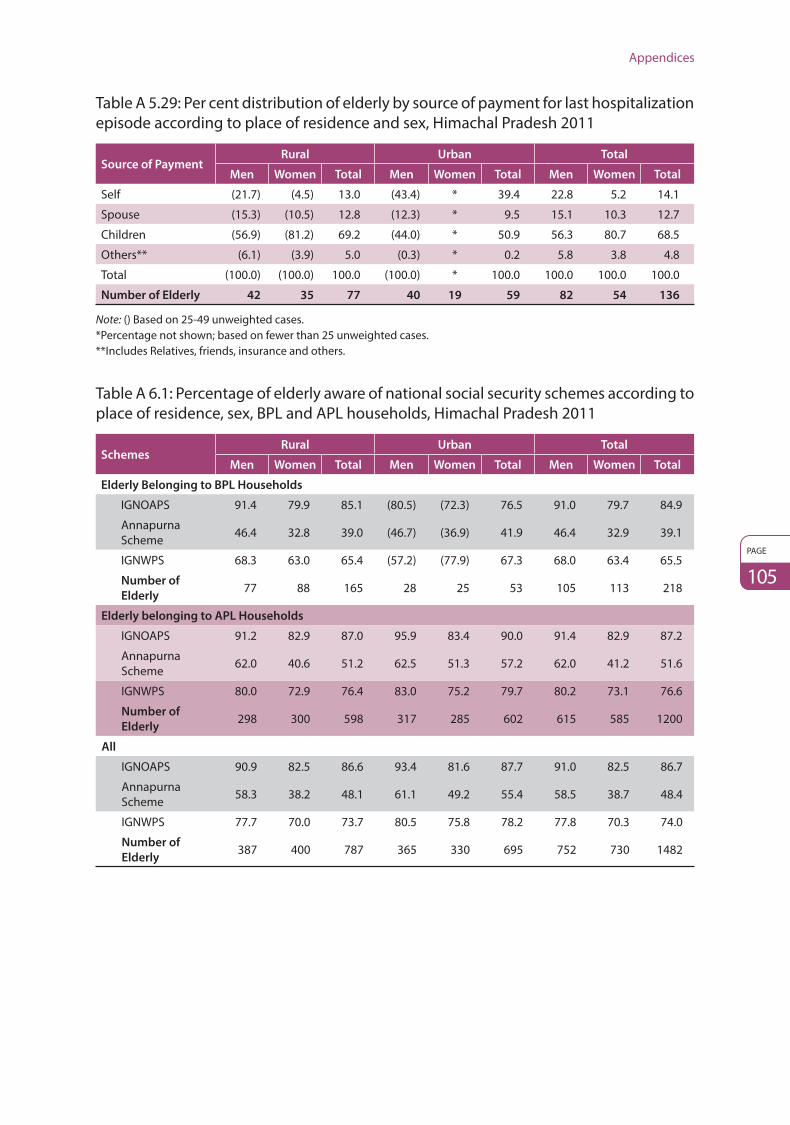
Appendices
PAGE
105
Table A 5.29: Per cent distribution of elderly by source of payment for last hospitalization episode according to place of residence and sex, Himachal Pradesh 2011
Source of PaymentRural Urban Total
Men Women Total Men Women Total Men Women Total
Self (21.7) (4.5) 13.0 (43.4) * 39.4 22.8 5.2 14.1
Spouse (15.3) (10.5) 12.8 (12.3) * 9.5 15.1 10.3 12.7
Children (56.9) (81.2) 69.2 (44.0) * 50.9 56.3 80.7 68.5
Others** (6.1) (3.9) 5.0 (0.3) * 0.2 5.8 3.8 4.8
Total (100.0) (100.0) 100.0 (100.0) * 100.0 100.0 100.0 100.0
Number of Elderly 42 35 77 40 19 59 82 54 136
Note: () Based on 25-49 unweighted cases.*Percentage not shown; based on fewer than 25 unweighted cases.**Includes Relatives, friends, insurance and others.
Table A 6.1: Percentage of elderly aware of national social security schemes according to place of residence, sex, BPL and APL households, Himachal Pradesh 2011
SchemesRural Urban Total
Men Women Total Men Women Total Men Women Total
Elderly Belonging to BPL Households
IGNOAPS 91.4 79.9 85.1 (80.5) (72.3) 76.5 91.0 79.7 84.9
Annapurna Scheme 46.4 32.8 39.0 (46.7) (36.9) 41.9 46.4 32.9 39.1
IGNWPS 68.3 63.0 65.4 (57.2) (77.9) 67.3 68.0 63.4 65.5
Number of
Elderly77 88 165 28 25 53 105 113 218
Elderly belonging to APL Households
IGNOAPS 91.2 82.9 87.0 95.9 83.4 90.0 91.4 82.9 87.2
Annapurna Scheme 62.0 40.6 51.2 62.5 51.3 57.2 62.0 41.2 51.6
IGNWPS 80.0 72.9 76.4 83.0 75.2 79.7 80.2 73.1 76.6
Number of
Elderly298 300 598 317 285 602 615 585 1200
All
IGNOAPS 90.9 82.5 86.6 93.4 81.6 87.7 91.0 82.5 86.7
Annapurna Scheme 58.3 38.2 48.1 61.1 49.2 55.4 58.5 38.7 48.4
IGNWPS 77.7 70.0 73.7 80.5 75.8 78.2 77.8 70.3 74.0
Number of
Elderly387 400 787 365 330 695 752 730 1482
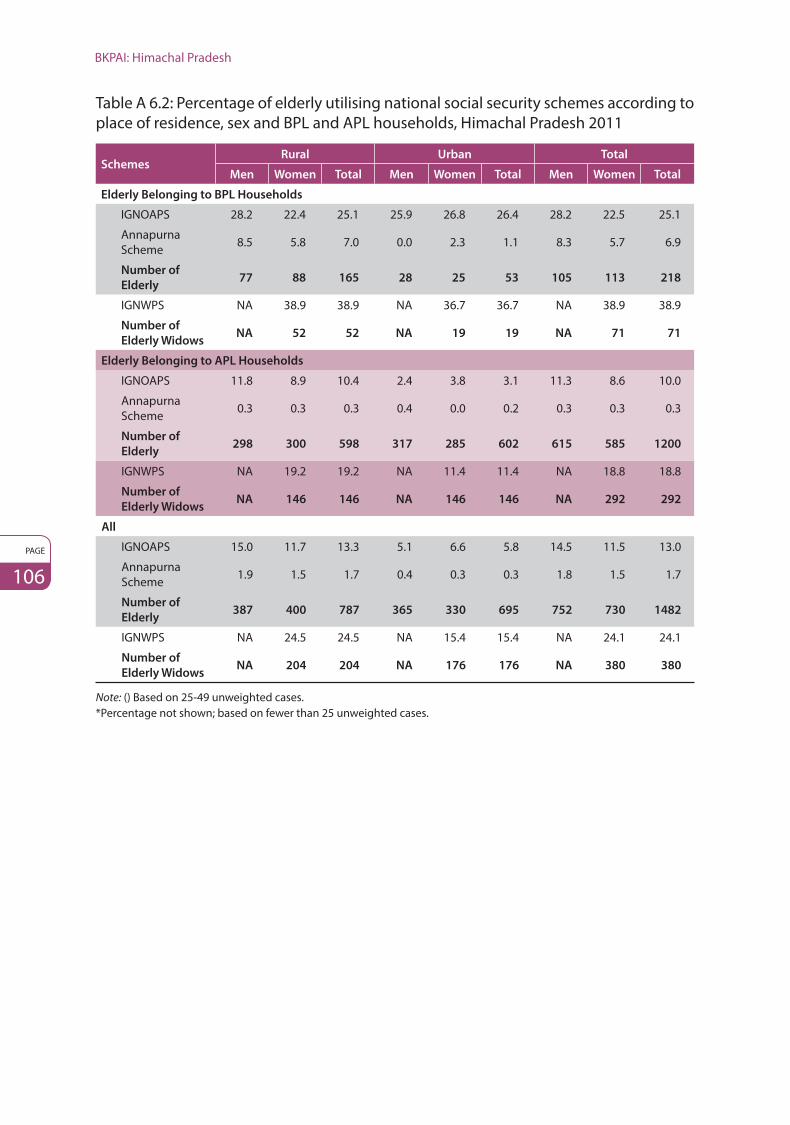
BKPAI: Himachal Pradesh
PAGE
106
Table A 6.2: Percentage of elderly utilising national social security schemes according to place of residence, sex and BPL and APL households, Himachal Pradesh 2011
SchemesRural Urban Total
Men Women Total Men Women Total Men Women Total
Elderly Belonging to BPL Households
IGNOAPS 28.2 22.4 25.1 25.9 26.8 26.4 28.2 22.5 25.1
Annapurna Scheme 8.5 5.8 7.0 0.0 2.3 1.1 8.3 5.7 6.9
Number of
Elderly77 88 165 28 25 53 105 113 218
IGNWPS NA 38.9 38.9 NA 36.7 36.7 NA 38.9 38.9
Number of
Elderly WidowsNA 52 52 NA 19 19 NA 71 71
Elderly Belonging to APL Households
IGNOAPS 11.8 8.9 10.4 2.4 3.8 3.1 11.3 8.6 10.0
Annapurna Scheme 0.3 0.3 0.3 0.4 0.0 0.2 0.3 0.3 0.3
Number of
Elderly298 300 598 317 285 602 615 585 1200
IGNWPS NA 19.2 19.2 NA 11.4 11.4 NA 18.8 18.8
Number of
Elderly WidowsNA 146 146 NA 146 146 NA 292 292
All
IGNOAPS 15.0 11.7 13.3 5.1 6.6 5.8 14.5 11.5 13.0
Annapurna Scheme 1.9 1.5 1.7 0.4 0.3 0.3 1.8 1.5 1.7
Number of
Elderly387 400 787 365 330 695 752 730 1482
IGNWPS NA 24.5 24.5 NA 15.4 15.4 NA 24.1 24.1
Number of
Elderly WidowsNA 204 204 NA 176 176 NA 380 380
Note: () Based on 25-49 unweighted cases.*Percentage not shown; based on fewer than 25 unweighted cases.

Appendices
PAGE
107
Table A 6.3: Per cent distribution of elderly by awareness and utilization of special government facilities/schemes according to place of residence and sex, Himachal Pradesh 2011
Special Government Facilities/
Schemes
Rural Urban Total
Men Women Total Men Women Total Men Women Total
Awareness of Facilities/Schemes
Train ticket concession 57.6 30.2 43.6 71.8 52.5 62.6 58.3 31.3 44.6
Bus seat reservation 57.6 30.2 39.0 56.7 47.6 52.4 52.4 27.4 39.7
Preference for telephone connection 52.1 26.4 17.6 32.8 20.3 26.8 24.6 11.7 18.0
Higher interest for deposits in banks/Post offices 24.2 11.3 23.4 49.6 27.9 39.2 34.2 14.5 24.2
Income tax benefits 33.4 13.9 12.8 33.9 16.5 25.6 18.9 8.1 13.4
MGNREGA 18.1 7.7 41.9 48.9 35.4 42.4 48.8 35.3 41.9
Utilization of Facilities/Schemes
Train ticket concession 5.1 0.6 2.8 18.5 8.6 13.7 5.8 1.0 3.4
Bus seat reservation 2.4 0.7 1.5 2.8 2.5 2.7 2.4 0.7 1.6
Preference for telephone connection 0.1 0.0 0.1 1.4 0.4 0.9 0.2 0.0 0.1
Higher interest for deposits in banks/Post offices 9.7 4.2 6.9 25.9 12.6 19.5 10.5 4.6 7.5
Income tax benefits 1.6 0.8 1.2 9.6 2.5 6.2 2.1 0.9 1.5
MGNREGA 6.8 2.5 4.6 0.0 0.5 0.2 6.5 2.4 4.4
Number of Elderly 387 400 787 365 330 695 752 730 1482
PAGE
108
ReferencesAlam, M. 2004. “Ageing, Old Age Income Security and Reforms: An Exploration of Indian Situation,” Economic
and Political Weekly, pp. 3731-3740, August 14.
_______. 2006. “Aging in India: Socio-Economic and Health Dimensions,” Academic Foundation Press,
New Delhi.
Alam, M. and A. Karan. 2011. “Elderly Health in India: Dimension, Determinants and Differentials,” BKPAI Working
Paper No. 3, United Nations Population Fund (UNFPA), New Delhi.
Alam, M., K.S. James, G. Giridhar, K.M. Sathyanarayana, S. Kumar and S. Siva Raju. 2013. “Report on the Status
of Elderly in Select States of India, 2011–Sample Design, Survey Instruments, and Estimates of Sampling Errors,”
United Nations Population Fund (India). http://india.unfpa.org/?publications=8412
Alam, M., K.S. James, G. Giridhar, K.M. Sathyanarayana, S. Kumar, S. Siva Raju, T.S. Syamala, L. Subaiya,
D.W. Bansod. 2012. “Report on the Status of Elderly in Select States of India, 2011,” United Nations Population
Fund (UNFPA, India). http://india.unfpa.org/drive/AgeingReport_2012_F.pdf
Alam, M., and P. Yadav. 2013. “Growing Life Span, Ageing and Income Challenges in India: Activity Status of the
Older Indians,” (mimeo).
___________________, 2014. “Poverty among the Elderly in India,” (mimeo).
Alam, M., S. Mazumdar and P. Yadav. 2014. “Inequality in Elderly health and well-being in India: An Exploration,”
forthcoming in BKPAI Working Paper Series, United Nations Population Fund (UNFPA, India).
Asher, G. Mukul. 2008. “Social Security Reform Imperatives in Developing Asia”, The Indian Economic Journal,
56, No. 1, pp. 112-123.
Barro, Robert, J. 1974. “Are Government Bonds Net Wealth?” Journal of Political Economy, 82, No. 6,
pp. 1095-1117.
Bhalla, S.S. and R. Kaur. 2011. “Labour Force Participation of Women in India: Some Facts, Some Queries, Asia
Research Centre”, Working Paper 40, London School of Economics & Political Science, London, UK.
Bhalotra, S. and M. Umana-Aponte. 2010. “The Dynamics of Women’s Labour Supply in Developing Countries”,
IZA Discussion Paper No. 4879, The Institute for Study of Labour (IZA), Bonn, Germany.
Bose, Ashish and M. K. Shankardass. 2004. “Growing Old in India: Voices Reveal, Statistics Speak,” BR Publishing
Corporation, Delhi.
Building a Knowledge Base on Population Ageing in India Survey, 2011. Unit level data collected by Institute
for Social and Economic Change (ISEC) and Institute of Economic Growth (IEG) in collaboration with UNFPA,
New Delhi.
Census of India, 2001. “Table C-14: Population in Five Year Age-Group by Residence and Sex,” Office of the
Registrar General and Census Commissioner, Government of India, New Delhi, electronic data. Downloaded
from http://censusindia.gov.in/
References
PAGE
109
_____________, 2011. “Table C-14: Population in Five Year Age-Group by Residence and Sex,” Office of the
Registrar General and Census Commissioner, Government of India, New Delhi, electronic data. Downloaded
from http://censusindia.gov.in/
Economic Times. 2013. “Your Guide to investing in the National Pension Scheme,” New Delhi, September 23.
http://articles.economictimes.indiatimes.com/2013-09-23/news/42324225_1_uti-retirement-solutions-
npsfunds-lic-pension-fund
Fan, Elliott. 2010. “Who Benefits from Public Old Age Pensions? Evidence from a Targeted Program,” Economic
Development and Cultural Change, Vol. 58(2), pp. 297-322.
Goldberg, D.P. and B. Blackwell. 1970. “Psychiatric Illness in General Practice: A Detailed Study Using a New
Method of Case Identification,” British Medical Journal, Vol. 1(707), pp. 439-443.
Goldberg D.P. and V.F. Hiller. 1979. “A Scaled Version of the General Health Questionnaire,” Psychological
Medicine, Vol. 9, pp. 139-145.
Gondolf, E. 2002. “Batterer Intervention Systems: Issues, Outcomes and Recommendations,” Thousand Oaks,
CA: Sage Publications.
Government of Himachal Pradesh. 2012. “Socio Economic Indicators of Himachal Pradesh 2012,” Department of
Economics and Statistics, Government of Himachal Pradesh, Shimla.
____________________________. 2013. “An Integrated Scheme for Older Persons,” Department of Social Justice
and Empowerment, Government of Himachal Pradesh, Shimla.
____________________________. 2013. “Budget Speech of Chief Minister”, Himachal Pradesh, Shimla.
____________________________. 2014. “Economic Survey of Himachal Pradesh 2013-14,” Department of
Economics and Statistics, Government of Himachal Pradesh, Shimla.
___________________________. (2013). “Economic Survey of Himachal Pradesh 2012-13,” Department of
Economics and Statistics, Government of Himachal Pradesh, Shimla.
___________________________. 2012. “Economic Survey of Himachal Pradesh 2011-12,” Department of
Economics and Statistics, Government of Himachal Pradesh, Shimla.
___________________________. 2012. “Implementation of Rashtriya Swasthya Bima Yojana in Himachal
Pradesh”, Department of Health and Family Welfare, Government of Himachal Pradesh, Shimla http://himachal.
nic.in/showfile.php?lang=1&dpt_id=19&level=1&lid=1793&sublinkid=1443
___________________________. 2013. “State Policy on Older Persons in Himachal Pradesh,” Department of
Social Justice and Empowerment, Government of Himachal Pradesh, Shimla.
__________________________. 2013. “Statistical Outline of Himachal Pradesh”, Department of Economics and
Statistics, Government of Himachal Pradesh, Shimla.
__________________________. “Post-Independence Period,” Shimla, Himachal Pradesh. http://himachal.gov.
in/index1.php?lang=1&dpt_id=17&level=2&lid=3589&sublinkid=3027

BKPAI: Himachal Pradesh
PAGE
110
__________________________. “Information and Public Relations Department,” Government of Himachal
Pradesh, Shimla.
Government of India, 2009. “Report of the Expert Group to Advise the Ministry of Rural Development on the
Methodology for Conducting the Below Poverty Line (BPL) Census for 11th Five Year Plan,” Ministry of Rural
Development, Krishi Bhavan, New Delhi, September.
Government of India. 2013. “Annual report 2012-13”, Ministry of Social Justice and Empowerment, Department
of Social Justice and Empowerment, India. http://socialjustice.nic.in/pdf/ar13eng.pdf
________________. 2012. “Annual report 2011-12,” Ministry of Social Justice and Empowerment, Department
of Social Justice and Empowerment, India. http://socialjustice.nic.in/pdf/ar12eng.pdf
_______________. 2008-9. “Budget 2008-2009,” Department of Economic Affairs, Ministry of Finance, New
Delhi.
_______________. 2013-14. “Economic Survey: 2013-2014,” Department of Economic Affairs, Ministry of
Finance, New Delhi.
HelpAge India, 2012. “Report on Elder Abuse in India,” New Delhi, India. http://www.helpageindia.org/images/
pdf/survey%20&%20reports/Report%20on%20Elder%20Abuse%20in%20India%202012.pdf
_______________. 2012. “Newsletter for the Month of September,” Himachal Pradesh. http://www.
helpageindiaprogramme.org/other/latest_newsfromstates_29_3_2011/Himachal%20Pradesh.pdf
Hill Post. 2008. “Social Security Schemes: Coverage, Regional Dimension and Related Issues in Himachal Pradesh,”
Shimla, September 25. http://hillpost.in/2008/09/social-security-schemescoverage-regional-dimension-
andrelated-issues-in-himachal-pradesh/6655/
Himachal Connect. 2012. “Avail Benefits under RSBY,” Shimla, September 12. http://himsamachar.com/
availbenefits-under-rsby/
International Institute for Population Sciences (IIPS) and Macro International. 2007. “National Family Health
Survey (NFHS-3), 2005–06: India: Volume I,” Mumbai: IIPS.
International Institute for Population Sciences (IIPS) and Macro International. 2007. “National Family Health
Survey (NFHS-3), 2005–06: India: Volume II,” Mumbai: IIPS.
IIT Delhi and Indian Council of Social Science Research (ICSSR). 2013. “Survey of Social Security Schemes in
10 States”. http://web.iitd.ac.in/~reetika/Preliminary%20Field%20Reports/Himachal%20Pradesh/Press%20
Release%20(English).pdf
Jadhav, A., K.M. Sathyanarayana, S. Kumar and K.S. James. 2013. “Living Arrangements of the Elderly in India:
Who Lives Alone and What are the Patterns of Familial Support?” UNFPA, New Delhi.
Jensen, Robert, T. 2003. “Do Private Transfers Displace the Benefits of Public Transfers? Evidence from South Africa,”
Journal of Public Economics, 88 (Nos. 1-2), pp. 89-112.
Jha, Praveen and Nilachal Acharya. 2013. “Social Security for the Elderly I India: A Note on Old Age Pension,”
HelpAge India - Research & Development Journal, 19(2), pp. 3-15.

References
PAGE
111
Kapoor, Sahil. 2013. “A Ray of Hope: Sensitization of Children and Youth”, Help-Age India-Research and
Development Journal, Vol. 19(2), pp. 34-37.
Katz, S., A.B. Ford, R.W. Moskowitz, B.A. Jackson and M.W. Jaffe. 1963. “Studies of Illness in the Aged.” Journal of
the American Medical Association, 185, pp. 94-99.
Katz, S. 1983. “Assessing Self-Maintenance: Activities of Daily Living, Mobility, and Instrumental Activities of
Daily Living.” Journal of the American Geriatrics Association, Vol. 31, pp. 721-727.
Lawton, M.P. and E.M. Brody. 1969. “Assessment of Older People: Self-Maintaining and Instrumental Activities
of Daily Living,” The Gerontologist, Vol. 9(3), pp. 179-186.
Likert, Rensis. 1932. “A Technique for the Measurement of Attitudes,” Archive of Psychology, Vol. 140, pp. 1-55.
Lorig, K., A. Stewart, P. Ritter, V. Gonzalez, D. Laurent and J. Lynch. 1996. “Outcome Measures for Health Education
and other Health Care Interventions.” Thousand Oaks, CA: Sage Publications Inc.
Ministry of Health and Family Welfare, 2011. “National Programme for Health Care of the Elderly: Operational
Guidelines.” Directorate General of Health Services, Government of India.
Moore, S.E, H.Y. leslie and C.A. Lavis. 2005. “Subjective Well-being and Life Satisfaction in the Kingdom of
Tonga,” Social Indicators Research, Vol. 70, pp. 287-311.
National Commission on Population. 2006. “Population projections for India and States 2001-2026”, Report
of Technical Group on Population Projections, Office of the Registrar General and Census Commissioner,
Government of India, New Delhi.
National Sample Survey Organisation. 2004. “Morbidity, Health Care and the Condition of the Aged.” NSS 60th
Round (January-June 2004), Report No. 507 (60/25.0/1), National Sample Survey Organisation, Department of
Statistics, Ministry of Planning and Plan Implementation, Government of India.
____________________________________. “Schedule 25.0: Morbidity and Health Care,” Unit Level Data,
Department of Statistics, Ministry of Planning and Plan Implementation, Government of India.
____________________________________. (2013). “Key Indicators of Household Consumer Expenditure
in India, 2011-12 (July 2011-June 2012),” Vol. KI of 68th round. National Sample Survey Office, Ministry of
Statistics and Programme Implementation, Government of India.
National Sample Survey Organization (NSSO). 68th Round, July 2011 – June 2012. “Schedule 1.0: Consumer
Expenditure-Schedule Type I” unit level data, Ministry of Statistics and Programme Implementation,
Government of India.
___________________________________________________________. “Schedule 10.0: Employment and
Unemployment Survey,” unit level data, Ministry of Statistics and Programme Implementation, Government
of India.
Normand, C., A. McNamara and B. Whelan. 2013. “Pattern and Determinants of Health Care Utilization in Ireland,”
The Irish Longitudinal Study on Ageing, Ireland.

BKPAI: Himachal Pradesh
PAGE
112
Pal, S. 2011. “Understanding Poverty among The Elderly in India: Implication for Social Pension Policy,” Journal
of Development Studies, Vol. 47(7), pp. 1017-1037, July.
Parsuram, Ameeta. 1996. “Perceived Control and Successful Ageing,” HelpAge India, Research and Development
Journal, Vol. 2(3), pp. 28-36
Planning Commission. 2012.“The Report of the Expert Group to Recommend the Detailed Methodology for the
Identification of Families Living Below Poverty in the Urban Areas,” Government of India, New Delhi, December.
Prasad, S. 2011. “Deprivation and Vulnerability among Elderly in India,” working paper 2011-013, Indira Gandhi
Institute of Development Research (IGIDR), Mumbai. http://www.igidr.ac.in/pdf/publication/WP-2011-013.pdf
Rajan, S.I. 2010. “Demographic Ageing and Employment in India,” ILO Asia-Pacific Working Paper series. http://
www.ilo.org/public/libdoc/ilo/2010/455325.pdf
Rajan, S.I. 2004. “Chronic Poverty among the Elderly.” Working Paper 17, Chronic Poverty Research Centre,
Indian Institute of Public Administration, India.
Reddy, K.S., S. Selvaraj, K.D. Rao, M. Chokshi, P. Kumar, V. Arora, S. Bhokare and I. Ganguly. 2011. “A Critical
Assessment of the Existing Health Insurance Models in India,” Public Health Foundation of India (PHFI), New Delhi.
Root, L.S., and J.E. Tropman. 1984. “Income Sources of the Elderly,” Social Service Review, Vol. 58(3), September
1984, pp. 384-403.
Rutstein, S. 1999. “Wealth versus Expenditure: Comparison between the DHS Wealth Index and Household
Expenditures in Four Departments of Guatemala.” Calverton, Maryland, USA: ORC Macro (Unpublished).
Sample Registration System (SRS). 2013. “Statistical Report, No. 1,” Office of the Registrar General, Ministry of
Home Affairs, Government of India, New Delhi.
_____________. 2012. “SRS based Abridged Life Tables 2003-07 to 2006-10,” Registrar General, Government of
India. http://www.censusindia.gov.in/vital_statistics/SRS_Based/Introduction.pdf
Sell, H. and R. Nagpal. 1992. “Assessment of Subjective Well-Being: The Subjective Well-Being Inventory,” Regional
Health Paper, SEARO, No. 24, World Health Organization, Regional Office for South-East Asia, New Delhi.
Sengupta, A.R. 2007. “Report on the Condition of Work and Promotion of Livelihoods in the Unorganized Sector,”
National Commission for Enterprises in the unorganized sector, Government of India, New Delhi.
Sharma, D., R.S. Mazta and A. Parashar. 2013. “Morbidity Pattern and Health-Seeking Behavior of Aged
Population Residing in Shimla Hills of North India: A cross-Sectional Study.” Journal of Family Medicine and
Primary Care. http://www.jfmpc.com
Shepard, M. and E. Pence. 1999. “Coordinating Community Responses to Domestic Violence: Lessons from
Duluth Model and Beyond”, Thousand Oaks, CA: Sage Publications. http://www.igidr.ac.in/pdf/publication/wp-
2011-013.pdf.
UNFPA and HelpAge International. 2012. “Ageing in the Twenty-First Century: A Celebration and a Challenge.”
UNFPA, New York, USA.
References
PAGE
113
United Nations. 2013. “World Population Ageing, 2013,” Population Division, United Nations Department of
Economic and Social Affairs (UNDESA), New York.
Unni, J. and G. Raveendran, 2007. “Growth of Employment (1993-94 to 2004-05): Illusion of Inclusiveness?”
Economic and Political Weekly, January 20.
Werneke, U., D.P. Goldberg, I. Yalcin and B.T. Ustun, 2000. “The Stability of the Factor Structure of the General
Health Questionnaire,” Psychol Med, Vol. 30, pp. 823-829.
World Bank, 2008. “Poverty Target Programs for the Elderly in India with Special Reference to National Old Age
Pension Scheme,” Washington DC.
World Health Organisation (WHO). 1948. “Preamble to the Constitution of the World Health Organization,” as
adopted by the International Health Conference, New York, 19-22 June, 1946 signed on 22 July 1946 by the
representatives of 61 States (Official Records of the World Health Organization, no. 2, p. 100) and entered into
force on 7 April 1948.
______________________. 2005. “Alcohol, Gender and drinking Problems: Perspectives from Low and Middle
Income Countries,” Department of Mental Health and Substance Abuse, Geneva.


PAGE
115
Details of ContributorsSanjay Kumar: National Programme Officer (Monitoring and Evaluation), United Nations Population Fund,
Chanakyapuri, New Delhi – 110 021
Moneer Alam: Principal Investigator and IEG coordinator of the BKPAI Project, Institute of Economic Growth,
University of Delhi, Delhi – 110 007
Pratima Yadav: Consultant, Population Research Centre, Institute of Economic Growth, University of Delhi,
Delhi – 110 007
Sikander Kumar: Professor of Economics, Himachal Pradesh University, Shimla – 171 005
Sumit Mazumdar: Fellow, Institute for Human Development, IIPS Campus, New Delhi – 110 002