Embed Size (px)
Citation preview

CITY UNIVERSITY OF HONG KONG
Humor Styles, Gelotophobia and Self-esteem:
A comparative study between
the Chinese and the Indians
A Report Submitted to
Department of Applied Social Studies
In Partial Fulfillment of the Requirements for
the Bachelor of Social Sciences in Psychology
by
Hiranandani, Neelam Arjan
April, 2010
ii
Abstract
Objectives: Humor Styles has been studied intensively in recent years. Till date, there have
been reports on individual and cultural differences on Humor styles; however, there have
been minimal studies on the Indian humor styles and less research in the Chinese on this
issue. This paper addresses the styles of humor in two cultures – the Chinese and the
Indians. Furthermore, this study is an attempt to reveal empirically the relationship between
humor styles, gelotophobia and self-esteem in the Chinese and the Indians.
Method: The participants of the present study were sampled from universities in Hong
Kong and India at a random basis, consisting of a total of 203 undergraduate students
(57.6% females, 42.4% males; 49.8% Chinese, 50.2% Indians) who aged above 18 and
below 26 years.
To evaluate the findings, the data was collected through a questionnaire which was
a combination of three standardized instruments namely, the Rosenberg Self-esteem scale
(Rosenberg, 1965), the Humor Styles Questionnaire (Martin et al., 2003) and the
GELOPH-15 scale (Ruch & Proyer, 2008). Participants were also required to rank the
importance of humor and their self-humor. Moreover, they had to list three most humorous
people according to them along with reasoning. The data were then analyzed using SPSS,
Independent t-tests, Repeated measures ANOVA, Univariate analysis of variance, Pearson
correlation and Regression.
Results: Firstly, the results reported that Indian students rate the importance of humor
significantly higher than the Chinese students and also consider themselves as being
humorous. Secondly, this study affirms that collectivistic cultures use more adaptive humor

iii
than maladaptive humor styles. In terms of gelotophobia, results indicate that the Chinese
demonstrate signs of the fear of laughter more than Indians. Lastly, a relation of
gelotophobia and the following has been recorded: low self-esteem, low affiliative humor,
low self-enhancing humor and high self-defeating humor.
Conclusions: All in all, this study brings out the empirical data in the Indians and Chinese.
Indians use the adaptive styles of humor more than maladaptive styles just like other
collectivistic cultures; nonetheless, they use it more than the Chinese. Similar results were
found with the gelotophobia. Lastly, the significant relation between gelotophobia and self-
esteem indicates that low self-esteem scorers may have signs of expressions of fear of
laughter.

iv
Acknowledgements
From the beginning of the preparation of the present study, there are a few people
who have aided me (the author) in various ways. Firstly, I wish to thank my family and
friends for continuous support and motivation during the process of this study. I thank my
friends for helping with the data collection. Secondly, Dr Yue, Xiao Dong, my supervisor,
who has guided me from the very beginning till the end to facilitate, enhance and improve
my learning of research methods further. Lastly, Dr. Rod Martin, Dr. Ruch Willibald and
Dr. Chen who provided me with the Humor styles questionnaire-32 and GELOPH-15 scale
that was the most needed in this study. Their help and guidance were very much
appreciated.

v
City University of Hong Kong Department of Applied Social Studies
Thesis Submission Declaration Form
Student Name: Neelam Arjan Hiranandani Student No.: Title of Thesis/Dissertation: Humor Styles, Gelotophobia and Self-esteem: A
comparative study between the Chinese and the Indians
Course Code: SS4708 Programme: BSSPSY Supervisor’s Name: Dr. Yue Xiao Dong I have read and understood the following
Section 2.3 of the City University Code of Student Conduct (http://www.cityu.edu.hk/arro/arro_new/frame_student_discip.htm):
“Students must pursue their studies with academic honesty. Academic honesty is central to the conduct of academic work. Students are expected to present their own work, give proper acknowledgement of other's work, and honestly report findings obtained.“
Department’s Statement on Plagiarism.
Thesis/Dissertation Checklist (please tick):
( √ ) This paper is my own individual work. ( √ ) This paper has not been submitted to any other courses. ( √ ) All sources consulted have been acknowledged in the text and are listed in the
reference list, with sufficient documentation to allow their accurate identification. ( √ ) All quotations are enclosed in quotation marks and that the source for each quotation
has an accurate citation.
Signature: ________ Date: ___

vi
Table of Contents
Abstract……………………………………………………………………………………..ii
Acknowledgments………...……………………………………………………………….iv
Thesis Submission Declaration Form………………………………………………..........v
Table of Contents………………………………………………………………………….vi
List of Tables………………………………………………………………………………ix
List of Figures………………………………………………………………………...........xi
1. Introduction and Literature Review……………………..…………………………….1
1.1 Literature Review…………………………………………………………………...3
1.1.1 Definitions of Humor………………………………………………………..3
1.1.2 Theories of Humor……………………………………………………..........3
1.1.3 Styles of Humor……………………………………………………………..5
1.1.4 Studies of Humor………………………………………………………........7
1.1.5 Definitions of Gelotophobia………………………………………………..10
1.1.6 Theories of Gelotophobia…………………………………………………..11
1.1.7 Studies of Gelotophobia…………………………………………………....11
1.1.8 Definitions of Self-Esteem……………………………………………........12
1.1.9 Theories of Self-Esteem…………………………………………………....13
1.1.10 Studies of Self-Esteem………………………………………………..........14
1.1.11 Relationship between Humor, Gelotophobia and Self-Esteem……….........14
1.2 Research Questions and Hypotheses.....................………………………………....15
2. Methodology…………………………………………………………………………....17
2.1 Participants………………………………………………………………………....17
2.2 Questionnaires…………………………………………………………………..….17
2.3 Procedure……………………………………………………………………..…...19

vii
3. Results…………………………………………………………………………………..20
3.1 Descriptive Statistics of the Demographic Variables of the Present Study………..20
3.2 Ratings and Perception of Humor……………………………………………….....21
3.2.1 Ratings of Importance of Humor and Self-Humor…………………………..21
3.3 Nomination of Best Humorists………………………………………...………......22
3.3.1 Nomination of Best Humorists by Chinese and Indian Students...…………..22
3.3.2 Reasons of Nomination of Best Humorists …………….….……...................25
3.4 Reasons for Disliking Humor….…….....……….……………………...…………..26
3.5 Self-Esteem ………………………………………..…………………...……….…27
3.5.1 Level of Self-Esteem among Chinese and Indian University Students……...27
3.6 Humor Styles……………………………………………………………………….28
3.6.1 Humor Styles in Chinese and Indian Society…………………………..........28
3.6.2 Humor Styles by Gender and Age Differences………………………………30
3.6.3 Correlations with Humor Styles……………………………………………...32
3.7 Gelotophobia…………………………………………………………….……........33
3.7.1 Gelotophobia by Culture, Gender and Age……………………………..........33
3.7.2 Correlations with Gelotophobia……………………………………………...35
3.8 Correlations between Self-Esteem, Humor Styles and Gelotophobia……...……...36
3.9 Regression Analysis of Four Humor Styles, Self-Esteem and Gelotophobia……...37
4. Discussion and Conclusion…………………………………………….……………...40
4.1 Major Findings and Significance of the Present Study…………………….............40
4.1.1 Students’ Perception on the Importance of Humor and Self Humor...............40
4.1.2 Impact of Self-Esteem on Humor………………………………..…………..42
4.1.3 Impact of Age on Self-Esteem…………………………………..……...........43
4.1.4 Impact of Culture on Humor Styles…..………………………………...........43
4.1.5 Impact of Gender and Age on Humor………………………………………..44

viii
4.1.6 Impact of Culture on Gelotophobia…………………………………………..45
4.1.7 Impact of Gender and Age on Gelotophobia………………………………...45
4.1.8 Predictive Power of Humor Styles on Self-Esteem and Gelotophobia…........46
4.2 Limitations and Future Studies………………………………………..…………...47
4.3 Conclusion……………………………………………………………….…………48
References………………………………………………………………………………....50
Appendix..…………………………………………………………………………………57
Appendix A. Questionnaire………...…………………………………………………..57

ix
List of Tables
Table 1. Demographic Information of the Participants…………………………………….20
Table 2. Means and Standard Deviations for Rating of Importance of Humor and of Self-
Humor in Chinese and Indians……………………………………….…………..21
Table 3. Means and Standard Deviations for Rating of Importance of Humor and of Self-
Humor in Males and Females………………………………….………...............21
Table 4. Nomination of Humorists by Chinese and Indian Undergraduates………………22
Table 5(a). Ranking of the Top Ten Humorists Nominated by Hong Kong Chinese
Undergraduates………………….……………………………………………….23
Table 5(b). Ranking of the Top Ten Humorists Nominated by Indian Undergraduates…..23
Table 6. Top 10 Reasons for Selecting Best Humorists…………………………………....25
Table 7. Top 10 Reasons for Being Afraid or Dislike Humor………………...…………...26
Table 8(a). Means and Standard Deviations of Self-Esteem Level by Nationality and
Gender……...….………………………………………………………………....27
Table 8(b). Means and Standard Deviations of Self-Esteem Level by Nationality and Age
……………………………………………………………………………….…27
Table 9(a). Comparison in the Use of Humor Styles among the Chinese and Indian
University Students………………………………………..………………....28
Table 9(b). Comparison in the Use of Humor Styles among the Chinese and Indian
University Students……………………………………….……………….....28
Table 10. Comparison in the Use of Humor Styles among Male and Female University
Students………………………………………………………………….…...30
Table 11. Comparison in the Use of Humor Styles by Age………………………………..30
Table 12. Correlation Analysis between Humor Styles and Nationality, Gender, Height and
Weight………………..………………………………………………...............32
Table 13(a).Gelotophobia by Culture……………………………………………………...33
Table 13(b).Gelotophobia by Gender………………………………………………….......33
Table 13(c).Gelotophobia by Age…………………………………………………….……33

x
Table 14. Correlation Analysis between Gelotophobia and Nationality, Gender, Height and
Weight…………..……………………………………………………………...35
Table 15. Correlation Analysis between Self-Esteem, Humor Styles and
Gelotophobia…………..…………………………………………………….…36
Table 16. Regression Analysis of the Scales………………………………………………37

xi
List of Figures
Figure 1. Ratings of Importance of Humor and Self-humor………………………….…....21
Figure 2. Means of Humor Styles Across Culture……………………………………........29
Figure 3. Means of Gelotophobia Across Culture…………………………………………33
Figure 4. Means of Gelotophobia Across Age…………………………………………......34

1
1. INTRODUCTION AND LITERATURE REVIEW
Humor - a universal activity in which humans have the ability to interact and
communicate laughter. It stirs an emotional response bringing out a positive mood through
the exposure of humorous stimuli (Szabo, 2003). Ideally, humor can occur in any given
social situation for example in a political leader‟s speech (Martin, 2007). Socially, it is
often used as an ice-breaker to meet new people, interact, or as a form of play.
According to Martin (2007), “humor serves three functions, namely, for the purpose
of social communication, the cognitive and social benefits of the positive emotion of mirth
and its‟ influence as a tension relief and coping.” These functions translate emotions as
adaptive roles in which individuals focus their attention on environmental threats and
motivate them to deal with it (Levenson, 1994). There are four styles of humor – affiliative,
self-enhancing, aggressive and self-defeating humor. They are further categorized as either
adaptive (healthy) or maladaptive (unhealthy) in nature. When one communicates humor in
a serious and direct tone or manner, there are high risks of it resulting in embarrassment or
confrontations. This occurs formally or informally in everyday social interactions such as
spontaneous conversations (Martin, 2007). Thus, one can say maladaptive humor can cause
mixed feelings with stress and influence one‟s reaction. The positive or negative reaction is
determined according to how one comprehends the joke. Therefore, one‟s mental health can
be improved through emotion regulation which relives the stress between the
communication differences. In other words, the positive mirth replaces the depression and
feelings of anxiety, allowing one to think broadly and perform clear problem solving.
The individuals‟ different humor styles can be accounted by their individual
differences which can be attributed by their cultural backgrounds (Alonso-Rodriguez,
Carbelo-Baquero, Thorson, & Valero-Garces, 2006). Furthermore, Bilge and Saltuk (2007)

2
reported that differences in styles of humor are more observable during one‟s university
education where many personal and social exchanges take place. Thus, the purpose of this
study is to measure cultural divergence in Humor Styles and Gelotophobia among students
in Hong Kong and Indian Universities to reaffirm that humor style can vary among
different cultural groups.
Similarly, one may assume that self-esteem can be influenced by the difference in
humor styles or by cultural elements that one acquires. For instance, one may have low
self-esteem due to lack of confidence caused in situations where jokes are directed towards
one‟s weight (Hoffmeister, Teige-Mocigemba, Blechert, Klauer, & Tuschen-Caffier, 2010).
Such people may also develop a fear or grudge against humor if they are exposed to large
amounts of maladaptive humor, such as aggressive humor, thereby triggering gelotophobia.
Another element examined in this study is gelotophobia. Basically, it is defined as the fear
of humor that might be explained in terms of the styles of humor and the level of self-
esteem collectively. This study intends to measure this variable in the two above mentioned
cultures.
All in all, the meaning of humor has developed from positive mirth to more aggressive
forms of wit referring to laughter. Nowadays, people use humor for multiple purposes such
as sarcasm, satire or insults. Having said this, the significance of this study is to figure out
whether people adopt the maladaptive style of humor when communicating with others.
Moreover, some people are afraid of confronting people who say jokes simply due to their
low self-esteem. Thus, this study would like to measure and examine the humor styles,
level of self-esteem and fear of humor in two cultural groups.

3
1.1 Literature Review
1.1.1 Definition of Humor
Humor is defined as “the quality of action, speech or writing which excites
amusement; oddity, jocularity, facetiousness, comicality, fun”, according to the Oxford
English Dictionary (Simpson & Weiner, 1989). This definition refers to the humor stimulus
people say or do to make others laugh. The involvement of mental processes, the funny
jokes or creative acts of people result in an affective response drawn in the enjoyment of
laughter.
Moreover, one‟s „sense of humor‟ signifies a personality characteristic or individual
trait (Ruch, 1998). Furthermore, Ruch (1996) conceptualized „sense of humor‟ recognizing
that one understands, enjoys and laughs at others‟ jokes using it as a method to cope with
stress as a cognitive ability, an accustomed behavior or an emotion-related temperament
trait.
1.1.2 Theories of Humor
The first theory to interpret Humor is the Psychoanalytic theory. This view was the
most influential theory in humor research during the early twentieth century (Freud, 1935).
The baseline of this theory is addressing the question why people laugh (Matte, 2001).
Freud defined humor as “the highest one of the different types of defense mechanisms that
enables us to face difficult situations without being affected by unpleasant emotions and to
avoid them by maintaining a realistic perception of the situation”, (Martin, 2007). He
revealed that the release of excess nervous energy is the cause of laughter (Martin, 2007).
According to Freud, laughter is psychoanalytic in nature due to the similarity of its
fundamental dynamic of tension between the conscious and the suppressed idea and the

4
tension found in an incongruity (Matte, 2001). One can say the reason we enjoy jokes is
because of the illicit gratifying experience which allows us to satisfy our aggressive and
sexual impulses. In other words, cognitively, the jokes distract our conscience superego
mind. According to Martin (2007), Freud believed that humor occurs in stressful or
aversive situations when one experiences negative emotions like fear, anger or sadness.
Therefore, humor is referred to the tension-release function of mirth and laughter and its
use in coping with stress. Likewise, this theory explains the individual and cultural events
as the Incongruity Theory. The clear translation of this theory can be seen in stand-up
comedy. The comedians can comprehend the conscious resistance of their audience and
continuously incur ways to break down this resistance by reminding them that they are
joking (Matte, 2001).
Secondly, the Superiority/Disparagement Theory can be used to explicate the
reasons for social and emotional aspects of humor. This theory views humor as a form of
aggression which can be referred to as disparagement, aggression, or degradation (Martin,
2007). In simple words, one enjoys humor by laughing at others‟ foolishness or ridiculous
acts to spread joy. Simply, it is a form of verbal play. It emphasizes “humor as a way of
insisting a sense of victory over the people and situations that threaten us, mastery over the
circumstances of life that can otherwise oppress us and liberation from life‟s constraints”
(Martin, 2007). A positive expression of this theory includes the level of self-esteem,
feelings of competence and personal well-being in humor (Gruner, 1997).
Lastly, the Incongruity theory‟s focus is contrary to that of the
Superiority/Disparagement Theory. The former focuses on the cognitive aspect instead of
the social and emotional factors. Highlighting the meaning and perception of the jokes are
more important to determine if something is humorous (Martin, 2007). In other words,
whether a joke is truly „funny‟ or simply „lame‟ is a reaction, the Incongruity theory argues.

5
1.1.3 Styles of Humor
One‟s humor style can be accounted as their individual differences. There are four
styles of humor; each one can easily be differentiated from one another (Martin, Puhlik-
Doris, Larsen, Gray, & Weir, 2003), specifically, affiliative, self-enhancing, aggressive and
self-defeating humor.
Firstly, affiliative humor promotes and improves interpersonal and social
relationships and increases group morals, identity and cohesiveness (Klein & Kuiper,
2006). Moreover, this style of humor increases others‟ feelings of well-being and reduces
conflicts.
Secondly, self-enhancing humor always maintains a realistic yet a harmonious
perspective on life even when one faces a stressful or aversive situation. It serves to buffer
or enhance and protect oneself but not at the expense of others. As such, individuals using
this style of humor as a coping strategy to minimize negative emotions are said to benefit
the most (Klein & Kuiper, 2006).
Thirdly, the self-defeating humor attempts to gain approval of others
inappropriately to enhance their interpersonal relationships. It enables one to boost and
improve relationships at the cost of self. Klein and Kuiper (2006) declare this style is
generally used to conceal unfavorable feelings or avoid dealing with a difficulty
constructively. The visible traits of such individuals may include low self-esteem, avoidant
and emotional neediness due to the excessive use of self-disparaging humor.
Lastly, the aggressive humor serves a potentially negative impact on oneself or
others. The chances of hurting and alienating significant others or friends are high with this
kind of compulsive expressions of humor which tend to impair social and interpersonal
relationships (Martin et al., 2003). Janes and Olson (2000) state that aggressive humor is a
way one manipulates others. Aggressive humor is said to be positively related to

6
neuroticism and hostility such as anger (Martin et al., 2003). Therefore, it can be perceived
as a ridicule threat.
The four styles can be further divided into two types of humor - adaptive and
maladaptive humor. On one hand, adaptive humor is a healthy style of humor while on the
other hand; maladaptive humor is unhealthy and detrimental to oneself and others. The
positive adaptive humor styles lessen interpersonal tensions and facilitate relationships with
others by joking and bantering. Whereas, the negative maladaptive humor styles involve
teasing, ridicule, sarcasm and disparagement to put down others, thus is harmful to either
themselves or others (Klein & Kuiper, 2006).
Ziv (1984) described humor as oiling the wheels of communication and establishing
social relationships by minimizing conflicts. More specially, people could establish,
improve and increase the quality of their social relationships via humor. Wiggins (1991)
proved that the adaptive humor could increase group moral, group cohesiveness, identity
and create an enjoyment atmosphere. Adaptive humor could also reduce conflicts and
strengthen ties between individuals. Hence, it is a stress or tension relief or a coping
strategy (Martin et al., 2003). Interestingly, humor also increases and maintains creativity in
people (Rouff, 1975), increases one‟s attractiveness (Martin et al., 2003) and helps to
increase a worker‟s sense of self-actualization (Mauldin, 2008). In contrast, the hostile uses
of humor can be quite damaging and injurious in social communications. One reason for
this could be its‟ excessive usage and involvement in criticizing oneself and repression of
one‟s own emotional needs (Martin et al., 2003).

7
1.1.4 Studies of Humor
Theorists and researchers alike have adopted several perspectives reflecting humor,
its‟ styles, the fear of humor and self-esteem. For instance, academic studies have
discovered that inspirational and effective leaders have the ability to use humor (Decker &
Rotondo, 2001; Holmes & Marra, 2006; Lemer 2003). Holmes and Marra (2006)
recognized the need for humor for good leaders to be challenging. One can see how humor
can be influential in any settings.
Bilge and Saltuk (2007) compared the subjective well-being, trait anger and anxiety
in college students controlling humor styles. They reported students with affiliative and
self-enhancing humor styles scored higher in their subjective well-being and lower in trait
anger and anxiety. In contrast, students with aggressive and self-defeating humor styles had
higher trait anger scores and lower subjective well-being scores. This is to say that students
with self-enhancing and affiliative humor styles affirm a greater degree of psychological
health. Therefore, it is plausible to conclude that using healthy styles of humor increase
psychological health and well-being (Bilge & Saltuk, 2007; Martin et al., 2003; Yue, Hao,
& Goldman, 2008).
Similarly, Abel (2002) concluded that university students with high sense of humor
demonstrated less stress and anxiety than students with low sense of humor when dealing
with everyday problems. More notably, student with a good sense of humor tended to use
more positive reappraisal and problem-solving coping strategies in comparison to those
with inferior sense of humor. Likewise, humor has evidently shown to have a relationship
with pain and discomfort control and overall psychological health including a healthy self-
concept (Abel, 2002).
On one hand, Martin et al. (2003) argued individual differences are observable
when using humor to examine the following: self-esteem, optimism, mood, well-being,

8
intimacy and social support. On the other hand, Hampes (2006) found that shy people lack
the ability to relax well in social situations. His study significantly concluded the relation of
shyness and affiliative humor. All in all, the significant indication of a positive link
between shyness and self-defeating humor proves the existence of low self-esteem in shy
people.
Besides, Carbelo-Baquero, Alonso-Rodriguez, Valero-Garces and Thorson (2006)
demonstrated several differences in humor patterns of Americans and Spanish people. The
Americans scored higher on humor creativity whilst the Spanish scored higher on coping
humor. This study highlights that humor can be characteristic of culture.
There have been several humor studies measuring variables like culture, gender and
age. An Armenian study in Lebanon reported lower scores on all four of the humor styles
when compared to Belgians and Canadians (Kazariam & Martin, 2006). Additionally, the
study suggested that males used all the styles of humor significantly more than females,
especially aggressive and self-defeating humor. As stated earlier, the high aggressive
humor signaled higher individualism and lower collectivism. This study illustrates the
notion that there are cultural and perhaps, gender and age differences when evaluating
humor styles.
Since there are relatively a small number of humor studies in the Chinese society
and barely any humor studies in the Indian society, this study attempts to focus and
empirically examine humor in the two cultures.
Chen and Martin (2005) examined humor styles, coping humor and mental health of
university students in a Canadian and Chinese sample. Overall, they reported Canadians
scored significantly higher particularly on the aggressive humor than the Chinese. To be
specific, the males used more aggressive and self-defeating humor than females in the
Canadian sample. Furthermore, younger participants in both cultures were more likely to

9
use affiliative and aggressive humor. Alternatively, the collectivistic Chinese culture used
less maladaptive humor and more adaptive humor (Chen & Martin, 2005). It would be
interesting to investigate whether this culture-related finding is true for all collectivistic and
individualistic cultures.
Moreover, the Chinese university students placed high importance for the need of
humor but rated and perceived themselves low on self-humor (Yue, 2009 in press). Chinese
males considered themselves more humorous than Chinese females. In addition, Chinese
students used mostly affiliative humor and very little self-defeating humor (Yue, Hao, &
Goldman, 2008). The reason for such different findings in the Chinese culture as compared
to others might be due to the different humor they employ and exercise as Chinese humor
emphasizes on dialectic and aesthetic (Chen, 1985).
Limited literature could be found on the topic of humor in the Indian culture.
Panday (2006) referred humor as a factor responsible for health and concluded that humor
is the medicine for all sorts of health. The extremely limited research of humor in the
Indian society doesn‟t conclude that Indians don‟t have any humor at all. There have been
laughter Yoga practices in India, due to the belief that laughter is the best medicine
(Panday, 2006). Krishnamurti (2008) traced the first English-language comic „Amar Chitra
Katha‟ origins back to 1967. During the 1970s and 1980s, these comics were popular and
widely read by Indian students and South Asian children. The comics introduced themes of
religion, history and folklore. Krishnamurti (2008) expressed that the themes in the comics
from past till present are indistinct. In recent years, the Indian television has brought
standup comedians and comedy shows which cover a wide range of themes such as
political and self-enhancing jokes (Star TV, 2010). The Indian film industry transmits
messages on healthy living to the general public all over India (Star TV, 2010). This is one
of the sources where people review humor acts apart from their daily social interactions, at

10
school, work, etc. However, despite the ancient humor practice in India, there haven‟t been
many studies to examining humor styles of the Indian people.
1.1.5 Definitions of Gelotophobia
Affirming to the notion that humor in social interactions provides numerous benefits
such as a stress relieve and coping, Ruch (2009) proclaimed “there is a narrow gap
differentiating the use and abuse of humor”. Crossing the fine line may cause one to abuse
humor. This implies that some people instead of enjoying humor may fear it. Laughter, a
positive emotional expression has shown to be primarily associated with the phobia of
being laughed at (Ruch, Proyer, & Popa, 2008).
Dr. Micheal Titze introduced the term Gelotophobia (1996) after verifying cases of
fear-related humor consequences from social contacts. In simple words, the definition of
gelotophobia is the fear of being laughed at (Ruch, 2009). The formation of this term came
about from the word gelos and phobia which means laughter and fear respectively. It is
seen as a type of social phobia and has been a study of interest in recent years (Ruch &
Proyer, 2008a). Furthermore, Gelotophobia results from the menacing effect of laughing
with others making them deeply frightened. This can create serious disturbances and hence,
affecting the closeness and intimacy of their social relationships (Titze, 2009).
Ruch (2009) discovered that bullying or laughing at others frequently occurs in
settings such as school or work place, where gelotophobia might result. Ruch and Proyer
(2008) suggested that gelotophobia can be studied among psychiatric patients as well as
normal individuals. Therefore, this study also aims to measure the presence of fear of
laughter in university students in Hong Kong and India.

11
1.1.6 Theories of Gelotophobia
Gelotophobia arises due to the repetition of being ridiculed during one‟s childhood
and adolescence and referred to as traumatic incidents (Ruch, 2009). A clear explanation of
this is illustrated in Titze‟s model of „the putative causes and consequences of
Gelotophobia‟ (Ruch, 2004). The theoretical approach describes the causes of gelotophobia
as the experiences of not being taken seriously or being laughed at during childhood, youth
and adulthood. These causes are a result of the under-development of interpersonal bridge
from the primary shame during infancy. Such that, causes like these lead to the
development of Gelotophobia and one becomes afraid of humor. People tend to have
several consequences when they develop the fear of laughter. These include social
withdrawal, low self-esteem, lack of social competences, lack of liveliness and appear
humorless. Sometimes, they suffer from psychosomatic disturbances such as trembling,
blushing or Pinocchio-syndrome (Ruch, 2004). On the whole, this framework clearly
clarifies individual formulation of Gelotophobia and its outcomes.
1.1.7 Studies of Gelotophobia
The research in the area of Gelotophobia is very recent and limited. Of the few
studies conducted, Ruch, Proyer and Popa (2008) reported that women scored higher than
men in gelotophobia in Romania. Likewise, this study depicted a slight sign of
Gelotophobia in 13% of university students.
In contrast, Platt, Proyer and Ruch (2009) assessed gelotophobia in bullied victims
by stating that emotions in teasing experiences are related to ridicule-type scenarios. They
discovered that 13% of the participants exceeded the indicating gelotophobic symptom
scores with 10% of them having slight, 2% with pronounced and 1% with extreme

12
expressions of gelotophobia. Interestingly, age and gender weren‟t correlated to
gelotophobia (Platt, Proyer, & Ruch, 2009; Ruch & Proyer, 2008).
Ruch and Proyer (2009) studied the position of gelotophobia in the Eysenckian
PEN-model. They concluded that to a certain extent the personality of gelotophobes can be
described as introverts and neurotics. This study‟s sample also revealed 12.61%
gelotophobes. They also detected that younger participants scored higher in gelotophobia
stating with a significant correlation (r = -.16, p < .05).
Conversely, Platt (2008) reported that gelotophobes‟ perception is blurred when
differentiating playful and good-natured teasing as they can‟t identify the safe and non-
threatening quality of these teasing situations. Another study supported that emotion-related
traits are involved in the comprehension of the fear of laughter (Papousek, Ruch,
Freudenthaler, Kogler, Lang, & Schulter, 2009). They analyzed intrapersonal skills such as
the „regulation of one‟s emotions‟ and the „control over the expression of emotions‟ can
predict gelotophobia.
Lastly, Ruch and Proyer (2008a) realized that some gelotophobes can be agents or
targets of being laughed at or laughing at others despite knowing the harmful effects. There
have been signs showing that gelotophobia can be related to intense childhood memories,
for instance, being laughed at by peers.
1.1.8 Definitions of Self-Esteem
A crucial element for one‟s mental health is having positive regard for the self
(Taylor & Brown, 1988). This is to say that a relatively good self-esteem is fundamental for
one‟s psychological wellbeing (Martin, 2007). The definition of self-esteem is “the degree
to which one values their self-image or the amount of approval one has for the self-
concepts they hold about oneself” (Rosenberg, 1979). In other words, self-esteem is a
13
construct derived from individual assessment of one‟s value and worth (Kwan, Bond &
Singelis, 1997). One can comprehend self-esteem as an evaluative judgment of self-
knowledge which can be ranged from negative to positive (Kling, Hyde, Showers, &
Buswell, 1999).
1.1.9 Theories of Self-Esteem
There are three major theories of self-esteem. Firstly, the Social Identity theory
states that one has to have consensus about the value of the attributes that make up social
identity (Corenblum & Annis, 1993). Group comparisons are made very often in our daily
lives. Therefore, it is very important to stand up for your own group and to show the sense
of belonging to that group. Additionally, the social identity theory refers to the knowledge
of one‟s attitude towards another racial group (Hogg & Abrams, 1988). This can be seen in
various cases such as in majorities and minorities whether they are people of a different
culture living in a completely different country or in social groups. For example, a winning
basketball team maintains its dominant position; its members and fans acquire positive
group identity.
Similarly, cultural differences can be a function of self-concept. Different aspects of
the self are associated with Individualism and Collectivism (Twenge & Crocker, 2002).
Individualism tends to focus on personal goals, uniqueness and personal control and the
opposite is for collectivistic cultures. However, with these differences seen across the
geographical regions, this study examines two collectivistic cultures. One may think there
may not be any differences in the level of self-esteem or humor since they belong to the
similar backgrounds. Therefore, to see if this is true or not, this present study would like to
test whether there are differences in these two areas.

14
1.1.10 Studies of Self-Esteem
Self-esteem is a relevant construct in collectivism (Kling, Hyde, Showers, &
Buswell, 1999). Cultures like India have shown high self-esteem is related to low
depression and less difficult relations with parents (Hojat, Borenstein, & Shapurian, 1990;
Kamath & Kanekar, 1993). In the Indian culture, parental rejection is related to low self-
esteem (Hojat et al., 1990). It is said that self-esteem should predict group attitudes
however; results conclude that the relationship is different for majority and minority group
children (Corenblum & Annis, 1993). Additionally, in terms of personality, Kwan, Bond
and Singelis (1997) found a corelation between self-esteem and Neuroticism, Extraversion,
Openness to Experience and Conscientiousness across cultures.
Studies show that females have substantially lower self-esteem than males (Kling,
Hyde, Showers, & Buswell, 1999). Hampes (2006) discovered a link between shyness and
self-defeating humor as a result a large part was due to low self-esteem of the shy people.
In other words, the chances for shy people to use self-defeating humor are higher than the
other three styles. Moreover, adaptive styles of humor contribute to elevated mood, high
self-esteem, optimism, relationship satisfaction and social support (Martin, 2007).
1.1.11 Relationship between Humor, Gelotophobia and Self-Esteem
Thorson (2006) stated language and cultural elements influence ways by which national
groups construe humor, for instance, different elements of humor might be characteristic of
a particular culture group. Maslow (1954) and Vaillant (1977) viewed affiliative and self-
enhancing humor styles as indicative of mental health, meaning psychological health
encompasses subjective well-being, wellness and a sense of humor alike (Bilge & Saltuk,
2007). As mentioned earlier, there was a correlation between shy peoples use of self-
defeating humor indicating their low self-esteem level (Hampes, 2006). Moreover,
15
gelotophobes have shown to be introverts (Ruch & Proyer, 2009) and indirectly indicating
their possible low self-esteem. However, this needs to be further verified.
1.2 Research Questions and Hypotheses
Chinese students consider humor as an important element in daily interactions (Yue,
2009). A question whether there are any similarities within the collectivistic cultures being
measured arises. Chen and Martin (2005) revealed that students of collectivistic cultures
used more affiliative and self-enhancing humor than the aggressive and self-defeating
humor. This is proven in the Chinese culture; hence, one objective of this current study is to
examine and highlight if this is true to the Indian culture as well. Moreover, Martin (2007)
reported that Chinese students with low self-esteem tend to used more aggressive and self-
defeating humor. People with low self-esteem also tend to show slight expressions of
gelotophobia (Martin, 2007; Ruch & Proyer, 2009). This study aims to investigate whether
self-esteem, culture or gelotophobia are factors that are dependent on any of the four humor
styles (Independent variable). It also intends to measure gelotophobia as the independent
variable, and self-esteem, culture and the four humor styles as the dependent variables.
Based on the above reviewed literatures and current background of the two cultures,
India and Hong Kong, the following research questions would like to be addressed in this
present study: Firstly, “How the Chinese differ from the Indians in terms of their humor
styles?” Secondly, “Chinese people have shown to use more affililative and self-enhancing
humor and less aggressive and self-defeating humor; do Indians exhibit similar behaviors
seeing that both are collectivistic cultures?” Thirdly, “Are there any differences in the level
of Self-Esteem in the two cultures?” If so, “is there a relation between students with lower
self-esteem and their uses of maladaptive humor styles?” Fourthly, “Is there a relation
between the students with lower self-esteem level and signs of gelotophobia?” Lastly, “Is
16
there any distinctive differences between the students who show at least slight expressions
of Gelotophobia and their use of Humor Styles?”
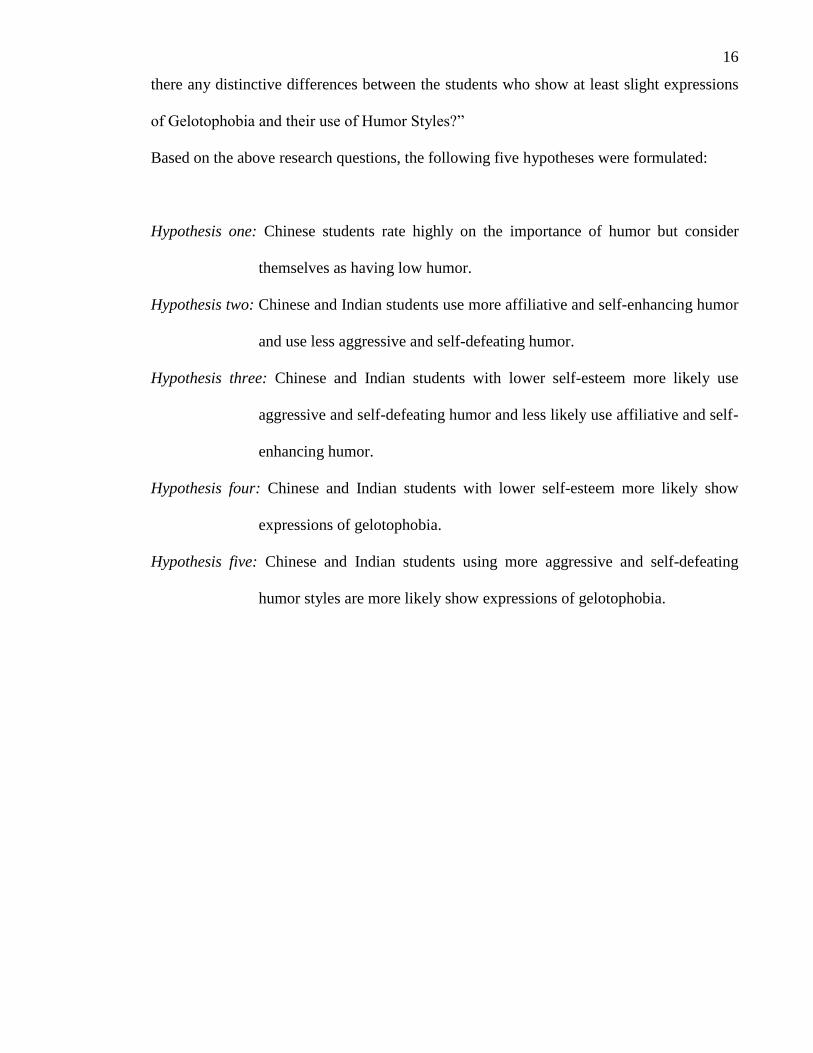
Based on the above research questions, the following five hypotheses were formulated:
Hypothesis one: Chinese students rate highly on the importance of humor but consider
themselves as having low humor.
Hypothesis two: Chinese and Indian students use more affiliative and self-enhancing humor
and use less aggressive and self-defeating humor.
Hypothesis three: Chinese and Indian students with lower self-esteem more likely use
aggressive and self-defeating humor and less likely use affiliative and self-
enhancing humor.
Hypothesis four: Chinese and Indian students with lower self-esteem more likely show
expressions of gelotophobia.
Hypothesis five: Chinese and Indian students using more aggressive and self-defeating
humor styles are more likely show expressions of gelotophobia.

17
2. METHODOLOGY
2.1 Participants
The participants of the present study were sampled from universities in Hong Kong
and India at a random basis, consisting of a total of 203 undergraduate students (57.6 %
females, 42.4 % males) with a mean age of 20.82 years old. The Chinese undergraduate
students were sampled from the University of Hong Kong, the City University of Hong
Kong and the Chinese University of Hong Kong, consisting of 101 students ( 24.8% males,
75.2% females) with a mean age of 20.57 years old (SD= 1.53). The Indian undergraduates
were sampled from the University of Mumbai, the Amity University (Noida), the
University of Chennai and the University of Calcutta, consisting of 102 students (59.8%
males, 40.2% females) with a mean age of 21.06% years old (SD= 1.69). The participants
in both cultures were selected randomly from different faculties and different years to avoid
a possible subject bias. The participants were invited to complete a questionnaire on a
voluntary basis.
2.2 Questionnaire
The questionnaire used in the present study consisted of three different standardized
questionnaires. In part A, participants were required to rate (1) the importance of humor
according to them, and (2) their self-humor, on a 10-point Likert scale (1=lowest;
10=highest). They also were required to nominate up to three most humorous people in
their own culture and give up to three reasons for their nomination, plus, up to three reasons
of why they would dislike humor.
Part B included the Rosenberg Self-Esteem scale (RSE), which consists of 10-item
general statements about the self in which participants had to self-rate the items on a 4-

18
point Likert scale ranging from strongly agree to strongly disagree such that the scores
ranged from 10 to 40. This scale has been widely used and has shown good reliability and
validity (Greenberger, Chen, Dmitrieva, & Farruggia, 2003; Rosenberg, 1965).
Furthermore, an acceptable reliability rate of Cronbach‟s Alpha was recorded (α = .74) to
account for the reliability in both the culture groups of the present study.
Part C consisted of the Humor Styles Questionnaire (HSQ-32) which examines the
four humor styles: self-enhancing humor, affiliative humor, self-defeating humor and
aggressive humor. It comprised of four 8-item scales and participants had to rate on a 7-
point Likert scale sub-ranging from totally disagree to totally agree. The HSQ-32 has
proven to be highly consistent with internal consistencies (Cronbach α) of .80 for
affiliative, .81 for self-enhancing, .77 for aggressive and .80 for self-defeating humor
respectively and test re-test reliability coefficients as .81 to .85 (Bilge & Saltuk, 2007; Chen
& Martin, 2007; Kazarian, 2006; Martin et al. 2003). According to this current study‟s
sample, the overall recorded Cronbach‟s Alpha was acceptable (α = .74) suggesting that
this scale was reliable to use as an instrument.
Part D included the Gelotophobia scale (GELOP-15) which measures the subjective
experience of the fear of being laughed at. This scale consists of 15 statements describing
the world of gelotophobes. Participants were required to rate the 15 statements on a 4-point
Likert scale ranging from 1 (Strongly disagree) and 4 (Strongly agree). An individual
scoring on average 1 to 2 shows no signs of Gelotophobia and 2 to 2.50 portray borderline
fear. Similarly, if one‟s average score exceeds 2.50, 3 or 3.50, they indicate slight,
pronounced, and extreme expression of gelotophobia respectively (Ruch & Proyer, 2008b).
The scale shows high internal consistency of .95 for normals and .90 for gelotophobes
(Ruch & Proyer, 2008b). Moreover, Cronbach‟s Alpha was according to this study‟s
sample was very good (α = .84) confirming that this scale is reliable.

19
Finally, Part E required participants to fill in several demographic variables about
themselves such as age, gender, height, weight, nationality, university they study at, the
year of study and course of study.
2.3 Procedure
Participants were invited to participate at purely a voluntary and anonymous basis.
This designed questionnaire including of 5 parts took approximately 15 minutes to
complete. It was in English language; however, some difficult words were translated into
simplified Chinese characters for the Chinese subjects. They were free to ask questions
regarding the questionnaire for clarifications. Prior to filling out the questionnaire, they
were informed of the purpose of the research study and were assured the information they
will provide will be considered as strictly confidential and destroyed after the research.
Also, after filling out the questionnaire, the participants were debriefed about the aim of the
study. Furthermore, the collected data were inputted into Statistical Package for the Social
Sciences Version 17.0 (SPSS) to analyze the data. The data were then analyzed using
SPSS, Independent t-tests, Repeated measures ANOVA, Univariate analysis of variance,
Pearson correlation and Regression.

20
3. RESULTS
3.1 Descriptive Statistics of the Demographic Variables of the Present Study
Table 1 Demographic Information of the Participants (N=202)
N Percentage
Gender Male 86 42.4
Female 117 57.6
Age Below 20 95 46.8
21 and above 108 53.2
Nationality Chinese 101 49.8
Indian 102 50.2
Education Level Year 1 74 36.5
Year 2 48 23.6
Year 3 31 15.3
Year 4 26 12.8
Year 5 16 7.9
Table 1 displays the demographic data of the present study, including the
participants‟ gender, age, nationality and educational level. More females (57.6%) were
sampled than males (42.4%). The participants ranged from 18 to 26 years old. 46.8% of
them aged from 18 to 20 years (N = 95); 53.2% aged 21 and above (N = 108). Majority of
them were in Year 1 (N = 74; 36.5%) and the least were in Year 4 or 5 (N = 42; 20.7%).
Lastly, the two main target groups of this study are Chinese (N = 101) and Indians (N =
102), hence, 49.8% and 50.2% respectively.

21
3.2 Ratings and Perception of Humor
3.2.1 Ratings of Importance of Humor and Self-Humor
Table 2 Means and Standard Deviations for Rating of Importance of Humor and of Self-
Humor in Chinese and Indians
Chinese
(n = 101)
Indians
(n = 102)
M SD M SD t-value
Importance of
Humor
7.36 1.46 7.95 2.24 -2.19*
Self-Humor 5.58 1.64 7.08 1.67 -6.39***
Note: *p<.05; **p<.01; ***p<.001
Table 3 Means and Standard Deviations for Rating of Importance of Humor and of Self-
Humor in Males and Females
Males
(n = 86)
Females
(n = 117)
M SD M SD t-value
Importance
of Humor
7.60 2.32 7.70 1.52 .74
Self-Humor 6.94 1.94 5.88 1.59 4.11***
Note: *p<.05; **p<.01; ***p<.001
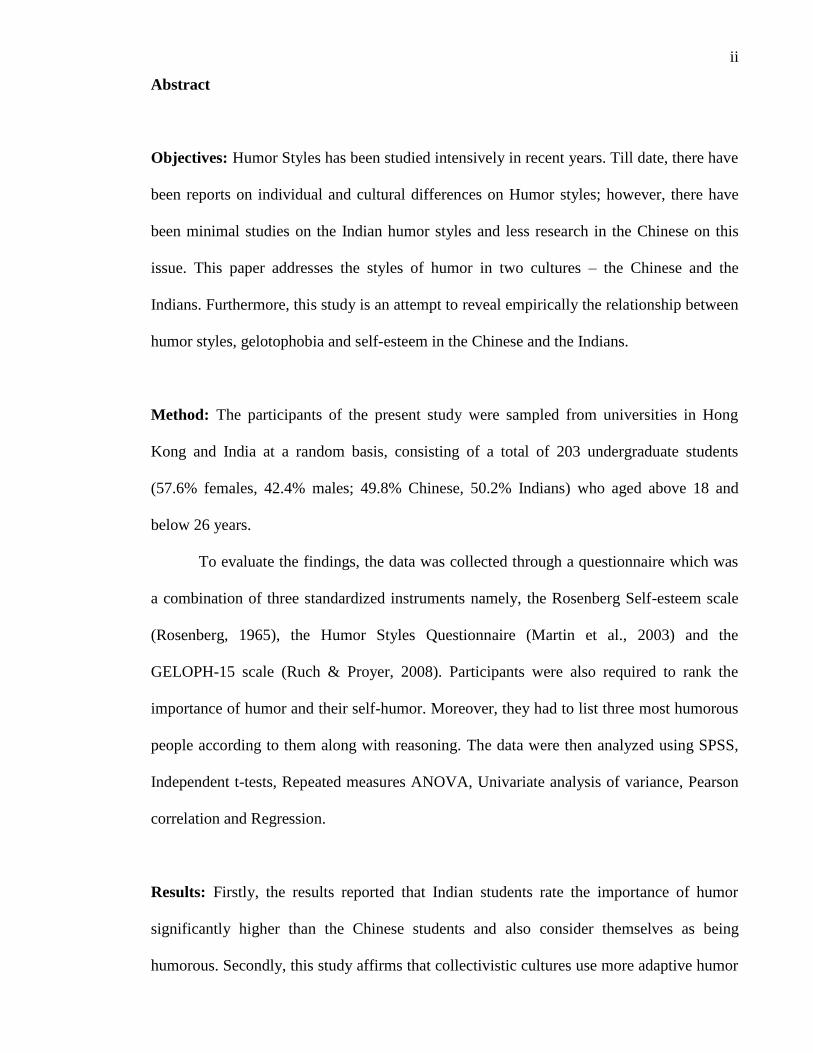
Figure 1. Ratings of importance of humor and self-humor.
Tables 2, 3 and Figure 1 summarize the ratings of the importance of humor and self-
humor among the university students. To compare the above ratings Independent t-tests
were run. In both samples, respondents rated quite high on the importance of humor (M =
7.36 for the Chinese sample and M = 7.95 for the Indian sample). But the ratings for the
Mean
scores

22
Indian samples are significantly higher than the Chinese on the rating of importance of
humor (t = -2.19, p < .05). No significant gender difference is found. Similarly, the ratings
of self-humor for the Indian sample are significantly higher than for Chinese sample (t = -
6.39, p < .001). In addition, males rated their self-humor significantly higher than females (t
= 4.11, p < .001). These findings offer good support to Hypothesis one, suggesting that
Indian students rated the importance of humor significantly higher than the Chinese and
considered themselves more humorous than the Chinese. They also suggest that male
students in both samples considered themselves more humorous than females, which has
been reported in previous studies (Yue, 2009).
3.3 Nomination of Best Humorists
3.3.1. Nomination of Best Humorists by Chinese and Indian Students
Table 4 Nomination of Humorists by Chinese and Indian Undergraduates
Chinese Indian
Humorists
Nominated
Ranking Percentage Humorists
Nominated
Ranking Percentage
Comedians 1 68.8 Actors 1 27.7
Artists 2 6.7 Comedians 2 21.0
Actors 3 3.2 Politicians 3 4.5
Teachers 4 2.4 TV hosts/DJ 4 1.3
TV
hosts/DJ
5 0.4
Others 6 18.6 Others 5 45.5
Note: Others include unknown family members, friends and unidentifiable people
Table 4 presents the categories and percentages of the most frequently nominated
humorists in the two samples. The Chinese students mostly selected comedians (68.8%)

23
followed by artists (6.7%), actors (3.2%), teachers (2.4%), TV hosts or DJs (.4%). The
Indian students selected actors the most (27.7%), followed by comedians (21%), politicians
(4.5%), TV hosts or DJs (1.3%). These categories show that the undergraduates in both
cultures nominate comedians, actors and artists the most when it comes to the selection of
humorists.
Table 5(a) Ranking of the Top Ten Humorists Nominated by Hong Kong Chinese
Undergraduates
Humorists Nominated Occupation Ranking Percentage
Stephen Chow Actor/Comedian 1 27.6
Wong Chi Wah (Dayo)
Actor/Comedian 2 24.4
Jim
Actor/Comedian 3 5.5
Jan Lam
Actor/Comedian 4 5.1
Eric Tsang Comedian 5 3.5
Sum Mei Artist 5 3.5
Sammi Cheng Artist 6 2.8
Dennis Ip Teacher 7 2.4
Ronald Cheng Comedian 8 1.6
Wong Jo Nam Actor 8 1.6
Total 78
Table 5(b) Ranking of the Top Ten Humorists Nominated by Indian Undergraduates
Humorists Nominated Occupation Ranking Percentage
Johnny Lever Actor/Comedian 1 8.0
Raju Srivastav
Comedian 1 8.0
Paresh Rawal
Actor/Comedian 2 5.4

24
Russel Peters
Comedian 3 4.9
Rajpal Yadav Actor/Comedian 4 4.5
Laloo Prasad Yadav Ex-Railway Minister 5 4.0
Akshay Kumar Actor 6 2.2
Javed Jafri Actor/Comedian 7 1.8
Mir Comedian 7 1.8
Shah Rukh Khan Actor 7 1.8
Total 42.4
Tables 5(a) and 5(b) show the ten most frequently nominated humorists by the
Chinese and Indian undergraduates respectively. The nominated Chinese humorists are
mostly comedians, actors, artists and a teacher which consists of 78% of the total
nominations; whereas, the nominated Indian humorists are mostly actors, comedians and a
high-marking politician in India, comprising of 42.4% of the total nominations. The
percentage of the nomination of the top ten humorists for the Chinese sample is much
higher than that for the Indian sample. Moreover, the nominated humorists in both cultures
are mostly locals in their own respective countries, except for Russel Peters in the Indian
sample, who is a Canadian-Indian. Such that, Stephen Chow, Wong Chi Wah (Dayo), Jim,
Jan Lam and Eric Tsang were reported among the top five voted humorists similar to past
studies (Yue, 2009). In addition, Johnny Lever, Raju Srivastav, Paresh Rawal, Russel
Peters and Rajpal Yadav are among the top five voted humorists by the Indian
undergraduates. Johnny Lever, Paresh Rawal and Rajpal Yadav are Bollywood‟s comedian
actors and have acted in a comic role in numerous films, whereas, Raju Srivastav and
Russel Peters are famous standup comedians. Raju Srivastav is mostly seen on Indian

25
television where he delivers his standup comedies and Russel Peters is a Canadian-Indian
standup stage comedian.
3.3.2. Reasons of Nomination for Best Humorists
Table 6 Top 10 Reasons for Selecting Best Humorists
Reasons Ranking Percentage
Funny 1 25.1
Actions, Body language, Facial
Expression
2 13.2
Creative 2 13.2
Talking style and Dialogues 3 8.2
All humor styles 4 7.4
Ability to entertain and make others
laugh
5 6.6
Comedians 6 5.8
Standup comedy 6 5.8
Lame jokes 7 4.5
Imitation and mocking 8 3.3
Furthermore, this present study evaluates the reasons of selecting the best humorists
in both cultures as reported in Table 6. The most commonly reported reason of nominating
the best humorists is funny (25.1%). 26.4% of the students mentioned the characteristics
include the actions, body language, facial expression and creativity that makes one
humorous. 8.2% recalled the talking styles, tones and dialogues when choosing their best

26
humorists. Lastly, 7.4% of the total sample enjoys the humor styles their humorists acquire
which enabled them to select their humorists.
3.4 Reasons for Disliking Humor
Table 7 Top 10 Reasons for Being Afraid or Dislike Humor
Reasons Ranking Percentage
Hurtful 1 23.6
Lame jokes 2 21.6
Embarrassing 3 11.2
Offending 4 10.8
Inappropriate situation 5 8.8
Crosses the line 6 6.8
Misunderstandings 7 4.4
Racism 8 3.2
Inappropriate timing 9 2.0
Sex-related jokes 10 1.6
Table 7 explores the reasons for being afraid or disliking humor. A total of 23.6% of
the samples are afraid or dislike humor because it can be hurtful to others or themselves.
21.6% are afraid or dislike humor when people make lame jokes or when jokes aren‟t
funny. 22% of the total sample are afraid or dislike humor when jokes are embarrassing and
offending. Other reasons includes, joking in an inappropriate situation, when one crosses
the line, when misunderstanding results, racism jokes, inappropriate timing and sex-related
jokes. This finding aids one to comprehend why one would be afraid or dislike humor.

27
3.5 Self-Esteem
3.5.1 Level of Self-Esteem among Chinese and Indian University Students
Table 8(a) Means and Standard Deviations of Self-Esteem Level by Nationality and Gender
Male
(n = 25)
Female
(n = 76)
M SD M SD t-value
Chinese (N = 101) 22.68 4.74 21.00 3.64 1.62
Male
(n = 61)
Female
(n = 41)
M SD M SD t-value
Indians (N = 103) 20.77 4.59 20.05 4.86 -.289
Note: *p<.05; **p<.01; ***p<.001
Table 8(b) Means and Standard Deviations of Self-Esteem Level by Nationality and Age
Age
(18-20)
Age
(21-26)
M SD M SD t-value
Chinese (N = 101) 22.27 3.80 20.51 4.00 2.26*
Indians (N = 103) 20.65 4.28 21.05 4.99 -.434
Note: *p<.05; **p<.01; ***p<.001
Tables 8(a) and 8(b) includes the mean scores and standard deviation of the level of
self-esteem by nationality, gender and age. Despite, the mean scores of the level of self-
esteem in the Chinese sample was higher than the Indian sample in terms of gender
differences, no significant results were recorded. Additionally, to examine the age
differences in the self-esteem scale, two groups were formed using the median of the age in
the two samples, i.e. below 20 and above 21. The data were analyzed by Independent t-tests
on the self-esteem scale. As a result, Indian students older than 21 years show slightly
higher self-esteem than students younger than 20 years, but no significant results were
found. Evidently, Chinese students aging from 18 to 20 years show significantly higher
level of self-esteem than in students aging from 21 to 26 years (t = 2.26, p < .05). This

28
finding suggests that younger students display higher levels of self-esteem than older
students in the Chinese sample according to this present study. In addition, a Univariate
analysis of variance was performed to explore further. The main effect of gender,
nationality and age were not significant (p > .05), but all the interaction effects were
significant, (F (1, 195) = 4.35, p < .05).
3.6 Humor Styles
3.6.1 Humor styles in Chinese and Indian society
Table 9(a) Comparison in the Use of Humor Styles among the Chinese and Indian
University Students
Chinese
(n = 101)
Indians
(n = 102)
M SD M SD t-value
Affiliative Humor 36.91 6.75 39.75 8.92 -2.55*
Self-enhancing
Humor
32.89 6.79 36.54 7.99 -3.51***
Aggressive Humor 29.74 4.93 28.91 6.83 .99
Self-defeating
Humor
32.08 5.48 30.52 7.43 1.70
Note: *p<.05; **p<.01; ***p<.001
Table 9(b) Comparison in the Use of Humor Styles among the Chinese and Indian
University Students
Note: *p<.05; **p<.01; ***p<.001
Affiliative
Humor
Self-
enhancing
Humor
Aggressive
Humor
Self-
defeating
Humor
M SD M SD M SD M SD F-value
Total
(N=203)
38.34 8.02 34.72 7.63 29.33 5.96 31.30 6.57 75.42***
Chinese
(N=101)
36.91 6.75 32.89 6.80 29.74 4.93 32.08 5.49 32.03***
Indian
(N=102)
39.75 8.92 36.54 7.99 28.91 6.83 30.52 7.43 49.33***

29
Figure 2. Means of humor styles across culture.
Tables 9(a), 9(b) and Figure 2 illustrate the four different humor styles in both
samples, Chinese and Indians. The data were analyzed by Independent t-test and ANOVA
(repeated measures) test to determine the significant differences among the four humor
styles. Firstly, the outcome notes with satisfaction that both the cultures use healthy styles
of humor significantly more than unhealthy styles of humor. Therefore, clearly
emphasizing that both the collectivistic cultures, Chinese and Indian, use the affiliative and
self-enhancing humor styles more than the aggressive and self-defeating styles of humor (F
(3, 606) = 75.42, p < .001) as also proven in previous studies (Yue, Hao, Lan & Yan, 2006;
Yue, Hao & Goldman, 2002: Paper presented). This finding affirms and strongly supports
Hypothesis three, indicating that Indians use adaptive styles of humor more than
maladaptive styles. Secondly, the Indian undergraduate students used affiliative and self-
enhancing humor styles significantly more than the Chinese (t = -2.55, p < .05; t = -3.51, p
= .001). To elaborate more, the Indians used the healthy humor styles significantly more
when comparing with the Chinese (F (3, 303) = 49.33, p < .001). Furthermore, the Chinese
used the unhealthy humor styles significantly more than the Indians (F (3, 300) = 32.03, p <
.001). This finding confirms Hypothesis four, proving that the Chinese students use the
maladaptive humor styles more than the Indians. In conjunction, a Univariate analysis of
variance was performed for all the humor styles. The results indicated the main effect of
nationality with self-enhancing humor was significant, (F (1, 195) = 11.7, p =.001). And, in
Mean
scores
Humor styles
30
terms of aggressive humor, the main effect of gender was significant, (F (1, 195) = 3.97, p
< .05). All the interaction effect was not significant.
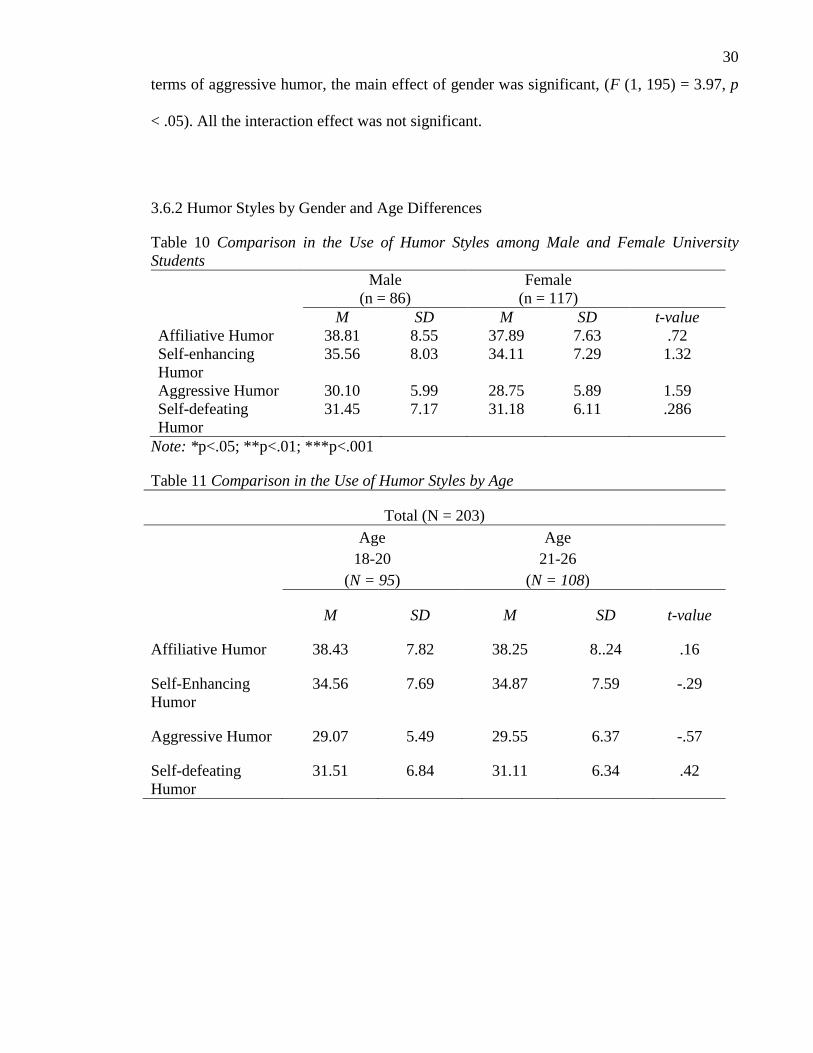
3.6.2 Humor Styles by Gender and Age Differences
Table 10 Comparison in the Use of Humor Styles among Male and Female University
Students
Male
(n = 86)
Female
(n = 117)
M SD M SD t-value
Affiliative Humor 38.81 8.55 37.89 7.63 .72
Self-enhancing
Humor
35.56 8.03 34.11 7.29 1.32
Aggressive Humor 30.10 5.99 28.75 5.89 1.59
Self-defeating
Humor
31.45 7.17 31.18 6.11 .286
Note: *p<.05; **p<.01; ***p<.001
Table 11 Comparison in the Use of Humor Styles by Age
Total (N = 203)
Age
18-20
(N = 95)
Age
21-26
(N = 108)
M SD M SD t-value
Affiliative Humor 38.43 7.82 38.25 8..24 .16
Self-Enhancing
Humor
34.56 7.69 34.87 7.59 -.29
Aggressive Humor 29.07 5.49 29.55 6.37 -.57
Self-defeating
Humor
31.51 6.84 31.11 6.34 .42

31
Chinese (N = 101)
Age
18-20
(N = 52)
Age
21-26
(N = 49)
M SD M SD t-value
Affiliative Humor 36.59 6.84 37.24 6.71 -.48
Self-Enhancing
Humor
33.21 6.69 32.55 6.96 .49
Aggressive Humor 29.90 3.74 29.57 5.98 .33
Self-defeating
Humor
33.13 5.13 30.95 5.69 .30*
Indian (N = 102)
Age
18-20
(N = 43)
Age
21-26
(N = 59)
M SD M SD t-value
Affiliative Humor 40.65 8.41 39.08 9.29 .88
Self-Enhancing
Humor
36.19 8.56 36.79 7.62 -.37
Aggressive Humor 28.06 6.97 28.06 6.97 -1.06
Self-defeating
Humor
29.53 8.09 31.24 6.88 -1.12
Note: *p<.05; **p<.01; ***p<.001
Tables 10 and 11 present the means and standard deviations of each of the four
styles. They include results for the whole sample as well as each culture, gender and the
two age groups separately. From the total sample and individual samples, males used all the
four styles more than females. No significant gender difference was found. Likewise, non-
significant results were recorded in both samples in terms of age except for the Chinese
32
Self-defeating humor style. Chinese participants below the age of 20 showed higher means
of using the self-defeating style than participants above the age of 21 (t = .30, p < .05).
Thus, younger Chinese participants proclaim a higher tendency to utilize self-disparaging
humor as assessed by the self-defeating humor scale.
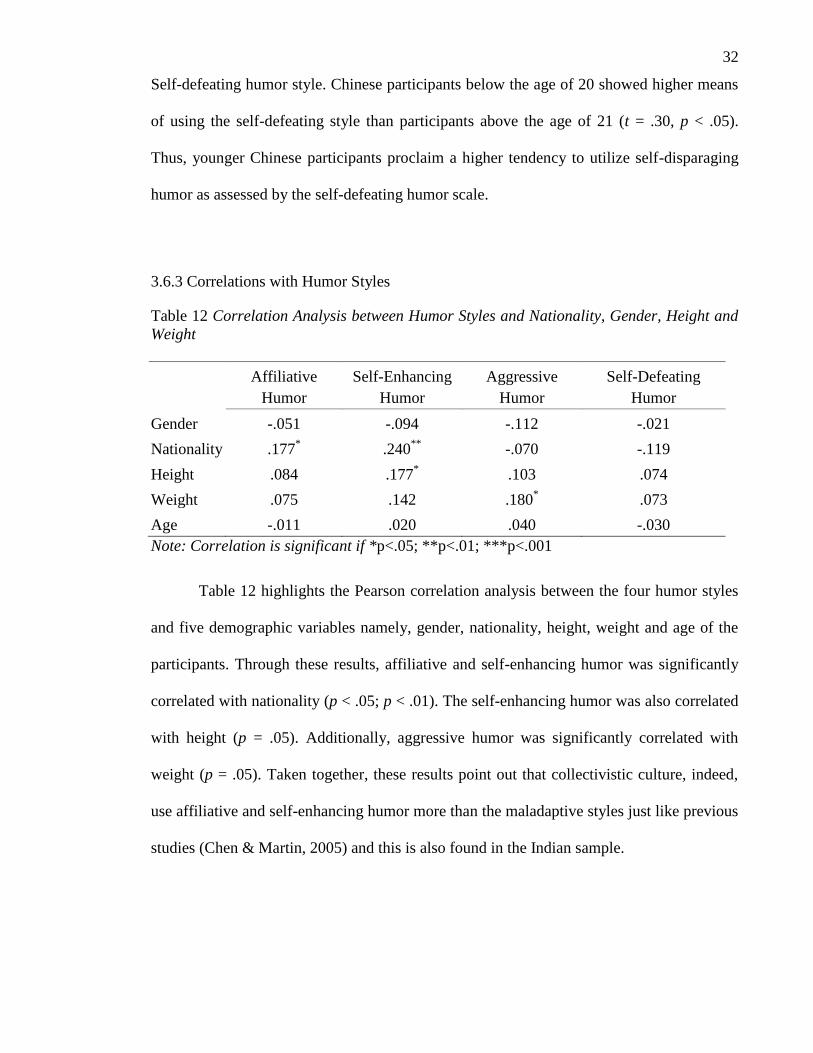
3.6.3 Correlations with Humor Styles
Table 12 Correlation Analysis between Humor Styles and Nationality, Gender, Height and
Weight
Affiliative
Humor
Self-Enhancing
Humor
Aggressive
Humor
Self-Defeating
Humor
Gender -.051 -.094 -.112 -.021
Nationality .177* .240
** -.070 -.119
Height .084 .177* .103 .074
Weight .075 .142 .180* .073
Age -.011 .020 .040 -.030
Note: Correlation is significant if *p<.05; **p<.01; ***p<.001
Table 12 highlights the Pearson correlation analysis between the four humor styles
and five demographic variables namely, gender, nationality, height, weight and age of the
participants. Through these results, affiliative and self-enhancing humor was significantly
correlated with nationality (p < .05; p < .01). The self-enhancing humor was also correlated
with height (p = .05). Additionally, aggressive humor was significantly correlated with
weight (p = .05). Taken together, these results point out that collectivistic culture, indeed,
use affiliative and self-enhancing humor more than the maladaptive styles just like previous
studies (Chen & Martin, 2005) and this is also found in the Indian sample.

33
3.7 Gelotophobia
3.7.1 Gelotophobia by Culture, Gender and Age
Table 13(a) Gelotophobia by Culture
Chinese
(n = 101)
Indians
(n = 102)
M SD M SD t-value
Gelotophobia 35.87 6.14 32.98 8.13 2.86**
Note: *p<.05; **p<.01; ***p<.001
Table 13(b) Gelotophobia by Gender
Chinese Indians
Males Females Males Females
M SD M SD t-
value
M SD M SD t-
value
Gelotophobia 36.08 7.40 35.80 5.71 .17 32.83 7.78 33.19 8.73 -.21
Note: *p<.05; **p<.01; ***p<.001
Table 13(c) Gelotophobia by Age
Age
18 - 20
Age
21-26
M SD M SD t-value
Gelotophobia 35.66 7.57 33.32 6.98 2.8*
Note: *p<.05; **p<.01; ***p<.001
Figure 3. Means of gelotophobia across culture.
Mean
scores

34
Figure 4. Means of gelotophobia across age.
Tables 13(a), 13(b), 13(c), Figure 3 and Figure 4 reveal the result of gelotophobia of
this current study in terms of culture, gender and age. On the whole, the Chinese students
had slightly higher significant mean scores than the Indians on the scale (t = 2.86, p < .01).
Similarly, significant results were found in terms of age differences. Participants younger
than 20 years old scored higher than participants older than 21 (t = 2.8, p < .05). In contrast,
no significant gender differences were adopted just like other studies (Platt, Proyer & Ruch,
2009; Ruch & Proyer, 2008b). Moreover, more Chinese participants showed slight and
pronounced expressions of gelotophobia (29.8%, 8%) than for the Indian participants
(24.4%, 5%) and 1% of the Indian sample reflected an extreme expression of gelotophobia
by exceeding the cut-off scores. This indicates that the Chinese demonstrate signs of the
fear of laughter more than Indians. Ultimately, a univariate analysis of variance was also
run to explain the effects of Gelotophobia further. The results suggest a main effect of age
was significant, (F (1, 195) = 5.76, p = .017). The main effect of nationality was also
significant, (F (1, 195) = 7.53, p = .007). However, all the interactions were not significant.
Mean
scores

35
3.7.2 Correlations with Gelotophobia
Table 14 Correlation Analysis between Gelotophobia and Nationality, Gender, Height and
Weight
Note: Correlation is significant if *p<.05; **p<.01; ***p<.001
Table 14 expresses the Pearson correlation analysis of gelotophobia with the
demographic variables such as nationality, gender, height, weight and age. The findings
recognize a significant correlation with nationality and age (p < .01; p < .05). Thus, as
reported by other studies, gender has no impact on gelotophobia in this study as well (Platt,
Proyer & Ruch, 2009; Ruch & Proyer, 2008b).
Gelotophobia
Gender .075
Nationality -.197**
Height -.117
Weight -.093
Age -.159*

36
3.8 Correlations between Self-Esteem, Humor Styles and Gelotophobia
Table 15 Correlation Analysis between Self-Esteem, Humor Styles and Gelotophobia
Note: Correlation is significant if *p<.05; **p<.01; ***p<.001
Table 15 describes that self-esteem was negatively and significantly correlated with
the affiliative humor and self-enhancing humor (p < .05) and was also positively and
significantly related with self-defeating humor and the gelotophobia (p < .05). As, self-
esteem is only significantly related to self-defeating humor and not the aggressive humor,
this finding partially supports Hypothesis two, implying that students will lower self-
esteem would use more unhealthy styles of humor than healthier styles of humor. As such,
Hypothesis five was strongly supported, suggesting that students with lower self-esteem
would show expressions of gelotophobia.
Likewise, the affiliative humor was significantly related to self-enhancing humor
and gelotophobia (p < .05). The self-enhancing humor also had a positive relationship with
self-defeating humor just like the aggressive humor (p < .05). Finally, self-defeating humor
is significantly and positively correlated with gelotophobia (p < .05). This also gives partial
Self-
Esteem
Affiliative
Humor
Self-
Enhancing
Humor
Aggressive
Humor
Self-
Defeating
Humor
Gelotop
hobia
Self-Esteem - - - - - -
Affiliative
Humor -.293
**
- - - - -
Self-Enhancing
Humor -.312
** .398
** - - - -
Aggressive
Humor .075 .039 .059 - - -
Self-Defeating
Humor .244
** -.050 .229
** .264
** - -
Gelotophobia .333**
-.354**
-.109 .108 .304**
-

37
support to Hypothesis six, such that students using more self-defeating humor would show
expressions of gelotophobia and use significantly less adaptive styles of humor.
All in all, from this study, there is a significant relationship between high self-
esteem and the two healthy styles of humor (affiliative and self-enhancing humor). Low
self-esteem is also related with self-defeating humor and gelotophobia. In other words,
gelotophobia is related to low self-esteem, low affiliative humor, low self-enhancing humor
and high self-defeating humor.
3.9 Regression Analysis of Four Humor Styles, Self-Esteem and Gelotophobia
Table 16 Regression Analysis of the Scales
Self-
Esteem
Affiliative
Humor
Self-
enhancing
Humor
Aggressive
Humor
Self-
defeating
Humor
Geloto
phobia
Gender -.92 .08 .01 -.20 .09 .01
Nationality .70 .05 .22* -.12 -.10 -.11
Year -.05 .08 -.04 -.09 -.06 .08
Height .92 .05 .12 -.11 .07 -.08
Weight -.06 -.01 -.02 .16 .06 -.01
Age -.00 -.15 -.01 .15 .07 -.18*
Self-Esteem - -.06 -.31*** -.02 .29*** .28***
Affiliative
Humor
-.06 - .27*** .15 -.02 -
.32***
Self-
enhancing
-.32*** 2.9*** - -.002 .36*** .05

38
Humor
Aggressive
Humor
-.02 .12 -.002
- .20** .09
Self-
defeating
Humor
.28*** -.02 .34*** .24** - .18*
Geloto-
phobia
.29*** -.35*** .05 .12 .19* -
R² .32*** .30 .35 .16 .31 .36
Note: *p<.05; **p<.01; ***p<.001
Table 16 displays the regression analysis of the scale along with the demographic
variable. Firstly, the combination of the self-esteem scale is significantly associated with
the self-enhancing humor, self-defeating humor and gelotophobia, (R² = .32, F (11, 151) =
6.57, p < .001). The self-esteem is significantly associated with self-enhancing humor (β = -
.32, t = - 4.14, p < .001), self-defeating humor (β = .28, t = 3.67, p < .001) and gelotophobia
(β = .29, t = 3.61, p < .001). This is to say that self-enhancing humor, self-defeating humor
and gelotophobia are significant predictors of Self-esteem.
Secondly, affiliative humor is associated with the self-enhancing humor and
gelotophobia significantly (IV), (R² = .30, F (11, 151) = 5.92, p < .001). This states that
self-enhancing humor (β = .29, t = 3.58, p < .001) and gelotophobia (β = -.35, t = - 4.38, p <
.001) are significant predictors of affiliative humor.
Thirdly, self-enhancing humor is significantly associated with the nationality,
affiliative humor, self-defeating humor and self-esteem (IV), (R² = .35, F (11, 151) = 7.22,
p < .001). The self-enhancing humor was much related to nationality (β = .22, t = 2.48, p <

39
.05), affiliative humor (β = .27, t = 3.58, p < .001), self-defeating humor (β = .34, t = 4.61, p
< .001) and self-esteem (β = -.31, t = - 4.14, p < .001). Hence, the significant predictors of
self-enhancing humor are affiliative humor, self-defeating humor and self-esteem.
Fourthly, aggressive humor is significantly associated only with self-defeating
humor (IV), (R² = .16, F (11, 151) = 2.68, p < .001) ; (β = .24, t = 2.70, p < .01). Therefore,
one can say that the self-defeating humor is a fair predictor of the aggressive humor.
Fifthly, there was a significant association of self-defeating with self-esteem, self-
enhancing humor, aggressive humor and gelotophobia, (R² = .31, F (11, 151) = 6.21, p <
.001). The self-defeating humor is significantly associated with self-esteem (β = .29, t =
3.67, p < .001), self-enhancing humor (β = .36, t = 4.61, p < .001) and aggressive humor (β
= .20, t = 2.70, p < .01). It is fairly significantly associated with Gelotophobia (β = .19, t =
2.29, p < .05). Thus, Self-esteem, Self-enhancing humor, Aggressive humor and
Gelotophobia are predictors of Self-defeating humor.
Lastly, gelotophobia is significantly associated with age, self-esteem, affiliative
humor and self-defeating humor (IV), (R² = .36, F (11, 151) = 7.55, p < .001). Gelotophobia
is significantly associated with self-esteem (β = .28, t = 3.61, p < .001) and affiliative
humor (β = -.32, t = -4.38, p < .001). It is also fairly significantly associated with age (β = -
.18, t = -2.01, p < .05) and self-defeating humor (β = .18, t = 2.29, p < .05). Hence, the
predictors of gelotophobia are age, self-esteem, affiliative humor and self-defeating humor.

40
4. DISCUSSION
4.1 Major Findings and Significance of the Present Study
This is the premiere comparative study examining the styles of humor and
gelotophobia focusing on Chinese and Indian University Students.
4.1.1 Students‟ Perception on the Importance of Humor and Self Humor
The present study reveals that both Chinese and Indian university students deem
humor as being highly important. Nonetheless, Indian students regard humor significantly
more important than Chinese students. With regards to self-humor, Indian students also
consider themselves as being more humorous than the counterparts in China. Chinese
students judged themselves as moderately humorous. These findings support Hypothesis
one, confirming though Chinese students scored high on the importance of humor; they
tend to consider themselves as being less humorous. This echoes the results of previous
studies (Chen & Martin, 2007; Yue, 2009). Additionally, this study highlights a new
finding that Indian students not only rate humor as highly imperative but also consider
them very humorous at the same time. This will need to be confirmed in later studies.
However, it asserts that humor is important for everyone despite their culture or race
(Martin, Puhlik-Doris, Larsen, Gray, & Weir, 2003).
This study also reports the frequently nominated humorists in both groups. It found
that the most frequently nominated Chinese humorists are mostly comprised of comedians,
actors and artists. To name a few, Stephen Chow, Wong Chi Wah (Dayo), Jim, Jan Lam
and Eric Tsang are among the most popular humorists nominated by the students. These
results are supportive to a study by Yue (in press). As far as the Indian students are

41
concerned, popular humorists mostly comprised of actors and comedians. The most
prevalent names included the likes of Johnny Lever, Raju Srivastav, Paresh Rawal, Russel
Peters and Rajpal Yadav. The fact that Indian students have also selected politicians
stipulates us that they idolize specific religious and political leaders (Krishnamurti, 2008).
The results imply that Indians have a more diverse selection than Chinese. This advocates
that the Chinese students have a relatively narrow view when selecting the best humorists.
Therefore, this highlights the fact that Indian students develop a healthier style of humor
than Chinese students.
The students‟ reasoning of their nomination commonly included being funny in
general, body language, facial expressions, creativity, talking styles and humor styles. This
basically tells us that the Chinese and the Indians determine the humorists based on what
they can observe. Moreover, when asked about situations they would „despise‟ or „be afraid
of humor‟, the most frequent responses included that the humorists were not being funny
enough, embarrassing, offensive, or the jokes being inappropriately timed. These results
indicate that both cultures dislike humor due to similar underlying reasons. As mentioned
earlier, 21.6% of the students dislike lame humor, thus, these students cognitively express
the importance of paying attention to the meaning of the joke as indicated by the
Incongruity theory (Martin, 2007). A possible explanation of why the Chinese and Indians
have similar reasoning is due to the nature of collectivistic cultures. They tend to be more
dependent on others and follow social norms. Therefore, if an individual is insulted in a
group setting, the implied humor behind the insult may be disliked. This is because of the
nature of the society the students are brought up in. This is to say that the Chinese and
Indian cultures have similar perspectives when they despise laughter (Liao, 2001).

42
4.1.2 Impact of Self-Esteem on Humor
There are various factors that affect self-esteem and these differ across different
cultures (Kling et al., 1999; Twenge & Crocker, 2002). Even though, this study accounted
non-significant results for self-esteem in the two cultural groups, it is crucial to note
whether there are differences between the two groups because self-esteem is an important
construct for collectivistic cultures (Hojat et al., 1990; Rudy & Grusec, 2006). A limitation
that has contributed to the non-significant results might be the small sample size.
In addition, the results successfully recorded that self-esteem is related to each of
the following: affiliative humor, self-enhancing humor, self-defeating humor and
gelotophobia. In other words, students with higher self-esteem tend to use the healthier
styles of humor while students with lower self-esteem were more likely to use self-
defeating humor and showed expressions of gelotophobia. The fact that students with
higher self-esteem use healthier styles of humor has been confirmed in a past study (Veron
et al., 2009). Hence, the results only provide partial support to Hypothesis Three, implying
that Chinese and Indian students with lower self-esteem are more likely to use self-
defeating humor and less affiliative and self-enhancing humor. Moreover, the outcome
provides full support to Hypothesis Four, affirming that Chinese and Indian Students with
lower self-esteem would show slight expressions of gelotophobia. Therefore, the results
discloses a relationship between beneficial forms of humor and to a certain extent one‟s
psychological wellbeing i.e. self-esteem. Since aggressive humor wasn‟t related to self-
esteem significantly, one cannot conclude that self-disparaging forms of humor could be
harmful towards the psychological wellbeing. This is consistent with the conclusion of
Martin et al. (2003) and Kazarian and Martin (2006).

43
4.1.3 Impact of Age on Self-Esteem
Interestingly, the present study found that Chinese students from 18 to 20 years of
age portray higher self-esteem than older students i.e. ages from 21 to 26 years. This
finding has been evoked in a prior literature proposing the variation in self-esteem in terms
of age (Kling et al., 1999). Kling et al. (1999) suggested that self-esteem usually peaks
during adolescence when an individual is most concerned of their physical appearance and
outlook. This implies that younger students in this sample can be referred to the
adolescents, as they are new to college lifestyle, hence, they must be more concerned about
their appearance than their academics.
4.1.4 Impact of Culture on Humor Styles
As predicted, the results of the study show that both cultures satisfactorily use
healthy styles of humor such as affiliative and self-enhancing humor significantly more
than self-defeating and aggressive humor which are unhealthy. This underlines previous
researches in both the collectivist cultures, Hong Kong and India; the people tend to use the
healthy humor styles more than the unhealthy humor styles (Chen & Martin, 2005; Yue,
Hao & Goldman, 2002; Yue, Hao, Lan, & Yan, 2006). It also strongly supports Hypothesis
Two, confiding that the Chinese and Indians use adaptive humor styles more than
maladaptive humor styles.
As important as it is to address the issue of the four styles of humor used by both
the collectivist samples of this study, it is also vital to differentiate between the two
samples. Unexpectedly, this study is the first to point out that Indian undergraduate students
used affiliative and self-enhancing styles considerably more than Chinese students and vice
versa. It insinuates that Indians used more adaptive than maladaptive humor styles
44
compared to the Chinese whereas, Chinese people used more maladaptive and less adaptive
humor styles in contrast with the Indian people. An implication of this is that the Chinese
have better sarcastic and disparaging humor. The results indicate a relationship between
affiliative and self-enhancing styles with nationality, and therefore imply a cultural
difference in the value or humor expressions in the two countries (Chen & Martin, 2007).
In terms of the overall correlations among the four styles, the outcome concludes
affiliative humor was related to self-esteem, self-enhancing humor and gelotophobia,
whereas self-enhancing humor had a correlation with height, self-esteem and self-defeating
humor. Previous literature states that self-enhancing humor was related to self-defeating
humor (Kazarian & Martin, 2006). It was initially proven that self-esteem was related with
the healthy humor styles (Bilge & Saltuk, 2007; Martin et al., 2002). Lastly, aggressive
humor was related with weight. One possible explanation for this could be that weight has
always been such a factor that make individuals conscious of their body image
(Hoffmeister, Teige-Mocigemba, Blechert, Klauer, & Tuschen-Caffier, 2010). Hence, in a
group setting, one may feel threatened by jokes targeted at their body image, i.e. weight.
Besides, it is necessary to note that the causality cannot be derived from these results and is
necessary to be verified by later studies.
4.1.5 Impact of Gender and Age on Humor
Like previous studies by Chen & Martin (2007), the present study also shows no
difference between males and females. However, a significant age difference was seen in
the Chinese sample concerning the self-defeating humor style. Chinese students younger
than 20 years tend to use the self-disparaging humor more than those over 21 years. This
result contradicted a past study that stated that younger Chinese participants used more

45
aggressive and affiliative humor (Chen & Martin, 2007). The contradiction may be due to
the sample size or one‟s social interaction experiences in the school settings.
4.1.6 Impact of Culture on Gelotophobia
This was the first study conducted on gelotophobia among the Indian university
students. The result indicates a significant relation of gelotophobia with nationality. It was
observed that the Chinese students had slightly higher significant mean scores than the
Indians on the GELOPH-15 scale. Interestingly, Chinese participants showed „slight‟ and
„pronounced‟ expressions of gelotophobia (29.8%, 8%) more than Indian participants
(24.4%, 5%) by exceeding the cut-off scores. This indicates that Chinese people
demonstrate signs of fear of laughter more than Indian people. Although Gelotophobia has
been previously found even in healthy individuals, Ruch (2009) mentioned it is more
prevalent in psychiatric patients. Therefore, despite participants in this study showing signs
of the fear of laughter, one cannot conclude that they necessarily have gelotophobia.
4.1.7 Impact of Gender and Age on Gelotophobia
In line with other studies, gelotophobia is unrelated to gender in this study as well
(Platt, Proyer, & Ruch, 2009; Ruch & Proyer, 2008b). There were non-significant gender
differences adopted in both the samples. This shows that both females and males have
equal chance of acquiring fear of laughter (Ruch & Proyer, 2008b). However, this study
concludes a relation of gelotophobia and age. In terms of age differences, this sample
illustrated participants aged under 20 years old higher than participants older than 21 (Ruch
& Proyer, 2009). One reason for the difference could be due to the less life experience the
younger students have than older ones. Hence, older participants are more immune to and
can tackle different kinds of humor or withhold different emotions.
46
4.1.8 Predictive Power of Humor Styles on Self-Esteem and Gelotophobia
Correspondingly, regression analysis effectively highlighted that self-enhancing
humor, self-defeating humor and gelotophobia could predict self-esteem in this sample and
vice versa. A possible justification for the relation between self-defeating humor and
gelotophobia with self-esteem could perhaps be that people with low self-esteem can
identify emotional expressions as negative and feel threatened and therefore as a result
respond with hostility or avoidance. However, this is yet to be further examined and
verified in later studies.
Further, the results of regression reports that self-enhancing humor and
gelotophobia are predictors of affiliative humor and self-defeating humor while self-esteem
can predict self-enhancing humor. Self-defeating humor is a fair predictor of the aggressive
humor. Self-esteem, self-enhancing humor, aggressive humor and gelotophobia are
predictors of self-defeating humor. Klein and Kuiper (2006) formerly proclaimed that peer
acceptance, group identity and cohesiveness during middle childhood is important for
developing the affiliative and self-enhancing humor. The reverse is true for self-defeating
and aggressive humor illustrating that peer rejection and bullying can play a role in
unhealthy humor development, thus, developing a fear towards humor.
All in all, gelotophobia is shown to be related to low self-esteem, low affiliative humor
and high self-defeating humor. Furthermore, the associations of gelotophobia according to
the regression analysis are age, self-esteem, affiliative humor and self-defeating humor.
This once again, supports Hypothesis four, stating that Chinese and Indian students with
lower self-esteem will show expressions of gelotophobia. Papousek et al. (2009) evidently
discussed that people with gelotophobia are weak at regulating emotions. Thus, the
unconfident and weak emotional attitude may lead to low self-esteem affecting an
individual‟s wellbeing resulting with the fear of being laughed at. The result of this study
47
partially supports Hypothesis five too, such that Chinese and Indian students who use more
self-defeating styles of humor and not aggressive humor would show expressions of
gelotophobia. This implication infers that students with slight expressions of gelotophobia
fail to evaluate the quality of playful healthy teasing which is the result of the healthy
affiliative humor (Platt, 2008). They instead might misinterpret the healthy humor style for
the unhealthy self-defeating humor style. Platt, Proyer and Ruch (2009) realized that people
with the fear of laughter generalize and believe all laughter is bad. Thus, they feel
threatened and react negatively. For instance, bullying or ragging on campus enhances the
fear towards laughter (Ruch & Proyer, 2008a). A number of literatures proposed that the
signs of gelotophobia can be traced back into one‟s childhood and adolescence wherein one
might have suffered from repeated traumatic incidents affecting their personality
development (Platt, Proyer & Ruch, 2009; Ruch, 2009; Ruch & Proyer, 2009; Titze, 2009).
4.2. Limitations and Future Studies
Despite the study concluding significant and new findings, there are some
limitations. Firstly, since the standardized instruments completed by the participants to
examine the Self-esteem, Humor styles and Gelotophobia, were in English. The two target
cultural groups were Chinese and Indian University students; thus, their native languages
are Cantonese and Hindi respectively. In an attempt to keep the questionnaires uniform for
both cultures, there may be a language bias due to the English-constructed questionnaires.
For this reason, future studies can consider using the instruments in the respective
languages for more perhaps effective results. Secondly, the results were greatly dependent
on the self-report measures of the instruments which have limited the quality of the
responses. Future studies can collect data via other sources like ratings and evaluations

48
from peers, interviews and behavioral observations to ensure more accurate results.
Moreover, qualitative data should also be collected to ensure more nonrestrictive answers.
Thirdly, most of the Chinese students sampled were Psychology majors; this might cause a
subject bias towards the results. Lastly, the small sample might have contributed to the
results that were non-significant. Also, for a study of a country with a large population,
India, a larger sample size is needed to be able to generalize it. To be a good indicator, later
studies must increase the sample size. Furthermore, future researches can collect data from
different regions of the country or people from different backgrounds.
4.3. Conclusion
Humor is present in all social interactions and it has shown to influence an
individual‟s well-being (Martin, 2007). In contrast, humor may result with harmful effects
such as fear towards it (Ruch, 2009). Aimed at university students, this empirical study
attempted to investigate the Self-esteem, Humor styles and Gelotophobia across two
collectivist cultures, namely Chinese and Indians. Minimal studies on humor styles and
gelotophobia collectively have been conducted in the Indian society, therefore, this titles to
be one the first studies in this area. This study, further elaborates the issue that collectivist
societies such as Hong Kong and India, tend to use healthier humor styles rather than
unhealthy humor styles. However, results between the two cultures, reported that Indian
students tend to use more healthy humor styles and less unhealthy humor styles whereas,
Chinese students tend to use more unhealthy than healthy styles of humor. It also highlights
the presence of at least slight expressions of gelotophobia in the students by exceeding the
cut-off scores. With support to all the five hypotheses, this study concludes there is an
association between self-esteem, self-defeating humor style and gelotophobia. This resolves

49
the issue that an individual with low self-esteem has higher chances of using self-defeating
humor style and showing expressions of the fear of being laughed at, gelotophobia.
Likewise, one can deduce that if an individual has expressions of gelotophobia, they may
have low self-esteem and tend to use the self-defeating style more than the other humor
styles. Future studies need to investigate the relations more thoroughly. Later studies may
use other forms of data collection and collect data from people of different age groups and
backgrounds to be more accurate. Lastly, there should be more effort in the promotion of
humor in both cultures to enhance individual‟s healthy well-being as well as healthy use of
humor.

50
References
Abel, M. (2002). Humor, stress, and coping strategies. Humor: International Journal of
Humor Research, 15, 365
Bilge, F., & Saltuk, S. (2007). Humor styles, subjective well-being, trait anger and anxiety
among university students in Turkey. World Applied Sciences Journal, 2, 464-469.
Carbelo-Baquero, B., Alonso-Rodriguez, M. C., Valero-Garces, C., & Thorson, J. A.
(2006). A Study of Sense of Humor in Spanish and American Samples. North
American Journal of Psychology, 8, 447-454.
Chen, C. C. (1985). A study of ancient Chinese jokes. Master thesis. National Taiwan
Normal University.
Chen, G., & Martin, R. (2007). A comparison of humor styles, coping humor, and mental
health between Chinese and Canadian university students. Humor: International
Journal of Humor Research, 20, 215-234.
Corenblum, B., & Annis, R. C. (1993). Development of racial identity in minority and
majority children: An affect discrepancy model. Canadian Journal of Behavioral
Science, 25, 499-521.
Decker, W. H., & Rotondo, D. M. (2001). Relationships among gender, type of humor and
perceived leader effectiveness. Journal of Managerial Issues, 13, 450-465.
Freud, S. (1935). A general introduction to psycho-analysis. New York, NY: Liveright
Publishing.

51
Greenberger, E., Chen, C., Dmitrieva, J., & Farruggia, S. P. (2003). Item-wording and the
dimensionality of the Rosenberg self-esteem scale: Do they matter? Personality and
Individual Differences, 35, 1241-1254.
Gruner, C. R. (1997). The game of humor: A comprehensive theory of why we laugh. New
Brunswick, NJ: Transaction Publishers.
Hampes, W. (2006). Humor and shyness: The relation between humor styles and shyness.
Humor: International Journal of Humor Research, 19, 179-187.
Hoffmeister, K., Teige-Mocigemba, S., Blechert, J., Klauer, K. C., Tuschen-Caffier, B.
(2010). Is implicit self-esteem linked to shape and weight concerns in restrained and
unrestrained eaters? Journal of Behavior Therapy and Experimental Psychiatry, 41,
31-38.
Hogg, M. A., & Abrams, D. (1988). Social identifications: A social psychology of
intergroup relations and group processes. London: Routledge.
Hojat, M., Borenstein, B. D., & Shapurian, R. (1990). Perception of childhood
dissatisfaction with parents and selected personality traits in adulthood. Journal of
General Psychology, 117, 241-253.
Holmes, J., & Marra, M. (2006). Humor and leadership style. Humor: International
Journal of Humor Research, 19, 119-138.
Janes, L. M., & Olson, J. M. (2000). Jeer pressure: The behavioral effects of observing
ridicule of others. Personality and Social Psychology Bulletin, 26, 474-485
Kamath, M., & Kanekar, S. (1993). Loneliness, shyness, self-esteem and extraversion.
Journal of Social Psychology, 133, 855-857.
Kazarian, S. S., & Martin, R. A. (2006). Humor styles, culture-related personality, well-
being, and family adjustment among Armenians in Lebanon. Humor: International
Journal of Humor Research, 19, 405-423.
52
Kazarian, S., & Martin, R. (2006). Humor styles, culture-related personality, well-being,
and family adjustment among Armenians in Lebanon. Humor: International Journal
of Humor Research, 19, 405-423.
Klein, D., & Kuiper, N. (2006). Humor styles, peer relationships, and bullying in middle
childhood. Humor: International Journal of Humor Research, 19, 383-404.
Kling, K. C., Hyde, J. S., Showers, C. J., & Buswell, B. N. (1999). Gender differences in
self-esteem: A meta-analysis. Psychological Bulletin, 125, 470-500.
Koestler, A. (1964). The act of creation. London: Hutchinson.
Krishnamurti, S. V. (2008). The route to your roots: History, Hindu nationalism and comics
in India and South Asian Diasporas. Dissertation Abstracts International Section A:
Humanities and Social Science 69(6A), 2469.
Kwan, V. S. Y., Bond, M. H., & Singelis, T. M. (1997). Pancultural explanations for Life
Satisfaction: Adding relationship harmony to Self-esteem. Journal of Personality and
Social Psychology, 73, 1038-1051.
Lemer, H. (2003). The practical qualities for effective leaders. The Scrivener, 12, 16.
Levenson, R. W. (1994). Human emotions: A functional view. In P. Ekman & R. J.
Davidson (Eds.), The nature of emotions: Fundamental questions (pp. 123-126). New
York, NY: Oxford University Press.
Liao, C C. (2001). Taiwanese perceptions of humor: A sociolinguistic perspective. Taipei:
Crane.
Martin, R. A. (2007). The psychology of humor: An integrative approach. Burlington, MA:
Elsevier Academic Press.
Martin, R. A., Puhlik-Doris, P., Larsen, G., Gray, J., & Weir, K. (2003). Individual
differences in uses of humor and their relation to psychological well-being:

53
Development of the humor styles questionnaire. Journal of Research in Personality
37, 48-75.
Matte, G. (2001). A psychological perspective of humor. Humor: International Journal of
Humor Research, 14, 223-241.
Mauldin, R. (2008). Alienation: A laughing matter. Humor: International Journal of
Humor Research, 21, 313-345.
Panday, R.K. (2006). Nepalese humor. Humor: International Journal of Humor Research
19(3).
Papousek, I., Ruch, W., Freudenthaler, H. H., Kogler, E., Lang, B., & Schulter, G. (2009).
Gelotophobia, emotion-related skills and responses to the affective states of others.
Personality and Individual Differences, 47, 58-63.
Platt, T. (2008). Emotional responses to ridicule and teasing: Should gelotophobes react
differently? Humor: International Journal of Humor Research, 21, 105-128.
Platt, T., Proyer, R. T., & Ruch, W. (2009). Gelotophobia and bullying: The assessment of
the fear of being laughed at and its application among bullying victims. Psychology
Science Quarterly, 51, 135-147.
Rosenberg, M. (1965). Society and the adolescent self-image. Princeton, NJ: Princeton
University Press.
Rosenberg, M. (1979). Conceiving the self. Malabar, FL: Krieger.
Rouff, L. L. (1975). Creativity and sense of humor. Psychological Reports, 37, 10-22.
Ruch, W. (1996). Measurement approaches to the sense of humor: Introduction and
overview. Humor: International Journal of Humor Research, 9, 239-250.
Ruch, W. (2009). Fearing humor? Gelotophobia: The fear of being laughed at. Introduction
and overview. Humor: International Journal of humor research, 22, 1-25.

54
Ruch, W. (Ed.). (1998). The sense of humor: Explorations of a personality characteristic.
New York: Mouton de Gruyter.
Ruch, W., & Proyer, R. T. (2008a). The fear of being laughed at: Individual and group
differences in Gelotophobia. Humor: International Journal of Humor Research, 21,
47-67.
Ruch, W., & Proyer, R. T. (2008b). Who is Gelotophobic? Assessement criteria for the fear
of being laughed at. Swiss Journal of Psychology, 67, 19-27.
Ruch, W., & Proyer, R. T. (2009). Who fears being laughed at? The location of
Gelotophobia in the Eysenckian PEN-model of personality. Personality and
Individual Differences, 46, 627-630.
Ruch, W., Proyer, R. T., & Popa, D. E. (2008). The fear of being laughter at (Gelotophobia)
and personality. Humor: International Journal of Humor Research, 53-68.
Rudy, D., & Grusec, J. E. (2006). Authoritarian parenting in individualist and collectivist
groups: Associations with maternal emotion and cognition and children‟s self-esteem.
Journal of Family Psychology, 20, 68-78.
Simpson, J. A., & Weiner, E. S. C. (1989). The Oxford English Dictionary (2nd
ed., Vol.
7.). Oxford: Clarendon Press.
Star India (2010). StarOne - Star TV India. Retrieved January 18, 2010 from
http://starone.indya.com/serials/tgics/
Szabo, A. (2003). The acute effects of humor and exercise mood and anxiety. Journal of
Leisure Research, 35, 152-162.
Taylor, S. E., & Brown, J. D. (1988). Illusion and well-being: A social psychological
perspective on mental health. Psychological Bulletin, 103, 193-210.
Titze, M. (1996). The Pinocchio Complex: Overcoming the fear of laughter. Humor and
Health Journal, 5, 1-11.

55
Titze, M. (2009). Gelotophobia: The fear of being laughed at. Humor: International
Journal of Humor Research, 22, 27-48.
Twenge, J. M., & Crocker, J. (2002). Race and self-esteem: Meta-analyses comparing
whites, blacks, Hispanics, Asians and American Indians and comment on gray-little
and hafdahl. Psychological Bulletin, 128, 371-408.
Veron, P. A., Villani, V. C., Schermer, J. A., Kirilovic, S., Martin, R. A., Petrides, K. V.,
Spector, T. D., & Cherkas, L. F. (2009). Genetic and environmental correlations
between trait emotional intelligence and humor styles. Journal of Individual
Differences, 30, 130-137.
Wiggins, J. S. (1991). Agency and communion as conceptual coordinates for the
understanding and measurement of interpersonal behavior. In W. M. Grove & D.
Cicchetti (Eds.), Personality and psychopathy (Vol.2, Thinking clearly about
psychology, pp. 89-113). Minneapolis: University of Minnesota Press.
Yue, X. D. (In press). The Chinese ambivalence to humor: Views from University students
in Hong Kong and China. Humor: International Journal of Humor Research.
Yue, X. D., Hao, X., & Goldman, G. (2008). Humor styles, dispositional optimism and
mental health: A study among 800 undergraduates in Hong Kong and Mainland China.
The 20th
International Humor Conference, Madrid, Spain: July 7-11, 2008.
Yue, X. D., Hao, X., Lan, L., & Yan, F. (2006). Humor and Youth Empowerment: A Self-
Cultivation Approach. Paper Presented at the 2nd
International Conference on Youth
Empowerment, City University of Hong Kong, Hong Kong, China: June 5-8, 2006.
Ziv, A. (1984). Personality and sense of humor. New York: Springer.

56
Appendix A: Questionnaire
This study would like to measure your feelings toward self. Your participation is
highly appreciated. All information you provide will be treated strictly CONFIDENTIAL.
For queries, please contact at Neelam Hiranandani at .
PART A
The following questions require you to answer according to what applies to you. Please
circle the number, on the scale of 1 to 10, with 1 being very unimportant and 10 being very
important:
1.) How important is humor to you? Very Unimportant Very Important
1 2 3 4 5 6 7 8 9 10
2.) Please rate your own level of humor. Very Low Very High
1 2 3 4 5 6 7 8 9 10
3.) Please nominate 3 Chinese whom you think are most humorous (If you are an Indian,
please nominate 3 Indians whom you think are most humorous) and state the reasons
for nomination.
Names Reasons
a.)
b.)
c.)
4.) Please give three reasons that you are afraid of or dislike humor
1. 2. 3.
_______________________________________________________________________
PART B
Below is a list of statements dealing with your general feelings about yourself. Please circle
which applies to you most: Strongly Agree, Agree, Disagree and Strongly Disagree:
Strongly
Disagree
Disagree Agree Strongly
Agree
1.
On the whole, I am satisfied with myself.
1
2
3
4
2. At times, I think I am no good at all. 1 2 3 4
3. I feel that I have a number of good qualities. 1 2 3 4
4. I am able to do things as well as most other people. 1 2 3 4
5. I feel I do not have much to be proud of. 1 2 3 4
6. I certainly feel useless at times. 1 2 3 4
7. I feel that I‟m a person of worth, at least on an equal 1 2 3 4
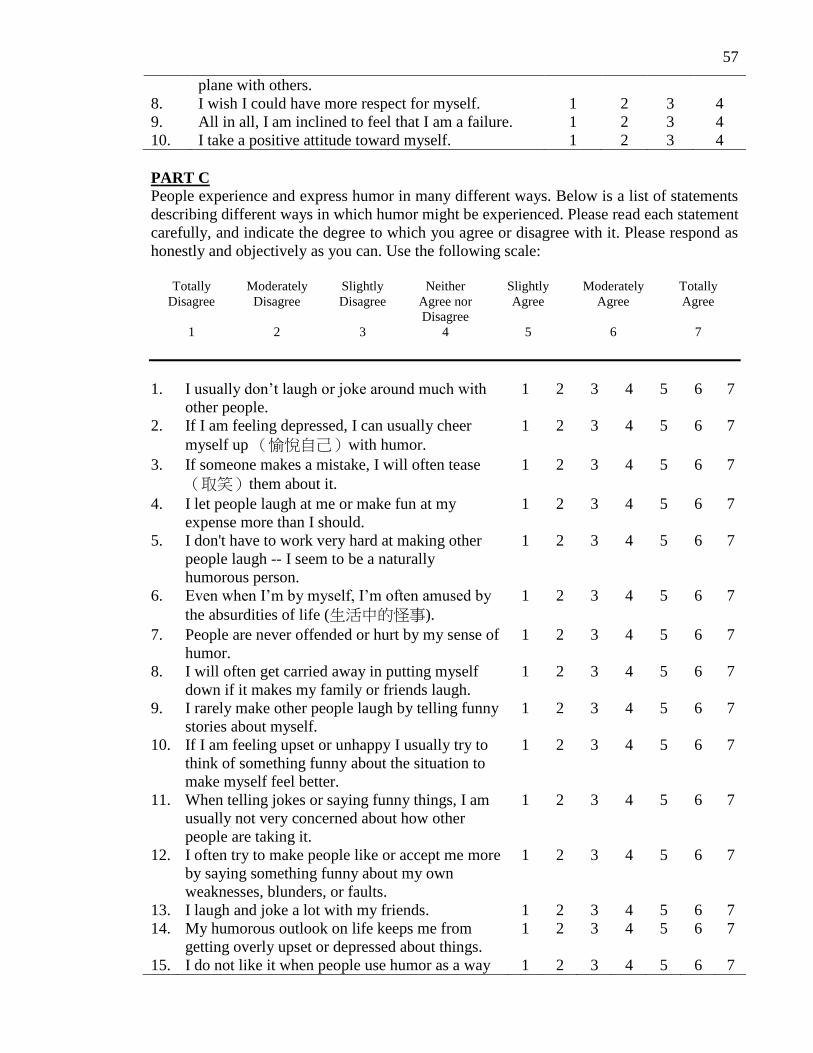
57
PART C
People experience and express humor in many different ways. Below is a list of statements
describing different ways in which humor might be experienced. Please read each statement
carefully, and indicate the degree to which you agree or disagree with it. Please respond as
honestly and objectively as you can. Use the following scale:
Totally
Disagree
Moderately
Disagree
Slightly
Disagree
Neither
Agree nor
Disagree
Slightly
Agree
Moderately
Agree
Totally
Agree
1 2 3 4 5 6 7
1. I usually don‟t laugh or joke around much with
other people.
1 2 3 4 5 6 7
2. If I am feeling depressed, I can usually cheer
myself up (愉悅自己)with humor.
1 2 3 4 5 6 7
3. If someone makes a mistake, I will often tease
(取笑)them about it.
1 2 3 4 5 6 7
4. I let people laugh at me or make fun at my
expense more than I should.
1 2 3 4 5 6 7
5. I don't have to work very hard at making other
people laugh -- I seem to be a naturally
humorous person.
1 2 3 4 5 6 7
6. Even when I‟m by myself, I‟m often amused by
the absurdities of life (生活中的怪事).
1 2 3 4 5 6 7
7. People are never offended or hurt by my sense of
humor.
1 2 3 4 5 6 7
8. I will often get carried away in putting myself
down if it makes my family or friends laugh.
1 2 3 4 5 6 7
9. I rarely make other people laugh by telling funny
stories about myself.
1 2 3 4 5 6 7
10. If I am feeling upset or unhappy I usually try to
think of something funny about the situation to
make myself feel better.
1 2 3 4 5 6 7
11. When telling jokes or saying funny things, I am
usually not very concerned about how other
people are taking it.
1 2 3 4 5 6 7
12. I often try to make people like or accept me more
by saying something funny about my own
weaknesses, blunders, or faults.
1 2 3 4 5 6 7
13. I laugh and joke a lot with my friends. 1 2 3 4 5 6 7
14. My humorous outlook on life keeps me from
getting overly upset or depressed about things.
1 2 3 4 5 6 7
15. I do not like it when people use humor as a way 1 2 3 4 5 6 7
plane with others.
8. I wish I could have more respect for myself. 1 2 3 4
9. All in all, I am inclined to feel that I am a failure. 1 2 3 4
10. I take a positive attitude toward myself. 1 2 3 4

58
of criticizing or putting someone down.
16. I don‟t often say funny things to put myself
down.
1 2 3 4 5 6 7
17. I usually don‟t like to tell jokes or amuse people. 1 2 3 4 5 6 7
18. If I‟m by myself and I‟m feeling unhappy, I
make an effort to think of something funny to
cheer myself up.
1 2 3 4 5 6 7
19. Sometimes I think of something that is so funny
that I can‟t stop myself from saying it, even if it
is not appropriate for the situation.
1 2 3 4 5 6 7
20. I often go overboard in putting myself down
when I am making jokes or trying to be funny.
1 2 3 4 5 6 7
21. I enjoy making people laugh. 1 2 3 4 5 6 7
22. If I am feeling sad or upset, I usually lose my
sense of humor.
1 2 3 4 5 6 7
23. I never participate in laughing at others even if
all my friends
are doing it.
1 2 3 4 5 6 7
24. When I am with friends or family, I often seem
to be the one that other people make fun of or
joke about.
1 2 3 4 5 6 7
25. I don‟t often joke around with my friends. 1 2 3 4 5 6 7
26. It is my experience that thinking about some
amusing aspect of a situation is often a very
effective way of coping with problems.
1 2 3 4 5 6 7
27. If I don't like someone, I often use humor or
teasing to put them down.
1 2 3 4 5 6 7
28. If I am having problems or feeling unhappy, I
often cover it up by joking around, so that even
my closest friends don‟t know how I really feel.
1 2 3 4 5 6 7
29. I usually can‟t think of witty things to say when
I‟m with other people.
1 2 3 4 5 6 7
30. I don‟t need to be with other people to feel
amused -- I can usually find things to laugh
about even when I‟m by myself.
1 2 3 4 5 6 7
31. Even if something is really funny to me, I will
not laugh or joke about it if someone will be
offended.
1 2 3 4 5 6 7
32. Letting others laugh at me is my way of keeping
my friends and family in good spirits.
1 2 3 4 5 6 7
PART D
The following statements refer to your feelings, actions, and perceptions in general. Please
try as much as possible to describe your habitual behaviour patterns and attitudes by
marking an X through one of the four alternatives. Please use the following scale:
(1) strongly disagree (2) moderately disagree (3) moderately agree (4) strongly agree
For example
I am a cheerful person......................................................................................(1) (2) (3) (4)
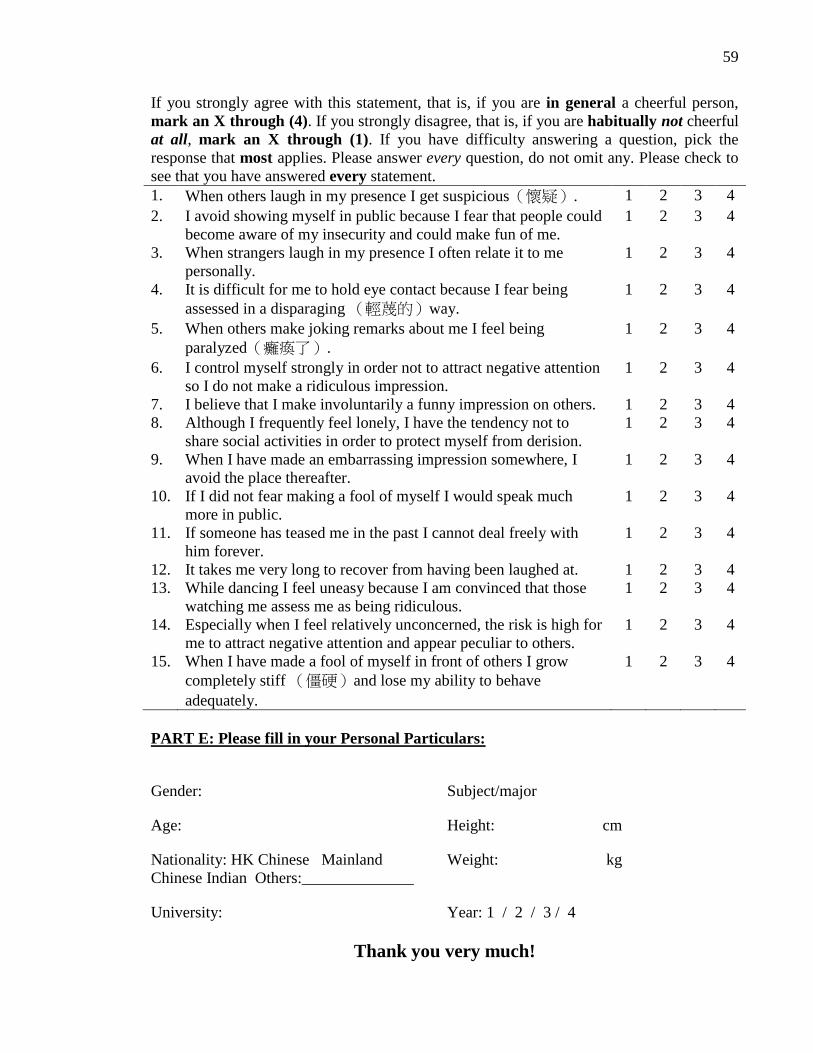
59
If you strongly agree with this statement, that is, if you are in general a cheerful person,
mark an X through (4). If you strongly disagree, that is, if you are habitually not cheerful
at all, mark an X through (1). If you have difficulty answering a question, pick the
response that most applies. Please answer every question, do not omit any. Please check to
see that you have answered every statement.
1. When others laugh in my presence I get suspicious(懷疑). 1 2 3 4
2. I avoid showing myself in public because I fear that people could
become aware of my insecurity and could make fun of me.
1 2 3 4
3. When strangers laugh in my presence I often relate it to me
personally.
1 2 3 4
4. It is difficult for me to hold eye contact because I fear being
assessed in a disparaging (輕蔑的)way.
1 2 3 4
5. When others make joking remarks about me I feel being
paralyzed(癱瘓了).
1 2 3 4
6. I control myself strongly in order not to attract negative attention
so I do not make a ridiculous impression.
1 2 3 4
7. I believe that I make involuntarily a funny impression on others. 1 2 3 4
8. Although I frequently feel lonely, I have the tendency not to
share social activities in order to protect myself from derision.
1 2 3 4
9. When I have made an embarrassing impression somewhere, I
avoid the place thereafter.
1 2 3 4
10. If I did not fear making a fool of myself I would speak much
more in public.
1 2 3 4
11. If someone has teased me in the past I cannot deal freely with
him forever.
1 2 3 4
12. It takes me very long to recover from having been laughed at. 1 2 3 4
13. While dancing I feel uneasy because I am convinced that those
watching me assess me as being ridiculous.
1 2 3 4
14. Especially when I feel relatively unconcerned, the risk is high for
me to attract negative attention and appear peculiar to others.
1 2 3 4
15. When I have made a fool of myself in front of others I grow
completely stiff (僵硬)and lose my ability to behave
adequately.
1 2 3 4
PART E: Please fill in your Personal Particulars:
Gender: Subject/major
Age: Height: cm
Nationality: HK Chinese Mainland
Chinese Indian Others:______________
Weight: kg
University: Year: 1 / 2 / 3 / 4
Thank you very much!