Embed Size (px)
DESCRIPTION
drying
Citation preview
118 Integrated Systems for Agri-food Production ISAP’03
ENERGY SAVING IN SPRAY DRYING PROCESS
'DUNR�9(/,û��0DWH�%,/,û��6UHüNR�720$6��0LUHOD�3/$1,1,û Faculty of Food Technology, University J. J. Strossmayer of Osijek
Department of Process Engineering, F. Kuhaca 18, P. O. Box 709, 31000 Osijek, C R O A T I A
ABSTRACT: In this work some possibilities to improve the conventional spray drying process using programming in Excel as a calculation tool have been presented. The minimization of energy consumption during the drying operation can be achieved by recycling exhaust air. The maximum theoretical range of recirculation is 60%. The fuel oil saving rate depends linearly on the rate of recirculation, and the theoretical maximum fuel oil saving is approximately 14%. Ecological issues were also considered as well, since decreased fuel consumption lowers harmful gas emission to the environment.
KEY WORDS: spray drying, recycling, recirculation, optimisation, fuel saving
1. INTRODUCTION
The spray drying process needs a large amount of heat for water evaporation and for this reason heat saving is an important factor for the successful process functioning. For the past ten years an intensive optimisation of spray drying operation has been performed. One of the early-published articles on energy conservation in spray drying has been contributed [1,2]. Since then a spray drying optimisation using exit air recirculation has become a part of industrial practice. A lot of existing plants have been redesigned, and manufacturers of spray drying equipment regularly offer new plants with process optimisation included. The energy minimisation contributes also to the process furnace burner emission reduction giving an additional environmental improvement. However, the dryer plant operators still have a problem to understand and calculate a heat and mass balance, in order to see a potential savings in every day operation [3,4,5]. To make the spray drying operation more clear and understandable to those who run or redesign the existing plants, or design the new plants, a process calculation using Excel as a program tool is used and presented below. Using Excel as a calculation tool, it is easy to calculate any spray drying process knowing only a few basic entering data.
Moreover, it is easy to see any changes at any point of a spray drying process, and what is probably most important, this program contributes to a better understanding of spray drying, especially in its thermodynamics.
2. PROGRAM DESCRIPTION
The program is divided in six parts, where specific calculations are performed. The first part of the program is an entering data calculation from water and air
database, separately created. Only a few entering data is necessary to know and to type in the cells, other data as a water and air enthalpy, water and air specific volumes are automatically calculated.
The first column in data base (only part of data base adapted from Raznjevic (1995) or complete version in the third work sheet in Excel programme) represents a temperature in the range of 0 - 450 °C, the second column is a dry air enthalpy, the third is a water vapour enthalpy, all for the same temperature range 0 – 450 °C [6]. The fourth column is a water enthalpy, the fifth is a dry air specific volume, and the sixth column is a water vapour specific volume, all for the 0 - 100 °C temperature range.
The related enthalpy and specific volumes are calculated using command (= VLOOKUP) for the temperature range specified in the entering data. For example, the water vapour enthalpy for the inlet air temperature is calculated using formula [=VLOOKUP(H11;'Data base'!C5:E455;2;FALSE] and the dry air enthalpy for the same temperature is calculated replacing integer 2 with 3 in the above formula.
Only one data from first part of the program is calculated in the second part of the program and returned in the cell H7 in the first part of the program. It is the amount of dried material leaving spray drier. This is done just for the purpose of having all the heat and mass data in the first part of the program.
The second part of the program calculates the basic heat and mass balance data. In this part of the program the basic calculations are performed. The amount of dried material (cell I31), water evaporated (cell I33) and required amount of heat to evaporate water (cell I38) are calculated. From the data for the total amount of heat required (cell I42), the amount of fuel oil is calculated (cell I45). The evaporation efficiency (kg evaporated water/ kg fuel oil) is calculated in cell I47. The third part of the program calculates the heat and mass balance for the furnace where fuel burning and hot air production take place. The total amount of the heat in the furnace represents the sum (cell I58) of heat from ambiental air (cell I52), heat from fuel (cell I54) and heat from combustion (cell I56). The heat from furnace is a sum (cell I85) of heat from hot air (cell I74), and heat from products made by combustion: water (cell I76), nitrogen (cell I79) and carbon dioxide (cell I82). The furnace losses are difference between heat in the furnace and heat from then furnace, (cell I87).
The fourth part of the program calculates heat and mass balance of the spray drying tower. The total heat entering the tower is the sum (cell I93) of the heat from the furnace (cell I90), heat from the wet material (cell I91), and heat from leak air (cell I92). The heat leaving the spray drier tower is a sum (cell I103) of heat of exhaust air (cell I96), heat from water evaporated (cell I97), heat from nitrogen
20-��������������7LPLúRDUD��5RPDQLD 119 120 Integrated Systems for Agri-food Production ISAP’03
(cell I98), heat from carbon dioxide (cell I99), and heat from dried material (cell I100).
The fifth part of the program calculates overall process heat utilization. The heat for water evaporation is calculated in cell I109, the heat in dried material is in cell I110, and the heat in exhaust air is in cell I112. The furnace loss is in cell I113 and the tower loss is in cell I114.
The heat balance is represented as a kJ/kg (cells from H117 to H122), and as a percentage of total heat in the process (cells from I117 to I122). The mass balance of exit air is represented as kg of each components (cells from H126 to H130), and as volume of each component (cells from I126 to I130), which is important for the exhaust system design (ducts, blowers, cyclones, scrubbers, air filters, etc.).
The sixth part of the program is process optimisation using exhaust air recirculation as a method for energy conservation.
The maximum theoretical range of recirculation is 60%. The desired recirculation range has to be print in cell I134. The ambiental air moisture content is also entering data and has to be print in cell I135. For the desired recirculation rate, the amount of blended quench air (recirculated air + ambiental air) is calculated in cell I146. Taking into account the amounts of recirculated and ambiental air, and their temperatures, the temperature of blended quench air is calculated in cell I148. From the combustion data and quench air amount, the total amount of hot air is calculated in cell I150, and heat content of hot air is calculated in cell I154. From the heat required in the process the amount of fuel oil is calculated in cell I157, and the fuel oil saving as a percentage of fuel oil for process without recirculation is calculated in cell I160. At the same time in column D, cells from D167 to D174, the moisture content of recirculated air is calculated, to be sure that the dew point is far enough for every stage of the drying process. For better understanding and following of the calculation procedure, the formulae for each calculation step are presented in column B under title or in column E.
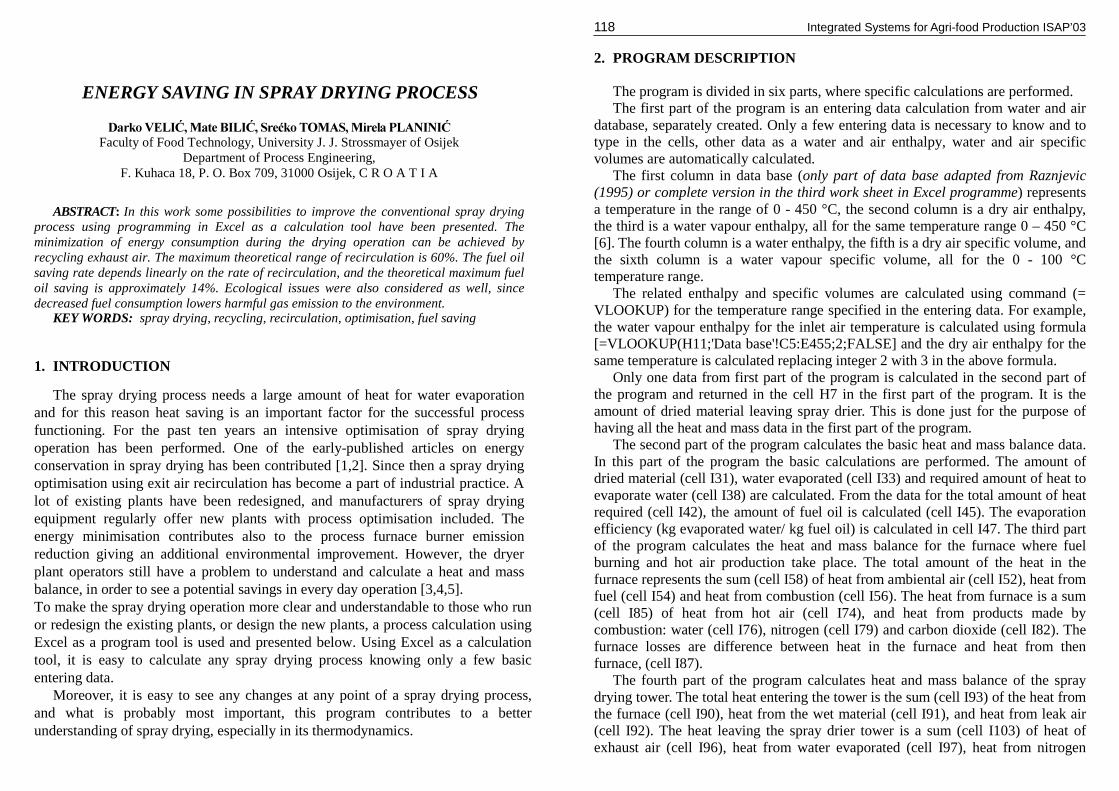
Figure 1
20-��������������7LPLúRDUD��5RPDQLD 121 122 Integrated Systems for Agri-food Production ISAP’03
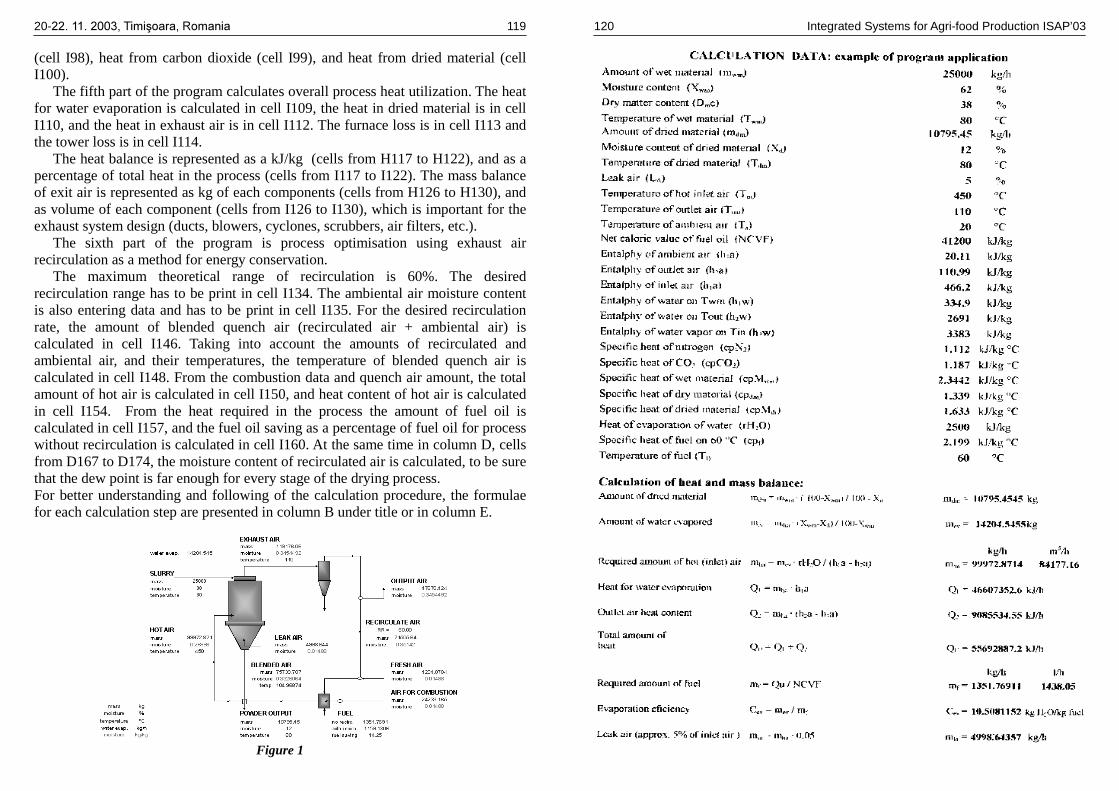
Table 1
20-��������������7LPLúRDUD��5RPDQLD 123 124 Integrated Systems for Agri-food Production ISAP’03
Figure 2 Figure 3
Figure 4
3. RESULT AND DISCUSSION
The table 1 is an example of program application. As it can be seen, the calculation is performed for the entering data shown in the first part of the program.
The results of calculations have also been shown in the active cells of the Process Flow Sheet, Fig. 1 where it can be seen how process respond on parameters entered.
The Fig. 1 represents the Process Flow Sheet, where all main process parameters are shown. All cells are active, which means that any change in the process calculations automatically induce the value changes in the cells of the Flow Sheet. Therefore, it is easy to follow the process changes at any stage, even for minimal changes in the entering data.
There are some other process parameters that are presented graphically here, in order to show the possibilities and gains of process optimisation.
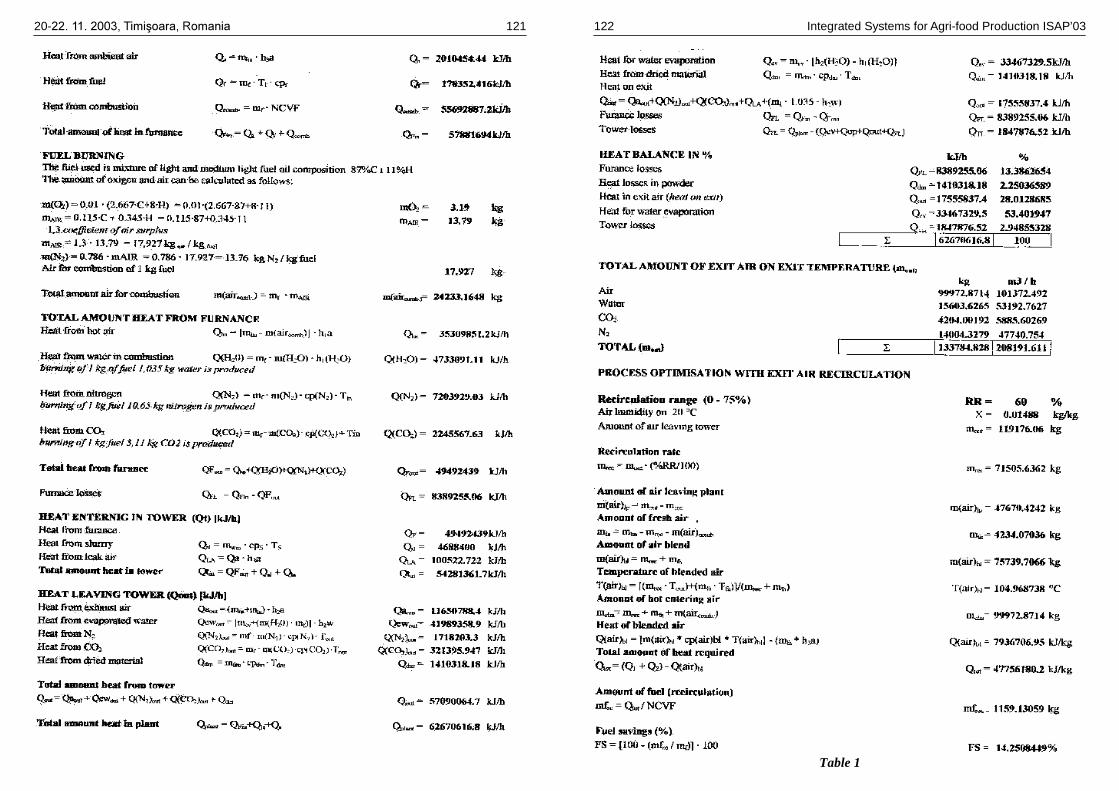
The moisture content in the critical process steps is shown in Fig. 2. It is evident that in any process stages the moisture content is between 0.15-0.4 kg water/kg air. These values are far from the value of 0.789 kg/kg, which is a dew point of
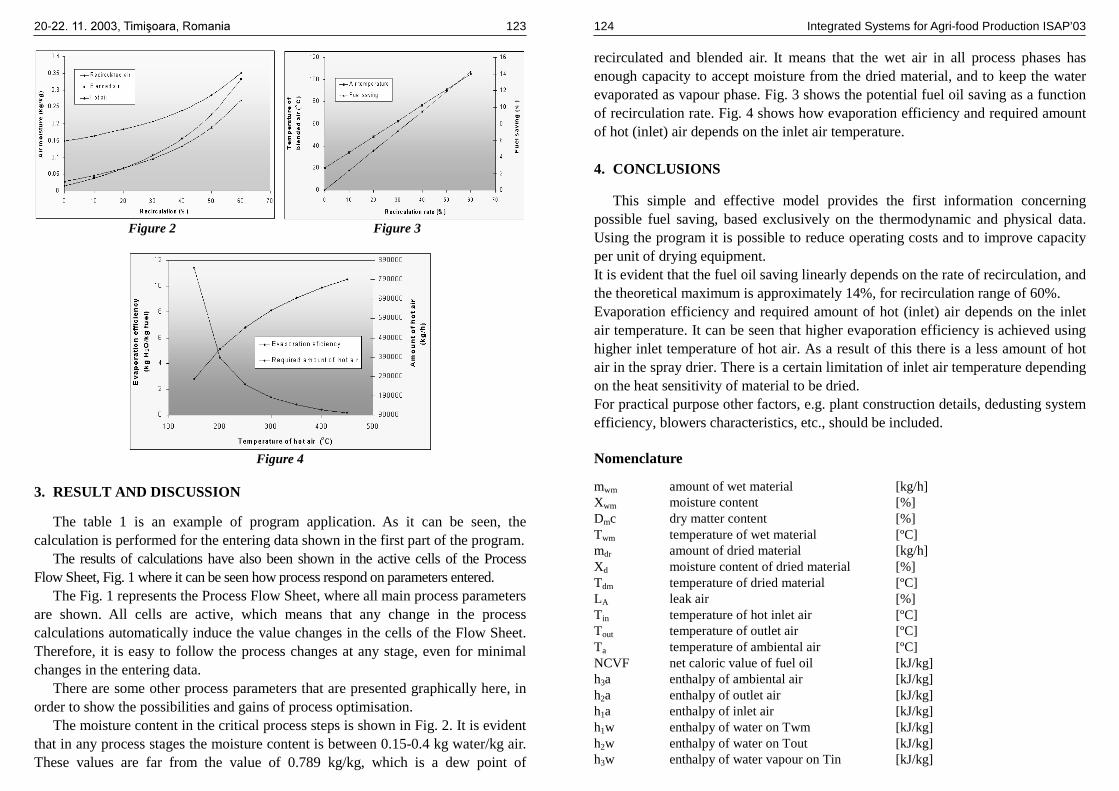
recirculated and blended air. It means that the wet air in all process phases has enough capacity to accept moisture from the dried material, and to keep the water evaporated as vapour phase. Fig. 3 shows the potential fuel oil saving as a function of recirculation rate. Fig. 4 shows how evaporation efficiency and required amount of hot (inlet) air depends on the inlet air temperature.
4. CONCLUSIONS
This simple and effective model provides the first information concerning possible fuel saving, based exclusively on the thermodynamic and physical data. Using the program it is possible to reduce operating costs and to improve capacity per unit of drying equipment. It is evident that the fuel oil saving linearly depends on the rate of recirculation, and the theoretical maximum is approximately 14%, for recirculation range of 60%. Evaporation efficiency and required amount of hot (inlet) air depends on the inlet air temperature. It can be seen that higher evaporation efficiency is achieved using higher inlet temperature of hot air. As a result of this there is a less amount of hot air in the spray drier. There is a certain limitation of inlet air temperature depending on the heat sensitivity of material to be dried. For practical purpose other factors, e.g. plant construction details, dedusting system efficiency, blowers characteristics, etc., should be included. Nomenclature
mwm amount of wet material [kg/h] Xwm moisture content [%] Dmc dry matter content [%] Twm temperature of wet material [ºC] mdr amount of dried material [kg/h] Xd moisture content of dried material [%] Tdm temperature of dried material [ºC] LA leak air [%] Tin temperature of hot inlet air [ºC] Tout temperature of outlet air [ºC] Ta temperature of ambiental air [ºC] NCVF net caloric value of fuel oil [kJ/kg] h3a enthalpy of ambiental air [kJ/kg] h2a enthalpy of outlet air [kJ/kg] h1a enthalpy of inlet air [kJ/kg] h1w enthalpy of water on Twm [kJ/kg] h2w enthalpy of water on Tout [kJ/kg] h3w enthalpy of water vapour on Tin [kJ/kg]
20-��������������7LPLúRDUD��5RPDQLD 125 126 Integrated Systems for Agri-food Production ISAP’03
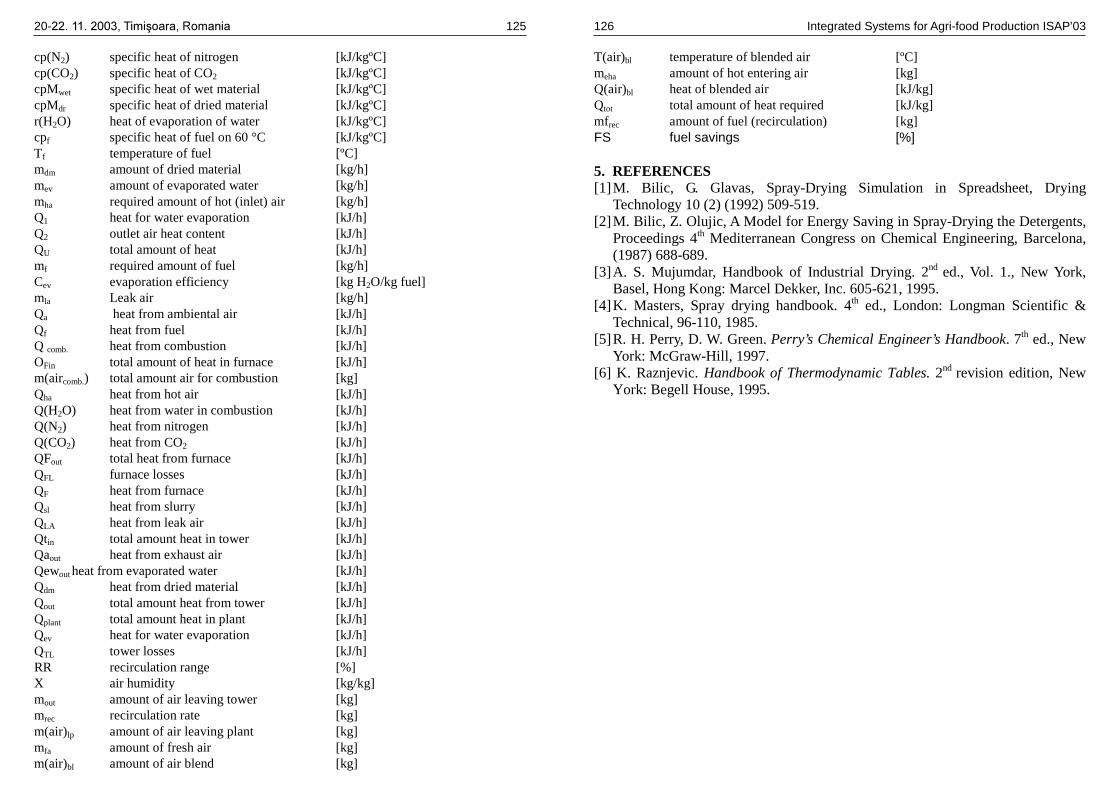
cp(N2) specific heat of nitrogen [kJ/kgºC] cp(CO2) specific heat of CO2 [kJ/kgºC] cpMwet specific heat of wet material [kJ/kgºC] cpMdr specific heat of dried material [kJ/kgºC] r(H2O) heat of evaporation of water [kJ/kgºC] cpf specific heat of fuel on 60 °C [kJ/kgºC] Tf temperature of fuel [ºC] mdm amount of dried material [kg/h] mev amount of evaporated water [kg/h] mha required amount of hot (inlet) air [kg/h] Q1 heat for water evaporation [kJ/h] Q2 outlet air heat content [kJ/h] QU total amount of heat [kJ/h] mf required amount of fuel [kg/h] Cev evaporation efficiency [kg H2O/kg fuel] mla Leak air [kg/h] Qa heat from ambiental air [kJ/h] Qf heat from fuel [kJ/h] Q comb. heat from combustion [kJ/h] OFin total amount of heat in furnace [kJ/h] m(aircomb.) total amount air for combustion [kg] Qha heat from hot air [kJ/h] Q(H2O) heat from water in combustion [kJ/h] Q(N2) heat from nitrogen [kJ/h] Q(CO2) heat from CO2 [kJ/h] QFout total heat from furnace [kJ/h] QFL furnace losses [kJ/h] QF heat from furnace [kJ/h] Qsl heat from slurry [kJ/h] QLA heat from leak air [kJ/h] Qtin total amount heat in tower [kJ/h] Qaout heat from exhaust air [kJ/h] Qewout heat from evaporated water [kJ/h] Qdm heat from dried material [kJ/h] Qout total amount heat from tower [kJ/h] Qplant total amount heat in plant [kJ/h] Qev heat for water evaporation [kJ/h] QTL tower losses [kJ/h] RR recirculation range [%] X air humidity [kg/kg] mout amount of air leaving tower [kg] mrec recirculation rate [kg] m(air)lp amount of air leaving plant [kg] mfa amount of fresh air [kg] m(air)bl amount of air blend [kg]
T(air)bl temperature of blended air [ºC] meha amount of hot entering air [kg] Q(air)bl heat of blended air [kJ/kg] Qtot total amount of heat required [kJ/kg] mfrec amount of fuel (recirculation) [kg] FS fuel savings [%] 5. REFERENCES [1] M. Bilic, G. Glavas, Spray-Drying Simulation in Spreadsheet, Drying
Technology 10 (2) (1992) 509-519. [2] M. Bilic, Z. Olujic, A Model for Energy Saving in Spray-Drying the Detergents,
Proceedings 4th Mediterranean Congress on Chemical Engineering, Barcelona, (1987) 688-689.
[3] A. S. Mujumdar, Handbook of Industrial Drying. 2nd ed., Vol. 1., New York, Basel, Hong Kong: Marcel Dekker, Inc. 605-621, 1995.
[4] K. Masters, Spray drying handbook. 4th ed., London: Longman Scientific & Technical, 96-110, 1985.
[5] R. H. Perry, D. W. Green. Perry’s Chemical Engineer’s Handbook. 7th ed., New York: McGraw-Hill, 1997.
[6] K. Raznjevic. Handbook of Thermodynamic Tables. 2nd revision edition, New York: Begell House, 1995.


