Embed Size (px)
Citation preview
5100 THOMPSON TERRACE, COLLEYVILLE TEXAS 76034 | F 682.223.1593 | P 682.223.1322
© 2021 MODERN GEOSCIENCES. ALL RIGHTS RESERVED.
WWW.MODERNGEOSCIENCES.COM
DATE
February 2021
PROJECT
20002
PADSITE INSPECTION
SUMMARY REPORT
CALENDAR YEAR 2020
PREPARED FOR
City of Denton
215 East McKinney Street
Denton, Texas 76201
PREPARED BY
______________________________________________
Zachary Tondre, MS, GIT
PROJECT MANAGER
REVIEWED BY
______________________________________________
Kenneth S. Tramm, PhD, PG, CHMM
SENIOR PROGRAM MANAGER
PROJECT 20002 | FEBRUARY 2021 | PAGE 2
WWW.MODERNGEOSCIENCES.COM
TABLE OF CONTENTS
1. INTRODUCTION ......................................................................................................................................... 5
1.1. Project Background ................................................................................................................................. 5
1.2. Program Design ....................................................................................................................................... 5
2. INSPECTION APPROACH ............................................................................................................................. 7
2.1. Ordinance and City Inspection Items ...................................................................................................... 7
2.2. Near‐Equipment Inspection .................................................................................................................... 7
2.3. Fencline Monitoring ................................................................................................................................ 9
2.4. Contingency Sampling ........................................................................................................................... 10
2.5. Pre and Post‐Inspection Activities ........................................................................................................ 12
3. INFRASTRUCTURE SUMMARY ...................................................................................................................13
3.1. City of Denton Padsites (Total in City Limits) ........................................................................................ 13
3.2. First Half 2020 (High, Moderate, and Selected Low Priority) ............................................................... 14
3.3. Second Half 2020 (High Prioirty) ........................................................................................................... 15
4. INSPECTION RESULTS ................................................................................................................................17
4.1. Identified Action Items ......................................................................................................................... 18
4.1.1. First Half 2020 ....................................................................................................................................... 18
4.1.2. Second Half 2020 .................................................................................................................................. 19
4.2. Addressed Action Items ........................................................................................................................ 21
4.2.1. First Half 2020 ....................................................................................................................................... 21
4.2.2. Second Half 2020 .................................................................................................................................. 22
4.3. Outstanding Action Items ..................................................................................................................... 24
4.3.1. First Half 2020 ....................................................................................................................................... 24
4.3.2. Second Half 2020 .................................................................................................................................. 25
5. ACTION ITEM RESULTS (DETAIL) ................................................................................................................27
5.1. Leaks (Methane) ................................................................................................................................... 27
5.1.1. First Half 2020 ....................................................................................................................................... 27
5.1.2. Second Half 2020 .................................................................................................................................. 28
5.2. NORM .................................................................................................................................................... 30
5.2.1. Total NORM Exceedances ..................................................................................................................... 30
5.2.1.1. First Half 2020 ....................................................................................................................................... 30
PROJECT 20002 | FEBRUARY 2021 | PAGE 3
WWW.MODERNGEOSCIENCES.COM
5.2.1.2. Second Half 2020 .................................................................................................................................. 31
5.2.2. Unlabeled NORM Exceedances ............................................................................................................. 32
5.2.2.1. First Half 2020 ....................................................................................................................................... 32
5.2.2.2. Second Half 2020 .................................................................................................................................. 33
5.3. Fenceline Monitoring ............................................................................................................................ 34
5.3.1. First Half 2020 ....................................................................................................................................... 34
5.3.2. Second Half 2020 .................................................................................................................................. 34
5.4. Compliance Monitoring ........................................................................................................................ 35
5.4.1. First Half 2020 ....................................................................................................................................... 35
5.4.2. Second Half 2020 .................................................................................................................................. 35
6. INSPECTION RESULTS (COMPREHENSIVE COMPARATIVE ANALYSIS) ..........................................................37
6.1. Leaks per Well (All Data) ....................................................................................................................... 37
6.2. NORM per Well (All Data) ..................................................................................................................... 38
6.2.1. Total NORM per Well ............................................................................................................................ 38
6.2.2. Unlabeled NORM per Well .................................................................................................................... 38
6.3. Action Items per Well (All Data) ........................................................................................................... 39
6.3.1. Identified Action Items per Well ........................................................................................................... 39
6.3.2. Addressed Action Items per Well ......................................................................................................... 39
6.3.3. Outstanding Action Items per Well....................................................................................................... 40
7. YEAR TO YEAR TRENDING .........................................................................................................................41
7.1. Identified Action Items Per Well ........................................................................................................... 41
7.2. Leaks per Well ....................................................................................................................................... 42
7.1. Unlabeled NORM per Well .................................................................................................................... 43
8. CONCLUSIONS AND RECOMMENDATIONS ................................................................................................44
8.1. Near‐Equipment Inspection .................................................................................................................. 44
8.2. Fenceline Monitoring ............................................................................................................................ 44
8.3. Outstanding Action Items ..................................................................................................................... 44
8.4. Operator Performance .......................................................................................................................... 46
8.5. Program Updates .................................................................................................................................. 46
9. IMPORTANT ACRONYMS...........................................................................................................................48
10. LIMITATIONS AND EXCEPTIONS ................................................................................................................50
PROJECT 20002 | FEBRUARY 2021 | PAGE 4
WWW.MODERNGEOSCIENCES.COM
TABLES
TABLE 1: PROGRAM DESIGN
TABLE 2: NEAR‐EQUIPMENT CRITERIA
TABLE 3: FENCELINE CRITERIA
TABLE 4: PADSITE DATA SUMMARY
TABLE 5: FIRST HALF OF 2020 PADSITE DATA SUMMARY
TABLE 6: FIRST HALF 2020 – OUTSTANDING ACTION ITEM SUMMARY
TABLE 7: SECOND HALF 2020 – OUTSTANDING ACTION ITEM SUMMARY
FIGURES
FIGURE 1: PADSITE LOCATION MAP
FIGURE 2: PADSITE INSPECTION SUMMARY MAP
PROJECT 20002 | FEBRUARY 2021 | PAGE 5
WWW.MODERNGEOSCIENCES.COM
1. INTRODUCTION
Modern Geosciences (Modern) is pleased to provide this report as a summary of our inspection results for the
City of Denton (City) concerning gas well padsites within the city limits during 2020.
1.1. PROJECT BACKGROUND Modern’s staff has been providing technical support and inspection services to municipalities addressing urban
oil and gas concerns for over a decade. As part of these efforts, our staff has contributed to numerous ordinance
revisions, gas drilling task forces, technical presentations and papers, performed continuous air monitoring
events, inspected thousands of wells across Texas, and aided in the identification of hazardous site conditions
that would have otherwise been left unaddressed.
As part of the City’s desire to enhance its inspection efforts, Modern was asked to provide programmatic
support in 2018 that would ensure enough high‐resolution data was available to the community, operators, and
city staff for prioritization of any repairs or corrective action needed.
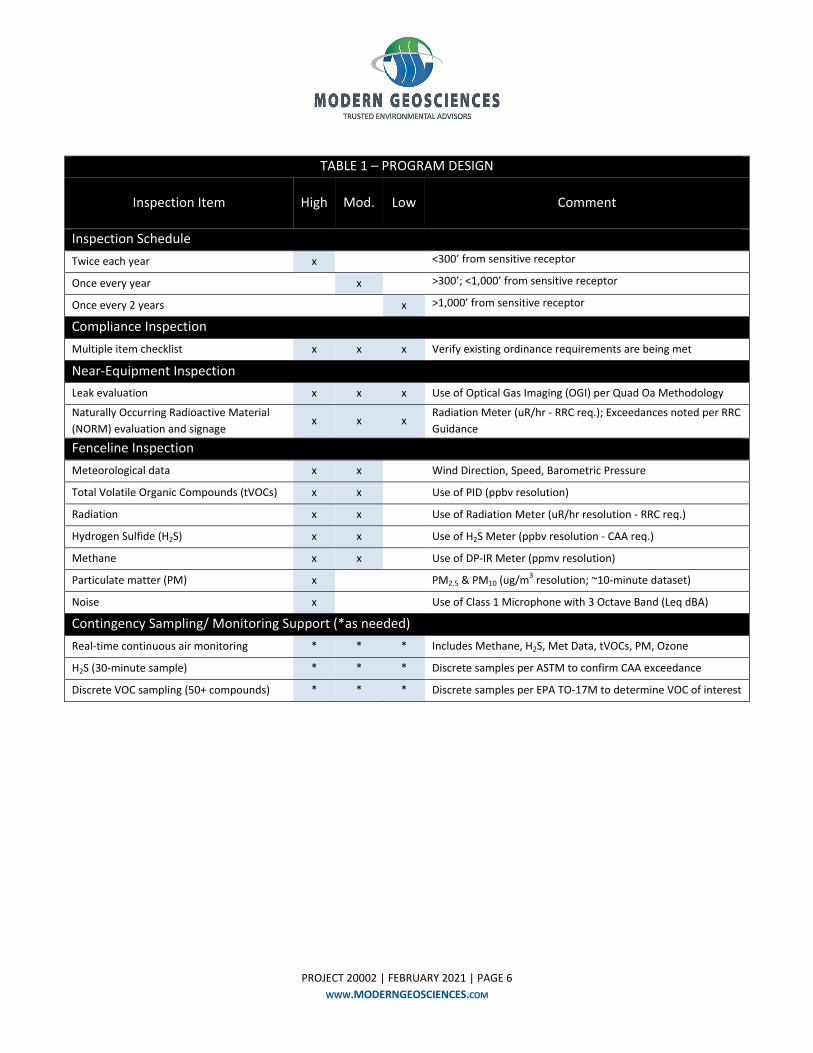
1.2. PROGRAM DESIGN
Our inspection program was tailored to meet the City’s project goals of:
Maintaining a comprehensive GIS‐based tracking program for each padsite inclusive of existing
infrastructure (e.g., wells, separators, compressors);
Identifying leaks associated with each padsite in a manner that can be tracked and communicated
efficiently;
Identifying non‐compliance concerns associated with each padsite (e.g., corrosion issues, spills/releases,
unmarked equipment with excessive radiation);
Collection of air monitoring data at padsite fencelines when near sensitive receptors;
Contingency sampling when fenceline data suggested significant environmental impact may affect
neighboring areas; and
A succinct reporting format that provides a clear summary of our findings, highlights outstanding action
items, and allowed integration with the City’s online access to the reports.
To ensure the padsites were adequately evaluated, the City prioritized inspections as low, moderate, and high
based on proximity to sensitive receptors (e.g., schools, residential areas). Padsite inspection efforts include the
performance of a compliance evaluation (e.g., signage, equipment maintenance, fire department access,
landscaping, safety requirements) with additional leak detection efforts to better identify and communicate
potential leaks and/or fugitive emission concerns. A summary of the program design is provided below in Table
1.
PROJECT 20002 | FEBRUARY 2021 | PAGE 6
WWW.MODERNGEOSCIENCES.COM
TABLE 1 – PROGRAM DESIGN
Inspection Item High Mod. Low Comment
Inspection Schedule
Twice each year x <300’ from sensitive receptor
Once every year x >300’; <1,000’ from sensitive receptor
Once every 2 years x >1,000’ from sensitive receptor
Compliance Inspection
Multiple item checklist x x x Verify existing ordinance requirements are being met
Near‐Equipment Inspection
Leak evaluation x x x Use of Optical Gas Imaging (OGI) per Quad Oa Methodology
Naturally Occurring Radioactive Material
(NORM) evaluation and signage x x x
Radiation Meter (uR/hr ‐ RRC req.); Exceedances noted per RRC
Guidance
Fenceline Inspection
Meteorological data x x Wind Direction, Speed, Barometric Pressure
Total Volatile Organic Compounds (tVOCs) x x Use of PID (ppbv resolution)
Radiation x x Use of Radiation Meter (uR/hr resolution ‐ RRC req.)
Hydrogen Sulfide (H2S) x x Use of H2S Meter (ppbv resolution ‐ CAA req.)
Methane x x Use of DP‐IR Meter (ppmv resolution)
Particulate matter (PM) x PM2.5 & PM10 (ug/m3 resolution; ~10‐minute dataset)
Noise x Use of Class 1 Microphone with 3 Octave Band (Leq dBA)
Contingency Sampling/ Monitoring Support (*as needed)
Real‐time continuous air monitoring * * * Includes Methane, H2S, Met Data, tVOCs, PM, Ozone
H2S (30‐minute sample) * * * Discrete samples per ASTM to confirm CAA exceedance
Discrete VOC sampling (50+ compounds) * * * Discrete samples per EPA TO‐17M to determine VOC of interest
PROJECT 20002 | FEBRUARY 2021 | PAGE 7
WWW.MODERNGEOSCIENCES.COM
2. INSPECTION APPROACH
2.1. ORDINANCE AND CITY INSPECTION ITEMS
Prior to project initiation, Modern performs a review of current ordinance and city inspection requirements
(e.g., signage, equipment maintenance, fire department access, landscaping, safety requirements) to be
included in each inspection effort in the form of a city‐approved checklist.
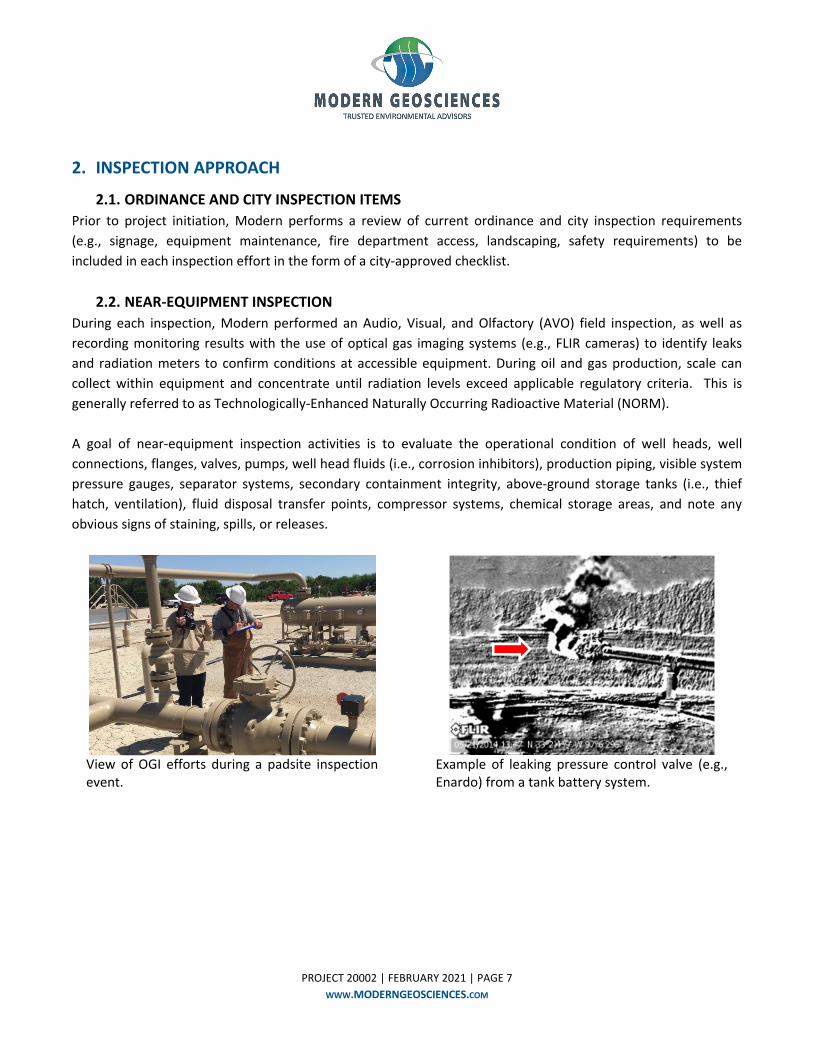
2.2. NEAR‐EQUIPMENT INSPECTION
During each inspection, Modern performed an Audio, Visual, and Olfactory (AVO) field inspection, as well as
recording monitoring results with the use of optical gas imaging systems (e.g., FLIR cameras) to identify leaks
and radiation meters to confirm conditions at accessible equipment. During oil and gas production, scale can
collect within equipment and concentrate until radiation levels exceed applicable regulatory criteria. This is
generally referred to as Technologically‐Enhanced Naturally Occurring Radioactive Material (NORM).
A goal of near‐equipment inspection activities is to evaluate the operational condition of well heads, well
connections, flanges, valves, pumps, well head fluids (i.e., corrosion inhibitors), production piping, visible system
pressure gauges, separator systems, secondary containment integrity, above‐ground storage tanks (i.e., thief
hatch, ventilation), fluid disposal transfer points, compressor systems, chemical storage areas, and note any
obvious signs of staining, spills, or releases.
View of OGI efforts during a padsite inspection event.
Example of leaking pressure control valve (e.g., Enardo) from a tank battery system.
PROJECT 20002 | FEBRUARY 2021 | PAGE 8
WWW.MODERNGEOSCIENCES.COM
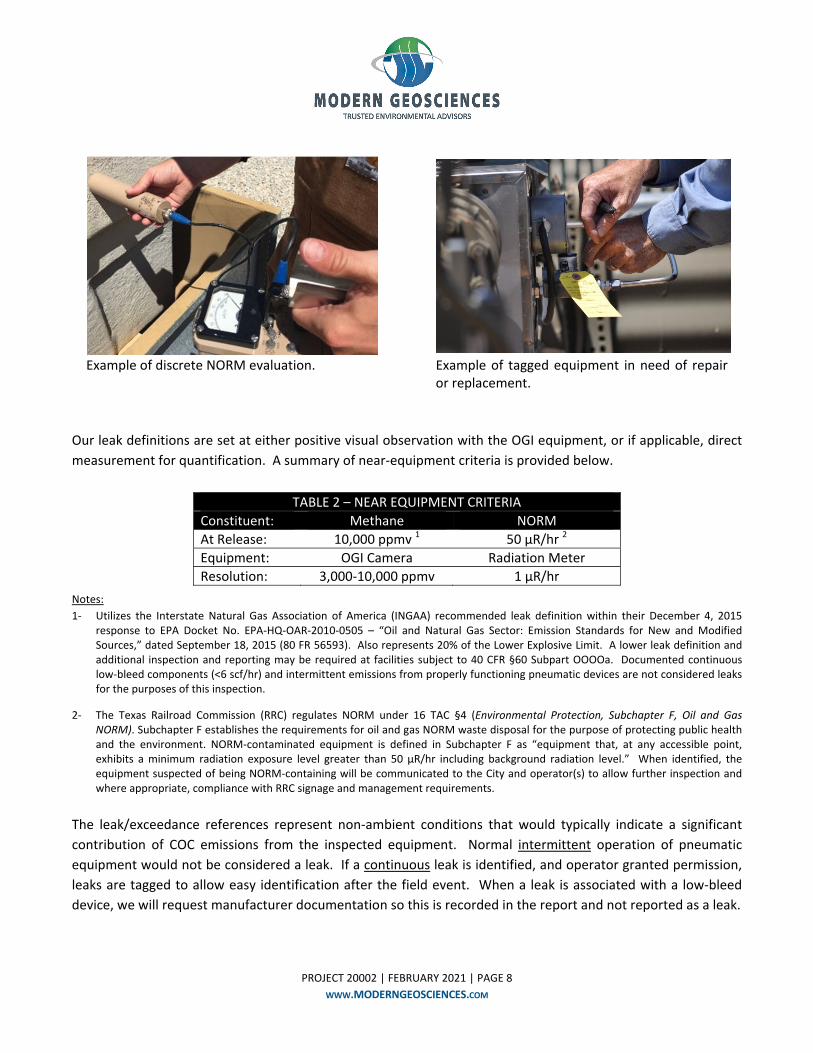
Example of discrete NORM evaluation. Example of tagged equipment in need of repair
or replacement.
Our leak definitions are set at either positive visual observation with the OGI equipment, or if applicable, direct
measurement for quantification. A summary of near‐equipment criteria is provided below.
Notes:
1‐ Utilizes the Interstate Natural Gas Association of America (INGAA) recommended leak definition within their December 4, 2015 response to EPA Docket No. EPA‐HQ‐OAR‐2010‐0505 – “Oil and Natural Gas Sector: Emission Standards for New and Modified Sources,” dated September 18, 2015 (80 FR 56593). Also represents 20% of the Lower Explosive Limit. A lower leak definition and additional inspection and reporting may be required at facilities subject to 40 CFR §60 Subpart OOOOa. Documented continuous low‐bleed components (<6 scf/hr) and intermittent emissions from properly functioning pneumatic devices are not considered leaks for the purposes of this inspection.
2‐ The Texas Railroad Commission (RRC) regulates NORM under 16 TAC §4 (Environmental Protection, Subchapter F, Oil and Gas NORM). Subchapter F establishes the requirements for oil and gas NORM waste disposal for the purpose of protecting public health and the environment. NORM‐contaminated equipment is defined in Subchapter F as “equipment that, at any accessible point, exhibits a minimum radiation exposure level greater than 50 µR/hr including background radiation level.” When identified, the equipment suspected of being NORM‐containing will be communicated to the City and operator(s) to allow further inspection and where appropriate, compliance with RRC signage and management requirements.
The leak/exceedance references represent non‐ambient conditions that would typically indicate a significant
contribution of COC emissions from the inspected equipment. Normal intermittent operation of pneumatic
equipment would not be considered a leak. If a continuous leak is identified, and operator granted permission,
leaks are tagged to allow easy identification after the field event. When a leak is associated with a low‐bleed
device, we will request manufacturer documentation so this is recorded in the report and not reported as a leak.
TABLE 2 – NEAR EQUIPMENT CRITERIA
Constituent: Methane NORM
At Release: 10,000 ppmv 1 50 µR/hr 2
Equipment: OGI Camera Radiation Meter
Resolution: 3,000‐10,000 ppmv 1 µR/hr
PROJECT 20002 | FEBRUARY 2021 | PAGE 9
WWW.MODERNGEOSCIENCES.COM
The OGI system is verified in the field prior to leak detection screening using a known standard to confirm
methane leak detection goals are met. In general, this includes verification at both three (3) and 10 meters if
screening will be performed within these distances. Additionally, all other equipment used for near‐equipment
is calibrated per manufacturer specifications and verified daily prior to inspections.
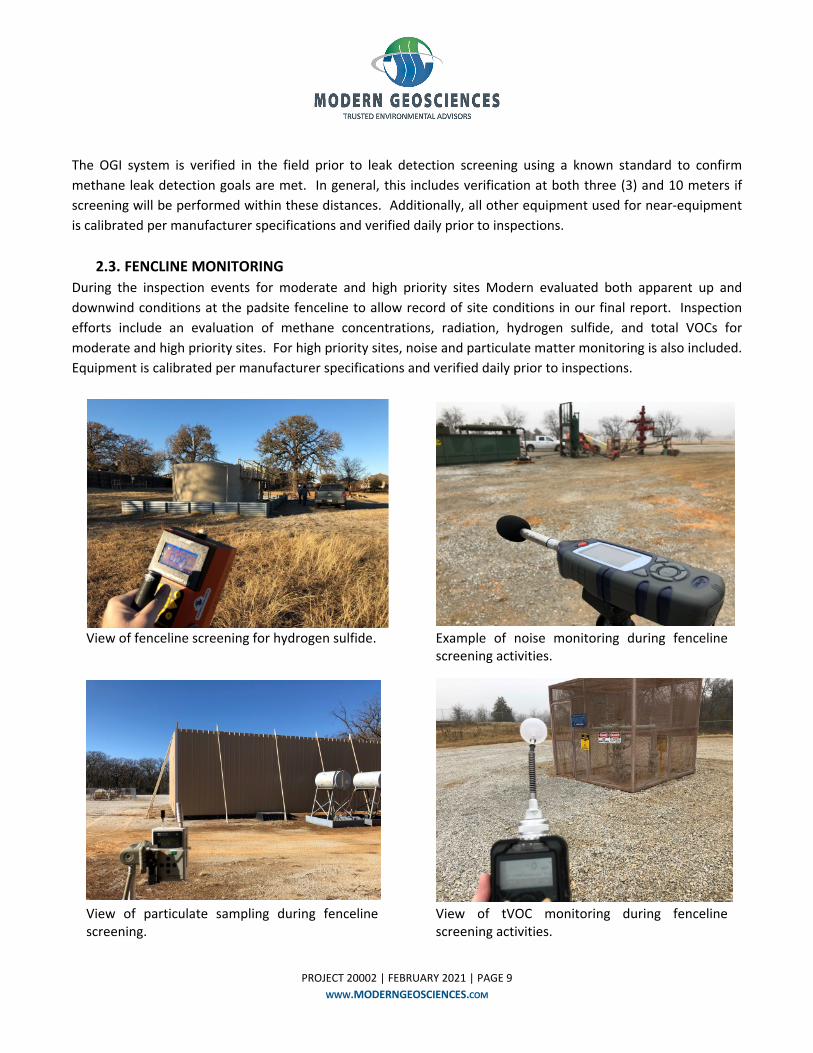
2.3. FENCLINE MONITORING
During the inspection events for moderate and high priority sites Modern evaluated both apparent up and
downwind conditions at the padsite fenceline to allow record of site conditions in our final report. Inspection
efforts include an evaluation of methane concentrations, radiation, hydrogen sulfide, and total VOCs for
moderate and high priority sites. For high priority sites, noise and particulate matter monitoring is also included.
Equipment is calibrated per manufacturer specifications and verified daily prior to inspections.
View of fenceline screening for hydrogen sulfide. Example of noise monitoring during fenceline screening activities.
View of particulate sampling during fenceline screening.
View of tVOC monitoring during fenceline screening activities.
PROJECT 20002 | FEBRUARY 2021 | PAGE 10
WWW.MODERNGEOSCIENCES.COM
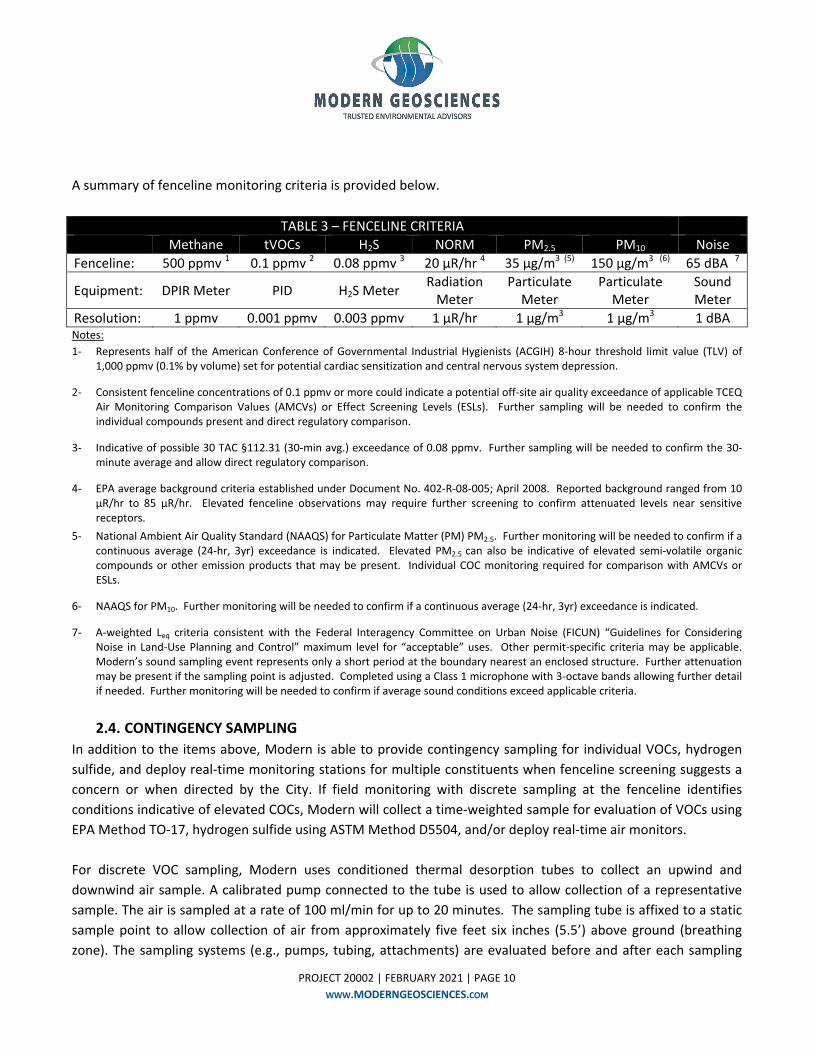
A summary of fenceline monitoring criteria is provided below.
Notes:
1‐ Represents half of the American Conference of Governmental Industrial Hygienists (ACGIH) 8‐hour threshold limit value (TLV) of 1,000 ppmv (0.1% by volume) set for potential cardiac sensitization and central nervous system depression.
2‐ Consistent fenceline concentrations of 0.1 ppmv or more could indicate a potential off‐site air quality exceedance of applicable TCEQ Air Monitoring Comparison Values (AMCVs) or Effect Screening Levels (ESLs). Further sampling will be needed to confirm the individual compounds present and direct regulatory comparison.
3‐ Indicative of possible 30 TAC §112.31 (30‐min avg.) exceedance of 0.08 ppmv. Further sampling will be needed to confirm the 30‐minute average and allow direct regulatory comparison.
4‐ EPA average background criteria established under Document No. 402‐R‐08‐005; April 2008. Reported background ranged from 10 µR/hr to 85 µR/hr. Elevated fenceline observations may require further screening to confirm attenuated levels near sensitive receptors.
5‐ National Ambient Air Quality Standard (NAAQS) for Particulate Matter (PM) PM2.5. Further monitoring will be needed to confirm if a continuous average (24‐hr, 3yr) exceedance is indicated. Elevated PM2.5 can also be indicative of elevated semi‐volatile organic compounds or other emission products that may be present. Individual COC monitoring required for comparison with AMCVs or ESLs.
6‐ NAAQS for PM10. Further monitoring will be needed to confirm if a continuous average (24‐hr, 3yr) exceedance is indicated.
7‐ A‐weighted Leq criteria consistent with the Federal Interagency Committee on Urban Noise (FICUN) “Guidelines for Considering Noise in Land‐Use Planning and Control” maximum level for “acceptable” uses. Other permit‐specific criteria may be applicable. Modern’s sound sampling event represents only a short period at the boundary nearest an enclosed structure. Further attenuation may be present if the sampling point is adjusted. Completed using a Class 1 microphone with 3‐octave bands allowing further detail if needed. Further monitoring will be needed to confirm if average sound conditions exceed applicable criteria.
2.4. CONTINGENCY SAMPLING
In addition to the items above, Modern is able to provide contingency sampling for individual VOCs, hydrogen
sulfide, and deploy real‐time monitoring stations for multiple constituents when fenceline screening suggests a
concern or when directed by the City. If field monitoring with discrete sampling at the fenceline identifies
conditions indicative of elevated COCs, Modern will collect a time‐weighted sample for evaluation of VOCs using
EPA Method TO‐17, hydrogen sulfide using ASTM Method D5504, and/or deploy real‐time air monitors.
For discrete VOC sampling, Modern uses conditioned thermal desorption tubes to collect an upwind and
downwind air sample. A calibrated pump connected to the tube is used to allow collection of a representative
sample. The air is sampled at a rate of 100 ml/min for up to 20 minutes. The sampling tube is affixed to a static
sample point to allow collection of air from approximately five feet six inches (5.5’) above ground (breathing
zone). The sampling systems (e.g., pumps, tubing, attachments) are evaluated before and after each sampling
TABLE 3 – FENCELINE CRITERIA
Methane tVOCs H2S NORM PM2.5 PM10 Noise
Fenceline: 500 ppmv 1 0.1 ppmv 2 0.08 ppmv 3 20 µR/hr 4 35 µg/m3 (5) 150 µg/m3 (6) 65 dBA 7
Equipment: DPIR Meter PID H2S Meter Radiation Meter
Particulate Meter
Particulate Meter
Sound Meter
Resolution: 1 ppmv 0.001 ppmv 0.003 ppmv 1 µR/hr 1 µg/m3 1 µg/m3 1 dBA
PROJECT 20002 | FEBRUARY 2021 | PAGE 11
WWW.MODERNGEOSCIENCES.COM
event to ensure sample integrity is maintained. Upon completion of the sampling event, the tubes are placed in
a sealed inert container and placed on ice and sampling information (e.g., tube serial number, sample ID, time,
flow rate) is recorded on the chain of custody. The sampling and monitoring efforts are performed in
accordance with applicable elements of EPA Method TO‐17.
Following sample collection, the thermal desorption tubes are analyzed by Modern using a gas
chromatograph/mass spectrometer (GC/MS) and thermal desorber to allow identification and quantification of
individual chemicals of concern. All analyses are performed in accordance with Modern’s internal Quality
Assurance Project Plan (QAPP) governing sample analysis procedure.
Additionally, Modern reviews the resulting chromatograms of each sample using both the National Institute of
Standards (NIST) Library and the Automated Mass Spectral De‐covolution and Identification Software (AMDIS)
library to further evaluate any Tentatively Identified Compounds (TICs) not within the current calibration library.
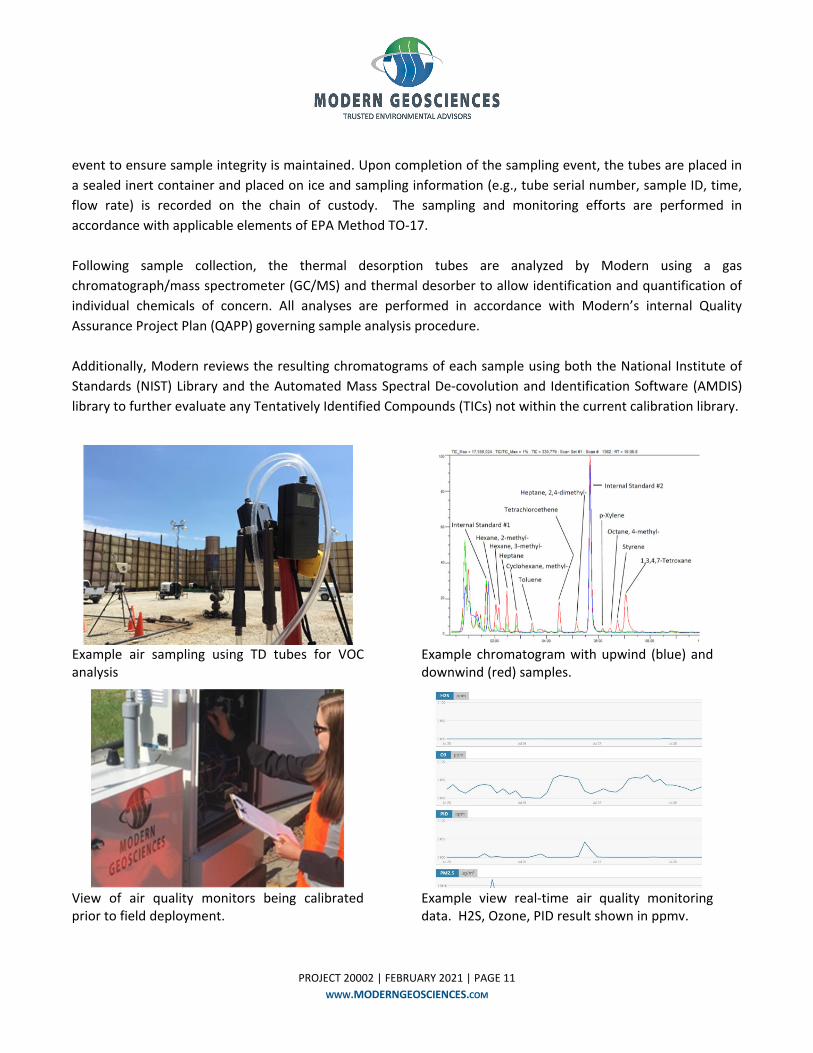
Example air sampling using TD tubes for VOC analysis
Example chromatogram with upwind (blue) and downwind (red) samples.
View of air quality monitors being calibrated prior to field deployment.
Example view real‐time air quality monitoring data. H2S, Ozone, PID result shown in ppmv.
PROJECT 20002 | FEBRUARY 2021 | PAGE 12
WWW.MODERNGEOSCIENCES.COM
2.5. PRE AND POST‐INSPECTION ACTIVITIES Modern coordinates with each operator prior to the inspection so a representative can be available to address
leaks and allow immediate re‐inspection when they are present. Additionally, Modern communicates the results
of the inspection with the operators so any corrective action completed after the inspection, within
approximately two (2) weeks, can be recorded in the final report.
An individual padsite inspection report was prepared for each padsite with the results of the inspection, figure
with equipment inspected (unique identifiers), photographs of leaking equipment (e.g., OGI pictures), graph of
noise (sound pressure) results and pure‐tone evaluation (spectral analysis), and notation of Action Items
requiring further attention. Any outstanding issues identified, including ordinance deficiencies, leaks still
requiring attention, required NORM labels, etc., are summarized in Modern’s inspection reports as “Outstanding
Action Items.”
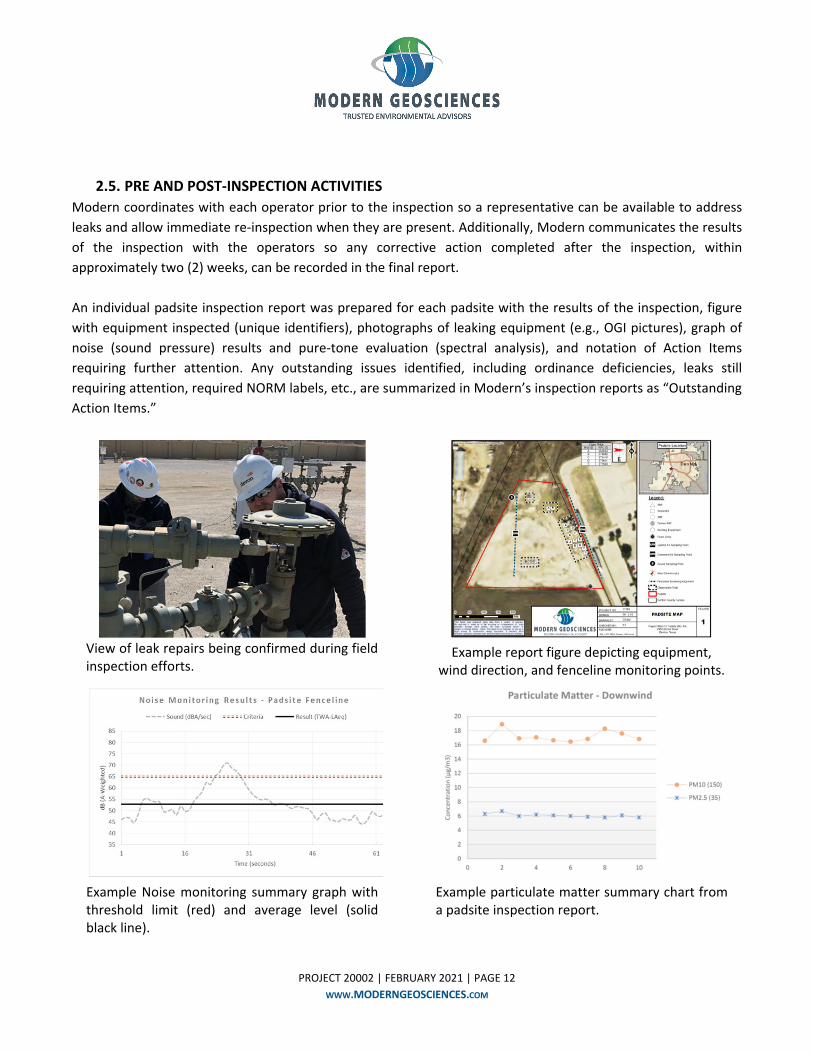
View of leak repairs being confirmed during field inspection efforts.
Example report figure depicting equipment, wind direction, and fenceline monitoring points.
Example Noise monitoring summary graph with threshold limit (red) and average level (solid black line).
Example particulate matter summary chart from a padsite inspection report.
PROJECT 20002 | FEBRUARY 2021 | PAGE 13
WWW.MODERNGEOSCIENCES.COM
3. INFRASTRUCTURE SUMMARY
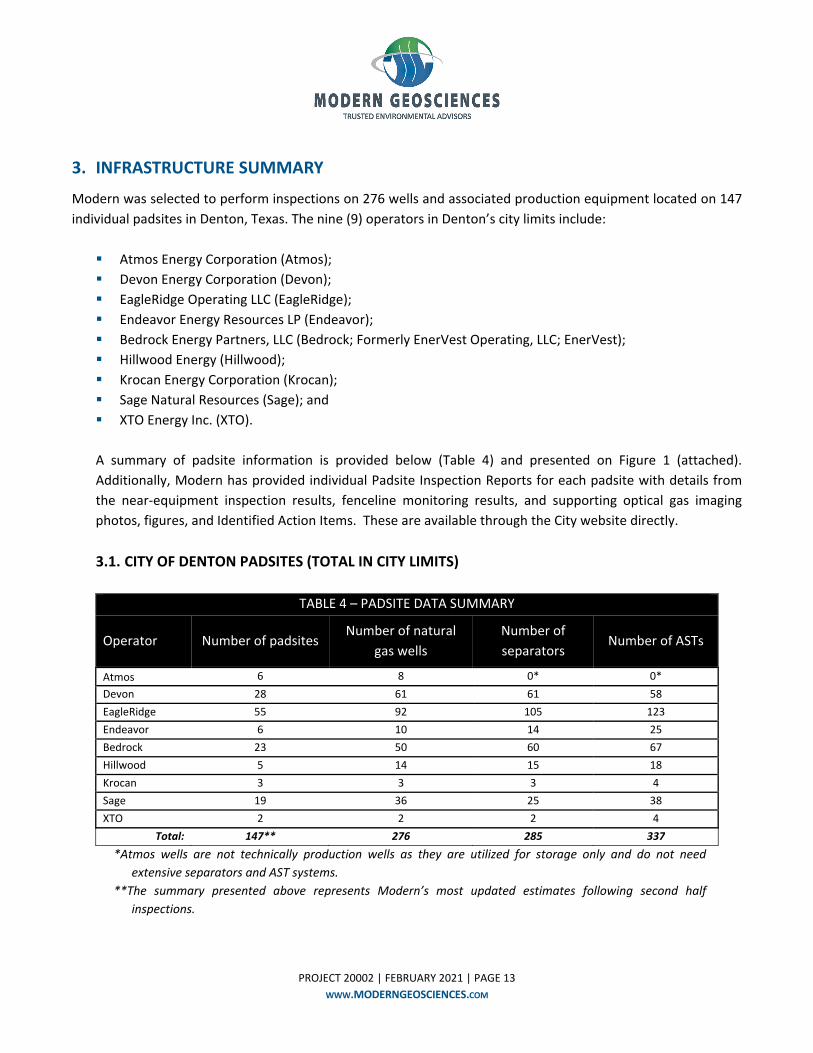
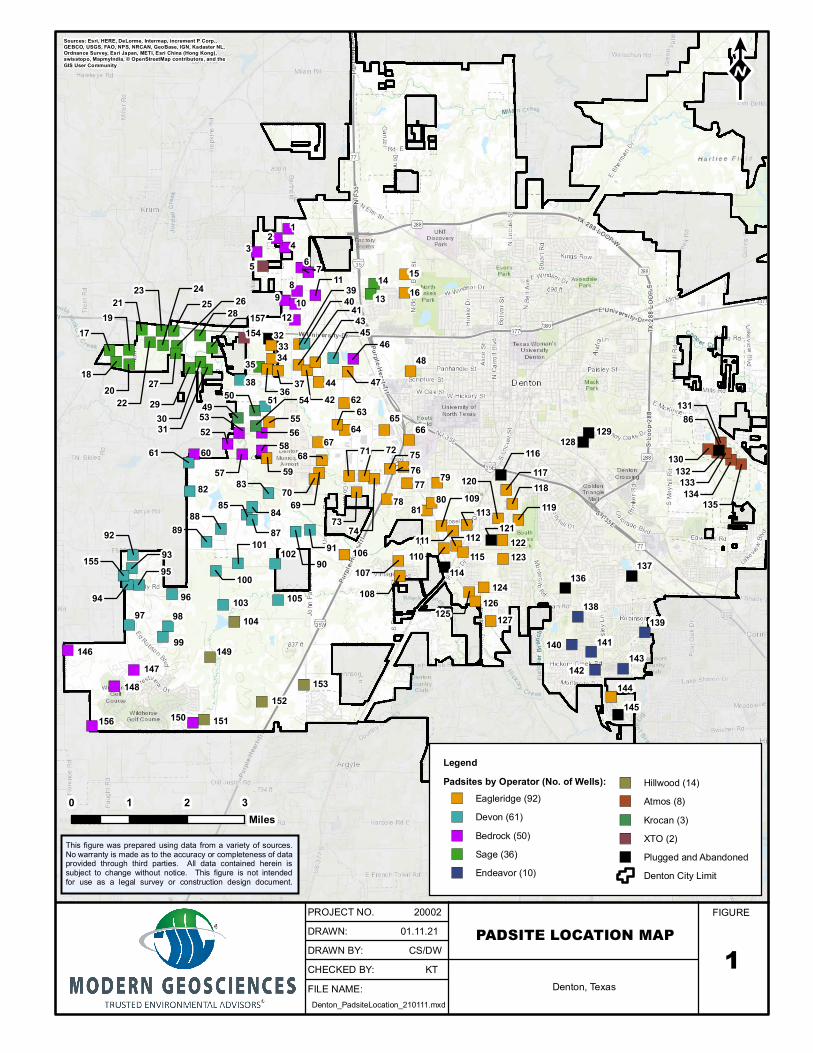
Modern was selected to perform inspections on 276 wells and associated production equipment located on 147
individual padsites in Denton, Texas. The nine (9) operators in Denton’s city limits include:
Atmos Energy Corporation (Atmos);
Devon Energy Corporation (Devon);
EagleRidge Operating LLC (EagleRidge);
Endeavor Energy Resources LP (Endeavor);
Bedrock Energy Partners, LLC (Bedrock; Formerly EnerVest Operating, LLC; EnerVest);
Hillwood Energy (Hillwood);
Krocan Energy Corporation (Krocan);
Sage Natural Resources (Sage); and
XTO Energy Inc. (XTO).
A summary of padsite information is provided below (Table 4) and presented on Figure 1 (attached).
Additionally, Modern has provided individual Padsite Inspection Reports for each padsite with details from
the near‐equipment inspection results, fenceline monitoring results, and supporting optical gas imaging
photos, figures, and Identified Action Items. These are available through the City website directly.
3.1. CITY OF DENTON PADSITES (TOTAL IN CITY LIMITS)
TABLE 4 – PADSITE DATA SUMMARY
Operator Number of padsites Number of natural
gas wells
Number of
separators Number of ASTs
Atmos 6 8 0* 0*
Devon 28 61 61 58
EagleRidge 55 92 105 123
Endeavor 6 10 14 25
Bedrock 23 50 60 67
Hillwood 5 14 15 18
Krocan 3 3 3 4
Sage 19 36 25 38
XTO 2 2 2 4
Total: 147** 276 285 337
*Atmos wells are not technically production wells as they are utilized for storage only and do not need
extensive separators and AST systems.
**The summary presented above represents Modern’s most updated estimates following second half
inspections.
PROJECT 20002 | FEBRUARY 2021 | PAGE 14
WWW.MODERNGEOSCIENCES.COM
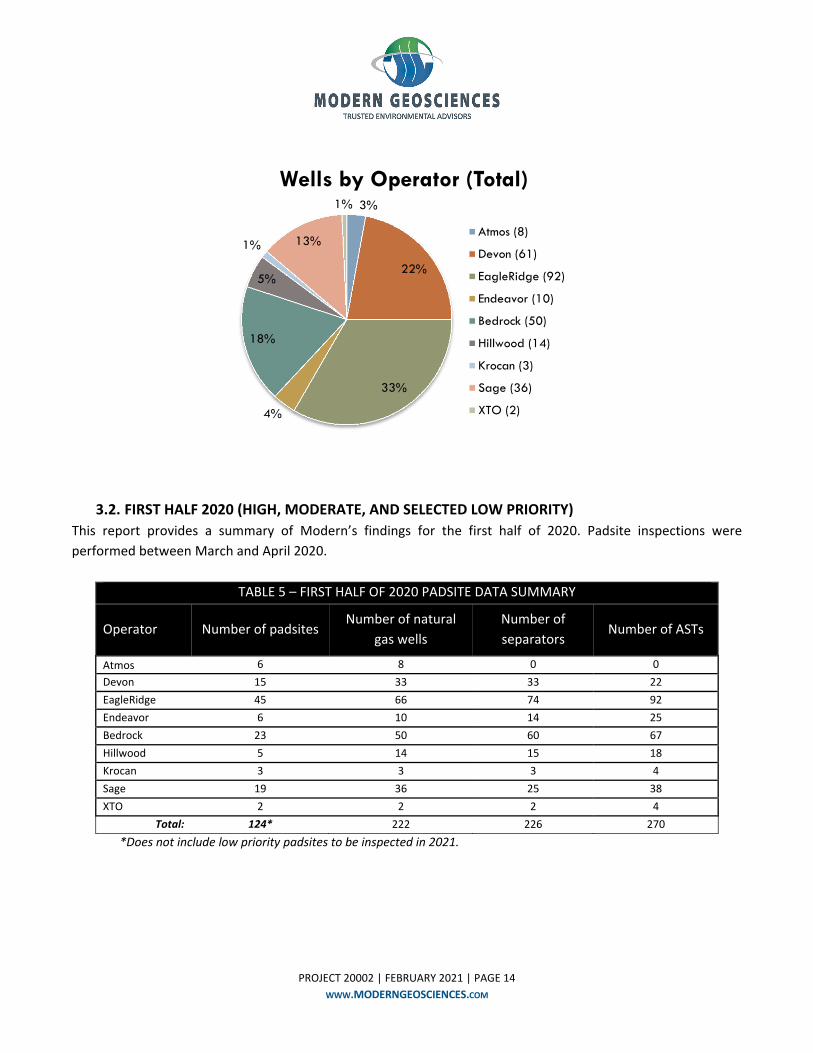
3.2. FIRST HALF 2020 (HIGH, MODERATE, AND SELECTED LOW PRIORITY)
This report provides a summary of Modern’s findings for the first half of 2020. Padsite inspections were
performed between March and April 2020.
TABLE 5 – FIRST HALF OF 2020 PADSITE DATA SUMMARY
Operator Number of padsites Number of natural
gas wells
Number of
separators Number of ASTs
Atmos 6 8 0 0
Devon 15 33 33 22
EagleRidge 45 66 74 92
Endeavor 6 10 14 25
Bedrock 23 50 60 67
Hillwood 5 14 15 18
Krocan 3 3 3 4
Sage 19 36 25 38
XTO 2 2 2 4
Total: 124* 222 226 270
*Does not include low priority padsites to be inspected in 2021.
3%
22%
33%
4%
18%
5%
1% 13%
1%
Wells by Operator (Total)
Atmos (8)
Devon (61)
EagleRidge (92)
Endeavor (10)
Bedrock (50)
Hillwood (14)
Krocan (3)
Sage (36)
XTO (2)

PROJECT 20002 | FEBRUARY 2021 | PAGE 15
WWW.MODERNGEOSCIENCES.COM
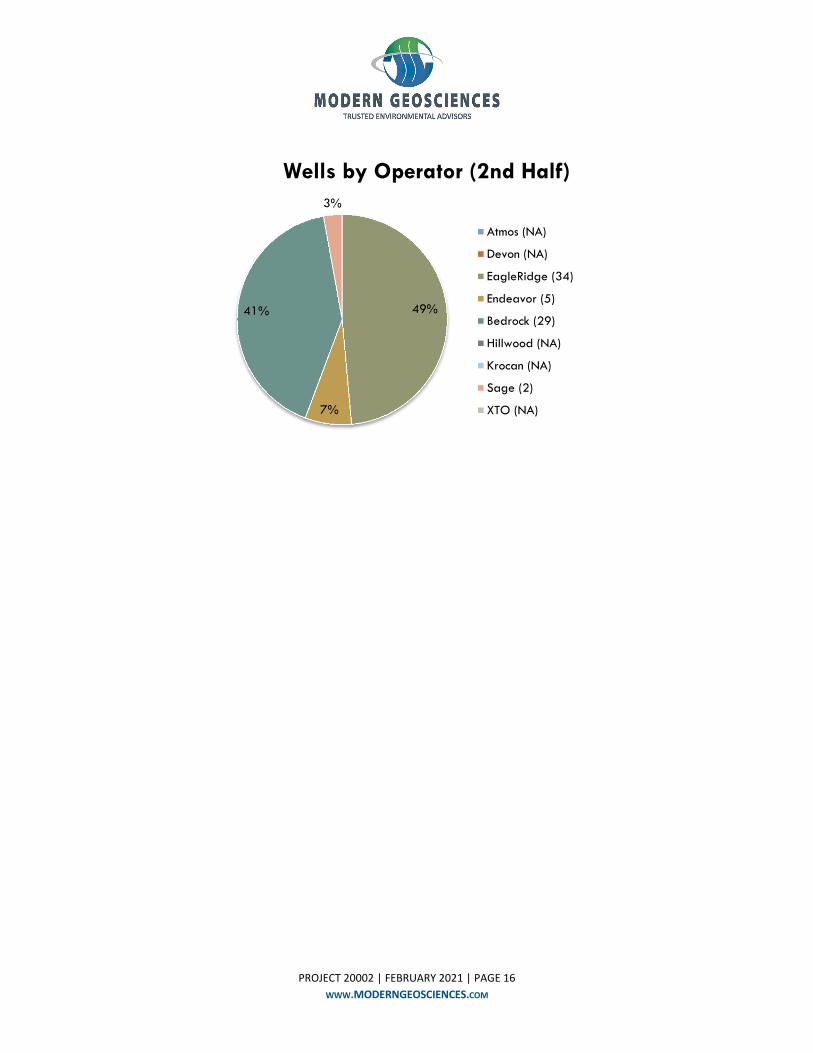
3.3. SECOND HALF 2020 (HIGH PRIOIRTY) This report provides a summary of Modern’s findings for the second half of 2020. Padsite inspections were
performed in October 2020.
TABLE 5 – SECOND HALF OF 2020 PADSITE DATA SUMMARY
Operator Number of padsites Number of natural
gas wells
Number of
separators Number of ASTs
Atmos 0 0 0 0
Devon 0 0 0 0
EagleRidge 18 34 39 43
Endeavor 4 5 6 11
Bedrock 9 29 35 45
Hillwood 0 0 0 0
Krocan 0 0 0 0
Sage 2 2 2 1
XTO 0 0 0 0
Total: 33* 70 82 100
*Only includes high priority padsites.
4%
15%
30%
4%
23%
6%
1%16%
1%
Wells by Operator (1st Half)
Atmos (8)
Devon (33)
EagleRidge (66)
Endeavor (10)
Bedrock (50)
Hillwood (14)
Krocan (3)
Sage (36)
XTO (2)
PROJECT 20002 | FEBRUARY 2021 | PAGE 16
WWW.MODERNGEOSCIENCES.COM
49%
7%
41%
3%
Wells by Operator (2nd Half)
Atmos (NA)
Devon (NA)
EagleRidge (34)
Endeavor (5)
Bedrock (29)
Hillwood (NA)
Krocan (NA)
Sage (2)
XTO (NA)
PROJECT 20002 | FEBRUARY 2021 | PAGE 17
WWW.MODERNGEOSCIENCES.COM
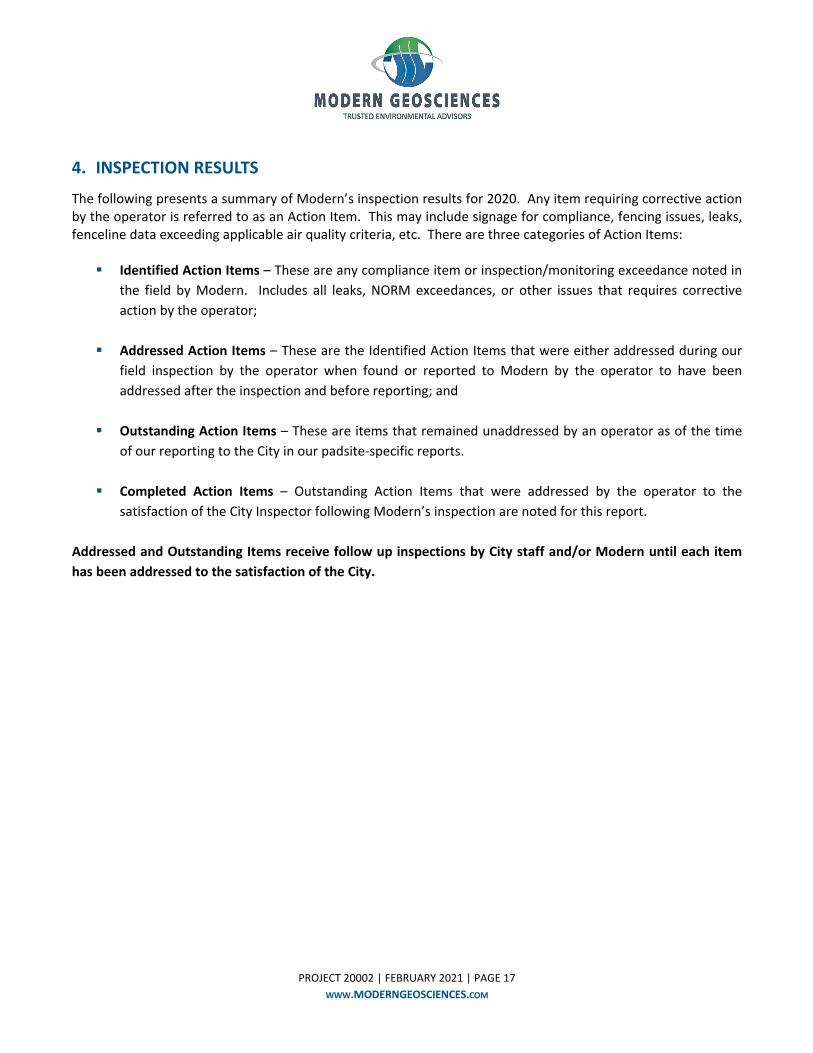
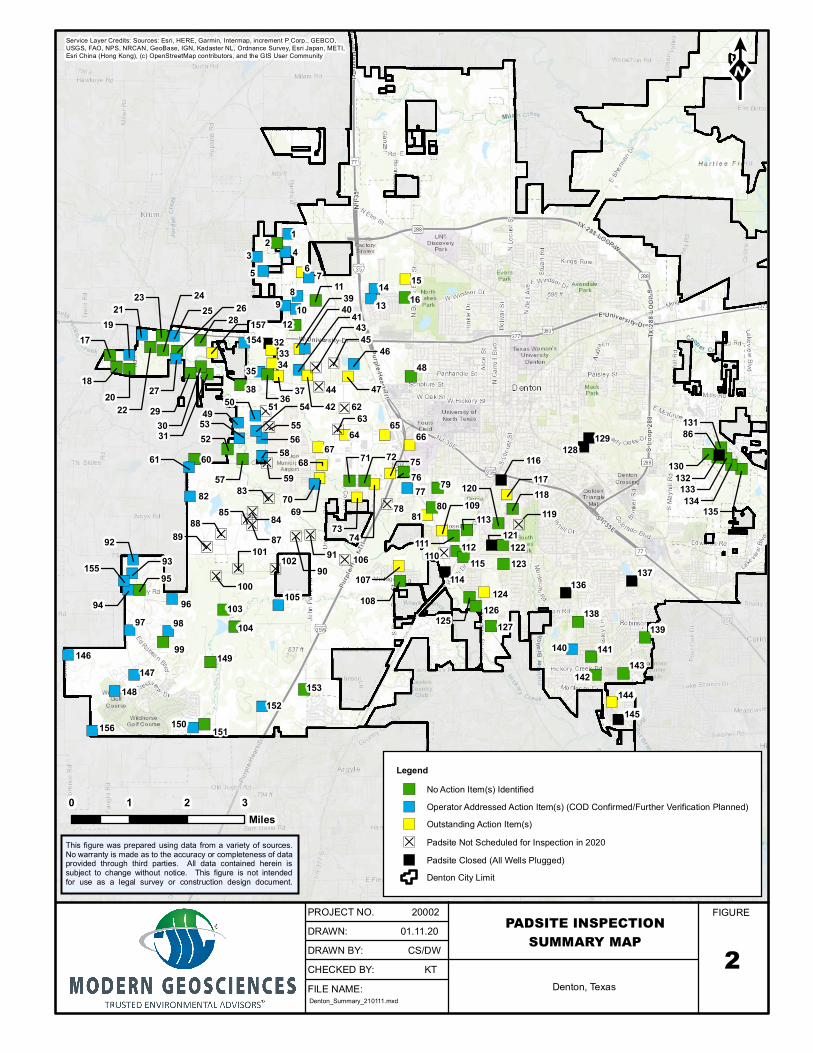
4. INSPECTION RESULTS
The following presents a summary of Modern’s inspection results for 2020. Any item requiring corrective action by the operator is referred to as an Action Item. This may include signage for compliance, fencing issues, leaks, fenceline data exceeding applicable air quality criteria, etc. There are three categories of Action Items: Identified Action Items – These are any compliance item or inspection/monitoring exceedance noted in
the field by Modern. Includes all leaks, NORM exceedances, or other issues that requires corrective
action by the operator;
Addressed Action Items – These are the Identified Action Items that were either addressed during our
field inspection by the operator when found or reported to Modern by the operator to have been
addressed after the inspection and before reporting; and
Outstanding Action Items – These are items that remained unaddressed by an operator as of the time
of our reporting to the City in our padsite‐specific reports.
Completed Action Items – Outstanding Action Items that were addressed by the operator to the
satisfaction of the City Inspector following Modern’s inspection are noted for this report.
Addressed and Outstanding Items receive follow up inspections by City staff and/or Modern until each item
has been addressed to the satisfaction of the City.
PROJECT 20002 | FEBRUARY 2021 | PAGE 18
WWW.MODERNGEOSCIENCES.COM
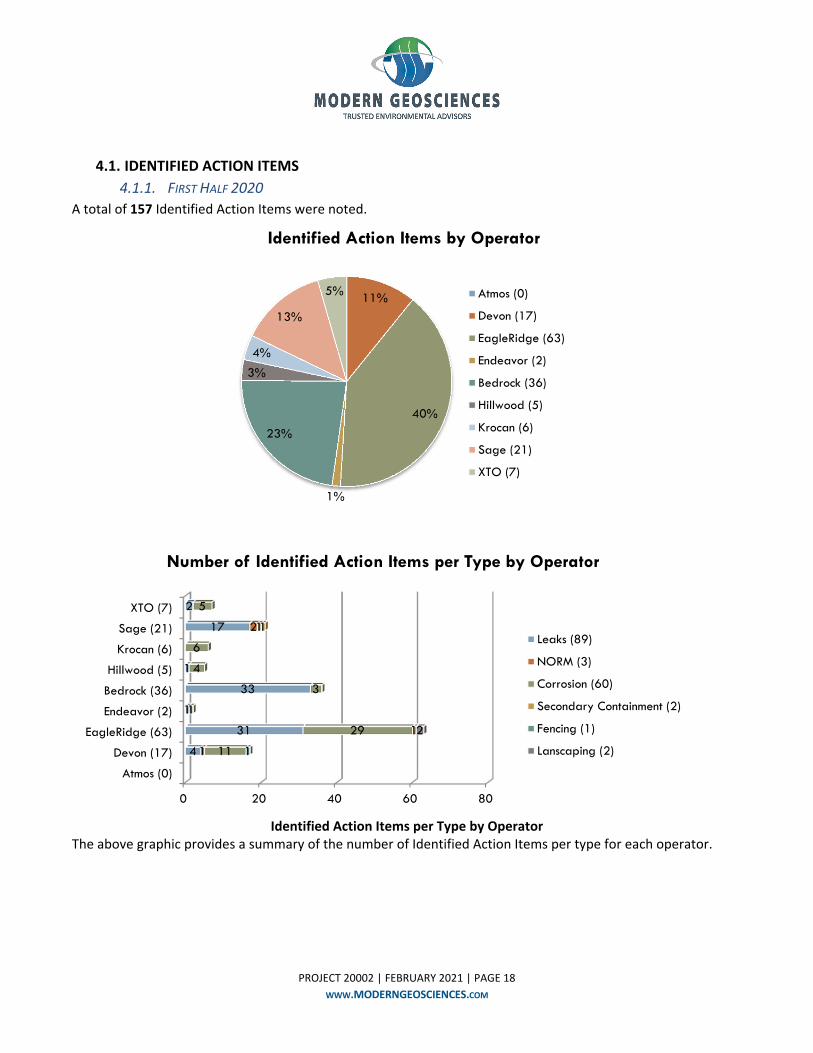
4.1. IDENTIFIED ACTION ITEMS
4.1.1. FIRST HALF 2020
A total of 157 Identified Action Items were noted.
Identified Action Items per Type by Operator
The above graphic provides a summary of the number of Identified Action Items per type for each operator.
11%
40%
1%
23%
3%
4%
13%
5%
Identified Action Items by Operator
Atmos (0)
Devon (17)
EagleRidge (63)
Endeavor (2)
Bedrock (36)
Hillwood (5)
Krocan (6)
Sage (21)
XTO (7)
0 20 40 60 80
Atmos (0)
Devon (17)
EagleRidge (63)
Endeavor (2)
Bedrock (36)
Hillwood (5)
Krocan (6)
Sage (21)
XTO (7)
4
31
1
33
1
17
2
1
2
11
29
1
3
4
6
1
5
1
1
1
2
Number of Identified Action Items per Type by Operator
Leaks (89)
NORM (3)
Corrosion (60)
Secondary Containment (2)
Fencing (1)
Lanscaping (2)
PROJECT 20002 | FEBRUARY 2021 | PAGE 19
WWW.MODERNGEOSCIENCES.COM
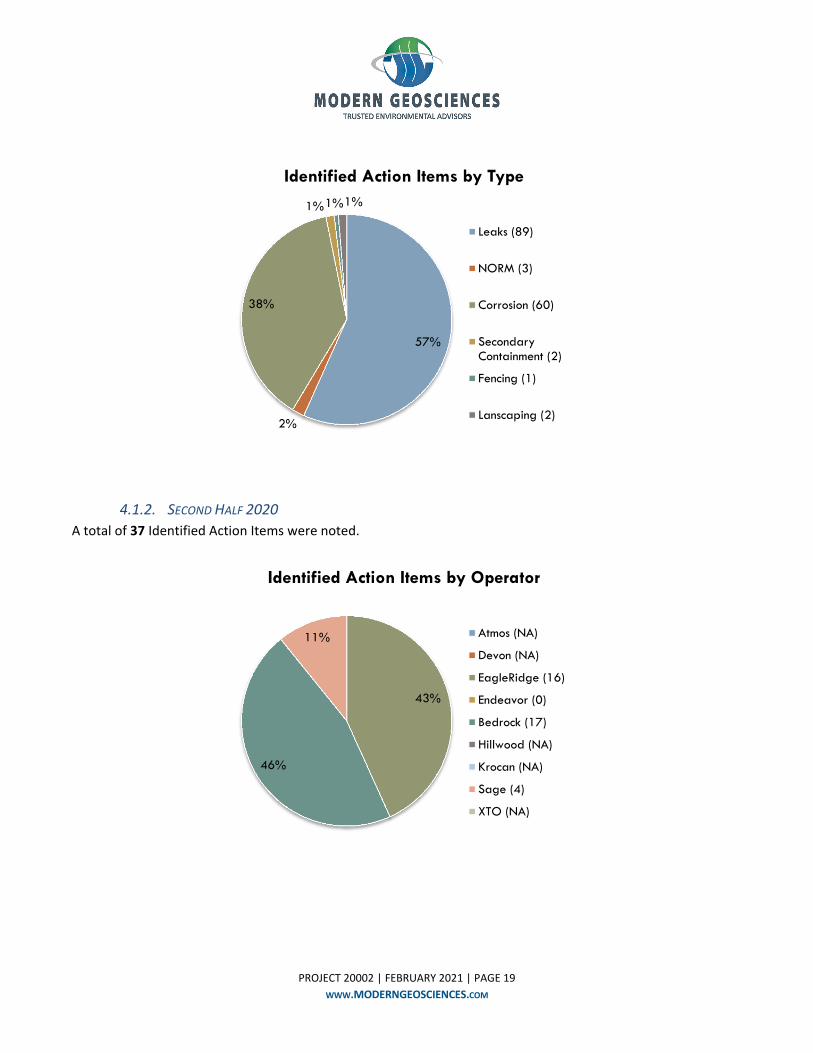
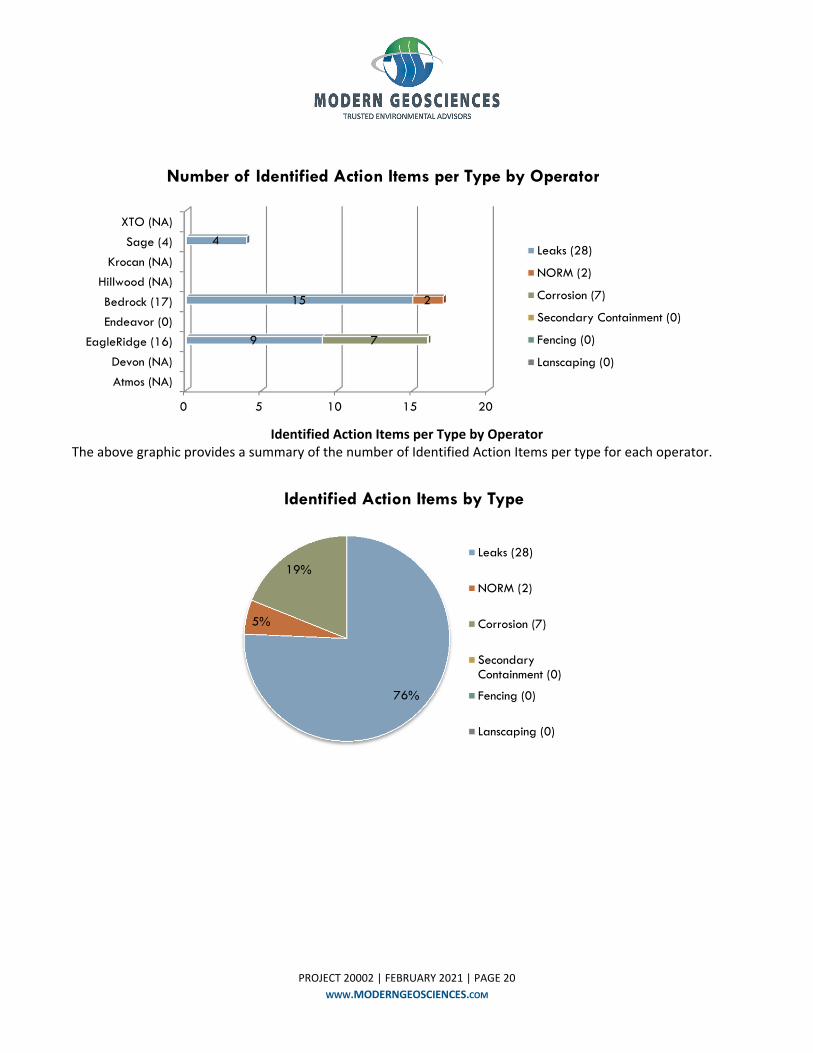
4.1.2. SECOND HALF 2020
A total of 37 Identified Action Items were noted.
57%
2%
38%
1%1%1%
Identified Action Items by Type
Leaks (89)
NORM (3)
Corrosion (60)
SecondaryContainment (2)
Fencing (1)
Lanscaping (2)
43%
46%
11%
Identified Action Items by Operator
Atmos (NA)
Devon (NA)
EagleRidge (16)
Endeavor (0)
Bedrock (17)
Hillwood (NA)
Krocan (NA)
Sage (4)
XTO (NA)
PROJECT 20002 | FEBRUARY 2021 | PAGE 20
WWW.MODERNGEOSCIENCES.COM
Identified Action Items per Type by Operator
The above graphic provides a summary of the number of Identified Action Items per type for each operator.
0 5 10 15 20
Atmos (NA)
Devon (NA)
EagleRidge (16)
Endeavor (0)
Bedrock (17)
Hillwood (NA)
Krocan (NA)
Sage (4)
XTO (NA)
9
15
4
2
7
Number of Identified Action Items per Type by Operator
Leaks (28)
NORM (2)
Corrosion (7)
Secondary Containment (0)
Fencing (0)
Lanscaping (0)
76%
5%
19%
Identified Action Items by Type
Leaks (28)
NORM (2)
Corrosion (7)
SecondaryContainment (0)
Fencing (0)
Lanscaping (0)
PROJECT 20002 | FEBRUARY 2021 | PAGE 21
WWW.MODERNGEOSCIENCES.COM
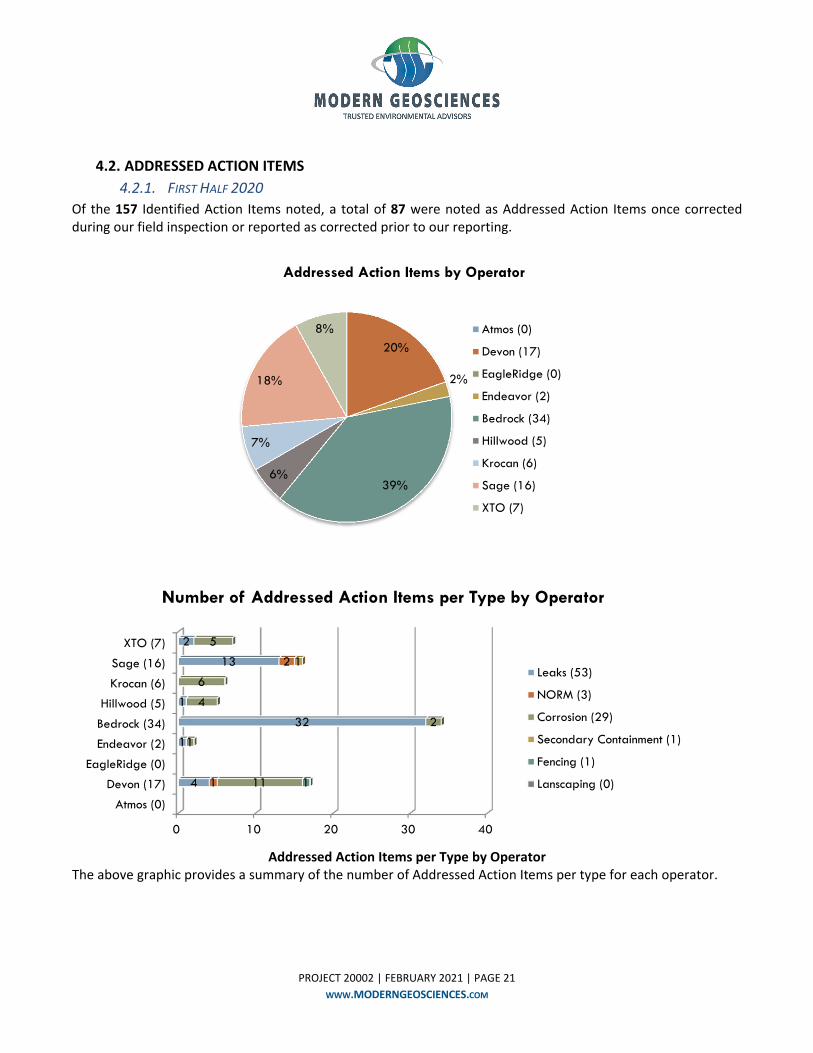
4.2. ADDRESSED ACTION ITEMS
4.2.1. FIRST HALF 2020
Of the 157 Identified Action Items noted, a total of 87 were noted as Addressed Action Items once corrected during our field inspection or reported as corrected prior to our reporting.
Addressed Action Items per Type by Operator
The above graphic provides a summary of the number of Addressed Action Items per type for each operator.
20%
2%
39%6%
7%
18%
8%
Addressed Action Items by Operator
Atmos (0)
Devon (17)
EagleRidge (0)
Endeavor (2)
Bedrock (34)
Hillwood (5)
Krocan (6)
Sage (16)
XTO (7)
0 10 20 30 40
Atmos (0)
Devon (17)
EagleRidge (0)
Endeavor (2)
Bedrock (34)
Hillwood (5)
Krocan (6)
Sage (16)
XTO (7)
4
1
32
1
13
2
1
2
11
1
2
4
6
5
1
1
Number of Addressed Action Items per Type by Operator
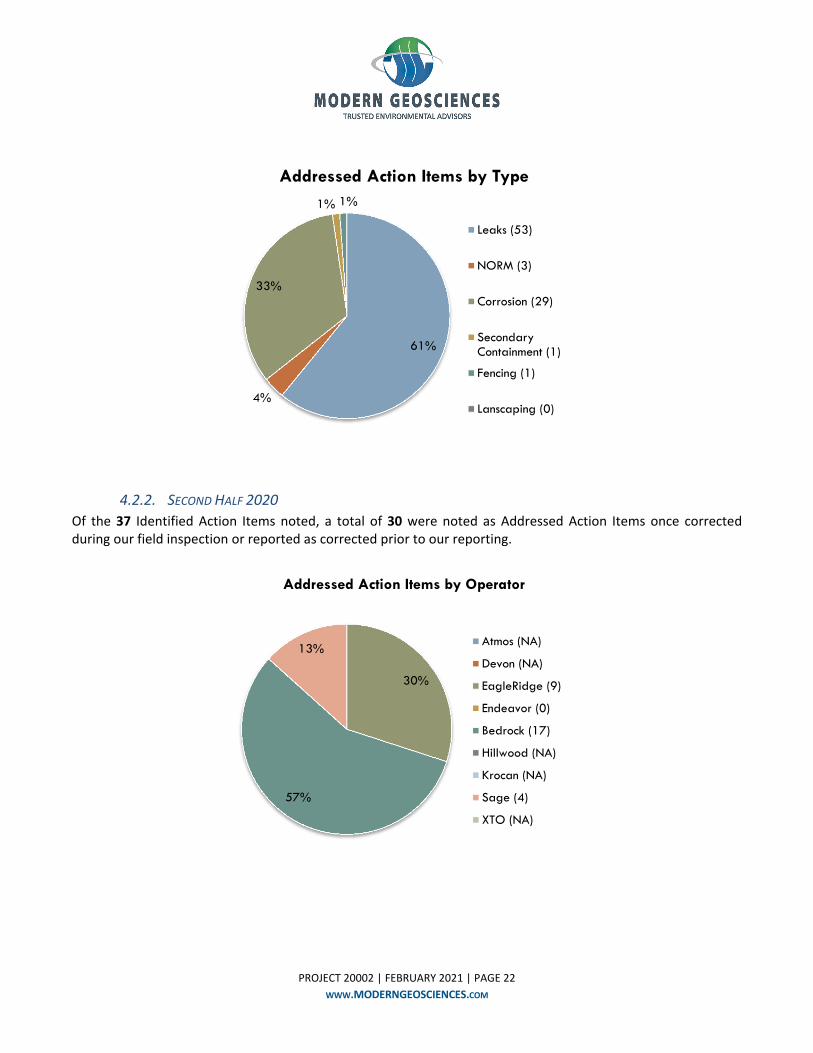
Leaks (53)
NORM (3)
Corrosion (29)
Secondary Containment (1)
Fencing (1)
Lanscaping (0)
PROJECT 20002 | FEBRUARY 2021 | PAGE 22
WWW.MODERNGEOSCIENCES.COM
4.2.2. SECOND HALF 2020
Of the 37 Identified Action Items noted, a total of 30 were noted as Addressed Action Items once corrected during our field inspection or reported as corrected prior to our reporting.
61%
4%
33%
1% 1%
Addressed Action Items by Type
Leaks (53)
NORM (3)
Corrosion (29)
SecondaryContainment (1)
Fencing (1)
Lanscaping (0)
30%
57%
13%
Addressed Action Items by Operator
Atmos (NA)
Devon (NA)
EagleRidge (9)
Endeavor (0)
Bedrock (17)
Hillwood (NA)
Krocan (NA)
Sage (4)
XTO (NA)
PROJECT 20002 | FEBRUARY 2021 | PAGE 23
WWW.MODERNGEOSCIENCES.COM
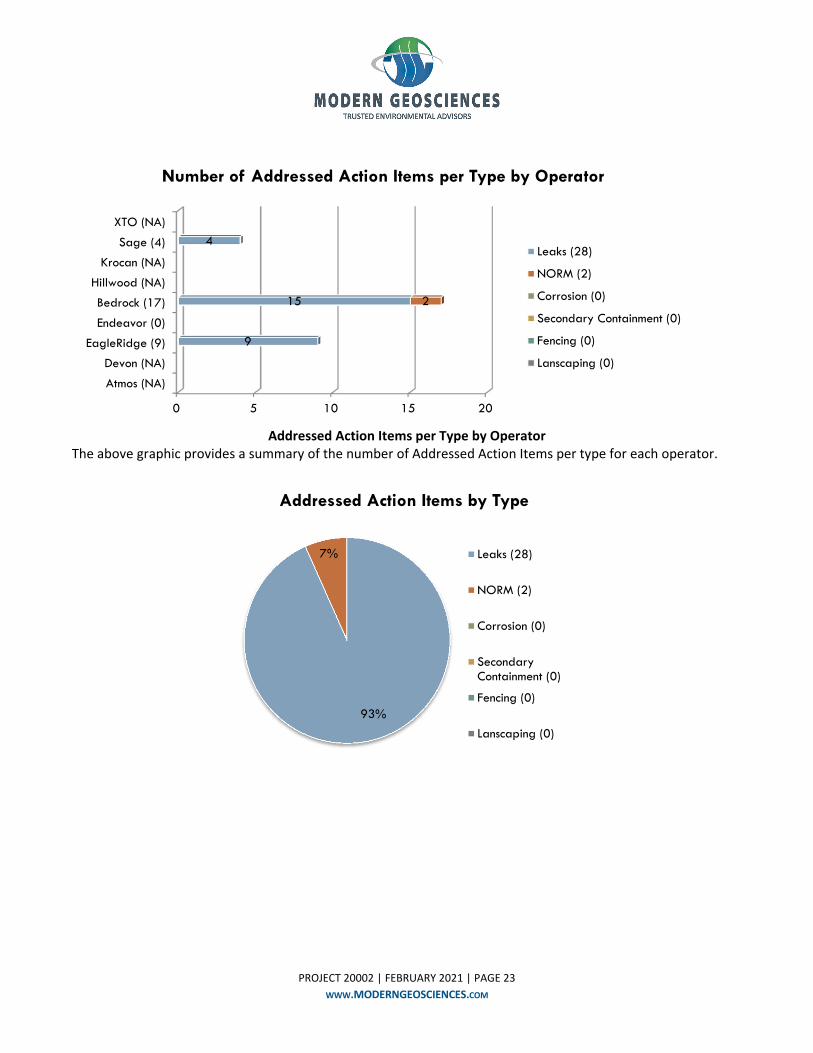
Addressed Action Items per Type by Operator
The above graphic provides a summary of the number of Addressed Action Items per type for each operator.
0 5 10 15 20
Atmos (NA)
Devon (NA)
EagleRidge (9)
Endeavor (0)
Bedrock (17)
Hillwood (NA)
Krocan (NA)
Sage (4)
XTO (NA)
9
15
4
2
Number of Addressed Action Items per Type by Operator
Leaks (28)
NORM (2)
Corrosion (0)
Secondary Containment (0)
Fencing (0)
Lanscaping (0)
93%
7%
Addressed Action Items by Type
Leaks (28)
NORM (2)
Corrosion (0)
SecondaryContainment (0)
Fencing (0)
Lanscaping (0)
PROJECT 20002 | FEBRUARY 2021 | PAGE 24
WWW.MODERNGEOSCIENCES.COM
4.3. OUTSTANDING ACTION ITEMS
4.3.1. FIRST HALF 2020
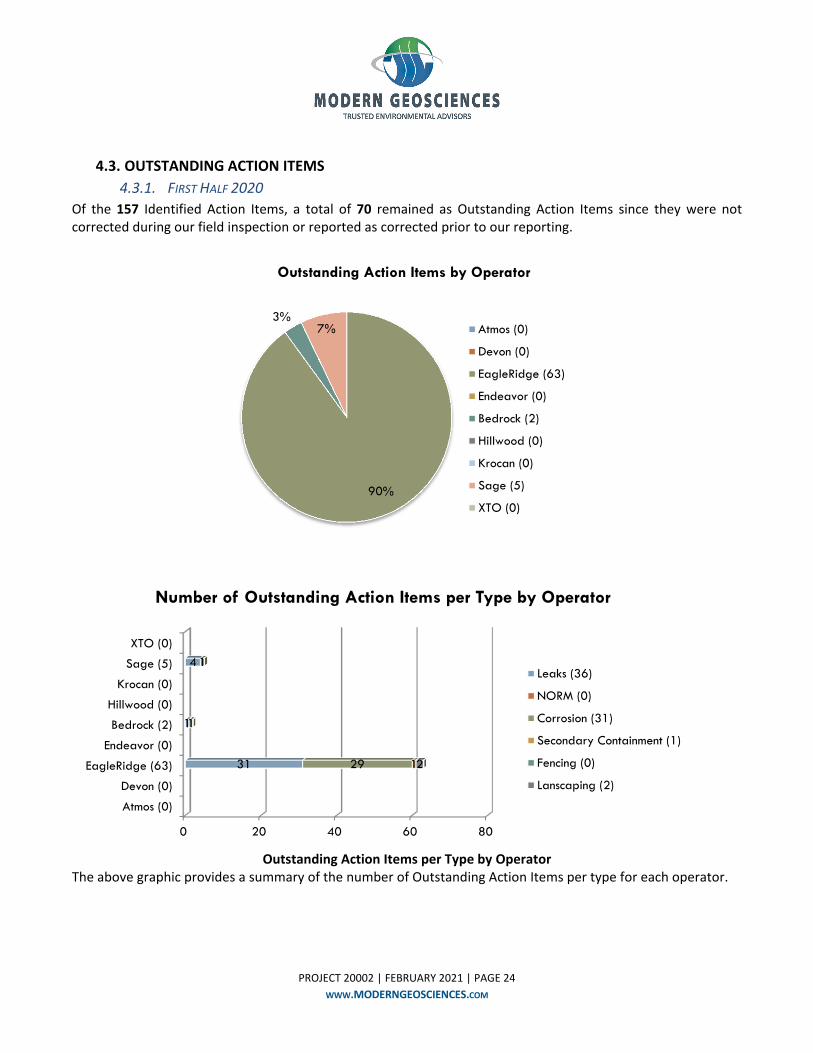
Of the 157 Identified Action Items, a total of 70 remained as Outstanding Action Items since they were not corrected during our field inspection or reported as corrected prior to our reporting.
Outstanding Action Items per Type by Operator
The above graphic provides a summary of the number of Outstanding Action Items per type for each operator.
90%
3%7%
Outstanding Action Items by Operator
Atmos (0)
Devon (0)
EagleRidge (63)
Endeavor (0)
Bedrock (2)
Hillwood (0)
Krocan (0)
Sage (5)
XTO (0)
0 20 40 60 80
Atmos (0)
Devon (0)
EagleRidge (63)
Endeavor (0)
Bedrock (2)
Hillwood (0)
Krocan (0)
Sage (5)
XTO (0)
31
1
4
29
1
1
12
Number of Outstanding Action Items per Type by Operator
Leaks (36)
NORM (0)
Corrosion (31)
Secondary Containment (1)
Fencing (0)
Lanscaping (2)
PROJECT 20002 | FEBRUARY 2021 | PAGE 25
WWW.MODERNGEOSCIENCES.COM
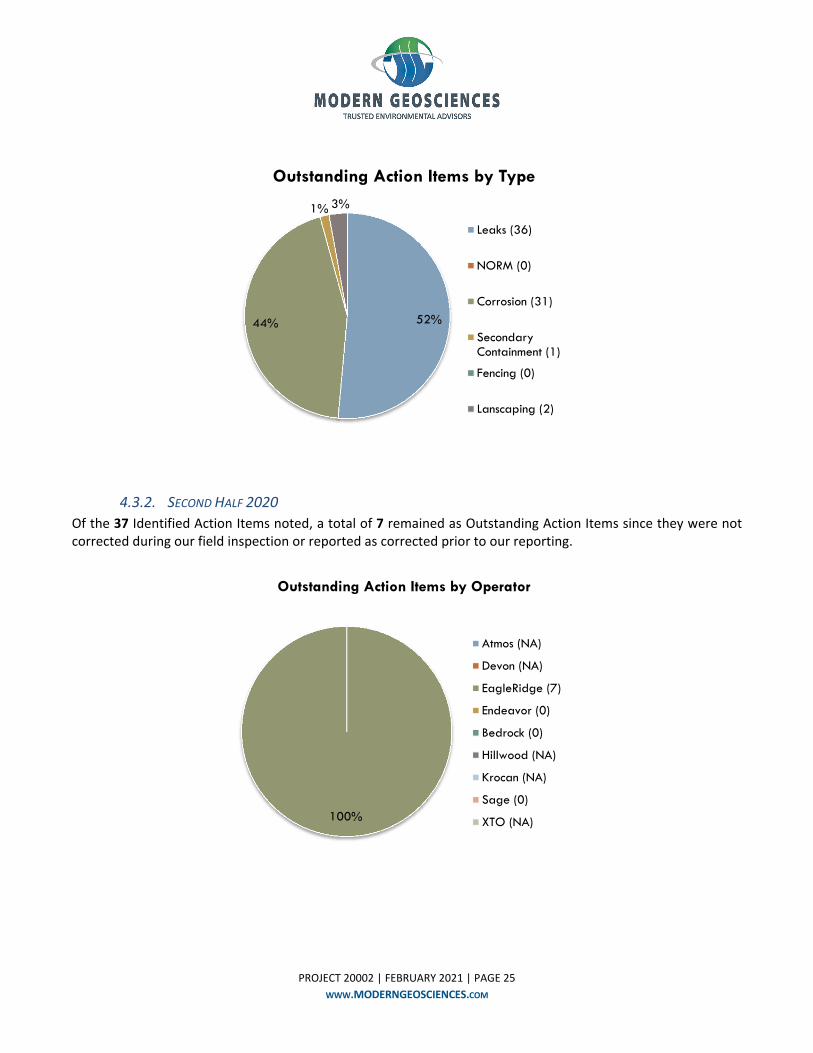
4.3.2. SECOND HALF 2020
Of the 37 Identified Action Items noted, a total of 7 remained as Outstanding Action Items since they were not corrected during our field inspection or reported as corrected prior to our reporting.
52%44%
1% 3%
Outstanding Action Items by Type
Leaks (36)
NORM (0)
Corrosion (31)
SecondaryContainment (1)
Fencing (0)
Lanscaping (2)
100%
Outstanding Action Items by Operator
Atmos (NA)
Devon (NA)
EagleRidge (7)
Endeavor (0)
Bedrock (0)
Hillwood (NA)
Krocan (NA)
Sage (0)
XTO (NA)
PROJECT 20002 | FEBRUARY 2021 | PAGE 26
WWW.MODERNGEOSCIENCES.COM
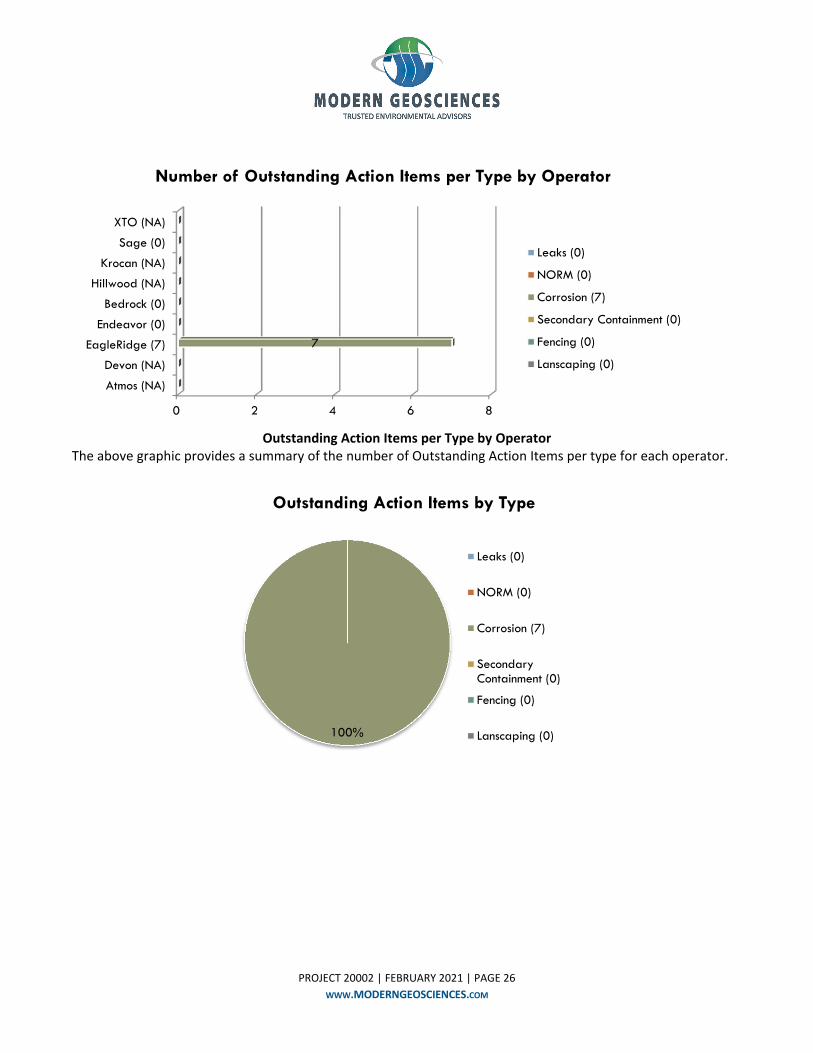
Outstanding Action Items per Type by Operator
The above graphic provides a summary of the number of Outstanding Action Items per type for each operator.
0 2 4 6 8
Atmos (NA)
Devon (NA)
EagleRidge (7)
Endeavor (0)
Bedrock (0)
Hillwood (NA)
Krocan (NA)
Sage (0)
XTO (NA)
7
Number of Outstanding Action Items per Type by Operator
Leaks (0)
NORM (0)
Corrosion (7)
Secondary Containment (0)
Fencing (0)
Lanscaping (0)
100%
Outstanding Action Items by Type
Leaks (0)
NORM (0)
Corrosion (7)
SecondaryContainment (0)
Fencing (0)
Lanscaping (0)
PROJECT 20002 | FEBRUARY 2021 | PAGE 27
WWW.MODERNGEOSCIENCES.COM
5. ACTION ITEM RESULTS (DETAIL)
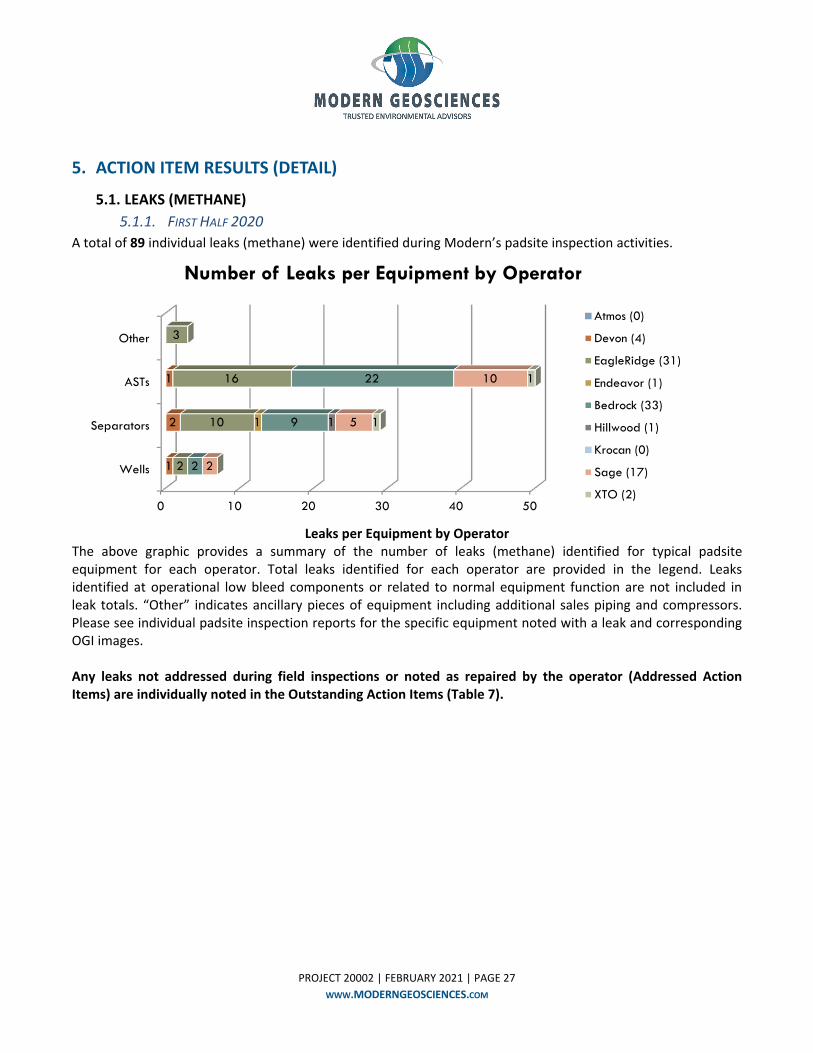
5.1. LEAKS (METHANE)
5.1.1. FIRST HALF 2020
A total of 89 individual leaks (methane) were identified during Modern’s padsite inspection activities.
Leaks per Equipment by Operator
The above graphic provides a summary of the number of leaks (methane) identified for typical padsite equipment for each operator. Total leaks identified for each operator are provided in the legend. Leaks identified at operational low bleed components or related to normal equipment function are not included in leak totals. “Other” indicates ancillary pieces of equipment including additional sales piping and compressors. Please see individual padsite inspection reports for the specific equipment noted with a leak and corresponding OGI images. Any leaks not addressed during field inspections or noted as repaired by the operator (Addressed Action Items) are individually noted in the Outstanding Action Items (Table 7).
0 10 20 30 40 50
Wells
Separators
ASTs
Other
1
2
1
2
10
16
3
1
2
9
22
1
2
5
10
1
1
Number of Leaks per Equipment by Operator
Atmos (0)
Devon (4)
EagleRidge (31)
Endeavor (1)
Bedrock (33)
Hillwood (1)
Krocan (0)
Sage (17)
XTO (2)
PROJECT 20002 | FEBRUARY 2021 | PAGE 28
WWW.MODERNGEOSCIENCES.COM
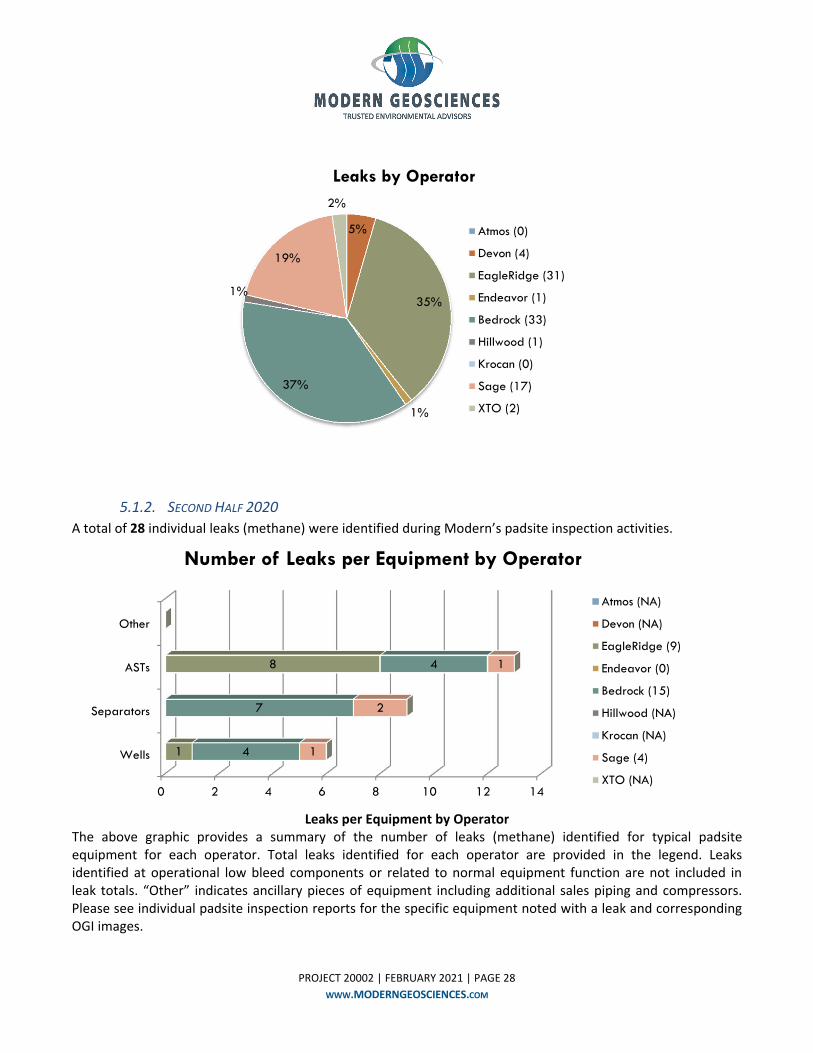
5.1.2. SECOND HALF 2020
A total of 28 individual leaks (methane) were identified during Modern’s padsite inspection activities.
Leaks per Equipment by Operator
The above graphic provides a summary of the number of leaks (methane) identified for typical padsite equipment for each operator. Total leaks identified for each operator are provided in the legend. Leaks identified at operational low bleed components or related to normal equipment function are not included in leak totals. “Other” indicates ancillary pieces of equipment including additional sales piping and compressors. Please see individual padsite inspection reports for the specific equipment noted with a leak and corresponding OGI images.
5%
35%
1%
37%
1%
19%
2%
Leaks by Operator
Atmos (0)
Devon (4)
EagleRidge (31)
Endeavor (1)
Bedrock (33)
Hillwood (1)
Krocan (0)
Sage (17)
XTO (2)
0 2 4 6 8 10 12 14
Wells
Separators
ASTs
Other
1
8
4
7
4
1
2
1
Number of Leaks per Equipment by Operator
Atmos (NA)
Devon (NA)
EagleRidge (9)
Endeavor (0)
Bedrock (15)
Hillwood (NA)
Krocan (NA)
Sage (4)
XTO (NA)

PROJECT 20002 | FEBRUARY 2021 | PAGE 29
WWW.MODERNGEOSCIENCES.COM
Any leaks not addressed during field inspections or noted as repaired by the operator (Addressed Action Items) are individually noted in the Outstanding Action Items (Table 7).
32%
54%
14%
Leaks by Operator
Atmos (NA)
Devon (NA)
EagleRidge (9)
Endeavor (0)
Bedrock (15)
Hillwood (NA)
Krocan (NA)
Sage (4)
XTO (NA)
PROJECT 20002 | FEBRUARY 2021 | PAGE 30
WWW.MODERNGEOSCIENCES.COM
5.2. NORM
5.2.1. TOTAL NORM EXCEEDANCES
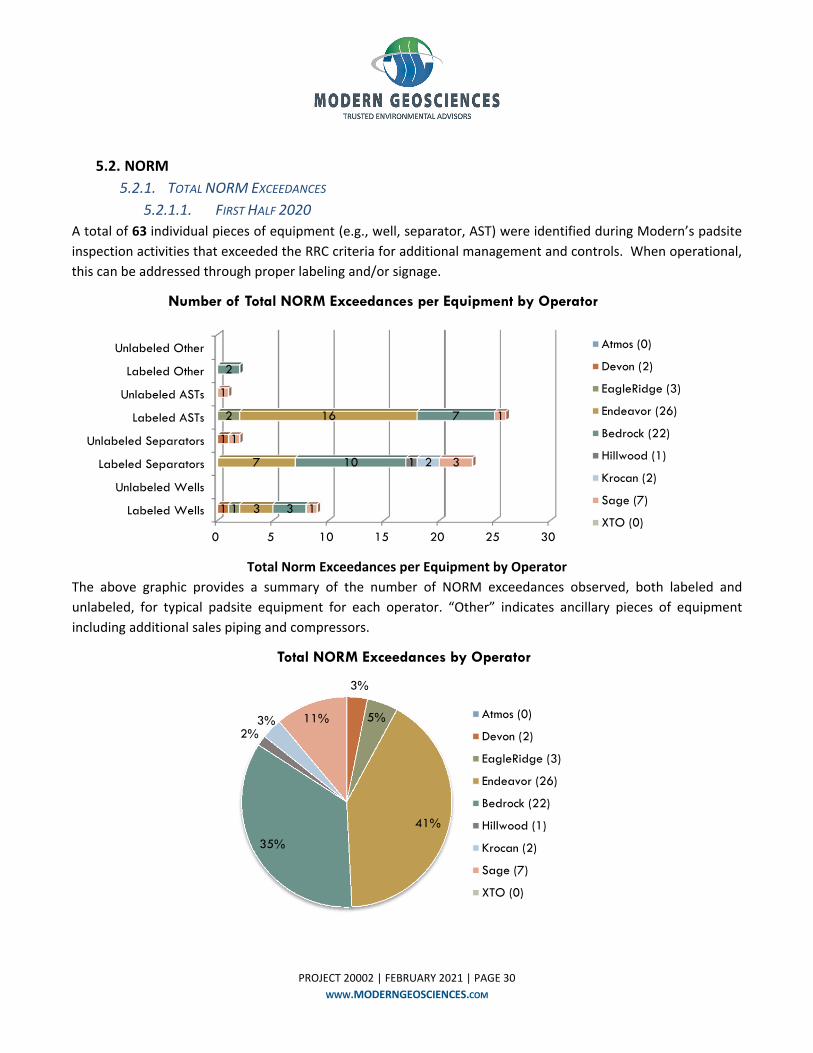
5.2.1.1. FIRST HALF 2020
A total of 63 individual pieces of equipment (e.g., well, separator, AST) were identified during Modern’s padsite
inspection activities that exceeded the RRC criteria for additional management and controls. When operational,
this can be addressed through proper labeling and/or signage.
Total Norm Exceedances per Equipment by Operator
The above graphic provides a summary of the number of NORM exceedances observed, both labeled and
unlabeled, for typical padsite equipment for each operator. “Other” indicates ancillary pieces of equipment
including additional sales piping and compressors.
0 5 10 15 20 25 30
Labeled Wells
Unlabeled Wells
Labeled Separators
Unlabeled Separators
Labeled ASTs
Unlabeled ASTs
Labeled Other
Unlabeled Other
1
1
1
2
3
7
16
3
10
7
2
1 2
1
3
1
1
1
Number of Total NORM Exceedances per Equipment by Operator
Atmos (0)
Devon (2)
EagleRidge (3)
Endeavor (26)
Bedrock (22)
Hillwood (1)
Krocan (2)
Sage (7)
XTO (0)
3%
5%
41%
35%
2%3% 11%
Total NORM Exceedances by Operator
Atmos (0)
Devon (2)
EagleRidge (3)
Endeavor (26)
Bedrock (22)
Hillwood (1)
Krocan (2)
Sage (7)
XTO (0)
PROJECT 20002 | FEBRUARY 2021 | PAGE 31
WWW.MODERNGEOSCIENCES.COM
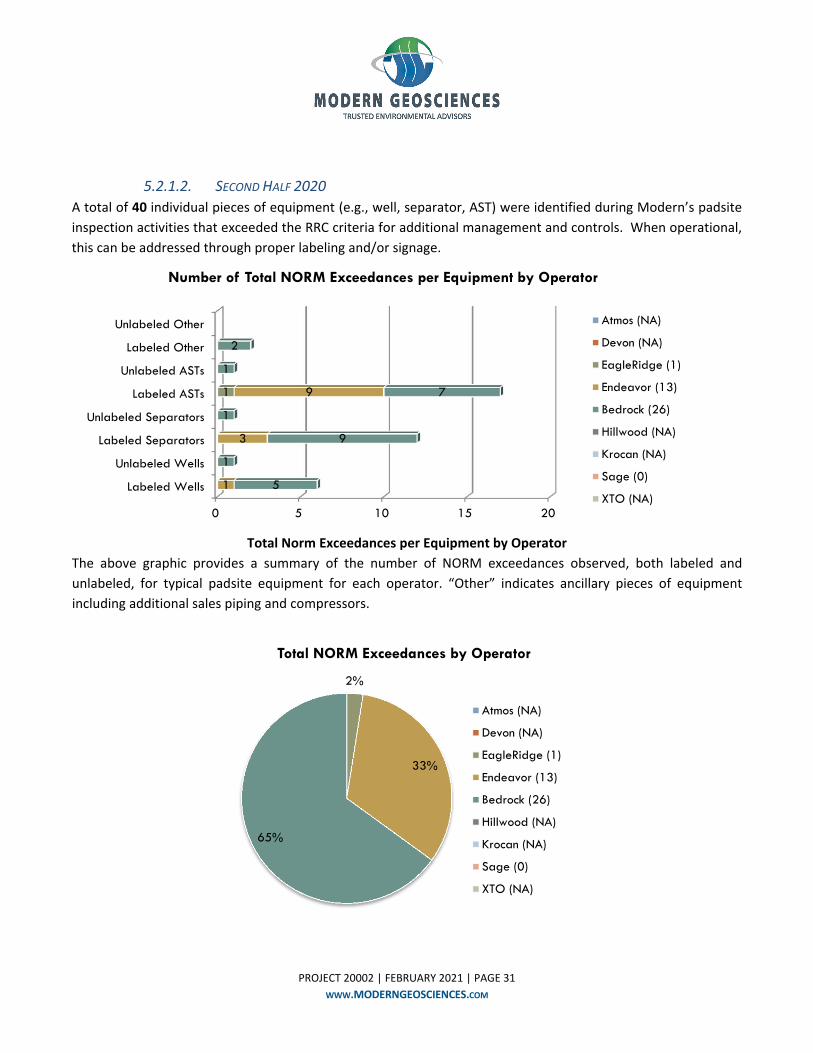
5.2.1.2. SECOND HALF 2020
A total of 40 individual pieces of equipment (e.g., well, separator, AST) were identified during Modern’s padsite
inspection activities that exceeded the RRC criteria for additional management and controls. When operational,
this can be addressed through proper labeling and/or signage.
Total Norm Exceedances per Equipment by Operator
The above graphic provides a summary of the number of NORM exceedances observed, both labeled and
unlabeled, for typical padsite equipment for each operator. “Other” indicates ancillary pieces of equipment
including additional sales piping and compressors.
0 5 10 15 20
Labeled Wells
Unlabeled Wells
Labeled Separators
Unlabeled Separators
Labeled ASTs
Unlabeled ASTs
Labeled Other
Unlabeled Other
1
1
3
9
5
1
9
1
7
1
2
Number of Total NORM Exceedances per Equipment by Operator
Atmos (NA)
Devon (NA)
EagleRidge (1)
Endeavor (13)
Bedrock (26)
Hillwood (NA)
Krocan (NA)
Sage (0)
XTO (NA)
2%
33%
65%
Total NORM Exceedances by Operator
Atmos (NA)
Devon (NA)
EagleRidge (1)
Endeavor (13)
Bedrock (26)
Hillwood (NA)
Krocan (NA)
Sage (0)
XTO (NA)
PROJECT 20002 | FEBRUARY 2021 | PAGE 32
WWW.MODERNGEOSCIENCES.COM
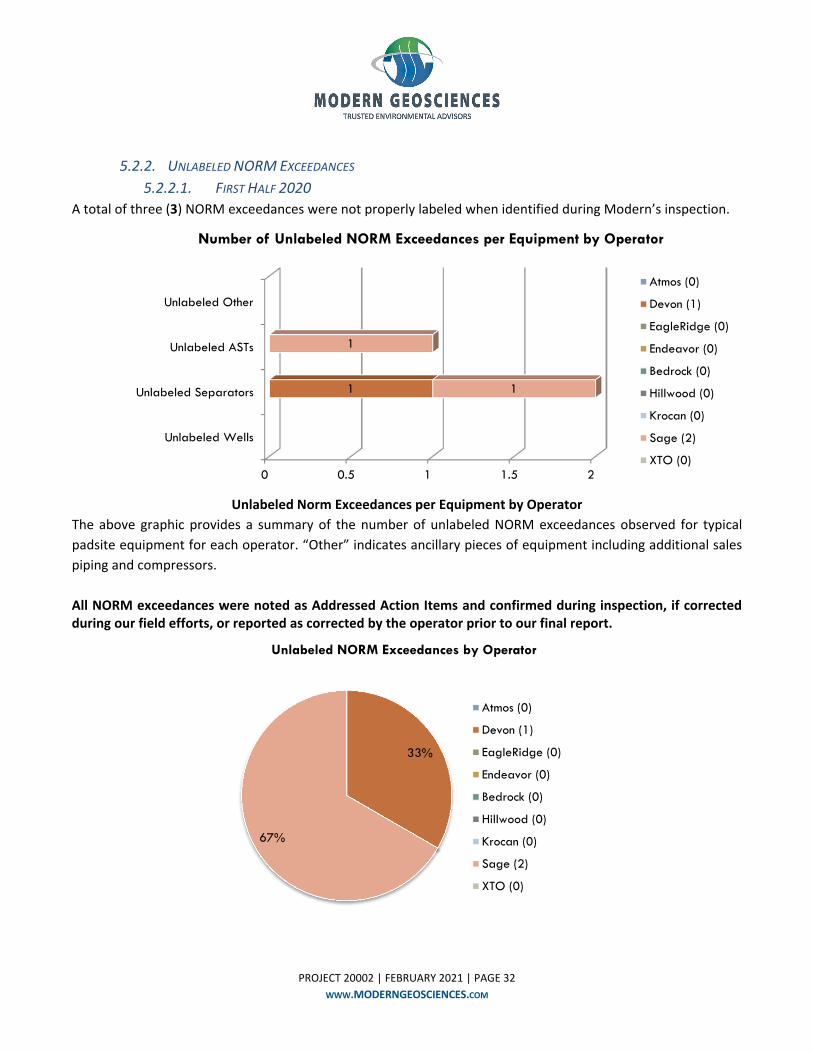
5.2.2. UNLABELED NORM EXCEEDANCES
5.2.2.1. FIRST HALF 2020
A total of three (3) NORM exceedances were not properly labeled when identified during Modern’s inspection.
Unlabeled Norm Exceedances per Equipment by Operator
The above graphic provides a summary of the number of unlabeled NORM exceedances observed for typical
padsite equipment for each operator. “Other” indicates ancillary pieces of equipment including additional sales
piping and compressors.
All NORM exceedances were noted as Addressed Action Items and confirmed during inspection, if corrected during our field efforts, or reported as corrected by the operator prior to our final report.
0 0.5 1 1.5 2
Unlabeled Wells
Unlabeled Separators
Unlabeled ASTs
Unlabeled Other
1 1
1
Number of Unlabeled NORM Exceedances per Equipment by Operator
Atmos (0)
Devon (1)
EagleRidge (0)
Endeavor (0)
Bedrock (0)
Hillwood (0)
Krocan (0)
Sage (2)
XTO (0)
33%
67%
Unlabeled NORM Exceedances by Operator
Atmos (0)
Devon (1)
EagleRidge (0)
Endeavor (0)
Bedrock (0)
Hillwood (0)
Krocan (0)
Sage (2)
XTO (0)
PROJECT 20002 | FEBRUARY 2021 | PAGE 33
WWW.MODERNGEOSCIENCES.COM
5.2.2.2. SECOND HALF 2020
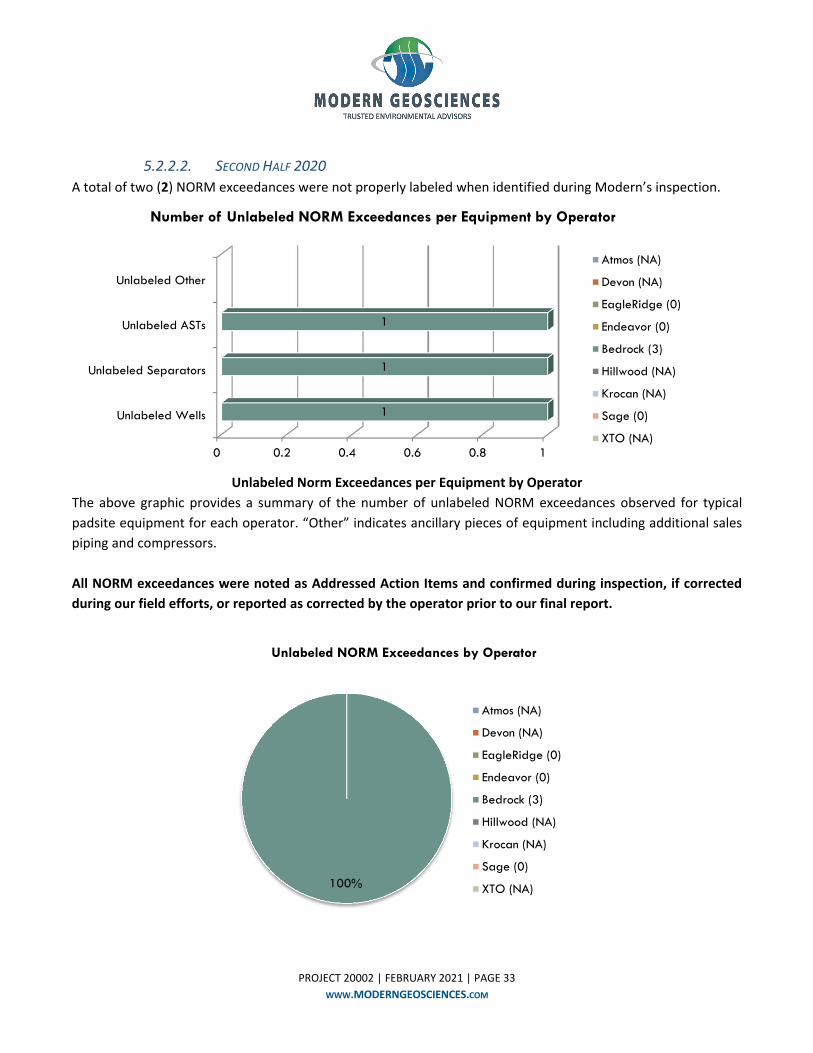
A total of two (2) NORM exceedances were not properly labeled when identified during Modern’s inspection.
Unlabeled Norm Exceedances per Equipment by Operator
The above graphic provides a summary of the number of unlabeled NORM exceedances observed for typical
padsite equipment for each operator. “Other” indicates ancillary pieces of equipment including additional sales
piping and compressors.
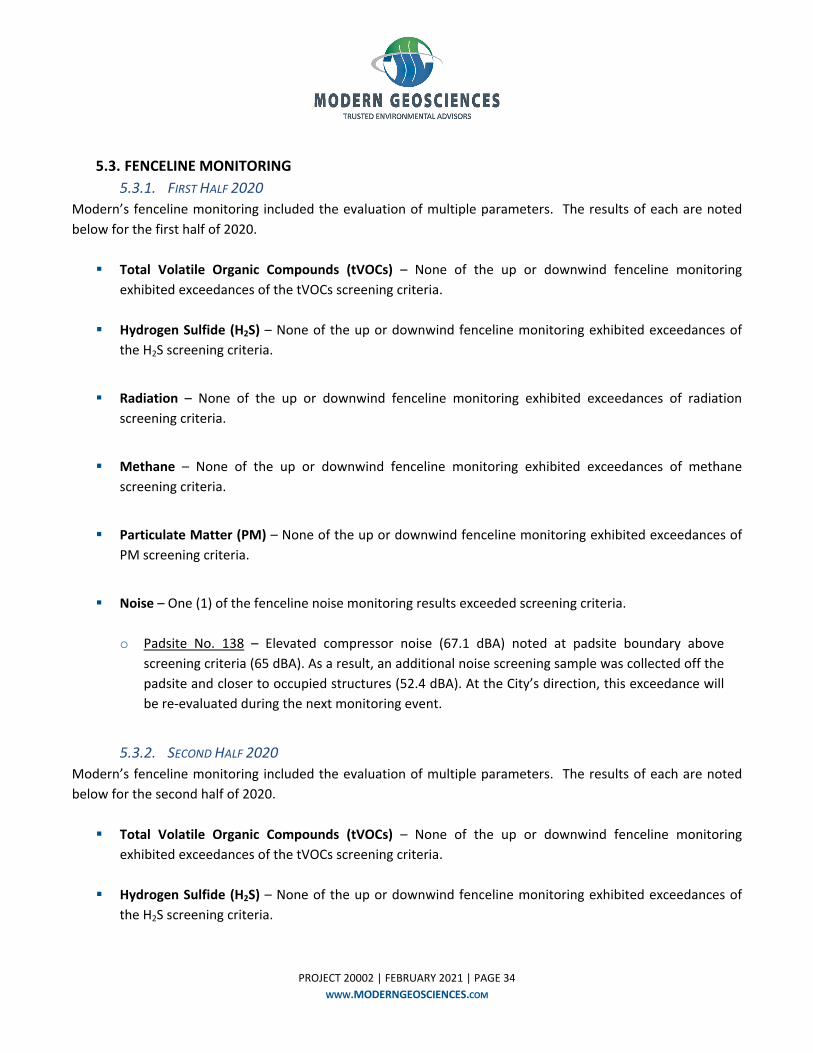
All NORM exceedances were noted as Addressed Action Items and confirmed during inspection, if corrected
during our field efforts, or reported as corrected by the operator prior to our final report.
0 0.2 0.4 0.6 0.8 1
Unlabeled Wells
Unlabeled Separators
Unlabeled ASTs
Unlabeled Other
1
1
1
Number of Unlabeled NORM Exceedances per Equipment by Operator
Atmos (NA)
Devon (NA)
EagleRidge (0)
Endeavor (0)
Bedrock (3)
Hillwood (NA)
Krocan (NA)
Sage (0)
XTO (NA)
100%
Unlabeled NORM Exceedances by Operator
Atmos (NA)
Devon (NA)
EagleRidge (0)
Endeavor (0)
Bedrock (3)
Hillwood (NA)
Krocan (NA)
Sage (0)
XTO (NA)
PROJECT 20002 | FEBRUARY 2021 | PAGE 34
WWW.MODERNGEOSCIENCES.COM
5.3. FENCELINE MONITORING
5.3.1. FIRST HALF 2020
Modern’s fenceline monitoring included the evaluation of multiple parameters. The results of each are noted
below for the first half of 2020.
Total Volatile Organic Compounds (tVOCs) – None of the up or downwind fenceline monitoring
exhibited exceedances of the tVOCs screening criteria.
Hydrogen Sulfide (H2S) – None of the up or downwind fenceline monitoring exhibited exceedances of
the H2S screening criteria.
Radiation – None of the up or downwind fenceline monitoring exhibited exceedances of radiation
screening criteria.
Methane – None of the up or downwind fenceline monitoring exhibited exceedances of methane
screening criteria.
Particulate Matter (PM) – None of the up or downwind fenceline monitoring exhibited exceedances of
PM screening criteria.
Noise – One (1) of the fenceline noise monitoring results exceeded screening criteria.
o Padsite No. 138 – Elevated compressor noise (67.1 dBA) noted at padsite boundary above
screening criteria (65 dBA). As a result, an additional noise screening sample was collected off the
padsite and closer to occupied structures (52.4 dBA). At the City’s direction, this exceedance will
be re‐evaluated during the next monitoring event.
5.3.2. SECOND HALF 2020
Modern’s fenceline monitoring included the evaluation of multiple parameters. The results of each are noted
below for the second half of 2020.
Total Volatile Organic Compounds (tVOCs) – None of the up or downwind fenceline monitoring
exhibited exceedances of the tVOCs screening criteria.
Hydrogen Sulfide (H2S) – None of the up or downwind fenceline monitoring exhibited exceedances of
the H2S screening criteria.
PROJECT 20002 | FEBRUARY 2021 | PAGE 35
WWW.MODERNGEOSCIENCES.COM
Radiation – None of the up or downwind fenceline monitoring exhibited exceedances of radiation
screening criteria.
Methane – None of the up or downwind fenceline monitoring exhibited exceedances of methane
screening criteria.
Particulate Matter (PM) – None of the up or downwind fenceline monitoring exhibited exceedances of
PM screening criteria.
Noise – One (1) of the fenceline noise monitoring results exceeded screening criteria.
o Padsite No. 138 – Elevated compressor noise noted at padsite boundary above screening criteria
(66.0 dBA). As a result, an additional noise screening sample was collected off the padsite and
closer to occupied structures (62.6 dBA). The City was advised of the observations and further
coordination with the operator was planned by the City. This exceedance will be re‐evaluated
during the next monitoring event.
5.4. COMPLIANCE MONITORING
5.4.1. FIRST HALF 2020
Modern’s compliance monitoring for the first half of 2020 identified Action Items related to the following:
Excessive Corrosion;
NORM;
Landscaping;
Secondary Containment; and
Fencing.
Any of the above items not addressed during field inspections or noted as repaired by the operator
(Addressed Action Items) are individually noted in the Outstanding Action Items (Table 7).
5.4.2. SECOND HALF 2020
Modern’s compliance monitoring for the second half of 2020 identified Action Items related to the following:
Excessive Corrosion; and
PROJECT 20002 | FEBRUARY 2021 | PAGE 36
WWW.MODERNGEOSCIENCES.COM
NORM.
Any of the above items not addressed during field inspections or noted as repaired by the operator
(Addressed Action Items) are individually noted in the Outstanding Action Items (Table 7).
PROJECT 20002 | FEBRUARY 2021 | PAGE 37
WWW.MODERNGEOSCIENCES.COM
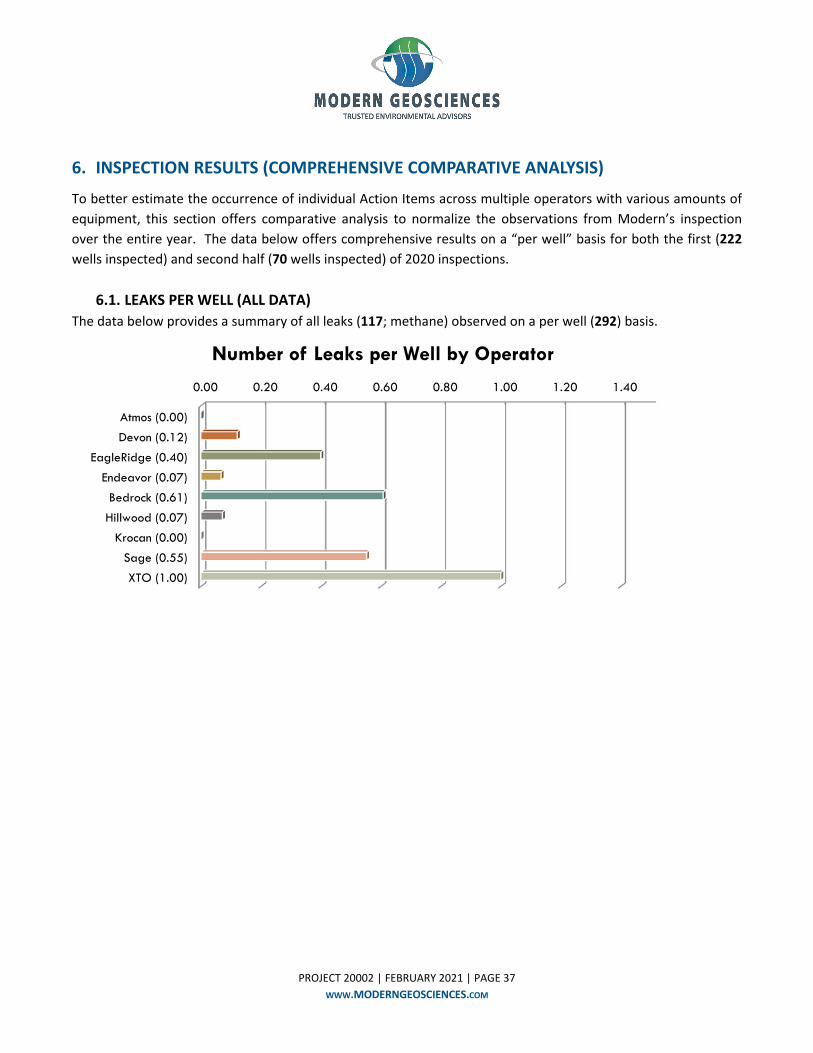
6. INSPECTION RESULTS (COMPREHENSIVE COMPARATIVE ANALYSIS)
To better estimate the occurrence of individual Action Items across multiple operators with various amounts of
equipment, this section offers comparative analysis to normalize the observations from Modern’s inspection
over the entire year. The data below offers comprehensive results on a “per well” basis for both the first (222
wells inspected) and second half (70 wells inspected) of 2020 inspections.
6.1. LEAKS PER WELL (ALL DATA)
The data below provides a summary of all leaks (117; methane) observed on a per well (292) basis.
0.00 0.20 0.40 0.60 0.80 1.00 1.20 1.40
Atmos (0.00)
Devon (0.12)
EagleRidge (0.40)
Endeavor (0.07)
Bedrock (0.61)
Hillwood (0.07)
Krocan (0.00)
Sage (0.55)
XTO (1.00)
Number of Leaks per Well by Operator
PROJECT 20002 | FEBRUARY 2021 | PAGE 38
WWW.MODERNGEOSCIENCES.COM
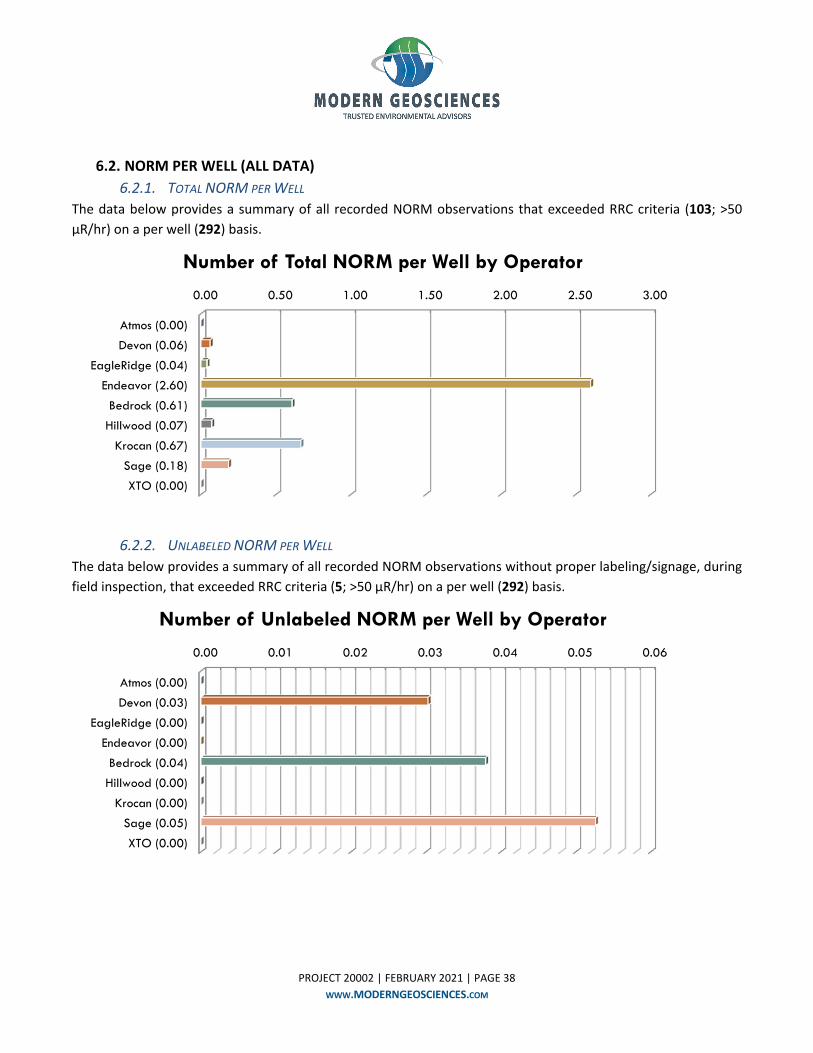
6.2. NORM PER WELL (ALL DATA)
6.2.1. TOTAL NORM PER WELL
The data below provides a summary of all recorded NORM observations that exceeded RRC criteria (103; >50
µR/hr) on a per well (292) basis.
6.2.2. UNLABELED NORM PER WELL
The data below provides a summary of all recorded NORM observations without proper labeling/signage, during
field inspection, that exceeded RRC criteria (5; >50 µR/hr) on a per well (292) basis.
0.00 0.50 1.00 1.50 2.00 2.50 3.00
Atmos (0.00)
Devon (0.06)
EagleRidge (0.04)
Endeavor (2.60)
Bedrock (0.61)
Hillwood (0.07)
Krocan (0.67)
Sage (0.18)
XTO (0.00)
Number of Total NORM per Well by Operator
0.00 0.01 0.02 0.03 0.04 0.05 0.06
Atmos (0.00)
Devon (0.03)
EagleRidge (0.00)
Endeavor (0.00)
Bedrock (0.04)
Hillwood (0.00)
Krocan (0.00)
Sage (0.05)
XTO (0.00)
Number of Unlabeled NORM per Well by Operator
PROJECT 20002 | FEBRUARY 2021 | PAGE 39
WWW.MODERNGEOSCIENCES.COM
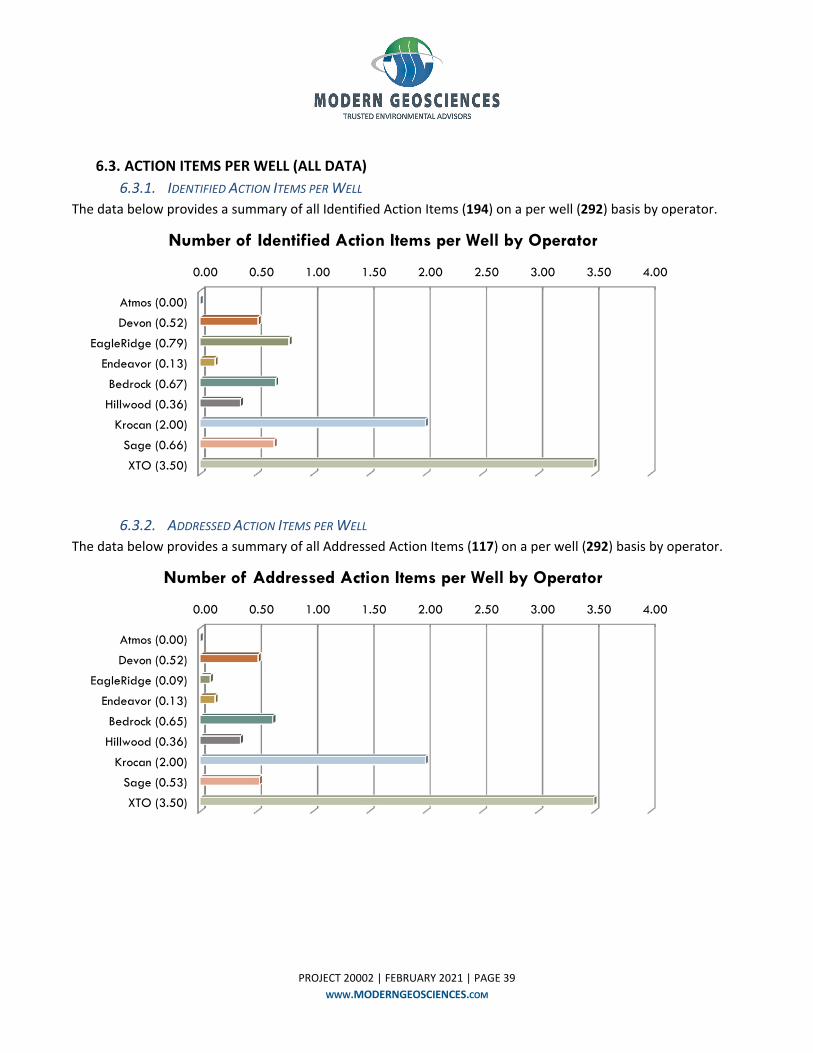
6.3. ACTION ITEMS PER WELL (ALL DATA)
6.3.1. IDENTIFIED ACTION ITEMS PER WELL
The data below provides a summary of all Identified Action Items (194) on a per well (292) basis by operator.
6.3.2. ADDRESSED ACTION ITEMS PER WELL
The data below provides a summary of all Addressed Action Items (117) on a per well (292) basis by operator.
0.00 0.50 1.00 1.50 2.00 2.50 3.00 3.50 4.00
Atmos (0.00)
Devon (0.52)
EagleRidge (0.79)
Endeavor (0.13)
Bedrock (0.67)
Hillwood (0.36)
Krocan (2.00)
Sage (0.66)
XTO (3.50)
Number of Identified Action Items per Well by Operator
0.00 0.50 1.00 1.50 2.00 2.50 3.00 3.50 4.00
Atmos (0.00)
Devon (0.52)
EagleRidge (0.09)
Endeavor (0.13)
Bedrock (0.65)
Hillwood (0.36)
Krocan (2.00)
Sage (0.53)
XTO (3.50)
Number of Addressed Action Items per Well by Operator
PROJECT 20002 | FEBRUARY 2021 | PAGE 40
WWW.MODERNGEOSCIENCES.COM
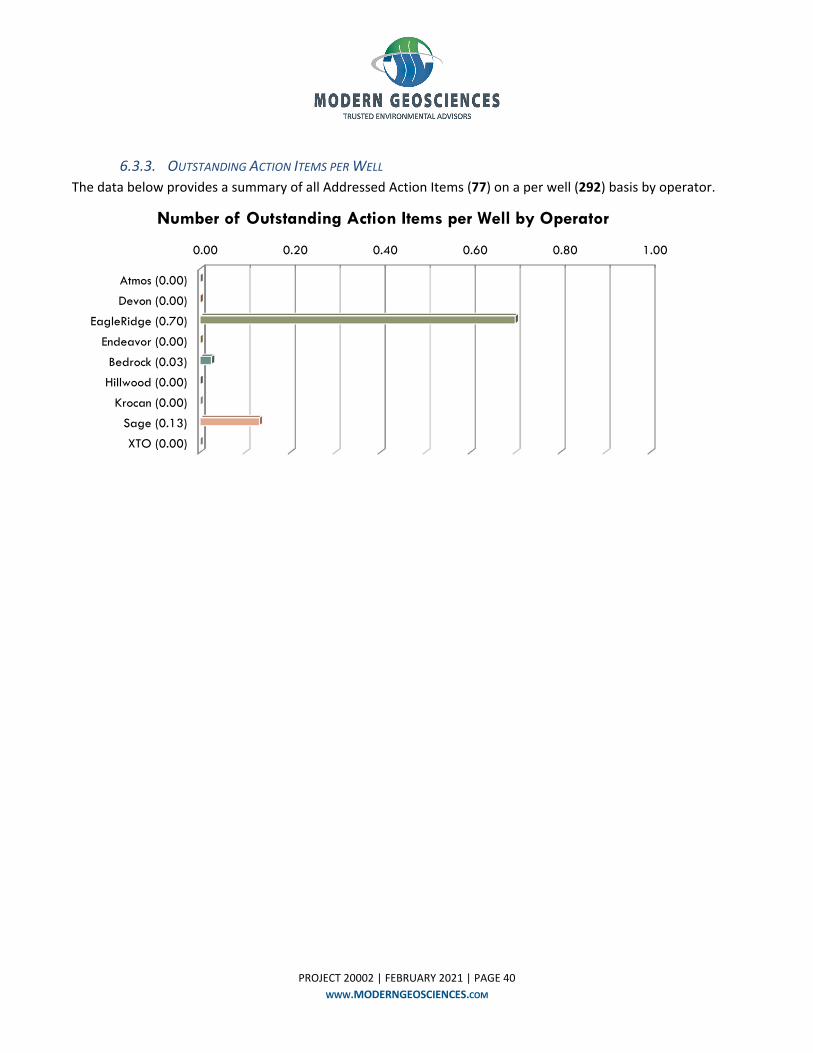
6.3.3. OUTSTANDING ACTION ITEMS PER WELL
The data below provides a summary of all Addressed Action Items (77) on a per well (292) basis by operator.
0.00 0.20 0.40 0.60 0.80 1.00
Atmos (0.00)
Devon (0.00)
EagleRidge (0.70)
Endeavor (0.00)
Bedrock (0.03)
Hillwood (0.00)
Krocan (0.00)
Sage (0.13)
XTO (0.00)
Number of Outstanding Action Items per Well by Operator
PROJECT 20002 | FEBRUARY 2021 | PAGE 41
WWW.MODERNGEOSCIENCES.COM
7. YEAR TO YEAR TRENDING
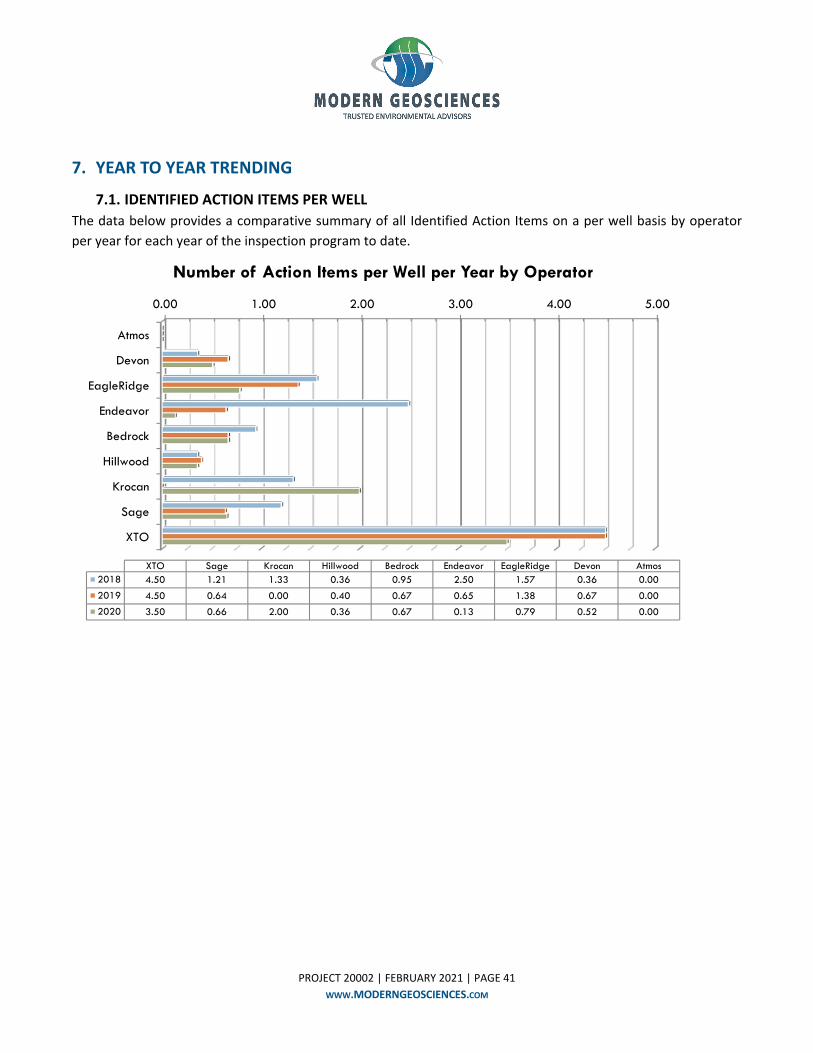
7.1. IDENTIFIED ACTION ITEMS PER WELL
The data below provides a comparative summary of all Identified Action Items on a per well basis by operator
per year for each year of the inspection program to date.
0.00 1.00 2.00 3.00 4.00 5.00
Atmos
Devon
EagleRidge
Endeavor
Bedrock
Hillwood
Krocan
Sage
XTO
AtmosDevonEagleRidgeEndeavorBedrockHillwoodKrocanSageXTO2018 0.000.361.572.500.950.361.331.214.50
2019 0.000.671.380.650.670.400.000.644.50
2020 0.000.520.790.130.670.362.000.663.50
Number of Action Items per Well per Year by Operator
PROJECT 20002 | FEBRUARY 2021 | PAGE 42
WWW.MODERNGEOSCIENCES.COM
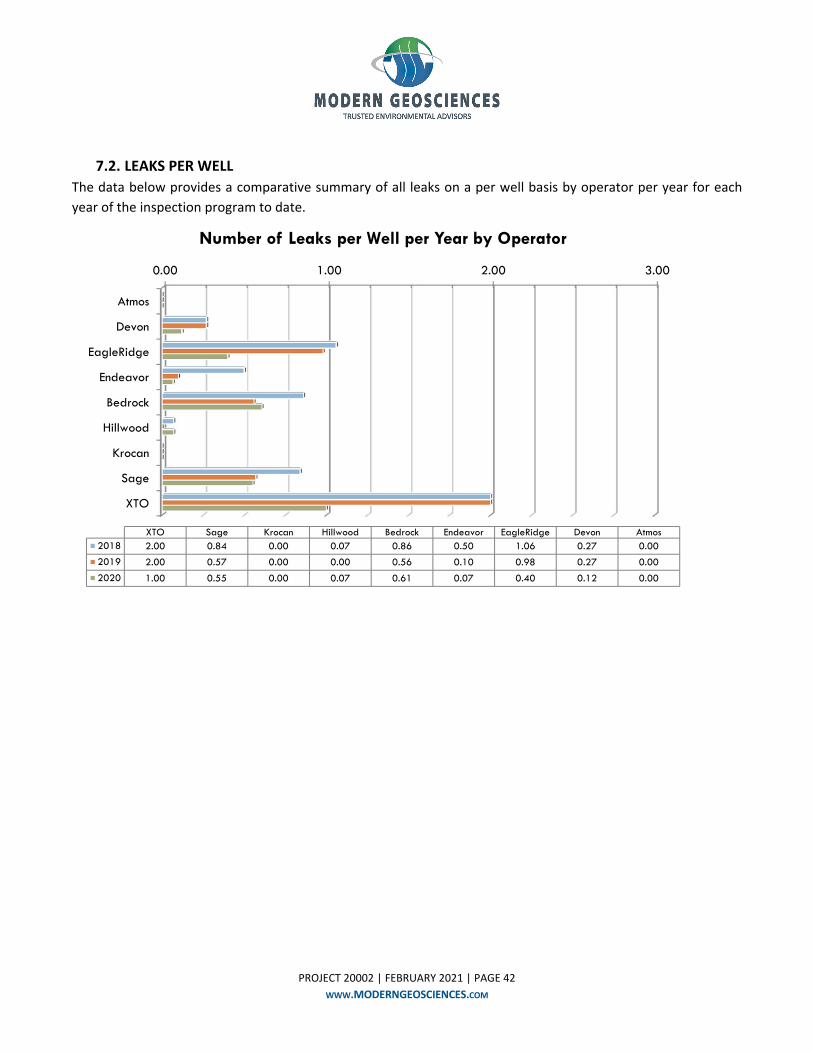
7.2. LEAKS PER WELL
The data below provides a comparative summary of all leaks on a per well basis by operator per year for each
year of the inspection program to date.
0.00 1.00 2.00 3.00
Atmos
Devon
EagleRidge
Endeavor
Bedrock
Hillwood
Krocan
Sage
XTO
AtmosDevonEagleRidgeEndeavorBedrockHillwoodKrocanSageXTO2018 0.000.271.060.500.860.070.000.842.00
2019 0.000.270.980.100.560.000.000.572.00
2020 0.000.120.400.070.610.070.000.551.00
Number of Leaks per Well per Year by Operator
PROJECT 20002 | FEBRUARY 2021 | PAGE 43
WWW.MODERNGEOSCIENCES.COM
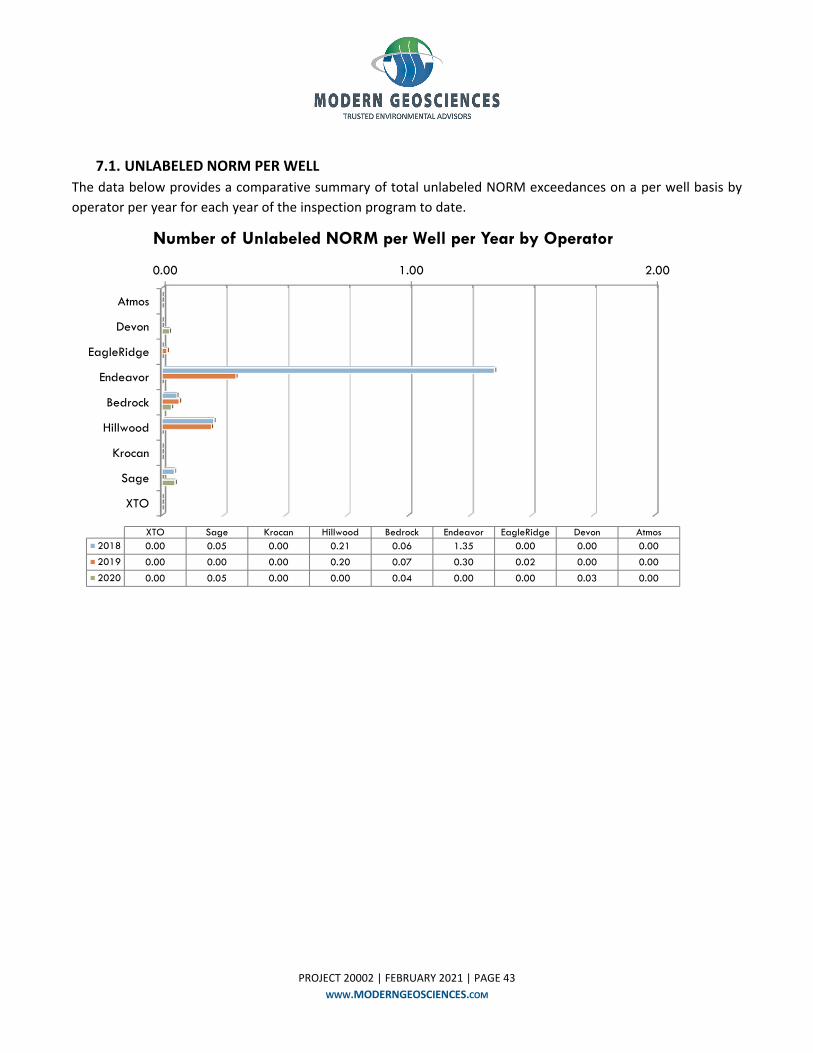
7.1. UNLABELED NORM PER WELL
The data below provides a comparative summary of total unlabeled NORM exceedances on a per well basis by
operator per year for each year of the inspection program to date.
0.00 1.00 2.00
Atmos
Devon
EagleRidge
Endeavor
Bedrock
Hillwood
Krocan
Sage
XTO
AtmosDevonEagleRidgeEndeavorBedrockHillwoodKrocanSageXTO2018 0.000.000.001.350.060.210.000.050.00
2019 0.000.000.020.300.070.200.000.000.00
2020 0.000.030.000.000.040.000.000.050.00
Number of Unlabeled NORM per Well per Year by Operator
PROJECT 20002 | FEBRUARY 2021 | PAGE 44
WWW.MODERNGEOSCIENCES.COM
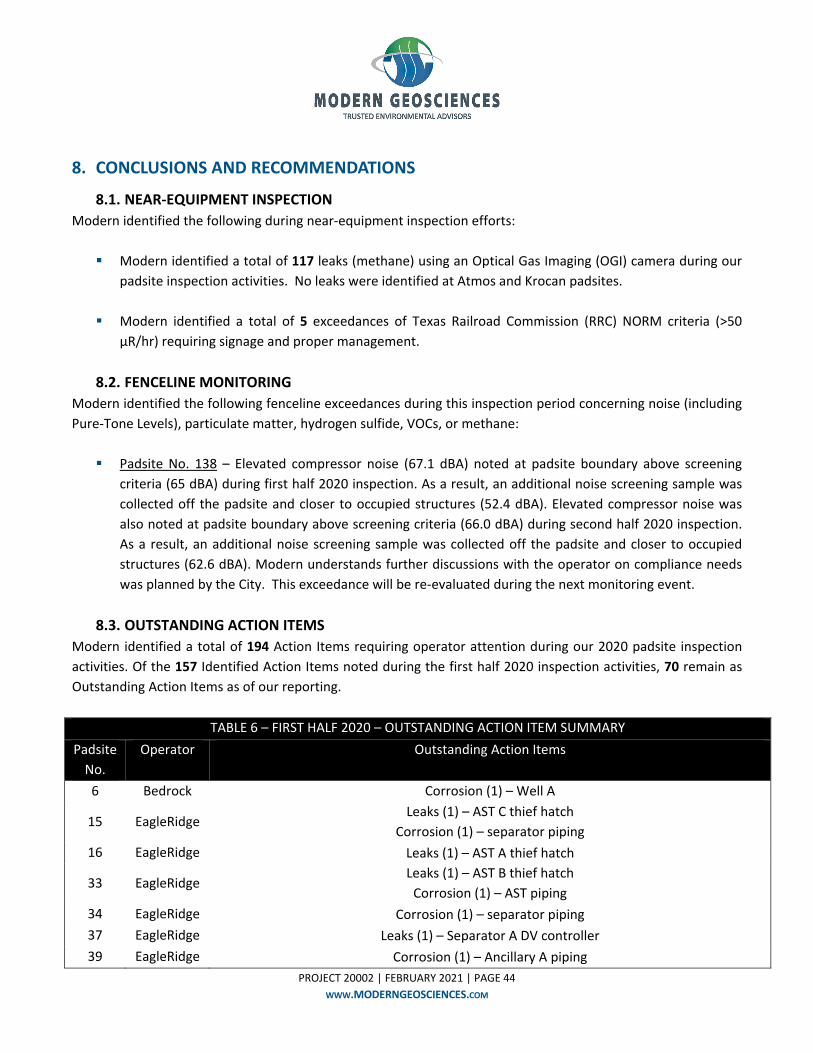
8. CONCLUSIONS AND RECOMMENDATIONS
8.1. NEAR‐EQUIPMENT INSPECTION
Modern identified the following during near‐equipment inspection efforts:
Modern identified a total of 117 leaks (methane) using an Optical Gas Imaging (OGI) camera during our
padsite inspection activities. No leaks were identified at Atmos and Krocan padsites.
Modern identified a total of 5 exceedances of Texas Railroad Commission (RRC) NORM criteria (>50
µR/hr) requiring signage and proper management.
8.2. FENCELINE MONITORING
Modern identified the following fenceline exceedances during this inspection period concerning noise (including
Pure‐Tone Levels), particulate matter, hydrogen sulfide, VOCs, or methane:
Padsite No. 138 – Elevated compressor noise (67.1 dBA) noted at padsite boundary above screening
criteria (65 dBA) during first half 2020 inspection. As a result, an additional noise screening sample was
collected off the padsite and closer to occupied structures (52.4 dBA). Elevated compressor noise was
also noted at padsite boundary above screening criteria (66.0 dBA) during second half 2020 inspection.
As a result, an additional noise screening sample was collected off the padsite and closer to occupied
structures (62.6 dBA). Modern understands further discussions with the operator on compliance needs
was planned by the City. This exceedance will be re‐evaluated during the next monitoring event.
8.3. OUTSTANDING ACTION ITEMS
Modern identified a total of 194 Action Items requiring operator attention during our 2020 padsite inspection
activities. Of the 157 Identified Action Items noted during the first half 2020 inspection activities, 70 remain as
Outstanding Action Items as of our reporting.
TABLE 6 – FIRST HALF 2020 – OUTSTANDING ACTION ITEM SUMMARY
Padsite
No.
Operator Outstanding Action Items
6 Bedrock Corrosion (1) – Well A
15 EagleRidge Leaks (1) – AST C thief hatch
Corrosion (1) – separator piping
16 EagleRidge Leaks (1) – AST A thief hatch
33 EagleRidge Leaks (1) – AST B thief hatch
Corrosion (1) – AST piping
34 EagleRidge Corrosion (1) – separator piping
37 EagleRidge Leaks (1) – Separator A DV controller
39 EagleRidge Corrosion (1) – Ancillary A piping

PROJECT 20002 | FEBRUARY 2021 | PAGE 45
WWW.MODERNGEOSCIENCES.COM
TABLE 6 – FIRST HALF 2020 – OUTSTANDING ACTION ITEM SUMMARY
Padsite
No.
Operator Outstanding Action Items
41 EagleRidge Leaks (2) – Well A kimray valve and Separator A DV controller
42 EagleRidge
Leaks (1) – AST B thief hatch
Corrosion (2) – separator piping and AST piping
Secondary Containment (1) – sheen on standing water (no leak visible)
47 EagleRidge Leaks (2) – AST A enardo valve and DV controller
48 EagleRidge Leaks (3) – Separator A DV controller, Separator B DV controller, and AST E enardo valve
Corrosion (2) – separator piping and AST piping
64 EagleRidge Leaks (1) – AST A thief hatch
Corrosion (1) – separator piping
65 EagleRidge
Leaks (4) – Separator B DV controller, AST A enardo valve, AST E enardo valve, and
Compressor A pneumatic liquid level controller
Corrosion (1) – AST piping
66 EagleRidge Corrosion (1) – AST piping
67 EagleRidge Leaks (1) – Separator A DV controller
Corrosion (2) – Separator A and AST piping
68 EagleRidge
Leaks (5) – Separator A DV controller, Separator B DV controller, AST B thief hatch, AST C
enardo valve, and Compressor A pinhole leaks on hose
Corrosion (3) – Well A, Well B, and AST piping
69 EagleRidge Leaks (1) – AST A enardo valve
73 EagleRidge Overgrown vegetation (1) – Well A
74 EagleRidge Corrosion (3) – separator piping, AST piping, and Ancillary A
75 EagleRidge
Leaks (5) – Separator B DV controller, Separator C DV controller, AST A enardo valve, AST B
thief hatch, and Compressor A kimray valve
Corrosion (2) – separator piping and AST piping
77 EagleRidge Leaks (1) – AST B enardo valve
81 EagleRidge Corrosion (1) – AST piping
107 EagleRidge Corrosion (2) – separator piping and AST piping
109 EagleRidge Overgrown vegetation (1) – Well A
117 EagleRidge Corrosion (3) – separator piping, AST A, and AST piping
124 EagleRidge Leaks (1) – Well A B‐section
144 EagleRidge Corrosion (2) – AST A and B
150 Bedrock Leaks (1) – Separator F actuator
157 Sage
Leaks (4) – Separator C actuator, AST C enardo valve, AST D enardo valve, and AST E enardo
valve
Corrosion (1) – AST piping
PROJECT 20002 | FEBRUARY 2021 | PAGE 46
WWW.MODERNGEOSCIENCES.COM
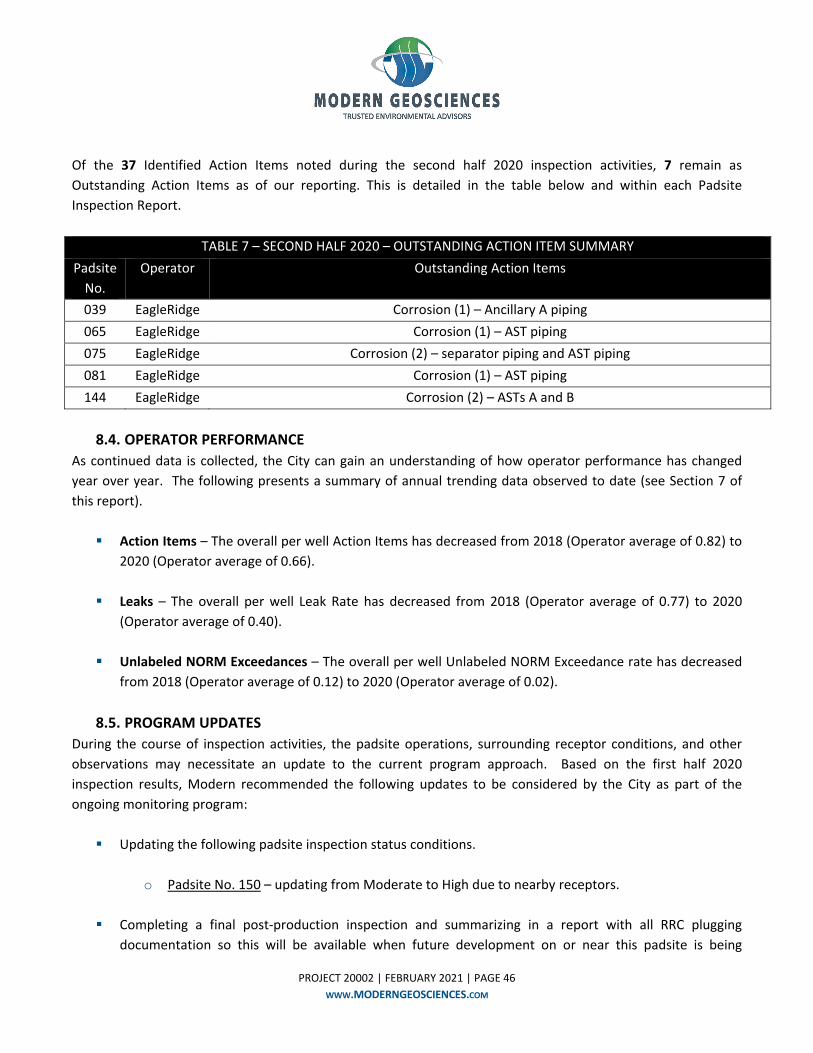
Of the 37 Identified Action Items noted during the second half 2020 inspection activities, 7 remain as
Outstanding Action Items as of our reporting. This is detailed in the table below and within each Padsite
Inspection Report.
TABLE 7 – SECOND HALF 2020 – OUTSTANDING ACTION ITEM SUMMARY
Padsite
No.
Operator Outstanding Action Items
039 EagleRidge Corrosion (1) – Ancillary A piping
065 EagleRidge Corrosion (1) – AST piping
075 EagleRidge Corrosion (2) – separator piping and AST piping
081 EagleRidge Corrosion (1) – AST piping
144 EagleRidge Corrosion (2) – ASTs A and B
8.4. OPERATOR PERFORMANCE
As continued data is collected, the City can gain an understanding of how operator performance has changed
year over year. The following presents a summary of annual trending data observed to date (see Section 7 of
this report).
Action Items – The overall per well Action Items has decreased from 2018 (Operator average of 0.82) to
2020 (Operator average of 0.66).
Leaks – The overall per well Leak Rate has decreased from 2018 (Operator average of 0.77) to 2020
(Operator average of 0.40).
Unlabeled NORM Exceedances – The overall per well Unlabeled NORM Exceedance rate has decreased
from 2018 (Operator average of 0.12) to 2020 (Operator average of 0.02).
8.5. PROGRAM UPDATES
During the course of inspection activities, the padsite operations, surrounding receptor conditions, and other
observations may necessitate an update to the current program approach. Based on the first half 2020
inspection results, Modern recommended the following updates to be considered by the City as part of the
ongoing monitoring program:
Updating the following padsite inspection status conditions.
o Padsite No. 150 – updating from Moderate to High due to nearby receptors.
Completing a final post‐production inspection and summarizing in a report with all RRC plugging
documentation so this will be available when future development on or near this padsite is being
PROJECT 20002 | FEBRUARY 2021 | PAGE 47
WWW.MODERNGEOSCIENCES.COM
considered. This should include a surface NORM survey, subgrade leak evaluation, and confirmation
ordinance requirements have all been met.
o Padsite Nos. 032, 086, 114, 116, 121, 128, 129, 136, 137, and 145 – Once all infrastructure is
properly plugged and removed.
PROJECT 20002 | FEBRUARY 2021 | PAGE 48
WWW.MODERNGEOSCIENCES.COM
9. IMPORTANT ACRONYMS
AMCV Air Monitoring Comparison Value (Short or Long Term Criteria)
AST Aboveground storage tank
ASTM ASTM International
BACT Best Available Control Technology
BMP Best Management Practice
CAA Clean Air Act
COC Chemicals of Concern
EPA United States Environmental Protection Agency
ESL Effect Screening Level (Short or Long Term Criteria)
ETJ Extra Territorial Jurisdiction
FID Flame Ionization Detector
FRP Fiberglass Reinforced Plastic
GC/MS Gas Chromatograph/Mass Spectrometer
HAP Hazardous Air Pollutant
HASP Health and Safety Plan
HQ Hazard Quotient
IDLH Immediately Dangerous to Life and Health
IHW TCEQ Industrial & Hazardous Waste Program
LDAR Leak Detection and Repair
LDCP Leak Detection and Compliance Plan
MACT Maximum Achievable Control Technology
MSDS Material Safety Data Sheet
NAAQS National Ambient Air Quality Standard
NESHAP National Emissions Standards for Hazardous Air Pollutants
NORM (Technologically Enhanced) Naturally Occurring Radioactive Material
NSPS New Source Performance Standard
OPM Open Path Monitoring
OSHA Occupational Safety & Health Administration
PEL OSHA Permissible Exposure Limit
PID Photo Ionization Detector
PM Particulate Matter
PROJECT 20002 | FEBRUARY 2021 | PAGE 49
WWW.MODERNGEOSCIENCES.COM
PPB Parts Per Billion (PPBV – by volume)
PPM Parts Per Million (PPMV – by volume)
RBEL Risk Based Exposure Limit
RCRA Resource Conservation and Recovery Act
RfC Reference Concentration
ROD Record of Decision
RRC Texas Railroad Commission
RSC Reduced Sulfur Compounds
SVOCs Semi‐volatile Organic Compounds
TCEQ Texas Commission on Environmental Quality
TD Thermal Desorption
TOX Total Organic Halides
TPH Total Petroleum Hydrocarbons
TPWD Texas Parks and Wildlife Department
TRRP Texas Risk Reduction Program
tVOCs Total Volatile Organic Compounds
TVA Total Vapor Analyzer (Typically in the form of a Flame Ionization Detector or FID)
TWDB Texas Water Development Board
TXU Texas Utilities
URF Unit Risk Factor
USC United States Code
USGS United States Geological Survey
UST Underground Storage Tank
UV Ultraviolet
VOCs Volatile Organic Compounds
PROJECT 20002 | FEBRUARY 2021 | PAGE 50
WWW.MODERNGEOSCIENCES.COM
10. LIMITATIONS AND EXCEPTIONS
Modern’s services were performed in a manner consistent with a level of care and skill ordinarily exercised by
other members of our profession practicing in the same locality, under similar conditions and at the time the
services were performed. Laws, regulations and professional standards applicable to Modern's services are
continually evolving. Techniques are, by necessity, often new and relatively untried. Different professionals
may reasonably adopt different approaches to similar problems. As such, our services are intended to provide
our client with a source of professional advice, opinions and recommendations based on a limited number of
field observations and tests, collected and performed in accordance with the generally accepted practice that
exists at the time, and may depend on, and be qualified by, information gathered previously by others and
provided to Modern by our Client.
The monitoring results collected as part of these services represent conditions at the time of inspection or
monitoring only. Samples or monitoring data collected at other times may reveal different results that are
representative of site conditions during other periods of time. The use of monitoring efforts is not intended to
replace laboratory methodology. Modern’s air sampling has been consistent with current regulatory guidance
and manufacturer specification. For a higher level of certainty our monitoring methods can be expanded over
longer periods of time and/or supplemented by use of a state‐accredited laboratory when evaluation of specific
COCs is desired or further verification is needed.
Our conclusions, opinions and recommendations are based only on the information available for review at the
time of reporting. This included a limited number of observations and data points. It is likely that conditions will
vary between or beyond the specific points evaluated. Environmental conditions at areas or portions of the Site
where sampling was not conducted may vary from those encountered at actual sample locations. Further,
certain indicators for the presence of hazardous materials or other constituents may have been latent,
inaccessible, unobservable, or not present during Modern’s performance of its services, and Modern cannot
represent that the Site contains no hazardous materials or other latent conditions beyond those identified in
connection with this effort. There is no investigation that is thorough enough to identify the presence or
absence of all materials at a site which is currently, or at some point in the future, may be considered hazardous.
Modern offers various levels of investigative services to suit the varying needs of our clients. It should be
recognized that definition and evaluation of geologic and environmental conditions are a difficult and inexact
science. Judgments leading to conclusions and recommendations are generally made with incomplete
knowledge of the atmospheric or subsurface conditions present due to the limitations of data from field studies.
Although risk can never be eliminated, more exhaustive studies will produce additional data, which can help
understand and manage the level of risk present. Since more detailed studies require greater expense, our
clients participate in the determination of acceptable risk for their purposes.
WWW.MODERNGEOSCIENCES.COM
FIGURES
")
")
") ")")
")")
")
")")")
")
")")")
")") ")
")")")
")")
")
")")")")")")
")")
")")")
")
")")")
")")
")")
")")
") ")")
") ")")")")")
")
")
")")")")
")
")
")")")")")
")
")
")
")
")")
")
")
")
")")
")
")
")")
")
")
")
")
")
")
")
")
")
")
")
")
")
") ")
")
")")
")
")
")
")
")")
")
")
")
")
")
")
") ")
")")
")")") ")
")
")
")
")
")")")")")")")")
")")
")
")
")")
")")
")
")
")
")
")
")
")
")
")")
")")
")
")
")
")
")
157
65 7
2
8
4
9
13
8663
4762
75
9497
45
48
84
44
78
16
88
65
91
18
80
61
51
59
55
7970
35
40
81
21
67
9896
11
7487
6672
4313
20
17
99
92
95
34
19
3649
14
4254
68
69
15
3850
41
64
39
89
90
33
73
32
93
83
10
717677
46
28
3130
2922
2523
2624
8285
57
585253
12
60
156
155
150
153152
148
151
149
133
146
104
147
138
140
102
100105
154
145
103139
136137
117118
144
128
110
126
112
142
121113
143
120
108
122
141
129
111
124
115
109
106107
127
119
116
123
125
114
132
101
130
134135
131
56
27 37
PADSITE LOCATION MAP
Denton, Texas1
2000201.11.21
CS/DWKT
K
PROJECT NO.DRAWN:DRAWN BY:CHECKED BY:FILE NAME:
FIGURE
0 1 2 3Miles
Sources: Esri, HERE, DeLorme, Intermap, increment P Corp., GEBCO, USGS, FAO, NPS, NRCAN, GeoBase, IGN, Kadaster NL, Ordnance Survey, Esri Japan, METI, Esri China (Hong Kong), swisstopo, MapmyIndia, © OpenStreetMap contributors, and the GIS User Community
This figure was prepared using data from a variety of sources.No warranty is made as to the accuracy or completeness of dataprovided through third parties. All data contained herein issubject to change without notice. This figure is not intendedfor use as a legal survey or construction design document.
Denton_PadsiteLocation_210111.mxd
LegendPadsites by Operator (No. of Wells):") Eagleridge (92)") Devon (61)") Bedrock (50)") Sage (36)") Endeavor (10)
") Hillwood (14)") Atmos (8)") Krocan (3)") XTO (2)") Plugged and Abandoned
Denton City Limit
")
")
") ")")
")")
")
")")")
")
")")")
")") ")
")")")")")
")")")")
")")
")")")
")")")
")")
")")
") ")")
") ")")")")")
")
")
")")")
")")")")")
")
")
")
")
")")
")
")
")
")")
")
")")")
")
")
")
")
")
")
")
")
")
")
") ")
")")
")
")
")")
")")
")
")
")
")
")
")
")")") ")
")
")
")
")
")")")")")")
")")
")
")
")")
") ")
")
")
")
")
")")
")")
")
")
")
")
")
D)D)
D)
D)
D)D)
D)
D)
D)
D)
D)D)
D)
D)
D)
D)D)
D)
D)
D)
D)
D)
D)
3727
56131
135134
130
101
132
114
125
123
116
119
127
107106
109
115
124
111
129
141
122
108
120
143
113121
142
112
126
110
128
144
118117
137136
139103
145
154
105100
102
140
138
147
104
146
133
149
151
148152
153
150
155
156
60
12
5352
58
57
8582
2426
2325
22 293031
28
46
7776
71
10
83
93
32
73
33
90
89
39
64
41
5038
15
69
68
54 42
14
4936
19
34
95
92
99
17
20
1343
7266
87 74
11
9698
67
21
81
40
35
7079
55
59
51
61
80
18
91
65
88
16
78
44
84
48
45
9794
75
6247
6386
31
9
4
8
2
75 6
157
PADSITE INSPECTIONSUMMARY MAP
Denton, Texas2
2000201.11.20
CS/DWKT
K
PROJECT NO.DRAWN:DRAWN BY:CHECKED BY:FILE NAME:
FIGURE
0 1 2 3Miles
This figure was prepared using data from a variety of sources.No warranty is made as to the accuracy or completeness of dataprovided through third parties. All data contained herein issubject to change without notice. This figure is not intendedfor use as a legal survey or construction design document.
Service Layer Credits: Sources: Esri, HERE, Garmin, Intermap, increment P Corp., GEBCO,USGS, FAO, NPS, NRCAN, GeoBase, IGN, Kadaster NL, Ordnance Survey, Esri Japan, METI,Esri China (Hong Kong), (c) OpenStreetMap contributors, and the GIS User Community
Denton_Summary_210111.mxd
Legend") No Action Item(s) Identified") Operator Addressed Action Item(s) (COD Confirmed/Further Verification Planned)") Outstanding Action Item(s)D) Padsite Not Scheduled for Inspection in 2020") Padsite Closed (All Wells Plugged)
Denton City Limit