Embed Size (px)
Citation preview
Package ‘EloRating’February 19, 2015
Type Package
Title Animal Dominance Hierarchies by Elo Rating
Version 0.43
Depends zoo
Date 2014-11-23
Author Christof Neumann & Lars Kulik
Maintainer Christof Neumann <[email protected]>
Description Calculate Elo ratings as means to describe animal dominance hierarchies
License GPL (>= 2)
NeedsCompilation no
Repository CRAN
Date/Publication 2014-11-23 23:36:52
R topics documented:EloRating-package . . . . . . . . . . . . . . . . . . . . . . . . . . . . . . . . . . . . . 2adv . . . . . . . . . . . . . . . . . . . . . . . . . . . . . . . . . . . . . . . . . . . . . . 3bonobos . . . . . . . . . . . . . . . . . . . . . . . . . . . . . . . . . . . . . . . . . . . 4creatematrix . . . . . . . . . . . . . . . . . . . . . . . . . . . . . . . . . . . . . . . . . 4DS . . . . . . . . . . . . . . . . . . . . . . . . . . . . . . . . . . . . . . . . . . . . . . 6e.single . . . . . . . . . . . . . . . . . . . . . . . . . . . . . . . . . . . . . . . . . . . 7elo.seq . . . . . . . . . . . . . . . . . . . . . . . . . . . . . . . . . . . . . . . . . . . . 8eloplot . . . . . . . . . . . . . . . . . . . . . . . . . . . . . . . . . . . . . . . . . . . . 10extract.elo . . . . . . . . . . . . . . . . . . . . . . . . . . . . . . . . . . . . . . . . . . 11individuals . . . . . . . . . . . . . . . . . . . . . . . . . . . . . . . . . . . . . . . . . . 12lastdaypresent . . . . . . . . . . . . . . . . . . . . . . . . . . . . . . . . . . . . . . . . 13print . . . . . . . . . . . . . . . . . . . . . . . . . . . . . . . . . . . . . . . . . . . . . 14print.elo . . . . . . . . . . . . . . . . . . . . . . . . . . . . . . . . . . . . . . . . . . . 15prunk . . . . . . . . . . . . . . . . . . . . . . . . . . . . . . . . . . . . . . . . . . . . 15randomelo . . . . . . . . . . . . . . . . . . . . . . . . . . . . . . . . . . . . . . . . . . 16randomeloextract . . . . . . . . . . . . . . . . . . . . . . . . . . . . . . . . . . . . . . 17randomsequence . . . . . . . . . . . . . . . . . . . . . . . . . . . . . . . . . . . . . . 18
1
2 EloRating-package
scale.elo . . . . . . . . . . . . . . . . . . . . . . . . . . . . . . . . . . . . . . . . . . . 19seqcheck . . . . . . . . . . . . . . . . . . . . . . . . . . . . . . . . . . . . . . . . . . . 19stab.elo . . . . . . . . . . . . . . . . . . . . . . . . . . . . . . . . . . . . . . . . . . . 22summary.elo . . . . . . . . . . . . . . . . . . . . . . . . . . . . . . . . . . . . . . . . . 23traj.elo . . . . . . . . . . . . . . . . . . . . . . . . . . . . . . . . . . . . . . . . . . . . 24winprob . . . . . . . . . . . . . . . . . . . . . . . . . . . . . . . . . . . . . . . . . . . 25
Index 26
EloRating-package Elo Rating
Description
Calculate Elo ratings as means to describe animal dominance hierarchies
Details
Package: EloRatingType: PackageVersion: 0.43Date: 2014-11-23License: GPL (>= 2)
Author(s)
Christof Neumann & Lars Kulik Maintainer: Christof Neumann <[email protected]>
References
Elo, A. E. 1978. The Rating of Chess Players, Past and Present. New York: Arco.
Albers, P. C. H. & de Vries, H. 2001. Elo-rating as a tool in the sequential estimation of dominancestrengths. Animal Behaviour, 61, 489-495.
Neumann, C., Duboscq, J., Dubuc, C., Ginting, A., Irwan, A. M., Agil, M., Widdig, A. & En-gelhardt, A. 2011. Assessing dominance hierarchies: validation and advantages of progressiveevaluation with Elo-rating. Animal Behaviour, 82, 911-921.
Examples
data(adv)SEQ <- elo.seq(winner=adv$winner, loser=adv$loser, Date=adv$Date)summary(SEQ)
adv 3
adv Dominance sequence from Albers and de Vries (2001)
Description
Dominance sequence from Albers and de Vries (2001)
Usage
data(adv)
Format
Fictional example of an interaction sequence, with 33 interactions between 7 individuals.
Date Date of the interaction
Time Time of the interaction (not mandatory for calculations)
winner Winner of the interaction
loser Loser of the interaction
tie indicates whether the interaction ended undecided, i.e. in a draw/tie
Details
adv is the data set of fictional interactions that was used by Albers and de Vries (2001). adv2 adds tothis fictional data to indicate whether an interaction ended undecided (draw). advpres is a fictionalpresence data set, indicating which individuals were present and absent on which date.
Source
Albers, P. C. H. & de Vries, H. 2001. Elo-rating as a tool in the sequential estimation of dominancestrengths. Animal Behaviour, 61, 489-495.
References
Albers, P. C. H. & de Vries, H. 2001. Elo-rating as a tool in the sequential estimation of dominancestrengths. Animal Behaviour, 61, 489-495.
Examples
data(adv)
4 creatematrix
bonobos Dominance matrix from de Vries et al. 2006
Description
Dominance matrix of seven bonobos
Usage
data(bonobos)
Format
Dominance matrix of seven bonobos
Source
de Vries, H., Stevens, J. M. G. & Vervaecke, H. 2006. Measuring and testing the steepness ofdominance hierarchies. Animal Behaviour, 71, 585-592.
References
de Vries, H., Stevens, J. M. G. & Vervaecke, H. 2006. Measuring and testing the steepness ofdominance hierarchies. Animal Behaviour, 71, 585-592.
Examples
data(bonobos)
creatematrix create a dominance matrix
Description
create a dominance matrix from the underlying observed sequence
Usage
creatematrix(eloobject, daterange=NULL,drawmethod="omit", onlyinteracting=FALSE)
creatematrix 5
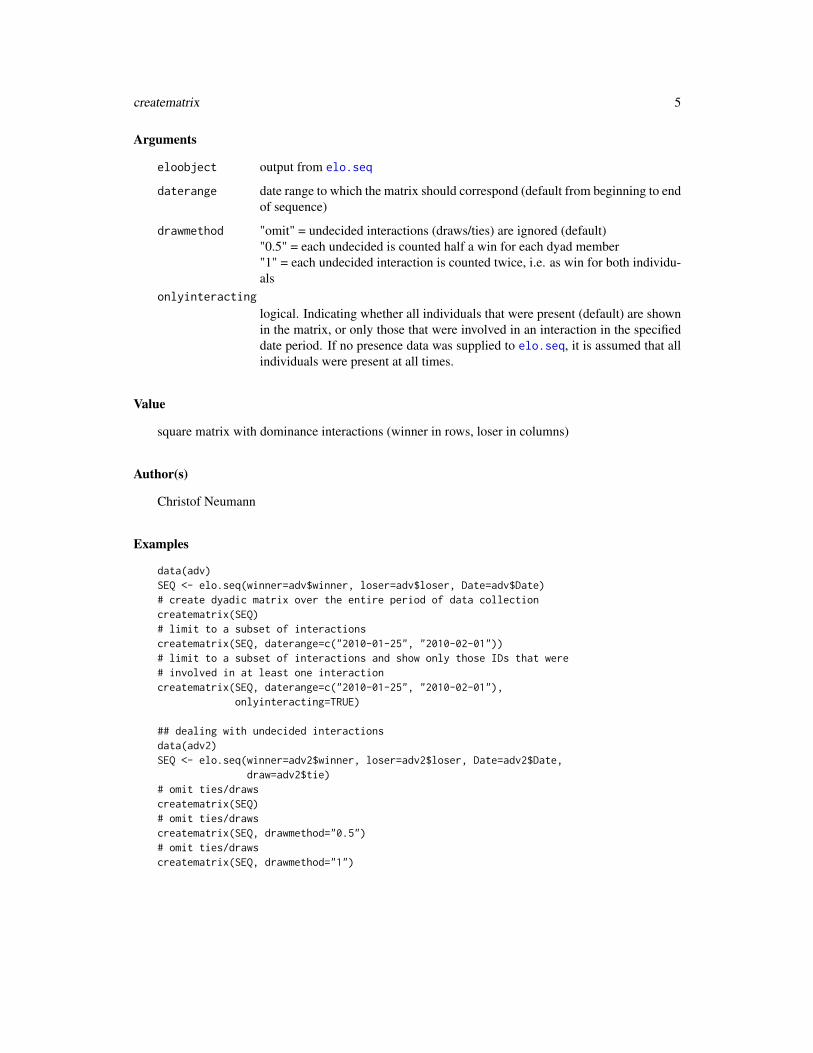
Arguments
eloobject output from elo.seq
daterange date range to which the matrix should correspond (default from beginning to endof sequence)
drawmethod "omit" = undecided interactions (draws/ties) are ignored (default)"0.5" = each undecided is counted half a win for each dyad member"1" = each undecided interaction is counted twice, i.e. as win for both individu-als
onlyinteracting
logical. Indicating whether all individuals that were present (default) are shownin the matrix, or only those that were involved in an interaction in the specifieddate period. If no presence data was supplied to elo.seq, it is assumed that allindividuals were present at all times.
Value
square matrix with dominance interactions (winner in rows, loser in columns)
Author(s)
Christof Neumann
Examples
data(adv)SEQ <- elo.seq(winner=adv$winner, loser=adv$loser, Date=adv$Date)# create dyadic matrix over the entire period of data collectioncreatematrix(SEQ)# limit to a subset of interactionscreatematrix(SEQ, daterange=c("2010-01-25", "2010-02-01"))# limit to a subset of interactions and show only those IDs that were# involved in at least one interactioncreatematrix(SEQ, daterange=c("2010-01-25", "2010-02-01"),
onlyinteracting=TRUE)
## dealing with undecided interactionsdata(adv2)SEQ <- elo.seq(winner=adv2$winner, loser=adv2$loser, Date=adv2$Date,
draw=adv2$tie)# omit ties/drawscreatematrix(SEQ)# omit ties/drawscreatematrix(SEQ, drawmethod="0.5")# omit ties/drawscreatematrix(SEQ, drawmethod="1")
6 DS
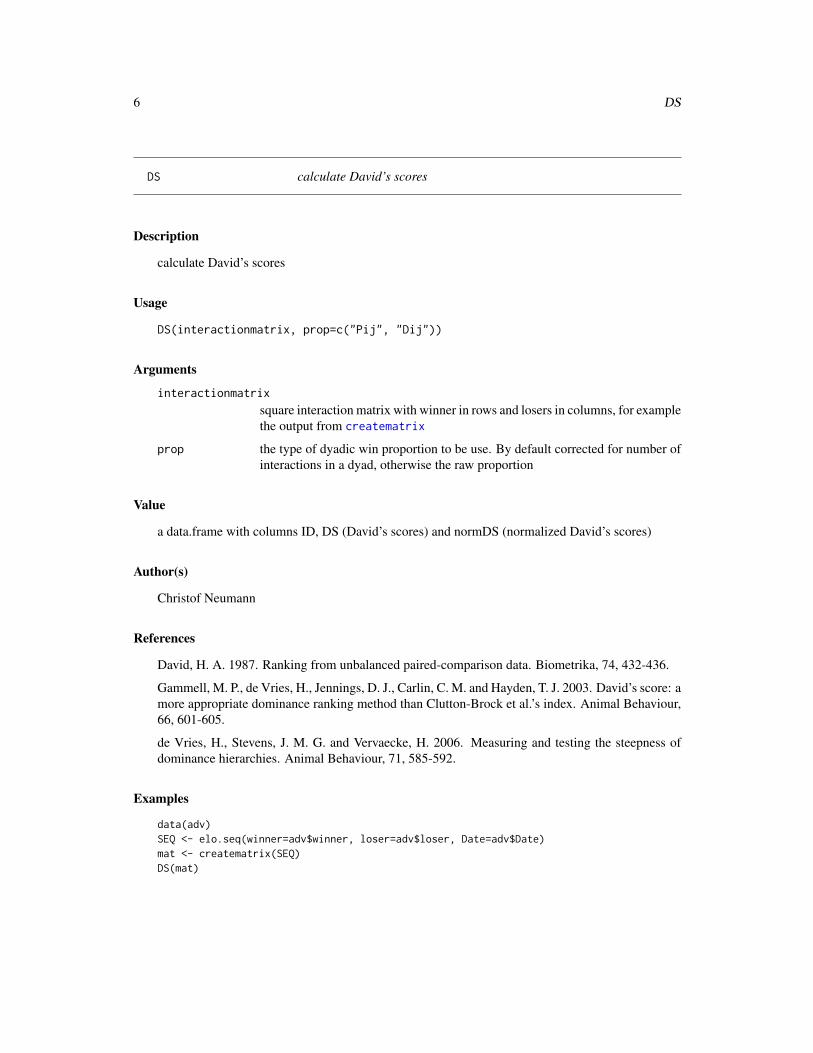
DS calculate David’s scores
Description
calculate David’s scores
Usage
DS(interactionmatrix, prop=c("Pij", "Dij"))
Arguments
interactionmatrix
square interaction matrix with winner in rows and losers in columns, for examplethe output from creatematrix
prop the type of dyadic win proportion to be use. By default corrected for number ofinteractions in a dyad, otherwise the raw proportion
Value
a data.frame with columns ID, DS (David’s scores) and normDS (normalized David’s scores)
Author(s)
Christof Neumann
References
David, H. A. 1987. Ranking from unbalanced paired-comparison data. Biometrika, 74, 432-436.
Gammell, M. P., de Vries, H., Jennings, D. J., Carlin, C. M. and Hayden, T. J. 2003. David’s score: amore appropriate dominance ranking method than Clutton-Brock et al.’s index. Animal Behaviour,66, 601-605.
de Vries, H., Stevens, J. M. G. and Vervaecke, H. 2006. Measuring and testing the steepness ofdominance hierarchies. Animal Behaviour, 71, 585-592.
Examples
data(adv)SEQ <- elo.seq(winner=adv$winner, loser=adv$loser, Date=adv$Date)mat <- creatematrix(SEQ)DS(mat)
e.single 7
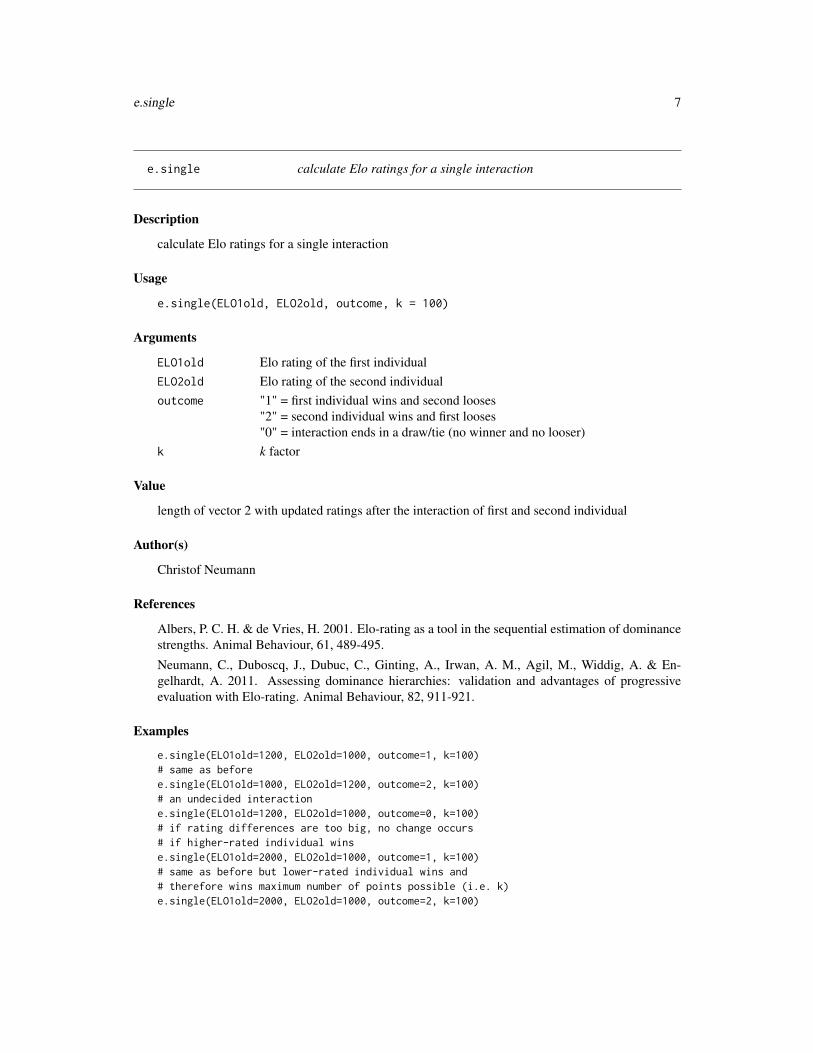
e.single calculate Elo ratings for a single interaction
Description
calculate Elo ratings for a single interaction
Usage
e.single(ELO1old, ELO2old, outcome, k = 100)
Arguments
ELO1old Elo rating of the first individualELO2old Elo rating of the second individualoutcome "1" = first individual wins and second looses
"2" = second individual wins and first looses"0" = interaction ends in a draw/tie (no winner and no looser)
k k factor
Value
length of vector 2 with updated ratings after the interaction of first and second individual
Author(s)
Christof Neumann
References
Albers, P. C. H. & de Vries, H. 2001. Elo-rating as a tool in the sequential estimation of dominancestrengths. Animal Behaviour, 61, 489-495.
Neumann, C., Duboscq, J., Dubuc, C., Ginting, A., Irwan, A. M., Agil, M., Widdig, A. & En-gelhardt, A. 2011. Assessing dominance hierarchies: validation and advantages of progressiveevaluation with Elo-rating. Animal Behaviour, 82, 911-921.
Examples
e.single(ELO1old=1200, ELO2old=1000, outcome=1, k=100)# same as beforee.single(ELO1old=1000, ELO2old=1200, outcome=2, k=100)# an undecided interactione.single(ELO1old=1200, ELO2old=1000, outcome=0, k=100)# if rating differences are too big, no change occurs# if higher-rated individual winse.single(ELO1old=2000, ELO2old=1000, outcome=1, k=100)# same as before but lower-rated individual wins and# therefore wins maximum number of points possible (i.e. k)e.single(ELO1old=2000, ELO2old=1000, outcome=2, k=100)
8 elo.seq
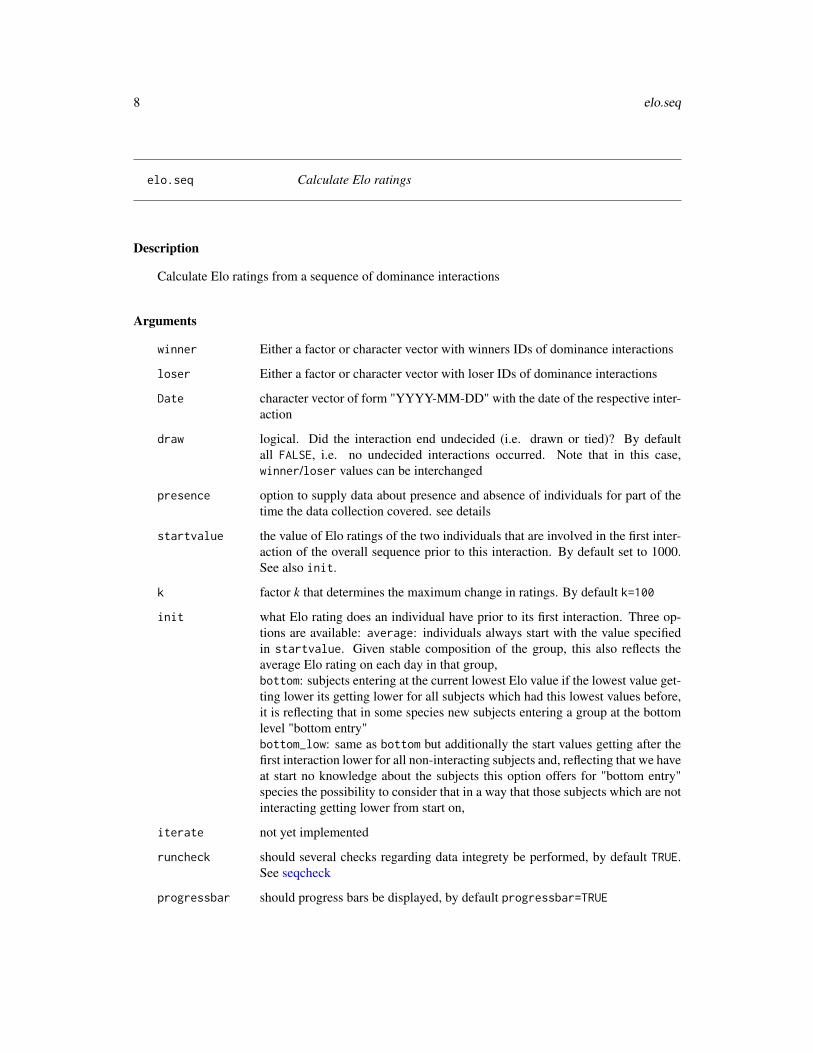
elo.seq Calculate Elo ratings
Description
Calculate Elo ratings from a sequence of dominance interactions
Arguments
winner Either a factor or character vector with winners IDs of dominance interactions
loser Either a factor or character vector with loser IDs of dominance interactions
Date character vector of form "YYYY-MM-DD" with the date of the respective inter-action
draw logical. Did the interaction end undecided (i.e. drawn or tied)? By defaultall FALSE, i.e. no undecided interactions occurred. Note that in this case,winner/loser values can be interchanged
presence option to supply data about presence and absence of individuals for part of thetime the data collection covered. see details
startvalue the value of Elo ratings of the two individuals that are involved in the first inter-action of the overall sequence prior to this interaction. By default set to 1000.See also init.
k factor k that determines the maximum change in ratings. By default k=100
init what Elo rating does an individual have prior to its first interaction. Three op-tions are available: average: individuals always start with the value specifiedin startvalue. Given stable composition of the group, this also reflects theaverage Elo rating on each day in that group,bottom: subjects entering at the current lowest Elo value if the lowest value get-ting lower its getting lower for all subjects which had this lowest values before,it is reflecting that in some species new subjects entering a group at the bottomlevel "bottom entry"bottom_low: same as bottom but additionally the start values getting after thefirst interaction lower for all non-interacting subjects and, reflecting that we haveat start no knowledge about the subjects this option offers for "bottom entry"species the possibility to consider that in a way that those subjects which are notinteracting getting lower from start on,
iterate not yet implemented
runcheck should several checks regarding data integrety be performed, by default TRUE.See seqcheck
progressbar should progress bars be displayed, by default progressbar=TRUE
elo.seq 9
Details
the presence ’matrix’ is actually an object of class data.frame containing information about wetheran individual was present on a given day or not. The first column represents the dates, running atleast from the date of the earliest interaction until at least the date of the last interaction with oneline per day (regardless of whether there were actually interactions observed on each day). Further,each individual is represented as a column in which "1" indicates an individual was present on therow-date and a "0" indicates the individuals absence on this date. NAs are not allowed. See advpresfor an example.
Value
An object of class elo, which is list with 10 items that serves as basis to extract relevant info.
mat a date by ID-matrix with raw Elo ratings
lmat a date by ID-matrix with raw Elo ratings
cmat a date by ID-matrix with raw Elo ratings
pmat a date by ID-matrix with with presence data
nmat a date by ID-matrix containing the number of interactions a given ID was in-volved in on a given day
logtable details on each single interaction
stability a data.frame containing information about stability (see stab.elo)
truedates vector of class Date covering the ranges of dates in the dataset
misc various
allids a (sorted) character vector with all IDs that occur in the dataset
Author(s)
Christof Neumann & Lars Kulik
References
Albers, P. C. H. & de Vries, H. 2001. Elo-rating as a tool in the sequential estimation of dominancestrengths. Animal Behaviour, 61, 489-495.
Neumann, C., Duboscq, J., Dubuc, C., Ginting, A., Irwan, A. M., Agil, M., Widdig, A. & En-gelhardt, A. 2011. Assessing dominance hierarchies: validation and advantages of progressiveevaluation with Elo-rating. Animal Behaviour, 82, 911-921.
Examples
data(adv)SEQ <- elo.seq(winner=adv$winner, loser=adv$loser, Date=adv$Date)summary(SEQ)
10 eloplot
eloplot Elo rating plotting
Description
Plotting Elo ratings for all or selected individuals over a specified time period
Usage
eloplot(eloobject, ids="all", interpolate="yes", from="start",to="end", color=TRUE)
Arguments
eloobject elo object output of elo.seq function
ids "all" will plot trajectories for all individuals within the dataset. "first.20"will plot the 20 first individuals. "random.20" will plot 20 randomly chosenindividuals from the dataset. Alternatively, provide a list of individual IDs.
interpolate by default ("yes") plot interpolated Elo values or plot Elo values without inter-polation ("no")
from "start": the plotted date range will start at the first date of the dataset or providea custom date ("YYYY-MM-DD")
to "end": the plotted date range will end at the last date of the dataset or provide acustom date ("YYYY-MM-DD")
color the plot is either colored (TRUE) or in black and white with symbols
Details
For a visual inspection of an Elo object it is useful to plot the calculated trajectories. We recommendnot to plot trajectories for more than 20 individuals at once.
Note also, if plots for IDs are requested that had observations on only one day, these IDs are ex-cluded from plotting and a corresponding warning message is produced.
Author(s)
Lars Kulik & Christof Neumann
Examples
data(adv)SEQ <- elo.seq(winner=adv$winner, loser=adv$loser, Date=adv$Date)eloplot(SEQ, ids="all", interpolate="yes", from="start", to="end",
color=TRUE)
extract.elo 11
extract.elo extract Elo ratings from elo object
Description
extract Elo ratings from elo object
Usage
extract.elo(eloobject, extractdate, standardize = FALSE, IDs = NULL,NA.interpolate = FALSE, daterange = 1)
Arguments
eloobject result from elo.seq
extractdate date on which Elo ratings should be obtained, defaults to the last day in the dataset
standardize should the returned ratings be scaled between 0 and 1. Default is FALSE. Seescale.elo
IDs specify IDs for which ratings are returned. By default, returns all that werepresent on the date or at least on one day of the date range
NA.interpolate if FALSE (default), the last known rating is returned, which might not be from thespecified date itself (but older). If TRUE, ratings on days without observations arelinearly interpolated between days with known ratings (i.e. dates with observedinteractions)
daterange if averaged ratings are desired, supply here the number of days fromextractdate - 1. By default (daterange = 1), the ratings of the singleextractdate are returned. daterange = 2 produces average ratings fromextractdate and the day after, and so on...
Value
named (IDs) vector of (average) Elo ratings
Author(s)
Christof Neumann
Examples
data(adv)SEQ <- elo.seq(winner=adv$winner, loser=adv$loser, Date=adv$Date)extract.elo(SEQ, "2010-01-30")extract.elo(SEQ, "2010-01-30", standardize=TRUE)
# same ratings (regardless of NA.interpolate),# since "g" was observed on both days
12 individuals
extract.elo(SEQ, "2010-01-29", IDs="g")extract.elo(SEQ, "2010-01-29", IDs="g", NA.interpolate=TRUE)
extract.elo(SEQ, "2010-01-31", IDs="g")extract.elo(SEQ, "2010-01-31", IDs="g", NA.interpolate=TRUE)
# different ratings (depending on NA.interpolate),# since "g" was not observed that dayextract.elo(SEQ, "2010-01-30", IDs="g")extract.elo(SEQ, "2010-01-30", IDs="g", NA.interpolate=TRUE)
extract.elo(SEQ, "2010-01-10", daterange=5)extract.elo(SEQ, "2010-01-10", daterange=5, NA.interpolate=TRUE)
individuals individuals present in the group
Description
returns IDs, number or IDs, or CV of number of present individuals
Usage
individuals(eloobject, from=eloobject$misc["maxDate"], to=NULL,outp=c("N", "IDs", "CV"))
Arguments
eloobject result from elo.seq
from from which date onwards should the ID statistics be calculated. By default thefirst date in the sequence is used
to until which date should the ID statistics be calculated. By default NULL, i.e. thereturned information refers to only the date specified by from
outp one of three options to determine which kind of information is returned: (1) "N":the (average) number of individuals present, (2) "IDs": the actual IDs, and (3):"CV": coefficient of number of individuals present
Details
if to=NULL, either the IDs (outp="IDs") or the number of individuals (outp="N") present on thisday is returned. outp="CV" is not defined in such a case (returns NA).
if a to date is set (i.e. different from NULL), either the IDs of all individuals that were present onat least one day of the date range (outp="IDs") is returned or the average number of individualspresent during this time (outp="N"). If outp="CV", the coefficient of variation of the number ofindividuals present is returned, which might be considererd another measure of stability on thegroup level.
lastdaypresent 13
Value
numeric or character
Author(s)
Christof Neumann
Examples
data(adv)SEQ <- elo.seq(winner=adv$winner, loser=adv$loser, Date=adv$Date)individuals(SEQ, outp="N")individuals(SEQ, outp="IDs")individuals(SEQ, outp="CV") # not defined
# consider additional presence informationdata(advpres)SEQ <- elo.seq(winner=adv$winner, loser=adv$loser, Date=adv$Date,
presence=advpres)individuals(SEQ, outp="N")individuals(SEQ, outp="IDs")individuals(SEQ, outp="CV") # not defined
# across a date rangeindividuals(SEQ, from="2010-01-01", to="2010-01-31", outp="N")individuals(SEQ, from="2010-01-01", to="2010-01-31", outp="IDs")individuals(SEQ, from="2010-01-01", to="2010-01-31", outp="CV")
lastdaypresent last day an individual was present
Description
last day an individual was present with respect to a reference date
Usage
lastdaypresent(x, ID="all", refdate=NULL)
Arguments
x output from elo.seq
ID character, if "all", all individuals are returned, otherwise only for the desiredID
refdate character or Date (YYYY-MM-DD), up to which date the presence data shouldbe considered, by default the last date of the sequene
14 print
Details
the function can result in NA for two reasons. 1) the ID is not found in the presence data, which isaccompanied by a warning and 2) the ID was not yet present if a referene date is specified
Value
Date or NA
Author(s)
Christof Neumann
Examples
data(adv); data(advpres)SEQ <- elo.seq(winner=adv$winner, loser=adv$loser, Date=adv$Date, presence=advpres)lastdaypresent(SEQ, "all", refdate="2010-01-02")lastdaypresent(SEQ, "f", refdate="2010-02-02")
print prints its argument
Description
prints its argument
Usage
## S3 method for class 'sequencecheck'print(x, ...)## S3 method for class 'seqchecknopres'print(x, ...)
Arguments
x the result from seqcheck
... further arguments passed to or from other methods
Author(s)
Christof Neumann
Examples
data(adv); data(advpres)SEQC <- seqcheck(winner=adv$winner, loser=adv$loser, Date=adv$Date,
presence=advpres)print(SEQC)
print.elo 15
print.elo prints its argument
Description
prints its argument
Usage
## S3 method for class 'elo'print(x, ...)
Arguments
x result from elo.seq
... further arguments passed to or from other methods
Author(s)
Christof Neumann
Examples
data(adv)SEQ <- elo.seq(winner=adv$winner, loser=adv$loser, Date=adv$Date)print(SEQ)
prunk unknown relationships
Description
unknown relationships
Usage
prunk(eloobject, daterange=NULL)
Arguments
eloobject output from elo.seq or a matrix, e.g. from creatematrix
daterange date range to be considered (character or Date of length 2), by default considersthe entire date range of the sequence. In case the function works on a matrix thisis ignored.
16 randomelo
Value
numeric, proportion of unknown relationships (and total N) when considering all possible dyads,and the same after accounting for co-residency. For matrices, considering co-residency is ignored(not possible...)
Author(s)
Christof Neumann
Examples
data(adv); data(advpres)x <- elo.seq(winner=adv$winner, loser=adv$loser, Date=adv$Date, presence=advpres)prunk(x, c("2010-01-01", "2010-01-15"))mat <- creatematrix(x, c("2010-01-01", "2010-01-15"))prunk(mat)
randomelo calculate Elo ratings from an interaction matrix
Description
calculate Elo ratings from an interaction matrix based on randomly generated sequences
Usage
randomelo(interactionmatrix, runs=2000)
Arguments
interactionmatrix
square interaction matrix with winner in rows and losers in columns, for examplethe output from creatematrix
runs number of randomly generated sequences based on the interactions in the matrix
Value
list of length 2. The first element contains a matrix with the final ratings of each individual fromeach random sequence. IDs are in the columns, each run is represented as one row. The secondelement of the list contains the original interaction matrix.
Author(s)
Christof Neumann
randomeloextract 17
Examples
data(adv)SEQ <- elo.seq(winner=adv$winner, loser=adv$loser, Date=adv$Date)mat <- creatematrix(SEQ)res <- randomelo(mat, 10)data.frame(ID=colnames(res[[1]]), avg=round(colMeans(res[[1]]),1))
randomeloextract extract ratings from random sequences based on an interaction matrix
Description
extract ratings from random sequences based on an interaction matrix
Usage
randomeloextract(x, ID, mode=c("obj", "samp", "avg"))
Arguments
x output from randomelo
ID ID
mode character, one of three: 1) obj: a random value from all the sequences; 2) samp:a random value sampled from a normal distribution with mean and sd of allrandomized values; 3) avg: the average value from all the runs
Value
numeric
Author(s)
Christof Neumann
Examples
data(adv)SEQ <- elo.seq(winner=adv$winner, loser=adv$loser, Date=adv$Date)mat <- creatematrix(SEQ)res <- randomelo(mat, 10)randomeloextract(res, "a", "samp")randomeloextract(res, "a", "obj")randomeloextract(res, "a", "avg")
18 randomsequence
randomsequence create a random dominance sequence
Description
create a random dominance sequence for testing or simulations
Usage
randomsequence(nID=10, avgIA=20, startdate=as.Date("2000-01-01"),alphabet=T, reversals=0.1, ties=NULL, presence=NULL)
Arguments
nID number of IDs, must be less than 2601.avgIA average number of interactions and individual is involved in.startdate a start datealphabet should the individual within an interaction that comes first in alphabetical order
be the winner? By default TRUE, which gives some orderliness in the hierarchy.reversals this proportion of interactions ends in reversed outcomes, i.e. the individual that
comes first in the alphabet looses. Default = 0.1.ties this proportion of interactions ends undecided.presence vector of length 2. The first value indicates what proportion of individuals are
absent for some time. The second value indicates the propotion of time (days)these individuals are absent.
Value
an object of class randomsequence, which is a list with the following items:
seqdat an interaction sequencepres a presence matrix, actually a data.frame
Author(s)
Christof Neumann
Examples
IA <- randomsequence()SEQ <- elo.seq(winner=IA$seqdat$winner, loser=IA$seqdat$loser,
Date=IA$seqdat$Date)stab.elo(SEQ)
IA <- randomsequence(presence=c(0.5,0.5))SEQ <- elo.seq(winner=IA$seqdat$winner, loser=IA$seqdat$loser,
Date=IA$seqdat$Date, presence=IA$pres)stab.elo(SEQ)
scale.elo 19
scale.elo standardize Elo ratings
Description
standardize Elo ratings between 0 and 1
Usage
## S3 method for class 'elo'scale(x, center = TRUE, scale = TRUE)
Arguments
x a vector of Elo ratings.
center ignored.
scale ignored.
Value
returns a vector of Elo ratings, which are scaled between 0 and 1, with the highest rating that issupplied becoming 1, the lowest becoming 0, and all others being proportionally scaled in between
Author(s)
Christof Neumann
Examples
data(adv)SEQ <- elo.seq(winner=adv$winner, loser=adv$loser, Date=adv$Date)extract.elo(SEQ, "2010-01-30")extract.elo(SEQ, "2010-01-30", standardize=TRUE)# same asscale.elo(extract.elo(SEQ, "2010-01-30"))
seqcheck runs raw data diagnostics for Elo rating
Description
runs some diagnostics on the data supplied to elo.seq, to check whether elo.seq will run withouterrors
20 seqcheck
Usage
seqcheck(winner, loser, Date, draw=NULL, presence=NULL)
Arguments
winner factor or character vector of winner IDs
loser factor or character vector of loser IDs
Date character vector of form "YYYY-MM-DD" with the date of the respective inter-action
draw logical (of length(winner)). Did did the interaction end undecided (i.e. drawedor tied)? By default all FALSE, i.e. no undecided interactions occured
presence data.frame with presence data, see elo.seq
Details
calender dates (for the sequence as well as in the first column of presence, if supplied) need to bein "YYYY-MM-DD" format!
seqcheck will return two types of messages: warnings and errors. Errors will result in the data NOTworking when supplied to elo.seq, and need to be fixed. Warning message do not necessarily leadto failure of executing elo.seq. Note that by default seqcheck is part of elo.seq. If any erroror warning is produced by seqcheck, these data will not work in elo.seq. Some warning (butnot error) messages can be ignored (see below) and if the runcheck argument in elo.seq is set toFALSE Elo ratings will be calculated properly in such cases.
The actual checks (and corresponding messages) that are performed are described in more detailhere:
Most likely (i.e. in our experience), problems are caused by mismatches between the interactiondata and the corresponding presence data.
Errors:presence starts AFTER data: indicates that during interactions at the beginning of the sequence,no corresponding information was found in the presence data. Solution: augment presence data, orremove interactions until the date on which presence data startspresence stops BEFORE data: refers to the corresponding problem towards the end of interactionand presence dataduring the following interactions, IDs were absent...: indicates that according to thepresence data, IDs were absent (i.e. "0"), but interactions with them occured on the very date(s)according to the interaction datathe following IDs occur in the data sequence but NOT...: there is/are no columnscorresponding to the listed IDs in the presence datathere appear to be gaps in your presence (days missing?)...: check whether yourpresence data includes a line for each date starting from the date of the first interaction through tothe date of the last interaction
Warnings:presence continues beyond data: indicates that presence and interaction data do not end onthe same date.presence starts earlier than data: indicates that presence and interaction data do not starton the same date.
seqcheck 21
the following IDs occur in the presence data but NOT...: there are more ID columnsin the presence data than IDs occuring in the interaction data
Other warnings/errors can result from inconsistencies in either the presence or sequence data, or beof a more general nature:
Errors:no 'Date' column found: in the presence data, no column exists with the name/header "Date".Please rename (or add) the necessary column named "Date" to your presence data.at least one presence entry is not 1 or 0: presence data must come in binary form, i.e.an ID was either present ("1") or absent ("0") on a given date. No NAs or other values are allowed.your data vectors do not match in length: at least one of the three mandatory arguments(winner, loser, Date) differs from one other in length. Consider handling your data in a data.frame,which avoids this error.
Warnings:IDs occur in the data with inconsistent capitalization: because R is case-sensitive,"A" and "a" are considered different individuals. If such labelling of IDs is on purpose, ignore thewarning and set runcheck=FALSE when calling elo.seq()There is (are) X case(s) in which loser ID equals winner ID: winner and loserrepresent the same IDthe following individuals were observed only on one day: while not per se a problem forthe calculation of Elo ratings, individuals that were observed only on one day (irrespective of thenumber of interactions on that day) cannot be plotted. eloplot will give a warning in such cases,too.
Value
returns info about possible errors, or states that data are fine for running with elo.seq
Author(s)
Christof Neumann
Examples
data(adv)seqcheck(winner=adv$winner, loser=adv$loser, Date=adv$Date)data(advpres)seqcheck(winner=adv$winner, loser=adv$loser, Date=adv$Date,
presence=advpres)
# create faulty presence datafaultypres <- advpres[-1, ]faultypres[5,2:8] <- 0# seqcheck(winner=adv$winner, loser=adv$loser, Date=adv$Date,# presence=faultypres)
22 stab.elo
stab.elo calculate stability index S
Description
Calculates the S index as metric for the overall stability of a hierarchy during a specified time period
Usage
stab.elo(eloobject, from=min(eloobject$stability$date),to=max(eloobject$stability$date), weight=TRUE)
Arguments
eloobject an object of class "elo", usually the result of a call to elo.seq
from from which date onwards should S be calculated. By default the first date in thesequence is used
to until which date should S be calculated. By default the last date in the sequenceis used
weight should single rank changes be weighted by the Elo rating of the highest-ratedindividual involved in a rank change? Default is TRUE
Details
S ranges between 0 and 1, where 0 indicates an unstable hierarchy, in which the ordering reversesevery other day, and 1, in which the ordering is stable and no rank changes occur.In contrast to the originally proposed S, this version is now standardized between 0 and 1, andadditionally, the interpretation is reversed, i.e. 1 refers to stable situations, whereas values closer to0 indicate more instable hierarchies
Value
returns the S index
Author(s)
Christof Neumann
References
Neumann, C., Duboscq, J., Dubuc, C., Ginting, A., Irwan, A. M., Agil, M., Widdig, A. & En-gelhardt, A. 2011. Assessing dominance hierarchies: validation and advantages of progressiveevaluation with Elo-rating. Animal Behaviour, 82, 911-921.
McDonald, D. B. & Shizuka, D. 2013. Comparative transitive and temporal orderliness in domi-nance networks. Behavioral Ecology, 24, 511-520.
summary.elo 23
Examples
data(adv)SEQ <- elo.seq(winner=adv$winner, loser=adv$loser, Date=adv$Date)stab.elo(SEQ)stab.elo(SEQ, weight=FALSE)stab.elo(SEQ, from="2010-01-20", to="2010-01-30")stab.elo(SEQ, from="2010-01-20", to="2010-01-30", weight=FALSE)
summary.elo summarize elo object
Description
overview of elo object
Usage
## S3 method for class 'elo'summary(object, ...)
Arguments
object an object of class "elo", usually the result of a call to elo.seq
... further arguments passed to or from other methods.
Author(s)
Christof Neumann
Examples
IA <- randomsequence()SEQ <- elo.seq(winner=IA$seqdat$winner, loser=IA$seqdat$loser,
Date=IA$seqdat$Date, draw=IA$seqdat$Draw,presence=IA$pres)
summary(SEQ)
24 traj.elo
traj.elo calculate dominance trajectory
Description
calculate individual Elo rating trajectory over time
Usage
traj.elo(eloobject, ID, from=min(eloobject$stability$date),to=max(eloobject$stability$date))
Arguments
eloobject result from elo.seqID the ID(s) of the individual(s)from from which date onwards should the trajectory be calculated. By default the first
date in the sequence is usedto until which date should the trajectory be calculated. By default the last date in
the sequence is used
Value
A data.frame with as many lines as specified in ID, columns for ID, date range, the actual slope(trajectory), and the number of observed interactions within the date range
Author(s)
Christof Neumann
Examples
data(adv)SEQ <- elo.seq(winner=adv$winner, loser=adv$loser, Date=adv$Date)traj.elo(SEQ, "a")
traj.elo(SEQ, "a", from="2010-01-20", to="2010-01-30")
# no slope available if ID was not observed interacting# inside the date rangetraj.elo(SEQ, "a", from="2010-01-17", to="2010-01-18")
# no slope available if ID was only observed interacting# once within the date rangetraj.elo(SEQ, "a", from="2010-01-17", to="2010-01-19")
# for several individualstraj.elo(SEQ, c("a", "b", "c"))
winprob 25
winprob calculate expected probability of winning
Description
calculate expected probability of winning given known strength of both opponents
Usage
winprob(elo1, elo2)
Arguments
elo1 Elo rating from individual for which the winning probability should be calcu-lated
elo2 Elo rating of the opponent
Value
numeric, expected chance of first individual to win an interacation with the second individual
Author(s)
Christof Neumann
References
Elo, A. E. 1978. The Rating of Chess Players, Past and Present. New York: Arco.
Examples
winprob(1200,1000)winprob(1000,1200)winprob(1000,1000)
Index
∗Topic \textasciitildekwd1e.single, 7extract.elo, 11print, 14print.elo, 15randomsequence, 18scale.elo, 19seqcheck, 19traj.elo, 24
∗Topic \textasciitildekwd2e.single, 7extract.elo, 11print, 14print.elo, 15randomsequence, 18scale.elo, 19seqcheck, 19traj.elo, 24
∗Topic datasetsadv, 3bonobos, 4
∗Topic packageEloRating-package, 2
adv, 3adv2 (adv), 3advpres, 9advpres (adv), 3
bonobos, 4
creatematrix, 4, 6, 15, 16
DS, 6
e.single, 7elo.seq, 5, 8, 10–13, 15, 19–24eloplot, 10, 21EloRating (EloRating-package), 2EloRating-package, 2extract.elo, 11
individuals, 12
lastdaypresent, 13
print, 14print.elo, 15prunk, 15
randomelo, 16, 17randomeloextract, 17randomsequence, 18
scale.elo, 11, 19seqcheck, 8, 14, 19stab.elo, 9, 22summary.elo, 23
traj.elo, 24
winprob, 25
26