Embed Size (px)
Citation preview
B O N N E V I L L E P O W E R A D M I N I S T R A T I O N
Pacific Northwest Smart Grid Demonstration Project
A COMPILATION OF SUCCESS STORIES

02 Letters from BPA and Battelle
05 Avista
11 PGE
15 University of Washington
19 Idaho Falls
23 Flathead Electric Co-op
27 NorthWestern Energy
31 Milton-Freewater
35 Lower Valley Energy
39 PenLight
43 City of Ellensburg
47 Benton PUD
51 Glossary

2
THE BONNEVILLE POWER ADMINISTRATION INVESTS in the Northwest’s energy future. Through its Technology Innovation program, BPA funds an annual portfolio of projects that advance technologies and enable breakthroughs and operational improvements in support of BPA’s mission of providing low-cost, reliable electric power to the Pacific Northwest. BPA’s research goals, as outlined in its strategic direction and technology roadmaps, focus on key areas such as advancing energy efficiency technologies, preserving and enhancing generation and transmission system assets, and expanding balancing capabilities and resources. Since 2005, Technology Innovation’s disciplined research management approach has led to unprecedented levels of success.
BPA works closely with the U.S. Department of Energy and Electric Power Research Institute, and continues to strategically expand its partnerships with electric utilities, universities, researchers and technology developers. Technology Innovation has led the collaborative development of roadmaps that pinpoint the technology needs for the electric power industry for the next five to 20 years. To date, BPA has partnered with industry experts, researchers and others to develop technology roadmaps for energy efficiency, transmission and demand response. These roadmaps now serve as a resource for BPA and others to prioritize their technology investments and identify partnership opportunities.
BPA’s R&D investments deliver savings of millions of dollars in avoided costs and increased efficiencies, and result in a smarter, more dynamic, efficient and reliable Northwest electric power system. Today, BPA is investing about $17 million annually in R&D, which is nearly five times the U.S. industry average. The largest project in the TI portfolio is the $178 million Pacific Northwest Smart Grid Demonstration Project. The nation’s largest smart grid demonstration project involves 60,000 metered customers across five states, 11 public and private utilities, two universities and six infrastructure partners. Through BPA’s $10 million cost-share contribution, the project has deployed $80 million in new smart grid technologies in the Northwest, setting the stage for regional smart grid growth.
Terry Oliver BPA CHIEF TECHNOLOGY INNOVATION OFFICER
LETTER FROM BPA

3
WHEN WE EMBARKED UPON THIS AMBITIOUS PROJECT in 2010, we began an exciting, and highly challenging, journey. It was not an entirely new endeavor — we were building on the earlier GridWise® Olympic Peninsula demonstration. But no project had tackled the breadth and scope of implementing a key new smart grid technology called transactive control, for coordinating demand response from 11 utilities across a five-state region. In addition, participants identified their own individual smart grid technology objectives. In all, the project will have evaluated about 80 different technology test cases. Like any project of this size and nature, we worked our way through perplexing technical issues and challenges we didn’t anticipate, but we also experienced rewarding accomplishments.
This booklet chronicles the Pacific Northwest Smart Grid Demonstration Project’s successes. It’s exciting to read about Lower Valley Energy’s great experience with water heater demand response, Portland General Electric’s creation of the Salem Smart Power Center, the University of Washington’s broader understanding of electricity consumption in campus buildings, and Avista’s visionary work in establishing a smart grid city. There are a number of successes to report among the participating utilities, and I hope you’ll take time to peruse the articles and learn more about other examples of progress. It’s also illuminating to read about aspects of the project that didn’t turn out as planned — essentially “lessons learned” that, along with successes, will be important in informing the industry for future smart grid technology deployment.
Battelle and the other participants in this demonstration are pleased and proud to have been a part of a monumental project that reflects the unique grid-related capabilities — and ingenuity — of the Pacific Northwest. I have no doubt that this project and the knowledge that has been gained will successfully prepare the region for a bold energy future that strengthens our economy, protects our environment and enhances our quality of life.
Ron Melton BATTELLE PROJECT DIRECTOR
LETTER FROM BATTELLE


5
Pacific Northwest Smart Grid Demonstration Project SUCCESS STORIES
AVISTA
Creating a smart city by focusing on grid efficienciesBefore Washington was granted statehood, the utility known as Avista had already built the world’s longest transmission line and would later go on to create the country’s first electric stove. Today, Avista’s rich history of innovation is being applied to one of the greatest challenges facing the energy industry — integrating new technologies. Avista’s vision for modernizing its grid resulted in the region’s first smart grid city as part of the Pacific Northwest Smart Grid Demonstration Project.
With an investment of $19 million, matched by funds from the Department of Energy, Avista has the momentum to deploy a system-of-systems architecture model. Washington State University partnered with Avista as part of its project.
As Avista’s funding accelerated, so did the pace of the upgrades. Yet the approach to planning one of the region’s first smart cities remained strategic and forwarding-looking.
The case for a system of systems “You have to look at the business case with respect to the current reality and potential new realities,” said Curtis Kirkeby, Avista’s principal investigator for the smart grid demonstration. “The economics that we have used forever in utilities may not be the economics that are actually valid anymore.”
Instead of looking at one particular system, Avista’s business case for smart grid
AVISTA CORPORATIONSpokane, Washington � Investor-owned utility since 1889
� 125-year history of innovation
� 30,000 square-mile service territory
� Serves population of 1.5 million in eastern Washington, northern Idaho and eastern Oregon
� Electricity and gas service
� 359,000 electric customers
INVESTMENT $19 million
HIGHLIGHTS � Voltage optimization
� Capacitor bank controls
� Smart transformers
� Customer thermostats and apps
�WSU air handlers, chillers and generators
FOR MORE INFORMATIONCurtis Kirkeby (509) 495-4763www.avistautilities.com

6
An Avista dispatcher is able to see, in real-time, the current state of portions of Avista’s distribution network.
concentrated on a much broader set of objectives, with a deliberate focus on interoperability and the ability to share information across multiple systems.
“It made for strong solutions as we move forward,” said Kirkeby. “You don’t want to limit yourself or short the vision.”
After all, to create a smart city, scale is important.
“Our goal was to do everything possible that would result in better operation of our system. At the same time, we wanted to maximize reliability, system efficiency and the customer experience. We knew that’s where we would find the greatest value, when we could achieve all three of these objectives,” said Heather Rosentrater, Avista’s director of engineering.
Smart circuits set the stage First, Avista upgraded electrical facilities and automated the electrical distribution system in Spokane and Pullman. A distribution management system was put in place to serve as the brains for the
smart city, along with intelligent devices and a communications system to benefit more than 110,000 electric customers.
Smart circuits reduce energy losses, lower system costs and improve reliability and efficiency in the electricity distribution system.
The system efficiencies will save about 42,000 megawatt-hours per year, enough to power 3,500 homes, and prevent
14,000 tons of carbon from being released into the atmosphere from power generation.
Problem areas on the system are instantly identified by the advanced distribution management system, which was deployed for one-third of the customer base. A whole new level of information is displayed, which can be operated manually or fully automated around the clock — not a typical installation. The distribution management system features predictive applications and auto-restoration technology.
The new, advanced distribution manage-ment system revolutionizes how the system is designed, built, tuned and operated. Real-time power management systems require an accurately maintained
calculation model so that the distributed resources can be managed regardless of location.
Smart transformers Every home or business uses different amounts of energy that’s distributed through a transformer on a pole to multiple sites. Smart transformers installed in the Pullman area gather information about how much energy each transformer supplies, so Avista can determine the appropriate size transformer to meet customers’ energy needs. The “right sizing” of transformers makes the distribution system more efficient as energy is delivered to customers.
Biggest bang for your buckEfficiency equals managing voltage and power factors.
Using voltage optimization, the utility can lower the voltage on the feeder — the line from a substation to the home or business — to minimize the loss of electricity.
“As we scoped the project, we realized this is where the biggest bang for the buck is,” said Kirkeby. “This is where the real dollars are. We estimated 1.86 percent savings by applying this technology to the feeders in Pullman on WSU’s campus based on a regional study, but we’re actually seeing 2.5 percent.”
There’s also still room to grow this efficiency savings. Fine tuning continues.
“Be part of the study that may change everything”The two-way communication foundation requires installation of advanced meters at the customer’s location. All of Pullman and Albion — a total of 13,600 customers — now have advanced meters. The digital meters operate via a secure wireless network, allowing two-way, real-time communication between the customer’s meter and Avista.

7
Smart thermostat pilot participants received a free thermostat.
We upgraded your meter to a digital advanced meter so you can save energy.
As part of Avista’s Smart Grid Demon-stration Project, you've been given a new, smarter meter. Advanced meters allow a secure, two-way wireless communication between your meter and Avista.
This means you can now access an online portal to view your usage down to the hour, make adjustments, and start saving energy. You’re helping us learn how new technologies can enhance the safety, reliability and efficiency of energy delivery for all of our customers.
LOG ON. ADJUST. SAVE!
Use your advanced meter dashboard to manage your home’s energy use:
portal to view your usage down to the hour, make adjustments, and start saving energy. You’re helping us learn how new technologies can enhance the safety, reliability and efficiency of energy delivery for all of our customers.
Use your advanced meter dashboard to manage your home’s energy use:
Compare daily energy use with outside temperatures.
Track your hour-by-hour daily usage.
See the ways that your home uses energy.
Log in to your account at avistautilities.com and click on the “My Advanced Meter” icon.
WATCH a QUICK TUTORIAL »
We upgraded your meter to a digital advanced meter so you can save energy.
As part of Avista’s Smart Grid Demon-stration Project, you've been given a new, smarter meter. Advanced meters allow a secure, two-way wireless communication between your meter and Avista.
LOG ON. ADJUST. SASAS VAVA E!
Log in to your account at avistautilities.com and click on the “My Advanced Meter” icon.
SIGN IN NOW to START »
To learn more, please visit avistautilities.com/smartgrid.You will need an account to access your online reports.
Don’t have one? Sign up now at avistautilities.com.
© 2012 Avista Corporation. All Rights Reserved
Avista’s marketing campaign used inspirational language to recruit volunteers.
“We didn’t have any opposition to putting advanced meters there, which may not be typical across the country,” Kirkeby said.
Building awareness and understanding among customers was critical to successfully deploying new technology and engaging people. Inspirational key messages were disseminated through focus groups, targeted email and direct mail, print advertising, town meetings and board meetings. Cutting through the clutter of busy lives was challenging. Customers responded best to the in-person communication.
“They had the feeling that they were part of a project of national importance. The research aspect of our work resonated in a college community like Pullman. It was a feel-good thing for the customer — they felt like they were making a difference,” said Laurine Jue, a senior communications manager at Avista.
A dedicated point of contact was critical to answer tough questions about the pilot.
Smart thermostat pilotThe smart thermostat pilot was one of the customer-experience components of the project. Customers who volunteered to participate in the two-year pilot received a free smart thermostat, plus $100 per year in exchange for allowing the utility to remotely adjust the thermostat by 2 degrees Fahrenheit for a period of 10 minutes to 24 hours. The customer could always override the setting at any time.
“You can set up a program to override at any point,” said Joshah Jennings, a smart thermostat pilot participant.
Settings, including alerts, can be adjusted directly, over the Internet or with a smart phone. Using the application on a regular basis keeps energy usage “top of mind” for customers. Participants could view energy usage down to the hour, make adjustments, and start saving energy. A price curve was set for hourly consumption. For the Jennings, a fiscally conservative family of five, saving money is important.
“But being a technology buff too, it was kind of fun to play with the new technology,” Jennings said.
All customers with the smart thermostats also had advanced meters that provided usage data. At the end of the pilot, data indicated that smart thermostat participants reduced consumption between 4.5 and 9 percent.
AVISTA TIP: The thermostat was designed so that the vendor and its product were not dependent on Avista — the connection was through public Internet. The thermostat read the meter and sent data back to the thermostat vendor through its own mechanism. That means no maintenance for Avista.
Energy Analyzer needs actionable itemsAnother aspect of the customer experience was giving customers access to information about their energy use. Using a web portal, called the Energy Analyzer, customers could log in to their account to see their energy use patterns and make informed decisions about choices that drive energy costs.
The launch of the web portal was promoted with direct marketing and an online video to help educate customers about how to use it. While some customers looked at the portal frequently, most customers did not find it compelling. Although the average site visit was six minutes and 36 seconds, access to the web portal did not result in a measureable change in consumption.

8
One of the main factors that could have contributed to this is the absence of time-of-use rates, which could directly impact customers’ usage patterns. Plus, every customer has a preferred method for accessing information, whether it’s direct mail, email, a website or a mobile device.
Avista suspected that if an actionable item doesn’t result from the data, it’s not something a customer will get excited about. If a customer wants a lower bill, suggestions based on the data provided would be more useful.
“That’s why we launched a texting pilot,” said Kirkeby. “It allowed customers to opt-in to receive daily or weekly usage updates via text or email, which included usage predictions based on all kinds of factors. Weather factors, household factors and HVAC factors are useful to a customer trying to manage their bill through their own efforts.”
“All of the work that we did in Pullman really has helped our customers understand on a personal level what Avista is doing to modernize our grid,” said Rosentrater. “What it means for customers is improved reliability; they’re going to experience fewer and shorter outages. What used to take hours to restore, can now be done in minutes.”
Washington State University was a centerpiece of Avista’s smart city in Pullman.
In the long run, fewer and shorter outages, plus options for saving energy, matter most. It’s a big win for customers.
A big win for Washington State University As a key partner in the project, Washington State University brought its best minds and dozens of facilities to the table. The campus can now be operated as a microgrid with the ability to control both loads and generation resources on campus, as well as respond to a transactive control request from Avista based on regional grid needs.
Working with Avista and with WSU professors Anurag Srivastava and Anjan Bose, students helped simplify the process for computing real-time savings from improved power factors and voltage reduction. They also developed new tools for reliability benefit calculations, for data transfer between software tools and for real-time load characteristic estimations.
The project resulted in award-winning work and provided valuable, hands-on experience to prepare students to be leaders in the 21st century power industry.
With its cost-share investment of $2.1 million, WSU also installed 88 smart electric meters, providing direct feedback to Avista for voltage optimization of the campus power circuits, and built sophisticated building control programs to automate its chillers, air handlers and three generators for smart grid operations.
For example, the air handlers in 29 campus buildings used to run without consideration of building occupancy levels. Air handlers ensure the air quality in buildings is consistent. With the new programs, the air handlers automatically ramp down when occupancy levels are low and ramp up before higher occupancy periods. While the technology doesn’t change what happens within the building, it optimizes the efficiency of the system by scheduling appropriate actions based upon campus needs.
“Their systems are smart enough to be able to manage all air handlers individually to get to some level of cumulative benefit,” said Kirkeby.
The voltage optimization and new air handler programs save the university a lot of money; it expects to save about $150,000 a year. Each one of the controllable assets can be managed in a much more efficient way and fine-tuned as conditions change.

9
It’s been really exciting! A year and a half after the distribution management system went live, we hit our one-millionth avoided outage minute. That’s a tangible benefit for our customers. Avista is also realizing benefits – we’ve learned so much and we’re applying these lessons every day.”
– HEATHER ROSENTRATER, AVISTA DIRECTOR OF ENGINEERING
Students helped to simplify the process of validating real-time savings from power factor and voltage reduction. A new tool was built to validate, or at least estimate with a high degree of accuracy, every circuit that’s involved in the system for every five-minute interval.
Avista generates a requestThese generation assets are also connected to Avista’s distribution management sys-tem through an Avista Generated Signal. Avista can generate a request to reduce those loads or generate power for various needs.
“If you think back to the energy crisis in 2000 when, in the Northwest, we were all looking for generation, now we have a push button for three of them,” said Kirkeby. “All Avista does now is make a request and they can be online.”
For the smart grid demo, a transactive control signal request came from Battelle. Avista then translated that into an Avista Generated Request Signal that went to WSU, asking for one of five tiers: one tier for air handlers, one tier for chillers, and three different tiers for generators.
Avista’s request asked for deployment of certain assets based on the request from Battelle. A WSU facilities operator decided whether or not to honor that request. If not, software sent Avista a text explaining why. Automatic texts were also generated. Codes were built into the system so that it still functions even without the transactive signal.
“Being a part of this pilot project has really opened doors for improved communica-tions, metering, power system operations, and building controls, which provide the tools for WSU to assist with regional needs while also reducing our operating costs,” said Terry Ryan, WSU director of Energy System Operations.
Win! Win! Win!Leveraging university assets is a model that Avista believes can be used elsewhere. After all, utilities and universities alike are always looking for ways to reduce costs.
“That’s exactly what we did,” said Kirkeby. “It’s a win-win-win for WSU, Avista and for the region.”
The project also greatly improved cyber security across the utility footprint. National Institute of Standards and Technology guidelines were used to assess risk. Then a mitigation measure was assigned to each risk to determine whether to proceed or how to proceed.
By participating in the project, Avista learned in a real-world environment the benefit stream from each component in a particular use case, and which pieces will extend well beyond the project and into the future to create an ultimate smart city configuration.
Some pieces of that puzzle are important lessons learned.
Learn! Learn! Learn!It’s not always easy to change an established paradigm, especially when redesigning business processes around
technologies such as automating grid control. Even some vendors pushed back.
“Some said: you don’t really want automation,” said Kirkeby. “To which we responded, ‘Yes! We really do!’ That’s why we’re doing this. We don’t want an army of people operating it; we want it to be automated.”
When working with vendors, “It always comes down to relationships and partnerships,” said Kirkeby.
Ironically, the very people expected to push back on automation were the most supportive: the linemen. For them, doing away with mundane tasks was positive. For others, it took trust that the system wouldn’t make mistakes and that, if it did make a mistake, consequences were managed.
Creating a smart city meant embracing change. It’s everywhere.
“We’ve changed as part of this project,” said Kirkeby. “We’ve revised the design, engineering and equipment standards going forward. We’ll add to those standards as new learnings come about and as we add more technologies or benefit streams we find.”

10
The future is an evolving vision. The grid will be a system that’s flexible, scalable and under-standable by the people building it. Avista’s roadmap includes a grid modernization program
budgeted for the next 25 to 30 years.
“We’re trying to be really proactive and create the utility of the future now,” said Rosentrater. “So we’re trying to figure out as a utility where we need to be, what we need to do to provide the most value to customers, and where customers will value us — value what we do and keep our business viable.”
With an increased capital budget for grid modernization, Avista is leveraging what’s already in place to advance the rest of the system. Armed with a smart grid roadmap from the demonstration, each feeder in Spokane will be modernized. In Pullman, a new battery unit is already in the works as part of a Washington State Department of Commerce grant. Avista will explore how battery storage capabilities can be integrated onto the grid to address the intermittent energy from renewable power.
Participating in the Pacific Northwest Smart Grid Dem-onstration project gave Avista the opportunity to realize the “endless” possibilities. And the many lessons learned have provided a solid foundation for Avista as it contin-ues to modernize the grid to meet the energy needs of its customers well into the future.
WHAT’S NEXT for Avista?

11
PORTLANDGENERALELECTRIC
Smart power in store for the futureGetting smart about electricity has never been more exciting. That’s especially true at Portland General Electric – Oregon’s largest investor-owned utility. PGE’s Salem Smart Power Center is a new five-megawatt battery storage facility that is part of the larger Pacific Northwest Smart Grid Demon-stration Project. This first-of-its-kind facility is one of the most advanced electrical systems in the nation and, as such, has inspired the imagination of a region. Energy storage is just one of the new technologies being tested by the proj-ect to integrate renewable energy, improve grid reliability and lower costs to customers.
With the foundation of a smart grid already in place — 800,000 smart meters — PGE was inspired to integrate several smart grid programs into one effort. It was an endeavor much larger than PGE could tackle on its own. The heart of it centered on the Salem Smart Power Center.
“A five-megawatt lithium-ion battery system that is grid-tied is very rare in the electricity business,” said Wayne Lei, director of R&D for PGE. “It’s one of just two owned and operated by an investor-owned utility.”
Big – really big –batteriesLithium batteries are widely used because of their high-energy density — the ability to store a lot of energy in a lightweight, compact form. It’s the same battery technology used in laptops and cell phones but on a much larger scale. The key feature of the 8,000-square-foot center is a five-megawatt lithium-ion battery-inverter system. The bank of batteries stores 1.25 megawatt-hours of
PORTLAND GENERAL ELECTRICPortland, Oregon � Founded in 1889
�Oregon’s largest invester-owned utility
� Serving 52 communities across Oregon
� 842,000 customers
� 13 power plants with capacity of 2,781 megawatts
INVESTMENT
$6.5 million
HIGHLIGHTS �Distribution microgrid
� Five-megawatt lithium-ion battery
� Intelligent distribution management
� Commercial demand response
�Demonstrates renewable integration
FOR MORE INFORMATIONKevin Whitener (503) 464-8219www.portlandgeneral.com
Pacific Northwest Smart Grid Demonstration Project SUCCESS STORIES

12
WHAT IS A MICROGRID?
A microgrid is a small-scale version of an electrical grid. It can be “islanded,” or disconnected from external transmission services. Local distribution provides power for customers’ electrical needs with only local generators and battery storage.
energy, which allows PGE engineers and planners to demonstrate high-reliability strategies involving intentional islanding of the feeder, distribution automation using smart switches, demand response, renewable energy integration and auto-matic economic dispatch.
Building the battery facility was an under-taking. But integrating the technologies was the real feat. It required a dedicated engineering team to address the complex challenges that arose in bringing this innovative facility to life. After all, many of the technologies implemented were new to the market.
“We underestimated what it takes to attach a five-megawatt battery to our own system,” said Kevin Whitener, the lead engineer for the project. “The complexity and the engineering challenge of doing that is something we hadn’t fully anticipated.”
Thousands of battery cells are stored in racks and wired together into a single system. Batteries use direct current while the distribution system uses alternating current, so inverters sit between the grid and the batteries. This allows power to flow in either direction, converting from AC to DC and back on demand. Coordinating the communication between the systems and components was substantial and complex.
For example, between the inverters, the battery management system and the other controllers in the facility, there are five different communication protocols. There are sixty-seven separately addressed internet devices communicating on two different networks within the facility. That created a lot of data handling challenges.
“The protocols had to be sorted out and interfaced together,” said Whitener. “There’s no way to do that short of spending weeks and months struggling to get it to work. But we did it.”
The safety of employees and the public is important to PGE, which is why the Salem Smart Power Center was constructed with a focus on safety. Due to the high energy density of the large battery, a unique fire control system was specially designed for the lithium-ion application that includes giant fans that keep the batteries cool at all times.
Creating a microgrid with macro resiliencyA microgrid improves a system’s resiliency by allowing the utility to segment a certain part of the feeder and to provide back-up electricity during
an outage. When a substation loses its power supply from the transmission lines, the battery system starts immediately, serving as an uninterruptable power supply.
If an outage were to occur in Salem, all residential, commercial and industrial customers on the circuit can be supplied electricity from the battery’s 1.25 mega-watt-hours of energy for 15–20 minutes. This is more than enough time to start the six customer-owned distributed diesel generators and synchronize them on the line. Once the feeder is isolated from the utility grid, the generators start up, and the circuit becomes a microgrid.
PGE has been working for more than 10 years to establish cooperative microgrids with customers that own standby generation. Together, they have built the nation’s largest distributed gen-eration program which shares customer generation with the utility in times of need. Many of PGE’s large customers have local diesel generation on site to prevent a power outage in case of an emergency. By partnering together, PGE is able to tap into this standby generation during an outage situation. The result is a highly resilient system.

13
Our electrical grid in the United States is one of the greatest accomplishments of the 20th century. Portland General Electric and its partners are demonstrating new technologies that hold promise for building a more efficient, sustainable and reliable grid. As these technologies became cost effective they can provide the opportunity to reshape not only the infrastructure that makes up the grid, but the approach utilities take to meeting the needs of our customers, the economy and the environment in the 21st century.
— JIM PIRO, PGE CEO AND PRESIDENT
A High Reliability ZonePGE named its microgrid a “High Reliability Zone.” The HRZ includes the large-scale energy storage system, customer standby generators and distribution automation components. These compo-nents, called smart switches, quickly sectionalize the microgrid in case of a fault, like a downed power line. The switches bring an even higher level of reliability to customers.
Unlike a standard feeder switch, which must be manually operated to change or stop the flow of power on a feeder, a smart switch “senses” changes in the feeder, like a fault, and activates the switch automatically. This changes the physical configuration of the feeder within seconds.
It’s a microgrid that heals itself.
For solar, it’s all in the algorithmOne of the most exciting parts of the project for PGE was exploring solutions
to integrate renewable energy into the grid using battery storage. A key challenge to using solar as a power source is that sunshine is intermittent, especially in Oregon. Using an algorithm, PGE demonstrated how solar energy can be combined with a battery to fill in the gaps when the sun isn’t shining and offer a seamless power flow.
With more than 6,000 megawatts of intermittent wind and solar power sweeping the Pacific Northwest electrical grid, the project provided an opportunity to learn how to best partner with customers to deliver high reliability. To test the integration, PGE used the solar output from the local potato chip maker, Kettle Brand, and then aimed to levelize, or fill in the blanks of this irregular output, using the battery.
Here is how the process works. First, an instantaneous measurement is taken of the customer demand on the circuit. Then a measurement is taken of the instantaneous power output from Kettle Brands’ solar plant. This information is compared to the theoretical ideal load for the utility’s circuit. The battery makes up the difference in the output in real-time,
either filling in the gaps where the clouds caused output to fall short of the best possible power or charging the batteries when the output from the panels is higher than normal.
“This is one of the few opportunities that the industry has had to prove these concepts and demonstrate that energy storage is indeed a solution to integrating solar energy,” said Whitener. “Impacts from what we’re doing here are far-reaching.”
An interesting exhibitThe Salem Smart Power Center has had many curious visitors. Tours feature a video reviewing the safety of the system, smart grid exhibits and an educational gallery with views into the operations center. Schools, other utilities, industry suppliers, consultants and government representatives all wanted to see this state-of-the-art facility.
“We’ve had more than 1,200 people visit the facility and learn about the project,” said Whitener. “That’s pretty astonishing.”
Partnering with customersPGE’s smart meters enable a two-way conversation between PGE and its customers, helping the utility to optimize its services, add convenience and lower energy costs. As part of this demonstration project, residential and business customers were enlisted to respond to grid conditions by reducing energy during peak times or during a test.
“The utility can decrease the load at peak times of use, or shift loads from one period to another,” says Carol Mills, PGE’s senior project manager. “The objective was to offer demand response assets that could respond to the project’s integrated systems.”
Although PGE installed a demand response management system in Salem, a ‘human in the loop’ was used to ensure the programs would be initiated and observed carefully when called into action.

14
An impressive transactive systemAs part of this project, PGE is testing ways in which we can automate renewable integration and demand response op-portunities to ensure customers receive the most benefit from energy resources for the least cost. The project includes testing a transactive system, an informa-tion system that automatically shares real-time data between computers at utilities and the transmission coordina-tor. Similar to how utilities get information from wholesale power markets today, this system sends out a price signal every five minutes, which reaches a multiple utility footprint at the same time. The signal shows how the price of power is expect-ed to change over the next three days.
Utilities then respond with a load forecast based on that string of future prices. This allows a system coordinator, in this case the Pacific Northwest National Laboratory, to calculate where the entire grid may have congestion issues in advance. The process is then repeated every five minutes, allowing for planning around congestion and prices to occur for everyone in the system.
Using artificial intelligence Although, automating the electricity market is still in testing stages, strides were made learning about which tools are needed for its development.
“We’ve proven that we can dispatch resources at the command of the trans-active node,” said Whitener.
The transactive node, which PGE calls the Smart Power Platform, is the main computer program that optimizes the economic decisions about the smart grid assets: when to dispatch, when to charge or discharge the battery, and when to use the demand response capability. The node responds to a signal from PNNL. To interact with the signal, PGE wrote its own software program using artificial
intelligence. Neural networks analyze the thousands of data points in the system and respond to the transactive signal. The computer absorbs all that information, synthesizes it, and makes a decision.
“We were able to demonstrate the ability of the computers on both sides to learn and get better at optimizing power for the least cost to customers,” said Lei. “It’s literally a monetary estimation in terms of the value to deliver and the value to acquire that power.”
Learning from unique systemsVirtually all systems tested by PGE were new and unique. The Salem Smart Power Center demonstrated the ability to island a microgrid with utility-scale storage and customer standby generation, operate demand response, respond to a transactive signal, and how to integrate these complex resources into a single control system. As a result, PGE offered several key takeaways:
� Take full advantage of consulting talent both within and outside the company to assess risk and make plans to mitigate that risk.
� Reduce financial risks by using government funds when possible.
� When it comes to a first-of-its-kind project, testing is your best friend. PGE sought to protect customers by ensuring the systems were reliable and robust. Perform and document lots of testing, especially when there is a potential to impact commercial and residential customers.
� Thoroughly vet vendors’ capabilities and financial strength. Smart grid technology is a growing industry, full of emerging companies. Ensure those companies are well-capitalized.
� To ensure the safety of employees and the public, it’s critical to have a robust set of safety requirements in place that serve as a system of checks and balances. For example, every test was preceded by a test plan. Test plans were
circulated through the project team and various departments within the company for approval.
Finally, assembling a strong, adaptable engineering and project management team makes all the difference.
“The team was able to lead the project over many different hurdles,” says Lei. “As the recognized experts in the topic, the team not only had to work with the management and technical aspects, but also to be able to communicate well with everyone in and outside the company.”
Smart grid technologies represent an opportunity to enhance the value custom-ers receive from the elec-tric system. This transition will be a significant chal-lenge — one that involves not only leveraging new technology, but also mak-ing major changes in the way electricity is provided and used. PGE is eager to engage in the research and development needed to bring our local and regional grid into the 21st century.
WHAT’S NEXT for PGE?

15
UNIVERSITY OF WASHINGTON
UW’s electric grid gets smart with living laboratoryHigher education happens at the University of Washington in more ways than one. For students, it’s academics. For facilities, it’s smart grid. More than 250 buildings on the university’s Seattle campus are temperature conditioned. That’s more than 13 million square feet of comfortable space to conduct research. And it goes to good use, because UW has one of the biggest research budgets among schools nationwide.
The scholastic setting provided a unique perspective for the Department of Energy demonstration. More than 20 million people are enrolled in higher-education programs across the country. That’s a lot of students, not to mention researchers and faculty. For that reason, college campuses make an ideal environment for advancing smart grid technologies.
“Finding solutions to real work problems is a really important part of today’s educational environment,” said Norm Menter, UW’s energy conservation manager. “Our student population demands that the university be involved in projects like this.”
UW is one of two universities, five technical firms and 11 utilities across an unprecedented five-state region selected to participate. The university was awarded $5.1 million in federal funds to complete its $10.2 million project.
By the numbersThe average daily population on campus is 60,000, and the average daily electrical demand is 38 megawatts. This costs the university about $1 million a month — making it Seattle City Light’s second largest customer. Even so, the campus also has its own five-megawatt steam turbine generator. The power
UNIVERSITY OF WASHINGTONSeattle, Washington
� Seattle City Light’s second largest commercial customer
� Population of 60,000
� 38 megawatts of demand
� Electricity bill of $1 million a month
INVESTMENT$5.1 million
HIGHLIGHTS � Energy dashboard
� Living laboratory
� Five-megawatt steam generator
FOR MORE INFORMATION
Norm Menter (206) 221-4269www.washington.edu
Pacific Northwest Smart Grid Demonstration Project SUCCESS STORIES
16
is distributed through a network of underground utility tunnels.
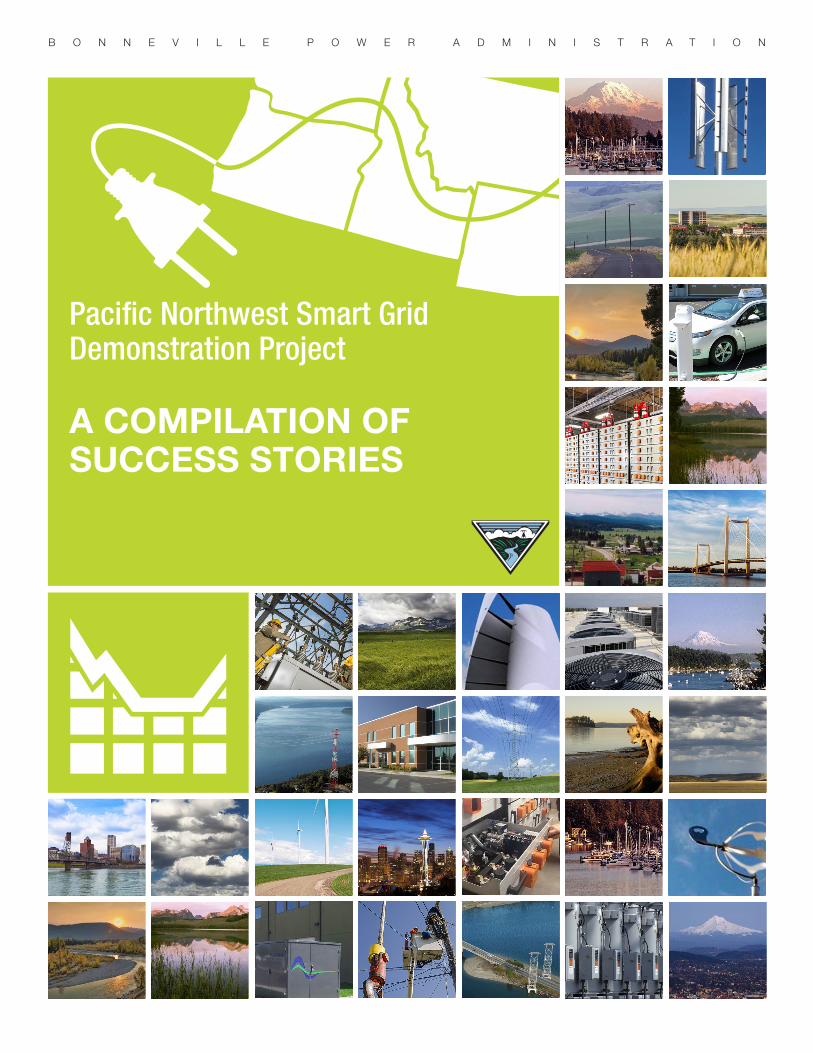
Energy dashboard drives decisionsBefore the project, UW had just seven meters on its Seattle campus to monitor energy use. Now, there are more than 200 smart meters acquiring near real-time data about energy consumption every five to 15 minutes. These meters transmit the data to a central repository. To see the data and more accurately predict future energy use, the project team built a console to analyze and display the information collected.
Data is analyzed and displayed on “dashboards” that provide an at-a-glance, graphical presentation of the energy use, within just minutes of its consumption. Anyone can view the data online and compare a year-and-a-half worth of information on each building’s energy consumption during any hour, and see how much that energy costs and patterns of use over time. Engineers at the univer-sity also use software tools to analyze the data collected, helping UW eliminate waste and save money.
One feature allows a comparison of energy use by building at different times of the day or year. That information is vital to determining how to reduce energy use and eliminate energy waste.
“The surprising thing we learned was that energy waste is not the same thing as en-ergy consumption,” said Menter. “Waste occurs just about everywhere, but just because you have high consumption in a particular building doesn’t necessarily mean that it’s being wasted. The informa-tion is valuable for decision-making, but it’s not the whole story.”
The dashboard raises awareness about a building’s overall efficiency and provides the opportunity to have a conversation about why changes need to be made to a building. This dialogue builds a common understanding so that decisions are made together across campus.
Sharing of data equals a need for improved cyber security. As a public university, UW has an open network. So coming into this project, the university had to overlay a private network onto its existing system. That cost quite a bit of extra money. But it was worth it. After all, having data, and being able to store that data securely and
make it available to the public, is immensely valuable to the research mission of UW.
A student energy intervention Of those interested in the data were — no surprise — the students. The energy use of freshmen in two residence halls was looked at by fellow students to see if a “technology intervention” could reduce the freshmen’s energy consumption, compared to a manual intervention.
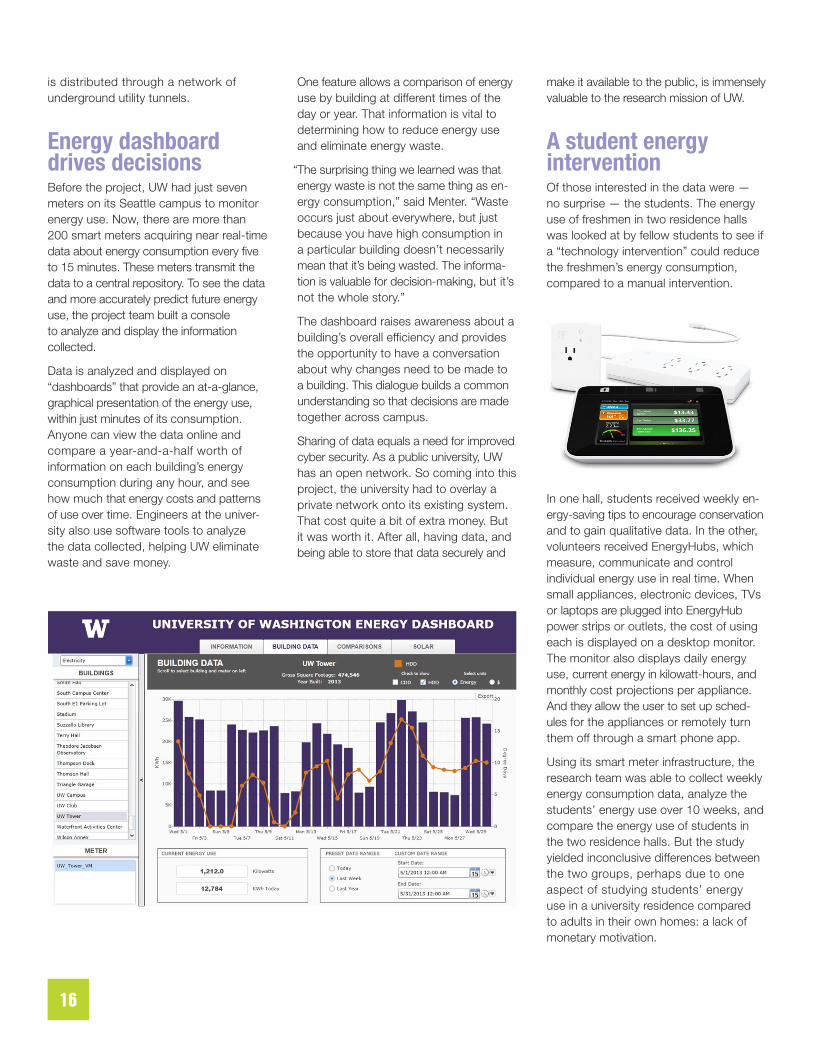
In one hall, students received weekly en-ergy-saving tips to encourage conservation and to gain qualitative data. In the other, volunteers received EnergyHubs, which measure, communicate and control individual energy use in real time. When small appliances, electronic devices, TVs or laptops are plugged into EnergyHub power strips or outlets, the cost of using each is displayed on a desktop monitor. The monitor also displays daily energy use, current energy in kilowatt-hours, and monthly cost projections per appliance. And they allow the user to set up sched-ules for the appliances or remotely turn them off through a smart phone app.
Using its smart meter infrastructure, the research team was able to collect weekly energy consumption data, analyze the students’ energy use over 10 weeks, and compare the energy use of students in the two residence halls. But the study yielded inconclusive differences between the two groups, perhaps due to one aspect of studying students’ energy use in a university residence compared to adults in their own homes: a lack of monetary motivation.
17
These assets represent an investment that’s going to be here for many years. We can use the data to build a greater understanding about how buildings use energy, and to make the entire campus community more intelligent about how we use energy. It’s a change in our relationship with electricity.”
— NORM MENTERUW ENERGY CONSERVATION MANAGER
“One important long-term outcome of the research was to raise student awareness of the personal energy choices we all make every day,” said Kelly Hall, a UW graduate student on the research team.
The team believes the university should not rely on student actions to reduce energy consumption, but move towards using more automated and integrated systems.
A regional transactive roleOne part of the project, which spans an unprecedented five-state region and 60,000 metered customers, is automating the system for a regional benefit.
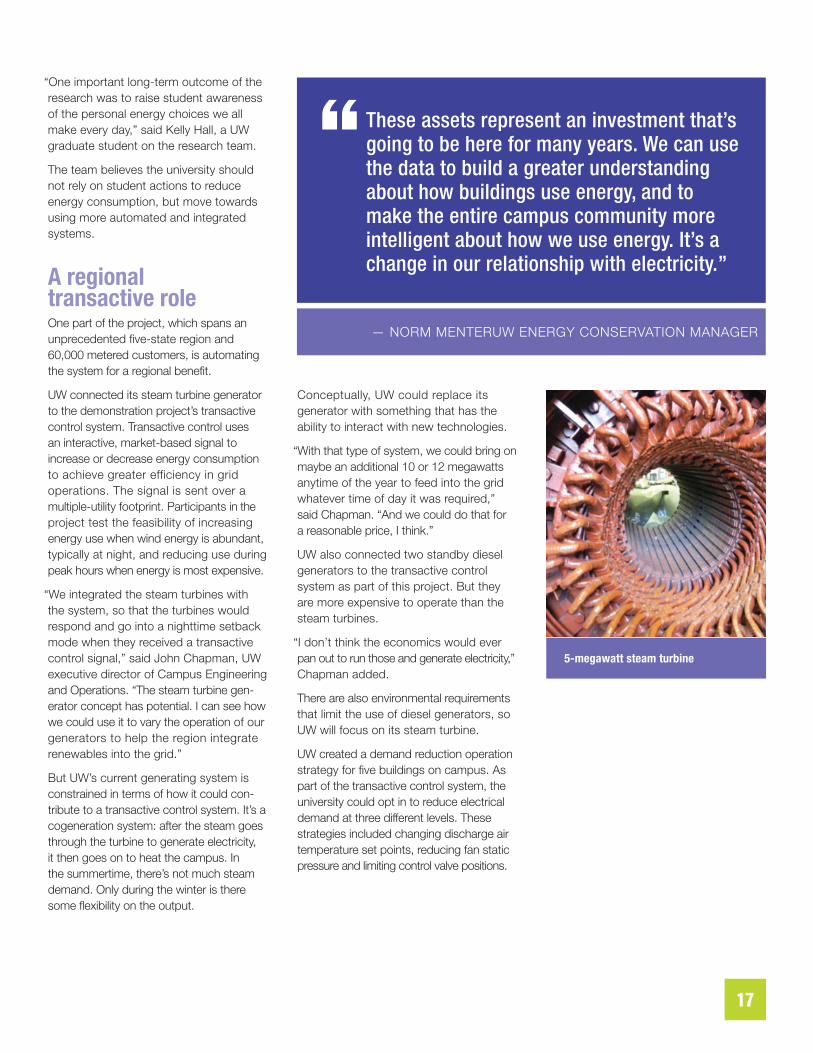
UW connected its steam turbine generator to the demonstration project’s transactive control system. Transactive control uses an interactive, market-based signal to increase or decrease energy consumption to achieve greater efficiency in grid operations. The signal is sent over a multiple-utility footprint. Participants in the project test the feasibility of increasing energy use when wind energy is abundant, typically at night, and reducing use during peak hours when energy is most expensive.
“We integrated the steam turbines with the system, so that the turbines would respond and go into a nighttime setback mode when they received a transactive control signal,” said John Chapman, UW executive director of Campus Engineering and Operations. “The steam turbine gen-erator concept has potential. I can see how we could use it to vary the operation of our generators to help the region integrate renewables into the grid.”
But UW’s current generating system is constrained in terms of how it could con-tribute to a transactive control system. It’s a cogeneration system: after the steam goes through the turbine to generate electricity, it then goes on to heat the campus. In the summertime, there’s not much steam demand. Only during the winter is there some flexibility on the output.
Conceptually, UW could replace its generator with something that has the ability to interact with new technologies.
“With that type of system, we could bring on maybe an additional 10 or 12 megawatts anytime of the year to feed into the grid whatever time of day it was required,” said Chapman. “And we could do that for a reasonable price, I think.”
UW also connected two standby diesel generators to the transactive control system as part of this project. But they are more expensive to operate than the steam turbines.
“I don’t think the economics would ever pan out to run those and generate electricity,” Chapman added.
There are also environmental requirements that limit the use of diesel generators, so UW will focus on its steam turbine.
UW created a demand reduction operation strategy for five buildings on campus. As part of the transactive control system, the university could opt in to reduce electrical demand at three different levels. These strategies included changing discharge air temperature set points, reducing fan static pressure and limiting control valve positions.
5-megawatt steam turbine

18
As far as the impacts on operations, the university is just getting started, but a solid foundation is now place.
Tools such as the dashboard allow UW’s energy engineers to look for anomalies in energy consumption and deter-mine which buildings they should take a look at first. The dataset builds a greater understanding about how the campus buildings use energy. And, the improved infra-structure makes the entire operation more efficient, which means there is potential to reduce the costs of education.
“That makes the entire campus and the entire community more intelligent about how we use energy,” said Menter. “It’s a change in the relationship with electricity.”
WHAT’S NEXT for the University of Washington?

19
IDAHOFALLSPOWER
IDAHO FALLS POWERIdaho Falls, Idaho
� Locally-owned and operated since 1900
� Largest municipal utility in Idaho
� 27,000 metered customers, including 3,500 commercial customers
� Installed 1,500 AMI meters
� Generates 50 megawatts and sells to BPA
INVESTMENT$3.5 million
HIGHLIGHTS �Wireless mesh network
� Electric vehicles
� Capacitors
FOR MORE INFORMATION
Mark Reed (208) 612-8234www.idahofallsidaho.gov
Small city in Idaho gets smarter with automation Idaho Falls is simply a smart city. Since 1900, the western town has generated electricity by making use of the Snake River, which runs right through it. Today, Idaho Falls Power — which is known for its early adoption of tools to improve system reliability — is testing some hefty smart grid technologies as part of the Pacific Northwest Smart Grid Demonstration Project.
A city-wide wireless networkIdaho Falls Power services 23 square miles within the city, which is framed by wide-street neighborhoods and well-educated residents — many of whom work at the Idaho National Laboratory nearby. So when the utility decided to test smart meters through a city-wide wireless network, most of their technologically-savvy customers didn’t blink an eye.
The wireless mesh communications system allowed the utility to test a number of new technologies, such as
automation of switches in substations for outage restoration. Another benefit of using the wireless network is improving computer and electronic protections.
“We drastically improved cyber security awareness and increased focus in that area as a result of this project,” said Mark Reed, Idaho Falls Power superintendent. “That’s something near and dear to my heart.”
Having a secured wireless system means the utility can do more with its smart meter system, or AMI — advanced metering infrastructure — and integrate those meters with the centralized computer system of a substation’s control center.
Pacific Northwest Smart Grid Demonstration Project SUCCESS STORIES

20
Meters talk to in-home displays wirelesslyThe progressive utility has 13,250 smart meters, including 1,500 meters that were installed as part of this project. All 27,000 customers are expected to have a smart meter by May 2015.
Eight hundred in-home display monitors communicate wirelessly with the meters of volunteers, allowing a real-time view of their electric use either by the hour, day or month. Usage trends and costs, as well as important utility messages and alerts, are also displayed. All the information will be available on a web portal and mobile app that customers can access by fall 2014, making it even easier for households to calculate daily energy costs and estimate their bills.
For one long time resident, the technology is about much more than crunching numbers.
“I’ve looked at the climate data,” said Jim Seydel, Idaho Falls Power customer. “I believe we’re going to have more extreme weather. I believe under those conditions, we’re likely to have more outages than we’ve had in the past because of climate change. So, I’m looking for ways that I can counter that.”
In short, these devices empower customers to take ownership of their energy use and planning. Still, about 135 customers have vetoed the meter.
“I think there is just some confusion about what smart meters are,” said Matt Evans,
customer relations supervisor at Idaho Falls Power. “When they Google ‘smart meter’ they find some alarming things.”
But the majority of the community, which attracts world-class outdoor recreationists, regional business owners and culturally savvy patrons, has embraced these leading-edge technologies. They can be found just about everywhere … even on appliances.
Hitting the snooze button on appliancesBack in 1934, Idaho Falls was one of the first cities in the United States to adopt devices that could prevent brownouts. These devices were able to cycle water heaters off, using frequencies, when river flows were low or as households began installing electric appliances and using more energy.
Today, the methodology remains the same — only the communication tools are much more advanced. Loads can now be shifted to later in the day when the cost of electricity has fallen or demand has fallen. For this project, 217 volunteers tried a power control device. These devices cycle off electricity to appliances when the need for energy is highest. This avoids unplanned power purchases, which are more expensive.
Heating and cooling costs account for most of the utility’s peaks. Forty-one customers signed up for programmable thermostats. With these “smart” in-home displays, the utility can make
very subtle temperature adjustments within households for brief periods when energy use is highest — the utility equivalent of rush hour traffic.
The newer systems are also more advanced. Idaho Falls Power alerts the customer before it makes any changes. The thermostat indicates when the utility plans to make a scheduled thermostat adjustment, and the customer always has the option to override or opt out of the utility request.
Improving energy use automaticallyAnother way to reduce energy consump-tion is by automating the distribution system. One little electronic device, a capacitor, is helping to make this happen. While capacitors have stored energy and stabilized voltage and power flows on distribution lines for decades, the process is getting smarter with two-way commu-nication. The stable and steady delivery of electrons saves time and money. For big industries, that savings can add up.
Making malt for brewing beer, for example, takes a lot of energy. IFP’s largest industrial customers are malt houses, which benefit from something called automated power factor control. A power factor is a measure of the efficiency of the power being used. A power factor of 100 percent means the voltage and current are cycling between positive and negative in unison, but when one lags behind the other, the power factor declines. The lower the power factor, the more power the generator has to supply for each watt being consumed.
One way to improve the power factor is by installing banks of capacitors, which can automatically bring the current and voltage closer to unity. Idaho Falls Power purchased two capacitor banks as part of the project — one for each of its large commercial customers. The projected wholesale energy savings is $37,750 per year. But saving money isn’t the only benefit.
As a result, we gained insight and knowledge on the technology to help us forge into the future a little more prepared with better ideas of where we want to go.”
– MARK REED, IDAHO FALLS POWER SUPERINTENDENT

21
For Idaho Falls Power, the next step is evaluation. Assessing the feasibility and cost-benefit of the smart grid technologies tested in the demonstra-tion project is essential.
“It’s how we’ll determine which technologies have value for expansion across the entire system,” said Reed.
And, of course, they’ll be sharing what they’ve learned.
WHAT’S NEXT for Idaho Falls?
An electric vehicle charges using stored energy from a nearby photovoltaic panel.
“It reduces the electric current on the line,” said Reed, “which could defer the large capital cost of an upgrade.”
Another way to use distributed automation is through conservation voltage reduction. In this case, CVR reduces the overall voltage on the residential feeder to 1,375 smart-metered customers.
A “self-healing” gridLet’s face it. Lightning causes power outages. That used to mean a utility worker would be dispatched to locate the fault and manually reset switches on the transmission lines to reroute power. Now this can be done automatically through fault detection, isolation and restoration, or FDIR — sometimes referred to as “self-healing” technology. This smart technology can instantly detect a fault and automatically reroute electricity to keep customers from losing power in the first place. The tool uses automated switching between two distribution system feeders and control algorithms to isolate the problem and restore the system.
Saving some for laterElectric vehicles can be great energy storage units. Of course, these mobile batteries also make great transportation tools. Incorporate a solar panel and you have quite a setup.
Here’s how it works:The solar panel charges a stationary battery during the day. That battery, with 10,000 watts of capacity, is hooked up to the car-charging stations. When a car is plugged in, it draws 3.35 kilowatts for four hours from the stationary battery. That means two or three electric vehicles can be plugged in to receive a full charge.
“The integration work was outstanding,” said Reed. “The AMI interface was really fantastic.”
The drive behind the test is to integrate distributed solar with distributed storage to optimize grid efficiency. It works — but with one problem.
The test was nearly complete when the vendor went bankrupt. This has left Idaho Falls Power with no access to the software
or any of the data that was collected. If the vendor never returns with the data, the utility is considering working with nearby Idaho National Laboratory to explore possible solutions to retrieving the data.

22
AND BY THE WAY ...Project Landscape

23
FLATHEAD ELECTRIC CO-OP
FLATHEAD ELECTRIC CO-OPKalispell, Montana
� Locally-owned & operated since 1937
� Second largest utility in state
� 3,900 miles of line
� 48,000 customers
INVESTMENT$2.3 million
HIGHLIGHTS � Single point of contact
� Completed a systemwide AMI rollout
� Home Energy Network
FOR MORE INFORMATIONRuss Schneider (406) 751-1828 www.flatheadelectric.com
With 48,000 members, Flathead Electric Co-op is the second largest electric utility in Montana. Yet it maintains the cooperative spirit of neighbor helping neighbor. When granted the opportunity to help consumers reduce their energy use during periods of peak demand and save money on their monthly power bills, Flathead put its members’ needs and interests first.
With the project in its fifth and final year, Flathead is planning for further investment in some of the technologies it has tested. The utility is also teaching others what it has learned.
A solid foundation Flathead was a prime candidate for the project because it had already invested
in developing an advanced metering infrastructure, a crucial component of the two-way communication between the utility and end-users. Households fitted with these advanced meters allow the utility to monitor electricity use in real time and identify peak-use times, when electricity is most expensive.
“This is different from conventional energy conservation because, while participants may not actually use less energy in total, they may choose to use it at times of lower cost to the co-op,” says Flathead Regulatory Analyst Russ Schneider. “This has the potential to ultimately reduce power supply expenditures for members and the co-op as a whole.”
Flathead’s objectives included completing installation of the advanced metering
Building a smart grid the cooperative wayTucked in the mountains of Glacier Country in Northwest Montana, Flathead Valley’s grand landscapes and unspoiled freshwater lake attract recreationalists year-round. Legendary, small-town hospitality appears even in unexpected ways — like the local electric cooperative’s participation in the Pacific Northwest Smart Grid Demonstration Project.
Pacific Northwest Smart Grid Demonstration Project SUCCESS STORIES

24
infrastructure in northwest Montana, determining member preferences and comparing the cost effectiveness of three program options offered to members who volunteered.
But first the co-op needed community buy-in.
Peak Time Flathead emphasized customer education and outreach and put tremendous thought into designing a program that its members would support, down to the project’s name. Instead of the term “smart grid,” Flathead’s leaders chose a name they felt would better describe the pilot’s purpose and resonate with members: Peak Time.
“I think that worked well for us. We wanted to be very clear about what we were trying to do as a cooperative,” says Teri Rayome-Kelly, Flathead’s demand response coordinator. “And we also stressed what was in it for them — what they would gain for participating. We basically used any kind of communication tool available and talked to every community group that would listen. We did a lot of boots on the ground stuff.”
Peak Time aims to help energy consumers reduce energy use when the demand for and cost of power is highest. This type of adjustment in energy consumption is called demand response. Smart grid-enabled demand response requires two-way communication between the utility and the end-users.
I think the biggest thing that’s misunderstood with smart meters or two-way meters or remote meter reading is there’s going to be more privacy intrusions by that than having a person actually walk around your house once a month to check the meter. There’s a little bit of disconnect on the privacy/security aspect of it with the public compared to what was done or what they’re willing to accept from other technology.”
— RUSS SCHNEIDER, REGULATORY ANALYST
The method for carrying out this communication was also an important consideration for Flathead. Based on some initial reactions from members about the use of wireless networks to transmit information, the co-op chose to use an “over the power line” approach, and emphasized that in its communications.
To gather the most information about member preferences, Flathead offered three options:
OPTION 1: In-home display A free in-home display unit notifies households of peak demand times, signaling them
to reduce consumption until demand on the system declines.
Participants receive a $5 monthly credit and an annual rebate determined by their energy consumption. If the participant’s highest hour of use during the billing cycle is during a non-peak time, the participant receives $4/kilowatt for the
difference in consumption between the highest non-peak hour and the highest peak hour.
The in-home display was the least-costly option to implement, at about $125 per member. Its purpose was to show consumers how much electricity they were using and when they were using it.
Due to some limitations of the emerging technology, Flathead has been unable to use the tool as it had planned, such as to send volunteers data about their current use or billing information. The only information households receive is an indication that it is a peak time, signaling them to reduce their energy use until the demand on the system decreases.
Keeping the households tuned-in to the tool during the five-year demonstration has been a challenge.
“There is a little bit of attrition on a long project,” says Schneider. “Utilities need to have an actionable activity for the members on a regular basis in order to keep them engaged.”

25
Teri Rayome-Kelly chats with residents to rally participation in Peak Time.
OPTION 2: Water heater demand-response unit A free demand-response unit automatically cycles off
participants’ water heaters for up to two hours during times of peak demand to reduce energy consumption.
Members who volunteered for this option receive an $8 monthly credit. The co-op uses over-the-power-line technology to operate each household’s water heater in response to peak demands.
The water heater cycling has produced the most reliable savings across most peak demand events. On average, this option reduced energy consumption by 0.58 kilowatts per unit. With an average installation cost of $413, the utility expects it could recover the investment in three to five years.
“The demand response units attached to hot water heaters are very reliable,” says Rayome-Kelly. “I can’t think of any significant challenges we’ve had with those. When we started this, we thought this test group would be the hardest one to sign people up for, because you’re hooking equipment onto their water heaters. But people really accepted that quite well. It wasn’t a problem to get people to sign up.”
Flathead received zero complaints from members regarding a lack of hot water.
OPTION 3: Home Energy Network Volunteers paid $800 for new appliances — a dishwasher, clothes washer and dryer — plus an electric water heater demand response unit and equipment that enables the appli-ances to communicate with the utility over the members’ home wireless internet connection.
Using a signal sent over the power line from the integrated advanced metering infrastructure system to each participant’s wireless internet connection, energy-efficient appliances can be cycled off or put into an energy-saving mode as needed to reduce demand on the system. If the participant’s highest
hour of use during the billing cycle is during a non-peak time, the participant receives $4/kilowatt for the difference in consumption between the highest non-peak hour and the highest peak hour.
When Flathead offered a Home Energy Network option, it didn’t take long for the utility to realize it had taken on more than it had anticipated.
“We hadn’t planned on being in the appliance business,” said Rayome-Kelly. “But as a small community, we don’t have any big box stores, so we had to look for a contractor to install those for us.”
Appliance handling and installation scheduling became a newly acquired skill for some.
“I can level a washer with the best of ‘em,” Rayome-Kelly said.
While the smart appliances proved that they could reduce household peak energy use by up to 2.34 kilowatts, it was the most costly option to implement. It cost about $2,500 more to install the smart appliances and related equipment, compared to the cost of new traditional appliances.
Flathead also learned that the integration of different technologies can be messy. Technical issues arose from the use of interoperable appliances, which struggled to communicate with the Home Energy Network. Vendors had to learn about new technologies and new products and figure out how to make them work together. Flathead also faced challenges integrating its own internal systems with the Home Energy Network.
At the end of the day, the co-op’s pilot project gathered important data and learned key lessons to improve future implementation.

26
With a toolkit of expertise and lessons learned, the co-op is ready to get started with a demand response program that makes sense to the bottom line.
“We’re already planning to do an extended water heater program,” says Schneider. “We’re planning to connect 1,000 water heaters each year for five years.”
WHAT’S NEXT for Flathead?

27
NORTHWESTERNENERGY
Small steps to a smarter gridListen to a planning meeting at NorthWestern Energy and you’ll likely hear: deploy at the speed of value, and stay on right side of the repair-versus-replace curve. Decisions here are made very carefully. After all, this award-winning, investor-owned utility serves one of the largest, most geographically diverse territories in the region. With an infrastructure that spans over 28,000 miles of transmission and distribution lines across three states, planning ahead is important. Especially as the 500,000 poles, components and wires get older.
A plan to upgrade its basic distribution system was already in the works when the opportunity arose to take part in the $178 million Pacific Northwest Smart Grid Demonstration Project. Improving upon existing infrastructure using smart grid technologies just made business sense.
“We weren’t quite ready for it,” said George Horvath, manager of automation and technology for NorthWestern. “We expected that the technologies would advance, change and be improved over two to three times during the course of the project.”
So going small-scale was NorthWestern’s solution.
With its $2.1 million investment, North-Western also planned to learn from the other participants.
Customer side of the meterA perfect urban area to test new tech-nologies turned out to be Helena, Mont. With 30,000 customers and an electric load of 90 megawatts, Helena had
NORTHWESTERN ENERGYButte, Montana
� Serving 349 communities across Montana, South Dakota and Nebraska
�One of the largest service territories in the Northwest
� 28,000 miles of lines
� 400,000 metered customers
INVESTMENT
$2.1 million
HIGHLIGHTS �Demand response program
�Distribution Voltage Reduction
� Advanced AMI communications network
� In-home energy displays
FOR MORE INFORMATIONClaudia Rapkoch (406) 497-2641www.northwesternenergy.com
Pacific Northwest Smart Grid Demonstration Project SUCCESS STORIES

28
the right mix of customers and basic systems.
FIRST STEP: recruit participants. Around 200 residential customers and two commercial buildings from the State of Montana were enlisted to take part in the nation’s largest test of new smart grid technologies. It took two marketing campaigns and extending the area beyond Helena to reach recruitment goals.
NEXT STEP: install equipment. Residents’ homes were fitted with switches to control appliances, outlet-type switches that turn regular electrical outlets on and off, as well as programmable thermostats and energy system display devices.
Installing the equipment was easy.
Educating customers and learning from the experience took more time.
Working closely with customers “We hired a company to work directly with our customers and teach them how to benefit from the equipment in their homes and to learn to use it effectively,” said June Pusich-Lester, NorthWestern’s demand side management engineer.
Training included how to program the equipment and use a web portal. A web portal is another name for a dedicated website that has special functionality.
EL
IZA
WIL
EY
, IN
DE
PE
ND
EN
T R
EC
OR
D
The portal showed past energy use, as well as the energy consumption of every device connected to the network. A monthly electronic newsletter was also sent to educate customers.
The benefits were twofold. Customers could see their energy use to better understand ways to save, and North-Western gained insight into what customers want and what they are willing to do to conserve energy.
Would customers respond to a reward?
Time of use and demand response Residential customers were set up for time-of-use pricing. These programs help the utility to control some of the consumers’ electrical load in response to grid conditions and the price of electricity. Here’s how it worked:
Montana has a flat residential rate, but the demonstration project offered a regional price. So for testing purposes, the rate fluctuated. Each customer received a signal that displayed the price of electricity
as low, medium or high depending on the time of day, the day of the week and the month or season.
Customers responded by adjusting and programming the equipment, attached to a home area network, based on the pricing schemes. As a result, load decreased during peak times of use.
“We rewarded our customers for energy savings,” said Pusich-Lester. “With the smart meters and the communication network working together, we could read energy usage in 15-minute increments.”
If a customer used less energy when prices were high, NorthWestern credited the customer’s monthly bill. As of September 2014, total savings from the time-of-use pricing totaled $13,787 for all customers.

29
We’re going to have the benefit of all the other, much larger projects from the demonstration, reading through their evaluations, and learning from them. It’s an important part of our project, what we’ve learned and accomplished, so now we can better communicate about the smart grid with our regulators and customers in the future.”
— GEORGE HORVATH, MANAGER OF AUTOMATION AND TECHNOLOGY
The system also gave the utility direct control over some residential customer loads.
“Now we are able to send demand response events directly to the homes,” said Pusich-Lester.
With the ability to control home appliances using two-way communications, North-Western reduced home temperatures or turned off appliances when the price was high in the middle of the day. Demand re-sponse and time-of-use methods provide flexibility while saving money.
Other technologies focus on overall efficiency.
Voltage reduction = efficiencyWe’re all familiar with the concept of energy efficiency. Consumers reduce power consumption through choices in lighting, insulation, appliances and many other methods. Utilities have been working with customers to improve energy efficiency for more than 30 years.
But there’s a new player in town.
Distribution voltage optimization, or DVO, lowers the energy consumption on a whole feeder — the line that delivers electricity from a substation to a home. By dropping the voltage on a circuit — while staying above the minimum level necessary to operate electric devices — the customer’s energy costs decrease. “We flatten the voltage profile, make voltage adjustments, and save energy for the whole feeder,” said Horvath.
According to industry data, a potential exists to shave one to three percent of circuit load using this technique.
Utility side of the meter Keeping the lights on is a mission of every utility. Until smart grid technologies came along, distribution systems were in the dark. Utilities were unaware of an outage until a customer called to report it.
Now, new technologies on the utility side of the meter use automation to improve reliability by detecting a problem, isolating it, and then restoring as many customers to service as possible.
This type of system is called distribution automation or self-healing technology. Computer systems quickly react to electrical issues in the system, like a fault in a feeder, without intervention from an operator or line worker. NorthWestern tested Fault Detection, Isolation and Restoration, or FDIR, software.
“We configured circuits with remote capabilities, to monitor circuits with central software, and to be able to reconfigure circuits in case of issues,” said Horvath.
Since October 2012, the system has already automatically reconfigured and mitigated customer service on the feeder for two outages in Helena. That means shorter outages for customers and resource savings for NorthWestern.
Testing technologies to solve real-time, real-world problems is what the demonstration is all about. Still, many lessons were also learned in the research and development initiative.
Lessons to shareNorthWestern’s goal was to make slow improvements to prepare for larger business objectives and to learn how to invest in products and services that have longevity.
“We definitely realized our objectives,” says Pusich-Lester.
One unexpected lesson was in selecting vendors. Some vendors evolved or went out of business, leaving the utility stranded with products that didn’t work. The complexity of integrating components from different vendors while building the systems was also unexpected.
Other notable lessons from NorthWestern:
� Start with a small project — it makes the business case analysis easier
� Emphasize the importance of customer education with project stakeholders
� Integrate a customer information system to smart grid at the start
� Work closely with customers to understand new system enhancements and in-home display features

30
� Billing system integration for new programs requires significant planning effort
� Build a distribution management system first, then add smart grid
� Allow sufficient time and money cushion for communication backbone
� First-time equipment rollouts have engineering, IT system, communication and business program learning curves
� In your risk analysis, consider the possibility of a vendor going out of business during your deployment
“The project has helped to mold our thinking on how we plan on a larger scale,” said Horvath. “We might do things differently now from the big picture perspective.”
During the project, NorthWestern kept a clear focus on its basic infrastructure and worked to remain on that right side of that repair-versus-
WHAT’S NEXT for NorthWestern?
That includes keeping customers engaged.
For both the utility and the customer, the chance to become better informed, educated and experienced with the technologies will prepare everyone for the utility of the future, whatever that may bring.
replace curve. Outcomes from the project will inform future smart grid improvement processes and projects.
“We will continue to invest in the basic infrastructure and incorporate new tech-nologies where they make sense,” said Horvath. “This project provided a foundation for us to evalu-ate something much larger going forward.”

31
MILTON-FREEWATER
MILTON-FREEWATER CITY LIGHT & POWERMilton-Freewater, Oregon
� Locally-owned and operated since 1889
� Average annual sales: 118,000,000 kilowatt-hours
� 4,550 customers
INVESTMENT$1.8 million
HIGHLIGHTS � Completed AMI rollout
�Direct load control/DR
� Five-megawatt reduction
� Conservation voltage reduction
FOR MORE INFORMATIONTina Kain (541) 938-8238www.mfcity.com/electric
Milton-Freewater is the only public utility in Oregon chosen to take part in the nation’s largest smart grid test.
With Milton-Freewater’s $1.8 million investment and DOE’s matching funds, the rural utility upgraded its historic demand response program and tested some newer technologies, such as voltage reduction and voltage-sensing water heaters.
Of the 60,000 metered customers involved in the regionwide project, Milton-Freewater City Light and Power is the smallest participant with only 4,550 customers. The utility did not hire any additional staff except for a contractor to perform installations, because the utility’s only electrician had retired.
Blazing the trail for demand responseWhen not at his cherry orchard, retired city electrician Bill Saager enjoys the cowboy shooting range just outside of town. The 75-year-old bandana-wearing quick-draw installed the city’s original demand response units — all 500 of them.
But getting and using a contractor’s license wasn’t easy. Saager convinced the State of Oregon Construction Contractors Board to forgo the insurance and bonding requirement because he was only doing work for the utility, not the customer. Clearly, Saager is a fan of smart technology.
“I think that utilities are really missing the target if they don’t pursue some type of DR
Milton-Freewater: A frontier for new technologyOregon’s oldest city-owned utility is far from old-fashioned. In fact, it’s a power pioneer in the Pacific Northwest. Since 1985, Milton-Freewater City Light and Power has reduced peak energy use with a technique called demand response. Demand response may not be the talk of the town, but it’s still a big deal to this homegrown utility. And it’s one of the many technologies the Pacific Northwest Smart Grid Demonstration Project intends to advance.
Pacific Northwest Smart Grid Demonstration Project SUCCESS STORIES

32
in the future,” said Saager. “You can really extend the capabilities of your system.”
Milton-Freewater’s original demand response program used a radio energy management system, or REMS, to control electric water heaters and electric heating and air conditioning systems. A centralized computer system monitored the power demand and sent a radio signal to the REMS units to cycle off connected loads to reduce energy when the peak demand set-point was reached.
The city’s goal of the Pacific Northwest Smart Grid Demonstration Project has been to enhance its already highly successful demand response program.
Listen. Respond. Repeat.To do that, the newer technology must go one step further, by listening and responding from both sides of the com-munication. With a smart meter system that uses two-way communications, the utility confirms that the demand response units receive the signal and controls the amount of time the electricity is shut off. The goal is for the entire demand response process to go unnoticed.
Master Station(DRU Management Software)
DRU(Demand Response Unit)
Water Heater
Air Conditioner
Water heaters, electric heaters and air conditioners are connected to the demand response system to trim energy use when a certain set-point is reached. Up to three megawatts can be reduced by shaving the energy used in 754 customers’ homes, businesses and even churches.
Replacing the old units with the newer models spurred a lot of questions. Many customers didn’t know the units existed. A few were suspicious of the utility installing new, more intelligent units. But only a few opted out.
“We found that many homes had changed tenants,” said Tina Kain, engineering technician for the city. “New residents were unaware of the DR units, which is a great sign. The undisruptive units helped residents save money without even knowing it.”
To entice participation, a rate discount was offered to customers:
� 2.5 percent for water heaters
� 2.5 percent on electric heating
� 1 percent for air conditioning
DR is used as a last resort in the peak shaving process. When the system begins to approach its peak energy use, the first step is to reduce voltage by 4.5 percent.
Next, the city shuts off the wells that are connected to the centralized computer system. Finally, DR units are employed. Reverse order restores the system to its original state.
The incredible value of the smart meter Every customer of Milton-Freewater City Power and Light is now set up with a smart meter that uses two-way commu-nication over the power line. With these more advanced meters, energy use is monitored every fifteen minutes. That means better customer service, such as helping homeowners troubleshoot high bill complaints and remote meter read-ing. On selected meters, a device called a disconnect collar, which allows for a remote disconnect or reconnect, was installed.
One of the biggest benefits is a smart meter’s ability to quickly detect an outage. Previously, the utility wasn’t aware of an outage until a customer called it in. A crew was then dispatched to investigate and do the repairs. Often, the process could take hours. Now, many outages are fixed in minutes, saving the utility both labor and transportation

33
You can see from our history that Milton-Freewater City Light and Power is innovative and forward thinking. It’s about planning ahead. We all know that electric rates probably aren’t going to be going down any time soon, so if a new technology pencils out now, it’s going to be more beneficial in years to come.”
– RICK RAMBO, THE CITY OF MILTON-FREEWATER ELECTRIC SUPERINTENDENT
expenses as well as providing better service to the customers.
Conservation voltage reduction Conservation voltage reduction is Milton-Freewater’s first step to address a peak on the system. Substation voltage regulators lower the system voltage by 1.5 volts on four feeder lines out of the Milton Substation. This reduces the megawatts used on the entire system while still maintaining adequate distribu-tion voltage.
To test the theory that every 1 percent in voltage reduction leads to a 1 percent reduction in kilowatt-hours used, Milton-Freewater reduces voltage one week, and then returns it to the status quo the next. By alternating weeks, the utility will be able to compare the two datasets and calculate the benefits once the demonstration is complete.
Specialized water heaters To further test possibilities with conserva-tion voltage reduction, Milton-Freewater installed 100 demand response units on
water heaters that operate when the city’s voltage reduction occurs. The demand response units are programmed to sense voltage and turn off connected load.
Although the water heaters worked well with the voltage reduction system, they didn’t work so well with another part of the project — the transactive control signal. This signal is being tested as part of the demonstration across a multiple utility footprint to assess the feasibility of automating the trade of energy based on many conditions, such as the availability of wind or solar power, for a regional benefit.
When the transactive control signal acti-vated a voltage reduction, the demand response units turned off the connected water heaters, and they stayed off until the voltage reduction ended. When the signal lasts longer than five or six hours, the customer may run out of hot water, resulting in customer complaints and countering the city’s goal of ensuring demand response goes unnoticed.
Sizing up the studyEven though the city has been doing demand response for three decades, testing new technologies presented challenges.
First, differences between the original and new demand response systems were disappointing. The old REMS units operated 20 minutes on, 15 minutes off, so Milton-Freewater could reassure customers that their water heaters would be turned off no longer than 15 minutes. But the new units turn on and off in an inconsistent, unpredictable pattern, which is a little more difficult for customers to accept.
And that wasn’t the only challenge with the units. They all cycled on or off at the same time, creating their own peaks and valleys. Innovative solutions were needed to stagger the units.
Data storage is also a problem. Unless the data is manually extracted from the unit before its next operation, the data is lost. That means the utility cannot determine how well the unit worked for that cycle. To work around this issue, the research laboratory will analyze meter data to determine load fluctuations from the demand response units.
Overall, lack of resources has been one of the largest challenges for the small rural utility — the employees had to learn a whole new system while doing their regular jobs. But that also demonstrates the city’s dedication to keeping rates low.
“Every little bit counts,” said Bill Saager, the retired electrician-turned cowboy.

34
As a result of the lessons learned from the project, the city plans to discon-tinue conservation voltage reduction. Even though it has provided some benefits, operating more than one voltage reduction
system at the same time on different feeders was confus-ing for work crews.
Furthermore, once the project concludes, the city will explore transactive control opportunities based on the needs of the city and the potential benefits.
Other ideas for the future include a customer pre-pay system so that energy use can be managed based on an individual family budget.
“We’re at the point of trying to learn what we can do with the system,” said Rick Rambo, the electric utility’s superintendent. “I know we’re not using it to its full potential.”
Still, the tried and true prevails. Demand response will continue as it has since 1985 across the city’s entire electrical system, with fine-tuning of the operation as needed and with very little impact on the customer.
WHAT’S NEXT for Milton-Freewater?

35
LOWERVALLEYENERGY
LOWER VALLEY ENERGYAfton, Wyoming
� Began in 1937 with 10 members
� Provides electricity, natural gas and propane
� 5,616 square-mile territory
� 26,406 electric customers
� 195 megawatts
INVESTMENT$1.2 million
HIGHLIGHTS � Adaptive Voltage Control
� Complete AMI rollout
FOR MORE INFORMATION
Rick Knori (307) 739-6038www.lvenergy.com
Cold-climate co-op heats up with smart gridLower Valley Energy provides electricity to one of the biggest resort towns — Jackson Hole, Wyo. — in one of the coldest climates in the Northwest. At the southern base of the Grand Teton and Yellowstone national parks, out-of-town visitors and residents alike rely on the home-grown electric co-op for heat, hot water and light — especially during cold snaps when the demand for power is highest.
That’s one reason Director of Engineering Rick Knori wanted to complete the utility’s deployment of its smart grid metering system and help its more than 26,000 electric customers better under-stand their energy use. That opportunity surfaced with the Pacific Northwest Smart Grid Demonstration Project,
With a focus on exceptional customer service, reliability and low rates, Lower Valley Energy jumped on the chance to improve the way it provides services.
Smart meters and demand responseBefore the project, more than 12,000, or nearly half, of Lower Valley’s members
had smart meters that allow for two-way communications between the utility and end-user. As of March 2014, 100 percent of its members had smart meters installed in their homes. This technology is a necessary component of many smart grid technologies, including water heater demand response, which allows a utility to cycle off participants’ water heaters during times of peak demand to reduce energy consumption.
High-end tourism is big business in the Grand Teton area. One county in the Lower Valley service area is consistently rated one of the top five wealthiest counties in the United States. So, it’s no surprise that hot water is a hot commodity. Getting a cold-climate community warmed
Pacific Northwest Smart Grid Demonstration Project SUCCESS STORIES

36
up to a program that even hinted at the risk of a cold shower was a tough sell.
A $15 a month incentive to participate in the demand response program just wasn’t enough for some members, but for others it was worth a try. Ultimately, the co-op deployed more than 500 demand response units and used them to temporarily turn off customers’ water heaters during periods of high demand, when energy prices are highest, thereby reducing energy consumption.
“They worked excellent,” said Knori. “These are going to be long-term assets that we keep and control.”
Now there are 100 people on Lower Valley Energy’s waiting list for a water heater demand response unit.
Adaptive voltage control a surpriseThe most successful assets Lower Valley deployed were tools for adaptive voltage control, which can reduce a customer’s overall voltage during brief high-demand periods and result in short-term demand reductions.
Using regular feedback from its customers’ meters, Lower Valley reduced voltage — and therefore demand — during peak load periods at the utility’s East Jackson Substation. This technology provided the greatest benefit for the least investment of time and money.
Warren Jones, Lower Valley’s distribution engineer, programmed the adaptive voltage control signals.
“I think it was a surprise for us how well the adaptive voltage control worked,” said Jones. “That’s the one thing I would suggest to other utilities that have advanced metering infrastructure in place. It does open up some opportunities for a utility to use that intelligence to actually lower your voltage.”
Adaptive voltage control has the potential to greatly lower future monthly demand charges paid by Lower Valley to Bonneville, reducing energy costs to customers. The test case also proved that Lower Valley can easily expand adaptive voltage control to all of its distribution system substations in the coming years.
Solar successLower Valley wanted to capture wind and solar power during the day, store it in batteries and discharge it during the utility’s two-hour morning peak. The purpose was to test whether new technologies could reduce transmission system losses and improve voltage stability on a 60-mile distribution line to Bondurant, Wyo. At its Hoback Substation, Lower Valley installed a system of renewable energy resources and battery storage, including one 15-kilowatt solar photovoltaic, one 20-kilowatt windmill set and a 200-kilowatt-hour battery.
“The solar and inverters worked flawlessly,” said Knori. “We’re getting about a 17 to 18 percent capacity factor out of those units. And they’re working trouble-free. But the windmills were kind of a bust.”
After two years of operation, the total output of the four windmills was about 80 kilowatt-hours. Lower Valley installed an anemometer on the windmills to prove to the vendor that the turbines were not producing to the expected capacity. But by the time the data was available from the anemometer, the vendor was out of business.
The battery storage — the newest of the technologies — also presented some challenges. The batteries arrived damaged and had to be replaced, which caused a delay. After a couple of programming issues were worked out with the vendor, the batteries were up and running, but at half the expected 120 kilowatts of storage capacity.
In-home displays, in the drawerLower Valley also installed in-home display units to provide consumers information about their energy consumption. It was a lot of work for crews to install the 400 devices. Yet with minimal customer feedback, the tool’s impact on consumer behavior is unknown.
Knori believes that few customers are paying attention to the display units because newer tools, such as smart phone applications that perform the same function, outpaced the in-home display technology.
Lower Valley consumers have been very excited to see the new technologies related to smart grid, and that we have been doing pilot projects to improve their power quality and efficiency.”
– RICK KNORI, LVE DIRECTOR OF ENGINEERING

37
Continued use of the hot water heater demand response units will help Lower Valley keep electric bills affordable. As energy costs continue to increase over time, Lower Valley
might decide to expand its demand response program.
By installing the adaptive voltage control technology to additional substations, the co-op will take advantage of even more energy savings.
Finally, with the help of the solar array, Lower Valley Energy looks forward to keeping more electrons where they belong by avoiding the losses that typically occur over long distances.
WHAT’S NEXT for Lower Valley?
38
AND BY THE WAY ...Profile of Battelle
In the Pacific Northwest Smart Grid Demonstration Project, Battelle leads a collaborative effort that includes the Bonneville Power Administration, 11 utilities and six technology companies. Battelle also was a partner in the AEP Ohio gridSMART Demonstration Project.
Battelle has been headquartered in Columbus, Ohio, since its founding in 1929 and is a research and development organization that also designs and manufactures products and delivers critical services for government and commercial customers. Battelle’s contract research portfolio spans consumer and industrial, energy and environment, health and pharmaceutical, and national security. As part of its government-related work, Battelle manages national laboratories, including Pacific Northwest National Laboratory in Richland, Wash.
Battelle is the world’s largest nonprofit research and development organization, with over 22,000 employees at more than 60 locations globally. A 501(c)(3) charitable trust, Battelle was founded on industrialist Gordon Battelle’s vision that business and scientific interests can go hand-in-hand as forces for positive change. Battelle’s strong charitable commitment to community development and education includes a focus on staff volunteer efforts; science, technology, engineering and mathematics (STEM) education programs; and philanthropic projects in the communities Battelle serves.

39
PENINSULA LIGHT CO.
Smart grid provides power bridge to Fox IslandNearly half of Fox Island’s 1,200 residents moved here to retire by the water. They sail. They hike. They kayak in scenic Puget Sound. But the highly educated maritime residents also expect the same reliable electricity they once enjoyed in the city. That was a challenge for the utility that relied on aging cables to deliver the island’s electricity.
Yet it was also an opportunity to test new technologies to improve service, and the reason Peninsula Light Co. applied to participate in the Pacific Northwest Smart Grid Demonstration Project.
PenLight invested $1.2 million in the $178 million cost-share project. Just in time, too.
A critical need PenLight serves all of Fox Island, which, given its watery surroundings, has no gas service. That means many residents and businesses are dependent on electric power for everyday needs. Two cables deliver electricity to the island: one submarine cable and the other attached to a bridge.
“During the summer of 2010, the submarine cable that was installed in 1970 started to fail,” said Jonathan White, PenLight director of Marketing and Member Services. “An analysis determined that if the temperature fell below 20 degrees Fahrenheit, the ability to maintain load on the island’s remaining circuit would be difficult.”
To cope with potential outages, a com-prehensive strategic plan was developed. The plan included rolling blackouts, backup diesel distributed generation and a smart grid program.
“Fox Island became a smart grid test bed,” said Mike Simpson, PenLight’s manager of Engineering. “Knowing there was an aging issue with one cable, we thought: let’s look at demand response to reduce the load.”
PENINSULA LIGHT CO.Gig Harbor, Washington
�Member owned since 1925
� Second largest membership of any co-op in Northwest
� 997 circuit miles of line
� 112 square-miles of service territory
� 31,000 metered customers
INVESTMENT $1.2 million
HIGHLIGHTS � Power Sharing
� Power line-carrier system
� Self-healing network
� Integrated volt-VAR control
FOR MORE INFORMATIONMike Simpson (253) 857-1580www.PenLight.org
Pacific Northwest Smart Grid Demonstration Project SUCCESS STORIES

40
Failing cable leads to fast launch By September 2010, with winter quickly approaching, a demand response mar-keting program for electric water heaters called Power Sharing was launched. The program would reduce electric demand when needed by controlling residential water heater operations during peak load time periods.
Community meetings were held as con-struction started on a new cable 40 feet below Puget Sound. The participation
goal was to get 400 of the 1,700 metered customers on the island to participate in the program. Volunteers were offered a $5 credit on their monthly power bills.
“You don’t have to tell the light company about this, but I would do it without a discount,” said Dick Olszewski, a PenLight customer. “Electricity is something you must have to survive. Being on an island makes it more difficult, but it’s worth it.”
A few months later, the old cable partially failed. That’s when the program fast-tracked its way to load reduction during the coming winter months. By the end of December 2010, approximately 25 percent of the targeted customers were on board with the project. A month later, an additional 10 percent had joined. By February 2011, the goal was met.
During several low-temperature days, a phone message was sent alerting island residents of the low-temp risk and that the utility would begin cycling off water heaters.
“We were sending communications out to the members that this was a crisis situation and that we needed their assistance,” said White. “Rolling blackouts were imminent if the demand
response program and voluntary curtailment failed to meet the need.”
The emergency plan worked to get the island through the winter.
One bit every 20 minutesCommunication sent to the water heater controllers, turning them on or off, worked well. But getting data from the controllers back to the utility over its power line-carrier data collection system was another story.
The technology sent the data along with electricity through the power line. While these systems are generally known for being low-cost, they have significant bandwidth limitations. A smart phone or streaming TV connection delivers 10 megabits per second — PenLight’s system could only deliver one bit every 20 minutes. Hourly meter reads created challenges for the required project reporting.
With 500 homes on the island participating in the program and with the low speed of data transmittal, it was hard to tell if the program was working.
“We realized we had to get higher speed communications or it would be difficult to determine how effective it would be to use the system throughout the rest of our service area,” Simpson said.
A cellular solutionCellular-based transformer monitors provided a perfect work-around.
The devices — part of PenLight’s systemwide monitoring program — were installed to measure, in 15-minute intervals, transformer loads and conditions. This monitoring was critical to the ongoing reporting requirements of the demonstration, allowing the utility to
know if a hot water tank was turned off and if so, precisely when.
In addition, gathering data at the trans-former meant that a demand response event could be validated at one point for multiple participating homes. That means the utility now knows, on a cost-per-unit basis, whether it’s practical to deploy the system elsewhere.
Shorter and shorter and shorter outages Imagine a grid that fixes itself when a car hits a power pole or a storm trips a wire. That’s exactly what a self-healing grid does. The system detects the fault and then isolates the problem quickly — within minutes — by automatically deciding which switches on the transmission system to open and close. The result: fewer members affected. In addition, work crews know the precise location to investigate. Eliminating the need to patrol the entire circuit saves time and also reduces the length of the outage.
For some, adopting such technology without hands-on experience is tough to embrace. That’s why PenLight is taking time to learn about the operation of the system and how to get the most value from the demonstration project for its customers.
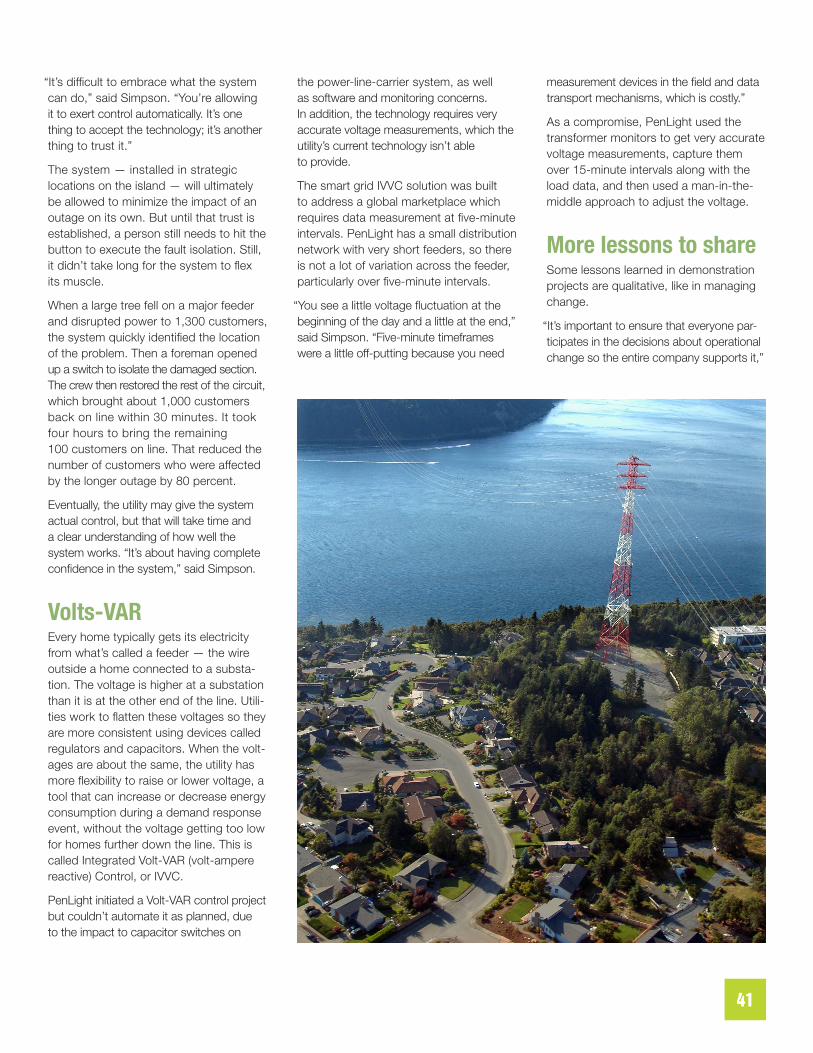
41
“It’s difficult to embrace what the system can do,” said Simpson. “You’re allowing it to exert control automatically. It’s one thing to accept the technology; it’s another thing to trust it.”
The system — installed in strategic locations on the island — will ultimately be allowed to minimize the impact of an outage on its own. But until that trust is established, a person still needs to hit the button to execute the fault isolation. Still, it didn’t take long for the system to flex its muscle.
When a large tree fell on a major feeder and disrupted power to 1,300 customers, the system quickly identified the location of the problem. Then a foreman opened up a switch to isolate the damaged section. The crew then restored the rest of the circuit, which brought about 1,000 customers back on line within 30 minutes. It took four hours to bring the remaining 100 customers on line. That reduced the number of customers who were affected by the longer outage by 80 percent.
Eventually, the utility may give the system actual control, but that will take time and a clear understanding of how well the system works. “It’s about having complete confidence in the system,” said Simpson.
Volts-VAR Every home typically gets its electricity from what’s called a feeder — the wire outside a home connected to a substa-tion. The voltage is higher at a substation than it is at the other end of the line. Utili-ties work to flatten these voltages so they are more consistent using devices called regulators and capacitors. When the volt-ages are about the same, the utility has more flexibility to raise or lower voltage, a tool that can increase or decrease energy consumption during a demand response event, without the voltage getting too low for homes further down the line. This is called Integrated Volt-VAR (volt-ampere reactive) Control, or IVVC.
PenLight initiated a Volt-VAR control project but couldn’t automate it as planned, due to the impact to capacitor switches on
the power-line-carrier system, as well as software and monitoring concerns. In addition, the technology requires very accurate voltage measurements, which the utility’s current technology isn’t able to provide.
The smart grid IVVC solution was built to address a global marketplace which requires data measurement at five-minute intervals. PenLight has a small distribution network with very short feeders, so there is not a lot of variation across the feeder, particularly over five-minute intervals.
“You see a little voltage fluctuation at the beginning of the day and a little at the end,” said Simpson. “Five-minute timeframes were a little off-putting because you need
measurement devices in the field and data transport mechanisms, which is costly.”
As a compromise, PenLight used the transformer monitors to get very accurate voltage measurements, capture them over 15-minute intervals along with the load data, and then used a man-in-the-middle approach to adjust the voltage.
More lessons to shareSome lessons learned in demonstration projects are qualitative, like in managing change.
“It’s important to ensure that everyone par-ticipates in the decisions about operational change so the entire company supports it,”

42
said Simpson. “If new processes and pro-cedure are thrust upon employees who have been doing business the same way for a very long time and trust that process, it’s difficult to make determinations about the new solution. Because you’re really dealing more with perceptions and how comfortable people are with something rather than the value you’ve built into it.”
Other lessons to note from the team include:
� Have operational personnel involved in equipment selection. The overhead switches are awkward and difficult to manually operate for some line crews.
� Ensure that the geospatial database is very accurate if purchasing a system model out of the box.
� Use more than one vendor when integrating software. With just one vendor, it’s really difficult to identify the root cause when there’s a problem. When integrating tools from different vendors there is an integration point and a boundary that assists in problem-solving.
� Be as clear as possible about team responsibilities — be strategic in assignments according to the functionality of a device and the role of a team member.
“Often, sharing the lessons learned is the most valuable part of a project like this,” Simpson said.
The member-owned utility intends to ensure that resilience is built into the system. One way to do that is by being very proactive. They will take a step forward by taking a look back. Technology platforms installed over
10 years ago may need to be upgraded. And if so, PenLight will determine how those technologies will be integrated into other platforms.
After all, many customers are already on board.
“This type of technology is not a bother,” said Olszewski. “It only operates when there’s a peak that’s taking place.”
In today’s world, there’s really not a single right path from one utility to another. Every utility has its own unique challenges. PenLight’s included being surrounded by water.
WHAT’S NEXT for Peninsula Light Co.?

43
CITY OFELLENSBURG
Renewable expansion for a historic utilityThere’s a lot of sunshine in the heart of Washington State. So much so that the City of Ellensburg uses the area’s most abundant natural resource — the sun — to help meet the needs of its energy consumers. In 2006, the nation’s first city-owned community solar array was installed north of Interstate 90. The successful system brought with it an audience of onlookers and inspired lawmakers. So, when the chance to expand its renewable resources came along, the utility sought funding from the Pacific Northwest Smart Grid Demonstration Project.
Washington State’s oldest municipal utility invested $850,000 to test the effectiveness of a variety of wind and solar systems and to gather information to share with the public.
What the customer wantsIn this tight-knit town of just under 10,000 people, when the customers speak, the utility listens. One message was loud and clear: Offer more distributed energy options.
“There was a lot of interest in residential wind and solar generation,” said Larry Dunbar, the city’s director of Energy Services. “So we wanted to test which ones would work.”
After all, the city had already achieved great success with the 300-watt solar array at the Ellensburg Community Renewables Park, one of the first of its kind in the nation.
“Residents were invited to purchase a (solar) panel, which ranged from $250 and up,” said Beth Leader of Ellensburg’s
CITY OF ELLENSBURG LIGHT DIVISIONEllensburg, Washington
� Founded in 1891
� 9,300 electronic customers
INVESTMENT$850,000
HIGHLIGHTS � Renewable energy park expansion
� Residential wind turbine demonstration
� Advanced SCADA communications network
� Real-time data system for education and research
FOR MORE INFORMATIONBeth Leader (509) 962-7124 www.ci.ellensburg.wa.us
Pacific Northwest Smart Grid Demonstration Project SUCCESS STORIES

44
Energy Services group. “Then they receive a percentage of that generation in the form of a rebate on their utility bills.”
With that kind of community investment, the city knew it needed to make very careful decisions.
Research and developmentThe city conducted a significant amount of research before selecting the technology for the project. Nine residential-class wind turbines were selected, ranging from
1.0 to 10 kilowatts, with a total output of about 45 kilowatts. The turbines were purchased from separate vendors to allow for a performance comparison. A meteorological tower was also installed to capture wind and temperature data in real-time. In addition, the existing solar array was expanded with an additional 40 kilowatts of thin-film panels. Finally, the city’s fiber communications system was connected to tie all of the resources together.
The resulting array could have won awards for its artistic appeal.
It was beneficial in finding out what technology is out there, what it does, and what it takes to make it work. And seeing how it responds in whatever conditions it’s in.”
– LARRY DUNBAR, CITY OF ELLENSBURG DIRECTOR OF ENERGY SERVICES
Small wind a blow The different turbine designs, staggered at differing heights, were visually appealing. But their performance was problematic. The smaller turbines required frequent maintenance.
The first tower that we installed was a great producer with no issues,” said Dunbar. “Then one of the turbines failed.”
That was just the beginning.
Months after installation, several other turbines stopped producing energy. Of the nine turbines, only five produced data significant to the project.
Then, a tower structure failed under high winds.
It turned out that four of the tallest tower structures, at nearly 80 feet, actually posed a safety risk, due to sustained winds of 30 to 40 mph. This is one of the windiest locations in the state — a good thing for wind generation, but not if your turbines aren’t designed for it.
“That prompted a safety review of every turbine mounting,” said Shan Rowbotham, the city’s power and gas manager.

45
After uneven results from the demonstration project, the utility plans to march forward with planning for the future. With energy costs rising, looking at alternative energy options is top-of-mind. And the
solar array isn’t going anywhere.
“We’re excited as we move forward to have the solar photo-voltaic array operating until the end of its life,” said Dunbar.
That’s in 11 years.
WHAT’S NEXT for City of Ellensburg?
Ultimately, two blade casings came apart and fell to the ground. Windy conditions sent the blades airborne — threating public safety at the park, where a trail wanders through the base of each turbine. Although no one was hurt, all towers were quickly deconstructed and removed.
“Having to take down the wind turbines was a very sensitive matter for us,” said Dunbar. “We don’t want to be portrayed as being anti-wind, but public safety is the most important thing.”
Although the wind element was a blow to the project, the utility still saw solar success and fiber-optic fame of sorts.
Fiber fame and a school toolThe city’s fiber system has drawn the attention of much larger cities, like Seattle. In fact, the City of Ellensburg fiber-optic network is well known throughout the state. Millions of points of data are delivered in real-time each second through five or six streams of information. The fiber network is connected to the utility’s centralized computer system to capture data from the turbines and the solar array. That data will be used to help Central Washington University develop a K-12 renewables curriculum.
Learning from the project is important to the city.
Lessons to shareFor the small utility, with less than 10,000 meters, buying into the technology and installing it was one thing. Keeping it operating and generating was another. Special products and special tools were required.
“It’s imperative to do that research,” said Dunbar. “Expect to take chances with new technology, expect things aren’t always going to work out as planned. There’s going to be some trial and error. That’s the whole point of doing a project like this.”
Other lessons learned from the project include:
� A fleet of small wind generation is very costly to maintain
� Carefully vet small vendors before making payments
� Use extra due diligence with ever-evolving experimental software and control systems
� Get expected costs right up-front

46
AND BY THE WAY ...Profile of BPA
The Bonneville Power Administration is a federal nonprofit power marketing administration based in the Pacific Northwest. Although BPA is part of the U.S. Department of Energy, it is self-funding and covers its costs by selling its products and services. BPA markets wholesale electrical power from 31 federal hydro projects in the Columbia River Basin, one nonfederal nuclear plant and several small nonfederal power plants. The dams are operated by the U.S. Army Corps of Engineers and the Bureau of Reclamation. About 30 percent of the electric power used in the Northwest comes from BPA. BPA’s resources — primarily hydroelectric — make its power nearly carbon free.
BPA also operates and maintains about three-fourths of the high-voltage transmission in its service territory. BPA’s service territory includes Idaho, Oregon, Washington, western Montana and small parts of eastern Montana, California, Nevada, Utah and Wyoming.
BPA promotes energy efficiency, renewable resources and new technologies that improve its ability to deliver on its mission. BPA also funds regional efforts to protect and enhance fish and wildlife populations affected by hydropower development in the Columbia River Basin.
BPA is committed to public service and seeks to make its decisions in a manner that provides opportunities for input from stakeholders. In its vision statement, BPA dedicates itself to providing high system reliability, low rates consistent with sound business principles, environmental stewardship and accountability.

47
BENTONPUD
Stepping into smart grid Flanking the Columbia River in Washington are three sunny cities — Richland, Pasco and Kennewick — with roots in many things from vineyards to energy. Challenged by being one of the fastest growing areas in the state, utility providers here work together to make sure the lights stay on. They also team up to find new, innovative energy solutions to meet the area’s growing energy needs. That’s why Benton PUD opted to take part in the Pacific Northwest Smart Grid Demonstration Project. The goal: investigate new technologies and prepare for a more efficient future.
The project — in its fifth and final year — is led by Battelle Northwest, about 15 miles upriver from Benton PUD’s headquarters at the Pacific Northwest National Laboratory.
The public-power utility district focused on two test cases: energy storage and a web platform to work with smart meter data. A smart meter uses two-way com-munications between a customer and the utility to improve services. This framework is called an advanced metering infrastruc-ture, or AMI.
An AMI opens up a world of useful data to make the operation of the grid more efficient.
For Benton PUD, knowing how to apply the data was the first step.
A data training toolA web platform called DataCatcher™ used real-time communication to acquire alarm data from the wireless AMI system. These alarms notified the utility of potential problems on the
BENTON PUDKennewick, Washington
� Founded in 1934
� 939 square miles
� 1,626 circuit-miles of line
� 49,816 metered customers
INVESTMENT $512,500
HIGHLIGHTS � AMI event data
� Energy storage
FOR MORE INFORMATIONBlake Scherer (509) 585-5361www.bentonpud.org
Pacific Northwest Smart Grid Demonstration Project SUCCESS STORIES

48
system, such as high voltages, low voltages, hot sockets and outages. This off-the-shelf but customizable software enabled operations groups to know what’s going on with the system. Any potential problem could then be actively addressed.
Learning the dos and don’ts of handling the alarm data demonstrated how to best maximize the AMI meters in two ways. First, identify which department would best benefit from that information. Second, learn how to most effectively implement the information into a future data management system that will eventually replace the DataCatcher™ demonstration.
“We now know the basics about collecting the AMI meter alarm data and how to present it. That will help us define our requirements for future integration with our other systems,” said Blake Scherer, project manager with Benton PUD.
Ultimately, learning about those future requirements was the biggest benefit for Benton PUD from the demonstration.
Energy storage partnersForging an energy storage partnership with Franklin PUD and the City of Richland was conceptually unique. Each utility installed an energy storage device that would be controlled by Benton PUD. The battery-based 10-kilowatt system would store electricity during off-peak periods when the price is cheap, and then distribute the energy later when the demand is high.
The project helped to raise awareness of things like cyber security and interoperability. It also raised awareness on those kinds of topics between Information Technology and Engineering – about working together to make the project happen.”
– BLAKE SCHERER,
PROJECT MANAGER WITH BENTON PUD
“One goal was to test software that uses a transactive incentive signal provided by Battelle,” said Scherer. “Then, wirelessly direct operations of storage devices from neighboring utilities and dispatch them as load or generation, as circumstances dictated.”
Transactive control uses an interactive, market-based signal to increase or decrease the energy consumption of households and industries to achieve greater efficiency in grid operations. In the Pacific Northwest, the signal is sent over a multiple utility footprint. Participants in the project test the feasibility of increasing energy use when wind energy is abundant, typically at night, and reducing use during peak hours when energy is most expensive. The integration of the technologies was a challenge for some
participants in the project because of the complexity of the project and the cost.
Unfortunately for Benton PUD, the energy storage vendor went out of business while a contractor was trying to implement the transactive control software.
“We were unable to have it working before the vendor went out of business,” said Scherer.
Lessons learnedThe biggest lesson learned: structure vendor contracts using milestones for certain accomplishments.
“We initially needed flexibility in the scope of work,” said Scherer. “But as the project became clearer, we

49
With an AMI foundation in place, Benton PUD wants to maximize the value of this investment by applying its lessons learned. It was also continue to organize and present AMI meter
event data to utility personnel to improve system operations, reliability and power quality. With regards to energy storage, Benton PUD will continue to monitor developments in the industry, looking for the technology to mature and the costs to decrease.
WHAT’S NEXT for Benton PUD?
should have established new payment milestones for our vendor. As it was, our contractor struggled with the complexity of the project, which used up our project budget and resulted in several deliverables not being completed by the contractor.”
Other lessons included properly under-standing the level of effort required for a federal demonstration. The project re-porting and project management require-ments were more than expected.
On the plus side, the project improved awareness of cyber security best practices.


51
ADVANCED METERING INFRASTRUCTURE (AMI): an integrated system of smart meters, communications networks, and data management systems that enables two-way communication between utilities and customers.
AMERICAN RECOVERY AND REINVESTMENT ACT OF 2009: an economic stimulus package signed into law on Feb. 17, 2009, in response to the Great Recession. The primary objective for ARRA was to save and create jobs almost immediately. Secondary objectives were to provide temporary relief programs for those most impacted by the recession and invest in infrastructure, education, health, and renewable energy.
AUTOMATED POWER FACTOR CONTROL: consists of a number of capacitors that are switched by means of contactors. These contactors are controlled by a regulator that measures power factor in an electrical network. Depending on the load and power factor of the network, the power factor controller will switch the necessary blocks of capacitors in steps to make sure the power factor stays above a selected value.
CAPACITOR: a passive two-terminal electrical component used to store energy electrostatically in an electric field.
CELLULAR-BASED TRANSFORMER MONITORS: a device that monitors the transformer activity using cellular technology.
CONSERVATION VOLTAGE REDUCTION (CVR): a technique for improving the efficiency of the
electrical grid by optimizing voltage on the feeder lines that run from substations to homes and businesses. Adaptive voltage control or dynamic voltage control is controlling voltage at specific times.
DEMAND RESPONSE: a resource that allows end-use electric customers to reduce their electricity usage in a given time period, or shift that usage to another time period.
DISTRIBUTION AUTOMATION (OR SELF-HEALING TECHNOLOGY): when computer systems quickly react to electrical issues in the system, like a fault in a feeder, without intervention from an operator or line worker.
DISTRIBUTION VOLTAGE OPTIMIZATION (DVO): lowers the energy consumption on a whole feeder — the line that delivers electricity from a substation to a home.
FIBER COMMUNICATIONS SYSTEM: a method of transmitting information from one place to another by sending pulses of light through an optical fiber.
HIGH RELIABILITY ZONE (HRZ): what PGE calls its microgrid.
IN-HOME DISPLAY UNIT: provides consumers with real-time hourly, daily, weekly and seasonal energy consumption information.
INTEGRATED VOLT-VAR (VOLT-AMPERE REACTIVE) CONTROL: a tool that can increase or decrease energy consumption during a demand response event, without the voltage getting too low for homes further down the line.
INVERTER: an electronic device or circuitry that changes direct current (DC) to alternating current (AC).
MICROGRID: a small-scale version of an electrical grid. It can be “islanded,” or disconnected from external transmission services. Local distribution provides power for customers’ electrical needs with only local generators and battery storage.
PEAK TIME OR PEAK DEMAND: when energy consumption is highest.
PREDICTIVE APPLICATIONS: software applications that learn by doing and become better at solving problems as they collect more and more data.
PROGRAMMABLE THERMOSTAT: a thermostat designed to adjust the temperature according to a series of programmed settings that take effect at different times of the day.
RADIO ENERGY MANAGEMENT SYSTEM (REMS): A centralized computer system monitors the demand, sending out a radio signal to the REMS unit and cycling off connected loads in order to reduce energy when the peak demand set-point is reached.
REGULATOR: is designed to automatically maintain a constant voltage level.
SMART EQUIPMENT: technology that can be controlled or managed regardless of location.
SMART METER: an electronic device that records consumption of electric energy in intervals
GLOSSARY

52
of an hour or less and communicates that information back to the utility for monitoring and billing purposes. Smart meters enable two-way communication between the meter and the central system.
SMART SWITCH: detects changes in the feeder, like a fault, and activates the switch automatically.
SMART THERMOSTAT: a Wi-Fi enabled thermostat that can be controlled regardless of location.
SMART TRANSFORMERS: work independently to constantly regulate voltage and maintain contact with the smart grid in order to allow remote administration if needed and to provide information and feedback about the power supply and the transformers themselves.
TRANSACTIVE CONTROL SIGNAL: incentive (price) and feedback (load) signals exchanged between active components in the electric power system. These signals forward forecasts and enable a process of negotiating future consumption against future price.
TRANSACTIVE NODE: which PGE calls the Smart Power Platform, is the main computer program which optimizes the economic decisions about the smart grid assets.
TRANSFORMER: an electrical device that transfers energy between two or more circuits through electromagnetic induction.
VOLTAGE OPTIMIZATION: uses a smart transformer to provide the exact amount of power that is needed and responds instantly to fluctuations within the power grid, acting as a voltage regulator to ensure that the optimized voltage is undisturbed.
WATER-HEATER DEMAND RESPONSE: controls when the water heater cycles on and off so usage can be shifted to off-peak times.
WIRELESS MESH SYSTEM: a network connection that is spread out among dozens or even hundreds of wireless mesh nodes that communicate with each other to share the network connection across a large area, such as an entire city.

Acknowledgement & Disclaimer This material is based upon work supported by the Department of Energy under Award Number DE-OE0000190.
This report was prepared as an account of work sponsored by an agency of the United States Government. Neither the United States Government nor any agency thereof, nor any of their employees, makes any warranty, express or implied, or assumes any legal liability or responsibility for the accuracy, completeness, or usefulness of any information, apparatus, product, or process disclosed, or represents that its use would not infringe privately owned rights. Reference herein to any specific commercial product, process, or service by trade name, trademark, manufacturer, or otherwise does not necessarily constitute or imply its endorsement, recommendation, or favoring by the United States Government or any agency thereof. The views and opinions of authors expressed herein do not necessarily state or reflect those of the United States Government or any agency thereof.

www.bpa.govDOE/BP-4654 • December 2014