Embed Size (px)
Citation preview
Pacific Northwest Association of Rail Shippers
Marc Brazeau
President & CEO
September 18, 2019
1

Canada’s railway franchise
About the RAC
Class 1: CN, CP and US
carriers
Short line: 50+ across Canada
Passenger: Commuter,
Intercity, Tourist
500 rail industry suppliers.
2

Our Board of Directors
• Jeff Ellis, Chief Legal Officer & Corporate Secretary, CP
(RAC Chair)
• Jean-Jacques Ruest, President and CEO, CN
(RAC Vice-Chair)
• Cynthia Garneau, President & CEO, VIA Rail Canada
Inc.
• Sean Finn, Executive Vice-President, Corporate
Services & Chief Legal Officer, CN
• Louis Gravel, President, Genesee & Wyoming Canada
• Corina Moore, President and CEO, Ontario Northland
Transportation Commission
• Derek Ollmann, President, Southern Railway of British
Columbia Ltd.
• Gordon Peters, President, Cando Rail Services Ltd.
• Robert Taylor, Assistant Vice President North American
Advocacy, CP
• Phil Verster, President and CEO, Metrolinx
3
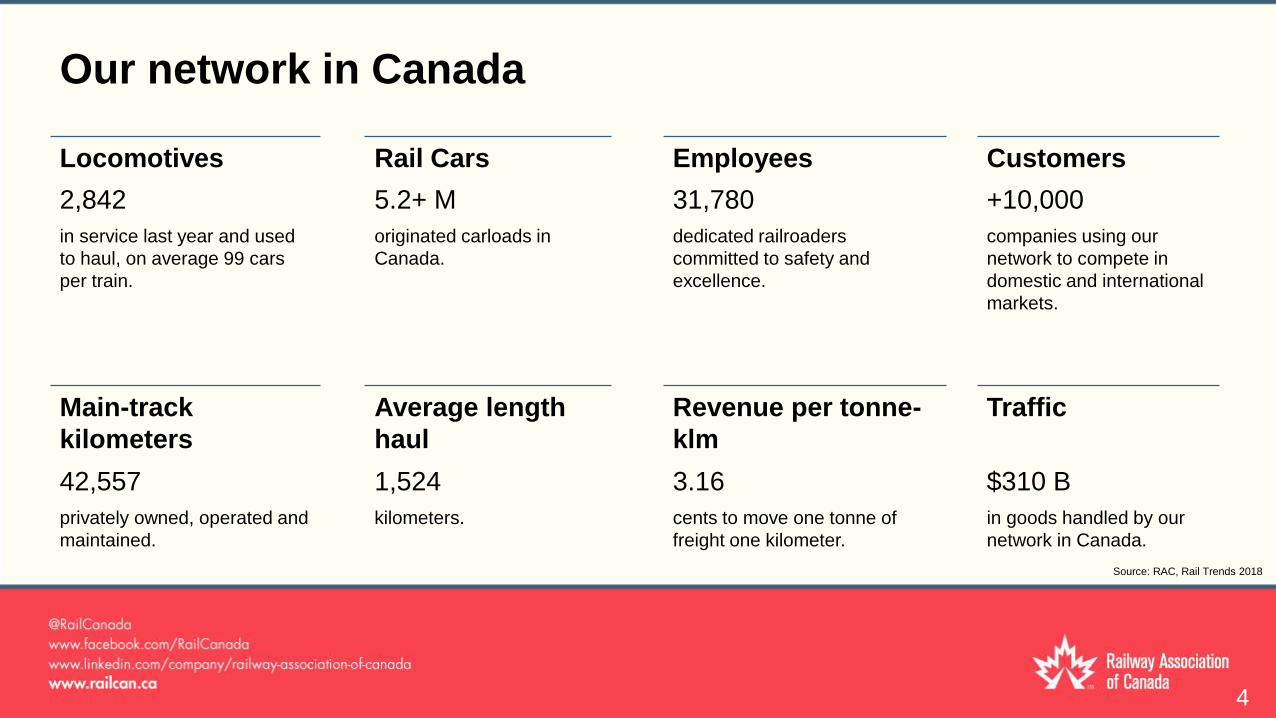
Our network in Canada
Locomotives Rail Cars Employees Customers
2,842 5.2+ M 31,780 +10,000
in service last year and used
to haul, on average 99 cars
per train.
originated carloads in
Canada.
dedicated railroaders
committed to safety and
excellence.
companies using our
network to compete in
domestic and international
markets.
Main-track
kilometers
Average length
haul
Revenue per tonne-
klm
Traffic
42,557 1,524 3.16 $310 B
privately owned, operated and
maintained.
kilometers. cents to move one tonne of
freight one kilometer.
in goods handled by our
network in Canada.
4
Source: RAC, Rail Trends 2018

Our diversified portfolio
Sources: RAC, 2018. Rail Trends 2017 database.
5

• CAPEX in 2019 exceeds $5.5B.
• CAPEX facilitates growth and capacity.
• A resilient railway network is required to
grow the economy and capitalize on
trade agreements.
Railway investments support growth
Sources: Railway Association of Canada, 2019. Rail Trends 2017 database.
6
6

• Infrastructure: yard and terminal
expansions, new track, sidings.
• Rolling stock: hundreds of new and
refurbished locomotives and thousands
of new rail cars.
• People: thousands of new railroaders
coming on board.
Investing in capacity
Source: CP Investor Day 2018
7

8

9

10

11

Although the U.S. remains our main trading partner, Canada has
diversified its imports and exports destinations over the last decade
•10 Emerging Partners
• The top 5 export destinations represent 86% of total exports
while the top 5 origins represent 76% of total imports.
• The U.S. still represents 75% of Canada’s total exports and
51% of total imports. Those shares have remained fairly stable
over the last 10 years.
• The 10 emerging destinations represent 2.2% of total exports while
the 10 emerging countries of origin represent 4.4% of total imports.
• Exports to the top 5 trading partners increased 21% from 2008 to
2018 while they increased by 114% for the 10 emerging partners.
• Imports from the top 5 trading partners increased 43% from 2008
while they increased 200% from the 10 emerging partners.
12
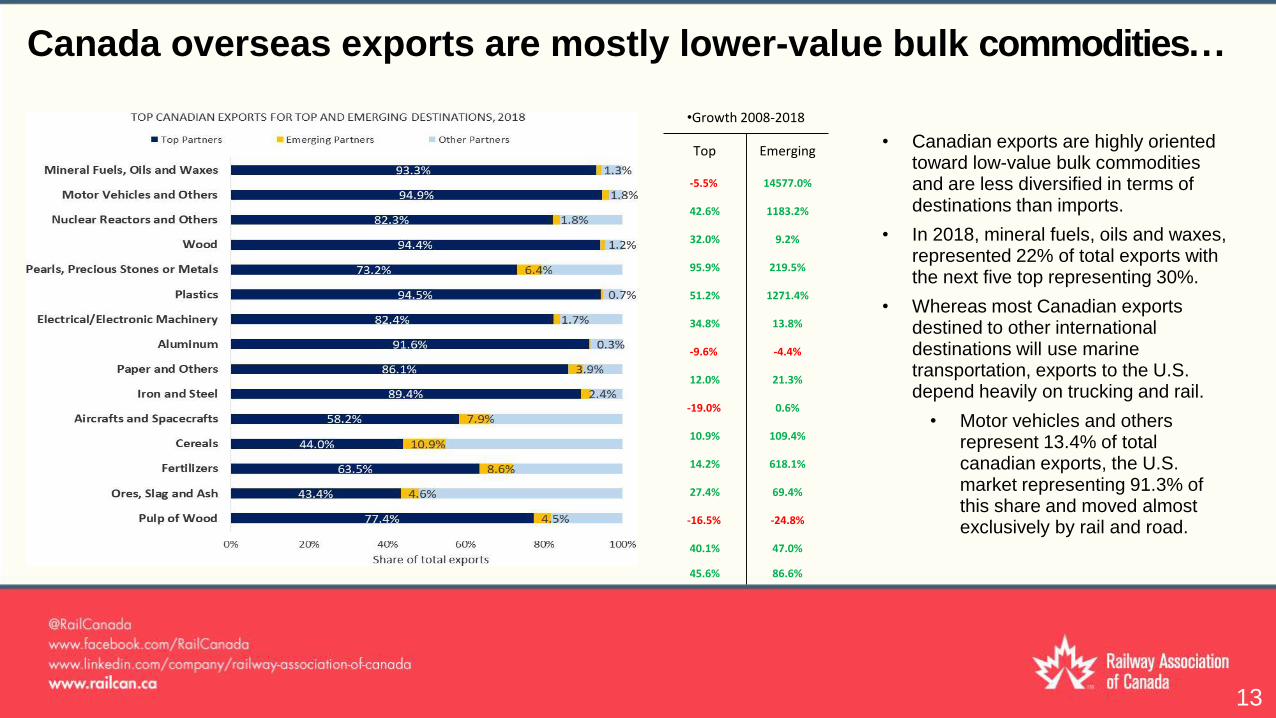
Canada overseas exports are mostly lower-value bulk commodities...
•Growth 2008-2018
Top Emerging
-5.5% 14577.0%
42.6% 1183.2%
32.0% 9.2%
95.9% 219.5%
51.2% 1271.4%
34.8% 13.8%
-9.6% -4.4%
12.0% 21.3%
-19.0% 0.6%
10.9% 109.4%
14.2% 618.1%
27.4% 69.4%
-16.5% -24.8%
40.1% 47.0%
45.6% 86.6%
• Canadian exports are highly oriented toward low-value bulk commodities and are less diversified in terms of destinations than imports.
• In 2018, mineral fuels, oils and waxes, represented 22% of total exports with the next five top representing 30%.
• Whereas most Canadian exports destined to other international destinations will use marine transportation, exports to the U.S. depend heavily on trucking and rail.
• Motor vehicles and others represent 13.4% of total canadian exports, the U.S. market representing 91.3% of this share and moved almost exclusively by rail and road.
13

...and imports more high-value finished goods
•Growth 2008-2018
Top Emerging
49.5% 832.3%
39.7% 196.5%
42.3% 457.1%
83.8% 179.7%
52.3% 213.3%
33.6% 100.8%
- 20.4% 187.4%
43.4% 154.8%
50.8% 165.4%
64.9% 30.7%
1.3% 820.8%
9.8% 180.5%
17.6% 443.6%
-11.2% 218.5%
• High-value finished goods make up a
significant share of Canada’s imports.
• Imports of top high-value goods
(motor vehicles and others, nuclear
reactors and others,
electrical/electronic machinery,
optical and other instrumentation
and pharmaceutical products
represents 46.6% of total
Canadian imports while only 27.4%
of exports).
• Due to the nature of the goods imported
and the higher diversification of origin
countries for imports, container inbound
traffic through Canadian ports is heavy
and port infrastructure plays a significant
role in moving these goods.
14

Total rail traffic growth was uneven across the network
• Total rail traffic (origin and destination) for September 2018 to April 2019 compared to the same period last year
increased 2% for intermodal and 6% for carloads.
• In Western Canada, total rail traffic increased 3.8% and 7.9% for intermodal and carloads.
• In Central Canada, total rail traffic declined by -1.2% for intermodal and increased by 3.7% for carloads.
• In Eastern Canada, rail traffic declined by -9.3% and -6.7% for both intermodal and carloads.
15

Despite strong traffic growth, the system remains competitive, with
growing market share of North American traffic on the West Coast
• Canada’s Share of North American
container port traffic has been relatively flat
over the past 10 years
• The Canadian West Coast has been
competitive, increasing market share 3.8%
over the past decade
• The Canadian East Coast ports have lost
1.4% market share of North American
East Coast traffic.
• However Canadian East Coast ports
continue to grow just not at the rate of the
US east coast ports
16

In Western Canada, the BC Lower mainland faces operational
challenges amid intensifying freight traffic
• The Lower mainland is characterized by heavy rail and
road traffic servicing the Port of Vancouver
• A large mix of commodities transit through this area as the
port is Canada’s largest gateway between North American
and International Markets
• Many operational challenges exist in the Lower mainland
including:
• Rail interswitching points,
• Bridges and tunnels to access the North Shore and
• Supply chain coordination between marine and
inland transportation modes
17

Western Canada – Two Year Outlook
After robust volumes in 2018, anticipated that
there will be no elevation of pressure on ports
(2-7%).
• Inbound shipments will see greatest
growth. Although, trade uncertainty will
weigh on potential.
• Grain and potash will be key drivers of
out bound traffic growth.
For hire long-haul trucking (6-8%)will continue
to be dominated by intra-provincial shipments.
• Growth in the Calgary-Edmonton
corridor may contribute to existing
congestion issues.
• Strong export oriented growth may
place additional pressure on traffic in
Vancouver area.
18
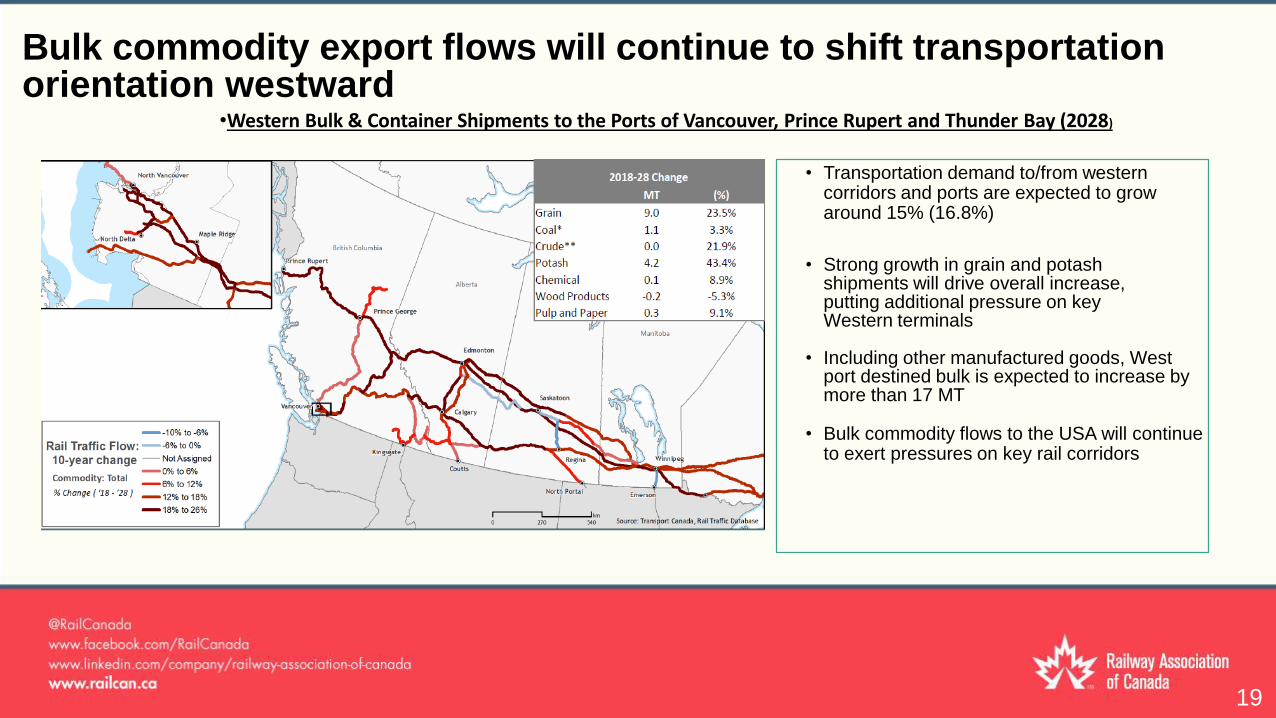
Bulk commodity export flows will continue to shift transportation orientation westward
•Western Bulk & Container Shipments to the Ports of Vancouver, Prince Rupert and Thunder Bay (2028)
• Transportation demand to/from western corridors and ports are expected to grow around 15% (16.8%)
• Strong growth in grain and potash shipments will drive overall increase, putting additional pressure on key Western terminals
• Including other manufactured goods, West port destined bulk is expected to increase by more than 17 MT
• Bulk commodity flows to the USA will continue to exert pressures on key rail corridors
19

Implications of Risks for Baseline
Transportation Outlook Macroeconomic risks
• Global slowdown may constrain forecast results below current baseline due to
current contraction in trade flows
• Deteriorating Canada/China relations may reduce shipments to west coast ports
• Deteriorating US/China relations may reduce incoming intermodal shipment to
west ports and outgoing shipments to boarder crossing. May also restrict export of
goods.
• New trade opportunities may provide a boost to Canadian exports to west
ports and boarder crossing
Commodity risks
• Lower grain yield growth will alleviate pressure on all ports
• Further pipeline delays will place pressure on network segments connecting
production to border crossings
• Canadian potash market share may not be maintained, resulting in a decrease in
shipments to Kingsgate crossing and ports
Transportation technology and logistics
• New hopper cars may decrease total carloads on the network but may also
improve shipment volumes.
• More challenging weather may reduce shipments network-wide and create
additional bottlenecks for west coast port shipments
Downside scenario
• Downside view sees demand lower than baseline (reduced trade flows)
but pressure persisting at 2018 levels for most network segments.
20

Climate change vulnerabilities are putting additional pressures on
transportation supply chain capacity and affecting efficiency
• In Western Canada, landslides near Ashcroft, British Columbia; floods in
Winnipeg and the U.S. mid-west; rising sea levels; and heavy winds at the
Port of Vancouver are all likely to impact rail traffic and port activities.
• In Central Canada, extreme weather events will continue to affect fluidity in
the high density areas.
• In Eastern Canada, key infrastructure connecting the eastern gateway to
central Canada such as the Chignecto Isthmus, are at risk of flooding with
little resilience options in place. More frequent and intense storms in the
Atlantic are also imposing challenges.
• In Northern Canada, thawing permafrost threatens the efficiency and
safety of transportation infrastructure.
• Status quo could be costly for the Canadian economy. Adapting the
transportation system to climate change is necessary to mitigate the impact
of extreme weather-related events. Climate change has already had financial
impacts on Canada and these costs are expected to continue growing.
21

22
23