Embed Size (px)
Citation preview

A f r i c a n D e v e l o p m e n t B a n k
AfDB
CONTENTS
1 Introduction
2 Trends of trade between Korea and Africa
3 Trend of Korean Investments into Africa
4 Trend of Korea’s ODA for Africa
5 Implications for Africa
The findings of this paper reflect the opinions of the authors and not those of the African Development Bank,its Board of Directors or the countries they represent.
Mthuli NcubeChief Economist and Vice President (ECON)[email protected]+216 7110 2062
Charles Leyeka LufumpaDirectorStatistics Department (ESTA)[email protected]+216 7110 2175
Désiré VencatachellumDirectorDevelopment Research Department (EDRE)[email protected]+216 7110 2076
Chief Economist ComplexVolume 2 • Issue 9June 2011
Africa Economic Brief
The Korea- Africa Partnership: BeyondTrade and Investment
Gil Seong Kang*
1 – Introduction
Africa’s economic relationships with Korea
are increasing rapidly and they are drawing
the attention of Korean policymakers and
business houses. These relations extend
beyond trade and investment and involve
also knowledge sharing and policy dialogue.
In this context, the Korean Government,
who hosted the Seoul G20 summit in 2010,
has actively reached out to Africa to help
increase awareness of Africa’s development
interests.
This brief examines the major trends in trade,
investment and aid flows between Korea and
Africa. It highlights policy implications for
African countries in view of the recent
developments in this economic relationship.
2 – Trend of trade between Korea and Africa
The volume of trade between Africa and
Korea has increased rapidly, reaching $13.9
billion in 2009, up from $6.4 billion in 2000
(Table 1). However, in relative terms, Africa
remains a marginal trade partner for Korea.
Africa accounts for only 3.3% of total Korean
exports and 1% of imports. While the share of
the continent in Korean exports has steadily
increased since 2003, Africa’s share in
Korean imports has declined after rising to
about 2% in 2006 (figure 1). Overall, trade
flows are in favour of Korea, with a trade
surplus of USD 7 billion in 2009.
Nevertheless, recent trade trends between
Korea and Africa are encouraging, with a
rapid increase in exports and imports.
* The brief was written when the author was with the Development Research Department of the AfDB as Principal ResearchEconomist.
Table 1 Trend of the trade between Korea and Africa
1990 1995 2000 2001 2002 2003 2004 2005 2006 2007 2008 2009
Total Korean exports toAfrica (US $ mn)
1 248 3 048 3 294 3 973 3 902 4 143 7 278 8 032 9 924 11 244 13 265 10 424
Share of Africa in Koreanexports (%)
2,0 2,3 1,9 2,6 2,4 2,1 2,9 2,8 3,0 3,0 3,1 3,3
Total Korean importsfrom Africa (US $ mn)
607 2 272 3 192 2 088 2 174 2 523 3 662 3 520 5 739 6 052 6 593 3 432
Share of Africa in Koreanimports (%)
0,8 1,7 2,0 1,5 1,4 1,4 1,6 1,3 1,9 1,7 1,5 1,0
Total trade Korea-Africa(imports+exports) (US $ mn)
1 855 5 320 6 486 6 061 6 076 6 665 10 939 11 552 15 663 17 296 19 858 13 856
Share of Korea in totalAfrica's trade (%)
1,2 3,2 3,1 2,3 2,2 2,0 2,6 2,2 2,4 2,2 1,9 1,8
Source: Source: IMF Direction of Trade (2010).
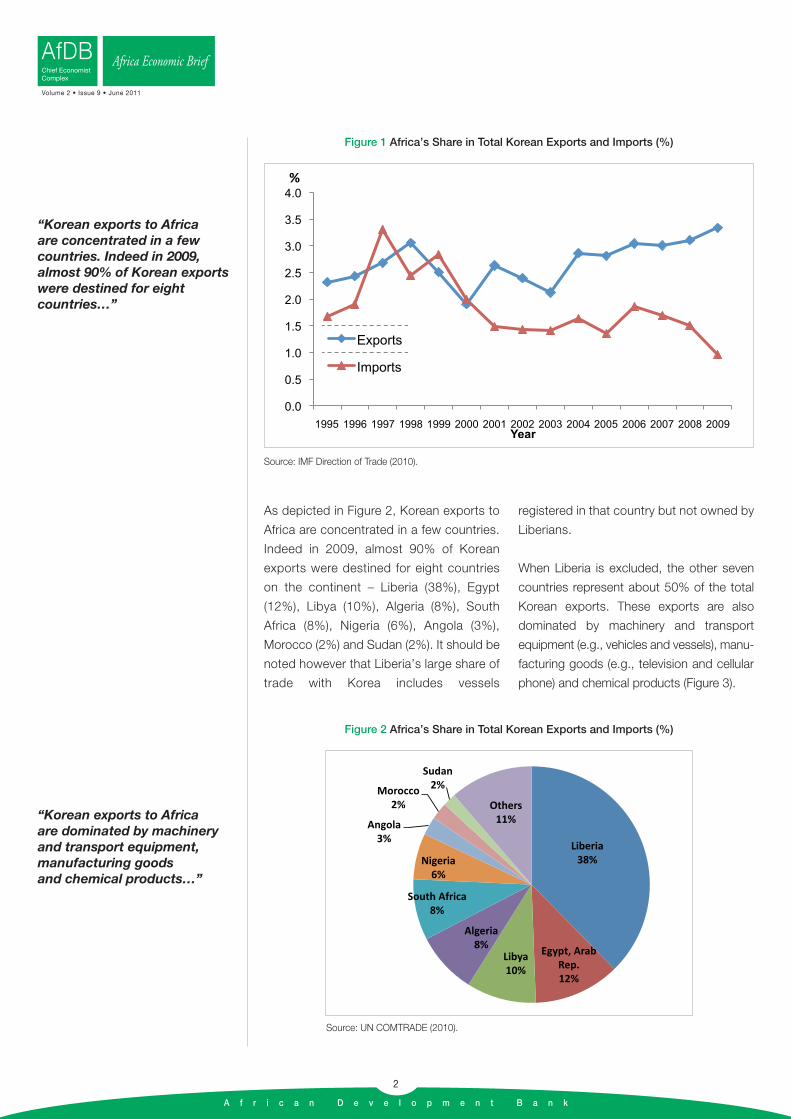
As depicted in Figure 2, Korean exports to
Africa are concentrated in a few countries.
Indeed in 2009, almost 90% of Korean
exports were destined for eight countries
on the continent – Liberia (38%), Egypt
(12%), Libya (10%), Algeria (8%), South
Africa (8%), Nigeria (6%), Angola (3%),
Morocco (2%) and Sudan (2%). It should be
noted however that Liberia’s large share of
trade with Korea includes vessels
registered in that country but not owned by
Liberians.
When Liberia is excluded, the other seven
countries represent about 50% of the total
Korean exports. These exports are also
dominated by machinery and transport
equipment (e.g., vehicles and vessels), manu -
facturing goods (e.g., television and cellular
phone) and chemical products (Figure 3).
“Korean exports to Africa are concentrated in a fewcountries. Indeed in 2009,almost 90% of Korean exportswere destined for eightcountries…”
“Korean exports to Africa are dominated by machineryand transport equipment,manufacturing goods and chemical products…”
A f r i c a n D e v e l o p m e n t B a n k
2
AfDB Africa Economic BriefChief Economist Complex
Volume 2 • Issue 9 • June 2011
Source: IMF Direction of Trade (2010).
Figure 1 Africa’s Share in Total Korean Exports and Imports (%)
Source: UN COMTRADE (2010).
Figure 2 Africa’s Share in Total Korean Exports and Imports (%)

Similarly, more that 90% of African export to
Korea originated from 10 countries: South
Africa (26%), Equatorial Guinea (16%), Algeria
(15%), Egypt (10%), Zambia (8%), Nigeria
(5%) and Gabon (5%) (Figure 4).
Figure 5 demonstrates that primary
commodities constitute the largest share of
the exports from Africa. In particular, crude oil
accounts for over 50% of the total exports
from Africa to Korea.
“…more that 90% of Africanexport to Korea originatedfrom 10 countries…”
“Primary commodities such as crude oil constitute the largest share of theexports from Africa.”
A f r i c a n D e v e l o p m e n t B a n k
3
AfDBAfrica Economic BriefChief Economist Complex
Volume 2 • Issue 9 • June 2011
Figure 3 Imports from Korea by Product, 2009 (%)
Source: UN COMTRADE (2010).
Source: UN COMTRADE (2010).
Figure 4 High Concentration of Exports from Africa to Korea, 2009 (%)

3 – Trend of Korean Investments in Africa
Korea’s investment into Africa has steadily
increased as Figure 6 illustrates. Korean FDI
to Africa, which was USD 16.9 million in
2001, recorded USD 373.6 million in 2009.
Considering the potential of the African
market, however, Korean investments in
Africa still remain marginal. Africa’s share in
total Korean outward FDI flows that had
peaked up to 2.8% for 1990 – 1994, dropped
to 1.1% for 2000 – 2004 and slightly
rebounded to 1.5% for 2005 - 2009 (Figure
7). Asia, North America and Europe are the
major destinations of Korean outward FDI,
while Africa, the Middle East and Oceania
have marginal shares (Figure 8).
“Considering the potential ofthe African market, Koreaninvestments still remainmarginal in the continent.”
“Asia, North America and Europe are the majordestinations of Koreanoutward FDI, while Africa, the Middle East and Oceaniahave marginal shares…”
A f r i c a n D e v e l o p m e n t B a n k
4
AfDB Africa Economic BriefChief Economist Complex
Volume 2 • Issue 9 • June 2011
Source: UN COMTRADE (2010).
Figure 5 Key African Exports to Korea (by Country and by Product), 2009
Source: Korea EXIM Bank database, 2010.
Figure 6 Trend of Korean foreign investments to Africa for 1987-2009
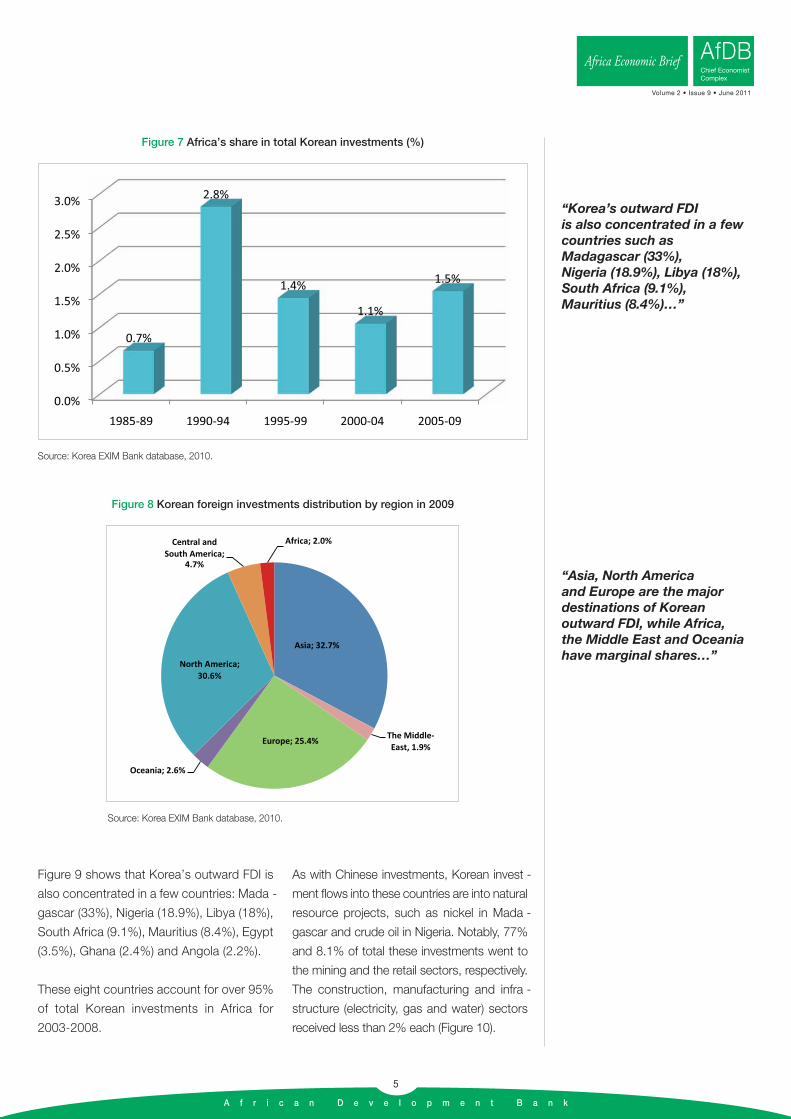
Figure 9 shows that Korea’s outward FDI is
also concentrated in a few countries: Mada -
gas car (33%), Nigeria (18.9%), Libya (18%),
South Africa (9.1%), Mauritius (8.4%), Egypt
(3.5%), Ghana (2.4%) and Angola (2.2%).
These eight countries account for over 95%
of total Korean investments in Africa for
2003-2008.
As with Chinese investments, Korean invest -
ment flows into these countries are into natural
resource projects, such as nickel in Mada -
gascar and crude oil in Nigeria. Notably, 77%
and 8.1% of total these investments went to
the mining and the retail sectors, respectively.
The construction, manufacturing and infra -
structure (electricity, gas and water) sectors
received less than 2% each (Figure 10).
“Korea’s outward FDI is also concentrated in a fewcountries such asMadagascar (33%), Nigeria (18.9%), Libya (18%),South Africa (9.1%), Mauritius (8.4%)…”
“Asia, North America and Europe are the majordestinations of Koreanoutward FDI, while Africa, the Middle East and Oceaniahave marginal shares…”
A f r i c a n D e v e l o p m e n t B a n k
5
AfDBAfrica Economic BriefChief Economist Complex
Volume 2 • Issue 9 • June 2011
Source: Korea EXIM Bank database, 2010.
Figure 7 Africa’s share in total Korean investments (%)
Source: Korea EXIM Bank database, 2010.
Figure 8 Korean foreign investments distribution by region in 2009

As depicted in Figure 11, the objectives of
Korean investments into Africa have
changed over time. For 1986 – 1988, almost
50% of total Korean investments came into
the continent to search for natural
resources. During the period of 1986 –
1988, local market access was the most
important reason for Korean investments
into Africa and then, natural resources of
Africa became again the most dominant
driver for 2006 – 2008. The cheap labor of
Africa, which attracted about 5% of total
Korean investments for 1996 – 1998,
represented less than 1% for 2006-2008.
“For 1986-1988, almost 50% of total Koreaninvestments came into thecontinent to search fornatural resources.”
“The cheap labor of Africa,which attracted about 5% of total Korean investmentsfor 1996-1998, representedmere less than 1% for 2006-2008.”
A f r i c a n D e v e l o p m e n t B a n k
6
AfDB Africa Economic BriefChief Economist Complex
Volume 2 • Issue 9 • June 2011
Source: OECD. Stat, 2010.
Figure 9 Destinations of Korea’s FDI Flows into Africa for 2003-2008 (%)
Source: Korea EXIM Bank and author's calculation.
Figure 10 Korea’s FDI in Africa by sectors for 2007-2009

“Africa is the second largest and one of the fastestgrowing recipients of Korea’s ODA.”
“Recently, socialinfrastructure such as education, health andwater supply and sanitationhas received an increased attention…”
A f r i c a n D e v e l o p m e n t B a n k
7
AfDBAfrica Economic BriefChief Economist Complex
Volume 2 • Issue 9 • June 2011
Source: Korea EXIM bank, 2010 and author’s calculation.
Figure 11 Objectives of Korean investments into Africa
4 – Trend of Korea’s ODA for Africa
Africa is the second largest and one of the
fastest growing recipients of Korea’s ODA.
Since 2005 Korea’s aid to Africa has
continuously increased, rising to a record
USD 95.8 million in 2008. The share of aid to
Africa among total Korean ODA, which fell
to 1% until 2004, has sharply increased
since 2005, reaching 18.4 percent in 2008
(Figure 12).
In the 1990s, Korean ODA was concentrated
in economic infrastructure such as
transportation and communication, which
accounted for over 70% of total bilateral
ODA. Recently, social infrastructure such as
education, health and water supply and
sanitation has received increased attention
(Figure 13).
Source: OECD, International Development Statistics Online DB (2010) and Korean EXIM Bank.
Figure 12 Trend of Korean Bilateral ODA for Africa for 2000-2008

There are prospects for increased Korean aid
to Africa following its announcement in
November 2009 that it would double its official
development aid to Africa by 2012. This
commitment was reaffirmed during the
KOAFEC (Korea Africa Economic
Cooperation) ministerial conferences in Seoul
in September 2010 by the Korean
government’s announcement on a increase in
the Economic Development and Cooperation
Fund (EDCF) by almost twofold to USD 1.1
billion in the next five years, compared to USD
590 million for 2005 - 2009. These moves
could be a positive sign for increases in
contributions by Korea to the Bank, including
the full implementation of commitment on an
about US$ 16 million grant for the knowledge
sharing for 2009- 2011.
5 – Implications for Africa
Africa’s economic partnerships with South
Korea are strengthening and new
opportunities are emerging. Africa's
economic growth presents opportunities for
closer business ties with South Korea.
However there is need for strategic
reorientation of the current relationships to
maximize their potential:
• Africa’s large potential in natural resources
will continue to attract investments from
Korea, which strives for the diversification
of its energy sources. Africa could benefit
from Korea’s active engagement in the
mining industry, particularly through
financing and technology transfer.
• Despite the abundance of Africa’s natural
resources, the continent needs to move
up the value chain if it is to achieve strong,
sustainable and shared growth. This will
require investment flows into
manufacturing activities that present the
greatest potential for sectoral linkages and
jobs creation. Korea has strong manu -
facturing industries which are expanding
to foreign countries such as China and
Vietnam, largely driven by cheap labor
and market access. Some countries in
Africa may provide a good location for
such manufacturing companies.
• Korea is also a good partner for Africa in
infrastructure development. Korea has
demonstrated strengths in civil engineering
and construction as has been the case in
the Middle East. The Korean experiences
and capabilities in ICT infrastructure may
be used in connecting Africa and allowing
growth of ICT industry on the continent.
• Furthermore, Africa can benefit from
knowledge sharing on policy and
institutional issues through increased
dialogue and cooperation.
“There are prospects for increased Korean aid to Africa following itsannouncement in November2009 that it would double its official development aid to Africa by 2012.”
“Africa's economic growthpresents opportunities for closer business ties with South Korea. Howeverthere is need for strategicreorientation of the currentrelationship…”
A f r i c a n D e v e l o p m e n t B a n k
8
AfDB Africa Economic BriefChief Economist Complex
Volume 2 • Issue 9 • June 2011
© 2011 - AfDB - Design, ERCU/YAL
Figure 13 Korean Bilateral ODA distribution by sector in 1996 and 2007