Embed Size (px)
Citation preview
Internal
Pacific Gas and Electric Company
EPIC Final Report
Program Electric Program Investment Charge (EPIC)
Project
Dynamic Rate Design Tool
Reference Name
EPIC 2.36
Department
Regulatory Affairs
Project Sponsor Megan Lawson
Project Business
Lead
Contact Info
Date
Deb Ghosh [email protected] August 14, 2020
Version Type Final
Version Version 1.3
EPIC Final Report | 2.36 Rate Design Tool
Internal
Table of Contents
1 Executive Summary __________________________________________________________ 1
1.1 Objectives ____________________________________________________________ 1
1.2 Issues Addressed _______________________________________________________ 1
1.3 Key Accomplishments ___________________________________________________ 2
1.4 Challenges and Lessons Learned ___________________________________________ 2
1.5 Conclusion ____________________________________________________________ 3
2 Introduction ________________________________________________________________ 4
3 Project Summary ____________________________________________________________ 5
3.1 Project Objectives ______________________________________________________ 5
3.2 Issues Addressed _______________________________________________________ 5
3.3 Scope of Work and Project Tasks __________________________________________ 6
4 Project Activities, Results, and Findings __________________________________________ 7
4.1 Technical Development and Methods _______________________________________ 7 4.1.1 High Level System Overview ................................................................................ 7 4.1.2 New Rate Design Process .................................................................................... 9 4.1.3 Rate Design Modules ......................................................................................... 11
4.2 Results and Observations _______________________________________________ 17 4.2.1 System Architecture .......................................................................................... 17
5 Value proposition __________________________________________________________ 26
5.1 Primary Principles _____________________________________________________ 27
5.2 Secondary Principles ___________________________________________________ 27
5.3 Key Accomplishments __________________________________________________ 27
5.4 Key Recommendations _________________________________________________ 28
5.5 Technology transfer plan ________________________________________________ 28 5.5.1 Production Deployment .................................................................................... 28 5.5.2 IOU’s technology transfer plans ........................................................................ 29 Information Sharing Forums Held ................................................................................. 29 5.5.3 Adaptability to other Utilities and Industry ....................................................... 29
5.6 Data Access __________________________________________________________ 29
6 Metrics ___________________________________________________________________ 29
7 Conclusion ________________________________________________________________ 30
8 Appendix A – Technical Information Data Dictionary _______________________________ 31
EPIC Final Report | 2.36 Rate Design Tool
Internal
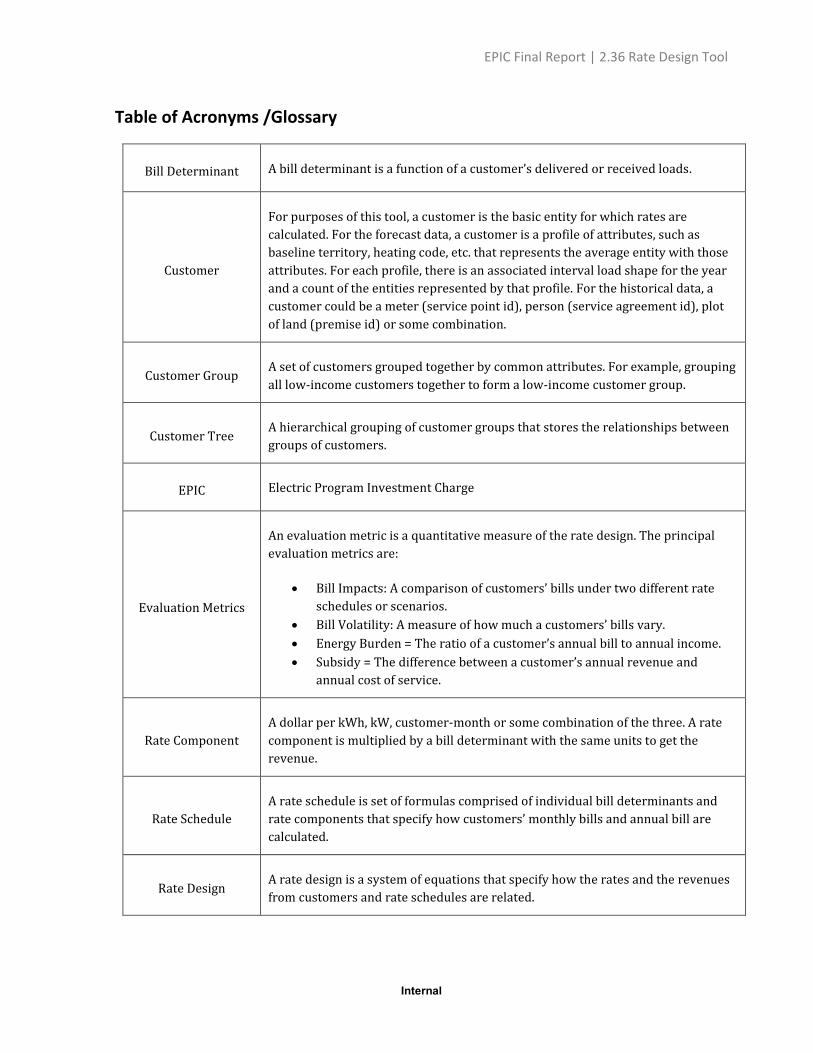
Table of Acronyms /Glossary
Bill Determinant A bill determinant is a function of a customer’s delivered or received loads.
Customer
For purposes of this tool, a customer is the basic entity for which rates are
calculated. For the forecast data, a customer is a profile of attributes, such as
baseline territory, heating code, etc. that represents the average entity with those
attributes. For each profile, there is an associated interval load shape for the year
and a count of the entities represented by that profile. For the historical data, a
customer could be a meter (service point id), person (service agreement id), plot
of land (premise id) or some combination.
Customer Group A set of customers grouped together by common attributes. For example, grouping
all low-income customers together to form a low-income customer group.
Customer Tree A hierarchical grouping of customer groups that stores the relationships between
groups of customers.
EPIC Electric Program Investment Charge
Evaluation Metrics
An evaluation metric is a quantitative measure of the rate design. The principal
evaluation metrics are:
• Bill Impacts: A comparison of customers’ bills under two different rate
schedules or scenarios.
• Bill Volatility: A measure of how much a customers’ bills vary.
• Energy Burden = The ratio of a customer’s annual bill to annual income.
• Subsidy = The difference between a customer’s annual revenue and
annual cost of service.
Rate Component
A dollar per kWh, kW, customer-month or some combination of the three. A rate
component is multiplied by a bill determinant with the same units to get the
revenue.
Rate Schedule
A rate schedule is set of formulas comprised of individual bill determinants and
rate components that specify how customers’ monthly bills and annual bill are
calculated.
Rate Design A rate design is a system of equations that specify how the rates and the revenues
from customers and rate schedules are related.
EPIC Final Report | 2.36 Rate Design Tool
Internal
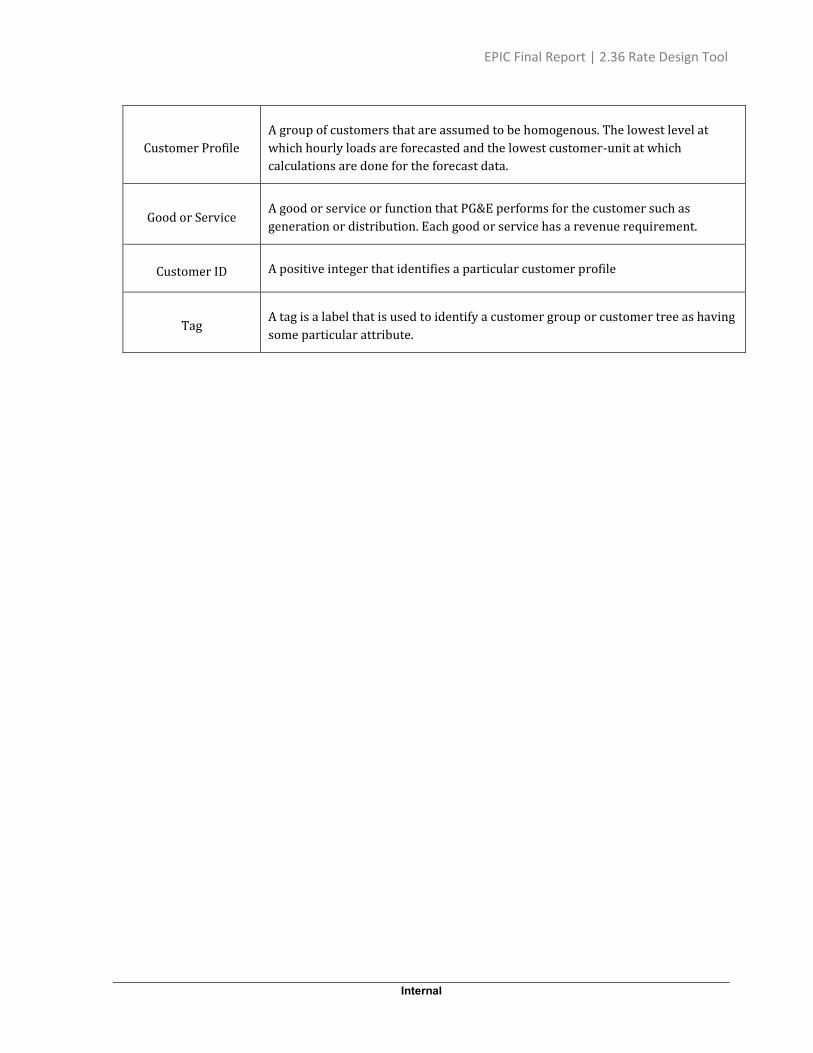
Customer Profile
A group of customers that are assumed to be homogenous. The lowest level at
which hourly loads are forecasted and the lowest customer-unit at which
calculations are done for the forecast data.
Good or Service A good or service or function that PG&E performs for the customer such as
generation or distribution. Each good or service has a revenue requirement.
Customer ID A positive integer that identifies a particular customer profile
Tag A tag is a label that is used to identify a customer group or customer tree as having
some particular attribute.

EPIC Final Report | 2.36 Rate Design Tool
Internal
1
1 Executive Summary
This report summarizes the project objectives, technical results and lessons learned for Electric Program Investment Charge (EPIC) Project 2.36 Dynamic Rate Design Tool as listed in the EPIC annual report.
1.1 Objectives
The key objectives of EPIC 2.36 were to:
• Demonstrate a more dynamic rate design tool1 approach for modeling customer bill impacts
from changes to rates and new rate scenarios;
• Leverage advanced approaches, such as distributed computing or parallel processing, that can
be applied to the rate design process;
• Explore a faster and easier process to experiment with new bill determinants and analyze
impacts of different scenarios under consideration, such as impacts of Distributed Energy
Resource (DER) adoption.
The vision for this project was to design an experimental rate design tool for scenario analysis. As the
penetration of technologies, such as DERs, continues to grow, the Company identified an opportunity
to develop a rate scenario engine that could provide analysis without the time constraint of its
“production” rate models. In order to perform quick analysis of multiple scenarios that utilize “big
data,” the Company would demonstrate that such a rate engine could be built on a distributed
computing platform. Although the envisioned tool is not a replacement for existing production quality
rate models which are built on hundreds of mandated policies and rate design principles, it was
intended as a dynamic rate design and evaluation product that can provide directional information for
making policy decisions.
1.2 Issues Addressed
Current rate design and evaluation tools were built on technologies from decades ago. PG&E’s rate
design models are in Microsoft Excel spreadsheets, upstream (to rate design) bill determinant models
and downstream rate evaluation models are in SAS whereas customer demographics, billing and
hourly usage data are stored in Teradata database. It requires significant back and forth coordination
among the proceeding witnesses, rate analysts, and data analytics team to prepare all inputs and
outputs for rate design. The current labor intensive and time-consuming processes limit the ability of
PG&E to experiment with new and novel rate designs using these tools and processes. While PG&E’s
existing rate design models remain necessary for formal proposals in regulatory proceedings at the
California Public Utilities Commission (CPUC or Commission) or at the Federal Energy Regulatory
1 Note that the term “dynamic rate design tool” as used here, refers to the flexibility of the tool itself and is not a reference to dynamic pricing structures, i.e., rates structures where price signals are sent to customers.

EPIC Final Report | 2.36 Rate Design Tool
Internal
2
Commission (FERC), those models are not nimble for exploratory or scenario-based rate design work
for new technologies, such as DERs.
1.3 Key Accomplishments
The following has been accomplished through this project:
• PG&E built a distributed computing platform leveraging Amazon Web Services (AWS), which
have been deployed in production at the conclusion of this project.
• PG&E extracted residential customers’ characteristics and hourly usage data for one year and
created a database, utilizing big data technologies, that enables the processing of billions of
rows of information in a few hours, compared to a number of days using PG&E’s current
process
• PG&E built a high-level rate design framework that can enable a faster and easier experimental
rate design process.
• PG&E built high level building blocks for experimental rate design so users can dynamically
segment customers, create bill determinants, design new rate structures and evaluate their bill
impacts.
• PG&E built application programming interfaces (API) for users to interact with the above
building blocks to design and evaluate rates at a high level.
These key accomplishments are foundational for the future development of a more fully functional
rate design and evaluation product. At this stage, the tool can design high level experimental tiered,
time-of-use, and tiered time-of-use rates as well as rates with a maximum demand charge. It is
important to note that the milestones that PG&E achieved in support of building the dynamic rate
design tool (e.g., creating the distributed computing platforms, database, and design framework) are
not only proof of concept, but can be leveraged to significantly improve other production-grade tools
for rate and bill analysis that are built on existing technology.
1.4 Challenges and Lessons Learned
Rate design and, in general, pricing models are industry-specific, and the rate design requirements of a
California electric utility are overwhelmingly complicated. To develop a faster, easier and more flexible
pricing model that is capable of handling millions of customers’ hourly usage (approximately 1.5
terabytes of data), expert data engineering and data science skillsets are required. Finding experienced
resources that could pair data science and newly taught utility pricing concepts proved to be the most
challenging aspect of this project.
Creating experimental bill determinants iteratively, rapidly and on-demand using terabytes of hourly
usage data as well as calculating monthly bills for over 4 million customers, which was required to

EPIC Final Report | 2.36 Rate Design Tool
Internal
3
solve rates, proved to be quite a challenge even for a distributed computing environment and required
extensive research and development on database design and parallel processing capabilities. The team
addressed that by implementing an innovative approach to sort and partition customers’ hourly usage
data before storing them in the distributed computing platform.
1.5 Conclusion
The key features of a Dynamic Rate Design Tool were successfully demonstrated, laying the
groundwork to enable PG&E to improve rate design and evaluation capabilities in the future.
Rate design for regulatory proceedings and implementation in tariffs is based on numerous niche
policies, rules, and principles which are often conflicting and constantly evolving. While this tool
cannot be a replacement for PG&E’s operational rate design models used in rate cases, PG&E
concluded that big data technologies can provide a one-stop solution to build experimental rate design
and evaluation models, back-end customer database as well as front-end user interface. This provides
a consistent and cohesive approach for designing, developing and deploying complex yet flexible
applications that are also easy to maintain in the future.
PG&E demonstrated five distinct rate designs in this project. This demonstrates that a fully functional product using this framework can potentially model hundreds of illustrative rate design scenarios in a limited amount of time and effectively assess impacts to utility customers. However, such a fully functional product requires improving usability through development of a
custom graphical user interface for input and output and integration with utilities’ existing customer
information and analytics systems.
EPIC Final Report | 2.36 Rate Design Tool
Internal
4
2 Introduction
This report documents the EPIC 2.36 Dynamic Rate Design Tool project achievements, highlights key
learnings from the project that have industry value, and identifies future opportunities for utilities to
leverage this project.
The California Public Utilities Commission (CPUC) passed two decisions that established the basis for
this demonstration program. The CPUC initially issued D. 11-12-035, Decision Establishing Interim
Research, Development and Demonstrations and Renewables Program Funding Level2, which
established the Electric Program Investment Charge (EPIC) on December 15, 2011. Subsequently, on
May 24, 2012, the CPUC issued D. 12-05-037, Phase 2 Decision Establishing Purposes and Governance
for Electric Program Investment Charge and Establishing Funding Collections for 2013-20203, which
authorized funding in the areas of applied research and development, technology demonstration and
deployment (TD&D), and market facilitation. In this later decision, CPUC defined TD&D as “the
installation and operation of pre-commercial technologies or strategies at a scale sufficiently large and
in conditions sufficiently reflective of anticipated actual operating environments to enable appraisal of
the operational and performance characteristics and the financial risks associated with a given
technology.”4
The decision also required the EPIC Program Administrators5 to submit Triennial Investment Plans to
cover three-year funding cycles for 2012-2014, 2015-2017, and 2018-2020. On November 1, 2012, in
A.12-11-003, PG&E filed its first triennial Electric Program Investment Charge (EPIC) Application with
the CPUC, requesting $49,328,000 including funding for 26 Technology Demonstration and
Deployment Projects. On November 14, 2013, in D.13-11-025, the CPUC approved PG&E’s EPIC plan,
including $49,328,000 for this program category. On May 1, 2014, PG&E filed its second triennial
investment plan for the period of 2015-2017 in the EPIC 2 Application (A.14-05-003). CPUC approved
this plan in D.15-04-020 on April 15, 2015, including $51,080,200 for 31 TD&D projects.6
Pursuant to PG&E’s approved 2015-2017 EPIC triennial plan, PG&E initiated, planned and implemented
the following project: 2.36 Dynamic Rate Design Tool. Through the annual reporting process, PG&E has
kept CPUC staff and stakeholders informed on the progress of this project. The following is PG&E’s
final report on this project.
2 http://docs.cpuc.ca.gov/PublishedDocs/WORD_PDF/FINAL_DECISION/156050.PDF 3 http://docs.cpuc.ca.gov/PublishedDocs/WORD_PDF/FINAL_DECISION/167664.PDF 4 Decision 12-05-037 pg. 37 5 Pacific Gas & Electric (PG&E), San Diego Gas & Electric (SDG&E), Southern California Edison (SCE), and the California Energy Commission (CEC) 6 In the EPIC 2 Plan Application (A.14-05-003), PG&E originally proposed 30 projects. Per CPUC D.15-04-020 to include an assessment of the use and impact of EV energy flow capabilities, Project 2.03 was split into two projects, resulting in a total of 31 projects.
EPIC Final Report | 2.36 Rate Design Tool
Internal
5
3 Project Summary
The EPIC 2.36 Dynamic Rate Design Tool project demonstrated essential supporting structures that
enable flexible rate design and a faster and easier process to evaluate potentially hundreds of such
scenarios leveraging big data technologies.
3.1 Project Objectives
The key objectives of EPIC 2.36 were to:
• Demonstrate a more dynamic rate design tool approach for modeling customer bill impacts
from changes to rates and new rate scenarios;
• Leverage advanced approaches, such as distributed computing or parallel processing, that can
be applied to the rate design process;
• Explore a faster and easier process to experiment with new bill determinants and analyze
impacts of different scenarios under consideration, such as impacts of Distributed Energy
Resource (DER) adoption.
3.2 Issues Addressed
Current rate design tools were built decades ago when utilities were the sole providers of electricity
and DER technology was not prevalent. PG&E’s rate design models are in Microsoft Excel
spreadsheets, upstream (to rate design) bill determinant models and downstream rate evaluation
models are in SAS whereas customer demographics, billing and hourly usage data are stored in
Teradata database. It requires significant back and forth coordination among the proceeding
witnesses, rate analysts, and data analytics team to prepare all inputs and outputs for rate design. The
current labor intensive and time-consuming processes limit the ability of PG&E to experiment with
new and novel rate designs using these tools and processes. While PG&E’s existing rate design models
remain necessary for formal proposals in regulatory proceedings at the California Public Utilities
Commission (CPUC or Commission) or at the Federal Energy Regulatory Commission (FERC), those
models are not nimble for exploratory or scenario-based rate design work for new technologies, such
as DERs.
DERs and other drivers such as EV charging, electrification, regionalization, new service offerings etc.
are changing the utility landscape and creating gaps in the current rate design process. For utilities and
regulators to address the continued growth expected in technology penetration, there is a need for
new capabilities to effectively model the interaction between technology adoption and rates, and to
ultimately encourage adoption.
In line with PG&E’s strategy to create more equitable, cost-based rate structures that minimize cross-
subsidies within revenue classes, a modern rate design tool can strengthen policy decisions by
designing and evaluating various experimental rate scenarios. Such a modern rate design tool requires
rethinking from the ground up, including:

EPIC Final Report | 2.36 Rate Design Tool
Internal
6
• an ability to analyze customer data prior to designing rates;
• an ability to dynamically create customer segments based on their characteristics so that
experimental rates can be designed either by keeping the same revenue requirement or by
changing it to meet certain policy requirements;
• an ability to dynamically create bill determinants using advanced metering infrastructure
(AMI) interval meter data for both usage and demand charges for various time-of-use periods;
• a flexible rate design framework so any rate structure can be implemented using the
aforementioned bill determinant;
• an ability to calculate customers’ bills in a reasonable amount of time; and
• an ability to generate rates in a reasonable time and to evaluate rates using various metrics
such as bill impact, bill volatility and energy burden.
It is expected that a modern rate design tool will enable a faster and easier exploratory rate design process for the users as well as make it more cost effective to maintain. Finally, it is required that such a tool be able to process, in a reasonable amount of time, high volumes of customers’ (AMI) interval meter data, which is typically over a terabyte (one thousand gigabytes).
3.3 Scope of Work and Project Tasks
To accomplish the above objectives, the project team completed the following tasks:
1. Designed, created and tested a database using big data technologies to store customers’
characteristic and hourly usage data spanning one year.
2. Designed, developed and tested a Customer Segmentation module to dynamically crate
customer groups based on their characteristics.
3. Designed, developed and tested a Bill Determinant Module to calculate bill determinants using
customers’ hourly usage data.
4. Designed, developed and tested a Rate Schedule Module to build rate schedules in order to
calculate bills for customers in a segment and calculate corresponding revenue.
5. Designed, developed and tested a Rate Design Module to create formula for rate design and
solve rates.
6. Designed, developed and tested a Rate Evaluation Module to calculate customers’ bill impact,
bill volatility and energy burden.
7. Designed and developed an extensible code base so that others can extend the code to
incorporate their models.
8. Designed, developed and tested the ability for users to load and save the results of rate design
calculations.
EPIC Final Report | 2.36 Rate Design Tool
Internal
7
4 Project Activities, Results, and Findings
4.1 Technical Development and Methods
The rate design tool framework has a three-tier architecture. The first tier consists of a back-end
database hosted on an Amazon Web Services (AWS) cluster. The second tier comprises of the actual
rate design and evaluation building blocks, written in Python, Pandas and PySpark, as well as
application programming interfaces (APIs), which enable interactions with the building blocks. For
the third tier, Jupyter notebook, a web based graphical user interface has been provided to
demonstrate the functionalities.
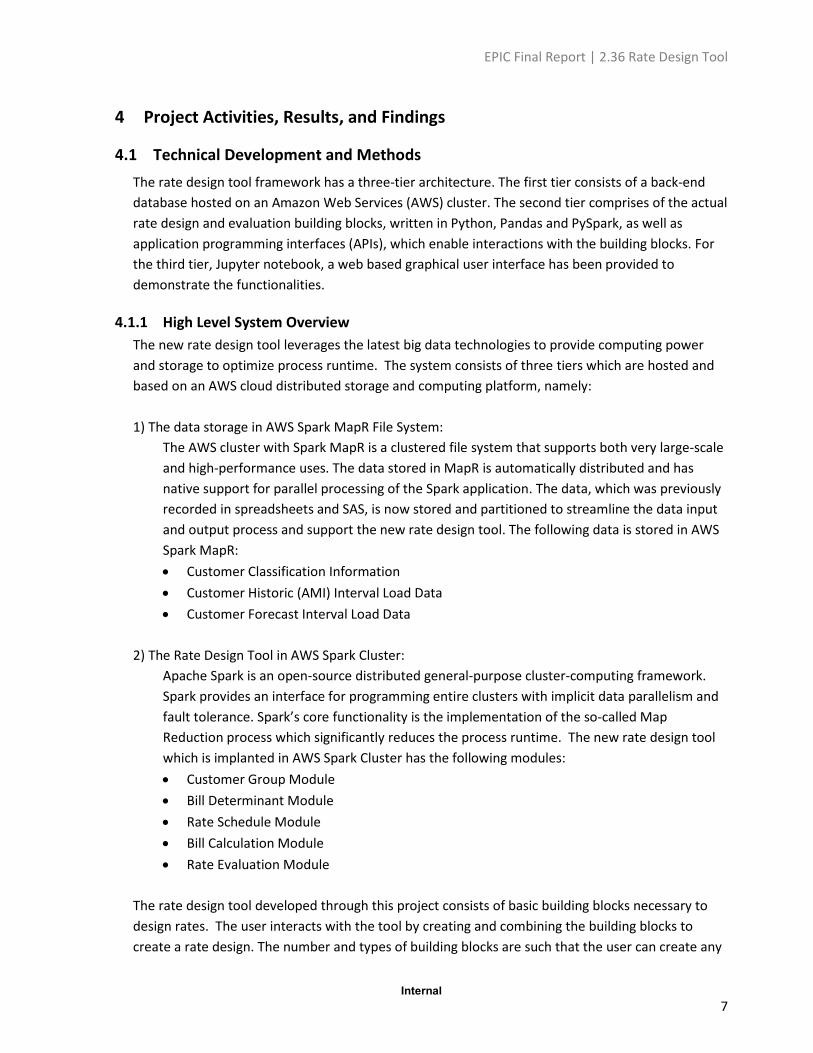
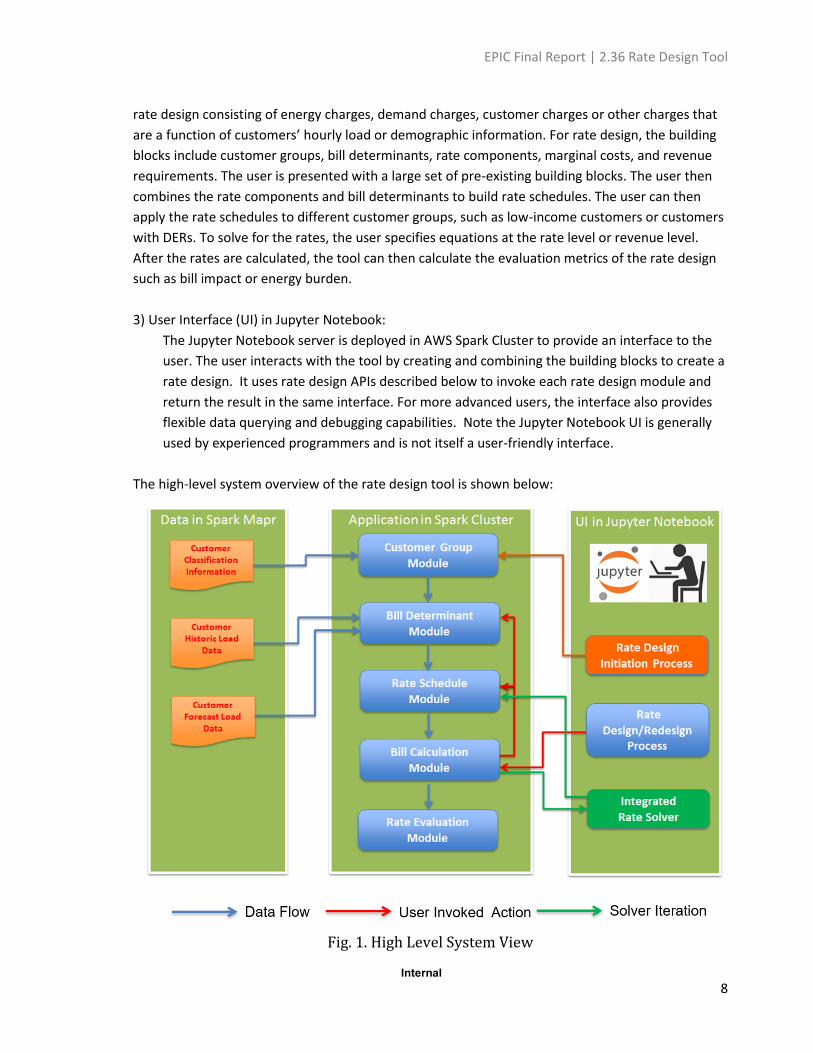
4.1.1 High Level System Overview
The new rate design tool leverages the latest big data technologies to provide computing power
and storage to optimize process runtime. The system consists of three tiers which are hosted and
based on an AWS cloud distributed storage and computing platform, namely:
1) The data storage in AWS Spark MapR File System:
The AWS cluster with Spark MapR is a clustered file system that supports both very large-scale
and high-performance uses. The data stored in MapR is automatically distributed and has
native support for parallel processing of the Spark application. The data, which was previously
recorded in spreadsheets and SAS, is now stored and partitioned to streamline the data input
and output process and support the new rate design tool. The following data is stored in AWS
Spark MapR:
• Customer Classification Information
• Customer Historic (AMI) Interval Load Data
• Customer Forecast Interval Load Data
2) The Rate Design Tool in AWS Spark Cluster:
Apache Spark is an open-source distributed general-purpose cluster-computing framework.
Spark provides an interface for programming entire clusters with implicit data parallelism and
fault tolerance. Spark’s core functionality is the implementation of the so-called Map
Reduction process which significantly reduces the process runtime. The new rate design tool
which is implanted in AWS Spark Cluster has the following modules:
• Customer Group Module
• Bill Determinant Module
• Rate Schedule Module
• Bill Calculation Module
• Rate Evaluation Module
The rate design tool developed through this project consists of basic building blocks necessary to
design rates. The user interacts with the tool by creating and combining the building blocks to
create a rate design. The number and types of building blocks are such that the user can create any
EPIC Final Report | 2.36 Rate Design Tool
Internal
8
rate design consisting of energy charges, demand charges, customer charges or other charges that
are a function of customers’ hourly load or demographic information. For rate design, the building
blocks include customer groups, bill determinants, rate components, marginal costs, and revenue
requirements. The user is presented with a large set of pre-existing building blocks. The user then
combines the rate components and bill determinants to build rate schedules. The user can then
apply the rate schedules to different customer groups, such as low-income customers or customers
with DERs. To solve for the rates, the user specifies equations at the rate level or revenue level.
After the rates are calculated, the tool can then calculate the evaluation metrics of the rate design
such as bill impact or energy burden.
3) User Interface (UI) in Jupyter Notebook:
The Jupyter Notebook server is deployed in AWS Spark Cluster to provide an interface to the
user. The user interacts with the tool by creating and combining the building blocks to create a
rate design. It uses rate design APIs described below to invoke each rate design module and
return the result in the same interface. For more advanced users, the interface also provides
flexible data querying and debugging capabilities. Note the Jupyter Notebook UI is generally
used by experienced programmers and is not itself a user-friendly interface.
The high-level system overview of the rate design tool is shown below:
Fig. 1. High Level System View
EPIC Final Report | 2.36 Rate Design Tool
Internal
9
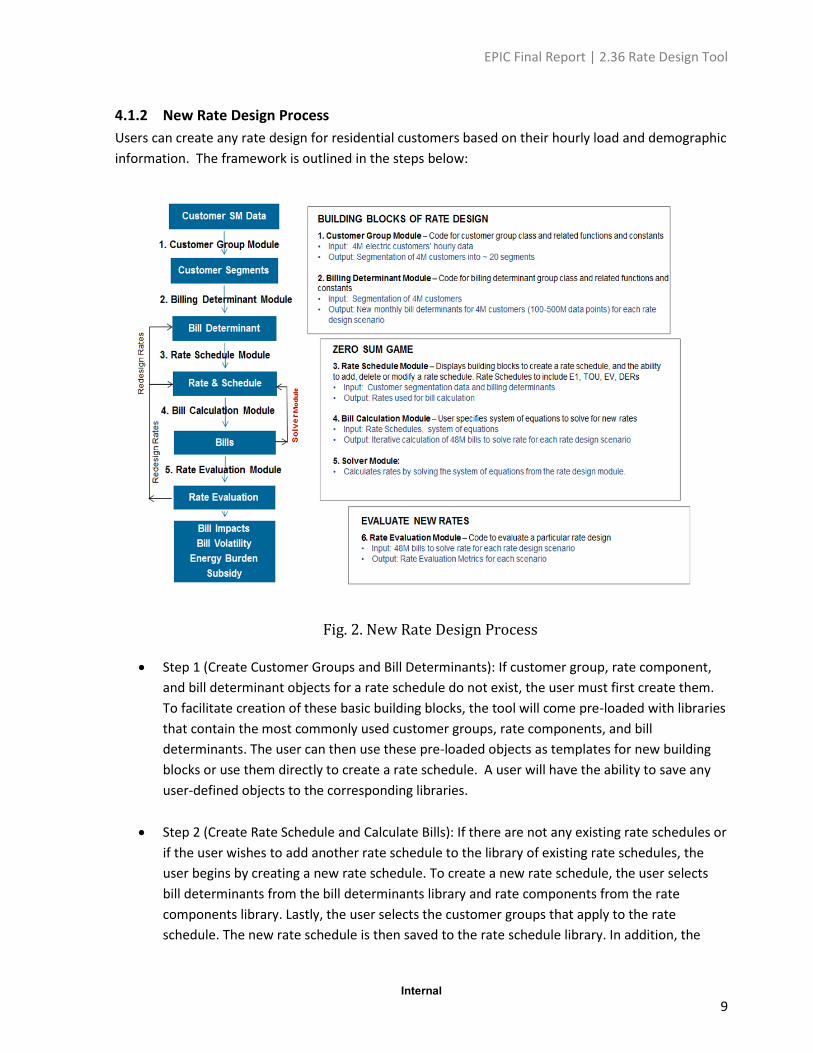
4.1.2 New Rate Design Process
Users can create any rate design for residential customers based on their hourly load and demographic
information. The framework is outlined in the steps below:
Fig. 2. New Rate Design Process
• Step 1 (Create Customer Groups and Bill Determinants): If customer group, rate component,
and bill determinant objects for a rate schedule do not exist, the user must first create them.
To facilitate creation of these basic building blocks, the tool will come pre-loaded with libraries
that contain the most commonly used customer groups, rate components, and bill
determinants. The user can then use these pre-loaded objects as templates for new building
blocks or use them directly to create a rate schedule. A user will have the ability to save any
user-defined objects to the corresponding libraries.
• Step 2 (Create Rate Schedule and Calculate Bills): If there are not any existing rate schedules or
if the user wishes to add another rate schedule to the library of existing rate schedules, the
user begins by creating a new rate schedule. To create a new rate schedule, the user selects
bill determinants from the bill determinants library and rate components from the rate
components library. Lastly, the user selects the customer groups that apply to the rate
schedule. The new rate schedule is then saved to the rate schedule library. In addition, the

EPIC Final Report | 2.36 Rate Design Tool
Internal
10
rate schedule library will come pre-loaded with common rate schedules, such as E1 for
residential customers, to facilitate the building of rate schedules.
• Step 3 (Create a Rate Design): The next step is to specify the mathematical formulas that relate
the unknown rate components and recover revenue from customer groups. The tool will
require the user to input the same number of equations as the number of unknown rate
components. Inputs into this step are the rate schedules for which the user wants to calculate
the rates and revenue.
Example Rate Design:
Suppose the user has created two rates schedules: E1A and EL1A. E1A applies to non-CARE
customer groups, while EL1A applies only to the CARE customer group. E1A has two energy
rate components 𝑟1and 𝑟2 and a customer charge component 𝑐. EL1A has two energy rate
components 𝑟1′and 𝑟2
′. Since there are five rate components, the user must enter five
equations:
(1) 𝑟2 = 1.25𝑟1
(2) 𝑐 = 10
(3) 𝑟2′ = 1.1𝑟1
′
(4) 𝐸𝐿1𝐴_𝐶𝐴𝑅𝐸_𝑟𝑒𝑣 = 0.65 𝐸1𝐴_𝐶𝐴𝑅𝐸_𝑟𝑒𝑣
(5) 𝐸1𝐴_𝑛𝑜𝑛𝐶𝐴𝑅𝐸_𝑟𝑒𝑣 + 𝐸𝐿1𝐴_𝐶𝐴𝑅𝐸_𝑟𝑒𝑣 = 𝑅𝑅𝑄
Note that equation (4) is the Public Utility Code Statute 739.1 that states that “the average
effective CARE discount shall not be less than 30 percent or more than 35 percent of the
revenues that would have been produced for the same billed usage by non-CARE customers.”
• Step 4 (Solve for Rates): In this step, the tool takes all the information from steps 1 and 3 and
solves for the rates. In the process of solving for the rates, the tool will make use of the cached
bill determinants for each customer group and rate schedule combination. The tool will then
take the rate design equations and call the appropriate numerical solver to solve the system of
equations. It is expected that the majority of rate designs will be a linear system of equations,
although a nonlinear system of equations is possible, for example if the user specifies a
monthly or annual minimum bill.
• Step 5 (Calculate Rate Evaluation Metrics): In this step, the tool calculates bill impact, bill
volatility and energy burden metrics. The inputs for this step are the bills calculated from step
4 and customer demographic information. The tool will also generate charts to visually display
the results.
EPIC Final Report | 2.36 Rate Design Tool
Internal
11
4.1.3 Rate Design Modules
The following modules of the rate design tool were developed using Python programming language
and leveraged the distributed parallel processing capability using PySpark library.
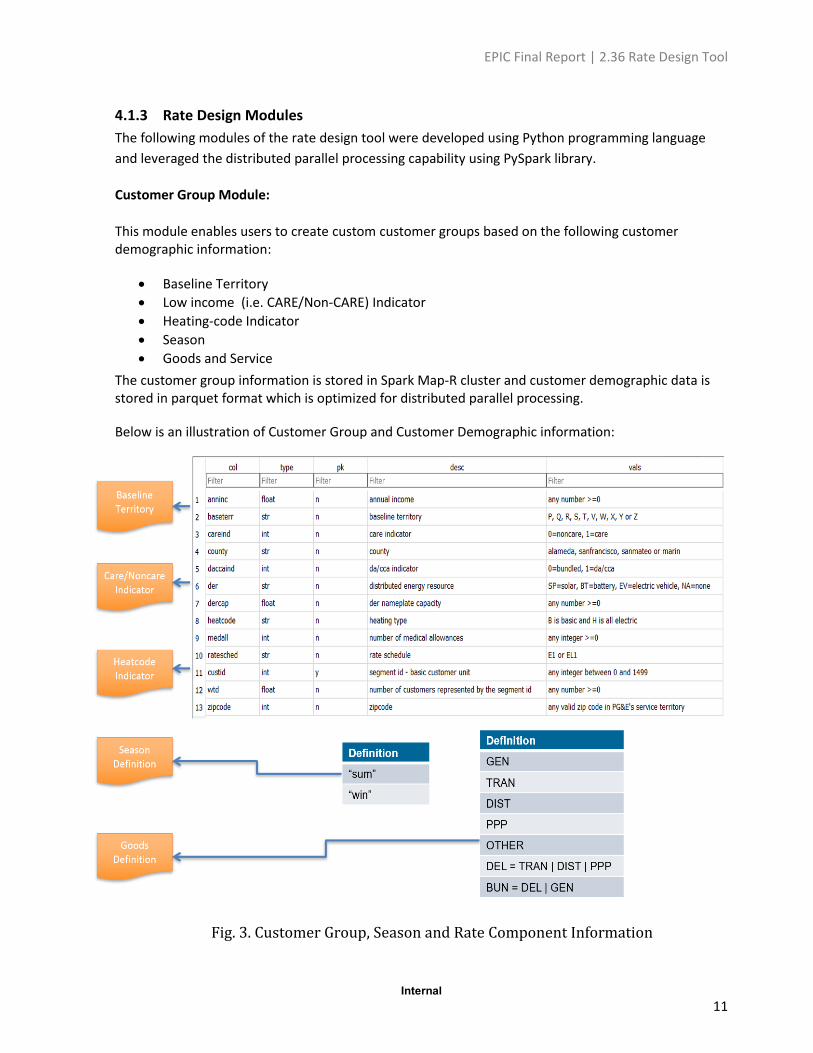
Customer Group Module:
This module enables users to create custom customer groups based on the following customer demographic information:
• Baseline Territory
• Low income (i.e. CARE/Non-CARE) Indicator
• Heating-code Indicator
• Season
• Goods and Service
The customer group information is stored in Spark Map-R cluster and customer demographic data is stored in parquet format which is optimized for distributed parallel processing.
Below is an illustration of Customer Group and Customer Demographic information:
Fig. 3. Customer Group, Season and Rate Component Information
EPIC Final Report | 2.36 Rate Design Tool
Internal
12
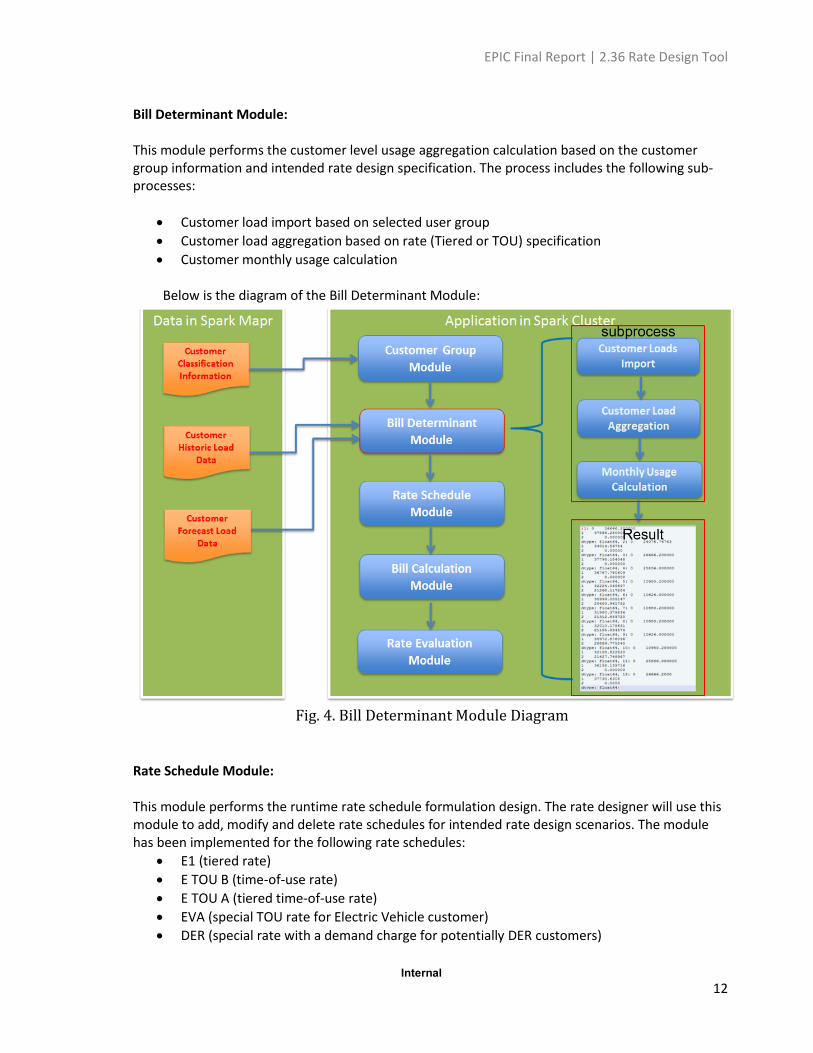
Bill Determinant Module: This module performs the customer level usage aggregation calculation based on the customer group information and intended rate design specification. The process includes the following sub-processes:
• Customer load import based on selected user group
• Customer load aggregation based on rate (Tiered or TOU) specification
• Customer monthly usage calculation Below is the diagram of the Bill Determinant Module:
Fig. 4. Bill Determinant Module Diagram
Rate Schedule Module: This module performs the runtime rate schedule formulation design. The rate designer will use this module to add, modify and delete rate schedules for intended rate design scenarios. The module has been implemented for the following rate schedules:
• E1 (tiered rate)
• E TOU B (time-of-use rate)
• E TOU A (tiered time-of-use rate)
• EVA (special TOU rate for Electric Vehicle customer)
• DER (special rate with a demand charge for potentially DER customers)
EPIC Final Report | 2.36 Rate Design Tool
Internal
13
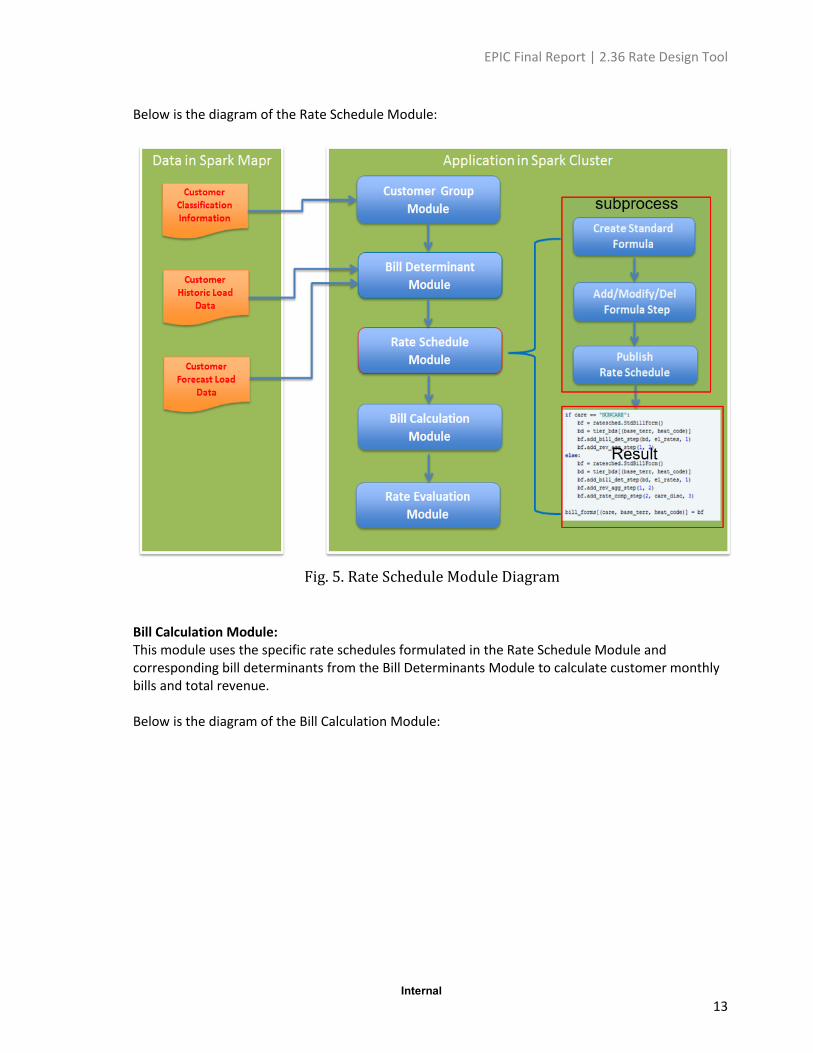
Below is the diagram of the Rate Schedule Module:
Fig. 5. Rate Schedule Module Diagram
Bill Calculation Module: This module uses the specific rate schedules formulated in the Rate Schedule Module and corresponding bill determinants from the Bill Determinants Module to calculate customer monthly bills and total revenue. Below is the diagram of the Bill Calculation Module:
EPIC Final Report | 2.36 Rate Design Tool
Internal
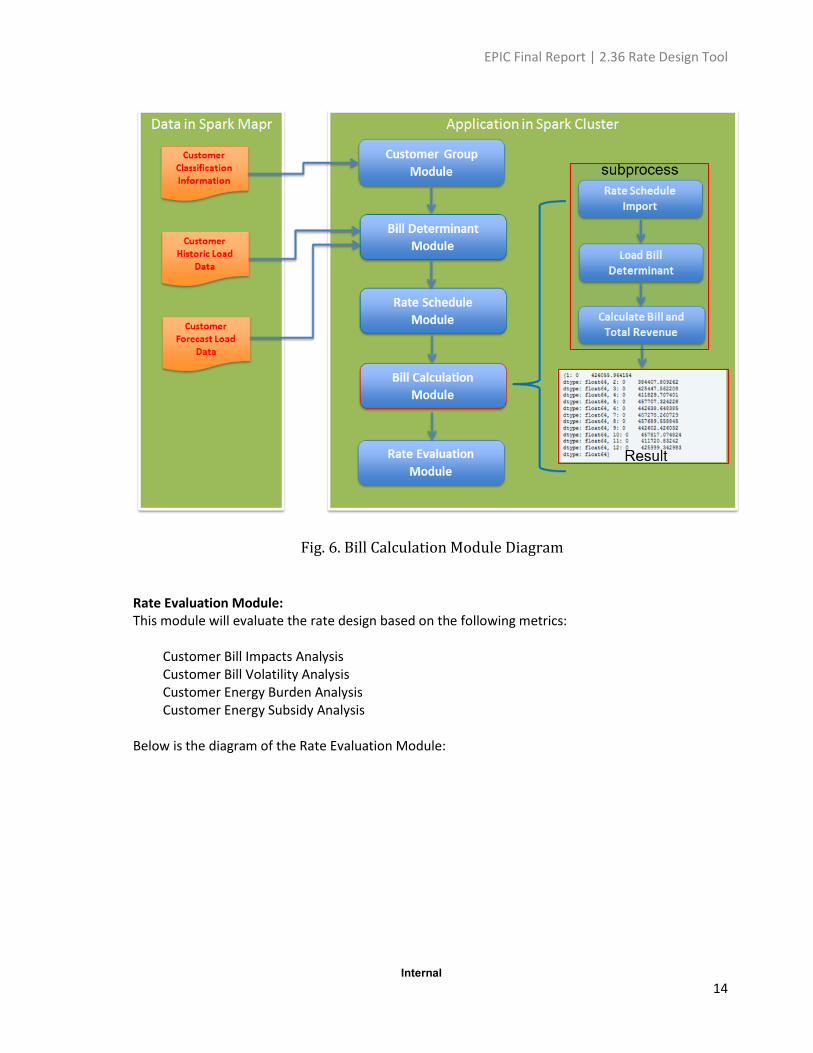
14
Fig. 6. Bill Calculation Module Diagram Rate Evaluation Module: This module will evaluate the rate design based on the following metrics: Customer Bill Impacts Analysis Customer Bill Volatility Analysis Customer Energy Burden Analysis Customer Energy Subsidy Analysis Below is the diagram of the Rate Evaluation Module:
EPIC Final Report | 2.36 Rate Design Tool
Internal
15
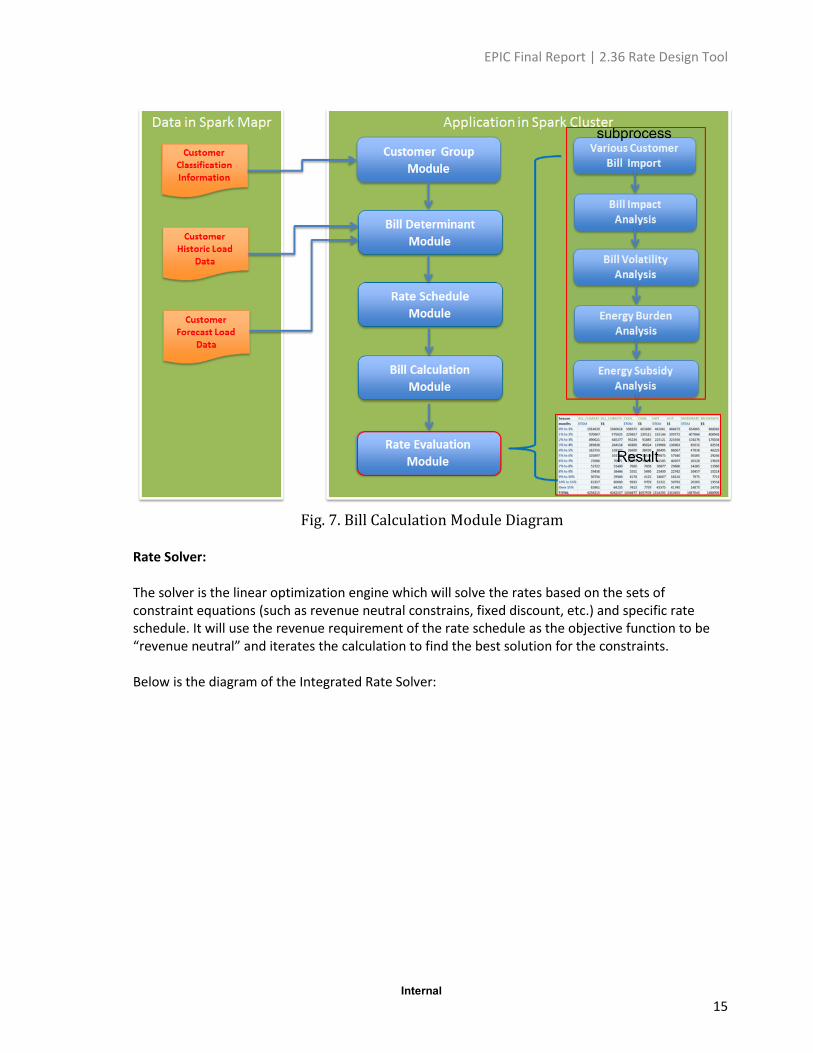
Fig. 7. Bill Calculation Module Diagram
Rate Solver: The solver is the linear optimization engine which will solve the rates based on the sets of constraint equations (such as revenue neutral constrains, fixed discount, etc.) and specific rate schedule. It will use the revenue requirement of the rate schedule as the objective function to be “revenue neutral” and iterates the calculation to find the best solution for the constraints. Below is the diagram of the Integrated Rate Solver:
EPIC Final Report | 2.36 Rate Design Tool
Internal
16
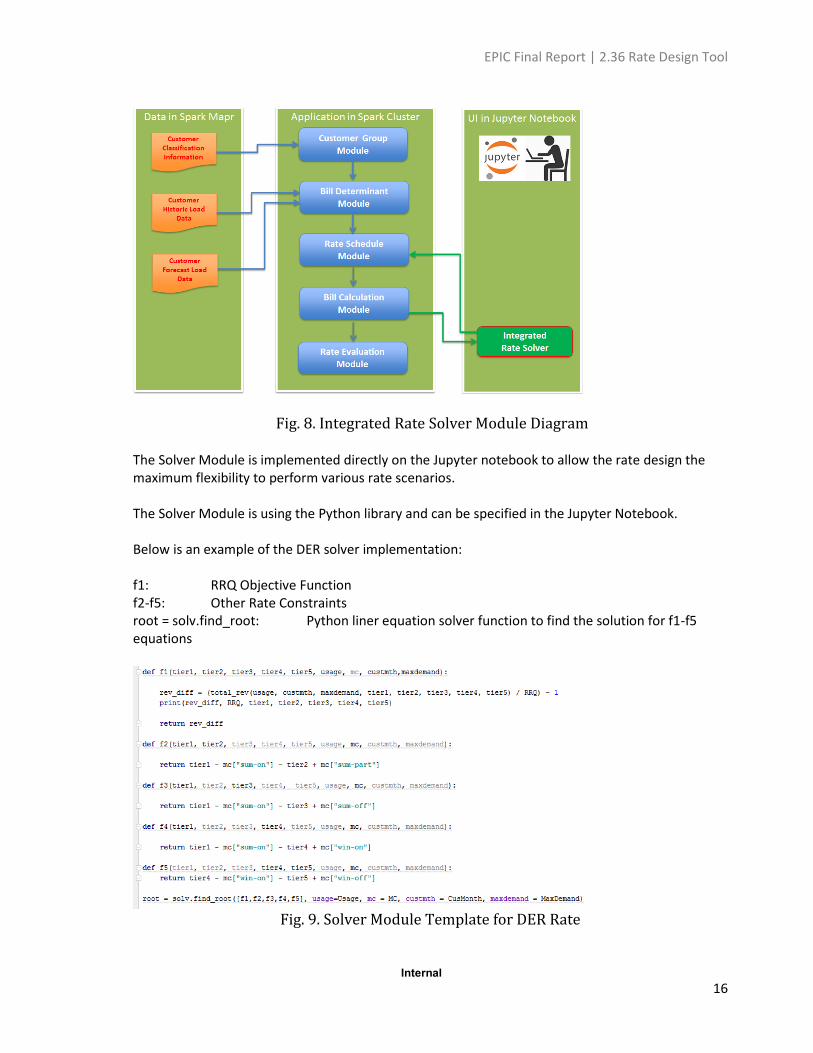
Fig. 8. Integrated Rate Solver Module Diagram The Solver Module is implemented directly on the Jupyter notebook to allow the rate design the maximum flexibility to perform various rate scenarios. The Solver Module is using the Python library and can be specified in the Jupyter Notebook. Below is an example of the DER solver implementation: f1: RRQ Objective Function f2-f5: Other Rate Constraints root = solv.find_root: Python liner equation solver function to find the solution for f1-f5 equations
Fig. 9. Solver Module Template for DER Rate
EPIC Final Report | 2.36 Rate Design Tool
Internal
17
4.2 Results and Observations
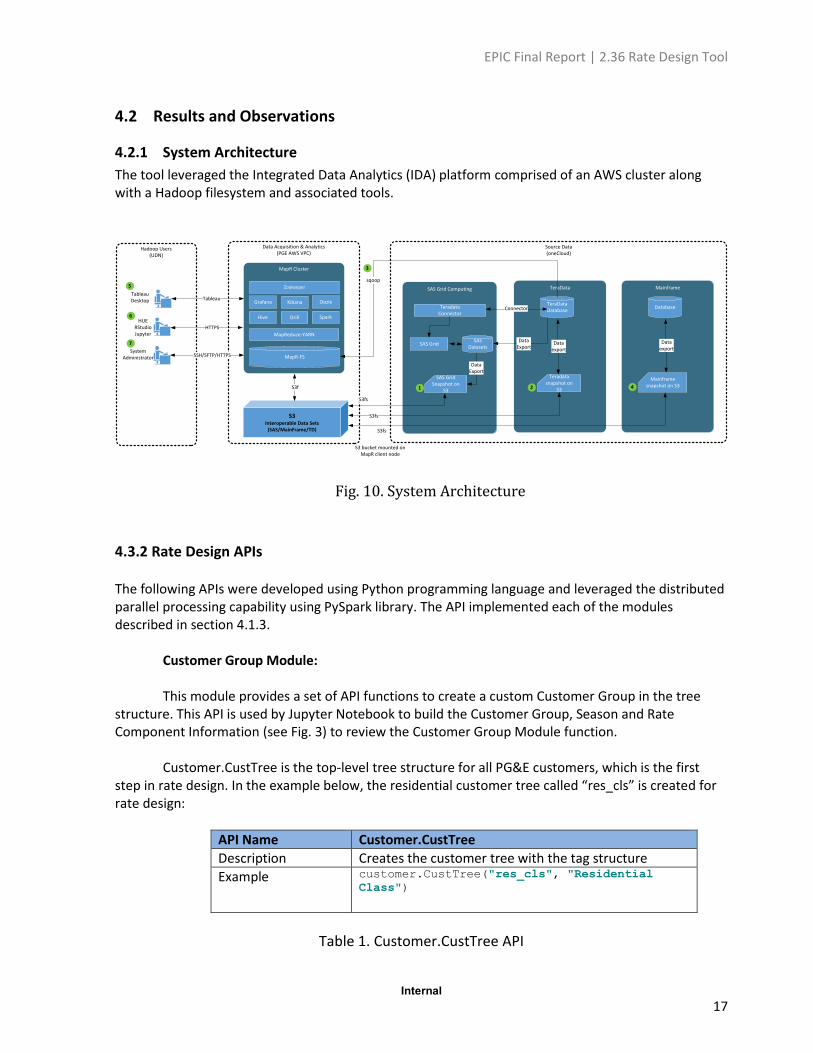
4.2.1 System Architecture
The tool leveraged the Integrated Data Analytics (IDA) platform comprised of an AWS cluster along with a Hadoop filesystem and associated tools.
Fig. 10. System Architecture
4.3.2 Rate Design APIs
The following APIs were developed using Python programming language and leveraged the distributed parallel processing capability using PySpark library. The API implemented each of the modules described in section 4.1.3. Customer Group Module: This module provides a set of API functions to create a custom Customer Group in the tree structure. This API is used by Jupyter Notebook to build the Customer Group, Season and Rate Component Information (see Fig. 3) to review the Customer Group Module function. Customer.CustTree is the top-level tree structure for all PG&E customers, which is the first step in rate design. In the example below, the residential customer tree called “res_cls” is created for rate design:
API Name Customer.CustTree
Description Creates the customer tree with the tag structure
Example customer.CustTree("res_cls", "Residential
Class")
Table 1. Customer.CustTree API
HUERStudioJupyter
Hadoop Users(UDN)
Data Acquisition & Analytics(PGE AWS VPC)
Source Data(oneCloud)
TableauDesktop
MapR Cluster
MapR-FS
S3Interoperable Data Sets
(SAS/MainFrame/TD)
S3f
Grafana Kibana Oozie
Hive Drill Spark
SAS Grid Computing TeraData
TeradataConnector
SASDatasets
TeraDataDatabase
Teradata snapshot on
S3
Connector
SAS GridSnapshot on
S3
Zookeeper
Tableau
Dataexport
SAS Grid
MapReduce-YARN
DataExport
DataExport
1 2
3
HTTPS
SystemAdministrator SSH/SFTP/HTTPS
5
6
7
S3 bucket mounted on MapR client node
S3fs
Mainframe
Database
Mainframe snapshot on S3
Dataexport
4
S3fs
S3fs
sqoop
EPIC Final Report | 2.36 Rate Design Tool
Internal
18
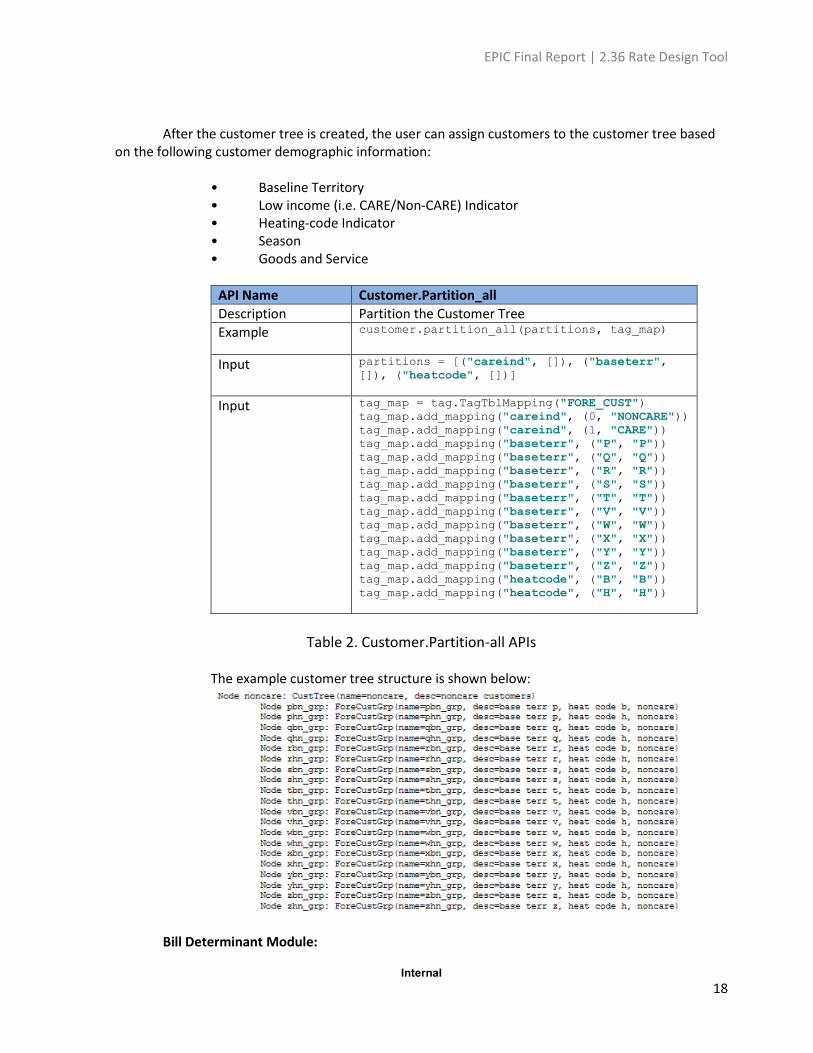
After the customer tree is created, the user can assign customers to the customer tree based
on the following customer demographic information:
• Baseline Territory • Low income (i.e. CARE/Non-CARE) Indicator • Heating-code Indicator • Season • Goods and Service
API Name Customer.Partition_all
Description Partition the Customer Tree
Example customer.partition_all(partitions, tag_map)
Input partitions = [("careind", []), ("baseterr",
[]), ("heatcode", [])]
Input tag_map = tag.TagTblMapping("FORE_CUST")
tag_map.add_mapping("careind", (0, "NONCARE"))
tag_map.add_mapping("careind", (1, "CARE"))
tag_map.add_mapping("baseterr", ("P", "P"))
tag_map.add_mapping("baseterr", ("Q", "Q"))
tag_map.add_mapping("baseterr", ("R", "R"))
tag_map.add_mapping("baseterr", ("S", "S"))
tag_map.add_mapping("baseterr", ("T", "T"))
tag_map.add_mapping("baseterr", ("V", "V"))
tag_map.add_mapping("baseterr", ("W", "W"))
tag_map.add_mapping("baseterr", ("X", "X"))
tag_map.add_mapping("baseterr", ("Y", "Y"))
tag_map.add_mapping("baseterr", ("Z", "Z"))
tag_map.add_mapping("heatcode", ("B", "B"))
tag_map.add_mapping("heatcode", ("H", "H"))
Table 2. Customer.Partition-all APIs
The example customer tree structure is shown below:
Bill Determinant Module:
EPIC Final Report | 2.36 Rate Design Tool
Internal
19
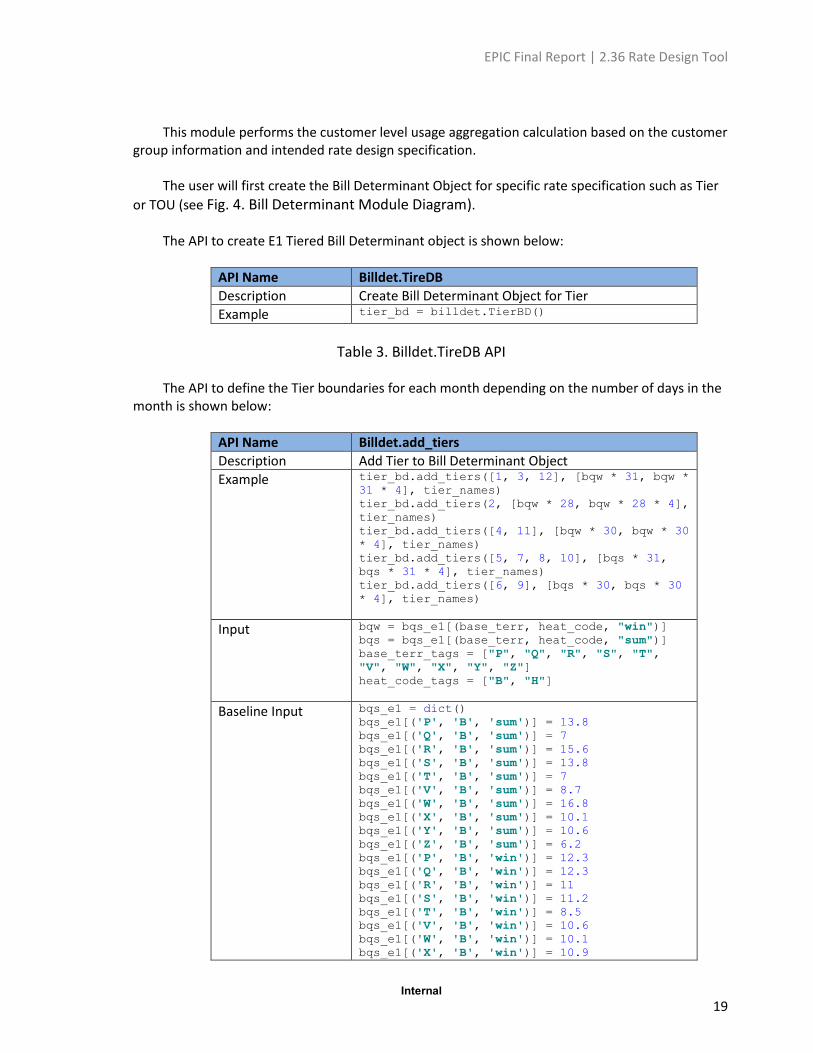
This module performs the customer level usage aggregation calculation based on the customer group information and intended rate design specification. The user will first create the Bill Determinant Object for specific rate specification such as Tier
or TOU (see Fig. 4. Bill Determinant Module Diagram). The API to create E1 Tiered Bill Determinant object is shown below:
API Name Billdet.TireDB
Description Create Bill Determinant Object for Tier
Example tier_bd = billdet.TierBD()
Table 3. Billdet.TireDB API
The API to define the Tier boundaries for each month depending on the number of days in the month is shown below:
API Name Billdet.add_tiers
Description Add Tier to Bill Determinant Object
Example tier_bd.add_tiers([1, 3, 12], [bqw * 31, bqw *
31 * 4], tier_names)
tier_bd.add_tiers(2, [bqw * 28, bqw * 28 * 4],
tier_names)
tier_bd.add_tiers([4, 11], [bqw * 30, bqw * 30
* 4], tier_names)
tier_bd.add_tiers([5, 7, 8, 10], [bqs * 31,
bqs * 31 * 4], tier_names)
tier_bd.add_tiers([6, 9], [bqs * 30, bqs * 30
* 4], tier_names)
Input bqw = bqs_e1[(base_terr, heat_code, "win")]
bqs = bqs_e1[(base_terr, heat_code, "sum")]
base_terr_tags = ["P", "Q", "R", "S", "T",
"V", "W", "X", "Y", "Z"]
heat_code_tags = ["B", "H"]
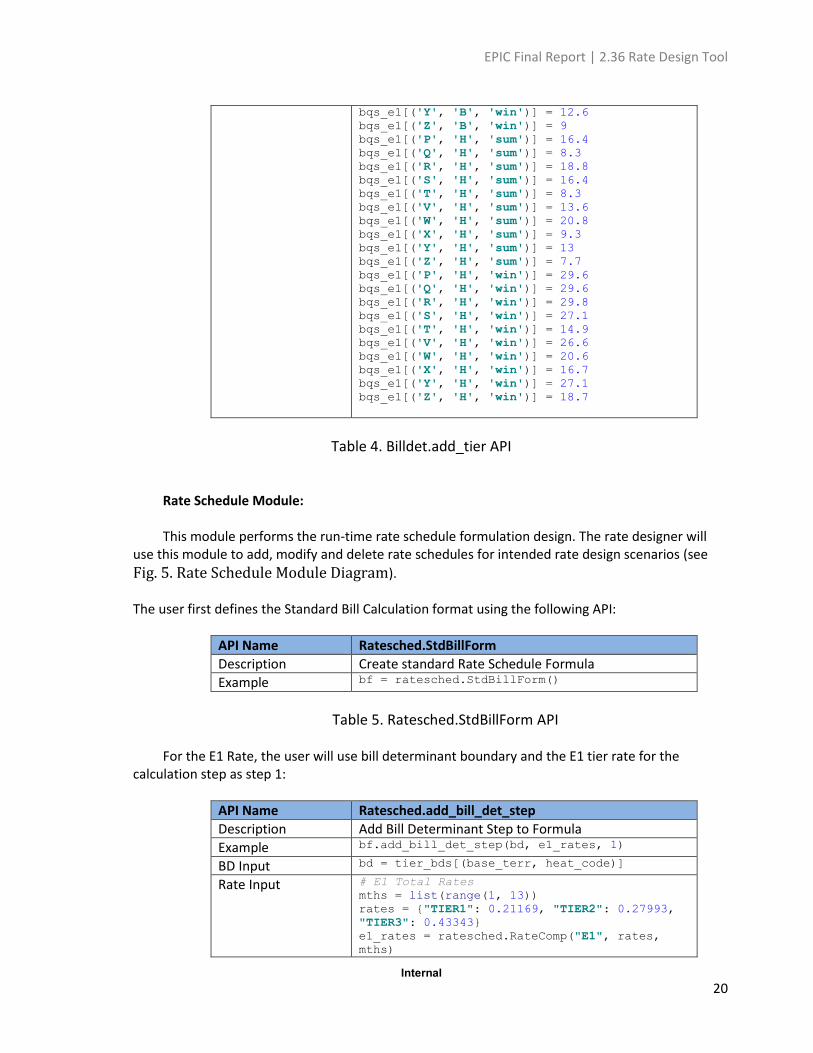
Baseline Input bqs_e1 = dict()
bqs_e1[('P', 'B', 'sum')] = 13.8
bqs_e1[('Q', 'B', 'sum')] = 7
bqs_e1[('R', 'B', 'sum')] = 15.6
bqs_e1[('S', 'B', 'sum')] = 13.8
bqs_e1[('T', 'B', 'sum')] = 7
bqs_e1[('V', 'B', 'sum')] = 8.7
bqs_e1[('W', 'B', 'sum')] = 16.8
bqs_e1[('X', 'B', 'sum')] = 10.1
bqs_e1[('Y', 'B', 'sum')] = 10.6
bqs_e1[('Z', 'B', 'sum')] = 6.2
bqs_e1[('P', 'B', 'win')] = 12.3
bqs_e1[('Q', 'B', 'win')] = 12.3
bqs_e1[('R', 'B', 'win')] = 11
bqs_e1[('S', 'B', 'win')] = 11.2
bqs_e1[('T', 'B', 'win')] = 8.5
bqs_e1[('V', 'B', 'win')] = 10.6
bqs_e1[('W', 'B', 'win')] = 10.1
bqs_e1[('X', 'B', 'win')] = 10.9
EPIC Final Report | 2.36 Rate Design Tool
Internal
20
bqs_e1[('Y', 'B', 'win')] = 12.6
bqs_e1[('Z', 'B', 'win')] = 9
bqs_e1[('P', 'H', 'sum')] = 16.4
bqs_e1[('Q', 'H', 'sum')] = 8.3
bqs_e1[('R', 'H', 'sum')] = 18.8
bqs_e1[('S', 'H', 'sum')] = 16.4
bqs_e1[('T', 'H', 'sum')] = 8.3
bqs_e1[('V', 'H', 'sum')] = 13.6
bqs_e1[('W', 'H', 'sum')] = 20.8
bqs_e1[('X', 'H', 'sum')] = 9.3
bqs_e1[('Y', 'H', 'sum')] = 13
bqs_e1[('Z', 'H', 'sum')] = 7.7
bqs_e1[('P', 'H', 'win')] = 29.6
bqs_e1[('Q', 'H', 'win')] = 29.6
bqs_e1[('R', 'H', 'win')] = 29.8
bqs_e1[('S', 'H', 'win')] = 27.1
bqs_e1[('T', 'H', 'win')] = 14.9
bqs_e1[('V', 'H', 'win')] = 26.6
bqs_e1[('W', 'H', 'win')] = 20.6
bqs_e1[('X', 'H', 'win')] = 16.7
bqs_e1[('Y', 'H', 'win')] = 27.1
bqs_e1[('Z', 'H', 'win')] = 18.7
Table 4. Billdet.add_tier API Rate Schedule Module:
This module performs the run-time rate schedule formulation design. The rate designer will use this module to add, modify and delete rate schedules for intended rate design scenarios (see
Fig. 5. Rate Schedule Module Diagram). The user first defines the Standard Bill Calculation format using the following API:
API Name Ratesched.StdBillForm
Description Create standard Rate Schedule Formula
Example bf = ratesched.StdBillForm()
Table 5. Ratesched.StdBillForm API For the E1 Rate, the user will use bill determinant boundary and the E1 tier rate for the
calculation step as step 1:
API Name Ratesched.add_bill_det_step
Description Add Bill Determinant Step to Formula
Example bf.add_bill_det_step(bd, e1_rates, 1)
BD Input bd = tier_bds[(base_terr, heat_code)]
Rate Input # E1 Total Rates
mths = list(range(1, 13))
rates = {"TIER1": 0.21169, "TIER2": 0.27993,
"TIER3": 0.43343}
e1_rates = ratesched.RateComp("E1", rates,
mths)
EPIC Final Report | 2.36 Rate Design Tool
Internal
21
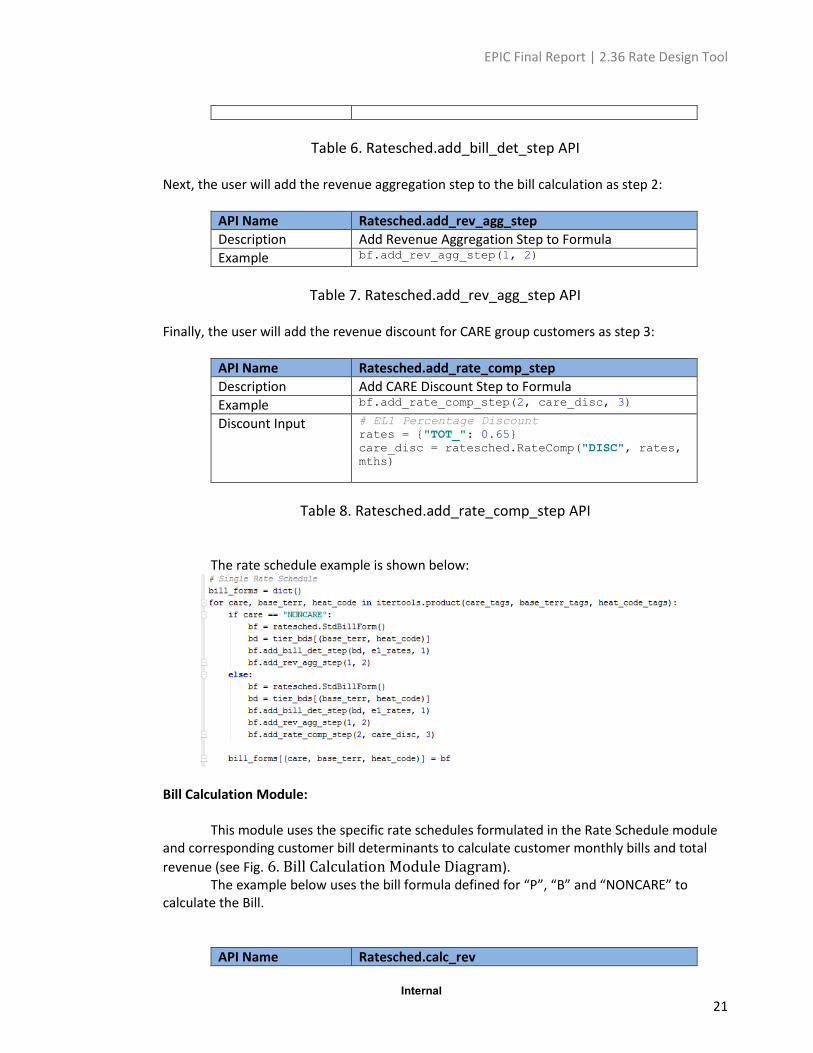
Table 6. Ratesched.add_bill_det_step API
Next, the user will add the revenue aggregation step to the bill calculation as step 2:
API Name Ratesched.add_rev_agg_step
Description Add Revenue Aggregation Step to Formula
Example bf.add_rev_agg_step(1, 2)
Table 7. Ratesched.add_rev_agg_step API Finally, the user will add the revenue discount for CARE group customers as step 3:
API Name Ratesched.add_rate_comp_step
Description Add CARE Discount Step to Formula
Example bf.add_rate_comp_step(2, care_disc, 3)
Discount Input # EL1 Percentage Discount
rates = {"TOT_": 0.65}
care_disc = ratesched.RateComp("DISC", rates,
mths)
Table 8. Ratesched.add_rate_comp_step API
The rate schedule example is shown below:
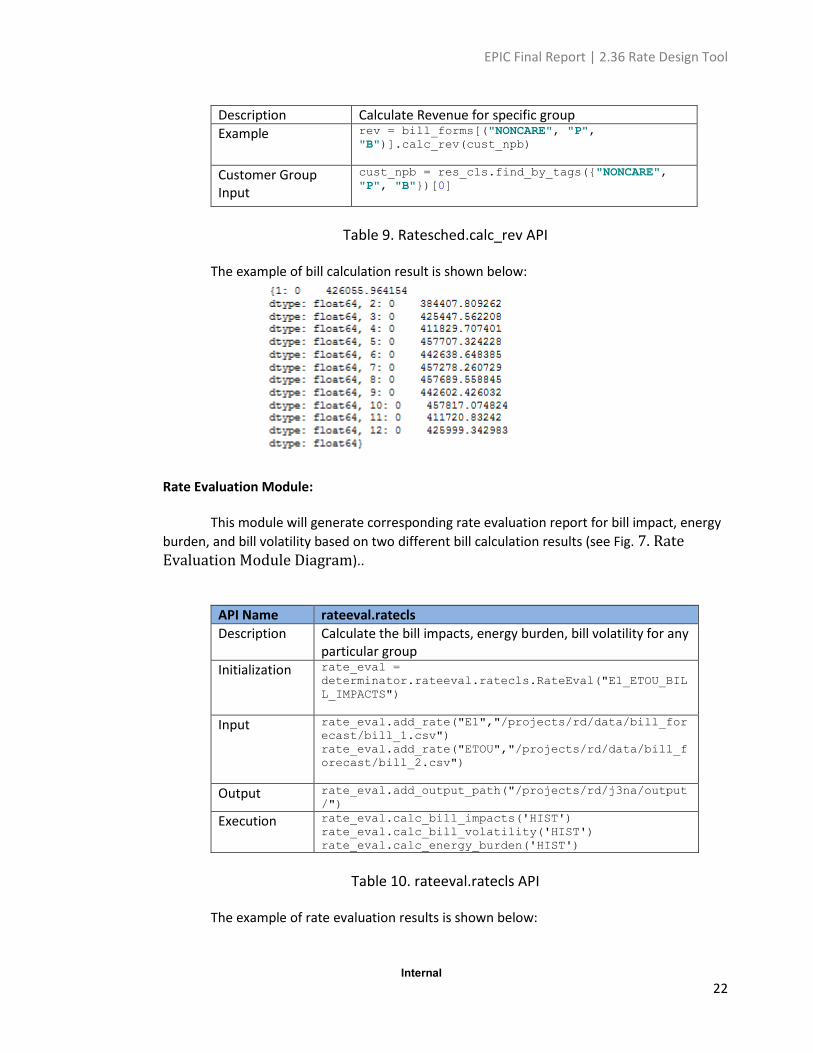
Bill Calculation Module: This module uses the specific rate schedules formulated in the Rate Schedule module and corresponding customer bill determinants to calculate customer monthly bills and total
revenue (see Fig. 6. Bill Calculation Module Diagram). The example below uses the bill formula defined for “P”, “B” and “NONCARE” to calculate the Bill.
API Name Ratesched.calc_rev
EPIC Final Report | 2.36 Rate Design Tool
Internal
22
Description Calculate Revenue for specific group
Example rev = bill_forms[("NONCARE", "P",
"B")].calc_rev(cust_npb)
Customer Group Input
cust_npb = res_cls.find_by_tags({"NONCARE",
"P", "B"})[0]
Table 9. Ratesched.calc_rev API The example of bill calculation result is shown below:
Rate Evaluation Module: This module will generate corresponding rate evaluation report for bill impact, energy
burden, and bill volatility based on two different bill calculation results (see Fig. 7. Rate Evaluation Module Diagram)..
API Name rateeval.ratecls
Description Calculate the bill impacts, energy burden, bill volatility for any particular group
Initialization rate_eval =
determinator.rateeval.ratecls.RateEval("E1_ETOU_BIL
L_IMPACTS")
Input rate_eval.add_rate("E1","/projects/rd/data/bill_for
ecast/bill_1.csv")
rate_eval.add_rate("ETOU","/projects/rd/data/bill_f
orecast/bill_2.csv")
Output rate_eval.add_output_path("/projects/rd/j3na/output
/")
Execution rate_eval.calc_bill_impacts('HIST')
rate_eval.calc_bill_volatility('HIST')
rate_eval.calc_energy_burden('HIST')
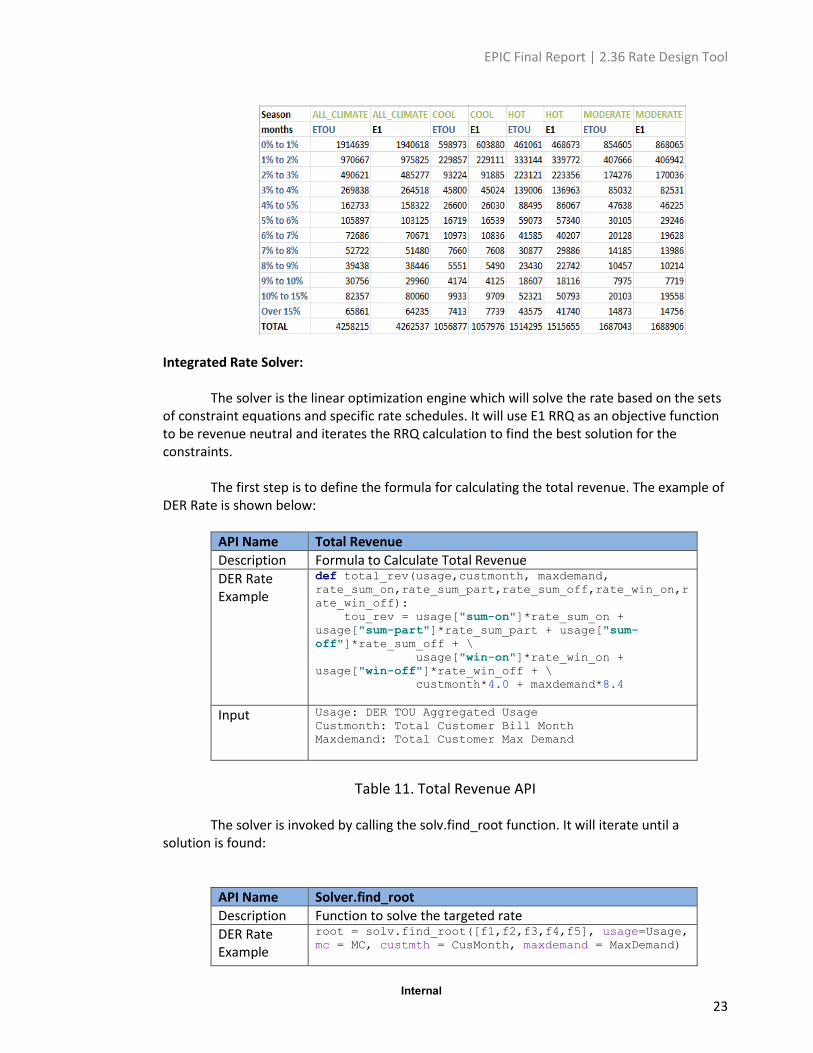
Table 10. rateeval.ratecls API The example of rate evaluation results is shown below:
EPIC Final Report | 2.36 Rate Design Tool
Internal
23
Integrated Rate Solver: The solver is the linear optimization engine which will solve the rate based on the sets of constraint equations and specific rate schedules. It will use E1 RRQ as an objective function to be revenue neutral and iterates the RRQ calculation to find the best solution for the constraints. The first step is to define the formula for calculating the total revenue. The example of DER Rate is shown below:
API Name Total Revenue
Description Formula to Calculate Total Revenue
DER Rate Example
def total_rev(usage,custmonth, maxdemand,
rate_sum_on,rate_sum_part,rate_sum_off,rate_win_on,r
ate_win_off):
tou_rev = usage["sum-on"]*rate_sum_on +
usage["sum-part"]*rate_sum_part + usage["sum-
off"]*rate_sum_off + \
usage["win-on"]*rate_win_on +
usage["win-off"]*rate_win_off + \
custmonth*4.0 + maxdemand*8.4
Input Usage: DER TOU Aggregated Usage
Custmonth: Total Customer Bill Month
Maxdemand: Total Customer Max Demand
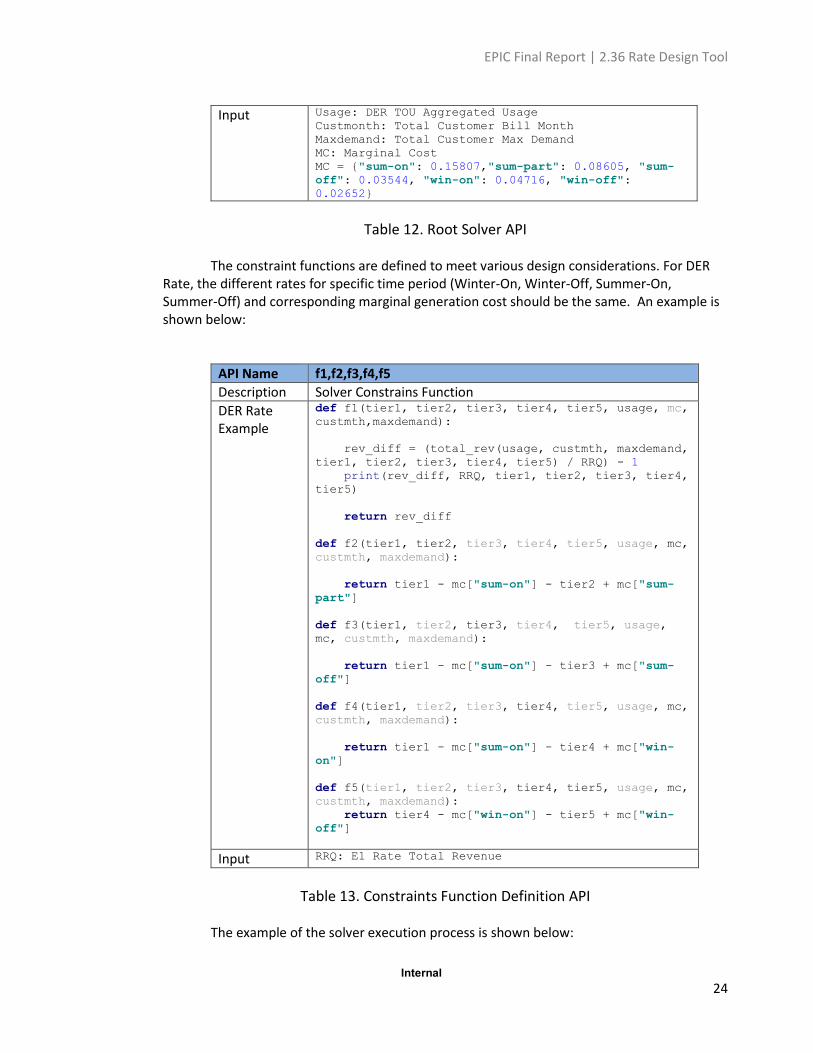
Table 11. Total Revenue API The solver is invoked by calling the solv.find_root function. It will iterate until a solution is found:
API Name Solver.find_root
Description Function to solve the targeted rate
DER Rate Example
root = solv.find_root([f1,f2,f3,f4,f5], usage=Usage,
mc = MC, custmth = CusMonth, maxdemand = MaxDemand)
EPIC Final Report | 2.36 Rate Design Tool
Internal
24
Input Usage: DER TOU Aggregated Usage
Custmonth: Total Customer Bill Month
Maxdemand: Total Customer Max Demand
MC: Marginal Cost
MC = {"sum-on": 0.15807,"sum-part": 0.08605, "sum-
off": 0.03544, "win-on": 0.04716, "win-off":
0.02652}
Table 12. Root Solver API The constraint functions are defined to meet various design considerations. For DER Rate, the different rates for specific time period (Winter-On, Winter-Off, Summer-On, Summer-Off) and corresponding marginal generation cost should be the same. An example is shown below:
API Name f1,f2,f3,f4,f5
Description Solver Constrains Function
DER Rate Example
def f1(tier1, tier2, tier3, tier4, tier5, usage, mc,
custmth,maxdemand):
rev_diff = (total_rev(usage, custmth, maxdemand,
tier1, tier2, tier3, tier4, tier5) / RRQ) - 1
print(rev_diff, RRQ, tier1, tier2, tier3, tier4,
tier5)
return rev_diff
def f2(tier1, tier2, tier3, tier4, tier5, usage, mc,
custmth, maxdemand):
return tier1 - mc["sum-on"] - tier2 + mc["sum-
part"]
def f3(tier1, tier2, tier3, tier4, tier5, usage,
mc, custmth, maxdemand):
return tier1 - mc["sum-on"] - tier3 + mc["sum-
off"]
def f4(tier1, tier2, tier3, tier4, tier5, usage, mc,
custmth, maxdemand):
return tier1 - mc["sum-on"] - tier4 + mc["win-
on"]
def f5(tier1, tier2, tier3, tier4, tier5, usage, mc,
custmth, maxdemand):
return tier4 - mc["win-on"] - tier5 + mc["win-
off"]
Input RRQ: E1 Rate Total Revenue
Table 13. Constraints Function Definition API
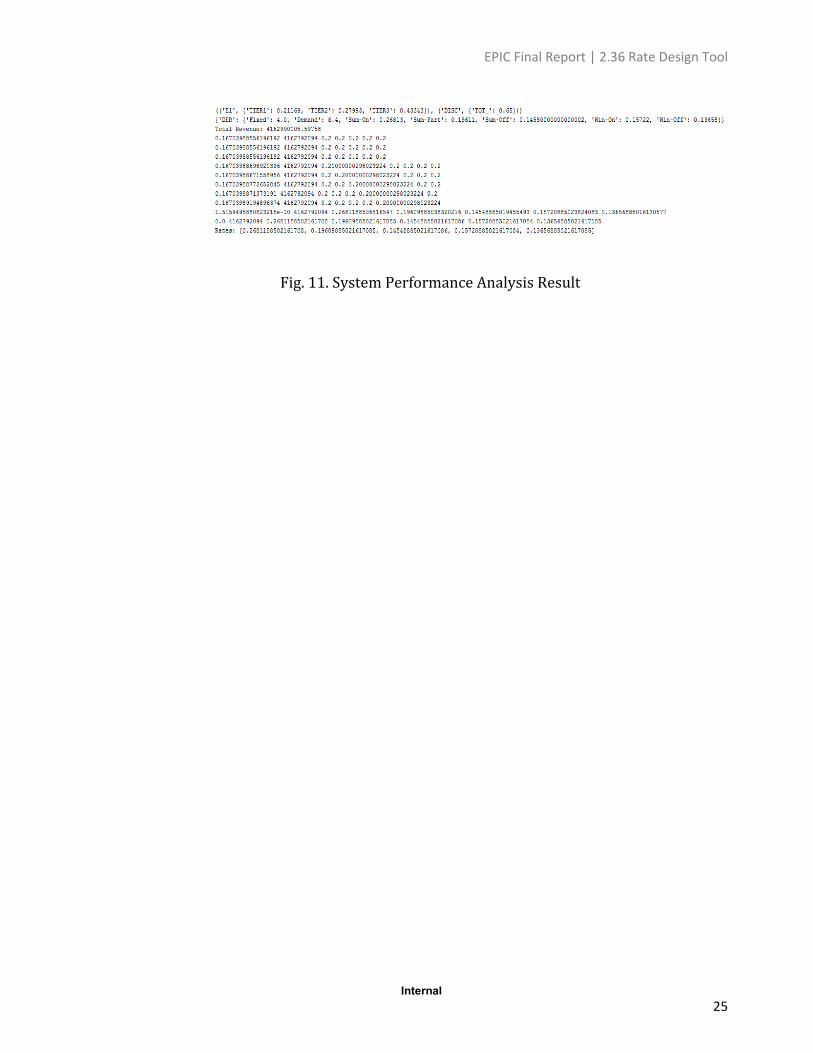
The example of the solver execution process is shown below:
EPIC Final Report | 2.36 Rate Design Tool
Internal
25
Fig. 11. System Performance Analysis Result
EPIC Final Report | 2.36 Rate Design Tool
Internal
26
5 Value proposition
The purpose of EPIC funding is to support investments in technology demonstration and deployment projects that benefit the electricity customers of PG&E, San Diego Gas and Electric (SDG&E), and Southern California Edison (SCE). The Rate Design Tool as demonstrated in this project enables flexible rate design and faster and more efficient processes to experiment and evaluate potentially hundreds of scenarios. The specific benefits are outlined below. • Potential to design experimental rates such as for DER customers.
• Explicit and rigorous evaluations of multiple rate design scenarios so that they can be
quantitatively compared.
• Significant efficiency in running multiple rate design scenarios and evaluating rates using
Advanced Metering Infrastructure (AMI) interval meter data.
• Seamless integration of customer data and rate design framework eliminates dependencies on
data engineers.
• Reduces potential errors, such as from copying and pasting large amounts of customer data
and/or bill determinants, since the tool relies on a single framework for all rate design and
evaluation steps.
• A seamless one stop technology solution eliminates back and forth interactions among
multiple resources and/or teams.
• Reduces internal labor hours as the data intensive processes leverage big data technologies.
Furthermore, the infrastructure required to develop the Rate Design Tool, i.e., the distributed computing platform, may be leveraged to advance existing, production grade rate design models and analytical tools. EPIC 2.36 demonstrated the potential for the following cost benefits:
• Metric 1: Reduction in time to complete the process of designing, optimizing, and analyzing
the impact of an exploratory rate design.
• Metric 2: Increased number of rate design scenarios that can be analyzed and evaluated.
• Metric 3: Overall reduction in internal labor cost as a direct result of the tool.
Additional Metrics:
• Number of proactively addressed data requests as a result of tools capabilities.
• The number and types of hypothetical rate designs a user can create.
• Reduction in time required to respond to data requests.

EPIC Final Report | 2.36 Rate Design Tool
Internal
27
5.1 Primary Principles
The primary principles of EPIC are to invest in technologies and approaches that provide benefits to
electric ratepayers by promoting greater reliability and lower costs. This EPIC project contributes to
these primary principles in the following ways:
• Greater reliability: Reduces errors in the rate design and evaluation processes by eliminating
manual transfer of inputs and outputs.
• Lower costs: Enables employees to run analyses faster. The tool enables employees to be
more efficient and focus more on innovative rate design and evaluation.
5.2 Secondary Principles
EPIC also has a set of complementary secondary principles. This project contributes to the following
secondary principle:
• Efficient use of ratepayer funds: Enables experimental rate designs and potentially evaluate
hundreds of scenarios in a short amount of time.
5.3 Key Accomplishments
The following has been accomplished through this project:
• PG&E built a distributed computing platform leveraging Amazon Web Services (AWS), which
have been deployed in production at the conclusion of this project.
• PG&E extracted residential customers’ characteristics and hourly usage data for one year and
created a database, utilizing big data technologies, that enables the processing of billions of
rows of information in a few hours.
• PG&E built a high-level rate design framework that can enable a faster and easier experimental
rate design process.
• PG&E built high level building blocks for rate design so users can dynamically segment
customers, create bill determinants, design new rate structures and evaluate their bill impacts.
• PG&E built application programming interfaces (API) for users to interact with the above
building blocks to design and evaluate rates at a high level.
These key accomplishments are foundational for the future development of a more fully functional
rate design and evaluation product. At this stage, the tool can design high level experimental tiered,
time-of-use, and tiered time-of-use rates as well as rates with a maximum demand charge. It is
important to note that the milestones that PG&E achieved in support of building the dynamic rate
design tool (e.g., creating the distributed computing platforms, database, and design framework) are
not only proof of concept, but can be leveraged to significantly improve other production-grade tools
for rate and bill analysis that are built on existing technology.
EPIC Final Report | 2.36 Rate Design Tool
Internal
28
5.4 Key Recommendations
The project aligns well with PG&E’s strategy to create more equitable, cost-based rate structures
that minimize cross-subsidies within revenue classes. A fully functional production quality tool can
strengthen policy decisions by designing various experimental rate scenarios and evaluating bill
impact, bill volatility and energy burden for such proposals.
The tool enables rate analysts to create their own rate designs from a list of most commonly used
billing determinants (tiered, time-of-use, monthly demand, fixed charge etc.) as well as user-
defined billing determinants based on customer hourly usage and demographic information.
The Rate Design Tool demonstrated through this project provides access to the rate design APIs
described in section 4.3.2 via Jupyter notebook. The Jupyter notebook is a web-based rapid
application development tool that is generally used by experienced programmers. In order for rate
analysts, who are generally non-programmers, to use this tool as currently built they have to learn
how to use Jupyter notebook but most importantly they have to learn Python to use the rate
design APIs. Therefore, a broader adoption of the tool will rely greatly on improving usability
through the development of a user-friendly graphical user interface (GUI), which can be used by
any rate analyst. The interface must include user authentication capability to enable customer
data privacy.
For the purpose of this demonstration, the project created a back-end customer demographic and
hourly usage databases in AWS clusters and loaded the data from PG&E’s customer data and
analytics systems. An automated interface to periodically refresh the databases will greatly
improve efficiency and applicability of the tool.
5.5 Technology transfer plan
5.5.1 Production Deployment
As part of this EPIC project, PG&E leveraged big data technologies in an AWS platform to analyze over four million customers characteristics and hourly usage data spanning one year, which is over 40 billion rows (over one terabyte) of information. PG&E has deployed the AWS platform and corresponding technologies for use to support regulatory proceedings. PG&E has also deployed customer database and customers’ hourly usage database in the AWS platform at the conclusion of the project to support regulatory proceedings. PG&E has installed the rate design and rate evaluation tool as built in this project for high level experimental rate design. It requires an IT programmer to run and produce results given a clear set of requirements for rate design and evaluation.
EPIC Final Report | 2.36 Rate Design Tool
Internal
29
5.5.2 IOU’s technology transfer plans
A primary benefit of the EPIC program is the technology and knowledge sharing that occurs both
internally within PG&E, and across the other CA IOUs, the CEC and the industry. In order to
facilitate this knowledge sharing, PG&E shared some of the analysis and demonstrated the product
as follows. PG&E will publish a public report in its website as required in EPIC program. Specifically,
below are information sharing forums where the results and lessons learned from this EPIC project
have been presented to date:
Information Sharing Forums Held
• Rutgers Center for Research in Regulated Industries 31st Annual Western Conference
− Rutgers University New Jersey 6/28/18
• Market Credit and Risk
− PG&E San Francisco 8/30/18
• PG&E Data Users Community of Practice
− PG&E San Francisco 9/18/18
• IT Electric and Gas Planning Strategy
− PG&E San Francisco 10/5/18
• Energy Policy & Planning
− PG&E San Francisco 10/10/18
• Demo for PG&E Electric Rates Team
− PG&E Electric Rates Team 12/6/2018
5.5.3 Adaptability to other Utilities and Industry
For utilities and regulators to be prepared for expected substantial growth in DER and other technology penetration, there is a need for the capability to effectively model the interaction between technology adoption and rates. This tool may help improve that understanding, especially in relation to en masse bill impact assessment automation, enabled rate schedule experimentation, and technology adoption scenario impact modeling with additional investment as concluded later in this document.
5.6 Data Access
Upon request, PG&E will submit data from user acceptance testing that is consistent with the CPUC's data access requirements for EPIC data and results.
6 Metrics
The following metrics were identified for this project and included in PG&E’s EPIC Annual Report as potential metrics to measure project benefits at full scale.7 Given the proof of concept nature of this EPIC project, these metrics are forward looking.
7 PG&E EPIC 2018 Annual Report. Submitted Feb 28, 2018. https://www.pge.com/pge_global/common/pdfs/about-pge/environment/what-we-are-doing/electric-program-investment-charge/2018-EPIC-Annual-Report.pdf

EPIC Final Report | 2.36 Rate Design Tool
Internal
30
D.13-11-025, Attachment 4. List of Proposed Metrics and Potential Areas of
Measurement (as applicable to a specific project or investment area) Reference
3. Economic benefits
Time to complete the process of designing, optimizing, and analyzing the impact of a
hypothetical rate design 1.3
7 Conclusion
This report documented the achievements, highlights, and key learnings of EPIC 2.36 – Dynamic Rate
Design Tool. The key components of a Dynamic Rate Design Tool were successfully demonstrated,
laying the groundwork to enable PG&E to improve rate design capabilities in the future.
Rate design for regulatory proceedings and implementation in tariffs is based on numerous niche
policies, rules, and principles which are often conflicting and constantly evolving. While this tool
cannot be a replacement for PG&E’s operational rate design models used in rate cases, PG&E
concluded that big data technologies can provide a one-stop solution to build experimental rate design
and evaluation models, back-end customer databases, as well as front-end user interfaces. This
provides a consistent and cohesive approach for designing, developing, and deploying complex yet
flexible applications that are also easy to maintain in the future.
PG&E demonstrated five distinct rate designs in this project. This demonstrates that a fully functional
product using this framework can potentially model hundreds of rate design scenarios in a limited
amount of time and effectively assess impacts to utility customers.
PG&E concluded that development of a fully functional, flexible and robust product will require
significant multi-year investment. In addition to the rate design and evaluation functions, the product
needs to improve its usability through the development of a custom graphical user interface for input
and output and integration with utilities’ existing customer information and analytics systems.
EPIC Final Report | 2.36 Rate Design Tool
Internal
31
8 Appendix A – Technical Information Data Dictionary
The following is a data dictionary for the various modules of the Rate Design Tool.
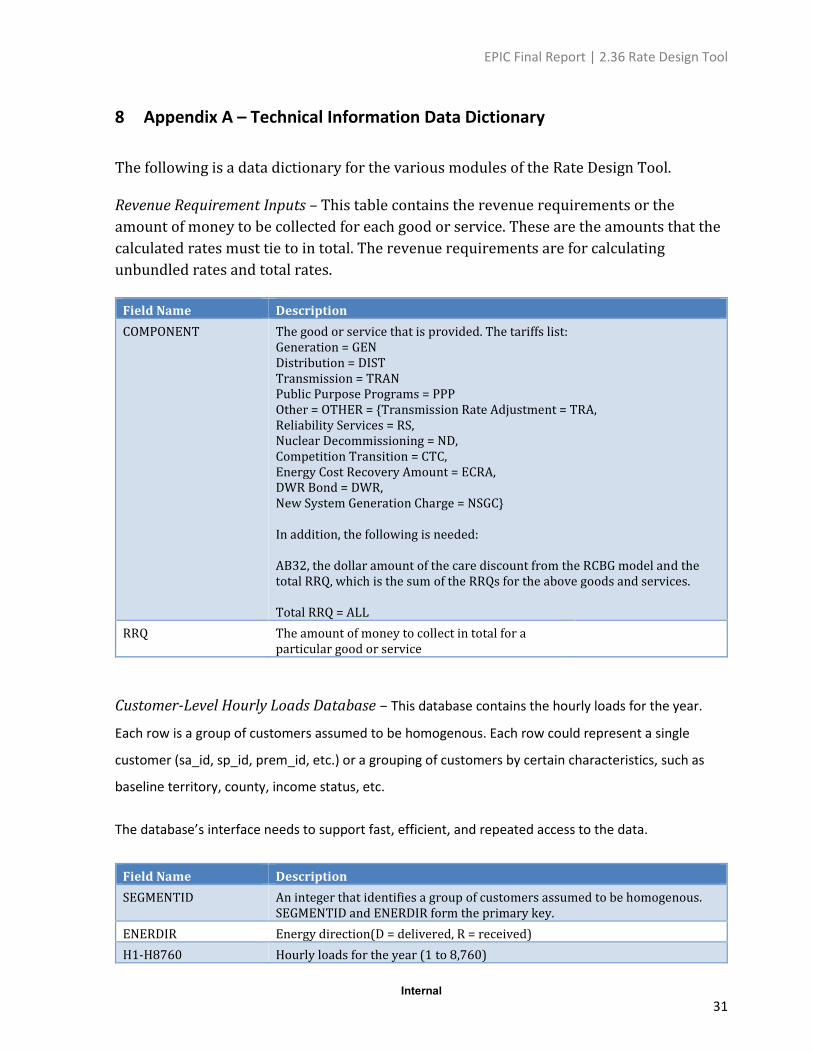
Revenue Requirement Inputs – This table contains the revenue requirements or the
amount of money to be collected for each good or service. These are the amounts that the
calculated rates must tie to in total. The revenue requirements are for calculating
unbundled rates and total rates.
Field Name Description
COMPONENT The good or service that is provided. The tariffs list: Generation = GEN Distribution = DIST Transmission = TRAN Public Purpose Programs = PPP Other = OTHER = {Transmission Rate Adjustment = TRA, Reliability Services = RS, Nuclear Decommissioning = ND, Competition Transition = CTC, Energy Cost Recovery Amount = ECRA, DWR Bond = DWR, New System Generation Charge = NSGC} In addition, the following is needed: AB32, the dollar amount of the care discount from the RCBG model and the total RRQ, which is the sum of the RRQs for the above goods and services. Total RRQ = ALL
RRQ The amount of money to collect in total for a particular good or service
Customer-Level Hourly Loads Database – This database contains the hourly loads for the year.
Each row is a group of customers assumed to be homogenous. Each row could represent a single
customer (sa_id, sp_id, prem_id, etc.) or a grouping of customers by certain characteristics, such as
baseline territory, county, income status, etc.
The database’s interface needs to support fast, efficient, and repeated access to the data.
Field Name Description
SEGMENTID An integer that identifies a group of customers assumed to be homogenous. SEGMENTID and ENERDIR form the primary key.
ENERDIR Energy direction(D = delivered, R = received)
H1-H8760 Hourly loads for the year (1 to 8,760)
EPIC Final Report | 2.36 Rate Design Tool
Internal
32
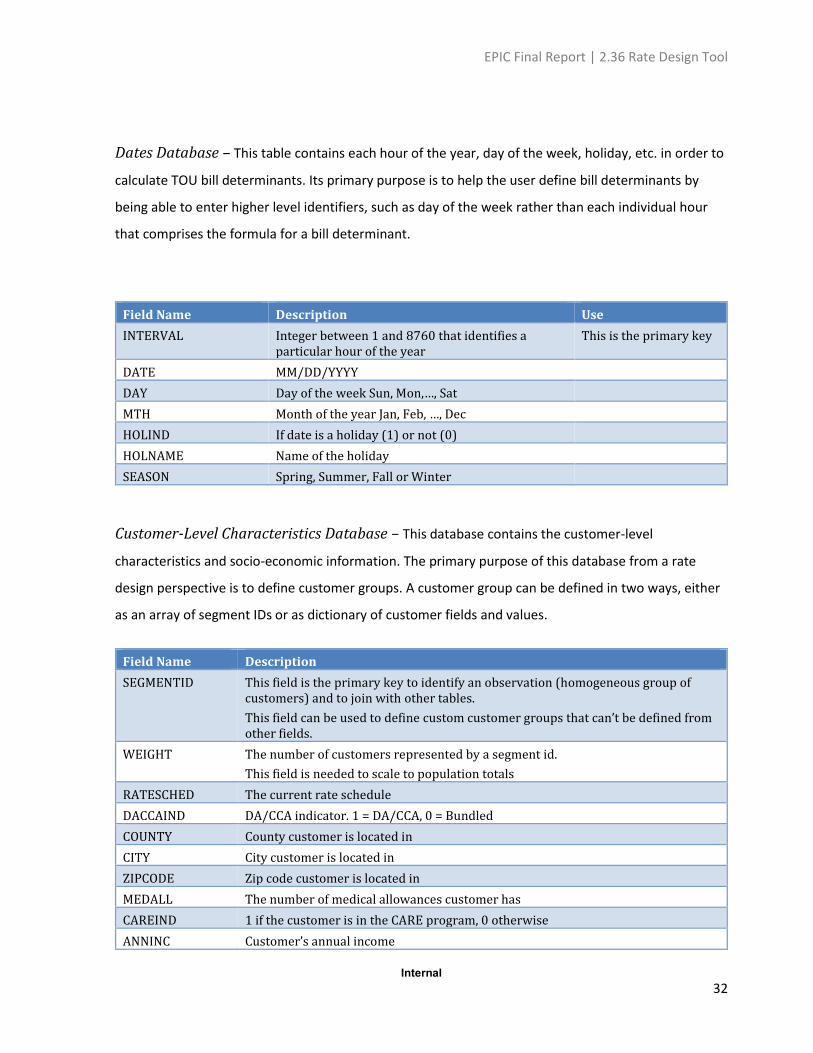
Dates Database – This table contains each hour of the year, day of the week, holiday, etc. in order to
calculate TOU bill determinants. Its primary purpose is to help the user define bill determinants by
being able to enter higher level identifiers, such as day of the week rather than each individual hour
that comprises the formula for a bill determinant.
Field Name Description Use
INTERVAL Integer between 1 and 8760 that identifies a particular hour of the year
This is the primary key
DATE MM/DD/YYYY
DAY Day of the week Sun, Mon,…, Sat
MTH Month of the year Jan, Feb, …, Dec
HOLIND If date is a holiday (1) or not (0)
HOLNAME Name of the holiday
SEASON Spring, Summer, Fall or Winter
Customer-Level Characteristics Database – This database contains the customer-level
characteristics and socio-economic information. The primary purpose of this database from a rate
design perspective is to define customer groups. A customer group can be defined in two ways, either
as an array of segment IDs or as dictionary of customer fields and values.
Field Name Description
SEGMENTID This field is the primary key to identify an observation (homogeneous group of customers) and to join with other tables.
This field can be used to define custom customer groups that can’t be defined from other fields.
WEIGHT The number of customers represented by a segment id.
This field is needed to scale to population totals
RATESCHED The current rate schedule
DACCAIND DA/CCA indicator. 1 = DA/CCA, 0 = Bundled
COUNTY County customer is located in
CITY City customer is located in
ZIPCODE Zip code customer is located in
MEDALL The number of medical allowances customer has
CAREIND 1 if the customer is in the CARE program, 0 otherwise
ANNINC Customer’s annual income
EPIC Final Report | 2.36 Rate Design Tool
Internal
33
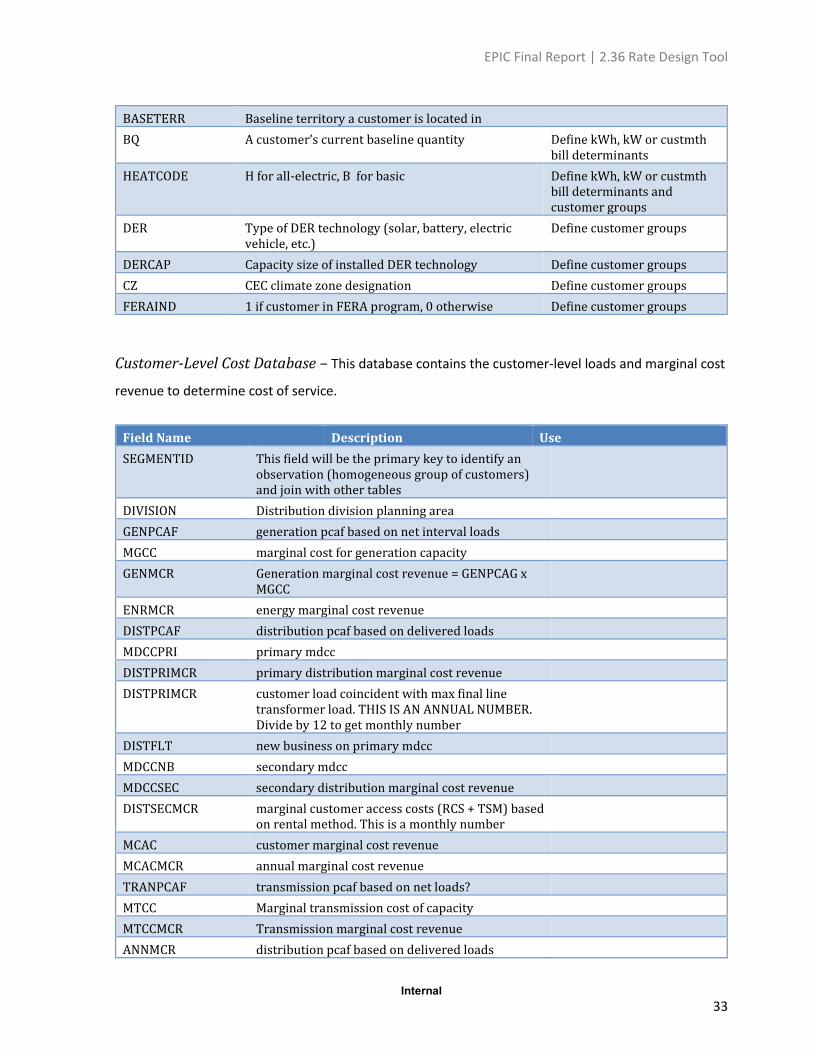
BASETERR Baseline territory a customer is located in
BQ A customer’s current baseline quantity Define kWh, kW or custmth bill determinants
HEATCODE H for all-electric, B for basic Define kWh, kW or custmth bill determinants and customer groups
DER Type of DER technology (solar, battery, electric vehicle, etc.)
Define customer groups
DERCAP Capacity size of installed DER technology Define customer groups
CZ CEC climate zone designation Define customer groups
FERAIND 1 if customer in FERA program, 0 otherwise Define customer groups
Customer-Level Cost Database – This database contains the customer-level loads and marginal cost
revenue to determine cost of service.
Field Name Description Use
SEGMENTID This field will be the primary key to identify an observation (homogeneous group of customers) and join with other tables
DIVISION Distribution division planning area
GENPCAF generation pcaf based on net interval loads
MGCC marginal cost for generation capacity
GENMCR Generation marginal cost revenue = GENPCAG x MGCC
ENRMCR energy marginal cost revenue
DISTPCAF distribution pcaf based on delivered loads
MDCCPRI primary mdcc
DISTPRIMCR primary distribution marginal cost revenue
DISTPRIMCR customer load coincident with max final line transformer load. THIS IS AN ANNUAL NUMBER. Divide by 12 to get monthly number
DISTFLT new business on primary mdcc
MDCCNB secondary mdcc
MDCCSEC secondary distribution marginal cost revenue
DISTSECMCR marginal customer access costs (RCS + TSM) based on rental method. This is a monthly number
MCAC customer marginal cost revenue
MCACMCR annual marginal cost revenue
TRANPCAF transmission pcaf based on net loads?
MTCC Marginal transmission cost of capacity
MTCCMCR Transmission marginal cost revenue
ANNMCR distribution pcaf based on delivered loads
EPIC Final Report | 2.36 Rate Design Tool
Internal
34
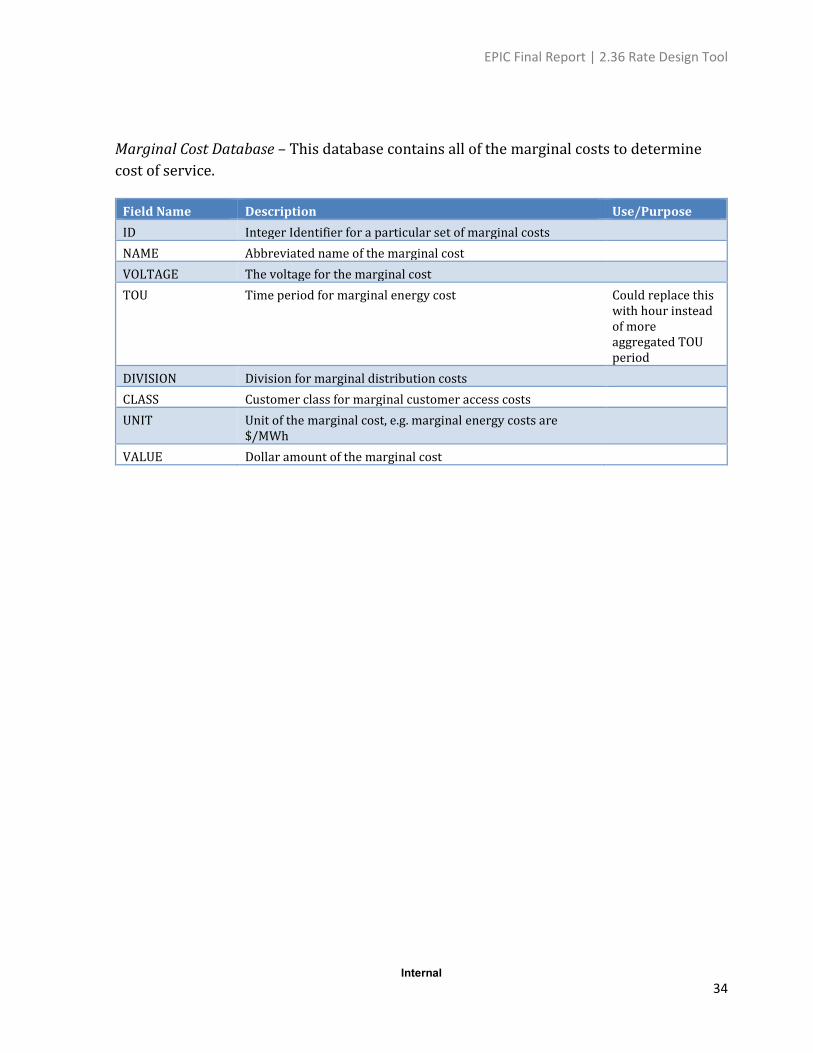
Marginal Cost Database – This database contains all of the marginal costs to determine
cost of service.
Field Name Description Use/Purpose
ID Integer Identifier for a particular set of marginal costs
NAME Abbreviated name of the marginal cost
VOLTAGE The voltage for the marginal cost
TOU Time period for marginal energy cost Could replace this with hour instead of more aggregated TOU period
DIVISION Division for marginal distribution costs
CLASS Customer class for marginal customer access costs
UNIT Unit of the marginal cost, e.g. marginal energy costs are $/MWh
VALUE Dollar amount of the marginal cost