Embed Size (px)
Citation preview

Application: 21-06-021 (U 39 M) Exhibit No.: (PG&E-9) Date: November 5, 2021 Witness(es): Various
PACIFIC GAS AND ELECTRIC COMPANY
2023 GENERAL RATE CASE
EXHIBIT (PG&E-9)
ADMINISTRATIVE AND GENERAL
[INCLUDES NOVEMBER 5, 2021 ERRATA]

(PG&E-9)
-i-
PACIFIC GAS AND ELECTRIC COMPANY 2023 GENERAL RATE CASE
EXHIBIT (PG&E-9) ADMINISTRATIVE AND GENERAL
TABLE OF CONTENTS
Chapter Title Witness
1 INTRODUCTION [INCLUDES NOVEMBER 5, 2021 ERRATA]
Ivana E. Tamburrino
2 FINANCE ORGANIZATION COSTS [INCLUDES
NOVEMBER 5, 2021 ERRATA] Travis Britanik
3 RISK, AUDIT, AND INSURANCE DEPARTMENTS
[INCLUDES NOVEMBER 5, 2021 ERRATA] Stephen J. Cairns
4 COMPLIANCE AND ETHICS [INCLUDES
NOVEMBER 5, 2021 ERRATA] Jennifer Andrews
5 REGULATORY AFFAIRS [INCLUDES
NOVEMBER 5, 2021 ERRATA] Megan Lawson
6 LAW ORGANIZATION [INCLUDES NOVEMBER 5,
2021 ERRATA] William Manheim
7 PG&E CORPORATION AND PG&E EXECUTIVE
OFFICES; AND CORPORATE SECRETARY DEPARTMENT COSTS [INCLUDES NOVEMBER 5, 2021 ERRATA]
William Manheim
8 CORPORATE AFFAIRS COSTS [INCLUDES
NOVEMBER 5, 2021 ERRATA] Susan Martinez
9 ADMINISTRATIVE AND GENERAL RATEMAKING
ADJUSTMENTS Ivana E. Tamburrino

(PG&E-9)
PACIFIC GAS AND ELECTRIC COMPANY
CHAPTER 1
INTRODUCTION
[INCLUDES NOVEMBER 5, 2021 ERRATA]

(PG&E-9)
1-i
PACIFIC GAS AND ELECTRIC COMPANY CHAPTER 1
INTRODUCTION
TABLE OF CONTENTS
A. Introduction ....................................................................................................... 1-1
B. Summary of Forecast ....................................................................................... 1-2
C. Forecasting Process ......................................................................................... 1-7
D. Risk Assessment Mitigation Phase ................................................................... 1-8
E. Compliance With 2020 GRC Settlement: Section 5.2...................................... 1-8
F. Structure of the Exhibit ..................................................................................... 1-8
G. Cost Tables ...................................................................................................... 1-9

(PG&E-9)
1-1
PACIFIC GAS AND ELECTRIC COMPANY 1
CHAPTER 1 2
INTRODUCTION 3
A. Introduction 4
This chapter provides an overview of Pacific Gas and Electric Company’s 5
(PG&E or the Company) Administrative and General (A&G) exhibit for PG&E’s 6
2023 General Rate Case (GRC). A&G expenses support and benefit all of 7
PG&E’s lines of business (LOB). The California Public Utilities Commission 8
(CPUC or Commission) has described A&G costs as follows: 9
A&G expenses are of a general nature and are not directly chargeable to 10 any specific utility function. They include general office labor and supply 11 expenses and items such as insurance, casualty payments, consultant fees, 12 employee benefits, regulatory expenses, association dues, and stock and 13 bond expenses.1 14
A&G is comprised of the Corporate Services organizations that provide 15
companywide support and are essential to the operational LOBs’ ability to 16
deliver on their operational goals. For example, the Corporate Services 17
organizations disseminate important information to customers and their local and 18
state representatives regarding all manner of programs, services, safety 19
initiatives, and emergency communications. They also allow PG&E to work 20
effectively with its regulators and be responsive to its requests for information. 21
In addition, A&G consists of services—such as those provided by the 22
Company’s Law, Finance, Human Resources (HR), and Risk and Audit 23
departments—that are critical to any business the size and complexity of PG&E. 24
This exhibit addresses the following types of A&G costs: 25
1. Corporate Services Department Costs: Department costs are for support 26
services necessary for day-to-day operations;2 27
2. Companywide A&G Expenses: These costs include insurance premiums, 28
settlements and judgments, healthcare benefits, fees, and other similar 29
costs; and 30
1 D.00-02-046, pp. 243-244, Section 9.2.2.1. 2 HR is presented in Exhibit (PG&E-8).

(PG&E-9)
1-2
3. Information Technology (IT) Project Costs: Where applicable, the chapters 1
within this exhibit address costs associated with IT projects. 2
B. Summary of Forecast 3
Department Costs – $153.9 million3 4
PG&E requests that the Commission adopt its 2023 department cost 5
forecast for A&G organizations of $153.9 million,4 which is $8.3 million 6
(approximately 5 percent) lower than 2020 recorded adjusted costs of 7
$162.2 million.5 The decrease is primarily due to reductions in contract and 8
staffing costs, offset by an increase for labor escalation.6 Figure 1-1 below 9
summarizes the key changes of department costs from the 2020 recorded 10
adjusted to the 2023 forecast. 11
3 See Tables 1-2 and 1-3. 4 See Tables 1-2 and 1-3. 5 See Tables 1-2 and 1-3. 6 The increase of $10.2 million in labor escalation is calculated using the labor escalation
factors described in Exhibit (PG&E-8), Ch. 4, and is applied to 2020 recorded adjusted labor.

(PG&E-9)
1-3
FIGURE 1-1 DEPARTMENT COSTS
EXPENSE WALK (2020-2023)
(THOUSANDS OF NOMINAL DOLLARS)
Among other things, PG&E’s A&G forecast includes labor costs, which are 1
included in Federal Energy Regulatory Commission (FERC) Account 920. 2
Pursuant to CPUC Resolution E-4963 (December 14, 2018), PG&E has 3
excluded from its 2023 forecast the salary and benefits of the utility’s Securities 4
and Exchange Commission (SEC) Rule 240.3b-7 officers. PG&E has also 5
voluntarily excluded from its 2023 forecast the salary and benefits of the PG&E 6
Corporation’s SEC Rule 240.3b-7 officers although not required by the 7
Resolution. See Exhibit (PG&E-8), Chapter 4 for further discussion of officer 8
compensation costs. To the extent such costs were included in the forecast for 9
employee benefits, adjustments were made by plan to remove costs associated 10
with these officers.7 11
7 Exhibit (PG&E-8) HR, Ch. 4 Compensation for additional information.

(PG&E-9)
1-4
As shown in Figure 1-1 above, contract reductions represent the largest 1
area of cost decreases among A&G organizations. The overall $15.2 million 2
contract costs decrease is approximately 9 percent from the 2020 recorded 3
adjusted costs. With the exception of Corporate Affairs organization,8 the 4
reductions are forecasted in the Finance, Risk Audit and Insurance, Compliance 5
and Ethics, Law and Executive Offices organizations. In addition to contract 6
costs, PG&E also forecasts reductions in staffing in 2023. Figure 1-2 below 7
shows the headcount changes by A&G organization.8
8 The Corporate Affairs organization is forecasting an increase in contract costs primarily
to support Commission-mandated work.

(PG&E-9)
1-5
FIG
URE
1-2
FULL
-TIM
E EQ
UIV
ALE
NT
(FTE
) EM
PLO
YEES

(PG&E-9)
1-6
Most A&G organizations’ headcount is remaining flat or decreasing. 1
Collectively, the A&G organizations are forecasting a total headcount reduction 2
of 13 FTEs for 2023, which represents approximately 1.5 percent of the total 3
A&G workforce compared to 2020 levels. This will result in a total decrease of 4
approximately $8 million (or 5 percent) to the A&G forecast compared to 2020 5
recorded adjusted costs. 6
The headcount reductions are occurring in the Finance and Law 7
organizations with reductions of 31 FTEs and 3 FTEs, respectively.9 Finance 8
headcount reductions are planned to occur naturally through attrition and Law 9
reductions by not filling some existing vacancies. Only the Corporate Affairs and 10
Risk, Audit and Insurance organizations forecast the addition of new employees. 11
Corporate Affairs plans to add 6 FTEs to support Commission-mandated 12
Climate Vulnerability Assessment work, and to support the Local Government 13
Relations function.10 Risk, Audit and Insurance plans to fill 14 existing FTE 14
vacancies to support key functions across the organization including Market and 15
Credit Risk Management, Internal Audit, Sarbanes Oxley compliance, Third 16
Party Risk Management and Insurance. Information about the headcount 17
forecast changes is provided in those organizations’ respective chapters in this 18
exhibit.11 19
Companywide A&G Expenses – $959.6 million12 20
PG&E’s 2023 forecast is $36.9 million (approximately 4 percent) lower than 21
2020 recorded adjusted costs of $996.5 million.13 The 2020 recorded costs 22
include approximately $360 million of one-time costs that are not expected to 23
recur in 2023.14 The 2023 forecast reflects approximately a 51 percent increase 24
compared to the 2020 recorded adjusted when accounting for the removal of the 25
non-recurring items. A primary driver of the corporate items forecast is the 26
9 See Exhibit (PG&E-9), Ch. 2 for discussion of the Finance Organization headcount
decrease; See Exhibit (PG&E-9), Ch. 6 for discussion of the Law Organization headcount decrease.
10 See Exhibit (PG&E-9), Ch. 8 for discussion of these FTEs. 11 See Exhibit (PG&E-9), Ch. 3 for discussion of these FTEs. 12 See Table 1-4. 13 See Table 1-4. 14 These relate primarily to accelerated expense recognition of future insurance premiums
and the purchase of additional Directors and Officers liability insurance in 2020.

(PG&E-9)
1-7
continuing high market cost of wildfire liability insurance along with cost 1
increases for various other insurance types. PG&E’s wildfire insurance forecast 2
is based on the cost of its most recent renewal from April 2021, which is the 3
most recent cost data available. Consistent with previous Commission 4
guidance, PG&E has included only 50 percent of the forecast cost of Directors 5
and Officers insurance in its 2023 forecast. Insurance is discussed in Exhibit 6
(PG&E-9), Chapter 3. Other corporate items include Bank Fees;15 Settlements, 7
Judgments and Claims;16 and Director Fees and Expenses.17 The A&G 8
Corporate Items are shown in Table 1-1 below. 9
IT Projects 10
PG&E’s 2023 forecast expense is $1.5 million, which is $0.6 million 11
(approximately 28 percent) lower than 2020 recorded costs of $2.1 million. The 12
reduction is primarily due to a decrease in the Finance and Regulatory Affairs 13
department IT costs. Capital IT forecast cost amounts are: $0.1 million in 2021, 14
$3.0 million in 2022, $2.5 million in 2023, $2.5 million in 2024, $2.5 million in 15
2025 and $2.5 million in 2026.18 16
These forecasts consist of IT projects designed to support the Corporate 17
Services organizations. Table 1-5 provides IT expense from 2016 through 2023 18
and Table 1-6 provides IT and other capital expenditures from 2016 through 19
2026. 20
C. Forecasting Process 21
As described in Exhibit (PG&E-2), Chapter 3, PG&E’s enterprise-wide 22
planning and budgeting process (known as the Operating Rhythm) sets the 23
foundation for PG&E’s 2023 GRC planning process. The Operating Rhythm is 24
the successor planning and budgeting process to the Integrated Planning 25
Process that was followed to prepare PG&E’s 2020 GRC forecast. PG&E 26
adjusts the forecast developed through the Operating Rhythm process by 27
removing below-the-line activities (i.e., items that are not included in the revenue 28
15 See Exhibit (PG&E-9), Ch. 2. 16 See Exhibit (PG&E-9), Ch. 6. 17 See Exhibit (PG&E-9), Ch. 7. 18 See Tables 1-5 and 1-6.

(PG&E-9)
1-8
requirement for cost recovery), capitalizing costs, and removing non-utility 1
affiliate activities.19 2
D. Risk Assessment Mitigation Phase 3
As described in Exhibit (PG&E-2), Chapter 3, PG&E submitted its second 4
Risk Assessment and Mitigation Phase (RAMP) report in 2020, which 5
incorporated 12 risk models that use both quantitative and qualitative inputs to 6
model baseline risk and mitigated risk. In the RAMP report, PG&E presented its 7
top safety risks for which it expects to seek cost recovery for its related controls 8
and mitigations in the GRC or other rate proceedings. Cross-cutting factors are 9
drivers and/or consequences that may impact multiple event-based risks, and 10
are incorporated into the analysis of risk events. Exhibit (PG&E-9) includes one 11
cross-cutting factor (Climate Change) identified in the 2020 RAMP report. This 12
is discussed in the Corporate Affairs testimony. An example of a 2020 RAMP 13
risk impacted by Climate Change is wildfires. 14
E. Compliance With 2020 GRC Settlement: Section 5.2 15
Section 5.220 of the 2020 GRC Settlement Agreement requires PG&E to 16
make an additional showing in its 2023 GRC testimony for work that was 17
previously requested and authorized based on representations that the work 18
was needed to provide safe and reliable service. In the 2020 GRC and the 2019 19
Gas Transmission and Storage, the A&G organizations did not request or 20
receive authorized funding for any work (1) identified as safety, reliability, or 21
maintenance-related in the 2020 Risk Spending Accountability Report or 22
(2) based on representations in testimony and work papers that the work was 23
needed to provide safe and reliable service. 24
F. Structure of the Exhibit 25
Table 1-1 below shows the types of costs and other information provided in 26
the A&G exhibit on a chapter-by-chapter basis. 27
19 Exhibit (PG&E-9), Ch. 9 for further information about these adjustments. 20 A.18-12-009, In the 2020 GRC settlement agreement, (December 20, 2019), p. 36,
Section 5.2, approved by the CPUC in D.20-12-005, the settling parties agreed that PG&E will continue to make a deferred work showing consistent with the format of the showing in PG&E’s 2020 GRC testimony. The six principles of deferred work continued in the 2020 GRC that were agreed to in the 2017 GRC settlement are listed in the 2017 GRC settlement agreement, (August 3, 2016), p. 1-29 to p. 1-30, Section 3.2.8.4, see A.15-09-001.

(PG&E-9)
1-9
TABLE 1-1 SUMMARY OF TYPES OF COSTS
Line No. Chapter Department Cost Companywide Expense IT RAMP
1 1 Introduction N/A N/A N/A
2 2 Finance Bank/Trustee Fees x N/A
3 3 Risk, Audit, and Insurance Liability and Property Insurance
x N/A
4 4 Compliance and Ethics N/A x N/A
5 5 Regulatory Affairs N/A x N/A
6 6 Law Organization Third Party Claims; Litigation, Settlement, and Judgments
x N/A
7 7 PG&E Corporation, PG&E Executive Offices, Corporate Secretary
Director Fees and Expenses N/A N/A
8 8 Corporate Affairs N/A N/A x
9 9 A&G Ratemaking Adjustments
N/A N/A N/A
G. Cost Tables 1
The forecasts for Exhibit (PG&E-9) costs are shown in Tables 1-2 2
through 1-6 below. The testimony and workpapers (WP) for each organization 3
contain additional detail regarding its forecast. 4

1-10
(PG&E-9) TA
BLE
1-2
SU
MM
AR
Y O
F D
EPAR
TMEN
T EX
PEN
SES
CO
RPO
RA
TES
SER
VIC
ES O
RG
AN
IZA
TIO
NS
HIS
TOR
ICA
L A
ND
FO
REC
AST
( T
HO
USA
ND
S O
F N
OM
INA
L D
OLL
AR
S)
Line
N
o.
Des
crip
tion
Rec
orde
d Ad
just
ed
Fore
cast
W
P R
efer
ence
20
16
2017
20
18
2019
20
20
2021
20
22
2023
1 C
hapt
er 2
: Fi
nanc
e $6
3,50
9 $6
4,62
4 $6
3,51
1 $5
4,70
8 $6
0,55
3 $5
2,99
1 $5
4,71
7 $5
4,44
1 W
P 1-
9, li
ne 2
8
2 C
hapt
er 3
: R
isk,
Aud
it, a
nd
Insu
ranc
e 9,
475
8,63
3 9,
728
9,49
8 12
,219
12
,499
12
,853
13
,220
W
P 1-
9, li
ne 5
6
3 C
hapt
er 4
: C
ompl
ianc
e an
d Et
hics
5,
695
6,58
0 6,
767
6,25
7 7,
241
7,85
3 8,
069
8,29
8 W
P 1-
9, li
ne 1
3
4 C
hapt
er 5
: R
egul
ator
y Af
fairs
18
,072
15
,745
14
,751
14
,259
15
,888
16
,347
16
,828
17
,323
W
P 1-
9, li
ne 4
9 5
Cha
pter
6:
Law
53
,212
50
,650
51
,280
47
,469
48
,072
46
,250
46
,739
46
,666
W
P 1-
9, li
ne 3
5 6
Cha
pter
7:
Exec
utiv
e O
ffice
s an
d C
orpo
rate
Sec
reta
ry
8,53
6 7,
823
7,36
9 4,
874
11,2
03
4,96
1 5,
012
5,05
4 W
P 1-
9, li
ne 4
2
7 C
hapt
er 8
: C
orpo
rate
Affa
irs
12,9
58
7,85
9 6,
753
6,02
4 7,
016
7,84
7 7,
968
8,89
0 W
P 1-
9, li
ne 2
0
8 To
tal
$171
,457
$1
61,9
14
$160
,159
$1
43,0
89
$162
,192
$1
48,7
48
$152
,187
$1
53,8
92
WP
1-9,
line
6

1-11
(PG&E-9) TA
BLE
1-3
SU
MM
AR
Y O
F D
EPA
RTM
ENT
EXPE
NSE
S B
Y FE
RC
AC
CO
UN
T H
ISTO
RIC
AL
AN
D F
OR
ECA
ST
(TH
OU
SAN
DS
OF
NO
MIN
AL
DO
LLA
RS)
Line
N
o.
Des
crip
tion
Rec
orde
d Ad
just
ed
Fore
cast
W
P R
efer
ence
20
16
2017
20
18
2019
20
20
2021
20
22
2023
1 92
0 –
A&G
Sal
arie
s $9
5,73
9 $9
4,76
6 $9
0,50
6 $8
8,64
9 $9
3,12
1 $9
4,38
2 $9
6,25
9 $9
9,52
0 W
P 1-
9, li
ne 1
2
921
– O
ffice
Sup
plie
s an
d Ex
. 6,
809
4,39
6 5,
694
5,20
5 5,
030
5,20
5 5,
229
5,25
2 W
P 1-
9, li
ne 2
3
923
– O
utsi
de S
ervi
ce
Empl
oyee
s-U
tility
46
,454
42
,838
46
,058
36
,490
48
,525
35
,182
36
,409
34
,524
W
P 1-
9, li
ne 3
4 92
3 –
Out
side
Ser
vice
Em
ploy
ees-
Cor
p 8,
853
8,30
6 8,
523
3,21
7 4,
306
3,20
8 3,
226
3,23
2 W
P 1-
9, li
ne 4
5 Bu
sine
ss F
inan
ce –
OS
13,6
02
11,6
09
9,37
9 9,
527
11,2
10
10,7
72
11,0
64
11,3
65
WP
1-9,
line
5
6 To
tal
$171
,457
$1
61,9
14
$160
,160
$1
43,0
89
$162
,192
$1
48,7
48
$152
,187
$1
53,8
92
WP
1-9,
line
6

1-12
(PG&E-9) TA
BLE
1-4
SU
MM
AR
Y O
F C
OM
PAN
YWID
E A
&G
EXP
ENSE
ITEM
S IN
TH
IS E
XHIB
IT
HIS
TOR
ICA
L A
ND
FO
REC
AST
(T
HO
USA
ND
S O
F N
OM
INA
L D
OLL
AR
S)
Line
N
o.
Des
crip
tion
Rec
orde
d Ad
just
ed
Fore
cast
2016
20
17
2018
20
19
2020
20
21
2022
20
23
WP
Ref
eren
ce
1 C
hapt
er 2
: Ba
nk F
ees
$4,3
59
$5,0
06
$4,5
04
$22,
959
$8,8
09
$12,
807
$13,
619
$10,
749
WP
2-74
, lin
e 5
2 C
hapt
er 3
: Li
abilit
y In
sura
nce
64,0
44
164,
941
451,
993
134,
021
98,7
81
155,
847
158,
592
161,
760
WP
3-29
, lin
e 2
C
hapt
er 3
: W
ildfir
e Li
abilit
y In
sura
nce
– –
– –
768,
596
726,
622
707,
499
707,
499
WP
3-29
, lin
e 3
3 C
hapt
er 3
: D
&O L
iabi
lity
Insu
ranc
e 2,
118
1,71
0 3,
425
24,4
94
26,9
97
6,19
1
6,31
5
6,44
1
WP
3-29
, lin
e 1
4 C
hapt
er 3
: Pr
oper
ty
Insu
ranc
e 21
,449
20
,694
15
,048
20
,451
11
,673
22
,504
29
,047
28
,632
W
P 3-
29, l
ine
4, 5
5 C
hapt
er 3
: C
orpo
rate
In
sura
nce
712
710
890
5,61
5 10
,131
2,
661
2,69
8 2,
744
WP
3-29
, lin
e 6
6 C
hapt
er 6
: Se
ttlem
ents
an
d Ju
dgm
ents
27
,051
11
,170
29
,097
40
5 59
,565
25
,059
25
,059
25
,059
W
P 6-
29, l
ine
1
7 C
hapt
er 6
: Th
ird-P
arty
C
laim
s 12
,839
21
,391
16
,438
9,
096
10,2
67
14,2
98
14,2
98
14,2
98
WP
6-29
, lin
e 2
8 C
hapt
er 7
: D
irect
or F
ees
1,97
4 1,
881
1,95
2 2,
618
1,67
1 2,
054
2,36
9 2,
440
WP
7-38
, lin
e 1
9 To
tal
$134
,546
$2
27,5
03
$543
,347
$2
19,6
59
$996
,490
$9
68,0
43
$959
,496
$9
59,6
22

1-13
(PG&E-9) TA
BLE
1-5
IT
EXP
ENSE
H
ISTO
RIC
AL
AN
D F
OR
ECA
ST
(TH
OU
SAN
DS
OF
NO
MIN
AL
DO
LLA
RS)
Line
N
o.
Des
crip
tion
Rec
orde
d Ad
just
ed
Fore
cast
W
P R
efer
ence
20
16
2017
20
18
2019
20
20
2021
20
22
2023
1 C
hapt
er 2
: Fi
nanc
e $4
,799
$1
,494
$8
67
$836
$8
19
$468
$4
68
$468
W
P 2-
78, l
ine
2 2
Cha
pter
3:
Ris
k, A
udit,
and
Insu
ranc
e 22
64
4 (7
) –
– 10
7 20
7 10
4 W
P 3-
33, l
ine
2 3
Cha
pter
4:
Com
plia
nce
and
Ethi
cs
26
280
311
125
107
175
225
225
WP
4-28
, lin
e 2
4 C
hapt
er 5
: R
egul
ator
y Af
fairs
1,
032
1,45
8 1,
080
327
763
279
429
429
WP
5-46
, lin
e 2
5 C
hapt
er 6
: La
w
415
151
233
238
449
314
314
314
WP
6-34
, lin
e 2
6 C
hapt
er 7
: Ex
ecut
ive
Offi
ces
and
Cor
pora
te S
ecre
tary
–
– –
– –
– –
–
7 C
hapt
er 8
: C
orpo
rate
Affa
irs
808
334
678
– –
– –
– W
P 8-
46, l
ine
2
8 To
tal
$7,1
02
$4,3
61
$3,1
62
$1,5
26
$2,1
38
$1,3
43
$1,6
43
$1,5
40

1-14
(PG&E-9) TA
BLE
1-6
IT
AN
D O
THER
CA
PITA
L EX
PEN
DIT
UR
ES
HIS
TOR
ICA
L A
ND
FO
REC
AST
(T
HO
USA
ND
S O
F N
OM
INA
L D
OLL
AR
S)
Line
N
o.
Des
crip
tion
Rec
orde
d Ad
just
ed
Fore
cast
W
P R
efer
ence
20
16
2017
20
18
2019
20
20
2021
20
22
2023
20
24
2025
20
26
1 C
hapt
er 2
: Fi
nanc
e $3
,484
$1
,102
$2
,511
$1
,314
$4
5 –
– –
– –
– W
P 2 -
80, l
ine
2 2
Cha
pter
3:
Ris
k, A
udit,
and
In
sura
nce
2,15
5 69
4 20
(6
) –
– $1
,000
$5
00
$500
$5
00
$500
W
P 3-
35, l
ine
2
3 C
hapt
er 4
: C
ompl
ianc
e an
d Et
hics
–
1,31
4 1,
120
494
1 –
500
500
500
500
500
WP
4-30
, lin
e 2
4 C
hapt
er 5
: R
egul
ator
y Af
fairs
9,
906
3,60
0 1,
605
684
1,27
9 $1
00
1,50
0 1,
500
1,50
0 1,
500
1,50
0 W
P 5-
48, l
ine
2 5
Cha
pter
6:
Law
48
9 –
– –
– –
– –
– –
– W
P 6-
36, l
ine
2 6
Cha
pter
7:
Exec
utiv
e O
ffice
s an
d C
orpo
rate
Sec
reta
ry
– –
– –
– –
– –
– –
–
7 C
hapt
er 8
: C
orpo
rate
Affa
irs
– –
– –
– –
– –
– –
–
8 To
tal
$16,
054
$6,7
09
$5,2
56
$2,4
86
$1,3
25
$100
$3
,000
$2
,500
$2
,500
$2
,500
$2
,500

(PG&E-9)
-i-
PACIFIC GAS AND ELECTRIC COMPANY 2023 GENERAL RATE CASE
Testimony _____x________ Workpapers ___x________ SOQ ______________ Exhibit Number: ____9____ Chapter Number: ____1___ Chapter Title: Introduction Witness Name: Ivana Tamburrino Page No. Line No. Item As Filed As Corrected
Errata as of November 5, 2021
1-2 6 Forecast cost $154.2 $153.9
1-2 6 Forecast cost $154.2; $9.1 $153.9; $8.3
1-2 8 Recorded cost $163.2 $162.2
1-2 Footnote 6 Forecast cost $11.9 $10.2
1-3 Figure 1-1 Recorded & Forecast cost
- Replaced in full
1-4 2 Forecast cost $10.2 $15.2
1-4 3 Forecast cost 6 9

(PG&E-9)
-ii-
1-4 4 through 7 Forecast cost With the exception of PG&E’s Executive Offices and the Corporate Affairs organization, the reductions are forecasted in the Finance, Risk Audit and Insurance, Compliance and Ethics and Law organizations.
With the exception of Corporate Affairs organization, the reductions are forecasted in the Finance, Risk Audit and Insurance, Compliance and Ethics, Law and Executive Offices organizations.
1-7 11 Forecast cost $1.6; $0.5 $1.5; $0.6
1-7 12 Forecast cost 25 28
1-10 Table 1-2, Line 1
Recorded & Forecast cost
2016: 63,508 2017: 64,625 2018: 63,510 2019: 54,707 2020: 60,554 2021: 53,006 2022: 54,734 2023: 54,456
2016: 63,509 2017: 64,624 2018: 63,511 2019: 54,708 2020: 60,553 2021: 52,991 2022: 54,717 2023: 54,441
1-10 Table 1-2, Line 2
Recorded & Forecast cost
2016: 9,476 2018: 9,729 2019: 9,499 2020: 12,220 2021: 12,498
2016: 9,475 2018: 9,728 2019: 9,498 2020: 12,219 2021: 12,499
1-10 Table 1-2, Line 4
Recorded & Forecast cost
2017: 15,744 2020: 15,889 2021: 16,570 2022: 17,056 2023: 17,558
2017: 15,745 2020: 15,888 2021: 16,347 2022: 16,828 2023: 17,323
1-10 Table 1-2, Line 5
Recorded & Forecast cost
2016: 53,211 2018: 51,281 2019: 47,470 2020: 49,131 2021: 46,248 2022: 46,738
2016: 53,212 2018: 51,280 2019: 47,469 2020: 48,072 2021: 46,250 2022: 46,739
(PG&E-9)
-iii-
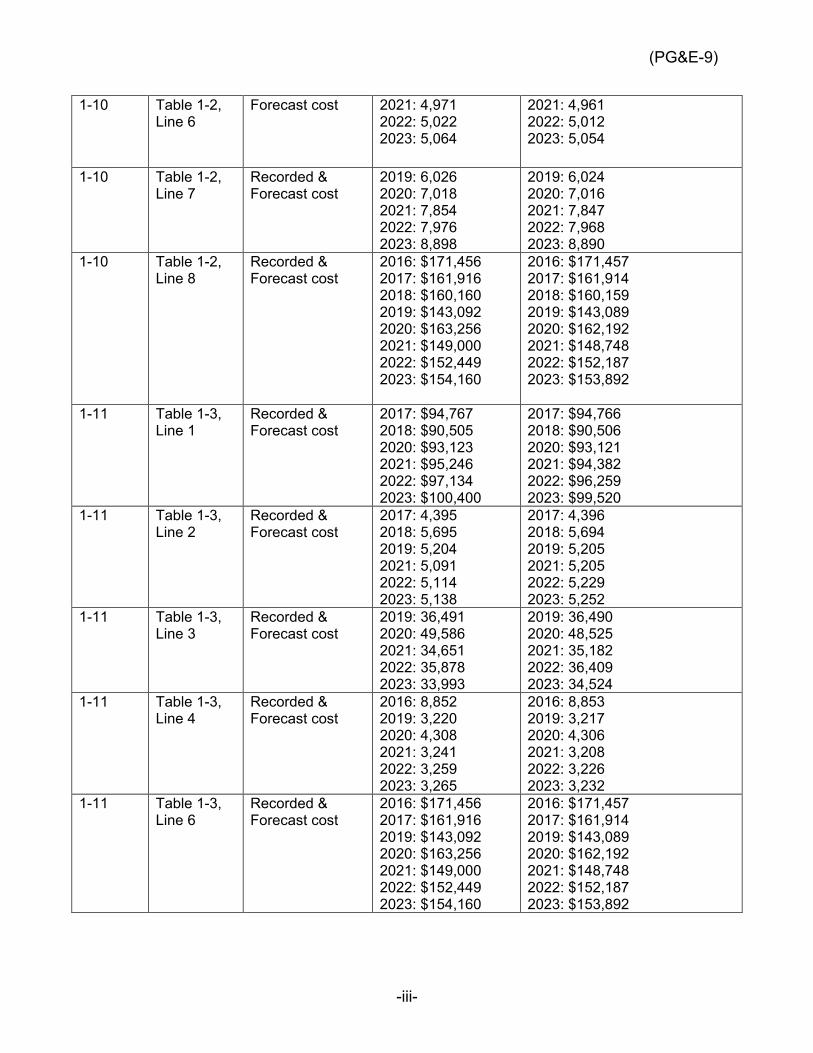
1-10 Table 1-2, Line 6
Forecast cost 2021: 4,971 2022: 5,022 2023: 5,064
2021: 4,961 2022: 5,012 2023: 5,054
1-10 Table 1-2, Line 7
Recorded & Forecast cost
2019: 6,026 2020: 7,018 2021: 7,854 2022: 7,976 2023: 8,898
2019: 6,024 2020: 7,016 2021: 7,847 2022: 7,968 2023: 8,890
1-10 Table 1-2, Line 8
Recorded & Forecast cost
2016: $171,456 2017: $161,916 2018: $160,160 2019: $143,092 2020: $163,256 2021: $149,000 2022: $152,449 2023: $154,160
2016: $171,457 2017: $161,914 2018: $160,159 2019: $143,089 2020: $162,192 2021: $148,748 2022: $152,187 2023: $153,892
1-11 Table 1-3, Line 1
Recorded & Forecast cost
2017: $94,767 2018: $90,505 2020: $93,123 2021: $95,246 2022: $97,134 2023: $100,400
2017: $94,766 2018: $90,506 2020: $93,121 2021: $94,382 2022: $96,259 2023: $99,520
1-11 Table 1-3, Line 2
Recorded & Forecast cost
2017: 4,395 2018: 5,695 2019: 5,204 2021: 5,091 2022: 5,114 2023: 5,138
2017: 4,396 2018: 5,694 2019: 5,205 2021: 5,205 2022: 5,229 2023: 5,252
1-11 Table 1-3, Line 3
Recorded & Forecast cost
2019: 36,491 2020: 49,586 2021: 34,651 2022: 35,878 2023: 33,993
2019: 36,490 2020: 48,525 2021: 35,182 2022: 36,409 2023: 34,524
1-11 Table 1-3, Line 4
Recorded & Forecast cost
2016: 8,852 2019: 3,220 2020: 4,308 2021: 3,241 2022: 3,259 2023: 3,265
2016: 8,853 2019: 3,217 2020: 4,306 2021: 3,208 2022: 3,226 2023: 3,232
1-11 Table 1-3, Line 6
Recorded & Forecast cost
2016: $171,456 2017: $161,916 2019: $143,092 2020: $163,256 2021: $149,000 2022: $152,449 2023: $154,160
2016: $171,457 2017: $161,914 2019: $143,089 2020: $162,192 2021: $148,748 2022: $152,187 2023: $153,892

(PG&E-9)
-iv-
1-13 Table 1-5, Line 7
Recorded cost N/A 2016: 808 2017: 334 2018: 678 WP Reference: WP 8-46, line 2
1-13 Table 1-5, Line 8
Recorded cost 2016: $6,295 2017: $4,027 2018: $2,484
2016: $7,102 2017: $4,361 2018: $3,162
1-14 Table 1-5, Line 7
Recorded cost N/A 0 for all years
All changes in the Chapter 1 workpapers are a result of the errata items identified in Chapters 2-8. No errata to Chapter 9.

(PG&E-9)
PACIFIC GAS AND ELECTRIC COMPANY
CHAPTER 2
FINANCE ORGANIZATION COSTS
[INCLUDES NOVEMBER 5, 2021 ERRATA]

(PG&E-9)
2-i
PACIFIC GAS AND ELECTRIC COMPANY CHAPTER 2
FINANCE ORGANIZATION COSTS
TABLE OF CONTENTS
A. Introduction ....................................................................................................... 2-1
1. Summary of Request ................................................................................. 2-1
2. Organization of Remainder of This Chapter ............................................... 2-2
B. Department Costs ............................................................................................. 2-2
1. Summary of Forecast ................................................................................. 2-2
2. Organization Descriptions .......................................................................... 2-3
a. EVP and Chief Financial Officer (CFO) ............................................... 2-3
1) Department Overview ................................................................... 2-3
2) Functions of Department ............................................................... 2-3
b. Business Finance ................................................................................ 2-4
1) Department Overview ................................................................... 2-4
2) Functions of Department ............................................................... 2-5
c. Controller ............................................................................................. 2-7
1) Department Overview ................................................................... 2-7
2) Functions of Department ............................................................... 2-8
d. Investor Relations .............................................................................. 2-12
e. Treasury ............................................................................................ 2-13
1) Department Overview ................................................................. 2-13
2) Functions of Department ............................................................. 2-14
f. Finance and Planning ........................................................................ 2-17
1) Department Overview ................................................................. 2-17
2) Functions of Department ............................................................. 2-18
3. 2023 Forecast Drivers .............................................................................. 2-18
a. Labor Escalation ................................................................................ 2-19

(PG&E-9) PACIFIC GAS AND ELECTRIC COMPANY
CHAPTER 2 FINANCE ORGANIZATION COSTS
TABLE OF CONTENTS
(CONTINUED)
2-ii
b. Staffing (FERC 920 and 921) ............................................................ 2-19
c. Contracts and Fees (FERC 923) ....................................................... 2-19
C. Companywide Expense .................................................................................. 2-19
1. Bank Fees ................................................................................................ 2-19
D. IT Projects ...................................................................................................... 2-20
E. Corporate Risk: Liquidity Management .......................................................... 2-20
F. Cost Tables .................................................................................................... 2-21

(PG&E-9)
2-1
PACIFIC GAS AND ELECTRIC COMPANY 1
CHAPTER 2 2
FINANCE ORGANIZATION COSTS 3
A. Introduction 4
1. Summary of Request 5
Pacific Gas and Electric Company’s (PG&E or the Company or the 6
Utility) Finance organization provides the necessary financial capabilities 7
found in any large, publicly traded company. It is responsible for functions 8
such as raising capital, communicating with investors, providing financial 9
forecasts, filing financial statements with the Securities and Exchange 10
Commission (SEC) and other regulatory bodies, making necessary tax 11
filings with federal and state authorities, and managing payment services for 12
employees and vendors. It also works with the other organizations within 13
the Company to plan and manage budgets and improve processes and 14
performance. The Finance organization works to provide these services 15
efficiently, while continually adapting to changes in the Company’s business 16
environment. The organization strives to continuously improve the efficiency 17
and effectiveness of its processes and tools. 18
The Finance organization forecast for 2023 is as follows: 19
Department Costs – $54.4 million.1,2 This amount is $6.1 million 20
(11.2 percent) lower than the 2020 recorded amount of $60.6 million.3 In 21
2020, the organization had 378 Full-Time Equivalent (FTE) positions. The 22
Department’s 2023 forecast includes a staffing reduction of 31 FTEs from 23
2020.4 The staffing decrease will occur through natural attrition and by not 24
backfilling for other vacancies. PG&E also forecasts an overall decrease in 25
1 See Table 2-1, line 8. 2 Pursuant to CPUC Resolution E-4963 (Issued Dec. 14, 2018), PG&E has excluded from
its 2023 forecast the salary and benefits of the utility’s SEC Rule 240.3b-7 officers. PG&E has also voluntarily excluded from its 2023 forecast to the salary and benefits of the PG&E Corporation’s SEC Rule 240.3b-7 officers although not required by the Resolution. See Exhibit (PG&E-8), Ch. 4 for further discussion of officer compensation costs.
3 See Table 2-1, line 8. 4 Exhibit (PG&E-9), WP 2-8, line 16.

(PG&E-9)
2-2
contract costs and fees driven by reductions for Controller contracts and 1
outside services. These decreases are partially offset by an increase for 2
labor escalation.5 3
Bank Fees – The 2023 forecast for bank fees is $10.7 million.6 This is 4
an increase of $1.9 million (22 percent) compared to 2020, which is driven 5
primarily by an increase in letter of credit fees associated with real estate 6
transactions, as well as upfront and other fees associated with the Accounts 7
Receivable facility put in place in late 2020. 8
Information Technology (IT) Projects – Finance forecasts $0.5 million7 9
in ongoing maintenance work that supports the core financial systems of 10
PG&E. 11
2. Organization of Remainder of This Chapter 12
The remainder of this chapter is organized as follows: 13
• Section B – Department Costs; 14
• Section C – Companywide Expenses; 15
• Section D – IT Projects; 16
• Section E – Description of Corporate Risk: Liquidity Risk; and 17
• Section F – Cost Tables. 18
B. Department Costs 19
1. Summary of Forecast 20
Activities for the department are described in Section B.2. Figure 2-1 21
shows the drivers of changes in department costs, from 2020 recorded 22
adjusted costs to the 2023 forecast. These drivers are discussed in 23
Section B.3 2023 Forecast Drivers. 24
5 See Section B.3.c. for a discussion of contracts and fees. 6 See Table 2-3, line 5. 7 See Table 2-4, line 1.

(PG&E-9)
2-3
FIGURE 2-1 EXPENSE WALK (2020-2023)
(THOUSANDS OF NOMINAL DOLLARS)
2. Organization Descriptions 1
a. EVP and Chief Financial Officer (CFO) 2
1) Department Overview 3
The PG&E Corporation Executive Vice President (EVP) and 4
CFO’s office has overall responsibility for PG&E’s financial 5
functions. 6
2) Functions of Department 7
The PG&E Corporation EVP and CFO’s responsibilities include 8
the following: 9
• Advising the Board of Directors on the full range of strategic and 10
financial options for the Company and PG&E Corporation; 11
• Working with the lines of business (LOB) to develop budgets 12
and forecasts for necessary work; 13

(PG&E-9)
2-4
• Overseeing the short-term and long-term financial outlook of the 1
Company and PG&E Corporation; 2
• Overseeing SEC filings, other regulatory filings, and tax filings; 3
• Communicating financial expectations and performance to 4
investors, the financial community and employees; 5
• Overseeing financial transactions including cash management, 6
debt, and equity issuances, and payments to vendors 7
and employees; 8
• Promoting continuous improvement within the Finance 9
organization; and 10
• Overseeing the operations of the Office of Vice President (VP) 11
and Chief Audit Officer.8 12
The EVP and CFO’s office also includes his assistant and a 13
chief of staff that report directly to the EVP and CFO. The chief of 14
staff is responsible for providing the analytics, metrics monitoring, 15
and process improvement initiative support for the Finance 16
organization. At the end of 2020, the EVP’s office consisted of 17
two FTEs.9 18
The EVP and CFO currently remain at PG&E Corporation. The 19
analysis provided in Exhibit (PG&E-9), Chapter 9, Administrative 20
and General (A&G) Ratemaking Adjustments, was used to 21
determine the portion of time spent on Company and non-Company 22
matters. 23
b. Business Finance 24
1) Department Overview 25
PG&E’s Business Finance Department is responsible for 26
budgeting, financial planning, and forecasting activities for all PG&E 27
organizations. Business Finance also communicates that 28
information internally, directs financial support for strategy analyses 29
and provides technical leadership on projects focused on improving 30
8 Exhibit (PG&E-9), Ch. 3, Risk and Audit Department Costs and Insurance Expense for
the costs and activities associated with the VP and Chief Audit Officer’s organization. 9 Exhibit (PG&E-9), WP 2-8, line 5.

(PG&E-9)
2-5
utility performance in specific operational areas. PG&E’s Business 1
Finance Department is responsible for monitoring and reporting the 2
financial and operational performance of the LOBs, providing 3
economic analysis and project governance services, providing 4
project leadership and support for improving utility performance and 5
enabling decision support and technology support for the 6
Company’s financial applications and systems. 7
The Business Finance Department is composed of Business 8
Finance Services and Finance Process & Systems (FPS). 9
At the end of 2020, the Business Finance Department consisted 10
of 143 FTEs.10 11
2) Functions of Department 12
a) Business Finance Directors 13
The Business Finance Directors report to the VP and are 14
responsible for: 15
• Overseeing the Planning Process to establish the 16
Company’s and LOBs’ multi-year operational and financial 17
plans 18
• Working with the LOBs to evaluate, set, and adjust financial 19
performance targets for operations and projects; 20
• Governing and reporting of financial performance of LOBs; 21
• Supporting continuous improvement and process 22
improvement within the LOBs and across the Company; and 23
• Partnering with the Strategy and Policy organization to 24
provide financial oversight and rigor to strategic decisions. 25
b) Business Finance Services 26
• Business Finance Services is responsible for the financial 27
planning, forecasting, and reporting of every LOB within 28
PG&E. The Business Finance Services enables effective 29
financial management. The costs for Electric, Gas, Energy 30
Supply and Customer Care specific business services have 31
10 Exhibit (PG&E-9), WP 2-8, lines 1-2.
(PG&E-9)
2-6
been recorded and are forecast in Federal Energy 1
Regulatory Commission (FERC) operating accounts, while 2
the remainder of the costs have been recorded and are 3
forecast in the A&G FERC accounts.11 Business Finance 4
Services consists of two subsections: Operational Services 5
and Corporate Services. 6
• Operational Services: Operational Services provides 7
business planning and business decision support services 8
to PG&E’s operations organizations: Electric Operations; 9
Gas Operations; Customer Care; Energy Supply 10
(Power Generation and Nuclear Generation); Shared 11
Services; and IT. Specifically, Operational Services 12
ensures that senior management in the operations’ 13
organizations receive accurate views of financial 14
information; manages the budgeting and forecasting 15
process with the operations organizations; reports on 16
financial and operations performance; and ensures that 17
costs are accurately recorded. 18
• Corporate Services: Corporate Services supports Finance 19
and Risk, Human Resources, General Counsel, Strategy 20
and Policy, Safety and Health, Compliance and Ethics, 21
Office of the Chairman, and the Utility President. Corporate 22
Services provides the same types of business and financial 23
services that Operational Services (described above) 24
provides to PG&E’s operating organizations. These 25
services ensure effective financial management of PG&E’s 26
Corporate Service organizations. 27
c) Finance Process and Systems 28
FPS provides the operational support (OS) to enable 29
efficient financial processes and systems to access accurate 30
financial information. FPS oversees and manages all IT 31
11 For more information on the forecasts in FERC operating accounts, see
Exhibit (PG&E-9), WP 2-3 and WP 2-37 through WP 2-45. As with A&G and company-wide expense, a portion of these costs are not recovered in PG&E’s GRC.

(PG&E-9)
2-7
projects within the Finance organization and is also responsible 1
for the Finance Technology Roadmap (i.e., long-term IT plans 2
for financial applications and systems). FPS ensures the 3
integrity of the financial applications, maximizes internal cost 4
management, and effectively manages Finance IT projects. 5
FPS consists of two sections: Cost Model Governance & 6
Support and Financial Application Support. 7
• Cost Model Governance and Support: Cost Model 8
Governance & Support provides cost model advice and 9
support to business partners and ensures that the Company 10
complies with cost accounting policies. In addition, the 11
section reviews and posts field journal entries and budget 12
transfers; manages overheads and various cost allocation 13
rules; and approves and/or changes master data such as 14
cost centers and Major Work Categories (MWC). 15
• Financial Application Services: Financial Application 16
Services manages PG&E’s major financial applications such 17
as SAP (general ledger, accounts payable, treasury, cost 18
accounting, project system), PowerPlant (asset 19
management, tax provisioning, capital forecasting), Concur 20
(expense reimbursement), SAP Reporting (all areas) and 21
SAP Business Planning and Consolidations (cost center 22
planning, order planning, consolidations). The section 23
partners with the IT organization to ensure that the finance 24
systems are stable and available to end users as 25
scheduled. 26
c. Controller 27
1) Department Overview 28
PG&E’s Controller’s Department has the primary responsibility 29
for financial accounting, external financial reporting, and enterprise 30
forecasting and monitoring. The Controller’s Department is 31
composed of the VP’s office and four sections: Capital Accounting; 32

(PG&E-9)
2-8
Corporate Accounting; Financial Forecasting and Revenue 1
Requirements; and Tax. 2
At the end of 2020, the Controller’s Department consisted of 3
123 FTEs.12 4
2) Functions of Department 5
a) VP, Controller, and Utility CFO 6
The responsibilities of the VP-Controller-CFO’s office 7
include oversight of all parts of the Controller’s Department and 8
management of the Utility CFO responsibilities. The 9
VP-Controller-CFO’s specific responsibilities include: 10
• Overseeing PG&E’s financial and regulatory accounting and 11
reporting in accordance with Generally Accepted 12
Accounting Principles and other regulatory requirements as 13
promulgated by the California Public Utilities Commission 14
(CPUC or Commission), FERC, and other regulatory 15
bodies; 16
• Establishing and implementing PG&E’s accounting policies; 17
• Working closely with external auditors on matters 18
involving PG&E; 19
• Monitoring monthly financial performance for the enterprise; 20
and 21
• Providing financial forecasts for the enterprise. 22
b) Capital Accounting 23
Capital Accounting is responsible for providing timely 24
accounting of PG&E’s fixed assets, establishing the 25
capitalization policies for PG&E and providing capital recovery 26
analysis for regulatory filings. The Capital Accounting section is 27
composed of the senior director’s office and three subsections: 28
Capital Accounting; Capital Advice; and Capital Recovery. 29
• Capital Accounting: Capital Accounting closes the books 30
monthly for plant, accumulated depreciation, and other 31
12 Exhibit (PG&E-9), WP 2-8, line 3.

(PG&E-9)
2-9
capital-related items; calculates Allowance for Funds Used 1
During Construction (AFUDC); records and analyzes 2
depreciation and asset retirement obligations; and accounts 3
for property sales and assists in preparing regulatory filings 4
for approval of such sales. 5
• Capital Advice: Capital Advice informs business partners 6
on the accounting implications of alternative transactions, 7
determines the appropriate accounting treatment of complex 8
issues, and supports the LOBs with the application of 9
Company accounting policies and procedures. 10
• Capital Recovery: Capital Recovery analyzes AFUDC, 11
cost of removal, depreciation, and decommissioning. 12
Additionally, Capital Recovery performs revenue 13
requirement calculations and regulatory analyses for rate 14
base and depreciation for the GRC, Gas Transmission and 15
Storage Rate Case, the Transmission Owner Rate Case 16
(filed with FERC), and separately-funded projects. 17
c) Corporate Accounting 18
Corporate Accounting maintains the financial records for 19
PG&E. This section prepares external financial reports and 20
provides research, analyses, and advice on the accounting 21
impacts of regulatory developments, significant business 22
transactions, and implementation of PG&E’s accounting 23
policies. The Corporate Accounting section is composed of the 24
senior director’s office and two subsections: Corporate 25
Accounting; Accounting Advice and External Reporting. 26
• Corporate Accounting: The Corporate Accounting section 27
is responsible for the monthly close and reporting activities. 28
Specifically, the section records and reconciles 29
customer-related and revenue-related accounts, analyzes 30
revenue-related transactions for appropriate accounting 31
treatment, and reconciles over 50 bank accounts. The 32
section also analyzes and reconciles various employee 33
benefits (including equity-based compensation and pension 34

(PG&E-9)
2-10
and post-retirement benefits accounts); records and 1
reconciles all intercompany-related transactions; files the 2
annual Significant Utility Affiliate Transactions Report with 3
the CPUC; and records and reconciles energy-related cost 4
accounts, balancing accounts, and regulatory asset and 5
liability accounts. 6
• Accounting Advice and External Reporting: Accounting 7
Advice and External Reporting prepares external financial 8
reports and provides analyses and advice on the accounting 9
impacts of regulatory developments, significant business 10
transactions, and new accounting policies. The section also 11
develops guidance on new accounting pronouncements and 12
financial reporting disclosures, facilitates subsequent review 13
and concurrence from independent auditors, develops the 14
overall financial accounting policy, prepares the Utility’s 15
financial reports filed with the SEC, the FERC, and the 16
CPUC (e.g., 77-M), and prepares employee benefit plan 17
financial statements and related regulatory filings. 18
d) Financial Forecasting and Revenue Requirements 19
Financial Forecasting and Revenue Requirements plans 20
and forecasts the Company’s overall financial performance at 21
the enterprise level and calculates revenue requirements for 22
major rate cases. Additionally, the team manages the Utility’s 23
capital structure and identifies the Utility’s financing needs. In 24
addition, they provide a financing plan to the Treasury 25
Department for use in ensuring the Company has access to 26
liquidity to support its operations and energy procurement 27
programs. 28
Financial Forecasting and Revenue Requirements is 29
comprised of the director’s office and three subsections: 30
Financial Forecasting and Modeling; Financial Analysis and 31
Reporting; and Revenue Requirements and Cost Analysis. 32
• Financial Forecasting and Modeling: Financial 33
Forecasting and Modeling section provides long-term 34

(PG&E-9)
2-11
financial forecasts for the Board of Directors, senior 1
management, regulatory filings, and credit rating agencies. 2
In addition, it monitors the Company’s capital structure and 3
develops monthly forecasts and variance analyses of 4
operating interest expense, holding company earnings, and 5
shares outstanding. 6
• Financial Analysis and Reporting: Financial Analysis and 7
Reporting provides enterprise-level analysis and reporting 8
for financial performance, oversight and management of 9
corporate item costs and revenues, and manages the 10
enterprise annual budget. In addition, the section develops 11
year-over-year and long-term budgets and forecasts for 12
each corporate revenue and expense item, supports 13
monthly and quarterly close activities, and provides analytic 14
support to senior management and Investor Relations. 15
• Revenue Requirements and Cost Analysis: This group 16
supports regulatory filings by providing regulatory analysis 17
and Results of Operations (RO) modeling. Responsibilities 18
include providing revenue requirement calculation and 19
analysis using the RO model, developing cost recovery 20
mechanisms, and supporting regulatory proceedings. 21
e) Tax Department 22
The Tax section is responsible for all federal and state 23
income tax matters and all property and sales/use tax matters. 24
The section monitors and analyzes PG&E’s taxes with the 25
objective of keeping taxes as low as possible for its customers. 26
Additionally, the Tax section is responsible for compliance with 27
federal and state income tax laws. 28
The Tax Section is composed of the VP’s office and 29
four subsections: Tax Accounting; Tax Compliance; Tax Audit 30
and Regulatory Support; and Client Service Initiatives. 31
• Tax Accounting: Tax Accounting is responsible for 32
calculating current, deferred, and forecasted income taxes 33
included in the Company’s financial statements, SEC 34

(PG&E-9)
2-12
Forms 10Q and 10K, and FERC Form 1. The section is 1
also responsible for analyzing tax issues attributable to the 2
implementation of new and constantly changing accounting 3
standards. Changes in accounting standards could cause 4
changes in tax accounting methods that, in most cases, 5
require permission from the Commissioner of the Internal 6
Revenue Service (IRS). 7
• Tax Compliance: Tax Compliance prepares all annual and 8
quarterly federal and state income tax filings, in compliance 9
with federal and state income tax laws. In addition, the 10
section also prepares and submits property tax filings with 11
the Board of Equalization (BOE). Tax Compliance performs 12
asset valuations and property appraisals for actual and 13
proposed purchase, sale, or retirements of the Company’s 14
assets. 15
• Tax Audit and Regulatory Support: Tax Audit and 16
Regulatory Support interacts extensively with the IRS, BOE, 17
and Franchise Tax Board and, if necessary, represents 18
PG&E from the initial examination, through the appeals 19
process and in tax litigation. Additionally, this section 20
develops the Company’s income tax estimates and related 21
testimony for CPUC and FERC ratemaking proceedings. 22
This section also responds to tax regulatory inquiries and 23
provides tax analysis and advice on regulatory matters. 24
• Client Services Initiatives: Client Services Initiatives 25
provides income tax research and planning advice on 26
proposed PG&E transactions and for analysis of new tax 27
legislation. 28
d. Investor Relations 29
PG&E’s Investor Relations Department structures and facilitates 30
PG&E’s communication with investors regarding financial performance 31
and future expectations, including information about key milestones, 32
regulatory decisions or proposed decisions, operational risks and other 33
issues. Investor Relations’ functions provide substantial benefit to the 34

(PG&E-9)
2-13
Company and its customers as they are critical for access to capital 1
markets that enable the Company to obtain funding for infrastructure 2
investments. 3
Investor Relations is composed of the Senior Director’s office and 4
the Investor Relations Department. The Investor Relations section is 5
responsible for ensuring PG&E complies with the SEC rules and 6
regulations pertaining to communication with investors. In addition, the 7
Investor Relations section helps ensure PG&E has access to financial 8
markets required to support investment in the electric and gas 9
infrastructure necessary to ensure safe and reliable service. 10
At the end of 2020, PG&E’s Investor Relations Department 11
consisted of three FTEs.13 12
e. Treasury 13
1) Department Overview 14
PG&E’s Treasury Department is responsible for optimizing 15
PG&E’s capital structure, executing all financing transactions, all 16
payment services functions and ensuring sufficient liquidity to 17
support the business, corporate, and strategic objectives. Treasury 18
communicates with fixed-income investors, bankers, and rating 19
agencies regarding PG&E’s financial performance and future 20
expectations, including financing needs. 21
Treasury functions are critical for the issuance and management 22
of bank credit facilities and financial securities, which enables the 23
Company to support ongoing operational activities and obtain 24
funding for infrastructure investments. In addition, Treasury is 25
responsible for the management of retirement, disability, and other 26
benefits trust assets. 27
The Treasury Department is composed of the VP’s office and 28
five sections: Banking and Money Management; Investments and 29
Benefit Finance; Payment Services; Strategic Analysis; and 30
Economic and Project Analysis. 31
13 Exhibit (PG&E-9), WP 2-8, line 6.

(PG&E-9)
2-14
At the end of 2020, PG&E’s Treasury Department consisted of 1
57 FTEs.14 2
2) Functions of Department 3
a) VP Treasury 4
The responsibilities of the VP Treasury’s office include 5
management and supervision of all treasury functions. 6
Specifically, the VP and Treasurer’s office ensures that: 7
• Financing is properly evaluated and executed to meet 8
capital requirements, new and existing debt is managed, 9
short-term borrowings and investments are executed to 10
manage liquidity, and necessary bank services are provided 11
to Utility departments; 12
• Trusts related to employee benefits at both the Utility and 13
PG&E Corporation are properly managed; 14
• Accounts payable and payroll functions are executed 15
accurately; 16
• Financial analysis of key strategic activities are executed; 17
and 18
• Project managers evaluating financial viability of projects 19
and initiatives are supported. 20
b) Banking and Money Management 21
The Banking and Money Management section executes 22
financing transactions necessary for investments in 23
infrastructure to serve PG&E’s customers. In addition, by 24
minimizing interest expense and financial transaction costs, 25
Banking and Money Management helps manage some of 26
PG&E’s costs. Banking and Money Management is responsible 27
for: 28
• Setting enterprise-wide corporate finance policies such as 29
dividend, capital structure, and liquidity; 30
14 Exhibit (PG&E-9), WP 2-8, line 7.

(PG&E-9)
2-15
• Establishing and maintaining effective relationships with 1
banks, rating agencies, and fixed-income investors; 2
• Implementing and executing financing transactions to meet 3
PG&E’s capital requirements; 4
• Managing PG&E’s new and existing debt, preferred stock, 5
and common equity to minimize the long-term cost of capital 6
while maintaining access to capital markets; 7
• Managing PG&E’s cash flows to ensure sufficient liquidity to 8
meet all corporate obligations; 9
• Managing short-term borrowing (Commercial Paper 10
Program) and short-term investments; and 11
• Assisting other PG&E departments in implementing 12
necessary bank services, such as electronic account 13
reconciliation, check fraud detection and prevention, and 14
alternative customer payment options. 15
c) Investments and Benefit Finance 16
The Investments and Benefit Finance section is responsible 17
for ensuring appropriate funding and investment management of 18
all external trust assets maintained by PG&E, and its holding 19
company, PG&E Corporation, including PG&E’s Retirement 20
Plan, Post-Retirement Benefits Other Than Pensions medical 21
and life insurance plans, as well as its Long-Term Disability 22
(LTD) plan. Contributions and costs related to the LTD plan are 23
discussed further and requested in Exhibit (PG&E-7), 24
Chapter 1A. Contributions and costs related to all other trust 25
accounts are discussed further and requested in 26
Exhibit (PG&E-8), Chapter 4. 27
Investments and Benefit Finance serves as staff to the 28
PG&E Corporation Employee Benefit Committee for assets 29
related to Employee Benefit programs and as staff to the PG&E 30
Nuclear Facilities Decommissioning Master Trust Committee for 31
assets held for decommissioning PG&E’s nuclear power plants. 32
For these committees, Investments and Benefit Finance makes 33
recommendations pertaining to all aspects of investment 34

(PG&E-9)
2-16
management, including investment policy and asset allocation, 1
as well as asset class and investment management structure. 2
In addition, Investments and Benefit Finance monitors quarterly 3
investment performance and reviews funded status. 4
A small portion of the employee benefit assets managed by 5
the Investments and Benefit Finance section are associated 6
with PG&E Corporation employees. PG&E Corporation does 7
not have its own investments and benefit finance organization. 8
Using an allocation based on employee headcount, PG&E has 9
allocated 0.03 percent of the section costs to PG&E 10
Corporation. The allocation percentage was calculated by 11
taking the total number of PG&E Corporation employees as 12
a percentage of total Company employees. 13
d) Payment Services 14
Payment Services provides timely and accurate payments 15
to employees, vendors, and other third parties. Payment 16
Services also maintains compliance with employment tax 17
reporting and payment requirements, administers employee 18
expense reimbursements, and maintains records associated 19
with Company credit cards and Purchasing Cards. 20
Payment Services is composed of two subsections: 21
Accounts Payable and Payroll. 22
• Accounts Payable: Accounts Payable makes timely and 23
accurate payments to vendors and employees and retains, 24
organizes, and manages source documents as required by 25
PG&E’s procedures, government agencies, and regulators. 26
The section processes all invoices and employee expense 27
reimbursement checks. In addition, Accounts Payable 28
administers the Corporate Credit Card Program and the 29
Petty Cash Program, reconciles Accounts Payable-related 30
General Ledger accounts, provides tax withholding and 31
reporting as required, and maintains all Accounts 32
Payable-related master files and control tables. 33

(PG&E-9)
2-17
• Payroll: The Payroll Department’s primary function is to 1
pay all employees and pensioners correctly, on time, and in 2
compliance with bargained contracts, laws, ordinances, 3
regulations, or mandated requirements. In addition, Payroll 4
is responsible for disbursement of payroll taxes, overseeing 5
garnishments and the production of periodic filings, and 6
reporting requirements such as payroll tax filings, W-2s for 7
employees, and 1099-Rs for pensioners. 8
e) Strategic Analysis 9
Strategic Analysis performs Utility and Corporation strategic 10
analyses, focusing primarily on the financial aspects of key 11
strategy activities. Strategic Analysis’ workload includes 12
specific projects for Utility clients. Additionally, Strategic 13
Analysis partners with the Corporate Strategy organization, 14
consolidates information, and prepares analytics and 15
recommendations that enable informed decision making by 16
PG&E senior management as well as the Board of Directors. 17
f) Economic and Project Analysis 18
Economic and Project Analysis provides economic and 19
financial advice and analysis to support project managers in 20
evaluating PG&E projects and initiatives; performs valuations of 21
assets and liabilities; evaluates the impact of financing decisions 22
and other financial impacts; analyzes recovery of the cost of 23
capital, discount rates, capital structure, debt equivalency, 24
incentive earnings, and credit capability. 25
f. Finance and Planning 26
1) Department Overview 27
Finance and Planning coordinates the Company’s financial 28
planning processes, including the timing and methods to complete 29
detailed financial plans for the organization. The department is 30
responsible for all versions of plan, budget, and target data in SAP. 31

(PG&E-9)
2-18
At the end of 2020, the Finance and Planning Department 1
consisted of 50 FTEs.15 2
2) Functions of Department 3
a) Enterprise Planning & Reporting 4
Enterprise Planning and Reporting facilitates PG&E’s 5
annual budgeting process. The section provides guidelines, 6
requirements, and support for annual financial and operational 7
targets for the Company through the 5-year Integrated Planning 8
Process, specifically Sessions 1 and 2, and manages monthly 9
financial and operations reviews with senior management. 10
b) Enterprise Project Management 11
Enterprise Project Management supports senior 12
management in PG&E’s project approval and tracking process; 13
develops and implements project governance, quality 14
improvements to project management, financial controls and 15
budget planning policies and procedures for PG&E projects; and 16
provides business case facilitation, training, tools and support 17
for PG&E projects. 18
c) Enterprise Continuous Improvement 19
Enterprise Continuous Improvement focuses on improving 20
utility performance in specific operational areas. Specifically, 21
the section supports continuous improvement and process 22
improvement within the LOBs and across the Company. The 23
department also focuses on improving safety, human 24
performance, quality, and efficiency. 25
3. 2023 Forecast Drivers 26
Figure 2-1 above shows the Finance Organization cost drivers for the 27
2023 forecast. Each of the drivers is discussed below: 28
15 Exhibit (PG&E-9), WP 2-8, line 4. Excludes vacancies.

(PG&E-9)
2-19
a. Labor Escalation 1
PG&E forecasts annual labor escalation of $1.3 million based on the 2
escalation factors provided in Exhibit (PG&E-8), Chapter 4. 3
b. Staffing (FERC 920 and 921) 4
The Finance Organization has continued to support the needs of the 5
enterprise while reducing its headcount over time. For 2023, PG&E 6
forecasts a total staffing level in the Finance Organization of 7
347 FTEs,16 which is a reduction of 31 FTEs (8 percent) compared to 8
2020. The staffing decrease will occur through natural attrition and by 9
not backfilling for other vacancies. The FTE reductions are primarily 10
attributable to an on-going drive for continuous process improvements. 11
The 2023 forecast headcount of 347 FTEs represents a 15 percent total 12
reduction in the size of the organization since 2017. 13
c. Contracts and Fees (FERC 923) 14
PG&E forecasts a $6.4 million reduction in 2023. Finance uses 15
consultants to provide a variety of support services to the organization 16
such as audits, payroll services, actuarial analysis, and other financial 17
services. The forecast reduction is primarily attributable to non-recurring 18
consulting work performed in 2020, which is not planned for 2023. 19
C. Companywide Expense 20
1. Bank Fees 21
Utility bank fees represent the fees charged for depository, 22
disbursement, custody, and trustee-related services. Utility bank fees also 23
include all fees associated with the Utility’s working capital facilities. 24
These costs are included in the estimate of bank fees recorded to FERC 25
Account 930. For 2023, PG&E’s forecast for Bank Fees is $10.7 million, 26
which represents a 22 percent increase compared to 2020 recorded 27
costs.17 PG&E’s forecast of bank fees for 2023 is based on actual 28
expenses in 2020 adjusted for any planned capital structure changes and 29
16 Exhibit (PG&E-9), WP 2-8, line 8. 17 See Table 2-3, line 5. Also, Exhibit (PG&E-9), WP 2-77 for additional information about
forecast methodology and assumptions.

(PG&E-9)
2-20
anticipated changes in contract terms. The increase compared to 2020 is 1
primarily driven by an increase in Letter of Credit fees related to Letters of 2
Credit supporting real estate transactions as well as upfront and other fees 3
associated with the Accounts Receivable facility put in place in late 2020. 4
D. IT Projects 5
The Finance Organization forecasts $468 thousand in expense costs in 6
2023 to perform ongoing maintenance of its current systems for software 7
upgrades and manufacturer obsolescence. These costs are summarized in 8
Table 2-4. 9
These costs are forecasted in MWC JV (Maintain Applications and 10
Infrastructure) and include costs for ongoing maintenance, operations, and 11
repair for PG&E’s applications, systems, and infrastructure, primarily to the SAP 12
financial system. As part of the normal course of business, PG&E must upgrade 13
and enhance its SAP financial system to maintain functionality and security. 14
SAP is one of PG&E’s most critical platforms and touches virtually all aspects of 15
the Company’s financial operations. 16
E. Corporate Risk: Liquidity Management 17
Liquidity risk is one of PG&E’s top financial risks and is on the Corporate 18
Risk Register. As such, PG&E describes the nature of the risk and its mitigation 19
efforts in this section. There is no separate forecast for this item. 20
Liquidity risk is defined as the inability to meet financial obligations as they 21
come due. The consequences of a significant liquidity event include operational 22
impacts such as vendors curtailing deliveries of key supplies needed to maintain 23
safe and reliable service, or financial impacts such as acceleration of payments, 24
higher cost financing, or financial distress. Key drivers of liquidity risk include 25
catastrophic events leading to extraordinary claims against PG&E, margin 26
activity related to energy procurement contracts, customer billing and collection, 27
credit ratings, compliance with financial agreements, and access to capital 28
markets. In addition, the Utility’s substantial capital investment program requires 29
significant ongoing financing in the capital and bank loan markets, which 30
magnifies the potential impact of a liquidity risk event. 31
To manage liquidity risk, each month the Utility monitors forward-looking 32
liquidity risk metrics to ensure adequate liquidity even in the event of 33

(PG&E-9)
2-21
unexpected, unfavorable variances in cash flows. The Utility has access to 1
significant liquidity through revolving credit facilities, which are a common 2
resource for large companies and enable streamlined access to funds on a 3
same-day basis. The Utility can supplement these facilities with additional 4
liquidity through incremental financing when or if needed, subject to debt 5
authorization limits approved by the Commission. In a more extreme situation, 6
the Utility could implement more significant liquidity risk management measures 7
including cash conservation or non-traditional forms of financing. In addition to 8
the detective controls reviewed each month, the Utility has controls to monitor 9
compliance with financial agreements and market conditions. 10
Current areas of focus for liquidity risk management include delayed cost 11
recovery including coronavirus-related under-collections, managing debt 12
maturities related to PG&E’s rate neutral securitization application, and 13
improving credit ratings over time. 14
F. Cost Tables 15
The Finance organization’s recorded adjusted costs for 2020, forecast costs 16
for expense for 2021 through 2023, and capital expenditures for 2021 through 17
2023 are shown in Tables 2-1 through 2-4.18

(PG&E-9)
2-22
TAB
LE 2
-1
SUM
MA
RY
OF
DEP
AR
TMEN
T EX
PEN
SE
HIS
TOR
ICA
L A
ND
FO
REC
AST
(T
HO
USA
ND
S O
F N
OM
INA
L D
OLL
AR
S)
Line
N
o.
Des
crip
tion
Rec
orde
d Ad
just
ed
Fore
cast
W
orkp
aper
R
efer
ence
20
16
2017
20
18
2019
20
20
2021
20
22
2023
1 C
FO Im
med
iate
Offi
ce
$1,3
10
$1,3
85
$1,3
31
$534
$4
43
$368
$3
77
$387
W
P 2-
3, li
ne 4
8 2
Busi
ness
Fin
ance
9,
156
7,37
5 6,
314
6,26
6 5,
404
5,51
8 5,
685
5,85
8 W
P 2-
3, li
ne 3
5 3
Con
trolle
r 24
,193
22
,761
22
,064
20
,857
26
,458
19
,596
20
,418
19
,205
W
P 2-
3, li
ne 2
8 4
Inve
stor
Rel
atio
ns
873
822
1,00
7 1,
268
970
777
794
812
WP
2-4,
line
55
5 Tr
easu
ry
8,64
7 8,
488
9,29
8 7,
853
8,15
5 8,
029
8,23
1 8,
441
WP
2-4,
line
62
6 Fi
nanc
e an
d Pl
anni
ng
5,72
7 12
,185
14
,116
8,
401
7,91
6 7,
932
8,14
9 8,
374
WP
2-3,
line
13
7 Bu
sine
ss F
inan
ce –
OS
13,6
02
11,6
09
9,37
9 9,
527
11,2
10
10,7
72
11,0
64
11,3
65
WP
2-3,
line
21
8 To
tal
$63,
508
$64,
625
$63,
510
$54,
707
$60,
554
$52,
991
$54,
717
$54,
441
WP
2-3,
line
6
TAB
LE 2
-2
SUM
MA
RY
OF
DEP
AR
TMEN
T EX
PEN
SE B
Y FE
RC
AC
CO
UN
T (T
HO
USA
ND
S O
F N
OM
INA
L D
OLL
AR
S)
Line
N
o.
Des
crip
tion
Rec
orde
d Ad
just
ed
Fore
cast
W
orkp
aper
R
efer
ence
20
16
2017
20
18
2019
20
20
2021
20
22
2023
1 O
rgan
izat
ion
View
2 92
0 –
Adm
in &
Gen
Sal
arie
s $3
8,26
3 $3
9,99
0 $3
7,17
7 $3
5,66
4 $3
5,15
3 $3
3,80
3 $3
4,84
1 $3
5,91
7 W
P 2-
3, li
ne 1
3
921
– O
ffice
Sup
plie
s &
Ex
1,19
0 71
0 1,
034
1,38
9 1,
039
1,28
2 1,
284
1,28
5 W
P 2-
3, li
ne 2
4
923
– O
utsi
de S
vc E
mpl
oy –
Util
ity
7,57
2 9,
396
12,4
17
6,86
1 10
,854
5,
691
6,08
5 4,
431
WP
2-3,
line
3
5 92
3 –
Out
side
Svc
Em
ploy
– C
orp
2,88
1 2,
920
3,50
2 1,
265
2,29
8 1,
443,
1,
443
1,44
3 W
P 2-
3, li
ne 4
6
OS
13,6
02
11,6
09
9,37
9 9,
527
11,2
10
10,7
72
11,0
64
11,3
65
WP
2-3,
line
5
7 To
tal
$63,
508
$64,
625
$63,
510
$54,
707
$60,
554
$52,
991
$54,
717
$54,
441
WP
2-3,
line
6

(PG&E-9)
2-23
TAB
LE 2
-3
CO
MPA
NY
WID
E EX
PEN
SES
– B
AN
K F
EES
(TH
OU
SAN
DS
OF
NO
MIN
AL
DO
LLA
RS)
Line
N
o.
Des
crip
tion
Rec
orde
d Ad
just
ed
Fore
cast
W
orkp
aper
R
efer
ence
20
16
2017
20
18
2019
20
20
2021
20
22
2023
1 Ba
nk S
ervi
ce F
ees
$1,4
64
$1,6
21
$1,2
83
$3,0
65
$1,6
37
$1,3
00
$1,3
03
$1,3
07
WP
2-91
, lin
e 1
2 Tr
uste
e Fe
es
171
174
186
20
201
40
20
20
WP
2-91
, lin
e 2
3 LO
C F
ees
94
92
107
800
1,44
4 3,
639
3,64
8 1,
750
WP
2-91
, lin
e 3
4 Ba
nk C
redi
t Fee
s 2,
630
3,11
9 2,
928
19,0
74
5,52
7 7,
828
8,64
9 7,
672
WP
2-91
, lin
e 4
5 To
tal
$4,3
59
$5,0
06
$4,5
04
$22,
959
$8,8
09
$12,
807
$13,
619
$10,
749
WP
2-91
, lin
e 5
TAB
LE 2
-4
EXPE
NSE
S B
Y M
WC
(T
HO
USA
ND
S O
F N
OM
INA
L D
OLL
AR
S)
Line
N
o.
MW
C
Des
crip
tion
Rec
orde
d Ad
just
ed
Fore
cast
W
orkp
aper
R
efer
ence
20
16
2017
20
18
2019
20
20
2021
20
22
2023
1 JV
M
aint
ain
IT A
pps
& In
fra
$4,7
99
$1,4
94
$867
$8
36
$819
$4
68
$468
$4
68
WP
2-78
, lin
e 1
2 To
tal
$4
,799
$1
,494
$8
67
$836
$8
19
$468
$4
68
$468
W
P 2-
78, l
ine
2

(PG&E-9)
-i-
PACIFIC GAS AND ELECTRIC COMPANY 2023 GENERAL RATE CASE
Testimony _____x________ Workpapers ____________ SOQ ______________ Exhibit Number: ____9____ Chapter Number: ___2____ Chapter Title: Finance Witness Name: Travis Britanik Page No.
Line No. Item As Filed As Corrected
Errata as of November 5, 2021
2-1 20 Forecast Cost $54.5 $54.4
2-3 Figure 2-1 Forecast Cost Replaced Figure Replaced Figure
2-20 15 Forecast Cost $7.6 $6.4
2-23 Table 2-1 Forecast Cost line 1, 2022: 378 line 1, 2023: 388 line 3, 2021: 19,606 line 3, 2022: 20,428 line 3, 2023: 19,215 line 4, 2021: 778 line 4, 2022: 795 line 4, 2023: 813 line 5, 2021: 8,032 line 5, 2022: 8,235 line 5, 2023: 8,444 line 8, 2021: 53,006 line 8, 2022: 54,734 line 8, 2023: 54,456
line 1, 2022: 377 line 1, 2023: 387 line 3, 2021: 19,596 line 3, 2022: 20,418 line 3, 2023: 19,205 line 4, 2021: 777 line 4, 2022: 794 line 4, 2023: 812 line 5, 2021: 8,029 line 5, 2022: 8,231 line 5, 2023: 8,441 line 8, 2021: 52,991 line 8, 2022: 54,717 line 8, 2023: 54,441
2-23 Table 2-1 Forecast Cost line 2, 2021: 33,801 line 2, 2022: 34,842 line 2, 2023: 35,916 line 3, 2021: 1,283 line 3, 2022: 1,285
line 2, 2021: 33,803 line 2, 2022: 34,841 line 2, 2023: 35,917 line 3, 2021: 1,282 line 3, 2022: 1,284

(PG&E-9)
-ii-
Page No.
Line No. Item As Filed As Corrected
line 3, 2023: 1,286 line 5, 2021: 1,458 line 5, 2022: 1,458 line 5, 2023: 1,458 line 7, 2021: 53,006 line 7, 2022: 54,734 line 7, 2023: 54,456
line 3, 2023: 1,285 line 5, 2021: 1,443 line 5, 2022: 1,443 line 5, 2023: 1,443 line 7, 2021: 52,991 line 7, 2022: 54,717 line 7, 2023: 54,441

(PG&E-9)
PACIFIC GAS AND ELECTRIC COMPANY
CHAPTER 3
RISK, AUDIT, AND INSURANCE DEPARTMENTS
[INCLUDES NOVEMBER 5, 2021 ERRATA]

(PG&E-9)
3-i
PACIFIC GAS AND ELECTRIC COMPANY CHAPTER 3
RISK, AUDIT, AND INSURANCE DEPARTMENTS
TABLE OF CONTENTS
A. Introduction ....................................................................................................... 3-1
B. Department Costs ............................................................................................. 3-2
1. Summary of Forecast ................................................................................. 3-2
2. Organization Description ............................................................................ 3-3
a. The Vice President and Chief Audit Officer ......................................... 3-3
b. Market and Credit Risk Management (M&CRM) ................................. 3-4
c. Internal Audit ....................................................................................... 3-5
d. Insurance and Loss Control ................................................................. 3-6
e. SOX Compliance ................................................................................. 3-7
f. TPRM .................................................................................................. 3-7
3. 2023 Forecast Drivers ................................................................................ 3-8
a. Labor Escalation .................................................................................. 3-8
b. Staffing ................................................................................................ 3-8
c. Contracts ............................................................................................. 3-9
C. Insurance Companywide Expense ................................................................. 3-10
1. PG&E Works to Find Capacity and Manage the Cost of its Insurance Program ................................................................................................... 3-11
a. PG&E Works With Expert Insurance Brokers to Fill its Insurance Needs ................................................................................................ 3-11
b. PG&E Maintains Large Deductibles for Commercial Insurance Products ............................................................................................ 3-12
c. PG&E Is Working to Incorporate Self-Insurance Into Its Program ..... 3-12
d. PG&E Evaluates Other Market-Based Alternative Insurance Products That May Offer Better Pricing and Additional Capacity ....... 3-12
1) Captives ...................................................................................... 3-12
2) Catastrophe (CAT) Bonds ........................................................... 3-13

(PG&E-9) PACIFIC GAS AND ELECTRIC COMPANY
CHAPTER 3 RISK, AUDIT, AND INSURANCE DEPARTMENTS
TABLE OF CONTENTS
(CONTINUED)
3-ii
3) Parametric Insurance .................................................................. 3-14
2. Summary of Forecast ............................................................................... 3-14
3. PG&E’s Insurance Forecast ..................................................................... 3-16
a. Property Insurance ............................................................................ 3-16
1) Non-Nuclear Property Insurance ................................................. 3-16
2) Nuclear Property Insurance ......................................................... 3-19
3) Other Property Insurance ............................................................ 3-20
b. Liability Insurance .............................................................................. 3-21
1) General Liability Insurance .......................................................... 3-21
2) Other Liability Insurance ............................................................. 3-43
3) Directors and Officers Liability Insurance .................................... 3-45
c. PG&E Corporation Allocation ............................................................ 3-46
D. Information Technology Projects .................................................................... 3-47
1. M&CRM ................................................................................................... 3-47
E. Cost Tables .................................................................................................... 3-48

(PG&E-9)
3-1
PACIFIC GAS AND ELECTRIC COMPANY 1
CHAPTER 3 2
RISK, AUDIT, AND INSURANCE DEPARTMENTS 3
A. Introduction 4
Pacific Gas and Electric Company’s (PG&E, the Company or the Utility) Risk 5
and Audit organization is responsible for overseeing PG&E’s Market and Credit 6
Risk Management (M&CRM), Internal Audit (IA), Insurance and Loss Control, 7
Sarbanes Oxley (SOX) compliance, and Third Party Risk Management (TPRM) 8
and other functions that help the Company manage its key risks. 9
In the 2020 General Rate Case (GRC), the Risk, Audit, and Insurance 10
chapter included the responsibilities of the Chief Risk Officer (CRO) and the 11
Enterprise and Operational Risk Management (EORM) department. In 2020, to 12
further strengthen PG&E’s enterprise-wide risk mitigation and operational safety 13
capabilities, PG&E split the duties of CRO into two distinct roles: CRO and 14
Chief Audit Officer. As a result, for the 2023 GRC, the EORM department was 15
separated from Risk, Audit, and Insurance. EORM’s 2023 policy testimony is in 16
Exhibit (PG&E-2), Chapter 1 and its costs are forecast in Exhibit (PG&E-7) 17
Chapter 11. 18
The forecasted costs of the Risk, Audit and Insurance departments are 19
shown in Tables 3-1 through 3-13. PG&E requests that the California Public 20
Utilities Commission (CPUC or Commission) adopt its forecast for 2023 as 21
follows: 22
Department Costs – $13.2 million in expense in 2023.1 This is $1 million 23
(approximately 8.2 percent) higher than the 2020 recorded adjusted amount of 24
$12.2 million.2 The increase is driven primarily by labor escalation, staffing, and 25
is partially offset by lower staff augmentation and consulting service costs. 26
Companywide Insurance Expenses – $907.1 million in expense in 2023.3 27
This represents a decrease of approximately 1 percent compared to 2020 28
1 See Table 3-9, line 3 and Table 3-10, line 5. 2 See Table 3-9, line 3 and Table 3-10, line 5. 3 See Table 3-11, line 19. PG&E requests an additional $75 million for each year 2024-
2026 for wildfire liability insurance as part of its Post Test-Year Ratemaking proposal (See Exhibit 11, Ch. 2).

(PG&E-9)
3-2
recorded costs.4 The 2020 recorded costs include approximately $360 million of 1
one-time costs that are not expected to recur in 2023.5 The 2023 forecast 2
reflects approximately a 63 percent increase compared to the 2020 recorded, 3
adjusted when accounting for the removal of the non-recurring items. As 4
described below, PG&E’s forecast is based on the cost of its most recent 5
renewal from April 2021, which is the most recent cost data available. 6
In Decision (D.) 20-12-005, the Commission authorized a new Risk Transfer 7
Balancing Account (RTBA) for general liability insurance costs and authorized 8
the use of self-insurance. PG&E requests authority to continue the RTBA for the 9
2023 GRC period. Additionally, PG&E proposes to designate a portion of the 10
wildfire insurance liability insurance revenue requirement for the use of 11
self-insurance to reduce reliance on the limited insurance market. As required 12
by D.20-12-005, PG&E reports on the status of the self-insurance for the 2020 13
GRC period in Section C.4. 14
Information Technology (IT) Project Costs – $104 thousand in expense for 15
2023.6 PG&E also requests that the Commission adopt its capital expenditure 16
forecast of $1.0 million for 2022, $0.5 million per year in 2023, 2024, 2025, and 17
2026 for IT projects.7 The IT projects support M&CRM’s technology initiatives.8 18
Tables 3-12 and 3-13 include forecasts for each year 2021-2023 for expense 19
and 2021-2026 for capital, respectively. 20
B. Department Costs 21
1. Summary of Forecast 22
A description of the M&CRM, IA, Insurance and Loss Control, SOX, and 23
TPRM organization’s activities is provided in Section B.2. Figure 3-1 shows 24
the primary drivers for overall department costs, from 2020 recorded 25
adjusted costs to the 2023 forecast. The cost drivers for the 2023 forecast 26
are discussed in Section B.3. 27
4 See Table 3-11, lines 19-20. 5 These relate primarily to accelerated expense recognition of future premiums and the
purchase of additional Directors and Officers liability insurance in 2020. 6 See Table 3-12, line 2. 7 See Table 3-13, line 2. 8 See Section D for discussion.
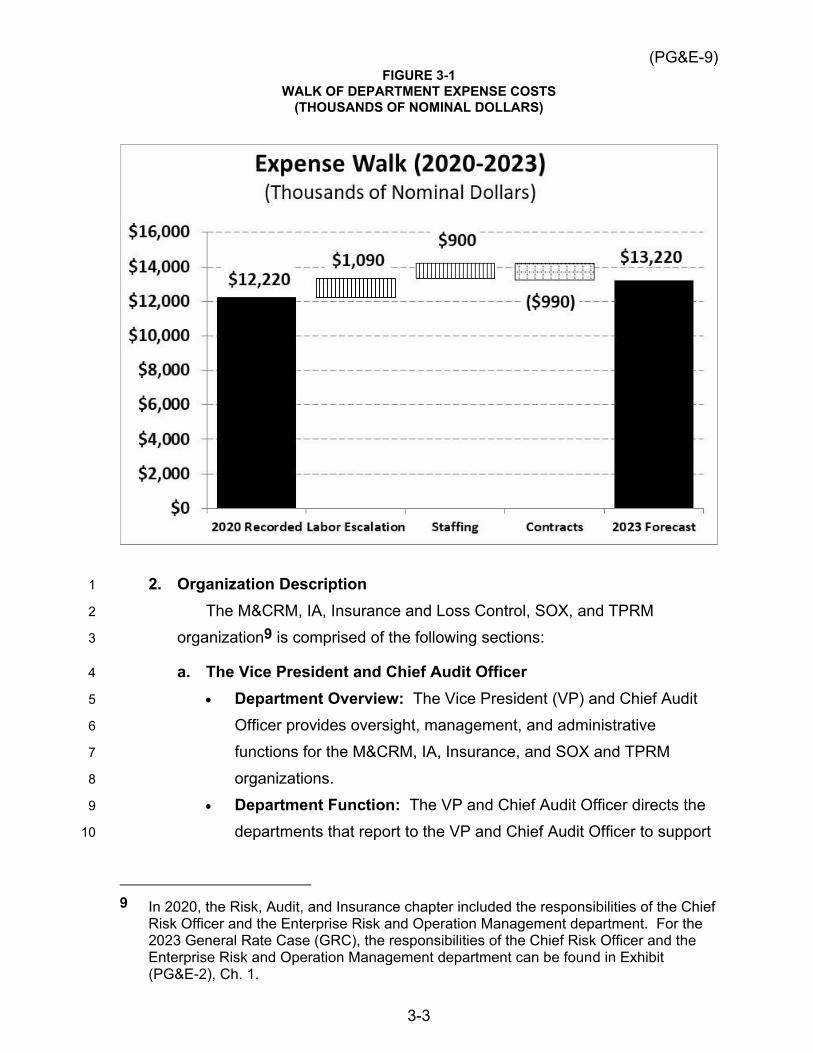
(PG&E-9)
3-3
FIGURE 3-1 WALK OF DEPARTMENT EXPENSE COSTS
(THOUSANDS OF NOMINAL DOLLARS)
2. Organization Description 1
The M&CRM, IA, Insurance and Loss Control, SOX, and TPRM 2
organization9 is comprised of the following sections: 3
a. The Vice President and Chief Audit Officer 4
• Department Overview: The Vice President (VP) and Chief Audit 5
Officer provides oversight, management, and administrative 6
functions for the M&CRM, IA, Insurance, and SOX and TPRM 7
organizations. 8
• Department Function: The VP and Chief Audit Officer directs the 9
departments that report to the VP and Chief Audit Officer to support 10
9 In 2020, the Risk, Audit, and Insurance chapter included the responsibilities of the Chief
Risk Officer and the Enterprise Risk and Operation Management department. For the 2023 General Rate Case (GRC), the responsibilities of the Chief Risk Officer and the Enterprise Risk and Operation Management department can be found in Exhibit (PG&E-2), Ch. 1.

(PG&E-9)
3-4
the lines of business’ (LOB) risk management efforts and provides 1
independent risk oversight over PG&E’s energy procurement 2
function. The VP and Chief Audit Officer serves on enterprise-wide 3
governance committees (such as the Public Safety Risk Council, 4
Risk Policy Committee/Utility Risk Management Committee and 5
Wildfire Governance Steering Committee), on LOB Risk and 6
Compliance Committees, and reports to the Audit Committee, and 7
Safety and Nuclear Oversight Committees of the Board of Directors. 8
The VP and Chief Audit Officer’s Immediate Office had 2 Full-Time 9
Equivalents (FTE) at the end of 2020—the VP and Chief Audit 10
Officer and an Administrative Assistant, who also supports two other 11
Directors within the team. 12
b. Market and Credit Risk Management (M&CRM) 13
• Department Overview: M&CRM measures and monitors market, 14
liquidity, and credit risk. 15
• Department Function: The M&CRM Department provides the 16
Utility critical services such as modeling and analysis, transaction 17
monitoring, and market and credit risk management of financial and 18
compliance risks of the multi-billion-dollar natural gas, nuclear fuel, 19
and electric procurement and sales functions. These risks include 20
volatile natural gas and electric markets, unauthorized trading, 21
counterparty defaults, and emerging markets. In addition, M&CRM 22
creates, analyzes, and manages energy procurement systems and 23
controls to ensure compliance with regulatory decisions and 24
mandates, and meet internal governance requirements. 25
M&CRM processes and systems which address financial and 26
compliance risks include counterparty credit exposure measures, 27
energy commodity risk measures and metrics, transaction 28
valuations, and price forecasts. Systems also include a commodity 29
trading and risk management application environment with an 30
automated control framework to manage trader limits, product 31
controls, term and transaction value limits, procurement strategies, 32
and associated controls and reporting. 33

(PG&E-9)
3-5
M&CRM uses several metrics to monitor energy 1
commodity-related risks for the Company, including counterparty 2
exposure, market risk and associated time-based risk metrics 3
including To-Expiration-Value-at-Risk (TeVaR), financial 4
Liquidity-at-Risk, and collateral management and concentration risk. 5
In addition, M&CRM supports the Sourcing organization with credit 6
analysis and guidance on credit processes. M&CRM had 26 FTEs 7
at the end of 2020, including one vacancy.10 8
c. Internal Audit 9
• Department Overview: IA provides independent, objective 10
assurance over the adequacy of processes and controls to manage 11
business risk and provides control advisory services. 12
• Department Function: IA is responsible for all internal audit 13
services and follows a standardized, disciplined approach to help 14
management evaluate and improve the effectiveness of risk 15
management, control, and governance processes. IA’s workplan 16
focus’ on the Utility’s key operational (including safety), financial, IT, 17
fraud and contract compliance, and compliance processes and 18
controls to manage risks associated with the process under review. 19
To meet its objectives and deliver cost-effective audit services, IA 20
develops a risk-based audit plan that focuses on the Company’s 21
most significant business risks. IA also provides control advisory 22
(CA) services to support the LOBs in defining all objectives to be 23
achieved in a process, identifying the risks inherent to that process, 24
and implementing controls commensurate with those risks. 25
The responsibilities assigned to IA are consistent with Institute 26
of Internal Auditors standards. IA regularly discusses its work and 27
coordinates efforts with the Company’s external auditors (currently 28
Deloitte & Touche LLP) to avoid duplication and overlap of audit 29
efforts. IA reports its performance through a combination of metrics 30
such as number of audits, number of control advisories, status of 31
10 Exhibit (PG&E-9), WP 3-6.

(PG&E-9)
3-6
open issues, and an aging of open issues. IA had 34 FTEs at the 1
end of 2020 which included seven vacancies.11 2
d. Insurance and Loss Control 3
• Department Overview: The Insurance department manages and 4
minimizes PG&E’s financial exposure to major risks of loss through 5
the procurement insurance. 6
• Department Function: The Insurance Department procures the 7
necessary financial risk transfer products on behalf of the Company 8
to protect against the potential risk of financial loss from PG&E’s 9
business operations, assets, and the delivery of electric and natural 10
gas services. The department has two functions: (1) Insurance and 11
(2) Loss Control. 12
− Insurance: The Insurance Department is responsible for 13
procuring and maintaining financial risk transfer products for the 14
following first and third-party risks: Wildfire Liability, General 15
Liability, Non-Nuclear Property, Nuclear Liability, Nuclear 16
Property, Directors and Officers (D&O) Liability, Fiduciary 17
Liability, Cyber Liability, Aviation and other smaller programs. 18
Lastly, the Insurance Department supports third-party 19
contracting by setting and reviewing insurance requirements in 20
vendor contracts to provide financial protection for PG&E, 21
securing surety bonds for LOBs, and supplying proof of 22
insurance documents. 23
– Loss Control: Loss Control consults with LOBs to reduce the 24
frequency and severity of potential losses, helps improve 25
operations and risk reduction efforts by inspecting PG&E 26
facilities and conducting loss control surveys, and provides risk 27
engineering support for large capital projects. This function also 28
manages PG&E’s pressure vessel permitting and compliance 29
program, which involves working with LOBs and state certified 30
11 Exhibit (PG&E-9), WP 3-6. The headcount and vacancies shown for Internal Audit on
WP 3-6 include those for Internal Audit, Insurance and Loss Control, SOX Compliance and TPRM discussed in the next sections.

(PG&E-9)
3-7
inspectors to inspect the utility’s pressure vessels and maintain 1
current operating permits as required by law. 2
Insurance had 5 FTEs at the end of 2020 including 3
one vacancy.12 4
e. SOX Compliance 5
• Department Overview: SOX Compliance oversees compliance 6
with the SOX Act requirements; 7
• Department Function: The SOX team is responsible for monitoring 8
and reporting on effectiveness of the PG&E Corporation’s and the 9
Utility’s internal control over financial reporting related to 10
Sections 302 and 404 of the SOX Act and providing technical 11
guidance and advice to the LOBs with respect to changes in the 12
Company’s systems, processes, and controls impacting SOX Act 13
compliance. The SOX team regularly discusses its work and 14
coordinates SOX compliance efforts with the Company’s external 15
Auditors to ensure effective use of resources. The SOX compliance 16
team had 8 FTEs at the end of 2020 which includes two 17
vacancies.13 18
f. TPRM 19
• Department Overview: TPRM is responsible for establishing 20
third-party registration and contract risk assessments requirements 21
and for monitoring compliance with those requirements. 22
• Department Function: TPRM is responsible for third-party 23
registration and contract risk screening process design, 24
implementation, oversight, training, and reporting to demonstrate 25
compliance with PG&E’s non-delegable duty to assess and mitigate 26
risks associated with services provided by third-party entities. 27
TPRM has 6 FTEs which includes three vacancies.14 28
12 Ibid. 13 Ibid. 14 Ibid.

(PG&E-9)
3-8
3. 2023 Forecast Drivers 1
M&CRM, Audit, and Insurance has three main drivers affecting the 2023 2
forecast: (1) Labor Escalation; (2) Staffing; and (3) Contracts. The details 3
of these drivers are discussed below. 4
a. Labor Escalation 5
For 2023, PG&E forecasts an increase of $1.1 million driven by 6
annual labor escalation. The forecast labor escalation rates can be 7
found in Exhibit (PG&E-8), Chapter 4, Compensation: Short-Term 8
Incentive Plan (STIP), Non-Qualified Retirement and Labor Escalation. 9
b. Staffing 10
PG&E forecasts a net staffing-related increase of $900 thousand for 11
2023. In 2020, the total staffing level in the M&CRM, Audit, SOX, TPRM 12
and Insurance organization was 81 FTEs, which included 14 vacancies. 13
PG&E’s 2023 forecast includes $900 thousand, which is approximately 14
half of the total cost of filling the existing vacancies. PG&E will absorb 15
the additional cost within its operating budget for 2023. For 2023, PG&E 16
intends to fill the 14 vacancies as follows: 17
• Internal Audit: IA will fill seven total vacant positions to provide 18
increased coverage over fraud, contract compliance, IT, Wildfire 19
Risk and Vegetation Management, and Operations. Three of the 20
seven positions have already been filled in the first half of 2021. 21
The remaining four vacancies include: (1) two new fraud positions 22
created in 2020, but which have not yet been filled, (2) one fraud 23
position that became vacant in 2020, and (3) one operational related 24
position that became vacant in 2019.15 25
• TPRM: TPRM will fill three vacancies that will support new vendor 26
registration and supply chain contract risk screening, and the 27
evaluation of the design and effectiveness of company’s contractor 28
oversight controls. One of these positions was filled the first quarter 29
of 2021. PG&E is in the process of hiring a second position as of 30
15 Exhibit (PG&E-9), WP 3-41 – for additional information about these positions. See also,
WP 3-85 for the job descriptions for these FTEs (the job posting for Internal Auditor, Senior (Operational) is being revised and is not included).

(PG&E-9)
3-9
the time of this filing. This employee will perform work previously 1
done by a contractor, resulting in a decrease in the staff 2
augmentation costs.16 3
• SOX Compliance: Sox Compliance will fill two vacancies. One of 4
these open positions was filled in the first quarter of 2021. The 5
other will replace a position filled by a contractor in 2020, resulting in 6
a decrease in the forecast staff augmentation costs.17 These 7
employees will strengthen the team’s ability to evaluate the design 8
and operating effectiveness of internal control over financial 9
reporting and will support the LOBs in the design and 10
implementation of new controls to reduce the risk of financial 11
reporting errors.18 12
• Insurance: One vacancy to support the procurement and 13
maintenance of financial risk transfer products.19 14
• M&CRM: One vacancy to perform credit-related duties and to 15
assist with the development, test and deployment of risk 16
management systems and models.20 17
c. Contracts 18
For 2023, PG&E forecasts a reduction in contracts of $1.0 million 19
due to lower staff augmentation and consulting service expenses 20
Approximately, $200 thousand of the reduction is attributable to PG&E’s 21
filling vacant FTE positions in SOX Compliance and TPRM for work 22
performed by contractors in 2020.21 23
16 Exhibit (PG&E-9), WP 3-46 – for additional information about these positions. See also,
WP 3-94 for the job descriptions for these FTEs (the job posting for Program Manager, Principal is being developed and is not included.).
17 Exhibit (PG&E-3), WP 3-13 – Schedule D3 Historical and Forecast Year over Year Walk.
18 Exhibit (PG&E-9), WP 3-49 – for additional information about these positions. See also, WP 3-96 for the job descriptions for these FTEs.
19 Exhibit (PG&E-9), WP 3-49 – for additional information about this position. See also, WP 3-102 for the job description for this FTE.
20 Exhibit (PG&E-9), WP 3-49 – for additional information about this position. See also, WP 3-100 for the job description for this FTE.
21 Exhibit (PG&E-3), WP 3-13 – Schedule D3 Historical and Forecast Year over Year Walk.

(PG&E-9)
3-10
C. Insurance Companywide Expense 1
PG&E maintains first-party property insurance to limit financial exposure for 2
unforeseeable losses of its assets due to catastrophes such as fires, 3
earthquakes, floods, or catastrophic operational losses. The Company also 4
maintains liability insurance to protect against third-party claims. It is a 5
reasonable business practice to procure and maintain financial protection for the 6
Utility’s risks through insurance and other risk transfer products.22 7
PG&E requests that the Commission adopt its insurance forecast of 8
approximately $907.1 million and authorize continuation of the RTBA as 9
described in this section. 10
The remainder of this section is organized as follows: 11
• Section C.1. – Describes how PG&E manages costs of insurance and 12
develops capacity options; 13
• Section C.2. – Summarizes PG&E’s 2023 Insurance Forecast; 14
• Section C.3. – Describes the various components of PG&E’s property and 15
liability insurance program and their associated forecasts. This includes a 16
discussion of the RTBA and PG&E’s request to continue the account for the 17
2023 GRC period. It also includes two proposals for the continued use of 18
self-insurance in PG&E’s 2023 insurance program, one of which would 19
adopt a separate revenue requirement specifically for self-insurance. This 20
section also reports on PG&E’s use of self-insurance in the 2020 GRC 21
period as required by the 2020 GRC settlement.23 22
22 The Commission noted the same in its decision in PG&E’s 2014 GRC. (See,
e.g., D.14-08-032, p. 550 (“Procuring excess liability insurance is a reasonable business practice;”) p. 713, Findings of Fact 260 (“Ratepayer funding of insurance premiums offers a reasonable way to limit risks of large, unforeseeable loss of utility property due to natural catastrophes.”).
23 A.18-12-009, Joint Motion of the Public Advocates Office, The Utility Reform Network (TURN), Small Business Utility Advocates (SBUA), Center for Accessible Technology, The National Diversity Coalition, of California Utility Employees, California City County Street Light Association, The Office of the Safety Advocate and PG&E for Approval of Settlement Agreement (Dec. 20, 2019), Attachment 1, (Settlement Agreement) p. 28, Section 2.8.3.3.

(PG&E-9)
3-11
1. PG&E Works to Find Capacity and Manage the Cost of its Insurance 1
Program 2
As discussed in more detail in Section C.3.b.1, the significant increase 3
in wildfire risk combined with the application of inverse condemnation to the 4
California Investor-Owned Utilities (IOU) have exponentially increased the 5
IOUs’ potential liability for claims arising from wildfires. The general liability 6
insurance market has responded with increased premiums and reductions in 7
available insurance capacity for products covering wildfire risk, thereby 8
reducing the amount of risk transfer PG&E can achieve through these 9
products.24 10
PG&E works diligently to manage the cost of insurance and find 11
available capacity where possible including: (1) working with expert 12
insurance brokers to place coverage for the Company; (2) maintaining high 13
deductibles to reduce premiums; (3) working to incorporate self-insurance 14
into its program structure; and (4) exploring alternative market-based 15
products that may offer better pricing and additional capacity compared to 16
traditional insurance. 17
a. PG&E Works With Expert Insurance Brokers to Fill its Insurance 18
Needs 19
One of the primary ways PG&E finds available capacity and 20
manages the costs of its insurance program is by working with large 21
insurance brokers as well as specialty broker who are experts in placing 22
insurance for energy companies. As part of the renewal process, 23
PG&E’s brokers extensively survey numerous market participants to 24
assess virtually all potential coverage opportunities available. The 25
brokers have access to global markets to assist with developing 26
insurance capacity options, to increase competition among prospective 27
counterparties, and to negotiate price and policy terms from offers 28
received. By working with these brokers, PG&E ensures that the price 29
and terms of the insurance products it purchases are consistent with 30
market conditions. 31
24 See Section C.3. for additional discussion of premiums and capacity.

(PG&E-9)
3-12
b. PG&E Maintains Large Deductibles for Commercial Insurance 1
Products 2
Another tool PG&E uses to manage the cost of insurance premiums 3
is maintaining large deductibles across its insurance programs. For 4
example, PG&E currently maintains liability insurance deductibles of 5
$10 million (non-wildfire) and $60 million (wildfire), and a non-nuclear 6
property deductible of $50 million. Insurance coverage begins only 7
when losses exceed the deductible. Retaining risk through large 8
deductibles can be an effective method for reducing insurance premium 9
costs as it lessens the financial exposure of insurance providers to loss 10
events, which is a consideration in the pricing of insurance. 11
c. PG&E Is Working to Incorporate Self-Insurance Into Its Program 12
As the price of wildfire liability insurance in the commercial market 13
continues to increase, the level of effective financial risk transfer 14
achieved by purchasing commercial policies continues to decrease. 15
PG&E is seeking to address this issue by incorporating self-insurance 16
into its program structure. PG&E discusses this in more detail in 17
Section 3.b.1.c.ii below. 18
d. PG&E Evaluates Other Market-Based Alternative Insurance 19
Products That May Offer Better Pricing and Additional Capacity 20
In addition to traditional insurance and self-insurance described 21
above, PG&E researches other sources of potential insurance capacity, 22
such as: 23
1) Captives 24
A captive is a licensed insurance company created by a 25
company, or group of companies, to cover unique risks specific to 26
the operations of the forming companies that are difficult to place 27
directly into the traditional insurance market (e.g., wildfire risk). 28
Through the captive, these risks can be covered by funds invested 29
in the captive, placement of the risk into markets that are not 30
commonly accessible due to the licensing status of the captive 31
(e.g., reinsurance and capital markets), or a combination of both. 32
The benefits of using a captive include but are not limited to: (1) an 33
(PG&E-9)
3-13
ability to fund one’s own risk in lieu of purchasing high-cost policies 1
offered by insurance carriers; (2) the opportunity to market the risk 2
to a wider audience and thereby increase the competitiveness of 3
quotes; and (3) the pursuit of additional capacity that is unavailable 4
in the absence of a captive.25 In 2017, PG&E established a captive 5
(PG&E only) to pursue additional sources of wildfire liability 6
capacity. The creation of the captive allowed PG&E to directly 7
access the reinsurance markets resulting in the procurement of 8
approximately $100 million in wildfire property damage liability 9
protection at more cost-effective pricing than offers of comparable 10
insurance in the traditional markets. The Company has continued to 11
use the captive in subsequent insurance renewals, including its 12
April 2021 wildfire liability renewal in which approximately 13
$31.8 million in wildfire property damage liability reinsurance was 14
secured. 15
2) Catastrophe (CAT) Bonds 16
A CAT bond is another tool to transfer financial risk to external 17
counterparties. Specifically, CAT bonds transfer risk to capital 18
markets, rather than to insurance companies. Although historically 19
used for large catastrophic risks such as earthquakes, hurricanes, 20
floods and other weather driven events, PG&E successfully placed a 21
CAT bond in 2018 as an alternative source of coverage to address 22
third-party liability claims for wildfire-caused property damages. 23
This effort was the first in the CAT bond market and similar efforts 24
have been used by other utilities since the creation of this 25
product.26 PG&E continues to explore the use of CAT bonds in the 26
company’s liability renewals, as well as other programs where there 27
25 Insurance companies purchase reinsurance and financial protection in the capital
markets to safeguard against large catastrophic losses. Direct access and negotiations on price with these same markets allows potential savings in costs that would otherwise be negotiated by insurance companies and passed onto customers, like PG&E, through traditional insurance products.
26 In calendar year 2020, Sempra Energy and the Los Angeles Department of Water and Power each placed wildfire related CAT Bonds into the capital markets.

(PG&E-9)
3-14
may be a financial benefit (e.g., earthquake coverage in PG&E’s 1
property program). 2
3) Parametric Insurance 3
Parametric insurance is a risk transfer tool that passes financial 4
risk to external counterparties based on a set of pre-defined terms 5
on payout patterns and covered events. This is different from 6
traditional insurance which is designed to provide coverage for loss 7
events up to the policy limit so long as the loss events take place 8
during the coverage term of the policy. As an illustrative example, 9
an earthquake parametric may be established to provide property 10
insurance protection only when an earthquake of a certain 11
magnitude occurs, with different payout sizes (e.g., 80 percent of the 12
loss) depending on the location of damaged assets, by distance, to 13
the epicenter of the earthquake. Under traditional property 14
insurance, coverage for the same earthquake would be based on 15
whether or not the earthquake occurred during the term of the policy 16
period. PG&E plans to explore the use of parametric products in its 17
insurance renewals, particularly in programs where securing 18
sufficient amounts of financial protection is proving difficult. 19
Each of these financial risk transfer options are in addition to 20
PG&E’s traditional approach to securing insurance coverage. The 21
Company will continue to approach new markets to gauge their 22
interest in participating in PG&E’s insurance programs and to 23
strengthen relationships with incumbent insurance providers to 24
encourage ongoing participation. Combined, these efforts are 25
intended to increase optionality and create a more competitive 26
market for insurance products covering California utility risks. 27
2. Summary of Forecast 28
PG&E requests that the Commission adopt the following forecast for 29
insurance premiums and other financial risk transfer instruments: 30

(PG&E-9)
3-15
TABLE 3-1 2023 INSURANCE FORECAST
(MILLIONS OF NOMINAL DOLLARS)
Line No. Insurance Type
2023 Forecast
Testimony Reference
Cost Table Reference
1 Property Insurance
2 Non-Nuclear Property $26.0 C.3.a.1. Table 3-11, line 6 3 Nuclear Property 0.1 C.3.a.2. Table 3-11, line 5 4 Other Property 2.6 C.3.a.3. Table 3-11, line 7
5 Liability Insurance
6 General Liability including: Wildfire Liability, Non-Wildfire Liability and Other Liability
$869.3 C.3.b.1. Table 3-11, line 13
7 Directors and Officers 6.4 C.3.b.2. Table 3-11, line 14 8 PG&E Corporation Allocation 2.7 C.3.c. Table 3-11, line 18
9 Total $907.1 Table 3-11, line 19
PG&E forecasts a total insurance expense of approximately 1
$907.1 million for 2023, which is approximately 1 percent less than 2020 2
recorded costs.27 The 2020 recorded costs include approximately 3
$360 million of one-time costs that are not expected to recur in 2023.28 The 4
2023 forecast reflects approximately a 63 percent increase compared to the 5
2020 recorded, adjusted when accounting for the removal of the 6
non-recurring items. 7
A primary driver of the insurance forecast is the continuing high market 8
cost of wildfire liability insurance.29 That said, the 2020 recorded costs are 9
not the best indicator of the actual pricing available at that time compared to 10
the pricing actually obtained at the 2020 annual renewal. Portions of the 11
2020 recorded costs reflect multi-year policies PG&E bought in 2018 at 12
pricing that was no longer available in 2020. As described below, PG&E’s 13
forecast for wildfire liability insurance is based on the cost of its most recent 14
renewal from April 2021, which is the most recent cost data available. 15
27 See Table 3-11, line 20. Please note, PG&E requests an additional $75 million for each
year 2024-2026 for wildfire liability insurance as part of its Post Test-Year Ratemaking proposal (see Exhibit 11, Ch. 2).
28 These relate primarily to accelerated expense recognition of future premiums and the purchase of additional Directors and Officers liability insurance in 2020.
29 See Section C for discussion.

(PG&E-9)
3-16
As discussed further in this section, additional cost drivers are reasons 1
for these costs are: (1) an increase in D&O liability premium costs due to 2
tightening market conditions; (2) an increase in aviation insurance costs 3
resulting from the purchase of additional aircraft and specialty equipment for 4
pipeline and powerline inspections by PG&E coupled with a challenging 5
insurance market; (3) an increase in non-nuclear property insurance costs 6
due to a hardening market, separate coverage purchased for PG&E’s 7
corporate headquarters and increasing insured asset values; and (4) a 8
decrease for nuclear property costs primarily due to distributions from an 9
industry mutual insurance company and a reduction in property insurance 10
limits carried on the nuclear assets at Humboldt Bay Power Plant (HBPP). 11
The insurance forecasts in Table 3-1 do not include excise taxes which are 12
addressed in Exhibit (PG&E-10), Chapter 9. This is consistent with the 13
presentation of insurance premium forecasts in PG&E’s 2020 GRC 14
testimony. 15
PG&E also requests authority to continue the two-way RTBA. As 16
discussed below, General Liability insurance for both wildfire and 17
non-wildfire perils continue to be difficult to forecast accurately. PG&E also 18
proposes to designate a portion of the revenue requirement for wildfire 19
liability insurance specifically for self-insurance. If adopted, the 20
self-insurance revenue requirement would also be managed through the 21
RTBA. 22
3. PG&E’s Insurance Forecast 23
PG&E’s insurance forecast includes: (1) Property Insurance costs; and 24
(2) Liability Insurance costs; and (3) an allocation of a portion of these costs 25
to PG&E Corporation. Each is discussed below. 26
a. Property Insurance 27
PG&E’s Property Insurance program consists of: (1) Non-Nuclear 28
Property Insurance; (2) Nuclear Property Insurance; and (3) Other 29
Property Insurance. 30
1) Non-Nuclear Property Insurance 31
PG&E forecasts $26.0 million for non-nuclear property 32
insurance premiums in 2023, which is a 22 percent increase 33

(PG&E-9)
3-17
compared to 2020.30 The forecast is based on PG&E’s 2020 1
renewal cost which has been escalated by a factor of five percent 2
each year through the 2023 Test Year. The five percent escalation 3
is conservative when compared to average price increases 4
expected in the markets during the same period.31 This program 5
provides coverage for the cost of repair and replacement of 6
damaged PG&E property from perils such as storms, earthquakes, 7
terrorism, and fires at PG&E’s non-nuclear facilities. 8
The property insurance market constricted following calendar 9
year 2017 in which natural catastrophic activity reached historical 10
levels for property insurers. There was an estimated $161 billion in 11
global insured losses that year, due in large part to damages 12
sustained in connection to Hurricanes Harvey, Irma and Maria.32 13
The insurance markets have continued to experience elevated 14
levels of global insured losses in subsequent years, including 15
calendar year 2020 which is estimated to be the fifth-costliest year 16
for public and private entities collectively33 due to a record-setting 17
Atlantic hurricane season, insured losses arising out of the derecho 18
(e.g., combination of windstorms and thunderstorms) in the Midwest 19
in August 2020, and the impact of the 2020 wildfire season on the 20
Western United States. During 2018-2020, there have also been 21
several large global property losses specific to the utility sector 22
involving power generation equipment failure.34 The markets have 23
responded to this insurance industry loss experience by increasing 24
premiums and reducing the amount of available capacity for 25
purchasers of first-party property insurance. Additionally, the 26
property insurance markets now view wildfires as a “peak peril” and 27
have been adjusting premium costs to strengthen their financial 28
30 See Table 3-11, line 6. 31 Exhibit (PG&E-3), WP 3-53 – Property Market Dynamics – Aon, Q1 2021 Update. 32 Ibid. 33 Ibid. 34 Exhibit (PG&E-9), WP 3-65 – Summary of Industry Property Losses 2018-2020.

(PG&E-9)
3-18
position in anticipation of future claim costs.35 PG&E has 1
experienced difficulty in procuring comparable amounts of financial 2
protection as it carried in the past, and within previous forecasted 3
amounts, as a result of these market conditions. PG&E plans to 4
secure coverage amounts consistent with limits carried in the past if 5
market conditions improve during the 2023 GRC period. 6
As part of PG&E’s 2020 property insurance renewal, PG&E 7
purchased a separate insurance policy for the General Office 8
Complex (GOC) for the first time. PG&E’s decision to purchase the 9
coverage was based on the following factors: 10
• The planned sale of this asset by PG&E; 11
• Procurement of a distinct set of policy limits and coverage for 12
that location given that its risks differ from the remainder of the 13
utility’s asset portfolio; and 14
• The cost to repair or rebuild that asset, as measured by its 15
insured value, in the event of a large catastrophic loss 16
(e.g., earthquake) has the potential to impact the amount of 17
remaining insurance available for subsequent losses at other 18
PG&E locations.36 19
PG&E has entered a lease, with an option to purchase, its new 20
headquarters in Oakland. If PG&E exercises the right to purchase 21
the building, it will procure a separate policy for the Oakland site for 22
the same reasons that it acquired a standalone policy for the current 23
GOC, including the new location’s proximity to the Hayward 24
earthquake fault. The estimated cost to procure a comparable 25
policy for the new headquarters is included in the forecast. The 26
35 A “peak peril” is an industry term to refer to events capable of causing large financial
losses for the insurance industry as a whole (including the potential insolvency of carriers). Historically, this term has been used to describe earthquake and hurricane risks. The markets have adjusted this view to also include wildfires.
36 There is a finite amount of insurance under PG&E’s property program for certain risks, such as earthquakes. Given the proximity of the GOC to the San Andreas fault, and its estimated asset value in excess of $1 billion, one large event (including interrelated aftershocks and fires that may follow) has historically had the potential to impair or exhaust the policy limits available under the program for earthquake losses at other locations.

(PG&E-9)
3-19
forecast also anticipates increases to the total insured values of 1
PG&E’s assets, which serve as a basis in pricing property insurance 2
to account for general inflation. 3
2) Nuclear Property Insurance 4
PG&E forecasts nuclear property premium costs of 5
$110 thousand. This program provides coverage for the cost of 6
repair and replacement of first-party nuclear property from loss 7
perils (such as floods, earthquakes and fires), decontamination and 8
stabilization following a catastrophic nuclear event, and 9
reimbursement for business interruption expenses (replacement 10
power costs) at a damaged facility in the event a plant is shut down. 11
Given the risks specific to the nuclear energy industry, the insurance 12
programs for Diablo Canyon Power Plant (DCPP) and HBPP are 13
separate from other PG&E insurance programs and generally 14
excluded in non-nuclear insurance products. PG&E will need to 15
continue the purchase of nuclear property insurance for DCPP 16
despite the planned retirement of that location in 2025 due in large 17
part to the presence of nuclear fuel that will continue to be stored on 18
the premises during the decommissioning process. The 2023 19
forecast includes the anticipated premium cost to continue the 20
purchase of coverage for DCPP following the plant’s retirement 21
from service. 22
PG&E purchases nuclear property insurance from two industry 23
mutuals: (1) Nuclear Electric Insurance Limited (NEIL); and 24
(2) European Mutual Association for Nuclear Insurance (EMANI). 25
NEIL was established in the early 1970s by nuclear power plant 26
owners. NEIL sometimes pays distributions to its members based 27
on an annual assessment of its financial condition and ability to pay 28
losses. These distributions are not guaranteed as they are based 29
largely on unpredictable events such as whether the nuclear 30
property industry will experience a large property loss, or series of 31
losses, in the future. PG&E has not historically relied on potential 32
NEIL distributions as a factor in its nuclear property forecast. Given 33
the financial position of NEIL however, if the industry continues to 34

(PG&E-9)
3-20
see relative low loss activity, PG&E anticipates future distributions 1
and has accounted for them in its forecast.37 PG&E has historically 2
received approximately 2.5 percent of NEIL’s total distribution in 3
recent years. The distribution forecast in Table 3-11 is based on 4
NEIL’s targeted annual distributions in 2022 multiplied by the same 5
2.5 percent factor. NEIL does not currently have a guidance 6
forecast for potential distributions in calendar year 2023. 7
In January 2020, PG&E submitted a request to the Nuclear 8
Regulatory Commission (NRC) seeking approval to reduce the 9
amount of property insurance required to be carried at HBPP to 10
$50 million. NRC approved this request in March 2020. The 11
reduction in limits is designed to align coverage with the reduction in 12
risk and financial exposure to future losses at HBPP due to its 13
current decommissioning status. The estimated premium cost 14
savings from this program change is approximately $66 thousand 15
annually. 16
Table 3-2 illustrates the recent history of NEIL’s distributions to 17
PG&E, which reduce PG&E’s forecast. 18
TABLE 3-2 NEIL DISTRIBUTIONS
(THOUSANDS OF DOLLARS)
Line No. Year
DCPP and HBPP
1 2014 $2,509 2 2015 $2,497 3 2016 $2,490 4 2017 $2,493 5 2018 $10,806 6 2019 $7,000 7 2020 $16,937
3) Other Property Insurance 19
PG&E forecasts $2.6 million for Other Property insurance, which 20
is approximately 20 percent more than 2020 recorded costs.38 The 21
37 See Table 3-11, lines 4-5. 38 See Table 3-11, line 7.

(PG&E-9)
3-21
primary cost driver in this program is the premium cost of property 1
insurance (referred to as “hull” insurance) for helicopters and 2
specialty equipment attached to the Company’s airplane fleet for 3
pipeline and powerline inspections (cameras, navigational and 4
infrared asset scanning equipment) purchased by PG&E since its 5
last GRC filing. In its 2020 renewal, the utility paid an estimated 6
total of $1.04 million in property insurance costs attributed to these 7
assets, more than ninety percent of which relates to property 8
insurance on PG&E’s helicopters. This compares to an estimated 9
spend of approximately $31 thousand that PG&E paid for “hull” 10
coverage in the renewal leading into the 2020 GRC period. These 11
procurements have occurred in the midst of a tightening aviation 12
insurance market due to industry losses arising from events such as 13
the grounding of Boeing 737 Max passenger airlines between 14
March 2019 to November 2020 (the policies may provide “layup” 15
coverage which reimburses policyholders when aircraft is not in use 16
over a certain time period), and an increase in the number of fatal 17
aviation accidents in recent years.39 18
b. Liability Insurance 19
PG&E’s Liability Insurance program consists of: (1) General Liability 20
Insurance; and (2) D&O Liability Insurance. 21
1) General Liability Insurance 22
PG&E forecasts approximately $869.3 million in General 23
Liability insurance. This includes: (1) $156 million for Non-Wildfire 24
Liability insurance; (2) $707 million for Wildfire Liability insurance; 25
and (3) $6.2 million in Other Liability insurance products, including, 26
fiduciary liability, business travel, surety bonds, nuclear liability 27
insurance, and applicable broker fees.40 28
39 Exhibit (PG&E-9), WP 3-66 – General Aviation Insurance Overview – Marsh, Q1 2021. 40 See Table 3-11, line 12. Please note, PG&E requests an additional $75 million for each
year 2024-2026 for wildfire liability insurance as part of its Post Test-Year Ratemaking proposal (see Exhibit 11, Ch. 2).

(PG&E-9)
3-22
Table 3-3 shows the actual amount paid by PG&E in the 2020 1
renewals for Non-Wildfire and Other Liability insurance, which is the 2
most recent cost data available. PG&E’s most recent renewal for 3
Wildfire Liability insurance took place in April 2021, which PG&E 4
used as the basis of its 2023 forecast for that item. As such, 5
Table 3-3 shows 2021 renewal information for Wildfire Liability 6
insurance. Table 3-3 also includes the amount of coverage PG&E 7
acquired in the renewals of each program. Table 3-4 shows 8
PG&E’s 2023 premium and coverage forecast for these same 9
insurance procurements. 10
TABLE 3-3 2020/2021 LIABILITY INSURANCE PREMIUMS AND COVERAGE
(MILLIONS OF NOMINAL DOLLARS)
Line No.
2020 Renewal (Non-Wildfire)
2021 Renewal (Wildfire)
2020 Renewal (Other Liability)
1 Premium $148 $707 $6.6 2 Coverage $720 $900 $650
TABLE 3-4 2023 GENERAL LIABILITY INSURANCE PREMIUM AND COVERAGE FORECAST
(MILLIONS OF NOMINAL DOLLARS)
Line No.
2023 Forecast (Non-Wildfire)
2023 Forecast (Wildfire)
2023 Forecast (Other Liability)
1 Premium $156 $707 $6.2 2 Coverage $720 $1,000 $650
a) Structure of PG&E’s General Liability Program 11
PG&E’s General Liability insurance forecast represents its 12
best estimate based on information currently available.41 13
One notable difference between PG&E’s current liability 14
insurance program and its earlier programs is that PG&E now 15
purchases the majority of its wildfire liability insurance in 16
41 Nevertheless, accurate forecasting can be difficult in the current environment and
therefore has requested approval to continue the two-way RTBA for these costs to mitigate against any such uncertainty. (See discussion in Section C.4.a. below.)

(PG&E-9)
3-23
separate policies from those that cover other non-wildfire liability 1
perils. This change is due in large part to the significant 2
increase in wildfire risk and exposure for utilities and their 3
insurers in recent years. 4
Wildfire liability insurance covers a broad range of claims 5
made by plaintiffs with respect to wildfires involving PG&E’s 6
facilities. PG&E previously had far less wildfire liability 7
exposure, which had traditionally been considered a greater risk 8
for the Southern California utilities based on their service area 9
characteristics.42 As such, insurance coverage for both wildfire 10
liability and other perils was typically offered to PG&E at the 11
same price and in the same blended policy. Because of the 12
recent, significant increase in size of wildfires and the 13
magnitude of the damage they cause, the cost of wildfire 14
coverage has increased dramatically. Additionally, there has 15
been a significant decrease in the number of insurers offering 16
wildfire coverage to California IOUs. 17
As a result, PG&E now procures most of its wildfire 18
coverage separately from coverage for other perils, essentially 19
creating two different insurance towers—one for wildfire and 20
one for non-wildfire. The structure of PG&E’s 2023 forecast for 21
general liability insurance reflects this separation of risk in the 22
policies now procured. 23
b) Non-Wildfire Liability Insurance Forecast 24
The 2023 forecast is based on PG&E’s 2020 renewal cost 25
which has been escalated by a factor of 2 percent to calendar 26
42 For example, in a 2012 decision regarding regulations to reduce fire hazards, the
Commission imposed more stringent electric distribution inspection requirements on utilities located in Southern California, explaining: “We also conclude that patrol inspections every two years, and detailed inspections every ten years, is sufficient for CIP facilities located in the high fire-threat areas of Northern California. There is no history of catastrophic power-line fires in Northern California, and Northern California does not experience Santa Ana winds that contribute significantly to the risk of catastrophic power-line fires in Southern California. Therefore, because the overall risk of power-line fires is lower in Northern California, we can safely reduce the frequency (and associated cost) of inspections.” D.12-01-032, p. 74; see also p. 166, Findings of Fact (FOF) 8.

(PG&E-9)
3-24
year 2023 to track with general inflation. Non-wildfire liability 1
insurance covers the broad range of general liability risks across 2
PG&E’s business. As discussed above, PG&E now procures a 3
separate insurance tower covering its non-wildfire liability 4
exposures. The forecast is the Company’s best estimate of 5
future renewal costs for this new program. 6
As shown in Table 3-3 above, PG&E paid $148 million for 7
non-wildfire liability insurance in 2020 for approximately 8
$700 million in coverage. PG&E plans to target the same 9
coverage level for the 2023 GRC period. As discussed in more 10
detail below in Section 3.b.1.d.i, the costs of non-wildfire liability 11
insurance are difficult to forecast accurately. As such, PG&E 12
requests authority to continue to manage these costs through 13
the two-way RTBA. 14
c) Wildfire Liability Insurance Forecast 15
PG&E and the other California IOUs have continued to see 16
increases in the cost of wildfire liability insurance offered in the 17
commercial marketplace. The price of insurance is affected by 18
a number of factors including, continued exposure to wildfire risk 19
given the Company’s service area characteristics, California’s 20
application of inverse condemnation law to the IOUs and 21
PG&E-specific considerations (e.g., percentage of service 22
territory in elevated fire risk areas, percentage of PG&E electric 23
lines in elevated risk areas,43 concentration of properties within 24
these risk areas, the frequency and severity of claims). 25
Additionally, the number of market participants and the total 26
amount of coverage available in the market continues to 27
decrease. As a result, the difficulty of managing the company’s 28
risks through the commercial insurance market alone continues 29
to be extremely challenging as does the prospect of accurately 30
forecasting the costs to do so. For these reasons, PG&E 31
43 The insurance markets perceive wildfire risk as primarily an electric operations
exposure. The majority of wildfire ignitions for which insurance claims have ultimately been paid out in recent years were related to PG&E’s electrical facilities.
(PG&E-9)
3-25
requests authority to continue to manage its wildfire insurance 1
program through the two-way RTBA authorized by the 2
Commission in the 2020 GRC. 3
The decision to purchase wildfire liability insurance in the 4
current market is primarily based on: (1) the Assembly Bill 5
(AB) 1054 requirement that IOUs be responsible for the first 6
$1 billion in claim costs before the Wildfire Fund may be 7
accessed;44 and (2) Insurance is generally seen as a capital 8
management tool by investors when loss events occur and 9
therefore, there is an expectation that insurance be procured as 10
a prudent business practice by the investment community. To 11
maximize the value from the policies procured, PG&E and its 12
brokers have negotiated no-claim bonuses and the removal of 13
unfavorable terms, such as loss-sharing provisions, to the 14
extent possible. PG&E has also elected not to pursue the 15
purchase of separate punitive damages coverage 16
(e.g., “puni-wraps”) which has added to premium costs in prior 17
renewals.45 18
Due to the high cost of wildfire insurance in the commercial 19
market, PG&E will seek to reduce its dependence on the 20
commercial market and decrease customer costs by 21
implementing a program of self-insurance. PG&E has 22
two proposals for self-insurance below. 23
This remainder of this section is organized as follows: 24
i) PG&E’s 2023 forecast for wildfire liability insurance; and 25
ii) PG&E’s proposal for self-insurance and how it differs from a 26
proposal in PG&E’s 2020 GRC. 27
i) Summary of the Forecast 28
PG&E forecasts $707 million for wildfire liability 29
insurance in 2023. In its Post Test-Year Ratemaking 30
44 Pub. Util. Code § 3280 (f). 45 There is one exception which is the single multi-year policy in which the premium cost is
the same with or without the inclusion of the additional punitive wrap coverage. The coverage terms were therefore left unchanged at the time of the insurance renewal.

(PG&E-9)
3-26
(PTYR) exhibit, PG&E also proposes an annual attrition 1
adjustment of $75 million for each year 2024 through 2026 2
as compared to the 2023 forecast.46 Each forecast is 3
summarized below. 4
A) 2023 GRC Forecast 5
PG&E’s 2023 forecasts of $707 million for wildfire 6
liability insurance is based on the amount it paid for its 7
April 2021 renewal. A summary of the 2023 forecast is 8
shown in Table 3-5 below. 9
In February 2021, PG&E began marketing its 10
wildfire liability insurance program to traditional 11
insurance carriers, capital markets, reinsurance 12
providers, and collateralized reinsurance providers. 13
PG&E approached more than 73 different markets, 14
including some counterparties through different 15
channels (e.g., the program was marketed to the 16
traditional insurance and reinsurance divisions of the 17
same carrier independently to increase optionality). 18
The Utility received offers from 16 remaining markets, 19
which included premium quotes ranging from a 20
rate-on-line (ROL) of 41 percent to 75 percent 21
(equivalent to $0.41 to $0.75 per dollar of coverage).47 22
PG&E secured $900 million of coverage as of 23
April 2021. This amount includes $300 million in wildfire 24
liability insurance procured in April 2021 at a cost of 25
$207 million, and the annual renewal of $600 million in 26
wildfire liability insurance obtained through a single 27
multi-year policy in August 2020 at a cost of 28
$501 million. The multi-year policy provides $1.8 billion 29
46 The $75 million attrition adjustment is based on the procurement of an additional
$100 million in wildfire insurance to fill the tower to $1 billion, at a ROL of 75 percent as determined by market pricing recently experienced by PG&E.
47 PG&E was only able to procure approximately $31.8 million in wildfire liability protection at the 41 percent ROL in its 2021 renewal.

(PG&E-9)
3-27
in total coverage ($600 million per year over its 1
three-year policy term) through August 1, 2023. 2
TABLE 3-5 2023 LIABILITY INSURANCE FORECAST SUMMARY
(MILLIONS OF NOMINAL DOLLARS)
Line No.
Multi-Year Coverage Remaining from 2020 Renewal
Additional Single-Year
Coverage from 2021 Renewal
Total Coverage and Premium
as of April 2021 2023 Forecast
1 Premium $501 $207 $707 $707 2 Coverage $600 $300 $900 $900
B) Post Test-Year Attrition Adjustment (Exhibit 11, 3
Chapter 2) 4
In addition to the forecast shown in Table 3-5 5
above, PG&E proposes a $75 million increase 6
compared to the 2023 forecast for each year 2024 7
through 2026 as part of its PTYR proposal.48 The 8
summary of the attrition proposal is shown in Table 3-6 9
below. 10
As shown in Table 3-5, PG&E was able to secure 11
the $900 million of wildfire liability previously discussed 12
and that is the subject of PG&E’s forecast for 13
approximately $707 million in premium cost. This 14
coverage was approximately 11 percent less than 15
PG&E’s $1 billion coverage target to meet the 16
requirements of AB 1054 to cover the first $1 billion in 17
losses to access the Wildfire Fund.49 The purpose of 18
the attrition year adjustment is to add approximately 19
11 percent to the 2023 forecast to address the cost of 20
additional coverage to approach the $1 billion target 21
consistent with the AB 1054 structure. As discussed in 22
48 See Exhibit 11, Ch. 2. 49 See Table 3-2.

(PG&E-9)
3-28
Exhibit 11, Chapter 2, PG&E has included the additional 1
amount in its attrition proposal in part to reduce the 2
initial impact on rates in 2023 and will use the additional 3
funding for self-insurance.50 4
TABLE 3-6 SUMMARY OF POST TEST-YEAR ATTRITION PROPOSAL FOR WILDFIRE LIABILITY
INSURANCE SEE EXHIBIT 11, CHAPTER 2
(MILLIONS OF NOMINAL DOLLARS)
Line No.
Total Coverage and Premium
as of April 2021 2023 Forecast
PTYR Attrition Proposal for each year 2024-2026
Total Annual Cost and Coverage for 2024-2026 (2023 Forecast + Annual
Attrition Adjustment)
1 Premium $707 $707 $75 $782 2 Coverage $900 $900 $75 $975
ii) Use of Self-Insurance in PG&E’s Wildfire Liability 5
Insurance Program 6
In the 2020 GRC, the Commission authorized a limited 7
amount of customer funding for self-insurance.51 The 8
Commission noted that the proposal adopted in the 2020 9
GRC was “reasonable and allow[s] PG&E to invest unspent 10
amounts authorized for General Liability insurance when 11
competitively-priced insurance available in the market is 12
limited.”52 13
Self-insurance offers potential benefits that warrant 14
continued consideration for inclusion and expansion within 15
PG&E’s program. For the reasons discussed in this section, 16
PG&E believes it is reasonable to set a target of procuring 17
50 See Exhibit 11, Ch. 2 and p. 3-11 above. 51 A.18-12-009, Joint Motion of the Public Advocates Office, TURN, SBUA Center for
Accessible Technology, The National Diversity Coalition, of California Utility Employees, California City County Street Light Association, The Office of the Safety Advocate and Pacific Gas and Electric Company for Approval of Settlement Agreement (Dec. 20, 2019), Attachment 1, (Settlement Agreement) p. 28, Section 2.8.3.3.
52 D.20-12-005, p. 404, Conclusions of Law (COL) 85.

(PG&E-9)
3-29
up to $1 billion in self-insurance for wildfire claims over time 1
in accordance with the AB 1054 eligibility requirements for 2
the Wildfire Fund. 3
Self-insurance provides potential cost savings benefits 4
that traditional commercial insurance does not. With 5
commercial policies, the premium is paid whether the 6
coverage is used or not. In contrast, to the extent 7
self-insurance is not used in a given year it remains 8
available for use in future years. There is the potential for 9
the size of the fund to increase over time, thereby reducing 10
the amount of coverage PG&E needs to purchase from the 11
commercial market in later years. As such, self-insurance 12
has the potential to reduce customer costs down the road. 13
Self-insurance may also provide cash flow and time 14
value of money benefits to customers. Payments from a 15
self-insurance fund would not be due until claims are 16
ultimately settled, which can occur sometimes three to four 17
years after an event. In contrast, premiums for a 18
commercial policy applicable to the same event need to be 19
paid at the time the policy is bound. 20
In this section, PG&E: (A) reports on the use of 21
self-insurance in 2020 GRC period as required by the 2020 22
GRC settlement; and (B) makes two proposals for the 23
continued use of self-insurance in PG&E’s insurance 24
program for the 2023 GRC period. 25
A) Report on Self-Insurance for the 2020 GRC Period 26
In the 2020 GRC, the Commission adopted a 27
multi-party settlement authorizing limited customer 28
funding for self-insurance as part of the Company’s 29
insurance program.53 The settlement stated, in 30
relevant part: 31
53 Id.

(PG&E-9)
3-30
Customers shall fund self-insurance through the 1 Risk Transfer Balancing Account (RTBA) only to the 2 extent that: (1) PG&E has not spent the total 3 forecast amount on other products on an annual 4 basis; and (2) the amount of self-insurance does not 5 exceed $1 billion in the aggregate for the 2020 GRC 6 period (2020-2022). The RTBA is discussed in 7 Section 2.8.3.2. 8
Should PG&E self-insure above either of those 9
amounts, PG&E would record the additional amounts in 10
the Wildfire Expense Memorandum Account (WEMA) 11
and would be required to obtain Commission approval 12
to recover the additional amounts through the WEMA 13
process. In the next GRC, PG&E will report on the 14
status of the self-insurance fund and make a proposal 15
addressing if the fund should continue and if there are 16
any unused funds that should be returned.54 17
PG&E provides this status report in accordance with 18
Section 2.8.3.3. of the settlement. PG&E was not able 19
to incorporate self-insurance as contemplated in the 20
settlement because there was no funding remaining in 21
the adopted forecast after the purchase of commercial 22
policies. As such, there are no funds in the 23
self-insurance fund that require disposition in this GRC. 24
PG&E’s 2020 GRC forecast was based on the cost 25
of its 2018 insurance renewal in which PG&E spent 26
approximately $300 million on General Liability 27
insurance. Ultimately the settlement agreement 28
included a total General Liability insurance forecast of 29
approximately $300 million, approximately $246 million 30
of which was allocated the GRC.55 As discussed 31
above, because of the continued increase in wildfire 32
insurance pricing and the reduced capacity offered in 33
54 D.20-12-005, p. 250. 55 A.18-12-009, Settlement Agreement, pp. 27-28, Section 2.8.3.1.

(PG&E-9)
3-31
the market, PG&E spent approximately $828 million for 1
its 2020 General Liability renewal, approximately 2
$681 million of which was related to wildfire coverage. 3
The majority of the premium for the wildfire coverage 4
represents the annual cost of a multi-year policy that will 5
be effective through 2023. As described above, PG&E 6
purchased additional, single-year coverage in 2021 at a 7
cost of $207 million. Because of these market 8
conditions, PG&E was required to spend amounts 9
above the adopted forecast to obtain a reasonable level 10
of liability coverage. Even with this level of spend in 11
2020 and 2021, PG&E was unable to procure its target 12
$1 billion in wildfire coverage. 13
B) Two Alternative Proposals for the Continued Use of 14
Self-Insurance for the 2023 Period 15
While PG&E was unable to make use of the 16
self-insurance authority provided in the 2020 GRC for 17
the reasons discussed above, PG&E continues to 18
support the inclusion of self-insurance in its liability 19
insurance program. Below, PG&E makes two proposals 20
for the continued use of self-insurance in the 2023 21
GRC. 22
For both alternatives, PG&E proposes that 23
self-insurance will be funded exclusively through 24
CPUC-jurisdictional, retail rates for the 2023 GRC 25
period. There is currently a settlement in place with 26
respect to the FERC formula rate for PG&E through the 27
end of 2023. PG&E will attempt to pursue recovery of 28
self-insurance costs for wholesale customers through 29
the FERC process over the course of the 2023 GRC 30
period. To the extent PG&E is successful, the costs 31
recovered will be credited back to retail customers 32
through the RTBA. 33
(PG&E-9)
3-32
Additionally, consistent with the authority granted in 1
the 2020 GRC, under either proposal, PG&E would 2
report on the status of available self-insurance in the 3
2027 GRC and make a proposal regarding its use going 4
forward. 5
(i) Adopt a Separate Self-Insurance Revenue 6
Requirement (PG&E’s Recommended 7
Approach) 8
PG&E recommends that the Commission 9
authorize a separate revenue requirement 10
specifically for self-insurance as follows: 11
1. The $707 million wildfire liability revenue 12
requirement would be bifurcated into two parts: 13
(1) a $250 million revenue requirement to be 14
used only for self-insurance; and (2) a separate 15
$457 million revenue requirement for 16
procurement of additional wildfire insurance up 17
to an amount that would secure a total of 18
$1 billion in wildfire coverage for the year 19
including self-insurance. 20
2. PG&E would also direct the additional 21
$75 million proposed in its Post Test-Year 22
(PTY) attrition adjustment for each year 2024 23
through 2026 for self-insurance.56 24
A summary of the self-insurance funding 25
sources is provided in Table 3-7 below. 26
56 See Exhibit 11, Ch. 2 for PG&E’s Post Test-Year attrition proposal on insurance.

(PG&E-9)
3-33
TABLE 3-7 SUMMARY OF SELF INSURANCE PROPOSAL
(MILLIONS OF NOMINAL DOLLARS)
Line No.
Bifurcating the $707 M 2023 GRC Forecast
Attrition Proposal for 2024-2026
Total Funding Dedicated to
Self-Insurance for 2023
Total Funding Dedicated to
Self-Insurance for each year 2024-2026
1 Self-Insurance Only RRQ $250 $75 $250 $325
2 Market Insurance or Self Insurance RRQ
$457(a) – – –
_______________
(a) Unspent amounts from this source can be used for self-insurance in addition to the funding dedicated solely for self-insurance shown above.
The self-insurance proposal would operate 1
subject to the following principles: 2
1. The $250 million revenue requirement will be 3
collected annually and used only for 4
self-insurance. 5
2. The $457 million revenue requirement will be 6
collected annually. PG&E is authorized to use it 7
to procure additional wildfire liability necessary 8
to reach $1 billion in total coverage (commercial 9
coverage plus self-insurance). This revenue 10
requirement is subject to two-way RTBA 11
treatment. PG&E is authorized to recover its 12
actual costs of procuring the additional 13
coverage necessary to meet the $1 billion target 14
even if they exceed the $457 million forecast. If 15
there are unspent funds remaining from this 16
revenue requirement, PG&E would direct them 17
to self-insurance in addition to the dedicated 18
self-insurance amounts discussed above. 19
3. All revenue requirements including PG&E’s 20
attrition proposal on insurance would be 21
managed through the RTBA. PG&E would be 22
authorized to collect them to the extent 23

(PG&E-9)
3-34
necessary to procure $1 billion in total wildfire 1
insurance (a combination of market-based 2
insurance and self-insurance) for the year. At 3
that point, PG&E would stop collecting the 4
revenue requirements and refund any unspent 5
funds to customers through the RTBA. 6
4. PG&E proposes to obtain self-insurance 7
through its captive to cover its wildfire liability 8
risks.57 To the extent that doing so results in 9
interest proceeds net of fees and costs 10
associated with utilization of the captive, PG&E 11
will either credit those proceeds to customers 12
through the RTBA and or will apply the 13
proceeds towards the purchase of additional 14
self-insurance, which would then be considered 15
available self-insurance counted to the $1 billion 16
target. 17
5. As with commercial policies, PG&E would notify 18
the captive of potential claims against the 19
policy. The value of potential claims noticed 20
shall no longer be considered to be available for 21
general use and will not be counted towards the 22
calculation of PG&E’s total insurance for 23
purposes of determining whether it has met the 24
$1 billion coverage target. 25
6. Self-insurance may be used to cover any 26
uninsured liabilities related to wildfire claims. 27
7. With respect to ratemaking and cost recovery 28
issues, self-insurance through the captive would 29
operate just as a market-based policy would in 30
that it would be available for use to pay claims 31
and costs as needed and would not be subject 32
57 Please see Section C.1.d.1 on the use of captives.

(PG&E-9)
3-35
to any additional regulatory process or 1
after-the-fact reasonableness or prudency 2
review. 3
This proposal has several advantages for the 4
Company and its customers compared to the status 5
quo. First, it has the distinct advantage of ensuring 6
that self-insurance will be incorporated into PG&E’s 7
program each year without jeopardizing PG&E’s 8
ability to procure the remaining coverage necessary 9
to cover the $1 billion portion of utility responsibility 10
under the AB 1054 wildfire fund. Additionally, 11
immediately upon implementation, this approach 12
would begin reducing the amount of insurance 13
coverage PG&E would need to procure in the 14
commercial market. For example, if adopted, 15
PG&E would need to target only $750 million in 16
wildfire liability insurance from the market in year 17
one as it would already have $250 million in 18
self-insurance coverage. Should the self-insurance 19
not be needed to pay for claims in year one, it 20
would remain available for use in future years, 21
thereby further reducing the amount of insurance 22
PG&E would need to target in the commercial 23
market to $500 million in year two of implementation 24
and so forth. As noted above, as the amount of 25
insurance required from the commercial market 26
decreases, PG&E would be authorized to direct 27
unspent funding within the $457 million revenue 28
requirement to additional self-insurance or 29
otherwise return it to customers through the RTBA. 30
While PG&E acknowledges that there may be 31
some uncertainties about how a novel proposal like 32
this would play out over time, the potential 33
opportunity to decrease the company’s reliance on 34

(PG&E-9)
3-36
commercial market pricing and terms over time, 1
thereby increasing value for customers makes this a 2
proposal worth adopting on a trial basis for the 2023 3
GRC period. PG&E believes this proposal strikes 4
the right balance of ensuring sufficient customer 5
funding for a reasonable business expense like 6
insurance, while minimizing risk to customers by 7
capping the total amount of customer-funded 8
self-insurance to $1 billion in the aggregate for the 9
2023 GRC and requiring PG&E to report on the 10
status of available self-insurance funds in the 2027 11
GRC. 12
PG&E performed a cost-benefit analysis of the 13
potential use of self-insurance under this proposal 14
to bifurcate the revenue requirement for wildfire 15
liability coverage.58 The analysis considers the 16
inclusion of $250 million of self-insurance into the 17
Company’s wildfire liability insurance program, 18
along with the purchase of $750 million in traditional 19
insurance, and evaluates how the program would 20
perform under seventeen hypothetical loss 21
scenarios. The analysis also contemplates factors 22
such as the estimated cash flow timing between 23
premium payments and receipt of insurance 24
proceeds by PG&E, and the estimated timing of 25
claim payments to claimants. The analysis shows 26
that in all scenarios, with the exception of one,59 it 27
is more beneficial for PG&E to include 28
self-insurance in its wildfire liability insurance 29
58 See WP 3-105 – PG&E Self-Insurance Analysis Worksheet. 59 The single scenario in which the benefit of self-insurance did not outweigh the cost in
the analysis is a low probability scenario that assumes PG&E experiences losses greater than $1.2 billion in the aggregate in each year of the 2023 GRC period.

(PG&E-9)
3-37
program than to rely solely on the purchase of 1
coverage in the retail markets. 2
(ii) Continue Self-Insurance Authority From 2020 3
GRC 4
As an alternative to PG&E’s recommendation, 5
PG&E requests that at a minimum, the Commission 6
authorize the use of self-insurance for the 2023 on 7
the same terms as applied for the 2020 GRC as 8
described in Section 2.8.3.3 of the 2020 GRC 9
settlement, as follows: 10
Customers shall fund self-insurance through the 11 Risk Transfer Balancing Account (RTBA) only 12 to the extent that: (1) PG&E has not spent the 13 total forecast amount on other products on an 14 annual basis; and (2) the amount of 15 self-insurance does not exceed $1 billion in the 16 aggregate for the 2023 GRC period 17 (2023-2026). 18
Should PG&E self-insure above either of those 19 amounts, PG&E would record the additional 20 amounts in the Wildfire Expense Memorandum 21 Account (WEMA) and would be required to 22 obtain Commission approval to recover the 23 additional amounts through the WEMA process. 24 In the next GRC, PG&E will report on the status 25 of the self-insurance fund and make a proposal 26 addressing if the fund should continue and if 27 there are any unused funds that should be 28 returned. 29
While a benefit of this approach is that is allows 30
for the inclusion of self-insurance in PG&E’s 31
program in theory, it has some notable drawbacks 32
as well. One lesson learned with respect to the way 33
self-insurance was authorized in the 2020 GRC, 34
was that despite best intentions, it actually created 35
an unintended conflict because of the way it was 36
structured. Notwithstanding the increasing cost of 37
wildfire insurance in the commercial market, it still 38
typically provides some level of risk transfer. For 39

(PG&E-9)
3-38
example, even if a policy cost 75 cents for every 1
dollar of coverage, the coverage amount provided 2
usually exceeds the premium paid. While 3
self-insurance certainly has the potential to provide 4
cost savings benefits over time, it is more expensive 5
than market-based insurance early on, in that it 6
initially costs one dollar of premium for every one 7
dollar of coverage. As such, choosing to purchase 8
self-insurance with a limited pot of money 9
(i.e., where authority do to so is limited to the 10
adopted forecast amount) will almost certainly result 11
in the utility procuring a lower level of total coverage 12
to manage its wildfire risk in the short term 13
compared to spending that money in the 14
commercial market. As described above, even with 15
authority to collect actual cost incurred through the 16
two-way RTBA, PG&E was unable to procure its 17
target $1 billion in wildfire coverage for 2020 as 18
contemplated by the Wildfire Fund eligibility 19
requirements of AB 1054. Against that backdrop, it 20
could increase the difficulty of managing that 21
situation even further if a utility would have to 22
choose to further reduce the amount of total 23
coverage it could procure to avail itself of the 24
opportunity to add customer-funded self-insurance 25
to its program. 26
d) Request for Authority to Continue the Risk-Transfer 27
Balancing Account With Modifications 28
In the 2020 GRC, the Commission authorized creation of 29
the two-way RTBA to manage the uncertain costs associated 30
with General Liability insurance that were not easily forecast. In 31
doing so, the Commission stated: 32
Regarding the establishment of the RTBA, we agree that 33 insurance costs for General Liability coverage has been 34

(PG&E-9)
3-39
difficult to predict in recent times because of market 1 conditions and the recent wildfires in California. A two-way 2 balancing account will also allow PG&E to address 3 uncertainty in a timely manner and at the same time ensure 4 that there is adequate insurance coverage.60 5
The terms of the RTBA provided that: 6
PG&E shall establish a two-way RTBA to recover the costs 7 of PG&E’s excess liability insurance coverage exceeding its 8 adopted forecast for coverage of up to $1.4 billion. PG&E 9 may file a Tier 2 advice letter for coverage beyond 10 $1.4 billion, consistent with Cal Advocates’ proposal.61 11
PG&E requests authority to continue the RTBA for the 2023 12
GRC period with modifications as described in this section. This 13
section is organized as follows: 14
• Section i describes the continuing need for the RTBA given 15
the difficulty to accurately forecast the costs of liability 16
insurance. 17
• Section ii describes PG&E’s proposal to continue the RTBA, 18
which would apply to costs for wildfire liability insurance, 19
non-wildfire liability insurance (non-nuclear), self-insurance 20
and related taxes and fees associated with the purchase of 21
insurance.62 22
i) General Liability Insurance Costs Are Significant and 23
Continue Difficult to Forecast Accurately 24
Costs of General Liability insurance for both non-wildfire 25
and wildfire perils remain volatile and difficult to forecast 26
accurately. 27
As described in Section C.3.b.1.b of this chapter, 28
PG&E’s August 2020 renewal was the first time that the 29
Utility purchased separate liability policies for the 30
non-wildfire peril. Given that this is a new program change 31
for PG&E, it is uncertain how program costs will change 32
60 D.20-12-005, p. 254, p. 403, Conclusions of Law (COL), 83. 61 A.18-12-009, Settlement Agreement, p. 28, Section 2.8.3.2. 62 The forecast for excise taxes is included in Exhibit (PG&E-10), Ch. 9.

(PG&E-9)
3-40
over time. Additionally, non-wildfire liability is subject to an 1
insurance market factor called “social inflation”, which refers 2
to the condition whereby claim costs rise faster than general 3
inflation due to societal trends. The insurance markets have 4
experienced a rise in claims costs due to societal factors 5
such as an increase in the number of “nuclear” verdicts 6
rendered in jury trials, increases in healthcare costs which 7
impacts the cost of bodily injury claims, increases in the 8
number of automobile liability claims as a result of distracted 9
driving, and increases in workers’ compensation claim costs 10
attributed to COVID-19 covered losses. It is difficult to 11
predict how these and other societal factors may impact 12
future non-wildfire liability premium costs. 13
With respect to PG&E’s wildfire insurance forecast, 14
many factors affect the price of coverage which make 15
accurate forecasting difficult. It is important to note that 16
insurance is a global market that pools different types of 17
risks and each year is subject to unpredictable events, often 18
beyond the control of the Utility, that have led to swings in 19
capacity and cost. Additionally, continuing wildfire risk is 20
also causing insurance carriers to reconsider their exposure 21
to California wildfire risks and to further reduce available 22
capacity.63 23
These factors create challenges in developing an 24
accurate risk transfer forecast in today’s market. In its 2020 25
GRC, PG&E described the circumstances of the 2017 GRC 26
as an illustrative example. As PG&E described, in 27
D.17-05-013, the Commission adopted a forecast of 28
approximately $52 million annually for liability and other 29
63 Exhibit (PG&E-9), WP 3-63.

(PG&E-9)
3-41
miscellaneous insurance for the 2017-2019 period.64 The 1
cost of PG&E’s 2017 and 2018 liability insurance renewals 2
were $124 million and $360 million respectively—3
significantly higher than the forecast amount. More recent 4
data points to the same trend. In the 2020 GRC, PG&E 5
forecast $360 million based on its most recent renewal at 6
the time from 2018. In its most recent liability insurance 7
procurements, PG&E has paid approximately $828 million 8
for coverage. 9
Another significant driver that makes accurate 10
forecasting of total program costs difficult is the amount of 11
wildfire liability coverage available for purchase. PG&E 12
targets $1 billion in wildfire liability insurance in large part to 13
eligibility requirements of the Wildfire Fund established 14
under AB 1054 which requires the IOUs to be responsible 15
for covering at least the first $1 billion in wildfire costs in 16
order to access the fund. 17
While PG&E targets this level of coverage, it has not 18
always been available in the market. In the April 2021 19
renewal period for example, which is the primary basis for 20
the 2023 insurance forecast, PG&E targeted $1 billion of 21
wildfire coverage, but was able to obtain only procure 22
$900 million. While this represents a 109 percent increase 23
in the amount of wildfire coverage carried in 2019, it 24
remains shy of the utility’s responsibility prior to being able 25
to access the AB 1054 Wildfire Fund. Obviously, the total 26
coverage purchased directly affects the total program cost. 27
64 A.15-09-001, Joint Motion of Office of Ratepayer Advocates, TURN Alliance for Nuclear
Responsibility, Center for Accessible Technology, Coalition of California Utility Employees, Collaborative Approaches to Utility Safety Enforcement, Consumer Federation of California, Environmental Defense Fund, Marin Clean Energy, Merced Irrigation District, Modesto Irrigation District, National Diversity Coalition, SBUA, South San Joaquin Irrigation District, and Pacific Gas and Electric Company for Adoption of Settlement Agreement (Aug. 3, 2016), Appendix A, p. 10, line 51.

(PG&E-9)
3-42
PG&E plans to continue to target $1 billion in wildfire liability 1
insurance for the 2023 GRC period. 2
ii) Request to Continue the RTBA 3
For the reasons discussed above, it is appropriate to 4
continue the RTBA to manage the cost of: wildfire liability 5
insurance, non-wildfire liability insurance, self-insurance and 6
related taxes and fees associated with the purchase of 7
insurance. Table 3-8 below summarizes each cost to be 8
managed through the RTBA. PG&E discusses each below. 9
TABLE 3-8 SUMMARY OF INSURANCE COSTS SUBJECT TO RTBA
(MILLIONS OF NOMINAL DOLLARS)
Line No. Amount Cost Recovery Reference
1 2023 Forecast: Wildfire Liability
$707 total
($250 self-insurance; $457 other wildfire coverage if PG&E’s
self-insurance proposal is adopted.)
Up to $1 billion in coverage through the RTBA;
Coverage over $1 billion through Tier 2 Advice Letter
Ex. 9, Ch. 3, Section C.3.b.1.b
2 2023 Forecast: Non-Wildfire Liability
$156 Up to $700 million in coverage through the RTBA;
Coverage over $700 million through Tier 2 Advice Letter
Ex. 9, Ch. 3, Section C.3.b.1.c
3 2024-2026 PTY Attrition Proposal on Insurance
$75 Through the RTBA Ex. 11, Ch.2, Section C.3.b.1.c.i
4 Excise Tax $33.4 Through RTBA and Tier 2 AL as noted above for the underlying coverage type and amount
Ex. 10, Ch. 9
• Wildfire and Non-Wildfire Liability: Two Coverage 10
Caps – The RTBA will authorize cost recovery without 11
triggering additional Commission review for the 12
following: (1) $1 billion of wildfire coverage; and (2) an 13
additional $700 million of non-wildfire liability coverage. 14
Should PG&E procure insurance coverage in excess of 15
those non-wildfire or wildfire caps, PG&E may file a 16
Tier 2 advice letter to seek recovery of the costs of the 17

(PG&E-9)
3-43
additional coverage. The amount of coverage will be 1
calculated as follows: 2
− Policies that provide no wildfire liability coverage will 3
be counted as non-wildfire coverage; 4
− Policies that provide only wildfire coverage will be 5
counted as wildfire coverage; 6
− Policies that provide combined coverage for both 7
non-wildfire and wildfire perils will be counted as 8
wildfire coverage; and 9
− Available self-insurance will be counted as wildfire 10
coverage. The value of potential claims noticed 11
against a self-insurance policy shall not be counted 12
towards the $1 billion target. 13
• Application to Self-Insurance – The RTBA will apply to 14
any self-insurance revenue requirement authorized by 15
the Commission such that if lesser amounts of 16
self-insurance are needed in a given period to meet 17
PG&E’s $1 billion wildfire coverage target, PG&E has a 18
mechanism to return excess self-insurance funding to 19
customers. 20
• Excise Tax – Excise taxes are assessed on the 21
purchase of most insurance and are tied to the cost of 22
the coverage.65 Excise taxes associated with the cost 23
of wildfire and non-wildfire liability (non-nuclear) 24
coverage should be managed through the RTBA along 25
with the cost of underlying coverage discussed above. 26
2) Other Liability Insurance 27
PG&E forecasts $6.2 million for Other Liability insurance, which 28
is approximately 7 percent less than 2020 recorded costs.66 The 29
65 The forecast for excise taxes is included in Exhibit (PG&E-10), Ch. 9. 66 See Table 3-11, line 12. Please note, PG&E incurred higher one-time fiduciary liability
costs in 2020 due to the Company’s bankruptcy (separate coverage needed to be purchased covering potential liabilities for both the pre-emerged company, and the new company upon bankruptcy exit).

(PG&E-9)
3-44
primary cost drivers behind this forecast are costs related to the 1
Company’s surety bond program, and fiduciary liability insurance 2
premium costs. 3
Surety bonds are commonly used as a form of guarantee when 4
work is performed for others under a contract or permit. In the event 5
the work is not completed in accordance with the agreed terms and 6
conditions, the surety bond may be called upon to correct 7
deficiencies.67 The Company has experienced an increase in 8
surety bond requests from external parties following the Company’s 9
bankruptcy proceeding. PG&E has also utilized the surety bond 10
program as a means to replace letters of credit used on certain 11
projects to fulfill a similar performance guarantee. The forecast 12
accounts for expected surety bond costs during the 2023 GRC 13
period. 14
Fiduciary liability insurance is intended to cover liabilities 15
associated with the management of employee benefit plans, 16
including employer provided retirement programs. The Company 17
has experienced an increase in premium costs for this product in 18
recent renewals due to market concerns over the level of PG&E 19
stock held within the Company’s various retirement programs. The 20
markets perceive this as a potential exposure for “stock drop” 21
litigation due to the current price of the Company’s stock in relation 22
to historic levels. PG&E also increased the level of insurance 23
purchased in this program in its 2020 renewal to align the limits with 24
the levels carried by its peers. The forecast includes the anticipated 25
cost to continue the procurement and maintenance of PG&E’s 26
fiduciary liability program in the context of the conditions discussed 27
herein. 28
67 When a claim is made against a surety bond, the surety (e.g., carrier) will step in and
assist with the completion of work, including the financing of project costs if needed through surety bond proceeds (which is subject to repayment by the defaulting party).

(PG&E-9)
3-45
3) Directors and Officers Liability Insurance 1
PG&E forecasts $17.6 million for its 2023 D&O Liability 2
Program, which is a 9 percent increase compared to 2020 premium 3
costs of approximately $16.2 million. 4
PG&E requires this insurance to attract qualified Directors, 5
Officers, and trustees who would otherwise be unlikely to accept 6
these positions without such coverage because of the litigation 7
risk.68 For that reason, the cost of D&O insurance is a reasonable 8
cost of providing utility service. 9
D&O provides coverage for claims alleging wrongful acts, such 10
as breach of fiduciary duty by Board of Director members or 11
Officers. During the 2020 renewal, PG&E saw a 300 percent 12
increase in premiums from 2018 costs to $16.2 million. The 13
premium cost increase is due in large part to a hardening of the 14
D&O liability insurance market as a result of the following: 15
• Increased claim frequency from “event-driven” class-action 16
lawsuits;69 17
• Increased claim frequency from recent court decisions 18
permitting claimants to pursue recoveries in multiple legal 19
venues;70 20
• Growth in the number of plaintiff firms bringing suits against 21
publicly traded companies; 22
• Global insurance market losses attributed to opioid litigation in 23
the United States; and 24
• Increase in the number of insurers exiting the market 25
68 The coverage is also designed to protect personal assets of individuals in these
positions which may be exposed in the absence of insurance. 69 Event-driven lawsuits refers to litigation following negative press from an event, activity
or response to social trends (e.g., COVID-19 response, Board Diversity, cyber-attack #MeToo, etc.). This differs from traditional Directors and Officers claims which focuses on accounting practices, merger and acquisition decisions, and securities fraud allegations.
70 Securities class action lawsuits were historically held in federal court. Some allegations may also be pursued in California courts (Cyan decision).

(PG&E-9)
3-46
The hardening of the D&O liability market has resulted in higher 1
premium costs, reductions in available capacity, and more restrictive 2
coverage terms. Other drivers of premium costs include the 3
existence of securities class action and derivative lawsuits brought 4
after recent wildfire events, and the amount of coverage PG&E 5
purchases which accounts for future litigation risk by shareholders. 6
PG&E forecasts a total D&O cost of $17.5 million for 2023. 7
PG&E has historically sought recovery of the total amount of 8
D&O insurance costs in the GRC. In recent GRCs, including 9
PG&E’s 2020 GRC, the Commission authorized recovery of only 10
50 percent of D&O insurance costs.71 In accordance with that 11
Commission guidance, PG&E seeks recovery of $8.8 million, which 12
is 50 percent of the total forecast cost for D&O insurance for 2023. 13
The PG&E Utility portion of that is $6.4 million.72 The PG&E 14
Corporation portion of these costs is approximately $2.3 million and 15
is included within the total “PG&E Corporate Allocation” costs 16
discussed in the next section. 17
c. PG&E Corporation Allocation 18
PG&E Corporation forecasts $2.7 million in costs for 2023.73 These 19
represent the Corporation’s allocation of costs for coverage provided 20
under many of the same policies identified in the property and liability 21
discussions above. PG&E Corporation is also insured under those 22
programs. Because nearly all of the Corporation’s work is for the benefit 23
of the Utility, PG&E’s forecast appropriately includes the Corporation’s 24
share of insurance costs. The decrease in cost compared to 2020 25
recorded adjusted is primarily due to the allocation of one-time Directors 26
and Officers Liability costs incurred by PG&E in relation to its bankruptcy 27
proceeding that are not expected to recur in 2023. 28
71 D.14-08-032, p. 552. 72 See Table 3-11, line 18. The PG&E Corporation portion of the D&O forecast is
approximately $700 thousand, which is included in the $2.7 million Corporate Allocation forecast discussed in Section C.3.c. below, and referenced in Table 3-7, line 18.
73 See Table 3-11, line 18.

(PG&E-9)
3-47
D. Information Technology Projects 1
1. M&CRM 2
PG&E spends more than $4 billion annually to procure natural gas and 3
power on behalf of approximately 16 million customers. Most of these 4
expenditures flow through the energy trading and risk management system. 5
Accurate, compliant, efficient, and timely execution and tracking of these 6
procurement activities is necessary to manage customer costs and help 7
mitigate price and credit risks associated with these expenditures. 8
For M&CRM to provide the critical operational services and benefits to 9
customers (as described earlier in this chapter), M&CRM forecasts the 10
continued need for IT projects to address basic maintenance and upgrade 11
cycles, and to mitigate the risks associated with participation in and 12
management of activity in the energy commodity markets. Like most 13
companies in the energy commodity markets, the Utility increasingly runs 14
complex, sophisticated IT systems. There are not many choices for 15
ready-to-deploy systems to replace risk management and trade capture 16
systems. As such, the Utility must continue to invest in its IT systems to 17
accommodate the demands of industry reform and regulation, and state 18
regulatory policies and mandates. 19
PG&E forecasts $0.1 million in expense for 2023, and capital costs of 20
$1 million in 2022 and $0.5 million annually from 2023-2026.74 This work is 21
a continuation of program spend reflected in the 2020 GRC (including 22
$1 million for anticipated 2022 capital spend), and seen as an ongoing need 23
covering multiple GRC applications, similar to the enterprise transaction and 24
risk management applications within the Utility. The focus of the work for 25
2023 and beyond is to upgrade IT applications that M&CRM uses for its 26
control, reporting, risk-management functions. One application PG&E will 27
update is the Procurement Portfolio Planner (PPP). The PPP is a Monte 28
Carlo simulation model developed in house to provide an accurate 29
representation of the bundled electric portfolio at the Utility, to forecast 30
generation and procurement costs for the Utility’s portfolio, to provide 31
probabilistic distributions of volumes and costs, and to conduct analysis to 32
74 See WP 3-33 through 3-37.

(PG&E-9)
3-48
support the procurement business. PPP forecasts net open portfolio 1
positions and calculates risk metrics and mark to market for regulatory and 2
financial compliance reporting, such as TeVaR. PG&E also plans to update 3
other critical applications as necessary developed and managed by M&CRM 4
which may include those for measuring Liquidity at Risk, Potential Future 5
Exposure and Loss Given Default credit calculations, hedge compliance for 6
the Bundled Electric portfolio, and the Core Procurement Incentive 7
Mechanism model for Core Gas Supply.75 8
E. Cost Tables 9
75 See WP 3-38.

(PG&E-9)
3-49
TAB
LE 3
-9
SUM
MA
RY
OF
DEP
AR
TMEN
T EX
PEN
SE
HIS
TOR
ICA
L A
ND
FO
REC
AST
(T
HO
USA
ND
S O
F D
OLL
AR
S)
Line
N
o.
Des
crip
tion
Rec
orde
d Ad
just
ed
Fore
cast
W
orkp
aper
R
efer
ence
20
16
2017
20
18
2019
20
20
2021
20
22
2023
1 In
tern
al A
udit
$6,1
02
$5,5
90
$5,9
30
$5,7
58
$7,5
89
$8,2
65
$8,4
97
$8,7
36
WP
3-3,
line
11
2 M
arke
t and
Cre
dit R
isk
3,37
3 3,
044
3,79
9 3,
741
4,63
1 4,
232
4,35
6 4,
484
WP
3-3,
line
17
3 To
tal
$9,4
76
$8,6
33
$9,7
29
$9,4
99
$12,
220
$12,
498
$12,
853
$13,
220
WP
3-3,
line
5
TAB
LE 3
-10
SUM
MA
RY
OF
DEP
AR
TMEN
T EX
PEN
SE B
Y FE
DER
AL
ENER
GY
REG
ULA
TOR
Y CO
MM
ISSI
ON
AC
CO
UN
T (T
HO
USA
ND
S O
F D
OLL
AR
S)
Line
N
o.
Des
crip
tion
Rec
orde
d Ad
just
ed
Fore
cast
W
orkp
aper
R
efer
ence
20
16
2017
20
18
2019
20
20
2021
20
22
2023
1 92
0 –
Adm
in &
G
en S
alar
ies
$8,8
05
$8,1
69
$9,0
12
$8,5
99
$10,
357
$11,
624
$11,
979
$12,
346
WP
3-3,
line
1
2 92
1 –
Offi
ce
Supp
lies
& Ex
56
9 42
9 43
7 61
2 82
2 38
4 38
4 38
4 W
P 3-
3, li
ne 2
3 92
3 –
Out
side
Svc
Em
ploy
– U
tility
89
5 31
26
9 27
9 1,
041
481
481
481
WP
3-3,
line
3
4 92
3 –
Out
side
Svc
Em
ploy
– C
orp
12
4 11
9
– 9
9 9
WP
3-3,
line
4
5 To
tal
$9,4
76
$8,6
33
$9,7
29
$9,4
99
$12,
220
$12,
498
$12,
853
$13,
220
WP
3-3,
line
5

(PG&E-9)
3-50
TAB
LE 3
-11
SUM
MA
RY
OF
CO
MPA
NYW
IDE
A&
G E
XPEN
SE IT
EMS
INSU
RA
NC
E H
ISTO
RIC
AL
AN
D F
OR
ECA
ST
( TH
OU
SAN
DS
OF
DO
LLA
RS)
Line
N
o.
Des
crip
tion
2020
Rec
orde
d Ad
just
ed
2023
Fo
reca
st
Wor
kpap
er
Ref
eren
ce
1 U
tili ty
2 U
tility
Pro
perty
(FER
C 9
24)
3 N
ucle
ar
$5,3
42
$5,6
10
4 N
ucle
ar D
istri
butio
n Fr
om N
EIL
$(16
,937
) (5
,500
)
5 To
tal N
ucle
ar
(11,
595)
$1
10
WP
3-29
, lin
e 5
6 N
on-N
ucle
ar
$21,
234
$25,
968
7 O
ther
(e.g
., C
rime,
Bus
ines
s Tr
avel
, Airc
raft
Hul
l) $2
,130
$2
,554
8 To
tal N
on-N
ucle
ar a
nd O
ther
$2
3,36
4 $2
8,52
2 W
P 3-
29, l
ine
4
9 To
tal P
rope
rty
$11,
769
$28,
632
10
Util
ity L
iabi
lity
(FER
C 9
25)
11
Gen
eral
Lia
bilit
y (W
ildfir
e an
d N
on-W
ildfir
e)
$860
,730
$8
63,0
82
12
Oth
er L
iabi
lity
(e.g
., N
ucle
ar L
iabi
lity,
Sur
ety
Bond
s, F
iduc
iary
, Bro
ker F
ees,
Cyb
er)
$6,6
47
$6,1
77
13
Tota
l Exc
ess
and
Oth
er
$867
,377
$8
69,2
59
WP
3-29
, lin
e 2
14
Di re
ctor
s an
d O
f fice
rs
$26,
997
6,44
1 W
P 3-
29, l
ine
1
15
Tota
l Lia
bilit
y $8
94,3
74
$875
,700
16
Tota
l Util
ity
$906
,143
$9
04,3
32
17
PG&
E C
orpo
ratio
n
18
PG&E
Cor
pora
tion
Allo
catio
n (F
ERC
923
) $1
0,13
0 $2
,744
W
P 3 -
29, l
ine
6
19
Tota
l Exp
ense
$9
16,2
73
$907
,076
W
P 3-
29, l
ine
7
20
Perc
ent I
ncre
ase
– (1
.00%
)

(PG&E-9)
3-51
TAB
LE 3
-12
IT E
XPEN
SES
HIS
TOR
ICA
L A
ND
FO
REC
AST
(T
HO
USA
ND
S O
F D
OLL
AR
S)
Line
N
o.
MW
C
Des
crip
tion
Rec
orde
d Ad
just
ed
Fore
cast
W
orkp
aper
R
efer
ence
20
16
2017
20
18
2019
20
20
2021
20
22
2023
-26
1 JV
M
aint
ain
IT A
pp &
Infra
$2
2 $6
44
$(7)
–
$3
$107
$2
07
$104
W
P 3-
33, l
ine
1
2
Tota
l $2
2 $6
44
$(7)
$2
2 $3
$1
07
$207
$1
04
WP
3-33
, lin
e 2
TAB
LE 3
-13
IT C
API
TAL
EXPE
ND
ITU
RES
BY
MA
JOR
WO
RK
CA
TEG
OR
Y H
ISTO
RIC
AL
AN
D F
OR
ECA
ST
(TH
OU
SAN
DS
OF
DO
LLA
RS)
Line
N
o.
MW
C
Des
crip
tion
Rec
orde
d Ad
just
ed
Fore
cast
W
orkp
aper
R
efer
ence
20
16
2017
20
18
2019
20
20
2021
20
22
2023
20
24
2025
20
26
1 2F
AS
vcs:
D
e vel
opm
ent
$2,1
55
$694
$2
0 $(
6 )
– –
$1,0
00
$500
$5
00
$500
$5
00
WP
3-35
, lin
e 1
2
Tota
l $2
,155
$6
94
$20
$(6)
–
– $1
,000
$5
00
$500
$5
00
$500
W
P 3-
35, l
ine
2

(PG&E-9)
-i-
PACIFIC GAS AND ELECTRIC COMPANY 2023 GENERAL RATE CASE
Testimony ______x_______ Workpapers _____ ______ SOQ ______________ Exhibit Number: ____9____ Chapter Number: ___3____ Chapter Title: Risk, Audit, and Insurance Witness Name: Stephen Cairns
Page No.
Line No. Item As Filed As Corrected
Errata as of November 5, 2021
3-50 Table 3-11, lines 3-16
Recorded Cost line 3: $5,500 line 4: $5,342 line 5: (16,937) line 6: ($11,595) line 7: $21,234 line 8: $2,130 line 9: $23,364 line 10: $11,769 line 11: blank line 12: $860,730 line 13: $6,647 line 14: $867,377 line 15: $26,997 line 16: $894,374
line 3: $5,342 line 4: $(16,937) line 5: $(11,595) line 6: $21,234 line 7: $2,130 line 8: $23,364 line 9: $11,769 line 10: blank line 11: $860,730 line 12: $6,647 line 13: $867,377 line 14: $26,997 line 15: $894,374 line 16: $906,143

(PG&E-9)
PACIFIC GAS AND ELECTRIC COMPANY
CHAPTER 4
COMPLIANCE AND ETHICS
[INCLUDES NOVEMBER 5, 2021 ERRATA]
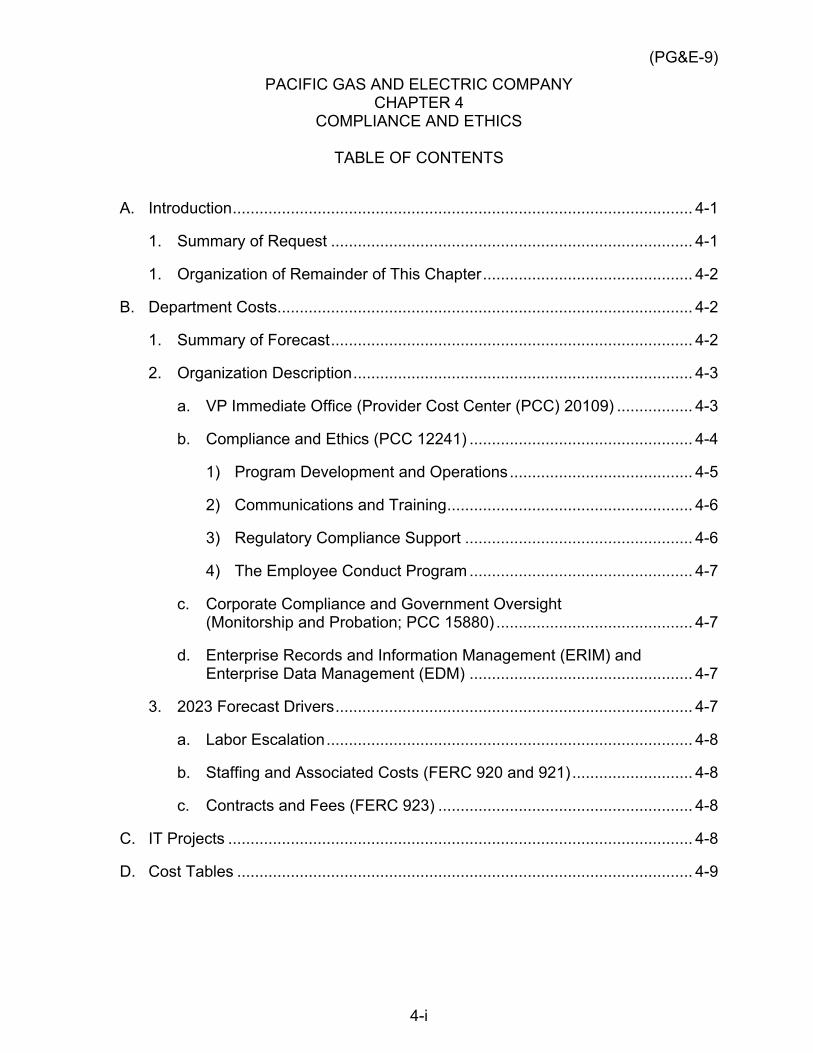
(PG&E-9)
4-i
PACIFIC GAS AND ELECTRIC COMPANY CHAPTER 4
COMPLIANCE AND ETHICS
TABLE OF CONTENTS
A. Introduction ....................................................................................................... 4-1
1. Summary of Request ................................................................................. 4-1
1. Organization of Remainder of This Chapter ............................................... 4-2
B. Department Costs ............................................................................................. 4-2
1. Summary of Forecast ................................................................................. 4-2
2. Organization Description ............................................................................ 4-3
a. VP Immediate Office (Provider Cost Center (PCC) 20109) ................. 4-3
b. Compliance and Ethics (PCC 12241) .................................................. 4-4
1) Program Development and Operations ......................................... 4-5
2) Communications and Training ....................................................... 4-6
3) Regulatory Compliance Support ................................................... 4-6
4) The Employee Conduct Program .................................................. 4-7
c. Corporate Compliance and Government Oversight (Monitorship and Probation; PCC 15880) ............................................ 4-7
d. Enterprise Records and Information Management (ERIM) and Enterprise Data Management (EDM) .................................................. 4-7
3. 2023 Forecast Drivers ................................................................................ 4-7
a. Labor Escalation .................................................................................. 4-8
b. Staffing and Associated Costs (FERC 920 and 921) ........................... 4-8
c. Contracts and Fees (FERC 923) ......................................................... 4-8
C. IT Projects ........................................................................................................ 4-8
D. Cost Tables ...................................................................................................... 4-9

(PG&E-9)
4-1
PACIFIC GAS AND ELECTRIC COMPANY 1
CHAPTER 4 2
COMPLIANCE AND ETHICS 3
A. Introduction 4
1. Summary of Request 5
Pacific Gas and Electric Company’s (PG&E, the Company or the Utility) 6
Compliance and Ethics (C&E) Department is responsible for enhancing and 7
promoting an effective C&E program that is designed to prevent and detect 8
criminal conduct, and promote an organizational culture that encourages 9
ethical conduct and a commitment to compliance with applicable laws and 10
regulations. The C&E program is modeled after the United States (U.S.) 11
sentencing guidelines requirements for an effective C&E program.1 12
PG&E is a large and complex organization and has designed its C&E 13
program to engage each level of the organization—from the Lines of 14
Business (LOB) to the corporate board—while enhancing coordination 15
across LOBs. Specifically, PG&E has implemented a C&E program that: 16
(1) is accountable to the Boards of Directors; (2) is supported by senior-level 17
commitment; (3) has visibility within each LOB; (4) manages, reports and 18
collaborates on compliance efforts across LOBs; (5) communicates these 19
values throughout the organization and provides thoughtful training and 20
feedback mechanisms; (6) promotes a culture where all employees are 21
encouraged to “speak up”; (7) identifies gaps, measures results, and fosters 22
continuous improvement throughout the Company; and (8) promotes 23
accountability. 24
The forecasted costs of the C&E Department are shown in Tables 4-1 25
through 4-4. PG&E requests that the California Public Utilities Commission 26
(Commission) adopt its forecast for 2023 as follows: 27
1 The United States Sentencing Commission’s sentencing guidelines were formally
adopted in 1987. The guidelines provide a model of good corporate citizenship and apply to corporations, partnerships, labor unions, pension funds, trusts, non-profit entities, and governmental units.
(PG&E-9)
4-2
• Department Costs – $8.3 million in expense in 2023.2 This is a 1
$1.1 million (14.6 percent) increase compared to 2020 recorded 2
adjusted costs and is primarily attributable to labor escalation, filling 3
existing vacancies, and a small reduction in contracts. These costs are 4
discussed in Section B below. 5
• Information Technology (IT) – These projects support the increased 6
maturity of PG&E’s C&E program by enhancing the Company’s 7
management of its compliance requirements and strengthening its 8
Guidance Document Management Program. These costs are discussed 9
in Section C below. 10
1. Organization of Remainder of This Chapter 11
The remainder of this chapter is organized as follows: 12
• Section B – Department Costs 13
• Section C – IT Projects 14
• Section D – Cost Tables 15
B. Department Costs 16
1. Summary of Forecast 17
A description of the C&E Department and the activities comprising the 18
basis for the 2020 costs are described in Section B.2. Figure 4-1 below 19
shows the drivers of the 2023 department cost forecast compared to 20
2020 recorded costs. The drivers of the 2023 forecast compared to 2020 21
recorded adjusted costs are: (1) labor escalation; (2) staffing costs 22
associated with filling vacant positions; and (3) contracts and fees. These 23
forecast drivers are discussed in more detail in Section B.3. 24
2 See Table 4-1, line 3.

(PG&E-9)
4-3
FIGURE 4-1 EXPENSE WALK (2017-2020)
(THOUSANDS OF NOMINAL DOLLARS)
2. Organization Description 1
The C&E organization is a part of the General Counsel department 2
which is headed by the Executive Vice President (EVP), General Counsel 3
and Chief Ethics and Compliance Officer (CECO).The CECO reports directly 4
to the CEO of PG&E Corporation. 5
C&E is led by a Vice President (VP), and the department includes 6
five groups: (1) the Immediate Office; (2) Compliance and Ethics; 7
(3) Corporate Compliance and Government Oversight; (4) Enterprise 8
Records and Information Management; and (5) Enterprise Data 9
Management, which are described below. 10
a. VP Immediate Office (Provider Cost Center (PCC) 20109) 11
The VP of C&E reports to the CECO and is further developing the 12
C&E program structure to support the breadth and complexity of the 13
organization’s operations. Specifically, the C&E program aims to ensure 14

(PG&E-9)
4-4
cross-functional engagement and best practices across the enterprise. 1
The C&E VP oversees the enterprise-wide C&E program, including the 2
programs and systems designed to prevent, detect, and mitigate 3
non-compliance, and leads the Company's ethics and compliance 4
training and culture-building efforts. 5
The VP Immediate Office is comprised of one Full-Time Equivalent 6
(FTE): The C&E VP.3 7
b. Compliance and Ethics (PCC 12241) 8
The purpose of the Compliance and Ethics group is to promote and 9
enable ethical and compliant behaviors within PG&E by providing 10
subject matter expertise, tools, resources, and guidance on C&E 11
matters to leaders and employees. The C&E program is an essential 12
entity-level control for complying with the Sarbanes-Oxley Act of 2002, 13
and to meet the standards for an effective compliance program as 14
established under the U.S. Sentencing Guidelines. 15
The Compliance and Ethics group partners with the LOBs to 16
promote consistent advancement of each LOB’s C&E program across 17
the enterprise. For example, Compliance and Ethics works 18
collaboratively with the LOBs to implement the Company’s C&E Maturity 19
Model, which is foundational and enterprise-wide, and includes 20
identification and implementation of U.S. Sentencing Guidelines 21
requirements for the Company. Compliance and Ethics also partners 22
with the LOBs to: (1) assess top compliance requirements; (2) review 23
how the LOBs are managing those requirements; (3) develop 24
prospective mitigation plans for managing them; (4) proactively examine 25
potential future compliance requirements; (5) provide regular Ethics 26
communication and training; and (6) promote ethical decision making 27
throughout the company. In addition, Compliance and Ethics oversees 28
the enterprise-wide Guidance Document Management Program, whose 29
purpose is to reduce the likelihood of human error and enable 30
employees to perform their work safely, correctly, efficiently, and in 31
compliance with all laws, regulations, and internal Company standards. 32
3 Exhibit (PG&E-9), WP 4-6.

(PG&E-9)
4-5
PG&E designed an Integrated Compliance Operating Model that 1
addresses top compliance risks at the enterprise level. This is intended 2
to accelerate compliance maturity on a risk-prioritized basis and improve 3
management of shared compliance responsibilities. Key compliance 4
functions, such as North American Electric Reliability Corporation 5
(NERC) work, may move to direct ownership by Compliance and Ethics. 6
PG&E also recognizes that there is a fundamental relationship 7
between enterprise and compliance risks. As part of the Integrated 8
Compliance Operating Model, PG&E will begin to implement an 9
improved integrated risk and compliance approach, which includes 10
aligning compliance risks to key safety and reliability risk events and 11
cross-cutting factors. Additional information on this subject can be 12
found in Exhibit (PG&E-2), Chapter 3. 13
The Compliance and Ethics group is comprised of four sub-groups: 14
(1) Program Development and Operations; (2) Communications and 15
Training; (3) Regulatory Compliance Support; and (4) the Employee 16
Conduct Program. 17
The Compliance and Ethics department had 22 FTEs in 2020. 18
1) Program Development and Operations 19
Program Development and Operations (PDO) is principally 20
responsible for developing a multi-year roadmap for the enterprise 21
Compliance and Ethics team's work. This includes developing and 22
tracking milestones for the program, performing benchmarking and 23
developing leading metrics to understand LOBs’ compliance 24
performance, and providing training and workshops to promote best 25
practices. PDO also has responsibility for enterprise compliance 26
programs and initiatives, including the enterprise Guidance 27
Document Management Program, Federal Contract Compliance 28
Program, and Compliance Management Tool. PDO is also 29
responsible for Governance, Reporting, and Metrics, which includes 30
managing and tracking the deliverables for the Senior-Officer team, 31
Senior-Officer Compliance, Ethics, and Audit Committee, 32
Director-level C&E Leadership Team, and Manager/Principal-level 33
C&E Liaisons team. 34

(PG&E-9)
4-6
2) Communications and Training 1
The purpose of the Communications and Training group is to 2
promote a culture of C&E, where employees are enabled and 3
inspired to act with integrity, speak-up to raise concerns, and comply 4
with all legal and regulatory requirements. The Communications 5
and Training group is comprised of two sub-groups: (1) C&E 6
Awareness and Outreach; and (2) Training Content and Delivery. 7
C&E Awareness and Outreach provides employees with tools 8
and education on how to raise issues, ideas, and concerns; 9
identifies and reports on cultural trends; and develops and 10
implements a conduct-related communications program. Its key 11
deliverables include the preparation, implementation, and 12
management of PG&E’s Code of Conduct, data analysis and action 13
plans to strengthen and enhance the Company’s Speak-Up, 14
Listen-Up, Follow-Up culture, management of the PG&E Ethics 15
Council, and a wide variety of communications efforts. 16
Training Content and Delivery designs and implements PG&E’s 17
annual C&E training, the annual Code of Conduct training, and other 18
targeted trainings. 19
3) Regulatory Compliance Support 20
Regulatory Compliance Support is principally responsible for 21
managing the C&E Department's interface with other LOBs 22
regarding PG&E's C&E programs, including the C&E Maturity 23
Model, and controls testing. The C&E Maturity Model is a 24
foundational and enterprise-wide effort. It consists of 25
eight elements—generally derived from the U.S. Sentencing 26
Guidelines—that reflect best practices for managing C&E programs. 27
It does not assess whether a program owner is in or out of 28
compliance in any area, but, rather, identifies numerous specific 29
criteria that the program owners and central C&E program must 30
achieve to reach successive levels of program maturity. The C&E 31
Maturity Model establishes a common roadmap to program maturity 32
and enables those with more mature C&E programs to share with 33
others how to implement those practices. 34

(PG&E-9)
4-7
Using the model as a guide, PG&E’s expectation is for each 1
LOB to effectively manage its high- and medium-risk C&E items. 2
The Maturity Model is a foundation of PG&E’s C&E program and the 3
work to continuously improve the Company’s C&E maturity will carry 4
on indefinitely. 5
4) The Employee Conduct Program 6
The Employee Conduct Program oversees PG&E’s Compliance 7
and Ethics Helpline, and the employee conduct investigation and 8
reporting process. The group’s key deliverables include analyzing 9
conduct data and regularly reporting to PG&E’s Boards of Directors 10
and senior management. The group also partners with LOBs across 11
the Company to assess and resolve allegations of employee 12
misconduct, as well as respond to requests for guidance on 13
C&E-related matters. 14
c. Corporate Compliance and Government Oversight 15
(Monitorship and Probation; PCC 15880) 16
Corporate Compliance and Government Oversight leads and 17
manages PG&E’s efforts to ensure full and timely compliance with 18
requirements and requests under the terms of PG&E’s Federal 19
Monitorship and Probation. This team is comprised of 3 FTEs. 20
Costs for this group’s activities are booked below-the-line and paid 21
for by PG&E shareholders. They are not included in PG&E’s 22
2023 General Rate Case (GRC) forecast. 23
d. Enterprise Records and Information Management (ERIM) and 24
Enterprise Data Management (EDM) 25
The ERIM and EDM functions are addressed in Exhibit (PG&E-7), 26
Chapter 7. 27
3. 2023 Forecast Drivers 28
The department forecast of $8.3 million for 2023 is approximately 29
$1.1 million (14.6 percent) higher than the 2020 recorded adjusted amount 30
of $7.2 million.4 As discussed further below, the increase is primarily 31
4 See Table 4-1, line 3.

(PG&E-9)
4-8
attributable to the following drivers: (1) Labor Escalation; (2) Staffing and 1
Associated Costs; and (3) Contracts and Fees. 2
a. Labor Escalation 3
Compliance and Ethics forecasts a $ .37 million increase attributable 4
to the cumulative impact of labor escalation from 2020 through 2023, 5
based on the labor escalation values provided in Exhibit (PG&E-8), 6
Chapter 4. 7
b. Staffing and Associated Costs (FERC 920 and 921) 8
PG&E forecasts a $.81 million increase in staffing costs associated 9
with filling positions that were vacant in the organization in 2020. PG&E 10
does not forecast adding additional headcount to the organization for 11
2023. 12
c. Contracts and Fees (FERC 923) 13
PG&E forecasts a $.12 million decrease in contract costs for 2023. 14
This does not represent a material change to PG&E’s use of consultants 15
to support the organization. The C&E Department will continue to 16
leverage outside consultant expertise in working towards the Company’s 17
maturity and to perform important functions related to program maturity 18
going forward. These functions include the review and validation of 19
documented evidence submitted by LOBs to demonstrate achievement 20
of higher maturity levels. It also includes the review and validation of all 21
LOBs’ C&E program maturity to assess the Company’s overall progress 22
in achieving its maturity goals. Lastly, these functions include ongoing 23
reviews and validations to confirm that the LOBs have not only achieved 24
but are also maintaining maturity and are continuously improving. 25
C. IT Projects 26
PG&E forecasts $0.2 million in expense and $0.5 million capital per year 27
from 2022-2026 to upgrade existing IT systems that support Compliance & 28
Ethics. The organization will update MetricStream, PG&E’s Compliance 29
Management Tool which provides comprehensive and uniform risk and 30
compliance management capabilities and is used across the enterprise5. The 31
5 Exhibit (PG&E 9), WP 4-33 to WP 4-34.

(PG&E-9)
4-9
updates will increase the reach and efficiency of MetricStream, supporting the 1
goal of continually improving compliance performance. PG&E also plans to 2
implement an update to enable mobile access to guidance documents. The 3
project will increase access to these key resources for PG&E field- and 4
office-based employees and contractors who leverage mobile devices as their 5
primary technology tools. The guidance document update will be completed 6
prior to 2023.6 7
D. Cost Tables 8
The C&E organization’s recorded costs for 2020 and forecast expense for 9
2021 through 2023 are shown in Tables 4-1 and 4-4.10
6 Exhibit (PG&E 9), WP 4-35.

4-10
(PG&E-9)
TAB
LE 4
-1
SUM
MA
RY
OF
DEP
AR
TMEN
T EX
PEN
SE H
ISTO
RIC
AL
AN
D F
OR
ECA
ST
(TH
OU
SAN
DS
OF
NO
MIN
AL
DO
LLA
RS)
Line
N
o.
Des
crip
tion
Rec
orde
d Ad
just
ed
Fore
cast
W
orkp
aper
R
efer
ence
2016
20
17
2018
20
19
2020
20
21
2022
20
23
1 1)
C&E
Imm
edia
te O
ffice
$4
83
$451
$4
70
$481
$3
22
$353
$3
68
$398
W
P 4-
3, li
ne 1
9 2
2) C
&E
5,21
2 6,
129
6,29
7 5,
776
6,92
0 7,
500
7,70
1 7,
900
WP
4-3,
line
12
3 To
tal
$5,6
95
$6,5
80
$6,7
67
$6,2
57
$7,2
42
$7,8
53
$8,0
69
$8,2
98
WP
4-3,
line
5
TAB
LE 4
-2
SUM
MA
RY
OF
DEP
AR
TMEN
T EX
PEN
SE B
Y FE
RC
AC
CO
UN
T (T
HO
USA
ND
S O
F N
OM
INA
L D
OLL
AR
S)
Line
N
o.
Des
crip
tion
Rec
orde
d Ad
just
ed
Fore
cast
W
orkp
aper
R
efer
ence
20
16
2017
20
18
2019
20
20
2021
20
22
2023
Org
aniz
atio
n Vi
ew
1 92
0 –
Adm
in &
Gen
Sal
arie
s $1
,827
$2
,854
$3
,085
$3
,483
$3
,399
$4
,066
$4
,180
$4
,309
W
P 4-
3, li
ne 1
2
921
– O
ffice
Sup
plie
s &
Ex
251
440
181
168
109
353
363
372
WP
4-3,
line
2
3 92
3 –
Out
side
Svc
Em
ploy
–
Util
ity
3,13
5 2,
836
3,03
2 2,
598
3,72
6 3,
434
3,52
6 3,
617
WP
4-3,
line
3
4 92
3 –
Out
side
Svc
Em
ploy
– C
orp
483
451
470
8 7
– –
– W
P 4-
3, li
ne 4
5 To
tal
$5,6
95
$6,5
80
$6,7
67
$6,2
57
$7,2
41
$7,8
53
$8,0
69
$8,2
98
WP
4-3,
line
5
6 C
hang
e fro
m P
rior Y
ear
$8
85
$187
$(
510)
$9
84
$612
$2
16
$229
W
P 4-
3, li
ne 6

4-11
(PG&E-9)
TAB
LE 4
-3
IT E
XPEN
SE B
Y M
AJO
R W
OR
K C
ATE
GO
RY
(TH
OU
SAN
DS
OF
NO
MIN
AL
DO
LLA
RS)
Line
N
o.
Des
crip
tion
MW
C
Rec
orde
d Ad
just
ed
Fore
cast
W
orkp
aper
R
efer
ence
20
16
2017
20
18
2019
20
20
2021
20
22
2023
1 M
aint
ain
IT A
pplic
atio
ns a
nd In
frast
ruct
ure
JV
$27
$280
$3
11
$125
$1
07
$175
$2
25
$225
W
P 4-
28, l
ine
1
2 To
tal
$2
7 $2
80
$311
$1
25
$107
$1
75
$225
$2
25
WP
4-28
, lin
e 2

4-12
(PG&E-9)
TAB
LE 4
-4
IT C
API
TAL
BY
MA
JOR
WO
RK
CA
TEG
OR
Y (T
HO
USA
ND
S O
F N
OM
INA
L D
OLL
AR
S)
Line
N
o.
MW
C
MAT
M
AT
Des
crip
tion
Cap
ital E
xpen
ditu
res
2016
R
ecor
ded
Adj u
sted
2017
R
ecor
ded
Adju
s ted
2018
R
ecor
ded
Adj u
sted
2019
R
ecor
ded
Adj u
sted
2020
R
ecor
ded
Adj u
sted
20
21
For e
cast
20
22
For e
cast
20
23
For e
cast
20
24
For e
cast
20
25
For e
cast
20
26
For e
cast
W
orkp
aper
R
efer
enc e
1 2F
2F
A AS
vcs:
D
evel
opm
ent
– $1
,314
$1
,120
$4
94
$1
– $5
00
$500
$5
00
$500
$5
00
2
To
tal
–
$1,3
14
$1,1
20
$494
$1
–
$500
$5
00
$500
$5
00
$500
____
____
____
___
Not
e: E
xclu
des
proj
ects
gre
ater
than
$3
milli
on

(PG&E-9)
-i-
PACIFIC GAS AND ELECTRIC COMPANY 2023 GENERAL RATE CASE
Testimony _____x________ Workpapers _____________ SOQ _______ Exhibit Number: ____9____ Chapter Number: ___4____ Chapter Title: Compliance and Ethics Witness Name: Jennifer Andrews
Page No.
Line No. Item As Filed As Corrected
Errata as of November 5, 2021
4-11 2 Recorded Cost Forecast Cost
2017: $1,594K 2018: $1,431K 2019: $619K 2020: $108K 2022: $725K 2023: $725K
2017: $280K 2018: $311K 2019: $125K 2020: $107K 2022: $225K 2023: $225K

(PG&E-9)
PACIFIC GAS AND ELECTRIC COMPANY
CHAPTER 5
REGULATORY AFFAIRS
[INCLUDES NOVEMBER 5, 2021 ERRATA]

(PG&E-9)
5-i
PACIFIC GAS AND ELECTRIC COMPANY CHAPTER 5
REGULATORY AFFAIRS
TABLE OF CONTENTS
A. Introduction ....................................................................................................... 5-1
1. Scope and Purpose ................................................................................... 5-1
2. Organization of Remainder of This Chapter ............................................... 5-2
B. Department Costs ............................................................................................. 5-2
1. Summary of Forecast ................................................................................. 5-2
2. Organization Description ............................................................................ 5-3
a. VP Immediate Office (PCC 15479) ...................................................... 5-4
1) Regulatory Operations and Analytics ............................................ 5-4
b. Regulatory Relations (PCC 15477) ..................................................... 5-6
1) CPUC Relations ............................................................................ 5-6
2) FERC and Independent System Operator Relations ..................... 5-7
c. Regulatory Proceedings (PCC 10421) ................................................ 5-8
1) CPUC Proceedings ....................................................................... 5-8
2) FERC Electric Proceedings ........................................................... 5-9
d. Rates (PCC 15465) ............................................................................. 5-9
1) Rate Design .................................................................................. 5-9
2) Load Forecasting .......................................................................... 5-9
3. 2023 Forecast Drivers .............................................................................. 5-10
a. Labor Escalation ................................................................................ 5-10
b. Staffing .............................................................................................. 5-10
C. IT Projects ...................................................................................................... 5-11
1. Cost of Service Enhancements ................................................................ 5-12
2. Gas Rate Design Enhancements ............................................................. 5-12
D. Cost Tables .................................................................................................... 5-12

(PG&E-9)
5-1
PACIFIC GAS AND ELECTRIC COMPANY 1
CHAPTER 5 2
REGULATORY AFFAIRS 3
A. Introduction 4
1. Scope and Purpose 5
Pacific Gas and Electric Company’s (PG&E or the Company) Regulatory 6
Affairs organization provides to the operating Lines of Business (LOB) 7
expertise in state and federal regulatory matters. This includes regulatory 8
policy development and implementation, advocacy, rate design and data 9
analysis, and the management of a growing number of complex regulatory 10
cases and initiatives. Since PG&E is a regulated company, the functions 11
performed by the Regulatory Affairs organization are necessary for PG&E 12
to serve its customers. 13
Working closely with the LOBs, Regulatory Affairs develops regulatory 14
policies, prepares filings, and manages regulatory cases before state and 15
federal regulators and other external stakeholders. These include, 16
the California Public Utilities Commission (CPUC or Commission), 17
Federal Energy Regulatory Commission (FERC), and California 18
Independent System Operator (CAISO). Regulatory Affairs also manages 19
the implementation of final decisions issued by these regulators. This 20
implementation includes the development of processes and reports to 21
comply with decision requirements. Regulatory Affairs also performs 22
several support functions for proceedings, including rate design; data 23
analyses; revenue forecasting; advice filings; tariff management; load 24
forecasting and research; and document processing and management. 25
To fulfill its objectives, the Regulatory Affairs organization continually adapts 26
to changes in the business environment and focuses on improving its 27
operational efficiency by leveraging technology and improving processes. 28
The Regulatory Affairs forecast for 2023 is shown in Tables 5-1 29
through 5-4. PG&E requests that the Commission adopt its 2023 total 30
forecast as follows: 31

(PG&E-9)
5-2
• Department Costs – The 2023 forecast is $17.3 million,1 which is 1
$1.4 million (9 percent) higher than the 2020 recorded amount of 2
$15.9 million.2 The $1.4 million increase is primarily attributable to labor 3
escalation3 and costs to backfill vacant positions. 4
• Information Technology (IT) Projects – PG&E forecasts approximately 5
$429 thousand in expense for 2023.4 PG&E requests that the 6
Commission adopt its IT capital forecast as follows: $100 thousand for 7
2021; $1.5 million for 2022, $1.5 million for 2023, $1.5 million for 2024, 8
$1.5 million for 2025, and $1.5 million for 2026.5 These projects support 9
the continued development of analytical models for rate design, 10
marginal cost analyses, load research, and customer data analytics as 11
discussed in Section C below. Table 5-4 includes the forecasts for 12
capital projects for each year 2021-2026. 13
2. Organization of Remainder of This Chapter 14
The remainder of this chapter is organized as follows: 15
• Section B – Department Costs; 16
• Section C – Information Technology Projects; and 17
• Section D – Cost Tables. 18
B. Department Costs 19
1. Summary of Forecast 20
Activities for the department are described in Section B.2. Figure 5-1 21
shows the primary drivers of changes in department costs from 22
2020 recorded adjusted costs to the 2023 forecast. These drivers are 23
discussed in detail in Section B.3. 24
1 See Tables 5-1 and 5-2. 2 Exhibit (PG&E-9), WP 5-3, line 5. 3 See Exhibit (PG&E-8) – Human Resources, Ch. 4 – Compensation, STIP,
Non-Qualified Retirement and Labor Escalations. 4 Exhibit (PG&E-9), WP 5-46, line 2; see also Table 5-3. 5 Exhibit (PG&E-9), WP 5-48, line 2; see also Table 5-4.

(PG&E-9)
5-3
FIGURE 5-1 EXPENSE WALK (2020-2023)
(THOUSANDS OF NOMINAL DOLLARS)
2. Organization Description 1
The Regulatory Affairs organization costs cover labor expenses for 2
four distinct functions: 3
1) Vice President’s (VP) Immediate Office – The VP manages the overall 4
development, execution, and oversight of PG&E’s Regulatory Affairs 5
activities including the functions described below. In addition, 6
the VP’s Immediate Office manages the Regulatory Operations and 7
Analytics team described below. 8
2) Regulatory Relations – Manages PG&E’s interactions with the 9
CPUC, FERC, and CAISO. 10
3) Regulatory Proceedings – Manages PG&E’s proceedings with the 11
CPUC and FERC. This includes case management and filings. 12
4) Rates – Manages PG&E’s electric and gas Rate Design; 13
Revenue Forecasting, and Load Forecasting. 14
$17,323 $15,889
$1,235 $200
$0
$2,000
$4,000
$6,000
$8,000
$10,000
$12,000
$14,000
$16,000
$18,000
$20,000
2020 Recorded Labor Escalation Staffing 2023 Forecast
Expense Walk (2020-2023)(Thousands of Nominal Dollars)

(PG&E-9)
5-4
a. VP Immediate Office (PCC 15479) 1
The VP of Regulatory Affairs is responsible for the overall 2
development, execution, oversight, and management of PG&E’s 3
Regulatory Affairs activities. 4
The VP works with the Company’s leaders on a broad range of key 5
issues, such as long-term electric and natural gas supply and resource 6
planning; renewable resource procurement and development; 7
customer service and safety and reliability initiatives; regulatory 8
investigations; infrastructure development and expansion; demand-side 9
management programs; conservation and green programs and 10
initiatives; customer-focused rate design; and revenue requirements 11
and financial impacts. Specifically, responsibilities of the VP include: 12
• Providing oversight for PG&E’s CPUC and FERC proceedings, 13
with the goals of solid policy development, public safety, customer 14
satisfaction, and adequate revenue recovery; 15
• Representing PG&E in CAISO and FERC meetings, stakeholder 16
processes, and the proceedings of other regulatory and legislative 17
bodies; 18
• Providing guidance and regulatory expertise to Company leaders to 19
inform key business decisions and issues; 20
• Leading and developing the management leadership team within the 21
Regulatory Affairs organization; and 22
• Managing the regulatory functions that report to the VP, 23
which include: (1) Regulatory Operations and Analytics; 24
(2) Regulatory Relations; (3) Regulatory Proceedings; 25
and (4) Rates. 26
1) Regulatory Operations and Analytics 27
The Regulatory Operations and Analytics group is made up of 28
the following teams: Regulatory Analytics, Regulatory Operations, 29
and Regulatory Support. 30
a) Regulatory Analytics 31
The Regulatory Analytics group provides data analysis 32
support for numerous proceedings, compliance requirements 33

(PG&E-9)
5-5
and many internal and external groups. This support includes 1
working closely with stakeholders to: (1) design and implement 2
analytical databases and related systems; (2) develop reports 3
and analyses of historical customer and hourly load data; and 4
(3) estimation of customers bill determinants and bill impacts for 5
proposed rate changes. This team uses several models that 6
access customers’ demographic, interval meter and billing data. 7
This team also develops and validates models and maintains 8
them for Regulatory Affairs and serves as liaison with IT to 9
implement IT projects for Regulatory Affairs. The Regulatory 10
Analytics group is primarily responsible for: 11
• Developing and maintaining analytical databases and 12
related systems; 13
• Partnering with IT to implement IT projects; 14
• Developing and maintaining models; 15
• Developing the annual Class Load Research Study, the 16
annual California Energy Commission (CEC) Load Data 17
Deliverable, and the annual Static Load Profiles; 18
• Developing the load research statistics for the annual 19
Electric Vehicle Load Research and Cost Studies; 20
• Responding to ad hoc data requests for load profiles and 21
other load research statistics; 22
• Providing load research, bill determinants and bill impact 23
analyses for all rate change proposals; and 24
• Preparing customized reports on customers demographic, 25
interval meter and billing data to support rate case filings, 26
rate design, and other analytical needs. 27
b) Regulatory Operations 28
The Regulatory Operations group provides 29
cross-departmental support, including: (1) tariff management 30
and Advice Letter (AL) support; (2) department metrics and 31
reporting; (3) coordinating strategic and operating plan 32
development, and (4) support of process improvement 33
initiatives. Primary responsibilities include: 34

(PG&E-9)
5-6
• Coordinating all AL filings; 1
• Facilitating the tracking of regulatory compliance items 2
which result from regulatory decisions; 3
• Providing support for: Regulatory Affairs department tools, 4
which includes the department intranet and Proceedings 5
SharePoint sites; and 6
• Facilitating the Regulatory Accounting Document process 7
and related Sarbanes-Oxley testing. 8
c) Regulatory Support 9
This group performs a variety of regulatory support 10
activities, such as: records management, document services, 11
case coordination and hearings support. Primary 12
responsibilities include: 13
• Supporting the case management process, including case 14
coordination from the case planning stage through case 15
approval and implementation; 16
• Providing logistical and administrative support to case 17
teams during hearings; and 18
• Providing support to the external regulation site, including 19
the discovery portal. 20
b. Regulatory Relations (PCC 15477) 21
The Regulatory Relations Department manages PG&E’s 22
interactions with the FERC and CPUC, and with other state agencies, 23
such as the CAISO and Wildfire Safety Division (which moves from the 24
CPUC to the California Natural Resources Agency in 2021). 25
1) CPUC Relations 26
CPUC Relations directs the development and management of 27
PG&E’s regulatory cases before the CPUC, supports the operating 28
LOBs by providing regulatory expertise, and manages 29
communications with the CPUC. The responsibilities of CPUC 30
Relations include: 31

(PG&E-9)
5-7
• Supporting the Company’s LOBs at the CPUC by providing 1
regulatory advice to inform and improve their operations and 2
planning, as appropriate, to achieve their business objectives; 3
• Overseeing and monitoring the Company’s communications 4
with the CPUC, and serving as the primary point of contact 5
between the CPUC and the Company; and 6
• Working with a wide range of stakeholders to build 7
mutually-agreeable regulatory policies and outcomes that 8
reduce litigation and promote broad-based and 9
customer-focused regulatory solutions. 10
2) FERC and Independent System Operator Relations 11
FERC and Independent System Operator (ISO) Relations 12
supports the Company’s LOBs by managing the development, 13
approval, and implementation of federal regulatory filings involving 14
the CAISO and other policy matters before the FERC. This group 15
works with stakeholders on national and state levels to adopt and 16
implement market policies. In addition, the department works on 17
renewable resource and grid integration projects to support PG&E’s 18
compliance activities. 19
The primary responsibilities of the FERC and ISO Relations 20
group are: 21
• Identifying and providing regulatory guidance needed to 22
support LOBs; 23
• Managing issue development and participating in CAISO 24
stakeholder processes; 25
• Managing PG&E’s participation in CAISO and FERC 26
proceedings, including: developing policy and strategy; 27
overseeing the regulatory process; and ensuring equitable cost 28
and revenue allocation; and 29
• Managing compliance with CAISO tariffs and rate schedules. 30
The time and costs for the FERC and ISO Relations group 31
associated with Electric Transmission are charged to 32
FERC-jurisdictional electric transmission operations and 33
maintenance expense, in proportion to time spent on electric 34

(PG&E-9)
5-8
transmission matters, which are determined and recovered in the 1
FERC Transmission Owner (TO) rate cases. The FERC and ISO 2
Relations group also provides regulatory support to various other 3
departments, including: Energy Policy and Procurement, Electric 4
Operations Asset Management, Power Generation, Customer Care, 5
and Gas Operations. The costs related to the time spent supporting 6
these other LOBs are properly categorized as Administrative and 7
General (A&G) expenses, and are recovered in this GRC in 8
accordance with the unbundling of A&G principles discussed in 9
Exhibit (PG&E-10), Chapter 8.6 10
c. Regulatory Proceedings (PCC 10421) 11
The Regulatory Proceedings Department develops and manages 12
PG&E’s regulatory cases before the CPUC and FERC, including 13
supporting LOBs in developing regulatory strategy and case showings. 14
1) CPUC Proceedings 15
The CPUC Proceedings group supports various LOBs to: 16
develop revenue forecasts and testimony; prepare witnesses; 17
manage discovery; and manage proceedings from filing through 18
approval and implementation. This also includes management of 19
PG&E’s General Rate Case (GRC). 20
The primary responsibilities for the CPUC Proceedings group 21
include: 22
• Working with LOBs to develop policy and case strategies; 23
• Overseeing the case management process, including: 24
developing testimony, managing discovery, preparing rebuttal, 25
and preparing witnesses; 26
• Working to identify and resolve issues as they arise; and 27
• Working with LOBs to identify and implement regulatory 28
compliance items resulting from regulatory decisions. 29
• Examples of proceedings managed by this group include the 30
GRC, Risk Assessment and Mitigation Phase (RAMP) of the 31
GRC, Power Charge Indifference Adjustment (PCIA) Order 32
6 Exhibit (PG&E-10), Ch. 8, Section C.

(PG&E-9)
5-9
Instituting Rulemaking (OIR); Disconnections OIR, Energy 1
Resource Recovery Account Forecast and Compliance, Climate 2
Adaptation OIR and Wildfire Mitigation Plan. 3
2) FERC Electric Proceedings 4
This department supports the development and management of 5
the TO rate case. The costs of this department are not included in 6
the GRC as they are related to FERC-jurisdictional activities. 7
d. Rates (PCC 15465) 8
The Rates and Regulatory Analytics Department consists of 9
two distinct functions: (1) Rate Design; and (2) Load Forecasting. 10
1) Rate Design 11
The Rate Design group is responsible for rate design and 12
marginal cost estimation for PG&E, as well as implementing rate 13
changes resulting from rate design or revenue proceedings. 14
This team uses numerous models that access interval and customer 15
billing data to: forecast rates, design Time-of-Use (TOU) periods, 16
and develop new rates or rate components. The Rate Design 17
group’s primary responsibilities include: 18
• Designing electric and gas rates; 19
• Supporting rates-related cases, such as the GRC Phase 2, 20
Rate Design Window, GT&S Cost Allocation and Rate Design 21
Proceeding, and the Gas Cost Allocation Proceeding; 22
• Providing data analytics and analysis; 23
• Analyzing customer sales, load, rates, usage, and 24
billing information; 25
• Forecasting future rate and bill impacts; and 26
• Estimating and forecasting marginal costs and cost of service. 27
2) Load Forecasting 28
The Load Forecasting group develops hourly, monthly, and 29
annual electric and gas sales forecasts for PG&E’s service territory, 30
and PG&E’s bundled electric and core gas customers. This team 31
uses several models that access interval and demographic data to 32
(PG&E-9)
5-10
perform these forecasts. The Load Forecasting group’s primary 1
responsibilities include: 2
• Developing electric energy sales forecasts, electric demand 3
forecasts, and electric customer forecasts for PG&E’s 4
service territory; and 5
• Developing gas throughput forecasts and gas customer 6
forecasts for PG&E’s service territory. 7
3. 2023 Forecast Drivers 8
The 2023 forecast is $17.3 million, which is $1.4 million (9 percent), 9
higher than the 2020 recorded amount of $15.9 million. As shown in 10
Figure 5-1 above, the major cost driver for the 2023 forecast is labor 11
escalation and backfilling open positions offset by the elimination of a 12
onetime charge incurred in 2020. Each is discussed in more detail below. 13
a. Labor Escalation 14
For 2023, PG&E forecasts increases of $1.2 million in labor 15
escalation based on the labor escalation values provided in Exhibit 16
(PG&E-8), Chapter 4.7 17
b. Staffing 18
For 2023, PG&E forecasts a net increase of $200 thousand in 19
staffing costs, which includes the cost of backfilling of open positions, 20
partially offset by a reduction for the costs of non-recurring work incurred 21
in 2020.8 22
7 See Exhibit (PG&E-8), Ch. 4 for the forecast labor escalation rates. 8 Exhibit (PG&E-9), WP 5-31, line 29.

(PG&E-9)
5-11
C. IT Projects 1
As part of the normal course of business, the Regulatory Affairs organization 2
has a continuing need to review and upgrade existing IT systems and models to 3
keep up with changing regulatory requirements, evolving rate structures, 4
and new rate schedules. In addition, as discussed above, Regulatory Affairs is 5
responsible for several data analytics, modeling, and forecasting functions, 6
including: (1) load forecasting; (2) load research; (3) rate data analytics, 7
including accessing customer billing and interval meter data for discovery and 8
regulatory requests; (4) revenue allocation; (5) rate design; (6) billing 9
determinants estimating; and (7) bill calculating. 10
Although PG&E has made great strides in recent years, the technologies 11
that are available in the “big data industry” to manage, maintain, and analyze 12
these extremely large data continue to evolve. To perform the rate analytics that 13
are necessary for PG&E’s rate proceedings and the increasing complexity of 14
regulatory proceedings, the organization must build upon and integrate the data 15
and model platform work that has already been done. In addition, 16
Regulatory Affairs must further leverage new technologies that are available in 17
the marketplace today to perform the complex analytics needed to support the 18
rate structures for PG&E to and to help California’s economy transition to 19
greenhouse gas (GHG) neutrality by 2045. These projects will help PG&E and 20
California meet ambitious policy mandates in a transparent and affordable 21
manner. 22
The Regulatory Affairs organization is planning two technology projects to 23
enhance its analytical capabilities: (1) Cost of Service Enhancements; and 24
(2) Gas Rate Design Enhancements. These projects support the Safety, 25
Governance, Regulatory, and Compliance value stream as described in 26
Exhibit (PG&E-7), Chapter 8. For these projects, PG&E forecasts a total of 27
$429 thousand in expense for 2023, and $1.5 million in capital for each year 28
from 2022 to 2026. Each project is discussed below.9 In addition, PG&E 29
forecasts $100 thousand in capital in 2021 for model validation and stabilization 30
of the Model Platform and Data Integration project which was approved in the 31
2020 GRC. 32
9 Exhibit (PG&E-9), WP 5-46 and WP 5-48.

(PG&E-9)
5-12
1. Cost of Service Enhancements 1
The purpose of this project is to make cost data from PG&E’s SAP 2
financial system available to PG&E’s analytics platform to enable the 3
development of new Cost of Service models that can be used to improve 4
downstream Revenue Allocation and Rate Design models. 5
PG&E forecasts approximately $429 thousand in expense in 2023, 6
$1.5 million in capital for 2022, $1.5 million in capital for 2023, and 7
$1.137 million in capital for 2024.10 8
2. Gas Rate Design Enhancements 9
The Gas Rate Design Project will enable integration of customer specific 10
information concerning usage levels and patterns, income levels, and 11
information regarding the type of premise (single family home, multi-family, 12
North American Industry Classification System code for small commercial 13
customers, etc.) with information concerning the risk-based timeline of when 14
that gas line, services, regulators, and meters could require normal 15
replacement. Analyzing the distribution of these joint characteristics will 16
inform PG&E’s ability to propose targeted rate designs and programs to 17
more efficiently achieve electrification of customers served from PG&E’s gas 18
distribution system. This is compared to a status quo scenario of random 19
electrification where PG&E must maintain the current gas distribution 20
system in service as total gas demand declines. 21
PG&E forecasts no expenses for this project in 2023 and approximately 22
$346 thousand in capital in 2024, $1.5 million in capital for 2025, and 23
$1.5 million in capital for 2026.11 24
D. Cost Tables 25
Regulatory Affairs’ recorded adjusted costs for 2020, forecast costs for 26
expense for 2021 through 2023, and capital expenditures for 2021 through 2026 27
are shown in Tables 5-1 to 5-4. 28
10 See Exhibit (PG&E-9), WP 5-52 to WP 5-54 for more information about the project. 11 See Exhibit (PG&E-9), WP 5-55 to WP 5-58 for more information about the project.

5-13
(PG&E-9) TA
BLE
5-1
SU
MM
AR
Y O
F D
EPA
RTM
ENT
EXPE
NSE
S R
EGU
LATO
RY
AFF
AIR
S O
RG
AN
IZA
TIO
N
HIS
TOR
ICA
L A
ND
FO
REC
AST
( T
HO
USA
ND
S O
F N
OM
INA
L D
OLL
AR
S)
Line
N
o.
Des
crip
tion
Rec
orde
d Ad
just
ed
Fore
cast
W
orkp
aper
R
efer
ence
20
16
2017
20
18
2019
20
20
2021
20
22
2023
1 Im
med
iate
Offi
ce R
egul
ator
y Af
fairs
$5
54
$2,2
49
$2,5
88
$4,3
44
$5,7
05
$6,0
30
$6,2
07
$6,3
89
WP
5-3,
line
12
2 R
egul
ator
y R
elat
ions
2,
503
2,08
7 2,
078
1,92
8 1,
923
2,35
3 2,
425
2,49
8 W
P 5-
3, li
ne 3
3 3
Reg
ulat
ory
Proc
eedi
ngs
6,06
8 4,
231
5,00
2 3,
808
4,07
3 3,
601
3,70
3 3,
808
WP
5-3,
line
26
4 R
ates
and
Reg
ulat
ory
Anal
ytic
s 8,
947
7,17
8 5,
082
4,17
9 4,
188
4,36
3 4,
494
4,62
9 W
P 5-
3, li
ne 1
9
5 To
tal
$18,
072
$15,
744
$14,
751
$14,
259
$15,
889
$16,
347
$16,
828
$17,
323
WP
5-3,
line
5
TAB
LE 5
-2
SUM
MA
RY
OF
DEP
AR
TMEN
T EX
PEN
SES
BY
FER
C A
CC
OU
NT
REG
ULA
TOR
Y A
FFA
IRS
OR
GA
NIZ
ATI
ON
H
ISTO
RIC
AL
AN
D F
OR
ECA
ST
(TH
OU
SAN
DS
OF
NO
MIN
AL
DO
LLA
RS)
Line
N
o.
Des
crip
tion
Rec
orde
d Ad
just
ed
Fore
cast
W
orkp
aper
R
efer
ence
20
16
2017
20
18
2019
20
20
2021
20
22
2023
1 92
0 –
A&G
Sal
arie
s $1
3,80
8 $1
3,33
5 $1
3,26
7 $1
3,41
1 $1
4,23
3 $1
5,31
3 $1
5,78
3 $1
6,26
7 W
P 5-
3, li
ne 1
2
921
– O
ffice
Sup
plie
s an
d Ex
71
2 43
5 47
2 47
6 1,
078
341
351
362
WP
5-3,
line
2
3 92
3 –
Out
side
Svc
Em
ploy
– U
tility
3,
552
1,97
4 1,
012
373
578
695
695
695
WP
5-3,
line
3
4 92
3 –
Out
side
Svc
Em
ploy
– C
orp
– –
– –
– –
– –
WP
5-3,
line
4
5 To
tal
$18,
072
$15,
744
$14,
751
$14,
019
$15,
889
$16,
347
$16,
828
$17,
323
WP
5-3,
line
5

5-14
(PG&E-9) TA
BLE
5-3
R
EGU
LATO
RY
AFF
AIR
S D
EPA
RTM
ENT
COST
S IT
EXP
ENSE
BY
MA
JOR
WO
RK
CA
TEG
OR
Y (T
HO
USA
ND
S O
F N
OM
INA
L D
OLL
AR
S)
Line
N
o.
MW
C
Des
crip
tion
Rec
orde
d Ad
just
ed
Fore
cast
W
orkp
aper
R
efer
ence
20
16
2017
20
18
2019
20
20
2021
20
22
2023
1 JV
M
aint
ain
IT A
pplic
atio
ns a
nd In
frast
ruct
ure
$1,0
32
$1.4
58
$1,0
80
$327
$7
63
$279
$4
29
$429
W
P 5-
46, l
ine
1
2
Tota
l $1
.032
$1
,458
$1
,080
$3
27
$763
$2
79
$429
$4
29
WP
5-46
, lin
e 2
TAB
LE 5
-4
REG
ULA
TOR
Y A
FFA
IRS
DEP
AR
TMEN
T CO
STS
CA
PITA
L (T
HO
USA
ND
S O
F N
OM
INA
L D
OLL
AR
S)
Line
N
o.
MW
C
Des
crip
tion
Rec
orde
d Ad
just
ed
Fore
cast
W
orkp
aper
R
efer
ence
20
16
2017
20
18
2019
20
20
2021
20
22
2023
20
24
2025
20
26
1 2F
Bu
ild IT
Ap
plic
atio
ns a
nd
Infra
stru
ctur
e $9
,906
$3
,600
$1
,605
$6
84
$1,2
79
$100
$1
,500
$1
,500
$1
,500
$1
,500
$1
,500
W
P 5-
48, l
ine
1
2
Tota
l $9
,906
$3
,600
$1
,605
$6
84
$1,2
79
$100
$1
,500
$1
,500
$1
,500
$1
,500
$1
,500
W
P 5-
48, l
ine
2

(PG&E-9)
-i-
PACIFIC GAS AND ELECTRIC COMPANY 2023 GENERAL RATE CASE
Testimony ______x_______ Workpapers ___________ SOQ ______________ Exhibit Number: ____9____ Chapter Number: ___5____ Chapter Title: Regulatory Affairs Witness Name: Megan Lawson
Page No.
Line No. Item As Filed As Corrected
Errata as of November 5, 2021
5-2 lines 1-3 Forecast Cost The 2023 forecast is $17.6 million, which is $1.7 million (10.5 percent) higher than the 2020 recorded amount of $15.9 million.
The 2023 forecast is $17.3 million, which is $1.4 million (9 percent) higher than the 2020 recorded amount of $15.9 million
5-3 Figure 1 Forecast Cost 2023 Forecast amount: $17,558
Replaced figure in full; 2023 Forecast amount: $17,323
5-10 lines 9-10 Forecast Cost The 2023 forecast is $17.6 million, which is $1.7 million (10.5 percent), higher than the 2020 recorded amount of $15.9 million
The 2023 forecast is $17.3 million, which is $1.4 million (9 percent), higher than the 2020 recorded amount of $15.9 million
5-10 lines 15-17 Forecast Cost For 2023, PG&E forecasts increases of $1.5 million in labor escalation based on the labor escalation values provided in Exhibit (PG&E-8), Chapter 4.
For 2023, PG&E forecasts increases of $1.2 million in labor escalation based on the labor escalation values provided in Exhibit (PG&E-8), Chapter 4.
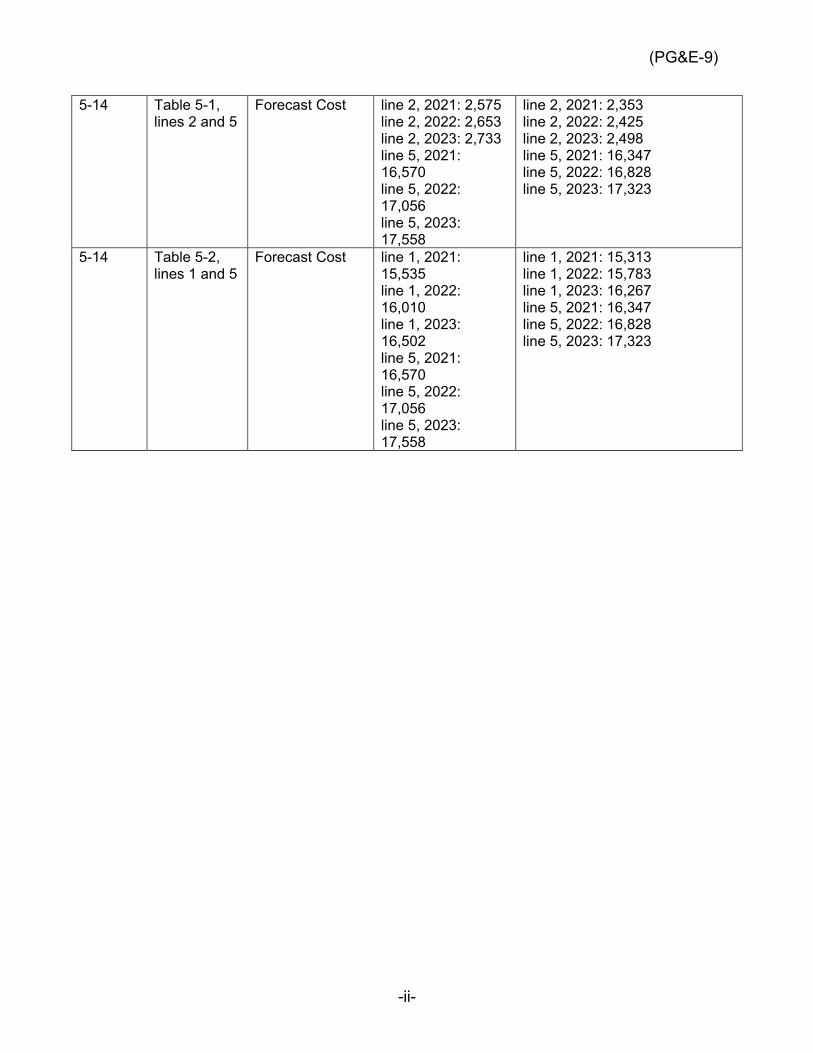
(PG&E-9)
-ii-
5-14 Table 5-1, lines 2 and 5
Forecast Cost line 2, 2021: 2,575 line 2, 2022: 2,653 line 2, 2023: 2,733 line 5, 2021: 16,570 line 5, 2022: 17,056 line 5, 2023: 17,558
line 2, 2021: 2,353 line 2, 2022: 2,425 line 2, 2023: 2,498 line 5, 2021: 16,347 line 5, 2022: 16,828 line 5, 2023: 17,323
5-14 Table 5-2, lines 1 and 5
Forecast Cost line 1, 2021: 15,535 line 1, 2022: 16,010 line 1, 2023: 16,502 line 5, 2021: 16,570 line 5, 2022: 17,056 line 5, 2023: 17,558
line 1, 2021: 15,313 line 1, 2022: 15,783 line 1, 2023: 16,267 line 5, 2021: 16,347 line 5, 2022: 16,828 line 5, 2023: 17,323

(PG&E-9)
PACIFIC GAS AND ELECTRIC COMPANY
CHAPTER 6
LAW ORGANIZATION
[INCLUDES NOVEMBER 5, 2021 ERRATA]

(PG&E-9)
6-i
PACIFIC GAS AND ELECTRIC COMPANY CHAPTER 6
LAW ORGANIZATION
TABLE OF CONTENTS
A. Introduction ....................................................................................................... 6-1
1. Summary of Request ................................................................................. 6-1
2. Organization of Remainder of This Chapter ............................................... 6-2
B. Department Costs ............................................................................................. 6-2
1. Summary of Forecast ................................................................................. 6-2
2. Law Organization Description .................................................................... 6-3
a. Law Department (Provider Cost Centers (PCC) 10448 and 10451) .......................................................................................... 6-3
1) Litigation and Claims ..................................................................... 6-4
2) Regulatory and Compliance .......................................................... 6-5
3) Corporate, Contracts and Commercial Services ........................... 6-5
4) Administrative Support .................................................................. 6-5
b. Immediate Office of the EVP and General Counsel (PCC 20050, 10373) ................................................................................................. 6-6
3. 2020 Forecast Drivers ................................................................................ 6-6
a. Labor Escalation (FERC 920) .............................................................. 6-7
b. Staffing (FERC 920 and 921) .............................................................. 6-7
c. Outside Services (FERC 923) ............................................................. 6-7
C. Settlements, Judgments, and Claims (FERC 925) ........................................... 6-8
D. IT Costs .......................................................................................................... 6-10
E. Cost Tables .................................................................................................... 6-10

(PG&E-9)
6-1
PACIFIC GAS AND ELECTRIC COMPANY 1
CHAPTER 6 2
LAW ORGANIZATION 3
A. Introduction 4
1. Summary of Request 5
Pacific Gas and Electric Company’s (PG&E or the Company or the 6
Utility) Law Department provides legal services. The Law Department 7
reports to PG&E’s Executive Vice President (EVP) and General Counsel. 8
The Law Department and General Counsel’s immediate office are 9
collectively referred to in this chapter as the Law Organization. The Law 10
Organization represents the Company in all its regulatory and legal matters 11
and provides advice and counsel to support the safe and reliable operation 12
of PG&E’s business. 13
The Law Organization’s forecasted costs are shown in Tables 6-1 14
through 6-5. PG&E requests that the California Public Utilities Commission 15
(CPUC or Commission) adopt its 2023 total expense forecast as follows: 16
• Department Costs – $46.7 million.1 Department costs include labor, 17
materials, and outside contracts. The 2023 forecast of $46.7 million is 18
approximately $1.4 million (3 percent) lower than the 2020 recorded 19
adjusted amount of $48.1 million.2 PG&E expects to manage these 20
costs at a level below normal escalation by replacing staff who leave the 21
department through natural attrition with lower cost resources and 22
reducing outside services costs. These costs are discussed in 23
Section B of this chapter. 24
• Settlements, Judgments and Claims – $25.1 million3 for settlements and 25
judgments costs and $14.3 million4 for third-party claims payments. 26
These amounts are based on the average of the recorded adjusted 27
payments for the 4-year period 2017-2020. PG&E used the same 28
1 See Table 6-1, line 3. 2 See Table 6-1, line 3. 3 See Table 6-3, line 1. 4 See Table 6-3, line 2.

(PG&E-9)
6-2
methodology in its 2017 and 2020 General Rate Cases (GRC). These 1
costs are discussed in Section C of this chapter. 2
• Information Technology (IT) Projects – The Law Department forecasts 3
$314 thousand5 in 2023 for minor technology enhancements. These 4
costs are discussed in Section D of this chapter. 5
2. Organization of Remainder of This Chapter 6
The remainder of this chapter is organized as follows: 7
• Section B – Department Costs; 8
• Section C – Settlements, Judgments, and Claims; 9
• Section D – IT Projects; and 10
• Section E – Cost Tables. 11
B. Department Costs 12
1. Summary of Forecast 13
Figure 6-1 below shows the drivers for the 2023 forecast compared to 14
2020 recorded adjusted costs. The activities included in the 2020 costs are 15
described in Section B.2. below. The following three drivers of the 2023 16
forecast change are described in Section B.3. below: (1) labor escalation; 17
(2) staffing; and (3) outside services. 18
5 See Table 6-4, line 2.

(PG&E-9)
6-3
FIGURE 6-1 EXPENSE WALK OF DEPARTMENT (2020-2023)
(THOUSANDS OF NOMINAL DOLLARS)
2. Law Organization Description 1
a. Law Department (Provider Cost Centers (PCC) 10448 and 10451) 2
PG&E’s Law Department seeks to provide high quality, 3
cost-effective legal support to solve problems, meet business objectives, 4
identify, and mitigate risks, and strengthen compliance. It is led by the 5
General Counsel and Deputy General Counsels. Together, they 6
manage the operations of the Law Department, and provide substantive 7
oversight for a variety of legal matters. There are three Deputy General 8
Counsel in the Law Organization. The Vice President (VP) Compliance 9
and Ethics (C&E) and Deputy General Counsel leads the C&E 10
Organization. The VP Deputy General Counsel, Corporate Secretary 11
and Utility General Counsel leads the Corporate Secretary organization 12
and corporate legal function. The VP and Deputy General Counsel, 13
Operations, leads the regulatory, operations, strategy and policy, and 14
environmental legal functions. Reporting to General Counsel and the 15
Deputy General Counsel are designated managing counsel who 16

(PG&E-9)
6-4
manage the legal support that the Law Department provides for the 1
various lines of business (LOB). 2
The Law Department’s substantive legal activities fall into 3
three broad categories: (1) litigation and claims; (2) regulatory 4
proceedings and compliance; and (3) corporate, contracts, and 5
commercial services. In addition, the Law Department includes 6
administrative support staff, who report to the Director of Legal 7
Administration. 8
The specific functions of the Law Department’s various groups are 9
described in greater detail below. 10
1) Litigation and Claims 11
The Law Department provides litigation support and services to 12
the Company in responding to lawsuits and disputes in several 13
areas including corporate and commercial, human resources, 14
environmental, public and employee safety, workers’ compensation, 15
and general litigation matters. This includes representing the 16
Company in cases or matters regarding personal injury and/or 17
property damage, real property and eminent domain disputes, 18
commercial disputes, environmental disputes, and employment 19
disputes. In addition, the Law Department provides affirmative 20
litigation support and services to the Company in order for the 21
Company to seek recovery or damages from third parties when such 22
third parties have damaged PG&E assets, equipment, or facilities. 23
The Law Department also provides legal advice to the Company 24
with respect to public and employee safety issues and claims. 25
The department is responsible for investigating, evaluating, and 26
resolving claims submitted by third parties for property damage, 27
economic loss or personal injury arising out of PG&E’s gas and 28
electric service. The department also performs litigation 29
assessments, with respect to potential third-party claims. 30
Employees who support the claims function include: Claims 31
Investigators, Supervisors, and associated staff. 32

(PG&E-9)
6-5
2) Regulatory and Compliance 1
The Law Department provides legal support for regulatory 2
matters and proceedings for each of the Company’s LOBs. 3
This work includes preparing filings and participating in related 4
proceedings with the CPUC, Federal Energy Regulatory 5
Commission (FERC), Nuclear Regulatory Commission, United 6
States Environmental Protection Agency, and other state and 7
federal agencies. In addition to participating in regulatory 8
proceedings, attorneys working on regulatory matters provide advice 9
regarding compliance with many complex regulatory requirements, 10
including federal and state utility, energy, and environmental laws. 11
3) Corporate, Contracts and Commercial Services 12
The Law Department provides corporate legal services to the 13
Company as well as commercial contracting services to support the 14
Company’s energy procurement, sourcing function and other 15
business needs. The department provides legal support, advice, 16
and counsel on commercial matters, including: (1) power purchase 17
and sale agreements; (2) engineering, procurement, and 18
construction contracts; and (3) various types of commercial 19
contracts. The department also provides legal support and advice 20
and counsel regarding: (1) public and private financing transactions; 21
(2) compliance with securities laws applicable to public companies; 22
and (3) employee benefits matters. Finally, the department provides 23
legal support for corporate functions such as governance, investor 24
relations, and compliance and risk. 25
4) Administrative Support 26
The Law Department’s administrative group is responsible for 27
providing general administrative support. This work includes: 28
• Paralegal services, contract administrative support, subpoena 29
processing, and secretarial support; 30
• Support for the department’s budget, legal and claims analytics, 31
payments processing, office services, law library, management 32
information services, timekeeping, document processing, 33

(PG&E-9)
6-6
administration of qualified domestic relations orders, and 1
various other administrative matters; 2
• Preparing legal notices and related compliance filings for 3
CPUC proceedings; 4
• Processing thousands of invoice payments (including payments 5
to CPUC intervenors), maintaining payroll timecards for the 6
Law Department’s employees, and processing contracts with 7
outside vendors; and 8
• Overseeing office logistics and administrative matters. 9
b. Immediate Office of the EVP and General Counsel (PCC 20050, 10
10373) 11
The General Counsel is responsible for the overall management of 12
PG&E’s Law Department.6 The General Counsel provides legal advice, 13
counsel, and guidance on significant matters affecting PG&E, and 14
oversees legal advice given by the attorneys in the Law Department. 15
The General Counsel is an officer of PG&E Corporation, although the 16
legal function reporting to the General Counsel primarily provides legal 17
services to the Utility. 18
In 2020, the General Counsel’s immediate office consisted of the 19
General Counsel, VP and Deputy General Counsel, chief of staff, and 20
an executive assistant. PG&E forecasts no change in staffing for this 21
office in 2023. PG&E is not seeking cost recovery of the General 22
Counsel labor costs in this GRC.7 23
3. 2020 Forecast Drivers 24
As shown in Section B.1, the $2.5 million (5 percent) net decrease in the 25
2023 forecast, relative to 2020 recorded adjusted costs, is attributable to the 26
6 The General Counsel also oversees: Enterprise Records and Information
Management, Land and Environmental Management, and Corporate Secretary. 7 Pursuant to CPUC Resolution E-4963 (Issued December 14, 2018), PG&E has
excluded from its 2023 forecast the salary and benefits of the utility’s SEC Rule 240.3b-7 officers. PG&E has also voluntarily excluded from its 2023 forecast to the salary and benefits of the PG&E Corporation’s SEC Rule 240.3b-7 officers although not required by the Resolution. See Exhibit (PG&E-8), Ch. 4 for further discussion of officer compensation costs.
(PG&E-9)
6-7
cumulative effect of three drivers: (1) labor escalation; (2) staffing; and 1
(3) outside services. Each of these drivers is described below. 2
a. Labor Escalation (FERC 920) 3
The Law Department forecasts a $2.0 million increase, attributable 4
to the cumulative impact of labor escalation from 2020 through 2023, 5
based on the labor escalation values provided in Exhibit (PG&E-8), 6
Chapter 4. 7
b. Staffing (FERC 920 and 921) 8
Account 920 consists of the salaries for Law Organization 9
employees (not including contract or temporary employees). 10
Account 921 consists of general expenses to support the Law 11
Department’s workforce, including: office supplies, California bar dues, 12
Lexis/Nexis fees, and legal subscription costs. PG&E forecasts a 13
decrease in staffing costs of approximately $1.8 million in 2023. 14
PG&E expects to decrease by 3 Full-Time Equivalent employees 15
(FTE) by 2023. At the end of 2020, the law organization had 144 FTEs, 16
which included 7 vacancies. PG&E plans to fill 4 of the existing 17
vacancies by 2023 for a total forecast of 141 FTEs. Over the next 18
3 years, the law department expects to see natural attrition and 19
retirements of more seasoned attorneys. The department plans to 20
achieve additional cost savings and offset merit escalation by backfilling 21
for those retirements with less expensive, more junior attorneys and 22
staff resources where appropriate. 23
c. Outside Services (FERC 923) 24
Account 923 consists of outside service costs. These include 25
outside law firms that provide legal services to PG&E, consultants, and 26
vendors who support the Law Department’s work. PG&E has excluded 27
all outside legal services costs in response to catastrophic wildfire 28
events or associated with Chapter 11 Bankruptcy. 29
PG&E’s 2023 outside services forecast of $23 million is $2.7 million 30
(approximately 10 percent) lower than its 2020 recorded adjusted 31
(PG&E-9)
6-8
costs.8 The forecast decrease is primarily attributable to the Law 1
Department’s continuing efforts to reduce costs through Outside 2
Counsel Management. 3
The Law Department’s 2023 outside services forecast is based on 4
the 4-year average of outside services costs from 2017-2020, which is 5
$25.9 million.9 PG&E uses an average forecast methodology because 6
outside services costs can vary significantly year-to-year, depending on 7
a number of factors, including the nature and volume of litigation in a 8
given year. PG&E then reduced its 4-year average outside services 9
costs by $2.8 million primarily to reflect continuing benefits of its Outside 10
Counsel Management efforts. For 2023, the law department will focus 11
on continuing its preferred provider program which commenced in 2018. 12
The purpose of the preferred provider program is to narrow the outside 13
law firms PG&E uses to provide legal services. This allows PG&E to 14
drive lower hourly rates by increasing competition among firms, increase 15
efficiencies by having each firm work on more matters thereby 16
developing deeper understanding of PG&E, and create opportunities for 17
volume discounts. PG&E will also focus on other strategies such as 18
implementing a competitive matter bidding platform. The platform is a 19
reverse auction that outside firms can access to bid against each other 20
on various PG&E matters. This will help PG&E engage outside counsel 21
to drive greater usage of Alternative Fee Arrangements that may further 22
reduce external legal spend. 23
C. Settlements, Judgments, and Claims (FERC 925) 24
The Law Department records two types of costs in Account 925: 25
(1) settlement and judgment costs as part of its litigation function; and (2) claims 26
payments to third-parties that did not proceed to litigation, alleging personal 27
injury, property damage, and economic loss as a result of PG&E’s operations. 28
PG&E maintains a self-administered, self-insured claims management program 29
covering settlement of single incident claims up to $10 million. Starting in 2020 30
wildfire related events will be self-insured for claims up to $60 million. 31
8 Exhibit (PG&E-9), WP 6-3, line 3. 9 Exhibit (PG&E-9), WP 6-3, line 3.

(PG&E-9)
6-9
Catastrophic coverage for certain single incident claims is typically provided by 1
the Associated Electric and Gas Insurance Services and other insurers. 2
As noted in Figure 6-2, PG&E forecasts $25.1 million for settlements and 3
judgments, and $14.3 million for third-party claims payments in 2023. This 4
forecast is based on the average of the adjusted actual costs for the 4-year 5
period 2017-2020, which is the same methodology that PG&E used in the 2014, 6
2017 and 2020 GRCs. This is shown in Figure 6-2. 7
FIGURE 6-2 SETTLEMENT AND THIRD-PARTY CLAIMS EXPENSES
(THOUSANDS OF NOMINAL DOLLARS)
None of the following costs were used in calculating PG&E’s 2023 8
settlements and judgments forecast: 9
1) The cost of catastrophic insurance coverage is not included in this chapter 10
and is charged against casualty insurance costs under Account 925;10 11
2) Settlements, judgments or claims that were reimbursed through insurance; 12
10 Exhibit (PG&E-9) Ch. 3, Section C.
(PG&E-9)
6-10
3) Settlements or judgments that included punitive damages or a court finding 1
of bad faith. This is consistent with PG&E’s approach in prior GRCs and 2
Commission guidance;11 and 3
4) Settlements, judgments, or claims pertaining to catastrophic wildfire events. 4
Costs included in PG&E’s 2023 GRC forecast for settlements, judgments, 5
and claims do include costs from other wildfires that fall within PG&E’s 6
self-insured retention discussed above. 7
D. IT Costs 8
The Law Department IT forecasts $314 thousand in 2023 for annual renewal 9
costs for legal applications and funding for minor enhancements. The Law 10
Department is planning the following technology investments to help improve 11
and modernize PG&E’s third party claims system as summarized in Tables 6-4 12
and 6-5. 13
PG&E’s Third party claims system is planned to migrate from outdated 14
unsupported servers to a cloud solution in 2021. To avoid risk of losing the 15
repository of evidence supporting Litigation and all privileged investigations 16
conducted by the Claims department involving third-party injury/fatality, property 17
damage or business loss, a migration is necessary. 18
Other investments include revamping the Claims public webpage with 19
mobile device integration. The project will require a phased approach to 20
modernize and improve functionality of the site and build the capability for the 21
public to submit claims through their mobile device. This effort is designed to 22
improve the user experience for the customer through an improved interface and 23
convenience of submitting a claim through their mobile device. 24
E. Cost Tables 25
11 D.14-08-032, pp. 571-572.

(PG&E-9)
6-11
TAB
LE 6
-1
SUM
MA
RY
OF
DEP
AR
TMEN
T EX
PEN
SES
LAW
OR
GA
NIZ
ATI
ON
H
ISTO
RIC
AL
AN
D F
OR
ECA
ST
( TH
OU
SAN
DS
OF
NO
MIN
AL
DO
LLA
RS)
Line
N
o.
Des
crip
tion
Rec
orde
d Ad
just
ed
Fore
cast
W
orkp
aper
R
efer
ence
20
16
2017
20
18
2019
20
20
2021
20
22
2023
1 EV
P G
ener
al C
ouns
el
Imm
edia
te O
ffice
$1
,784
$1
,313
$9
08
$934
$6
07
$736
$7
46
$695
W
P 6-
3, li
ne 1
2.
2 La
w
51,4
27
49,3
38
50,3
73
46,5
37
47,4
64
45,5
13
45,9
92
45,9
71
WP
6-3,
line
19.
3 To
tal
$53,
211
$50,
650
$51,
281
$47,
470
$48,
072
$46,
248
$46,
738
$46,
666
WP
6-3,
line
5.
TAB
LE 6
-2
SUM
MA
RY
OF
DEP
AR
TMEN
T EX
PEN
SES
BY
FER
C A
CC
OU
NT
LAW
OR
GA
NIZ
ATI
ON
H
ISTO
RIC
AL
AN
D F
OR
ECA
ST
(TH
OU
SAN
DS
OF
NO
MIN
AL
DO
LLA
RS)
Line
N
o.
Des
crip
tion
Rec
orde
d Ad
just
ed
Fore
cast
W
orkp
aper
R
efer
ence
20
16
2017
20
18
2019
20
20
2021
20
22
2023
1 92
0 –
Adm
inis
trativ
e an
d G
ener
al S
alar
ies
$22,
473
$21,
171
$21,
345
$21,
637
$21,
880
$21,
916
$21,
590
$22,
089
WP
6-3,
line
1
2 92
1 –
Offi
ce S
uppl
ies
and
Ex
1,72
6 1,
476
1,51
3 1,
445
1,53
8 1,
575
1,57
5 1,
575
WP
6-3,
line
2
3 92
3 –
Out
side
Svc
Em
ploy
– U
tility
27
,212
26
,794
27
,378
23
,652
24
,629
22
,758
23
,574
23
,002
W
P 6-
3, li
ne 3
4 92
3 –
Out
side
Svc
Em
ploy
– C
orp
(b)
1,79
9 1,
208
1,04
5 73
6 26
–
– –
WP
6-3,
line
4
5 To
tal
$53,
211
$50,
650
$51,
281
$47,
470
$48,
072
$46,
248
$46,
738
$46,
666
WP
6-3,
line
5

(PG&E-9)
6-12
TAB
LE 6
-3
SUM
MA
RY
OF
SETT
LEM
ENTS
, JU
DG
MEN
TS, A
ND
TH
IRD
-PA
RTY
CLA
IMS
EXPE
NSE
S LA
W O
RG
AN
IZA
TIO
N
HIS
TOR
ICA
L A
ND
FO
REC
AST
( T
HO
USA
ND
S O
F N
OM
INA
L D
OLL
AR
S)
Line
N
o.
Des
crip
tion
Rec
orde
d Ad
just
ed
Fore
cast
W
orkp
aper
R
efer
ence
20
16
2017
20
18
2019
20
20
2021
20
22
2023
1 Li
tigat
ion
Settl
emen
ts
and
Judg
men
ts
$27,
051
$11,
170
$29,
097
$405
$5
9,56
5 $2
5,05
9 $2
5,05
9 $2
5,05
9 W
P 6-
29, l
ine
1
2 Th
ird-P
arty
Cla
ims
(Pre
-Cap
italiz
atio
n)
12,8
39
21,3
91
16,4
38
9,09
6 10
,267
14
,298
14
,298
14
,298
W
P 6-
29, l
ine
2
3 To
tal
$39,
890
$32,
562
$45,
534
$9,5
01
$69,
832
$39,
357
$39,
357
$39,
357
WP
6-29
, lin
e 3
TAB
LE 6
-4
LAW
DEP
AR
TMEN
T A
ND
REL
ATED
CO
STS
EXPE
NSE
S B
Y M
AJO
R W
OR
K C
ATE
GO
RY
(MW
C)
(TH
OU
SAN
DS
OF
NO
MIN
AL
DO
LLA
RS)
Line
N
o.
MW
C
Des
crip
tion
Rec
orde
d Ad
just
ed
Fore
cast
W
orkp
aper
R
efer
ence
20
16
2017
20
18
2019
20
20
2021
20
22
2023
1 JV
M
aint
ain
IT A
pps
and
Infra
$4
15
$151
$2
32
$238
$4
49
$314
$3
14
$314
W
P 6-
34, l
ine
1
2
Tota
l $4
15
$151
$2
32
$238
$4
49
$314
$3
14
$314
W
P 6-
34, l
ine
2

(PG&E-9)
6-13
TAB
LE 6
-5
LAW
DEP
AR
TMEN
T A
ND
REL
ATED
CO
STS
CA
PITA
L (T
HO
USA
ND
S O
F N
OM
INA
L D
OLL
AR
S)
Line
N
o.
MW
C
Des
crip
tion
Rec
orde
d Ad
just
ed
Fore
cast
W
orkp
aper
R
efer
ence
20
16
2017
20
18
2019
20
20
2021
20
22
2023
20
24
2025
1 2F
Bu
ild IT
App
s an
d In
fra
$489
–
– –
– –
– –
– –
WP
6-36
, lin
e 1
2
Tota
l $4
89
– –
– –
– –
– –
– W
P 6-
36, l
ine
2

(PG&E-9)
-i-
PACIFIC GAS AND ELECTRIC COMPANY 2023 GENERAL RATE CASE
Testimony _____x________ Workpapers ____________ SOQ ______________ Exhibit Number: ____9____ Chapter Number: __6_____ Chapter Title: Law Witness Name: William Manheim
Page No.
Line No. Item As Filed As Corrected
Errata as of November 5, 2021
6-1 19 Recorded Cost $2.5 million (5 percent)
$1.4 million (3 percent)
6-1 20 Recorded Cost $49.1 million $48.1 million
6-3 Figure 6-1 Recorded Cost N/A Replaced in full
6-11 Table 6-1, line 2
Recorded Cost 48,524 47,464
6-11 Table 6-1, line 3
Recorded Cost 49,131 48,072

(PG&E-9)
PACIFIC GAS AND ELECTRIC COMPANY
CHAPTER 7
PG&E CORPORATION AND PG&E EXECUTIVE OFFICES; AND
CORPORATE SECRETARY DEPARTMENT COSTS
[INCLUDES NOVEMBER 5, 2021 ERRATA]

(PG&E-9)
7-i
PACIFIC GAS AND ELECTRIC COMPANY CHAPTER 7
PG&E CORPORATION AND PG&E EXECUTIVE OFFICES; AND CORPORATE SECRETARY DEPARTMENT COSTS
TABLE OF CONTENTS
A. Introduction ....................................................................................................... 7-2
1. Summary of Request ................................................................................. 7-2
2. Organization of Remainder of This Chapter ............................................... 7-2
B. Department Costs ............................................................................................. 7-3
1. Summary of Forecast ................................................................................. 7-3
2. Organization Descriptions .......................................................................... 7-4
a. Corporation CEO’s Immediate Office .................................................. 7-4
b. Enterprise PMO ................................................................................... 7-5
c. Office of the Corporate Secretary ........................................................ 7-6
3. 2023 Forecast Drivers ................................................................................ 7-8
a. Corporation CEO’s Immediate Office .................................................. 7-8
b. Enterprise PMO ................................................................................... 7-8
c. Office of the Corporate Secretary ........................................................ 7-9
C. Director Fees and Expenses ............................................................................ 7-9
1. Description of Activities .............................................................................. 7-9
2. Analysis of Forecast and Recorded Costs ............................................... 7-10
a. Retainer Fees .................................................................................... 7-10
b. Director Expenses ............................................................................. 7-10
D. Cost Tables .................................................................................................... 7-11

(PG&E-9)
7-2
PACIFIC GAS AND ELECTRIC COMPANY 1
CHAPTER 7 2
PG&E CORPORATION AND PG&E EXECUTIVE OFFICES; AND 3
CORPORATE SECRETARY DEPARTMENT COSTS 4
A. Introduction 5
1. Summary of Request 6
This chapter presents the 2023 forecast for: (1) the Pacific Gas and 7
Electric Company (PG&E or the Company or the Utility) Corporation Chief 8
Executive Officer’s (CEO) immediate office; (2) the Enterprise Project 9
Management Office (PMO); (3) the Corporate Secretary Department; and 10
(4) Board of Directors (BOD) fees and expenses. 11
The PG&E Corporation CEO is responsible for the executive leadership 12
of PG&E and PG&E Corporation. Since PG&E is the sole operating 13
subsidiary of PG&E Corporation, the activities of the Corporation CEO focus 14
on the core business of PG&E. 15
The Enterprise PMO manages strategic enterprise-wide projects such 16
as the Enhanced Oversight and Enforcement Process (EOEP), Major 17
Commitments, and Enterprise Strategy for Data Responses. It also handles 18
other special projects assigned to it by the Chief Operating Officer (COO) 19
and Chief Risk Officer (CRO). 20
PG&E’s Corporate Secretary Department supports the BOD of PG&E 21
and PG&E Corporation and their respective committees; provides 22
governance, reporting, shareholder, and other necessary services for PG&E 23
and PG&E Corporation; and manages Director fees and expenses for the 24
PG&E and PG&E Corporation BOD. 25
2. Organization of Remainder of This Chapter 26
The remainder of this chapter is organized as follows: 27
• Section B – Department Costs; 28
• Section C – Director Fees and Expenses; and 29
• Section D – Cost Tables. 30

(PG&E-9)
7-3
B. Department Costs 1
1. Summary of Forecast 2
The forecasted costs for the Corporation CEO’s immediate office, the 3
Enterprise PMO, the Corporate Secretary Department, and Director fees 4
and expenses are shown in Tables 7-1 through 7-3. PG&E requests that 5
the California Public Utilities Commission (CPUC or Commission) adopt its 6
2023 total forecast as follows: 7
• Department Costs – $5.1 million: Department costs include labor, 8
materials, and outside contracts for the Corporation CEO’s immediate 9
office, the Enterprise PMO, and the Corporate Secretary Department.1 10
The 2023 forecast is $6.1 million (approximately 54.8 percent) lower 11
than the 2020 recorded adjusted amount of $11.2 million. The decrease 12
is primarily due to reductions in costs for the Corporation CEO’s 13
immediate office and Enterprise PMO, offset by an increase in costs for 14
the Corporate Secretary Department related to the proxy statement and 15
annual meeting. 16
• Director Fees and Expenses – $2.4 million: PG&E’s 2023 forecast is 17
approximately $769,000 (46 percent) higher than the 2020 recorded 18
amount of approximately $1.7 million for due to in part a reduction of in 19
person meetings due to coronavirus (COVID-19) in years 2020 and 20
2021 and in part to escalation for Director Expenses. 21
This chapter does not include a capital request. Activities for the 22
departments are described in Section B.2. below. Figure 7-1 shows the 23
drivers of changes in department costs, from 2020 recorded adjusted costs 24
to the 2023 forecast. These drivers are discussed further in Section B.3. 25
1 Pursuant to CPUC Resolution E-4963 (Issued December 14, 2018), PG&E has
excluded from its 2023 forecast the salary and benefits of the utility’s SEC Rule 240.3b 7 officers. PG&E has also voluntarily excluded from its 2023 forecast to the salary and benefits of the PG&E Corporation’s Securities and Exchange Commission (SEC) Rule 240.3b-7 officers although not required by the Resolution. See Exhibit (PG&E-8), Ch. 4 for further discussion of officer compensation costs.

(PG&E-9)
7-4
FIGURE 7-1 EXPENSE WALK 2020-2023
(THOUSANDS OF NOMINAL DOLLARS)
2. Organization Descriptions 1
a. Corporation CEO’s Immediate Office 2
The Corporation CEO is responsible for the executive leadership of 3
PG&E and PG&E Corporation. Patricia K. Poppe was appointed as the 4
Corporation’s CEO and member of the PG&E and PG&E Corporation 5
Boards effective January 4, 2021. 6
Since PG&E is the sole operating subsidiary of PG&E Corporation, 7
the activities of the Corporation CEO focus on the core business of 8
PG&E. The position provides leadership for the strategic direction of 9
both companies with respect to all facets of their business. In addition, 10
this position is responsible for representing the interests of PG&E and 11
PG&E Corporation before major external constituencies, including the 12
financial services community, credit rating agencies, institutional 13
(PG&E-9)
7-5
investors, federal and state governmental officials, stakeholder 1
organizations, the business community, and the public at large. 2
The Corporation CEO’s primary focus is to provide leadership in 3
areas that are critical to addressing PG&E’s immediate challenges, and 4
to lead the Company’s efforts to position itself for long-term success. 5
In addition, the Corporation CEO is responsible for: 6
• All matters related to the shareholders of PG&E’s and PG&E 7
Corporation’s publicly traded stock; 8
• Overseeing, in consultation with PG&E Corporation’s and PG&E’s 9
respective independent non-executive Chairs of the Board, matters 10
related to the PG&E and PG&E Corporation BOD and all 11
committees of those Boards; 12
• Complying with legal and regulatory corporate governance 13
requirements for PG&E and PG&E Corporation, including 14
requirements relating to Sarbanes-Oxley (SOX) Act Section 404, 15
and financial disclosures to the SEC; 16
• Representing PG&E and PG&E Corporation before federal and 17
state legislative and congressional committees, and in 18
communications with the California Legislature and Governor, 19
as well as the United States Congress and Executive Branch, 20
and overseeing federal regulatory policy for PG&E and 21
PG&E Corporation; 22
• Representing PG&E and PG&E Corporation before the investment 23
community and the media; 24
• Managing issues of strategic concern to PG&E and PG&E 25
Corporation; and 26
• Overseeing the functions held at PG&E Corporation. 27
At the end of 2020, the Corporation CEO’s immediate office 28
consisted of one full-time equivalent (FTE) employee: a Supervisor 29
Leadership Support Services. 30
b. Enterprise PMO 31
The Enterprise PMO was set up to manage the development of a 32
regional design under the company’s Regionalization Proposal for the 33
Utility, filed with the CPUC on June 30, 2020. The requirement 34

(PG&E-9)
7-6
stemmed from the CPUC’s Decision 20-05-053, which approved 1
PG&E’s reorganization plan resolving the insolvency proceeding, and 2
required PG&E to file an application for regional restructuring, which has 3
the potential to improve PG&E’s performance and allow PG&E to be 4
responsive to local communities. Additionally, the Enterprise PMO 5
manages enterprise-wide initiatives to: 6
• Set up and manage the governance framework for EOEP, including 7
management of tracking and reporting; stakeholder engagement, 8
communication, and training; and corrective action plans and 9
continuous improvement opportunities; 10
• Stand up the governance framework and process for Major 11
Commitments, including management of tracking and reporting; 12
stakeholder engagement, communication, and training; and 13
continuous improvement opportunities; 14
• Ensure that guidance documents and other tools used to support 15
EOEP and Major Commitments are kept up-to-date and relevant, 16
and build a strong sense of accountability into the process; 17
• Establish an enterprise process owner for third-party data request 18
responses to improve information governance, unify standards, and 19
manage the ongoing continuous improvement of the process; and 20
• Implement a shared tool for the tracking of third-party data requests 21
and develop reporting capabilities of all third-party data requests 22
and responses for trending and categorization. 23
In addition, the Enterprise PMO undertakes other enterprise-wide 24
projects as directed by the COO and the CRO. 25
In 2020, the Enterprise PMO’s immediate office consisted of 26
eleven FTE employees: seven Principal Business Process and Data 27
Managers; one Director; one Chief of Staff position; one Executive 28
Assistant; and one Administrative Clerk. 29
c. Office of the Corporate Secretary 30
The Office of the Corporate Secretary is led by the Vice President 31
(VP), Deputy General Counsel and Corporate Secretary for PG&E 32
Corporation, and General Counsel and Corporate Secretary for PG&E 33
(Corporate Secretary). The Office of the Corporate Secretary provides 34

(PG&E-9)
7-7
support and advice to the BOD of PG&E and PG&E Corporation, the 1
Corporation CEO, and other members of PG&E and PG&E Corporation 2
senior management on matters related to corporate governance. The 3
Office of the Corporate Secretary also provides corporate governance, 4
reporting, and shareholder services for PG&E and PG&E Corporation. 5
Since PG&E is the sole operating subsidiary of PG&E Corporation, all 6
functions of the Office of the Corporate Secretary are performed for the 7
sole benefit of PG&E. If PG&E were a stand-alone publicly traded 8
corporation, it would be required to perform these functions for itself, as 9
any publicly-held corporation must have these functions. 10
The Office of the Corporate Secretary is also responsible for: 11
• Overseeing compliance with corporate governance policies and 12
practices for PG&E and PG&E Corporation; 13
• Providing support to the BOD of PG&E and PG&E Corporation and 14
their respective committees; 15
• Assuring that PG&E and PG&E Corporation remain in good legal 16
standing and comply with governance requirements contained in 17
applicable federal and state securities and corporate laws, including 18
governance requirements of the SOX Act, stock exchange rules, 19
SEC rules, and other legal or regulatory requirements pertaining to 20
PG&E or PG&E Corporation debt and equity securities; 21
• Preparing and filing SEC and Federal Energy Regulatory 22
Commission (FERC) reports for Directors and Officers of PG&E and 23
PG&E Corporation; 24
• Providing shareholder service functions and management of the 25
transfer agent contract for PG&E preferred stock and PG&E 26
Corporation common stock; 27
• Managing arrangements for PG&E and PG&E Corporation annual 28
shareholder meetings; 29
• Managing the preparation of PG&E and PG&E Corporation proxy 30
statements and related materials; 31
• Preparing documentation for PG&E and PG&E Corporation 32
securities issuances, redemptions, and maturities; and 33

(PG&E-9)
7-8
• Providing advice on authority of Officers and employees of PG&E 1
and PG&E Corporation to sign documents and take other actions, 2
and providing attestations for contracts and other documents signed 3
by Officers and employees. 4
In 2020, the Corporate Secretary’s Office consisted of five FTE 5
employees: two Principals, one Analyst and two Administrative Support 6
positions. 7
3. 2023 Forecast Drivers 8
Below is a discussion of the 2023 forecast drivers shown in Figure 7-1. 9
a. Corporation CEO’s Immediate Office 10
The Corporation CEO’s immediate office forecasts $1 million 11
for 2023, which is a decrease of approximately $0.7 million compared to 12
2020 recorded costs.2 The decrease is primarily due to one-time 13
contract costs for executive recruiting not continuing in 2021 and 14
beyond.3 15
b. Enterprise PMO 16
Enterprise PMO forecasts $1.0 million for 2023, which is a decrease 17
of approximately $6.1 million compared to 2020 recorded adjusted 18
costs.4 The decrease is primarily due to: (1) contract costs incurred in 19
2020 for consulting services to support the company’s regionalization 20
filing with the CPUC that will not be required in 2023; and (2) a reduction 21
of 9 FTEs who temporarily supported the initial work of the Enterprise 22
PMO, but who will not be required on a permanent basis to support its 23
ongoing operations in 2023 and beyond. The 2023 forecast reflects two 24
permanent FTEs to support ongoing operations: one Chief of Staff and 25
one Executive Administrative position. 26
2 See fns 1 and 2, supra, (PG&E is not seeking recovery of the CEO’s compensation in
this General Rate Case (GRC).); see also Exhibit (PG&E-9), WP 7-11, line 45. 3 Exhibit (PG&E-9), WP 7-11. 4 Exhibit (PG&E-9), WP 7-20.

(PG&E-9)
7-9
c. Office of the Corporate Secretary 1
The Office of the Corporate Secretary forecasts $3.1 million for 2
2023, which is an increase of approximately $0.6 million (25.6 percent) 3
compared to 2020 recorded costs.5 PG&E expects an increase related 4
to materials and contract costs for the PG&E Corporation and PG&E 5
Proxy Statement and Annual Meeting, which did not take place in 2020. 6
C. Director Fees and Expenses 7
1. Description of Activities 8
The PG&E Corporation BOD currently consists of fifteen Directors. The 9
PG&E BOD currently consists of sixteen Directors—the same fifteen 10
Directors that serve on the PG&E Corporation Board and PG&E’s Executive 11
VP, Operations and COO. Of PG&E’s sixteen Directors, fourteen are 12
outside (i.e., non-employee) Directors, one is an Officer of PG&E 13
Corporation (the Corporation CEO), and one is an Officer of PG&E (COO). 14
Each outside Director of PG&E or PG&E Corporation receives quarterly 15
retainers for his or her service on the Board. In addition, the Directors who 16
serve as the non-executive Chairs of the Board of the Corporation and the 17
Utility receive an additional retainer, as do the Directors who serve as Chair 18
of a Board committee. 19
Under the Director compensation policies of PG&E and PG&E 20
Corporation, outside Directors who serve on both the PG&E and PG&E 21
Corporation BOD and corresponding committees receive their Director 22
compensation from PG&E Corporation. They do not receive additional 23
compensation from PG&E for concurrent service on the PG&E Board or its 24
committees. 25
In addition, travel and other expenses are incurred by, or on behalf of, 26
outside Directors when they attend or participate in Board meetings, Board 27
committee meetings, shareholder meetings, and other activities undertaken 28
on behalf of PG&E or PG&E Corporation. If outside Directors incur 29
out-of-pocket travel or other expenses for these activities, PG&E or PG&E 30
Corporation reimburses them for their reasonably incurred expenses. 31
5 Exhibit (PG&E-9), WP 7-20.

(PG&E-9)
7-10
If PG&E Corporation did not exist and PG&E were a stand-alone 1
publicly-traded company, the PG&E BOD would have to perform all the 2
functions currently performed by the PG&E and PG&E Corporation Boards. 3
If that were the case, all the Director fees and expenses currently paid by 4
PG&E Corporation would otherwise be incurred directly by PG&E. PG&E 5
receives a cost-savings benefit of sharing Board members with PG&E 6
Corporation. 7
2. Analysis of Forecast and Recorded Costs 8
PG&E requests that the Commission adopt its 2023 total forecast of 9
$2.4 million for PG&E Corporation’s Director fees and expenses. This is an 10
increase of approximately $769,000 (46 percent) compared to the 2020 11
recorded amount,6 which is due to a reduction of in person meetings due to 12
COVID-19 in years 2020 and 2021 and escalation as described below. 13
a. Retainer Fees 14
As noted above, a quarterly retainer fee is paid to each 15
non-employee Director who serves on the PG&E and/or PG&E 16
Corporation Boards, and additional retainer fees are paid to those 17
Directors who serve as the non-executive Chair of the Board or Chair of 18
a Board committee. Retainer fees for directors who are not committee 19
or Board chairs were $120,000 for 2020. PG&E forecasts no change in 20
fees for 2023.7 21
b. Director Expenses 22
PG&E and PG&E Corporation pay for non-employee Directors’ 23
travel and other expenses related to attendance at, or participation in, 24
Board, Board committee, or shareholder meetings, as well as other 25
PG&E or PG&E Corporation activities. These expenses are either paid 26
directly by PG&E or PG&E Corporation on behalf of a Director or are 27
reimbursed to the Director if the Director personally incurred the 28
expense. For this GRC, reasonable expenses for: Director 29
6 Exhibit (PG&E-9), WP 7-38, line 6. 7 Exhibit (PG&E-9), WP 7-42. Please note, the Results of Operation (RO) data includes
slightly higher costs for Retainer Fees than is stated here. PG&E will adjust the RO accordingly at the next available opportunity.

(PG&E-9)
7-11
transportation (air and ground), lodging, Director education, and 1
one PG&E facility tour per year are included in the 2023 forecast. 2
PG&E forecasts a $18,000 annual increase in Director expenses,8 3
largely due to 3 percent escalation.9 In addition to escalation, travel 4
expenses in 2020 were lower than forecast for 2023 due to a lack of in 5
person meetings in 2020. 6
D. Cost Tables 7
The recorded adjusted costs for 2020 and the forecast costs for expense 8
for 2021 through 2023 for the departments covered in this chapter are shown in 9
Tables 7-1 and 7-2. PG&E’s Director Fees and Expenses are shown in 10
Table 7-3.11
8 Exhibit (PG&E-9), WP 7-41. 9 Escalation factors provided in Exhibit (PG&E 8), Ch. 4.

7-12
(PG&E-9) TA
BLE
7-1
SU
MM
AR
Y O
F D
EPA
RTM
ENT
EXPE
NSE
S C
EO O
RG
ANIZ
ATI
ON
H
ISTO
RIC
AL
AN
D F
OR
ECA
ST
( TH
OU
SAN
DS
OF
NO
MIN
AL
DO
LLA
RS)
Line
N
o.
Des
crip
tion
Rec
orde
d Ad
just
ed
Fore
cast
W
P R
efer
ence
2016
20
17
2018
20
19
2020
20
21
2022
20
23
1 C
hairm
an, C
EO a
nd
Pres
iden
t's O
ffice
$3
,731
$2
,959
$2
,306
$7
22
$1,6
52
$990
$9
90
$990
W
P 7-
3, li
ne 1
2
2 En
terp
rise
PMO
1,
688
1,63
5 1,
949
1,65
1 7,
113
1,00
0 1,
000
1,00
0 W
P 7-
3, li
ne 2
6 3
Co r
pora
te S
ecre
tary
3,
116
3,23
0 3,
114
2,50
1 2,
439
2,97
1 3,
022
3,06
4 W
P 7-
3, li
ne 1
9
4 To
tal
$8,5
36
$7,8
23
$7,3
69
$4,8
47
$11,
203
$4,9
61
$5,0
12
$5,0
54
WP
7-3,
line
5
TAB
LE 7
-2
SUM
MA
RY
OF
DEP
AR
TMEN
T EX
PEN
SES
BY
FER
C A
CC
OU
NT
CEO
OR
GAN
IZA
TIO
N
HIS
TOR
ICA
L A
ND
FO
REC
AST
(T
HO
USA
ND
S O
F N
OM
INA
L D
OLL
AR
S)
Line
N
o.
Des
crip
tion
Rec
orde
d Ad
just
ed
Fore
cast
W
P R
efer
ence
2016
20
17
2018
20
19
2020
20
21
2022
20
23
1
920-
Adm
in &
Gen
Sal
arie
s $3
,328
$2
,940
$2
,649
$1
,482
$2
,752
$1
,893
$1
,944
$1
,986
W
P 7-
3, li
ne 1
2
921-
Offi
ce S
uppl
ies
& Ex
1,
450
1,07
8 1,
418
575
184
738
738
738
WP
7-3,
line
2
3 92
3-O
utsi
de S
vc E
mpl
oy-U
tility
1,
100
1,03
1 99
6 2,
095
6,61
6 1,
340
1,34
0 1,
340
WP
7-3,
line
3
4 92
3-O
utsi
de S
vc E
mpl
oy-C
orp
2,
659
2,77
5 2,
306
722
1,65
2 99
0 99
0 99
0 W
P 7-
3, li
ne 4
5 To
tal
$8,5
36
$7,8
23
$7,3
69
$4,8
74
$11,
203
$4,9
61
$5,0
12
$5,0
54
WP
7-3,
line
5

7-13
(PG&E-9) TA
BLE
7-3
SU
MM
AR
Y O
F C
OM
PAN
YWID
E EX
PEN
SE
HIS
TOR
ICA
L A
ND
FO
REC
AST
(T
HO
USA
ND
S O
F N
OM
INA
L D
OLL
AR
S)
Line
N
o.
Des
crip
tion
Rec
orde
d Ad
just
ed
Fore
cast
W
P R
efer
ence
2016
20
17
2018
20
19
2020
20
21
2022
20
23
1 D
ir ect
or F
ees
and
Expe
nses
$1
,974
$1
,881
$1
,952
$2
,618
$1
,671
$2
,054
$2
,369
$2
,440
W
P 7-
38, l
ine
1
2 To
tal
$1,9
74
$1,8
81
$1,9
52
$2,6
18
$1,6
71
$2,0
54
$2,3
69
$2,4
40
WP
7-38
, lin
e 2

(PG&E-9)
-i-
PACIFIC GAS AND ELECTRIC COMPANY 2023 GENERAL RATE CASE
Testimony _____x________ Workpapers ____________ SOQ ______________ Exhibit Number: ____9____ Chapter Number: __7_____ Chapter Title: PG&E Corporation and PG&E Executive Offices; and Corporate Secretary Department Costs Witness Name: William Manheim
Page No. Line No. Item As Filed As Corrected
Errata as of November 5, 2021
7-3 Figure 7-1 Recorded cost N/A Replaced in full
7-11 Table 7-2, lines 1-3
Forecast cost line 1, 2021: 2,539 line 1, 2022: 2,590 line 1, 2023: 2,632 line 2, 2021: 623 line 2, 2022: 623 line 2, 2023: 623 line 3, 2021: 809 line 3, 2022: 809 line 3, 2023: 809
line 1, 2021: 1,893 line 1, 2022: 1,944 line 1, 2023: 1,986 line 2, 2021: 738 line 2, 2022: 738 line 2, 2023: 738 line 3, 2021: 1,340 line 3, 2022: 1,340 line 3, 2023: 1,340

(PG&E-9)
PACIFIC GAS AND ELECTRIC COMPANY
CHAPTER 8
CORPORATE AFFAIRS COSTS
[INCLUDES NOVEMBER 5, 2021 ERRATA]

(PG&E-9)
8-i
PACIFIC GAS AND ELECTRIC COMPANY CHAPTER 8
CORPORATE AFFAIRS COSTS
TABLE OF CONTENTS
A. Introduction ....................................................................................................... 8-1
1. Summary of Request ................................................................................. 8-1
2. Organization of Remainder of This Chapter ............................................... 8-2
B. Department Costs ............................................................................................. 8-2
1. Summary of Costs...................................................................................... 8-2
2. Corporate Affairs Organization ................................................................... 8-3
a. SVP of Corporate Affairs ..................................................................... 8-3
b. Government Relations and Corporate Sustainability ........................... 8-4
1) Government Relations .................................................................. 8-4
2) Corporate Sustainability ................................................................ 8-5
3. 2023 Forecast Drivers ................................................................................ 8-6
a. Labor Escalation .................................................................................. 8-6
b. Staffing ................................................................................................ 8-7
1) Climate Vulnerability Assessment ................................................. 8-7
2) Local Government Relations ......................................................... 8-8
c. Contracts and Fees ............................................................................. 8-8
C. Management of the Climate Change RAMP Cross-Cutting Factor ................... 8-9
D. Cost Tables .................................................................................................... 8-10

(PG&E-9)
8-1
PACIFIC GAS AND ELECTRIC COMPANY 1
CHAPTER 8 2
CORPORATE AFFAIRS COSTS 3
A. Introduction 4
1. Summary of Request 5
Pacific Gas and Electric Company’s (PG&E or the Company or the 6
Utility) Corporate Affairs department (Corporate Affairs) is responsible for 7
communicating with community leaders and public officials at all levels of 8
government.1,2 9
Corporate Affairs provides critical information during emergencies, 10
communicates public safety information, and keeps community stakeholders 11
and government officials apprised of key changes to PG&E’s operations in 12
their local communities, including those relating to public safety and service 13
options. Corporate Affairs is also responsible for building and maintaining 14
successful working relationships with government officials and community 15
stakeholders, advising on key matters related to the delivery of safe, 16
reliable, affordable, and clean gas and electric service. 17
Corporate Affairs works to develop strategies to align and adapt the 18
Utility with current and future changes in policy and customer preferences to 19
minimize costs while delivering products and services that meet customers’ 20
needs and prioritize the focus on safety. 21
The Corporate Affairs forecast is shown in Tables 8-1 and 8-2 in 22
Section D. PG&E requests that the California Public Utilities Commission 23
(CPUC or Commission) adopt its 2023 total forecast as follows: 24
• Department Costs – The 2023 forecast is $8.9 million, which is 25
$1.9 million (24 percent) higher than the 2020 recorded adjusted amount 26
of $7.0 million.3 The $1.9 million increase is primarily attributable to the 27
following drivers: (1) labor escalation; (2) staffing costs to support the 28
1 The remaining costs and activities of Corporate Affairs are presented in Exhibit
(PG&E-9), Ch. 5, Regulatory Affairs. 2 The Marketing and Communications organization testimony has moved to Exhibit
(PG&E-6), Ch. 11, Customer and Communications. 3 See Exhibit (PG&E-9), WP 8-3, line 5.

(PG&E-9)
8-2
Climate Vulnerability Assessment (CVA) beginning in 2023, as well as 1
the Local Government Relations function; and (3) Contract support for 2
the CVA program. These drivers are discussed in Section B.3. below. 3
2. Organization of Remainder of This Chapter 4
The remainder of this chapter is organized as follows:5
• Section B – Department Costs; 6
• Section C – Management of the Climate Change Cross-Cutting Factor in 7
the Risk Assessment and Mitigation Phase (RAMP) Program; and 8
• Section D – Cost Tables. 9
B. Department Costs10
1. Summary of Costs 11
Corporate Affairs functions and activities are described in Section B.2 12
below. Figure 8-1 shows the changes in department costs from 2020 13
recorded adjusted costs to the 2023 forecast. The drivers are discussed in 14
Section B.3. 15
FIGURE 8-1 CORPORATE AFFAIRS EXPENSE WALK 2020-2023
(THOUSANDS OF NOMINAL DOLLARS)

(PG&E-9)
8-3
2. Corporate Affairs Organization 1
The Corporate Affairs organization is overseen by the Senior Vice 2
President (SVP) of Corporate Affairs. It consists of the following 3
departments; Federal Affairs, State Legislative Affairs, Local Government 4
Affairs and Regulatory Affairs. The Corporate Affairs Organization 5
addressed in this chapter consists of the shaded areas shown in 6
Figure 8-2.4 7
FIGURE 8-2 CORPORATE AFFAIRS ORGANIZATION
a. SVP of Corporate Affairs 8
The SVP is responsible for the overall management of Corporate 9
Affairs and oversees PG&E’s Federal Affairs, State Legislative Affairs, 10
Local Government Affairs and Regulatory Affairs organizations.5 The 11
SVP provides leadership, direction, and oversight to develop PG&E’s 12
energy strategies and policies through innovative solutions, partnership 13
integration, public advocacy at the national, state, and local levels, and 14
all regulatory matters. In 2020, the SVP’s immediate office consisted of 15
two full-time equivalent (FTE) employees: the SVP, and an Executive 16
Assistant. 17
4 The Regulatory Affairs’ costs are presented in Exhibit (PG&E-9), Ch. 5, Regulatory
Affairs. 5 Id.

(PG&E-9)
8-4
b. Government Relations and Corporate Sustainability 1
The Government Relations and Corporate Sustainability function is 2
responsible for building and maintaining successful working 3
relationships with government and agency officials, as well as 4
community stakeholders. It is also responsible for developing, 5
integrating, and implementing sustainability goals. Government 6
Relations is responsible for engagement with local, state agency, and 7
federal elected and appointed officials; and Corporate Sustainability is 8
responsible for developing and implementing sustainability practices and 9
communicating with customers and stakeholders on sustainability goals; 10
At the end of 2020, there were approximately 52.1 FTEs in Government 11
Relations and Corporate Sustainability (including 1 vacancy). 12
1) Government Relations 13
Government Relations is comprised of three distinct functions, 14
Federal Affairs, State Legislative Affairs and Local Government 15
Affairs.6 16
a) The Federal Affairs team represents the Company and PG&E 17
Corporation before Congress and federal agencies. Federal 18
Affairs develops and enhances relationships with various 19
stakeholders at the national level to support PG&E’s safety 20
practices, infrastructure, operational goals, customer service, 21
and commitment to the environment. The Vice President (VP) 22
of Federal Affairs is responsible for developing, executing, 23
overseeing, and managing PG&E’s Federal Affairs activities. 24
b) The State Legislative Affairs team is responsible for 25
representing the interests of PG&E and its customers before 26
state agencies other than the CPUC (e.g., the California Energy 27
Commission, California State Water Resources Control Board, 28
California Governor’s Office of Emergency Services, and the 29
California Air Resources Board). It is responsible for regular 30
interaction with 8 elected statewide officials and 31
6 Cost information is provided in work papers organized by Immediate Office, Federal
Affairs, Local Government Affairs, and Sustainability. (See Exhibit (PG&E-9), WP 8-1 to WP 8-45.)

(PG&E-9)
8-5
24 departments, boards, and commissions in the areas of 1
energy, natural resources, tax collection, and the environment. 2
State Agency Relations represents PG&E in various forums to 3
support environmental leadership, customer satisfaction, and 4
safety and reliability goals. The VP of State Legislative Affairs is 5
responsible for representing the Company’s legislative agenda 6
and leading communications efforts with state legislative bodies. 7
c) Local Government Relations supports the work of PG&E’s 8
Electric, Gas, and Nuclear Operations teams by managing 9
PG&E’s interactions with counties, cities, school boards, special 10
districts, other local and regional public agencies, community 11
organizations, key civic and business leaders, and emergency 12
response coordination communication with local officials in the 13
48 counties, 62 tribal governments, and 244 towns and cities 14
across the Company’s 70,000 square-mile service territory. For 15
example, Local Government Relations provides local county 16
and agency planned shutoff specific information during Public 17
Safety Power Shutoff (PSPS) emergencies, and keeps key 18
stakeholders apprised throughout the PSPS process on weather 19
updates, scope, timing, and mitigations to reduce impacts to 20
customers and communities. The department also supports the 21
California Independent System Operator’s Flex Alert efforts, 22
providing information to local counties and agencies when 23
conservation is needed throughout the state. As local liaisons 24
with governments and other emergency response organizations, 25
they advise key functions in PG&E’s Emergency Operations 26
Center during a PSPS event, if there are requests for support, 27
for example, standing up a Community Resource Center, 28
requests for the location of circuits that may be in scope, or 29
support with the installation of temporary generation. 30
2) Corporate Sustainability 31
Corporate Sustainability’s activities include providing information 32
to customers and the public regarding the Company’s business and 33
sustainability goals, initiatives and progress; developing and 34

(PG&E-9)
8-6
implementing sustainable practices to enhance the Company’s 1
performance; analyzing energy, environmental and climate change 2
policies to reduce risk and costs to customers; and engaging with a 3
wide range of environmental, sustainability and other stakeholders 4
to obtain feedback on the Company’s performance and identify key 5
emerging issues, risks, and best practices. This includes leading 6
the Company’s engagement with tribal communities and working to 7
integrate environmental and social justice considerations into 8
PG&E’s business operations. It also includes conducting analysis 9
and advocacy to align state and federal climate change policy with 10
PG&E’s vision of a clean and resilient energy future for our 11
customers. 12
Corporate Sustainability leads the Company’s efforts to build 13
climate resilience, which is defined as the actions to be taken 14
related to PG&E’s assets, infrastructure, operations, employees, 15
and customers, to mitigate against potential consequences and 16
adapt to a changing climate and associated weather patterns. This 17
work includes incorporating climate resilience strategies into 18
business operating plans. PG&E’s 2020 Risk Assessment and 19
Mitigation Phase (RAMP) report identifies and discusses 20
management of the Climate Change cross-cutting factor which helps 21
the Company anticipate and plan for changing weather patterns and 22
climate change related events. See Section C below for more 23
information on the Climate Change RAMP risk. 24
3. 2023 Forecast Drivers 25
The 2023 forecast is $8.9 million, which is $1.9 million (27 percent) 26
higher than the 2020 recorded amount of $7.0 million. As shown in 27
Figure 8-1 above, there are three major cost drivers for 2023: (1) labor 28
escalation; (2) staffing; and (3) contracts and fees. PG&E discusses each 29
driver below. 30
a. Labor Escalation 31
PG&E forecasts $0.5 million in labor escalation based on the 32
escalation factors provided in Exhibit (PG&E-8), Chapter 4. 33

(PG&E-9)
8-7
b. Staffing 1
PG&E forecasts an approximate $1.1 million increase in staffing 2
costs including: (1) two FTEs to support the Climate Vulnerability 3
Assessment (CVA); and (2) four FTEs to support Local Government 4
Relations.7 5
1) Climate Vulnerability Assessment 6
PG&E will add two FTEs to support its continued work on the 7
CVA program, which was separately funded outside the GRC prior 8
to 2023 in the Climate Adaptation and Vulnerability Assessment 9
Memorandum Account (CAVAMA). 10
In Decision (D.) 20-08-046 in August 2020, the Commission 11
ordered California’s Investor-Owned Utilities (IOU) to conduct 12
systemwide CVAs of their assets, operations, and services, and to 13
file this assessment alongside its subsequent RAMP filing.8 14
D.20-08-046 also ordered the utilities to engage with all 15
disadvantaged and vulnerable communities throughout the CVA 16
process and to file a Community Engagement Plan outlining this 17
process.9 The two additional FTEs PG&E forecasts are necessary 18
to support this work ordered by the commission. 19
In 2020, there were three FTEs supporting climate resilience 20
work, which included the CVA technical analysis and preparation of 21
materials for the community engagement plan with disadvantaged 22
and vulnerable communities in PG&E’s service territory. The 23
additional two FTEs for 2023 include an Expert and a Senior 24
Representative. These FTEs’ roles will be to leverage the data 25
collected by the CVA and CEP process to inform data-driven, 26
risk-based decision-making, and to support the community 27
engagement plan with disadvantaged and vulnerable 28
communities.10 29
7 See WP 8-7. 8 D.20-08-046, Ordering Paragraphs (OP) 8, 9, 11, 12, and 14. 9 D.20-08-046, OPs 5-7. 10 See WPs 8-48 to 8-50.

(PG&E-9)
8-8
2) Local Government Relations 1
PG&E will add four FTEs (Local Government Relations 2
Representatives) for 2023. The addition of these representatives 3
supports the increasing needs of our local agencies, government 4
officials and community leaders in addressing evolving conditions 5
and requirements in permitting, vegetation management, drought, 6
and wildfire resiliency. The team also enables operations to work on 7
innovative programs such as battery storage, environmental efforts, 8
and company emergency response such as major outages and 9
communication for hydro operations events. This function also 10
provides a high level of support in PSPS (temporary generation 11
coordination, providing informational workshops, reporting and 12
responding during PSPS events), educating new local leaders on 13
the importance of climate change, translating county orders 14
(i.e., pandemic response orders) and how they apply to Company 15
operations, and work with public officials to minimize the impact to 16
customers during maintenance and other company activities.11 17
c. Contracts and Fees 18
PG&E forecasts an approximate $0.2 million increase in contract 19
costs for 2023 to support the CVA program discussed above. This 20
consultant support will focus on analysis of complex climate model 21
information relevant to the CVA and facilitating engagement with 22
disadvantaged and vulnerable communities, which, as the CPUC directs 23
in D.20-08-046, will involve the participation of community-based 24
organizations.12 25
11 See WPs 8-48 to 8-50. 12 D.20-08-046, OPs 6 and 7.

(PG&E-9)
8-9
C. Management of the Climate Change RAMP Cross-Cutting Factor 1
Climate Change was identified as one-of-eight cross-cutting risk factors in 2
the 2020 RAMP report.13 In the report, Climate Change was aggregated across 3
individual risk models and mapped according to RAMP risk impacts.14 4
Climate Change presents ongoing and future risks to PG&E assets, 5
infrastructure, operations, employees, and customers. Infrastructure and 6
management of this cross-cutting factor includes continued gathering and 7
collecting of knowledge, tools, and information to mitigate against potential 8
consequences and adaptation to a changing climate and associated weather 9
patterns. The management of this cross-cutting factor is a critical responsibility 10
in integrating climate change into the Company’s risk approach and preparing 11
for projected climate-driven natural hazards. In addition, through CPUC 12
D.20-08-046, PG&E along with other California IOUs were ordered to conduct a 13
CVA, which is overseen by the Climate Resilience team. 14
For the 2023 GRC, PG&E updated the foundational work it views as 15
necessary to prepare the Company to understand and plan for the physical risks 16
of climate change. In the 2020 RAMP report, PG&E anticipated the 2020 CPUC 17
Climate Adaptation decision. Given this, the foundational work proposed in 18
2020 included undertaking a CVA and developing climate adaptation plans to 19
make the Company more climate resilient. 20
In August 2020 the CPUC ordered the IOUs to conduct system wide CVAs 21
of their assets, operations, and services.15 The CVAs are due at the time of 22
each utility’s next RAMP Report. PG&E’s CVA will be filed in 2024. The CPUC, 23
in this decision, also instructed the IOUs to file a standalone chapter with their 24
subsequent GRC that includes: (1) a list of vulnerabilities, (2) proposals 25
addressing those vulnerabilities (with options), and (3) long term goals for 26
adapting to climate risks.16 PG&E will provide this chapter with its 2027 GRC. 27
13 Climate Change was previously referred to as “Climate Resilience” in the 2020 GRC
Exhibit (PG&E-9), Chapter 8. 14 PG&E’s 2020 Risk Assessment and Mitigation Phase Report, Attachment A,
p. 20 AtchA-9. 15 D.20-08-046, OPs 8 and 9. 16 D.20-08-046, OP 12.

(PG&E-9)
8-10
PG&E applauds this decision as an important step in improving our 1
understanding of the climate risks faced by the Company, its customers, and the 2
communities it serves. In March 2021, it informed the Commission of its 3
updated governance structure for climate resilience, and provided an update on 4
the progress it has made on the technical aspects of understanding climate 5
change risk on its assets and operations, as well as progress on developing a 6
community engagement plan. 7
D. Cost Tables 8
The Corporate Affairs organization’s recorded adjusted costs for 2016 9
through 2020, and forecasted costs for expense for 2021 through 2023, appear 10
in Tables 8-1 and 8-2. 11

(PG&E-9)
8-11
TAB
LE 8
-1
SUM
MA
RY
OF
DEP
AR
TMEN
T EX
PEN
SES
HIS
TOR
ICA
L A
ND
FO
REC
AST
(T
HO
USA
ND
S O
F N
OM
INA
L D
OLL
AR
S)
Line
N
o.
Des
crip
tion
Rec
orde
d Ad
just
ed
Fore
cast
W
orkp
aper
R
efer
ence
20
16
2017
20
18
2019
20
20
2021
20
22
2023
1 SV
P C
orpo
rate
Affa
irs Im
med
iate
Offi
ce
$3,9
60
$544
$5
97
$286
$2
55
$603
$6
23
$630
W
P 8-
3, li
ne 3
2 3
Loca
l Gov
ernm
ent R
elat
ions
5,
261
4,04
3 2,
653
3,37
9 3,
866
4,74
1 4,
875
5,01
3 W
P 8-
3, li
ne 3
1 4
Fede
ral A
ffairs
2,
339
1,80
6 1,
351
921
1,19
6 1,
169
1,18
7 1,
205
WP
8-3,
line
25
5 C
omm
unity
Rel
atio
ns
13
(13)
–
– –
– –
–
6 Su
stai
nabi
lity
1,38
4 1,
467
2,15
2 1,
441
1,70
0 1,
340
1,29
2 2,
050
WP
8-3,
line
46
8 To
tal C
orpo
rate
Affa
irs
$12,
957
$7,8
47
$6,7
53
$6,0
27
$7,0
17
$7,8
53
$7,9
77
$8,8
98
TAB
LE 8
-2
SUM
MA
RY
OF
DEP
AR
TMEN
T EX
PEN
SES
BY
FER
C A
CC
OU
NT
HIS
TOR
ICA
L A
ND
FO
REC
AST
(T
HO
USA
ND
S O
F N
OM
INA
L D
OLL
AR
S)
Line
N
o.
Des
crip
tion
Rec
orde
d Ad
just
ed
Fore
cast
W
orkp
aper
R
efer
ence
20
16
2017
20
18
2019
20
20
2021
20
22
2023
1 92
0 –
Adm
in &
Gen
Sal
arie
s $7
,235
$6
,308
$3
,971
$4
,374
$5
,350
$5
,764
$5
,942
$6
,606
W
P 8-
3, li
ne 1
2
921
– O
ffice
Sup
plie
s &
Ex
910
(172
) 63
9 53
9 25
9 53
2 53
4 53
7 W
P 8-
3, li
ne 2
3
923
– O
utsi
de S
vc E
mpl
oy –
Util
ity
3,79
4 77
6 95
5 87
6 1,
246
1,34
4 1,
287
958
WP
8-3,
line
3
4 92
3 –
Out
side
Svc
Em
ploy
– C
orp
1,01
8 94
8 1,
188
237
162
213
213
797
WP
8-3,
line
4
5 To
tal
$12,
957
$7,8
60
$6,7
53
$6,0
26
$7,0
17
$7,8
54
$7,9
76
$8,8
98
6 C
hang
e Fr
om P
rior Y
ear
– $(
5,09
8)
$(1,
106)
$(
727)
$9
90
$837
$1
22
$922

(PG&E-9)
8-12
TAB
LE 8
-3
CO
RPO
RA
TE A
FFA
IRS
EX
PEN
SES
BY
MA
JOR
WO
RK
CA
TEG
OR
Y (M
WC
) (T
HO
USA
ND
S O
F N
OM
INA
L D
OLL
AR
S)
Line
N
o.
MW
C
Des
crip
tion
Rec
orde
d Ad
just
ed
Fore
cast
W
orkp
aper
R
efer
ence
20
16
2017
20
18
2019
20
20
2021
20
22
2023
20
24
2025
1 JV
M
aint
ain
IT A
pps
& In
fra
$808
$3
34
$678
–
– –
– –
– –
WP
8-46
, lin
e 1
2
Tota
l $8
08
$334
$6
78
– –
– –
– –
– W
P 8-
46, l
ine
2

(PG&E-9)
-i-
PACIFIC GAS AND ELECTRIC COMPANY 2023 GENERAL RATE CASE
Testimony _____x________ Workpapers ____________ SOQ ______________ Exhibit Number: ____9____ Chapter Number: __8_____ Chapter Title: Corporate Affairs Witness Name: Susie Martinez
Page No.
Line No. Item As Filed As Corrected
Errata as of November 5, 2021
8-3 Figure 8-1 Recorded Cost N/A Replaced in full
8-7 Footnote 10 N/A See WPs 8-46 to 8-48. See WPs 8-48 to 8-50.
8-11 Table 8-1, lines 6 and 8, Year 2023
Forecast Cost line 6: $2,502 line 8: $9,350
line 6: $2,050 line 8: $8,898
8-11 Table 8-2, lines 2-6, Year 2023
Forecast Cost line 2: 921: $688 line 3: 923-U: $1,843 line 4: 923-C: $213 line 5: Total: $9,350 line 6: YoY Change: $1,374
line 2: 921: $537 line 3: 923-U: $958 line 4: 923-C: $797 line 5: Total: $8,898 line 6: YoY Change: $922
8-12 Table 8-3 Recorded Cost No table Table new in entirety

(PG&E-9)
PACIFIC GAS AND ELECTRIC COMPANY
CHAPTER 9
ADMINISTRATIVE AND GENERAL RATEMAKING
ADJUSTMENTS

(PG&E-9)
9-i
PACIFIC GAS AND ELECTRIC COMPANY CHAPTER 9
ADMINISTRATIVE AND GENERAL RATEMAKING ADJUSTMENTS
TABLE OF CONTENTS
A. Introduction ....................................................................................................... 9-1
1. Summary of Ratemaking Adjustments ....................................................... 9-1
2. Organization of Chapter ............................................................................. 9-2
B. Reductions for BTL and Non-Utility Affiliates .................................................... 9-2
1. A&G Department Cost Reductions ............................................................ 9-2
a. Below-the-Line ..................................................................................... 9-2
b. Non-Utility Affiliates ............................................................................. 9-3
2. Reductions for Companywide A&G Expenses ........................................... 9-4
a. BTL Allocation ..................................................................................... 9-4
b. Non-Utility Affiliates ............................................................................. 9-4
C. Capitalization Adjustments ............................................................................... 9-5
1. Capitalization of Corporate Services Department Costs ............................ 9-5
a. Labor and M&S Capitalization Factors ................................................ 9-5
b. Composite Rates ................................................................................. 9-6
2. Capitalization of Companywide A&G Expenses ......................................... 9-6
a. Labor and STIP Capitalization Factors ................................................ 9-6
b. Implementation of Financial Accounting Standards Board (FASB) No. 2017-07 ......................................................................................... 9-7
c. Third-Party Claims ............................................................................... 9-8

(PG&E-9)
9-1
PACIFIC GAS AND ELECTRIC COMPANY 1
CHAPTER 9 2
ADMINISTRATIVE AND GENERAL RATEMAKING ADJUSTMENTS 3
A. Introduction 4
In this chapter, Pacific Gas and Electric Company (PG&E or the Company 5
or the Utility) describes adjustments to its total Administrative and 6
General (A&G) expenses for ratemaking purposes in this General Rate 7
Case (GRC), as well as the methodologies that support those adjustments. 8
The purpose of the adjustments is to determine the appropriate amount of A&G 9
expenses to be included in the GRC and to present those costs in the format 10
required by the California Public Utilities Commission (CPUC or the 11
Commission). The adjustments discussed in this chapter are summarized in 12
Table 9-1 in the next section. 13
1. Summary of Ratemaking Adjustments 14
PG&E adjusts A&G expenses for ratemaking purposes in the 15
following ways: 16
PG&E removes certain items from its A&G expense forecast, which are 17
not recoverable in customer rates. Specifically, PG&E removes 18
below-the-line (BTL) activities and a portion for non-Utility affiliate activities. 19
The removal of these items reduces the overall revenue requirement 20
forecast. 21
PG&E also capitalizes certain A&G costs. The purpose of the 22
capitalization adjustment is to properly account for expenses associated with 23
construction projects included in capital expenditure forecasts. These 24
capitalized A&G costs will be recovered along with other capital costs over 25
the life of each asset. 26

(PG&E-9)
9-2
TABLE 9-1 RATEMAKING ADJUSTMENTS FOR ORGANIZATIONAL EXPENSES
AND COMPANYWIDE EXPENSES
Line No.
Ratemaking Adjustments
A&G Corporate Services Department Costs Companywide A&G Costs
1 Reduction Adjustment BTL and non-Utility Affiliates BTL and non-Utility Affiliates
2 Capitalization Composite Rates (Labor and Materials and Supplies (M&S))
Labor rate, Short-Term Incentive Plan (STIP) rate and Third-Party Claims rate
2. Organization of Chapter 1
The remainder of this chapter is organized as follows: 2
• Section B: Reductions for BTL and non-Utility Affiliate Activities – This 3
section explains adjustments to both Corporate Services expenses and 4
Companywide A&G costs for BTL activities and non-Utility affiliate 5
activities. 6
• Section C: Capitalization Adjustments – This section explains the 7
capitalization of portions of both Corporate Services expenses and 8
Companywide A&G costs. 9
B. Reductions for BTL and Non-Utility Affiliates 10
PG&E reduces its A&G expense forecast to exclude BTL activities and 11
non-Utility affiliate work. 12
1. A&G Department Cost Reductions 13
a. Below-the-Line 14
In general, expenses attributable to normal Utility operations are 15
above-the-line and recoverable in rates. Consistent with the 16
Commission requirements, certain PG&E’s costs are borne solely by 17
shareholders and excluded in the revenue requirement for cost 18
recovery. Those costs are classified as BTL. PG&E’s BTL Accounting 19
Standard describes the process and requirements for recording BTL 20
activities and expenses.1 Examples of BTL activities and expenses 21
include: (1) political activities; (2) political contributions and 22
memberships; (3) charitable contributions; (4) advertising; (5) penalties; 23
1 Utility Standard: FIN-3901S BTL Accounting Standard.

(PG&E-9)
9-3
and (6) other activities not attributable to normal Utility operations. All 1
PG&E employees receive an annual communication regarding their 2
obligation to comply with the BTL Accounting Standard. In addition, 3
employees who regularly charge directly to BTL orders receive annual 4
training on the BTL Accounting Standard.2 5
As part of the annual enterprise-wide planning process, Business 6
Finance department within the Finance organization reviews the BTL 7
allocations for all A&G cost centers to ensure the percentages are 8
reflective of current BTL activities. The Lines of Business owner of each 9
A&G cost center approves their BTL allocations annually. The 10
procedures in the BTL Accounting Standard are applicable to all PG&E 11
departments performing work activities for which the costs are borne by 12
shareholders. PG&E removes the BTL amounts from the A&G expense 13
forecast. 14
b. Non-Utility Affiliates 15
PG&E Corporation (PCG) sometimes performs services for its 16
non-Utility affiliates. In most instances, the Corporate Services 17
organizations directly charge for non-Utility affiliate work. The Company 18
has removed the costs of those services from its GRC forecast. 19
In addition to removing the direct charges, the Company removes 20
an additional 1 percent of Corporation expenses from the A&G 21
forecast.3 This additional allocation acts as an extra precaution, to 22
ensure that PG&E accounts for any potential non-Utility affiliate-related 23
activities, which may not have been captured through direct charges. 24
The 1 percent reduction is derived from a 3-factor methodology 25
employed by PG&E’s Affiliate Accounting Department. The 3-factor 26
methodology consists of taking an average of the following three ratios: 27
1) Affiliate Assets/Total Consolidated Assets; 28
2 PG&E’s Internal Audit Department conducts an annual compliance review of the BTL
guidelines documented in the BTL Accounting Standard. The Internal Audit Department reviews recorded costs and evaluates controls for recording and monitoring BTL costs in compliance with the BTL guidelines. PG&E adjusts its recorded costs for items identified through the audit.
3 Current non-Utility affiliates include PCG Support Services, Inc., PCG Support Services II, Inc., and PCG Capital, Inc.

(PG&E-9)
9-4
2) Affiliate Operating Expenses less Fuel purchase costs/Total 1
Consolidated Operating Expenses less Fuel purchase costs; and 2
3) Affiliate Headcount/Total Consolidated Headcount. 3
PG&E updates this calculation annually to account for new 4
non-Utility affiliates and affiliates which are no longer active. The 5
actual percentage resulting from the above calculation is less than 6
1 percent for 2020 and has historically remained at that level.4 To be 7
conservative, PG&E has rounded the calculated percentage to 1 percent 8
for the GRC forecast. 9
2. Reductions for Companywide A&G Expenses 10
PG&E also reduces its GRC forecast for certain other Companywide 11
A&G costs to account for BTL and non-Utility affiliate activities. 12
a. BTL Allocation 13
The BTL reductions for Companywide expenses are determined 14
differently than A&G departmental expense reductions because they are 15
not incurred by a particular Corporate Services department. The 16
BTL percentage is calculated by using the last recorded years’ total BTL 17
labor as a percentage of total Company expense labor. PG&E applies 18
the calculated percentage of BTL to the forecasted expenses. PG&E 19
updates this allocation factor annually to reflect current activity. 20
b. Non-Utility Affiliates 21
The treatment of non-Utility affiliates’ expenses is similar to the 22
reduction adjustments for the BTL expenses. PG&E reviews the last 23
recorded year to determine the percentage of benefits that were 24
associated with non-Utility affiliates expenses. PG&E applies the 25
calculated percentage of non-Utility affiliates to the forecasted 26
expenses. PG&E updates this allocation factor annually to reflect 27
current activity. 28
4 See workpapers supporting Exhibit (PG&E-10), Ch. 8 for the calculation supporting the
1 percent non-Utility affiliate reduction.

(PG&E-9)
9-5
C. Capitalization Adjustments 1
To reflect the total costs of ongoing and new construction, work supporting 2
construction activities not directly charged to construction orders must be 3
accounted for in capital and removed from expense. In this section, PG&E 4
explains the methodology for capitalizing these construction-related costs. 5
1. Capitalization of Corporate Services Department Costs 6
PG&E determines the appropriate amount of Corporate Services 7
department costs that should be capitalized by applying a composite Labor 8
capitalization factor to its A&G expenses in Federal Energy Regulatory 9
Commission (FERC) Account 920 (A&G Salaries), as well as a composite 10
Material & Supplies capitalization factor to expenses in Account 921 (Office 11
Supplies and Expenses). The capitalization methodology is described in 12
Section a and b below. 13
a. Labor and M&S Capitalization Factors 14
Determining the total capitalized amount of A&G expenses is a 15
two-step process: (1) determine the amount of each Corporate Services 16
department’s work that supports capital projects; and (2) calculate a 17
composite A&G capitalization rate for Labor and for M&S. 18
PG&E’s Corporate Services organization began by identifying the 19
costs in their respective forecasts that should be allocated to capital. 20
Each Corporate Services department generates a single 21
capitalization factor that will be applied to both labor and materials. 22
PG&E then applies each Corporate Services department’s labor 23
capitalization factor to the salaries in the department’s FERC 24
Account 920. The resulting capitalized labor amount for the department 25
is presented in FERC Account 922 (A&G Transfer Credit), along with the 26
capitalized labor amounts from the other Corporate Service 27
departments. Similarly, PG&E applies each Corporate Services 28
department’s M&S capitalization factor to the department’s Office 29
Supplies and Expense amount in FERC Account 921. The resulting 30
capitalized M&S amount for the department is presented in FERC 31
Account 922 (A&G Transfer Credit), along with the M&S amounts from 32
the other Corporate Service departments. The sum of all the Corporate 33

(PG&E-9)
9-6
Service departments’ capitalized labor amount and the capitalized M&S 1
amount is the total Corporate Services capitalization amount. 2
b. Composite Rates 3
After determining the total capitalization amount, PG&E develops a 4
Composite A&G capitalization rate. The composite rate is a convenient 5
accounting tool to recognize and implement the outcome of the A&G 6
capitalization on PG&E’s financial books in the years following a 7
GRC decision. The labor composite rate is calculated by dividing the 8
sum of all the Corporate Services departments’ resulting capitalized 9
labor amounts presented in FERC Account 922 (A&G Transfer Credit), 10
by the sum of the total Corporate Services Department labor in FERC 11
Account 920 (A&G Salaries). Similarly, the M&S composite rate is 12
calculated by dividing the sum of all the Corporate Services 13
departments’ resulting capitalized M&S amounts presented in FERC 14
Account 922 (A&G Transfer Credit), by the sum of the total Corporate 15
Services M&S in FERC Account 921 (Office Supplies and Expense). 16
See Table 9-2 for the 2020 capitalization rates. Similar to the 17
Companywide A&G expenses described in the section below, the 18
individual and composite rates may be updated annually to reflect 19
current activity. 20
TABLE 9-2 2023 CAPITALIZATION FACTORS
CAPITALIZATION OF CORPORATE SERVICES ORGANIZATIONAL COSTS
Line No. Factor
FERC Account Percent
1 Corporate Service – Labor Factor 920 11.50% 2 Corporate Services – M&S Factor 921 9.60%
2. Capitalization of Companywide A&G Expenses 21
Similar to the capitalization of Corporate Services department costs, 22
PG&E capitalizes certain Companywide A&G expenses. 23
a. Labor and STIP Capitalization Factors 24
PG&E capitalizes a portion of Companywide A&G expenses related 25
to workers compensation, benefits, and STIP. For ratemaking 26

(PG&E-9)
9-7
purposes, to calculate the capitalized amounts for workers 1
compensation, and benefits, PG&E divides the recorded capital labor by 2
the total Company labor5 to derive a capital labor ratio. To calculate the 3
capitalized amount for STIP, PG&E divides the capitalized 4
non-bargaining unit (NBU) labor and Engineers and Scientists of 5
California (ESC) STIP-eligible6 straight-time labor to total straight time 6
NBU and ESC STIP eligible straight time labor using 2020 recorded 7
labor. PG&E’s STIP capitalization practice was approved in PG&E’s 8
1993 GRC Decision and PG&E continues this methodology for recorded 9
costs.7 Table 9-3 below shows the 2023 GRC Labor and STIP 10
capitalization factors.8 PG&E updates these capitalization factors on an 11
annual basis to reflect current activity. 12
TABLE 9-3 2023 GRC LABOR AND STIP CAPITALIZATION FACTORS
CAPITALIZATION OF CERTAIN COMPANYWIDE EXPENSES
Line No. Type of Cost
FERC Account Basis for Capitalization Factor
1 Workers Compensation 925 Labor 43.62% 2 Benefits 926 Labor 43.62% 3 STIP 922 NBU & ESC Labor 35.94% 4 Third-Party Claims 925 Third-Party Claims 17.08%
b. Implementation of Financial Accounting Standards Board (FASB) 13
No. 2017-07 14
In March 2017, the FASB issued Accounting Standards Update 15
No. 2017-07 which required that companies calculate the capitalization 16
of Post-Retirement Benefits Other Than Pension (PBOP) costs based 17
on the annual service cost determined by a plan’s actuaries starting on 18
January 1, 2018. The annual service cost represents the present value 19
5 Total Company labor includes bargaining unit and NBU labor. 6 Not all ESC employees are eligible for STIP. Those that are eligible are included in the
calculation. 7 D.92-12-057, 1992 CPUC LEXIS 971, 47 CPUC2d 143, PG&E 1993 GRC,
Section 11.4.4. 8 See workpapers supporting Exhibit (PG&E-10), Ch. 8 for the development of these
capitalization factors.

(PG&E-9)
9-8
of future benefits earned by employees during the current year. Thus, 1
the amount of PBOP costs included in capital projects will be the capital 2
labor ratio,9 multiplied by the annual service cost. 3
PG&E effectuated this change by filing Advice Letter 4
(AL) 3915-G/5195-E, in which the Commission approved the 5
capitalization of PBOP based on the annual service cost determined by 6
a plan’s actuaries. The AL was approved on January 8, 2018 and 7
became effective January 1, 2018. 8
c. Third-Party Claims 9
PG&E classifies third-party claims based on the likelihood of having 10
a capital component. Examples of third-party claims that possibly have 11
a capital component are: (1) Company vehicle incidents and 12
(2) Company job site injuries. Examples of third-party claims not likely 13
to have a capital component include: outages and electrical 14
interruptions and non-dig in gas incidents. 15
PG&E then determines percentages of capital and expense 16
recorded costs for each Line of Business that has been assigned a 17
third-party claim with a possible capital component. To determine the 18
capitalization amount, the Company calculates the third-party claim 19
capitalization factor using four years of historical expense and capital 20
data for cost centers that have been assigned with third-party claims 21
(specifically for incidents with a possible capital component). The 22
capitalization factor is then applied to the total third-party claims to yield 23
the capitalization amount.10 PG&E updates this capitalization factor 24
every GRC cycle. 25
9 Calculated as capital labor divided by total labor. 10 See Table 9-3 for the 2023 Third-Party Claims capitalization factor.