Embed Size (px)
Citation preview
Pacific Gas and Electric Company
EPIC F ina l Report
Program Electric Program Investment Charge (EPIC)
Project
EPIC 1-15 – Demonstrate New Technologies and Strategies That Support Integrated “Customer-to-Market-to-Grid” Operations of the Future
Project Reference
Name
Grid Operations Situational Intelligence (GOSI)
Department
Emerging Technologies- Grid Analytics
Project Sponsor Ferhaan Jawed
Project Business Lead Tom Martin
Contact
Date December 30, 2016
Version Type Final
Final Report | EPIC Project 1.15 – Grid Operations Situational Intelligence (GOSI)
Table of Contents
1 Executive Summary _________________________________________ 3
2 Introduction _______________________________________________ 7
3 Project Overview ___________________________________________ 8
3.1 Issue Addressed __________________________________________________ 8
3.2 Project Objective _________________________________________________ 8
3.3 Scope of Work ___________________________________________________ 9 3.3.1 Major Tasks and Deliverables ______________________________________ 9
4 Project Results and Key Findings ______________________________ 14
4.1 Successful data integration into vendor’s system _______________________ 14
4.2 Successful Demonstration of the Interactive Map and Use Case Workbenches 14 4.2.1 Use Case 1: Outage Anticipation / Interactive Map ____________________ 14
4.2.2 Use Case 2: Construction Planning _________________________________ 16
4.2.3 Use Case 3: Tools for Circuit Loading Research ________________________ 17
4.2.4 Use Case 4: Operations and Emergency Operations ____________________ 18
4.2.5 Use Case 5: Distributed Generation (DG) Visualization and Research ______ 20
4.3 Agile Development Promoted Frequent Feedback Collection and Iterations __ 22
4.4 Data Access ____________________________________________________ 22
5 Unique Technology Implementation Issues _____________________ 23
5.1 Challenges in Maintaining Diverse Data Sources ________________________ 23
5.2 Challenges in Visualizing Data and Verifying Data Accuracy With Users _____ 24 5.2.1 Automated Testing _____________________________________________ 24
5.2.2 Visualization Sophistication _______________________________________ 24
5.3 Applying the Agile Development Method Without User Analytics __________ 25
6 Key Accomplishments and Future Opportunities _________________ 26
6.1 Key Accomplishments ____________________________________________ 26
6.2 Future Opportunities _____________________________________________ 26 6.2.1 Potential Features for Future Versions of the GOSI Platform _____________ 26
7 Value proposition _________________________________________ 27
7.1 EPIC Primary and Secondary Principles _______________________________ 27 7.1.1 Apply Business Logic to Raw Data Visualization _______________________ 28
7.2 Improving Industry Awareness _____________________________________ 28 7.2.1 Adaptability to Other Utilities / Industry _____________________________ 28
7.2.2 Dissemination of Best Practices ___________________________________ 29
8 EPIC Specific Metrics _______________________________________ 30
9 Conclusion _______________________________________________ 31
10 Appendix A – Out of Scope Stories ____________________________ 32
11 Appendix B – Introduction Guide to Using GOSI __________________ 34
12 Section 1: Interactive Map___________________________________ 34
Navigating to the Interactive Map _______________________________________ 34
Final Report | EPIC Project 1.15 – Grid Operations Situational Intelligence (GOSI)
Map Content Manager ________________________________________________ 35
Map Layers _________________________________________________________ 35
Clustering __________________________________________________________ 36
Map Use Cases ______________________________________________________ 37 1. Outage and Troubleman Tracking __________________________________ 37
2. Asset Threat Analysis/Outage Cause Assessment ______________________ 37
3. Grouping Construction Tags ______________________________________ 38
13 Section 2: Daily Operations Dashboard _________________________ 39
Daily Ops Dashboard Uses _____________________________________________ 39 1. AOR Outages __________________________________________________ 39
14 Section 3: Emergency Operations Center Video Wall ______________ 40
Configuration _______________________________________________________ 40
Closing _____________________________________________________________ 40
EOC Video Wall Uses __________________________________________________ 40 14.1.1 1. Outage Tracking During an Event ________________________________ 40
List of Tables Table 3-1: Use Cases for the GOSI Platform 10
Table 3-2: Data Sources Incorporated into the GOSI Platform 12
Table 7-1: EPIC Primary and Secondary Guiding Principles 27
List of Figures Figure 1: Screenshot of Interactive Map 13
Figure 2: Screenshot of Interactive Map with Outages and Troublemen Data Layers 15
Figure 3: Screenshot of Construction Planning Dashboard 17
Figure 4: Screenshot of Circuit Loading Research Workbench Output 18
Figure 5: Screenshot of Daily Operations Dashboard 19
Figure 6: Screenshot of Emergency Operations Center Dashboard 20
Figure 7: Screenshot of DG Visualization Heat Map 21
List of Acronyms
AMI Advanced Metering Infrastructure
CESO Customers Experiencing Sustained Outages
DG Distributed Generation
DER Distributed Energy Resources
DMS Distribution Management System
ED Electric Distribution
EOC Emergency Operations Center
GOSI Grid Operations Situational Intelligence
Final Report | EPIC Project 1.15 – Grid Operations Situational Intelligence (GOSI)
3
1 Executive Summary
This report summarizes the project objectives, technical results, and lessons learned for EPIC Project
1.15, Demonstrate New Technologies and Strategies That Support Integrated “Customer-to-Market-to-
Grid” Operations of the Future (in short referred to as Grid Operations Situational Intelligence or GOSI in
this report), as listed in the EPIC Annual Report.1
As Pacific Gas and Electric Company (PG&E) modernizes its grid technology, new sources of potentially
valuable operational intelligence are becoming available. SmartMeters, supervisory control and data
acquisition (SCADA) devices, and line sensor measurements – in addition to existing environmental and
asset data – could provide increased visibility to the state of the grid, but these sources present
challenges in their complexity and volume of data. Collating and visualizing this operational data may
provide insights into grid operations, and could minimize outages and cost while increasing safety.
Additionally, while there is a wealth of data being generated by new devices, there are growing
challenges to organizing and leveraging this data. To operate the next-generation grid safely, affordably,
and reliably, electric utilities will need to integrate significantly more data and information into both
existing and future operational systems. Data concerning Distributed Energy Resources2 (DERS) will grow
exponentially and be vital for control and planning operations. Data from customers concerning service,
outages, and safety issues with existing assets will also need to be tied into analysis tools. System
operators will need timely and simple access to this data and resulting analyses in order to manage the
system and the resources effectively.
To help address these concerns, EPIC Project 1.15 - Grid Operations Situational Intelligence was
established with the following objective: to develop and demonstrate a project version of a real-time
data visualization software platform for use by PG&E end users.
Key Accomplishments
The following is a summary of the key accomplishments of this project:
Integrated data streams from over 20 sources, in addition to developing and maintaining a
system to provide updated data extracts from each source.
Developed and demonstrated a visualization tool that enabled users to customize a map with
various data layers depending on their specific use case.
Developed custom data visualization tools for five specific use cases to respond to specific
concerns identified through interviews with operations personnel including:
o UC1: Outage Anticipation. Combines weather, wildfire, lightning, and earthquake feeds
onto a single map view along with GIS information to reduce the number of data view
windows an operator needs to open during an outage event.
1 http://www.pge.com/includes/docs/pdfs/about/environment/epic/EPICAnnualReportAttachmentA.pdf. 2 Including Electric Vehicles (EVs), Photovoltaic solar generation systems (PV), and Battery Energy Storage Systems
(BESS).
Final Report | EPIC Project 1.15 – Grid Operations Situational Intelligence (GOSI)
4
o UC 2: Construction Planning. Provides operational and SAP information, including feeder
maps, to construction planners to streamline the planning process.
o UC 3: Circuit Loading Research. Supports operators and engineers finding asset loading
information via a map-based search interface.
o UC 4a: Operations. Provides a real-time graphical dashboard of daily events for control
centers providing increased situational and operational awareness.
o UC 4b: Emergency Operations. Provides a real-time emergency operations center (EOC)
dashboard and reporting tool to replace existing Excel-based dashboards. These provide
a single-source of truth for data and consistent and timely reporting.
o UC 5: Distributed Generation (DG) Planning. Provides a geospatial visualization of DG
assets, ‘as-built’, to support improved operational research and planning.
Demonstrated the overall value and efficiency gains for a tool that allows users to view multiple
internal and external data streams on one map.
Key Takeaways
The following are the key takeaways and lessons learned from this project:
Overall, end users found the GOSI platform and the ability to view multiple layers of data on one
map / screen to be highly valuable. For example:
o In UC1, the GOSI platform demonstrated the value of integrating new external data sources
such as Google Streetview into Operations. Previously, users had to spend significant time
and energy guiding field personnel to equipment of interest. By providing access to street-
level views integrated with PG&E’s internal asset data, the GOSI platform acted as a tool
for personnel in operations centers to provide improved support to field personnel.
o In UC2, the Construction Planning Dashboard enabled easier optimization of construction
work planning and execution by allowing the user to potentially consolidate work on
nearby assets for just one clearance tag, instead of many. It was previously a challenge for
construction planners to sort through vast and isolated data sets and understand work
optimization opportunities.
o Prior to the GOSI platform, operators had to manually compare the PG&E asset database
displayed via a GIS-enabled map with external weather maps to plan for potential outages.
In UC 1, the GOSI platform allowed weather data to be overlaid on top of the asset maps, in
addition to providing troublemen locations.
o In UC 4b, emergency operations user feedback demonstrated the novelty of the GOSI
platform in being able to display asset location, field resource locations, and fire boundary
data all on one map. The Emergency Operations Dashboard, a specific use case module
built into the GOSI platform, was successfully demonstrated during the 2015 Valley and
Butte wildfire incidents.
The agile development method was an effective strategy for this type of technology
demonstration project that sought to quickly develop features and functionality that could be
regularly tested by end users to drive the end project.
o A particular testament to this development strategy was the GOSI platform’s successful
integration and visualization of data from over 20 different internal and external sources,
Final Report | EPIC Project 1.15 – Grid Operations Situational Intelligence (GOSI)
5
where updated data extracts were being delivered to the vendor’s software using an ad-
hoc combination of manual, push, and pull processes.
Unique Challenges
There were some unique challenges addressed in the project:
This technology demonstration project was unique in both the volume of data being integrated
into one platform, but also in the variation among the individual data sources. Not only did each
data stream need to be integrated into the vendor’s backend system, nearly all of the data
sources needed to be updated with some frequency in order for the visualization tool to provide
near real-time information. Due to the project nature of this project, varying data integration
patterns were used varying from on-going feeds to flat file incorporation.
Sometimes, a feature would appear to be providing the desired functionality and would pass
tests designed to verify that it was behaving as designed. Despite passing these tests, the output
of the feature would show incorrect data. Through the frequent user tests and feedback
collection mechanisms, it was the end users who would eventually identify the issue of a feature
displaying the incorrect data so that it could be corrected. Automated testing suites and
sophisticated visualization capabilities might help mitigate this issue, and are important
elements for utilities consider in choosing an integrated data platform.
Due to technical limitations, PG&E was unable to collect and track quantitative user analytics,
such as click-rates and data on which features were most widely used. These metrics would
have allowed PG&E to compare user provided feedback against how users were actually using
the tool’s features. The primary challenge preventing data collection was the aforementioned
output showing incorrect data. The initial goal of the GOSI project was to collect quantitative
feedback based on users’ real-life engagement with the technology, but because of the testing
challenges, most user engagement occurred in a controlled setting to prevent distribution
operations personnel accidentally acting on incorrect information.
Next Steps
Through the experience of this technology demonstration project, PG&E has identified a variety of
priorities when pursuing a vendor (or develop the in-house software capabilities) to construct, maintain,
and expand an evolving data platform of this type. While the current prototype version of the GOSI
platform has reached its end of life, PG&E will continue to explore future situational intelligence
platforms using the lessons learned from this demonstration project.
Furthermore, the project offers several recommendations for expanding upon a future version of the
GOSI platform:
Develop a data export functionality to allow users to explore deeper into the data to perform
specific analyses.
Apply an added layer of business logic and other “rules” to the raw data to provide the user with
actionable insights. This added layer of synthesis moves the point at which the end user is
required to interpret the data enabling increased internal consistency among data end users.
Seek to combine the GOSI platform approach with other EPIC and new technology initiatives in
order to test additional use cases that this situational intelligence platform could serve.
Final Report | EPIC Project 1.15 – Grid Operations Situational Intelligence (GOSI)
6
Conclusion
PG&E successfully developed a platform that allowed users to view these complex data sources in ways
that were previously impossible, specifically by allowing users to view all relevant data on one map or
screen. This project successfully achieved all of its key objectives, and in doing so, has captured key
learnings that can be leveraged by other utilities and industry members to leverage new and existing
data sources to improve situational intelligence around grid operations. Through the work executed in
this technology demonstration project and documented in this report, PG&E gained substantial
experience in developing and maintaining the IT infrastructure required to host the data integration and
visualization capabilities demonstrated by the GOSI platform.
Final Report | EPIC Project 1.15 – Grid Operations Situational Intelligence (GOSI)
7
2 Introduction
This report documents the achievements of EPIC Project 1.15, “Demonstrate New Technologies and
Strategies That Support Integrated “Customer-to-Market-to-Grid” Operations of the Future”, highlights
key learnings from the project that have industry-wide value, and identifies future opportunities for
PG&E to leverage this project. In short, the project is referred through the report as “Grid Operations
Situational Intelligence (GOSI)”.
The California Public Utilities Commission (CPUC) passed two decisions that established the basis for this
project program. The CPUC initially issued D. 11-12-035, Decision Establishing Interim Research,
Development and Demonstrations and Renewables Program Funding Level3, which established the
Electric Program Investment Charge (EPIC) on December 15, 2011. Subsequently, on May 24, 2012, the
CPUC issued D. 12-05-037, Phase 2 Decision Establishing Purposes and Governance for Electric Program
Investment Charge and Establishing Funding Collections for 2013-20204, which authorized funding in the
areas of applied research and development, technology demonstration and deployment (TD&D), and
market facilitation. In this later decision, CPUC defined TD&D as “the installation and operation of pre-
commercial technologies or strategies at a scale sufficiently large and in conditions sufficiently reflective
of anticipated actual operating environments to enable appraisal of the operational and performance
characteristics and the financial risks associated with a given technology.”5
The decision also required the EPIC Program Administrators6 to submit Triennial Investment Plans to
cover three-year funding cycles for 2012-2014, 2015-2017, and 2018-2020. On November 1, 2012, in
A.12-11-003, PG&E filed its first triennial Electric Program Investment Charge (EPIC) Application at the
CPUC, requesting $49,328,000 including funding for 26 Technology Demonstration and Deployment
Projects. On November 14, 2013, in D.13-11-025, the CPUC approved PG&E’s EPIC plan, including
$49,328,000 for this program category. Pursuant to PG&E’s approved EPIC triennial plan, PG&E initiated,
planned and implemented the following project: 1.15 Grid Operations Situational Intelligence (GOSI).
Through the annual reporting process, PG&E kept CPUC staff and stakeholder informed on the progress
of the project. The following is PG&E’s final report on this project.
3 http://docs.cpuc.ca.gov/PublishedDocs/WORD_PDF/FINAL_DECISION/156050.PDF. 4 http://docs.cpuc.ca.gov/PublishedDocs/WORD_PDF/FINAL_DECISION/167664.PDF.
5 Decision 12-05-037 p. 37.
6 Pacific Gas & Electric (PG&E), San Diego Gas & Electric (SDG&E), Southern California Edison (SCE), and the California Energy
Commission (CEC).
Final Report | EPIC Project 1.15 – Grid Operations Situational Intelligence (GOSI)
8
3 Project Overview
The project ultimately created two key deliverables, including an interactive map that allows users to
toggle different data layers on and off, as well as “workbenches” (i.e., customized modules) within the
GOSI platform for five specific use cases. These workbenches allow users to view multiple data outputs
simultaneously, allowing for more holistic views of the various use case scenarios. This section
summarizes the industry gap the project addresses, the project’s objectives, the scope of work, and the
major tasks, milestones, and their corresponding deliverables.
3.1 Issue Addressed
As Pacific Gas and Electric Company (PG&E) modernizes its grid technology, new sources of potentially
valuable operational intelligence data are becoming available. Data from SmartMeters™, supervisory
control and data acquisition (SCADA) devices, and line sensor measurements – in addition to existing
environmental and asset data – could provide increased visibility to the state of the grid; however
ingesting and integrating these sources present challenges due to the complexity and volume of data.
Despite these technical challenges, collating and visualizing these new sources of operational data could
provide insights into grid operations, and could minimize outages and cost while increasing safety.
Currently, utilities have limited access to easily configurable tools that provide near real-time awareness
on circuit loading, weather, fire, crew locations, solar generation, and other key data sources.
Additionally, even when these tools do exist, they operate on separate platforms, forcing distribution
operations personnel to view data outputs on multiple screens or in different formats in order to access
all relevant information about grid operations in a specific scenario. Because these tools are not
integrated with each other, this forces the distribution operations personnel to use “swivel chair
integration” where the people search between multiple data streams in an ad-hoc fashion.
The ability to integrate and visualize a wide range of data sources on a single platform in near real-time
would allow end users to make improved operational decisions, with the benefits of allocating resources
more efficiently, improving reliability, and increasing safety. At the time this report was written, other
utilities have now begun experimenting with real-time visualization platforms for grid operations,
however this is still a new topic in the industry.
3.2 Project Objective
The need for integrating multiple data streams into one platform, especially those from newer sources
like SmartMeters™ and SCADA devices, in addition to the lack of a readily available market solution
created the foundation for this technology demonstration project. The primary focus of EPIC 1.15 was to
demonstrate the integration and visualization of data streams from multiple sources to demonstrate the
value of having one integrated system, as opposed to the variety of tools operating across multiple
different screens and platforms. The key objective of this project was to develop and demonstrate a
project version of a real-time data visualization software platform for use by PG&E end users.
Final Report | EPIC Project 1.15 – Grid Operations Situational Intelligence (GOSI)
9
Completion of this objective includes demonstration of:
A foundation for enhanced tools to increase situational awareness.
A blueprint to enable PG&E and other utilities to integrate multiple data streams for near real-
time visualization of various grid operations.
The ability to visualize and leverage data in new and more informative ways.
The ability to streamline data and access, reducing the number of separate windows and
screens users must utilize to view data holistically.
User-based feedback on recommended future enhancements and user experience would
provide the most value in a production software platform.
A qualitative assessment of the degree to which end-users valued the project software platform.
3.3 Scope of Work
This project focused on the application of software technology to develop and demonstrate a situational
awareness tool that could visualize data from multiple sources. The tool would integrate near real-time
data, and be available on a project basis for a limited set of grid operations personnel to access and
provide feedback. The project was not designed to choose a vendor for a production level system,
locking PG&E into a choice before any exploratory work had occurred, but to identify the technology,
data needs, and change management strategies that would be useful in a future data aggregating
platform.
3.3.1 Major Tasks and Deliverables
There are four major tasks associated with this project that correspond to the four work streams:
Task 1 - Select a vendor to develop the GOSI platform: This task issued a RFP for a
software vendor to develop and provide the software platform to ingest and visualize the
multiple data streams, as well as create a user interface based on PG&E’s specifications.
As part of the RFP process, 17 vendors were contacted. Four vendors passed the initial
scoring criteria, and three of these were selected for finalist interviews (Error! Reference
source not found.).
o Deliverable: One vendor was selected as a partner to develop the GOSI
demonstration platform.
Task 2 - Identify use cases to be built into the GOSI platform: This task collected input
from various internal stakeholders in distribution operations to identify a specific set of
use cases to be built into the GOSI platform. Through the engagement with internal
stakeholders, PG&E developed an initial framework of what types of functionality the
GOSI platform would comprise at an enterprise level and selected the use cases that best
balanced the cost of demonstration (i.e., the integration and visualization of data) with
the overall benefits to end users.
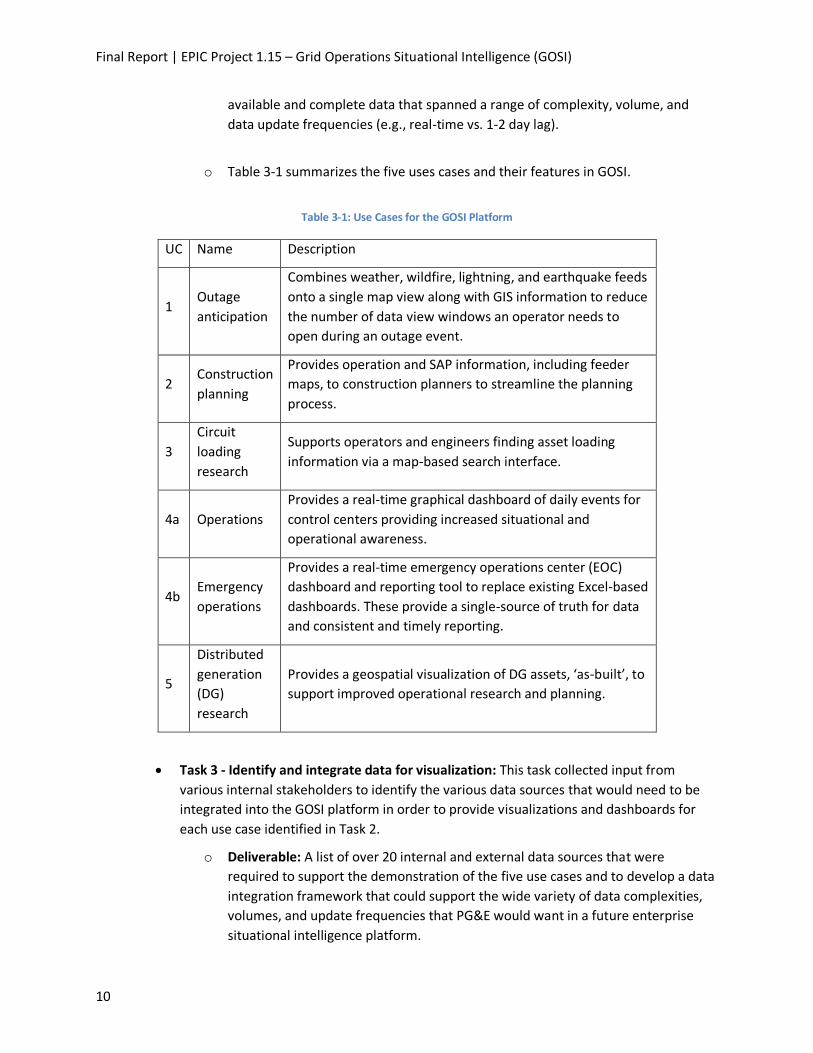
o Deliverable: Five use cases were selected to have specific workbenches and/or
customizable maps built into the GOSI platform. These use cases had the most
Final Report | EPIC Project 1.15 – Grid Operations Situational Intelligence (GOSI)
10
available and complete data that spanned a range of complexity, volume, and
data update frequencies (e.g., real-time vs. 1-2 day lag).
o Table 3-1 summarizes the five uses cases and their features in GOSI.
Table 3-1: Use Cases for the GOSI Platform
UC Name Description
1 Outage
anticipation
Combines weather, wildfire, lightning, and earthquake feeds
onto a single map view along with GIS information to reduce
the number of data view windows an operator needs to
open during an outage event.
2 Construction
planning
Provides operation and SAP information, including feeder
maps, to construction planners to streamline the planning
process.
3
Circuit
loading
research
Supports operators and engineers finding asset loading
information via a map-based search interface.
4a Operations
Provides a real-time graphical dashboard of daily events for
control centers providing increased situational and
operational awareness.
4b Emergency
operations
Provides a real-time emergency operations center (EOC)
dashboard and reporting tool to replace existing Excel-based
dashboards. These provide a single-source of truth for data
and consistent and timely reporting.
5
Distributed
generation
(DG)
research
Provides a geospatial visualization of DG assets, ‘as-built’, to
support improved operational research and planning.
Task 3 - Identify and integrate data for visualization: This task collected input from
various internal stakeholders to identify the various data sources that would need to be
integrated into the GOSI platform in order to provide visualizations and dashboards for
each use case identified in Task 2.
o Deliverable: A list of over 20 internal and external data sources that were
required to support the demonstration of the five use cases and to develop a data
integration framework that could support the wide variety of data complexities,
volumes, and update frequencies that PG&E would want in a future enterprise
situational intelligence platform.

Final Report | EPIC Project 1.15 – Grid Operations Situational Intelligence (GOSI)
11
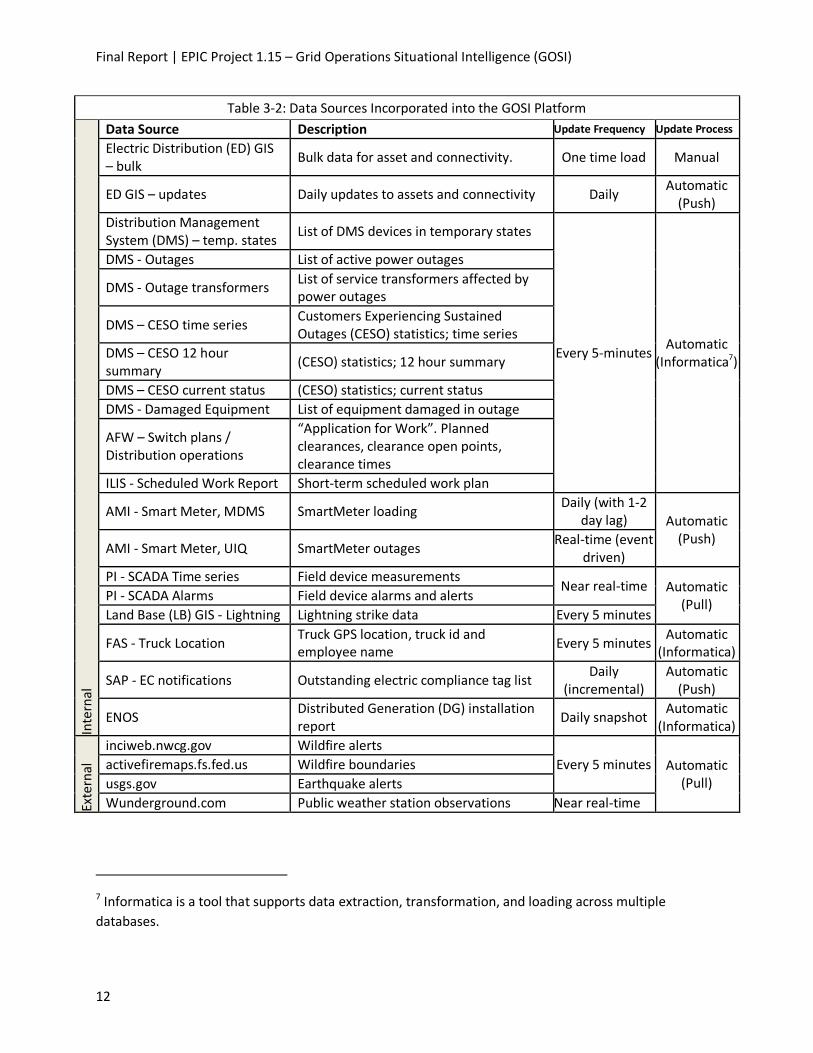
o 2-2 summarizes the data streams included, as well as the frequency with which
the data was updated.
Final Report | EPIC Project 1.15 – Grid Operations Situational Intelligence (GOSI)
12
Table 3-2: Data Sources Incorporated into the GOSI Platform
Data Source Description Update Frequency Update Process
Inte
rnal
Electric Distribution (ED) GIS – bulk
Bulk data for asset and connectivity. One time load Manual
ED GIS – updates Daily updates to assets and connectivity Daily Automatic
(Push)
Distribution Management System (DMS) – temp. states
List of DMS devices in temporary states
Every 5-minutes Automatic
(Informatica7)
DMS - Outages List of active power outages
DMS - Outage transformers List of service transformers affected by power outages
DMS – CESO time series Customers Experiencing Sustained Outages (CESO) statistics; time series
DMS – CESO 12 hour summary
(CESO) statistics; 12 hour summary
DMS – CESO current status (CESO) statistics; current status
DMS - Damaged Equipment List of equipment damaged in outage
AFW – Switch plans / Distribution operations
“Application for Work”. Planned clearances, clearance open points, clearance times
ILIS - Scheduled Work Report Short-term scheduled work plan
AMI - Smart Meter, MDMS SmartMeter loading Daily (with 1-2
day lag) Automatic (Push)
AMI - Smart Meter, UIQ SmartMeter outages Real-time (event
driven)
PI - SCADA Time series Field device measurements Near real-time Automatic
(Pull) PI - SCADA Alarms Field device alarms and alerts
Land Base (LB) GIS - Lightning Lightning strike data Every 5 minutes
FAS - Truck Location Truck GPS location, truck id and employee name
Every 5 minutes Automatic
(Informatica)
SAP - EC notifications Outstanding electric compliance tag list Daily
(incremental) Automatic
(Push)
ENOS Distributed Generation (DG) installation report
Daily snapshot Automatic
(Informatica)
Exte
rnal
inciweb.nwcg.gov Wildfire alerts
Every 5 minutes Automatic (Pull)
activefiremaps.fs.fed.us Wildfire boundaries
usgs.gov Earthquake alerts
Wunderground.com Public weather station observations Near real-time
7 Informatica is a tool that supports data extraction, transformation, and loading across multiple
databases.
Final Report | EPIC Project 1.15 – Grid Operations Situational Intelligence (GOSI)
13
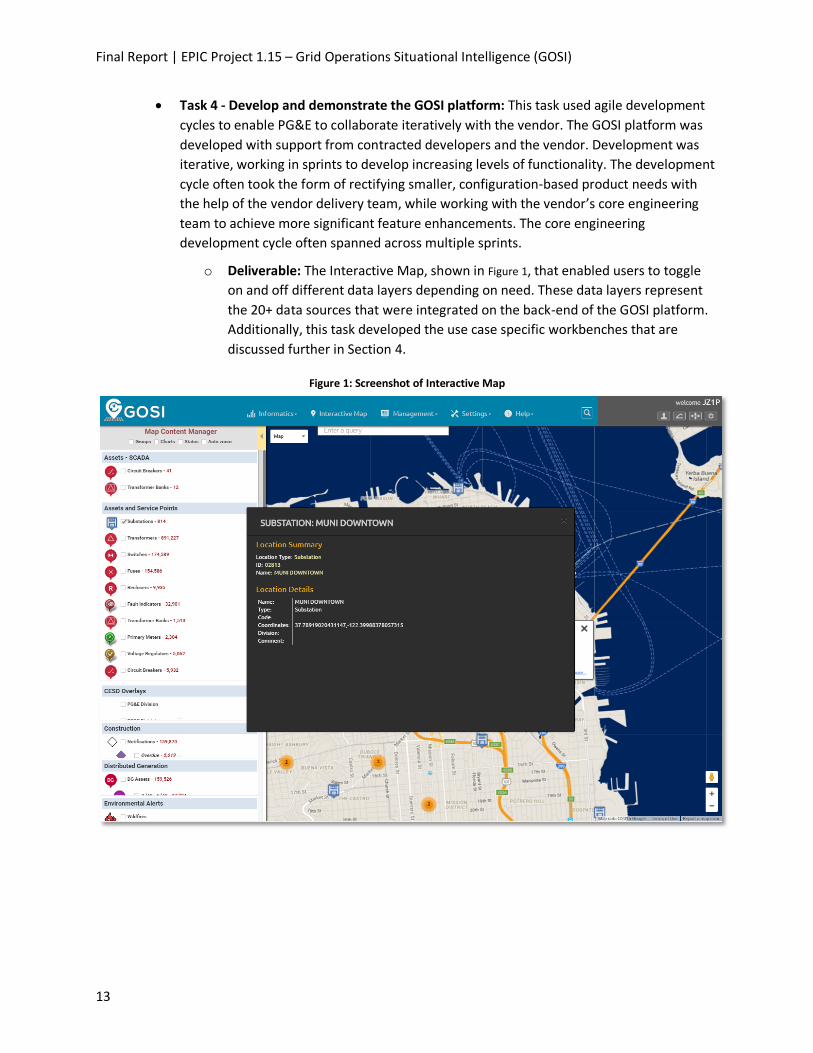
Task 4 - Develop and demonstrate the GOSI platform: This task used agile development
cycles to enable PG&E to collaborate iteratively with the vendor. The GOSI platform was
developed with support from contracted developers and the vendor. Development was
iterative, working in sprints to develop increasing levels of functionality. The development
cycle often took the form of rectifying smaller, configuration-based product needs with
the help of the vendor delivery team, while working with the vendor’s core engineering
team to achieve more significant feature enhancements. The core engineering
development cycle often spanned across multiple sprints.
o Deliverable: The Interactive Map, shown in Figure 1, that enabled users to toggle
on and off different data layers depending on need. These data layers represent
the 20+ data sources that were integrated on the back-end of the GOSI platform.
Additionally, this task developed the use case specific workbenches that are
discussed further in Section 4.
Figure 1: Screenshot of Interactive Map
Final Report | EPIC Project 1.15 – Grid Operations Situational Intelligence (GOSI)
14
4 Project Results and Key Findings
The project’s objective was to develop a platform on which features could be built to enable valuable
analytics and situational awareness use cases. The core success of the project was demonstrating the
capability to ingest and visualize data to improve operational decision-making. This section summarizes
the project’s technical results and key findings.
4.1 Successful data integration into vendor’s system
An integral step to the success of this technology demonstration project was the ability to extract and
integrate data streams from over 20 internal and external sources into the vendor’s proprietary backend
software system. Additionally, the data being ingested had to be updated with some frequency in order
for the visualization tool to provide near real-time information. Due to the project nature of this project,
varying data integration patterns were used. Some data sources required manual extracts to then be
pushed to the vendor’s system, while others were automatically pulled from or pushed to the system.
Table 3-2 summarizes the types of processes used to update different data source extract.
PG&E also learned a variety of lessons regarding important qualities of a data aggregation and
visualization system, which will benefit the company when exploring production
4.2 Successful Demonstration of the Interactive Map and Use Case Workbenches
After data were integrated into the software’s backend system, the vendor developed the various
visualization capabilities, based on PG&E’s specifications. The data visualizations and other functionality
of the GOSI platform were iteratively developed based on end user testing and feedback.
4.2.1 Use Case 1: Outage Anticipation / Interactive Map
The demonstration of use case one required the integration of all of the data sources listed in
Table 3-2 and created the Interactive Map, the primary tool for data visualization and a core
functionality component on the GOSI platform.
The Interactive Map was designed to solve a key problem for grid operators: data necessary to
understand a complex situation required multiple windows to be open on an operators’ screen,
and sometimes was not available at all. The operator would, for example, need to compare side by
side a map of utilities assets with information about a developing wildfire, to determine if assets
were endangered.
The Interactive Map addressed this gap by visualizing the data in a set of layers, allowing for
improved analysis as users generated custom data views. Distribution operators could select data
sources to be toggled on and off, allowing for a highly configurable situational awareness during
outage scenarios. This approach allowed users to visualize the data sources that were specifically
relevant to their current situation, while hiding non-pertinent data streams. For example, an
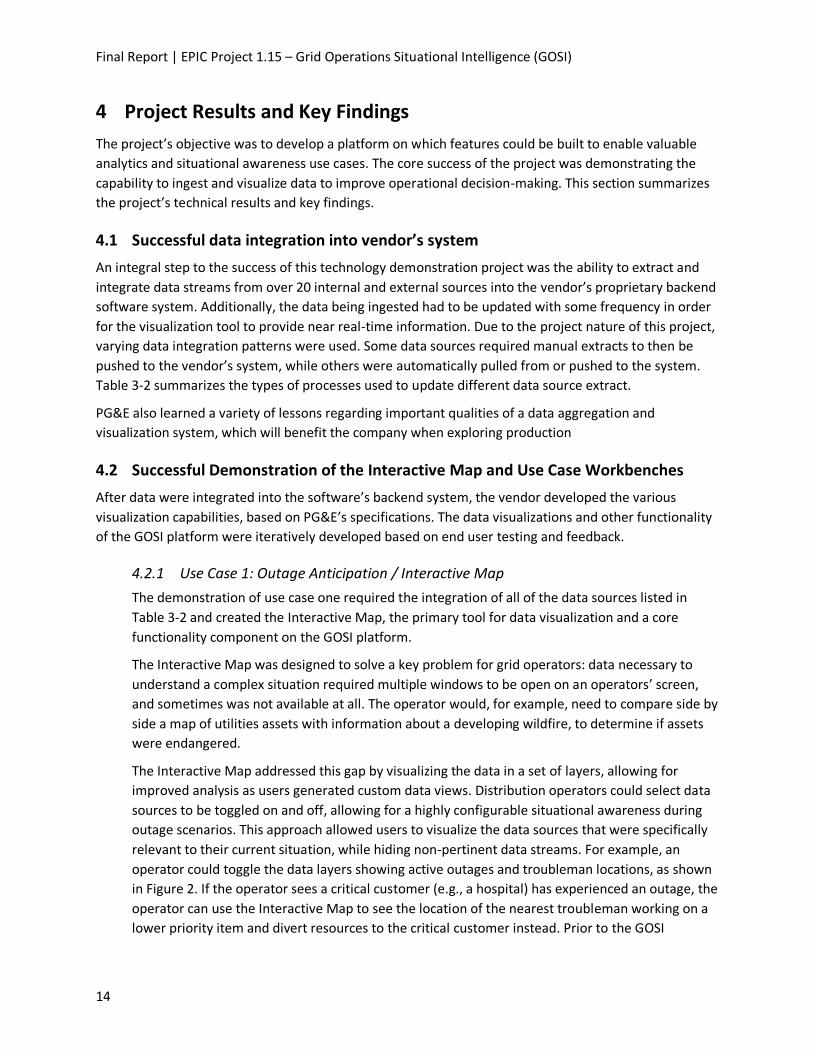
operator could toggle the data layers showing active outages and troubleman locations, as shown
in Figure 2. If the operator sees a critical customer (e.g., a hospital) has experienced an outage, the
operator can use the Interactive Map to see the location of the nearest troubleman working on a
lower priority item and divert resources to the critical customer instead. Prior to the GOSI
Final Report | EPIC Project 1.15 – Grid Operations Situational Intelligence (GOSI)
15
platform, operators had to manually compare the PG&E asset database displayed via a GIS-
enabled map with external weather maps to plan for potential outages.
Figure 2: Screenshot of Interactive Map with Outages and Troublemen Data Layers
Additionally, the Interactive Map demonstrated the value of integrating new external data sources
such as Google Streetview. Previously, users had to spend time and energy guiding field personnel
to equipment of interest. By providing personnel in operations centers with access to street-level
views, the GOSI platform enabled operators to offer improved support to field personnel.
A sample of additional scenarios where users could benefit from a customized map includes:
By displaying weather, lightning strikes, and map views from SmartMeter outage alerts, a
user could quickly infer if a recent outage was likely caused by a lightning strike. The
responding field crews could then be notified to take appropriate action, reducing the
duration and severity of the outage.
By displaying wildfire boundary data, asset information (GIS), and troubleman locations
during a wildfire emergency event, a user could ensure that all crews were safely out of
the fire boundary area. Then the user could begin making switching decisions based on
which assets where already likely consumed by the fire and which assets were likely to be
destroyed based on the projected growth of the wildfire boundary.
Final Report | EPIC Project 1.15 – Grid Operations Situational Intelligence (GOSI)
16
By viewing the GIS asset layer combined with Google StreetView, a user could
electronically trace a circuit and then zoom in to see the StreetView image of a specific
device. This could be used to field-verify a device in GIS for a Troubleman in the field
attempting to locate a device by providing specific visual identifiers.
Additional information about the functionality and features of the GOSI platform can be found in
Appendix B – Introduction Guide to Using GOSI, a guide which was creating for operational
personnel testing the system.
4.2.2 Use Case 2: Construction Planning
When construction planners are scheduling assignments, there is a prioritized list of necessary
jobs. However, a piece of work at the top of the priority list might be in the same location as
several pieces of work that are farther down the list. For example, construction planners used the
Distribution Asset Reconciliation Tool (DART), which is a software tool use to modify electric
distribution facility information, to give them visibility into assets, however the system only
showed asset locations and planners had to access another database to determine where
construction tags were on the system. Additionally, DART only showed assets “as built” with no
information about “as switched” assets. It was a challenge for construction planners to sort
through vast and isolated data sets and understand work optimization opportunities. The lack of
knowledge on switching operations made clearance for construction more difficult for operators.
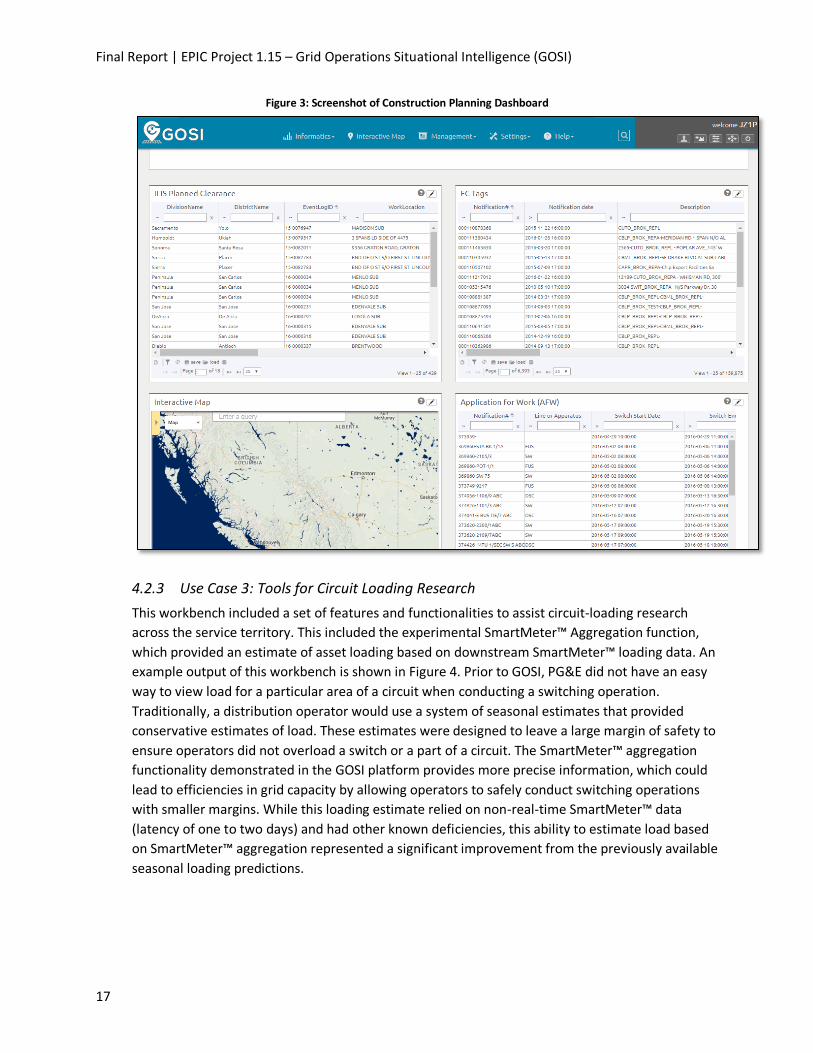
The workbench developed for this use case allowed construction planners to view relevant data in
one window (see Fig. 3: Screenshot of Construction Planning Dashboard). This dashboard enabled
easier optimization of construction work planning and execution by allowing the user to
potentially consolidate work on nearby assets for one clearance tag. By providing situational
awareness via the construction planning dashboard, work could be grouped and optimized.
Grouping tickets and bundling work in this way helps reduce the number of planned, construction-
related electricity outages experienced by customers.
Final Report | EPIC Project 1.15 – Grid Operations Situational Intelligence (GOSI)
17
Figure 3: Screenshot of Construction Planning Dashboard
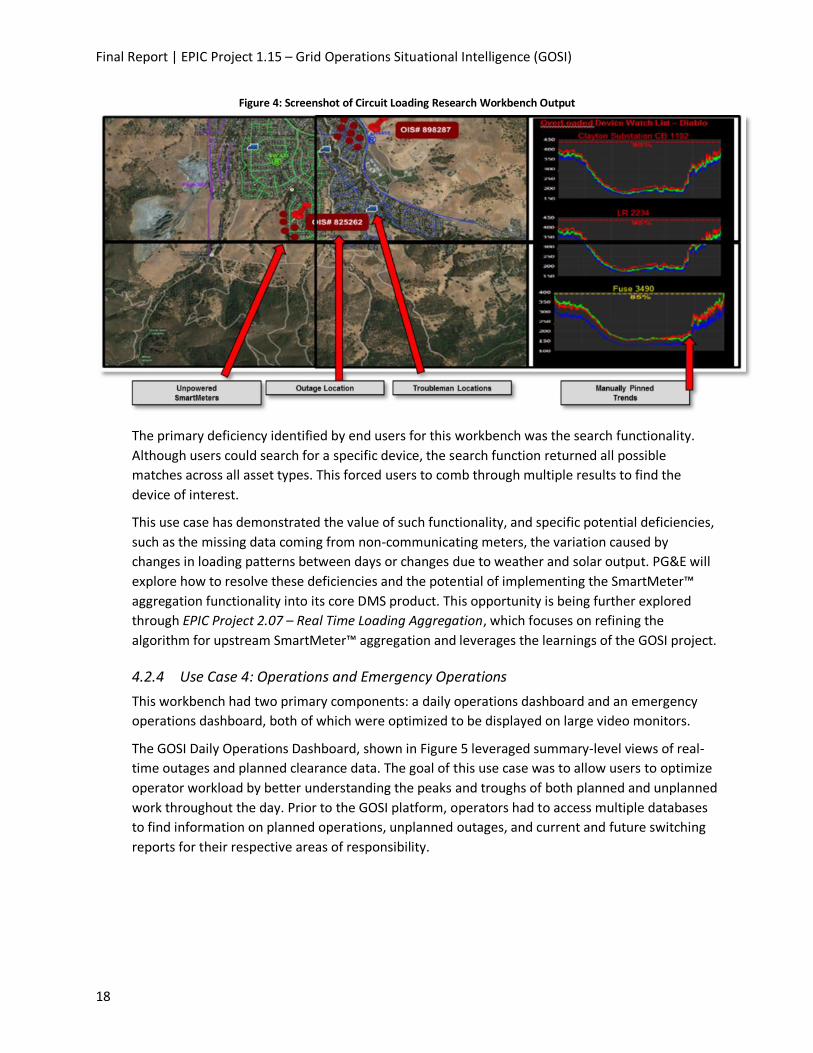
4.2.3 Use Case 3: Tools for Circuit Loading Research
This workbench included a set of features and functionalities to assist circuit-loading research
across the service territory. This included the experimental SmartMeter™ Aggregation function,
which provided an estimate of asset loading based on downstream SmartMeter™ loading data. An
example output of this workbench is shown in Figure 4. Prior to GOSI, PG&E did not have an easy
way to view load for a particular area of a circuit when conducting a switching operation.
Traditionally, a distribution operator would use a system of seasonal estimates that provided
conservative estimates of load. These estimates were designed to leave a large margin of safety to
ensure operators did not overload a switch or a part of a circuit. The SmartMeter™ aggregation
functionality demonstrated in the GOSI platform provides more precise information, which could
lead to efficiencies in grid capacity by allowing operators to safely conduct switching operations
with smaller margins. While this loading estimate relied on non-real-time SmartMeter™ data
(latency of one to two days) and had other known deficiencies, this ability to estimate load based
on SmartMeter™ aggregation represented a significant improvement from the previously available
seasonal loading predictions.
Final Report | EPIC Project 1.15 – Grid Operations Situational Intelligence (GOSI)
18
Figure 4: Screenshot of Circuit Loading Research Workbench Output
The primary deficiency identified by end users for this workbench was the search functionality.
Although users could search for a specific device, the search function returned all possible
matches across all asset types. This forced users to comb through multiple results to find the
device of interest.
This use case has demonstrated the value of such functionality, and specific potential deficiencies,
such as the missing data coming from non-communicating meters, the variation caused by
changes in loading patterns between days or changes due to weather and solar output. PG&E will
explore how to resolve these deficiencies and the potential of implementing the SmartMeter™
aggregation functionality into its core DMS product. This opportunity is being further explored
through EPIC Project 2.07 – Real Time Loading Aggregation, which focuses on refining the
algorithm for upstream SmartMeter™ aggregation and leverages the learnings of the GOSI project.
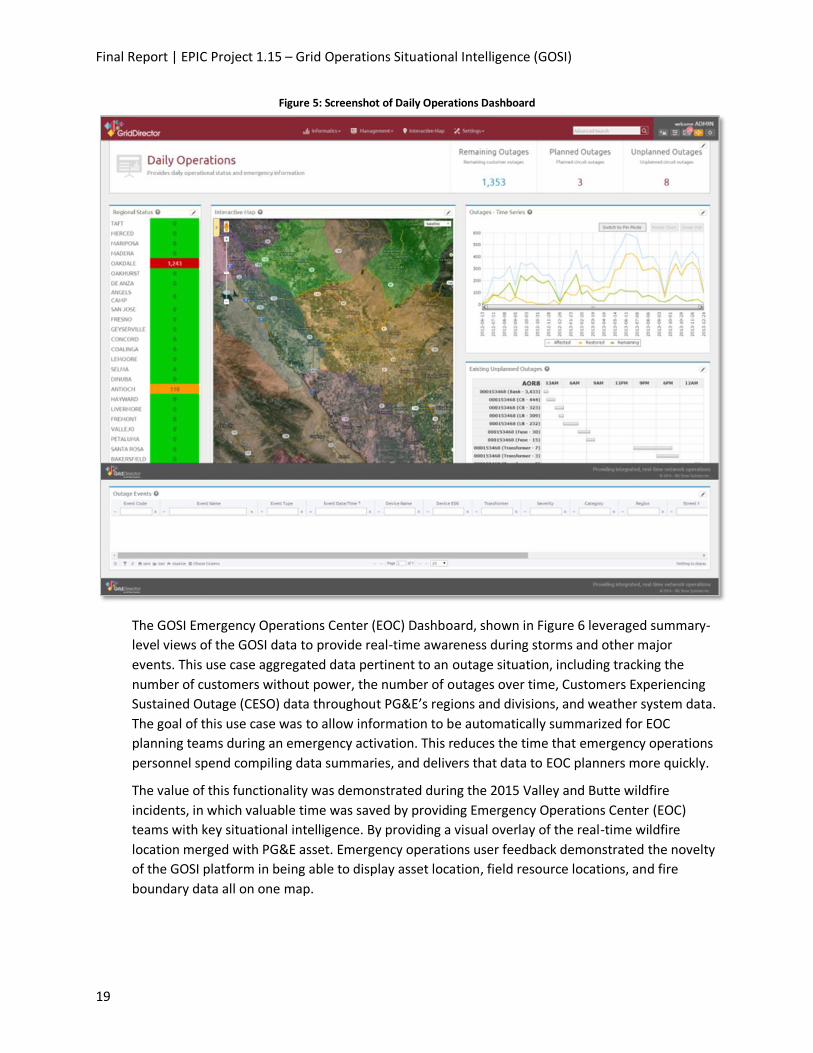
4.2.4 Use Case 4: Operations and Emergency Operations
This workbench had two primary components: a daily operations dashboard and an emergency
operations dashboard, both of which were optimized to be displayed on large video monitors.
The GOSI Daily Operations Dashboard, shown in Figure 5 leveraged summary-level views of real-
time outages and planned clearance data. The goal of this use case was to allow users to optimize
operator workload by better understanding the peaks and troughs of both planned and unplanned
work throughout the day. Prior to the GOSI platform, operators had to access multiple databases
to find information on planned operations, unplanned outages, and current and future switching
reports for their respective areas of responsibility.
Final Report | EPIC Project 1.15 – Grid Operations Situational Intelligence (GOSI)
19
Figure 5: Screenshot of Daily Operations Dashboard
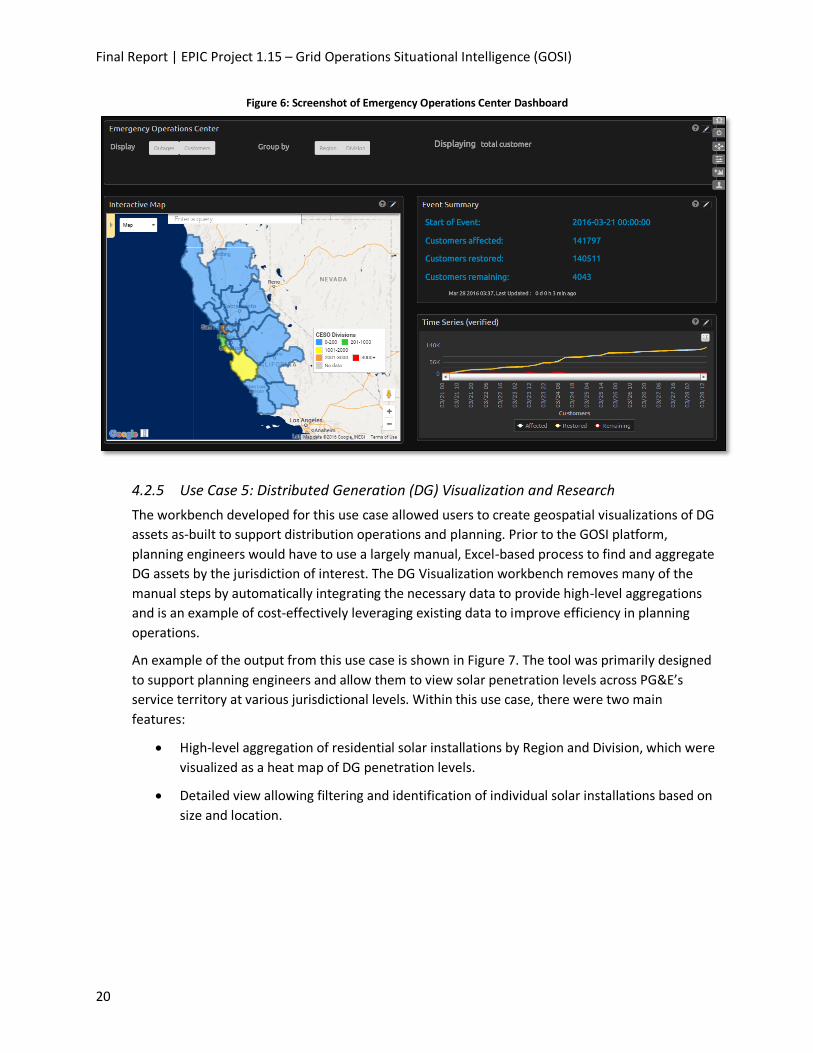
The GOSI Emergency Operations Center (EOC) Dashboard, shown in Figure 6 leveraged summary-
level views of the GOSI data to provide real-time awareness during storms and other major
events. This use case aggregated data pertinent to an outage situation, including tracking the
number of customers without power, the number of outages over time, Customers Experiencing
Sustained Outage (CESO) data throughout PG&E’s regions and divisions, and weather system data.
The goal of this use case was to allow information to be automatically summarized for EOC
planning teams during an emergency activation. This reduces the time that emergency operations
personnel spend compiling data summaries, and delivers that data to EOC planners more quickly.
The value of this functionality was demonstrated during the 2015 Valley and Butte wildfire
incidents, in which valuable time was saved by providing Emergency Operations Center (EOC)
teams with key situational intelligence. By providing a visual overlay of the real-time wildfire
location merged with PG&E asset. Emergency operations user feedback demonstrated the novelty
of the GOSI platform in being able to display asset location, field resource locations, and fire
boundary data all on one map.
Final Report | EPIC Project 1.15 – Grid Operations Situational Intelligence (GOSI)
20
Figure 6: Screenshot of Emergency Operations Center Dashboard
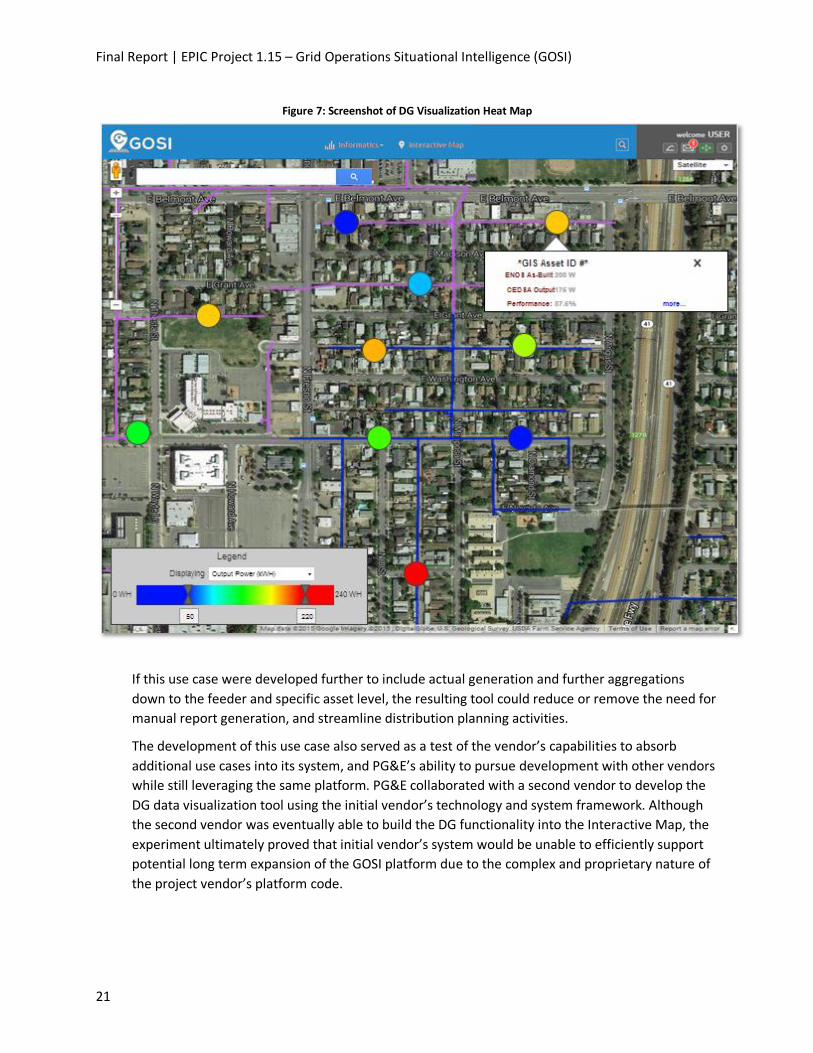
4.2.5 Use Case 5: Distributed Generation (DG) Visualization and Research
The workbench developed for this use case allowed users to create geospatial visualizations of DG
assets as-built to support distribution operations and planning. Prior to the GOSI platform,
planning engineers would have to use a largely manual, Excel-based process to find and aggregate
DG assets by the jurisdiction of interest. The DG Visualization workbench removes many of the
manual steps by automatically integrating the necessary data to provide high-level aggregations
and is an example of cost-effectively leveraging existing data to improve efficiency in planning
operations.
An example of the output from this use case is shown in Figure 7. The tool was primarily designed
to support planning engineers and allow them to view solar penetration levels across PG&E’s
service territory at various jurisdictional levels. Within this use case, there were two main
features:
High-level aggregation of residential solar installations by Region and Division, which were
visualized as a heat map of DG penetration levels.
Detailed view allowing filtering and identification of individual solar installations based on
size and location.
Final Report | EPIC Project 1.15 – Grid Operations Situational Intelligence (GOSI)
21
Figure 7: Screenshot of DG Visualization Heat Map
If this use case were developed further to include actual generation and further aggregations
down to the feeder and specific asset level, the resulting tool could reduce or remove the need for
manual report generation, and streamline distribution planning activities.
The development of this use case also served as a test of the vendor’s capabilities to absorb
additional use cases into its system, and PG&E’s ability to pursue development with other vendors
while still leveraging the same platform. PG&E collaborated with a second vendor to develop the
DG data visualization tool using the initial vendor’s technology and system framework. Although
the second vendor was eventually able to build the DG functionality into the Interactive Map, the
experiment ultimately proved that initial vendor’s system would be unable to efficiently support
potential long term expansion of the GOSI platform due to the complex and proprietary nature of
the project vendor’s platform code.
Final Report | EPIC Project 1.15 – Grid Operations Situational Intelligence (GOSI)
22
4.3 Agile Development Promoted Frequent Feedback Collection and Iterations
The GOSI platform was developed using an iterative, agile approach. This agile approach allowed PG&E
to test the GOSI technology in a lean and efficient way, leveraging minimum viable products to collect
regular, real end-user feedback and improve future iterations. This feedback collection took many
forms, including informal on-site sessions, training sessions, and “lunch and learns”. These interactions
helped to solidify an understanding of the features and functions that users valued most. For example,
in one feedback session, users identified the need to have a search functionality that could help them
quickly view a particular asset. This capability was built into a later iteration of the GOSI platform.
In another example, feedback from GOSI users yielded the potential value of including brand new data
sets, such as California Highway Patrol (CHP) car-pole8 data into the GOSI platform, with operators
suggesting that this data might allow them to shave valuable minutes off of the outage diagnosis and
restoration process. When a car hits a power pole and causes an outage, typically a call is first made to
911 and the incident is flagged in the CHP database. When an operator sees an unexpected outage on
the system, typically the first check is to cross-reference the location with the CHP database to see if
there was a car-pole. When end users were shown the lightning strike data layer in the Interactive Map
during the feedback sessions, they noted that a similar data layer could be created to overlay car-pole
data from CHP onto outage data. While this ultimately was not implemented into the project GOSI
platform due to prioritization during the limited time length of the project demonstration, this example
demonstrates the value of agile development. By quickly developing minimal, but functional parts of the
overall platform that users could actually test, users’ perspectives shifted regarding the potential of the
tool. This allowed users to identify additional data streams and use cases that were not initially
identified through user input sessions or through interaction with only screenshots of the platform’s
functionality.
Overall, user feedback was positive for the GOSI platform, especially the ability to view multiple data
streams at once using the Interactive Map. The feedback collection process also identified a number of
opportunities for improvement, such as the car-pole example discussed above, that could make future
versions of GOSI more user-friendly and effective. The project tracked and prioritized these ideas
through its product backlog. This also yielded a set of potential features and enhancements that did not
fit within the direct scope of this EPIC project, but may be used to inform future analytics and situational
awareness product requirements (Appendix A – Out of Scope Stories).
4.4 Data Access
Upon request, PG&E will provide access to data collected that is consistent with the CPUC's data access
requirements for EPIC data and results.
8 When a car hits a power pole and causes an outage.
Final Report | EPIC Project 1.15 – Grid Operations Situational Intelligence (GOSI)
23
5 Unique Technology Implementation Issues
5.1 Challenges in Maintaining Diverse Data Sources This technology demonstration project is unique in both the volume of data being integrated into one
platform, but also in the variation among the individual data sources. Not only did each data stream
need to be integrated into the vendor’s backend system, nearly all of the data sources needed to be
updated with some frequency in order for the visualization tool to provide fresh and accurate
information. Due to the nature of this project, varying data integration patterns were used. Some data
sources required manual extracts to then be pushed to the vendor’s system, while others were
automatically pulled from or pushed to the system. These data extract processes are summarized in
Error! Reference source not found..
Platform Architecture was critical to GOSI’s data processing performance. In the pilot, a single data
router within the vendor system architecture proved to be one of the main contributing bottlenecks for
the system performance. This design degraded the performance of the data throughput.
For a future enterprise platform, data velocity, volume and other performance characteristics should be
evaluated in detail. Any future state of the GOSI platform should streamline and automate the data
extract process and develop a backend system that could pull in updated data, rather than depending
on manual updates or new data extracts being pushed to the system.
In addition to the challenge of keeping a variety of data sources updated, another significant challenge
was the initial integration of this wide variety of data. Each set of data has its own unique properties,
and responds to changes in a unique way, which, if not correctly interpreted at the beginning of a
project, can lead to significant data errors later on. One example of this scenario was that a few external
data sets containing event data did not indicate the termination of those events. So while internal
outage data sends an ending message signifying that power has been restored, and GOSI can remove
the outage from the visualization, some data sets simply stopped transmitting, leaving a decision that
had to be made whether to keep displaying the data. During the GOSI project, the imported wildfire
data set would share the location of large wildfires, but once that fire was extinguished, there was no
“fire out” message. The vendor solution did not recognize this challenge at first, which inadvertently led
to a number of old fires being displayed in the visualization screen. The final solution for this was to
create a timer that leveraged business rules to determine when “stale” data could be closed out and
removed from the visualization display.
The project identified many metadata gaps in source data, such as discrepancies in entity naming across
various source systems. These discrepancies impacted aggregated data across multiple use cases in the
pilot. Some of these issues had never manifested themselves before as this was the first time that these
data sources had been combined in this way.
Any future state of the GOSI platform should leverage a data quality assurance system to ensure the
consistency of source data and metadata. In addition, deep engagement with data-owners and subject
matter experts can help explain the unique behaviors of each data set, ensuring that differing data
behaviors do not manifest themselves in displaying inaccurate information.
Final Report | EPIC Project 1.15 – Grid Operations Situational Intelligence (GOSI)
24
5.2 Challenges in Visualizing Data and Verifying Data Accuracy With Users
Given the volume and complexity of data streams being integrated and updated into the vendor’s
proprietary backend software, as well as the iterative nature of the GOSI platform’s development, it was
difficult to compare the data visualizations with their source data. Using the agile development method,
PG&E, in collaboration with the vendor, would develop a feature that was minimally operational to be
tested and assessed by end users. Sometimes, a feature would appear to be providing the desired
functionality and would pass tests designed to verify that it was behaving as designed. Testing was
typically manual in nature therefore took a long time to execute.
Despite passing these tests, the output of the feature would show incorrect data. Through the frequent
user tests and feedback collection mechanisms, it was the end users who would eventually identify the
issue of a feature displaying the incorrect data.
Any future state of the GOSI platform, or other projects integrating and visualizing large volumes of data
from different sources, should develop a process to verify the accuracy of the data being displayed to
end users at each stage the data are manipulated. These stages include, but are not limited to: when the
data are transferred from PG&E’s systems to the vendor’s software system, after the data are cleaned,
and after any formatting or other manipulations that are required to visualize the data for end use.
Potential tactics to assist with user engagement, testing, and data verification, include automated
testing and sophisticated visualization capabilities.
5.2.1 Automated Testing
In support of delivering a clearer user experience and verifiable data, future development of the
GOSI platform should employ automated testing as a cornerstone to a robust Quality Assurance
program. Test automation could allow for individual software components to be repeatedly and
reliably tested, at scale, at every point in the development process. As well as identifying software
issues that might lead to inconsistencies in data being displayed to end-users, this could reduce
the burden of manual testing while also identifying bugs introduced through incremental
development of new and existing features under an agile process.
5.2.2 Visualization Sophistication
A related priority to data verification is the sophistication of the visualization software. Without
appropriate display of data for users, it cannot be verified effectively. Utilities manage and interact
with a large number and variety of assets, and standard visualization packages may be inadequate
to support visualization capability requirements. Examples of this issue include:
Rendering Circuits at Scale: distribution circuit topology is the backbone of any
distribution operations application, illustrating connectivity of assets from the substation
to each individual customer. Viewing this information in an appropriate fashion is
paramount for operations personnel. Modeling and visualizing this density of lines caused
performance issues that impacted user experience, resulting in both client and
server issues.
Obstructing Clusters: If a number of assets in a given data layer were located close to each
other, they obscured the view of the area. The project’s solution was to develop grouped
Final Report | EPIC Project 1.15 – Grid Operations Situational Intelligence (GOSI)
25
clusters, showing the total number of assets in the cluster. However, not being able to
differentiate between types of assets in the cluster (e.g. reporting 9 assets, instead of
indicating 3 service transformers, 5 meters, and a troubleman) led to a suboptimal level of
visual detail.
Utilities considering visualization platforms should be expansive in their requirements for
visualization sophistication because of the uniquely complex and voluminous nature of the data
sets. This is particularly important for engaging users whose expectations have been set by
intuitive products like GoogleMaps and Uber. These UIs represent complex geospatial information
at scale in an intuitive fashion, and utilities should benchmark themselves against such products.
5.3 Applying the Agile Development Method Without User Analytics
Due to challenges ensuring that all data shown was correct and could be acted on, PG&E was unable to
collect quantitative user analytics, such as click-rates and data on which features were most widely
used. In order to iteratively test and develop the GOSI platform, the product team had to rely on
qualitative feedback provided by end users. Measurable data on tool use is an important aspect of agile
development, as it allows developers to compare and benchmark actual use to user-provided feedback.
Any future state of the GOSI platform, or other projects using agile development, should enable the
collection of quantitative user analytics.
Final Report | EPIC Project 1.15 – Grid Operations Situational Intelligence (GOSI)
26
6 Key Accomplishments and Future Opportunities
6.1 Key Accomplishments
The following is a summary of the key accomplishments of the project:
Integrated data streams from over 20 sources, in addition to developing and maintaining a
system to provide updated data extracts from each source.
Developed and demonstrated a visualization tool that enabled users to customize a map with
various data layers depending on their specific use case.
Developed custom data visualization tools for five specific use cases to respond to specific
concerns identified by PG&E.
Demonstrated the effectiveness of using an agile development method for this type of
technology demonstration project.
6.2 Future Opportunities
6.2.1 Potential Features for Future Versions of the GOSI Platform
A repeated theme during the feedback collection sessions was that some users require the ability
to explore deeper into the data to perform specific analyses. Future versions of the GOSI platform
or other situational awareness tools would benefit from leveraging the wide variety of data
sources by creating an export functionality for data to be further analyzed and distributed.
In addition to the use cases and features that were developed as part of the project, information
collected before, during, and after the GOSI project was captured and documented as part of an
extensive backlog of product requirements that reflects learnings from throughout the GOSI
project. The backlog can be used to inform future requirements for data analytics and situational
awareness projects.
This backlog is a valuable resource for electric utility teams designing a scalable, enterprise-wide
advanced operational data analytics and visualization platform, and includes additional use cases
beyond the five tested during the GOSI Project. Details from this backlog can be found in Appendix
A – Out of Scope Stories.
In addition to developing more use cases and features, a key consideration for future versions of
the GOSI platform is who will lead the development. PG&E will continue to conduct an analysis of
the marketplace to assess whether there are vendors that could deliver a tool to its full
specifications. Additionally, there is the potential to build out the platform in-house, although this
would require significant investment in software development assets.
Final Report | EPIC Project 1.15 – Grid Operations Situational Intelligence (GOSI)
27
7 Value proposition
7.1 EPIC Primary and Secondary Principles
This project advances several EPIC primary and secondary principles by providing a single platform for
user to holistically visualize over 20 data sources that are integral to distribution operations and
planning. The information presented in the Interactive Map and through the use case modules enables
grid operators to collect and visualize many disparate data sources to deliver more actionable situational
awareness. Table 7-1 summarizes the specific primary and secondary EPIC Guiding Principles advanced
by this technology demonstration project.
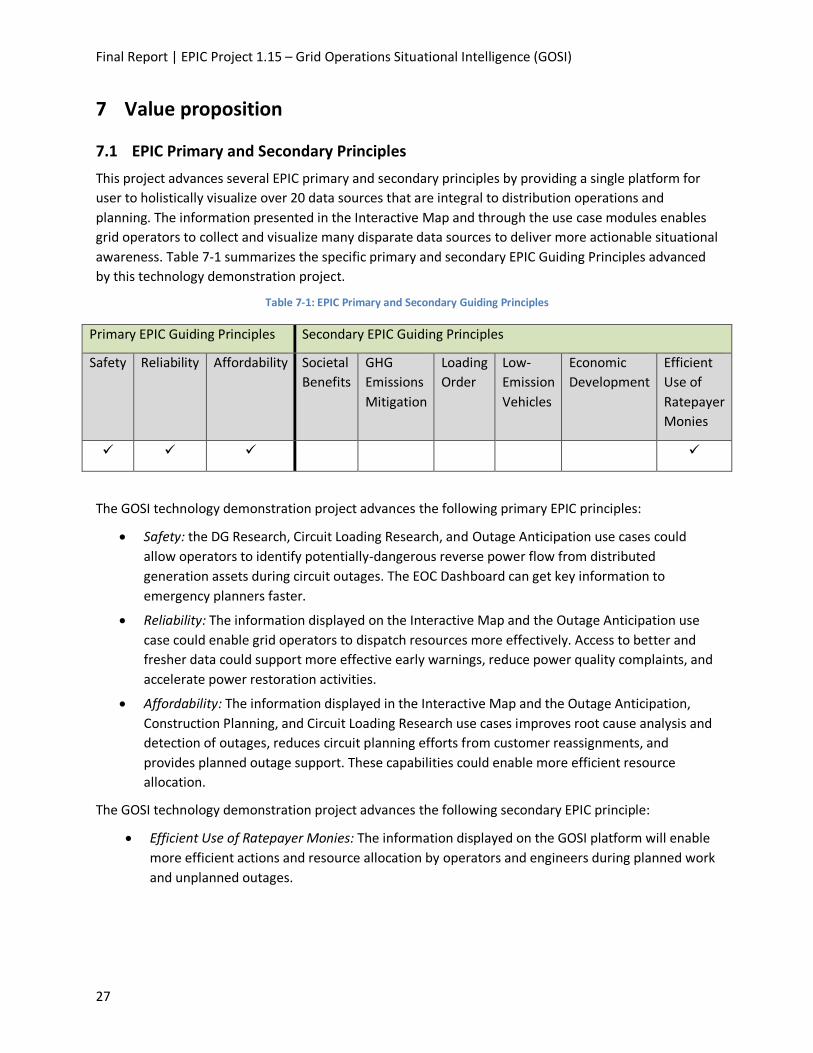
Table 7-1: EPIC Primary and Secondary Guiding Principles
Primary EPIC Guiding Principles Secondary EPIC Guiding Principles
Safety Reliability Affordability Societal
Benefits
GHG
Emissions
Mitigation
Loading
Order
Low-
Emission
Vehicles
Economic
Development
Efficient
Use of
Ratepayer
Monies
The GOSI technology demonstration project advances the following primary EPIC principles:
Safety: the DG Research, Circuit Loading Research, and Outage Anticipation use cases could
allow operators to identify potentially-dangerous reverse power flow from distributed
generation assets during circuit outages. The EOC Dashboard can get key information to
emergency planners faster.
Reliability: The information displayed on the Interactive Map and the Outage Anticipation use
case could enable grid operators to dispatch resources more effectively. Access to better and
fresher data could support more effective early warnings, reduce power quality complaints, and
accelerate power restoration activities.
Affordability: The information displayed in the Interactive Map and the Outage Anticipation,
Construction Planning, and Circuit Loading Research use cases improves root cause analysis and
detection of outages, reduces circuit planning efforts from customer reassignments, and
provides planned outage support. These capabilities could enable more efficient resource
allocation.
The GOSI technology demonstration project advances the following secondary EPIC principle:
Efficient Use of Ratepayer Monies: The information displayed on the GOSI platform will enable
more efficient actions and resource allocation by operators and engineers during planned work
and unplanned outages.
Final Report | EPIC Project 1.15 – Grid Operations Situational Intelligence (GOSI)
28
7.1.1 Apply Business Logic to Raw Data Visualization The GOSI platform provides visualization of raw data, but the end user still has to synthesize the
data in order to develop actionable insights. This tool can further be expanded by applying
business logic and other “rules” to provide initial insights from the raw data. This added layer of
synthesis could lead to improved decision making by extending the point at which the end user is
required to interpret the data.
An example of this would be a future dashboard for critical operating equipment (COE). When a
piece of equipment fails, but does not cause an outage because the system is able to reconfigure
and backfeed customers, the system is said to be in an abnormal operating condition. Because this
does not need to be fixed immediately (as compared to an equipment failure that causes an
outage) the equipment is flagged as a COE. At the time the equipment is flagged, PG&E assigns a
priority level, which informs the timing for repair; however the grid is very dynamic and the static
priority tag for a COE is not sufficient to reflect how changes to the grid would change the priority
level of a given COE tag. An example of business logic that could be applied to the raw data of COE
tags is a basic algorithm that can build a risk score by feeder (i.e., leveraging risk factors such as:
number of customers downstream of the COE, other COE tags on that feeder, safety for Critical
and Essential customers such as schools or hospitals, etc.) that is updated daily and displayed on a
map. This would allow PG&E to work on COE tags that would remove the most risk from the
system on a given day.
7.2 Improving Industry Awareness
7.2.1 Adaptability to Other Utilities / Industry
The following findings of this project are relevant and adaptable to other utilities and the industry:
Agile Development: The GOSI project demonstrated the potential value of agile
development as a software development practice. By focusing on customer feedback and
iterative development, agile software development allows for teams to optimize their
development process in a way that delivers the most value to customers. PG&E plans to
consider using this methodology, where appropriate, for other advanced software
development efforts. PG&E and other utilities should consider what practices they can
enact in order to make themselves more agile, and what “traditional” enterprise project
management practices hinder their ability to ultimately produce product that is useful to
end users.
Consideration for Open Environment Stack9 Components: As PG&E and other utilities
move towards more advanced systems for situational intelligence; the development
architecture is an important choice when building products using an agile methodology.
Given the potential complexity posed by a large scale analytics platform, the adoption of
9 A “stack” is the term used in PG&E’s reference architecture and refers to a group of functional
components.
Final Report | EPIC Project 1.15 – Grid Operations Situational Intelligence (GOSI)
29
open environment stack components that promote a scalable and flexible architecture
should be considered and assessed during the project’s early planning and development
phase. An open environment architecture is a combination of vendor software, open
source software, and custom built software. Software from any of these three categories
can fulfill specific functional requirements within the overall IT environment, with the key
assumption that as the environment evolves, these components also evolve and are either
further developed or replaced completely as better and/or cheaper technology becomes
available. Orchestrating these synergies on an enterprise scale requires an open
environment to enable the use of different technologies and the streamlined integration
between each stack component.
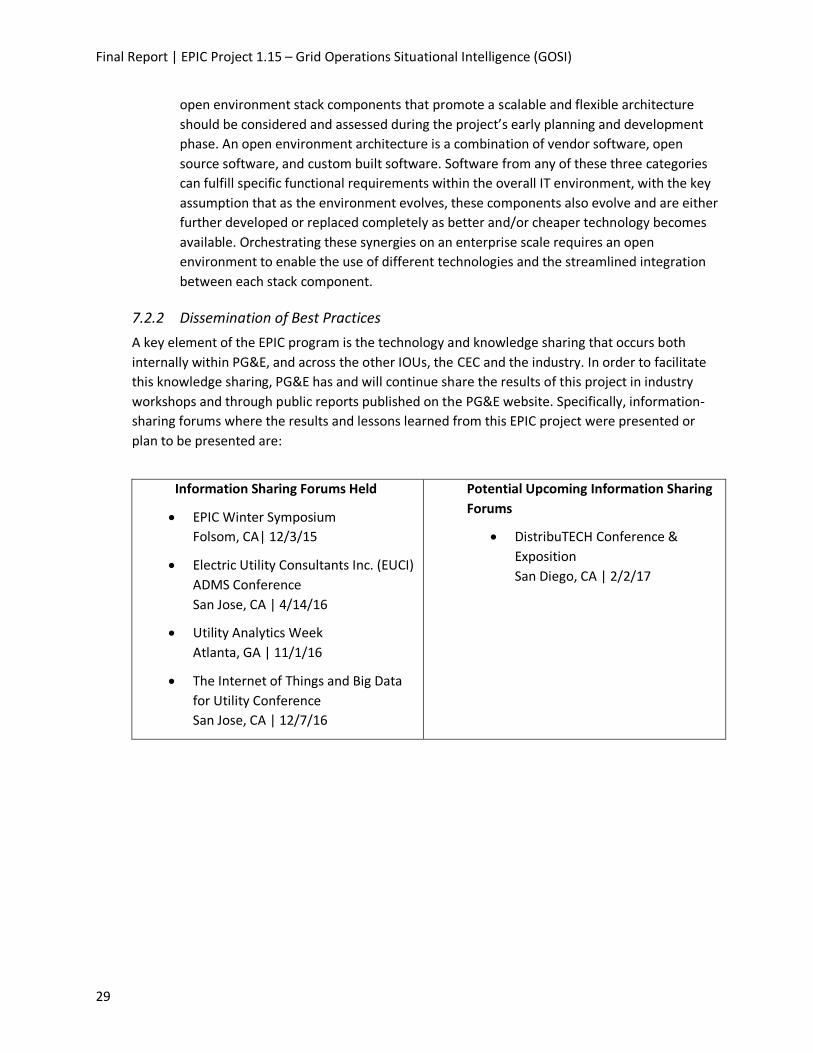
7.2.2 Dissemination of Best Practices
A key element of the EPIC program is the technology and knowledge sharing that occurs both
internally within PG&E, and across the other IOUs, the CEC and the industry. In order to facilitate
this knowledge sharing, PG&E has and will continue share the results of this project in industry
workshops and through public reports published on the PG&E website. Specifically, information-
sharing forums where the results and lessons learned from this EPIC project were presented or
plan to be presented are:
Information Sharing Forums Held
EPIC Winter Symposium
Folsom, CA| 12/3/15
Electric Utility Consultants Inc. (EUCI)
ADMS Conference
San Jose, CA | 4/14/16
Utility Analytics Week
Atlanta, GA | 11/1/16
The Internet of Things and Big Data
for Utility Conference
San Jose, CA | 12/7/16
Potential Upcoming Information Sharing
Forums
DistribuTECH Conference &
Exposition
San Diego, CA | 2/2/17
Final Report | EPIC Project 1.15 – Grid Operations Situational Intelligence (GOSI)
30
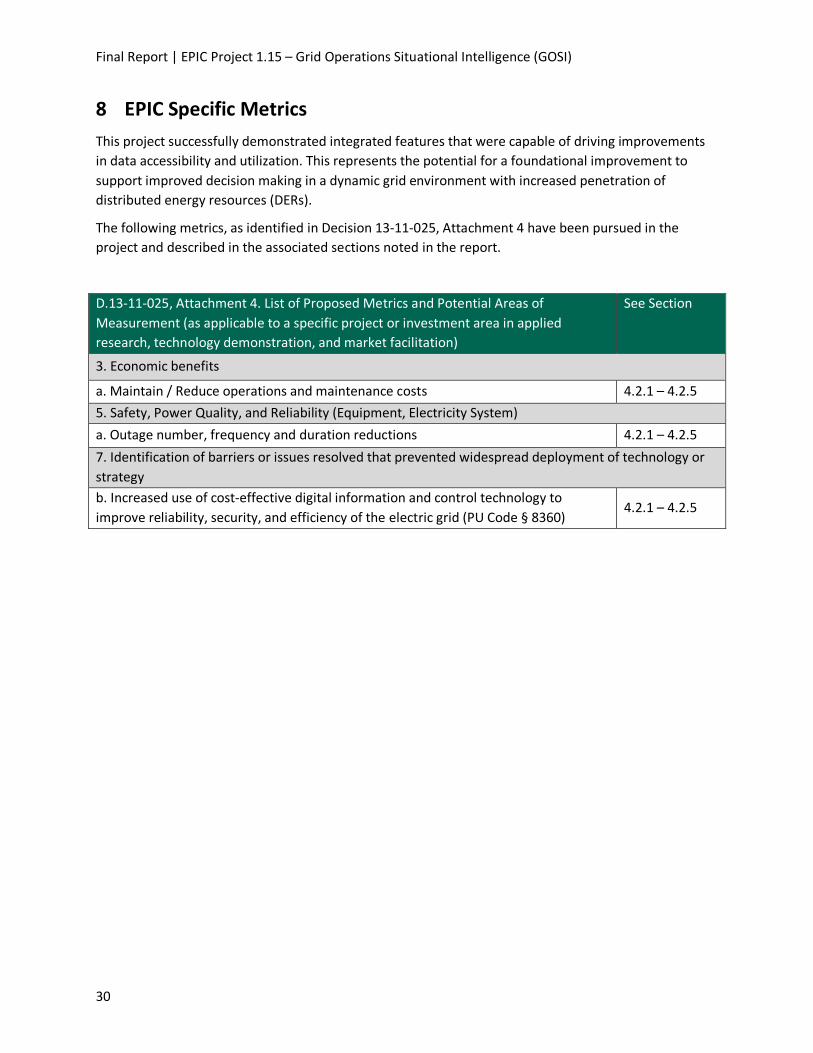
8 EPIC Specific Metrics
This project successfully demonstrated integrated features that were capable of driving improvements
in data accessibility and utilization. This represents the potential for a foundational improvement to
support improved decision making in a dynamic grid environment with increased penetration of
distributed energy resources (DERs).
The following metrics, as identified in Decision 13-11-025, Attachment 4 have been pursued in the
project and described in the associated sections noted in the report.
D.13-11-025, Attachment 4. List of Proposed Metrics and Potential Areas of
Measurement (as applicable to a specific project or investment area in applied
research, technology demonstration, and market facilitation)
See Section
3. Economic benefits
a. Maintain / Reduce operations and maintenance costs 4.2.1 – 4.2.5
5. Safety, Power Quality, and Reliability (Equipment, Electricity System)
a. Outage number, frequency and duration reductions 4.2.1 – 4.2.5
7. Identification of barriers or issues resolved that prevented widespread deployment of technology or
strategy
b. Increased use of cost-effective digital information and control technology to
improve reliability, security, and efficiency of the electric grid (PU Code § 8360) 4.2.1 – 4.2.5
Final Report | EPIC Project 1.15 – Grid Operations Situational Intelligence (GOSI)
31
9 Conclusion
This project successfully achieved all of its key objectives, and in doing so, has captured key learnings for
use by other utilities and industry members to leverage new and existing data sources in improving
situational intelligence around grid operations. Through the work executed in this technology
demonstration project and documented in this report, PG&E gained substantial experience in using the
agile development method and in developing and maintaining the IT infrastructure required to host the
data integration and visualization capabilities demonstrated by the GOSI platform. Specifically, the
project achieved the following:
Integrated data streams from over 20 sources, in addition to developing and maintaining a
system to provide updated data extracts from each source.
Developed and demonstrated a visualization tool that enabled users to customize a map with
various data layers depending on their specific use case.
Developed custom data visualization modes for five specific use cases to respond to specific
concerns identified by PG&E personnel.
Demonstrated the effectiveness of using an agile development method for this type of
technology demonstration project.
Demonstrated the overall value and efficiency gains for a tool that allows users to view multiple
internal and external data streams on one map.
While the current version of the GOSI platform developed through this technology demonstration
project is at its end of life due to the closeout of EPIC funding and the decision that the EPIC-selected
vendor is not the right long-term partner for a production GOSI, the successful execution of this project
has laid the foundation for the several potential future opportunities that include, but are not limited to:
Building out a new GOSI platform that expands upon the key learnings from this demonstration
project to include more use cases and user interface features.
Further building out the future GOSI platform to apply layers of business logic and other rules to
synthesize the raw data to provide users with actionable insights.
Further exploring potential market and in-house solutions for continued GOSI software
development and maintenance.
The GOSI project has allowed PG&E to validate the potential to better identify and leverage insights
from an increasingly complex ecosystem of operational data. The successful demonstration of the GOSI
technology demonstration has proven the value of combining and visualizing disparate data sources,
and has helped inform of the needs of a future visualization and analytics platforms.
Final Report | EPIC Project 1.15 – Grid Operations Situational Intelligence (GOSI)
32
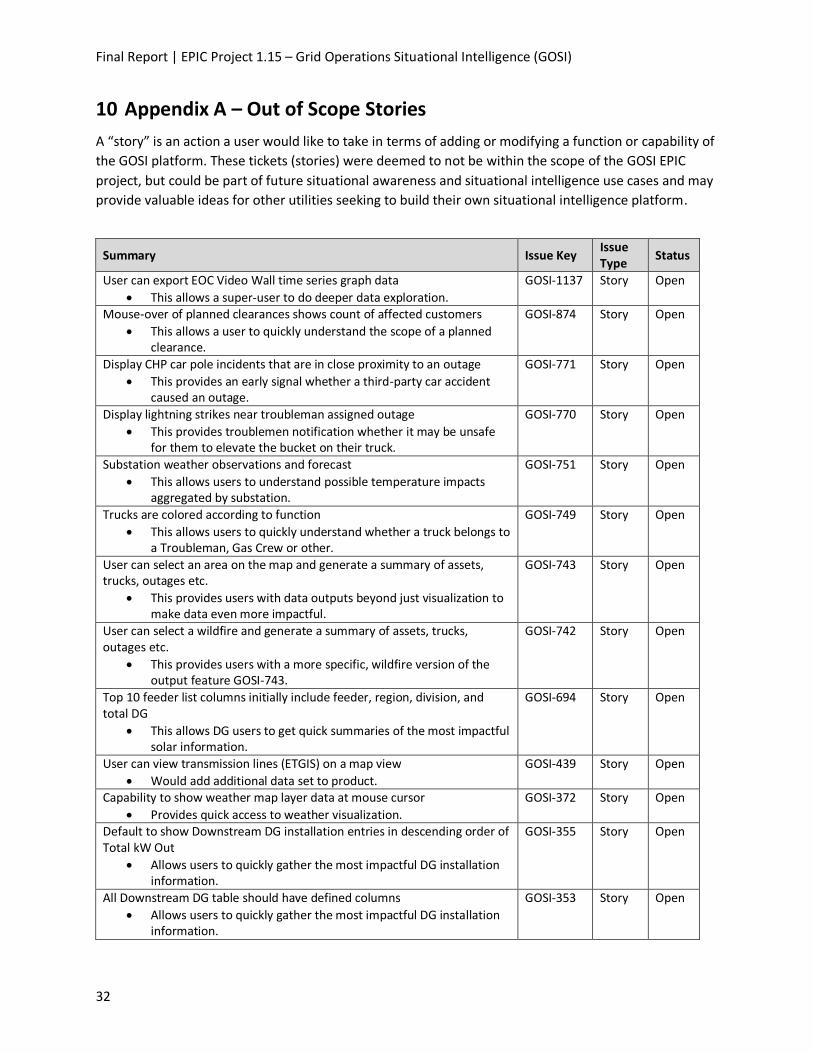
10 Appendix A – Out of Scope Stories
A “story” is an action a user would like to take in terms of adding or modifying a function or capability of
the GOSI platform. These tickets (stories) were deemed to not be within the scope of the GOSI EPIC
project, but could be part of future situational awareness and situational intelligence use cases and may
provide valuable ideas for other utilities seeking to build their own situational intelligence platform.
Summary Issue Key Issue Type
Status
User can export EOC Video Wall time series graph data
This allows a super-user to do deeper data exploration.
GOSI-1137 Story Open
Mouse-over of planned clearances shows count of affected customers
This allows a user to quickly understand the scope of a planned clearance.
GOSI-874 Story Open
Display CHP car pole incidents that are in close proximity to an outage
This provides an early signal whether a third-party car accident caused an outage.
GOSI-771 Story Open
Display lightning strikes near troubleman assigned outage
This provides troublemen notification whether it may be unsafe for them to elevate the bucket on their truck.
GOSI-770 Story Open
Substation weather observations and forecast
This allows users to understand possible temperature impacts aggregated by substation.
GOSI-751 Story Open
Trucks are colored according to function
This allows users to quickly understand whether a truck belongs to a Troubleman, Gas Crew or other.
GOSI-749 Story Open
User can select an area on the map and generate a summary of assets, trucks, outages etc.
This provides users with data outputs beyond just visualization to make data even more impactful.
GOSI-743 Story Open
User can select a wildfire and generate a summary of assets, trucks, outages etc.
This provides users with a more specific, wildfire version of the output feature GOSI-743.
GOSI-742 Story Open
Top 10 feeder list columns initially include feeder, region, division, and total DG
This allows DG users to get quick summaries of the most impactful solar information.
GOSI-694 Story Open
User can view transmission lines (ETGIS) on a map view
Would add additional data set to product.
GOSI-439 Story Open
Capability to show weather map layer data at mouse cursor
Provides quick access to weather visualization.
GOSI-372 Story Open
Default to show Downstream DG installation entries in descending order of Total kW Out
Allows users to quickly gather the most impactful DG installation information.
GOSI-355 Story Open
All Downstream DG table should have defined columns
Allows users to quickly gather the most impactful DG installation information.
GOSI-353 Story Open
Final Report | EPIC Project 1.15 – Grid Operations Situational Intelligence (GOSI)
33
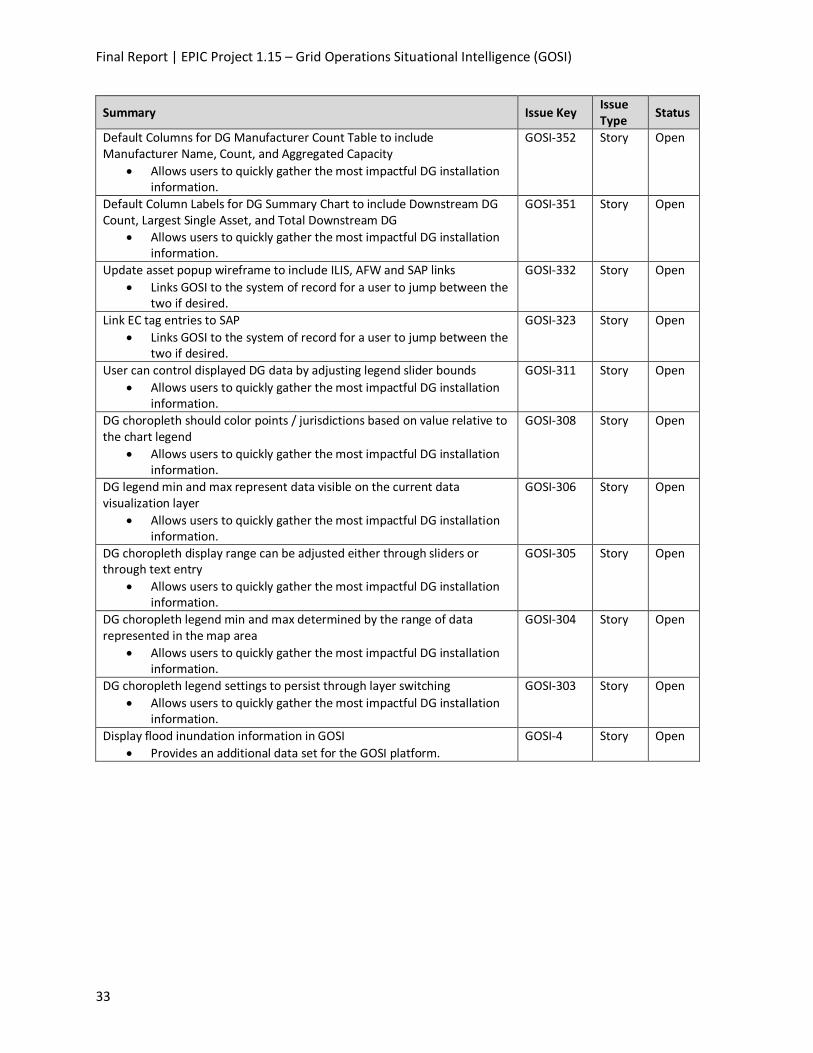
Summary Issue Key Issue Type
Status
Default Columns for DG Manufacturer Count Table to include Manufacturer Name, Count, and Aggregated Capacity
Allows users to quickly gather the most impactful DG installation information.
GOSI-352 Story Open
Default Column Labels for DG Summary Chart to include Downstream DG Count, Largest Single Asset, and Total Downstream DG
Allows users to quickly gather the most impactful DG installation information.
GOSI-351 Story Open
Update asset popup wireframe to include ILIS, AFW and SAP links
Links GOSI to the system of record for a user to jump between the two if desired.
GOSI-332 Story Open
Link EC tag entries to SAP
Links GOSI to the system of record for a user to jump between the two if desired.
GOSI-323 Story Open
User can control displayed DG data by adjusting legend slider bounds
Allows users to quickly gather the most impactful DG installation information.
GOSI-311 Story Open
DG choropleth should color points / jurisdictions based on value relative to the chart legend
Allows users to quickly gather the most impactful DG installation information.
GOSI-308 Story Open
DG legend min and max represent data visible on the current data visualization layer
Allows users to quickly gather the most impactful DG installation information.
GOSI-306 Story Open
DG choropleth display range can be adjusted either through sliders or through text entry
Allows users to quickly gather the most impactful DG installation information.
GOSI-305 Story Open
DG choropleth legend min and max determined by the range of data represented in the map area
Allows users to quickly gather the most impactful DG installation information.
GOSI-304 Story Open
DG choropleth legend settings to persist through layer switching
Allows users to quickly gather the most impactful DG installation information.
GOSI-303 Story Open
Display flood inundation information in GOSI
Provides an additional data set for the GOSI platform.
GOSI-4 Story Open
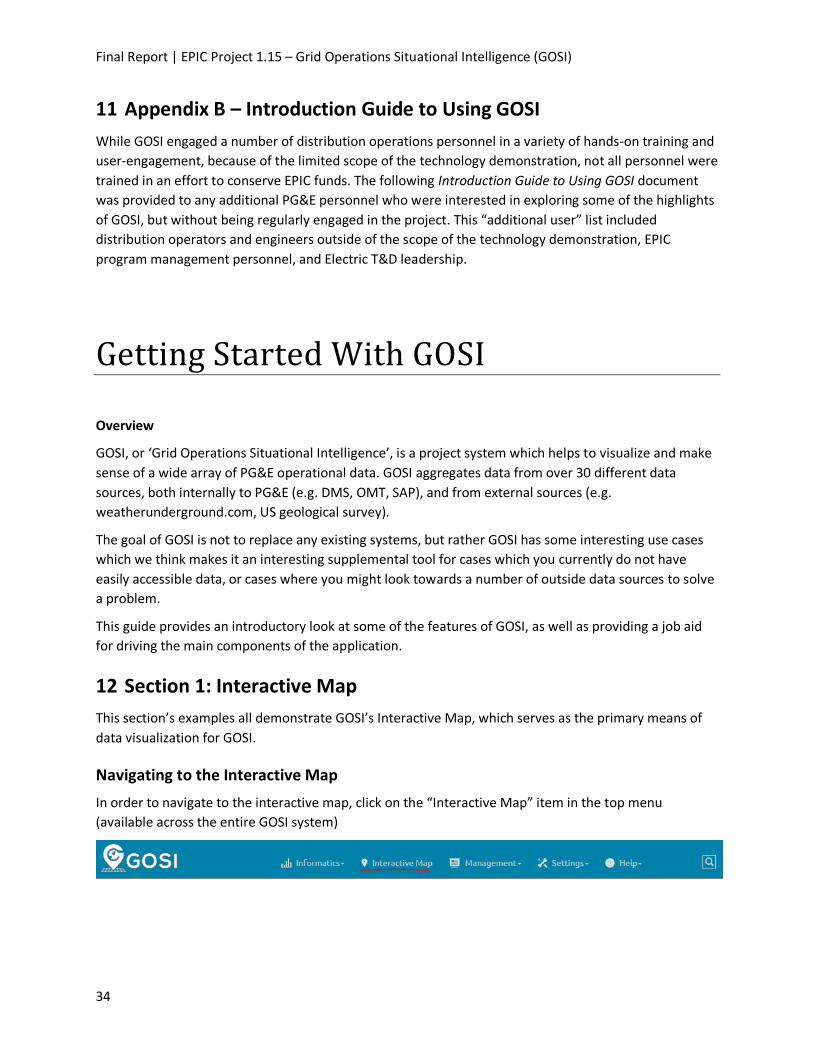
Final Report | EPIC Project 1.15 – Grid Operations Situational Intelligence (GOSI)
34
11 Appendix B – Introduction Guide to Using GOSI
While GOSI engaged a number of distribution operations personnel in a variety of hands-on training and
user-engagement, because of the limited scope of the technology demonstration, not all personnel were
trained in an effort to conserve EPIC funds. The following Introduction Guide to Using GOSI document
was provided to any additional PG&E personnel who were interested in exploring some of the highlights
of GOSI, but without being regularly engaged in the project. This “additional user” list included
distribution operators and engineers outside of the scope of the technology demonstration, EPIC
program management personnel, and Electric T&D leadership.
Getting Started With GOSI
Overview
GOSI, or ‘Grid Operations Situational Intelligence’, is a project system which helps to visualize and make
sense of a wide array of PG&E operational data. GOSI aggregates data from over 30 different data
sources, both internally to PG&E (e.g. DMS, OMT, SAP), and from external sources (e.g.
weatherunderground.com, US geological survey).
The goal of GOSI is not to replace any existing systems, but rather GOSI has some interesting use cases
which we think makes it an interesting supplemental tool for cases which you currently do not have
easily accessible data, or cases where you might look towards a number of outside data sources to solve
a problem.
This guide provides an introductory look at some of the features of GOSI, as well as providing a job aid
for driving the main components of the application.
12 Section 1: Interactive Map
This section’s examples all demonstrate GOSI’s Interactive Map, which serves as the primary means of
data visualization for GOSI.
Navigating to the Interactive Map
In order to navigate to the interactive map, click on the “Interactive Map” item in the top menu
(available across the entire GOSI system)
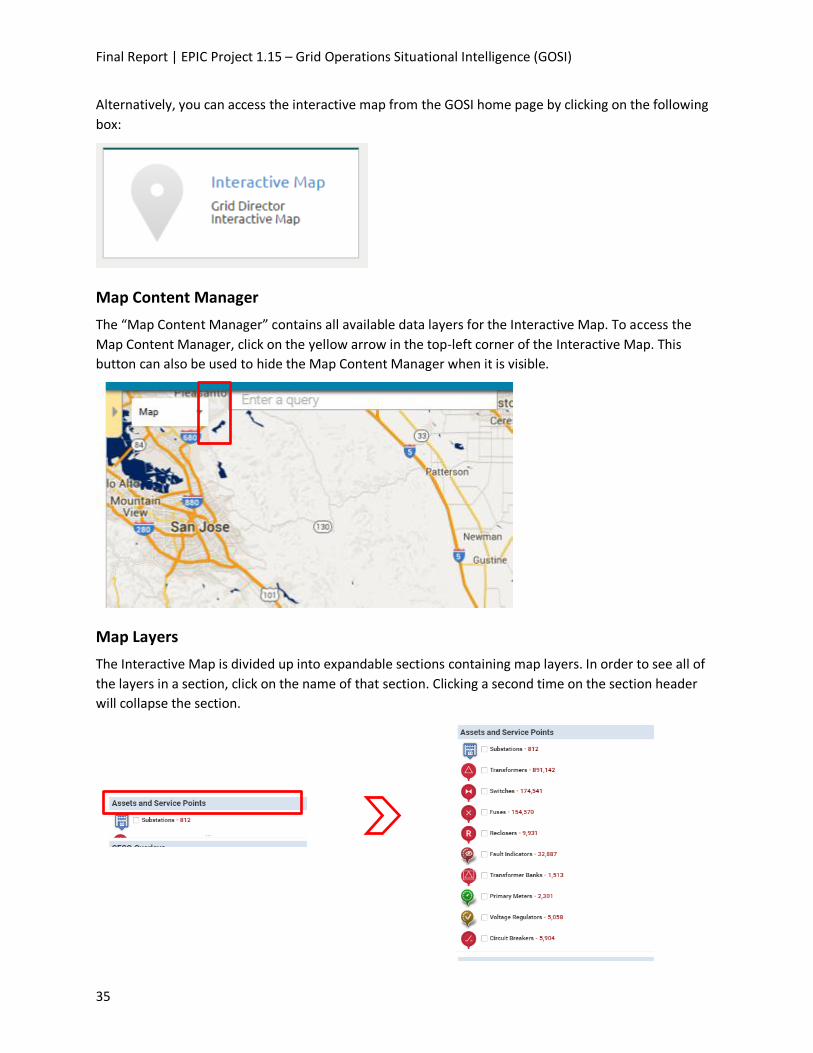
Final Report | EPIC Project 1.15 – Grid Operations Situational Intelligence (GOSI)
35
Alternatively, you can access the interactive map from the GOSI home page by clicking on the following
box:
Map Content Manager
The “Map Content Manager” contains all available data layers for the Interactive Map. To access the
Map Content Manager, click on the yellow arrow in the top-left corner of the Interactive Map. This
button can also be used to hide the Map Content Manager when it is visible.
Map Layers
The Interactive Map is divided up into expandable sections containing map layers. In order to see all of
the layers in a section, click on the name of that section. Clicking a second time on the section header
will collapse the section.
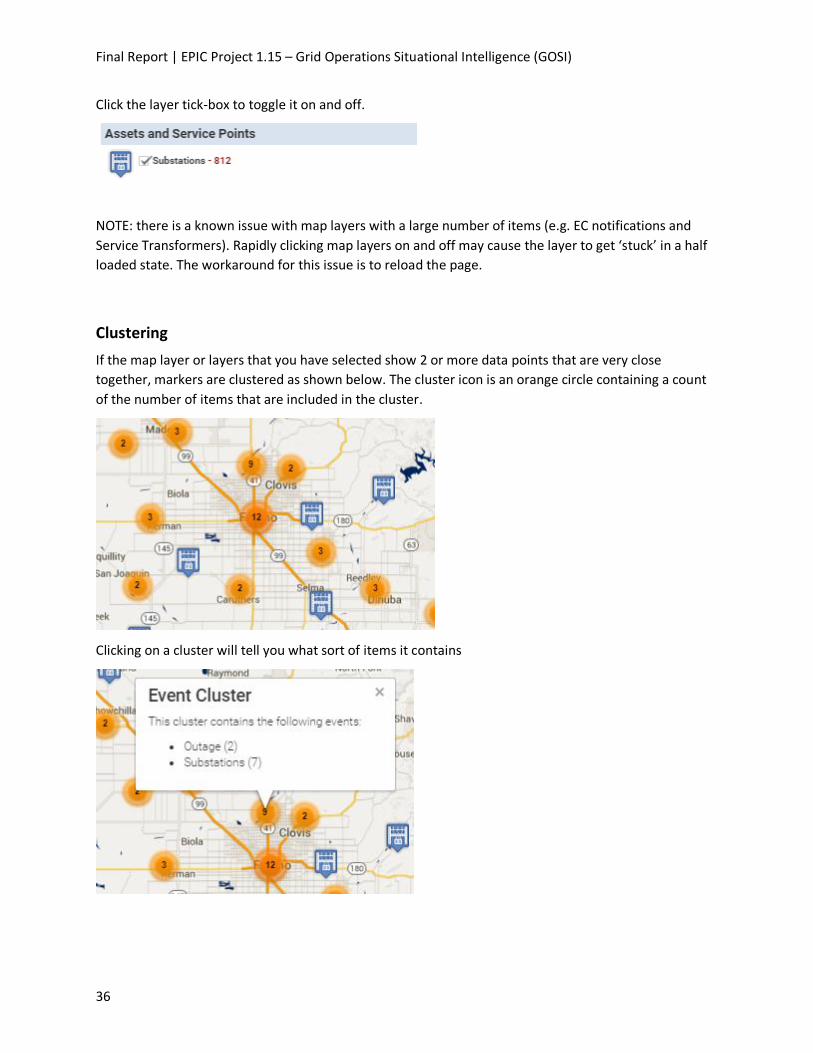
Final Report | EPIC Project 1.15 – Grid Operations Situational Intelligence (GOSI)
36
Click the layer tick-box to toggle it on and off.
NOTE: there is a known issue with map layers with a large number of items (e.g. EC notifications and
Service Transformers). Rapidly clicking map layers on and off may cause the layer to get ‘stuck’ in a half
loaded state. The workaround for this issue is to reload the page.
Clustering
If the map layer or layers that you have selected show 2 or more data points that are very close
together, markers are clustered as shown below. The cluster icon is an orange circle containing a count
of the number of items that are included in the cluster.
Clicking on a cluster will tell you what sort of items it contains
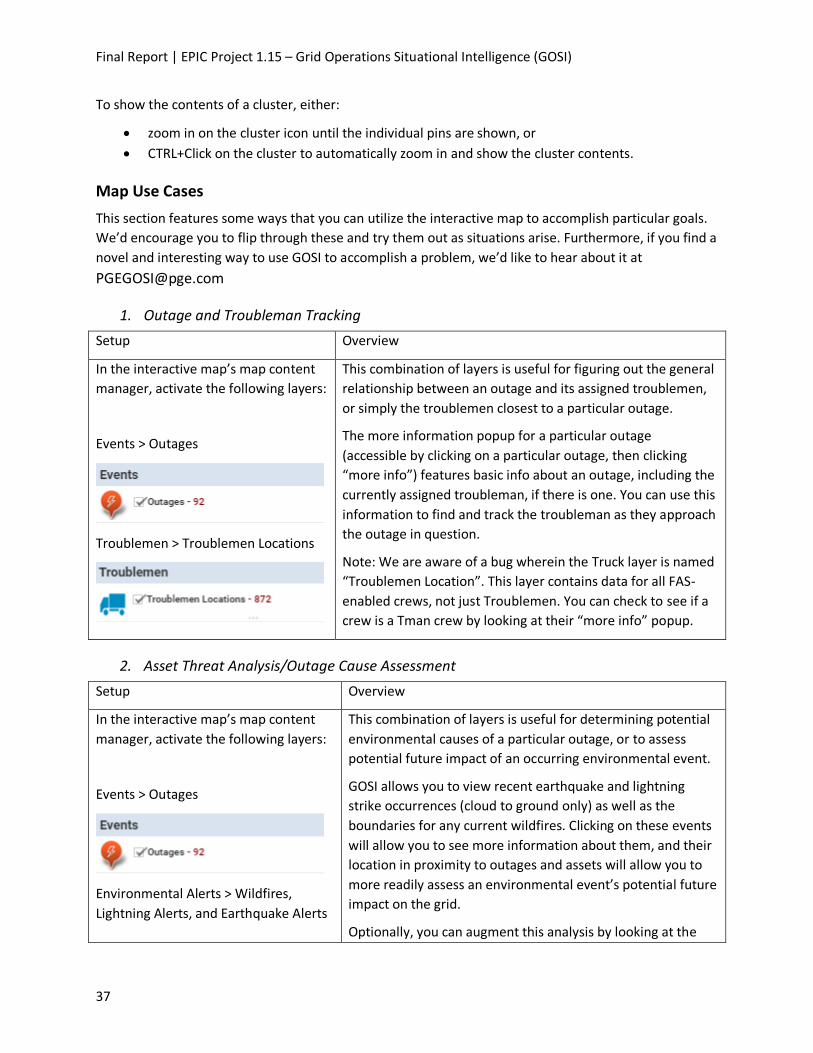
Final Report | EPIC Project 1.15 – Grid Operations Situational Intelligence (GOSI)
37
To show the contents of a cluster, either:
zoom in on the cluster icon until the individual pins are shown, or
CTRL+Click on the cluster to automatically zoom in and show the cluster contents.
Map Use Cases
This section features some ways that you can utilize the interactive map to accomplish particular goals.
We’d encourage you to flip through these and try them out as situations arise. Furthermore, if you find a
novel and interesting way to use GOSI to accomplish a problem, we’d like to hear about it at
1. Outage and Troubleman Tracking
Setup Overview
In the interactive map’s map content
manager, activate the following layers:
Events > Outages
Troublemen > Troublemen Locations
This combination of layers is useful for figuring out the general
relationship between an outage and its assigned troublemen,
or simply the troublemen closest to a particular outage.
The more information popup for a particular outage
(accessible by clicking on a particular outage, then clicking
“more info”) features basic info about an outage, including the
currently assigned troubleman, if there is one. You can use this
information to find and track the troubleman as they approach
the outage in question.
Note: We are aware of a bug wherein the Truck layer is named
“Troublemen Location”. This layer contains data for all FAS-
enabled crews, not just Troublemen. You can check to see if a
crew is a Tman crew by looking at their “more info” popup.
2. Asset Threat Analysis/Outage Cause Assessment
Setup Overview
In the interactive map’s map content
manager, activate the following layers:
Events > Outages
Environmental Alerts > Wildfires,
Lightning Alerts, and Earthquake Alerts
This combination of layers is useful for determining potential
environmental causes of a particular outage, or to assess
potential future impact of an occurring environmental event.
GOSI allows you to view recent earthquake and lightning
strike occurrences (cloud to ground only) as well as the
boundaries for any current wildfires. Clicking on these events
will allow you to see more information about them, and their
location in proximity to outages and assets will allow you to
more readily assess an environmental event’s potential future
impact on the grid.
Optionally, you can augment this analysis by looking at the
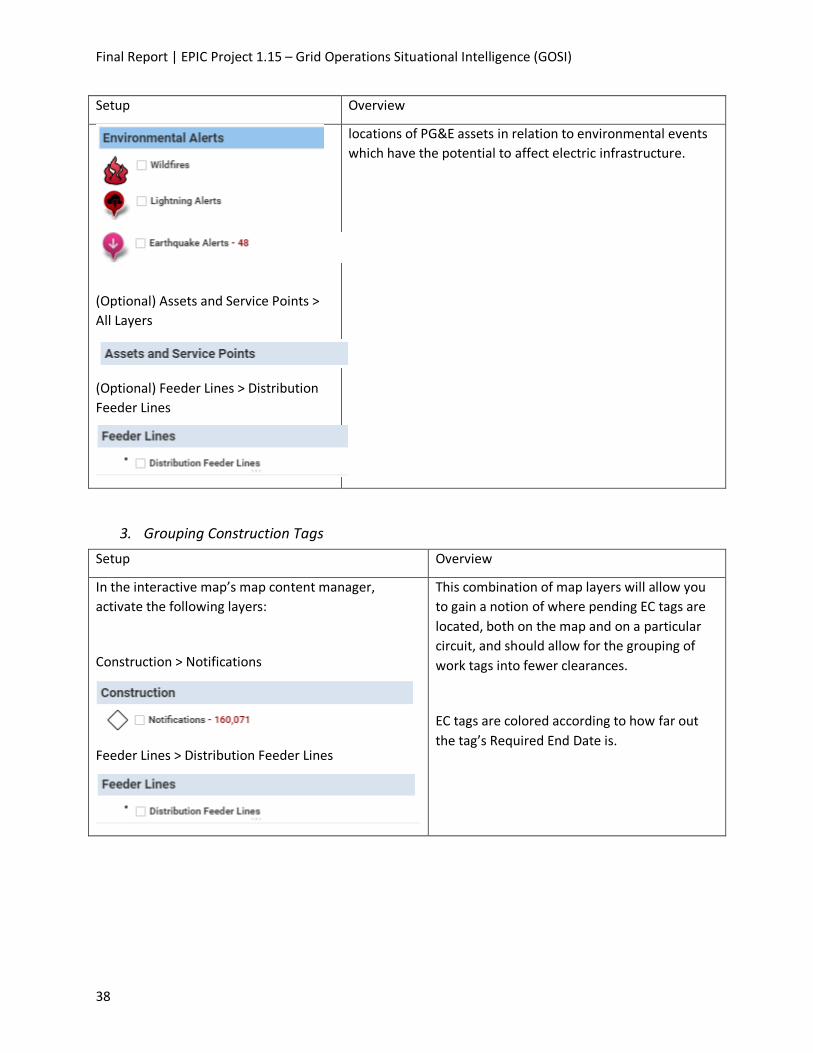
Final Report | EPIC Project 1.15 – Grid Operations Situational Intelligence (GOSI)
38
Setup Overview
(Optional) Assets and Service Points >
All Layers
(Optional) Feeder Lines > Distribution
Feeder Lines
locations of PG&E assets in relation to environmental events
which have the potential to affect electric infrastructure.
3. Grouping Construction Tags
Setup Overview
In the interactive map’s map content manager,
activate the following layers:
Construction > Notifications
Feeder Lines > Distribution Feeder Lines
This combination of map layers will allow you
to gain a notion of where pending EC tags are
located, both on the map and on a particular
circuit, and should allow for the grouping of
work tags into fewer clearances.
EC tags are colored according to how far out
the tag’s Required End Date is.
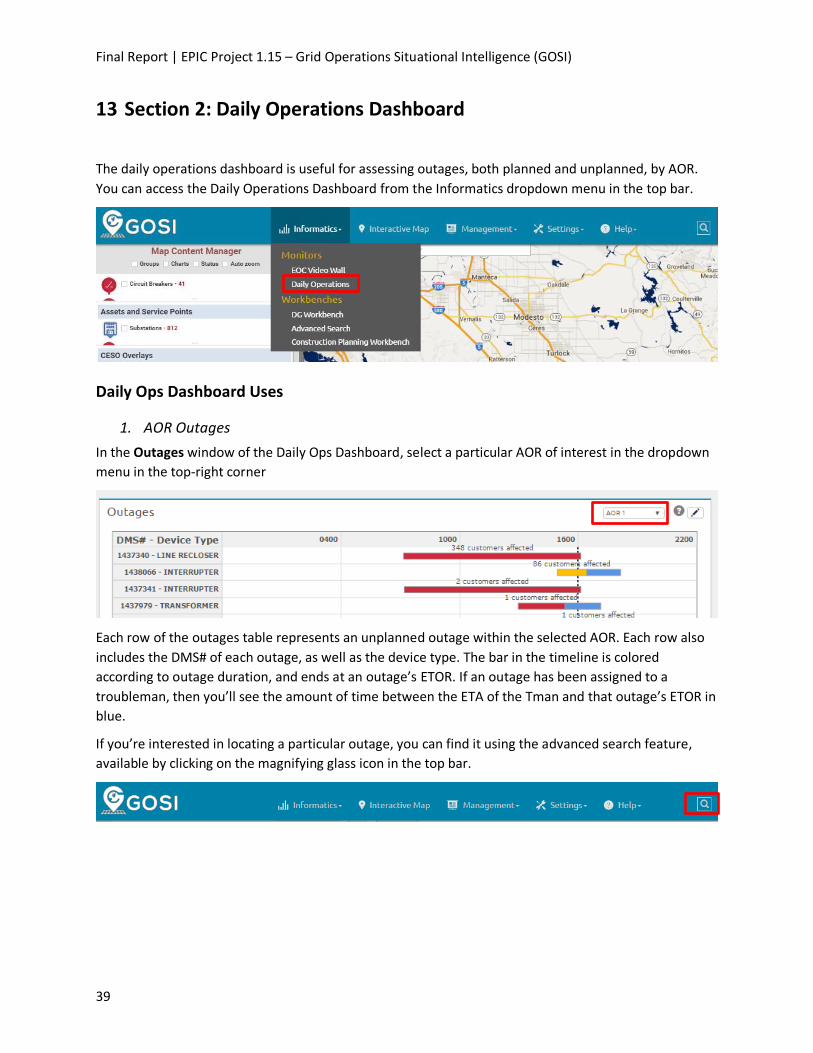
Final Report | EPIC Project 1.15 – Grid Operations Situational Intelligence (GOSI)
39
13 Section 2: Daily Operations Dashboard
The daily operations dashboard is useful for assessing outages, both planned and unplanned, by AOR.
You can access the Daily Operations Dashboard from the Informatics dropdown menu in the top bar.
Daily Ops Dashboard Uses
1. AOR Outages
In the Outages window of the Daily Ops Dashboard, select a particular AOR of interest in the dropdown
menu in the top-right corner
Each row of the outages table represents an unplanned outage within the selected AOR. Each row also
includes the DMS# of each outage, as well as the device type. The bar in the timeline is colored
according to outage duration, and ends at an outage’s ETOR. If an outage has been assigned to a
troubleman, then you’ll see the amount of time between the ETA of the Tman and that outage’s ETOR in
blue.
If you’re interested in locating a particular outage, you can find it using the advanced search feature,
available by clicking on the magnifying glass icon in the top bar.
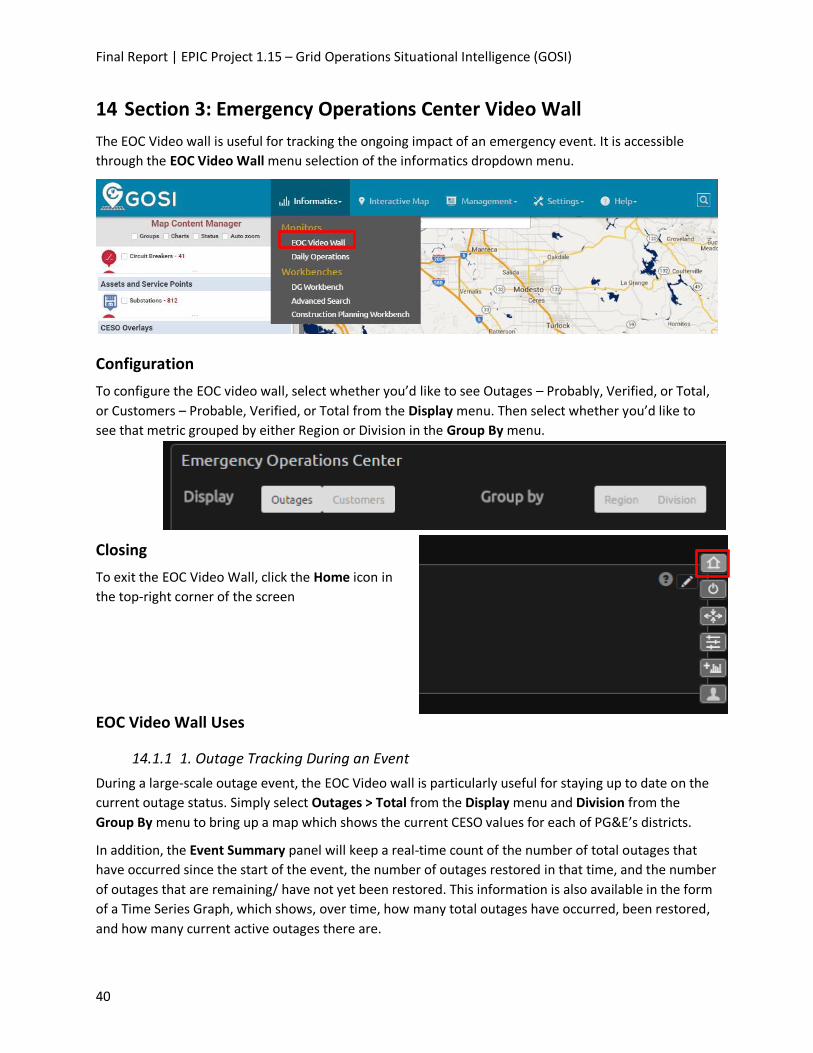
Final Report | EPIC Project 1.15 – Grid Operations Situational Intelligence (GOSI)
40
14 Section 3: Emergency Operations Center Video Wall
The EOC Video wall is useful for tracking the ongoing impact of an emergency event. It is accessible
through the EOC Video Wall menu selection of the informatics dropdown menu.
Configuration
To configure the EOC video wall, select whether you’d like to see Outages – Probably, Verified, or Total,
or Customers – Probable, Verified, or Total from the Display menu. Then select whether you’d like to
see that metric grouped by either Region or Division in the Group By menu.
Closing
To exit the EOC Video Wall, click the Home icon in
the top-right corner of the screen
EOC Video Wall Uses
14.1.1 1. Outage Tracking During an Event
During a large-scale outage event, the EOC Video wall is particularly useful for staying up to date on the
current outage status. Simply select Outages > Total from the Display menu and Division from the
Group By menu to bring up a map which shows the current CESO values for each of PG&E’s districts.
In addition, the Event Summary panel will keep a real-time count of the number of total outages that
have occurred since the start of the event, the number of outages restored in that time, and the number
of outages that are remaining/ have not yet been restored. This information is also available in the form
of a Time Series Graph, which shows, over time, how many total outages have occurred, been restored,
and how many current active outages there are.