Embed Size (px)
Citation preview
Pacific Ethanol, Inc.Pacific Ethanol, Inc.Pacific Ethanol, Inc.Pacific Ethanol, Inc.
November 16, 2016
(Nasdaq: PEIX)
Investor Presentation

Statements and information contained in this communication that refer to or include Pacific Ethanol’s estimated or anticipated future results or other non-historical expressions of fact are forward-looking statements that reflect Pacific Ethanol’s current perspective of existing trends and information as of the date of the communication. Forward looking statements generally will be accompanied by words such as “anticipate,” “believe,” “plan,” “could,” “should,” “estimate,” “expect,” “forecast,” “outlook,” “guidance,” “intend,” “may,” “might,” “will,” “possible,” “potential,” “predict,” “project,” or other similar words, phrases or expressions. Such forward-looking statements include, but are not limited to, market conditions, including the supply of and domestic and international demand for ethanol and co-products, growth for these products, as well as margins, commodity prices and export conditions; expectations regarding improvements in production assets and the carbon intensity of ethanol produced; expected gains from hedged positions; production levels of cellulosic ethanol and premiums and enhanced profitability from cellulosic ethanol; the timing, effectiveness, and costs and energy savings, of technologies implemented at Pacific Ethanol’s plants; the ability of Pacific Ethanol to timely and successfully execute on, and the effects of, its initiatives to optimize production, improve plant efficiencies and increase yields, reduce operating costs, and lower the carbon intensity of ethanol produced; the effects of Low-Carbon Fuel Standards in California and Oregon, and the premiums Pacific Ethanol may generate for its ethanol as a result of those programs; the expected adoption and growth of 15% ethanol blends; and Pacific Ethanol’s other plans, objectives, expectations and intentions. It is important to note that Pacific Ethanol’s plans, objectives, expectations and intentions are not predictions of actual performance. Actual results may differ materially from Pacific Ethanol’s current expectations depending upon a number of factors affecting Pacific Ethanol. These factors include, among others, adverse economic and market conditions, including for ethanol and its co-products; fluctuations in the prices of oil and gasoline; raw material costs, including ethanol production input costs; changes in governmental regulations and policies; insufficient capital resources; the inability to successfully execute on plant improvement initiatives or install new technologies, or both. These factors also include, among others, the inherent uncertainty associated with financial and other projections; the anticipated size of the markets and continued demand for Pacific Ethanol’s products; the impact of competitive products and pricing; the risks and uncertainties normally incident to the ethanol production and marketing industries; changes in generally accepted accounting principles; successful compliance with governmental regulations applicable to Pacific Ethanol’s facilities, products and/or businesses; changes in laws and regulations; the loss of key senior management or staff; and other events, factors and risks previously and from time to time disclosed in Pacific Ethanol’s filings with the Securities and Exchange Commission including, specifically, those factors set forth in the “Risk Factors” section contained in the Company’s Form 10-Q filed with the Securities and Exchange Commission on August 5, 2016.
2
Cautionary StatementsCautionary StatementsCautionary StatementsCautionary Statements

3
o 8 strategically located bio-refineries located in the U.S.
o Production capacity of 515M gallons/yr.
o Current run rate of 1 billion gallons/yr. of marketing volume
o Co-product production capacity of over 1.5M tons/yr. (dry matter basis)
o Positioned to access 48 states and export markets with ethanol production and
marketing
Mission: To be the leading producer and marketer of low-carbon renewable fuels
Feedstock procurementEthanol & co-
product productionMarketing, transportation
& logisticsDistribution & customer
services
Pacific Ethanol, Inc.
History: Founded in 2003, public in 2005 as the first pure-play ethanol company
Stock Profile a 11/09/16:
• Nasdaq: PEIX
• Trading at $6.45
• Market cap of $278.5M

o Octane, carbon and cost benefits of ethanol driving market growth
o Regulations support long-term increasing demand for renewable fuels
4
Leveraging strong operating platform to drive growth
o Strategically located biorefineries serve multiple markets
o Diversity of geography, technology, feedstocks, logistics and products
o Implementing plant improvements to increase efficiencies & yields
o Organic growth and acquisitions to increase market share
Continued long-term demand for ethanol
Strong financial foundation
o Q3’16 net sales of $417.8M
o Record total gallons sold of 243.7M
o Net loss $3.8M or $0.09 per share
o Adjusted EBITDA was $9.3M
Reasons to InvestReasons to InvestReasons to InvestReasons to Invest
$380.6 $376.8
$342.4
$422.9 $417.8
211.6 213.4 206.7233.2 243.7
0
50
100
150
200
250
300
350
400
450
Q3'15 Q4'15 Q1'16 Q2'16 Q3'16
Quarterly Revenue & Total Gallons Sold
Net Sales Total Gallons Sold

5
Fundamentals Support Continued Demand
Gasoline demand in the US market has hit record highs with lower fuel prices, an increase in large vehicle sales
and a strong summer driving season
Source: NYMEX, CBOT, EIA
0.00
20.00
40.00
60.00
80.00
100.00
120.00
140.00
160.00
0.00
100.00
200.00
300.00
400.00
500.00
600.00
700.00
800.00
900.00
WT
I [U
SD
/BB
L]
CO
RN
[U
SC
/BS
H]
Corn vs. Crude Oil
CBT CORN First Month [USC/BSH]
NYMEX Light Sweet Crude Oil (WTI) Futures Pit (Front Month) [USD/BBL]
8.0
8.2
8.4
8.6
8.8
9.0
9.2
9.4
9.6
9.8
10.0
2-Jan 2-Feb 2-Mar 2-Apr 2-May 2-Jun 2-Jul 2-Aug 2-Sep 2-Oct 2-Nov 2-Dec
Mil
lio
ns
BB
ls p
er
Da
y
U.S. Motor Gasoline Demand
Based on 4-Wk Average
5-Year Range 2014 2015 2016
6
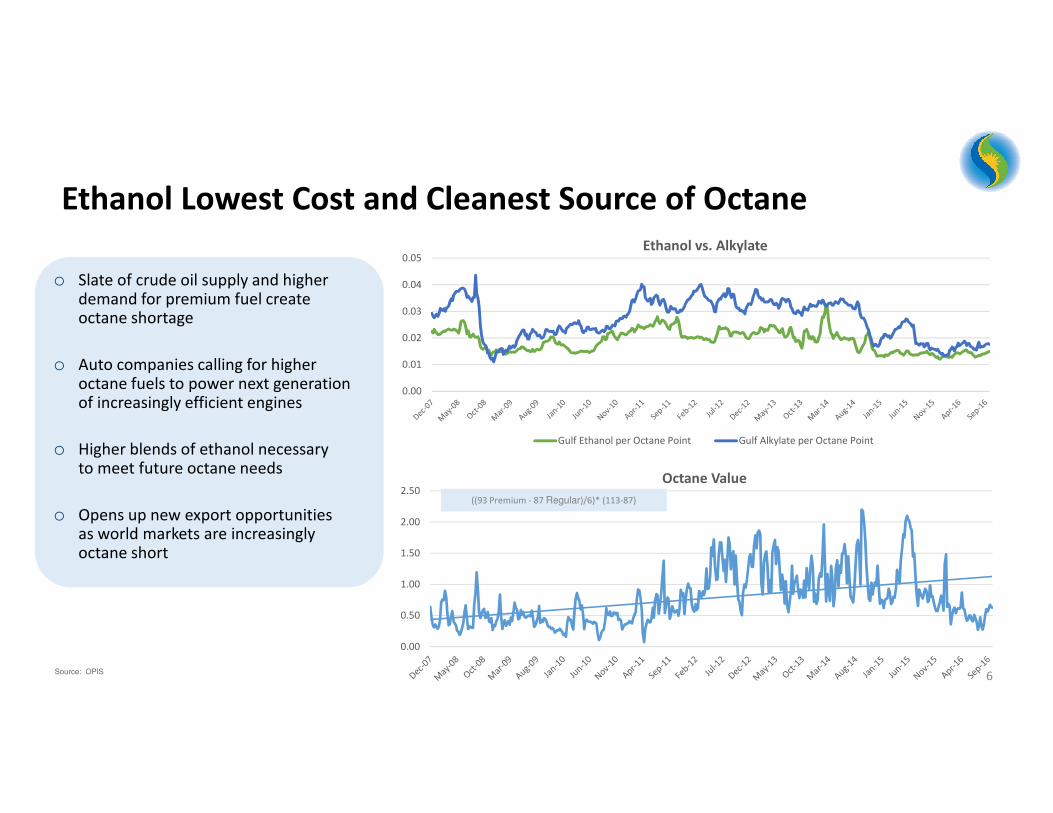
o Slate of crude oil supply and higher demand for premium fuel create octane shortage
o Auto companies calling for higher octane fuels to power next generation of increasingly efficient engines
o Higher blends of ethanol necessary to meet future octane needs
o Opens up new export opportunities as world markets are increasingly octane short
Ethanol Lowest Cost and Cleanest Source of Octane
Source: OPIS
0.00
0.50
1.00
1.50
2.00
2.50Octane Value
((93 Premium - 87 Regular)/6)* (113-87)
0.00
0.01
0.02
0.03
0.04
0.05Ethanol vs. Alkylate
Gulf Ethanol per Octane Point Gulf Alkylate per Octane Point

7
o Export levels are on track to exceed 2015 levels with expectations of nearly 1 billion gallons of exports in 2016
o Global demand is growing 2-3% annually as global markets incorporate environmental and performance benefits
o Approximately 30 countries have renewable fuel standards or targets
o US ethanol producers supply the world with low-cost ethanol while sugar prices surge
Source: EIA, Department of Commerce
Exports Create Growing Opportunity
99.6
(100.0)
(50.0)
-
50.0
100.0
150.0
200.0
Jun-11 Sep-11 Dec-11 Mar-12 Jun-12 Sep-12 Dec-12 Mar-13 Jun-13 Sep-13 Dec-13 Mar-14 Jun-14 Sep-14 Dec-14 Mar-15 Jun-15 Sep-15 Dec-15 Mar-16 Jun-16 Sep-16
MM
Ga
llo
ns
U.S. Ethanol Export and Import
Import Export Net Export

8Source: EIA
Top Markets for U.S. Ethanol in 2015
Canada
249
(30%)
Mexico
34 (4%)
Brazil
116
(14%)
Oman
33 (4%)
Philippines
72
(9%)
Tunisia
26
(3%)
Rest of world 12%
Total 2015 Export 844 million gallons
India
47
(6%)
China 71
(8%)
S. Korea
60
(7%)
Netherlands
34
(4%)

9Source: Renewable Fuels Association.
o Breaching the blend wall
o Only Federal fuels policy to reduce greenhouse gas (GHG) emissions
o Need regulatory certainty to secure development of cellulosic ethanol projects
Renewable Fuel Standard
-
5.0
10.0
15.0
20.0
25.0
30.0
35.0
40.0
2005 2006 2007 2008 2009 2010 2011 2012 2013 2014 2015 2016 2017 2018 2019 2020 2021 2022
Bil
lio
n G
all
on
s
RFS- Conventional Biofuel RFS - Advanced Biofuel Installed Capacity
Industry Production Total Demand Incl. Net Export blend ratio @ 10%
blend ratio @ 15% Domestic Ethanol Demand
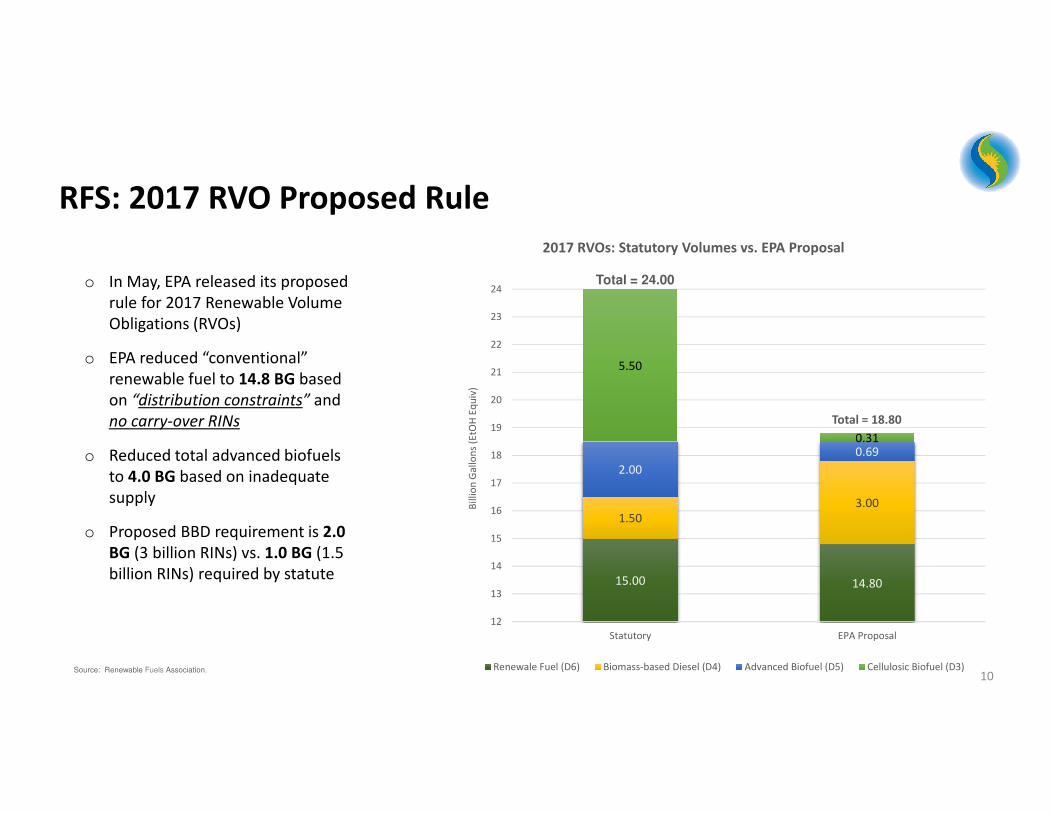
RFS: 2017 RVO Proposed Rule
15.00 14.80
1.50
3.00
2.00
0.69
5.50
0.31
12
13
14
15
16
17
18
19
20
21
22
23
24
Statutory EPA Proposal
Bil
lio
n G
all
on
s (E
tOH
Eq
uiv
)
2017 RVOs: Statutory Volumes vs. EPA Proposal
Renewale Fuel (D6) Biomass-based Diesel (D4) Advanced Biofuel (D5) Cellulosic Biofuel (D3)
o In May, EPA released its proposed
rule for 2017 Renewable Volume
Obligations (RVOs)
o EPA reduced “conventional”
renewable fuel to 14.8 BG based
on “distribution constraints” and
no carry-over RINs
o Reduced total advanced biofuels
to 4.0 BG based on inadequate
supply
o Proposed BBD requirement is 2.0
BG (3 billion RINs) vs. 1.0 BG (1.5
billion RINs) required by statute
Total = 18.80
Total = 24.00
10Source: Renewable Fuels Association.

11Source: OPIS
o The California Air Resources Board (CARB) re-adopted the LCFS with the revised program effective Jan. 2016
o Oregon LCFS initiated Jan. 2016 for a 10% reduction in carbon intensity by 2025
o RFS is successful carbon policy at the national level
Pacific Ethanol currently receives a $0.08 per gallon
premium over standard Midwest ethanol on each CA
production gallon sold into the CA market
Low-Carbon Fuel Standards
-
0.020
0.040
0.060
0.080
0.100
0.120
California Ethanol premium $/gal (CI 69.6)
1%2.0%
3.5%5.0%
7.5%
10.0%
20.0%??
0%
5%
10%
15%
20%
25%
2015 2016 2017 2018 2019 2020 2030 E
California LCFS Program
Reduction in Carbon Intensity
12
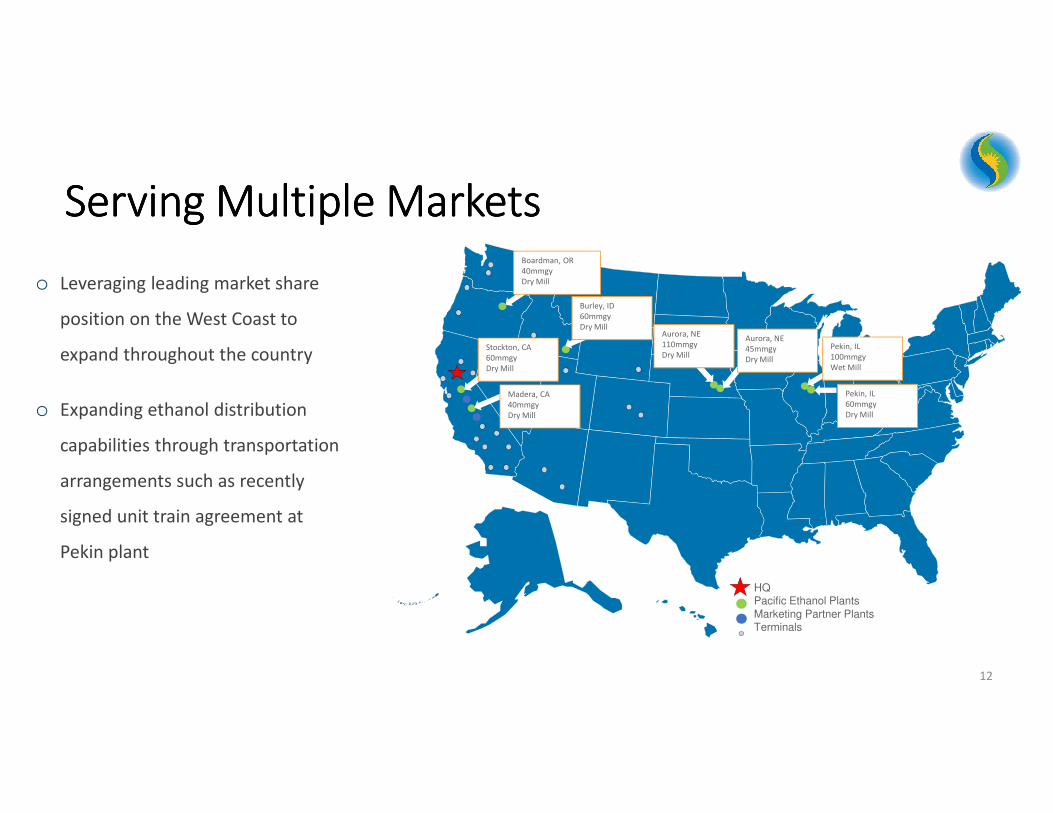
HQPacific Ethanol Plants
Marketing Partner PlantsTerminals
Pekin, IL
100mmgy
Wet Mill
Pekin, IL
60mmgy
Dry Mill
Aurora, NE
110mmgy
Dry Mill
Boardman, OR
40mmgy
Dry Mill
Burley, ID
60mmgy
Dry Mill
Stockton, CA
60mmgy
Dry Mill
Madera, CA
40mmgy
Dry Mill
Aurora, NE
45mmgy
Dry Mill
Serving Multiple MarketsServing Multiple MarketsServing Multiple MarketsServing Multiple Markets
o Leveraging leading market share
position on the West Coast to
expand throughout the country
o Expanding ethanol distribution
capabilities through transportation
arrangements such as recently
signed unit train agreement at
Pekin plant
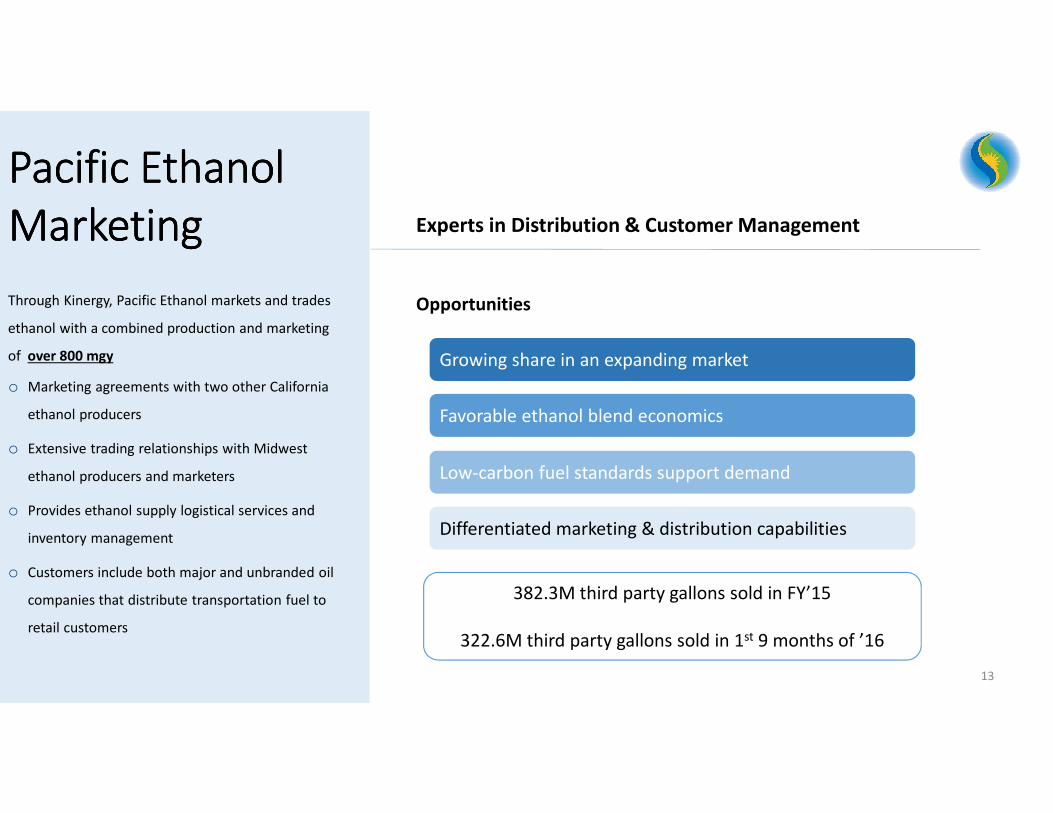
Pacific Ethanol Pacific Ethanol Pacific Ethanol Pacific Ethanol
MarketingMarketingMarketingMarketing
Through Kinergy, Pacific Ethanol markets and trades
ethanol with a combined production and marketing
of over 800 mgy
o Marketing agreements with two other California
ethanol producers
o Extensive trading relationships with Midwest
ethanol producers and marketers
o Provides ethanol supply logistical services and
inventory management
o Customers include both major and unbranded oil
companies that distribute transportation fuel to
retail customers
13
Opportunities
382.3M third party gallons sold in FY’15
322.6M third party gallons sold in 1st 9 months of ’16
Experts in Distribution & Customer Management
Growing share in an expanding market
Favorable ethanol blend economics
Low-carbon fuel standards support demand
Differentiated marketing & distribution capabilities

Madera, CAMadera, CAMadera, CAMadera, CA
Burley, IDBurley, IDBurley, IDBurley, IDStockton, CAStockton, CAStockton, CAStockton, CA
Date of Operation:Date of Operation:Date of Operation:Date of Operation:
September 2008
Annual Capacity:Annual Capacity:Annual Capacity:Annual Capacity:
60.0 mmgy
Technology:Technology:Technology:Technology:
Dry mill, WDG, corn oil,
cellulosic ethanol, terminal
Date of Operation:Date of Operation:Date of Operation:Date of Operation:
October 2006
Annual Capacity:Annual Capacity:Annual Capacity:Annual Capacity:
40.0 mmgy
Technology: Technology: Technology: Technology:
Dry mill, WDG, corn oil,
grain mill
Date of Operation:Date of Operation:Date of Operation:Date of Operation:
August 2007
Annual Capacity:Annual Capacity:Annual Capacity:Annual Capacity:
40.0 mmgy
Technology:Technology:Technology:Technology:
Dry mill, WDG, corn
oil, CO2
Date of Operation:Date of Operation:Date of Operation:Date of Operation:
April 2008
Annual Capacity:Annual Capacity:Annual Capacity:Annual Capacity:
60.0 mmgy
Technology:Technology:Technology:Technology:
Dry mill, WDG, corn oil
14
Western BiorefineriesWestern BiorefineriesWestern BiorefineriesWestern BiorefineriesStrategically located in the feed and fuel markets they serve
Boardman, ORBoardman, ORBoardman, ORBoardman, OR

Pekin, IL Pekin, IL Pekin, IL Pekin, IL –––– Dry MillDry MillDry MillDry Mill
Pekin, IL Pekin, IL Pekin, IL Pekin, IL –––– Wet Mill / YeastWet Mill / YeastWet Mill / YeastWet Mill / Yeast
15
Aurora, NEAurora, NEAurora, NEAurora, NE
Aurora, NEAurora, NEAurora, NEAurora, NE
Date of Operation:Date of Operation:Date of Operation:Date of Operation:
2012
Annual Capacity:Annual Capacity:Annual Capacity:Annual Capacity:
110.0 mmgy
Technology:Technology:Technology:Technology:
Dry mill, DDG/WDG,
corn oil
Date of Operation:Date of Operation:Date of Operation:Date of Operation:
1995
Annual Capacity:Annual Capacity:Annual Capacity:Annual Capacity:
45.0 mmgy
Technology:Technology:Technology:Technology:
Dry mill, DDG/WDG,
corn oil
Date of Operation:Date of Operation:Date of Operation:Date of Operation:
2007
Annual Capacity:Annual Capacity:Annual Capacity:Annual Capacity:
60.0 mmgy
Technology:Technology:Technology:Technology:
Dry mill, DDG, corn oil
Date of Operation:Date of Operation:Date of Operation:Date of Operation:
1981 / 1999
Annual Capacity:Annual Capacity:Annual Capacity:Annual Capacity:
100.0 mmgy / 55
mlbs/yr
Technology:Technology:Technology:Technology:
Wet mill, corn gluten
feed, corn germ & meal,
CO2, yeast
Yeast plantYeast plantYeast plantYeast plant
Midwest BiorefineriesMidwest BiorefineriesMidwest BiorefineriesMidwest BiorefineriesLocated near feedstock sources and directly linked to strong markets for ethanol and co-products

Distillers Grains with Solubles (DGS) & Wet Distillers Grains (WDG)
Production of over 1M tons per year (tpy) (dry matter) of DDG & WDG
• Pacific Ethanol plants are strategically located near dairies and feedlots and able to sell WDG directly to those users in the heart of the livestock industries of California, Oregon, Idaho and Nebraska
Distillers Corn Oil
Production of over 85M pounds of corn oil
• All Pacific Ethanol facilities produce corn oil, which is sold into feed markets as well as feedstock markets for biodiesel production
CO2
Production over 100K tons annually
• Pacific Ethanol sells raw CO2, another co-product of ethanol production, for processing into liquid CO2 and dry ice
16
Dry Mill CoDry Mill CoDry Mill CoDry Mill Co----Product PlatformProduct PlatformProduct PlatformProduct Platform

17
Corn Gluten Meal & Corn Gluten Feed
Production of 265k tpy of corn gluten feed and corn gluten meal annually
• Corn gluten meal is used primarily as a protein source and corn gluten
feed is used as fiber, starch and steep water source in poultry,
livestock rations, fish and pet foods
Corn Condensed Distillers Solubles (CCDS)
• CCDS is a palatable, free-flowing, energy and protein source for cattle
and fits into a large number of feeding programs
Corn Germ
Production of 70K tons of corn germ annually
• Through the wet milling process Aventine separates off the germ of
the corn kernel and sends it to third parties for further processing into
corn oil and corn germ meal.
Yeast
Production of over 50M pounds annually
• When extracted from the starch stream in the wet mill, yeast is
processed, dried, bagged and sold for animal, pet and human food
applications and is AIB food grade and also Kosher certified
Wet Mill CoWet Mill CoWet Mill CoWet Mill Co----Product PlatformProduct PlatformProduct PlatformProduct Platform

18
First of its kind registration from the Environmental Protection Agency (EPA)
o Production uses Edeniq Pathway and Cellunator technologies
o Achieving targeted yield increases of > 2%
o Expected to provide meaningful contribution to plant profitability
o Long-term goal to expand cellulosic production technology
to additional plants
Cellulosic Ethanol Production Generating ValueCellulosic Ethanol Production Generating ValueCellulosic Ethanol Production Generating ValueCellulosic Ethanol Production Generating Value
Now generating high-value Renewable Identification Numbers (RINs) at Stockton facility
Pacific Ethanol’s Stockton, CA ethanol facility

19
5 Megawatt solar photovoltaic (PV) power system at Madera plant
Reduces cost of operations
• Displaces approximately one-third of the grid electricity currently used
• Expected to cut annual utility operating costs by over $1 million,
not including tax credits
Improves carbon score
• Drives premium pricing on ethanol produced due to reductions in
carbon-intensity
• California’s Low Carbon Fuel Standard supports premium pricing for
ethanol produced with lower carbon scores
Source: SolarEnergyArena.com
Installing Solar PowerInstalling Solar PowerInstalling Solar PowerInstalling Solar Power
Expected to be fully operational
in early 2018 after
interconnection agreements
with local utility company
1st Ever Commercial Solar Electricity Project at a U.S. Ethanol Plant

Lower operating costs
Reduce energy demand
Increase yields
Low-cost operating platform
20
Additional Plant Additional Plant Additional Plant Additional Plant Investment InitiativesInvestment InitiativesInvestment InitiativesInvestment Initiatives
Initiated startup of industrial scale
membrane system at Madera plant
Expect to begin commercial
operations of cogeneration technology
at Stockton plant by December 2016
Expect a strong and supportive environment for ethanol into 2017
21
o Oil prices are forecasted to remain stable or move modestly higher
o Supply and Demand expected to remain well balanced
o Domestic demand set to strengthen as E15 expands, driven by new infrastructure and higher blending levels called for by the RFS
o Export forecasts remain robust as US ethanol remains the most competitively priced octane component in world markets
Encouraging Industry OutlookEncouraging Industry OutlookEncouraging Industry OutlookEncouraging Industry Outlook

3 Mos. 3 Mos. 3 Mos. 3 Mos.
9/30/169/30/169/30/169/30/16
3 Mos. 3 Mos. 3 Mos. 3 Mos.
9/30/159/30/159/30/159/30/15
9 Mos. 9 Mos. 9 Mos. 9 Mos.
9/30/169/30/169/30/169/30/16
9 Mos. 9 Mos. 9 Mos. 9 Mos.
9/30/159/30/159/30/159/30/15
Net sales $ 417,806 $ 380,622 $ 1,183,039 $ 814,419
Gross profit (loss) 6,364 (7,380) 25,137 (2,113)
SG&A 5,971 7,446 20,436 16,344
Operating income (loss) 393 (14,826) 4,701 (18,457)
Fair value adjustments (69) 1,202 (53) 1,413
Interest expense, net (3,874) (5,167) (16,643) (7,187)
Other income, net 32 203 92 16
Provision (benefit) for income taxes -- (3,925) (245) (6,095)
Consolidated net loss(3,518) (14,663) (11,658) (18,120)
Net loss available to common stockholders $ (3,837) $ (14,982) $ (12,607) $ (18,979)
Net loss per share, basic & diluted $ (0.09) $ (0.36) $ (0.30) $ (0.63)
Adjusted EBITDA(1)$ 9,282 $ 2,432 $ 31,319 $ 5,212
(1) A reconciling table for Adjusted EBITDA is available on slide 18 of the presentation
(Figures below in thousands, except per share amounts)
22
Consolidated Statement of OperationsConsolidated Statement of OperationsConsolidated Statement of OperationsConsolidated Statement of Operations
Net loss reflects the following
o Higher beginning inventory
valuation
o Lower margins in the ethanol
trading business resulting
from an intra-quarter drop in
ethanol prices
o Significant repair expense
o Non-cash mark-to-market
adjustments related to open
hedge positions
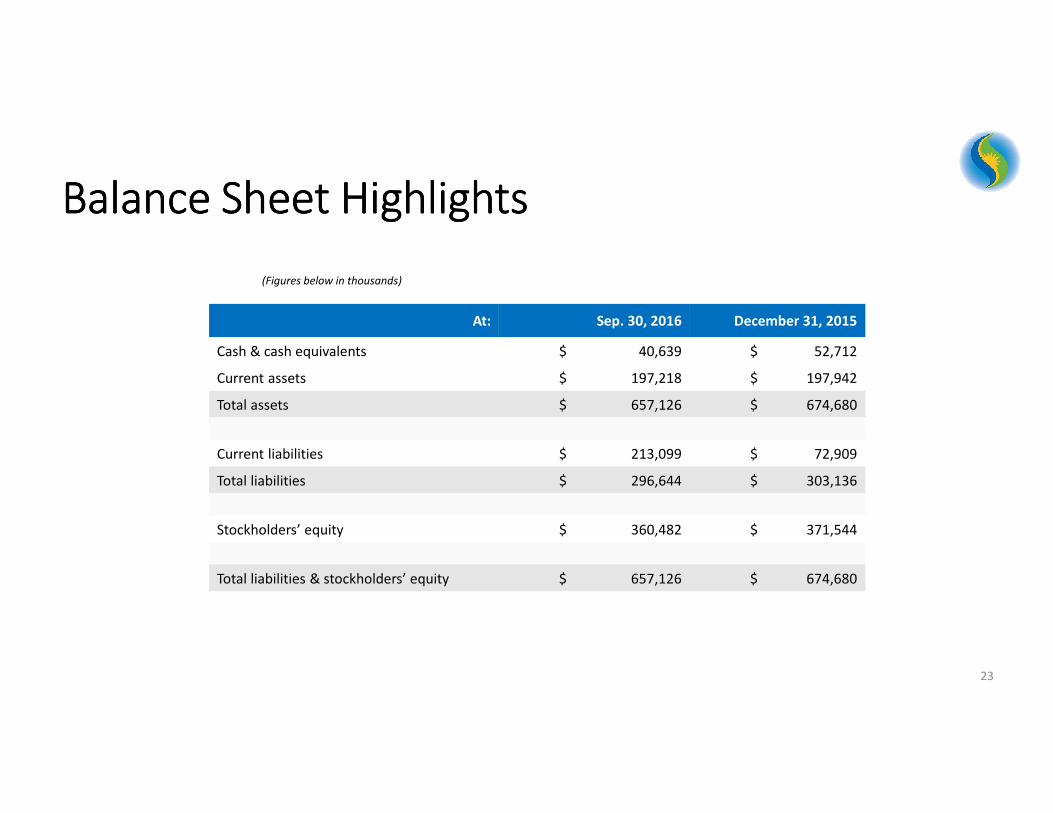
At: Sep. 30, 2016 December 31, 2015
Cash & cash equivalents $ 40,639 $ 52,712
Current assets $ 197,218 $ 197,942
Total assets $ 657,126 $ 674,680
Current liabilities $ 213,099 $ 72,909
Total liabilities $ 296,644 $ 303,136
Stockholders’ equity $ 360,482 $ 371,544
Total liabilities & stockholders’ equity $ 657,126 $ 674,680
(Figures below in thousands)
23
Balance Sheet HighlightsBalance Sheet HighlightsBalance Sheet HighlightsBalance Sheet Highlights

24
Strategy for GrowthStrategy for GrowthStrategy for GrowthStrategy for Growth
o Evaluating and investing in innovative technologies that optimize plant efficiencies,
improve our carbon score and ultimately enhance our profitability
o Reduce cost of capital by restructuring term debt
o Leverage diverse base of production and marketing assets to expand share of renewable
fuel and co-product markets
Lower carbon scoreStrengthen
balance sheet
Implement plant
improvements
Leverage diverse
assets
TTTTHANKHANKHANKHANK YYYYOUOUOUOU
25

26
AAAAPPENDIXPPENDIXPPENDIXPPENDIX
Management believes that certain financial measures not in accordance with generally accepted accounting principles (GAAP) are useful measures of operations.
The company defines Adjusted EBITDA as unaudited net income (loss) attributed to Pacific Ethanol before interest, provision (benefit) for income taxes, fair value adjustments,
purchase accounting adjustments and depreciation and amortization expense. A table is provided at the end of this presentation that provides a reconciliation of Adjusted
EBITDA to its most directly comparable GAAP measure. Management provides this non-GAAP measure so that investors will have the same financial information that
management uses, which may assist investors in properly assessing the company’s performance on a period-over-period basis. Adjusted EBITDA is not a measure of financial
performance under GAAP, and should not be considered an alternative to net income or any other measure of performance under GAAP, or to cash flows from operating,
investing or financing activities as an indicator of cash flows or as a measure of liquidity. Adjusted EBITDA has limitations as an analytical tool and you should not consider this
measures in isolation or as a substitute for analysis of the company’s results as reported under GAAP.
27
Use of NonUse of NonUse of NonUse of Non----GAAP Measures GAAP Measures GAAP Measures GAAP Measures

* Adjusted for non-controlling interests
3 Mos. 3 Mos. 3 Mos. 3 Mos.
9/30/169/30/169/30/169/30/16
3 Mos. 3 Mos. 3 Mos. 3 Mos.
9/30/159/30/159/30/159/30/15
9 Mos. 9 Mos. 9 Mos. 9 Mos.
9/30/169/30/169/30/169/30/16
9 Mos. 9 Mos. 9 Mos. 9 Mos.
9/30/159/30/159/30/159/30/15
Net loss attributed to Pacific Ethanol $ (3,518) $ (14,663) $ (11,658) $ (18,033)
Adjustments:
Interest expense* 3,874 5,167 16,643 7,134
Provision (benefit) for income taxes -- (3,925) (245) (6,095)
Purchase accounting adjustments -- 8,700 -- 8,700
Fair value adjustments 69 (1,202) 53 (1,413)
Depreciation and amortization expense* 8,857 8,355 26,526 14,919
Total adjustments 12,800 17,095 42,977 23,245
Adjusted EBITDA $ 9,282 $ 2,432 $ 31,319 $ 5,212
(Figures below in thousands)
28
Adjusted EBITDA ReconciliationAdjusted EBITDA ReconciliationAdjusted EBITDA ReconciliationAdjusted EBITDA Reconciliation
* Adjusted for noncontrolling interest.