Embed Size (px)
Citation preview

IJRRAS 11 (2) ● May 2012 www.arpapress.com/Volumes/Vol11Issue2/IJRRAS_11_2_16.pdf
310
P53 MUTATIONS AS FINGERPRINTS OF ENVIRONMENTAL
CARCINOGENS
Nadia Helal
1, Rizk Abdel Moneim
2 & Marwa Yassein
2
1 Nuclear&Radiological Regulatory Authority, Nasr City 11762, P. O. Box 7551, Cairo, Egypt.
2 Physics Department, Faculty of Science, Helwan University, Ain Helwan 11795, Cairo, Egypt.
*Email: [email protected]
ABSTRACT
Mutations in the tumor suppressor gene P53 are associated with a wide range of different cancers. Most mutation
detected was a single nucleotide mismatch (single nucleotide polymorphism (SNP)) that occurred in the P53-gene
coding region. P53 mutations indicate that the sites and features of DNA base changes differ among the various
human tumor types and depend on carcinogen type. The molecular epidemiology of p53 mutations allows the
possibility of correlating particular mutations with specific carcinogens and establishing one step in the causal
pathway between exposure to carcinogens and the development of cancer. Moreover, these carcinogens leave
molecular fingerprints on the p53 gene.
In this work, we have constructed a program using Matlab for screening and aligning P53-gene. This may help in
detecting the alterations and estimate the site of mutation along the gene sequence. The constructed program has
been applied for wild-type P53-gene (reference) and P53-gene for patients who have cancer treated with radio/
chemotherapy or exposed to different carcinogens (test). We conclude that the constructed program may consider as
a comprehensive screening tool for sequence alterations in tumors. It allows one to make comparison between
different sequences of any gene and detect the sites of mutations. The systematic study of these mutations may help
to find additional links between suspected carcinogens and different human cancers; it may also provide valuable
information on the relationship between carcinogen exposure and DNA damage in cancer-related genes.
Key Words: P53 Gene, carcinogens, MATLAB program, and SNP.
1. INTRODUCTION
The normal functioning of p53 is a potent barrier to cancer. Tumor-associated mutations in TP53, typically single
nucleotide substitutions in the coding sequence, are a hallmark of most human cancers and cause dramatic defects in
p53 function. By contrast, only a small fraction, if any, of the >200 naturally occurring sequence variations (single
nucleotide polymorphisms, SNPs) of TP53 in human populations are expected to cause measurable perturbation of
p53 function [1]. The protein product of p53 gene is involved in DNA damage response; consequently p53 gene may
be a preferred target for carcinogens, which also act as DNA damaging agents. This is probably why p53 mutations
are frequent in cancers linked to carcinogens. Moreover, these carcinogens leave molecular fingerprints on the p53
gene. Also we can know the effect of radio and chemotherapy on p53 gene by studying p53 status. Almost all of the
major cancers (cancers of the skin, lung, liver, breast, gastrointestinal tract, bladder, hematological) display
mutations scattered at the DNA-binding domain. There are mainly five reported hotspots (codons 175, 248, 249,
273, and 282) [2]
2. P53 MUTATIONS AND CARCINOGENS
Cancer is caused by changes in a cell's DNA. Some of these changes may be inherited from our parents (only 5%),
while others may be caused by outside exposures, which are often referred to as carcinogens, such as, Lifestyle
factors (nutrition, smoking), naturally occurring exposures (ultraviolet light, radon gas, infectious agents, etc.),
medical treatments (chemotherapy, radiation, etc.), workplace exposures ( uranium exposure), household exposures,
pollution (Aflatoxin B1 contaminated crops) [3]. Because of the widespread involvement of p53 in many types of
cancer, significant information concerning links between specific exposures, mutations in p53, and cancer type is
available. The p53 gene has been isolated and sequenced in a wide variety of cancers and the presence of signature
mutations in several exposure-induced types of cancer has been described [4]. These findings indicate that the p53
gene can be used as an indicator to reconstruct exposure and to identify the carcinogen responsible for the mutation.
The usefulness of p53 in exposure assessment is illustrated in the following sections.

IJRRAS 11 (2) ● May 2012 Helal & al. ● P53 Mutations as Fingerprints of Environmental Carcinogens
311
2.1 Dietary Aflatoxin B1
One of the best documented examples of the value of p53 as a biomarker of effect is the association that has been
established between exposure to dietary aflatoxin B1 (AFB1), hepatocellular carcinoma (HCC) of the liver, and
mutation in the p53 gene. AFB1, a fungal mycotoxin produced by aspergillus flavus, is a common contaminant in
grains, nuts, and oil seeds in certain geographical regions. In areas where exposure is endemic, such as sub-saharan
Africa and southern China, dietary AFB1 is considered a major risk factor for HCC [5], which occurs at high levels
in the population. Hepatitis B infection is often also common in these regions and is considered to have a substantial
and perhaps synergistic causative role in the development of HCC. A point mutation at the third position of codon
249 resulting in a G:C to T:A transversion (AGG-AGT) was common in HCC. P53 mutant DNA may be a
biomarker of exposure to AFB1 and possibly early HCC [6].
2.2. Vinyl Chloride
Occupational exposure to vinyl chloride during the manufacture of plastics has been tied to the occurrence of
angiosarcoma of the liver (ASL), a rare form of cancer. Typical p53 mutations was published for the first time in
1974, after a series of workers had developed hepatic angiosarcoma with an association to their exposure to vinyl
chloride (VC), the typical A:T to T:A transversions in the codons 179, 249, and 255 have been described [7].
2.3. Radiotherapy
High risks of lung cancer occur after successful radiation therapy treatment of Hodgkin’s disease. The lung cancers
occurred 9.8 years (mean) after treatment. Radiation doses to lung lobes that developed the tumors averaged 5.7 Gy
[8]. Despite moderate or heavy smoking histories in all patients, the mutation site in second lung cancers after
radiation therapy for Hodgkin’s disease appears to differ from usual smoking-related lung cancers in which G:C-T:A
transversions predominate. The absence of G:C-T:A mutations and the prominence of G:C-A:T transitions which
are characteristic of radiation and oxidative damage, suggest that radiotherapy might have caused some of the p53
mutations. These data illustrate the potential of mutation analysis to determine causes of human cancer. If
confirmed in a larger series, these results imply that some radiation-induced cancers can be distinguished from those
caused by other factors [9].
3. METHODOLOGY
Because specific types or patterns of mutation in the p53 gene can serve as indicators or predictors of cancers
resulting from exposure, the detection of such mutations is important not only for establishing a cause-effect
relationship between exposure and disease, but also for screening of exposed populations prior to the onset of
cancer. The mutations of p53 gene have been extensively studied in many human cancers for the last decade.
Therefore, there is a large number of mutation data on p53 gene available on several databases. We used two of
these databases [10, 11], to analyze the patterns of p53 mutations in some common human malignancies. The sites
of mutations were detected using Matlab constructed program.
3.1. Matlab Program
MATLAB is a high-level language and interactive environment that enables one to perform computationally
intensive tasks faster than with traditional programming languages such as C, C++, and FORTRAN. One can use
MATLAB in a wide range of applications, including signal and image processing, communications, control
design, test and measurement, financial modeling and analysis, and computational biology [12]. In this work we use
Global Alignement; an attempt is made to align the entire sequence, using as many characters as possible, up to
both ends of each sequence. Sequences that are quite similar and approximately the same length are suitable
candidates for global alignment [13].
3.1.1. Constructed Program
The present work provides computer program with Matlab language for wild type and mutant type of P53-gene,
using a series of cods to align and detect the site of mutation along P53-gene. The inputs of constructed program are
two P53-gene sequence text files, one has wild-type P53 sequence (reference) and the other has mutant type P53-
gene sequence (test). Program compares these two files, and detects the site of mutation. The structure (flow chart)
of present computer program is shown in figure 1.

IJRRAS 11 (2) ● May 2012 Helal & al. ● P53 Mutations as Fingerprints of Environmental Carcinogens
312
NO Yes
NO Yes
N o
Yes
Figure 1: The flowchart represents MATLAB constructed program.
Select test file name Select reference file name
filename.txt
If files exist
end
Reference=test
Print 'No mutation'
end i=1: length (reference)
Reference (i) ~= test (i)
Align tow sequences and find
base difference between them
Represent mutation event and its
position on graph (plot)
end
i=i+1 i=i+1 Out(i)
Start

IJRRAS 11 (2) ● May 2012 Helal & al. ● P53 Mutations as Fingerprints of Environmental Carcinogens
313
In bioinformatics, a sequence alignment is a way of arranging the sequences of DNA, RNA, or protein to identify
regions of similarity between the sequences. Aligned sequences of nucleotide or amino acid residues are typically
represented as rows within a matrix. Identical or similar characters are aligned in successive columns. Matlab
alignment finds homologous sequences, not by comparing either sequence in its entirety, but rather by locating short
matches between the two similar sequences. programs also use color to display information, similar characters
represented by red color and dissimilar one by black or pink color, as shown in the aligned sequence window
(program results) see figure 2 (a). The identities of two sequences reads from left top corner in aligned sequences
window as in figure 2 (a), identities=6/8 where 6 is the number of similar bases and 8 is the length of the sequence
(all bases) .
.
Figure 2: the output of constructed program for proposed reference sequence (AACCGGTT) and test sequence
(AGCTGGTT). (a) Shows the alignment between these two sequences. Transition from A to G is represented by pink
color and C to T transition represented by black color. The identities are 6/8 (75%). (b) Command window give
mutation type and its position (base number 7) and codon (c) plot represents mutation sites in p53 gene, at second
base in reference sequence where A has changed to G and fourth base C has changed to T.
Figure 2a shows the mutation events of transition or transversion, and the mutation position is given in command
window. The resulted output is shown in figures 2(b) and 2(c) respectively. The output codon number is used as an
indication of the three codon bases changes. For illustration, If codon number is 2.3333 it means that a point
mutation will occur at the first position of codon 3, but if codon number is 2.6667 then a point mutation occurs at the
second position of codon 3, and 3 represent a point mutation which occur at the third position of codon 3.
Figure 2 (c) represents a plot of the base number on x-axis and mutation events on y-axis. The mutation in the four
bases is represented by different colors. The mutation in adenine base (A) will appear by green color, changes in
(a) Aligned sequence window.
(b) Command window.
(c) plot of mutation events at each reference
base number( base number on x axis and mutation event in y axis) .
.

IJRRAS 11 (2) ● May 2012 Helal & al. ● P53 Mutations as Fingerprints of Environmental Carcinogens
314
cytosine (C) will be shown by blue color, finally, mutations in guanine (G) and thymine (T) are represented by
black and red colors respectively. Y-axis scaled for 12 mutation events (A-C, A-G, A-T,C-A, C-G, C-T, G-A, G-C,
G-T,T-A, T-C, T-G). T-G means thymine changes to guanine.
4. RESULTS AND DISCUSSIONS
The present work provides a computer program with MATLAB language for p53 gene alteration detection. The main purpose is to programmatically identify matches and mismatches between specific base pairs in two P53
sequences (reference and test sequence). For a small number of sequences, this can be done visually by hand quite
easily. However, it becomes quite tedious when greater number is involved. Matlab constructed program was
developed to solve this problem programmatically for a larger number of sequences.
Using a series of codes and functions to represent wild type and mutant p53-gene was presented. The Matlab
program provides a powerful programming language, as well as an interactive computational environment. All p53
gene has been screened for both wild-type and mutant-type P53 of some cancers. Applying the constructed program
with Matlab, the alignment and mutation base number along the gene sequence is given. The constructed program
window for wild-type P53 and mutant P53 sequence is shown in figure 3.

IJRRAS 11 (2) ● May 2012 Helal & al. ● P53 Mutations as Fingerprints of Environmental Carcinogens
315

IJRRAS 11 (2) ● May 2012 Helal & al. ● P53 Mutations as Fingerprints of Environmental Carcinogens
316
Figure 3: the constructed matlab program in editor matlab window.

IJRRAS 11 (2) ● May 2012 Helal & al. ● P53 Mutations as Fingerprints of Environmental Carcinogens
317
Figure 4, shows an example of the input data as a text files. The wild-type P53 gene is represented as a reference file
and the mutant sequence of P53 gene for hepatocellular carcinoma patients exposed to dietary aflatoxin B1 is used
as a test files, both files are saved in matlab folder.
Figure 4 a: the wild-type p53 gene sequence (reference file)
Figure 4b: p53 gene sequence for hepatocellular carcinoma patient exposed to dietary aflatoxin B1 (test file)

IJRRAS 11 (2) ● May 2012 Helal & al. ● P53 Mutations as Fingerprints of Environmental Carcinogens
318
The constructed program aligned two input sequences of P53 nucleotides (bases) to identify regions of similarity
between these sequences. For illustration, the aligned sequence of patients exposed to dietary aflatoxin B1 is shown
in figure 5(a). Mutation events, mutation positions and mutated codons are shown in matlab command window of
figure 5(b) and the resulted plot is shown in figure 5(c). To know the mutation site along P53-gene, clicking the
mouse on appoint of interest, displays data value of the point clicked.
The constructed model and the obtained alignment have the potential to detect the gene mutations since the change
in base color from red to black or pink suggesting the presence of mutation.
(a) The aligned sequence of patient exposed to dietary aflatoxin B1 .
(b) Command window.
(c) Plot of mutation event versus base number.
Figure 5: the output of constructed program for patients exposed to dietary folatoxin B1. (a) Shows the alignment
between wt P53 and mutant sequence of P53 for one of the patients. (b) Command window chart. (c) Plot of the
mutation site along p53.

IJRRAS 11 (2) ● May 2012 Helal & al. ● P53 Mutations as Fingerprints of Environmental Carcinogens
319
From the above figure, the patient exposed to aflatoxin B1 has G to T transversion which represented by black color
(highlighted by blue oval shape) as seen in fig. 5a.with an identities of 1178/1179 (100%). In fig. 5b, the command
window shows further details about the mutation where it gives its exact position (base number 747 in codon 249)
along the gene. Fig. 5c, represents the mutation site in p53 gene which occur at base number 747 and G in wt P53
gene has changed to T.
Figure 6(a) represents aligned sequence to P53 gene for worker exposed to vinyl chloride. The mutated codons, and
mutation events are shown in figure 6(b) and (c).
(a) The aligned sequence for a worker exposed to Vinyl Chloride.
(b) Command window.
(c) Plot of mutation event versus base number.
Figure 6: output of constructed program for worker exposed to vinyl chloride. (a) The nucleotide conversion. (b)
Command window shows the mutation type and position. (c) plot of the base number versus mutation position.
IJRRAS 11 (2) ● May 2012 Helal & al. ● P53 Mutations as Fingerprints of Environmental Carcinogens
320
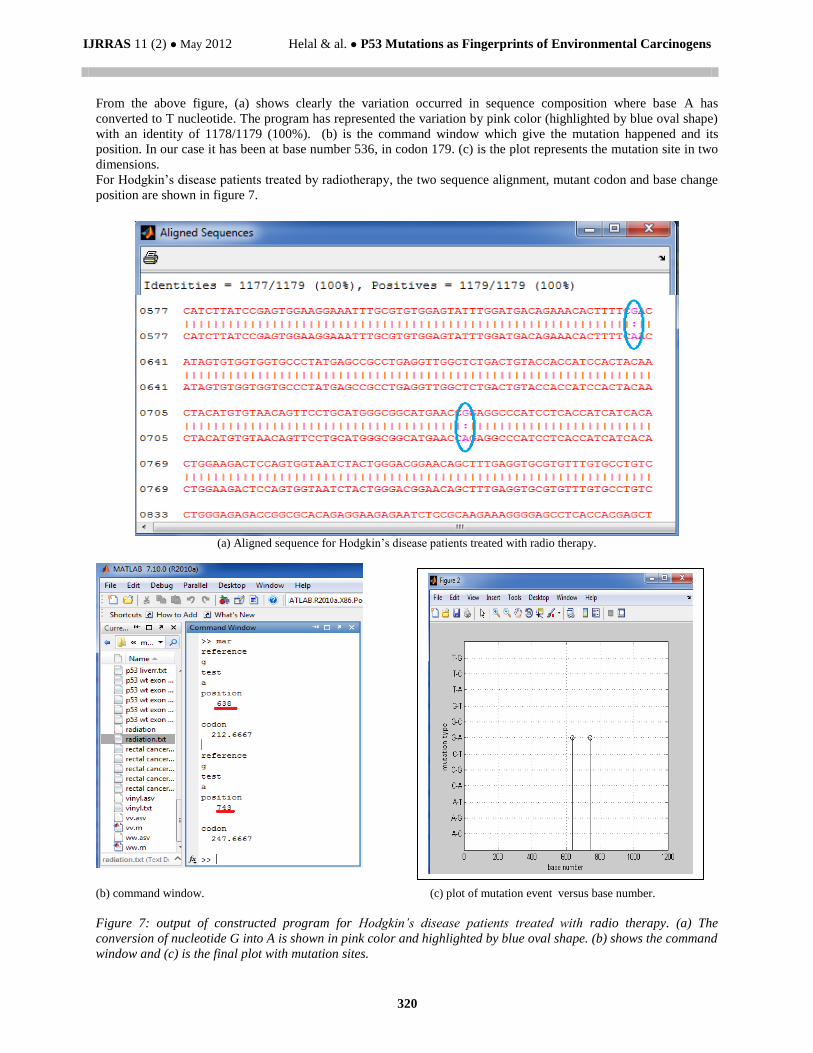
From the above figure, (a) shows clearly the variation occurred in sequence composition where base A has
converted to T nucleotide. The program has represented the variation by pink color (highlighted by blue oval shape)
with an identity of 1178/1179 (100%). (b) is the command window which give the mutation happened and its
position. In our case it has been at base number 536, in codon 179. (c) is the plot represents the mutation site in two
dimensions.
For Hodgkin’s disease patients treated by radiotherapy, the two sequence alignment, mutant codon and base change
position are shown in figure 7.
(a) Aligned sequence for Hodgkin’s disease patients treated with radio therapy.
(b) command window. (c) plot of mutation event versus base number.
Figure 7: output of constructed program for Hodgkin’s disease patients treated with radio therapy. (a) The
conversion of nucleotide G into A is shown in pink color and highlighted by blue oval shape. (b) shows the command
window and (c) is the final plot with mutation sites.

IJRRAS 11 (2) ● May 2012 Helal & al. ● P53 Mutations as Fingerprints of Environmental Carcinogens
321
From the above figure, the identities are 1177/1179 almost 100 % (fig. 7a). The type and position of mutation is
given in fig. 7b, where the base number 638 locates at the second base of codon 213, and the base number 743 is the
second base in codon 248. Finally, fig. 7c represents two sites of mutation along p53.
5. CONCLUSION
We have presented in this paper a mathematical methodology for clinical reporting of genetic variants in tumor
suppressor gene (P53) conferring a high risk of cancer. This is by applying an algorithm for
comparing primary biological sequence information, such as the amino-acid sequences of different proteins or
the nucleotides of DNA sequences.
This study will help to identify a subgroup of patients that may have tumors that are associated with environmental
exposures (carcinogen). Patients had different p53 gene alteration depend on carcinogen type and varied from one
cancer to another. We conclude that the constructed program is much faster and can process large sequences in relatively short time. The program is usable to detect base-mismatches events and its position along P53 gene sequence. The detection of such particular mutation in normal-appearing tissue provides further support for the involvement of
a specific carcinogen in a specific human cancer. Once a careful assessment of causation has been done for a
presumed carcinogen association, its associated molecular damage, and the final disease, individuals with an
increased cancer risk may be identified.
6. REFERENCES
[1]. Cetin R. and Ozturk M. "p53 mutations as fingerprints of environmental carcinogens" Pure and Applied
Chemistry, Vol.72, PP, 995-999, 2000.
[2]. Richard W Clapp; Molly M Jacobs; Edward L Loechler “Environmental and occupational causes of cancer:
new evidence 2005-2007”. Reviews on environmental health, 23(1):1-37. 2008.
[3]. Tamar L., Laurence M."Hepatocellular carcinoma p53G>T transversions at codon 249: the fingerprint of
aflatoxin exposure?" Journal of the National Cancer Institute. Vol. 87 Issue 12, p861, 1997.
[4]. Frank Staib, S. Hussain P., Lorne J. Hofseth, Xin W. Wang, and Curtis C. Harris. " TP53 and Liver
Carcinogenesis". Human Mutation, vol., PP. 21: 201-216, 2003.
[5]. Virna M. G. De Benedetti, Lois B. Travis, Judith A. Welsh, Flora E. Van Leeuwen, Marilyn Stovall, E.
Aileen Clarke, John D. Boice Jr., and William P. Bennett. “P53 Mutations in Lung Cancer following
Radiation Therapy for Hodgkin’s disease". Cancer Epidemiology Biomarkers. Vol. 5, PP. 93-98, 1996.
[6]. Mabrouk M. S., Hamdy M., Mamdouh M., Aboelfotoh M., Kadah Y. M. " BIOINFTool: Bioinformatics and
sequence data analysis in molecular biology using Matlab". Proceeding Cairo International Biomedical
Engineering Conference, 2006.
[7]. Scélo G, Constantinescu V, Csiki I, Zaridze D, Szeszenia-Dabrowska N, Rudnai P, Lissowska J, Fabiánová
E, Cassidy A, Slamova A, Foretova L, Janout V, Fevotte J, Fletcher T, Mannetje A, Brennan P, Boffetta P.
“Occupational exposure to vinyl chloride, acrylonitrile and styrene and lung cancer risk (europe)”. Cancer
Causes Control, 15(5):445-52. 2004.
[8]. Gilbert ES, Stovall M, Gospodarowicz M, Van Leeuwen FE, Andersson M, Glimelius B, Joensuu T, Lynch
CF, Curtis RE, Holowaty E, Storm H, Pukkala E, van't Veer MB, Fraumeni JF, Boice JD Jr, Clarke EA,
Travis LB. “Lung cancer after treatment for Hodgkin's disease: focus on radiation effects”. Radiation
Research: 159(2):161-73. 2003.
[9]. Lois B. Travis, Marry Gospodarowicz, Rochelle E. Curtis, E. Aileen Clarke, Michael Andersson, Bengt
Glimelius, et al., “Lung Cancer Following Chemotherapy and Radiotherapy for Hodgkin's Disease”. National
Cancer Institute, 94 (3): 182-192. 2002.
[10]. http://www.P53.iarc.fr.
[11]. http://www.p53.free.fr.
[12]. http://www.mathwork.com
[13]. http://www-p53.iarc.fr/SequenceAlignment.html