Embed Size (px)
Citation preview
Page 1p121866 - ICANN Global Study Wave 2 - ConsumersNielsenBanner 3
8 Jun 2016Table 1Q75. Sample source
Base: All Respondents
Region
2016 Total 2016 North 2016 South2015 Total Consumers 2015 North America 2015 South America 2016 Europe 2016 Africa 2016 AsiaConsumers (18+) America (18+) America (18+) 2015 Europe (18+) 2015 Africa (18+) 2015 Asia (18+)
(A) (B) (C) (D) (E) (F) (G) (H) (I) (J) (K) (L)
6144 5452 925 826 599 507 1086 963 409 378 3125 2778Unweighted Base
1573 800 702 642 - - 871 158 - - - -26% 15% 76% 78% - - 80% 16% - - - -
BEIK FJL AEIK BFHJL HACEIK FJL
HPOL
1 - - - - - 1 - - - - -* - - - - - * - - - - -
Novatris
- - - - - - - - - - - -- - - - - - - - - - - -
Toluna
- - - - - - - - - - - -- - - - - - - - - - - -
AIP
4570 4652 223 184 599 507 214 805 409 378 3125 277874% 85% 24% 22% 100% 100% 20% 84% 100% 100% 100% 100%
CG AD G ACG BDH GD ACG BDH ACG BDH
Survey Router Federated
6144 5452 925 826 599 507 1086 963 409 378 3125 2778100% 100% 100% 100% 100% 100% 100% 100% 100% 100% 100% 100%
Sigma
_________________________________________________________________________________________________________________Proportions/Means: Columns Tested (5% risk level) - A/B - C/D - E/F - G/H - I/J - K/L - A/C/E/G/I/K - B/D/F/H/J/LOverlap formulae used.
Page 2p121866 - ICANN Global Study Wave 2 - ConsumersNielsenBanner 3
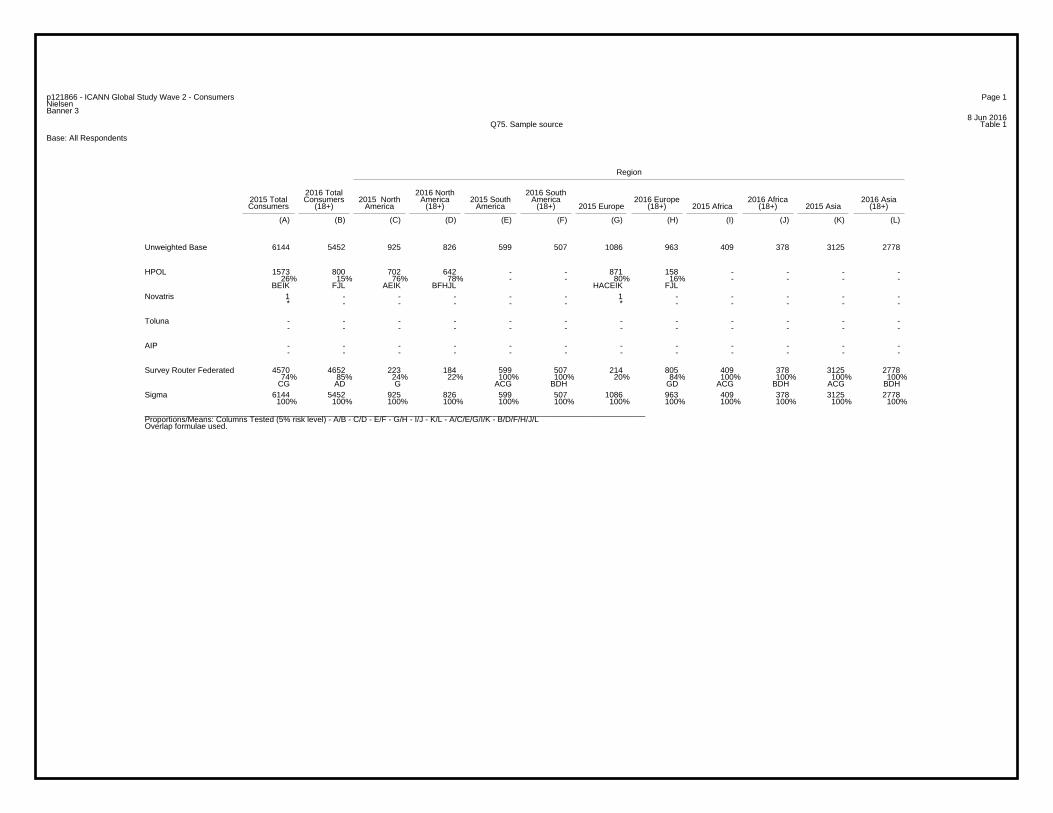
8 Jun 2016Table 2Q616. COUNTRY
Base: All Respondents
Region
2016 Total 2016 North 2016 South2015 Total Consumers 2015 North America 2015 South America 2016 Europe 2016 Africa 2016 AsiaConsumers (18+) America (18+) America (18+) 2015 Europe (18+) 2015 Africa (18+) 2015 Asia (18+)
(A) (B) (C) (D) (E) (F) (G) (H) (I) (J) (K) (L)
6144 5452 925 826 599 507 1086 963 409 378 3125 2778Unweighted Base
502 461 502 461 - - - - - - - -8% 8% 54% 56% - - - - - - - -
EGIK FHJL AEGIK BFHJL
US
200 181 200 181 - - - - - - - -3% 3% 22% 22% - - - - - - - -
EGIK FHJL AEGIK BFHJL
CANADA
223 184 223 184 - - - - - - - -4% 3% 24% 22% - - - - - - - -
EGIK FHJL AEGIK BFHJL
MEXICO
101 90 - - - - 101 90 - - - -2% 2% - - - - 9% 9% - - - -
CEIK DFJL ACEIK BDFJL
ITALY
102 95 - - - - 102 95 - - - -2% 2% - - - - 9% 10% - - - -
CEIK DFJL ACEIK BDFJL
TURKEY
100 97 - - - - 100 97 - - - -2% 2% - - - - 9% 10% - - - -
CEIK DFJL ACEIK BDFJL
SPAIN
112 92 - - - - 112 92 - - - -2% 2% - - - - 10% 10% - - - -
CEIK DFJL ACEIK BDFJL
POLAND
220 180 - - - - 220 180 - - - -4% 3% - - - - 20% 19% - - - -
CEIK DFJL ACEIK BDFJL
UK
201 181 - - - - 201 181 - - - -3% 3% - - - - 19% 19% - - - -
CEIK DFJL ACEIK BDFJL
FRANCE
250 228 - - - - 250 228 - - - -4% 4% - - - - 23% 24% - - - -
CEIK DFJL ACEIK BDFJL
GERMANY
1110 996 - - - - - - - - 1110 99618% 18% - - - - - - - - 36% 36%
CEGI DFHJ ACEGI BDFHJ
CHINA
100 93 - - - - - - - - 100 932% 2% - - - - - - - - 3% 3%
CEGI DFHJ ACEGI BDFHJ
VIETNAM
206 184 - - - - - - - - 206 1843% 3% - - - - - - - - 7% 7%
CEGI DFHJ ACEGI BDFHJ
PHILIPPINES
358 315 - - - - - - - - 358 3156% 6% - - - - - - - - 11% 11%
CEGI DFHJ ACEGI BDFHJ
JAPAN
204 183 - - - - - - - - 204 1833% 3% - - - - - - - - 7% 7%
CEGI DFHJ ACEGI BDFHJ
SOUTH KOREA
253 231 - - - - - - - - 253 2314% 4% - - - - - - - - 8% 8%
CEGI DFHJ ACEGI BDFHJ
RUSSIA
_________________________________________________________________________________________________________________Proportions/Means: Columns Tested (5% risk level) - A/B - C/D - E/F - G/H - I/J - K/L - A/C/E/G/I/K - B/D/F/H/J/LOverlap formulae used.

Page 3p121866 - ICANN Global Study Wave 2 - ConsumersNielsenBanner 3
8 Jun 2016Table 2Q616. COUNTRY
Base: All Respondents
Region
2016 Total 2016 North 2016 South2015 Total Consumers 2015 North America 2015 South America 2016 Europe 2016 Africa 2016 AsiaConsumers (18+) America (18+) America (18+) 2015 Europe (18+) 2015 Africa (18+) 2015 Asia (18+)
(A) (B) (C) (D) (E) (F) (G) (H) (I) (J) (K) (L)
6144 5452 925 826 599 507 1086 963 409 378 3125 2778Unweighted Base687 595 - - - - - - - - 687 595
11% 11% - - - - - - - - 22% 21%CEGI DFHJ ACEGI BDFHJ
INDIA
207 181 - - - - - - - - 207 1813% 3% - - - - - - - - 7% 7%
CEGI DFHJ ACEGI BDFHJ
INDONESIA
201 192 - - - - - - 201 192 - -3% 4% - - - - - - 49% 51% - -
CEGK DFHL ACEGK BDFHL
NIGERIA
105 90 - - - - - - 105 90 - -2% 2% - - - - - - 26% 24% - -
CEGK DFHL ACEGK BDFHL
SOUTH AFRICA
103 96 - - - - - - 103 96 - -2% 2% - - - - - - 25% 25% - -
CEGK DFHL ACEGK BDFHL
EGYPT
119 93 - - 119 93 - - - - - -2% 2% - - 20% 18% - - - - - -
CGIK DHJL ACGIK BDHJL
COLOMBIA
110 93 - - 110 93 - - - - - -2% 2% - - 18% 18% - - - - - -
CGIK DHJL ACGIK BDHJL
ARGENTINA
370 321 - - 370 321 - - - - - -6% 6% - - 62% 63% - - - - - -
CGIK DHJL ACGIK BDHJL
BRAZIL
6144 5452 925 826 599 507 1086 963 409 378 3125 2778100% 100% 100% 100% 100% 100% 100% 100% 100% 100% 100% 100%
Sigma
_________________________________________________________________________________________________________________Proportions/Means: Columns Tested (5% risk level) - A/B - C/D - E/F - G/H - I/J - K/L - A/C/E/G/I/K - B/D/F/H/J/LOverlap formulae used.
Page 4p121866 - ICANN Global Study Wave 2 - ConsumersNielsenBanner 3
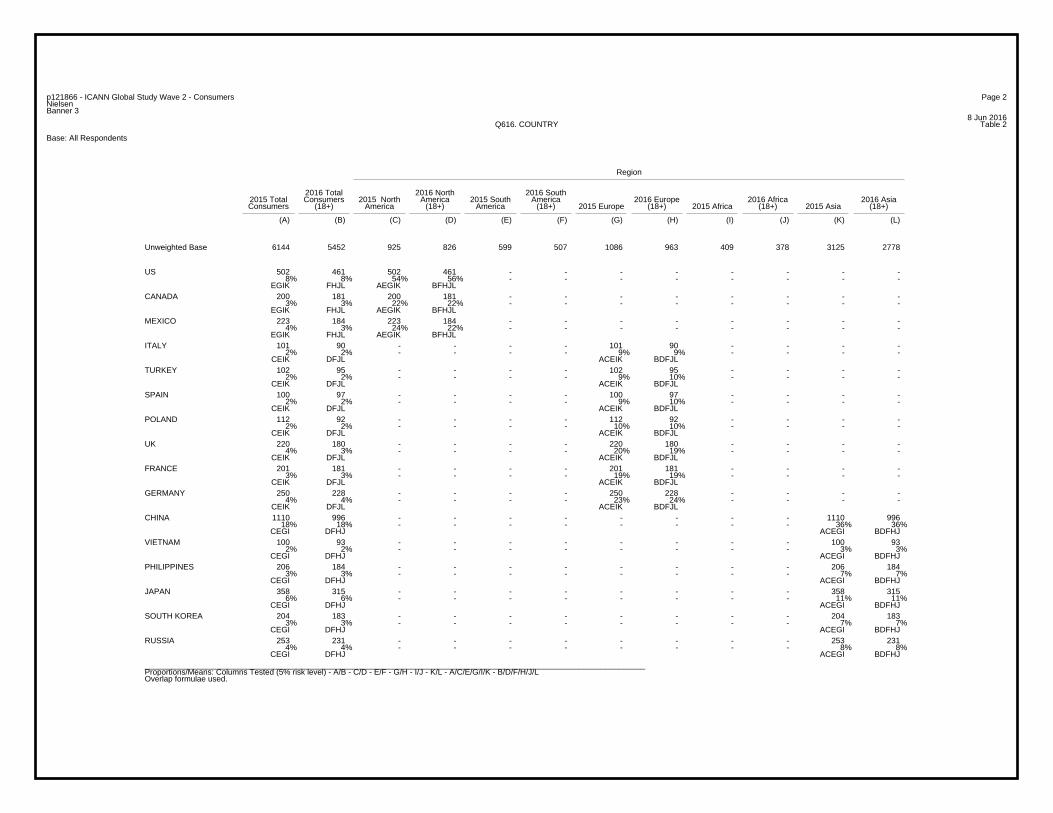
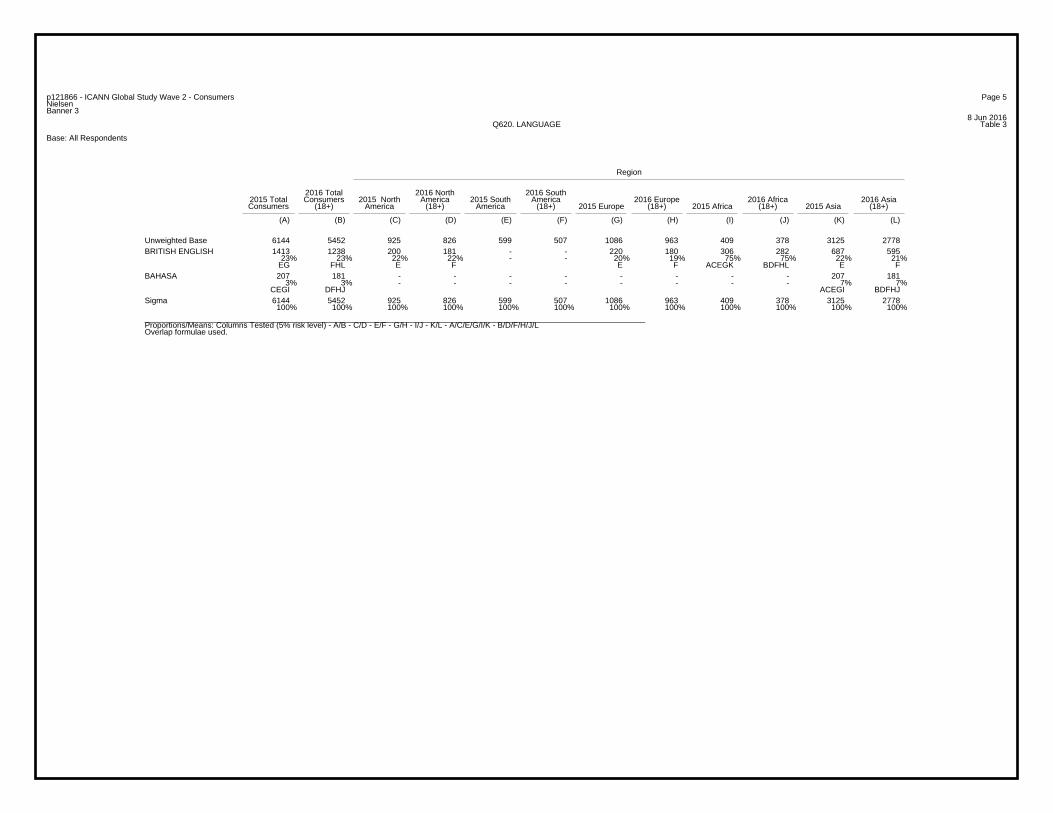
8 Jun 2016Table 3Q620. LANGUAGE
Base: All Respondents
Region
2016 Total 2016 North 2016 South2015 Total Consumers 2015 North America 2015 South America 2016 Europe 2016 Africa 2016 AsiaConsumers (18+) America (18+) America (18+) 2015 Europe (18+) 2015 Africa (18+) 2015 Asia (18+)
(A) (B) (C) (D) (E) (F) (G) (H) (I) (J) (K) (L)
6144 5452 925 826 599 507 1086 963 409 378 3125 2778Unweighted Base
502 461 502 461 - - - - - - - -8% 8% 54% 56% - - - - - - - -
EGIK FHJL AEGIK BFHJL
AMERICAN ENGLISH
100 97 - - - - 100 97 - - - -2% 2% - - - - 9% 10% - - - -
CEIK DFJL ACEIK BDFJL
SPAIN_SPANISH
370 321 - - 370 321 - - - - - -6% 6% - - 62% 63% - - - - - -
CGIK DHJL ACGIK BDHJL
PORTUGUESE (BRAZIL)
1110 996 - - - - - - - - 1110 99618% 18% - - - - - - - - 36% 36%
CEGI DFHJ ACEGI BDFHJ
SIMPLIFIED CHINESE
201 181 - - - - 201 181 - - - -3% 3% - - - - 19% 19% - - - -
CEIK DFJL ACEIK BDFJL
FRENCH (FRANCE)
250 228 - - - - 250 228 - - - -4% 4% - - - - 23% 24% - - - -
CEIK DFJL ACEIK BDFJL
GERMAN
101 90 - - - - 101 90 - - - -2% 2% - - - - 9% 9% - - - -
CEIK DFJL ACEIK BDFJL
ITALIAN
358 315 - - - - - - - - 358 3156% 6% - - - - - - - - 11% 11%
CEGI DFHJ ACEGI BDFHJ
JAPANESE
204 183 - - - - - - - - 204 1833% 3% - - - - - - - - 7% 7%
CEGI DFHJ ACEGI BDFHJ
KOREAN
253 231 - - - - - - - - 253 2314% 4% - - - - - - - - 8% 8%
CEGI DFHJ ACEGI BDFHJ
RUSSIAN
103 96 - - - - - - 103 96 - -2% 2% - - - - - - 25% 25% - -
CEGK DFHL ACEGK BDFHL
ARABIC
100 93 - - - - - - - - 100 932% 2% - - - - - - - - 3% 3%
CEGI DFHJ ACEGI BDFHJ
VIETNAMESE
206 184 - - - - - - - - 206 1843% 3% - - - - - - - - 7% 7%
CEGI DFHJ ACEGI BDFHJ
TAGALOG
102 95 - - - - 102 95 - - - -2% 2% - - - - 9% 10% - - - -
CEIK DFJL ACEIK BDFJL
TURKISH
112 92 - - - - 112 92 - - - -2% 2% - - - - 10% 10% - - - -
CEIK DFJL ACEIK BDFJL
POLISH
452 370 223 184 229 186 - - - - - -7% 7% 24% 22% 38% 37% - - - - - -
GIK HJL AGIK BHJL ACGIK BDHJL
LATAM_SPANISH
_________________________________________________________________________________________________________________Proportions/Means: Columns Tested (5% risk level) - A/B - C/D - E/F - G/H - I/J - K/L - A/C/E/G/I/K - B/D/F/H/J/LOverlap formulae used.
Page 5p121866 - ICANN Global Study Wave 2 - ConsumersNielsenBanner 3
8 Jun 2016Table 3Q620. LANGUAGE
Base: All Respondents
Region
2016 Total 2016 North 2016 South2015 Total Consumers 2015 North America 2015 South America 2016 Europe 2016 Africa 2016 AsiaConsumers (18+) America (18+) America (18+) 2015 Europe (18+) 2015 Africa (18+) 2015 Asia (18+)
(A) (B) (C) (D) (E) (F) (G) (H) (I) (J) (K) (L)
6144 5452 925 826 599 507 1086 963 409 378 3125 2778Unweighted Base1413 1238 200 181 - - 220 180 306 282 687 595
23% 23% 22% 22% - - 20% 19% 75% 75% 22% 21%EG FHL E F E F ACEGK BDFHL E F
BRITISH ENGLISH
207 181 - - - - - - - - 207 1813% 3% - - - - - - - - 7% 7%
CEGI DFHJ ACEGI BDFHJ
BAHASA
6144 5452 925 826 599 507 1086 963 409 378 3125 2778100% 100% 100% 100% 100% 100% 100% 100% 100% 100% 100% 100%
Sigma
_________________________________________________________________________________________________________________Proportions/Means: Columns Tested (5% risk level) - A/B - C/D - E/F - G/H - I/J - K/L - A/C/E/G/I/K - B/D/F/H/J/LOverlap formulae used.
Page 6p121866 - ICANN Global Study Wave 2 - ConsumersNielsenBanner 3
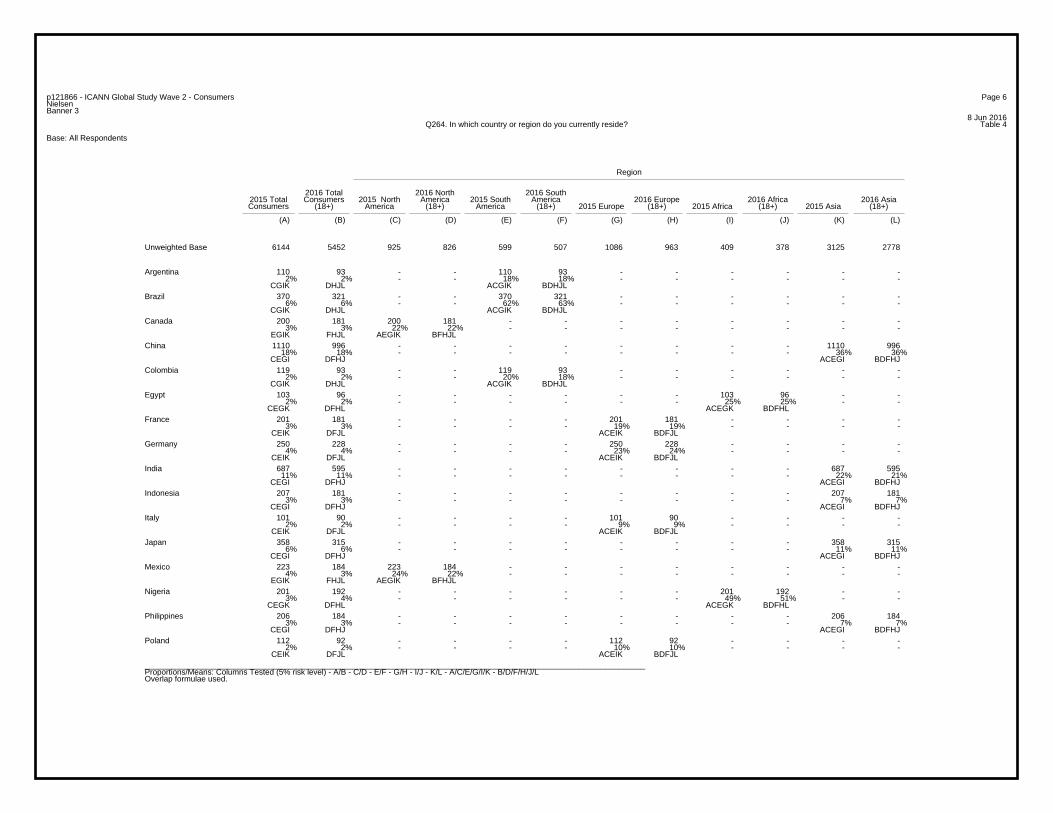
8 Jun 2016Table 4Q264. In which country or region do you currently reside?
Base: All Respondents
Region
2016 Total 2016 North 2016 South2015 Total Consumers 2015 North America 2015 South America 2016 Europe 2016 Africa 2016 AsiaConsumers (18+) America (18+) America (18+) 2015 Europe (18+) 2015 Africa (18+) 2015 Asia (18+)
(A) (B) (C) (D) (E) (F) (G) (H) (I) (J) (K) (L)
6144 5452 925 826 599 507 1086 963 409 378 3125 2778Unweighted Base
110 93 - - 110 93 - - - - - -2% 2% - - 18% 18% - - - - - -
CGIK DHJL ACGIK BDHJL
Argentina
370 321 - - 370 321 - - - - - -6% 6% - - 62% 63% - - - - - -
CGIK DHJL ACGIK BDHJL
Brazil
200 181 200 181 - - - - - - - -3% 3% 22% 22% - - - - - - - -
EGIK FHJL AEGIK BFHJL
Canada
1110 996 - - - - - - - - 1110 99618% 18% - - - - - - - - 36% 36%
CEGI DFHJ ACEGI BDFHJ
China
119 93 - - 119 93 - - - - - -2% 2% - - 20% 18% - - - - - -
CGIK DHJL ACGIK BDHJL
Colombia
103 96 - - - - - - 103 96 - -2% 2% - - - - - - 25% 25% - -
CEGK DFHL ACEGK BDFHL
Egypt
201 181 - - - - 201 181 - - - -3% 3% - - - - 19% 19% - - - -
CEIK DFJL ACEIK BDFJL
France
250 228 - - - - 250 228 - - - -4% 4% - - - - 23% 24% - - - -
CEIK DFJL ACEIK BDFJL
Germany
687 595 - - - - - - - - 687 59511% 11% - - - - - - - - 22% 21%
CEGI DFHJ ACEGI BDFHJ
India
207 181 - - - - - - - - 207 1813% 3% - - - - - - - - 7% 7%
CEGI DFHJ ACEGI BDFHJ
Indonesia
101 90 - - - - 101 90 - - - -2% 2% - - - - 9% 9% - - - -
CEIK DFJL ACEIK BDFJL
Italy
358 315 - - - - - - - - 358 3156% 6% - - - - - - - - 11% 11%
CEGI DFHJ ACEGI BDFHJ
Japan
223 184 223 184 - - - - - - - -4% 3% 24% 22% - - - - - - - -
EGIK FHJL AEGIK BFHJL
Mexico
201 192 - - - - - - 201 192 - -3% 4% - - - - - - 49% 51% - -
CEGK DFHL ACEGK BDFHL
Nigeria
206 184 - - - - - - - - 206 1843% 3% - - - - - - - - 7% 7%
CEGI DFHJ ACEGI BDFHJ
Philippines
112 92 - - - - 112 92 - - - -2% 2% - - - - 10% 10% - - - -
CEIK DFJL ACEIK BDFJL
Poland
_________________________________________________________________________________________________________________Proportions/Means: Columns Tested (5% risk level) - A/B - C/D - E/F - G/H - I/J - K/L - A/C/E/G/I/K - B/D/F/H/J/LOverlap formulae used.
Page 7p121866 - ICANN Global Study Wave 2 - ConsumersNielsenBanner 3
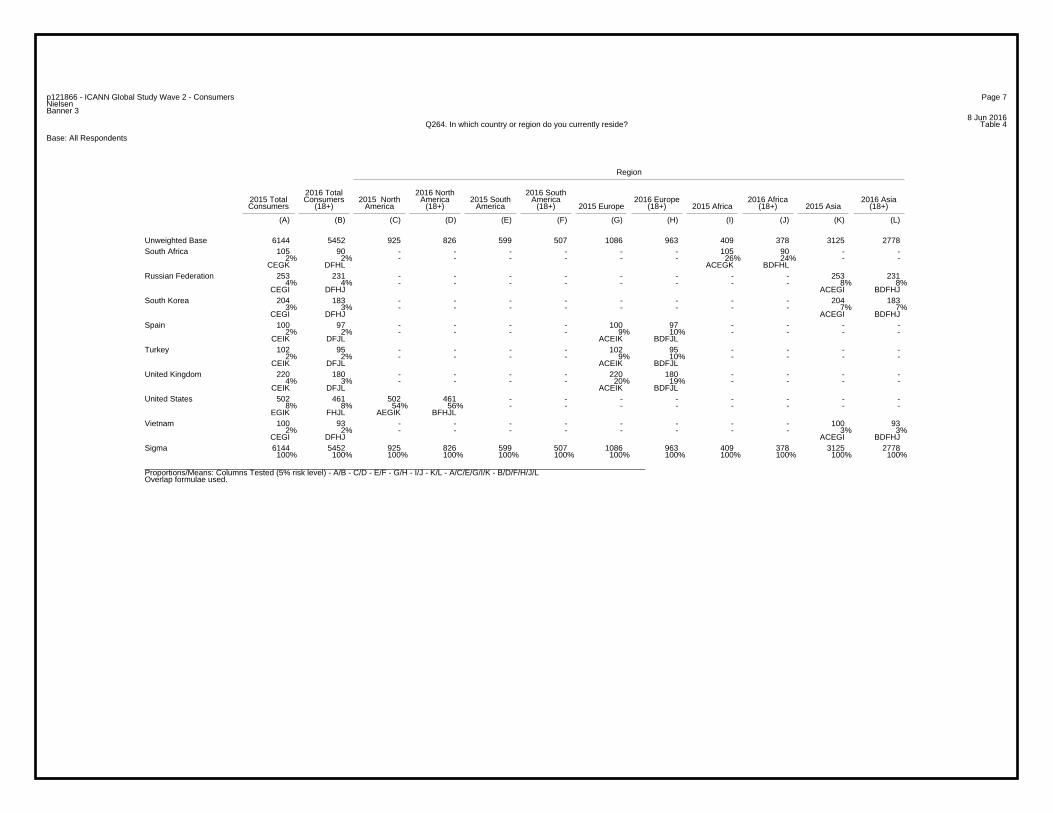
8 Jun 2016Table 4Q264. In which country or region do you currently reside?
Base: All Respondents
Region
2016 Total 2016 North 2016 South2015 Total Consumers 2015 North America 2015 South America 2016 Europe 2016 Africa 2016 AsiaConsumers (18+) America (18+) America (18+) 2015 Europe (18+) 2015 Africa (18+) 2015 Asia (18+)
(A) (B) (C) (D) (E) (F) (G) (H) (I) (J) (K) (L)
6144 5452 925 826 599 507 1086 963 409 378 3125 2778Unweighted Base105 90 - - - - - - 105 90 - -
2% 2% - - - - - - 26% 24% - - CEGK DFHL ACEGK BDFHL
South Africa
253 231 - - - - - - - - 253 2314% 4% - - - - - - - - 8% 8%
CEGI DFHJ ACEGI BDFHJ
Russian Federation
204 183 - - - - - - - - 204 1833% 3% - - - - - - - - 7% 7%
CEGI DFHJ ACEGI BDFHJ
South Korea
100 97 - - - - 100 97 - - - -2% 2% - - - - 9% 10% - - - -
CEIK DFJL ACEIK BDFJL
Spain
102 95 - - - - 102 95 - - - -2% 2% - - - - 9% 10% - - - -
CEIK DFJL ACEIK BDFJL
Turkey
220 180 - - - - 220 180 - - - -4% 3% - - - - 20% 19% - - - -
CEIK DFJL ACEIK BDFJL
United Kingdom
502 461 502 461 - - - - - - - -8% 8% 54% 56% - - - - - - - -
EGIK FHJL AEGIK BFHJL
United States
100 93 - - - - - - - - 100 932% 2% - - - - - - - - 3% 3%
CEGI DFHJ ACEGI BDFHJ
Vietnam
6144 5452 925 826 599 507 1086 963 409 378 3125 2778100% 100% 100% 100% 100% 100% 100% 100% 100% 100% 100% 100%
Sigma
_________________________________________________________________________________________________________________Proportions/Means: Columns Tested (5% risk level) - A/B - C/D - E/F - G/H - I/J - K/L - A/C/E/G/I/K - B/D/F/H/J/LOverlap formulae used.
Page 8p121866 - ICANN Global Study Wave 2 - ConsumersNielsenBanner 3
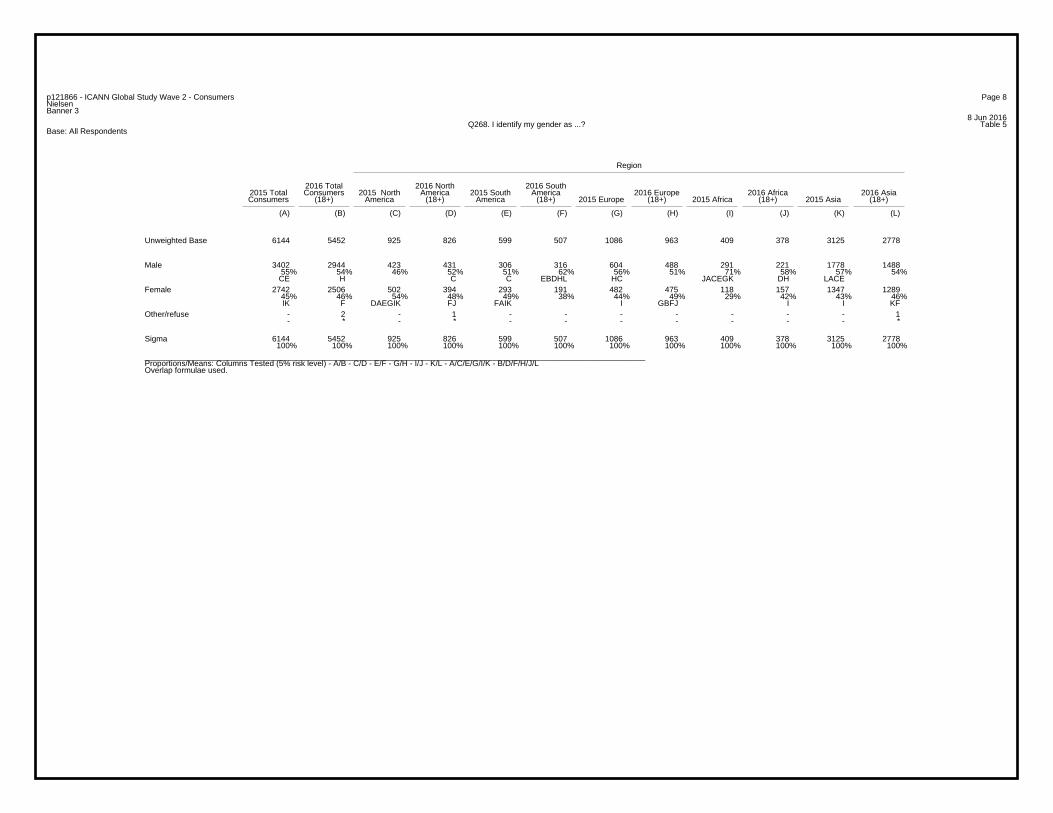
8 Jun 2016Table 5Q268. I identify my gender as ...?
Base: All Respondents
Region
2016 Total 2016 North 2016 South2015 Total Consumers 2015 North America 2015 South America 2016 Europe 2016 Africa 2016 AsiaConsumers (18+) America (18+) America (18+) 2015 Europe (18+) 2015 Africa (18+) 2015 Asia (18+)
(A) (B) (C) (D) (E) (F) (G) (H) (I) (J) (K) (L)
6144 5452 925 826 599 507 1086 963 409 378 3125 2778Unweighted Base
3402 2944 423 431 306 316 604 488 291 221 1778 148855% 54% 46% 52% 51% 62% 56% 51% 71% 58% 57% 54%CE H C C EBDHL HC JACEGK DH LACE
Male
2742 2506 502 394 293 191 482 475 118 157 1347 128945% 46% 54% 48% 49% 38% 44% 49% 29% 42% 43% 46%IK F DAEGIK FJ FAIK I GBFJ I I KF
Female
- 2 - 1 - - - - - - - 1- * - * - - - - - - - *
Other/refuse
6144 5452 925 826 599 507 1086 963 409 378 3125 2778100% 100% 100% 100% 100% 100% 100% 100% 100% 100% 100% 100%
Sigma
_________________________________________________________________________________________________________________Proportions/Means: Columns Tested (5% risk level) - A/B - C/D - E/F - G/H - I/J - K/L - A/C/E/G/I/K - B/D/F/H/J/LOverlap formulae used.
Page 9p121866 - ICANN Global Study Wave 2 - ConsumersNielsenBanner 3
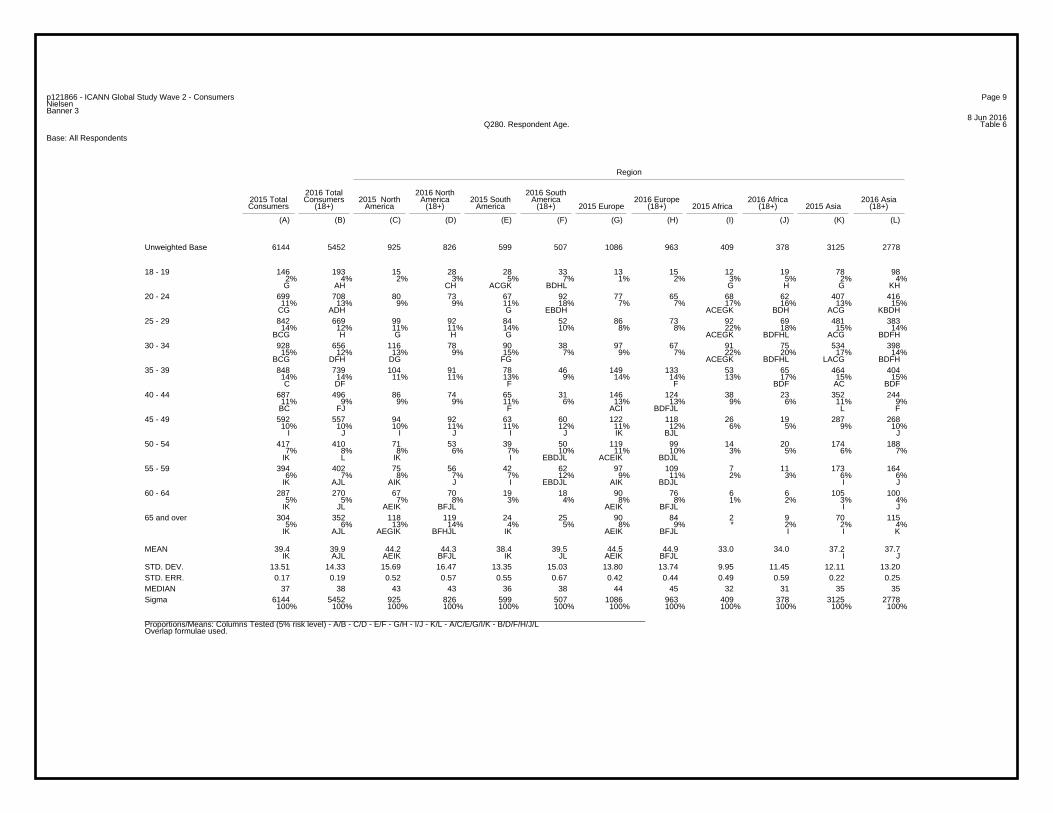
8 Jun 2016Table 6Q280. Respondent Age.
Base: All Respondents
Region
2016 Total 2016 North 2016 South2015 Total Consumers 2015 North America 2015 South America 2016 Europe 2016 Africa 2016 AsiaConsumers (18+) America (18+) America (18+) 2015 Europe (18+) 2015 Africa (18+) 2015 Asia (18+)
(A) (B) (C) (D) (E) (F) (G) (H) (I) (J) (K) (L)
6144 5452 925 826 599 507 1086 963 409 378 3125 2778Unweighted Base
146 193 15 28 28 33 13 15 12 19 78 982% 4% 2% 3% 5% 7% 1% 2% 3% 5% 2% 4%G AH CH ACGK BDHL G H G KH
18 - 19
699 708 80 73 67 92 77 65 68 62 407 41611% 13% 9% 9% 11% 18% 7% 7% 17% 16% 13% 15%
CG ADH G EBDH ACEGK BDH ACG KBDH
20 - 24
842 669 99 92 84 52 86 73 92 69 481 38314% 12% 11% 11% 14% 10% 8% 8% 22% 18% 15% 14%
BCG H G H G ACEGK BDFHL ACG BDFH
25 - 29
928 656 116 78 90 38 97 67 91 75 534 39815% 12% 13% 9% 15% 7% 9% 7% 22% 20% 17% 14%
BCG DFH DG FG ACEGK BDFHL LACG BDFH
30 - 34
848 739 104 91 78 46 149 133 53 65 464 40414% 14% 11% 11% 13% 9% 14% 14% 13% 17% 15% 15%C DF F F BDF AC BDF
35 - 39
687 496 86 74 65 31 146 124 38 23 352 24411% 9% 9% 9% 11% 6% 13% 13% 9% 6% 11% 9%BC FJ F ACI BDFJL L F
40 - 44
592 557 94 92 63 60 122 118 26 19 287 26810% 10% 10% 11% 11% 12% 11% 12% 6% 5% 9% 10%
I J I J I J IK BJL J
45 - 49
417 410 71 53 39 50 119 99 14 20 174 1887% 8% 8% 6% 7% 10% 11% 10% 3% 5% 6% 7%
IK L IK I EBDJL ACEIK BDJL
50 - 54
394 402 75 56 42 62 97 109 7 11 173 1646% 7% 8% 7% 7% 12% 9% 11% 2% 3% 6% 6%
IK AJL AIK J I EBDJL AIK BDJL I J
55 - 59
287 270 67 70 19 18 90 76 6 6 105 1005% 5% 7% 8% 3% 4% 8% 8% 1% 2% 3% 4%
IK JL AEIK BFJL AEIK BFJL I J
60 - 64
304 352 118 119 24 25 90 84 2 9 70 1155% 6% 13% 14% 4% 5% 8% 9% * 2% 2% 4%
IK AJL AEGIK BFHJL IK AEIK BFJL I I K
65 and over
39.4 39.9 44.2 44.3 38.4 39.5 44.5 44.9 33.0 34.0 37.2 37.7IK AJL AEIK BFJL IK JL AEIK BFJL I J
MEAN
13.51 14.33 15.69 16.47 13.35 15.03 13.80 13.74 9.95 11.45 12.11 13.20STD. DEV.0.17 0.19 0.52 0.57 0.55 0.67 0.42 0.44 0.49 0.59 0.22 0.25STD. ERR.
37 38 43 43 36 38 44 45 32 31 35 35MEDIAN6144 5452 925 826 599 507 1086 963 409 378 3125 2778
100% 100% 100% 100% 100% 100% 100% 100% 100% 100% 100% 100%Sigma
_________________________________________________________________________________________________________________Proportions/Means: Columns Tested (5% risk level) - A/B - C/D - E/F - G/H - I/J - K/L - A/C/E/G/I/K - B/D/F/H/J/LOverlap formulae used.
Page 10p121866 - ICANN Global Study Wave 2 - ConsumersNielsenBanner 3
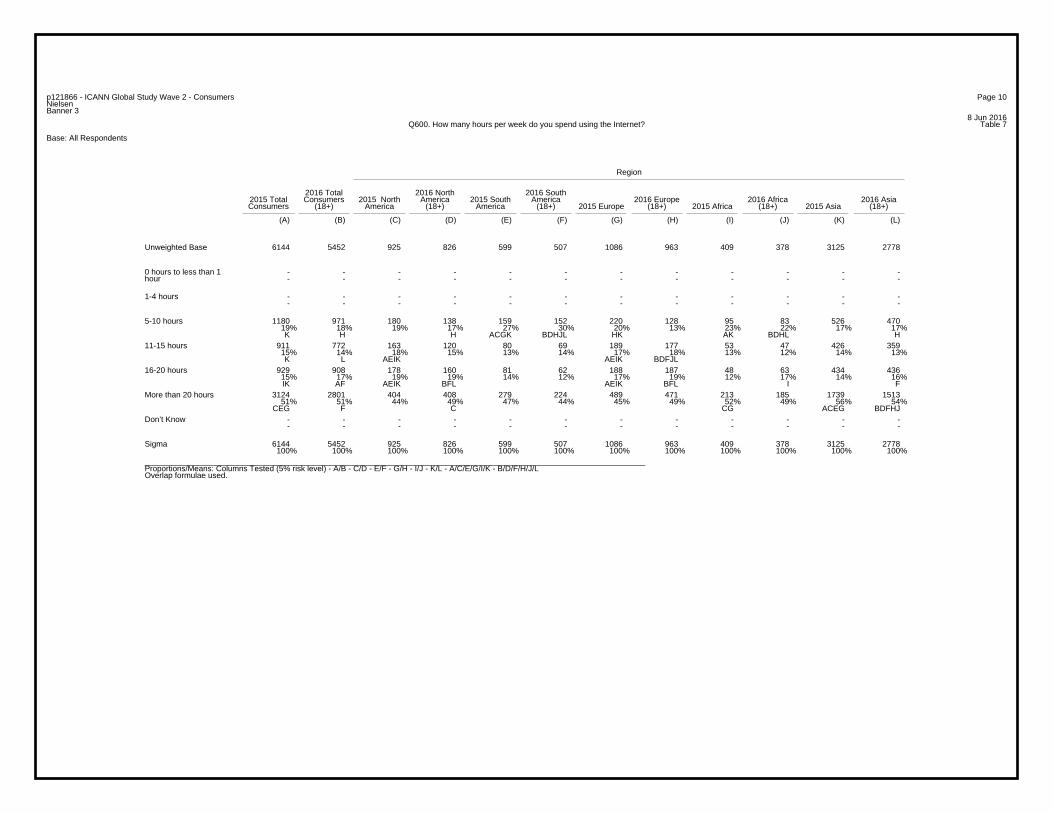
8 Jun 2016Table 7Q600. How many hours per week do you spend using the Internet?
Base: All Respondents
Region
2016 Total 2016 North 2016 South2015 Total Consumers 2015 North America 2015 South America 2016 Europe 2016 Africa 2016 AsiaConsumers (18+) America (18+) America (18+) 2015 Europe (18+) 2015 Africa (18+) 2015 Asia (18+)
(A) (B) (C) (D) (E) (F) (G) (H) (I) (J) (K) (L)
6144 5452 925 826 599 507 1086 963 409 378 3125 2778Unweighted Base
- - - - - - - - - - - -- - - - - - - - - - - -
0 hours to less than 1hour
- - - - - - - - - - - -- - - - - - - - - - - -
1-4 hours
1180 971 180 138 159 152 220 128 95 83 526 47019% 18% 19% 17% 27% 30% 20% 13% 23% 22% 17% 17%K H H ACGK BDHJL HK AK BDHL H
5-10 hours
911 772 163 120 80 69 189 177 53 47 426 35915% 14% 18% 15% 13% 14% 17% 18% 13% 12% 14% 13%K L AEIK AEIK BDFJL
11-15 hours
929 908 178 160 81 62 188 187 48 63 434 43615% 17% 19% 19% 14% 12% 17% 19% 12% 17% 14% 16%IK AF AEIK BFL AEIK BFL I F
16-20 hours
3124 2801 404 408 279 224 489 471 213 185 1739 151351% 51% 44% 49% 47% 44% 45% 49% 52% 49% 56% 54%
CEG F C CG ACEG BDFHJ
More than 20 hours
- - - - - - - - - - - -- - - - - - - - - - - -
Don’t Know
6144 5452 925 826 599 507 1086 963 409 378 3125 2778100% 100% 100% 100% 100% 100% 100% 100% 100% 100% 100% 100%
Sigma
_________________________________________________________________________________________________________________Proportions/Means: Columns Tested (5% risk level) - A/B - C/D - E/F - G/H - I/J - K/L - A/C/E/G/I/K - B/D/F/H/J/LOverlap formulae used.
Page 11p121866 - ICANN Global Study Wave 2 - ConsumersNielsenBanner 3
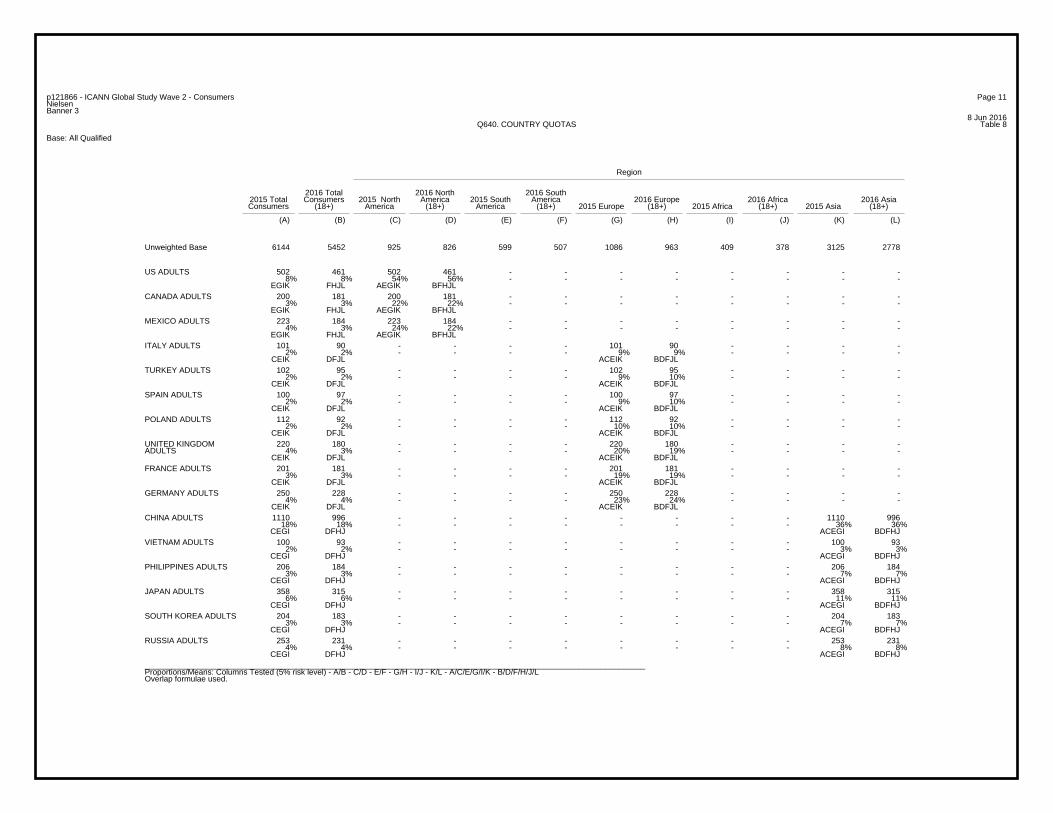
8 Jun 2016Table 8Q640. COUNTRY QUOTAS
Base: All Qualified
Region
2016 Total 2016 North 2016 South2015 Total Consumers 2015 North America 2015 South America 2016 Europe 2016 Africa 2016 AsiaConsumers (18+) America (18+) America (18+) 2015 Europe (18+) 2015 Africa (18+) 2015 Asia (18+)
(A) (B) (C) (D) (E) (F) (G) (H) (I) (J) (K) (L)
6144 5452 925 826 599 507 1086 963 409 378 3125 2778Unweighted Base
502 461 502 461 - - - - - - - -8% 8% 54% 56% - - - - - - - -
EGIK FHJL AEGIK BFHJL
US ADULTS
200 181 200 181 - - - - - - - -3% 3% 22% 22% - - - - - - - -
EGIK FHJL AEGIK BFHJL
CANADA ADULTS
223 184 223 184 - - - - - - - -4% 3% 24% 22% - - - - - - - -
EGIK FHJL AEGIK BFHJL
MEXICO ADULTS
101 90 - - - - 101 90 - - - -2% 2% - - - - 9% 9% - - - -
CEIK DFJL ACEIK BDFJL
ITALY ADULTS
102 95 - - - - 102 95 - - - -2% 2% - - - - 9% 10% - - - -
CEIK DFJL ACEIK BDFJL
TURKEY ADULTS
100 97 - - - - 100 97 - - - -2% 2% - - - - 9% 10% - - - -
CEIK DFJL ACEIK BDFJL
SPAIN ADULTS
112 92 - - - - 112 92 - - - -2% 2% - - - - 10% 10% - - - -
CEIK DFJL ACEIK BDFJL
POLAND ADULTS
220 180 - - - - 220 180 - - - -4% 3% - - - - 20% 19% - - - -
CEIK DFJL ACEIK BDFJL
UNITED KINGDOMADULTS
201 181 - - - - 201 181 - - - -3% 3% - - - - 19% 19% - - - -
CEIK DFJL ACEIK BDFJL
FRANCE ADULTS
250 228 - - - - 250 228 - - - -4% 4% - - - - 23% 24% - - - -
CEIK DFJL ACEIK BDFJL
GERMANY ADULTS
1110 996 - - - - - - - - 1110 99618% 18% - - - - - - - - 36% 36%
CEGI DFHJ ACEGI BDFHJ
CHINA ADULTS
100 93 - - - - - - - - 100 932% 2% - - - - - - - - 3% 3%
CEGI DFHJ ACEGI BDFHJ
VIETNAM ADULTS
206 184 - - - - - - - - 206 1843% 3% - - - - - - - - 7% 7%
CEGI DFHJ ACEGI BDFHJ
PHILIPPINES ADULTS
358 315 - - - - - - - - 358 3156% 6% - - - - - - - - 11% 11%
CEGI DFHJ ACEGI BDFHJ
JAPAN ADULTS
204 183 - - - - - - - - 204 1833% 3% - - - - - - - - 7% 7%
CEGI DFHJ ACEGI BDFHJ
SOUTH KOREA ADULTS
253 231 - - - - - - - - 253 2314% 4% - - - - - - - - 8% 8%
CEGI DFHJ ACEGI BDFHJ
RUSSIA ADULTS
_________________________________________________________________________________________________________________Proportions/Means: Columns Tested (5% risk level) - A/B - C/D - E/F - G/H - I/J - K/L - A/C/E/G/I/K - B/D/F/H/J/LOverlap formulae used.
Page 12p121866 - ICANN Global Study Wave 2 - ConsumersNielsenBanner 3
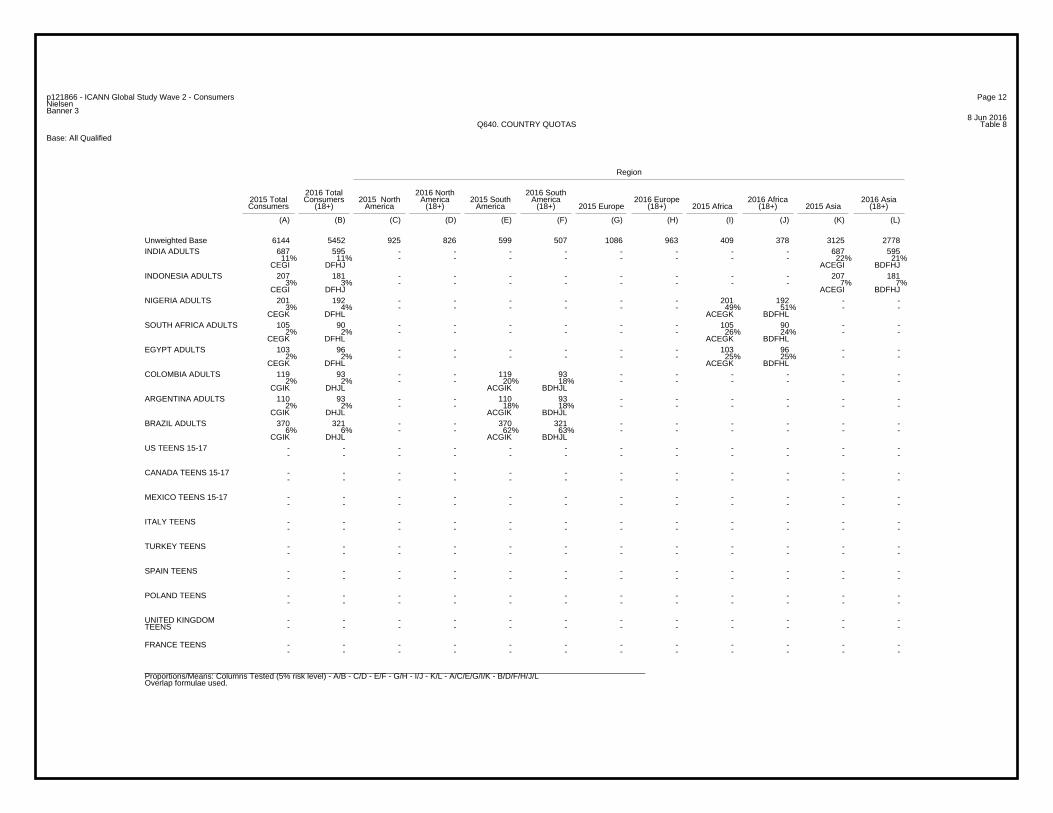
8 Jun 2016Table 8Q640. COUNTRY QUOTAS
Base: All Qualified
Region
2016 Total 2016 North 2016 South2015 Total Consumers 2015 North America 2015 South America 2016 Europe 2016 Africa 2016 AsiaConsumers (18+) America (18+) America (18+) 2015 Europe (18+) 2015 Africa (18+) 2015 Asia (18+)
(A) (B) (C) (D) (E) (F) (G) (H) (I) (J) (K) (L)
6144 5452 925 826 599 507 1086 963 409 378 3125 2778Unweighted Base687 595 - - - - - - - - 687 595
11% 11% - - - - - - - - 22% 21%CEGI DFHJ ACEGI BDFHJ
INDIA ADULTS
207 181 - - - - - - - - 207 1813% 3% - - - - - - - - 7% 7%
CEGI DFHJ ACEGI BDFHJ
INDONESIA ADULTS
201 192 - - - - - - 201 192 - -3% 4% - - - - - - 49% 51% - -
CEGK DFHL ACEGK BDFHL
NIGERIA ADULTS
105 90 - - - - - - 105 90 - -2% 2% - - - - - - 26% 24% - -
CEGK DFHL ACEGK BDFHL
SOUTH AFRICA ADULTS
103 96 - - - - - - 103 96 - -2% 2% - - - - - - 25% 25% - -
CEGK DFHL ACEGK BDFHL
EGYPT ADULTS
119 93 - - 119 93 - - - - - -2% 2% - - 20% 18% - - - - - -
CGIK DHJL ACGIK BDHJL
COLOMBIA ADULTS
110 93 - - 110 93 - - - - - -2% 2% - - 18% 18% - - - - - -
CGIK DHJL ACGIK BDHJL
ARGENTINA ADULTS
370 321 - - 370 321 - - - - - -6% 6% - - 62% 63% - - - - - -
CGIK DHJL ACGIK BDHJL
BRAZIL ADULTS
- - - - - - - - - - - -- - - - - - - - - - - -
US TEENS 15-17
- - - - - - - - - - - -- - - - - - - - - - - -
CANADA TEENS 15-17
- - - - - - - - - - - -- - - - - - - - - - - -
MEXICO TEENS 15-17
- - - - - - - - - - - -- - - - - - - - - - - -
ITALY TEENS
- - - - - - - - - - - -- - - - - - - - - - - -
TURKEY TEENS
- - - - - - - - - - - -- - - - - - - - - - - -
SPAIN TEENS
- - - - - - - - - - - -- - - - - - - - - - - -
POLAND TEENS
- - - - - - - - - - - -- - - - - - - - - - - -
UNITED KINGDOMTEENS
- - - - - - - - - - - -- - - - - - - - - - - -
FRANCE TEENS
_________________________________________________________________________________________________________________Proportions/Means: Columns Tested (5% risk level) - A/B - C/D - E/F - G/H - I/J - K/L - A/C/E/G/I/K - B/D/F/H/J/LOverlap formulae used.
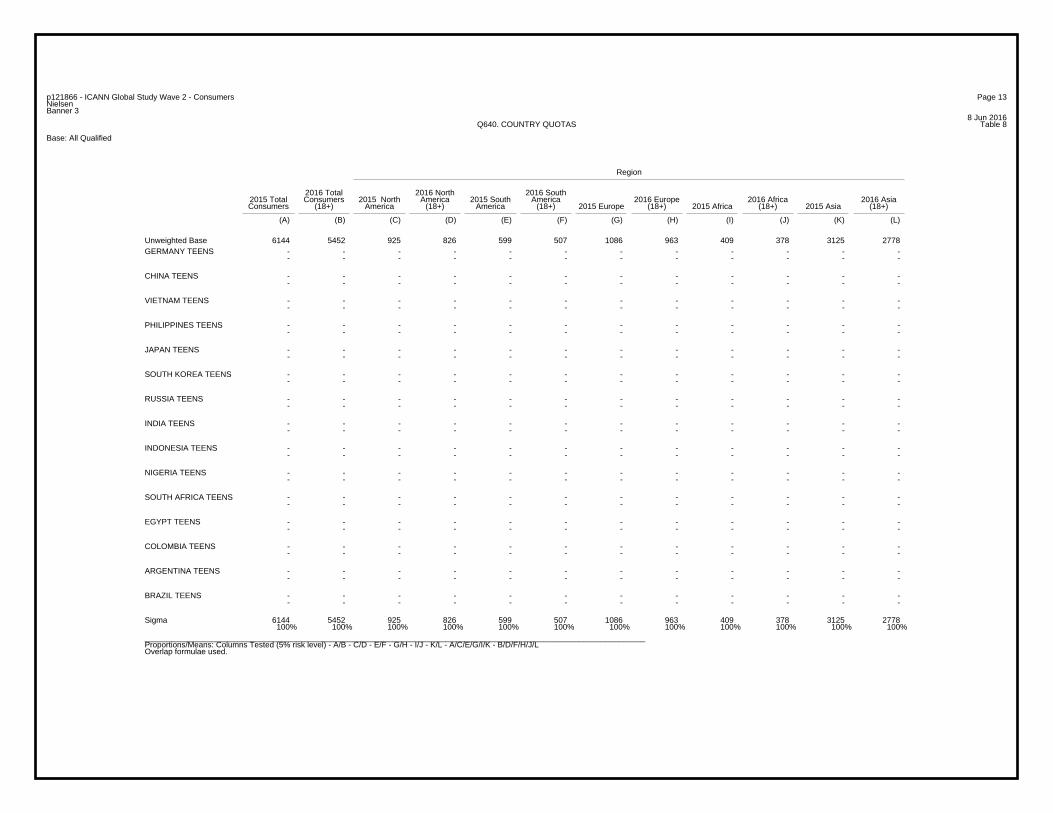
Page 13p121866 - ICANN Global Study Wave 2 - ConsumersNielsenBanner 3
8 Jun 2016Table 8Q640. COUNTRY QUOTAS
Base: All Qualified
Region
2016 Total 2016 North 2016 South2015 Total Consumers 2015 North America 2015 South America 2016 Europe 2016 Africa 2016 AsiaConsumers (18+) America (18+) America (18+) 2015 Europe (18+) 2015 Africa (18+) 2015 Asia (18+)
(A) (B) (C) (D) (E) (F) (G) (H) (I) (J) (K) (L)
6144 5452 925 826 599 507 1086 963 409 378 3125 2778Unweighted Base- - - - - - - - - - - -- - - - - - - - - - - -
GERMANY TEENS
- - - - - - - - - - - -- - - - - - - - - - - -
CHINA TEENS
- - - - - - - - - - - -- - - - - - - - - - - -
VIETNAM TEENS
- - - - - - - - - - - -- - - - - - - - - - - -
PHILIPPINES TEENS
- - - - - - - - - - - -- - - - - - - - - - - -
JAPAN TEENS
- - - - - - - - - - - -- - - - - - - - - - - -
SOUTH KOREA TEENS
- - - - - - - - - - - -- - - - - - - - - - - -
RUSSIA TEENS
- - - - - - - - - - - -- - - - - - - - - - - -
INDIA TEENS
- - - - - - - - - - - -- - - - - - - - - - - -
INDONESIA TEENS
- - - - - - - - - - - -- - - - - - - - - - - -
NIGERIA TEENS
- - - - - - - - - - - -- - - - - - - - - - - -
SOUTH AFRICA TEENS
- - - - - - - - - - - -- - - - - - - - - - - -
EGYPT TEENS
- - - - - - - - - - - -- - - - - - - - - - - -
COLOMBIA TEENS
- - - - - - - - - - - -- - - - - - - - - - - -
ARGENTINA TEENS
- - - - - - - - - - - -- - - - - - - - - - - -
BRAZIL TEENS
6144 5452 925 826 599 507 1086 963 409 378 3125 2778100% 100% 100% 100% 100% 100% 100% 100% 100% 100% 100% 100%
Sigma
_________________________________________________________________________________________________________________Proportions/Means: Columns Tested (5% risk level) - A/B - C/D - E/F - G/H - I/J - K/L - A/C/E/G/I/K - B/D/F/H/J/LOverlap formulae used.
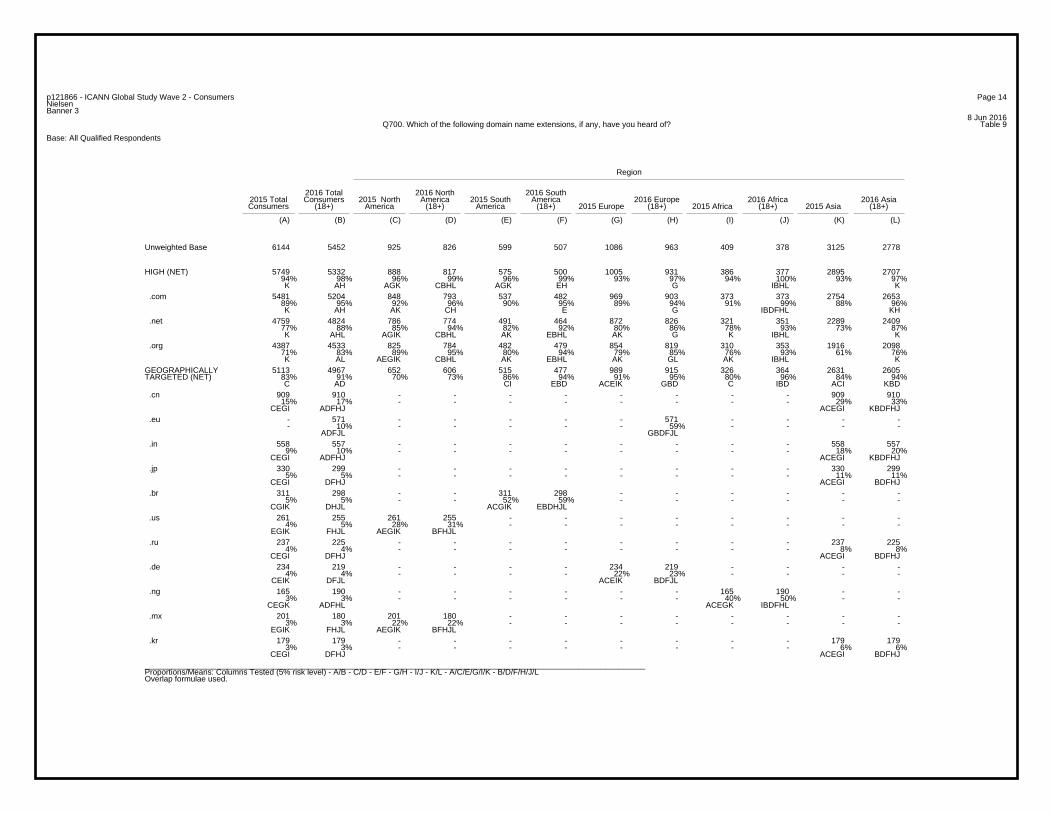
Page 14p121866 - ICANN Global Study Wave 2 - ConsumersNielsenBanner 3
8 Jun 2016Table 9Q700. Which of the following domain name extensions, if any, have you heard of?
Base: All Qualified Respondents
Region
2016 Total 2016 North 2016 South2015 Total Consumers 2015 North America 2015 South America 2016 Europe 2016 Africa 2016 AsiaConsumers (18+) America (18+) America (18+) 2015 Europe (18+) 2015 Africa (18+) 2015 Asia (18+)
(A) (B) (C) (D) (E) (F) (G) (H) (I) (J) (K) (L)
6144 5452 925 826 599 507 1086 963 409 378 3125 2778Unweighted Base
5749 5332 888 817 575 500 1005 931 386 377 2895 270794% 98% 96% 99% 96% 99% 93% 97% 94% 100% 93% 97%K AH AGK CBHL AGK EH G IBHL K
HIGH (NET)
5481 5204 848 793 537 482 969 903 373 373 2754 265389% 95% 92% 96% 90% 95% 89% 94% 91% 99% 88% 96%K AH AK CH E G IBDFHL KH
.com
4759 4824 786 774 491 464 872 826 321 351 2289 240977% 88% 85% 94% 82% 92% 80% 86% 78% 93% 73% 87%K AHL AGIK CBHL AK EBHL AK G K IBHL K
.net
4387 4533 825 784 482 479 854 819 310 353 1916 209871% 83% 89% 95% 80% 94% 79% 85% 76% 93% 61% 76%K AL AEGIK CBHL AK EBHL AK GL AK IBHL K
.org
5113 4967 652 606 515 477 989 915 326 364 2631 260583% 91% 70% 73% 86% 94% 91% 95% 80% 96% 84% 94%C AD CI EBD ACEIK GBD C IBD ACI KBD
GEOGRAPHICALLYTARGETED (NET)
909 910 - - - - - - - - 909 91015% 17% - - - - - - - - 29% 33%
CEGI ADFHJ ACEGI KBDFHJ
.cn
- 571 - - - - - 571 - - - -- 10% - - - - - 59% - - - -
ADFJL GBDFJL
.eu
558 557 - - - - - - - - 558 5579% 10% - - - - - - - - 18% 20%
CEGI ADFHJ ACEGI KBDFHJ
.in
330 299 - - - - - - - - 330 2995% 5% - - - - - - - - 11% 11%
CEGI DFHJ ACEGI BDFHJ
.jp
311 298 - - 311 298 - - - - - -5% 5% - - 52% 59% - - - - - -
CGIK DHJL ACGIK EBDHJL
.br
261 255 261 255 - - - - - - - -4% 5% 28% 31% - - - - - - - -
EGIK FHJL AEGIK BFHJL
.us
237 225 - - - - - - - - 237 2254% 4% - - - - - - - - 8% 8%
CEGI DFHJ ACEGI BDFHJ
.ru
234 219 - - - - 234 219 - - - -4% 4% - - - - 22% 23% - - - -
CEIK DFJL ACEIK BDFJL
.de
165 190 - - - - - - 165 190 - -3% 3% - - - - - - 40% 50% - -
CEGK ADFHL ACEGK IBDFHL
.ng
201 180 201 180 - - - - - - - -3% 3% 22% 22% - - - - - - - -
EGIK FHJL AEGIK BFHJL
.mx
179 179 - - - - - - - - 179 1793% 3% - - - - - - - - 6% 6%
CEGI DFHJ ACEGI BDFHJ
.kr
_________________________________________________________________________________________________________________Proportions/Means: Columns Tested (5% risk level) - A/B - C/D - E/F - G/H - I/J - K/L - A/C/E/G/I/K - B/D/F/H/J/LOverlap formulae used.
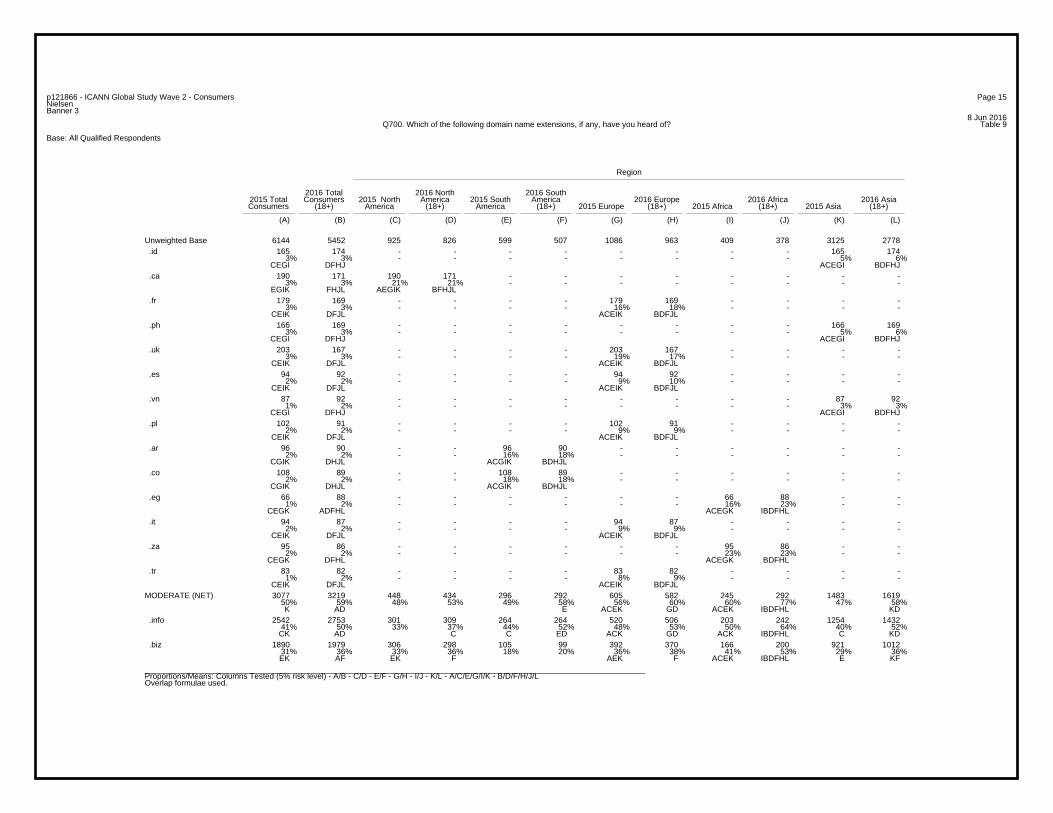
Page 15p121866 - ICANN Global Study Wave 2 - ConsumersNielsenBanner 3
8 Jun 2016Table 9Q700. Which of the following domain name extensions, if any, have you heard of?
Base: All Qualified Respondents
Region
2016 Total 2016 North 2016 South2015 Total Consumers 2015 North America 2015 South America 2016 Europe 2016 Africa 2016 AsiaConsumers (18+) America (18+) America (18+) 2015 Europe (18+) 2015 Africa (18+) 2015 Asia (18+)
(A) (B) (C) (D) (E) (F) (G) (H) (I) (J) (K) (L)
6144 5452 925 826 599 507 1086 963 409 378 3125 2778Unweighted Base165 174 - - - - - - - - 165 174
3% 3% - - - - - - - - 5% 6%CEGI DFHJ ACEGI BDFHJ
.id
190 171 190 171 - - - - - - - -3% 3% 21% 21% - - - - - - - -
EGIK FHJL AEGIK BFHJL
.ca
179 169 - - - - 179 169 - - - -3% 3% - - - - 16% 18% - - - -
CEIK DFJL ACEIK BDFJL
.fr
166 169 - - - - - - - - 166 1693% 3% - - - - - - - - 5% 6%
CEGI DFHJ ACEGI BDFHJ
.ph
203 167 - - - - 203 167 - - - -3% 3% - - - - 19% 17% - - - -
CEIK DFJL ACEIK BDFJL
.uk
94 92 - - - - 94 92 - - - -2% 2% - - - - 9% 10% - - - -
CEIK DFJL ACEIK BDFJL
.es
87 92 - - - - - - - - 87 921% 2% - - - - - - - - 3% 3%
CEGI DFHJ ACEGI BDFHJ
.vn
102 91 - - - - 102 91 - - - -2% 2% - - - - 9% 9% - - - -
CEIK DFJL ACEIK BDFJL
.pl
96 90 - - 96 90 - - - - - -2% 2% - - 16% 18% - - - - - -
CGIK DHJL ACGIK BDHJL
.ar
108 89 - - 108 89 - - - - - -2% 2% - - 18% 18% - - - - - -
CGIK DHJL ACGIK BDHJL
.co
66 88 - - - - - - 66 88 - -1% 2% - - - - - - 16% 23% - -
CEGK ADFHL ACEGK IBDFHL
.eg
94 87 - - - - 94 87 - - - -2% 2% - - - - 9% 9% - - - -
CEIK DFJL ACEIK BDFJL
.it
95 86 - - - - - - 95 86 - -2% 2% - - - - - - 23% 23% - -
CEGK DFHL ACEGK BDFHL
.za
83 82 - - - - 83 82 - - - -1% 2% - - - - 8% 9% - - - -
CEIK DFJL ACEIK BDFJL
.tr
3077 3219 448 434 296 292 605 582 245 292 1483 161950% 59% 48% 53% 49% 58% 56% 60% 60% 77% 47% 58%K AD E ACEK GD ACEK IBDFHL KD
MODERATE (NET)
2542 2753 301 309 264 264 520 506 203 242 1254 143241% 50% 33% 37% 44% 52% 48% 53% 50% 64% 40% 52%CK AD C C ED ACK GD ACK IBDFHL C KD
.info
1890 1979 306 298 105 99 392 370 166 200 921 101231% 36% 33% 36% 18% 20% 36% 38% 41% 53% 29% 36%EK AF EK F AEK F ACEK IBDFHL E KF
.biz
_________________________________________________________________________________________________________________Proportions/Means: Columns Tested (5% risk level) - A/B - C/D - E/F - G/H - I/J - K/L - A/C/E/G/I/K - B/D/F/H/J/LOverlap formulae used.
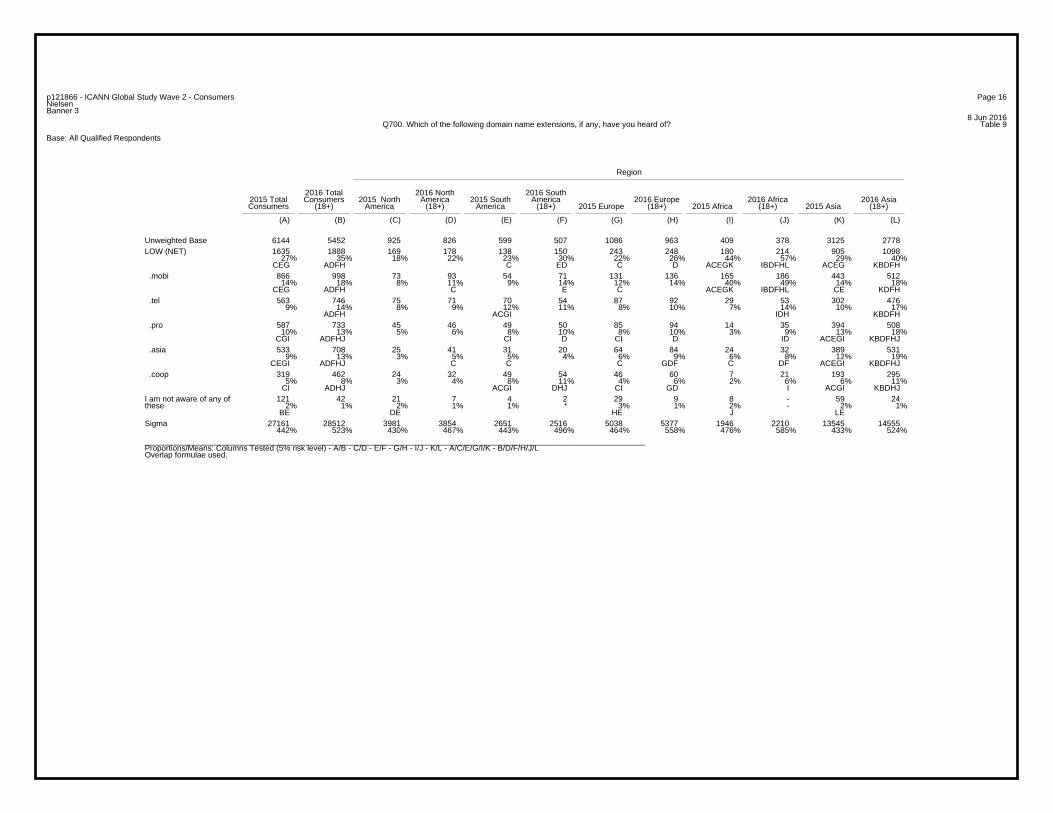
Page 16p121866 - ICANN Global Study Wave 2 - ConsumersNielsenBanner 3
8 Jun 2016Table 9Q700. Which of the following domain name extensions, if any, have you heard of?
Base: All Qualified Respondents
Region
2016 Total 2016 North 2016 South2015 Total Consumers 2015 North America 2015 South America 2016 Europe 2016 Africa 2016 AsiaConsumers (18+) America (18+) America (18+) 2015 Europe (18+) 2015 Africa (18+) 2015 Asia (18+)
(A) (B) (C) (D) (E) (F) (G) (H) (I) (J) (K) (L)
6144 5452 925 826 599 507 1086 963 409 378 3125 2778Unweighted Base1635 1888 169 178 138 150 243 248 180 214 905 1098
27% 35% 18% 22% 23% 30% 22% 26% 44% 57% 29% 40%CEG ADFH C ED C D ACEGK IBDFHL ACEG KBDFH
LOW (NET)
866 998 73 93 54 71 131 136 165 186 443 51214% 18% 8% 11% 9% 14% 12% 14% 40% 49% 14% 18%
CEG ADFH C E C ACEGK IBDFHL CE KDFH
.mobi
563 746 75 71 70 54 87 92 29 53 302 4769% 14% 8% 9% 12% 11% 8% 10% 7% 14% 10% 17%
ADFH ACGI IDH KBDFH
.tel
587 733 45 46 49 50 85 94 14 35 394 50810% 13% 5% 6% 8% 10% 8% 10% 3% 9% 13% 18%
CGI ADFHJ CI D CI D ID ACEGI KBDFHJ
.pro
533 708 25 41 31 20 64 84 24 32 389 5319% 13% 3% 5% 5% 4% 6% 9% 6% 8% 12% 19%
CEGI ADFHJ C C C GDF C DF ACEGI KBDFHJ
.asia
319 462 24 32 49 54 46 60 7 21 193 2955% 8% 3% 4% 8% 11% 4% 6% 2% 6% 6% 11%
CI ADHJ ACGI DHJ CI GD I ACGI KBDHJ
.coop
121 42 21 7 4 2 29 9 8 - 59 242% 1% 2% 1% 1% * 3% 1% 2% - 2% 1%
BE DE HE J LE
I am not aware of any ofthese
27161 28512 3981 3854 2651 2516 5038 5377 1946 2210 13545 14555442% 523% 430% 467% 443% 496% 464% 558% 476% 585% 433% 524%
Sigma
_________________________________________________________________________________________________________________Proportions/Means: Columns Tested (5% risk level) - A/B - C/D - E/F - G/H - I/J - K/L - A/C/E/G/I/K - B/D/F/H/J/LOverlap formulae used.
Page 17p121866 - ICANN Global Study Wave 2 - ConsumersNielsenBanner 3
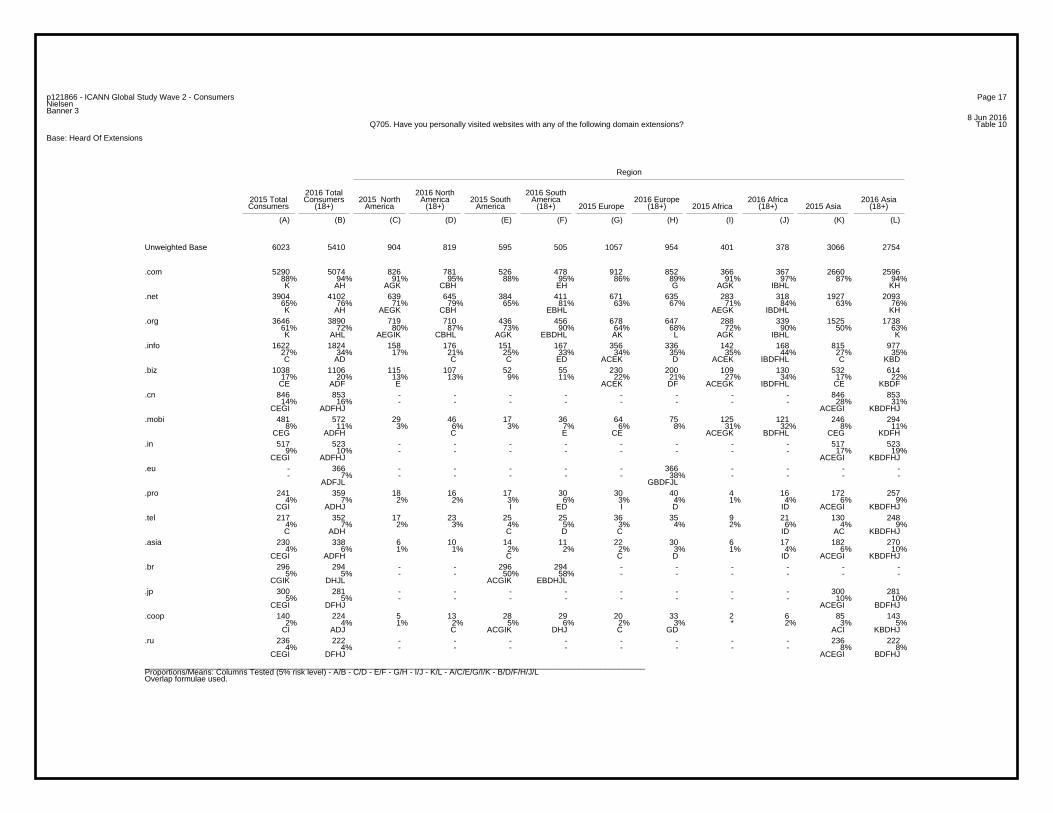
8 Jun 2016Table 10Q705. Have you personally visited websites with any of the following domain extensions?
Base: Heard Of Extensions
Region
2016 Total 2016 North 2016 South2015 Total Consumers 2015 North America 2015 South America 2016 Europe 2016 Africa 2016 AsiaConsumers (18+) America (18+) America (18+) 2015 Europe (18+) 2015 Africa (18+) 2015 Asia (18+)
(A) (B) (C) (D) (E) (F) (G) (H) (I) (J) (K) (L)
6023 5410 904 819 595 505 1057 954 401 378 3066 2754Unweighted Base
5290 5074 826 781 526 478 912 852 366 367 2660 259688% 94% 91% 95% 88% 95% 86% 89% 91% 97% 87% 94%K AH AGK CBH EH G AGK IBHL KH
.com
3904 4102 639 645 384 411 671 635 283 318 1927 209365% 76% 71% 79% 65% 81% 63% 67% 71% 84% 63% 76%K AH AEGK CBH EBHL AEGK IBDHL KH
.net
3646 3890 719 710 436 456 678 647 288 339 1525 173861% 72% 80% 87% 73% 90% 64% 68% 72% 90% 50% 63%K AHL AEGIK CBHL AGK EBDHL AK L AGK IBHL K
.org
1622 1824 158 176 151 167 356 336 142 168 815 97727% 34% 17% 21% 25% 33% 34% 35% 35% 44% 27% 35%C AD C C ED ACEK D ACEK IBDFHL C KBD
.info
1038 1106 115 107 52 55 230 200 109 130 532 61417% 20% 13% 13% 9% 11% 22% 21% 27% 34% 17% 22%CE ADF E ACEK DF ACEGK IBDFHL CE KBDF
.biz
846 853 - - - - - - - - 846 85314% 16% - - - - - - - - 28% 31%
CEGI ADFHJ ACEGI KBDFHJ
.cn
481 572 29 46 17 36 64 75 125 121 246 2948% 11% 3% 6% 3% 7% 6% 8% 31% 32% 8% 11%
CEG ADFH C E CE ACEGK BDFHL CEG KDFH
.mobi
517 523 - - - - - - - - 517 5239% 10% - - - - - - - - 17% 19%
CEGI ADFHJ ACEGI KBDFHJ
.in
- 366 - - - - - 366 - - - -- 7% - - - - - 38% - - - -
ADFJL GBDFJL
.eu
241 359 18 16 17 30 30 40 4 16 172 2574% 7% 2% 2% 3% 6% 3% 4% 1% 4% 6% 9%
CGI ADHJ I ED I D ID ACEGI KBDFHJ
.pro
217 352 17 23 25 25 36 35 9 21 130 2484% 7% 2% 3% 4% 5% 3% 4% 2% 6% 4% 9%C ADH C D C ID AC KBDFHJ
.tel
230 338 6 10 14 11 22 30 6 17 182 2704% 6% 1% 1% 2% 2% 2% 3% 1% 4% 6% 10%
CEGI ADFH C C D ID ACEGI KBDFHJ
.asia
296 294 - - 296 294 - - - - - -5% 5% - - 50% 58% - - - - - -
CGIK DHJL ACGIK EBDHJL
.br
300 281 - - - - - - - - 300 2815% 5% - - - - - - - - 10% 10%
CEGI DFHJ ACEGI BDFHJ
.jp
140 224 5 13 28 29 20 33 2 6 85 1432% 4% 1% 2% 5% 6% 2% 3% * 2% 3% 5%
CI ADJ C ACGIK DHJ C GD ACI KBDHJ
.coop
236 222 - - - - - - - - 236 2224% 4% - - - - - - - - 8% 8%
CEGI DFHJ ACEGI BDFHJ
.ru
_________________________________________________________________________________________________________________Proportions/Means: Columns Tested (5% risk level) - A/B - C/D - E/F - G/H - I/J - K/L - A/C/E/G/I/K - B/D/F/H/J/LOverlap formulae used.
Page 18p121866 - ICANN Global Study Wave 2 - ConsumersNielsenBanner 3
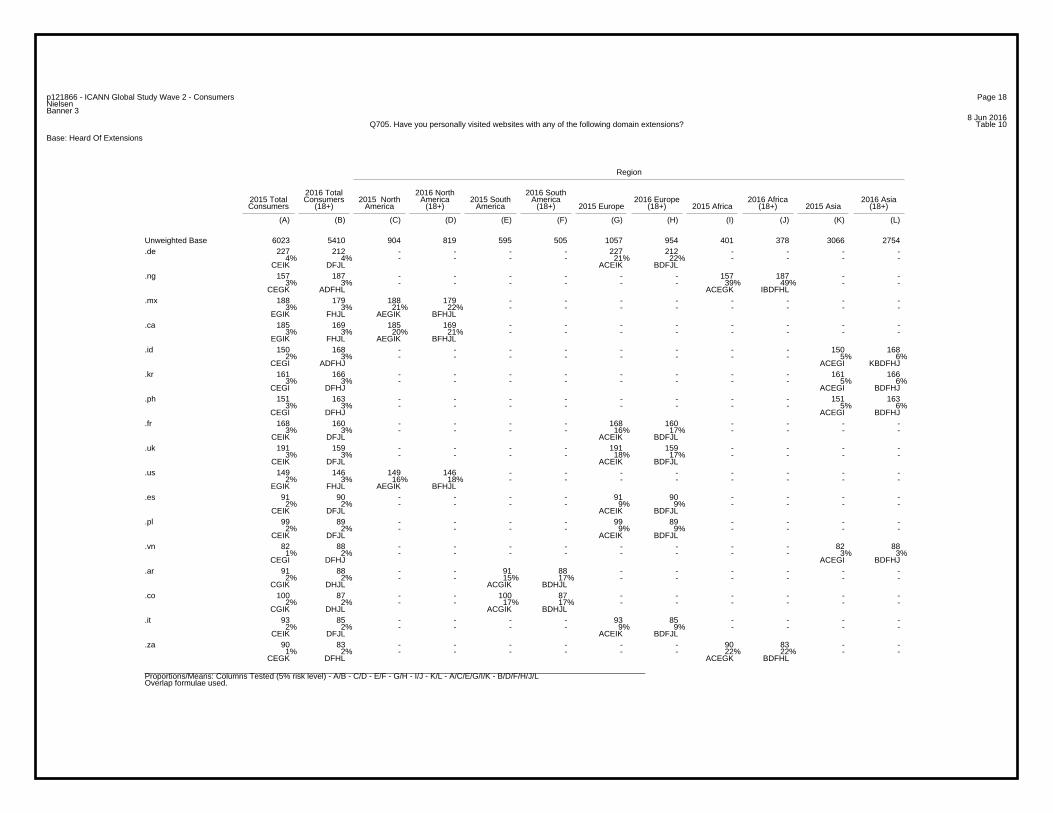
8 Jun 2016Table 10Q705. Have you personally visited websites with any of the following domain extensions?
Base: Heard Of Extensions
Region
2016 Total 2016 North 2016 South2015 Total Consumers 2015 North America 2015 South America 2016 Europe 2016 Africa 2016 AsiaConsumers (18+) America (18+) America (18+) 2015 Europe (18+) 2015 Africa (18+) 2015 Asia (18+)
(A) (B) (C) (D) (E) (F) (G) (H) (I) (J) (K) (L)
6023 5410 904 819 595 505 1057 954 401 378 3066 2754Unweighted Base227 212 - - - - 227 212 - - - -
4% 4% - - - - 21% 22% - - - - CEIK DFJL ACEIK BDFJL
.de
157 187 - - - - - - 157 187 - -3% 3% - - - - - - 39% 49% - -
CEGK ADFHL ACEGK IBDFHL
.ng
188 179 188 179 - - - - - - - -3% 3% 21% 22% - - - - - - - -
EGIK FHJL AEGIK BFHJL
.mx
185 169 185 169 - - - - - - - -3% 3% 20% 21% - - - - - - - -
EGIK FHJL AEGIK BFHJL
.ca
150 168 - - - - - - - - 150 1682% 3% - - - - - - - - 5% 6%
CEGI ADFHJ ACEGI KBDFHJ
.id
161 166 - - - - - - - - 161 1663% 3% - - - - - - - - 5% 6%
CEGI DFHJ ACEGI BDFHJ
.kr
151 163 - - - - - - - - 151 1633% 3% - - - - - - - - 5% 6%
CEGI DFHJ ACEGI BDFHJ
.ph
168 160 - - - - 168 160 - - - -3% 3% - - - - 16% 17% - - - -
CEIK DFJL ACEIK BDFJL
.fr
191 159 - - - - 191 159 - - - -3% 3% - - - - 18% 17% - - - -
CEIK DFJL ACEIK BDFJL
.uk
149 146 149 146 - - - - - - - -2% 3% 16% 18% - - - - - - - -
EGIK FHJL AEGIK BFHJL
.us
91 90 - - - - 91 90 - - - -2% 2% - - - - 9% 9% - - - -
CEIK DFJL ACEIK BDFJL
.es
99 89 - - - - 99 89 - - - -2% 2% - - - - 9% 9% - - - -
CEIK DFJL ACEIK BDFJL
.pl
82 88 - - - - - - - - 82 881% 2% - - - - - - - - 3% 3%
CEGI DFHJ ACEGI BDFHJ
.vn
91 88 - - 91 88 - - - - - -2% 2% - - 15% 17% - - - - - -
CGIK DHJL ACGIK BDHJL
.ar
100 87 - - 100 87 - - - - - -2% 2% - - 17% 17% - - - - - -
CGIK DHJL ACGIK BDHJL
.co
93 85 - - - - 93 85 - - - -2% 2% - - - - 9% 9% - - - -
CEIK DFJL ACEIK BDFJL
.it
90 83 - - - - - - 90 83 - -1% 2% - - - - - - 22% 22% - -
CEGK DFHL ACEGK BDFHL
.za
_________________________________________________________________________________________________________________Proportions/Means: Columns Tested (5% risk level) - A/B - C/D - E/F - G/H - I/J - K/L - A/C/E/G/I/K - B/D/F/H/J/LOverlap formulae used.
Page 19p121866 - ICANN Global Study Wave 2 - ConsumersNielsenBanner 3
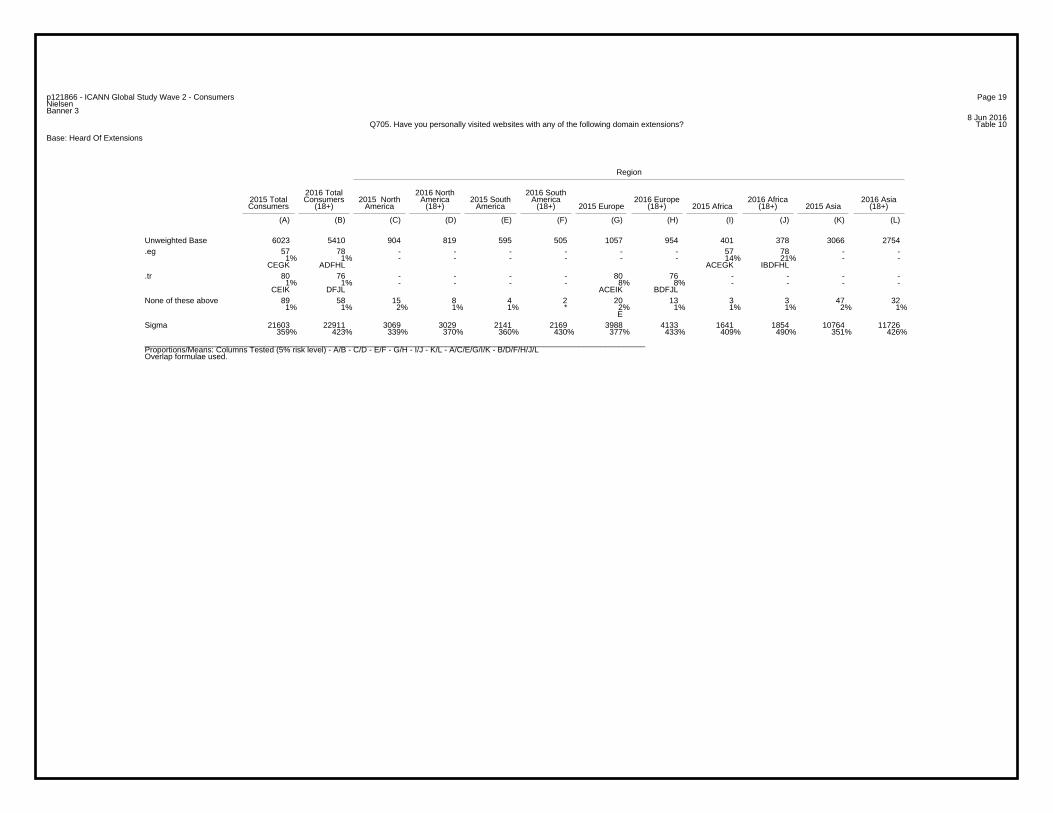
8 Jun 2016Table 10Q705. Have you personally visited websites with any of the following domain extensions?
Base: Heard Of Extensions
Region
2016 Total 2016 North 2016 South2015 Total Consumers 2015 North America 2015 South America 2016 Europe 2016 Africa 2016 AsiaConsumers (18+) America (18+) America (18+) 2015 Europe (18+) 2015 Africa (18+) 2015 Asia (18+)
(A) (B) (C) (D) (E) (F) (G) (H) (I) (J) (K) (L)
6023 5410 904 819 595 505 1057 954 401 378 3066 2754Unweighted Base57 78 - - - - - - 57 78 - -
1% 1% - - - - - - 14% 21% - - CEGK ADFHL ACEGK IBDFHL
.eg
80 76 - - - - 80 76 - - - -1% 1% - - - - 8% 8% - - - -
CEIK DFJL ACEIK BDFJL
.tr
89 58 15 8 4 2 20 13 3 3 47 321% 1% 2% 1% 1% * 2% 1% 1% 1% 2% 1%
E
None of these above
21603 22911 3069 3029 2141 2169 3988 4133 1641 1854 10764 11726359% 423% 339% 370% 360% 430% 377% 433% 409% 490% 351% 426%
Sigma
_________________________________________________________________________________________________________________Proportions/Means: Columns Tested (5% risk level) - A/B - C/D - E/F - G/H - I/J - K/L - A/C/E/G/I/K - B/D/F/H/J/LOverlap formulae used.
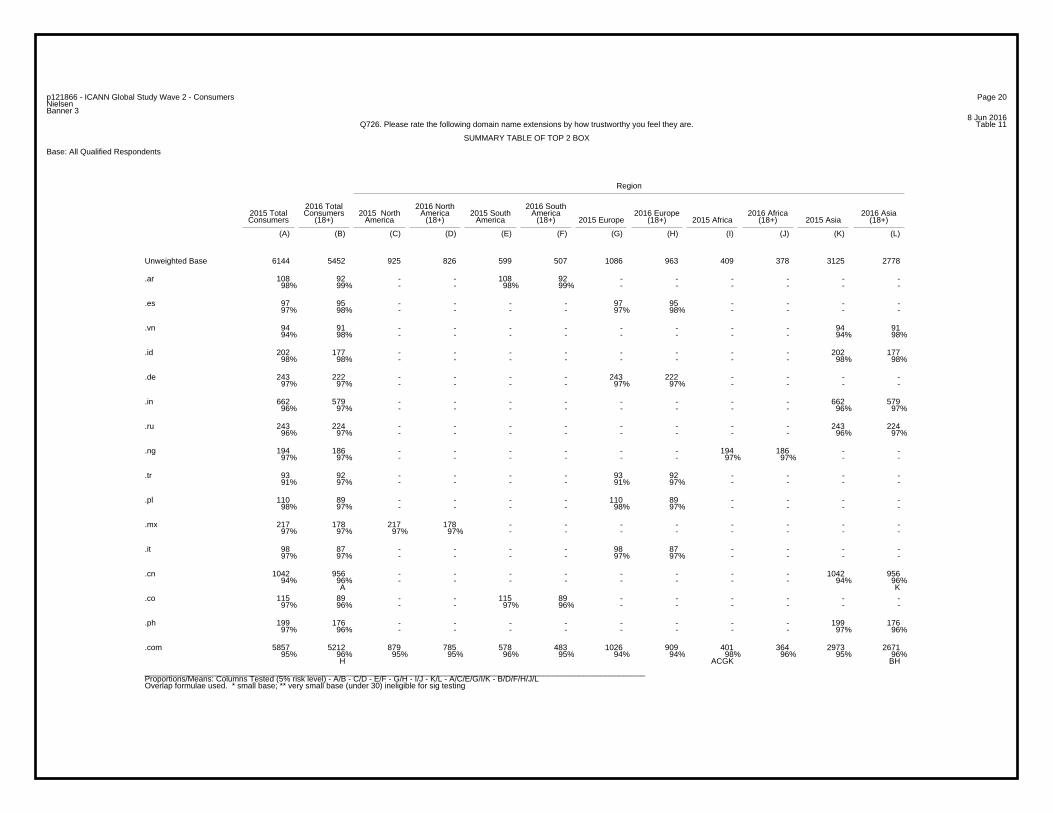
Page 20p121866 - ICANN Global Study Wave 2 - ConsumersNielsenBanner 3
8 Jun 2016Table 11Q726. Please rate the following domain name extensions by how trustworthy you feel they are.
SUMMARY TABLE OF TOP 2 BOX
Base: All Qualified Respondents
Region
2016 Total 2016 North 2016 South2015 Total Consumers 2015 North America 2015 South America 2016 Europe 2016 Africa 2016 AsiaConsumers (18+) America (18+) America (18+) 2015 Europe (18+) 2015 Africa (18+) 2015 Asia (18+)
(A) (B) (C) (D) (E) (F) (G) (H) (I) (J) (K) (L)
6144 5452 925 826 599 507 1086 963 409 378 3125 2778Unweighted Base
108 92 - - 108 92 - - - - - -98% 99% - - 98% 99% - - - - - -
.ar
97 95 - - - - 97 95 - - - -97% 98% - - - - 97% 98% - - - -
.es
94 91 - - - - - - - - 94 9194% 98% - - - - - - - - 94% 98%
.vn
202 177 - - - - - - - - 202 17798% 98% - - - - - - - - 98% 98%
.id
243 222 - - - - 243 222 - - - -97% 97% - - - - 97% 97% - - - -
.de
662 579 - - - - - - - - 662 57996% 97% - - - - - - - - 96% 97%
.in
243 224 - - - - - - - - 243 22496% 97% - - - - - - - - 96% 97%
.ru
194 186 - - - - - - 194 186 - -97% 97% - - - - - - 97% 97% - -
.ng
93 92 - - - - 93 92 - - - -91% 97% - - - - 91% 97% - - - -
.tr
110 89 - - - - 110 89 - - - -98% 97% - - - - 98% 97% - - - -
.pl
217 178 217 178 - - - - - - - -97% 97% 97% 97% - - - - - - - -
.mx
98 87 - - - - 98 87 - - - -97% 97% - - - - 97% 97% - - - -
.it
1042 956 - - - - - - - - 1042 95694% 96% - - - - - - - - 94% 96%
A K
.cn
115 89 - - 115 89 - - - - - -97% 96% - - 97% 96% - - - - - -
.co
199 176 - - - - - - - - 199 17697% 96% - - - - - - - - 97% 96%
.ph
5857 5212 879 785 578 483 1026 909 401 364 2973 267195% 96% 95% 95% 96% 95% 94% 94% 98% 96% 95% 96%
H ACGK BH
.com
_________________________________________________________________________________________________________________Proportions/Means: Columns Tested (5% risk level) - A/B - C/D - E/F - G/H - I/J - K/L - A/C/E/G/I/K - B/D/F/H/J/LOverlap formulae used. * small base; ** very small base (under 30) ineligible for sig testing
Page 21p121866 - ICANN Global Study Wave 2 - ConsumersNielsenBanner 3
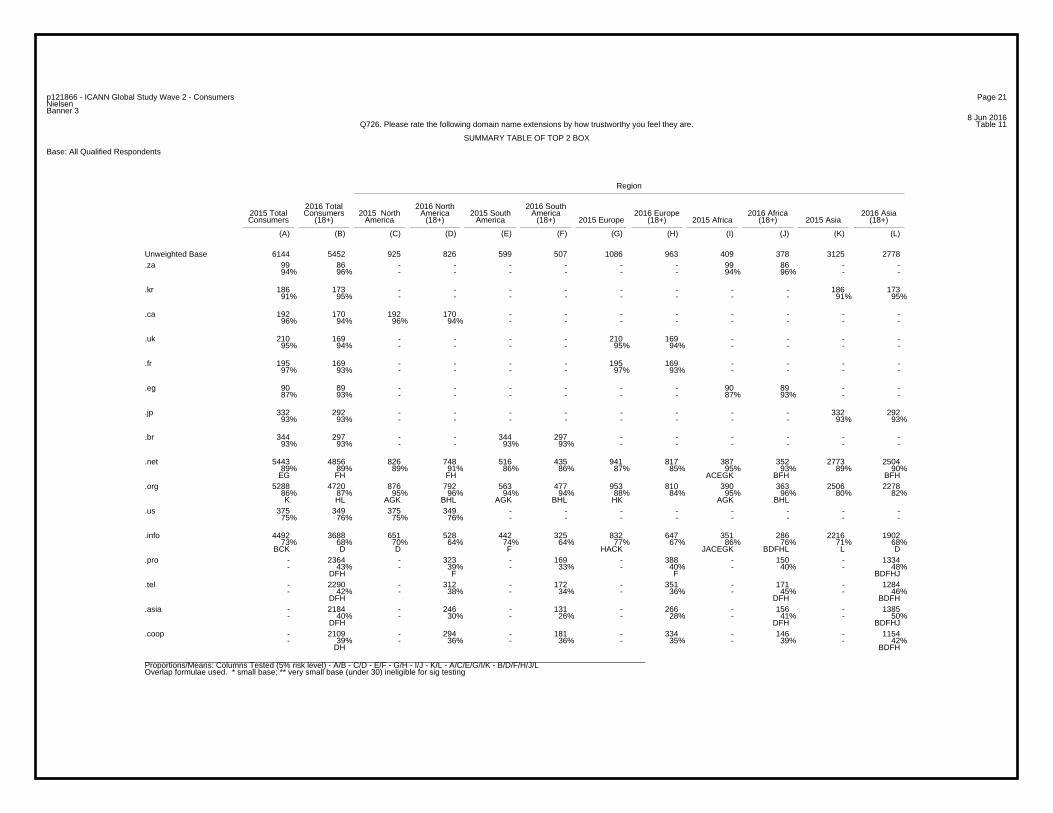
8 Jun 2016Table 11Q726. Please rate the following domain name extensions by how trustworthy you feel they are.
SUMMARY TABLE OF TOP 2 BOX
Base: All Qualified Respondents
Region
2016 Total 2016 North 2016 South2015 Total Consumers 2015 North America 2015 South America 2016 Europe 2016 Africa 2016 AsiaConsumers (18+) America (18+) America (18+) 2015 Europe (18+) 2015 Africa (18+) 2015 Asia (18+)
(A) (B) (C) (D) (E) (F) (G) (H) (I) (J) (K) (L)
6144 5452 925 826 599 507 1086 963 409 378 3125 2778Unweighted Base99 86 - - - - - - 99 86 - -94% 96% - - - - - - 94% 96% - -
.za
186 173 - - - - - - - - 186 17391% 95% - - - - - - - - 91% 95%
.kr
192 170 192 170 - - - - - - - -96% 94% 96% 94% - - - - - - - -
.ca
210 169 - - - - 210 169 - - - -95% 94% - - - - 95% 94% - - - -
.uk
195 169 - - - - 195 169 - - - -97% 93% - - - - 97% 93% - - - -
.fr
90 89 - - - - - - 90 89 - -87% 93% - - - - - - 87% 93% - -
.eg
332 292 - - - - - - - - 332 29293% 93% - - - - - - - - 93% 93%
.jp
344 297 - - 344 297 - - - - - -93% 93% - - 93% 93% - - - - - -
.br
5443 4856 826 748 516 435 941 817 387 352 2773 250489% 89% 89% 91% 86% 86% 87% 85% 95% 93% 89% 90%
EG FH FH ACEGK BFH BFH
.net
5288 4720 876 792 563 477 953 810 390 363 2506 227886% 87% 95% 96% 94% 94% 88% 84% 95% 96% 80% 82%K HL AGK BHL AGK BHL HK AGK BHL
.org
375 349 375 349 - - - - - - - -75% 76% 75% 76% - - - - - - - -
.us
4492 3688 651 528 442 325 832 647 351 286 2216 190273% 68% 70% 64% 74% 64% 77% 67% 86% 76% 71% 68%
BCK D D F HACK JACEGK BDFHL L D
.info
- 2364 - 323 - 169 - 388 - 150 - 1334- 43% - 39% - 33% - 40% - 40% - 48%
DFH F F BDFHJ
.pro
- 2290 - 312 - 172 - 351 - 171 - 1284- 42% - 38% - 34% - 36% - 45% - 46%
DFH DFH BDFH
.tel
- 2184 - 246 - 131 - 266 - 156 - 1385- 40% - 30% - 26% - 28% - 41% - 50%
DFH DFH BDFHJ
.asia
- 2109 - 294 - 181 - 334 - 146 - 1154- 39% - 36% - 36% - 35% - 39% - 42%
DH BDFH
.coop
_________________________________________________________________________________________________________________Proportions/Means: Columns Tested (5% risk level) - A/B - C/D - E/F - G/H - I/J - K/L - A/C/E/G/I/K - B/D/F/H/J/LOverlap formulae used. * small base; ** very small base (under 30) ineligible for sig testing
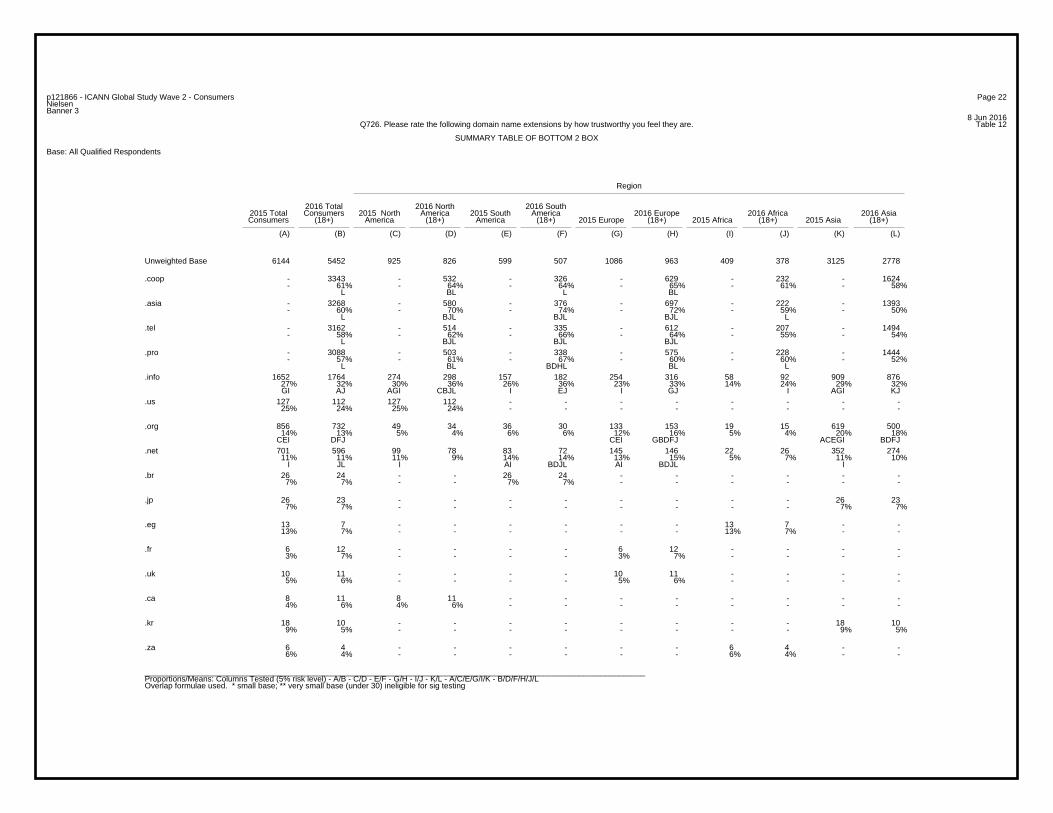
Page 22p121866 - ICANN Global Study Wave 2 - ConsumersNielsenBanner 3
8 Jun 2016Table 12Q726. Please rate the following domain name extensions by how trustworthy you feel they are.
SUMMARY TABLE OF BOTTOM 2 BOX
Base: All Qualified Respondents
Region
2016 Total 2016 North 2016 South2015 Total Consumers 2015 North America 2015 South America 2016 Europe 2016 Africa 2016 AsiaConsumers (18+) America (18+) America (18+) 2015 Europe (18+) 2015 Africa (18+) 2015 Asia (18+)
(A) (B) (C) (D) (E) (F) (G) (H) (I) (J) (K) (L)
6144 5452 925 826 599 507 1086 963 409 378 3125 2778Unweighted Base
- 3343 - 532 - 326 - 629 - 232 - 1624- 61% - 64% - 64% - 65% - 61% - 58%
L BL L BL
.coop
- 3268 - 580 - 376 - 697 - 222 - 1393- 60% - 70% - 74% - 72% - 59% - 50%
L BJL BJL BJL L
.asia
- 3162 - 514 - 335 - 612 - 207 - 1494- 58% - 62% - 66% - 64% - 55% - 54%
L BJL BJL BJL
.tel
- 3088 - 503 - 338 - 575 - 228 - 1444- 57% - 61% - 67% - 60% - 60% - 52%
L BL BDHL BL L
.pro
1652 1764 274 298 157 182 254 316 58 92 909 87627% 32% 30% 36% 26% 36% 23% 33% 14% 24% 29% 32%GI AJ AGI CBJL I EJ I GJ I AGI KJ
.info
127 112 127 112 - - - - - - - -25% 24% 25% 24% - - - - - - - -
.us
856 732 49 34 36 30 133 153 19 15 619 50014% 13% 5% 4% 6% 6% 12% 16% 5% 4% 20% 18%
CEI DFJ CEI GBDFJ ACEGI BDFJ
.org
701 596 99 78 83 72 145 146 22 26 352 27411% 11% 11% 9% 14% 14% 13% 15% 5% 7% 11% 10%
I JL I AI BDJL AI BDJL I
.net
26 24 - - 26 24 - - - - - -7% 7% - - 7% 7% - - - - - -
.br
26 23 - - - - - - - - 26 237% 7% - - - - - - - - 7% 7%
.jp
13 7 - - - - - - 13 7 - -13% 7% - - - - - - 13% 7% - -
.eg
6 12 - - - - 6 12 - - - -3% 7% - - - - 3% 7% - - - -
.fr
10 11 - - - - 10 11 - - - -5% 6% - - - - 5% 6% - - - -
.uk
8 11 8 11 - - - - - - - -4% 6% 4% 6% - - - - - - - -
.ca
18 10 - - - - - - - - 18 109% 5% - - - - - - - - 9% 5%
.kr
6 4 - - - - - - 6 4 - -6% 4% - - - - - - 6% 4% - -
.za
_________________________________________________________________________________________________________________Proportions/Means: Columns Tested (5% risk level) - A/B - C/D - E/F - G/H - I/J - K/L - A/C/E/G/I/K - B/D/F/H/J/LOverlap formulae used. * small base; ** very small base (under 30) ineligible for sig testing
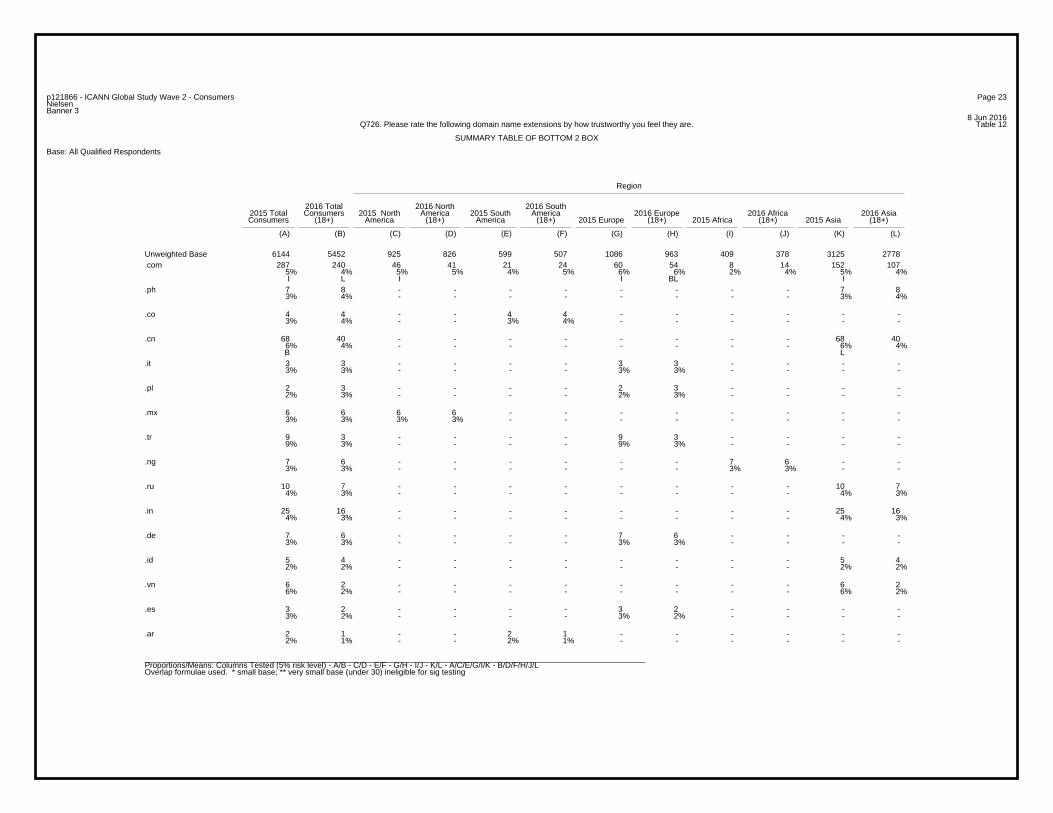
Page 23p121866 - ICANN Global Study Wave 2 - ConsumersNielsenBanner 3
8 Jun 2016Table 12Q726. Please rate the following domain name extensions by how trustworthy you feel they are.
SUMMARY TABLE OF BOTTOM 2 BOX
Base: All Qualified Respondents
Region
2016 Total 2016 North 2016 South2015 Total Consumers 2015 North America 2015 South America 2016 Europe 2016 Africa 2016 AsiaConsumers (18+) America (18+) America (18+) 2015 Europe (18+) 2015 Africa (18+) 2015 Asia (18+)
(A) (B) (C) (D) (E) (F) (G) (H) (I) (J) (K) (L)
6144 5452 925 826 599 507 1086 963 409 378 3125 2778Unweighted Base287 240 46 41 21 24 60 54 8 14 152 107
5% 4% 5% 5% 4% 5% 6% 6% 2% 4% 5% 4%I L I I BL I
.com
7 8 - - - - - - - - 7 83% 4% - - - - - - - - 3% 4%
.ph
4 4 - - 4 4 - - - - - -3% 4% - - 3% 4% - - - - - -
.co
68 40 - - - - - - - - 68 406% 4% - - - - - - - - 6% 4%B L
.cn
3 3 - - - - 3 3 - - - -3% 3% - - - - 3% 3% - - - -
.it
2 3 - - - - 2 3 - - - -2% 3% - - - - 2% 3% - - - -
.pl
6 6 6 6 - - - - - - - -3% 3% 3% 3% - - - - - - - -
.mx
9 3 - - - - 9 3 - - - -9% 3% - - - - 9% 3% - - - -
.tr
7 6 - - - - - - 7 6 - -3% 3% - - - - - - 3% 3% - -
.ng
10 7 - - - - - - - - 10 74% 3% - - - - - - - - 4% 3%
.ru
25 16 - - - - - - - - 25 164% 3% - - - - - - - - 4% 3%
.in
7 6 - - - - 7 6 - - - -3% 3% - - - - 3% 3% - - - -
.de
5 4 - - - - - - - - 5 42% 2% - - - - - - - - 2% 2%
.id
6 2 - - - - - - - - 6 26% 2% - - - - - - - - 6% 2%
.vn
3 2 - - - - 3 2 - - - -3% 2% - - - - 3% 2% - - - -
.es
2 1 - - 2 1 - - - - - -2% 1% - - 2% 1% - - - - - -
.ar
_________________________________________________________________________________________________________________Proportions/Means: Columns Tested (5% risk level) - A/B - C/D - E/F - G/H - I/J - K/L - A/C/E/G/I/K - B/D/F/H/J/LOverlap formulae used. * small base; ** very small base (under 30) ineligible for sig testing

Page 24p121866 - ICANN Global Study Wave 2 - ConsumersNielsenBanner 3
8 Jun 2016Table 13Q726_1. Please rate the following domain name extensions by how trustworthy you feel they are.
1. .com
Base: All Qualified Respondents
Region
2016 Total 2016 North 2016 South2015 Total Consumers 2015 North America 2015 South America 2016 Europe 2016 Africa 2016 AsiaConsumers (18+) America (18+) America (18+) 2015 Europe (18+) 2015 Africa (18+) 2015 Asia (18+)
(A) (B) (C) (D) (E) (F) (G) (H) (I) (J) (K) (L)
6144 5452 925 826 599 507 1086 963 409 378 3125 2778Unweighted Base
5857 5212 879 785 578 483 1026 909 401 364 2973 267195% 96% 95% 95% 96% 95% 94% 94% 98% 96% 95% 96%
H ACGK BH
TOP 2 BOX (NET)
3534 3376 507 453 398 347 439 467 320 298 1870 181158% 62% 55% 55% 66% 68% 40% 48% 78% 79% 60% 65%G ADH G H ACGK BDH G ACEGK BDFHL ACG KBDH
Very trustworthy
2323 1836 372 332 180 136 587 442 81 66 1103 86038% 34% 40% 40% 30% 27% 54% 46% 20% 17% 35% 31%
BEIK FJL EIK BFJL I J HACEIK BDFJL LEI J
Somewhat trustworthy
287 240 46 41 21 24 60 54 8 14 152 1075% 4% 5% 5% 4% 5% 6% 6% 2% 4% 5% 4%I L I I BL I
BOTTOM 2 BOX (NET)
230 181 36 26 14 17 47 41 6 11 127 864% 3% 4% 3% 2% 3% 4% 4% 1% 3% 4% 3%I I EI LEI
Not very trustworthy
57 59 10 15 7 7 13 13 2 3 25 211% 1% 1% 2% 1% 1% 1% 1% * 1% 1% 1%
L BL
Not at all trustworthy
6144 5452 925 826 599 507 1086 963 409 378 3125 2778100% 100% 100% 100% 100% 100% 100% 100% 100% 100% 100% 100%
Sigma
_________________________________________________________________________________________________________________Proportions/Means: Columns Tested (5% risk level) - A/B - C/D - E/F - G/H - I/J - K/L - A/C/E/G/I/K - B/D/F/H/J/LOverlap formulae used.
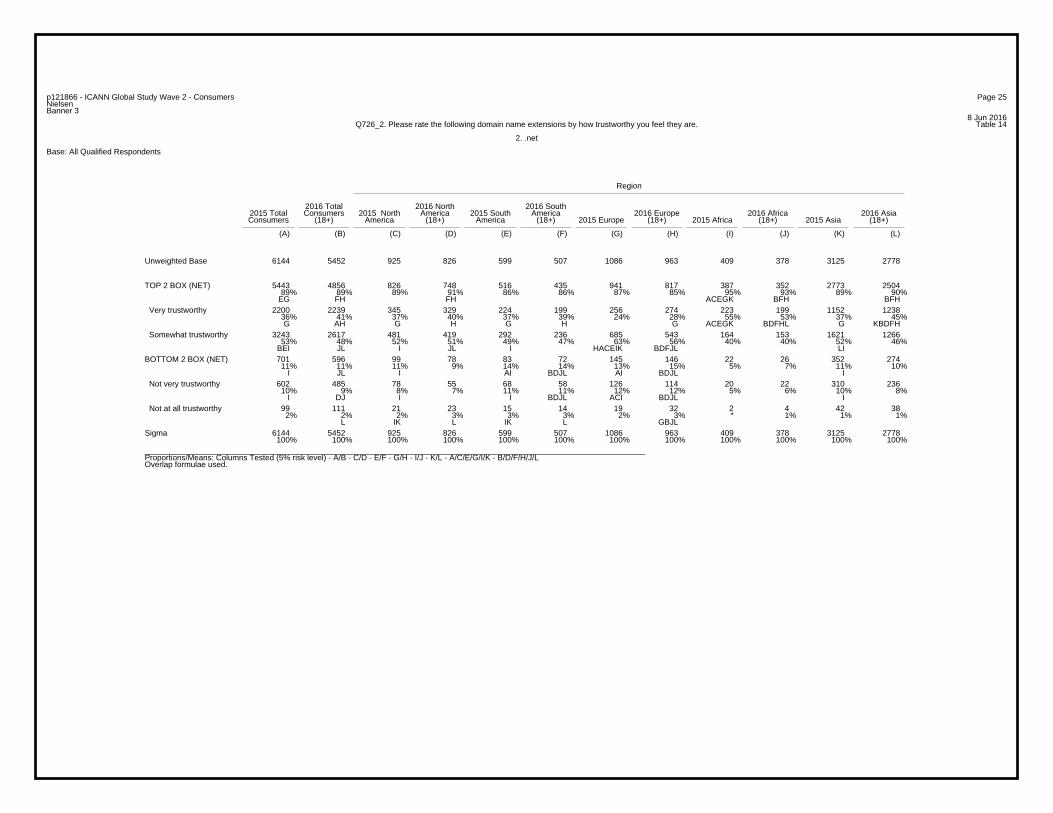
Page 25p121866 - ICANN Global Study Wave 2 - ConsumersNielsenBanner 3
8 Jun 2016Table 14Q726_2. Please rate the following domain name extensions by how trustworthy you feel they are.
2. .net
Base: All Qualified Respondents
Region
2016 Total 2016 North 2016 South2015 Total Consumers 2015 North America 2015 South America 2016 Europe 2016 Africa 2016 AsiaConsumers (18+) America (18+) America (18+) 2015 Europe (18+) 2015 Africa (18+) 2015 Asia (18+)
(A) (B) (C) (D) (E) (F) (G) (H) (I) (J) (K) (L)
6144 5452 925 826 599 507 1086 963 409 378 3125 2778Unweighted Base
5443 4856 826 748 516 435 941 817 387 352 2773 250489% 89% 89% 91% 86% 86% 87% 85% 95% 93% 89% 90%
EG FH FH ACEGK BFH BFH
TOP 2 BOX (NET)
2200 2239 345 329 224 199 256 274 223 199 1152 123836% 41% 37% 40% 37% 39% 24% 28% 55% 53% 37% 45%G AH G H G H G ACEGK BDFHL G KBDFH
Very trustworthy
3243 2617 481 419 292 236 685 543 164 153 1621 126653% 48% 52% 51% 49% 47% 63% 56% 40% 40% 52% 46%
BEI JL I JL I HACEIK BDFJL LI
Somewhat trustworthy
701 596 99 78 83 72 145 146 22 26 352 27411% 11% 11% 9% 14% 14% 13% 15% 5% 7% 11% 10%
I JL I AI BDJL AI BDJL I
BOTTOM 2 BOX (NET)
602 485 78 55 68 58 126 114 20 22 310 23610% 9% 8% 7% 11% 11% 12% 12% 5% 6% 10% 8%
I DJ I I BDJL ACI BDJL I
Not very trustworthy
99 111 21 23 15 14 19 32 2 4 42 382% 2% 2% 3% 3% 3% 2% 3% * 1% 1% 1%
L IK L IK L GBJL
Not at all trustworthy
6144 5452 925 826 599 507 1086 963 409 378 3125 2778100% 100% 100% 100% 100% 100% 100% 100% 100% 100% 100% 100%
Sigma
_________________________________________________________________________________________________________________Proportions/Means: Columns Tested (5% risk level) - A/B - C/D - E/F - G/H - I/J - K/L - A/C/E/G/I/K - B/D/F/H/J/LOverlap formulae used.
Page 26p121866 - ICANN Global Study Wave 2 - ConsumersNielsenBanner 3
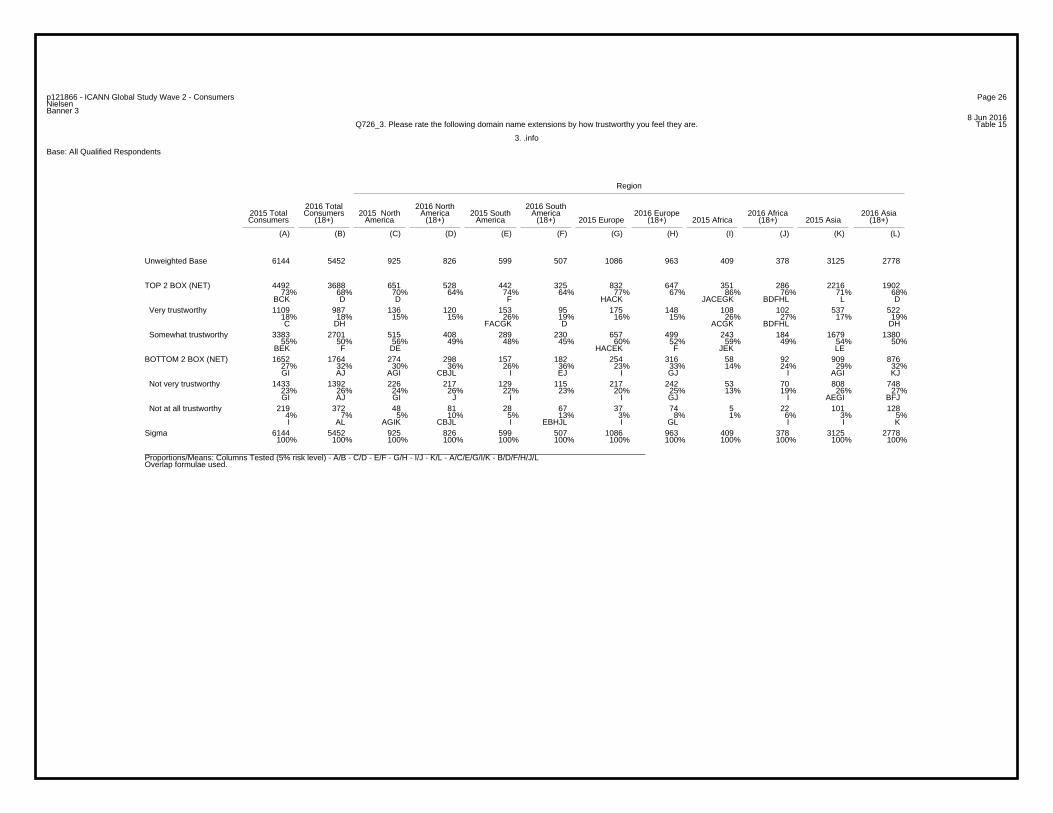
8 Jun 2016Table 15Q726_3. Please rate the following domain name extensions by how trustworthy you feel they are.
3. .info
Base: All Qualified Respondents
Region
2016 Total 2016 North 2016 South2015 Total Consumers 2015 North America 2015 South America 2016 Europe 2016 Africa 2016 AsiaConsumers (18+) America (18+) America (18+) 2015 Europe (18+) 2015 Africa (18+) 2015 Asia (18+)
(A) (B) (C) (D) (E) (F) (G) (H) (I) (J) (K) (L)
6144 5452 925 826 599 507 1086 963 409 378 3125 2778Unweighted Base
4492 3688 651 528 442 325 832 647 351 286 2216 190273% 68% 70% 64% 74% 64% 77% 67% 86% 76% 71% 68%
BCK D D F HACK JACEGK BDFHL L D
TOP 2 BOX (NET)
1109 987 136 120 153 95 175 148 108 102 537 52218% 18% 15% 15% 26% 19% 16% 15% 26% 27% 17% 19%C DH FACGK D ACGK BDFHL DH
Very trustworthy
3383 2701 515 408 289 230 657 499 243 184 1679 138055% 50% 56% 49% 48% 45% 60% 52% 59% 49% 54% 50%
BEK F DE HACEK F JEK LE
Somewhat trustworthy
1652 1764 274 298 157 182 254 316 58 92 909 87627% 32% 30% 36% 26% 36% 23% 33% 14% 24% 29% 32%GI AJ AGI CBJL I EJ I GJ I AGI KJ
BOTTOM 2 BOX (NET)
1433 1392 226 217 129 115 217 242 53 70 808 74823% 26% 24% 26% 22% 23% 20% 25% 13% 19% 26% 27%GI AJ GI J I I GJ I AEGI BFJ
Not very trustworthy
219 372 48 81 28 67 37 74 5 22 101 1284% 7% 5% 10% 5% 13% 3% 8% 1% 6% 3% 5%I AL AGIK CBJL I EBHJL I GL I I K
Not at all trustworthy
6144 5452 925 826 599 507 1086 963 409 378 3125 2778100% 100% 100% 100% 100% 100% 100% 100% 100% 100% 100% 100%
Sigma
_________________________________________________________________________________________________________________Proportions/Means: Columns Tested (5% risk level) - A/B - C/D - E/F - G/H - I/J - K/L - A/C/E/G/I/K - B/D/F/H/J/LOverlap formulae used.
Page 27p121866 - ICANN Global Study Wave 2 - ConsumersNielsenBanner 3
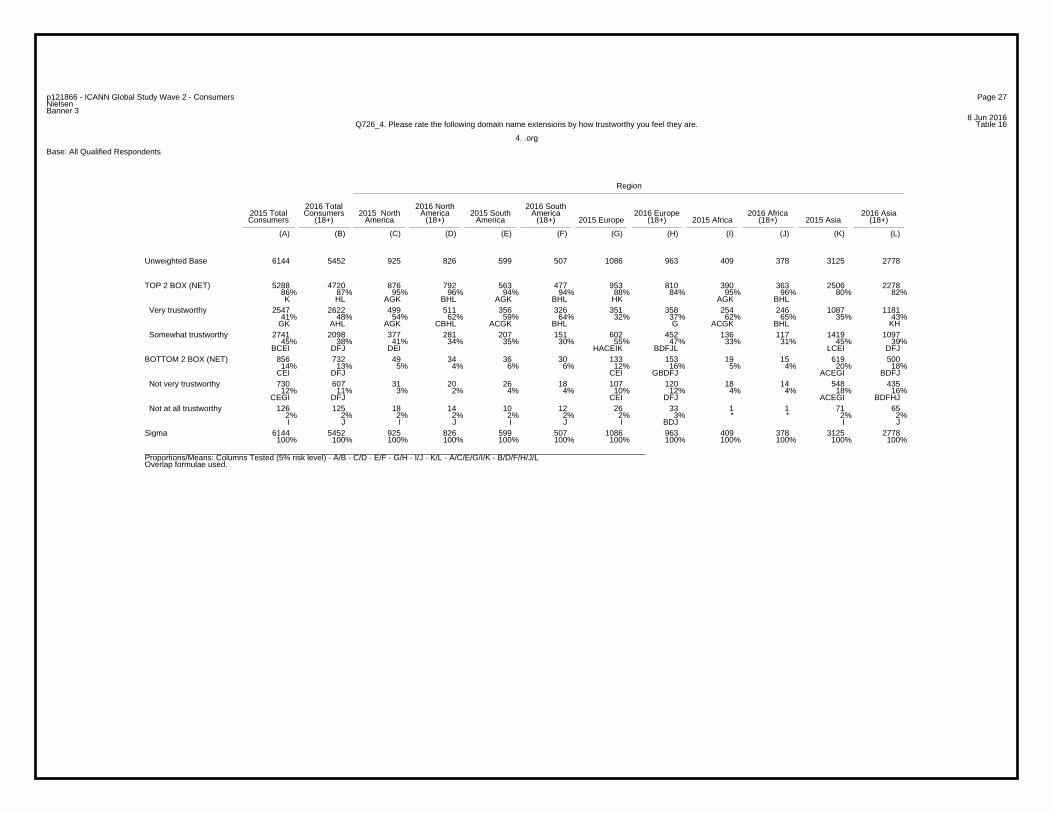
8 Jun 2016Table 16Q726_4. Please rate the following domain name extensions by how trustworthy you feel they are.
4. .org
Base: All Qualified Respondents
Region
2016 Total 2016 North 2016 South2015 Total Consumers 2015 North America 2015 South America 2016 Europe 2016 Africa 2016 AsiaConsumers (18+) America (18+) America (18+) 2015 Europe (18+) 2015 Africa (18+) 2015 Asia (18+)
(A) (B) (C) (D) (E) (F) (G) (H) (I) (J) (K) (L)
6144 5452 925 826 599 507 1086 963 409 378 3125 2778Unweighted Base
5288 4720 876 792 563 477 953 810 390 363 2506 227886% 87% 95% 96% 94% 94% 88% 84% 95% 96% 80% 82%K HL AGK BHL AGK BHL HK AGK BHL
TOP 2 BOX (NET)
2547 2622 499 511 356 326 351 358 254 246 1087 118141% 48% 54% 62% 59% 64% 32% 37% 62% 65% 35% 43%
GK AHL AGK CBHL ACGK BHL G ACGK BHL KH
Very trustworthy
2741 2098 377 281 207 151 602 452 136 117 1419 109745% 38% 41% 34% 35% 30% 55% 47% 33% 31% 45% 39%
BCEI DFJ DEI HACEIK BDFJL LCEI DFJ
Somewhat trustworthy
856 732 49 34 36 30 133 153 19 15 619 50014% 13% 5% 4% 6% 6% 12% 16% 5% 4% 20% 18%
CEI DFJ CEI GBDFJ ACEGI BDFJ
BOTTOM 2 BOX (NET)
730 607 31 20 26 18 107 120 18 14 548 43512% 11% 3% 2% 4% 4% 10% 12% 4% 4% 18% 16%
CEGI DFJ CEI DFJ ACEGI BDFHJ
Not very trustworthy
126 125 18 14 10 12 26 33 1 1 71 652% 2% 2% 2% 2% 2% 2% 3% * * 2% 2%I J I J I J I BDJ I J
Not at all trustworthy
6144 5452 925 826 599 507 1086 963 409 378 3125 2778100% 100% 100% 100% 100% 100% 100% 100% 100% 100% 100% 100%
Sigma
_________________________________________________________________________________________________________________Proportions/Means: Columns Tested (5% risk level) - A/B - C/D - E/F - G/H - I/J - K/L - A/C/E/G/I/K - B/D/F/H/J/LOverlap formulae used.
Page 28p121866 - ICANN Global Study Wave 2 - ConsumersNielsenBanner 3
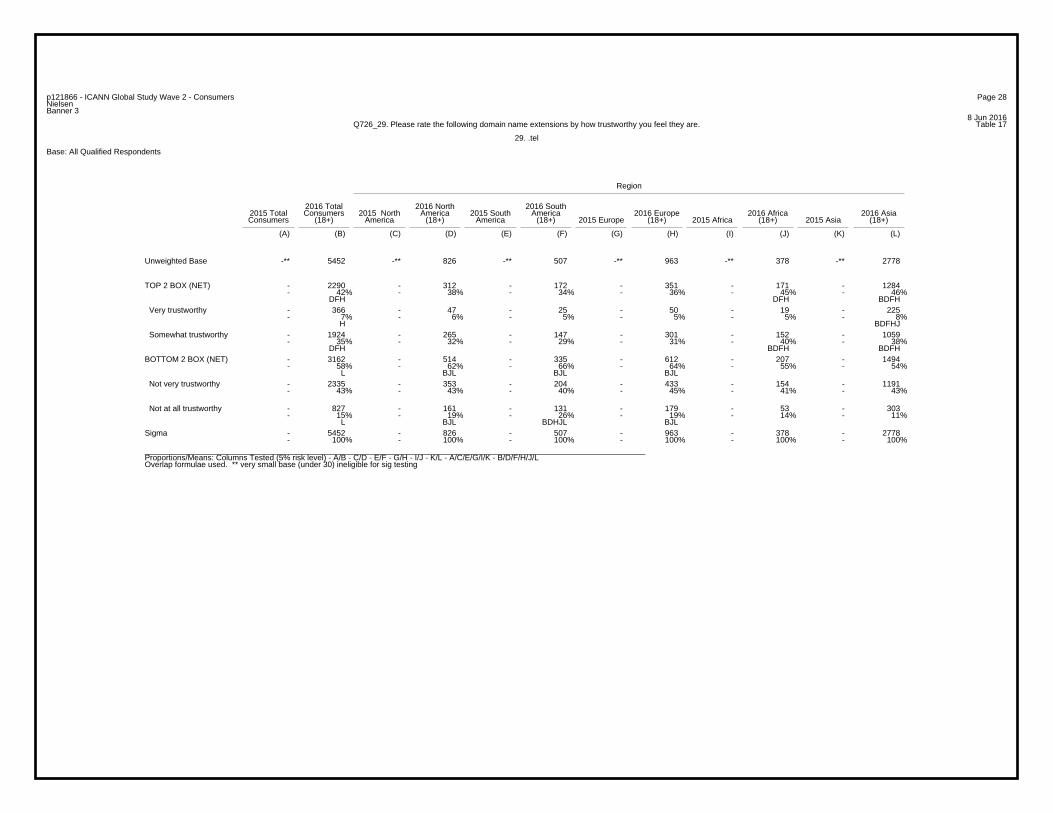
8 Jun 2016Table 17Q726_29. Please rate the following domain name extensions by how trustworthy you feel they are.
29. .tel
Base: All Qualified Respondents
Region
2016 Total 2016 North 2016 South2015 Total Consumers 2015 North America 2015 South America 2016 Europe 2016 Africa 2016 AsiaConsumers (18+) America (18+) America (18+) 2015 Europe (18+) 2015 Africa (18+) 2015 Asia (18+)
(A) (B) (C) (D) (E) (F) (G) (H) (I) (J) (K) (L)
-** 5452 -** 826 -** 507 -** 963 -** 378 -** 2778Unweighted Base
- 2290 - 312 - 172 - 351 - 171 - 1284- 42% - 38% - 34% - 36% - 45% - 46%
DFH DFH BDFH
TOP 2 BOX (NET)
- 366 - 47 - 25 - 50 - 19 - 225- 7% - 6% - 5% - 5% - 5% - 8%
H BDFHJ
Very trustworthy
- 1924 - 265 - 147 - 301 - 152 - 1059- 35% - 32% - 29% - 31% - 40% - 38%
DFH BDFH BDFH
Somewhat trustworthy
- 3162 - 514 - 335 - 612 - 207 - 1494- 58% - 62% - 66% - 64% - 55% - 54%
L BJL BJL BJL
BOTTOM 2 BOX (NET)
- 2335 - 353 - 204 - 433 - 154 - 1191- 43% - 43% - 40% - 45% - 41% - 43%
Not very trustworthy
- 827 - 161 - 131 - 179 - 53 - 303- 15% - 19% - 26% - 19% - 14% - 11%
L BJL BDHJL BJL
Not at all trustworthy
- 5452 - 826 - 507 - 963 - 378 - 2778- 100% - 100% - 100% - 100% - 100% - 100%
Sigma
_________________________________________________________________________________________________________________Proportions/Means: Columns Tested (5% risk level) - A/B - C/D - E/F - G/H - I/J - K/L - A/C/E/G/I/K - B/D/F/H/J/LOverlap formulae used. ** very small base (under 30) ineligible for sig testing

Page 29p121866 - ICANN Global Study Wave 2 - ConsumersNielsenBanner 3
8 Jun 2016Table 18Q726_30. Please rate the following domain name extensions by how trustworthy you feel they are.
30. .asia
Base: All Qualified Respondents
Region
2016 Total 2016 North 2016 South2015 Total Consumers 2015 North America 2015 South America 2016 Europe 2016 Africa 2016 AsiaConsumers (18+) America (18+) America (18+) 2015 Europe (18+) 2015 Africa (18+) 2015 Asia (18+)
(A) (B) (C) (D) (E) (F) (G) (H) (I) (J) (K) (L)
-** 5452 -** 826 -** 507 -** 963 -** 378 -** 2778Unweighted Base
- 2184 - 246 - 131 - 266 - 156 - 1385- 40% - 30% - 26% - 28% - 41% - 50%
DFH DFH BDFHJ
TOP 2 BOX (NET)
- 364 - 23 - 21 - 41 - 17 - 262- 7% - 3% - 4% - 4% - 4% - 9%
DFH BDFHJ
Very trustworthy
- 1820 - 223 - 110 - 225 - 139 - 1123- 33% - 27% - 22% - 23% - 37% - 40%
DFH F DFH BDFH
Somewhat trustworthy
- 3268 - 580 - 376 - 697 - 222 - 1393- 60% - 70% - 74% - 72% - 59% - 50%
L BJL BJL BJL L
BOTTOM 2 BOX (NET)
- 2227 - 329 - 200 - 422 - 157 - 1119- 41% - 40% - 39% - 44% - 42% - 40%
B
Not very trustworthy
- 1041 - 251 - 176 - 275 - 65 - 274- 19% - 30% - 35% - 29% - 17% - 10%
L BJL BHJL BJL L
Not at all trustworthy
- 5452 - 826 - 507 - 963 - 378 - 2778- 100% - 100% - 100% - 100% - 100% - 100%
Sigma
_________________________________________________________________________________________________________________Proportions/Means: Columns Tested (5% risk level) - A/B - C/D - E/F - G/H - I/J - K/L - A/C/E/G/I/K - B/D/F/H/J/LOverlap formulae used. ** very small base (under 30) ineligible for sig testing

Page 30p121866 - ICANN Global Study Wave 2 - ConsumersNielsenBanner 3
8 Jun 2016Table 19Q726_31. Please rate the following domain name extensions by how trustworthy you feel they are.
31. .pro
Base: All Qualified Respondents
Region
2016 Total 2016 North 2016 South2015 Total Consumers 2015 North America 2015 South America 2016 Europe 2016 Africa 2016 AsiaConsumers (18+) America (18+) America (18+) 2015 Europe (18+) 2015 Africa (18+) 2015 Asia (18+)
(A) (B) (C) (D) (E) (F) (G) (H) (I) (J) (K) (L)
-** 5452 -** 826 -** 507 -** 963 -** 378 -** 2778Unweighted Base
- 2364 - 323 - 169 - 388 - 150 - 1334- 43% - 39% - 33% - 40% - 40% - 48%
DFH F F BDFHJ
TOP 2 BOX (NET)
- 375 - 39 - 29 - 52 - 24 - 231- 7% - 5% - 6% - 5% - 6% - 8%
DH BDFH
Very trustworthy
- 1989 - 284 - 140 - 336 - 126 - 1103- 36% - 34% - 28% - 35% - 33% - 40%
F F F BDFHJ
Somewhat trustworthy
- 3088 - 503 - 338 - 575 - 228 - 1444- 57% - 61% - 67% - 60% - 60% - 52%
L BL BDHL BL L
BOTTOM 2 BOX (NET)
- 2321 - 347 - 203 - 420 - 165 - 1186- 43% - 42% - 40% - 44% - 44% - 43%
Not very trustworthy
- 767 - 156 - 135 - 155 - 63 - 258- 14% - 19% - 27% - 16% - 17% - 9%
L BL BDHJL BL L
Not at all trustworthy
- 5452 - 826 - 507 - 963 - 378 - 2778- 100% - 100% - 100% - 100% - 100% - 100%
Sigma
_________________________________________________________________________________________________________________Proportions/Means: Columns Tested (5% risk level) - A/B - C/D - E/F - G/H - I/J - K/L - A/C/E/G/I/K - B/D/F/H/J/LOverlap formulae used. ** very small base (under 30) ineligible for sig testing
Page 31p121866 - ICANN Global Study Wave 2 - ConsumersNielsenBanner 3
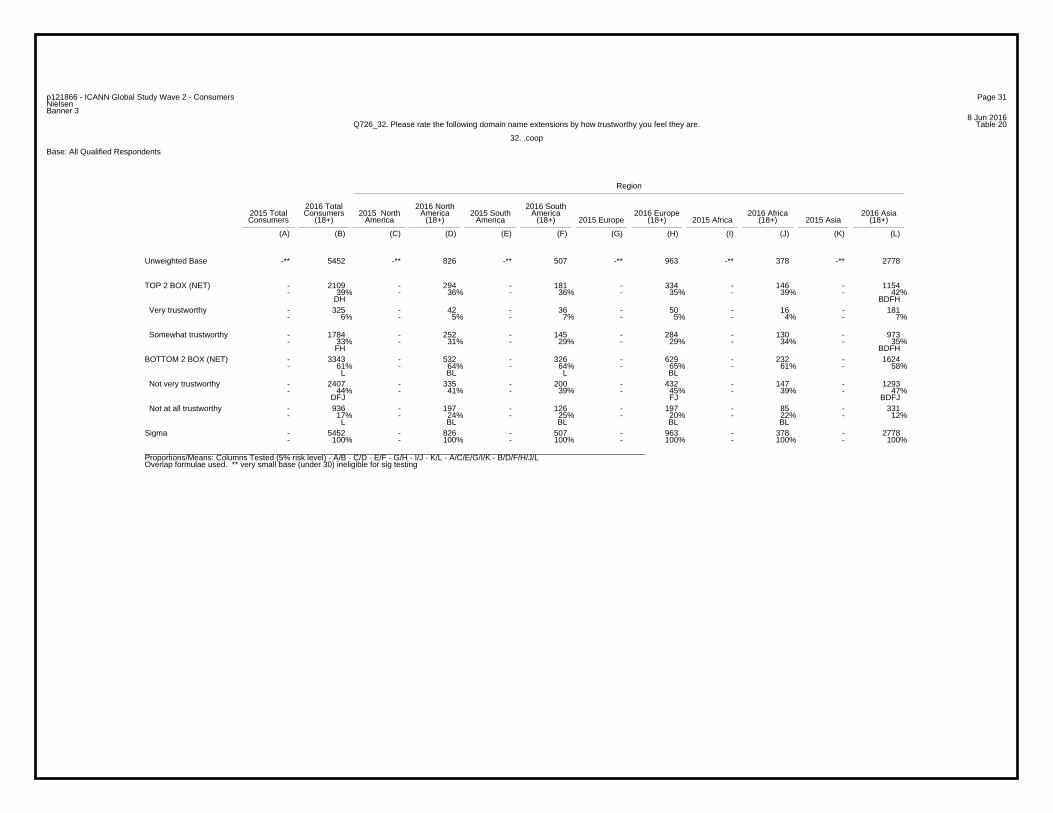
8 Jun 2016Table 20Q726_32. Please rate the following domain name extensions by how trustworthy you feel they are.
32. .coop
Base: All Qualified Respondents
Region
2016 Total 2016 North 2016 South2015 Total Consumers 2015 North America 2015 South America 2016 Europe 2016 Africa 2016 AsiaConsumers (18+) America (18+) America (18+) 2015 Europe (18+) 2015 Africa (18+) 2015 Asia (18+)
(A) (B) (C) (D) (E) (F) (G) (H) (I) (J) (K) (L)
-** 5452 -** 826 -** 507 -** 963 -** 378 -** 2778Unweighted Base
- 2109 - 294 - 181 - 334 - 146 - 1154- 39% - 36% - 36% - 35% - 39% - 42%
DH BDFH
TOP 2 BOX (NET)
- 325 - 42 - 36 - 50 - 16 - 181- 6% - 5% - 7% - 5% - 4% - 7%
Very trustworthy
- 1784 - 252 - 145 - 284 - 130 - 973- 33% - 31% - 29% - 29% - 34% - 35%
FH BDFH
Somewhat trustworthy
- 3343 - 532 - 326 - 629 - 232 - 1624- 61% - 64% - 64% - 65% - 61% - 58%
L BL L BL
BOTTOM 2 BOX (NET)
- 2407 - 335 - 200 - 432 - 147 - 1293- 44% - 41% - 39% - 45% - 39% - 47%
DFJ FJ BDFJ
Not very trustworthy
- 936 - 197 - 126 - 197 - 85 - 331- 17% - 24% - 25% - 20% - 22% - 12%
L BL BL BL BL
Not at all trustworthy
- 5452 - 826 - 507 - 963 - 378 - 2778- 100% - 100% - 100% - 100% - 100% - 100%
Sigma
_________________________________________________________________________________________________________________Proportions/Means: Columns Tested (5% risk level) - A/B - C/D - E/F - G/H - I/J - K/L - A/C/E/G/I/K - B/D/F/H/J/LOverlap formulae used. ** very small base (under 30) ineligible for sig testing
Page 32p121866 - ICANN Global Study Wave 2 - ConsumersNielsenBanner 3
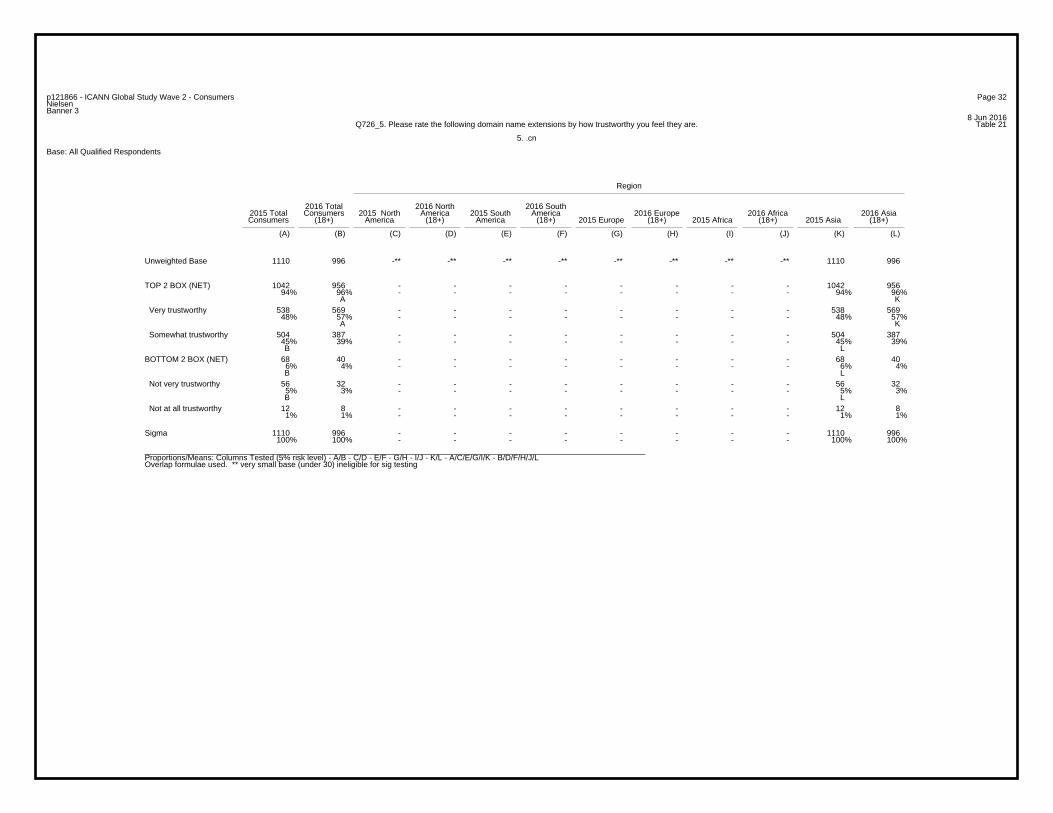
8 Jun 2016Table 21Q726_5. Please rate the following domain name extensions by how trustworthy you feel they are.
5. .cn
Base: All Qualified Respondents
Region
2016 Total 2016 North 2016 South2015 Total Consumers 2015 North America 2015 South America 2016 Europe 2016 Africa 2016 AsiaConsumers (18+) America (18+) America (18+) 2015 Europe (18+) 2015 Africa (18+) 2015 Asia (18+)
(A) (B) (C) (D) (E) (F) (G) (H) (I) (J) (K) (L)
1110 996 -** -** -** -** -** -** -** -** 1110 996Unweighted Base
1042 956 - - - - - - - - 1042 95694% 96% - - - - - - - - 94% 96%
A K
TOP 2 BOX (NET)
538 569 - - - - - - - - 538 56948% 57% - - - - - - - - 48% 57%
A K
Very trustworthy
504 387 - - - - - - - - 504 38745% 39% - - - - - - - - 45% 39%B L
Somewhat trustworthy
68 40 - - - - - - - - 68 406% 4% - - - - - - - - 6% 4%B L
BOTTOM 2 BOX (NET)
56 32 - - - - - - - - 56 325% 3% - - - - - - - - 5% 3%B L
Not very trustworthy
12 8 - - - - - - - - 12 81% 1% - - - - - - - - 1% 1%
Not at all trustworthy
1110 996 - - - - - - - - 1110 996100% 100% - - - - - - - - 100% 100%
Sigma
_________________________________________________________________________________________________________________Proportions/Means: Columns Tested (5% risk level) - A/B - C/D - E/F - G/H - I/J - K/L - A/C/E/G/I/K - B/D/F/H/J/LOverlap formulae used. ** very small base (under 30) ineligible for sig testing
Page 33p121866 - ICANN Global Study Wave 2 - ConsumersNielsenBanner 3
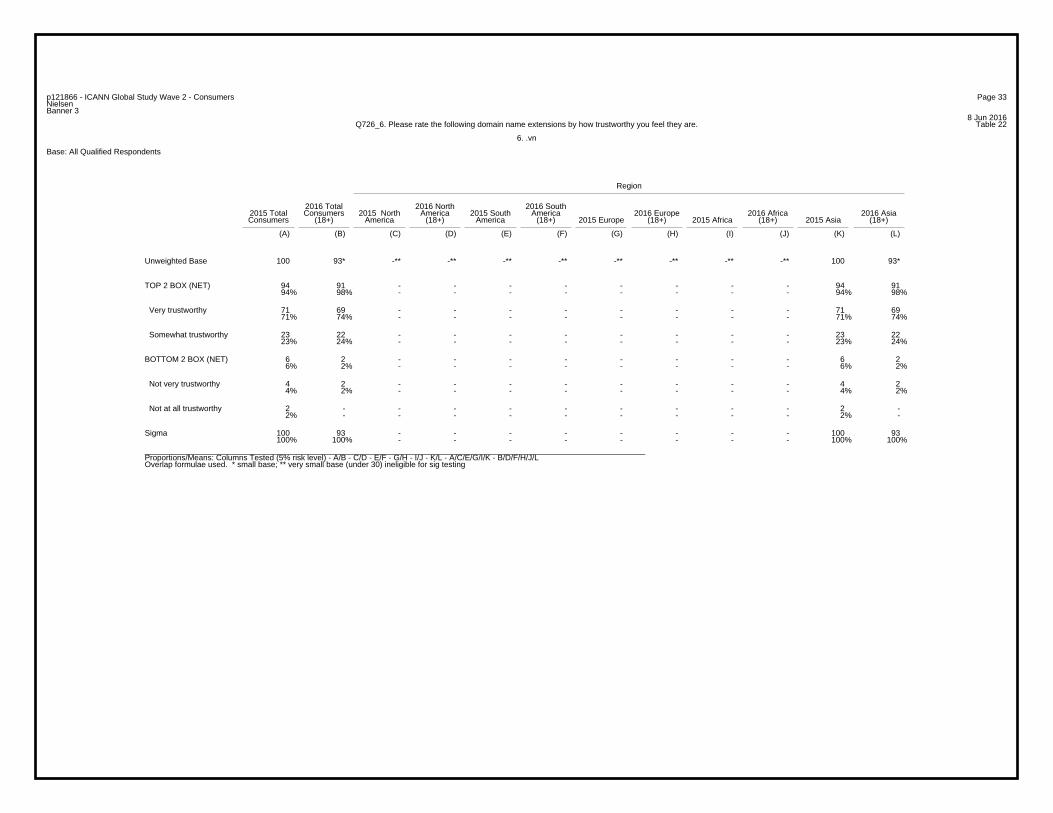
8 Jun 2016Table 22Q726_6. Please rate the following domain name extensions by how trustworthy you feel they are.
6. .vn
Base: All Qualified Respondents
Region
2016 Total 2016 North 2016 South2015 Total Consumers 2015 North America 2015 South America 2016 Europe 2016 Africa 2016 AsiaConsumers (18+) America (18+) America (18+) 2015 Europe (18+) 2015 Africa (18+) 2015 Asia (18+)
(A) (B) (C) (D) (E) (F) (G) (H) (I) (J) (K) (L)
100 93* -** -** -** -** -** -** -** -** 100 93*Unweighted Base
94 91 - - - - - - - - 94 9194% 98% - - - - - - - - 94% 98%
TOP 2 BOX (NET)
71 69 - - - - - - - - 71 6971% 74% - - - - - - - - 71% 74%
Very trustworthy
23 22 - - - - - - - - 23 2223% 24% - - - - - - - - 23% 24%
Somewhat trustworthy
6 2 - - - - - - - - 6 26% 2% - - - - - - - - 6% 2%
BOTTOM 2 BOX (NET)
4 2 - - - - - - - - 4 24% 2% - - - - - - - - 4% 2%
Not very trustworthy
2 - - - - - - - - - 2 -2% - - - - - - - - - 2% -
Not at all trustworthy
100 93 - - - - - - - - 100 93100% 100% - - - - - - - - 100% 100%
Sigma
_________________________________________________________________________________________________________________Proportions/Means: Columns Tested (5% risk level) - A/B - C/D - E/F - G/H - I/J - K/L - A/C/E/G/I/K - B/D/F/H/J/LOverlap formulae used. * small base; ** very small base (under 30) ineligible for sig testing

Page 34p121866 - ICANN Global Study Wave 2 - ConsumersNielsenBanner 3
8 Jun 2016Table 23Q726_7. Please rate the following domain name extensions by how trustworthy you feel they are.
7. .ph
Base: All Qualified Respondents
Region
2016 Total 2016 North 2016 South2015 Total Consumers 2015 North America 2015 South America 2016 Europe 2016 Africa 2016 AsiaConsumers (18+) America (18+) America (18+) 2015 Europe (18+) 2015 Africa (18+) 2015 Asia (18+)
(A) (B) (C) (D) (E) (F) (G) (H) (I) (J) (K) (L)
206 184 -** -** -** -** -** -** -** -** 206 184Unweighted Base
199 176 - - - - - - - - 199 17697% 96% - - - - - - - - 97% 96%
TOP 2 BOX (NET)
138 129 - - - - - - - - 138 12967% 70% - - - - - - - - 67% 70%
Very trustworthy
61 47 - - - - - - - - 61 4730% 26% - - - - - - - - 30% 26%
Somewhat trustworthy
7 8 - - - - - - - - 7 83% 4% - - - - - - - - 3% 4%
BOTTOM 2 BOX (NET)
5 8 - - - - - - - - 5 82% 4% - - - - - - - - 2% 4%
Not very trustworthy
2 - - - - - - - - - 2 -1% - - - - - - - - - 1% -
Not at all trustworthy
206 184 - - - - - - - - 206 184100% 100% - - - - - - - - 100% 100%
Sigma
_________________________________________________________________________________________________________________Proportions/Means: Columns Tested (5% risk level) - A/B - C/D - E/F - G/H - I/J - K/L - A/C/E/G/I/K - B/D/F/H/J/LOverlap formulae used. ** very small base (under 30) ineligible for sig testing

Page 35p121866 - ICANN Global Study Wave 2 - ConsumersNielsenBanner 3
8 Jun 2016Table 24Q726_8. Please rate the following domain name extensions by how trustworthy you feel they are.
8. .jp
Base: All Qualified Respondents
Region
2016 Total 2016 North 2016 South2015 Total Consumers 2015 North America 2015 South America 2016 Europe 2016 Africa 2016 AsiaConsumers (18+) America (18+) America (18+) 2015 Europe (18+) 2015 Africa (18+) 2015 Asia (18+)
(A) (B) (C) (D) (E) (F) (G) (H) (I) (J) (K) (L)
358 315 -** -** -** -** -** -** -** -** 358 315Unweighted Base
332 292 - - - - - - - - 332 29293% 93% - - - - - - - - 93% 93%
TOP 2 BOX (NET)
95 117 - - - - - - - - 95 11727% 37% - - - - - - - - 27% 37%
A K
Very trustworthy
237 175 - - - - - - - - 237 17566% 56% - - - - - - - - 66% 56%B L
Somewhat trustworthy
26 23 - - - - - - - - 26 237% 7% - - - - - - - - 7% 7%
BOTTOM 2 BOX (NET)
24 19 - - - - - - - - 24 197% 6% - - - - - - - - 7% 6%
Not very trustworthy
2 4 - - - - - - - - 2 41% 1% - - - - - - - - 1% 1%
Not at all trustworthy
358 315 - - - - - - - - 358 315100% 100% - - - - - - - - 100% 100%
Sigma
_________________________________________________________________________________________________________________Proportions/Means: Columns Tested (5% risk level) - A/B - C/D - E/F - G/H - I/J - K/L - A/C/E/G/I/K - B/D/F/H/J/LOverlap formulae used. ** very small base (under 30) ineligible for sig testing

Page 36p121866 - ICANN Global Study Wave 2 - ConsumersNielsenBanner 3
8 Jun 2016Table 25Q726_9. Please rate the following domain name extensions by how trustworthy you feel they are.
9. .kr
Base: All Qualified Respondents
Region
2016 Total 2016 North 2016 South2015 Total Consumers 2015 North America 2015 South America 2016 Europe 2016 Africa 2016 AsiaConsumers (18+) America (18+) America (18+) 2015 Europe (18+) 2015 Africa (18+) 2015 Asia (18+)
(A) (B) (C) (D) (E) (F) (G) (H) (I) (J) (K) (L)
204 183 -** -** -** -** -** -** -** -** 204 183Unweighted Base
186 173 - - - - - - - - 186 17391% 95% - - - - - - - - 91% 95%
TOP 2 BOX (NET)
85 89 - - - - - - - - 85 8942% 49% - - - - - - - - 42% 49%
Very trustworthy
101 84 - - - - - - - - 101 8450% 46% - - - - - - - - 50% 46%
Somewhat trustworthy
18 10 - - - - - - - - 18 109% 5% - - - - - - - - 9% 5%
BOTTOM 2 BOX (NET)
18 9 - - - - - - - - 18 99% 5% - - - - - - - - 9% 5%
Not very trustworthy
- 1 - - - - - - - - - 1- 1% - - - - - - - - - 1%
Not at all trustworthy
204 183 - - - - - - - - 204 183100% 100% - - - - - - - - 100% 100%
Sigma
_________________________________________________________________________________________________________________Proportions/Means: Columns Tested (5% risk level) - A/B - C/D - E/F - G/H - I/J - K/L - A/C/E/G/I/K - B/D/F/H/J/LOverlap formulae used. ** very small base (under 30) ineligible for sig testing

Page 37p121866 - ICANN Global Study Wave 2 - ConsumersNielsenBanner 3
8 Jun 2016Table 26Q726_10. Please rate the following domain name extensions by how trustworthy you feel they are.
10. .ru
Base: All Qualified Respondents
Region
2016 Total 2016 North 2016 South2015 Total Consumers 2015 North America 2015 South America 2016 Europe 2016 Africa 2016 AsiaConsumers (18+) America (18+) America (18+) 2015 Europe (18+) 2015 Africa (18+) 2015 Asia (18+)
(A) (B) (C) (D) (E) (F) (G) (H) (I) (J) (K) (L)
253 231 -** -** -** -** -** -** -** -** 253 231Unweighted Base
243 224 - - - - - - - - 243 22496% 97% - - - - - - - - 96% 97%
TOP 2 BOX (NET)
197 172 - - - - - - - - 197 17278% 74% - - - - - - - - 78% 74%
Very trustworthy
46 52 - - - - - - - - 46 5218% 23% - - - - - - - - 18% 23%
Somewhat trustworthy
10 7 - - - - - - - - 10 74% 3% - - - - - - - - 4% 3%
BOTTOM 2 BOX (NET)
7 5 - - - - - - - - 7 53% 2% - - - - - - - - 3% 2%
Not very trustworthy
3 2 - - - - - - - - 3 21% 1% - - - - - - - - 1% 1%
Not at all trustworthy
253 231 - - - - - - - - 253 231100% 100% - - - - - - - - 100% 100%
Sigma
_________________________________________________________________________________________________________________Proportions/Means: Columns Tested (5% risk level) - A/B - C/D - E/F - G/H - I/J - K/L - A/C/E/G/I/K - B/D/F/H/J/LOverlap formulae used. ** very small base (under 30) ineligible for sig testing

Page 38p121866 - ICANN Global Study Wave 2 - ConsumersNielsenBanner 3
8 Jun 2016Table 27Q726_11. Please rate the following domain name extensions by how trustworthy you feel they are.
11. .in
Base: All Qualified Respondents
Region
2016 Total 2016 North 2016 South2015 Total Consumers 2015 North America 2015 South America 2016 Europe 2016 Africa 2016 AsiaConsumers (18+) America (18+) America (18+) 2015 Europe (18+) 2015 Africa (18+) 2015 Asia (18+)
(A) (B) (C) (D) (E) (F) (G) (H) (I) (J) (K) (L)
687 595 -** -** -** -** -** -** -** -** 687 595Unweighted Base
662 579 - - - - - - - - 662 57996% 97% - - - - - - - - 96% 97%
TOP 2 BOX (NET)
449 427 - - - - - - - - 449 42765% 72% - - - - - - - - 65% 72%
A K
Very trustworthy
213 152 - - - - - - - - 213 15231% 26% - - - - - - - - 31% 26%B L
Somewhat trustworthy
25 16 - - - - - - - - 25 164% 3% - - - - - - - - 4% 3%
BOTTOM 2 BOX (NET)
21 12 - - - - - - - - 21 123% 2% - - - - - - - - 3% 2%
Not very trustworthy
4 4 - - - - - - - - 4 41% 1% - - - - - - - - 1% 1%
Not at all trustworthy
687 595 - - - - - - - - 687 595100% 100% - - - - - - - - 100% 100%
Sigma
_________________________________________________________________________________________________________________Proportions/Means: Columns Tested (5% risk level) - A/B - C/D - E/F - G/H - I/J - K/L - A/C/E/G/I/K - B/D/F/H/J/LOverlap formulae used. ** very small base (under 30) ineligible for sig testing
Page 39p121866 - ICANN Global Study Wave 2 - ConsumersNielsenBanner 3
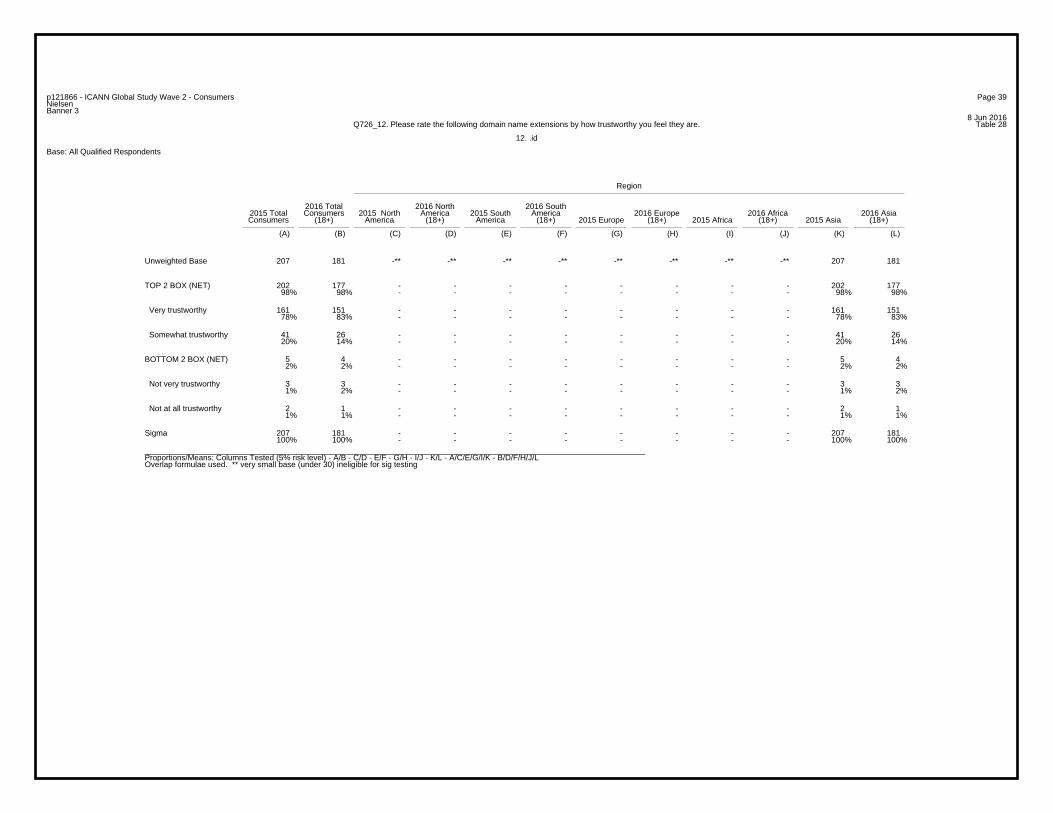
8 Jun 2016Table 28Q726_12. Please rate the following domain name extensions by how trustworthy you feel they are.
12. .id
Base: All Qualified Respondents
Region
2016 Total 2016 North 2016 South2015 Total Consumers 2015 North America 2015 South America 2016 Europe 2016 Africa 2016 AsiaConsumers (18+) America (18+) America (18+) 2015 Europe (18+) 2015 Africa (18+) 2015 Asia (18+)
(A) (B) (C) (D) (E) (F) (G) (H) (I) (J) (K) (L)
207 181 -** -** -** -** -** -** -** -** 207 181Unweighted Base
202 177 - - - - - - - - 202 17798% 98% - - - - - - - - 98% 98%
TOP 2 BOX (NET)
161 151 - - - - - - - - 161 15178% 83% - - - - - - - - 78% 83%
Very trustworthy
41 26 - - - - - - - - 41 2620% 14% - - - - - - - - 20% 14%
Somewhat trustworthy
5 4 - - - - - - - - 5 42% 2% - - - - - - - - 2% 2%
BOTTOM 2 BOX (NET)
3 3 - - - - - - - - 3 31% 2% - - - - - - - - 1% 2%
Not very trustworthy
2 1 - - - - - - - - 2 11% 1% - - - - - - - - 1% 1%
Not at all trustworthy
207 181 - - - - - - - - 207 181100% 100% - - - - - - - - 100% 100%
Sigma
_________________________________________________________________________________________________________________Proportions/Means: Columns Tested (5% risk level) - A/B - C/D - E/F - G/H - I/J - K/L - A/C/E/G/I/K - B/D/F/H/J/LOverlap formulae used. ** very small base (under 30) ineligible for sig testing

Page 40p121866 - ICANN Global Study Wave 2 - ConsumersNielsenBanner 3
8 Jun 2016Table 29Q726_13. Please rate the following domain name extensions by how trustworthy you feel they are.
13. .ng
Base: All Qualified Respondents
Region
2016 Total 2016 North 2016 South2015 Total Consumers 2015 North America 2015 South America 2016 Europe 2016 Africa 2016 AsiaConsumers (18+) America (18+) America (18+) 2015 Europe (18+) 2015 Africa (18+) 2015 Asia (18+)
(A) (B) (C) (D) (E) (F) (G) (H) (I) (J) (K) (L)
201 192 -** -** -** -** -** -** 201 192 -** -**Unweighted Base
194 186 - - - - - - 194 186 - -97% 97% - - - - - - 97% 97% - -
TOP 2 BOX (NET)
116 127 - - - - - - 116 127 - -58% 66% - - - - - - 58% 66% - -
Very trustworthy
78 59 - - - - - - 78 59 - -39% 31% - - - - - - 39% 31% - -
Somewhat trustworthy
7 6 - - - - - - 7 6 - -3% 3% - - - - - - 3% 3% - -
BOTTOM 2 BOX (NET)
7 5 - - - - - - 7 5 - -3% 3% - - - - - - 3% 3% - -
Not very trustworthy
- 1 - - - - - - - 1 - -- 1% - - - - - - - 1% - -
Not at all trustworthy
201 192 - - - - - - 201 192 - -100% 100% - - - - - - 100% 100% - -
Sigma
_________________________________________________________________________________________________________________Proportions/Means: Columns Tested (5% risk level) - A/B - C/D - E/F - G/H - I/J - K/L - A/C/E/G/I/K - B/D/F/H/J/LOverlap formulae used. ** very small base (under 30) ineligible for sig testing

Page 41p121866 - ICANN Global Study Wave 2 - ConsumersNielsenBanner 3
8 Jun 2016Table 30Q726_14. Please rate the following domain name extensions by how trustworthy you feel they are.
14. .za
Base: All Qualified Respondents
Region
2016 Total 2016 North 2016 South2015 Total Consumers 2015 North America 2015 South America 2016 Europe 2016 Africa 2016 AsiaConsumers (18+) America (18+) America (18+) 2015 Europe (18+) 2015 Africa (18+) 2015 Asia (18+)
(A) (B) (C) (D) (E) (F) (G) (H) (I) (J) (K) (L)
105 90* -** -** -** -** -** -** 105 90* -** -**Unweighted Base
99 86 - - - - - - 99 86 - -94% 96% - - - - - - 94% 96% - -
TOP 2 BOX (NET)
64 49 - - - - - - 64 49 - -61% 54% - - - - - - 61% 54% - -
Very trustworthy
35 37 - - - - - - 35 37 - -33% 41% - - - - - - 33% 41% - -
Somewhat trustworthy
6 4 - - - - - - 6 4 - -6% 4% - - - - - - 6% 4% - -
BOTTOM 2 BOX (NET)
6 4 - - - - - - 6 4 - -6% 4% - - - - - - 6% 4% - -
Not very trustworthy
- - - - - - - - - - - -- - - - - - - - - - - -
Not at all trustworthy
105 90 - - - - - - 105 90 - -100% 100% - - - - - - 100% 100% - -
Sigma
_________________________________________________________________________________________________________________Proportions/Means: Columns Tested (5% risk level) - A/B - C/D - E/F - G/H - I/J - K/L - A/C/E/G/I/K - B/D/F/H/J/LOverlap formulae used. * small base; ** very small base (under 30) ineligible for sig testing

Page 42p121866 - ICANN Global Study Wave 2 - ConsumersNielsenBanner 3
8 Jun 2016Table 31Q726_15. Please rate the following domain name extensions by how trustworthy you feel they are.
15. .eg
Base: All Qualified Respondents
Region
2016 Total 2016 North 2016 South2015 Total Consumers 2015 North America 2015 South America 2016 Europe 2016 Africa 2016 AsiaConsumers (18+) America (18+) America (18+) 2015 Europe (18+) 2015 Africa (18+) 2015 Asia (18+)
(A) (B) (C) (D) (E) (F) (G) (H) (I) (J) (K) (L)
103 96* -** -** -** -** -** -** 103 96* -** -**Unweighted Base
90 89 - - - - - - 90 89 - -87% 93% - - - - - - 87% 93% - -
TOP 2 BOX (NET)
47 48 - - - - - - 47 48 - -46% 50% - - - - - - 46% 50% - -
Very trustworthy
43 41 - - - - - - 43 41 - -42% 43% - - - - - - 42% 43% - -
Somewhat trustworthy
13 7 - - - - - - 13 7 - -13% 7% - - - - - - 13% 7% - -
BOTTOM 2 BOX (NET)
10 5 - - - - - - 10 5 - -10% 5% - - - - - - 10% 5% - -
Not very trustworthy
3 2 - - - - - - 3 2 - -3% 2% - - - - - - 3% 2% - -
Not at all trustworthy
103 96 - - - - - - 103 96 - -100% 100% - - - - - - 100% 100% - -
Sigma
_________________________________________________________________________________________________________________Proportions/Means: Columns Tested (5% risk level) - A/B - C/D - E/F - G/H - I/J - K/L - A/C/E/G/I/K - B/D/F/H/J/LOverlap formulae used. * small base; ** very small base (under 30) ineligible for sig testing

Page 43p121866 - ICANN Global Study Wave 2 - ConsumersNielsenBanner 3
8 Jun 2016Table 32Q726_16. Please rate the following domain name extensions by how trustworthy you feel they are.
16. .co
Base: All Qualified Respondents
Region
2016 Total 2016 North 2016 South2015 Total Consumers 2015 North America 2015 South America 2016 Europe 2016 Africa 2016 AsiaConsumers (18+) America (18+) America (18+) 2015 Europe (18+) 2015 Africa (18+) 2015 Asia (18+)
(A) (B) (C) (D) (E) (F) (G) (H) (I) (J) (K) (L)
119 93* -** -** 119 93* -** -** -** -** -** -**Unweighted Base
115 89 - - 115 89 - - - - - -97% 96% - - 97% 96% - - - - - -
TOP 2 BOX (NET)
89 67 - - 89 67 - - - - - -75% 72% - - 75% 72% - - - - - -
Very trustworthy
26 22 - - 26 22 - - - - - -22% 24% - - 22% 24% - - - - - -
Somewhat trustworthy
4 4 - - 4 4 - - - - - -3% 4% - - 3% 4% - - - - - -
BOTTOM 2 BOX (NET)
4 3 - - 4 3 - - - - - -3% 3% - - 3% 3% - - - - - -
Not very trustworthy
- 1 - - - 1 - - - - - -- 1% - - - 1% - - - - - -
Not at all trustworthy
119 93 - - 119 93 - - - - - -100% 100% - - 100% 100% - - - - - -
Sigma
_________________________________________________________________________________________________________________Proportions/Means: Columns Tested (5% risk level) - A/B - C/D - E/F - G/H - I/J - K/L - A/C/E/G/I/K - B/D/F/H/J/LOverlap formulae used. * small base; ** very small base (under 30) ineligible for sig testing

Page 44p121866 - ICANN Global Study Wave 2 - ConsumersNielsenBanner 3
8 Jun 2016Table 33Q726_17. Please rate the following domain name extensions by how trustworthy you feel they are.
17. .ar
Base: All Qualified Respondents
Region
2016 Total 2016 North 2016 South2015 Total Consumers 2015 North America 2015 South America 2016 Europe 2016 Africa 2016 AsiaConsumers (18+) America (18+) America (18+) 2015 Europe (18+) 2015 Africa (18+) 2015 Asia (18+)
(A) (B) (C) (D) (E) (F) (G) (H) (I) (J) (K) (L)
110 93* -** -** 110 93* -** -** -** -** -** -**Unweighted Base
108 92 - - 108 92 - - - - - -98% 99% - - 98% 99% - - - - - -
TOP 2 BOX (NET)
69 71 - - 69 71 - - - - - -63% 76% - - 63% 76% - - - - - -
A E
Very trustworthy
39 21 - - 39 21 - - - - - -35% 23% - - 35% 23% - - - - - - B F
Somewhat trustworthy
2 1 - - 2 1 - - - - - -2% 1% - - 2% 1% - - - - - -
BOTTOM 2 BOX (NET)
2 - - - 2 - - - - - - -2% - - - 2% - - - - - - -
Not very trustworthy
- 1 - - - 1 - - - - - -- 1% - - - 1% - - - - - -
Not at all trustworthy
110 93 - - 110 93 - - - - - -100% 100% - - 100% 100% - - - - - -
Sigma
_________________________________________________________________________________________________________________Proportions/Means: Columns Tested (5% risk level) - A/B - C/D - E/F - G/H - I/J - K/L - A/C/E/G/I/K - B/D/F/H/J/LOverlap formulae used. * small base; ** very small base (under 30) ineligible for sig testing
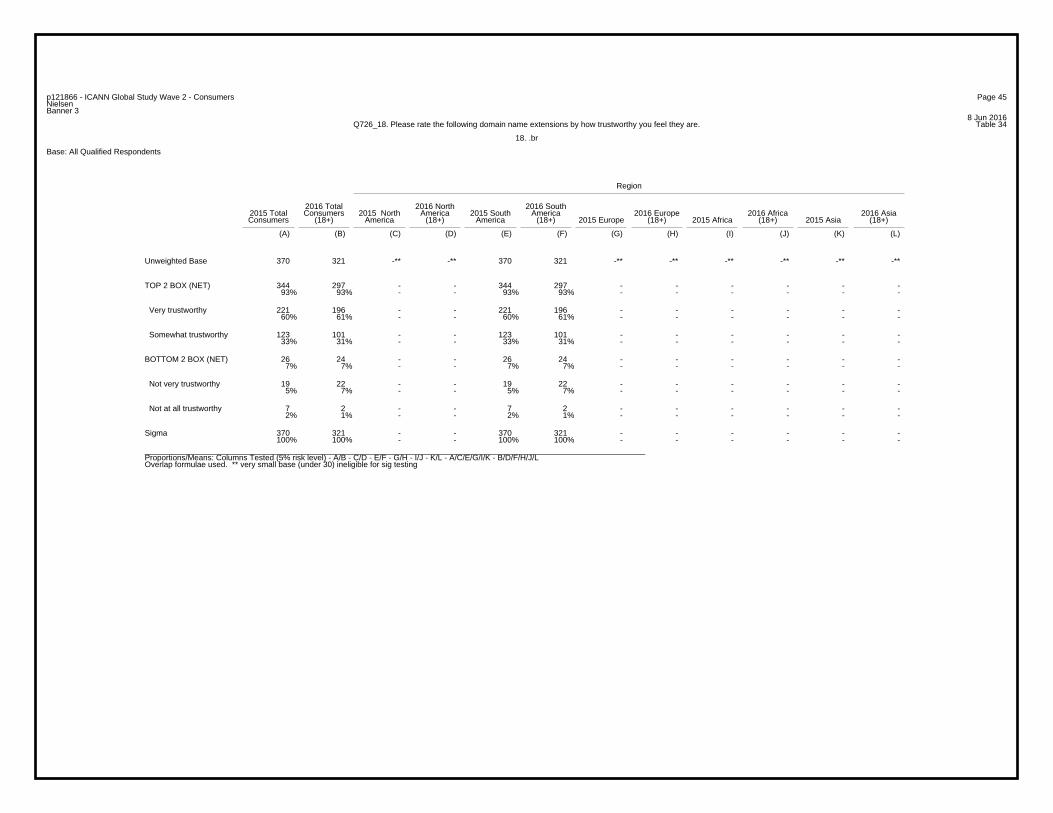
Page 45p121866 - ICANN Global Study Wave 2 - ConsumersNielsenBanner 3
8 Jun 2016Table 34Q726_18. Please rate the following domain name extensions by how trustworthy you feel they are.
18. .br
Base: All Qualified Respondents
Region
2016 Total 2016 North 2016 South2015 Total Consumers 2015 North America 2015 South America 2016 Europe 2016 Africa 2016 AsiaConsumers (18+) America (18+) America (18+) 2015 Europe (18+) 2015 Africa (18+) 2015 Asia (18+)
(A) (B) (C) (D) (E) (F) (G) (H) (I) (J) (K) (L)
370 321 -** -** 370 321 -** -** -** -** -** -**Unweighted Base
344 297 - - 344 297 - - - - - -93% 93% - - 93% 93% - - - - - -
TOP 2 BOX (NET)
221 196 - - 221 196 - - - - - -60% 61% - - 60% 61% - - - - - -
Very trustworthy
123 101 - - 123 101 - - - - - -33% 31% - - 33% 31% - - - - - -
Somewhat trustworthy
26 24 - - 26 24 - - - - - -7% 7% - - 7% 7% - - - - - -
BOTTOM 2 BOX (NET)
19 22 - - 19 22 - - - - - -5% 7% - - 5% 7% - - - - - -
Not very trustworthy
7 2 - - 7 2 - - - - - -2% 1% - - 2% 1% - - - - - -
Not at all trustworthy
370 321 - - 370 321 - - - - - -100% 100% - - 100% 100% - - - - - -
Sigma
_________________________________________________________________________________________________________________Proportions/Means: Columns Tested (5% risk level) - A/B - C/D - E/F - G/H - I/J - K/L - A/C/E/G/I/K - B/D/F/H/J/LOverlap formulae used. ** very small base (under 30) ineligible for sig testing

Page 46p121866 - ICANN Global Study Wave 2 - ConsumersNielsenBanner 3
8 Jun 2016Table 35Q726_19. Please rate the following domain name extensions by how trustworthy you feel they are.
19. .it
Base: All Qualified Respondents
Region
2016 Total 2016 North 2016 South2015 Total Consumers 2015 North America 2015 South America 2016 Europe 2016 Africa 2016 AsiaConsumers (18+) America (18+) America (18+) 2015 Europe (18+) 2015 Africa (18+) 2015 Asia (18+)
(A) (B) (C) (D) (E) (F) (G) (H) (I) (J) (K) (L)
101 90* -** -** -** -** 101 90* -** -** -** -**Unweighted Base
98 87 - - - - 98 87 - - - -97% 97% - - - - 97% 97% - - - -
TOP 2 BOX (NET)
53 57 - - - - 53 57 - - - -52% 63% - - - - 52% 63% - - - -
Very trustworthy
45 30 - - - - 45 30 - - - -45% 33% - - - - 45% 33% - - - -
Somewhat trustworthy
3 3 - - - - 3 3 - - - -3% 3% - - - - 3% 3% - - - -
BOTTOM 2 BOX (NET)
3 2 - - - - 3 2 - - - -3% 2% - - - - 3% 2% - - - -
Not very trustworthy
- 1 - - - - - 1 - - - -- 1% - - - - - 1% - - - -
Not at all trustworthy
101 90 - - - - 101 90 - - - -100% 100% - - - - 100% 100% - - - -
Sigma
_________________________________________________________________________________________________________________Proportions/Means: Columns Tested (5% risk level) - A/B - C/D - E/F - G/H - I/J - K/L - A/C/E/G/I/K - B/D/F/H/J/LOverlap formulae used. * small base; ** very small base (under 30) ineligible for sig testing

Page 47p121866 - ICANN Global Study Wave 2 - ConsumersNielsenBanner 3
8 Jun 2016Table 36Q726_20. Please rate the following domain name extensions by how trustworthy you feel they are.
20. .tr
Base: All Qualified Respondents
Region
2016 Total 2016 North 2016 South2015 Total Consumers 2015 North America 2015 South America 2016 Europe 2016 Africa 2016 AsiaConsumers (18+) America (18+) America (18+) 2015 Europe (18+) 2015 Africa (18+) 2015 Asia (18+)
(A) (B) (C) (D) (E) (F) (G) (H) (I) (J) (K) (L)
102 95* -** -** -** -** 102 95* -** -** -** -**Unweighted Base
93 92 - - - - 93 92 - - - -91% 97% - - - - 91% 97% - - - -
TOP 2 BOX (NET)
64 66 - - - - 64 66 - - - -63% 69% - - - - 63% 69% - - - -
Very trustworthy
29 26 - - - - 29 26 - - - -28% 27% - - - - 28% 27% - - - -
Somewhat trustworthy
9 3 - - - - 9 3 - - - -9% 3% - - - - 9% 3% - - - -
BOTTOM 2 BOX (NET)
8 2 - - - - 8 2 - - - -8% 2% - - - - 8% 2% - - - -
Not very trustworthy
1 1 - - - - 1 1 - - - -1% 1% - - - - 1% 1% - - - -
Not at all trustworthy
102 95 - - - - 102 95 - - - -100% 100% - - - - 100% 100% - - - -
Sigma
_________________________________________________________________________________________________________________Proportions/Means: Columns Tested (5% risk level) - A/B - C/D - E/F - G/H - I/J - K/L - A/C/E/G/I/K - B/D/F/H/J/LOverlap formulae used. * small base; ** very small base (under 30) ineligible for sig testing
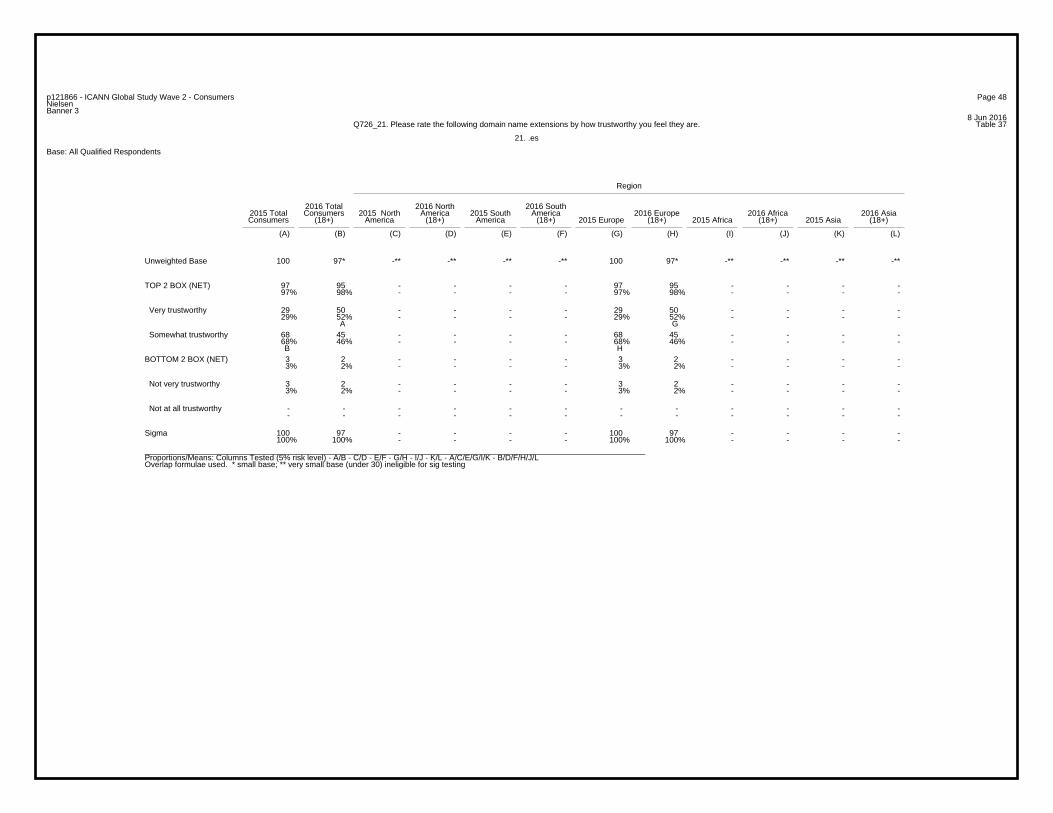
Page 48p121866 - ICANN Global Study Wave 2 - ConsumersNielsenBanner 3
8 Jun 2016Table 37Q726_21. Please rate the following domain name extensions by how trustworthy you feel they are.
21. .es
Base: All Qualified Respondents
Region
2016 Total 2016 North 2016 South2015 Total Consumers 2015 North America 2015 South America 2016 Europe 2016 Africa 2016 AsiaConsumers (18+) America (18+) America (18+) 2015 Europe (18+) 2015 Africa (18+) 2015 Asia (18+)
(A) (B) (C) (D) (E) (F) (G) (H) (I) (J) (K) (L)
100 97* -** -** -** -** 100 97* -** -** -** -**Unweighted Base
97 95 - - - - 97 95 - - - -97% 98% - - - - 97% 98% - - - -
TOP 2 BOX (NET)
29 50 - - - - 29 50 - - - -29% 52% - - - - 29% 52% - - - -
A G
Very trustworthy
68 45 - - - - 68 45 - - - -68% 46% - - - - 68% 46% - - - - B H
Somewhat trustworthy
3 2 - - - - 3 2 - - - -3% 2% - - - - 3% 2% - - - -
BOTTOM 2 BOX (NET)
3 2 - - - - 3 2 - - - -3% 2% - - - - 3% 2% - - - -
Not very trustworthy
- - - - - - - - - - - -- - - - - - - - - - - -
Not at all trustworthy
100 97 - - - - 100 97 - - - -100% 100% - - - - 100% 100% - - - -
Sigma
_________________________________________________________________________________________________________________Proportions/Means: Columns Tested (5% risk level) - A/B - C/D - E/F - G/H - I/J - K/L - A/C/E/G/I/K - B/D/F/H/J/LOverlap formulae used. * small base; ** very small base (under 30) ineligible for sig testing

Page 49p121866 - ICANN Global Study Wave 2 - ConsumersNielsenBanner 3
8 Jun 2016Table 38Q726_22. Please rate the following domain name extensions by how trustworthy you feel they are.
22. .pl
Base: All Qualified Respondents
Region
2016 Total 2016 North 2016 South2015 Total Consumers 2015 North America 2015 South America 2016 Europe 2016 Africa 2016 AsiaConsumers (18+) America (18+) America (18+) 2015 Europe (18+) 2015 Africa (18+) 2015 Asia (18+)
(A) (B) (C) (D) (E) (F) (G) (H) (I) (J) (K) (L)
112 92* -** -** -** -** 112 92* -** -** -** -**Unweighted Base
110 89 - - - - 110 89 - - - -98% 97% - - - - 98% 97% - - - -
TOP 2 BOX (NET)
63 42 - - - - 63 42 - - - -56% 46% - - - - 56% 46% - - - -
Very trustworthy
47 47 - - - - 47 47 - - - -42% 51% - - - - 42% 51% - - - -
Somewhat trustworthy
2 3 - - - - 2 3 - - - -2% 3% - - - - 2% 3% - - - -
BOTTOM 2 BOX (NET)
2 1 - - - - 2 1 - - - -2% 1% - - - - 2% 1% - - - -
Not very trustworthy
- 2 - - - - - 2 - - - -- 2% - - - - - 2% - - - -
Not at all trustworthy
112 92 - - - - 112 92 - - - -100% 100% - - - - 100% 100% - - - -
Sigma
_________________________________________________________________________________________________________________Proportions/Means: Columns Tested (5% risk level) - A/B - C/D - E/F - G/H - I/J - K/L - A/C/E/G/I/K - B/D/F/H/J/LOverlap formulae used. * small base; ** very small base (under 30) ineligible for sig testing

Page 50p121866 - ICANN Global Study Wave 2 - ConsumersNielsenBanner 3
8 Jun 2016Table 39Q726_23. Please rate the following domain name extensions by how trustworthy you feel they are.
23. .uk
Base: All Qualified Respondents
Region
2016 Total 2016 North 2016 South2015 Total Consumers 2015 North America 2015 South America 2016 Europe 2016 Africa 2016 AsiaConsumers (18+) America (18+) America (18+) 2015 Europe (18+) 2015 Africa (18+) 2015 Asia (18+)
(A) (B) (C) (D) (E) (F) (G) (H) (I) (J) (K) (L)
220 180 -** -** -** -** 220 180 -** -** -** -**Unweighted Base
210 169 - - - - 210 169 - - - -95% 94% - - - - 95% 94% - - - -
TOP 2 BOX (NET)
126 87 - - - - 126 87 - - - -57% 48% - - - - 57% 48% - - - -
Very trustworthy
84 82 - - - - 84 82 - - - -38% 46% - - - - 38% 46% - - - -
Somewhat trustworthy
10 11 - - - - 10 11 - - - -5% 6% - - - - 5% 6% - - - -
BOTTOM 2 BOX (NET)
8 8 - - - - 8 8 - - - -4% 4% - - - - 4% 4% - - - -
Not very trustworthy
2 3 - - - - 2 3 - - - -1% 2% - - - - 1% 2% - - - -
Not at all trustworthy
220 180 - - - - 220 180 - - - -100% 100% - - - - 100% 100% - - - -
Sigma
_________________________________________________________________________________________________________________Proportions/Means: Columns Tested (5% risk level) - A/B - C/D - E/F - G/H - I/J - K/L - A/C/E/G/I/K - B/D/F/H/J/LOverlap formulae used. ** very small base (under 30) ineligible for sig testing

Page 51p121866 - ICANN Global Study Wave 2 - ConsumersNielsenBanner 3
8 Jun 2016Table 40Q726_24. Please rate the following domain name extensions by how trustworthy you feel they are.
24. .fr
Base: All Qualified Respondents
Region
2016 Total 2016 North 2016 South2015 Total Consumers 2015 North America 2015 South America 2016 Europe 2016 Africa 2016 AsiaConsumers (18+) America (18+) America (18+) 2015 Europe (18+) 2015 Africa (18+) 2015 Asia (18+)
(A) (B) (C) (D) (E) (F) (G) (H) (I) (J) (K) (L)
201 181 -** -** -** -** 201 181 -** -** -** -**Unweighted Base
195 169 - - - - 195 169 - - - -97% 93% - - - - 97% 93% - - - -
TOP 2 BOX (NET)
80 86 - - - - 80 86 - - - -40% 48% - - - - 40% 48% - - - -
Very trustworthy
115 83 - - - - 115 83 - - - -57% 46% - - - - 57% 46% - - - - B H
Somewhat trustworthy
6 12 - - - - 6 12 - - - -3% 7% - - - - 3% 7% - - - -
BOTTOM 2 BOX (NET)
4 11 - - - - 4 11 - - - -2% 6% - - - - 2% 6% - - - -
A G
Not very trustworthy
2 1 - - - - 2 1 - - - -1% 1% - - - - 1% 1% - - - -
Not at all trustworthy
201 181 - - - - 201 181 - - - -100% 100% - - - - 100% 100% - - - -
Sigma
_________________________________________________________________________________________________________________Proportions/Means: Columns Tested (5% risk level) - A/B - C/D - E/F - G/H - I/J - K/L - A/C/E/G/I/K - B/D/F/H/J/LOverlap formulae used. ** very small base (under 30) ineligible for sig testing
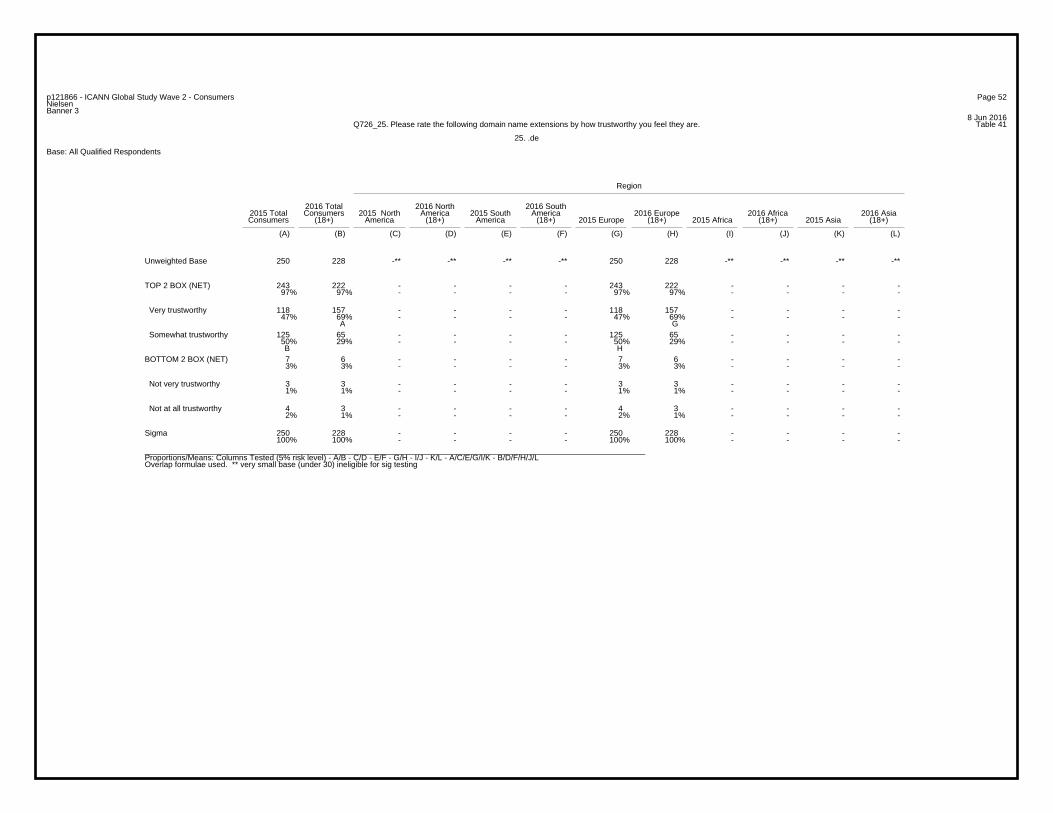
Page 52p121866 - ICANN Global Study Wave 2 - ConsumersNielsenBanner 3
8 Jun 2016Table 41Q726_25. Please rate the following domain name extensions by how trustworthy you feel they are.
25. .de
Base: All Qualified Respondents
Region
2016 Total 2016 North 2016 South2015 Total Consumers 2015 North America 2015 South America 2016 Europe 2016 Africa 2016 AsiaConsumers (18+) America (18+) America (18+) 2015 Europe (18+) 2015 Africa (18+) 2015 Asia (18+)
(A) (B) (C) (D) (E) (F) (G) (H) (I) (J) (K) (L)
250 228 -** -** -** -** 250 228 -** -** -** -**Unweighted Base
243 222 - - - - 243 222 - - - -97% 97% - - - - 97% 97% - - - -
TOP 2 BOX (NET)
118 157 - - - - 118 157 - - - -47% 69% - - - - 47% 69% - - - -
A G
Very trustworthy
125 65 - - - - 125 65 - - - -50% 29% - - - - 50% 29% - - - - B H
Somewhat trustworthy
7 6 - - - - 7 6 - - - -3% 3% - - - - 3% 3% - - - -
BOTTOM 2 BOX (NET)
3 3 - - - - 3 3 - - - -1% 1% - - - - 1% 1% - - - -
Not very trustworthy
4 3 - - - - 4 3 - - - -2% 1% - - - - 2% 1% - - - -
Not at all trustworthy
250 228 - - - - 250 228 - - - -100% 100% - - - - 100% 100% - - - -
Sigma
_________________________________________________________________________________________________________________Proportions/Means: Columns Tested (5% risk level) - A/B - C/D - E/F - G/H - I/J - K/L - A/C/E/G/I/K - B/D/F/H/J/LOverlap formulae used. ** very small base (under 30) ineligible for sig testing
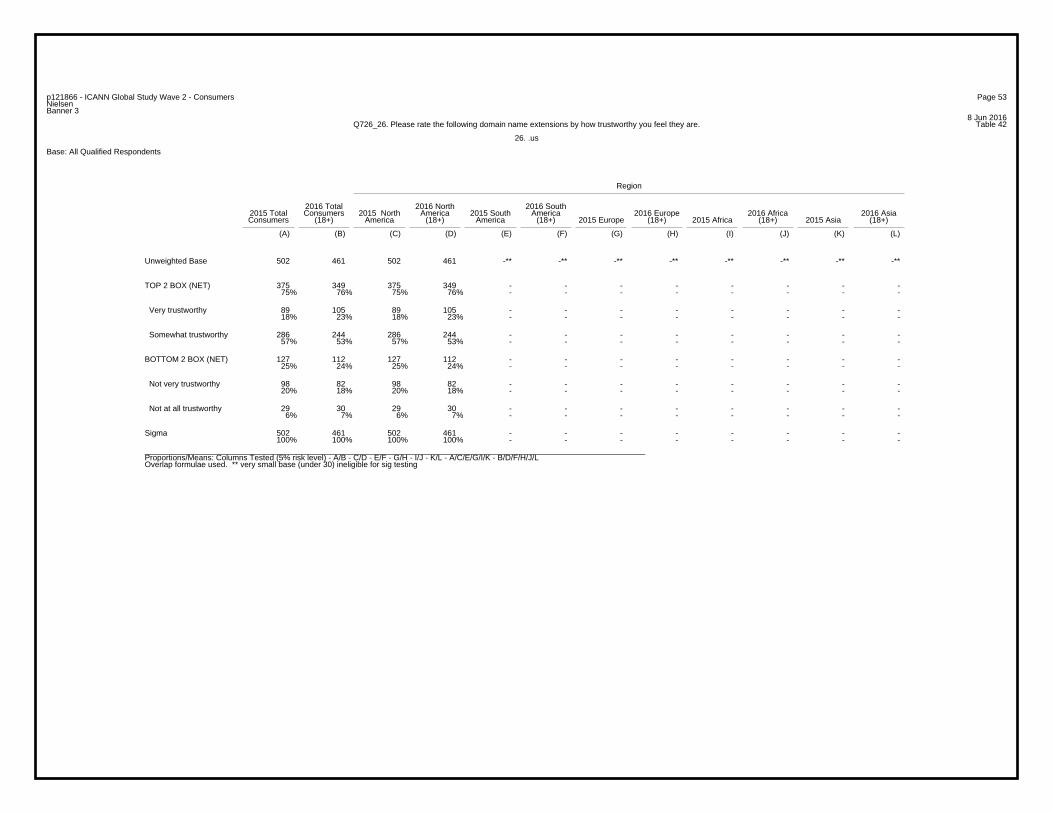
Page 53p121866 - ICANN Global Study Wave 2 - ConsumersNielsenBanner 3
8 Jun 2016Table 42Q726_26. Please rate the following domain name extensions by how trustworthy you feel they are.
26. .us
Base: All Qualified Respondents
Region
2016 Total 2016 North 2016 South2015 Total Consumers 2015 North America 2015 South America 2016 Europe 2016 Africa 2016 AsiaConsumers (18+) America (18+) America (18+) 2015 Europe (18+) 2015 Africa (18+) 2015 Asia (18+)
(A) (B) (C) (D) (E) (F) (G) (H) (I) (J) (K) (L)
502 461 502 461 -** -** -** -** -** -** -** -**Unweighted Base
375 349 375 349 - - - - - - - -75% 76% 75% 76% - - - - - - - -
TOP 2 BOX (NET)
89 105 89 105 - - - - - - - -18% 23% 18% 23% - - - - - - - -
Very trustworthy
286 244 286 244 - - - - - - - -57% 53% 57% 53% - - - - - - - -
Somewhat trustworthy
127 112 127 112 - - - - - - - -25% 24% 25% 24% - - - - - - - -
BOTTOM 2 BOX (NET)
98 82 98 82 - - - - - - - -20% 18% 20% 18% - - - - - - - -
Not very trustworthy
29 30 29 30 - - - - - - - -6% 7% 6% 7% - - - - - - - -
Not at all trustworthy
502 461 502 461 - - - - - - - -100% 100% 100% 100% - - - - - - - -
Sigma
_________________________________________________________________________________________________________________Proportions/Means: Columns Tested (5% risk level) - A/B - C/D - E/F - G/H - I/J - K/L - A/C/E/G/I/K - B/D/F/H/J/LOverlap formulae used. ** very small base (under 30) ineligible for sig testing
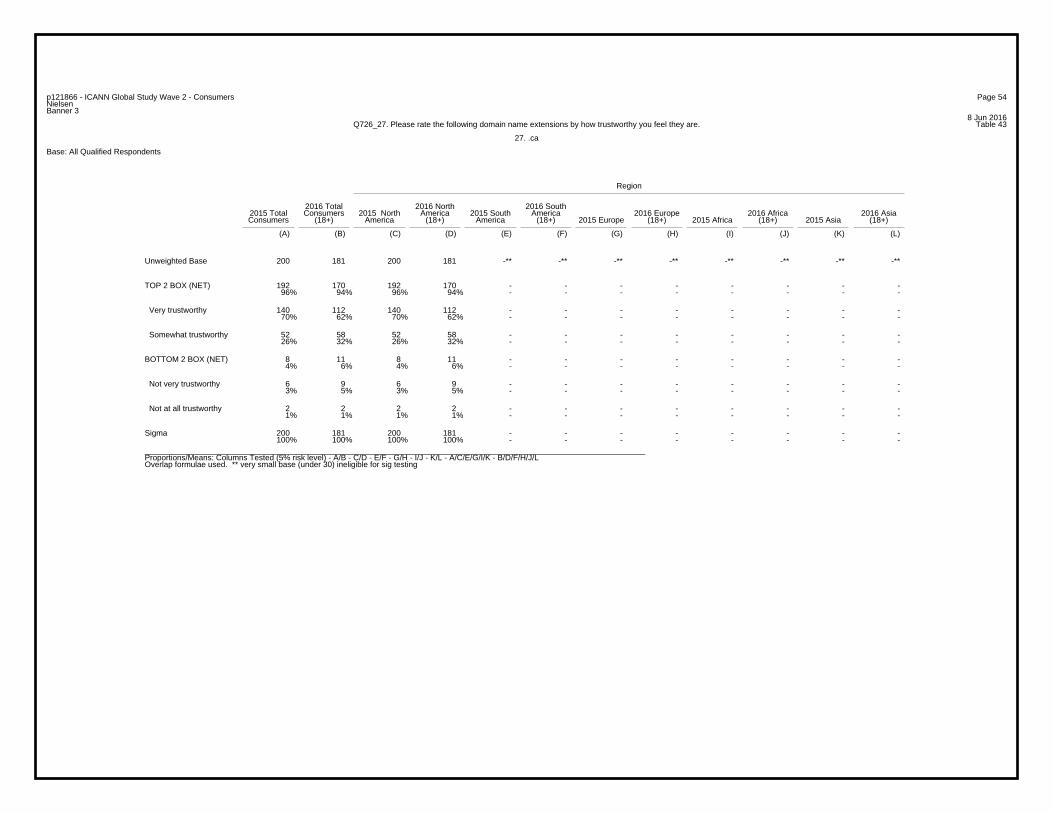
Page 54p121866 - ICANN Global Study Wave 2 - ConsumersNielsenBanner 3
8 Jun 2016Table 43Q726_27. Please rate the following domain name extensions by how trustworthy you feel they are.
27. .ca
Base: All Qualified Respondents
Region
2016 Total 2016 North 2016 South2015 Total Consumers 2015 North America 2015 South America 2016 Europe 2016 Africa 2016 AsiaConsumers (18+) America (18+) America (18+) 2015 Europe (18+) 2015 Africa (18+) 2015 Asia (18+)
(A) (B) (C) (D) (E) (F) (G) (H) (I) (J) (K) (L)
200 181 200 181 -** -** -** -** -** -** -** -**Unweighted Base
192 170 192 170 - - - - - - - -96% 94% 96% 94% - - - - - - - -
TOP 2 BOX (NET)
140 112 140 112 - - - - - - - -70% 62% 70% 62% - - - - - - - -
Very trustworthy
52 58 52 58 - - - - - - - -26% 32% 26% 32% - - - - - - - -
Somewhat trustworthy
8 11 8 11 - - - - - - - -4% 6% 4% 6% - - - - - - - -
BOTTOM 2 BOX (NET)
6 9 6 9 - - - - - - - -3% 5% 3% 5% - - - - - - - -
Not very trustworthy
2 2 2 2 - - - - - - - -1% 1% 1% 1% - - - - - - - -
Not at all trustworthy
200 181 200 181 - - - - - - - -100% 100% 100% 100% - - - - - - - -
Sigma
_________________________________________________________________________________________________________________Proportions/Means: Columns Tested (5% risk level) - A/B - C/D - E/F - G/H - I/J - K/L - A/C/E/G/I/K - B/D/F/H/J/LOverlap formulae used. ** very small base (under 30) ineligible for sig testing

Page 55p121866 - ICANN Global Study Wave 2 - ConsumersNielsenBanner 3
8 Jun 2016Table 44Q726_28. Please rate the following domain name extensions by how trustworthy you feel they are.
28. .mx
Base: All Qualified Respondents
Region
2016 Total 2016 North 2016 South2015 Total Consumers 2015 North America 2015 South America 2016 Europe 2016 Africa 2016 AsiaConsumers (18+) America (18+) America (18+) 2015 Europe (18+) 2015 Africa (18+) 2015 Asia (18+)
(A) (B) (C) (D) (E) (F) (G) (H) (I) (J) (K) (L)
223 184 223 184 -** -** -** -** -** -** -** -**Unweighted Base
217 178 217 178 - - - - - - - -97% 97% 97% 97% - - - - - - - -
TOP 2 BOX (NET)
117 125 117 125 - - - - - - - -52% 68% 52% 68% - - - - - - - -
A C
Very trustworthy
100 53 100 53 - - - - - - - -45% 29% 45% 29% - - - - - - - - B D
Somewhat trustworthy
6 6 6 6 - - - - - - - -3% 3% 3% 3% - - - - - - - -
BOTTOM 2 BOX (NET)
4 3 4 3 - - - - - - - -2% 2% 2% 2% - - - - - - - -
Not very trustworthy
2 3 2 3 - - - - - - - -1% 2% 1% 2% - - - - - - - -
Not at all trustworthy
223 184 223 184 - - - - - - - -100% 100% 100% 100% - - - - - - - -
Sigma
_________________________________________________________________________________________________________________Proportions/Means: Columns Tested (5% risk level) - A/B - C/D - E/F - G/H - I/J - K/L - A/C/E/G/I/K - B/D/F/H/J/LOverlap formulae used. ** very small base (under 30) ineligible for sig testing
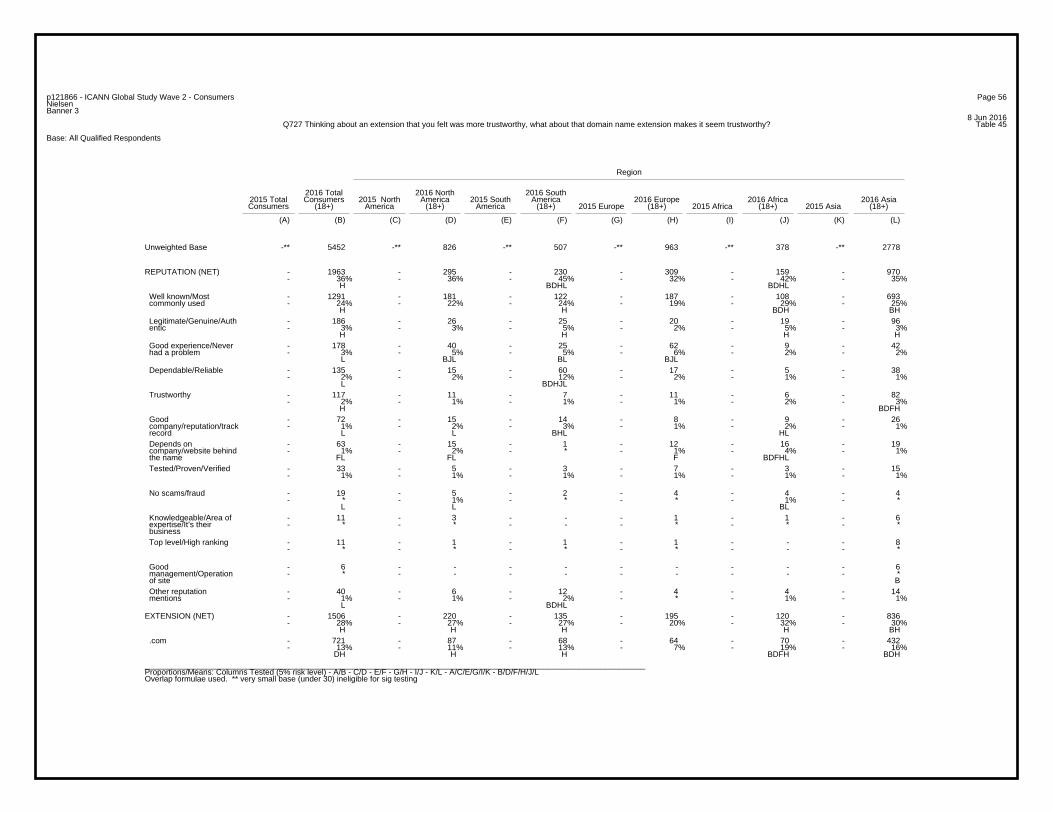
Page 56p121866 - ICANN Global Study Wave 2 - ConsumersNielsenBanner 3
8 Jun 2016Table 45Q727 Thinking about an extension that you felt was more trustworthy, what about that domain name extension makes it seem trustworthy?
Base: All Qualified Respondents
Region
2016 Total 2016 North 2016 South2015 Total Consumers 2015 North America 2015 South America 2016 Europe 2016 Africa 2016 AsiaConsumers (18+) America (18+) America (18+) 2015 Europe (18+) 2015 Africa (18+) 2015 Asia (18+)
(A) (B) (C) (D) (E) (F) (G) (H) (I) (J) (K) (L)
-** 5452 -** 826 -** 507 -** 963 -** 378 -** 2778Unweighted Base
- 1963 - 295 - 230 - 309 - 159 - 970- 36% - 36% - 45% - 32% - 42% - 35%
H BDHL BDHL
REPUTATION (NET)
- 1291 - 181 - 122 - 187 - 108 - 693- 24% - 22% - 24% - 19% - 29% - 25%
H H BDH BH
Well known/Most commonly used
- 186 - 26 - 25 - 20 - 19 - 96- 3% - 3% - 5% - 2% - 5% - 3%
H H H H
Legitimate/Genuine/Auth entic
- 178 - 40 - 25 - 62 - 9 - 42- 3% - 5% - 5% - 6% - 2% - 2%
L BJL BL BJL
Good experience/Never had a problem
- 135 - 15 - 60 - 17 - 5 - 38- 2% - 2% - 12% - 2% - 1% - 1%
L BDHJL
Dependable/Reliable
- 117 - 11 - 7 - 11 - 6 - 82- 2% - 1% - 1% - 1% - 2% - 3%
H BDFH
Trustworthy
- 72 - 15 - 14 - 8 - 9 - 26- 1% - 2% - 3% - 1% - 2% - 1%
L L BHL HL
Good company/reputation/track record
- 63 - 15 - 1 - 12 - 16 - 19- 1% - 2% - * - 1% - 4% - 1%
FL FL F BDFHL
Depends on company/website behind the name
- 33 - 5 - 3 - 7 - 3 - 15- 1% - 1% - 1% - 1% - 1% - 1%
Tested/Proven/Verified
- 19 - 5 - 2 - 4 - 4 - 4- * - 1% - * - * - 1% - *
L L BL
No scams/fraud
- 11 - 3 - - - 1 - 1 - 6- * - * - - - * - * - *
Knowledgeable/Area of expertise/It’s their business
- 11 - 1 - 1 - 1 - - - 8- * - * - * - * - - - *
Top level/High ranking
- 6 - - - - - - - - - 6- * - - - - - - - - - *
B
Good management/Operation of site
- 40 - 6 - 12 - 4 - 4 - 14- 1% - 1% - 2% - * - 1% - 1%
L BDHL
Other reputation mentions
- 1506 - 220 - 135 - 195 - 120 - 836- 28% - 27% - 27% - 20% - 32% - 30%
H H H H BH
EXTENSION (NET)
- 721 - 87 - 68 - 64 - 70 - 432- 13% - 11% - 13% - 7% - 19% - 16%
DH H H BDFH BDH
.com
_________________________________________________________________________________________________________________Proportions/Means: Columns Tested (5% risk level) - A/B - C/D - E/F - G/H - I/J - K/L - A/C/E/G/I/K - B/D/F/H/J/LOverlap formulae used. ** very small base (under 30) ineligible for sig testing
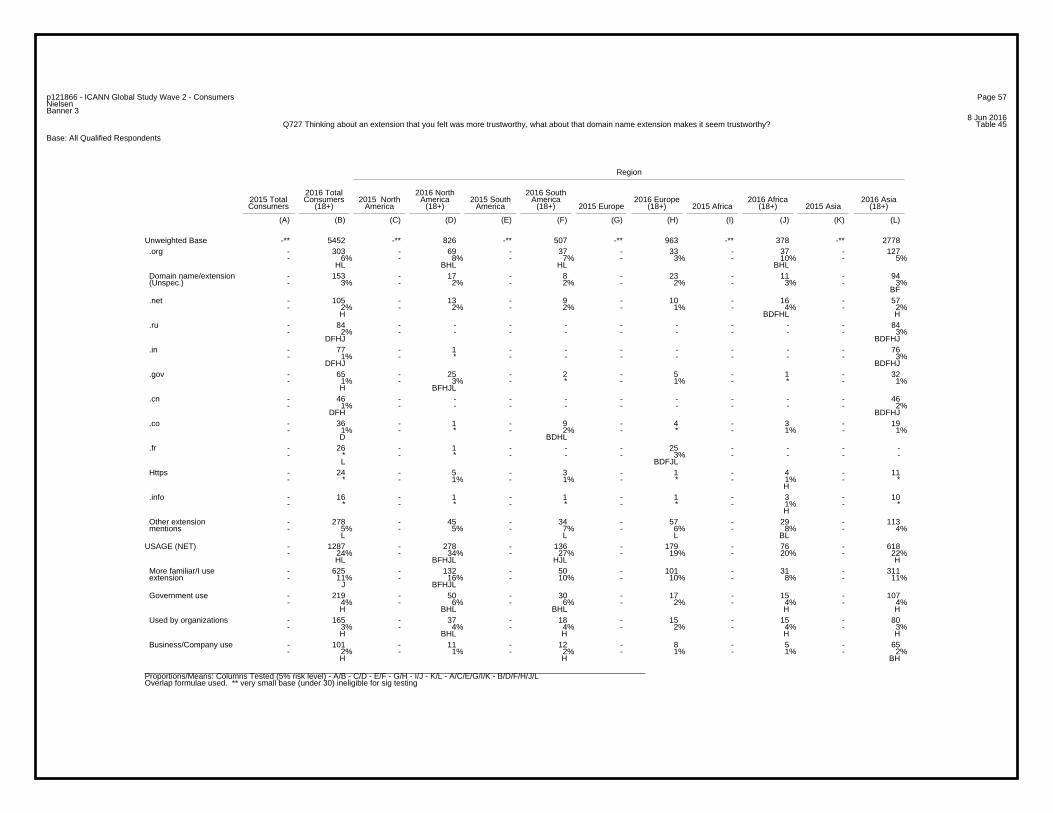
Page 57p121866 - ICANN Global Study Wave 2 - ConsumersNielsenBanner 3
8 Jun 2016Table 45Q727 Thinking about an extension that you felt was more trustworthy, what about that domain name extension makes it seem trustworthy?
Base: All Qualified Respondents
Region
2016 Total 2016 North 2016 South2015 Total Consumers 2015 North America 2015 South America 2016 Europe 2016 Africa 2016 AsiaConsumers (18+) America (18+) America (18+) 2015 Europe (18+) 2015 Africa (18+) 2015 Asia (18+)
(A) (B) (C) (D) (E) (F) (G) (H) (I) (J) (K) (L)
-** 5452 -** 826 -** 507 -** 963 -** 378 -** 2778Unweighted Base- 303 - 69 - 37 - 33 - 37 - 127- 6% - 8% - 7% - 3% - 10% - 5%
HL BHL HL BHL
.org
- 153 - 17 - 8 - 23 - 11 - 94- 3% - 2% - 2% - 2% - 3% - 3%
BF
Domain name/extension (Unspec.)
- 105 - 13 - 9 - 10 - 16 - 57- 2% - 2% - 2% - 1% - 4% - 2%
H BDFHL H
.net
- 84 - - - - - - - - - 84- 2% - - - - - - - - - 3%
DFHJ BDFHJ
.ru
- 77 - 1 - - - - - - - 76- 1% - * - - - - - - - 3%
DFHJ BDFHJ
.in
- 65 - 25 - 2 - 5 - 1 - 32- 1% - 3% - * - 1% - * - 1%
H BFHJL
.gov
- 46 - - - - - - - - - 46- 1% - - - - - - - - - 2%
DFH BDFHJ
.cn
- 36 - 1 - 9 - 4 - 3 - 19- 1% - * - 2% - * - 1% - 1%
D BDHL
.co
- 26 - 1 - - - 25 - - - -- * - * - - - 3% - - - -
L BDFJL
.fr
- 24 - 5 - 3 - 1 - 4 - 11- * - 1% - 1% - * - 1% - *
H
Https
- 16 - 1 - 1 - 1 - 3 - 10- * - * - * - * - 1% - *
H
.info
- 278 - 45 - 34 - 57 - 29 - 113- 5% - 5% - 7% - 6% - 8% - 4%
L L L BL
Other extension mentions
- 1287 - 278 - 136 - 179 - 76 - 618- 24% - 34% - 27% - 19% - 20% - 22%
HL BFHJL HJL H
USAGE (NET)
- 625 - 132 - 50 - 101 - 31 - 311- 11% - 16% - 10% - 10% - 8% - 11%
J BFHJL
More familiar/I use extension
- 219 - 50 - 30 - 17 - 15 - 107- 4% - 6% - 6% - 2% - 4% - 4%
H BHL BHL H H
Government use
- 165 - 37 - 18 - 15 - 15 - 80- 3% - 4% - 4% - 2% - 4% - 3%
H BHL H H H
Used by organizations
- 101 - 11 - 12 - 8 - 5 - 65- 2% - 1% - 2% - 1% - 1% - 2%
H H BH
Business/Company use
_________________________________________________________________________________________________________________Proportions/Means: Columns Tested (5% risk level) - A/B - C/D - E/F - G/H - I/J - K/L - A/C/E/G/I/K - B/D/F/H/J/LOverlap formulae used. ** very small base (under 30) ineligible for sig testing
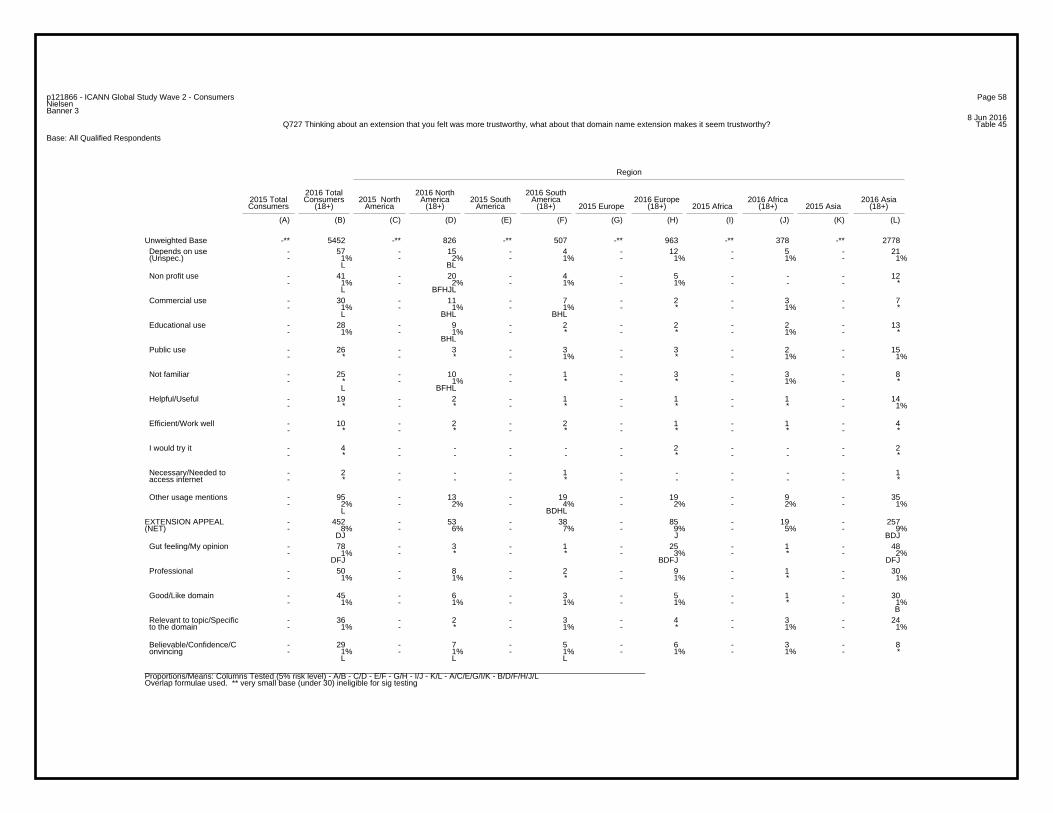
Page 58p121866 - ICANN Global Study Wave 2 - ConsumersNielsenBanner 3
8 Jun 2016Table 45Q727 Thinking about an extension that you felt was more trustworthy, what about that domain name extension makes it seem trustworthy?
Base: All Qualified Respondents
Region
2016 Total 2016 North 2016 South2015 Total Consumers 2015 North America 2015 South America 2016 Europe 2016 Africa 2016 AsiaConsumers (18+) America (18+) America (18+) 2015 Europe (18+) 2015 Africa (18+) 2015 Asia (18+)
(A) (B) (C) (D) (E) (F) (G) (H) (I) (J) (K) (L)
-** 5452 -** 826 -** 507 -** 963 -** 378 -** 2778Unweighted Base- 57 - 15 - 4 - 12 - 5 - 21- 1% - 2% - 1% - 1% - 1% - 1%
L BL
Depends on use (Unspec.)
- 41 - 20 - 4 - 5 - - - 12- 1% - 2% - 1% - 1% - - - *
L BFHJL
Non profit use
- 30 - 11 - 7 - 2 - 3 - 7- 1% - 1% - 1% - * - 1% - *
L BHL BHL
Commercial use
- 28 - 9 - 2 - 2 - 2 - 13- 1% - 1% - * - * - 1% - *
BHL
Educational use
- 26 - 3 - 3 - 3 - 2 - 15- * - * - 1% - * - 1% - 1%
Public use
- 25 - 10 - 1 - 3 - 3 - 8- * - 1% - * - * - 1% - *
L BFHL
Not familiar
- 19 - 2 - 1 - 1 - 1 - 14- * - * - * - * - * - 1%
Helpful/Useful
- 10 - 2 - 2 - 1 - 1 - 4- * - * - * - * - * - *
Efficient/Work well
- 4 - - - - - 2 - - - 2- * - - - - - * - - - *
I would try it
- 2 - - - 1 - - - - - 1- * - - - * - - - - - *
Necessary/Needed to access internet
- 95 - 13 - 19 - 19 - 9 - 35- 2% - 2% - 4% - 2% - 2% - 1%
L BDHL
Other usage mentions
- 452 - 53 - 38 - 85 - 19 - 257- 8% - 6% - 7% - 9% - 5% - 9%
DJ J BDJ
EXTENSION APPEAL(NET)
- 78 - 3 - 1 - 25 - 1 - 48- 1% - * - * - 3% - * - 2%
DFJ BDFJ DFJ
Gut feeling/My opinion
- 50 - 8 - 2 - 9 - 1 - 30- 1% - 1% - * - 1% - * - 1%
Professional
- 45 - 6 - 3 - 5 - 1 - 30- 1% - 1% - 1% - 1% - * - 1%
B
Good/Like domain
- 36 - 2 - 3 - 4 - 3 - 24- 1% - * - 1% - * - 1% - 1%
Relevant to topic/Specific to the domain
- 29 - 7 - 5 - 6 - 3 - 8- 1% - 1% - 1% - 1% - 1% - *
L L L
Believable/Confidence/C onvincing
_________________________________________________________________________________________________________________Proportions/Means: Columns Tested (5% risk level) - A/B - C/D - E/F - G/H - I/J - K/L - A/C/E/G/I/K - B/D/F/H/J/LOverlap formulae used. ** very small base (under 30) ineligible for sig testing
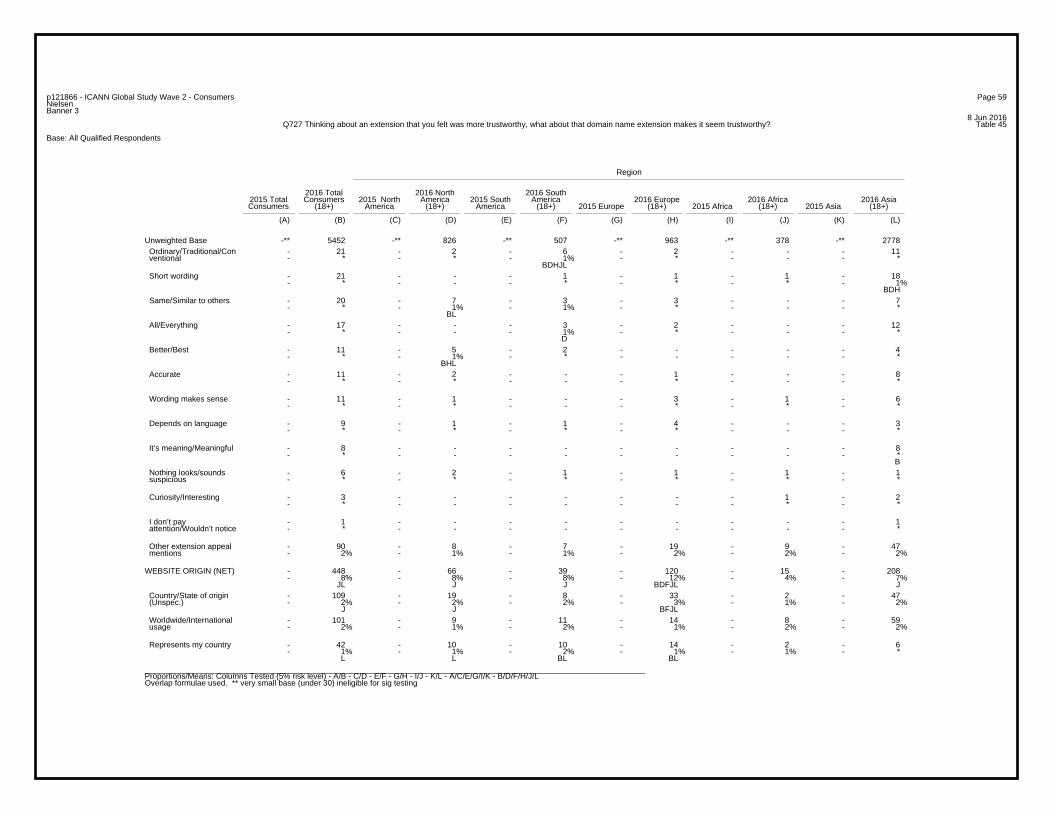
Page 59p121866 - ICANN Global Study Wave 2 - ConsumersNielsenBanner 3
8 Jun 2016Table 45Q727 Thinking about an extension that you felt was more trustworthy, what about that domain name extension makes it seem trustworthy?
Base: All Qualified Respondents
Region
2016 Total 2016 North 2016 South2015 Total Consumers 2015 North America 2015 South America 2016 Europe 2016 Africa 2016 AsiaConsumers (18+) America (18+) America (18+) 2015 Europe (18+) 2015 Africa (18+) 2015 Asia (18+)
(A) (B) (C) (D) (E) (F) (G) (H) (I) (J) (K) (L)
-** 5452 -** 826 -** 507 -** 963 -** 378 -** 2778Unweighted Base- 21 - 2 - 6 - 2 - - - 11- * - * - 1% - * - - - *
BDHJL
Ordinary/Traditional/Con ventional
- 21 - - - 1 - 1 - 1 - 18- * - - - * - * - * - 1%
BDH
Short wording
- 20 - 7 - 3 - 3 - - - 7- * - 1% - 1% - * - - - *
BL
Same/Similar to others
- 17 - - - 3 - 2 - - - 12- * - - - 1% - * - - - *
D
All/Everything
- 11 - 5 - 2 - - - - - 4- * - 1% - * - - - - - *
BHL
Better/Best
- 11 - 2 - - - 1 - - - 8- * - * - - - * - - - *
Accurate
- 11 - 1 - - - 3 - 1 - 6- * - * - - - * - * - *
Wording makes sense
- 9 - 1 - 1 - 4 - - - 3- * - * - * - * - - - *
Depends on language
- 8 - - - - - - - - - 8- * - - - - - - - - - *
B
It’s meaning/Meaningful
- 6 - 2 - 1 - 1 - 1 - 1- * - * - * - * - * - *
Nothing looks/sounds suspicious
- 3 - - - - - - - 1 - 2- * - - - - - - - * - *
Curiosity/Interesting
- 1 - - - - - - - - - 1- * - - - - - - - - - *
I don’t pay attention/Wouldn’t notice
- 90 - 8 - 7 - 19 - 9 - 47- 2% - 1% - 1% - 2% - 2% - 2%
Other extension appeal mentions
- 448 - 66 - 39 - 120 - 15 - 208- 8% - 8% - 8% - 12% - 4% - 7%
JL J J BDFJL J
WEBSITE ORIGIN (NET)
- 109 - 19 - 8 - 33 - 2 - 47- 2% - 2% - 2% - 3% - 1% - 2%
J J BFJL
Country/State of origin (Unspec.)
- 101 - 9 - 11 - 14 - 8 - 59- 2% - 1% - 2% - 1% - 2% - 2%
Worldwide/International usage
- 42 - 10 - 10 - 14 - 2 - 6- 1% - 1% - 2% - 1% - 1% - *
L L BL BL
Represents my country
_________________________________________________________________________________________________________________Proportions/Means: Columns Tested (5% risk level) - A/B - C/D - E/F - G/H - I/J - K/L - A/C/E/G/I/K - B/D/F/H/J/LOverlap formulae used. ** very small base (under 30) ineligible for sig testing

Page 60p121866 - ICANN Global Study Wave 2 - ConsumersNielsenBanner 3
8 Jun 2016Table 45Q727 Thinking about an extension that you felt was more trustworthy, what about that domain name extension makes it seem trustworthy?
Base: All Qualified Respondents
Region
2016 Total 2016 North 2016 South2015 Total Consumers 2015 North America 2015 South America 2016 Europe 2016 Africa 2016 AsiaConsumers (18+) America (18+) America (18+) 2015 Europe (18+) 2015 Africa (18+) 2015 Asia (18+)
(A) (B) (C) (D) (E) (F) (G) (H) (I) (J) (K) (L)
-** 5452 -** 826 -** 507 -** 963 -** 378 -** 2778Unweighted Base- 36 - - - - - - - - - 36- 1% - - - - - - - - - 1%
DH BDFHJ
Russian origin
- 179 - 33 - 12 - 61 - 6 - 67- 3% - 4% - 2% - 6% - 2% - 2%
L JL BDFJL
Other website origin mentions
- 316 - 43 - 43 - 68 - 42 - 120- 6% - 5% - 8% - 7% - 11% - 4%
L BDL L BDHL
SAFETY/SECURITY(NET)
- 263 - 37 - 33 - 54 - 38 - 101- 5% - 4% - 7% - 6% - 10% - 4%
L L L BDHL
Safety/Security/Padlock
- 33 - 3 - 7 - 9 - 2 - 12- 1% - * - 1% - 1% - 1% - *
BDL
Not being exposed to virus
- 16 - 1 - 1 - 3 - 2 - 9- * - * - * - * - 1% - *
Ensures privacy of personal information
- 10 - 2 - 4 - 2 - 2 - -- * - * - 1% - * - 1% - -
L L BL L L
Check with anti virus software
- 1 - - - - - - - - - 1- * - - - - - - - - - *
Other safety/security mentions
- 178 - 15 - 19 - 19 - 22 - 103- 3% - 2% - 4% - 2% - 6% - 4%
DH DH BDHL DH
CONVENIENCE (NET)
- 55 - 4 - 2 - 8 - 2 - 39- 1% - * - * - 1% - 1% - 1%
BD
Clear/Easy to understand/differentiate
- 48 - 2 - 7 - 5 - 13 - 21- 1% - * - 1% - 1% - 3% - 1%
D D BDFHL
Easy to use/access
- 30 - 3 - 3 - 1 - 5 - 18- 1% - * - 1% - * - 1% - 1%
H BH H
Faster/Quicker service
- 24 - 6 - 3 - 4 - 2 - 9- * - 1% - 1% - * - 1% - *
Harder to obtain/Requires certain criteria
- 38 - 2 - 4 - 1 - 3 - 28- 1% - * - 1% - * - 1% - 1%
H H H BDH
Other convenience mentions
- 142 - 16 - 21 - 18 - 17 - 70- 3% - 2% - 4% - 2% - 4% - 3%
BDHL BDHL
INFORMATION (NET)
- 121 - 14 - 16 - 14 - 14 - 63- 2% - 2% - 3% - 1% - 4% - 2%
H BDH
Content/Information provided
- 14 - 1 - 2 - 3 - 3 - 5- * - * - * - * - 1% - *
BL
Has what I am looking for
_________________________________________________________________________________________________________________Proportions/Means: Columns Tested (5% risk level) - A/B - C/D - E/F - G/H - I/J - K/L - A/C/E/G/I/K - B/D/F/H/J/LOverlap formulae used. ** very small base (under 30) ineligible for sig testing

Page 61p121866 - ICANN Global Study Wave 2 - ConsumersNielsenBanner 3
8 Jun 2016Table 45Q727 Thinking about an extension that you felt was more trustworthy, what about that domain name extension makes it seem trustworthy?
Base: All Qualified Respondents
Region
2016 Total 2016 North 2016 South2015 Total Consumers 2015 North America 2015 South America 2016 Europe 2016 Africa 2016 AsiaConsumers (18+) America (18+) America (18+) 2015 Europe (18+) 2015 Africa (18+) 2015 Asia (18+)
(A) (B) (C) (D) (E) (F) (G) (H) (I) (J) (K) (L)
-** 5452 -** 826 -** 507 -** 963 -** 378 -** 2778Unweighted Base- 9 - 1 - 3 - 1 - - - 4- * - * - 1% - * - - - *
BL
Other information mentions
- 131 - 15 - 6 - 48 - 8 - 54- 2% - 2% - 1% - 5% - 2% - 2%
L BDFJL
Illegible data
- 86 - 6 - 3 - 11 - 10 - 56- 2% - 1% - 1% - 1% - 3% - 2%
D DFH BDF
WEBSITE (NET)
- 10 - - - - - - - - - 10- * - - - - - - - - - *
B
Web based use/Used by major websites
- - - - - - - - - - - -- - - - - - - - - - - -
Linked from a trusted site
- 76 - 6 - 3 - 11 - 10 - 46- 1% - 1% - 1% - 1% - 3% - 2%
BDFH D
Other website mentions
- 77 - 7 - 10 - 5 - 15 - 40- 1% - 1% - 2% - 1% - 4% - 1%
H H BDHL H
SEARCH (NET)
- 49 - 3 - 4 - 3 - 12 - 27- 1% - * - 1% - * - 3% - 1%
H BDFHL H
Google search
- 15 - 3 - 6 - 2 - 1 - 3- * - * - 1% - * - * - *
L BHL
Researched it/Check out source first
- 6 - 1 - - - - - 1 - 4- * - * - - - - - * - *
Search engine/Found through searching
- 8 - - - - - - - 1 - 7- * - - - - - - - * - *
Other search mentions
- 60 - 1 - 9 - 8 - 3 - 39- 1% - * - 2% - 1% - 1% - 1%
D D D BD
WEBSITE APPEAL (NET)
- 32 - 1 - 3 - 2 - 2 - 24- 1% - * - 1% - * - 1% - 1%
D BDH
Design/Layout/Way it looks
- 29 - - - 7 - 6 - 1 - 15- 1% - - - 1% - 1% - * - 1%
D BDL D D
Few/No pop-ups/advertisements
- 211 - 16 - 29 - 44 - 14 - 108- 4% - 2% - 6% - 5% - 4% - 4%
D BD D D
MISCELLANEOUS (NET)
- 137 - 13 - 15 - 26 - 7 - 76- 3% - 2% - 3% - 3% - 2% - 3%
Authorized/Regulated
- 30 - 1 - 5 - 8 - 3 - 13- 1% - * - 1% - 1% - 1% - *
D D
Recommended by others
_________________________________________________________________________________________________________________Proportions/Means: Columns Tested (5% risk level) - A/B - C/D - E/F - G/H - I/J - K/L - A/C/E/G/I/K - B/D/F/H/J/LOverlap formulae used. ** very small base (under 30) ineligible for sig testing
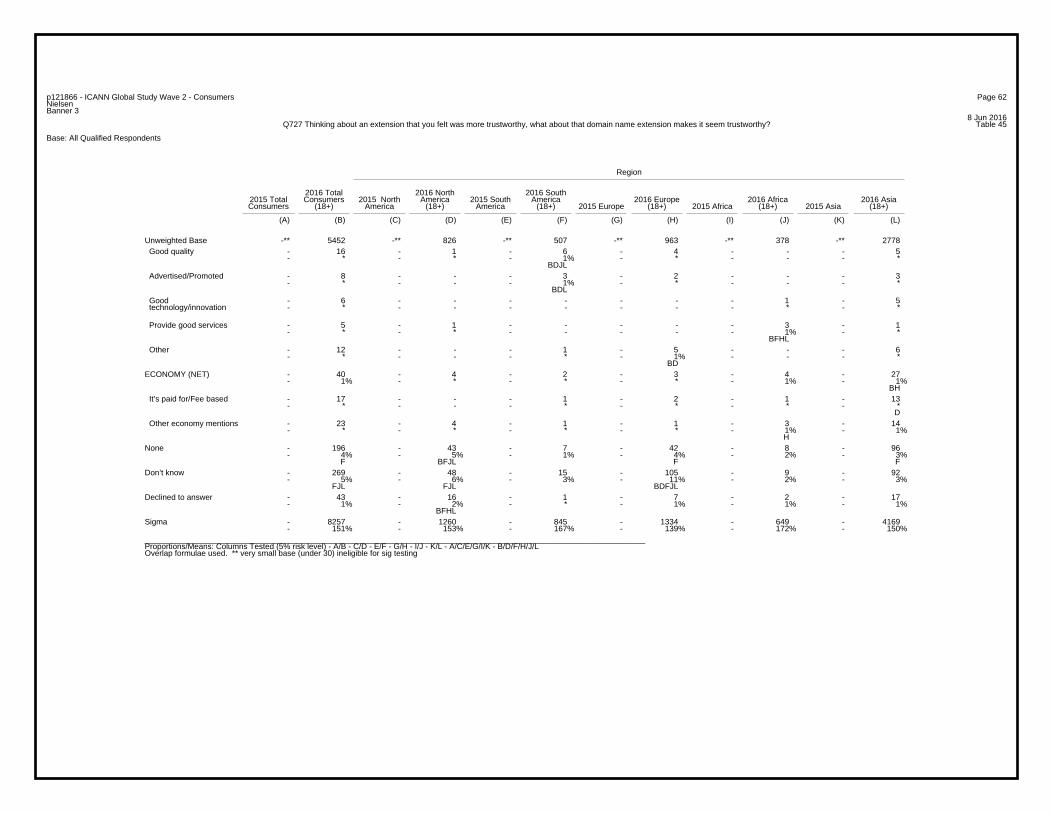
Page 62p121866 - ICANN Global Study Wave 2 - ConsumersNielsenBanner 3
8 Jun 2016Table 45Q727 Thinking about an extension that you felt was more trustworthy, what about that domain name extension makes it seem trustworthy?
Base: All Qualified Respondents
Region
2016 Total 2016 North 2016 South2015 Total Consumers 2015 North America 2015 South America 2016 Europe 2016 Africa 2016 AsiaConsumers (18+) America (18+) America (18+) 2015 Europe (18+) 2015 Africa (18+) 2015 Asia (18+)
(A) (B) (C) (D) (E) (F) (G) (H) (I) (J) (K) (L)
-** 5452 -** 826 -** 507 -** 963 -** 378 -** 2778Unweighted Base- 16 - 1 - 6 - 4 - - - 5- * - * - 1% - * - - - *
BDJL
Good quality
- 8 - - - 3 - 2 - - - 3- * - - - 1% - * - - - *
BDL
Advertised/Promoted
- 6 - - - - - - - 1 - 5- * - - - - - - - * - *
Good technology/innovation
- 5 - 1 - - - - - 3 - 1- * - * - - - - - 1% - *
BFHL
Provide good services
- 12 - - - 1 - 5 - - - 6- * - - - * - 1% - - - *
BD
Other
- 40 - 4 - 2 - 3 - 4 - 27- 1% - * - * - * - 1% - 1%
BH
ECONOMY (NET)
- 17 - - - 1 - 2 - 1 - 13- * - - - * - * - * - *
D
It’s paid for/Fee based
- 23 - 4 - 1 - 1 - 3 - 14- * - * - * - * - 1% - 1%
H
Other economy mentions
- 196 - 43 - 7 - 42 - 8 - 96- 4% - 5% - 1% - 4% - 2% - 3%
F BFJL F F
None
- 269 - 48 - 15 - 105 - 9 - 92- 5% - 6% - 3% - 11% - 2% - 3%
FJL FJL BDFJL
Don’t know
- 43 - 16 - 1 - 7 - 2 - 17- 1% - 2% - * - 1% - 1% - 1%
BFHL
Declined to answer
- 8257 - 1260 - 845 - 1334 - 649 - 4169- 151% - 153% - 167% - 139% - 172% - 150%
Sigma
_________________________________________________________________________________________________________________Proportions/Means: Columns Tested (5% risk level) - A/B - C/D - E/F - G/H - I/J - K/L - A/C/E/G/I/K - B/D/F/H/J/LOverlap formulae used. ** very small base (under 30) ineligible for sig testing
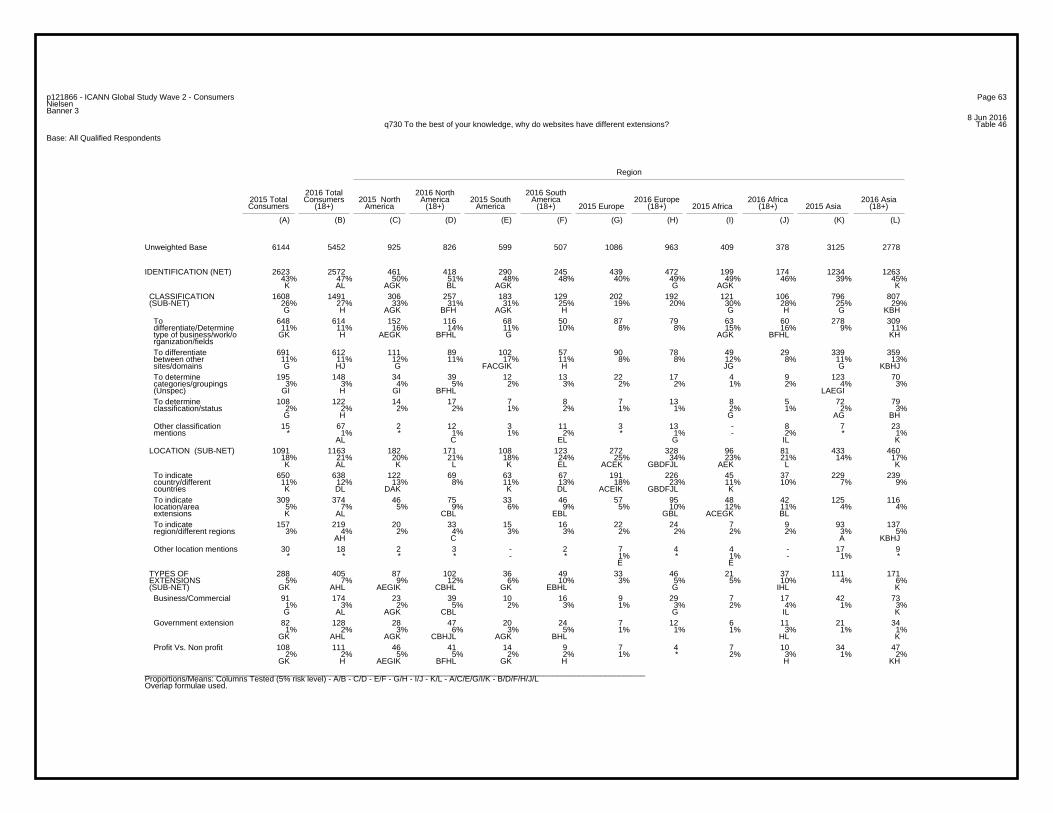
Page 63p121866 - ICANN Global Study Wave 2 - ConsumersNielsenBanner 3
8 Jun 2016Table 46q730 To the best of your knowledge, why do websites have different extensions?
Base: All Qualified Respondents
Region
2016 Total 2016 North 2016 South2015 Total Consumers 2015 North America 2015 South America 2016 Europe 2016 Africa 2016 AsiaConsumers (18+) America (18+) America (18+) 2015 Europe (18+) 2015 Africa (18+) 2015 Asia (18+)
(A) (B) (C) (D) (E) (F) (G) (H) (I) (J) (K) (L)
6144 5452 925 826 599 507 1086 963 409 378 3125 2778Unweighted Base
2623 2572 461 418 290 245 439 472 199 174 1234 126343% 47% 50% 51% 48% 48% 40% 49% 49% 46% 39% 45%K AL AGK BL AGK G AGK K
IDENTIFICATION (NET)
1608 1491 306 257 183 129 202 192 121 106 796 80726% 27% 33% 31% 31% 25% 19% 20% 30% 28% 25% 29%G H AGK BFH AGK H G H G KBH
CLASSIFICATION (SUB-NET)
648 614 152 116 68 50 87 79 63 60 278 30911% 11% 16% 14% 11% 10% 8% 8% 15% 16% 9% 11%
GK H AEGK BFHL G AGK BFHL KH
To differentiate/Determine type of business/work/o rganization/fields
691 612 111 89 102 57 90 78 49 29 339 35911% 11% 12% 11% 17% 11% 8% 8% 12% 8% 11% 13%G HJ G FACGIK H JG G KBHJ
To differentiate between other sites/domains
195 148 34 39 12 13 22 17 4 9 123 703% 3% 4% 5% 2% 3% 2% 2% 1% 2% 4% 3%
GI H GI BFHL LAEGI
To determine categories/groupings (Unspec)
108 122 14 17 7 8 7 13 8 5 72 792% 2% 2% 2% 1% 2% 1% 1% 2% 1% 2% 3%G H G AG BH
To determine classification/status
15 67 2 12 3 11 3 13 - 8 7 23* 1% * 1% 1% 2% * 1% - 2% * 1%
AL C EL G IL K
Other classification mentions
1091 1163 182 171 108 123 272 328 96 81 433 46018% 21% 20% 21% 18% 24% 25% 34% 23% 21% 14% 17%K AL K L K EL ACEK GBDFJL AEK L K
LOCATION (SUB-NET)
650 638 122 69 63 67 191 226 45 37 229 23911% 12% 13% 8% 11% 13% 18% 23% 11% 10% 7% 9%K DL DAK K DL ACEIK GBDFJL K
To indicate country/different countries
309 374 46 75 33 46 57 95 48 42 125 1165% 7% 5% 9% 6% 9% 5% 10% 12% 11% 4% 4%K AL CBL EBL GBL ACEGK BL
To indicate location/area extensions
157 219 20 33 15 16 22 24 7 9 93 1373% 4% 2% 4% 3% 3% 2% 2% 2% 2% 3% 5%
AH C A KBHJ
To indicate region/different regions
30 18 2 3 - 2 7 4 4 - 17 9* * * * - * 1% * 1% - 1% *
E E
Other location mentions
288 405 87 102 36 49 33 46 21 37 111 1715% 7% 9% 12% 6% 10% 3% 5% 5% 10% 4% 6%
GK AHL AEGIK CBHL GK EBHL G IHL K
TYPES OF EXTENSIONS (SUB-NET)
91 174 23 39 10 16 9 29 7 17 42 731% 3% 2% 5% 2% 3% 1% 3% 2% 4% 1% 3%G AL AGK CBL G IL K
Business/Commercial
82 128 28 47 20 24 7 12 6 11 21 341% 2% 3% 6% 3% 5% 1% 1% 1% 3% 1% 1%
GK AHL AGK CBHJL AGK BHL HL K
Government extension
108 111 46 41 14 9 7 4 7 10 34 472% 2% 5% 5% 2% 2% 1% * 2% 3% 1% 2%
GK H AEGIK BFHL GK H H KH
Profit Vs. Non profit
_________________________________________________________________________________________________________________Proportions/Means: Columns Tested (5% risk level) - A/B - C/D - E/F - G/H - I/J - K/L - A/C/E/G/I/K - B/D/F/H/J/LOverlap formulae used.
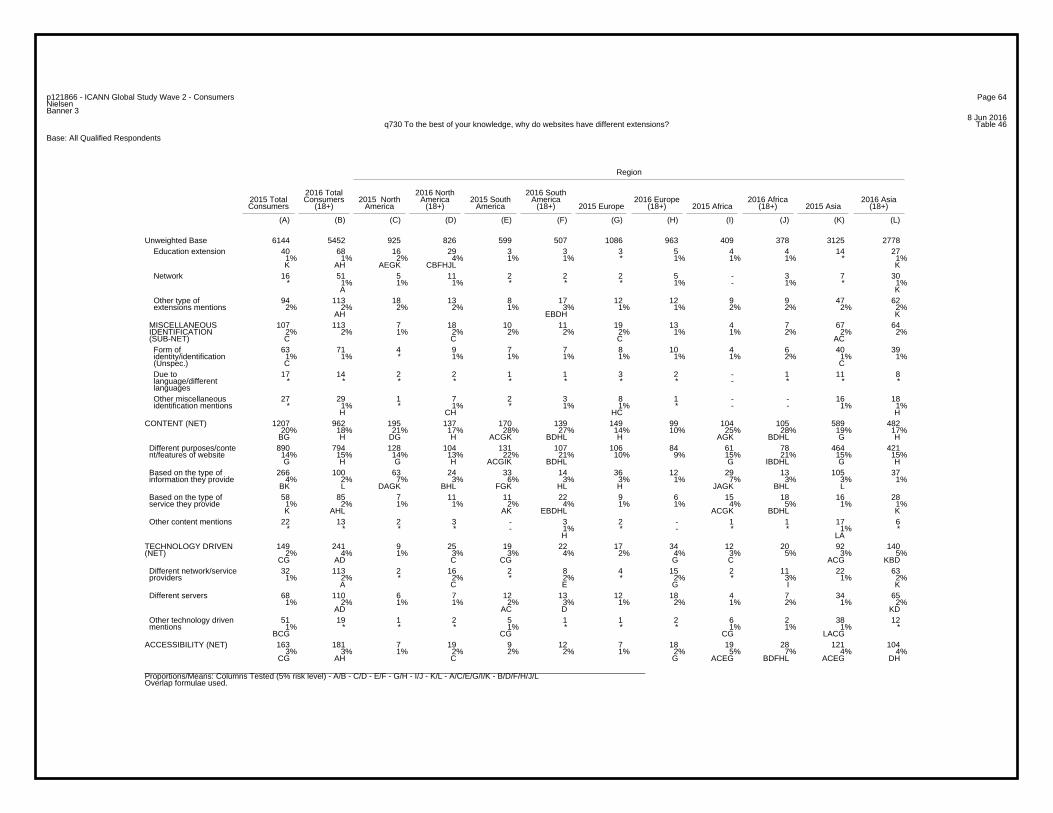
Page 64p121866 - ICANN Global Study Wave 2 - ConsumersNielsenBanner 3
8 Jun 2016Table 46q730 To the best of your knowledge, why do websites have different extensions?
Base: All Qualified Respondents
Region
2016 Total 2016 North 2016 South2015 Total Consumers 2015 North America 2015 South America 2016 Europe 2016 Africa 2016 AsiaConsumers (18+) America (18+) America (18+) 2015 Europe (18+) 2015 Africa (18+) 2015 Asia (18+)
(A) (B) (C) (D) (E) (F) (G) (H) (I) (J) (K) (L)
6144 5452 925 826 599 507 1086 963 409 378 3125 2778Unweighted Base40 68 16 29 3 3 3 5 4 4 14 27
1% 1% 2% 4% 1% 1% * 1% 1% 1% * 1%K AH AEGK CBFHJL K
Education extension
16 51 5 11 2 2 2 5 - 3 7 30* 1% 1% 1% * * * 1% - 1% * 1%
A K
Network
94 113 18 13 8 17 12 12 9 9 47 622% 2% 2% 2% 1% 3% 1% 1% 2% 2% 2% 2%
AH EBDH K
Other type of extensions mentions
107 113 7 18 10 11 19 13 4 7 67 642% 2% 1% 2% 2% 2% 2% 1% 1% 2% 2% 2%C C C AC
MISCELLANEOUS IDENTIFICATION (SUB-NET)
63 71 4 9 7 7 8 10 4 6 40 391% 1% * 1% 1% 1% 1% 1% 1% 2% 1% 1%C C
Form of identity/identification (Unspec.)
17 14 2 2 1 1 3 2 - 1 11 8* * * * * * * * - * * *
Due to language/different languages
27 29 1 7 2 3 8 1 - - 16 18* 1% * 1% * 1% 1% * - - 1% 1%
H CH HC H
Other miscellaneous identification mentions
1207 962 195 137 170 139 149 99 104 105 589 48220% 18% 21% 17% 28% 27% 14% 10% 25% 28% 19% 17%
BG H DG H ACGK BDHL H AGK BDHL G H
CONTENT (NET)
890 794 128 104 131 107 106 84 61 78 464 42114% 15% 14% 13% 22% 21% 10% 9% 15% 21% 15% 15%G H G H ACGIK BDHL G IBDHL G H
Different purposes/conte nt/features of website
266 100 63 24 33 14 36 12 29 13 105 374% 2% 7% 3% 6% 3% 3% 1% 7% 3% 3% 1%
BK L DAGK BHL FGK HL H JAGK BHL L
Based on the type of information they provide
58 85 7 11 11 22 9 6 15 18 16 281% 2% 1% 1% 2% 4% 1% 1% 4% 5% 1% 1%K AHL AK EBDHL ACGK BDHL K
Based on the type of service they provide
22 13 2 3 - 3 2 - 1 1 17 6* * * * - 1% * - * * 1% *
H LA
Other content mentions
149 241 9 25 19 22 17 34 12 20 92 1402% 4% 1% 3% 3% 4% 2% 4% 3% 5% 3% 5%
CG AD C CG G C ACG KBD
TECHNOLOGY DRIVEN(NET)
32 113 2 16 2 8 4 15 2 11 22 631% 2% * 2% * 2% * 2% * 3% 1% 2%
A C E G I K
Different network/service providers
68 110 6 7 12 13 12 18 4 7 34 651% 2% 1% 1% 2% 3% 1% 2% 1% 2% 1% 2%
AD AC D KD
Different servers
51 19 1 2 5 1 1 2 6 2 38 121% * * * 1% * * * 1% 1% 1% *
BCG CG CG LACG
Other technology driven mentions
163 181 7 19 9 12 7 18 19 28 121 1043% 3% 1% 2% 2% 2% 1% 2% 5% 7% 4% 4%
CG AH C G ACEG BDFHL ACEG DH
ACCESSIBILITY (NET)
_________________________________________________________________________________________________________________Proportions/Means: Columns Tested (5% risk level) - A/B - C/D - E/F - G/H - I/J - K/L - A/C/E/G/I/K - B/D/F/H/J/LOverlap formulae used.
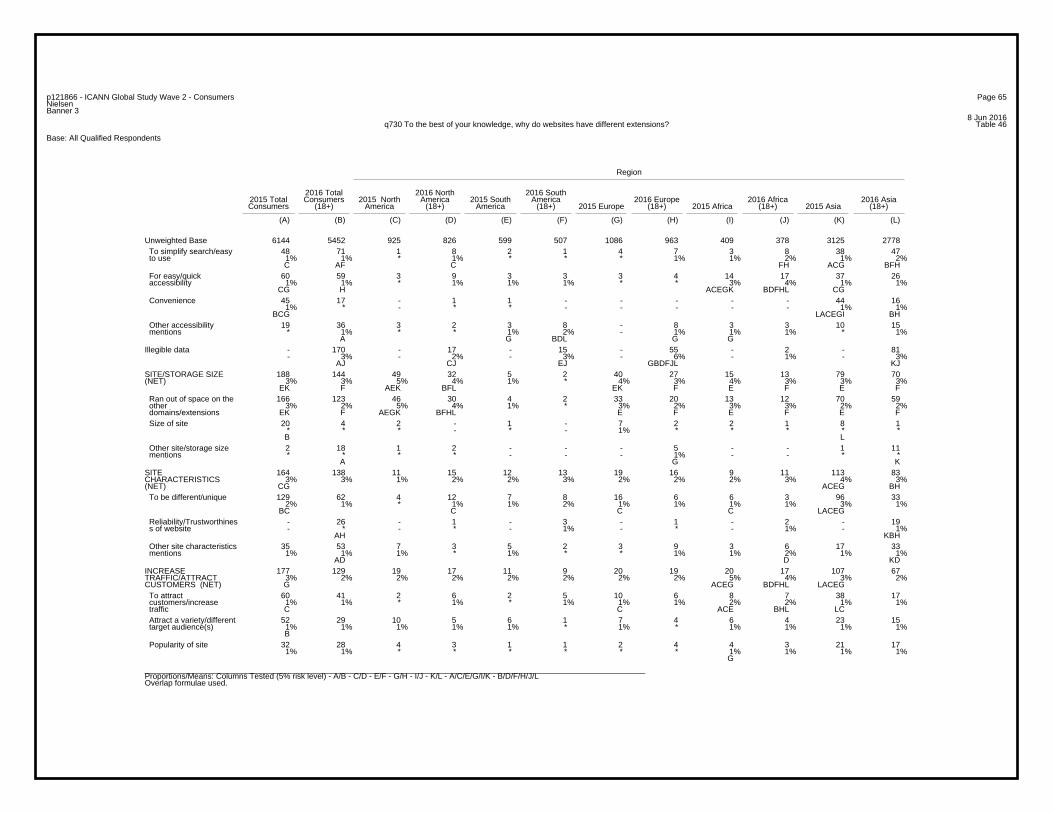
Page 65p121866 - ICANN Global Study Wave 2 - ConsumersNielsenBanner 3
8 Jun 2016Table 46q730 To the best of your knowledge, why do websites have different extensions?
Base: All Qualified Respondents
Region
2016 Total 2016 North 2016 South2015 Total Consumers 2015 North America 2015 South America 2016 Europe 2016 Africa 2016 AsiaConsumers (18+) America (18+) America (18+) 2015 Europe (18+) 2015 Africa (18+) 2015 Asia (18+)
(A) (B) (C) (D) (E) (F) (G) (H) (I) (J) (K) (L)
6144 5452 925 826 599 507 1086 963 409 378 3125 2778Unweighted Base48 71 1 8 2 1 4 7 3 8 38 47
1% 1% * 1% * * * 1% 1% 2% 1% 2%C AF C FH ACG BFH
To simplify search/easy to use
60 59 3 9 3 3 3 4 14 17 37 261% 1% * 1% 1% 1% * * 3% 4% 1% 1%
CG H ACEGK BDFHL CG
For easy/quick accessibility
45 17 - 1 1 - - - - - 44 161% * - * * - - - - - 1% 1%
BCG LACEGI BH
Convenience
19 36 3 2 3 8 - 8 3 3 10 15* 1% * * 1% 2% - 1% 1% 1% * 1%
A G BDL G G
Other accessibility mentions
- 170 - 17 - 15 - 55 - 2 - 81- 3% - 2% - 3% - 6% - 1% - 3%
AJ CJ EJ GBDFJL KJ
Illegible data
188 144 49 32 5 2 40 27 15 13 79 703% 3% 5% 4% 1% * 4% 3% 4% 3% 3% 3%
EK F AEK BFL EK F E F E F
SITE/STORAGE SIZE(NET)
166 123 46 30 4 2 33 20 13 12 70 593% 2% 5% 4% 1% * 3% 2% 3% 3% 2% 2%
EK F AEGK BFHL E F E F E F
Ran out of space on the other domains/extensions
20 4 2 - 1 - 7 2 2 1 8 1* * * - * - 1% * * * * * B L
Size of site
2 18 1 2 - - - 5 - - 1 11* * * * - - - 1% - - * *
A G K
Other site/storage size mentions
164 138 11 15 12 13 19 16 9 11 113 833% 3% 1% 2% 2% 3% 2% 2% 2% 3% 4% 3%
CG ACEG BH
SITECHARACTERISTICS(NET)
129 62 4 12 7 8 16 6 6 3 96 332% 1% * 1% 1% 2% 1% 1% 1% 1% 3% 1%
BC C C C LACEG
To be different/unique
- 26 - 1 - 3 - 1 - 2 - 19- * - * - 1% - * - 1% - 1%
AH KBH
Reliability/Trustworthines s of website
35 53 7 3 5 2 3 9 3 6 17 331% 1% 1% * 1% * * 1% 1% 2% 1% 1%
AD D KD
Other site characteristics mentions
177 129 19 17 11 9 20 19 20 17 107 673% 2% 2% 2% 2% 2% 2% 2% 5% 4% 3% 2%G ACEG BDFHL LACEG
INCREASETRAFFIC/ATTRACTCUSTOMERS (NET)
60 41 2 6 2 5 10 6 8 7 38 171% 1% * 1% * 1% 1% 1% 2% 2% 1% 1%C C ACE BHL LC
To attract customers/increase traffic
52 29 10 5 6 1 7 4 6 4 23 151% 1% 1% 1% 1% * 1% * 1% 1% 1% 1%B
Attract a variety/different target audience(s)
32 28 4 3 1 1 2 4 4 3 21 171% 1% * * * * * * 1% 1% 1% 1%
G
Popularity of site
_________________________________________________________________________________________________________________Proportions/Means: Columns Tested (5% risk level) - A/B - C/D - E/F - G/H - I/J - K/L - A/C/E/G/I/K - B/D/F/H/J/LOverlap formulae used.
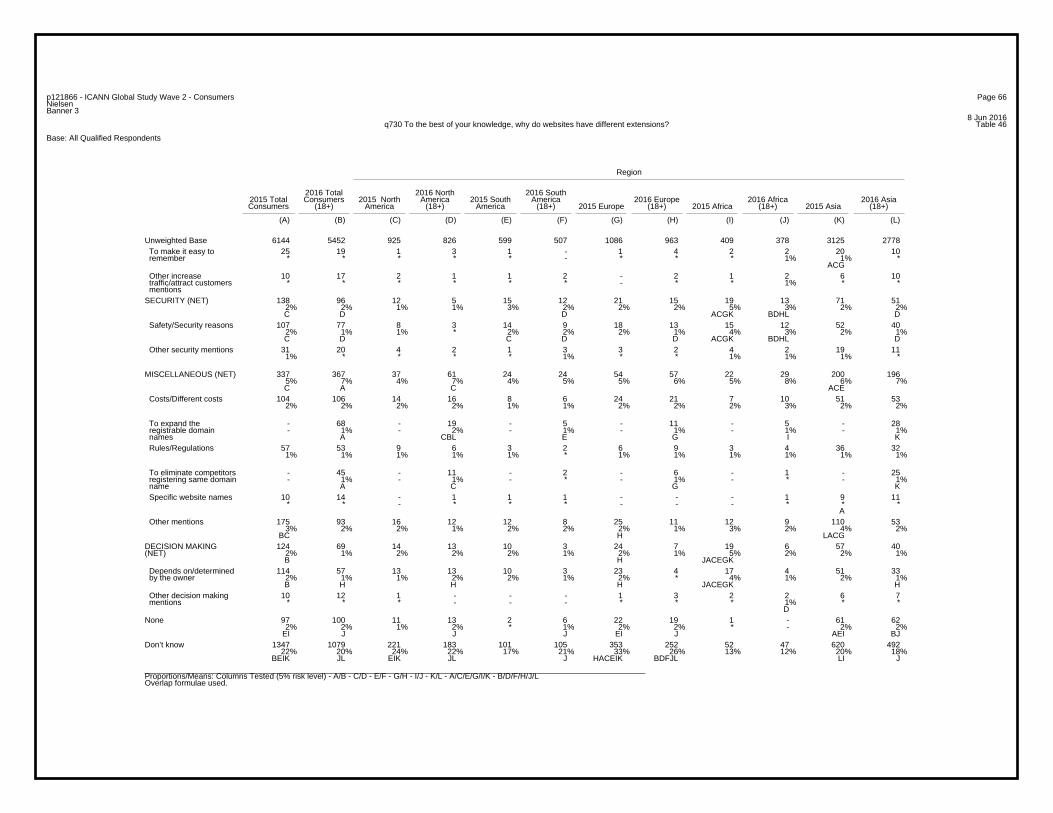
Page 66p121866 - ICANN Global Study Wave 2 - ConsumersNielsenBanner 3
8 Jun 2016Table 46q730 To the best of your knowledge, why do websites have different extensions?
Base: All Qualified Respondents
Region
2016 Total 2016 North 2016 South2015 Total Consumers 2015 North America 2015 South America 2016 Europe 2016 Africa 2016 AsiaConsumers (18+) America (18+) America (18+) 2015 Europe (18+) 2015 Africa (18+) 2015 Asia (18+)
(A) (B) (C) (D) (E) (F) (G) (H) (I) (J) (K) (L)
6144 5452 925 826 599 507 1086 963 409 378 3125 2778Unweighted Base25 19 1 3 1 - 1 4 2 2 20 10
* * * * * - * * * 1% 1% * ACG
To make it easy to remember
10 17 2 1 1 2 - 2 1 2 6 10* * * * * * - * * 1% * *
Other increase traffic/attract customers mentions
138 96 12 5 15 12 21 15 19 13 71 512% 2% 1% 1% 3% 2% 2% 2% 5% 3% 2% 2%C D D ACGK BDHL D
SECURITY (NET)
107 77 8 3 14 9 18 13 15 12 52 402% 1% 1% * 2% 2% 2% 1% 4% 3% 2% 1%C D C D D ACGK BDHL D
Safety/Security reasons
31 20 4 2 1 3 3 2 4 2 19 111% * * * * 1% * * 1% 1% 1% *
Other security mentions
337 367 37 61 24 24 54 57 22 29 200 1965% 7% 4% 7% 4% 5% 5% 6% 5% 8% 6% 7%C A C ACE
MISCELLANEOUS (NET)
104 106 14 16 8 6 24 21 7 10 51 532% 2% 2% 2% 1% 1% 2% 2% 2% 3% 2% 2%
Costs/Different costs
- 68 - 19 - 5 - 11 - 5 - 28- 1% - 2% - 1% - 1% - 1% - 1%
A CBL E G I K
To expand the registrable domain names
57 53 9 6 3 2 6 9 3 4 36 321% 1% 1% 1% 1% * 1% 1% 1% 1% 1% 1%
Rules/Regulations
- 45 - 11 - 2 - 6 - 1 - 25- 1% - 1% - * - 1% - * - 1%
A C G K
To eliminate competitors registering same domain name
10 14 - 1 1 1 - - - 1 9 11* * - * * * - - - * * *
A
Specific website names
175 93 16 12 12 8 25 11 12 9 110 533% 2% 2% 1% 2% 2% 2% 1% 3% 2% 4% 2%
BC H LACG
Other mentions
124 69 14 13 10 3 24 7 19 6 57 402% 1% 2% 2% 2% 1% 2% 1% 5% 2% 2% 1%B H JACEGK
DECISION MAKING(NET)
114 57 13 13 10 3 23 4 17 4 51 332% 1% 1% 2% 2% 1% 2% * 4% 1% 2% 1%B H H H JACEGK H
Depends on/determined by the owner
10 12 1 - - - 1 3 2 2 6 7* * * - - - * * * 1% * *
D
Other decision making mentions
97 100 11 13 2 6 22 19 1 - 61 622% 2% 1% 2% * 1% 2% 2% * - 2% 2%
EI J J J EI J AEI BJ
None
1347 1079 221 183 101 105 353 252 52 47 620 49222% 20% 24% 22% 17% 21% 33% 26% 13% 12% 20% 18%
BEIK JL EIK JL J HACEIK BDFJL LI J
Don’t know
_________________________________________________________________________________________________________________Proportions/Means: Columns Tested (5% risk level) - A/B - C/D - E/F - G/H - I/J - K/L - A/C/E/G/I/K - B/D/F/H/J/LOverlap formulae used.
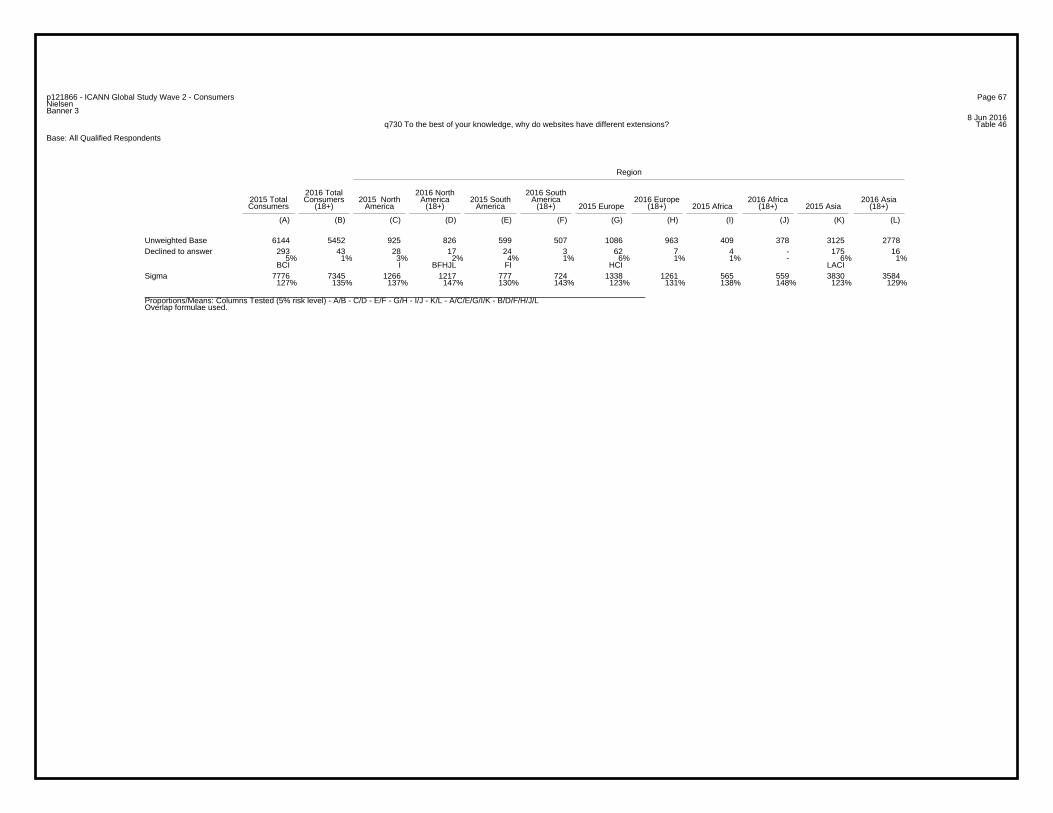
Page 67p121866 - ICANN Global Study Wave 2 - ConsumersNielsenBanner 3
8 Jun 2016Table 46q730 To the best of your knowledge, why do websites have different extensions?
Base: All Qualified Respondents
Region
2016 Total 2016 North 2016 South2015 Total Consumers 2015 North America 2015 South America 2016 Europe 2016 Africa 2016 AsiaConsumers (18+) America (18+) America (18+) 2015 Europe (18+) 2015 Africa (18+) 2015 Asia (18+)
(A) (B) (C) (D) (E) (F) (G) (H) (I) (J) (K) (L)
6144 5452 925 826 599 507 1086 963 409 378 3125 2778Unweighted Base293 43 28 17 24 3 62 7 4 - 175 16
5% 1% 3% 2% 4% 1% 6% 1% 1% - 6% 1%BCI I BFHJL FI HCI LACI
Declined to answer
7776 7345 1266 1217 777 724 1338 1261 565 559 3830 3584127% 135% 137% 147% 130% 143% 123% 131% 138% 148% 123% 129%
Sigma
_________________________________________________________________________________________________________________Proportions/Means: Columns Tested (5% risk level) - A/B - C/D - E/F - G/H - I/J - K/L - A/C/E/G/I/K - B/D/F/H/J/LOverlap formulae used.
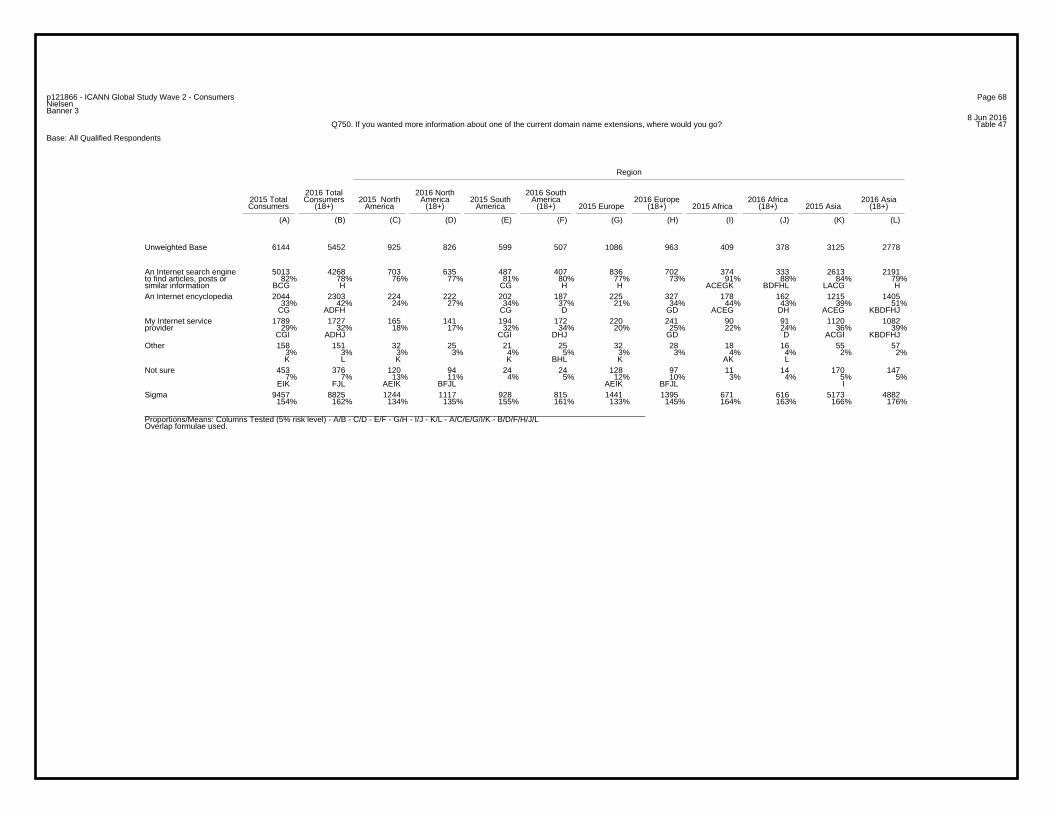
Page 68p121866 - ICANN Global Study Wave 2 - ConsumersNielsenBanner 3
8 Jun 2016Table 47Q750. If you wanted more information about one of the current domain name extensions, where would you go?
Base: All Qualified Respondents
Region
2016 Total 2016 North 2016 South2015 Total Consumers 2015 North America 2015 South America 2016 Europe 2016 Africa 2016 AsiaConsumers (18+) America (18+) America (18+) 2015 Europe (18+) 2015 Africa (18+) 2015 Asia (18+)
(A) (B) (C) (D) (E) (F) (G) (H) (I) (J) (K) (L)
6144 5452 925 826 599 507 1086 963 409 378 3125 2778Unweighted Base
5013 4268 703 635 487 407 836 702 374 333 2613 219182% 78% 76% 77% 81% 80% 77% 73% 91% 88% 84% 79%
BCG H CG H H ACEGK BDFHL LACG H
An Internet search engineto find articles, posts orsimilar information
2044 2303 224 222 202 187 225 327 178 162 1215 140533% 42% 24% 27% 34% 37% 21% 34% 44% 43% 39% 51%
CG ADFH CG D GD ACEG DH ACEG KBDFHJ
An Internet encyclopedia
1789 1727 165 141 194 172 220 241 90 91 1120 108229% 32% 18% 17% 32% 34% 20% 25% 22% 24% 36% 39%
CGI ADHJ CGI DHJ GD D ACGI KBDFHJ
My Internet serviceprovider
158 151 32 25 21 25 32 28 18 16 55 573% 3% 3% 3% 4% 5% 3% 3% 4% 4% 2% 2%K L K K BHL K AK L
Other
453 376 120 94 24 24 128 97 11 14 170 1477% 7% 13% 11% 4% 5% 12% 10% 3% 4% 5% 5%
EIK FJL AEIK BFJL AEIK BFJL I
Not sure
9457 8825 1244 1117 928 815 1441 1395 671 616 5173 4882154% 162% 134% 135% 155% 161% 133% 145% 164% 163% 166% 176%
Sigma
_________________________________________________________________________________________________________________Proportions/Means: Columns Tested (5% risk level) - A/B - C/D - E/F - G/H - I/J - K/L - A/C/E/G/I/K - B/D/F/H/J/LOverlap formulae used.
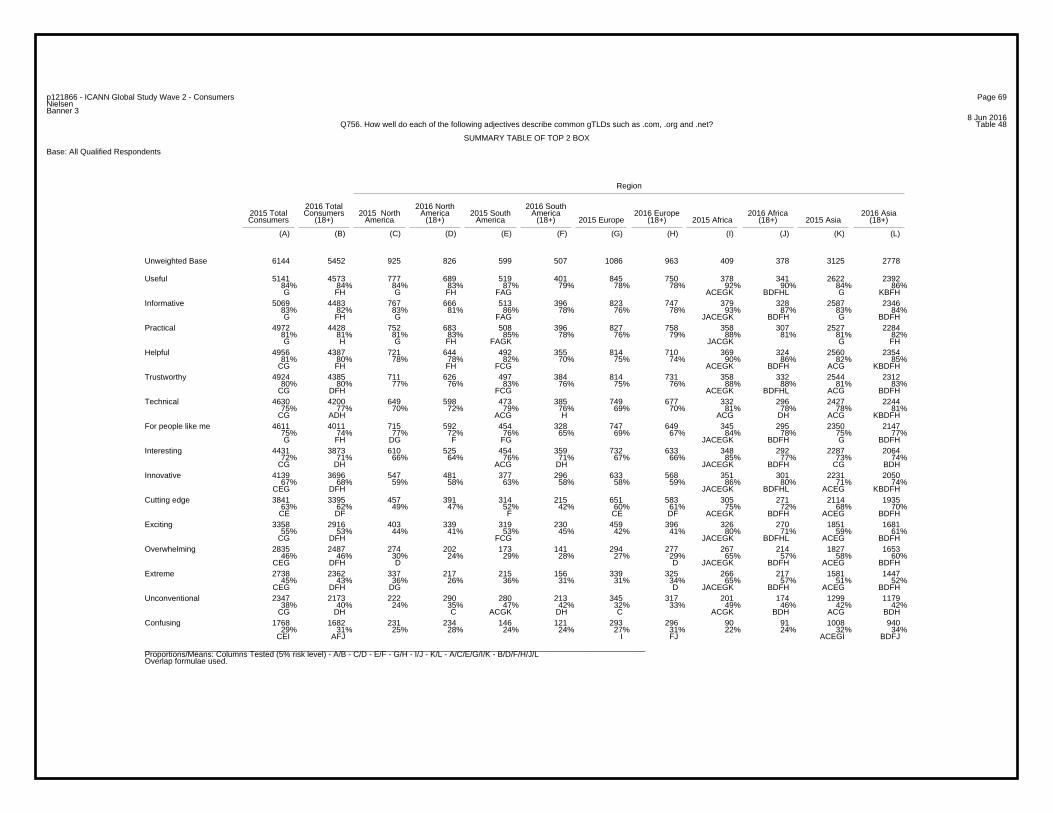
Page 69p121866 - ICANN Global Study Wave 2 - ConsumersNielsenBanner 3
8 Jun 2016Table 48Q756. How well do each of the following adjectives describe common gTLDs such as .com, .org and .net?
SUMMARY TABLE OF TOP 2 BOX
Base: All Qualified Respondents
Region
2016 Total 2016 North 2016 South2015 Total Consumers 2015 North America 2015 South America 2016 Europe 2016 Africa 2016 AsiaConsumers (18+) America (18+) America (18+) 2015 Europe (18+) 2015 Africa (18+) 2015 Asia (18+)
(A) (B) (C) (D) (E) (F) (G) (H) (I) (J) (K) (L)
6144 5452 925 826 599 507 1086 963 409 378 3125 2778Unweighted Base
5141 4573 777 689 519 401 845 750 378 341 2622 239284% 84% 84% 83% 87% 79% 78% 78% 92% 90% 84% 86%G FH G FH FAG ACEGK BDFHL G KBFH
Useful
5069 4483 767 666 513 396 823 747 379 328 2587 234683% 82% 83% 81% 86% 78% 76% 78% 93% 87% 83% 84%G FH G FAG JACEGK BDFH G BDFH
Informative
4972 4428 752 683 508 396 827 758 358 307 2527 228481% 81% 81% 83% 85% 78% 76% 79% 88% 81% 81% 82%G H G FH FAGK JACGK G FH
Practical
4956 4387 721 644 492 355 814 710 369 324 2560 235481% 80% 78% 78% 82% 70% 75% 74% 90% 86% 82% 85%
CG FH FH FCG ACEGK BDFH ACG KBDFH
Helpful
4924 4385 711 626 497 384 814 731 358 332 2544 231280% 80% 77% 76% 83% 76% 75% 76% 88% 88% 81% 83%
CG DFH FCG ACEGK BDFHL ACG BDFH
Trustworthy
4630 4200 649 598 473 385 749 677 332 296 2427 224475% 77% 70% 72% 79% 76% 69% 70% 81% 78% 78% 81%
CG ADH ACG H ACG DH ACG KBDFH
Technical
4611 4011 715 592 454 328 747 649 345 295 2350 214775% 74% 77% 72% 76% 65% 69% 67% 84% 78% 75% 77%G FH DG F FG JACEGK BDFH G BDFH
For people like me
4431 3873 610 525 454 359 732 633 348 292 2287 206472% 71% 66% 64% 76% 71% 67% 66% 85% 77% 73% 74%
CG DH ACG DH JACEGK BDFH CG BDH
Interesting
4139 3696 547 481 377 296 633 568 351 301 2231 205067% 68% 59% 58% 63% 58% 58% 59% 86% 80% 71% 74%
CEG DFH JACEGK BDFHL ACEG KBDFH
Innovative
3841 3395 457 391 314 215 651 583 305 271 2114 193563% 62% 49% 47% 52% 42% 60% 61% 75% 72% 68% 70%CE DF F CE DF ACEGK BDFH ACEG BDFH
Cutting edge
3358 2916 403 339 319 230 459 396 326 270 1851 168155% 53% 44% 41% 53% 45% 42% 41% 80% 71% 59% 61%
CG DFH FCG JACEGK BDFHL ACEG BDFH
Exciting
2835 2487 274 202 173 141 294 277 267 214 1827 165346% 46% 30% 24% 29% 28% 27% 29% 65% 57% 58% 60%
CEG DFH D D JACEGK BDFH ACEG BDFH
Overwhelming
2738 2362 337 217 215 156 339 325 266 217 1581 144745% 43% 36% 26% 36% 31% 31% 34% 65% 57% 51% 52%
CEG DFH DG D JACEGK BDFH ACEG BDFH
Extreme
2347 2173 222 290 280 213 345 317 201 174 1299 117938% 40% 24% 35% 47% 42% 32% 33% 49% 46% 42% 42%
CG DH C ACGK DH C ACGK BDH ACG BDH
Unconventional
1768 1682 231 234 146 121 293 296 90 91 1008 94029% 31% 25% 28% 24% 24% 27% 31% 22% 24% 32% 34%
CEI AFJ I FJ ACEGI BDFJ
Confusing
_________________________________________________________________________________________________________________Proportions/Means: Columns Tested (5% risk level) - A/B - C/D - E/F - G/H - I/J - K/L - A/C/E/G/I/K - B/D/F/H/J/LOverlap formulae used.
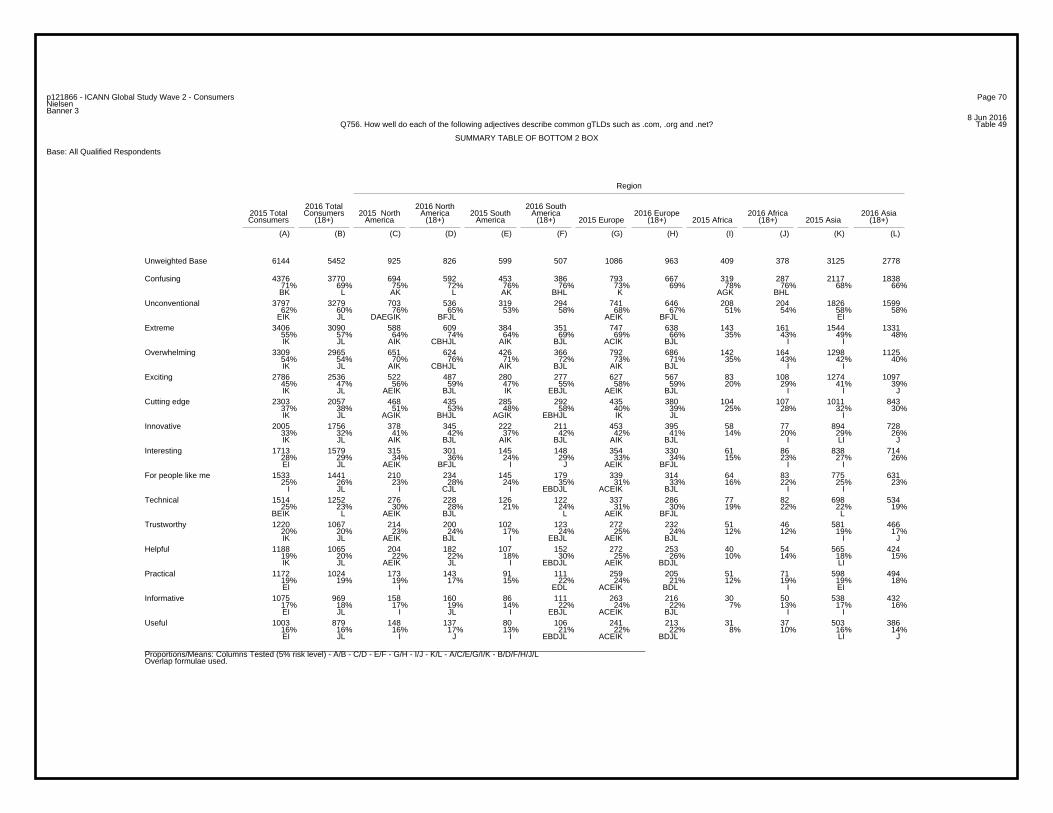
Page 70p121866 - ICANN Global Study Wave 2 - ConsumersNielsenBanner 3
8 Jun 2016Table 49Q756. How well do each of the following adjectives describe common gTLDs such as .com, .org and .net?
SUMMARY TABLE OF BOTTOM 2 BOX
Base: All Qualified Respondents
Region
2016 Total 2016 North 2016 South2015 Total Consumers 2015 North America 2015 South America 2016 Europe 2016 Africa 2016 AsiaConsumers (18+) America (18+) America (18+) 2015 Europe (18+) 2015 Africa (18+) 2015 Asia (18+)
(A) (B) (C) (D) (E) (F) (G) (H) (I) (J) (K) (L)
6144 5452 925 826 599 507 1086 963 409 378 3125 2778Unweighted Base
4376 3770 694 592 453 386 793 667 319 287 2117 183871% 69% 75% 72% 76% 76% 73% 69% 78% 76% 68% 66%BK L AK L AK BHL K AGK BHL
Confusing
3797 3279 703 536 319 294 741 646 208 204 1826 159962% 60% 76% 65% 53% 58% 68% 67% 51% 54% 58% 58%
EIK JL DAEGIK BFJL AEIK BFJL EI
Unconventional
3406 3090 588 609 384 351 747 638 143 161 1544 133155% 57% 64% 74% 64% 69% 69% 66% 35% 43% 49% 48%IK JL AIK CBHJL AIK BJL ACIK BJL I I
Extreme
3309 2965 651 624 426 366 792 686 142 164 1298 112554% 54% 70% 76% 71% 72% 73% 71% 35% 43% 42% 40%IK JL AIK CBHJL AIK BJL AIK BJL I I
Overwhelming
2786 2536 522 487 280 277 627 567 83 108 1274 109745% 47% 56% 59% 47% 55% 58% 59% 20% 29% 41% 39%IK JL AEIK BJL IK EBJL AEIK BJL I I J
Exciting
2303 2057 468 435 285 292 435 380 104 107 1011 84337% 38% 51% 53% 48% 58% 40% 39% 25% 28% 32% 30%IK JL AGIK BHJL AGIK EBHJL IK JL I
Cutting edge
2005 1756 378 345 222 211 453 395 58 77 894 72833% 32% 41% 42% 37% 42% 42% 41% 14% 20% 29% 26%IK JL AIK BJL AIK BJL AIK BJL I LI J
Innovative
1713 1579 315 301 145 148 354 330 61 86 838 71428% 29% 34% 36% 24% 29% 33% 34% 15% 23% 27% 26%EI JL AEIK BFJL I J AEIK BFJL I I
Interesting
1533 1441 210 234 145 179 339 314 64 83 775 63125% 26% 23% 28% 24% 35% 31% 33% 16% 22% 25% 23%
I JL I CJL I EBDJL ACEIK BJL I I
For people like me
1514 1252 276 228 126 122 337 286 77 82 698 53425% 23% 30% 28% 21% 24% 31% 30% 19% 22% 22% 19%
BEIK L AEIK BJL L AEIK BFJL L
Technical
1220 1067 214 200 102 123 272 232 51 46 581 46620% 20% 23% 24% 17% 24% 25% 24% 12% 12% 19% 17%IK JL AEIK BJL I EBJL AEIK BJL I J
Trustworthy
1188 1065 204 182 107 152 272 253 40 54 565 42419% 20% 22% 22% 18% 30% 25% 26% 10% 14% 18% 15%IK JL AEIK JL I EBDJL AEIK BDJL LI
Helpful
1172 1024 173 143 91 111 259 205 51 71 598 49419% 19% 19% 17% 15% 22% 24% 21% 12% 19% 19% 18%EI I EDL ACEIK BDL I EI
Practical
1075 969 158 160 86 111 263 216 30 50 538 43217% 18% 17% 19% 14% 22% 24% 22% 7% 13% 17% 16%EI JL I JL I EBJL ACEIK BJL I I
Informative
1003 879 148 137 80 106 241 213 31 37 503 38616% 16% 16% 17% 13% 21% 22% 22% 8% 10% 16% 14%EI JL I J I EBDJL ACEIK BDJL LI J
Useful
_________________________________________________________________________________________________________________Proportions/Means: Columns Tested (5% risk level) - A/B - C/D - E/F - G/H - I/J - K/L - A/C/E/G/I/K - B/D/F/H/J/LOverlap formulae used.

Page 71p121866 - ICANN Global Study Wave 2 - ConsumersNielsenBanner 3
8 Jun 2016Table 50Q756_1. How well do each of the following adjectives describe common gTLDs such as .com, .org and .net?
1. Innovative
Base: All Qualified Respondents
Region
2016 Total 2016 North 2016 South2015 Total Consumers 2015 North America 2015 South America 2016 Europe 2016 Africa 2016 AsiaConsumers (18+) America (18+) America (18+) 2015 Europe (18+) 2015 Africa (18+) 2015 Asia (18+)
(A) (B) (C) (D) (E) (F) (G) (H) (I) (J) (K) (L)
6144 5452 925 826 599 507 1086 963 409 378 3125 2778Unweighted Base
4139 3696 547 481 377 296 633 568 351 301 2231 205067% 68% 59% 58% 63% 58% 58% 59% 86% 80% 71% 74%
CEG DFH JACEGK BDFHL ACEG KBDFH
TOP 2 BOX (NET)
1340 1272 148 132 134 106 127 136 192 141 739 75722% 23% 16% 16% 22% 21% 12% 14% 47% 37% 24% 27%
CG DH G CG DH JACEGK BDFHL ACG KBDFH
Describes very well
2799 2424 399 349 243 190 506 432 159 160 1492 129346% 44% 43% 42% 41% 37% 47% 45% 39% 42% 48% 47%EI F EI F ACEI BDF
Describes somewhat well
2005 1756 378 345 222 211 453 395 58 77 894 72833% 32% 41% 42% 37% 42% 42% 41% 14% 20% 29% 26%IK JL AIK BJL AIK BJL AIK BJL I LI J
BOTTOM 2 BOX (NET)
1465 1271 245 214 150 128 312 284 36 48 722 59724% 23% 26% 26% 25% 25% 29% 29% 9% 13% 23% 21%
I JL AIK JL I J AIK BJL I J
Does not describe very well
540 485 133 131 72 83 141 111 22 29 172 1319% 9% 14% 16% 12% 16% 13% 12% 5% 8% 6% 5%
IK L AIK BHJL AIK EBHJL AIK BJL L
Does not describe at all
6144 5452 925 826 599 507 1086 963 409 378 3125 2778100% 100% 100% 100% 100% 100% 100% 100% 100% 100% 100% 100%
Sigma
_________________________________________________________________________________________________________________Proportions/Means: Columns Tested (5% risk level) - A/B - C/D - E/F - G/H - I/J - K/L - A/C/E/G/I/K - B/D/F/H/J/LOverlap formulae used.

Page 72p121866 - ICANN Global Study Wave 2 - ConsumersNielsenBanner 3
8 Jun 2016Table 51Q756_2. How well do each of the following adjectives describe common gTLDs such as .com, .org and .net?
2. Cutting edge
Base: All Qualified Respondents
Region
2016 Total 2016 North 2016 South2015 Total Consumers 2015 North America 2015 South America 2016 Europe 2016 Africa 2016 AsiaConsumers (18+) America (18+) America (18+) 2015 Europe (18+) 2015 Africa (18+) 2015 Asia (18+)
(A) (B) (C) (D) (E) (F) (G) (H) (I) (J) (K) (L)
6144 5452 925 826 599 507 1086 963 409 378 3125 2778Unweighted Base
3841 3395 457 391 314 215 651 583 305 271 2114 193563% 62% 49% 47% 52% 42% 60% 61% 75% 72% 68% 70%CE DF F CE DF ACEGK BDFH ACEG BDFH
TOP 2 BOX (NET)
1151 1097 113 104 94 70 123 142 140 114 681 66719% 20% 12% 13% 16% 14% 11% 15% 34% 30% 22% 24%
CEG DFH G G ACEGK BDFHL ACEG KBDFH
Describes very well
2690 2298 344 287 220 145 528 441 165 157 1433 126844% 42% 37% 35% 37% 29% 49% 46% 40% 42% 46% 46%CE DF F F ACEI BDF DF ACEI BDF
Describes somewhat well
2303 2057 468 435 285 292 435 380 104 107 1011 84337% 38% 51% 53% 48% 58% 40% 39% 25% 28% 32% 30%IK JL AGIK BHJL AGIK EBHJL IK JL I
BOTTOM 2 BOX (NET)
1667 1483 293 277 183 154 297 275 70 72 824 70527% 27% 32% 34% 31% 30% 27% 29% 17% 19% 26% 25%
I JL AGIK BHJL AIK JL I J I J
Does not describe very well
636 574 175 158 102 138 138 105 34 35 187 13810% 11% 19% 19% 17% 27% 13% 11% 8% 9% 6% 5%K L AGIK BHJL AGIK EBDHJL AIK L L
Does not describe at all
6144 5452 925 826 599 507 1086 963 409 378 3125 2778100% 100% 100% 100% 100% 100% 100% 100% 100% 100% 100% 100%
Sigma
_________________________________________________________________________________________________________________Proportions/Means: Columns Tested (5% risk level) - A/B - C/D - E/F - G/H - I/J - K/L - A/C/E/G/I/K - B/D/F/H/J/LOverlap formulae used.
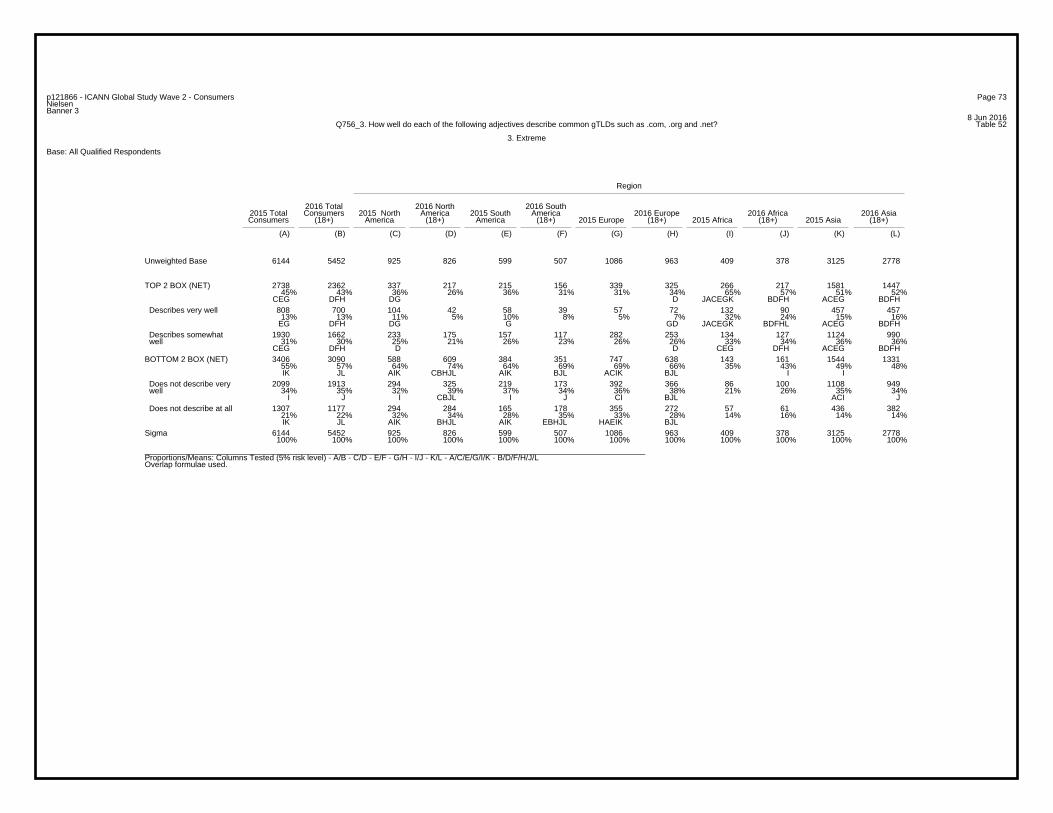
Page 73p121866 - ICANN Global Study Wave 2 - ConsumersNielsenBanner 3
8 Jun 2016Table 52Q756_3. How well do each of the following adjectives describe common gTLDs such as .com, .org and .net?
3. Extreme
Base: All Qualified Respondents
Region
2016 Total 2016 North 2016 South2015 Total Consumers 2015 North America 2015 South America 2016 Europe 2016 Africa 2016 AsiaConsumers (18+) America (18+) America (18+) 2015 Europe (18+) 2015 Africa (18+) 2015 Asia (18+)
(A) (B) (C) (D) (E) (F) (G) (H) (I) (J) (K) (L)
6144 5452 925 826 599 507 1086 963 409 378 3125 2778Unweighted Base
2738 2362 337 217 215 156 339 325 266 217 1581 144745% 43% 36% 26% 36% 31% 31% 34% 65% 57% 51% 52%
CEG DFH DG D JACEGK BDFH ACEG BDFH
TOP 2 BOX (NET)
808 700 104 42 58 39 57 72 132 90 457 45713% 13% 11% 5% 10% 8% 5% 7% 32% 24% 15% 16%
EG DFH DG G GD JACEGK BDFHL ACEG BDFH
Describes very well
1930 1662 233 175 157 117 282 253 134 127 1124 99031% 30% 25% 21% 26% 23% 26% 26% 33% 34% 36% 36%
CEG DFH D D CEG DFH ACEG BDFH
Describes somewhat well
3406 3090 588 609 384 351 747 638 143 161 1544 133155% 57% 64% 74% 64% 69% 69% 66% 35% 43% 49% 48%IK JL AIK CBHJL AIK BJL ACIK BJL I I
BOTTOM 2 BOX (NET)
2099 1913 294 325 219 173 392 366 86 100 1108 94934% 35% 32% 39% 37% 34% 36% 38% 21% 26% 35% 34%
I J I CBJL I J CI BJL ACI J
Does not describe very well
1307 1177 294 284 165 178 355 272 57 61 436 38221% 22% 32% 34% 28% 35% 33% 28% 14% 16% 14% 14%IK JL AIK BHJL AIK EBHJL HAEIK BJL
Does not describe at all
6144 5452 925 826 599 507 1086 963 409 378 3125 2778100% 100% 100% 100% 100% 100% 100% 100% 100% 100% 100% 100%
Sigma
_________________________________________________________________________________________________________________Proportions/Means: Columns Tested (5% risk level) - A/B - C/D - E/F - G/H - I/J - K/L - A/C/E/G/I/K - B/D/F/H/J/LOverlap formulae used.

Page 74p121866 - ICANN Global Study Wave 2 - ConsumersNielsenBanner 3
8 Jun 2016Table 53Q756_4. How well do each of the following adjectives describe common gTLDs such as .com, .org and .net?
4. Trustworthy
Base: All Qualified Respondents
Region
2016 Total 2016 North 2016 South2015 Total Consumers 2015 North America 2015 South America 2016 Europe 2016 Africa 2016 AsiaConsumers (18+) America (18+) America (18+) 2015 Europe (18+) 2015 Africa (18+) 2015 Asia (18+)
(A) (B) (C) (D) (E) (F) (G) (H) (I) (J) (K) (L)
6144 5452 925 826 599 507 1086 963 409 378 3125 2778Unweighted Base
4924 4385 711 626 497 384 814 731 358 332 2544 231280% 80% 77% 76% 83% 76% 75% 76% 88% 88% 81% 83%
CG DFH FCG ACEGK BDFHL ACG BDFH
TOP 2 BOX (NET)
1846 1848 240 227 221 194 195 213 212 188 978 102630% 34% 26% 27% 37% 38% 18% 22% 52% 50% 31% 37%
CG ADH G H ACGK BDH G ACEGK BDFHL ACG KBDH
Describes very well
3078 2537 471 399 276 190 619 518 146 144 1566 128650% 47% 51% 48% 46% 37% 57% 54% 36% 38% 50% 46%
BEI FJ I FJ FI ACEIK BDFJL LI FJ
Describes somewhat well
1220 1067 214 200 102 123 272 232 51 46 581 46620% 20% 23% 24% 17% 24% 25% 24% 12% 12% 19% 17%IK JL AEIK BJL I EBJL AEIK BJL I J
BOTTOM 2 BOX (NET)
926 805 144 137 72 72 190 174 35 33 485 38915% 15% 16% 17% 12% 14% 17% 18% 9% 9% 16% 14%EI J I J J AEI BJL EI J
Does not describe very well
294 262 70 63 30 51 82 58 16 13 96 775% 5% 8% 8% 5% 10% 8% 6% 4% 3% 3% 3%K L AEIK BJL K EBHJL AEIK L
Does not describe at all
6144 5452 925 826 599 507 1086 963 409 378 3125 2778100% 100% 100% 100% 100% 100% 100% 100% 100% 100% 100% 100%
Sigma
_________________________________________________________________________________________________________________Proportions/Means: Columns Tested (5% risk level) - A/B - C/D - E/F - G/H - I/J - K/L - A/C/E/G/I/K - B/D/F/H/J/LOverlap formulae used.
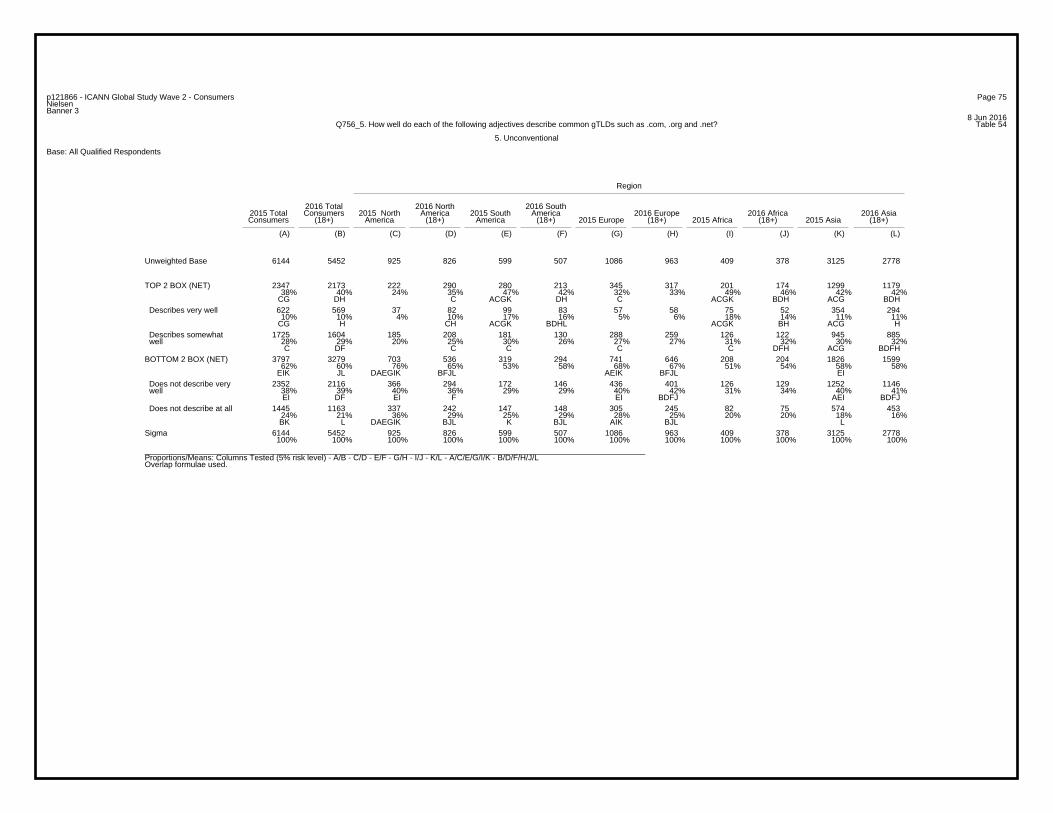
Page 75p121866 - ICANN Global Study Wave 2 - ConsumersNielsenBanner 3
8 Jun 2016Table 54Q756_5. How well do each of the following adjectives describe common gTLDs such as .com, .org and .net?
5. Unconventional
Base: All Qualified Respondents
Region
2016 Total 2016 North 2016 South2015 Total Consumers 2015 North America 2015 South America 2016 Europe 2016 Africa 2016 AsiaConsumers (18+) America (18+) America (18+) 2015 Europe (18+) 2015 Africa (18+) 2015 Asia (18+)
(A) (B) (C) (D) (E) (F) (G) (H) (I) (J) (K) (L)
6144 5452 925 826 599 507 1086 963 409 378 3125 2778Unweighted Base
2347 2173 222 290 280 213 345 317 201 174 1299 117938% 40% 24% 35% 47% 42% 32% 33% 49% 46% 42% 42%
CG DH C ACGK DH C ACGK BDH ACG BDH
TOP 2 BOX (NET)
622 569 37 82 99 83 57 58 75 52 354 29410% 10% 4% 10% 17% 16% 5% 6% 18% 14% 11% 11%
CG H CH ACGK BDHL ACGK BH ACG H
Describes very well
1725 1604 185 208 181 130 288 259 126 122 945 88528% 29% 20% 25% 30% 26% 27% 27% 31% 32% 30% 32%C DF C C C C DFH ACG BDFH
Describes somewhat well
3797 3279 703 536 319 294 741 646 208 204 1826 159962% 60% 76% 65% 53% 58% 68% 67% 51% 54% 58% 58%
EIK JL DAEGIK BFJL AEIK BFJL EI
BOTTOM 2 BOX (NET)
2352 2116 366 294 172 146 436 401 126 129 1252 114638% 39% 40% 36% 29% 29% 40% 42% 31% 34% 40% 41%EI DF EI F EI BDFJ AEI BDFJ
Does not describe very well
1445 1163 337 242 147 148 305 245 82 75 574 45324% 21% 36% 29% 25% 29% 28% 25% 20% 20% 18% 16%BK L DAEGIK BJL K BJL AIK BJL L
Does not describe at all
6144 5452 925 826 599 507 1086 963 409 378 3125 2778100% 100% 100% 100% 100% 100% 100% 100% 100% 100% 100% 100%
Sigma
_________________________________________________________________________________________________________________Proportions/Means: Columns Tested (5% risk level) - A/B - C/D - E/F - G/H - I/J - K/L - A/C/E/G/I/K - B/D/F/H/J/LOverlap formulae used.
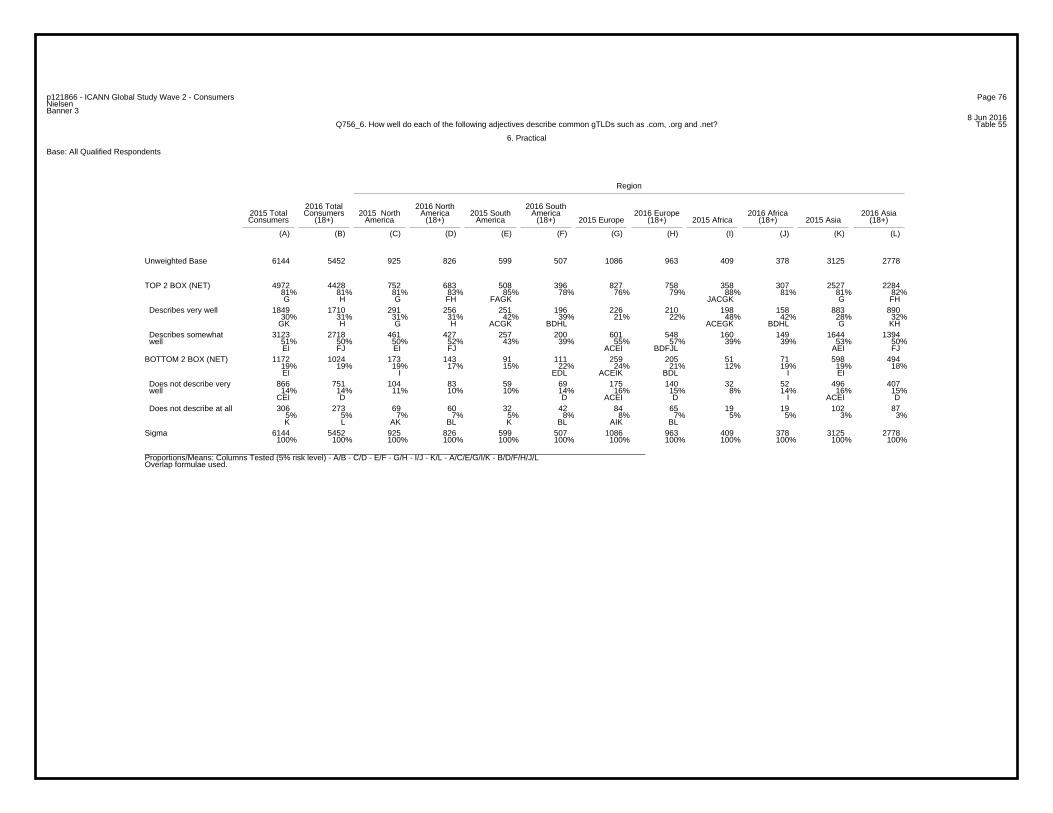
Page 76p121866 - ICANN Global Study Wave 2 - ConsumersNielsenBanner 3
8 Jun 2016Table 55Q756_6. How well do each of the following adjectives describe common gTLDs such as .com, .org and .net?
6. Practical
Base: All Qualified Respondents
Region
2016 Total 2016 North 2016 South2015 Total Consumers 2015 North America 2015 South America 2016 Europe 2016 Africa 2016 AsiaConsumers (18+) America (18+) America (18+) 2015 Europe (18+) 2015 Africa (18+) 2015 Asia (18+)
(A) (B) (C) (D) (E) (F) (G) (H) (I) (J) (K) (L)
6144 5452 925 826 599 507 1086 963 409 378 3125 2778Unweighted Base
4972 4428 752 683 508 396 827 758 358 307 2527 228481% 81% 81% 83% 85% 78% 76% 79% 88% 81% 81% 82%G H G FH FAGK JACGK G FH
TOP 2 BOX (NET)
1849 1710 291 256 251 196 226 210 198 158 883 89030% 31% 31% 31% 42% 39% 21% 22% 48% 42% 28% 32%
GK H G H ACGK BDHL ACEGK BDHL G KH
Describes very well
3123 2718 461 427 257 200 601 548 160 149 1644 139451% 50% 50% 52% 43% 39% 55% 57% 39% 39% 53% 50%EI FJ EI FJ ACEI BDFJL AEI FJ
Describes somewhat well
1172 1024 173 143 91 111 259 205 51 71 598 49419% 19% 19% 17% 15% 22% 24% 21% 12% 19% 19% 18%EI I EDL ACEIK BDL I EI
BOTTOM 2 BOX (NET)
866 751 104 83 59 69 175 140 32 52 496 40714% 14% 11% 10% 10% 14% 16% 15% 8% 14% 16% 15%
CEI D D ACEI D I ACEI D
Does not describe very well
306 273 69 60 32 42 84 65 19 19 102 875% 5% 7% 7% 5% 8% 8% 7% 5% 5% 3% 3%K L AK BL K BL AIK BL
Does not describe at all
6144 5452 925 826 599 507 1086 963 409 378 3125 2778100% 100% 100% 100% 100% 100% 100% 100% 100% 100% 100% 100%
Sigma
_________________________________________________________________________________________________________________Proportions/Means: Columns Tested (5% risk level) - A/B - C/D - E/F - G/H - I/J - K/L - A/C/E/G/I/K - B/D/F/H/J/LOverlap formulae used.
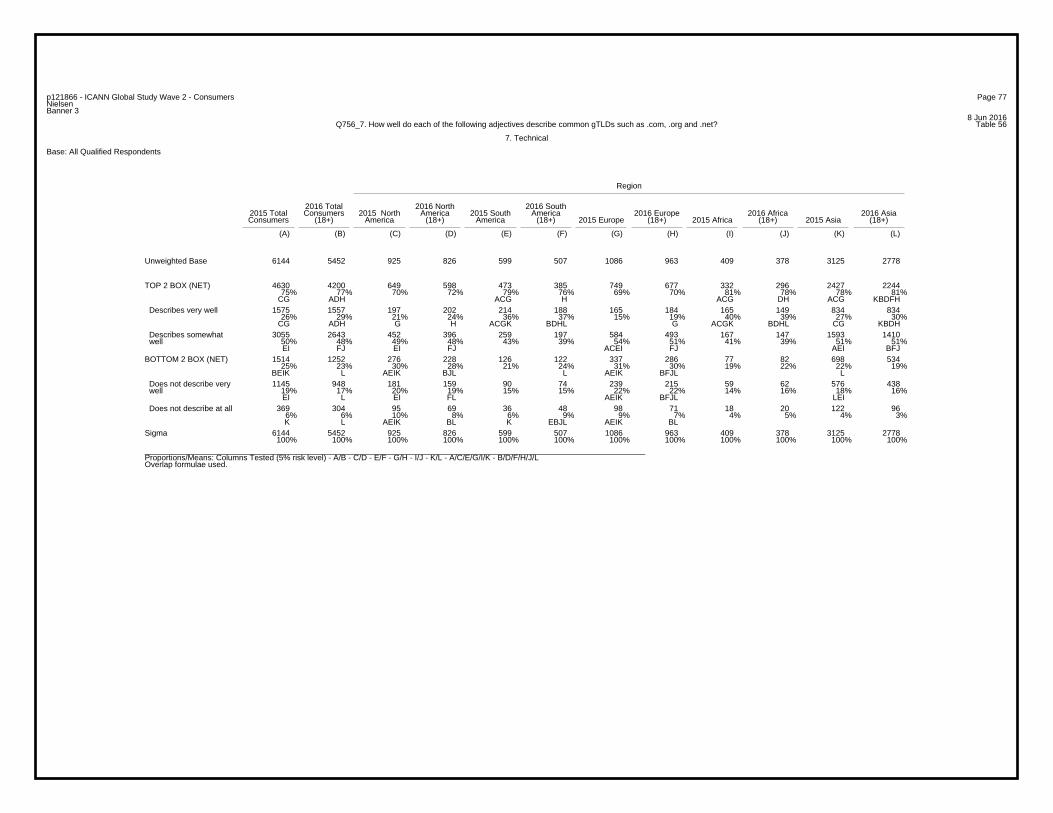
Page 77p121866 - ICANN Global Study Wave 2 - ConsumersNielsenBanner 3
8 Jun 2016Table 56Q756_7. How well do each of the following adjectives describe common gTLDs such as .com, .org and .net?
7. Technical
Base: All Qualified Respondents
Region
2016 Total 2016 North 2016 South2015 Total Consumers 2015 North America 2015 South America 2016 Europe 2016 Africa 2016 AsiaConsumers (18+) America (18+) America (18+) 2015 Europe (18+) 2015 Africa (18+) 2015 Asia (18+)
(A) (B) (C) (D) (E) (F) (G) (H) (I) (J) (K) (L)
6144 5452 925 826 599 507 1086 963 409 378 3125 2778Unweighted Base
4630 4200 649 598 473 385 749 677 332 296 2427 224475% 77% 70% 72% 79% 76% 69% 70% 81% 78% 78% 81%
CG ADH ACG H ACG DH ACG KBDFH
TOP 2 BOX (NET)
1575 1557 197 202 214 188 165 184 165 149 834 83426% 29% 21% 24% 36% 37% 15% 19% 40% 39% 27% 30%
CG ADH G H ACGK BDHL G ACGK BDHL CG KBDH
Describes very well
3055 2643 452 396 259 197 584 493 167 147 1593 141050% 48% 49% 48% 43% 39% 54% 51% 41% 39% 51% 51%EI FJ EI FJ ACEI FJ AEI BFJ
Describes somewhat well
1514 1252 276 228 126 122 337 286 77 82 698 53425% 23% 30% 28% 21% 24% 31% 30% 19% 22% 22% 19%
BEIK L AEIK BJL L AEIK BFJL L
BOTTOM 2 BOX (NET)
1145 948 181 159 90 74 239 215 59 62 576 43819% 17% 20% 19% 15% 15% 22% 22% 14% 16% 18% 16%EI L EI FL AEIK BFJL LEI
Does not describe very well
369 304 95 69 36 48 98 71 18 20 122 966% 6% 10% 8% 6% 9% 9% 7% 4% 5% 4% 3%K L AEIK BL K EBJL AEIK BL
Does not describe at all
6144 5452 925 826 599 507 1086 963 409 378 3125 2778100% 100% 100% 100% 100% 100% 100% 100% 100% 100% 100% 100%
Sigma
_________________________________________________________________________________________________________________Proportions/Means: Columns Tested (5% risk level) - A/B - C/D - E/F - G/H - I/J - K/L - A/C/E/G/I/K - B/D/F/H/J/LOverlap formulae used.

Page 78p121866 - ICANN Global Study Wave 2 - ConsumersNielsenBanner 3
8 Jun 2016Table 57Q756_8. How well do each of the following adjectives describe common gTLDs such as .com, .org and .net?
8. Confusing
Base: All Qualified Respondents
Region
2016 Total 2016 North 2016 South2015 Total Consumers 2015 North America 2015 South America 2016 Europe 2016 Africa 2016 AsiaConsumers (18+) America (18+) America (18+) 2015 Europe (18+) 2015 Africa (18+) 2015 Asia (18+)
(A) (B) (C) (D) (E) (F) (G) (H) (I) (J) (K) (L)
6144 5452 925 826 599 507 1086 963 409 378 3125 2778Unweighted Base
1768 1682 231 234 146 121 293 296 90 91 1008 94029% 31% 25% 28% 24% 24% 27% 31% 22% 24% 32% 34%
CEI AFJ I FJ ACEGI BDFJ
TOP 2 BOX (NET)
436 456 50 58 43 42 62 75 40 37 241 2447% 8% 5% 7% 7% 8% 6% 8% 10% 10% 8% 9%
CG A ACG CG
Describes very well
1332 1226 181 176 103 79 231 221 50 54 767 69622% 22% 20% 21% 17% 16% 21% 23% 12% 14% 25% 25%EI FJ I FJ I EI FJ ACEGI BDFJ
Describes somewhat well
4376 3770 694 592 453 386 793 667 319 287 2117 183871% 69% 75% 72% 76% 76% 73% 69% 78% 76% 68% 66%BK L AK L AK BHL K AGK BHL
BOTTOM 2 BOX (NET)
2395 2100 366 304 220 177 399 377 140 129 1270 111339% 39% 40% 37% 37% 35% 37% 39% 34% 34% 41% 40%
I AGI BFJ
Does not describe very well
1981 1670 328 288 233 209 394 290 179 158 847 72532% 31% 35% 35% 39% 41% 36% 30% 44% 42% 27% 26%K L AK BHL AK BDHL HAK L ACGK BDHL
Does not describe at all
6144 5452 925 826 599 507 1086 963 409 378 3125 2778100% 100% 100% 100% 100% 100% 100% 100% 100% 100% 100% 100%
Sigma
_________________________________________________________________________________________________________________Proportions/Means: Columns Tested (5% risk level) - A/B - C/D - E/F - G/H - I/J - K/L - A/C/E/G/I/K - B/D/F/H/J/LOverlap formulae used.
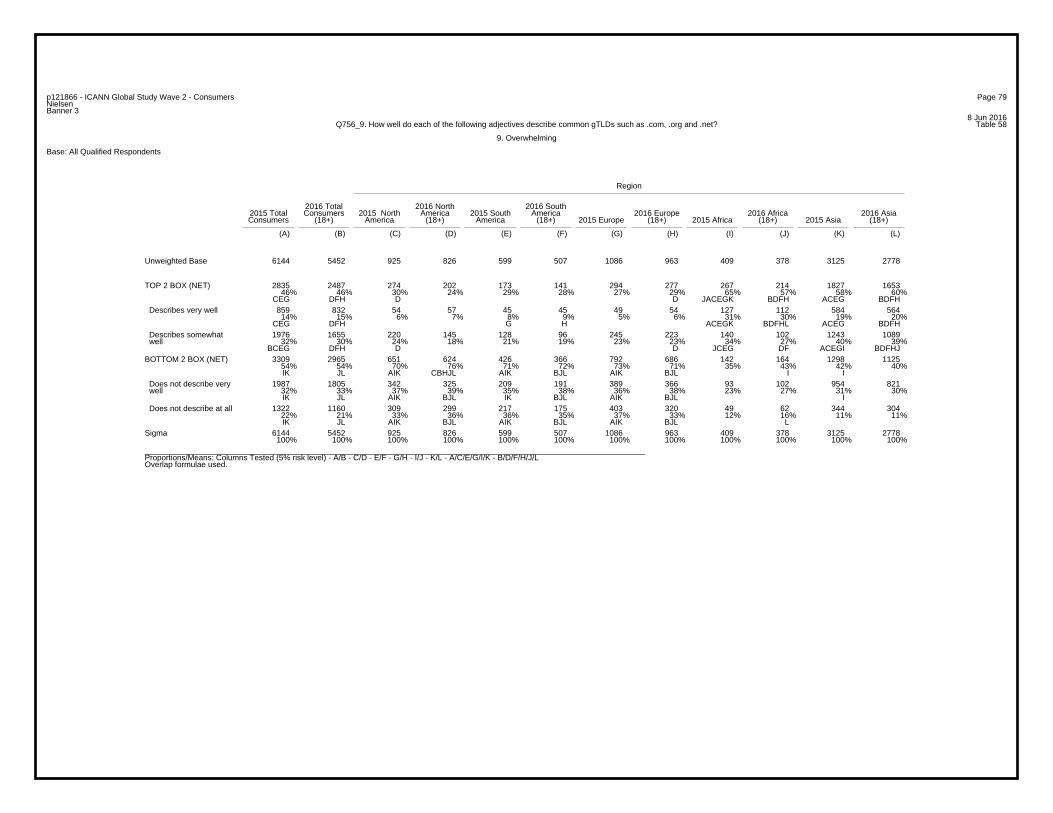
Page 79p121866 - ICANN Global Study Wave 2 - ConsumersNielsenBanner 3
8 Jun 2016Table 58Q756_9. How well do each of the following adjectives describe common gTLDs such as .com, .org and .net?
9. Overwhelming
Base: All Qualified Respondents
Region
2016 Total 2016 North 2016 South2015 Total Consumers 2015 North America 2015 South America 2016 Europe 2016 Africa 2016 AsiaConsumers (18+) America (18+) America (18+) 2015 Europe (18+) 2015 Africa (18+) 2015 Asia (18+)
(A) (B) (C) (D) (E) (F) (G) (H) (I) (J) (K) (L)
6144 5452 925 826 599 507 1086 963 409 378 3125 2778Unweighted Base
2835 2487 274 202 173 141 294 277 267 214 1827 165346% 46% 30% 24% 29% 28% 27% 29% 65% 57% 58% 60%
CEG DFH D D JACEGK BDFH ACEG BDFH
TOP 2 BOX (NET)
859 832 54 57 45 45 49 54 127 112 584 56414% 15% 6% 7% 8% 9% 5% 6% 31% 30% 19% 20%
CEG DFH G H ACEGK BDFHL ACEG BDFH
Describes very well
1976 1655 220 145 128 96 245 223 140 102 1243 108932% 30% 24% 18% 21% 19% 23% 23% 34% 27% 40% 39%
BCEG DFH D D JCEG DF ACEGI BDFHJ
Describes somewhat well
3309 2965 651 624 426 366 792 686 142 164 1298 112554% 54% 70% 76% 71% 72% 73% 71% 35% 43% 42% 40%IK JL AIK CBHJL AIK BJL AIK BJL I I
BOTTOM 2 BOX (NET)
1987 1805 342 325 209 191 389 366 93 102 954 82132% 33% 37% 39% 35% 38% 36% 38% 23% 27% 31% 30%IK JL AIK BJL IK BJL AIK BJL I
Does not describe very well
1322 1160 309 299 217 175 403 320 49 62 344 30422% 21% 33% 36% 36% 35% 37% 33% 12% 16% 11% 11%IK JL AIK BJL AIK BJL AIK BJL L
Does not describe at all
6144 5452 925 826 599 507 1086 963 409 378 3125 2778100% 100% 100% 100% 100% 100% 100% 100% 100% 100% 100% 100%
Sigma
_________________________________________________________________________________________________________________Proportions/Means: Columns Tested (5% risk level) - A/B - C/D - E/F - G/H - I/J - K/L - A/C/E/G/I/K - B/D/F/H/J/LOverlap formulae used.

Page 80p121866 - ICANN Global Study Wave 2 - ConsumersNielsenBanner 3
8 Jun 2016Table 59Q756_10. How well do each of the following adjectives describe common gTLDs such as .com, .org and .net?
10. Useful
Base: All Qualified Respondents
Region
2016 Total 2016 North 2016 South2015 Total Consumers 2015 North America 2015 South America 2016 Europe 2016 Africa 2016 AsiaConsumers (18+) America (18+) America (18+) 2015 Europe (18+) 2015 Africa (18+) 2015 Asia (18+)
(A) (B) (C) (D) (E) (F) (G) (H) (I) (J) (K) (L)
6144 5452 925 826 599 507 1086 963 409 378 3125 2778Unweighted Base
5141 4573 777 689 519 401 845 750 378 341 2622 239284% 84% 84% 83% 87% 79% 78% 78% 92% 90% 84% 86%G FH G FH FAG ACEGK BDFHL G KBFH
TOP 2 BOX (NET)
2191 1945 343 279 264 211 236 211 245 192 1103 105236% 36% 37% 34% 44% 42% 22% 22% 60% 51% 35% 38%G H G H ACGK BDH JACEGK BDFHL G KBDH
Describes very well
2950 2628 434 410 255 190 609 539 133 149 1519 134048% 48% 47% 50% 43% 37% 56% 56% 33% 39% 49% 48%EI FJ I FJ I ACEIK BDFJL I EI FJ
Describes somewhat well
1003 879 148 137 80 106 241 213 31 37 503 38616% 16% 16% 17% 13% 21% 22% 22% 8% 10% 16% 14%EI JL I J I EBDJL ACEIK BDJL LI J
BOTTOM 2 BOX (NET)
728 653 96 87 50 65 156 158 20 26 406 31712% 12% 10% 11% 8% 13% 14% 16% 5% 7% 13% 11%EI J I J I EJ ACEI BDJL ACEI J
Does not describe very well
275 226 52 50 30 41 85 55 11 11 97 694% 4% 6% 6% 5% 8% 8% 6% 3% 3% 3% 2%K L IK BJL K EBJL AEIK BJL
Does not describe at all
6144 5452 925 826 599 507 1086 963 409 378 3125 2778100% 100% 100% 100% 100% 100% 100% 100% 100% 100% 100% 100%
Sigma
_________________________________________________________________________________________________________________Proportions/Means: Columns Tested (5% risk level) - A/B - C/D - E/F - G/H - I/J - K/L - A/C/E/G/I/K - B/D/F/H/J/LOverlap formulae used.

Page 81p121866 - ICANN Global Study Wave 2 - ConsumersNielsenBanner 3
8 Jun 2016Table 60Q756_11. How well do each of the following adjectives describe common gTLDs such as .com, .org and .net?
11. For people like me
Base: All Qualified Respondents
Region
2016 Total 2016 North 2016 South2015 Total Consumers 2015 North America 2015 South America 2016 Europe 2016 Africa 2016 AsiaConsumers (18+) America (18+) America (18+) 2015 Europe (18+) 2015 Africa (18+) 2015 Asia (18+)
(A) (B) (C) (D) (E) (F) (G) (H) (I) (J) (K) (L)
6144 5452 925 826 599 507 1086 963 409 378 3125 2778Unweighted Base
4611 4011 715 592 454 328 747 649 345 295 2350 214775% 74% 77% 72% 76% 65% 69% 67% 84% 78% 75% 77%G FH DG F FG JACEGK BDFH G BDFH
TOP 2 BOX (NET)
1663 1492 259 210 195 160 182 170 211 166 816 78627% 27% 28% 25% 33% 32% 17% 18% 52% 44% 26% 28%G H G H AGK BDH JACEGK BDFHL G H
Describes very well
2948 2519 456 382 259 168 565 479 134 129 1534 136148% 46% 49% 46% 43% 33% 52% 50% 33% 34% 49% 49%EI FJ EI FJ FI AEI BFJ EI BFJ
Describes somewhat well
1533 1441 210 234 145 179 339 314 64 83 775 63125% 26% 23% 28% 24% 35% 31% 33% 16% 22% 25% 23%
I JL I CJL I EBDJL ACEIK BJL I I
BOTTOM 2 BOX (NET)
1072 1024 125 149 85 97 219 211 42 55 601 51217% 19% 14% 18% 14% 19% 20% 22% 10% 15% 19% 18%
CEI J C E ACEI BDJL ACEI
Does not describe very well
461 417 85 85 60 82 120 103 22 28 174 1198% 8% 9% 10% 10% 16% 11% 11% 5% 7% 6% 4%K L AIK BL AIK EBDHJL AIK BL L L
Does not describe at all
6144 5452 925 826 599 507 1086 963 409 378 3125 2778100% 100% 100% 100% 100% 100% 100% 100% 100% 100% 100% 100%
Sigma
_________________________________________________________________________________________________________________Proportions/Means: Columns Tested (5% risk level) - A/B - C/D - E/F - G/H - I/J - K/L - A/C/E/G/I/K - B/D/F/H/J/LOverlap formulae used.

Page 82p121866 - ICANN Global Study Wave 2 - ConsumersNielsenBanner 3
8 Jun 2016Table 61Q756_12. How well do each of the following adjectives describe common gTLDs such as .com, .org and .net?
12. Interesting
Base: All Qualified Respondents
Region
2016 Total 2016 North 2016 South2015 Total Consumers 2015 North America 2015 South America 2016 Europe 2016 Africa 2016 AsiaConsumers (18+) America (18+) America (18+) 2015 Europe (18+) 2015 Africa (18+) 2015 Asia (18+)
(A) (B) (C) (D) (E) (F) (G) (H) (I) (J) (K) (L)
6144 5452 925 826 599 507 1086 963 409 378 3125 2778Unweighted Base
4431 3873 610 525 454 359 732 633 348 292 2287 206472% 71% 66% 64% 76% 71% 67% 66% 85% 77% 73% 74%
CG DH ACG DH JACEGK BDFH CG BDH
TOP 2 BOX (NET)
1465 1314 165 153 171 137 136 156 188 142 805 72624% 24% 18% 19% 29% 27% 13% 16% 46% 38% 26% 26%
CG DH G ACG DH G JACEGK BDFHL ACG BDH
Describes very well
2966 2559 445 372 283 222 596 477 160 150 1482 133848% 47% 48% 45% 47% 44% 55% 50% 39% 40% 47% 48%
I J I I HACEIK FJ I J
Describes somewhat well
1713 1579 315 301 145 148 354 330 61 86 838 71428% 29% 34% 36% 24% 29% 33% 34% 15% 23% 27% 26%EI JL AEIK BFJL I J AEIK BFJL I I
BOTTOM 2 BOX (NET)
1256 1158 214 200 93 84 235 225 41 64 673 58520% 21% 23% 24% 16% 17% 22% 23% 10% 17% 22% 21%EI FJ AEI BFJ I EI FJ I AEI F
Does not describe very well
457 421 101 101 52 64 119 105 20 22 165 1297% 8% 11% 12% 9% 13% 11% 11% 5% 6% 5% 5%
IK L AIK BJL IK EBJL AIK BJL
Does not describe at all
6144 5452 925 826 599 507 1086 963 409 378 3125 2778100% 100% 100% 100% 100% 100% 100% 100% 100% 100% 100% 100%
Sigma
_________________________________________________________________________________________________________________Proportions/Means: Columns Tested (5% risk level) - A/B - C/D - E/F - G/H - I/J - K/L - A/C/E/G/I/K - B/D/F/H/J/LOverlap formulae used.

Page 83p121866 - ICANN Global Study Wave 2 - ConsumersNielsenBanner 3
8 Jun 2016Table 62Q756_13. How well do each of the following adjectives describe common gTLDs such as .com, .org and .net?
13. Exciting
Base: All Qualified Respondents
Region
2016 Total 2016 North 2016 South2015 Total Consumers 2015 North America 2015 South America 2016 Europe 2016 Africa 2016 AsiaConsumers (18+) America (18+) America (18+) 2015 Europe (18+) 2015 Africa (18+) 2015 Asia (18+)
(A) (B) (C) (D) (E) (F) (G) (H) (I) (J) (K) (L)
6144 5452 925 826 599 507 1086 963 409 378 3125 2778Unweighted Base
3358 2916 403 339 319 230 459 396 326 270 1851 168155% 53% 44% 41% 53% 45% 42% 41% 80% 71% 59% 61%
CG DFH FCG JACEGK BDFHL ACEG BDFH
TOP 2 BOX (NET)
1034 952 86 80 94 86 68 89 163 127 623 57017% 17% 9% 10% 16% 17% 6% 9% 40% 34% 20% 21%
CG DH G CG DH G ACEGK BDFHL ACEG BDH
Describes very well
2324 1964 317 259 225 144 391 307 163 143 1228 111138% 36% 34% 31% 38% 28% 36% 32% 40% 38% 39% 40%BC DFH F H DFH AC BDFH
Describes somewhat well
2786 2536 522 487 280 277 627 567 83 108 1274 109745% 47% 56% 59% 47% 55% 58% 59% 20% 29% 41% 39%IK JL AEIK BJL IK EBJL AEIK BJL I I J
BOTTOM 2 BOX (NET)
1867 1691 302 283 172 138 386 370 53 72 954 82830% 31% 33% 34% 29% 27% 36% 38% 13% 19% 31% 30%
I JL I BFJL I J AEIK BFJL I I J
Does not describe very well
919 845 220 204 108 139 241 197 30 36 320 26915% 15% 24% 25% 18% 27% 22% 20% 7% 10% 10% 10%IK JL AEIK BHJL AIK EBHJL AEIK BJL
Does not describe at all
6144 5452 925 826 599 507 1086 963 409 378 3125 2778100% 100% 100% 100% 100% 100% 100% 100% 100% 100% 100% 100%
Sigma
_________________________________________________________________________________________________________________Proportions/Means: Columns Tested (5% risk level) - A/B - C/D - E/F - G/H - I/J - K/L - A/C/E/G/I/K - B/D/F/H/J/LOverlap formulae used.
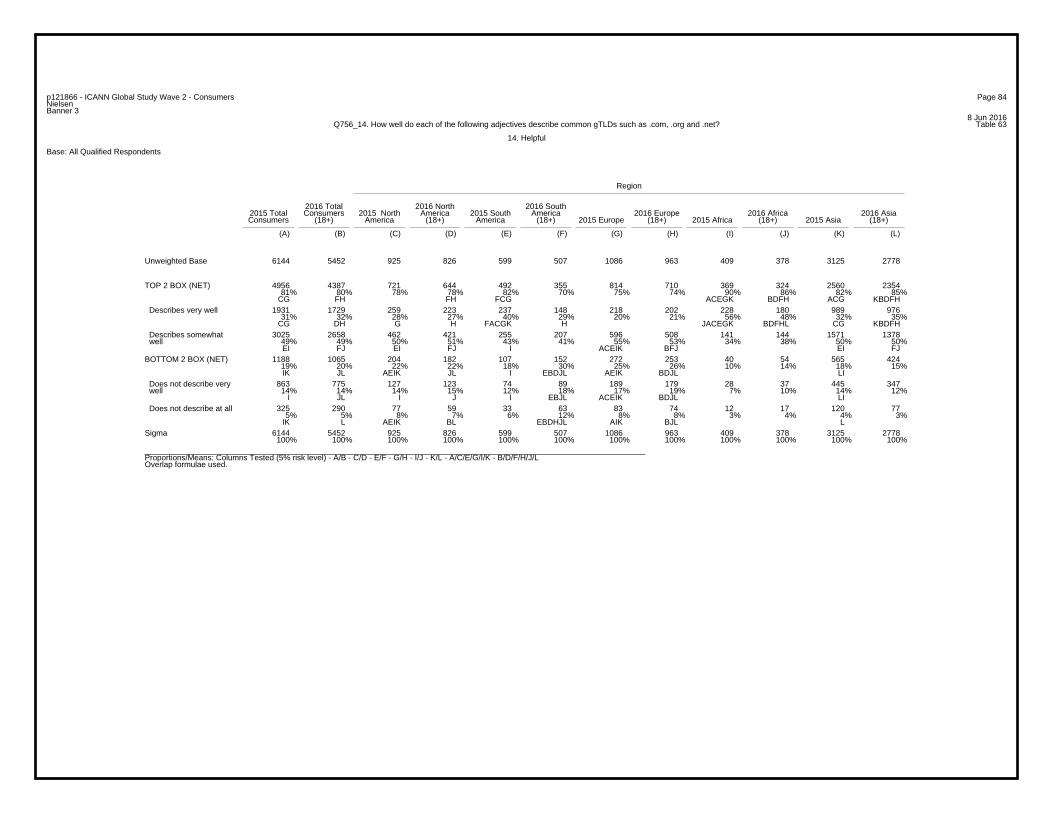
Page 84p121866 - ICANN Global Study Wave 2 - ConsumersNielsenBanner 3
8 Jun 2016Table 63Q756_14. How well do each of the following adjectives describe common gTLDs such as .com, .org and .net?
14. Helpful
Base: All Qualified Respondents
Region
2016 Total 2016 North 2016 South2015 Total Consumers 2015 North America 2015 South America 2016 Europe 2016 Africa 2016 AsiaConsumers (18+) America (18+) America (18+) 2015 Europe (18+) 2015 Africa (18+) 2015 Asia (18+)
(A) (B) (C) (D) (E) (F) (G) (H) (I) (J) (K) (L)
6144 5452 925 826 599 507 1086 963 409 378 3125 2778Unweighted Base
4956 4387 721 644 492 355 814 710 369 324 2560 235481% 80% 78% 78% 82% 70% 75% 74% 90% 86% 82% 85%
CG FH FH FCG ACEGK BDFH ACG KBDFH
TOP 2 BOX (NET)
1931 1729 259 223 237 148 218 202 228 180 989 97631% 32% 28% 27% 40% 29% 20% 21% 56% 48% 32% 35%
CG DH G H FACGK H JACEGK BDFHL CG KBDFH
Describes very well
3025 2658 462 421 255 207 596 508 141 144 1571 137849% 49% 50% 51% 43% 41% 55% 53% 34% 38% 50% 50%EI FJ EI FJ I ACEIK BFJ EI FJ
Describes somewhat well
1188 1065 204 182 107 152 272 253 40 54 565 42419% 20% 22% 22% 18% 30% 25% 26% 10% 14% 18% 15%IK JL AEIK JL I EBDJL AEIK BDJL LI
BOTTOM 2 BOX (NET)
863 775 127 123 74 89 189 179 28 37 445 34714% 14% 14% 15% 12% 18% 17% 19% 7% 10% 14% 12%
I JL I J I EBJL ACEIK BDJL LI
Does not describe very well
325 290 77 59 33 63 83 74 12 17 120 775% 5% 8% 7% 6% 12% 8% 8% 3% 4% 4% 3%
IK L AEIK BL EBDHJL AIK BJL L
Does not describe at all
6144 5452 925 826 599 507 1086 963 409 378 3125 2778100% 100% 100% 100% 100% 100% 100% 100% 100% 100% 100% 100%
Sigma
_________________________________________________________________________________________________________________Proportions/Means: Columns Tested (5% risk level) - A/B - C/D - E/F - G/H - I/J - K/L - A/C/E/G/I/K - B/D/F/H/J/LOverlap formulae used.

Page 85p121866 - ICANN Global Study Wave 2 - ConsumersNielsenBanner 3
8 Jun 2016Table 64Q756_15. How well do each of the following adjectives describe common gTLDs such as .com, .org and .net?
15. Informative
Base: All Qualified Respondents
Region
2016 Total 2016 North 2016 South2015 Total Consumers 2015 North America 2015 South America 2016 Europe 2016 Africa 2016 AsiaConsumers (18+) America (18+) America (18+) 2015 Europe (18+) 2015 Africa (18+) 2015 Asia (18+)
(A) (B) (C) (D) (E) (F) (G) (H) (I) (J) (K) (L)
6144 5452 925 826 599 507 1086 963 409 378 3125 2778Unweighted Base
5069 4483 767 666 513 396 823 747 379 328 2587 234683% 82% 83% 81% 86% 78% 76% 78% 93% 87% 83% 84%G FH G FAG JACEGK BDFH G BDFH
TOP 2 BOX (NET)
2130 1869 308 242 252 202 224 212 247 192 1099 102135% 34% 33% 29% 42% 40% 21% 22% 60% 51% 35% 37%G DH G H ACGK BDH JACEGK BDFHL G BDH
Describes very well
2939 2614 459 424 261 194 599 535 132 136 1488 132548% 48% 50% 51% 44% 38% 55% 56% 32% 36% 48% 48%EI FJ EI BFJ I ACEIK BFJL I FJ
Describes somewhat well
1075 969 158 160 86 111 263 216 30 50 538 43217% 18% 17% 19% 14% 22% 24% 22% 7% 13% 17% 16%EI JL I JL I EBJL ACEIK BJL I I
BOTTOM 2 BOX (NET)
797 715 98 99 56 69 185 154 19 36 439 35713% 13% 11% 12% 9% 14% 17% 16% 5% 10% 14% 13%
CEI J I I E ACEIK BDJL I ACEI
Does not describe very well
278 254 60 61 30 42 78 62 11 14 99 755% 5% 6% 7% 5% 8% 7% 6% 3% 4% 3% 3%K L AIK BJL K EBJL AIK BL
Does not describe at all
6144 5452 925 826 599 507 1086 963 409 378 3125 2778100% 100% 100% 100% 100% 100% 100% 100% 100% 100% 100% 100%
Sigma
_________________________________________________________________________________________________________________Proportions/Means: Columns Tested (5% risk level) - A/B - C/D - E/F - G/H - I/J - K/L - A/C/E/G/I/K - B/D/F/H/J/LOverlap formulae used.
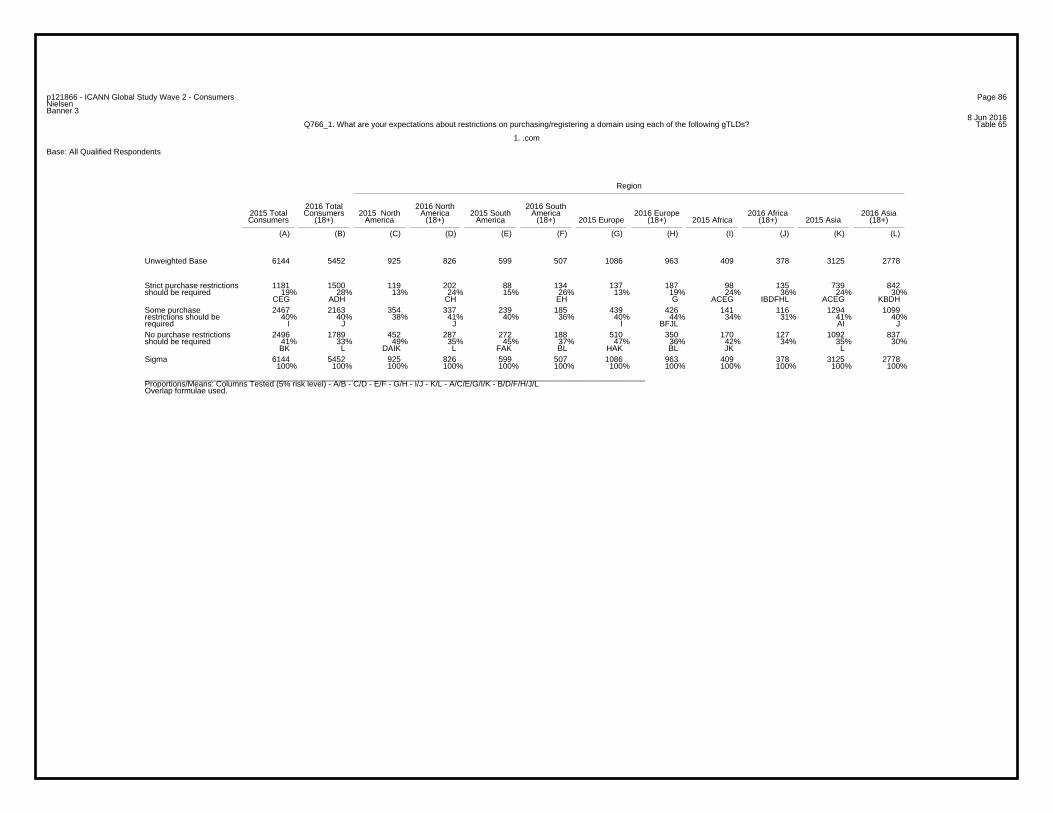
Page 86p121866 - ICANN Global Study Wave 2 - ConsumersNielsenBanner 3
8 Jun 2016Table 65Q766_1. What are your expectations about restrictions on purchasing/registering a domain using each of the following gTLDs?
1. .com
Base: All Qualified Respondents
Region
2016 Total 2016 North 2016 South2015 Total Consumers 2015 North America 2015 South America 2016 Europe 2016 Africa 2016 AsiaConsumers (18+) America (18+) America (18+) 2015 Europe (18+) 2015 Africa (18+) 2015 Asia (18+)
(A) (B) (C) (D) (E) (F) (G) (H) (I) (J) (K) (L)
6144 5452 925 826 599 507 1086 963 409 378 3125 2778Unweighted Base
1181 1500 119 202 88 134 137 187 98 135 739 84219% 28% 13% 24% 15% 26% 13% 19% 24% 36% 24% 30%
CEG ADH CH EH G ACEG IBDFHL ACEG KBDH
Strict purchase restrictionsshould be required
2467 2163 354 337 239 185 439 426 141 116 1294 109940% 40% 38% 41% 40% 36% 40% 44% 34% 31% 41% 40%
I J J I BFJL AI J
Some purchaserestrictions should berequired
2496 1789 452 287 272 188 510 350 170 127 1092 83741% 33% 49% 35% 45% 37% 47% 36% 42% 34% 35% 30%BK L DAIK L FAK BL HAK BL JK L
No purchase restrictionsshould be required
6144 5452 925 826 599 507 1086 963 409 378 3125 2778100% 100% 100% 100% 100% 100% 100% 100% 100% 100% 100% 100%
Sigma
_________________________________________________________________________________________________________________Proportions/Means: Columns Tested (5% risk level) - A/B - C/D - E/F - G/H - I/J - K/L - A/C/E/G/I/K - B/D/F/H/J/LOverlap formulae used.
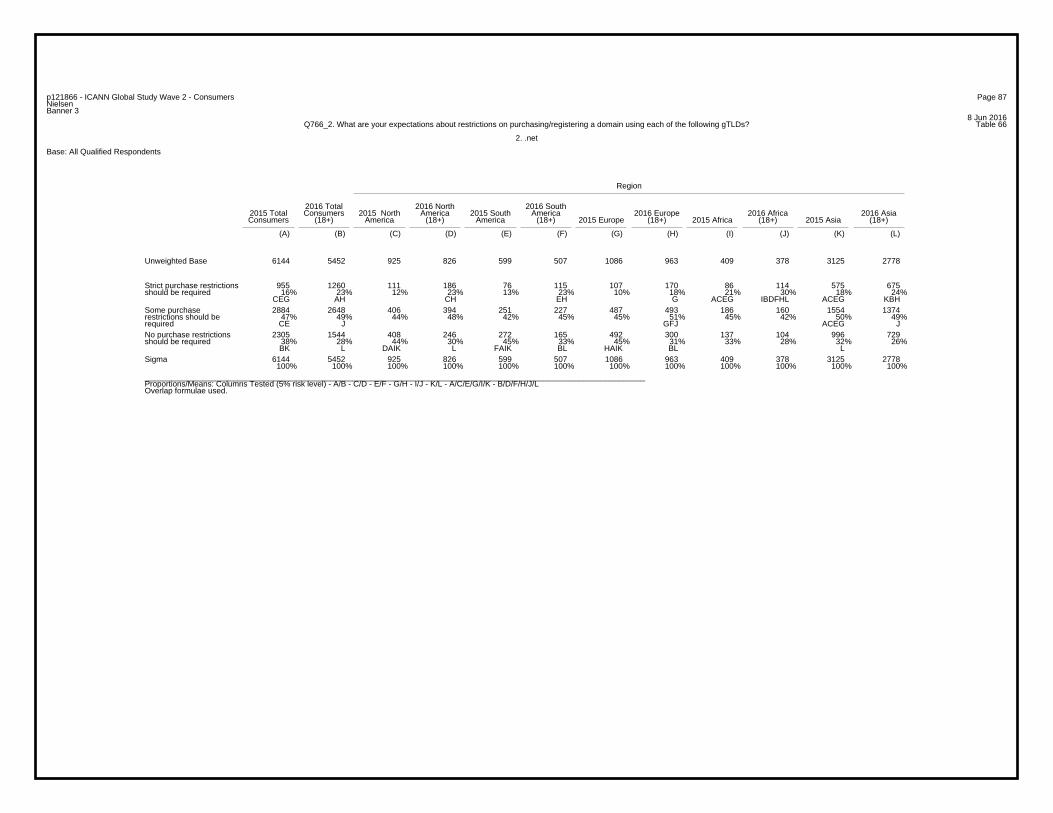
Page 87p121866 - ICANN Global Study Wave 2 - ConsumersNielsenBanner 3
8 Jun 2016Table 66Q766_2. What are your expectations about restrictions on purchasing/registering a domain using each of the following gTLDs?
2. .net
Base: All Qualified Respondents
Region
2016 Total 2016 North 2016 South2015 Total Consumers 2015 North America 2015 South America 2016 Europe 2016 Africa 2016 AsiaConsumers (18+) America (18+) America (18+) 2015 Europe (18+) 2015 Africa (18+) 2015 Asia (18+)
(A) (B) (C) (D) (E) (F) (G) (H) (I) (J) (K) (L)
6144 5452 925 826 599 507 1086 963 409 378 3125 2778Unweighted Base
955 1260 111 186 76 115 107 170 86 114 575 67516% 23% 12% 23% 13% 23% 10% 18% 21% 30% 18% 24%
CEG AH CH EH G ACEG IBDFHL ACEG KBH
Strict purchase restrictionsshould be required
2884 2648 406 394 251 227 487 493 186 160 1554 137447% 49% 44% 48% 42% 45% 45% 51% 45% 42% 50% 49%CE J GFJ ACEG J
Some purchaserestrictions should berequired
2305 1544 408 246 272 165 492 300 137 104 996 72938% 28% 44% 30% 45% 33% 45% 31% 33% 28% 32% 26%BK L DAIK L FAIK BL HAIK BL L
No purchase restrictionsshould be required
6144 5452 925 826 599 507 1086 963 409 378 3125 2778100% 100% 100% 100% 100% 100% 100% 100% 100% 100% 100% 100%
Sigma
_________________________________________________________________________________________________________________Proportions/Means: Columns Tested (5% risk level) - A/B - C/D - E/F - G/H - I/J - K/L - A/C/E/G/I/K - B/D/F/H/J/LOverlap formulae used.
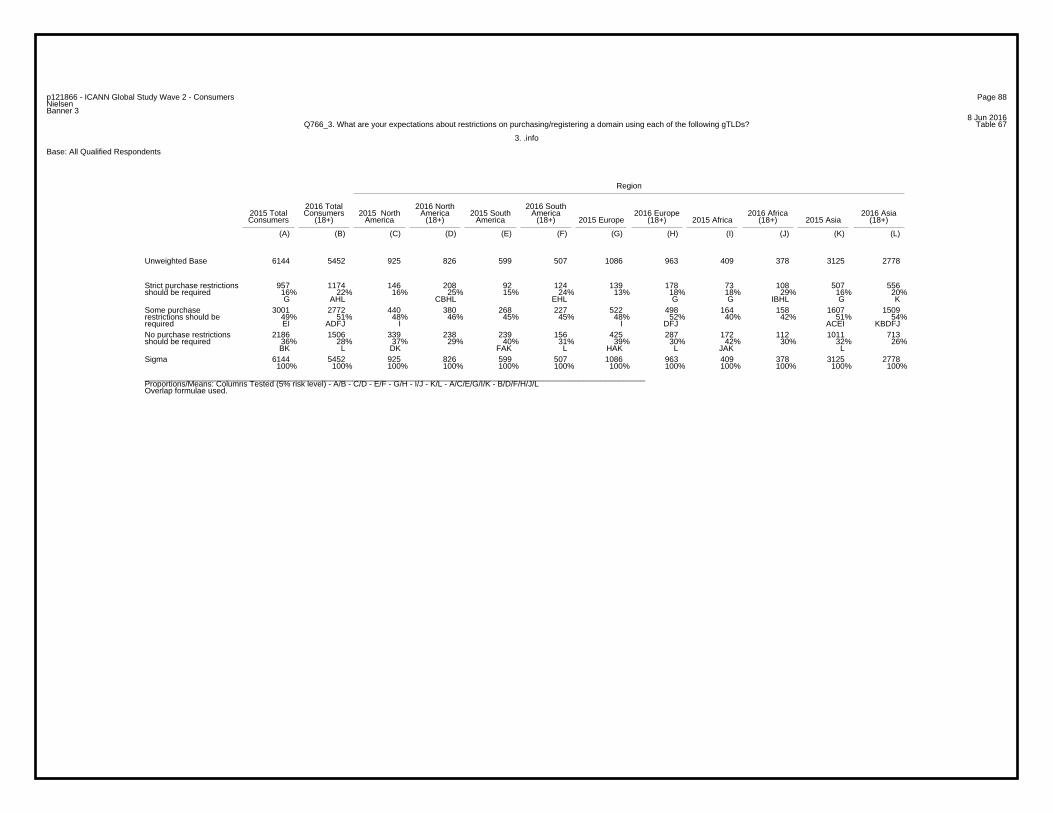
Page 88p121866 - ICANN Global Study Wave 2 - ConsumersNielsenBanner 3
8 Jun 2016Table 67Q766_3. What are your expectations about restrictions on purchasing/registering a domain using each of the following gTLDs?
3. .info
Base: All Qualified Respondents
Region
2016 Total 2016 North 2016 South2015 Total Consumers 2015 North America 2015 South America 2016 Europe 2016 Africa 2016 AsiaConsumers (18+) America (18+) America (18+) 2015 Europe (18+) 2015 Africa (18+) 2015 Asia (18+)
(A) (B) (C) (D) (E) (F) (G) (H) (I) (J) (K) (L)
6144 5452 925 826 599 507 1086 963 409 378 3125 2778Unweighted Base
957 1174 146 208 92 124 139 178 73 108 507 55616% 22% 16% 25% 15% 24% 13% 18% 18% 29% 16% 20%G AHL CBHL EHL G G IBHL G K
Strict purchase restrictionsshould be required
3001 2772 440 380 268 227 522 498 164 158 1607 150949% 51% 48% 46% 45% 45% 48% 52% 40% 42% 51% 54%EI ADFJ I I DFJ ACEI KBDFJ
Some purchaserestrictions should berequired
2186 1506 339 238 239 156 425 287 172 112 1011 71336% 28% 37% 29% 40% 31% 39% 30% 42% 30% 32% 26%BK L DK FAK L HAK L JAK L
No purchase restrictionsshould be required
6144 5452 925 826 599 507 1086 963 409 378 3125 2778100% 100% 100% 100% 100% 100% 100% 100% 100% 100% 100% 100%
Sigma
_________________________________________________________________________________________________________________Proportions/Means: Columns Tested (5% risk level) - A/B - C/D - E/F - G/H - I/J - K/L - A/C/E/G/I/K - B/D/F/H/J/LOverlap formulae used.
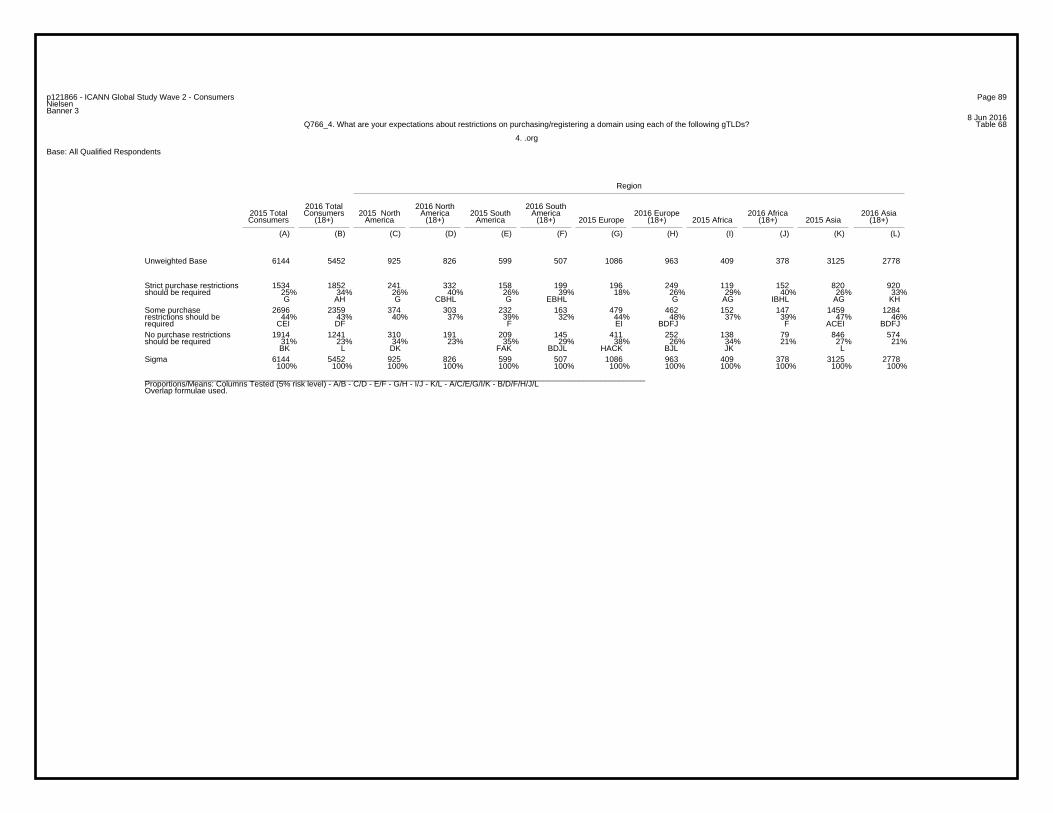
Page 89p121866 - ICANN Global Study Wave 2 - ConsumersNielsenBanner 3
8 Jun 2016Table 68Q766_4. What are your expectations about restrictions on purchasing/registering a domain using each of the following gTLDs?
4. .org
Base: All Qualified Respondents
Region
2016 Total 2016 North 2016 South2015 Total Consumers 2015 North America 2015 South America 2016 Europe 2016 Africa 2016 AsiaConsumers (18+) America (18+) America (18+) 2015 Europe (18+) 2015 Africa (18+) 2015 Asia (18+)
(A) (B) (C) (D) (E) (F) (G) (H) (I) (J) (K) (L)
6144 5452 925 826 599 507 1086 963 409 378 3125 2778Unweighted Base
1534 1852 241 332 158 199 196 249 119 152 820 92025% 34% 26% 40% 26% 39% 18% 26% 29% 40% 26% 33%G AH G CBHL G EBHL G AG IBHL AG KH
Strict purchase restrictionsshould be required
2696 2359 374 303 232 163 479 462 152 147 1459 128444% 43% 40% 37% 39% 32% 44% 48% 37% 39% 47% 46%
CEI DF F EI BDFJ F ACEI BDFJ
Some purchaserestrictions should berequired
1914 1241 310 191 209 145 411 252 138 79 846 57431% 23% 34% 23% 35% 29% 38% 26% 34% 21% 27% 21%BK L DK FAK BDJL HACK BJL JK L
No purchase restrictionsshould be required
6144 5452 925 826 599 507 1086 963 409 378 3125 2778100% 100% 100% 100% 100% 100% 100% 100% 100% 100% 100% 100%
Sigma
_________________________________________________________________________________________________________________Proportions/Means: Columns Tested (5% risk level) - A/B - C/D - E/F - G/H - I/J - K/L - A/C/E/G/I/K - B/D/F/H/J/LOverlap formulae used.

Page 90p121866 - ICANN Global Study Wave 2 - ConsumersNielsenBanner 3
8 Jun 2016Table 69Q766_5. What are your expectations about restrictions on purchasing/registering a domain using each of the following gTLDs?
5. .cn
Base: All Qualified Respondents
Region
2016 Total 2016 North 2016 South2015 Total Consumers 2015 North America 2015 South America 2016 Europe 2016 Africa 2016 AsiaConsumers (18+) America (18+) America (18+) 2015 Europe (18+) 2015 Africa (18+) 2015 Asia (18+)
(A) (B) (C) (D) (E) (F) (G) (H) (I) (J) (K) (L)
1110 996 -** -** -** -** -** -** -** -** 1110 996Unweighted Base
258 299 - - - - - - - - 258 29923% 30% - - - - - - - - 23% 30%
A K
Strict purchase restrictionsshould be required
475 425 - - - - - - - - 475 42543% 43% - - - - - - - - 43% 43%
Some purchaserestrictions should berequired
377 272 - - - - - - - - 377 27234% 27% - - - - - - - - 34% 27%B L
No purchase restrictionsshould be required
1110 996 - - - - - - - - 1110 996100% 100% - - - - - - - - 100% 100%
Sigma
_________________________________________________________________________________________________________________Proportions/Means: Columns Tested (5% risk level) - A/B - C/D - E/F - G/H - I/J - K/L - A/C/E/G/I/K - B/D/F/H/J/LOverlap formulae used. ** very small base (under 30) ineligible for sig testing
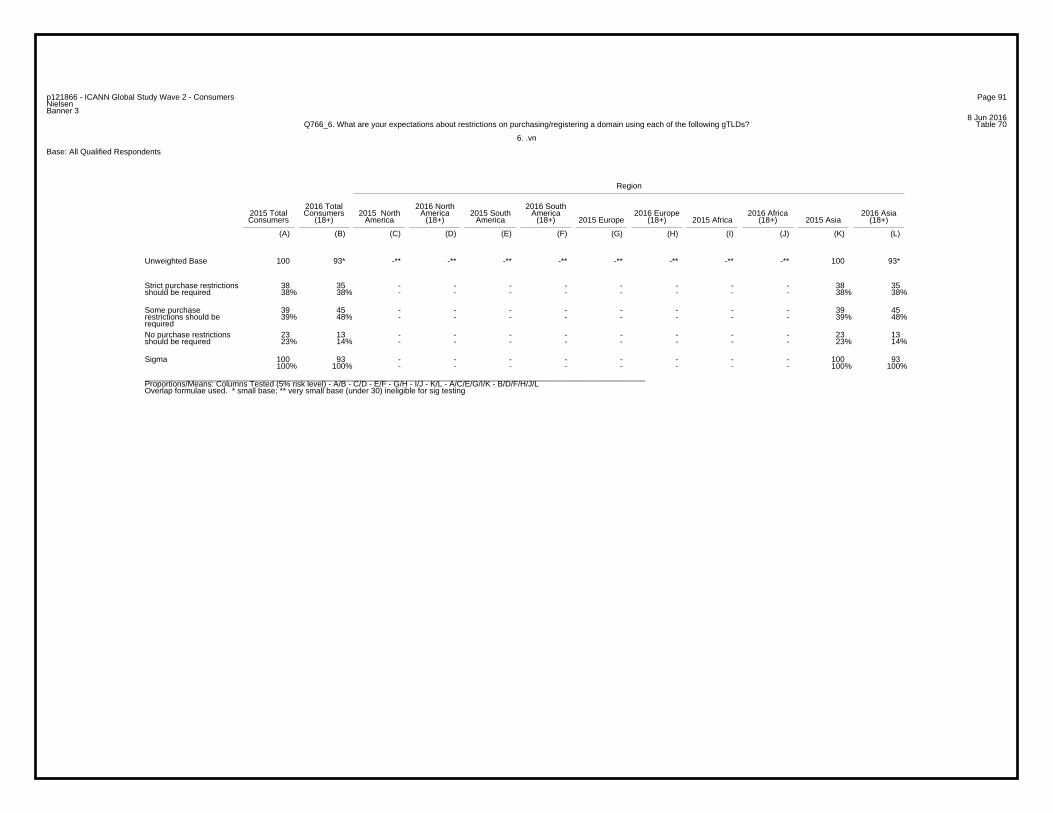
Page 91p121866 - ICANN Global Study Wave 2 - ConsumersNielsenBanner 3
8 Jun 2016Table 70Q766_6. What are your expectations about restrictions on purchasing/registering a domain using each of the following gTLDs?
6. .vn
Base: All Qualified Respondents
Region
2016 Total 2016 North 2016 South2015 Total Consumers 2015 North America 2015 South America 2016 Europe 2016 Africa 2016 AsiaConsumers (18+) America (18+) America (18+) 2015 Europe (18+) 2015 Africa (18+) 2015 Asia (18+)
(A) (B) (C) (D) (E) (F) (G) (H) (I) (J) (K) (L)
100 93* -** -** -** -** -** -** -** -** 100 93*Unweighted Base
38 35 - - - - - - - - 38 3538% 38% - - - - - - - - 38% 38%
Strict purchase restrictionsshould be required
39 45 - - - - - - - - 39 4539% 48% - - - - - - - - 39% 48%
Some purchaserestrictions should berequired
23 13 - - - - - - - - 23 1323% 14% - - - - - - - - 23% 14%
No purchase restrictionsshould be required
100 93 - - - - - - - - 100 93100% 100% - - - - - - - - 100% 100%
Sigma
_________________________________________________________________________________________________________________Proportions/Means: Columns Tested (5% risk level) - A/B - C/D - E/F - G/H - I/J - K/L - A/C/E/G/I/K - B/D/F/H/J/LOverlap formulae used. * small base; ** very small base (under 30) ineligible for sig testing

Page 92p121866 - ICANN Global Study Wave 2 - ConsumersNielsenBanner 3
8 Jun 2016Table 71Q766_7. What are your expectations about restrictions on purchasing/registering a domain using each of the following gTLDs?
7. .ph
Base: All Qualified Respondents
Region
2016 Total 2016 North 2016 South2015 Total Consumers 2015 North America 2015 South America 2016 Europe 2016 Africa 2016 AsiaConsumers (18+) America (18+) America (18+) 2015 Europe (18+) 2015 Africa (18+) 2015 Asia (18+)
(A) (B) (C) (D) (E) (F) (G) (H) (I) (J) (K) (L)
206 184 -** -** -** -** -** -** -** -** 206 184Unweighted Base
63 97 - - - - - - - - 63 9731% 53% - - - - - - - - 31% 53%
A K
Strict purchase restrictionsshould be required
102 67 - - - - - - - - 102 6750% 36% - - - - - - - - 50% 36%B L
Some purchaserestrictions should berequired
41 20 - - - - - - - - 41 2020% 11% - - - - - - - - 20% 11%B L
No purchase restrictionsshould be required
206 184 - - - - - - - - 206 184100% 100% - - - - - - - - 100% 100%
Sigma
_________________________________________________________________________________________________________________Proportions/Means: Columns Tested (5% risk level) - A/B - C/D - E/F - G/H - I/J - K/L - A/C/E/G/I/K - B/D/F/H/J/LOverlap formulae used. ** very small base (under 30) ineligible for sig testing

Page 93p121866 - ICANN Global Study Wave 2 - ConsumersNielsenBanner 3
8 Jun 2016Table 72Q766_8. What are your expectations about restrictions on purchasing/registering a domain using each of the following gTLDs?
8. .jp
Base: All Qualified Respondents
Region
2016 Total 2016 North 2016 South2015 Total Consumers 2015 North America 2015 South America 2016 Europe 2016 Africa 2016 AsiaConsumers (18+) America (18+) America (18+) 2015 Europe (18+) 2015 Africa (18+) 2015 Asia (18+)
(A) (B) (C) (D) (E) (F) (G) (H) (I) (J) (K) (L)
358 315 -** -** -** -** -** -** -** -** 358 315Unweighted Base
56 79 - - - - - - - - 56 7916% 25% - - - - - - - - 16% 25%
A K
Strict purchase restrictionsshould be required
205 149 - - - - - - - - 205 14957% 47% - - - - - - - - 57% 47%B L
Some purchaserestrictions should berequired
97 87 - - - - - - - - 97 8727% 28% - - - - - - - - 27% 28%
No purchase restrictionsshould be required
358 315 - - - - - - - - 358 315100% 100% - - - - - - - - 100% 100%
Sigma
_________________________________________________________________________________________________________________Proportions/Means: Columns Tested (5% risk level) - A/B - C/D - E/F - G/H - I/J - K/L - A/C/E/G/I/K - B/D/F/H/J/LOverlap formulae used. ** very small base (under 30) ineligible for sig testing

Page 94p121866 - ICANN Global Study Wave 2 - ConsumersNielsenBanner 3
8 Jun 2016Table 73Q766_9. What are your expectations about restrictions on purchasing/registering a domain using each of the following gTLDs?
9. .kr
Base: All Qualified Respondents
Region
2016 Total 2016 North 2016 South2015 Total Consumers 2015 North America 2015 South America 2016 Europe 2016 Africa 2016 AsiaConsumers (18+) America (18+) America (18+) 2015 Europe (18+) 2015 Africa (18+) 2015 Asia (18+)
(A) (B) (C) (D) (E) (F) (G) (H) (I) (J) (K) (L)
204 183 -** -** -** -** -** -** -** -** 204 183Unweighted Base
46 59 - - - - - - - - 46 5923% 32% - - - - - - - - 23% 32%
A K
Strict purchase restrictionsshould be required
95 61 - - - - - - - - 95 6147% 33% - - - - - - - - 47% 33%B L
Some purchaserestrictions should berequired
63 63 - - - - - - - - 63 6331% 34% - - - - - - - - 31% 34%
No purchase restrictionsshould be required
204 183 - - - - - - - - 204 183100% 100% - - - - - - - - 100% 100%
Sigma
_________________________________________________________________________________________________________________Proportions/Means: Columns Tested (5% risk level) - A/B - C/D - E/F - G/H - I/J - K/L - A/C/E/G/I/K - B/D/F/H/J/LOverlap formulae used. ** very small base (under 30) ineligible for sig testing
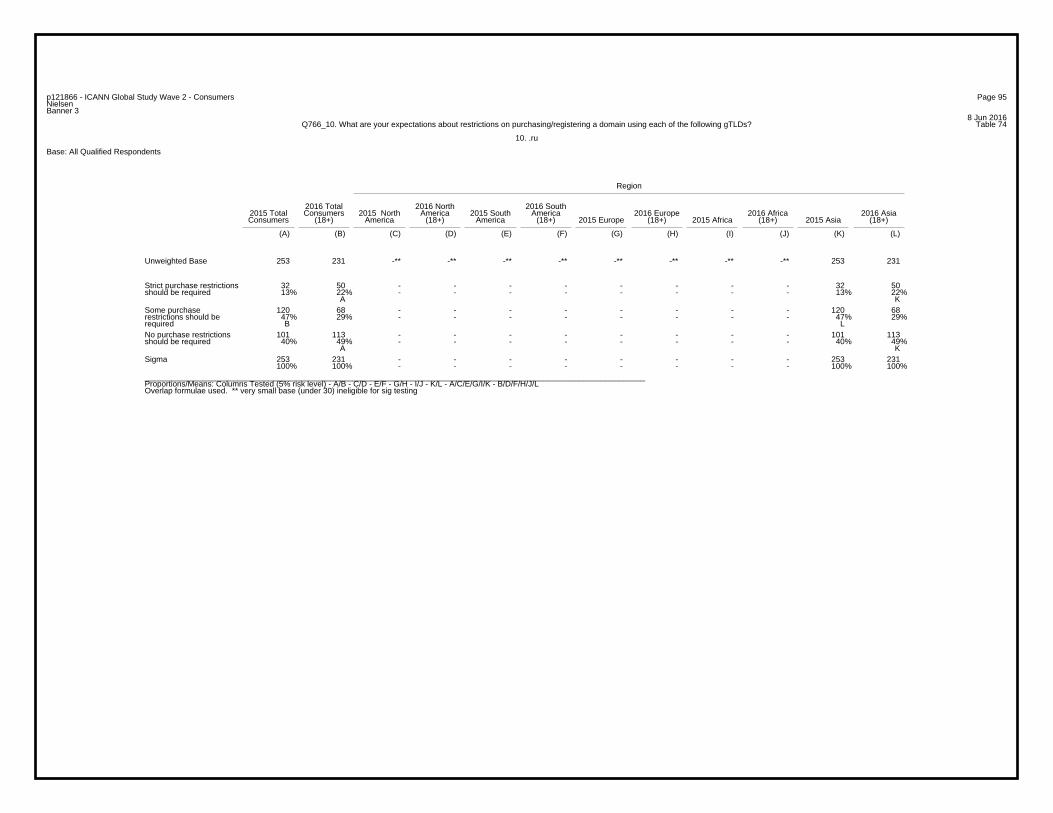
Page 95p121866 - ICANN Global Study Wave 2 - ConsumersNielsenBanner 3
8 Jun 2016Table 74Q766_10. What are your expectations about restrictions on purchasing/registering a domain using each of the following gTLDs?
10. .ru
Base: All Qualified Respondents
Region
2016 Total 2016 North 2016 South2015 Total Consumers 2015 North America 2015 South America 2016 Europe 2016 Africa 2016 AsiaConsumers (18+) America (18+) America (18+) 2015 Europe (18+) 2015 Africa (18+) 2015 Asia (18+)
(A) (B) (C) (D) (E) (F) (G) (H) (I) (J) (K) (L)
253 231 -** -** -** -** -** -** -** -** 253 231Unweighted Base
32 50 - - - - - - - - 32 5013% 22% - - - - - - - - 13% 22%
A K
Strict purchase restrictionsshould be required
120 68 - - - - - - - - 120 6847% 29% - - - - - - - - 47% 29%B L
Some purchaserestrictions should berequired
101 113 - - - - - - - - 101 11340% 49% - - - - - - - - 40% 49%
A K
No purchase restrictionsshould be required
253 231 - - - - - - - - 253 231100% 100% - - - - - - - - 100% 100%
Sigma
_________________________________________________________________________________________________________________Proportions/Means: Columns Tested (5% risk level) - A/B - C/D - E/F - G/H - I/J - K/L - A/C/E/G/I/K - B/D/F/H/J/LOverlap formulae used. ** very small base (under 30) ineligible for sig testing

Page 96p121866 - ICANN Global Study Wave 2 - ConsumersNielsenBanner 3
8 Jun 2016Table 75Q766_11. What are your expectations about restrictions on purchasing/registering a domain using each of the following gTLDs?
11. .in
Base: All Qualified Respondents
Region
2016 Total 2016 North 2016 South2015 Total Consumers 2015 North America 2015 South America 2016 Europe 2016 Africa 2016 AsiaConsumers (18+) America (18+) America (18+) 2015 Europe (18+) 2015 Africa (18+) 2015 Asia (18+)
(A) (B) (C) (D) (E) (F) (G) (H) (I) (J) (K) (L)
687 595 -** -** -** -** -** -** -** -** 687 595Unweighted Base
197 245 - - - - - - - - 197 24529% 41% - - - - - - - - 29% 41%
A K
Strict purchase restrictionsshould be required
300 219 - - - - - - - - 300 21944% 37% - - - - - - - - 44% 37%B L
Some purchaserestrictions should berequired
190 131 - - - - - - - - 190 13128% 22% - - - - - - - - 28% 22%B L
No purchase restrictionsshould be required
687 595 - - - - - - - - 687 595100% 100% - - - - - - - - 100% 100%
Sigma
_________________________________________________________________________________________________________________Proportions/Means: Columns Tested (5% risk level) - A/B - C/D - E/F - G/H - I/J - K/L - A/C/E/G/I/K - B/D/F/H/J/LOverlap formulae used. ** very small base (under 30) ineligible for sig testing

Page 97p121866 - ICANN Global Study Wave 2 - ConsumersNielsenBanner 3
8 Jun 2016Table 76Q766_12. What are your expectations about restrictions on purchasing/registering a domain using each of the following gTLDs?
12. .id
Base: All Qualified Respondents
Region
2016 Total 2016 North 2016 South2015 Total Consumers 2015 North America 2015 South America 2016 Europe 2016 Africa 2016 AsiaConsumers (18+) America (18+) America (18+) 2015 Europe (18+) 2015 Africa (18+) 2015 Asia (18+)
(A) (B) (C) (D) (E) (F) (G) (H) (I) (J) (K) (L)
207 181 -** -** -** -** -** -** -** -** 207 181Unweighted Base
44 52 - - - - - - - - 44 5221% 29% - - - - - - - - 21% 29%
Strict purchase restrictionsshould be required
80 69 - - - - - - - - 80 6939% 38% - - - - - - - - 39% 38%
Some purchaserestrictions should berequired
83 60 - - - - - - - - 83 6040% 33% - - - - - - - - 40% 33%
No purchase restrictionsshould be required
207 181 - - - - - - - - 207 181100% 100% - - - - - - - - 100% 100%
Sigma
_________________________________________________________________________________________________________________Proportions/Means: Columns Tested (5% risk level) - A/B - C/D - E/F - G/H - I/J - K/L - A/C/E/G/I/K - B/D/F/H/J/LOverlap formulae used. ** very small base (under 30) ineligible for sig testing

Page 98p121866 - ICANN Global Study Wave 2 - ConsumersNielsenBanner 3
8 Jun 2016Table 77Q766_13. What are your expectations about restrictions on purchasing/registering a domain using each of the following gTLDs?
13. .ng
Base: All Qualified Respondents
Region
2016 Total 2016 North 2016 South2015 Total Consumers 2015 North America 2015 South America 2016 Europe 2016 Africa 2016 AsiaConsumers (18+) America (18+) America (18+) 2015 Europe (18+) 2015 Africa (18+) 2015 Asia (18+)
(A) (B) (C) (D) (E) (F) (G) (H) (I) (J) (K) (L)
201 192 -** -** -** -** -** -** 201 192 -** -**Unweighted Base
48 74 - - - - - - 48 74 - -24% 39% - - - - - - 24% 39% - -
A I
Strict purchase restrictionsshould be required
79 76 - - - - - - 79 76 - -39% 40% - - - - - - 39% 40% - -
Some purchaserestrictions should berequired
74 42 - - - - - - 74 42 - -37% 22% - - - - - - 37% 22% - - B J
No purchase restrictionsshould be required
201 192 - - - - - - 201 192 - -100% 100% - - - - - - 100% 100% - -
Sigma
_________________________________________________________________________________________________________________Proportions/Means: Columns Tested (5% risk level) - A/B - C/D - E/F - G/H - I/J - K/L - A/C/E/G/I/K - B/D/F/H/J/LOverlap formulae used. ** very small base (under 30) ineligible for sig testing

Page 99p121866 - ICANN Global Study Wave 2 - ConsumersNielsenBanner 3
8 Jun 2016Table 78Q766_14. What are your expectations about restrictions on purchasing/registering a domain using each of the following gTLDs?
14. .za
Base: All Qualified Respondents
Region
2016 Total 2016 North 2016 South2015 Total Consumers 2015 North America 2015 South America 2016 Europe 2016 Africa 2016 AsiaConsumers (18+) America (18+) America (18+) 2015 Europe (18+) 2015 Africa (18+) 2015 Asia (18+)
(A) (B) (C) (D) (E) (F) (G) (H) (I) (J) (K) (L)
105 90* -** -** -** -** -** -** 105 90* -** -**Unweighted Base
22 27 - - - - - - 22 27 - -21% 30% - - - - - - 21% 30% - -
Strict purchase restrictionsshould be required
46 39 - - - - - - 46 39 - -44% 43% - - - - - - 44% 43% - -
Some purchaserestrictions should berequired
37 24 - - - - - - 37 24 - -35% 27% - - - - - - 35% 27% - -
No purchase restrictionsshould be required
105 90 - - - - - - 105 90 - -100% 100% - - - - - - 100% 100% - -
Sigma
_________________________________________________________________________________________________________________Proportions/Means: Columns Tested (5% risk level) - A/B - C/D - E/F - G/H - I/J - K/L - A/C/E/G/I/K - B/D/F/H/J/LOverlap formulae used. * small base; ** very small base (under 30) ineligible for sig testing
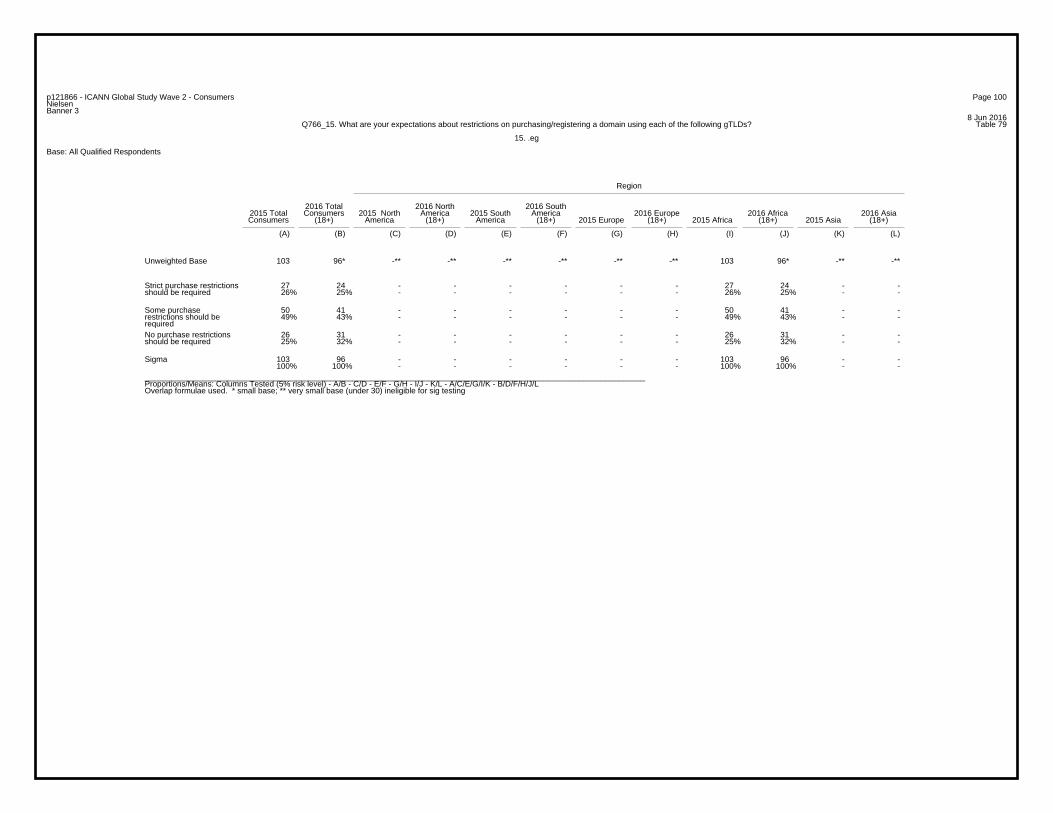
Page 100p121866 - ICANN Global Study Wave 2 - ConsumersNielsenBanner 3
8 Jun 2016Table 79Q766_15. What are your expectations about restrictions on purchasing/registering a domain using each of the following gTLDs?
15. .eg
Base: All Qualified Respondents
Region
2016 Total 2016 North 2016 South2015 Total Consumers 2015 North America 2015 South America 2016 Europe 2016 Africa 2016 AsiaConsumers (18+) America (18+) America (18+) 2015 Europe (18+) 2015 Africa (18+) 2015 Asia (18+)
(A) (B) (C) (D) (E) (F) (G) (H) (I) (J) (K) (L)
103 96* -** -** -** -** -** -** 103 96* -** -**Unweighted Base
27 24 - - - - - - 27 24 - -26% 25% - - - - - - 26% 25% - -
Strict purchase restrictionsshould be required
50 41 - - - - - - 50 41 - -49% 43% - - - - - - 49% 43% - -
Some purchaserestrictions should berequired
26 31 - - - - - - 26 31 - -25% 32% - - - - - - 25% 32% - -
No purchase restrictionsshould be required
103 96 - - - - - - 103 96 - -100% 100% - - - - - - 100% 100% - -
Sigma
_________________________________________________________________________________________________________________Proportions/Means: Columns Tested (5% risk level) - A/B - C/D - E/F - G/H - I/J - K/L - A/C/E/G/I/K - B/D/F/H/J/LOverlap formulae used. * small base; ** very small base (under 30) ineligible for sig testing

Page 101p121866 - ICANN Global Study Wave 2 - ConsumersNielsenBanner 3
8 Jun 2016Table 80Q766_16. What are your expectations about restrictions on purchasing/registering a domain using each of the following gTLDs?
16. .co
Base: All Qualified Respondents
Region
2016 Total 2016 North 2016 South2015 Total Consumers 2015 North America 2015 South America 2016 Europe 2016 Africa 2016 AsiaConsumers (18+) America (18+) America (18+) 2015 Europe (18+) 2015 Africa (18+) 2015 Asia (18+)
(A) (B) (C) (D) (E) (F) (G) (H) (I) (J) (K) (L)
119 93* -** -** 119 93* -** -** -** -** -** -**Unweighted Base
18 24 - - 18 24 - - - - - -15% 26% - - 15% 26% - - - - - -
Strict purchase restrictionsshould be required
41 40 - - 41 40 - - - - - -34% 43% - - 34% 43% - - - - - -
Some purchaserestrictions should berequired
60 29 - - 60 29 - - - - - -50% 31% - - 50% 31% - - - - - - B F
No purchase restrictionsshould be required
119 93 - - 119 93 - - - - - -100% 100% - - 100% 100% - - - - - -
Sigma
_________________________________________________________________________________________________________________Proportions/Means: Columns Tested (5% risk level) - A/B - C/D - E/F - G/H - I/J - K/L - A/C/E/G/I/K - B/D/F/H/J/LOverlap formulae used. * small base; ** very small base (under 30) ineligible for sig testing
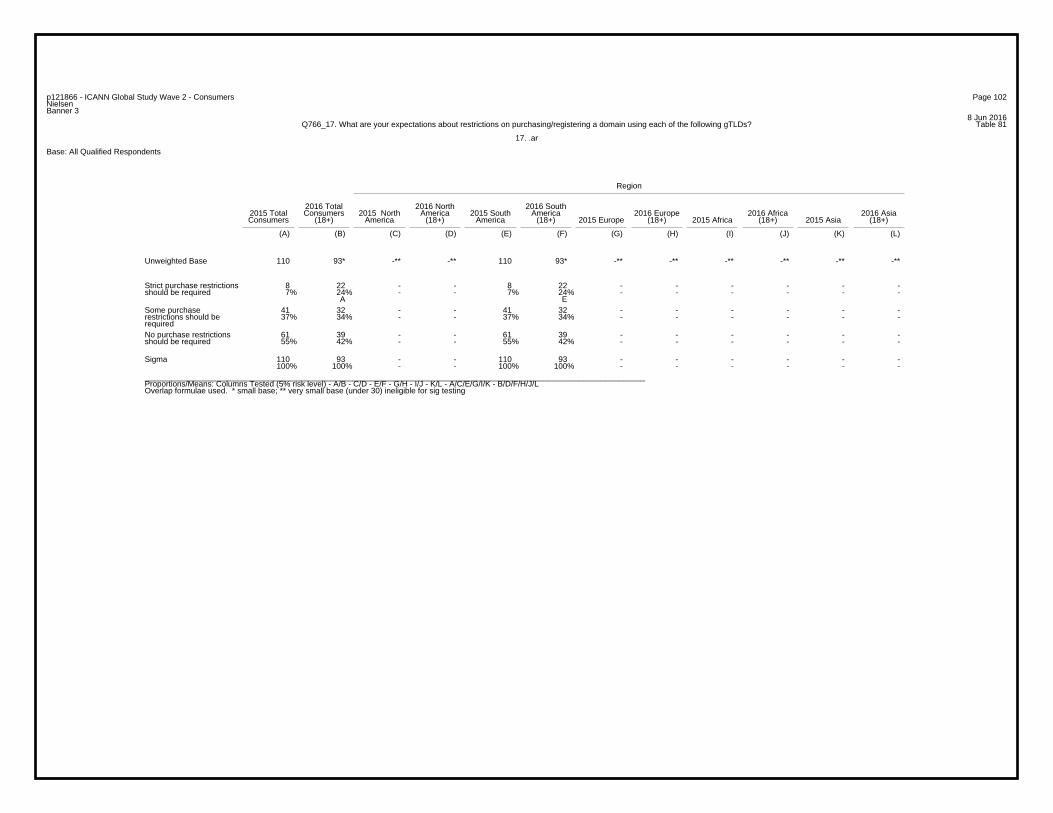
Page 102p121866 - ICANN Global Study Wave 2 - ConsumersNielsenBanner 3
8 Jun 2016Table 81Q766_17. What are your expectations about restrictions on purchasing/registering a domain using each of the following gTLDs?
17. .ar
Base: All Qualified Respondents
Region
2016 Total 2016 North 2016 South2015 Total Consumers 2015 North America 2015 South America 2016 Europe 2016 Africa 2016 AsiaConsumers (18+) America (18+) America (18+) 2015 Europe (18+) 2015 Africa (18+) 2015 Asia (18+)
(A) (B) (C) (D) (E) (F) (G) (H) (I) (J) (K) (L)
110 93* -** -** 110 93* -** -** -** -** -** -**Unweighted Base
8 22 - - 8 22 - - - - - -7% 24% - - 7% 24% - - - - - -
A E
Strict purchase restrictionsshould be required
41 32 - - 41 32 - - - - - -37% 34% - - 37% 34% - - - - - -
Some purchaserestrictions should berequired
61 39 - - 61 39 - - - - - -55% 42% - - 55% 42% - - - - - -
No purchase restrictionsshould be required
110 93 - - 110 93 - - - - - -100% 100% - - 100% 100% - - - - - -
Sigma
_________________________________________________________________________________________________________________Proportions/Means: Columns Tested (5% risk level) - A/B - C/D - E/F - G/H - I/J - K/L - A/C/E/G/I/K - B/D/F/H/J/LOverlap formulae used. * small base; ** very small base (under 30) ineligible for sig testing

Page 103p121866 - ICANN Global Study Wave 2 - ConsumersNielsenBanner 3
8 Jun 2016Table 82Q766_18. What are your expectations about restrictions on purchasing/registering a domain using each of the following gTLDs?
18. .br
Base: All Qualified Respondents
Region
2016 Total 2016 North 2016 South2015 Total Consumers 2015 North America 2015 South America 2016 Europe 2016 Africa 2016 AsiaConsumers (18+) America (18+) America (18+) 2015 Europe (18+) 2015 Africa (18+) 2015 Asia (18+)
(A) (B) (C) (D) (E) (F) (G) (H) (I) (J) (K) (L)
370 321 -** -** 370 321 -** -** -** -** -** -**Unweighted Base
60 88 - - 60 88 - - - - - -16% 27% - - 16% 27% - - - - - -
A E
Strict purchase restrictionsshould be required
178 117 - - 178 117 - - - - - -48% 36% - - 48% 36% - - - - - - B F
Some purchaserestrictions should berequired
132 116 - - 132 116 - - - - - -36% 36% - - 36% 36% - - - - - -
No purchase restrictionsshould be required
370 321 - - 370 321 - - - - - -100% 100% - - 100% 100% - - - - - -
Sigma
_________________________________________________________________________________________________________________Proportions/Means: Columns Tested (5% risk level) - A/B - C/D - E/F - G/H - I/J - K/L - A/C/E/G/I/K - B/D/F/H/J/LOverlap formulae used. ** very small base (under 30) ineligible for sig testing

Page 104p121866 - ICANN Global Study Wave 2 - ConsumersNielsenBanner 3
8 Jun 2016Table 83Q766_19. What are your expectations about restrictions on purchasing/registering a domain using each of the following gTLDs?
19. .it
Base: All Qualified Respondents
Region
2016 Total 2016 North 2016 South2015 Total Consumers 2015 North America 2015 South America 2016 Europe 2016 Africa 2016 AsiaConsumers (18+) America (18+) America (18+) 2015 Europe (18+) 2015 Africa (18+) 2015 Asia (18+)
(A) (B) (C) (D) (E) (F) (G) (H) (I) (J) (K) (L)
101 90* -** -** -** -** 101 90* -** -** -** -**Unweighted Base
11 15 - - - - 11 15 - - - -11% 17% - - - - 11% 17% - - - -
Strict purchase restrictionsshould be required
32 41 - - - - 32 41 - - - -32% 46% - - - - 32% 46% - - - -
Some purchaserestrictions should berequired
58 34 - - - - 58 34 - - - -57% 38% - - - - 57% 38% - - - - B H
No purchase restrictionsshould be required
101 90 - - - - 101 90 - - - -100% 100% - - - - 100% 100% - - - -
Sigma
_________________________________________________________________________________________________________________Proportions/Means: Columns Tested (5% risk level) - A/B - C/D - E/F - G/H - I/J - K/L - A/C/E/G/I/K - B/D/F/H/J/LOverlap formulae used. * small base; ** very small base (under 30) ineligible for sig testing

Page 105p121866 - ICANN Global Study Wave 2 - ConsumersNielsenBanner 3
8 Jun 2016Table 84Q766_20. What are your expectations about restrictions on purchasing/registering a domain using each of the following gTLDs?
20. .tr
Base: All Qualified Respondents
Region
2016 Total 2016 North 2016 South2015 Total Consumers 2015 North America 2015 South America 2016 Europe 2016 Africa 2016 AsiaConsumers (18+) America (18+) America (18+) 2015 Europe (18+) 2015 Africa (18+) 2015 Asia (18+)
(A) (B) (C) (D) (E) (F) (G) (H) (I) (J) (K) (L)
102 95* -** -** -** -** 102 95* -** -** -** -**Unweighted Base
18 37 - - - - 18 37 - - - -18% 39% - - - - 18% 39% - - - -
A G
Strict purchase restrictionsshould be required
42 35 - - - - 42 35 - - - -41% 37% - - - - 41% 37% - - - -
Some purchaserestrictions should berequired
42 23 - - - - 42 23 - - - -41% 24% - - - - 41% 24% - - - - B H
No purchase restrictionsshould be required
102 95 - - - - 102 95 - - - -100% 100% - - - - 100% 100% - - - -
Sigma
_________________________________________________________________________________________________________________Proportions/Means: Columns Tested (5% risk level) - A/B - C/D - E/F - G/H - I/J - K/L - A/C/E/G/I/K - B/D/F/H/J/LOverlap formulae used. * small base; ** very small base (under 30) ineligible for sig testing

Page 106p121866 - ICANN Global Study Wave 2 - ConsumersNielsenBanner 3
8 Jun 2016Table 85Q766_21. What are your expectations about restrictions on purchasing/registering a domain using each of the following gTLDs?
21. .es
Base: All Qualified Respondents
Region
2016 Total 2016 North 2016 South2015 Total Consumers 2015 North America 2015 South America 2016 Europe 2016 Africa 2016 AsiaConsumers (18+) America (18+) America (18+) 2015 Europe (18+) 2015 Africa (18+) 2015 Asia (18+)
(A) (B) (C) (D) (E) (F) (G) (H) (I) (J) (K) (L)
100 97* -** -** -** -** 100 97* -** -** -** -**Unweighted Base
12 15 - - - - 12 15 - - - -12% 15% - - - - 12% 15% - - - -
Strict purchase restrictionsshould be required
48 49 - - - - 48 49 - - - -48% 51% - - - - 48% 51% - - - -
Some purchaserestrictions should berequired
40 33 - - - - 40 33 - - - -40% 34% - - - - 40% 34% - - - -
No purchase restrictionsshould be required
100 97 - - - - 100 97 - - - -100% 100% - - - - 100% 100% - - - -
Sigma
_________________________________________________________________________________________________________________Proportions/Means: Columns Tested (5% risk level) - A/B - C/D - E/F - G/H - I/J - K/L - A/C/E/G/I/K - B/D/F/H/J/LOverlap formulae used. * small base; ** very small base (under 30) ineligible for sig testing
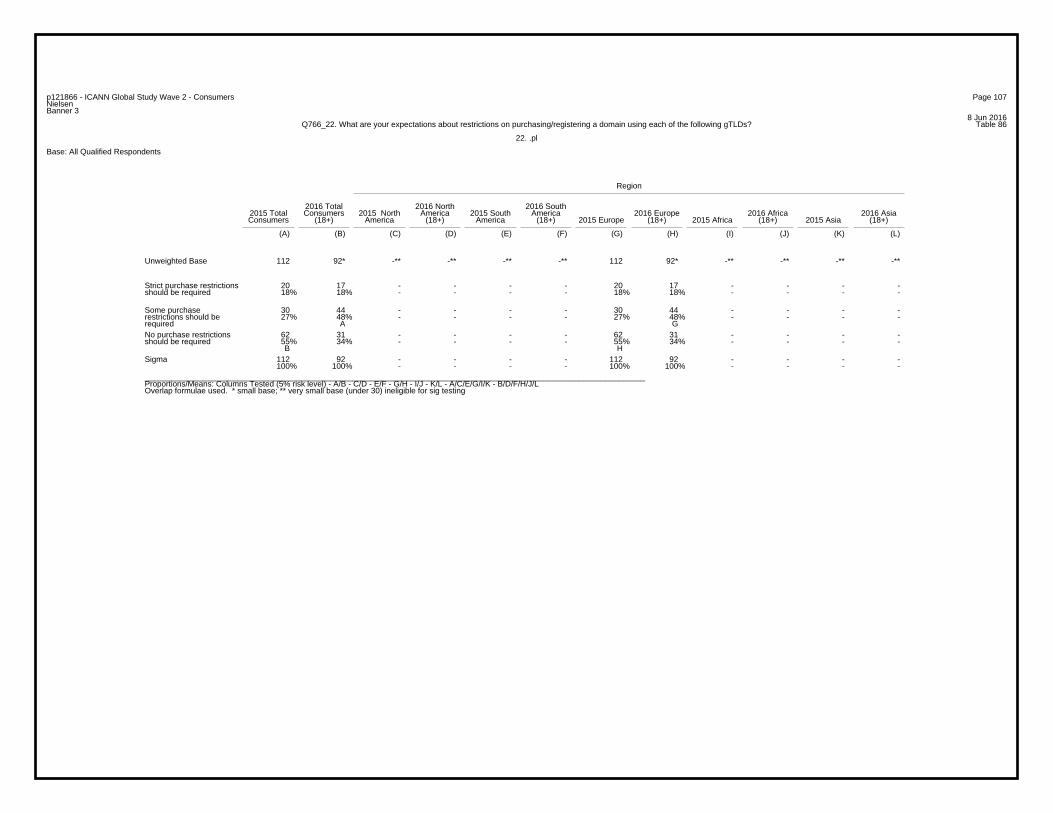
Page 107p121866 - ICANN Global Study Wave 2 - ConsumersNielsenBanner 3
8 Jun 2016Table 86Q766_22. What are your expectations about restrictions on purchasing/registering a domain using each of the following gTLDs?
22. .pl
Base: All Qualified Respondents
Region
2016 Total 2016 North 2016 South2015 Total Consumers 2015 North America 2015 South America 2016 Europe 2016 Africa 2016 AsiaConsumers (18+) America (18+) America (18+) 2015 Europe (18+) 2015 Africa (18+) 2015 Asia (18+)
(A) (B) (C) (D) (E) (F) (G) (H) (I) (J) (K) (L)
112 92* -** -** -** -** 112 92* -** -** -** -**Unweighted Base
20 17 - - - - 20 17 - - - -18% 18% - - - - 18% 18% - - - -
Strict purchase restrictionsshould be required
30 44 - - - - 30 44 - - - -27% 48% - - - - 27% 48% - - - -
A G
Some purchaserestrictions should berequired
62 31 - - - - 62 31 - - - -55% 34% - - - - 55% 34% - - - - B H
No purchase restrictionsshould be required
112 92 - - - - 112 92 - - - -100% 100% - - - - 100% 100% - - - -
Sigma
_________________________________________________________________________________________________________________Proportions/Means: Columns Tested (5% risk level) - A/B - C/D - E/F - G/H - I/J - K/L - A/C/E/G/I/K - B/D/F/H/J/LOverlap formulae used. * small base; ** very small base (under 30) ineligible for sig testing

Page 108p121866 - ICANN Global Study Wave 2 - ConsumersNielsenBanner 3
8 Jun 2016Table 87Q766_23. What are your expectations about restrictions on purchasing/registering a domain using each of the following gTLDs?
23. .uk
Base: All Qualified Respondents
Region
2016 Total 2016 North 2016 South2015 Total Consumers 2015 North America 2015 South America 2016 Europe 2016 Africa 2016 AsiaConsumers (18+) America (18+) America (18+) 2015 Europe (18+) 2015 Africa (18+) 2015 Asia (18+)
(A) (B) (C) (D) (E) (F) (G) (H) (I) (J) (K) (L)
220 180 -** -** -** -** 220 180 -** -** -** -**Unweighted Base
45 51 - - - - 45 51 - - - -20% 28% - - - - 20% 28% - - - -
Strict purchase restrictionsshould be required
90 82 - - - - 90 82 - - - -41% 46% - - - - 41% 46% - - - -
Some purchaserestrictions should berequired
85 47 - - - - 85 47 - - - -39% 26% - - - - 39% 26% - - - - B H
No purchase restrictionsshould be required
220 180 - - - - 220 180 - - - -100% 100% - - - - 100% 100% - - - -
Sigma
_________________________________________________________________________________________________________________Proportions/Means: Columns Tested (5% risk level) - A/B - C/D - E/F - G/H - I/J - K/L - A/C/E/G/I/K - B/D/F/H/J/LOverlap formulae used. ** very small base (under 30) ineligible for sig testing
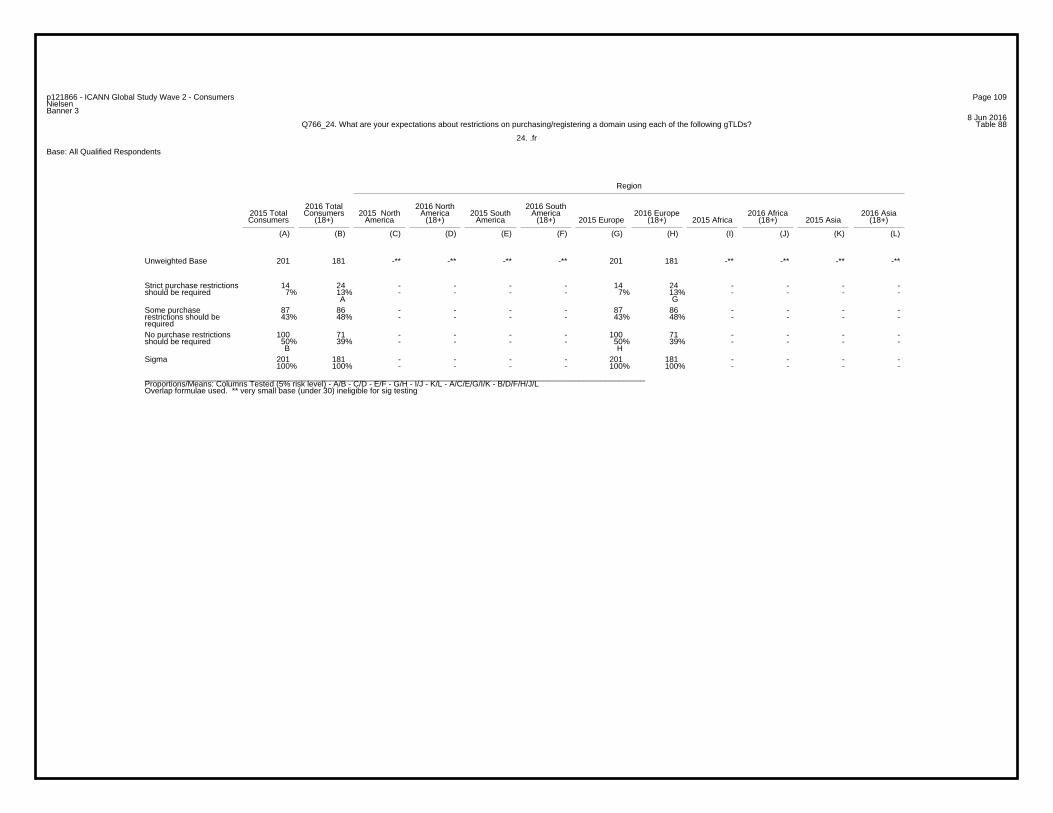
Page 109p121866 - ICANN Global Study Wave 2 - ConsumersNielsenBanner 3
8 Jun 2016Table 88Q766_24. What are your expectations about restrictions on purchasing/registering a domain using each of the following gTLDs?
24. .fr
Base: All Qualified Respondents
Region
2016 Total 2016 North 2016 South2015 Total Consumers 2015 North America 2015 South America 2016 Europe 2016 Africa 2016 AsiaConsumers (18+) America (18+) America (18+) 2015 Europe (18+) 2015 Africa (18+) 2015 Asia (18+)
(A) (B) (C) (D) (E) (F) (G) (H) (I) (J) (K) (L)
201 181 -** -** -** -** 201 181 -** -** -** -**Unweighted Base
14 24 - - - - 14 24 - - - -7% 13% - - - - 7% 13% - - - -
A G
Strict purchase restrictionsshould be required
87 86 - - - - 87 86 - - - -43% 48% - - - - 43% 48% - - - -
Some purchaserestrictions should berequired
100 71 - - - - 100 71 - - - -50% 39% - - - - 50% 39% - - - - B H
No purchase restrictionsshould be required
201 181 - - - - 201 181 - - - -100% 100% - - - - 100% 100% - - - -
Sigma
_________________________________________________________________________________________________________________Proportions/Means: Columns Tested (5% risk level) - A/B - C/D - E/F - G/H - I/J - K/L - A/C/E/G/I/K - B/D/F/H/J/LOverlap formulae used. ** very small base (under 30) ineligible for sig testing
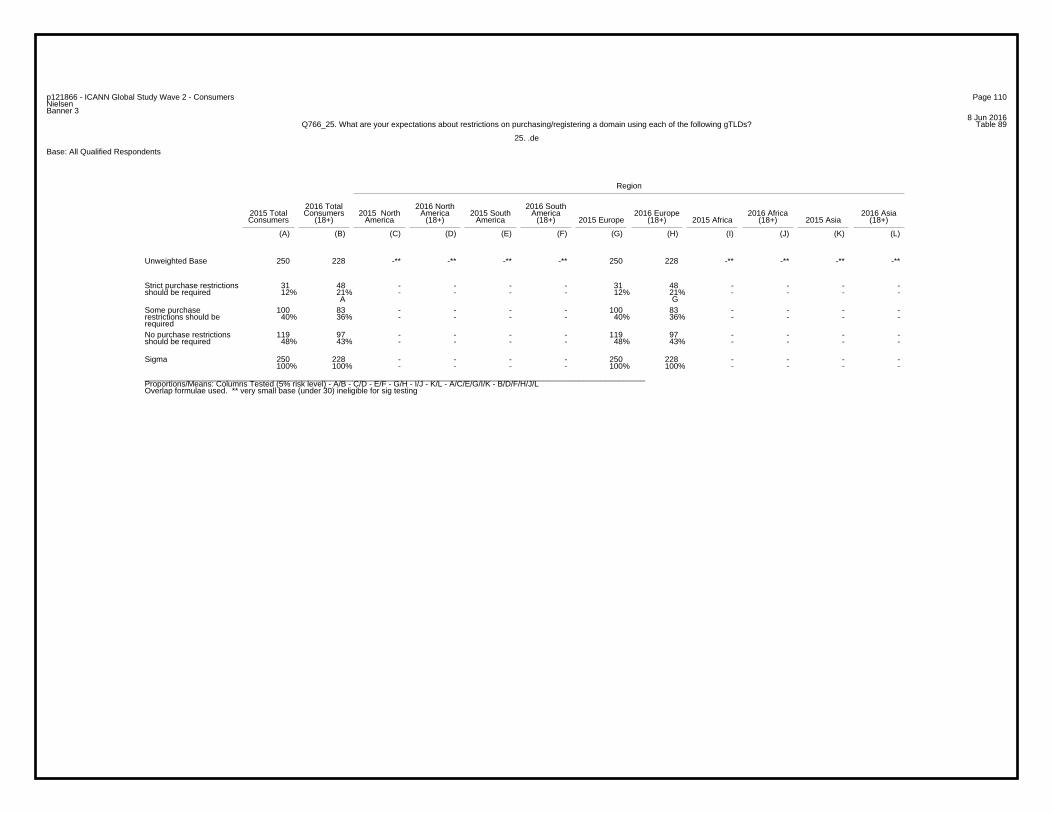
Page 110p121866 - ICANN Global Study Wave 2 - ConsumersNielsenBanner 3
8 Jun 2016Table 89Q766_25. What are your expectations about restrictions on purchasing/registering a domain using each of the following gTLDs?
25. .de
Base: All Qualified Respondents
Region
2016 Total 2016 North 2016 South2015 Total Consumers 2015 North America 2015 South America 2016 Europe 2016 Africa 2016 AsiaConsumers (18+) America (18+) America (18+) 2015 Europe (18+) 2015 Africa (18+) 2015 Asia (18+)
(A) (B) (C) (D) (E) (F) (G) (H) (I) (J) (K) (L)
250 228 -** -** -** -** 250 228 -** -** -** -**Unweighted Base
31 48 - - - - 31 48 - - - -12% 21% - - - - 12% 21% - - - -
A G
Strict purchase restrictionsshould be required
100 83 - - - - 100 83 - - - -40% 36% - - - - 40% 36% - - - -
Some purchaserestrictions should berequired
119 97 - - - - 119 97 - - - -48% 43% - - - - 48% 43% - - - -
No purchase restrictionsshould be required
250 228 - - - - 250 228 - - - -100% 100% - - - - 100% 100% - - - -
Sigma
_________________________________________________________________________________________________________________Proportions/Means: Columns Tested (5% risk level) - A/B - C/D - E/F - G/H - I/J - K/L - A/C/E/G/I/K - B/D/F/H/J/LOverlap formulae used. ** very small base (under 30) ineligible for sig testing
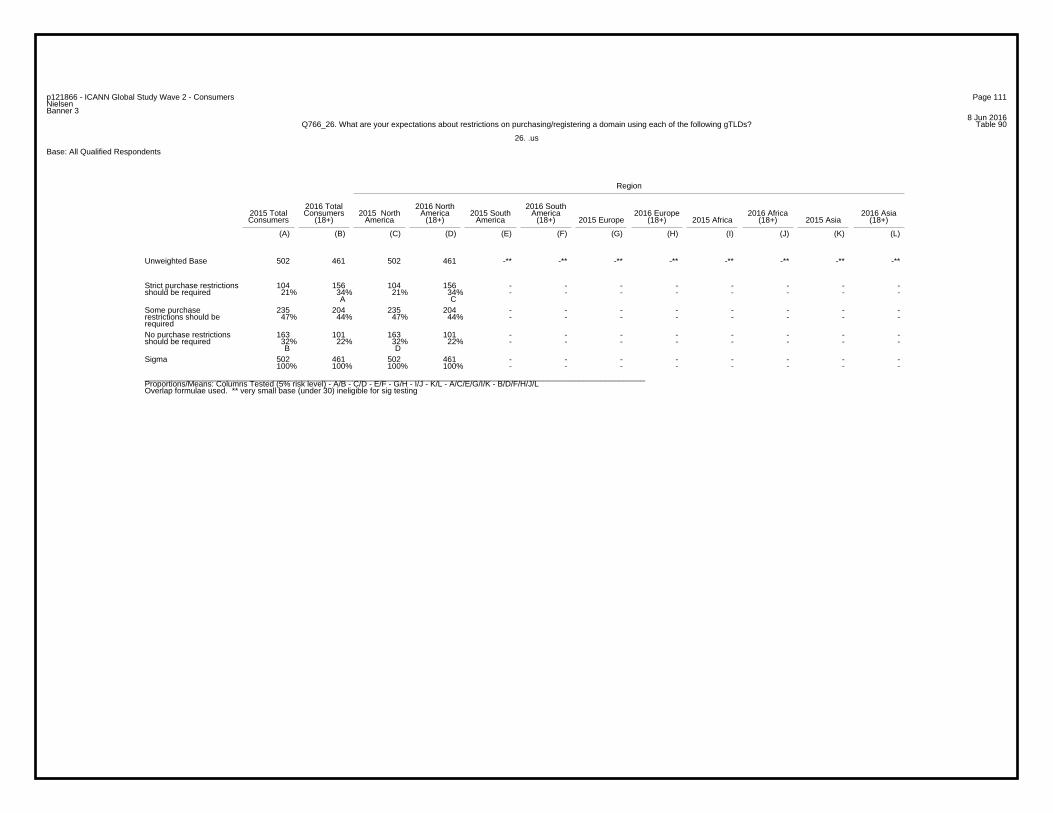
Page 111p121866 - ICANN Global Study Wave 2 - ConsumersNielsenBanner 3
8 Jun 2016Table 90Q766_26. What are your expectations about restrictions on purchasing/registering a domain using each of the following gTLDs?
26. .us
Base: All Qualified Respondents
Region
2016 Total 2016 North 2016 South2015 Total Consumers 2015 North America 2015 South America 2016 Europe 2016 Africa 2016 AsiaConsumers (18+) America (18+) America (18+) 2015 Europe (18+) 2015 Africa (18+) 2015 Asia (18+)
(A) (B) (C) (D) (E) (F) (G) (H) (I) (J) (K) (L)
502 461 502 461 -** -** -** -** -** -** -** -**Unweighted Base
104 156 104 156 - - - - - - - -21% 34% 21% 34% - - - - - - - -
A C
Strict purchase restrictionsshould be required
235 204 235 204 - - - - - - - -47% 44% 47% 44% - - - - - - - -
Some purchaserestrictions should berequired
163 101 163 101 - - - - - - - -32% 22% 32% 22% - - - - - - - - B D
No purchase restrictionsshould be required
502 461 502 461 - - - - - - - -100% 100% 100% 100% - - - - - - - -
Sigma
_________________________________________________________________________________________________________________Proportions/Means: Columns Tested (5% risk level) - A/B - C/D - E/F - G/H - I/J - K/L - A/C/E/G/I/K - B/D/F/H/J/LOverlap formulae used. ** very small base (under 30) ineligible for sig testing

Page 112p121866 - ICANN Global Study Wave 2 - ConsumersNielsenBanner 3
8 Jun 2016Table 91Q766_27. What are your expectations about restrictions on purchasing/registering a domain using each of the following gTLDs?
27. .ca
Base: All Qualified Respondents
Region
2016 Total 2016 North 2016 South2015 Total Consumers 2015 North America 2015 South America 2016 Europe 2016 Africa 2016 AsiaConsumers (18+) America (18+) America (18+) 2015 Europe (18+) 2015 Africa (18+) 2015 Asia (18+)
(A) (B) (C) (D) (E) (F) (G) (H) (I) (J) (K) (L)
200 181 200 181 -** -** -** -** -** -** -** -**Unweighted Base
46 57 46 57 - - - - - - - -23% 31% 23% 31% - - - - - - - -
Strict purchase restrictionsshould be required
95 80 95 80 - - - - - - - -48% 44% 48% 44% - - - - - - - -
Some purchaserestrictions should berequired
59 44 59 44 - - - - - - - -30% 24% 30% 24% - - - - - - - -
No purchase restrictionsshould be required
200 181 200 181 - - - - - - - -100% 100% 100% 100% - - - - - - - -
Sigma
_________________________________________________________________________________________________________________Proportions/Means: Columns Tested (5% risk level) - A/B - C/D - E/F - G/H - I/J - K/L - A/C/E/G/I/K - B/D/F/H/J/LOverlap formulae used. ** very small base (under 30) ineligible for sig testing

Page 113p121866 - ICANN Global Study Wave 2 - ConsumersNielsenBanner 3
8 Jun 2016Table 92Q766_28. What are your expectations about restrictions on purchasing/registering a domain using each of the following gTLDs?
28. .mx
Base: All Qualified Respondents
Region
2016 Total 2016 North 2016 South2015 Total Consumers 2015 North America 2015 South America 2016 Europe 2016 Africa 2016 AsiaConsumers (18+) America (18+) America (18+) 2015 Europe (18+) 2015 Africa (18+) 2015 Asia (18+)
(A) (B) (C) (D) (E) (F) (G) (H) (I) (J) (K) (L)
223 184 223 184 -** -** -** -** -** -** -** -**Unweighted Base
35 53 35 53 - - - - - - - -16% 29% 16% 29% - - - - - - - -
A C
Strict purchase restrictionsshould be required
87 71 87 71 - - - - - - - -39% 39% 39% 39% - - - - - - - -
Some purchaserestrictions should berequired
101 60 101 60 - - - - - - - -45% 33% 45% 33% - - - - - - - - B D
No purchase restrictionsshould be required
223 184 223 184 - - - - - - - -100% 100% 100% 100% - - - - - - - -
Sigma
_________________________________________________________________________________________________________________Proportions/Means: Columns Tested (5% risk level) - A/B - C/D - E/F - G/H - I/J - K/L - A/C/E/G/I/K - B/D/F/H/J/LOverlap formulae used. ** very small base (under 30) ineligible for sig testing
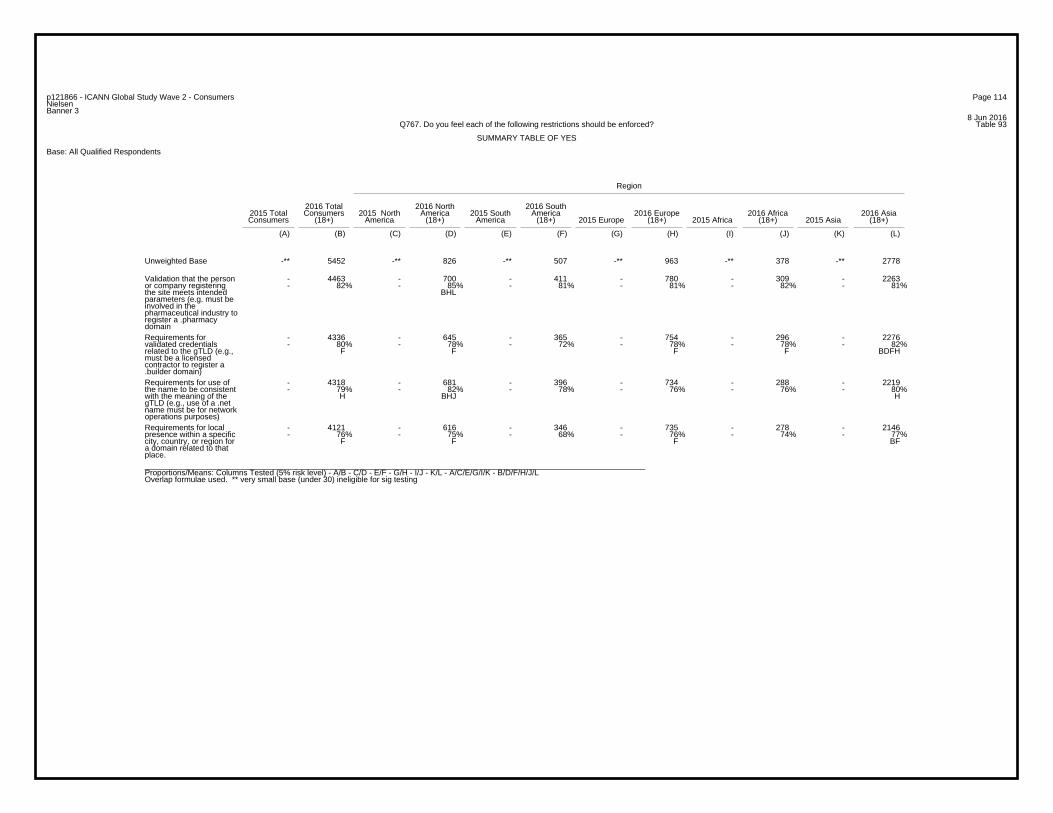
Page 114p121866 - ICANN Global Study Wave 2 - ConsumersNielsenBanner 3
8 Jun 2016Table 93Q767. Do you feel each of the following restrictions should be enforced?
SUMMARY TABLE OF YES
Base: All Qualified Respondents
Region
2016 Total 2016 North 2016 South2015 Total Consumers 2015 North America 2015 South America 2016 Europe 2016 Africa 2016 AsiaConsumers (18+) America (18+) America (18+) 2015 Europe (18+) 2015 Africa (18+) 2015 Asia (18+)
(A) (B) (C) (D) (E) (F) (G) (H) (I) (J) (K) (L)
-** 5452 -** 826 -** 507 -** 963 -** 378 -** 2778Unweighted Base
- 4463 - 700 - 411 - 780 - 309 - 2263- 82% - 85% - 81% - 81% - 82% - 81%
BHL
Validation that the personor company registeringthe site meets intendedparameters (e.g. must beinvolved in thepharmaceutical industry toregister a .pharmacydomain
- 4336 - 645 - 365 - 754 - 296 - 2276- 80% - 78% - 72% - 78% - 78% - 82%
F F F F BDFH
Requirements forvalidated credentialsrelated to the gTLD (e.g.,must be a licensedcontractor to register a.builder domain)
- 4318 - 681 - 396 - 734 - 288 - 2219- 79% - 82% - 78% - 76% - 76% - 80%
H BHJ H
Requirements for use ofthe name to be consistentwith the meaning of thegTLD (e.g., use of a .netname must be for networkoperations purposes)
- 4121 - 616 - 346 - 735 - 278 - 2146- 76% - 75% - 68% - 76% - 74% - 77%
F F F BF
Requirements for localpresence within a specificcity, country, or region fora domain related to thatplace._________________________________________________________________________________________________________________Proportions/Means: Columns Tested (5% risk level) - A/B - C/D - E/F - G/H - I/J - K/L - A/C/E/G/I/K - B/D/F/H/J/LOverlap formulae used. ** very small base (under 30) ineligible for sig testing
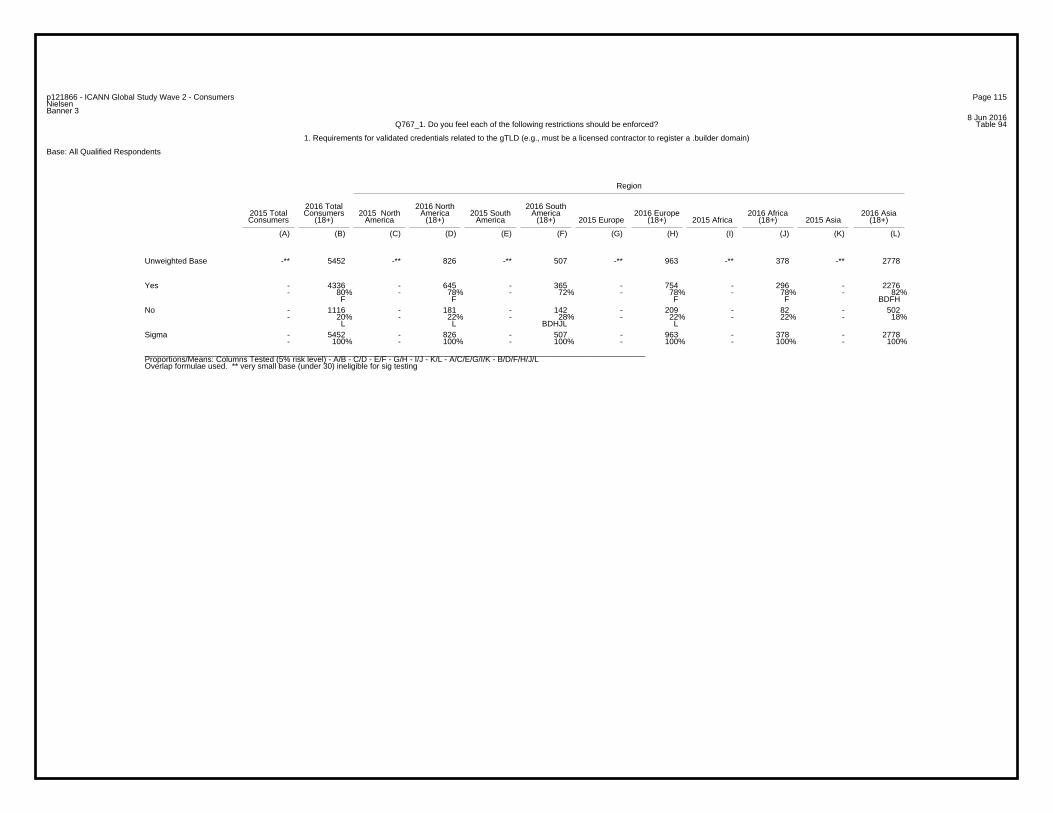
Page 115p121866 - ICANN Global Study Wave 2 - ConsumersNielsenBanner 3
8 Jun 2016Table 94Q767_1. Do you feel each of the following restrictions should be enforced?
1. Requirements for validated credentials related to the gTLD (e.g., must be a licensed contractor to register a .builder domain)
Base: All Qualified Respondents
Region
2016 Total 2016 North 2016 South2015 Total Consumers 2015 North America 2015 South America 2016 Europe 2016 Africa 2016 AsiaConsumers (18+) America (18+) America (18+) 2015 Europe (18+) 2015 Africa (18+) 2015 Asia (18+)
(A) (B) (C) (D) (E) (F) (G) (H) (I) (J) (K) (L)
-** 5452 -** 826 -** 507 -** 963 -** 378 -** 2778Unweighted Base
- 4336 - 645 - 365 - 754 - 296 - 2276- 80% - 78% - 72% - 78% - 78% - 82%
F F F F BDFH
Yes
- 1116 - 181 - 142 - 209 - 82 - 502- 20% - 22% - 28% - 22% - 22% - 18%
L L BDHJL L
No
- 5452 - 826 - 507 - 963 - 378 - 2778- 100% - 100% - 100% - 100% - 100% - 100%
Sigma
_________________________________________________________________________________________________________________Proportions/Means: Columns Tested (5% risk level) - A/B - C/D - E/F - G/H - I/J - K/L - A/C/E/G/I/K - B/D/F/H/J/LOverlap formulae used. ** very small base (under 30) ineligible for sig testing

Page 116p121866 - ICANN Global Study Wave 2 - ConsumersNielsenBanner 3
8 Jun 2016Table 95Q767_2. Do you feel each of the following restrictions should be enforced?
2. Validation that the person or company registering the site meets intended parameters (e.g. must be involved in the pharmaceutical industry to register a .pharmacy domain
Base: All Qualified Respondents
Region
2016 Total 2016 North 2016 South2015 Total Consumers 2015 North America 2015 South America 2016 Europe 2016 Africa 2016 AsiaConsumers (18+) America (18+) America (18+) 2015 Europe (18+) 2015 Africa (18+) 2015 Asia (18+)
(A) (B) (C) (D) (E) (F) (G) (H) (I) (J) (K) (L)
-** 5452 -** 826 -** 507 -** 963 -** 378 -** 2778Unweighted Base
- 4463 - 700 - 411 - 780 - 309 - 2263- 82% - 85% - 81% - 81% - 82% - 81%
BHL
Yes
- 989 - 126 - 96 - 183 - 69 - 515- 18% - 15% - 19% - 19% - 18% - 19%
D D D
No
- 5452 - 826 - 507 - 963 - 378 - 2778- 100% - 100% - 100% - 100% - 100% - 100%
Sigma
_________________________________________________________________________________________________________________Proportions/Means: Columns Tested (5% risk level) - A/B - C/D - E/F - G/H - I/J - K/L - A/C/E/G/I/K - B/D/F/H/J/LOverlap formulae used. ** very small base (under 30) ineligible for sig testing
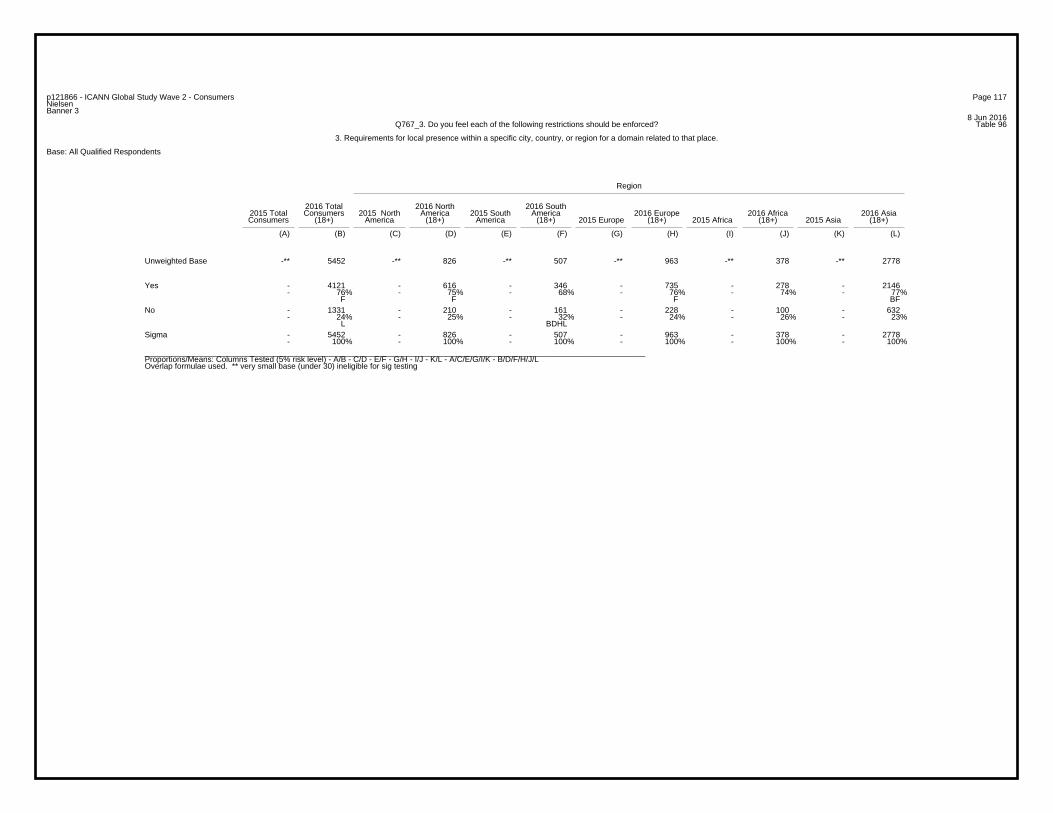
Page 117p121866 - ICANN Global Study Wave 2 - ConsumersNielsenBanner 3
8 Jun 2016Table 96Q767_3. Do you feel each of the following restrictions should be enforced?
3. Requirements for local presence within a specific city, country, or region for a domain related to that place.
Base: All Qualified Respondents
Region
2016 Total 2016 North 2016 South2015 Total Consumers 2015 North America 2015 South America 2016 Europe 2016 Africa 2016 AsiaConsumers (18+) America (18+) America (18+) 2015 Europe (18+) 2015 Africa (18+) 2015 Asia (18+)
(A) (B) (C) (D) (E) (F) (G) (H) (I) (J) (K) (L)
-** 5452 -** 826 -** 507 -** 963 -** 378 -** 2778Unweighted Base
- 4121 - 616 - 346 - 735 - 278 - 2146- 76% - 75% - 68% - 76% - 74% - 77%
F F F BF
Yes
- 1331 - 210 - 161 - 228 - 100 - 632- 24% - 25% - 32% - 24% - 26% - 23%
L BDHL
No
- 5452 - 826 - 507 - 963 - 378 - 2778- 100% - 100% - 100% - 100% - 100% - 100%
Sigma
_________________________________________________________________________________________________________________Proportions/Means: Columns Tested (5% risk level) - A/B - C/D - E/F - G/H - I/J - K/L - A/C/E/G/I/K - B/D/F/H/J/LOverlap formulae used. ** very small base (under 30) ineligible for sig testing

Page 118p121866 - ICANN Global Study Wave 2 - ConsumersNielsenBanner 3
8 Jun 2016Table 97Q767_4. Do you feel each of the following restrictions should be enforced?
4. Requirements for use of the name to be consistent with the meaning of the gTLD (e.g., use of a .net name must be for network operations purposes)
Base: All Qualified Respondents
Region
2016 Total 2016 North 2016 South2015 Total Consumers 2015 North America 2015 South America 2016 Europe 2016 Africa 2016 AsiaConsumers (18+) America (18+) America (18+) 2015 Europe (18+) 2015 Africa (18+) 2015 Asia (18+)
(A) (B) (C) (D) (E) (F) (G) (H) (I) (J) (K) (L)
-** 5452 -** 826 -** 507 -** 963 -** 378 -** 2778Unweighted Base
- 4318 - 681 - 396 - 734 - 288 - 2219- 79% - 82% - 78% - 76% - 76% - 80%
H BHJ H
Yes
- 1134 - 145 - 111 - 229 - 90 - 559- 21% - 18% - 22% - 24% - 24% - 20%
D BDL D
No
- 5452 - 826 - 507 - 963 - 378 - 2778- 100% - 100% - 100% - 100% - 100% - 100%
Sigma
_________________________________________________________________________________________________________________Proportions/Means: Columns Tested (5% risk level) - A/B - C/D - E/F - G/H - I/J - K/L - A/C/E/G/I/K - B/D/F/H/J/LOverlap formulae used. ** very small base (under 30) ineligible for sig testing
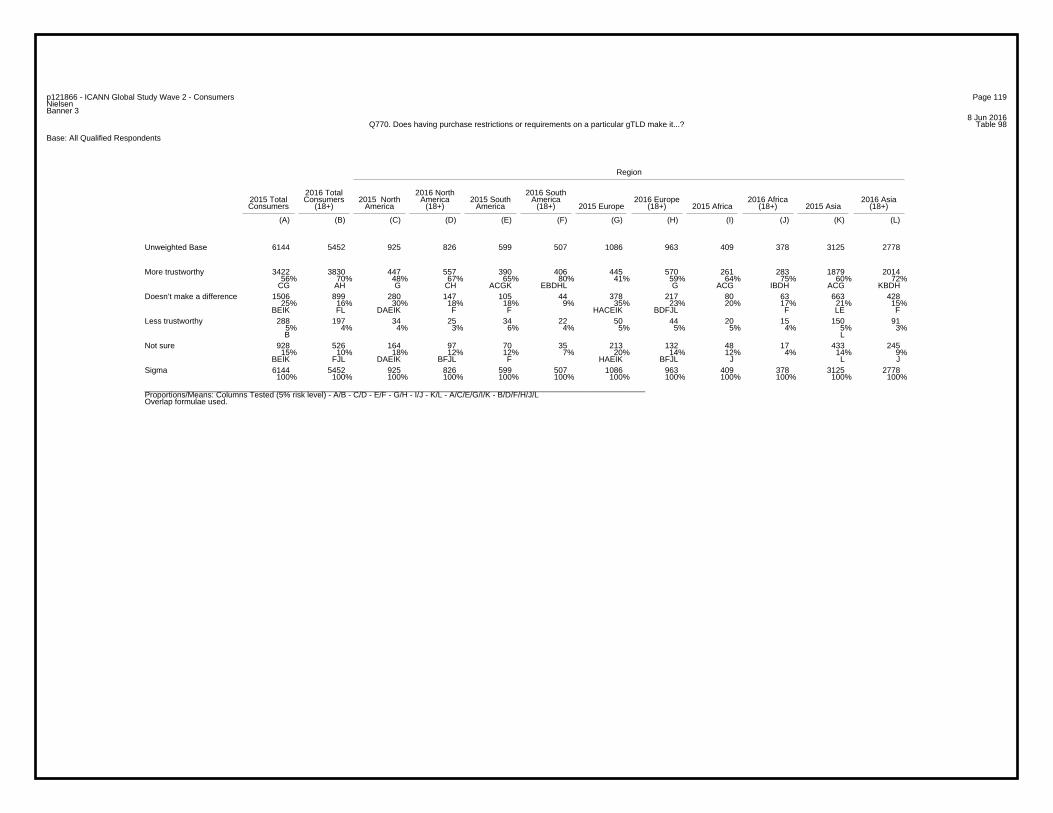
Page 119p121866 - ICANN Global Study Wave 2 - ConsumersNielsenBanner 3
8 Jun 2016Table 98Q770. Does having purchase restrictions or requirements on a particular gTLD make it...?
Base: All Qualified Respondents
Region
2016 Total 2016 North 2016 South2015 Total Consumers 2015 North America 2015 South America 2016 Europe 2016 Africa 2016 AsiaConsumers (18+) America (18+) America (18+) 2015 Europe (18+) 2015 Africa (18+) 2015 Asia (18+)
(A) (B) (C) (D) (E) (F) (G) (H) (I) (J) (K) (L)
6144 5452 925 826 599 507 1086 963 409 378 3125 2778Unweighted Base
3422 3830 447 557 390 406 445 570 261 283 1879 201456% 70% 48% 67% 65% 80% 41% 59% 64% 75% 60% 72%
CG AH G CH ACGK EBDHL G ACG IBDH ACG KBDH
More trustworthy
1506 899 280 147 105 44 378 217 80 63 663 42825% 16% 30% 18% 18% 9% 35% 23% 20% 17% 21% 15%
BEIK FL DAEIK F F HACEIK BDFJL F LE F
Doesn’t make a difference
288 197 34 25 34 22 50 44 20 15 150 915% 4% 4% 3% 6% 4% 5% 5% 5% 4% 5% 3%B L
Less trustworthy
928 526 164 97 70 35 213 132 48 17 433 24515% 10% 18% 12% 12% 7% 20% 14% 12% 4% 14% 9%
BEIK FJL DAEIK BFJL F HAEIK BFJL J L J
Not sure
6144 5452 925 826 599 507 1086 963 409 378 3125 2778100% 100% 100% 100% 100% 100% 100% 100% 100% 100% 100% 100%
Sigma
_________________________________________________________________________________________________________________Proportions/Means: Columns Tested (5% risk level) - A/B - C/D - E/F - G/H - I/J - K/L - A/C/E/G/I/K - B/D/F/H/J/LOverlap formulae used.
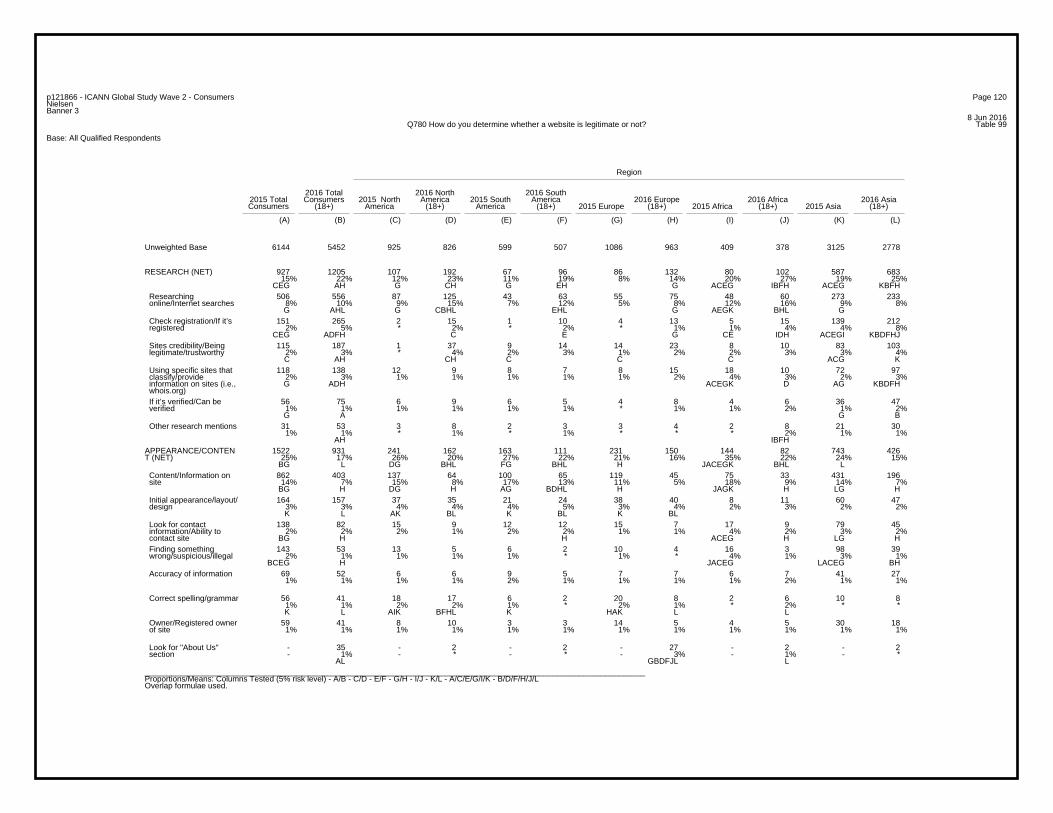
Page 120p121866 - ICANN Global Study Wave 2 - ConsumersNielsenBanner 3
8 Jun 2016Table 99Q780 How do you determine whether a website is legitimate or not?
Base: All Qualified Respondents
Region
2016 Total 2016 North 2016 South2015 Total Consumers 2015 North America 2015 South America 2016 Europe 2016 Africa 2016 AsiaConsumers (18+) America (18+) America (18+) 2015 Europe (18+) 2015 Africa (18+) 2015 Asia (18+)
(A) (B) (C) (D) (E) (F) (G) (H) (I) (J) (K) (L)
6144 5452 925 826 599 507 1086 963 409 378 3125 2778Unweighted Base
927 1205 107 192 67 96 86 132 80 102 587 68315% 22% 12% 23% 11% 19% 8% 14% 20% 27% 19% 25%
CEG AH G CH G EH G ACEG IBFH ACEG KBFH
RESEARCH (NET)
506 556 87 125 43 63 55 75 48 60 273 2338% 10% 9% 15% 7% 12% 5% 8% 12% 16% 9% 8%G AHL G CBHL EHL G AEGK BHL G
Researching online/Internet searches
151 265 2 15 1 10 4 13 5 15 139 2122% 5% * 2% * 2% * 1% 1% 4% 4% 8%
CEG ADFH C E G CE IDH ACEGI KBDFHJ
Check registration/If it’s registered
115 187 1 37 9 14 14 23 8 10 83 1032% 3% * 4% 2% 3% 1% 2% 2% 3% 3% 4%C AH CH C C C ACG K
Sites credibility/Being legitimate/trustworthy
118 138 12 9 8 7 8 15 18 10 72 972% 3% 1% 1% 1% 1% 1% 2% 4% 3% 2% 3%G ADH ACEGK D AG KBDFH
Using specific sites that classify/provide information on sites (i.e., whois.org)
56 75 6 9 6 5 4 8 4 6 36 471% 1% 1% 1% 1% 1% * 1% 1% 2% 1% 2%G A G B
If it’s verified/Can be verified
31 53 3 8 2 3 3 4 2 8 21 301% 1% * 1% * 1% * * * 2% 1% 1%
AH IBFH
Other research mentions
1522 931 241 162 163 111 231 150 144 82 743 42625% 17% 26% 20% 27% 22% 21% 16% 35% 22% 24% 15%
BG L DG BHL FG BHL H JACEGK BHL L
APPEARANCE/CONTENT (NET)
862 403 137 64 100 65 119 45 75 33 431 19614% 7% 15% 8% 17% 13% 11% 5% 18% 9% 14% 7%
BG H DG H AG BDHL H JAGK H LG H
Content/Information on site
164 157 37 35 21 24 38 40 8 11 60 473% 3% 4% 4% 4% 5% 3% 4% 2% 3% 2% 2%K L AK BL K BL K BL
Initial appearance/layout/ design
138 82 15 9 12 12 15 7 17 9 79 452% 2% 2% 1% 2% 2% 1% 1% 4% 2% 3% 2%
BG H H ACEG H LG H
Look for contact information/Ability to contact site
143 53 13 5 6 2 10 4 16 3 98 392% 1% 1% 1% 1% * 1% * 4% 1% 3% 1%
BCEG H JACEG LACEG BH
Finding something wrong/suspicious/illegal
69 52 6 6 9 5 7 7 6 7 41 271% 1% 1% 1% 2% 1% 1% 1% 1% 2% 1% 1%
Accuracy of information
56 41 18 17 6 2 20 8 2 6 10 81% 1% 2% 2% 1% * 2% 1% * 2% * * K L AIK BFHL K HAK L L
Correct spelling/grammar
59 41 8 10 3 3 14 5 4 5 30 181% 1% 1% 1% 1% 1% 1% 1% 1% 1% 1% 1%
Owner/Registered owner of site
- 35 - 2 - 2 - 27 - 2 - 2- 1% - * - * - 3% - 1% - *
AL GBDFJL L
Look for "About Us" section
_________________________________________________________________________________________________________________Proportions/Means: Columns Tested (5% risk level) - A/B - C/D - E/F - G/H - I/J - K/L - A/C/E/G/I/K - B/D/F/H/J/LOverlap formulae used.
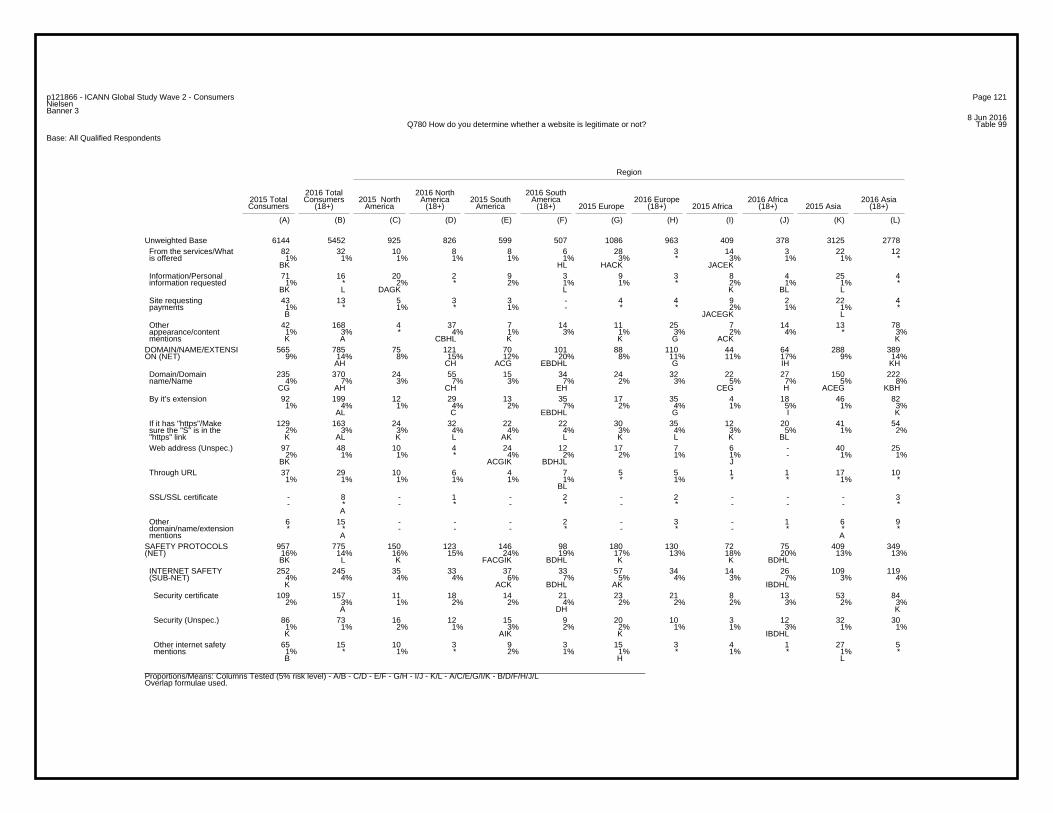
Page 121p121866 - ICANN Global Study Wave 2 - ConsumersNielsenBanner 3
8 Jun 2016Table 99Q780 How do you determine whether a website is legitimate or not?
Base: All Qualified Respondents
Region
2016 Total 2016 North 2016 South2015 Total Consumers 2015 North America 2015 South America 2016 Europe 2016 Africa 2016 AsiaConsumers (18+) America (18+) America (18+) 2015 Europe (18+) 2015 Africa (18+) 2015 Asia (18+)
(A) (B) (C) (D) (E) (F) (G) (H) (I) (J) (K) (L)
6144 5452 925 826 599 507 1086 963 409 378 3125 2778Unweighted Base82 32 10 8 8 6 28 3 14 3 22 12
1% 1% 1% 1% 1% 1% 3% * 3% 1% 1% * BK HL HACK JACEK
From the services/What is offered
71 16 20 2 9 3 9 3 8 4 25 41% * 2% * 2% 1% 1% * 2% 1% 1% *
BK L DAGK L K BL L
Information/Personal information requested
43 13 5 3 3 - 4 4 9 2 22 41% * 1% * 1% - * * 2% 1% 1% * B JACEGK L
Site requesting payments
42 168 4 37 7 14 11 25 7 14 13 781% 3% * 4% 1% 3% 1% 3% 2% 4% * 3%K A CBHL K K G ACK K
Other appearance/content mentions
565 785 75 121 70 101 88 110 44 64 288 3899% 14% 8% 15% 12% 20% 8% 11% 11% 17% 9% 14%
AH CH ACG EBDHL G IH KH
DOMAIN/NAME/EXTENSION (NET)
235 370 24 55 15 34 24 32 22 27 150 2224% 7% 3% 7% 3% 7% 2% 3% 5% 7% 5% 8%
CG AH CH EH CEG H ACEG KBH
Domain/Domain name/Name
92 199 12 29 13 35 17 35 4 18 46 821% 4% 1% 4% 2% 7% 2% 4% 1% 5% 1% 3%
AL C EBDHL G I K
By it’s extension
129 163 24 32 22 22 30 35 12 20 41 542% 3% 3% 4% 4% 4% 3% 4% 3% 5% 1% 2%K AL K L AK L K L K BL
If it has "https"/Make sure the "S" is in the "https" link
97 48 10 4 24 12 17 7 6 - 40 252% 1% 1% * 4% 2% 2% 1% 1% - 1% 1%
BK ACGIK BDHJL J
Web address (Unspec.)
37 29 10 6 4 7 5 5 1 1 17 101% 1% 1% 1% 1% 1% * 1% * * 1% *
BL
Through URL
- 8 - 1 - 2 - 2 - - - 3- * - * - * - * - - - *
A
SSL/SSL certificate
6 15 - - - 2 - 3 - 1 6 9* * - - - * - * - * * *
A A
Other domain/name/extension mentions
957 775 150 123 146 98 180 130 72 75 409 34916% 14% 16% 15% 24% 19% 17% 13% 18% 20% 13% 13%BK L K FACGIK BDHL K K BDHL
SAFETY PROTOCOLS(NET)
252 245 35 33 37 33 57 34 14 26 109 1194% 4% 4% 4% 6% 7% 5% 4% 3% 7% 3% 4%K ACK BDHL AK IBDHL
INTERNET SAFETY (SUB-NET)
109 157 11 18 14 21 23 21 8 13 53 842% 3% 1% 2% 2% 4% 2% 2% 2% 3% 2% 3%
A DH K
Security certificate
86 73 16 12 15 9 20 10 3 12 32 301% 1% 2% 1% 3% 2% 2% 1% 1% 3% 1% 1%K AIK K IBDHL
Security (Unspec.)
65 15 10 3 9 3 15 3 4 1 27 51% * 1% * 2% 1% 1% * 1% * 1% * B H L
Other internet safety mentions
_________________________________________________________________________________________________________________Proportions/Means: Columns Tested (5% risk level) - A/B - C/D - E/F - G/H - I/J - K/L - A/C/E/G/I/K - B/D/F/H/J/LOverlap formulae used.
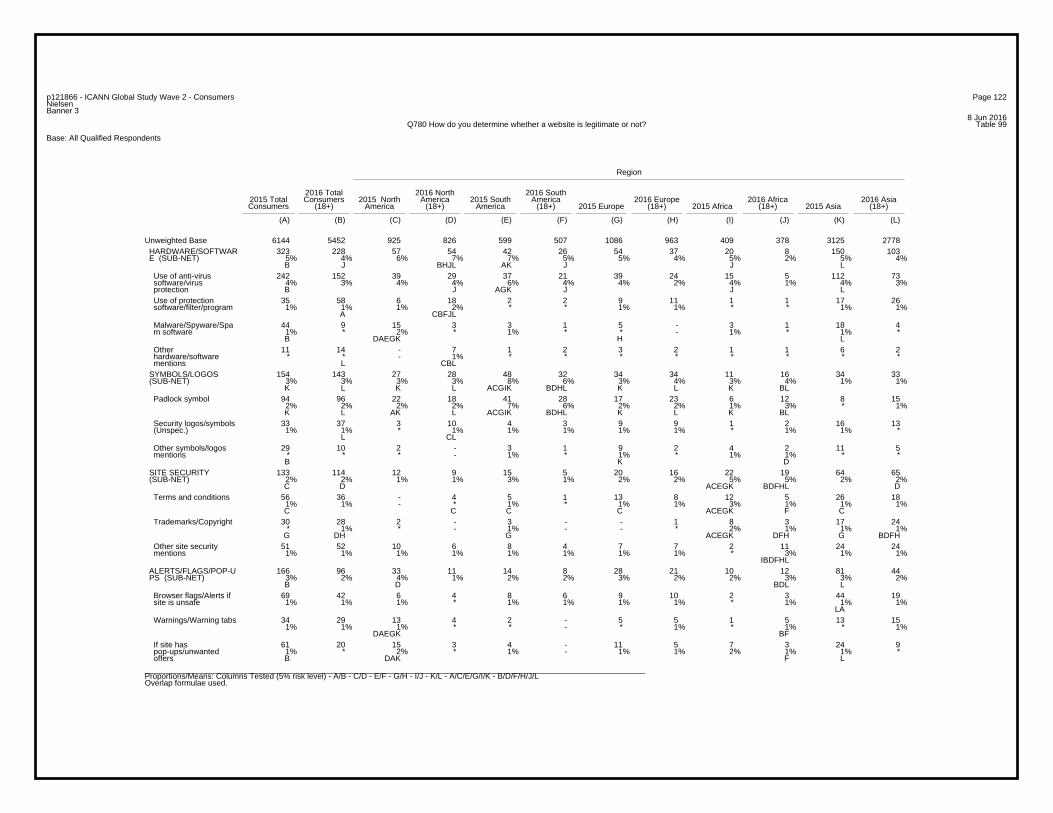
Page 122p121866 - ICANN Global Study Wave 2 - ConsumersNielsenBanner 3
8 Jun 2016Table 99Q780 How do you determine whether a website is legitimate or not?
Base: All Qualified Respondents
Region
2016 Total 2016 North 2016 South2015 Total Consumers 2015 North America 2015 South America 2016 Europe 2016 Africa 2016 AsiaConsumers (18+) America (18+) America (18+) 2015 Europe (18+) 2015 Africa (18+) 2015 Asia (18+)
(A) (B) (C) (D) (E) (F) (G) (H) (I) (J) (K) (L)
6144 5452 925 826 599 507 1086 963 409 378 3125 2778Unweighted Base323 228 57 54 42 26 54 37 20 8 150 103
5% 4% 6% 7% 7% 5% 5% 4% 5% 2% 5% 4%B J BHJL AK J J L
HARDWARE/SOFTWAR E (SUB-NET)
242 152 39 29 37 21 39 24 15 5 112 734% 3% 4% 4% 6% 4% 4% 2% 4% 1% 4% 3%B J AGK J J L
Use of anti-virus software/virus protection
35 58 6 18 2 2 9 11 1 1 17 261% 1% 1% 2% * * 1% 1% * * 1% 1%
A CBFJL
Use of protection software/filter/program
44 9 15 3 3 1 5 - 3 1 18 41% * 2% * 1% * * - 1% * 1% * B DAEGK H L
Malware/Spyware/Spa m software
11 14 - 7 1 2 3 2 1 1 6 2* * - 1% * * * * * * * *
L CBL
Other hardware/software mentions
154 143 27 28 48 32 34 34 11 16 34 333% 3% 3% 3% 8% 6% 3% 4% 3% 4% 1% 1%K L K L ACGIK BDHL K L K BL
SYMBOLS/LOGOS (SUB-NET)
94 96 22 18 41 28 17 23 6 12 8 152% 2% 2% 2% 7% 6% 2% 2% 1% 3% * 1%K L AK L ACGIK BDHL K L K BL
Padlock symbol
33 37 3 10 4 3 9 9 1 2 16 131% 1% * 1% 1% 1% 1% 1% * 1% 1% *
L CL
Security logos/symbols (Unspec.)
29 10 2 - 3 1 9 2 4 2 11 5* * * - 1% * 1% * 1% 1% * * B K D
Other symbols/logos mentions
133 114 12 9 15 5 20 16 22 19 64 652% 2% 1% 1% 3% 1% 2% 2% 5% 5% 2% 2%C D ACEGK BDFHL D
SITE SECURITY (SUB-NET)
56 36 - 4 5 1 13 8 12 5 26 181% 1% - * 1% * 1% 1% 3% 1% 1% 1%C C C C ACEGK F C
Terms and conditions
30 28 2 - 3 - - 1 8 3 17 24* 1% * - 1% - - * 2% 1% 1% 1%
G DH G ACEGK DFH G BDFH
Trademarks/Copyright
51 52 10 6 8 4 7 7 2 11 24 241% 1% 1% 1% 1% 1% 1% 1% * 3% 1% 1%
IBDFHL
Other site security mentions
166 96 33 11 14 8 28 21 10 12 81 443% 2% 4% 1% 2% 2% 3% 2% 2% 3% 3% 2%B D BDL L
ALERTS/FLAGS/POP-U PS (SUB-NET)
69 42 6 4 8 6 9 10 2 3 44 191% 1% 1% * 1% 1% 1% 1% * 1% 1% 1%
LA
Browser flags/Alerts if site is unsafe
34 29 13 4 2 - 5 5 1 5 13 151% 1% 1% * * - * 1% * 1% * 1%
DAEGK BF
Warnings/Warning tabs
61 20 15 3 4 - 11 5 7 3 24 91% * 2% * 1% - 1% 1% 2% 1% 1% * B DAK F L
If site has pop-ups/unwanted offers_________________________________________________________________________________________________________________Proportions/Means: Columns Tested (5% risk level) - A/B - C/D - E/F - G/H - I/J - K/L - A/C/E/G/I/K - B/D/F/H/J/LOverlap formulae used.
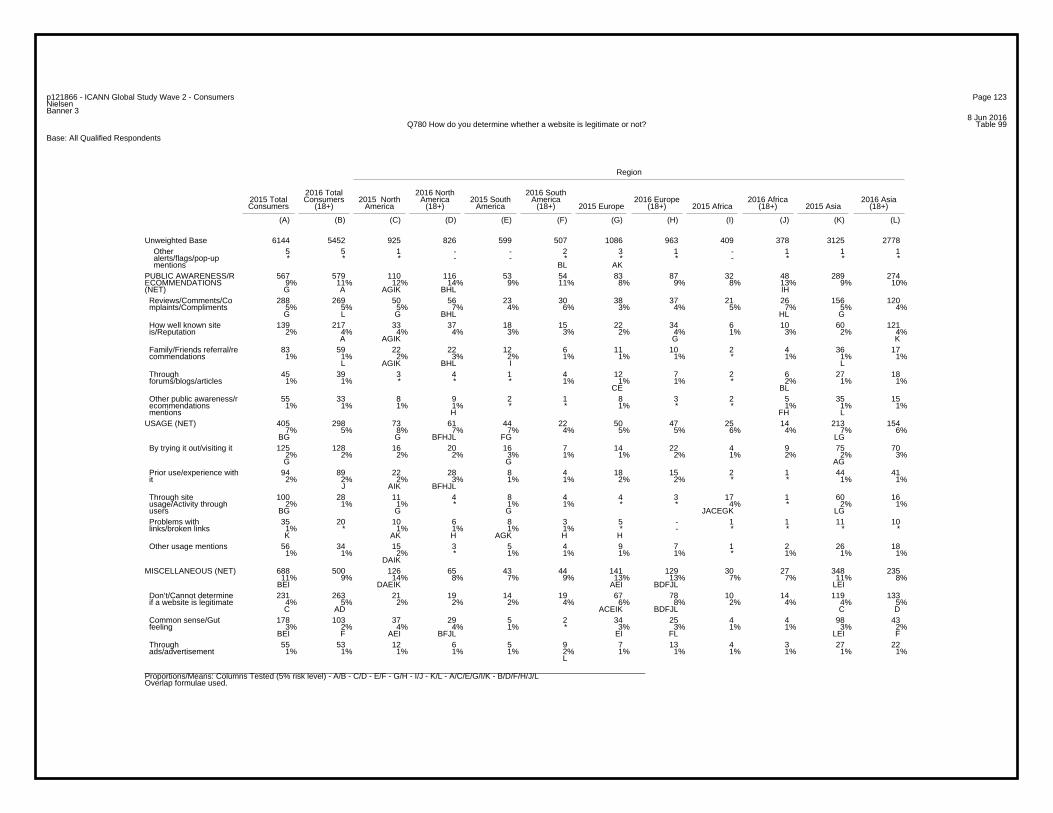
Page 123p121866 - ICANN Global Study Wave 2 - ConsumersNielsenBanner 3
8 Jun 2016Table 99Q780 How do you determine whether a website is legitimate or not?
Base: All Qualified Respondents
Region
2016 Total 2016 North 2016 South2015 Total Consumers 2015 North America 2015 South America 2016 Europe 2016 Africa 2016 AsiaConsumers (18+) America (18+) America (18+) 2015 Europe (18+) 2015 Africa (18+) 2015 Asia (18+)
(A) (B) (C) (D) (E) (F) (G) (H) (I) (J) (K) (L)
6144 5452 925 826 599 507 1086 963 409 378 3125 2778Unweighted Base5 5 1 - - 2 3 1 - 1 1 1* * * - - * * * - * * *
BL AK
Other alerts/flags/pop-up mentions
567 579 110 116 53 54 83 87 32 48 289 2749% 11% 12% 14% 9% 11% 8% 9% 8% 13% 9% 10%G A AGIK BHL IH
PUBLIC AWARENESS/RECOMMENDATIONS(NET)
288 269 50 56 23 30 38 37 21 26 156 1205% 5% 5% 7% 4% 6% 3% 4% 5% 7% 5% 4%G L G BHL HL G
Reviews/Comments/Co mplaints/Compliments
139 217 33 37 18 15 22 34 6 10 60 1212% 4% 4% 4% 3% 3% 2% 4% 1% 3% 2% 4%
A AGIK G K
How well known site is/Reputation
83 59 22 22 12 6 11 10 2 4 36 171% 1% 2% 3% 2% 1% 1% 1% * 1% 1% 1%
L AGIK BHL I L
Family/Friends referral/re commendations
45 39 3 4 1 4 12 7 2 6 27 181% 1% * * * 1% 1% 1% * 2% 1% 1%
CE BL
Through forums/blogs/articles
55 33 8 9 2 1 8 3 2 5 35 151% 1% 1% 1% * * 1% * * 1% 1% 1%
H FH L
Other public awareness/r ecommendations mentions
405 298 73 61 44 22 50 47 25 14 213 1547% 5% 8% 7% 7% 4% 5% 5% 6% 4% 7% 6%
BG G BFHJL FG LG
USAGE (NET)
125 128 16 20 16 7 14 22 4 9 75 702% 2% 2% 2% 3% 1% 1% 2% 1% 2% 2% 3%G G AG
By trying it out/visiting it
94 89 22 28 8 4 18 15 2 1 44 412% 2% 2% 3% 1% 1% 2% 2% * * 1% 1%
J AIK BFHJL
Prior use/experience with it
100 28 11 4 8 4 4 3 17 1 60 162% 1% 1% * 1% 1% * * 4% * 2% 1%
BG G G JACEGK LG
Through site usage/Activity through users
35 20 10 6 8 3 5 - 1 1 11 101% * 1% 1% 1% 1% * - * * * * K AK H AGK H H
Problems with links/broken links
56 34 15 3 5 4 9 7 1 2 26 181% 1% 2% * 1% 1% 1% 1% * 1% 1% 1%
DAIK
Other usage mentions
688 500 126 65 43 44 141 129 30 27 348 23511% 9% 14% 8% 7% 9% 13% 13% 7% 7% 11% 8%
BEI DAEIK AEI BDFJL LEI
MISCELLANEOUS (NET)
231 263 21 19 14 19 67 78 10 14 119 1334% 5% 2% 2% 2% 4% 6% 8% 2% 4% 4% 5%C AD ACEIK BDFJL C D
Don’t/Cannot determine if a website is legitimate
178 103 37 29 5 2 34 25 4 4 98 433% 2% 4% 4% 1% * 3% 3% 1% 1% 3% 2%
BEI F AEI BFJL EI FL LEI F
Common sense/Gut feeling
55 53 12 6 5 9 7 13 4 3 27 221% 1% 1% 1% 1% 2% 1% 1% 1% 1% 1% 1%
L
Through ads/advertisement
_________________________________________________________________________________________________________________Proportions/Means: Columns Tested (5% risk level) - A/B - C/D - E/F - G/H - I/J - K/L - A/C/E/G/I/K - B/D/F/H/J/LOverlap formulae used.
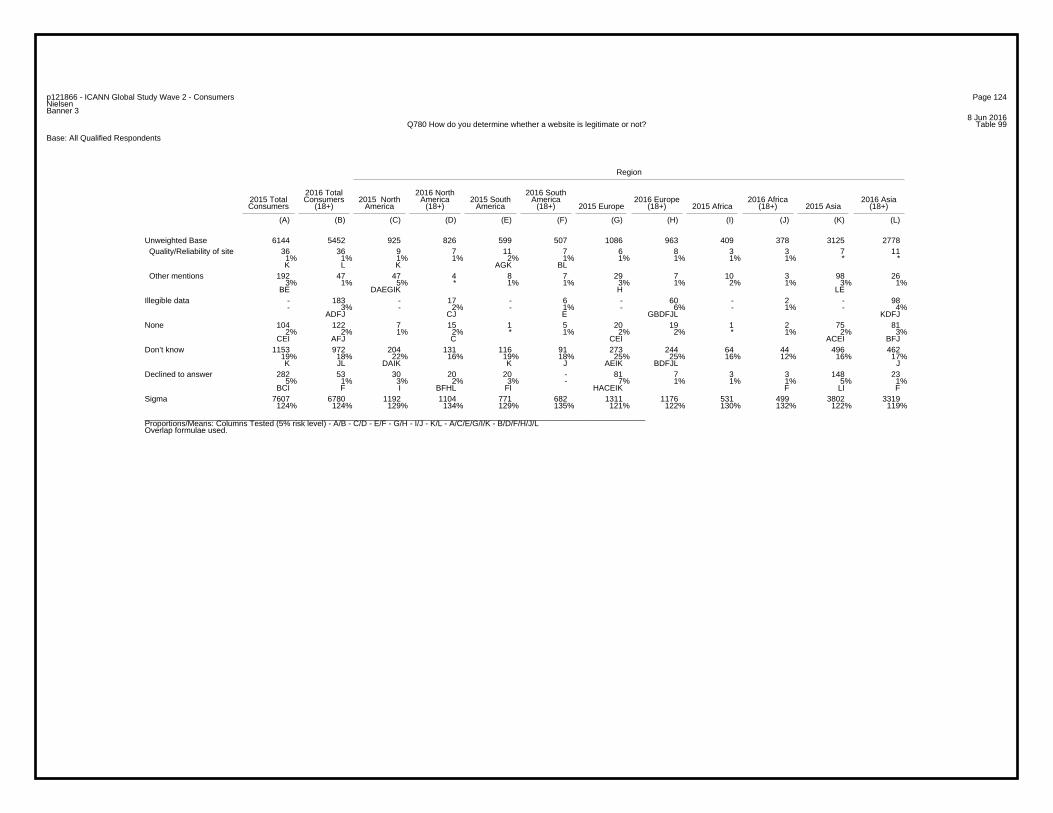
Page 124p121866 - ICANN Global Study Wave 2 - ConsumersNielsenBanner 3
8 Jun 2016Table 99Q780 How do you determine whether a website is legitimate or not?
Base: All Qualified Respondents
Region
2016 Total 2016 North 2016 South2015 Total Consumers 2015 North America 2015 South America 2016 Europe 2016 Africa 2016 AsiaConsumers (18+) America (18+) America (18+) 2015 Europe (18+) 2015 Africa (18+) 2015 Asia (18+)
(A) (B) (C) (D) (E) (F) (G) (H) (I) (J) (K) (L)
6144 5452 925 826 599 507 1086 963 409 378 3125 2778Unweighted Base36 36 9 7 11 7 6 8 3 3 7 11
1% 1% 1% 1% 2% 1% 1% 1% 1% 1% * * K L K AGK BL
Quality/Reliability of site
192 47 47 4 8 7 29 7 10 3 98 263% 1% 5% * 1% 1% 3% 1% 2% 1% 3% 1%
BE DAEGIK H LE
Other mentions
- 183 - 17 - 6 - 60 - 2 - 98- 3% - 2% - 1% - 6% - 1% - 4%
ADFJ CJ E GBDFJL KDFJ
Illegible data
104 122 7 15 1 5 20 19 1 2 75 812% 2% 1% 2% * 1% 2% 2% * 1% 2% 3%
CEI AFJ C CEI ACEI BFJ
None
1153 972 204 131 116 91 273 244 64 44 496 46219% 18% 22% 16% 19% 18% 25% 25% 16% 12% 16% 17%K JL DAIK K J AEIK BDFJL J
Don’t know
282 53 30 20 20 - 81 7 3 3 148 235% 1% 3% 2% 3% - 7% 1% 1% 1% 5% 1%
BCI F I BFHL FI HACEIK F LI F
Declined to answer
7607 6780 1192 1104 771 682 1311 1176 531 499 3802 3319124% 124% 129% 134% 129% 135% 121% 122% 130% 132% 122% 119%
Sigma
_________________________________________________________________________________________________________________Proportions/Means: Columns Tested (5% risk level) - A/B - C/D - E/F - G/H - I/J - K/L - A/C/E/G/I/K - B/D/F/H/J/LOverlap formulae used.
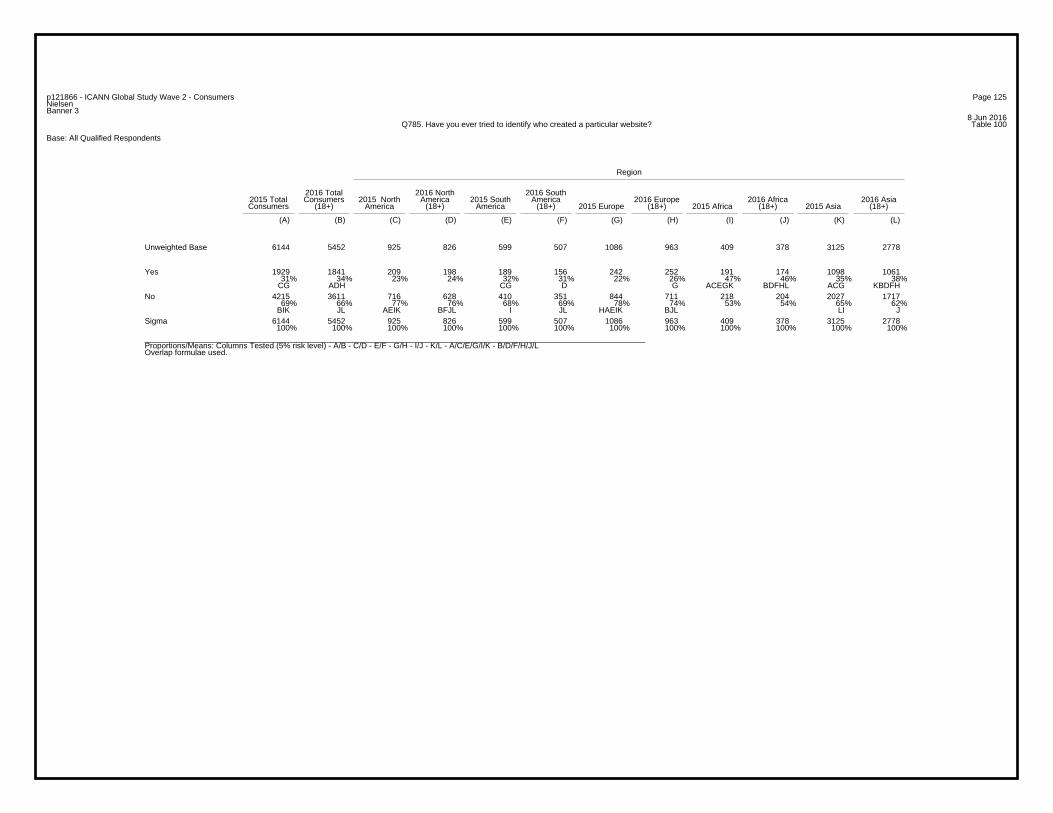
Page 125p121866 - ICANN Global Study Wave 2 - ConsumersNielsenBanner 3
8 Jun 2016Table 100Q785. Have you ever tried to identify who created a particular website?
Base: All Qualified Respondents
Region
2016 Total 2016 North 2016 South2015 Total Consumers 2015 North America 2015 South America 2016 Europe 2016 Africa 2016 AsiaConsumers (18+) America (18+) America (18+) 2015 Europe (18+) 2015 Africa (18+) 2015 Asia (18+)
(A) (B) (C) (D) (E) (F) (G) (H) (I) (J) (K) (L)
6144 5452 925 826 599 507 1086 963 409 378 3125 2778Unweighted Base
1929 1841 209 198 189 156 242 252 191 174 1098 106131% 34% 23% 24% 32% 31% 22% 26% 47% 46% 35% 38%
CG ADH CG D G ACEGK BDFHL ACG KBDFH
Yes
4215 3611 716 628 410 351 844 711 218 204 2027 171769% 66% 77% 76% 68% 69% 78% 74% 53% 54% 65% 62%
BIK JL AEIK BFJL I JL HAEIK BJL LI J
No
6144 5452 925 826 599 507 1086 963 409 378 3125 2778100% 100% 100% 100% 100% 100% 100% 100% 100% 100% 100% 100%
Sigma
_________________________________________________________________________________________________________________Proportions/Means: Columns Tested (5% risk level) - A/B - C/D - E/F - G/H - I/J - K/L - A/C/E/G/I/K - B/D/F/H/J/LOverlap formulae used.
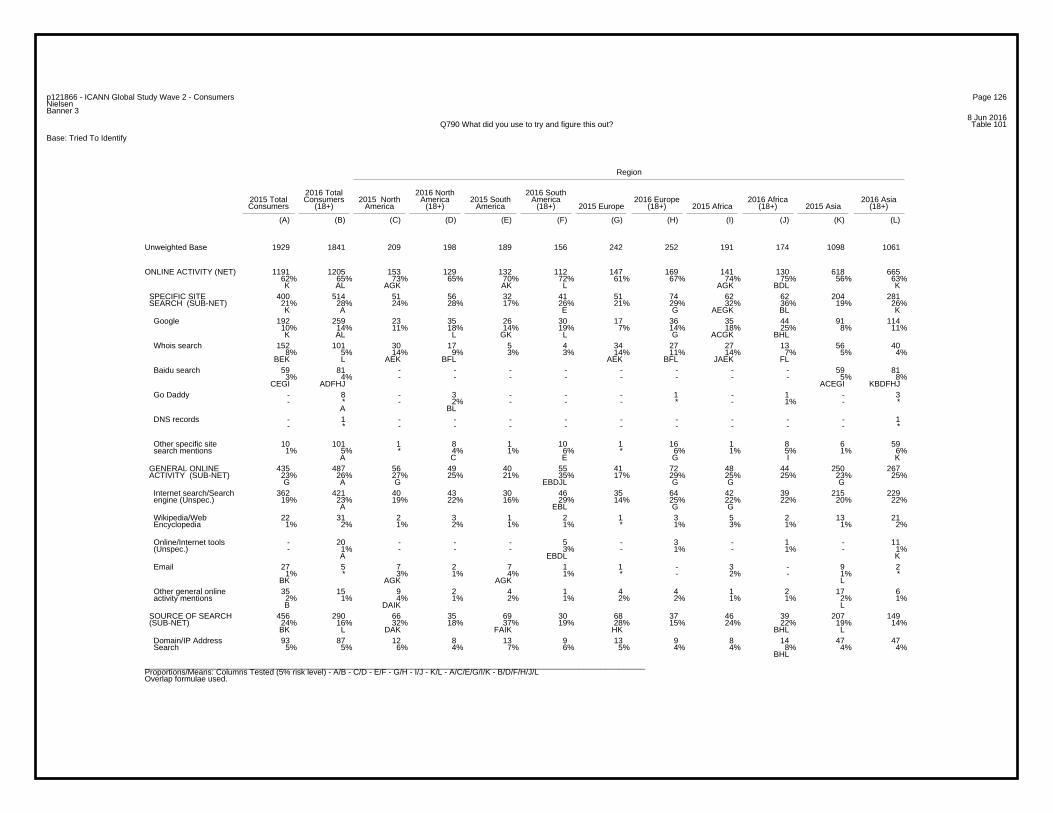
Page 126p121866 - ICANN Global Study Wave 2 - ConsumersNielsenBanner 3
8 Jun 2016Table 101Q790 What did you use to try and figure this out?
Base: Tried To Identify
Region
2016 Total 2016 North 2016 South2015 Total Consumers 2015 North America 2015 South America 2016 Europe 2016 Africa 2016 AsiaConsumers (18+) America (18+) America (18+) 2015 Europe (18+) 2015 Africa (18+) 2015 Asia (18+)
(A) (B) (C) (D) (E) (F) (G) (H) (I) (J) (K) (L)
1929 1841 209 198 189 156 242 252 191 174 1098 1061Unweighted Base
1191 1205 153 129 132 112 147 169 141 130 618 66562% 65% 73% 65% 70% 72% 61% 67% 74% 75% 56% 63%K AL AGK AK L AGK BDL K
ONLINE ACTIVITY (NET)
400 514 51 56 32 41 51 74 62 62 204 28121% 28% 24% 28% 17% 26% 21% 29% 32% 36% 19% 26%K A E G AEGK BL K
SPECIFIC SITE SEARCH (SUB-NET)
192 259 23 35 26 30 17 36 35 44 91 11410% 14% 11% 18% 14% 19% 7% 14% 18% 25% 8% 11%K AL L GK L G ACGK BHL
152 101 30 17 5 4 34 27 27 13 56 408% 5% 14% 9% 3% 3% 14% 11% 14% 7% 5% 4%
BEK L AEK BFL AEK BFL JAEK FL
Whois search
59 81 - - - - - - - - 59 813% 4% - - - - - - - - 5% 8%
CEGI ADFHJ ACEGI KBDFHJ
Baidu search
- 8 - 3 - - - 1 - 1 - 3- * - 2% - - - * - 1% - *
A BL
Go Daddy
- 1 - - - - - - - - - 1- * - - - - - - - - - *
DNS records
10 101 1 8 1 10 1 16 1 8 6 591% 5% * 4% 1% 6% * 6% 1% 5% 1% 6%
A C E G I K
Other specific site search mentions
435 487 56 49 40 55 41 72 48 44 250 26723% 26% 27% 25% 21% 35% 17% 29% 25% 25% 23% 25%G A G EBDJL G G G
GENERAL ONLINE ACTIVITY (SUB-NET)
362 421 40 43 30 46 35 64 42 39 215 22919% 23% 19% 22% 16% 29% 14% 25% 22% 22% 20% 22%
A EBL G G
Internet search/Search engine (Unspec.)
22 31 2 3 1 2 1 3 5 2 13 211% 2% 1% 2% 1% 1% * 1% 3% 1% 1% 2%
Wikipedia/Web Encyclopedia
- 20 - - - 5 - 3 - 1 - 11- 1% - - - 3% - 1% - 1% - 1%
A EBDL K
Online/Internet tools (Unspec.)
27 5 7 2 7 1 1 - 3 - 9 21% * 3% 1% 4% 1% * - 2% - 1% *
BK AGK AGK L
35 15 9 2 4 1 4 4 1 2 17 62% 1% 4% 1% 2% 1% 2% 2% 1% 1% 2% 1%B DAIK L
Other general online activity mentions
456 290 66 35 69 30 68 37 46 39 207 14924% 16% 32% 18% 37% 19% 28% 15% 24% 22% 19% 14%BK L DAK FAIK HK BHL L
SOURCE OF SEARCH (SUB-NET)
93 87 12 8 13 9 13 9 8 14 47 475% 5% 6% 4% 7% 6% 5% 4% 4% 8% 4% 4%
BHL
Domain/IP Address Search
_________________________________________________________________________________________________________________Proportions/Means: Columns Tested (5% risk level) - A/B - C/D - E/F - G/H - I/J - K/L - A/C/E/G/I/K - B/D/F/H/J/LOverlap formulae used.
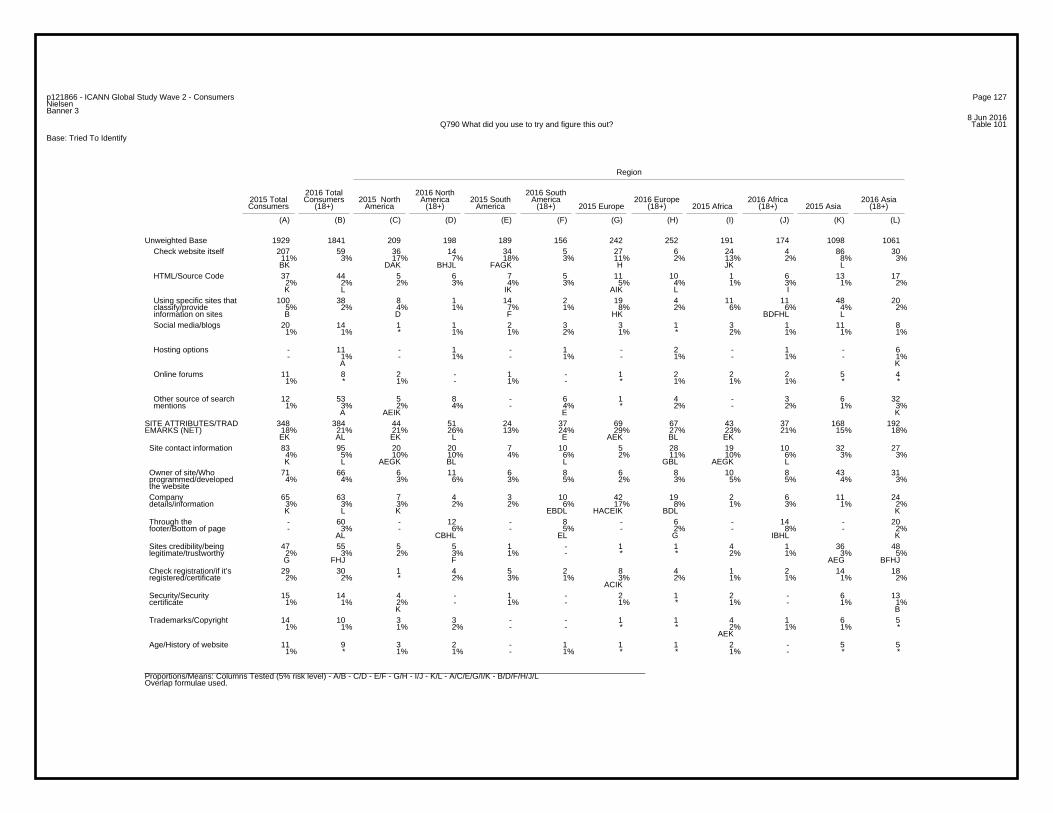
Page 127p121866 - ICANN Global Study Wave 2 - ConsumersNielsenBanner 3
8 Jun 2016Table 101Q790 What did you use to try and figure this out?
Base: Tried To Identify
Region
2016 Total 2016 North 2016 South2015 Total Consumers 2015 North America 2015 South America 2016 Europe 2016 Africa 2016 AsiaConsumers (18+) America (18+) America (18+) 2015 Europe (18+) 2015 Africa (18+) 2015 Asia (18+)
(A) (B) (C) (D) (E) (F) (G) (H) (I) (J) (K) (L)
1929 1841 209 198 189 156 242 252 191 174 1098 1061Unweighted Base207 59 36 14 34 5 27 6 24 4 86 30
11% 3% 17% 7% 18% 3% 11% 2% 13% 2% 8% 3%BK DAK BHJL FAGK H JK L
Check website itself
37 44 5 6 7 5 11 10 1 6 13 172% 2% 2% 3% 4% 3% 5% 4% 1% 3% 1% 2%K L IK AIK L I
HTML/Source Code
100 38 8 1 14 2 19 4 11 11 48 205% 2% 4% 1% 7% 1% 8% 2% 6% 6% 4% 2%B D F HK BDFHL L
Using specific sites that classify/provide information on sites
20 14 1 1 2 3 3 1 3 1 11 81% 1% * 1% 1% 2% 1% * 2% 1% 1% 1%
Social media/blogs
- 11 - 1 - 1 - 2 - 1 - 6- 1% - 1% - 1% - 1% - 1% - 1%
A K
Hosting options
11 8 2 - 1 - 1 2 2 2 5 41% * 1% - 1% - * 1% 1% 1% * *
Online forums
12 53 5 8 - 6 1 4 - 3 6 321% 3% 2% 4% - 4% * 2% - 2% 1% 3%
A AEIK E K
Other source of search mentions
348 384 44 51 24 37 69 67 43 37 168 19218% 21% 21% 26% 13% 24% 29% 27% 23% 21% 15% 18%EK AL EK L E AEK BL EK
SITE ATTRIBUTES/TRADEMARKS (NET)
83 95 20 20 7 10 5 28 19 10 32 274% 5% 10% 10% 4% 6% 2% 11% 10% 6% 3% 3%K L AEGK BL L GBL AEGK L
Site contact information
71 66 6 11 6 8 6 8 10 8 43 314% 4% 3% 6% 3% 5% 2% 3% 5% 5% 4% 3%
Owner of site/Who programmed/developed the website
65 63 7 4 3 10 42 19 2 6 11 243% 3% 3% 2% 2% 6% 17% 8% 1% 3% 1% 2%K L K EBDL HACEIK BDL K
Company details/information
- 60 - 12 - 8 - 6 - 14 - 20- 3% - 6% - 5% - 2% - 8% - 2%
AL CBHL EL G IBHL K
Through the footer/Bottom of page
47 55 5 5 1 - 1 1 4 1 36 482% 3% 2% 3% 1% - * * 2% 1% 3% 5%G FHJ F AEG BFHJ
Sites credibility/being legitimate/trustworthy
29 30 1 4 5 2 8 4 1 2 14 182% 2% * 2% 3% 1% 3% 2% 1% 1% 1% 2%
ACIK
Check registration/if it’s registered/certificate
15 14 4 - 1 - 2 1 2 - 6 131% 1% 2% - 1% - 1% * 1% - 1% 1%
K B
Security/Security certificate
14 10 3 3 - - 1 1 4 1 6 51% 1% 1% 2% - - * * 2% 1% 1% *
AEK
Trademarks/Copyright
11 9 3 2 - 1 1 1 2 - 5 51% * 1% 1% - 1% * * 1% - * *
Age/History of website
_________________________________________________________________________________________________________________Proportions/Means: Columns Tested (5% risk level) - A/B - C/D - E/F - G/H - I/J - K/L - A/C/E/G/I/K - B/D/F/H/J/LOverlap formulae used.
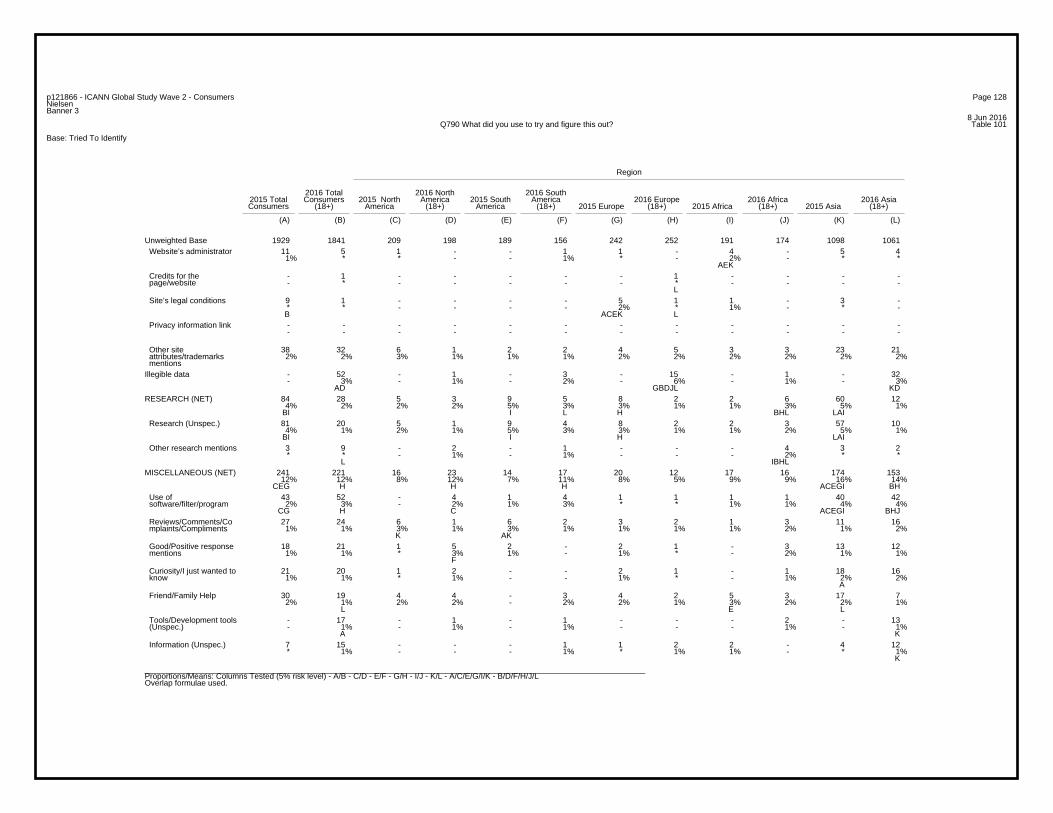
Page 128p121866 - ICANN Global Study Wave 2 - ConsumersNielsenBanner 3
8 Jun 2016Table 101Q790 What did you use to try and figure this out?
Base: Tried To Identify
Region
2016 Total 2016 North 2016 South2015 Total Consumers 2015 North America 2015 South America 2016 Europe 2016 Africa 2016 AsiaConsumers (18+) America (18+) America (18+) 2015 Europe (18+) 2015 Africa (18+) 2015 Asia (18+)
(A) (B) (C) (D) (E) (F) (G) (H) (I) (J) (K) (L)
1929 1841 209 198 189 156 242 252 191 174 1098 1061Unweighted Base11 5 1 - - 1 1 - 4 - 5 4
1% * * - - 1% * - 2% - * * AEK
Website’s administrator
- 1 - - - - - 1 - - - -- * - - - - - * - - - -
L
Credits for the page/website
9 1 - - - - 5 1 1 - 3 -* * - - - - 2% * 1% - * - B ACEK L
Site’s legal conditions
- - - - - - - - - - - -- - - - - - - - - - - -
Privacy information link
38 32 6 1 2 2 4 5 3 3 23 212% 2% 3% 1% 1% 1% 2% 2% 2% 2% 2% 2%
Other site attributes/trademarks mentions
- 52 - 1 - 3 - 15 - 1 - 32- 3% - 1% - 2% - 6% - 1% - 3%
AD GBDJL KD
Illegible data
84 28 5 3 9 5 8 2 2 6 60 124% 2% 2% 2% 5% 3% 3% 1% 1% 3% 5% 1%
BI I L H BHL LAI
RESEARCH (NET)
81 20 5 1 9 4 8 2 2 3 57 104% 1% 2% 1% 5% 3% 3% 1% 1% 2% 5% 1%
BI I H LAI
Research (Unspec.)
3 9 - 2 - 1 - - - 4 3 2* * - 1% - 1% - - - 2% * *
L IBHL
Other research mentions
241 221 16 23 14 17 20 12 17 16 174 15312% 12% 8% 12% 7% 11% 8% 5% 9% 9% 16% 14%
CEG H H H ACEGI BH
MISCELLANEOUS (NET)
43 52 - 4 1 4 1 1 1 1 40 422% 3% - 2% 1% 3% * * 1% 1% 4% 4%
CG H C ACEGI BHJ
Use of software/filter/program
27 24 6 1 6 2 3 2 1 3 11 161% 1% 3% 1% 3% 1% 1% 1% 1% 2% 1% 2%
K AK
Reviews/Comments/Co mplaints/Compliments
18 21 1 5 2 - 2 1 - 3 13 121% 1% * 3% 1% - 1% * - 2% 1% 1%
F
Good/Positive response mentions
21 20 1 2 - - 2 1 - 1 18 161% 1% * 1% - - 1% * - 1% 2% 2%
A
Curiosity/I just wanted to know
30 19 4 4 - 3 4 2 5 3 17 72% 1% 2% 2% - 2% 2% 1% 3% 2% 2% 1%
L E L
Friend/Family Help
- 17 - 1 - 1 - - - 2 - 13- 1% - 1% - 1% - - - 1% - 1%
A K
Tools/Development tools (Unspec.)
7 15 - - - 1 1 2 2 - 4 12* 1% - - - 1% * 1% 1% - * 1%
K
Information (Unspec.)
_________________________________________________________________________________________________________________Proportions/Means: Columns Tested (5% risk level) - A/B - C/D - E/F - G/H - I/J - K/L - A/C/E/G/I/K - B/D/F/H/J/LOverlap formulae used.
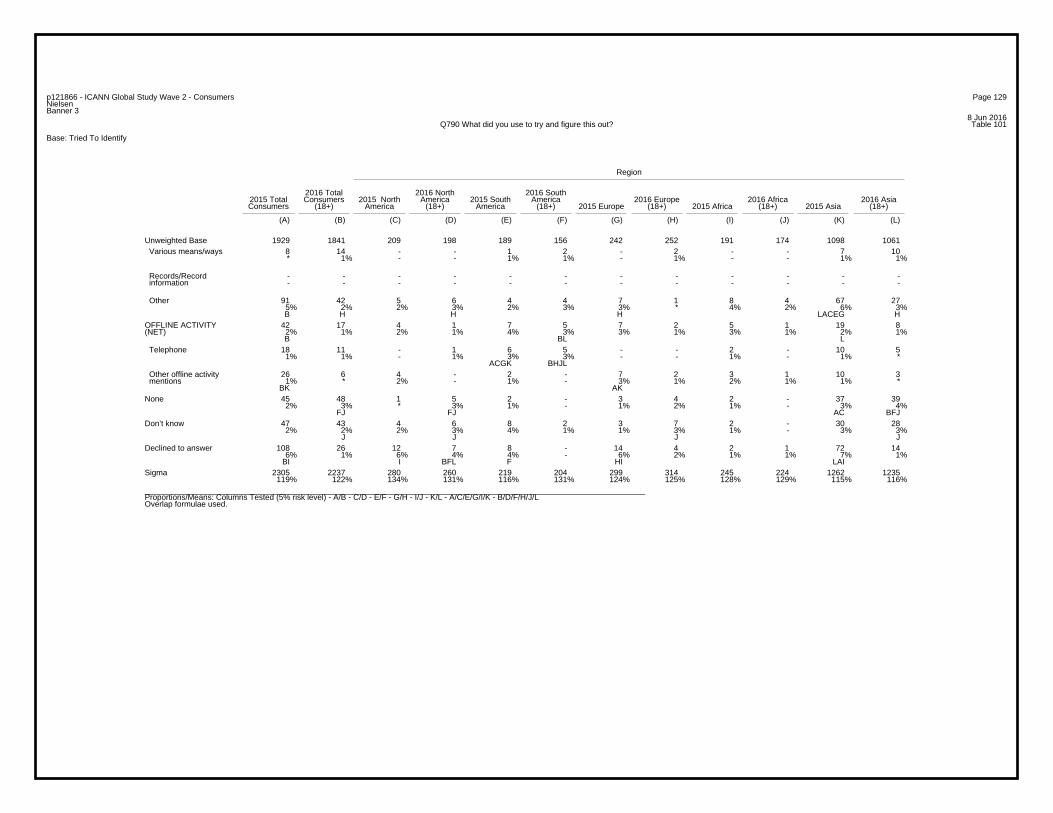
Page 129p121866 - ICANN Global Study Wave 2 - ConsumersNielsenBanner 3
8 Jun 2016Table 101Q790 What did you use to try and figure this out?
Base: Tried To Identify
Region
2016 Total 2016 North 2016 South2015 Total Consumers 2015 North America 2015 South America 2016 Europe 2016 Africa 2016 AsiaConsumers (18+) America (18+) America (18+) 2015 Europe (18+) 2015 Africa (18+) 2015 Asia (18+)
(A) (B) (C) (D) (E) (F) (G) (H) (I) (J) (K) (L)
1929 1841 209 198 189 156 242 252 191 174 1098 1061Unweighted Base8 14 - - 1 2 - 2 - - 7 10* 1% - - 1% 1% - 1% - - 1% 1%
Various means/ways
- - - - - - - - - - - -- - - - - - - - - - - -
Records/Record information
91 42 5 6 4 4 7 1 8 4 67 275% 2% 2% 3% 2% 3% 3% * 4% 2% 6% 3%B H H H LACEG H
Other
42 17 4 1 7 5 7 2 5 1 19 82% 1% 2% 1% 4% 3% 3% 1% 3% 1% 2% 1%B BL L
OFFLINE ACTIVITY(NET)
18 11 - 1 6 5 - - 2 - 10 51% 1% - 1% 3% 3% - - 1% - 1% *
ACGK BHJL
Telephone
26 6 4 - 2 - 7 2 3 1 10 31% * 2% - 1% - 3% 1% 2% 1% 1% *
BK AK
Other offline activity mentions
45 48 1 5 2 - 3 4 2 - 37 392% 3% * 3% 1% - 1% 2% 1% - 3% 4%
FJ FJ AC BFJ
None
47 43 4 6 8 2 3 7 2 - 30 282% 2% 2% 3% 4% 1% 1% 3% 1% - 3% 3%
J J J J
Don’t know
108 26 12 7 8 - 14 4 2 1 72 146% 1% 6% 4% 4% - 6% 2% 1% 1% 7% 1%
BI I BFL F HI LAI
Declined to answer
2305 2237 280 260 219 204 299 314 245 224 1262 1235119% 122% 134% 131% 116% 131% 124% 125% 128% 129% 115% 116%
Sigma
_________________________________________________________________________________________________________________Proportions/Means: Columns Tested (5% risk level) - A/B - C/D - E/F - G/H - I/J - K/L - A/C/E/G/I/K - B/D/F/H/J/LOverlap formulae used.
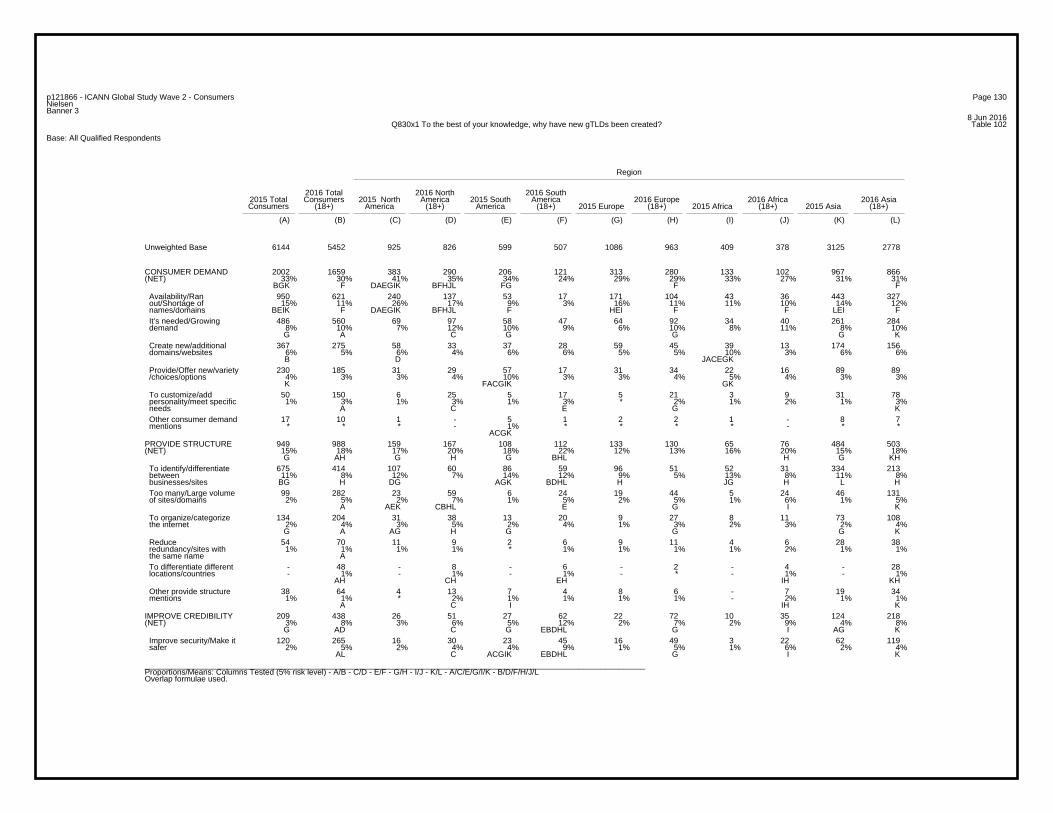
Page 130p121866 - ICANN Global Study Wave 2 - ConsumersNielsenBanner 3
8 Jun 2016Table 102Q830x1 To the best of your knowledge, why have new gTLDs been created?
Base: All Qualified Respondents
Region
2016 Total 2016 North 2016 South2015 Total Consumers 2015 North America 2015 South America 2016 Europe 2016 Africa 2016 AsiaConsumers (18+) America (18+) America (18+) 2015 Europe (18+) 2015 Africa (18+) 2015 Asia (18+)
(A) (B) (C) (D) (E) (F) (G) (H) (I) (J) (K) (L)
6144 5452 925 826 599 507 1086 963 409 378 3125 2778Unweighted Base
2002 1659 383 290 206 121 313 280 133 102 967 86633% 30% 41% 35% 34% 24% 29% 29% 33% 27% 31% 31%
BGK F DAEGIK BFHJL FG F F
CONSUMER DEMAND(NET)
950 621 240 137 53 17 171 104 43 36 443 32715% 11% 26% 17% 9% 3% 16% 11% 11% 10% 14% 12%
BEIK F DAEGIK BFHJL F HEI F F LEI F
Availability/Ran out/Shortage of names/domains
486 560 69 97 58 47 64 92 34 40 261 2848% 10% 7% 12% 10% 9% 6% 10% 8% 11% 8% 10%G A C G G G K
It’s needed/Growing demand
367 275 58 33 37 28 59 45 39 13 174 1566% 5% 6% 4% 6% 6% 5% 5% 10% 3% 6% 6%B D JACEGK
Create new/additional domains/websites
230 185 31 29 57 17 31 34 22 16 89 894% 3% 3% 4% 10% 3% 3% 4% 5% 4% 3% 3%K FACGIK GK
Provide/Offer new/variety /choices/options
50 150 6 25 5 17 5 21 3 9 31 781% 3% 1% 3% 1% 3% * 2% 1% 2% 1% 3%
A C E G K
To customize/add personality/meet specific needs
17 10 1 - 5 1 2 2 1 - 8 7* * * - 1% * * * * - * *
ACGK
Other consumer demand mentions
949 988 159 167 108 112 133 130 65 76 484 50315% 18% 17% 20% 18% 22% 12% 13% 16% 20% 15% 18%G AH G H G BHL H G KH
PROVIDE STRUCTURE(NET)
675 414 107 60 86 59 96 51 52 31 334 21311% 8% 12% 7% 14% 12% 9% 5% 13% 8% 11% 8%
BG H DG AGK BDHL H JG H L H
To identify/differentiate between businesses/sites
99 282 23 59 6 24 19 44 5 24 46 1312% 5% 2% 7% 1% 5% 2% 5% 1% 6% 1% 5%
A AEK CBHL E G I K
Too many/Large volume of sites/domains
134 204 31 38 13 20 9 27 8 11 73 1082% 4% 3% 5% 2% 4% 1% 3% 2% 3% 2% 4%G A AG H G G G K
To organize/categorize the internet
54 70 11 9 2 6 9 11 4 6 28 381% 1% 1% 1% * 1% 1% 1% 1% 2% 1% 1%
A
Reduce redundancy/sites with the same name
- 48 - 8 - 6 - 2 - 4 - 28- 1% - 1% - 1% - * - 1% - 1%
AH CH EH IH KH
To differentiate different locations/countries
38 64 4 13 7 4 8 6 - 7 19 341% 1% * 2% 1% 1% 1% 1% - 2% 1% 1%
A C I IH K
Other provide structure mentions
209 438 26 51 27 62 22 72 10 35 124 2183% 8% 3% 6% 5% 12% 2% 7% 2% 9% 4% 8%G AD C G EBDHL G I AG K
IMPROVE CREDIBILITY(NET)
120 265 16 30 23 45 16 49 3 22 62 1192% 5% 2% 4% 4% 9% 1% 5% 1% 6% 2% 4%
AL C ACGIK EBDHL G I K
Improve security/Make it safer
_________________________________________________________________________________________________________________Proportions/Means: Columns Tested (5% risk level) - A/B - C/D - E/F - G/H - I/J - K/L - A/C/E/G/I/K - B/D/F/H/J/LOverlap formulae used.
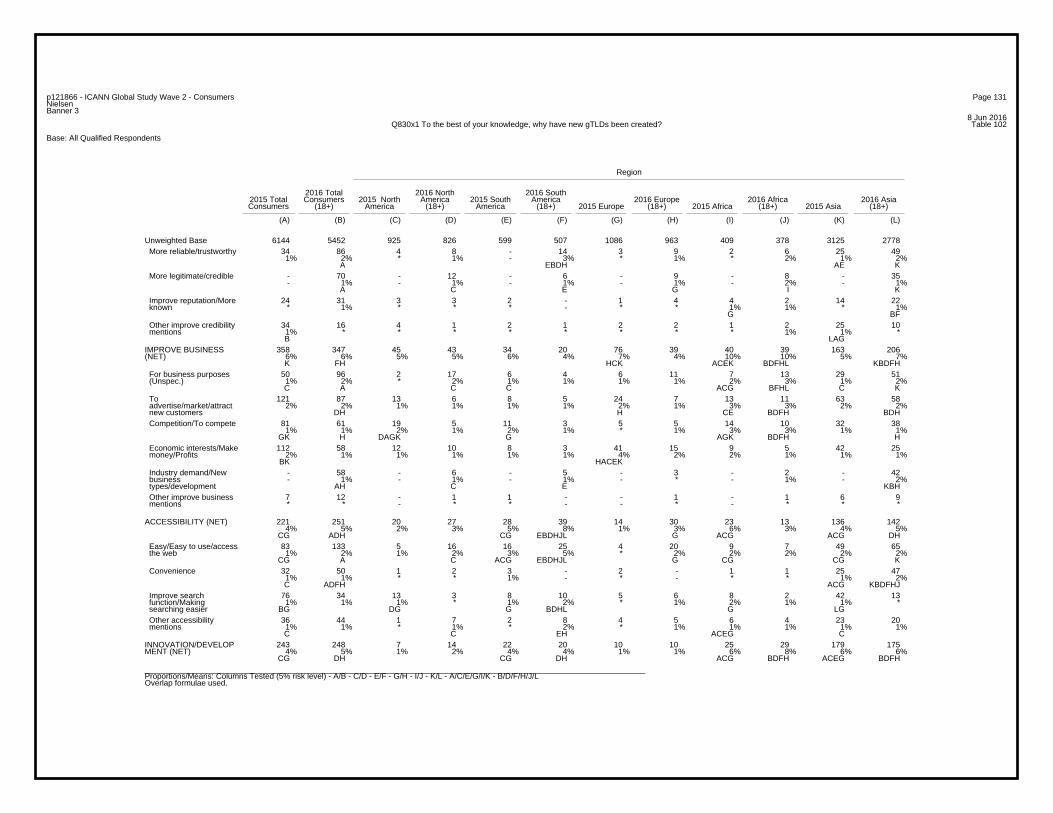
Page 131p121866 - ICANN Global Study Wave 2 - ConsumersNielsenBanner 3
8 Jun 2016Table 102Q830x1 To the best of your knowledge, why have new gTLDs been created?
Base: All Qualified Respondents
Region
2016 Total 2016 North 2016 South2015 Total Consumers 2015 North America 2015 South America 2016 Europe 2016 Africa 2016 AsiaConsumers (18+) America (18+) America (18+) 2015 Europe (18+) 2015 Africa (18+) 2015 Asia (18+)
(A) (B) (C) (D) (E) (F) (G) (H) (I) (J) (K) (L)
6144 5452 925 826 599 507 1086 963 409 378 3125 2778Unweighted Base34 86 4 8 - 14 3 9 2 6 25 49
1% 2% * 1% - 3% * 1% * 2% 1% 2%A EBDH AE K
More reliable/trustworthy
- 70 - 12 - 6 - 9 - 8 - 35- 1% - 1% - 1% - 1% - 2% - 1%
A C E G I K
More legitimate/credible
24 31 3 3 2 - 1 4 4 2 14 22* 1% * * * - * * 1% 1% * 1%
G BF
Improve reputation/More known
34 16 4 1 2 1 2 2 1 2 25 101% * * * * * * * * 1% 1% * B LAG
Other improve credibility mentions
358 347 45 43 34 20 76 39 40 39 163 2066% 6% 5% 5% 6% 4% 7% 4% 10% 10% 5% 7%K FH HCK ACEK BDFHL KBDFH
IMPROVE BUSINESS(NET)
50 96 2 17 6 4 6 11 7 13 29 511% 2% * 2% 1% 1% 1% 1% 2% 3% 1% 2%C A C C ACG BFHL C K
For business purposes (Unspec.)
121 87 13 6 8 5 24 7 13 11 63 582% 2% 1% 1% 1% 1% 2% 1% 3% 3% 2% 2%
DH H CE BDFH BDH
To advertise/market/attract new customers
81 61 19 5 11 3 5 5 14 10 32 381% 1% 2% 1% 2% 1% * 1% 3% 3% 1% 1%
GK H DAGK G AGK BDFH H
Competition/To compete
112 58 12 10 8 3 41 15 9 5 42 252% 1% 1% 1% 1% 1% 4% 2% 2% 1% 1% 1%
BK HACEK
Economic interests/Make money/Profits
- 58 - 6 - 5 - 3 - 2 - 42- 1% - 1% - 1% - * - 1% - 2%
AH C E KBH
Industry demand/New business types/development
7 12 - 1 1 - - 1 - 1 6 9* * - * * - - * - * * *
Other improve business mentions
221 251 20 27 28 39 14 30 23 13 136 1424% 5% 2% 3% 5% 8% 1% 3% 6% 3% 4% 5%
CG ADH CG EBDHJL G ACG ACG DH
ACCESSIBILITY (NET)
83 133 5 16 16 25 4 20 9 7 49 651% 2% 1% 2% 3% 5% * 2% 2% 2% 2% 2%
CG A C ACG EBDHJL G CG CG K
Easy/Easy to use/access the web
32 50 1 2 3 - 2 - 1 1 25 471% 1% * * 1% - * - * * 1% 2%C ADFH ACG KBDFHJ
Convenience
76 34 13 3 8 10 5 6 8 2 42 131% 1% 1% * 1% 2% * 1% 2% 1% 1% *
BG DG G BDHL G LG
Improve search function/Making searching easier
36 44 1 7 2 8 4 5 6 4 23 201% 1% * 1% * 2% * 1% 1% 1% 1% 1%C C EH ACEG C
Other accessibility mentions
243 248 7 14 22 20 10 10 25 29 179 1754% 5% 1% 2% 4% 4% 1% 1% 6% 8% 6% 6%
CG DH CG DH ACG BDFH ACEG BDFH
INNOVATION/DEVELOPMENT (NET)
_________________________________________________________________________________________________________________Proportions/Means: Columns Tested (5% risk level) - A/B - C/D - E/F - G/H - I/J - K/L - A/C/E/G/I/K - B/D/F/H/J/LOverlap formulae used.
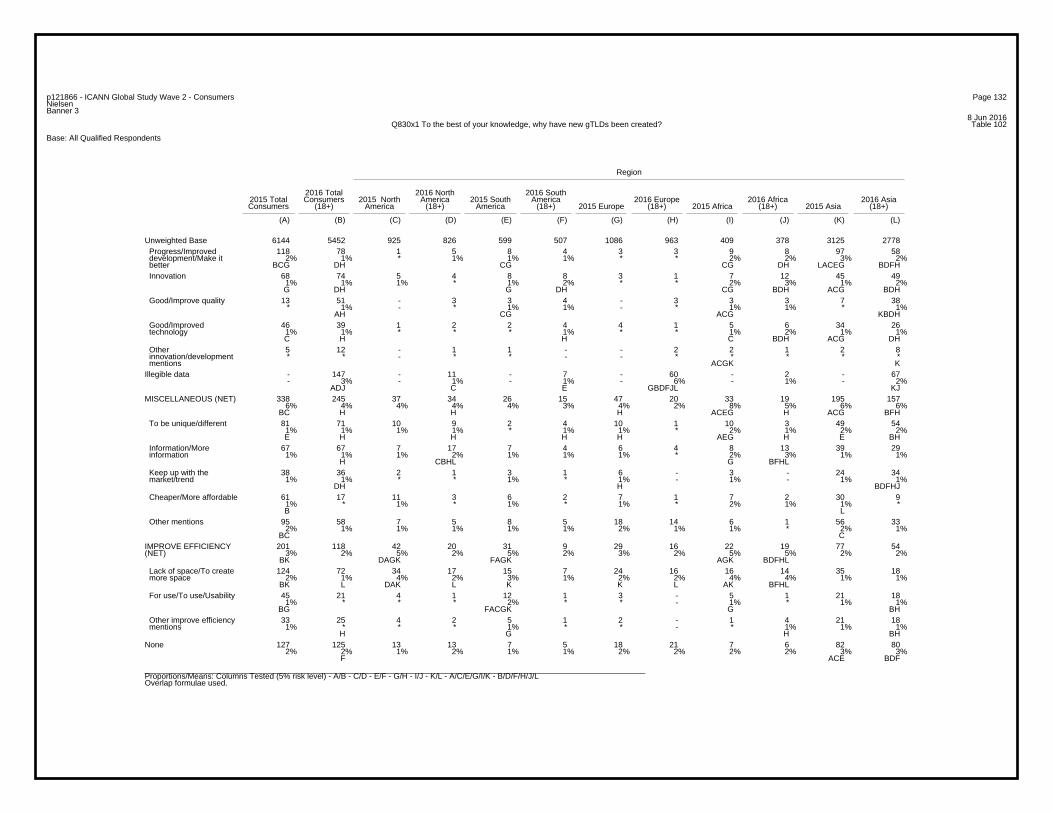
Page 132p121866 - ICANN Global Study Wave 2 - ConsumersNielsenBanner 3
8 Jun 2016Table 102Q830x1 To the best of your knowledge, why have new gTLDs been created?
Base: All Qualified Respondents
Region
2016 Total 2016 North 2016 South2015 Total Consumers 2015 North America 2015 South America 2016 Europe 2016 Africa 2016 AsiaConsumers (18+) America (18+) America (18+) 2015 Europe (18+) 2015 Africa (18+) 2015 Asia (18+)
(A) (B) (C) (D) (E) (F) (G) (H) (I) (J) (K) (L)
6144 5452 925 826 599 507 1086 963 409 378 3125 2778Unweighted Base118 78 1 5 8 4 3 3 9 8 97 58
2% 1% * 1% 1% 1% * * 2% 2% 3% 2%BCG DH CG CG DH LACEG BDFH
Progress/Improved development/Make it better
68 74 5 4 8 8 3 1 7 12 45 491% 1% 1% * 1% 2% * * 2% 3% 1% 2%G DH G DH CG BDH ACG BDH
Innovation
13 51 - 3 3 4 - 3 3 3 7 38* 1% - * 1% 1% - * 1% 1% * 1%
AH CG ACG KBDH
Good/Improve quality
46 39 1 2 2 4 4 1 5 6 34 261% 1% * * * 1% * * 1% 2% 1% 1%C H H C BDH ACG DH
Good/Improved technology
5 12 - 1 1 - - 2 2 1 2 8* * - * * - - * * * * *
ACGK K
Other innovation/development mentions
- 147 - 11 - 7 - 60 - 2 - 67- 3% - 1% - 1% - 6% - 1% - 2%
ADJ C E GBDFJL KJ
Illegible data
338 245 37 34 26 15 47 20 33 19 195 1576% 4% 4% 4% 4% 3% 4% 2% 8% 5% 6% 6%
BC H H H ACEG H ACG BFH
MISCELLANEOUS (NET)
81 71 10 9 2 4 10 1 10 3 49 541% 1% 1% 1% * 1% 1% * 2% 1% 2% 2%E H H H H AEG H E BH
To be unique/different
67 67 7 17 7 4 6 4 8 13 39 291% 1% 1% 2% 1% 1% 1% * 2% 3% 1% 1%
H CBHL G BFHL
Information/More information
38 36 2 1 3 1 6 - 3 - 24 341% 1% * * 1% * 1% - 1% - 1% 1%
DH H BDFHJ
Keep up with the market/trend
61 17 11 3 6 2 7 1 7 2 30 91% * 1% * 1% * 1% * 2% 1% 1% * B L
Cheaper/More affordable
95 58 7 5 8 5 18 14 6 1 56 332% 1% 1% 1% 1% 1% 2% 1% 1% * 2% 1%
BC C
Other mentions
201 118 42 20 31 9 29 16 22 19 77 543% 2% 5% 2% 5% 2% 3% 2% 5% 5% 2% 2%
BK DAGK FAGK AGK BDFHL
IMPROVE EFFICIENCY(NET)
124 72 34 17 15 7 24 16 16 14 35 182% 1% 4% 2% 3% 1% 2% 2% 4% 4% 1% 1%
BK L DAK L K K L AK BFHL
Lack of space/To create more space
45 21 4 1 12 1 3 - 5 1 21 181% * * * 2% * * - 1% * 1% 1%
BG FACGK G BH
For use/To use/Usability
33 25 4 2 5 1 2 - 1 4 21 181% * * * 1% * * - * 1% 1% 1%
H G H BH
Other improve efficiency mentions
127 125 13 13 7 5 18 21 7 6 82 802% 2% 1% 2% 1% 1% 2% 2% 2% 2% 3% 3%
F ACE BDF
None
_________________________________________________________________________________________________________________Proportions/Means: Columns Tested (5% risk level) - A/B - C/D - E/F - G/H - I/J - K/L - A/C/E/G/I/K - B/D/F/H/J/LOverlap formulae used.
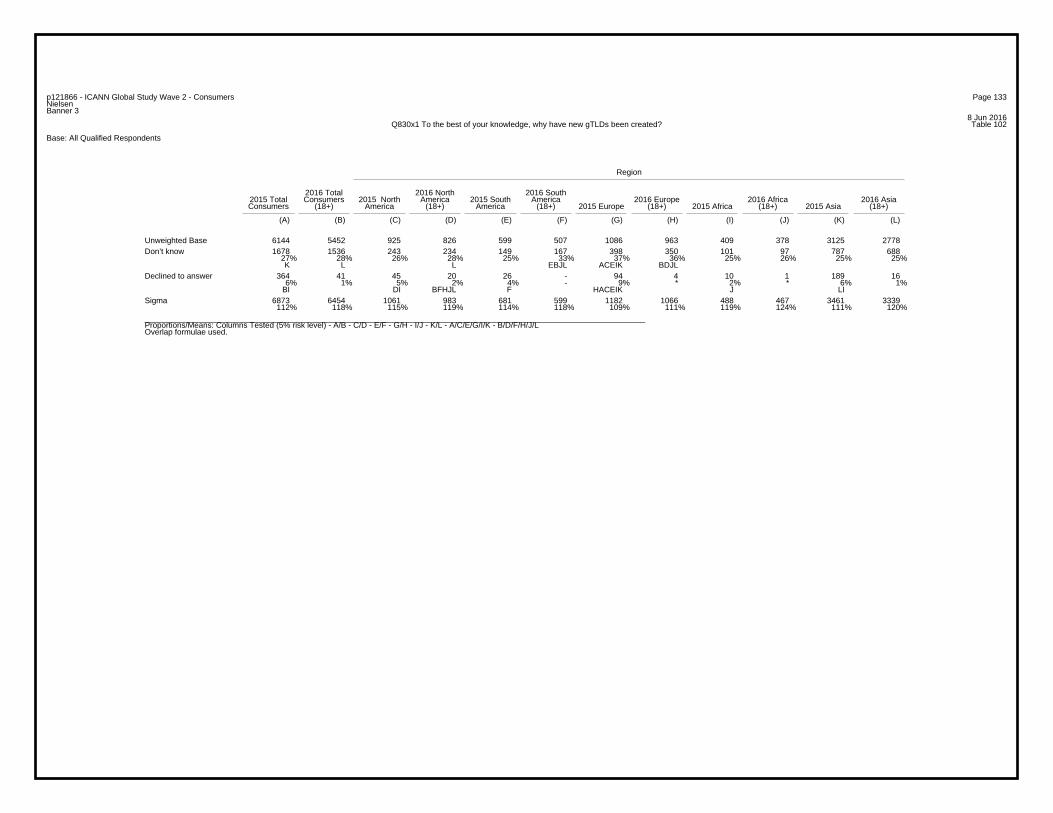
Page 133p121866 - ICANN Global Study Wave 2 - ConsumersNielsenBanner 3
8 Jun 2016Table 102Q830x1 To the best of your knowledge, why have new gTLDs been created?
Base: All Qualified Respondents
Region
2016 Total 2016 North 2016 South2015 Total Consumers 2015 North America 2015 South America 2016 Europe 2016 Africa 2016 AsiaConsumers (18+) America (18+) America (18+) 2015 Europe (18+) 2015 Africa (18+) 2015 Asia (18+)
(A) (B) (C) (D) (E) (F) (G) (H) (I) (J) (K) (L)
6144 5452 925 826 599 507 1086 963 409 378 3125 2778Unweighted Base1678 1536 243 234 149 167 398 350 101 97 787 688
27% 28% 26% 28% 25% 33% 37% 36% 25% 26% 25% 25%K L L EBJL ACEIK BDJL
Don’t know
364 41 45 20 26 - 94 4 10 1 189 166% 1% 5% 2% 4% - 9% * 2% * 6% 1%
BI DI BFHJL F HACEIK J LI
Declined to answer
6873 6454 1061 983 681 599 1182 1066 488 467 3461 3339112% 118% 115% 119% 114% 118% 109% 111% 119% 124% 111% 120%
Sigma
_________________________________________________________________________________________________________________Proportions/Means: Columns Tested (5% risk level) - A/B - C/D - E/F - G/H - I/J - K/L - A/C/E/G/I/K - B/D/F/H/J/LOverlap formulae used.
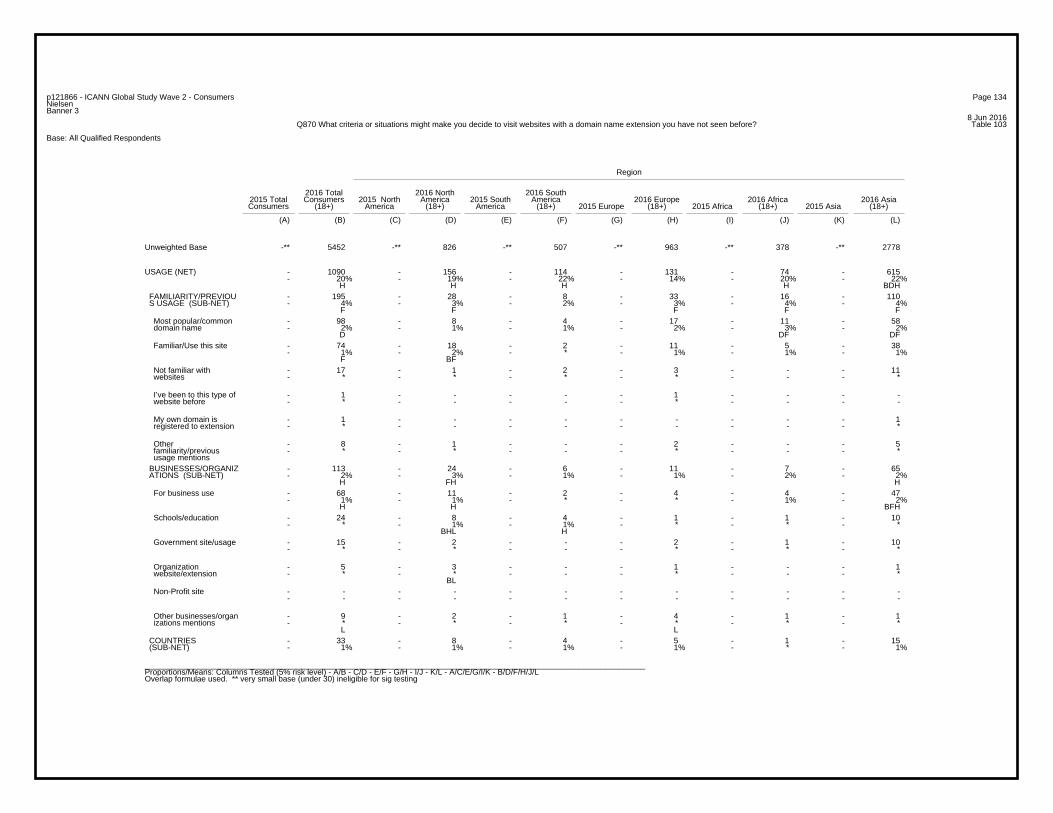
Page 134p121866 - ICANN Global Study Wave 2 - ConsumersNielsenBanner 3
8 Jun 2016Table 103Q870 What criteria or situations might make you decide to visit websites with a domain name extension you have not seen before?
Base: All Qualified Respondents
Region
2016 Total 2016 North 2016 South2015 Total Consumers 2015 North America 2015 South America 2016 Europe 2016 Africa 2016 AsiaConsumers (18+) America (18+) America (18+) 2015 Europe (18+) 2015 Africa (18+) 2015 Asia (18+)
(A) (B) (C) (D) (E) (F) (G) (H) (I) (J) (K) (L)
-** 5452 -** 826 -** 507 -** 963 -** 378 -** 2778Unweighted Base
- 1090 - 156 - 114 - 131 - 74 - 615- 20% - 19% - 22% - 14% - 20% - 22%
H H H H BDH
USAGE (NET)
- 195 - 28 - 8 - 33 - 16 - 110- 4% - 3% - 2% - 3% - 4% - 4%
F F F F F
FAMILIARITY/PREVIOU S USAGE (SUB-NET)
- 98 - 8 - 4 - 17 - 11 - 58- 2% - 1% - 1% - 2% - 3% - 2%
D DF DF
Most popular/common domain name
- 74 - 18 - 2 - 11 - 5 - 38- 1% - 2% - * - 1% - 1% - 1%
F BF
Familiar/Use this site
- 17 - 1 - 2 - 3 - - - 11- * - * - * - * - - - *
Not familiar with websites
- 1 - - - - - 1 - - - -- * - - - - - * - - - -
I’ve been to this type of website before
- 1 - - - - - - - - - 1- * - - - - - - - - - *
My own domain is registered to extension
- 8 - 1 - - - 2 - - - 5- * - * - - - * - - - *
Other familiarity/previous usage mentions
- 113 - 24 - 6 - 11 - 7 - 65- 2% - 3% - 1% - 1% - 2% - 2%
H FH H
BUSINESSES/ORGANIZ ATIONS (SUB-NET)
- 68 - 11 - 2 - 4 - 4 - 47- 1% - 1% - * - * - 1% - 2%
H H BFH
For business use
- 24 - 8 - 4 - 1 - 1 - 10- * - 1% - 1% - * - * - *
BHL H
Schools/education
- 15 - 2 - - - 2 - 1 - 10- * - * - - - * - * - *
Government site/usage
- 5 - 3 - - - 1 - - - 1- * - * - - - * - - - *
BL
Organization website/extension
- - - - - - - - - - - -- - - - - - - - - - - -
Non-Profit site
- 9 - 2 - 1 - 4 - 1 - 1- * - * - * - * - * - *
L L
Other businesses/organ izations mentions
- 33 - 8 - 4 - 5 - 1 - 15- 1% - 1% - 1% - 1% - * - 1%
COUNTRIES (SUB-NET)
_________________________________________________________________________________________________________________Proportions/Means: Columns Tested (5% risk level) - A/B - C/D - E/F - G/H - I/J - K/L - A/C/E/G/I/K - B/D/F/H/J/LOverlap formulae used. ** very small base (under 30) ineligible for sig testing
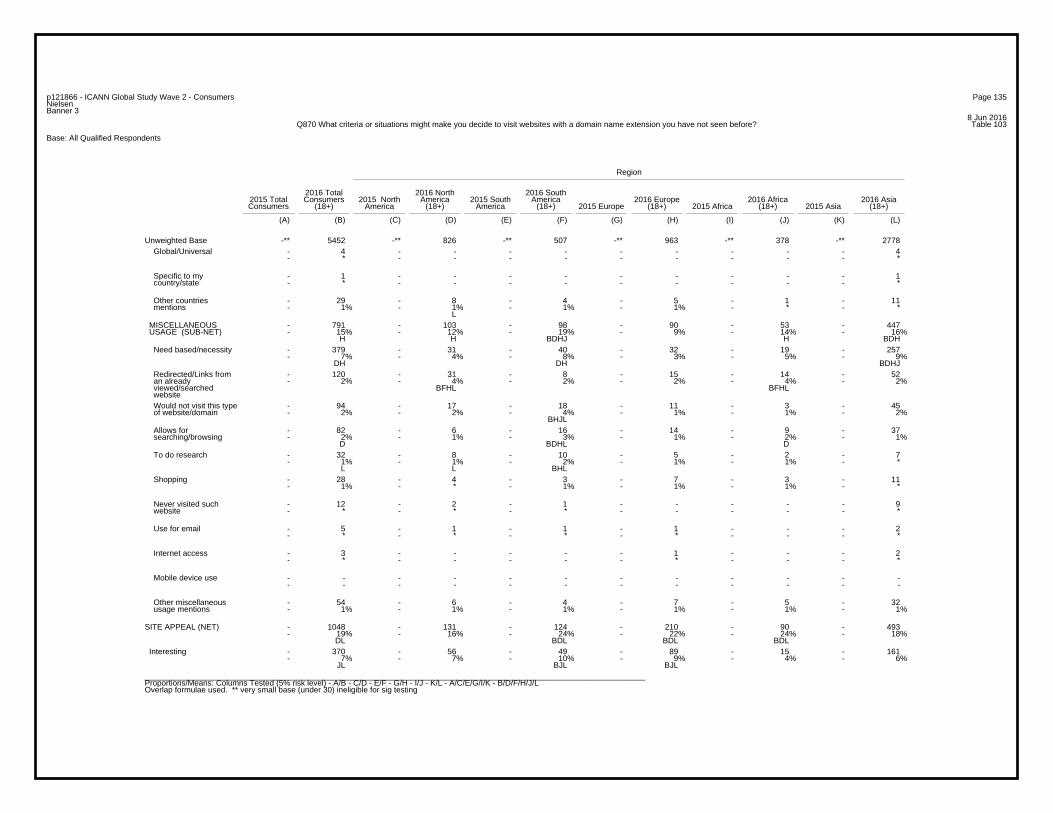
Page 135p121866 - ICANN Global Study Wave 2 - ConsumersNielsenBanner 3
8 Jun 2016Table 103Q870 What criteria or situations might make you decide to visit websites with a domain name extension you have not seen before?
Base: All Qualified Respondents
Region
2016 Total 2016 North 2016 South2015 Total Consumers 2015 North America 2015 South America 2016 Europe 2016 Africa 2016 AsiaConsumers (18+) America (18+) America (18+) 2015 Europe (18+) 2015 Africa (18+) 2015 Asia (18+)
(A) (B) (C) (D) (E) (F) (G) (H) (I) (J) (K) (L)
-** 5452 -** 826 -** 507 -** 963 -** 378 -** 2778Unweighted Base- 4 - - - - - - - - - 4- * - - - - - - - - - *
Global/Universal
- 1 - - - - - - - - - 1- * - - - - - - - - - *
Specific to my country/state
- 29 - 8 - 4 - 5 - 1 - 11- 1% - 1% - 1% - 1% - * - *
L
Other countries mentions
- 791 - 103 - 98 - 90 - 53 - 447- 15% - 12% - 19% - 9% - 14% - 16%
H H BDHJ H BDH
MISCELLANEOUS USAGE (SUB-NET)
- 379 - 31 - 40 - 32 - 19 - 257- 7% - 4% - 8% - 3% - 5% - 9%
DH DH BDHJ
Need based/necessity
- 120 - 31 - 8 - 15 - 14 - 52- 2% - 4% - 2% - 2% - 4% - 2%
BFHL BFHL
Redirected/Links from an already viewed/searched website
- 94 - 17 - 18 - 11 - 3 - 45- 2% - 2% - 4% - 1% - 1% - 2%
BHJL
Would not visit this type of website/domain
- 82 - 6 - 16 - 14 - 9 - 37- 2% - 1% - 3% - 1% - 2% - 1%
D BDHL D
Allows for searching/browsing
- 32 - 8 - 10 - 5 - 2 - 7- 1% - 1% - 2% - 1% - 1% - *
L L BHL
To do research
- 28 - 4 - 3 - 7 - 3 - 11- 1% - * - 1% - 1% - 1% - *
Shopping
- 12 - 2 - 1 - - - - - 9- * - * - * - - - - - *
Never visited such website
- 5 - 1 - 1 - 1 - - - 2- * - * - * - * - - - *
Use for email
- 3 - - - - - 1 - - - 2- * - - - - - * - - - *
Internet access
- - - - - - - - - - - -- - - - - - - - - - - -
Mobile device use
- 54 - 6 - 4 - 7 - 5 - 32- 1% - 1% - 1% - 1% - 1% - 1%
Other miscellaneous usage mentions
- 1048 - 131 - 124 - 210 - 90 - 493- 19% - 16% - 24% - 22% - 24% - 18%
DL BDL BDL BDL
SITE APPEAL (NET)
- 370 - 56 - 49 - 89 - 15 - 161- 7% - 7% - 10% - 9% - 4% - 6%
JL BJL BJL
Interesting
_________________________________________________________________________________________________________________Proportions/Means: Columns Tested (5% risk level) - A/B - C/D - E/F - G/H - I/J - K/L - A/C/E/G/I/K - B/D/F/H/J/LOverlap formulae used. ** very small base (under 30) ineligible for sig testing
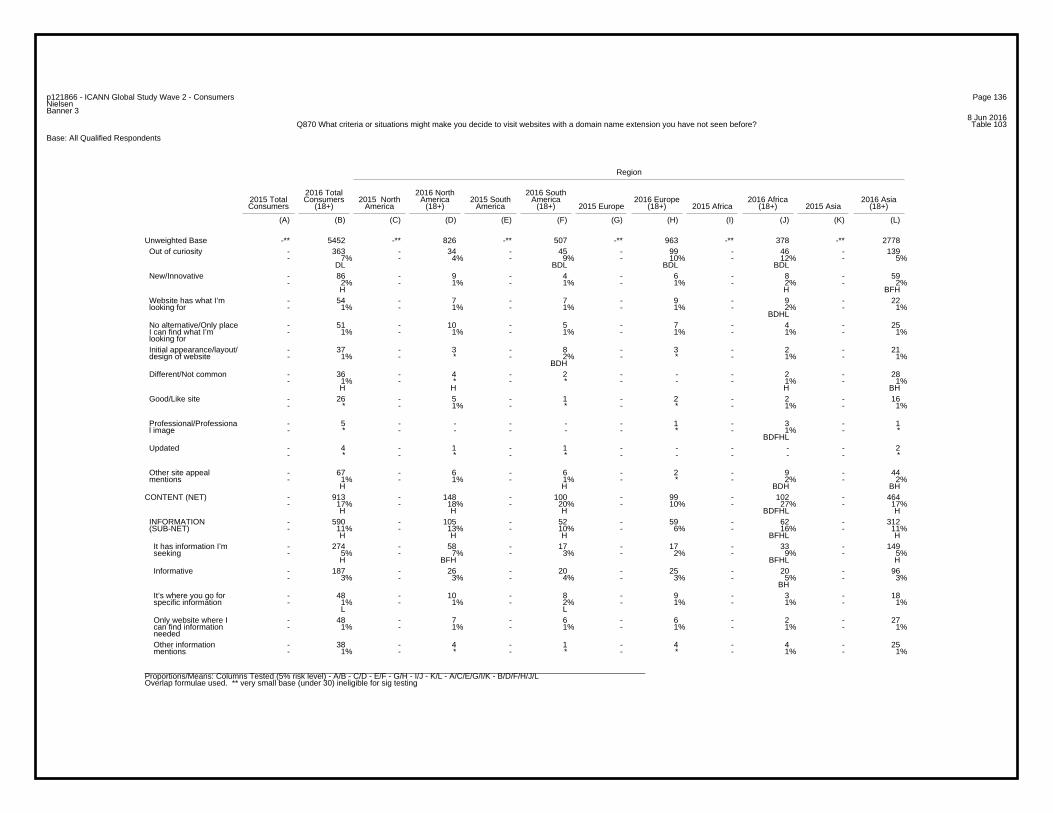
Page 136p121866 - ICANN Global Study Wave 2 - ConsumersNielsenBanner 3
8 Jun 2016Table 103Q870 What criteria or situations might make you decide to visit websites with a domain name extension you have not seen before?
Base: All Qualified Respondents
Region
2016 Total 2016 North 2016 South2015 Total Consumers 2015 North America 2015 South America 2016 Europe 2016 Africa 2016 AsiaConsumers (18+) America (18+) America (18+) 2015 Europe (18+) 2015 Africa (18+) 2015 Asia (18+)
(A) (B) (C) (D) (E) (F) (G) (H) (I) (J) (K) (L)
-** 5452 -** 826 -** 507 -** 963 -** 378 -** 2778Unweighted Base- 363 - 34 - 45 - 99 - 46 - 139- 7% - 4% - 9% - 10% - 12% - 5%
DL BDL BDL BDL
Out of curiosity
- 86 - 9 - 4 - 6 - 8 - 59- 2% - 1% - 1% - 1% - 2% - 2%
H H BFH
New/Innovative
- 54 - 7 - 7 - 9 - 9 - 22- 1% - 1% - 1% - 1% - 2% - 1%
BDHL
Website has what I’m looking for
- 51 - 10 - 5 - 7 - 4 - 25- 1% - 1% - 1% - 1% - 1% - 1%
No alternative/Only place I can find what I’m looking for
- 37 - 3 - 8 - 3 - 2 - 21- 1% - * - 2% - * - 1% - 1%
BDH
Initial appearance/layout/ design of website
- 36 - 4 - 2 - - - 2 - 28- 1% - * - * - - - 1% - 1%
H H H BH
Different/Not common
- 26 - 5 - 1 - 2 - 2 - 16- * - 1% - * - * - 1% - 1%
Good/Like site
- 5 - - - - - 1 - 3 - 1- * - - - - - * - 1% - *
BDFHL
Professional/Professiona l image
- 4 - 1 - 1 - - - - - 2- * - * - * - - - - - *
Updated
- 67 - 6 - 6 - 2 - 9 - 44- 1% - 1% - 1% - * - 2% - 2%
H H BDH BH
Other site appeal mentions
- 913 - 148 - 100 - 99 - 102 - 464- 17% - 18% - 20% - 10% - 27% - 17%
H H H BDFHL H
CONTENT (NET)
- 590 - 105 - 52 - 59 - 62 - 312- 11% - 13% - 10% - 6% - 16% - 11%
H H H BFHL H
INFORMATION (SUB-NET)
- 274 - 58 - 17 - 17 - 33 - 149- 5% - 7% - 3% - 2% - 9% - 5%
H BFH BFHL H
It has information I’m seeking
- 187 - 26 - 20 - 25 - 20 - 96- 3% - 3% - 4% - 3% - 5% - 3%
BH
Informative
- 48 - 10 - 8 - 9 - 3 - 18- 1% - 1% - 2% - 1% - 1% - 1%
L L
It’s where you go for specific information
- 48 - 7 - 6 - 6 - 2 - 27- 1% - 1% - 1% - 1% - 1% - 1%
Only website where I can find information needed
- 38 - 4 - 1 - 4 - 4 - 25- 1% - * - * - * - 1% - 1%
Other information mentions
_________________________________________________________________________________________________________________Proportions/Means: Columns Tested (5% risk level) - A/B - C/D - E/F - G/H - I/J - K/L - A/C/E/G/I/K - B/D/F/H/J/LOverlap formulae used. ** very small base (under 30) ineligible for sig testing
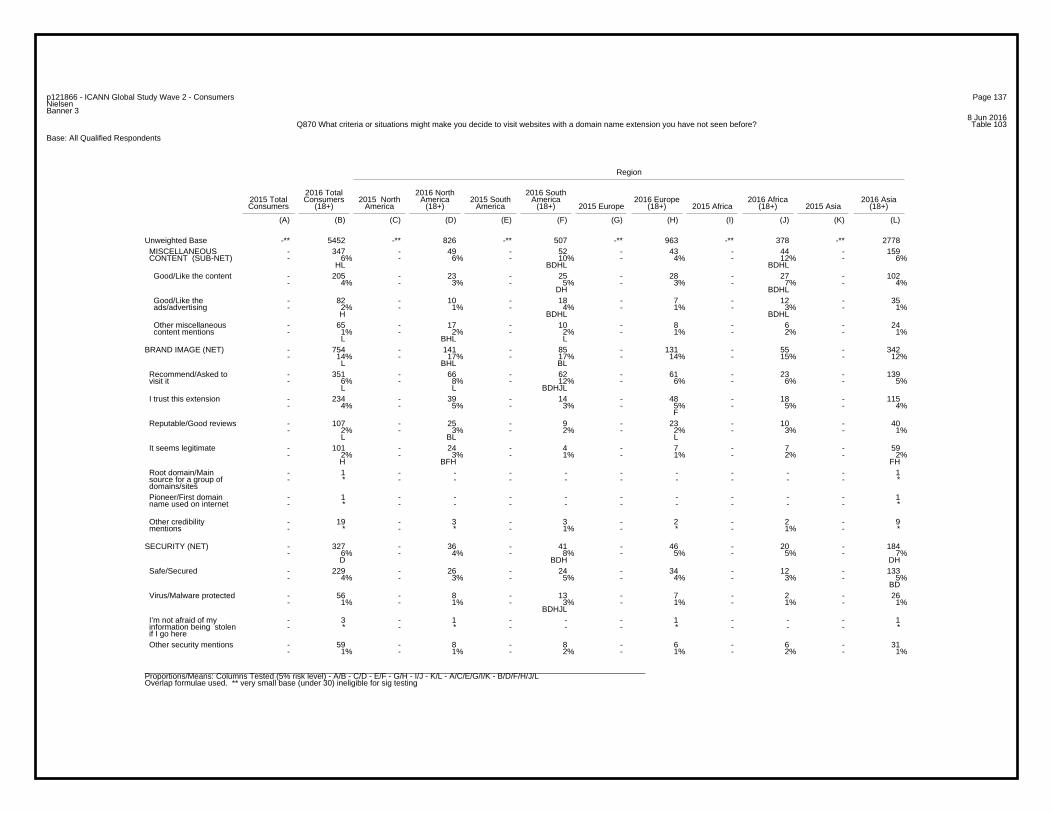
Page 137p121866 - ICANN Global Study Wave 2 - ConsumersNielsenBanner 3
8 Jun 2016Table 103Q870 What criteria or situations might make you decide to visit websites with a domain name extension you have not seen before?
Base: All Qualified Respondents
Region
2016 Total 2016 North 2016 South2015 Total Consumers 2015 North America 2015 South America 2016 Europe 2016 Africa 2016 AsiaConsumers (18+) America (18+) America (18+) 2015 Europe (18+) 2015 Africa (18+) 2015 Asia (18+)
(A) (B) (C) (D) (E) (F) (G) (H) (I) (J) (K) (L)
-** 5452 -** 826 -** 507 -** 963 -** 378 -** 2778Unweighted Base- 347 - 49 - 52 - 43 - 44 - 159- 6% - 6% - 10% - 4% - 12% - 6%
HL BDHL BDHL
MISCELLANEOUS CONTENT (SUB-NET)
- 205 - 23 - 25 - 28 - 27 - 102- 4% - 3% - 5% - 3% - 7% - 4%
DH BDHL
Good/Like the content
- 82 - 10 - 18 - 7 - 12 - 35- 2% - 1% - 4% - 1% - 3% - 1%
H BDHL BDHL
Good/Like the ads/advertising
- 65 - 17 - 10 - 8 - 6 - 24- 1% - 2% - 2% - 1% - 2% - 1%
L BHL L
Other miscellaneous content mentions
- 754 - 141 - 85 - 131 - 55 - 342- 14% - 17% - 17% - 14% - 15% - 12%
L BHL BL
BRAND IMAGE (NET)
- 351 - 66 - 62 - 61 - 23 - 139- 6% - 8% - 12% - 6% - 6% - 5%
L L BDHJL
Recommend/Asked to visit it
- 234 - 39 - 14 - 48 - 18 - 115- 4% - 5% - 3% - 5% - 5% - 4%
F
I trust this extension
- 107 - 25 - 9 - 23 - 10 - 40- 2% - 3% - 2% - 2% - 3% - 1%
L BL L
Reputable/Good reviews
- 101 - 24 - 4 - 7 - 7 - 59- 2% - 3% - 1% - 1% - 2% - 2%
H BFH FH
It seems legitimate
- 1 - - - - - - - - - 1- * - - - - - - - - - *
Root domain/Main source for a group of domains/sites
- 1 - - - - - - - - - 1- * - - - - - - - - - *
Pioneer/First domain name used on internet
- 19 - 3 - 3 - 2 - 2 - 9- * - * - 1% - * - 1% - *
Other credibility mentions
- 327 - 36 - 41 - 46 - 20 - 184- 6% - 4% - 8% - 5% - 5% - 7%
D BDH DH
SECURITY (NET)
- 229 - 26 - 24 - 34 - 12 - 133- 4% - 3% - 5% - 4% - 3% - 5%
BD
Safe/Secured
- 56 - 8 - 13 - 7 - 2 - 26- 1% - 1% - 3% - 1% - 1% - 1%
BDHJL
Virus/Malware protected
- 3 - 1 - - - 1 - - - 1- * - * - - - * - - - *
I’m not afraid of my information being stolen if I go here
- 59 - 8 - 8 - 6 - 6 - 31- 1% - 1% - 2% - 1% - 2% - 1%
Other security mentions
_________________________________________________________________________________________________________________Proportions/Means: Columns Tested (5% risk level) - A/B - C/D - E/F - G/H - I/J - K/L - A/C/E/G/I/K - B/D/F/H/J/LOverlap formulae used. ** very small base (under 30) ineligible for sig testing

Page 138p121866 - ICANN Global Study Wave 2 - ConsumersNielsenBanner 3
8 Jun 2016Table 103Q870 What criteria or situations might make you decide to visit websites with a domain name extension you have not seen before?
Base: All Qualified Respondents
Region
2016 Total 2016 North 2016 South2015 Total Consumers 2015 North America 2015 South America 2016 Europe 2016 Africa 2016 AsiaConsumers (18+) America (18+) America (18+) 2015 Europe (18+) 2015 Africa (18+) 2015 Asia (18+)
(A) (B) (C) (D) (E) (F) (G) (H) (I) (J) (K) (L)
-** 5452 -** 826 -** 507 -** 963 -** 378 -** 2778Unweighted Base- 191 - 26 - 13 - 22 - 18 - 112- 4% - 3% - 3% - 2% - 5% - 4%
H H BH
DOMAIN/NAME/EXTENSION (NET)
- 46 - 7 - 3 - 6 - 10 - 20- 1% - 1% - 1% - 1% - 3% - 1%
BDFHL
Good/Like name
- 11 - 2 - - - 1 - - - 8- * - * - - - * - - - *
Site name (Spec.)
- 5 - - - - - - - - - 5- * - - - - - - - - - *
Easy to remember name
- 135 - 18 - 11 - 15 - 8 - 83- 2% - 2% - 2% - 2% - 2% - 3%
H BH
Other domain/name/extension mentions
- 187 - 35 - 15 - 27 - 15 - 95- 3% - 4% - 3% - 3% - 4% - 3%
RESEARCH (NET)
- 161 - 32 - 14 - 22 - 14 - 79- 3% - 4% - 3% - 2% - 4% - 3%
Researching website online/Internet/Google search on website
- 26 - 3 - 1 - 5 - 1 - 16- * - * - * - 1% - * - 1%
Other research mentions
- 169 - 17 - 7 - 68 - 1 - 76- 3% - 2% - 1% - 7% - * - 3%
FJ J BDFJL J
Illegible data
- 132 - 25 - 16 - 19 - 16 - 56- 2% - 3% - 3% - 2% - 4% - 2%
L BHL
PERFORMANCE (NET)
- 70 - 13 - 16 - 13 - 7 - 21- 1% - 2% - 3% - 1% - 2% - 1%
L L BHL L
Reliable/No problems
- 42 - 12 - - - 4 - 5 - 21- 1% - 1% - - - * - 1% - 1%
F BFH F F
Good results/search results
- 16 - - - - - 2 - 5 - 9- * - - - - - * - 1% - *
BDFHL
High speed/fast
- 7 - - - - - - - 1 - 6- * - - - - - - - * - *
Other performance mentions
- 95 - 8 - 6 - 9 - 14 - 58- 2% - 1% - 1% - 1% - 4% - 2%
H BDFHL DH
FUNCTIONALITY (NET)
- 63 - 6 - 3 - 6 - 8 - 40- 1% - 1% - 1% - 1% - 2% - 1%
DFH H
Practical/Useful/Helpful website
- 14 - 1 - 2 - - - 3 - 8- * - * - * - - - 1% - *
BH
Easy to use/navigate
_________________________________________________________________________________________________________________Proportions/Means: Columns Tested (5% risk level) - A/B - C/D - E/F - G/H - I/J - K/L - A/C/E/G/I/K - B/D/F/H/J/LOverlap formulae used. ** very small base (under 30) ineligible for sig testing
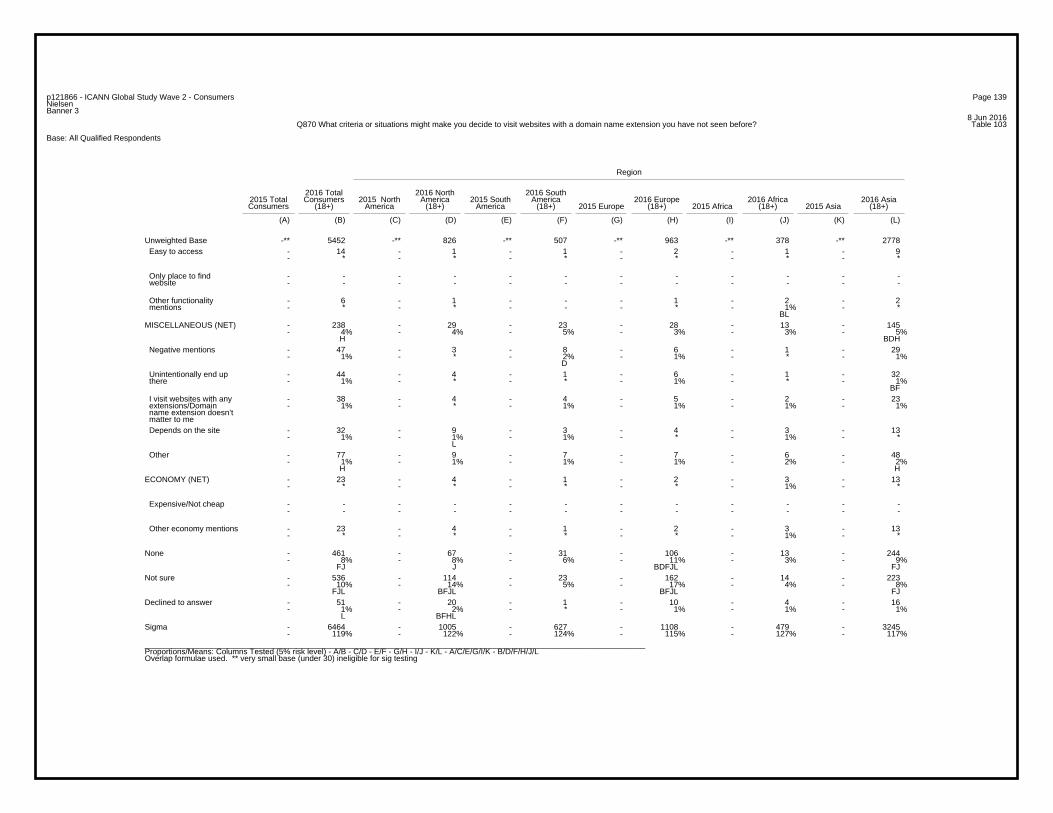
Page 139p121866 - ICANN Global Study Wave 2 - ConsumersNielsenBanner 3
8 Jun 2016Table 103Q870 What criteria or situations might make you decide to visit websites with a domain name extension you have not seen before?
Base: All Qualified Respondents
Region
2016 Total 2016 North 2016 South2015 Total Consumers 2015 North America 2015 South America 2016 Europe 2016 Africa 2016 AsiaConsumers (18+) America (18+) America (18+) 2015 Europe (18+) 2015 Africa (18+) 2015 Asia (18+)
(A) (B) (C) (D) (E) (F) (G) (H) (I) (J) (K) (L)
-** 5452 -** 826 -** 507 -** 963 -** 378 -** 2778Unweighted Base- 14 - 1 - 1 - 2 - 1 - 9- * - * - * - * - * - *
Easy to access
- - - - - - - - - - - -- - - - - - - - - - - -
Only place to find website
- 6 - 1 - - - 1 - 2 - 2- * - * - - - * - 1% - *
BL
Other functionality mentions
- 238 - 29 - 23 - 28 - 13 - 145- 4% - 4% - 5% - 3% - 3% - 5%
H BDH
MISCELLANEOUS (NET)
- 47 - 3 - 8 - 6 - 1 - 29- 1% - * - 2% - 1% - * - 1%
D
Negative mentions
- 44 - 4 - 1 - 6 - 1 - 32- 1% - * - * - 1% - * - 1%
BF
Unintentionally end up there
- 38 - 4 - 4 - 5 - 2 - 23- 1% - * - 1% - 1% - 1% - 1%
I visit websites with any extensions/Domain name extension doesn’t matter to me
- 32 - 9 - 3 - 4 - 3 - 13- 1% - 1% - 1% - * - 1% - *
L
Depends on the site
- 77 - 9 - 7 - 7 - 6 - 48- 1% - 1% - 1% - 1% - 2% - 2%
H H
Other
- 23 - 4 - 1 - 2 - 3 - 13- * - * - * - * - 1% - *
ECONOMY (NET)
- - - - - - - - - - - -- - - - - - - - - - - -
Expensive/Not cheap
- 23 - 4 - 1 - 2 - 3 - 13- * - * - * - * - 1% - *
Other economy mentions
- 461 - 67 - 31 - 106 - 13 - 244- 8% - 8% - 6% - 11% - 3% - 9%
FJ J BDFJL FJ
None
- 536 - 114 - 23 - 162 - 14 - 223- 10% - 14% - 5% - 17% - 4% - 8%
FJL BFJL BFJL FJ
Not sure
- 51 - 20 - 1 - 10 - 4 - 16- 1% - 2% - * - 1% - 1% - 1%
L BFHL
Declined to answer
- 6464 - 1005 - 627 - 1108 - 479 - 3245- 119% - 122% - 124% - 115% - 127% - 117%
Sigma
_________________________________________________________________________________________________________________Proportions/Means: Columns Tested (5% risk level) - A/B - C/D - E/F - G/H - I/J - K/L - A/C/E/G/I/K - B/D/F/H/J/LOverlap formulae used. ** very small base (under 30) ineligible for sig testing
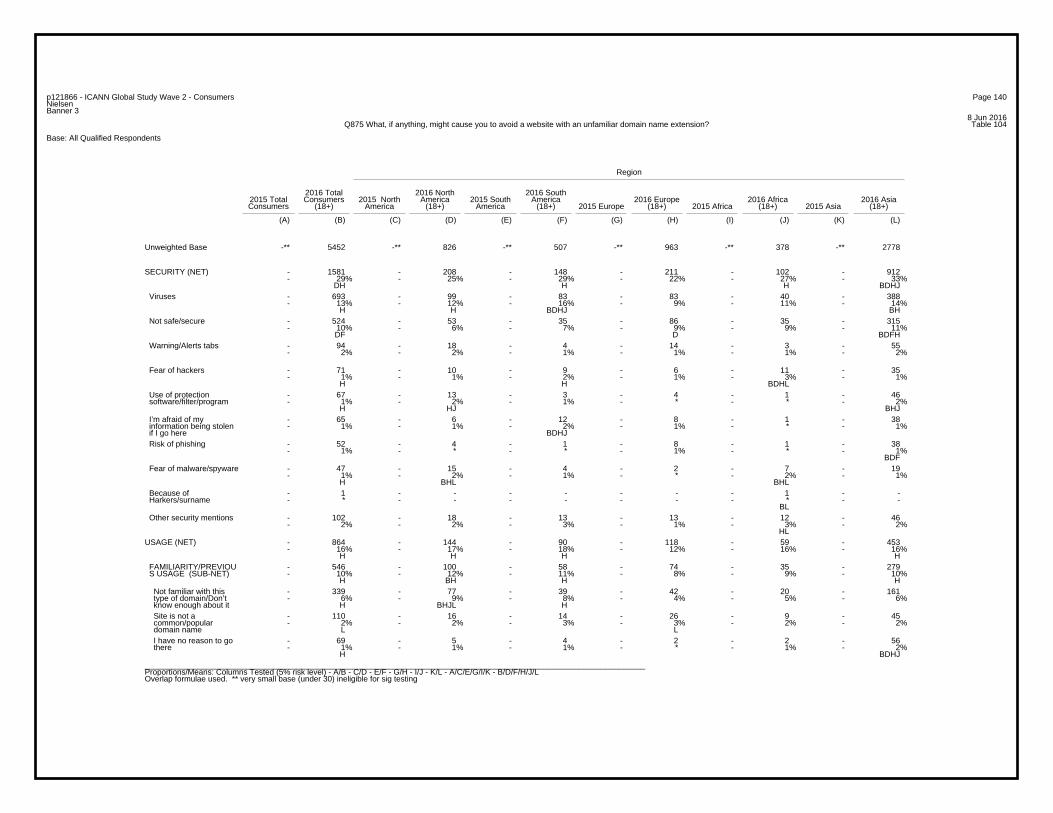
Page 140p121866 - ICANN Global Study Wave 2 - ConsumersNielsenBanner 3
8 Jun 2016Table 104Q875 What, if anything, might cause you to avoid a website with an unfamiliar domain name extension?
Base: All Qualified Respondents
Region
2016 Total 2016 North 2016 South2015 Total Consumers 2015 North America 2015 South America 2016 Europe 2016 Africa 2016 AsiaConsumers (18+) America (18+) America (18+) 2015 Europe (18+) 2015 Africa (18+) 2015 Asia (18+)
(A) (B) (C) (D) (E) (F) (G) (H) (I) (J) (K) (L)
-** 5452 -** 826 -** 507 -** 963 -** 378 -** 2778Unweighted Base
- 1581 - 208 - 148 - 211 - 102 - 912- 29% - 25% - 29% - 22% - 27% - 33%
DH H H BDHJ
SECURITY (NET)
- 693 - 99 - 83 - 83 - 40 - 388- 13% - 12% - 16% - 9% - 11% - 14%
H H BDHJ BH
Viruses
- 524 - 53 - 35 - 86 - 35 - 315- 10% - 6% - 7% - 9% - 9% - 11%
DF D BDFH
Not safe/secure
- 94 - 18 - 4 - 14 - 3 - 55- 2% - 2% - 1% - 1% - 1% - 2%
Warning/Alerts tabs
- 71 - 10 - 9 - 6 - 11 - 35- 1% - 1% - 2% - 1% - 3% - 1%
H H BDHL
Fear of hackers
- 67 - 13 - 3 - 4 - 1 - 46- 1% - 2% - 1% - * - * - 2%
H HJ BHJ
Use of protection software/filter/program
- 65 - 6 - 12 - 8 - 1 - 38- 1% - 1% - 2% - 1% - * - 1%
BDHJ
I’m afraid of my information being stolen if I go here
- 52 - 4 - 1 - 8 - 1 - 38- 1% - * - * - 1% - * - 1%
BDF
Risk of phishing
- 47 - 15 - 4 - 2 - 7 - 19- 1% - 2% - 1% - * - 2% - 1%
H BHL BHL
Fear of malware/spyware
- 1 - - - - - - - 1 - -- * - - - - - - - * - -
BL
Because of Harkers/surname
- 102 - 18 - 13 - 13 - 12 - 46- 2% - 2% - 3% - 1% - 3% - 2%
HL
Other security mentions
- 864 - 144 - 90 - 118 - 59 - 453- 16% - 17% - 18% - 12% - 16% - 16%
H H H H
USAGE (NET)
- 546 - 100 - 58 - 74 - 35 - 279- 10% - 12% - 11% - 8% - 9% - 10%
H BH H H
FAMILIARITY/PREVIOU S USAGE (SUB-NET)
- 339 - 77 - 39 - 42 - 20 - 161- 6% - 9% - 8% - 4% - 5% - 6%
H BHJL H
Not familiar with this type of domain/Don’t know enough about it
- 110 - 16 - 14 - 26 - 9 - 45- 2% - 2% - 3% - 3% - 2% - 2%
L L
Site is not a common/popular domain name
- 69 - 5 - 4 - 2 - 2 - 56- 1% - 1% - 1% - * - 1% - 2%
H BDHJ
I have no reason to go there
_________________________________________________________________________________________________________________Proportions/Means: Columns Tested (5% risk level) - A/B - C/D - E/F - G/H - I/J - K/L - A/C/E/G/I/K - B/D/F/H/J/LOverlap formulae used. ** very small base (under 30) ineligible for sig testing
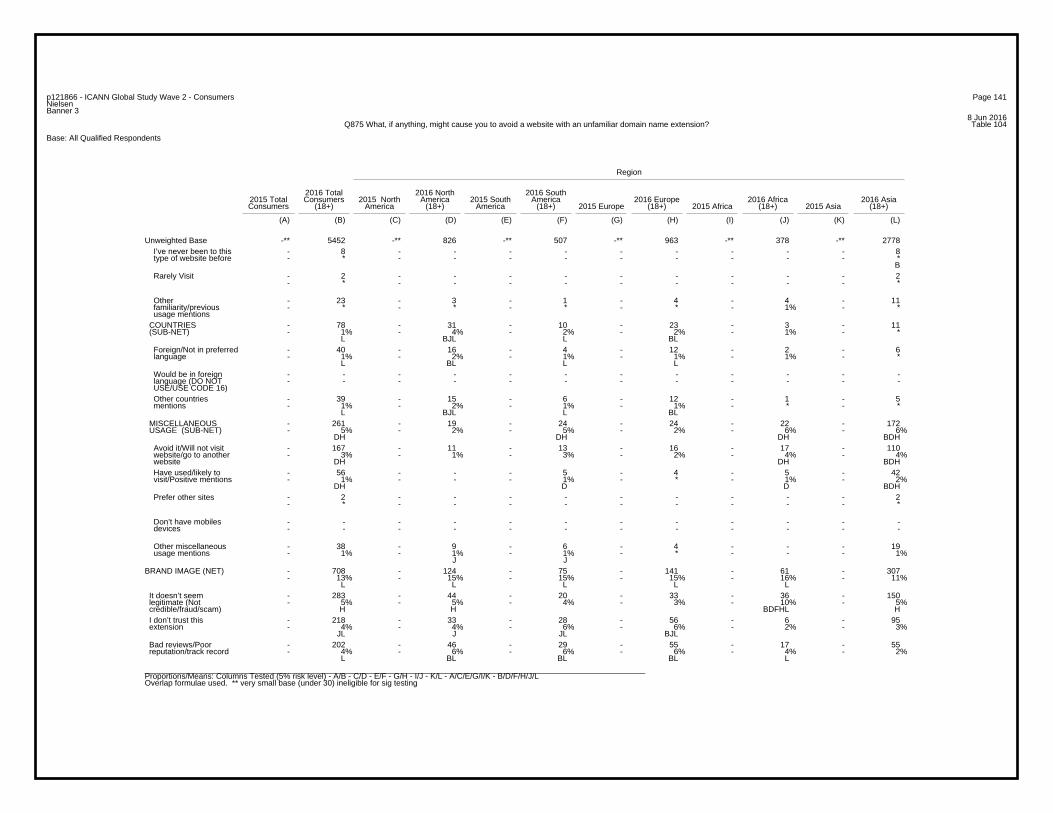
Page 141p121866 - ICANN Global Study Wave 2 - ConsumersNielsenBanner 3
8 Jun 2016Table 104Q875 What, if anything, might cause you to avoid a website with an unfamiliar domain name extension?
Base: All Qualified Respondents
Region
2016 Total 2016 North 2016 South2015 Total Consumers 2015 North America 2015 South America 2016 Europe 2016 Africa 2016 AsiaConsumers (18+) America (18+) America (18+) 2015 Europe (18+) 2015 Africa (18+) 2015 Asia (18+)
(A) (B) (C) (D) (E) (F) (G) (H) (I) (J) (K) (L)
-** 5452 -** 826 -** 507 -** 963 -** 378 -** 2778Unweighted Base- 8 - - - - - - - - - 8- * - - - - - - - - - *
B
I’ve never been to this type of website before
- 2 - - - - - - - - - 2- * - - - - - - - - - *
Rarely Visit
- 23 - 3 - 1 - 4 - 4 - 11- * - * - * - * - 1% - *
Other familiarity/previous usage mentions
- 78 - 31 - 10 - 23 - 3 - 11- 1% - 4% - 2% - 2% - 1% - *
L BJL L BL
COUNTRIES (SUB-NET)
- 40 - 16 - 4 - 12 - 2 - 6- 1% - 2% - 1% - 1% - 1% - *
L BL L L
Foreign/Not in preferred language
- - - - - - - - - - - -- - - - - - - - - - - -
Would be in foreign language (DO NOT USE/USE CODE 16)
- 39 - 15 - 6 - 12 - 1 - 5- 1% - 2% - 1% - 1% - * - *
L BJL L BL
Other countries mentions
- 261 - 19 - 24 - 24 - 22 - 172- 5% - 2% - 5% - 2% - 6% - 6%
DH DH DH BDH
MISCELLANEOUS USAGE (SUB-NET)
- 167 - 11 - 13 - 16 - 17 - 110- 3% - 1% - 3% - 2% - 4% - 4%
DH DH BDH
Avoid it/Will not visit website/go to another website
- 56 - - - 5 - 4 - 5 - 42- 1% - - - 1% - * - 1% - 2%
DH D D BDH
Have used/likely to visit/Positive mentions
- 2 - - - - - - - - - 2- * - - - - - - - - - *
Prefer other sites
- - - - - - - - - - - -- - - - - - - - - - - -
Don’t have mobiles devices
- 38 - 9 - 6 - 4 - - - 19- 1% - 1% - 1% - * - - - 1%
J J
Other miscellaneous usage mentions
- 708 - 124 - 75 - 141 - 61 - 307- 13% - 15% - 15% - 15% - 16% - 11%
L L L L L
BRAND IMAGE (NET)
- 283 - 44 - 20 - 33 - 36 - 150- 5% - 5% - 4% - 3% - 10% - 5%
H H BDFHL H
It doesn’t seem legitimate (Not credible/fraud/scam)
- 218 - 33 - 28 - 56 - 6 - 95- 4% - 4% - 6% - 6% - 2% - 3%
JL J JL BJL
I don’t trust this extension
- 202 - 46 - 29 - 55 - 17 - 55- 4% - 6% - 6% - 6% - 4% - 2%
L BL BL BL L
Bad reviews/Poor reputation/track record
_________________________________________________________________________________________________________________Proportions/Means: Columns Tested (5% risk level) - A/B - C/D - E/F - G/H - I/J - K/L - A/C/E/G/I/K - B/D/F/H/J/LOverlap formulae used. ** very small base (under 30) ineligible for sig testing
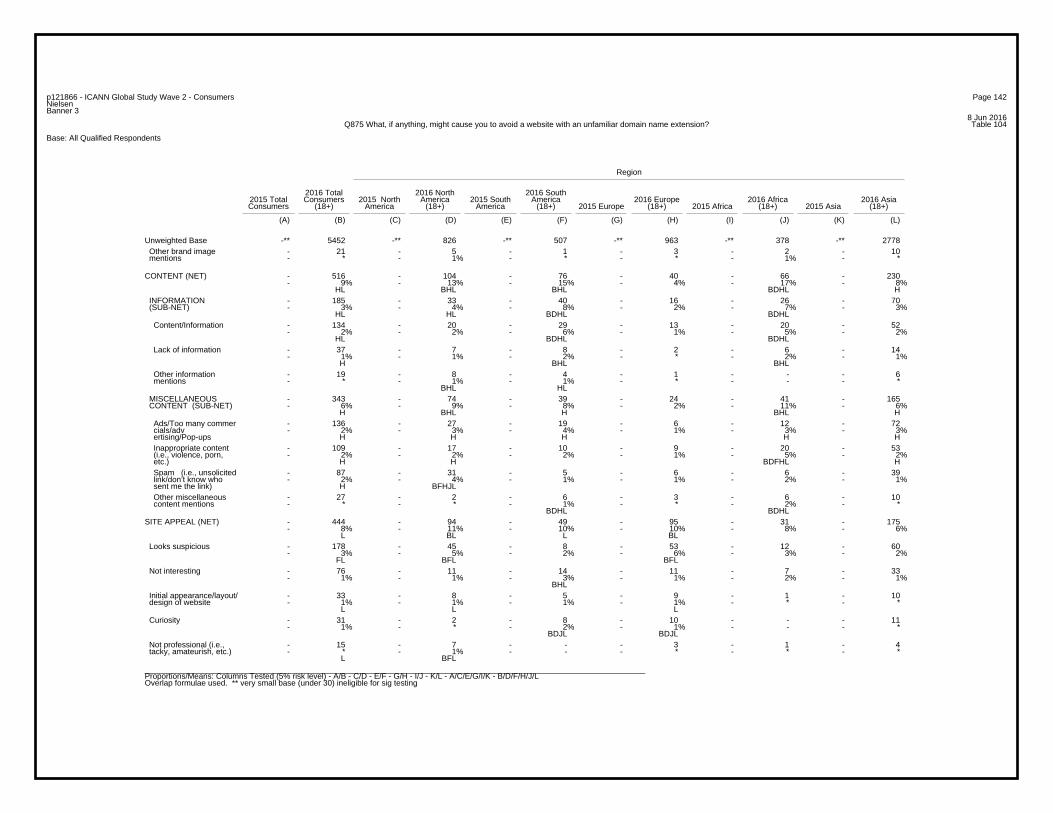
Page 142p121866 - ICANN Global Study Wave 2 - ConsumersNielsenBanner 3
8 Jun 2016Table 104Q875 What, if anything, might cause you to avoid a website with an unfamiliar domain name extension?
Base: All Qualified Respondents
Region
2016 Total 2016 North 2016 South2015 Total Consumers 2015 North America 2015 South America 2016 Europe 2016 Africa 2016 AsiaConsumers (18+) America (18+) America (18+) 2015 Europe (18+) 2015 Africa (18+) 2015 Asia (18+)
(A) (B) (C) (D) (E) (F) (G) (H) (I) (J) (K) (L)
-** 5452 -** 826 -** 507 -** 963 -** 378 -** 2778Unweighted Base- 21 - 5 - 1 - 3 - 2 - 10- * - 1% - * - * - 1% - *
Other brand image mentions
- 516 - 104 - 76 - 40 - 66 - 230- 9% - 13% - 15% - 4% - 17% - 8%
HL BHL BHL BDHL H
CONTENT (NET)
- 185 - 33 - 40 - 16 - 26 - 70- 3% - 4% - 8% - 2% - 7% - 3%
HL HL BDHL BDHL
INFORMATION (SUB-NET)
- 134 - 20 - 29 - 13 - 20 - 52- 2% - 2% - 6% - 1% - 5% - 2%
HL BDHL BDHL
Content/Information
- 37 - 7 - 8 - 2 - 6 - 14- 1% - 1% - 2% - * - 2% - 1%
H BHL BHL
Lack of information
- 19 - 8 - 4 - 1 - - - 6- * - 1% - 1% - * - - - *
BHL HL
Other information mentions
- 343 - 74 - 39 - 24 - 41 - 165- 6% - 9% - 8% - 2% - 11% - 6%
H BHL H BHL H
MISCELLANEOUS CONTENT (SUB-NET)
- 136 - 27 - 19 - 6 - 12 - 72- 2% - 3% - 4% - 1% - 3% - 3%
H H H H H
Ads/Too many commer cials/adv ertising/Pop-ups
- 109 - 17 - 10 - 9 - 20 - 53- 2% - 2% - 2% - 1% - 5% - 2%
H H BDFHL H
Inappropriate content (i.e., violence, porn, etc.)
- 87 - 31 - 5 - 6 - 6 - 39- 2% - 4% - 1% - 1% - 2% - 1%
H BFHJL
Spam (i.e., unsolicited link/don’t know who sent me the link)
- 27 - 2 - 6 - 3 - 6 - 10- * - * - 1% - * - 2% - *
BDHL BDHL
Other miscellaneous content mentions
- 444 - 94 - 49 - 95 - 31 - 175- 8% - 11% - 10% - 10% - 8% - 6%
L BL L BL
SITE APPEAL (NET)
- 178 - 45 - 8 - 53 - 12 - 60- 3% - 5% - 2% - 6% - 3% - 2%
FL BFL BFL
Looks suspicious
- 76 - 11 - 14 - 11 - 7 - 33- 1% - 1% - 3% - 1% - 2% - 1%
BHL
Not interesting
- 33 - 8 - 5 - 9 - 1 - 10- 1% - 1% - 1% - 1% - * - *
L L L
Initial appearance/layout/ design of website
- 31 - 2 - 8 - 10 - - - 11- 1% - * - 2% - 1% - - - *
BDJL BDJL
Curiosity
- 15 - 7 - - - 3 - 1 - 4- * - 1% - - - * - * - *
L BFL
Not professional (i.e., tacky, amateurish, etc.)
_________________________________________________________________________________________________________________Proportions/Means: Columns Tested (5% risk level) - A/B - C/D - E/F - G/H - I/J - K/L - A/C/E/G/I/K - B/D/F/H/J/LOverlap formulae used. ** very small base (under 30) ineligible for sig testing
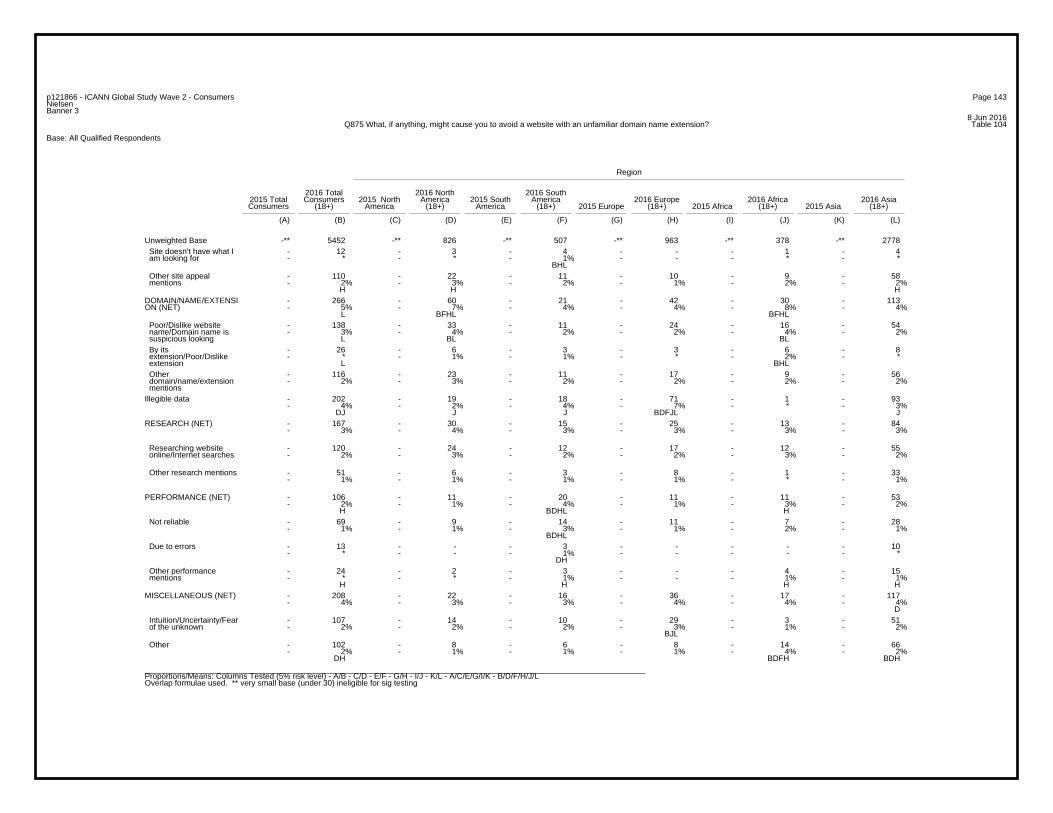
Page 143p121866 - ICANN Global Study Wave 2 - ConsumersNielsenBanner 3
8 Jun 2016Table 104Q875 What, if anything, might cause you to avoid a website with an unfamiliar domain name extension?
Base: All Qualified Respondents
Region
2016 Total 2016 North 2016 South2015 Total Consumers 2015 North America 2015 South America 2016 Europe 2016 Africa 2016 AsiaConsumers (18+) America (18+) America (18+) 2015 Europe (18+) 2015 Africa (18+) 2015 Asia (18+)
(A) (B) (C) (D) (E) (F) (G) (H) (I) (J) (K) (L)
-** 5452 -** 826 -** 507 -** 963 -** 378 -** 2778Unweighted Base- 12 - 3 - 4 - - - 1 - 4- * - * - 1% - - - * - *
BHL
Site doesn’t have what I am looking for
- 110 - 22 - 11 - 10 - 9 - 58- 2% - 3% - 2% - 1% - 2% - 2%
H H H
Other site appeal mentions
- 266 - 60 - 21 - 42 - 30 - 113- 5% - 7% - 4% - 4% - 8% - 4%
L BFHL BFHL
DOMAIN/NAME/EXTENSION (NET)
- 138 - 33 - 11 - 24 - 16 - 54- 3% - 4% - 2% - 2% - 4% - 2%
L BL BL
Poor/Dislike website name/Domain name is suspicious looking
- 26 - 6 - 3 - 3 - 6 - 8- * - 1% - 1% - * - 2% - *
L BHL
By its extension/Poor/Dislike extension
- 116 - 23 - 11 - 17 - 9 - 56- 2% - 3% - 2% - 2% - 2% - 2%
Other domain/name/extension mentions
- 202 - 19 - 18 - 71 - 1 - 93- 4% - 2% - 4% - 7% - * - 3%
DJ J J BDFJL J
Illegible data
- 167 - 30 - 15 - 25 - 13 - 84- 3% - 4% - 3% - 3% - 3% - 3%
RESEARCH (NET)
- 120 - 24 - 12 - 17 - 12 - 55- 2% - 3% - 2% - 2% - 3% - 2%
Researching website online/Internet searches
- 51 - 6 - 3 - 8 - 1 - 33- 1% - 1% - 1% - 1% - * - 1%
Other research mentions
- 106 - 11 - 20 - 11 - 11 - 53- 2% - 1% - 4% - 1% - 3% - 2%
H BDHL H
PERFORMANCE (NET)
- 69 - 9 - 14 - 11 - 7 - 28- 1% - 1% - 3% - 1% - 2% - 1%
BDHL
Not reliable
- 13 - - - 3 - - - - - 10- * - - - 1% - - - - - *
DH
Due to errors
- 24 - 2 - 3 - - - 4 - 15- * - * - 1% - - - 1% - 1%
H H H H
Other performance mentions
- 208 - 22 - 16 - 36 - 17 - 117- 4% - 3% - 3% - 4% - 4% - 4%
D
MISCELLANEOUS (NET)
- 107 - 14 - 10 - 29 - 3 - 51- 2% - 2% - 2% - 3% - 1% - 2%
BJL
Intuition/Uncertainty/Fear of the unknown
- 102 - 8 - 6 - 8 - 14 - 66- 2% - 1% - 1% - 1% - 4% - 2%
DH BDFH BDH
Other
_________________________________________________________________________________________________________________Proportions/Means: Columns Tested (5% risk level) - A/B - C/D - E/F - G/H - I/J - K/L - A/C/E/G/I/K - B/D/F/H/J/LOverlap formulae used. ** very small base (under 30) ineligible for sig testing
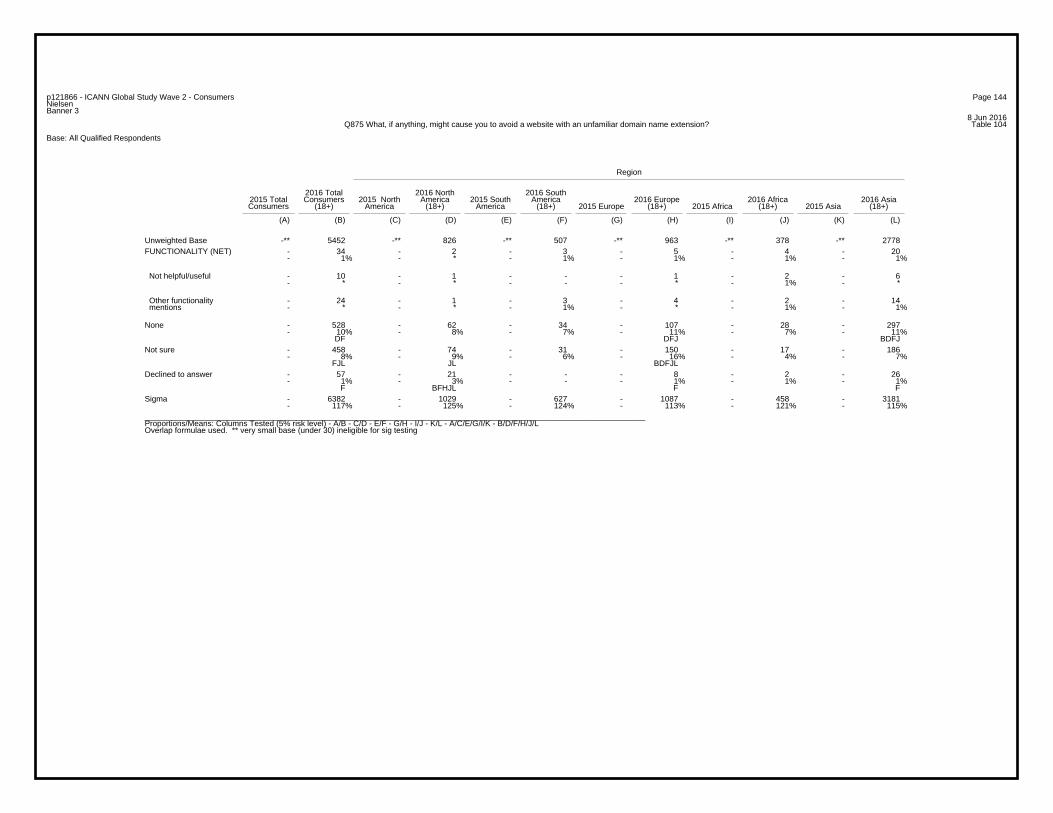
Page 144p121866 - ICANN Global Study Wave 2 - ConsumersNielsenBanner 3
8 Jun 2016Table 104Q875 What, if anything, might cause you to avoid a website with an unfamiliar domain name extension?
Base: All Qualified Respondents
Region
2016 Total 2016 North 2016 South2015 Total Consumers 2015 North America 2015 South America 2016 Europe 2016 Africa 2016 AsiaConsumers (18+) America (18+) America (18+) 2015 Europe (18+) 2015 Africa (18+) 2015 Asia (18+)
(A) (B) (C) (D) (E) (F) (G) (H) (I) (J) (K) (L)
-** 5452 -** 826 -** 507 -** 963 -** 378 -** 2778Unweighted Base- 34 - 2 - 3 - 5 - 4 - 20- 1% - * - 1% - 1% - 1% - 1%
FUNCTIONALITY (NET)
- 10 - 1 - - - 1 - 2 - 6- * - * - - - * - 1% - *
Not helpful/useful
- 24 - 1 - 3 - 4 - 2 - 14- * - * - 1% - * - 1% - 1%
Other functionality mentions
- 528 - 62 - 34 - 107 - 28 - 297- 10% - 8% - 7% - 11% - 7% - 11%
DF DFJ BDFJ
None
- 458 - 74 - 31 - 150 - 17 - 186- 8% - 9% - 6% - 16% - 4% - 7%
FJL JL BDFJL
Not sure
- 57 - 21 - - - 8 - 2 - 26- 1% - 3% - - - 1% - 1% - 1%
F BFHJL F F
Declined to answer
- 6382 - 1029 - 627 - 1087 - 458 - 3181- 117% - 125% - 124% - 113% - 121% - 115%
Sigma
_________________________________________________________________________________________________________________Proportions/Means: Columns Tested (5% risk level) - A/B - C/D - E/F - G/H - I/J - K/L - A/C/E/G/I/K - B/D/F/H/J/LOverlap formulae used. ** very small base (under 30) ineligible for sig testing
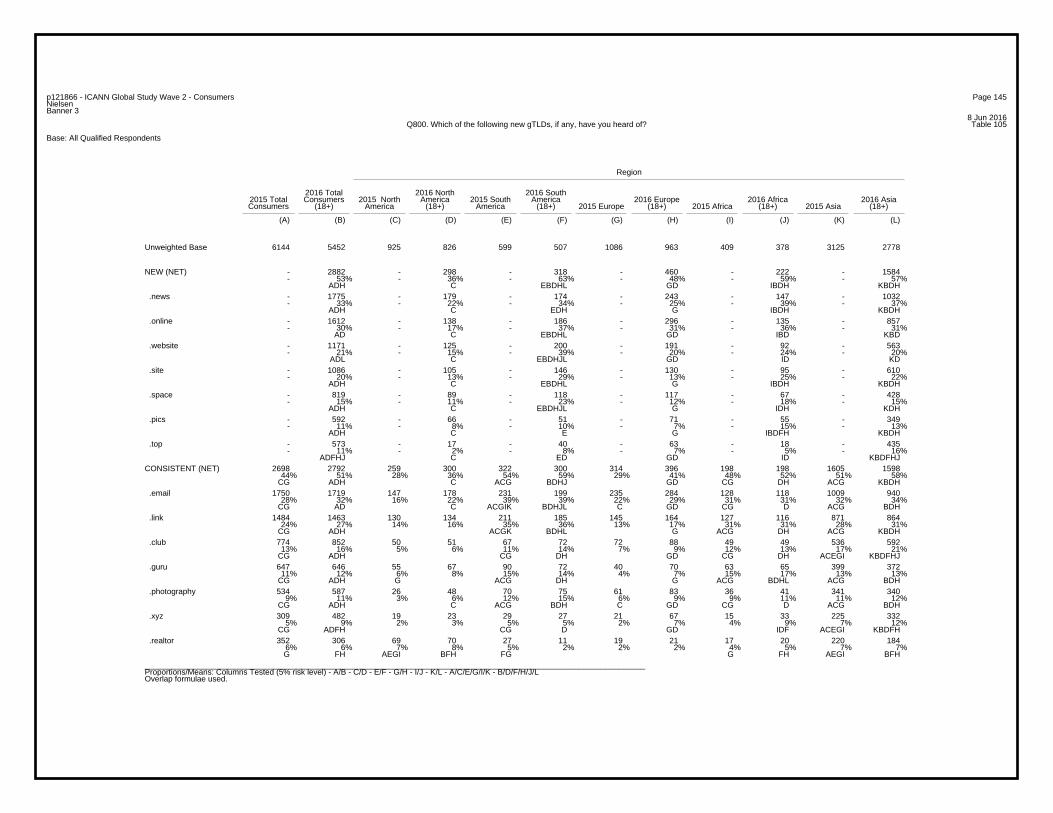
Page 145p121866 - ICANN Global Study Wave 2 - ConsumersNielsenBanner 3
8 Jun 2016Table 105Q800. Which of the following new gTLDs, if any, have you heard of?
Base: All Qualified Respondents
Region
2016 Total 2016 North 2016 South2015 Total Consumers 2015 North America 2015 South America 2016 Europe 2016 Africa 2016 AsiaConsumers (18+) America (18+) America (18+) 2015 Europe (18+) 2015 Africa (18+) 2015 Asia (18+)
(A) (B) (C) (D) (E) (F) (G) (H) (I) (J) (K) (L)
6144 5452 925 826 599 507 1086 963 409 378 3125 2778Unweighted Base
- 2882 - 298 - 318 - 460 - 222 - 1584- 53% - 36% - 63% - 48% - 59% - 57%
ADH C EBDHL GD IBDH KBDH
NEW (NET)
- 1775 - 179 - 174 - 243 - 147 - 1032- 33% - 22% - 34% - 25% - 39% - 37%
ADH C EDH G IBDH KBDH
.news
- 1612 - 138 - 186 - 296 - 135 - 857- 30% - 17% - 37% - 31% - 36% - 31%
AD C EBDHL GD IBD KBD
.online
- 1171 - 125 - 200 - 191 - 92 - 563- 21% - 15% - 39% - 20% - 24% - 20%
ADL C EBDHJL GD ID KD
.website
- 1086 - 105 - 146 - 130 - 95 - 610- 20% - 13% - 29% - 13% - 25% - 22%
ADH C EBDHL G IBDH KBDH
.site
- 819 - 89 - 118 - 117 - 67 - 428- 15% - 11% - 23% - 12% - 18% - 15%
ADH C EBDHJL G IDH KDH
.space
- 592 - 66 - 51 - 71 - 55 - 349- 11% - 8% - 10% - 7% - 15% - 13%
ADH C E G IBDFH KBDH
.pics
- 573 - 17 - 40 - 63 - 18 - 435- 11% - 2% - 8% - 7% - 5% - 16%
ADFHJ C ED GD ID KBDFHJ
.top
2698 2792 259 300 322 300 314 396 198 198 1605 159844% 51% 28% 36% 54% 59% 29% 41% 48% 52% 51% 58%
CG ADH C ACG BDHJ GD CG DH ACG KBDH
CONSISTENT (NET)
1750 1719 147 178 231 199 235 284 128 118 1009 94028% 32% 16% 22% 39% 39% 22% 29% 31% 31% 32% 34%
CG AD C ACGIK BDHJL C GD CG D ACG BDH
1484 1463 130 134 211 185 145 164 127 116 871 86424% 27% 14% 16% 35% 36% 13% 17% 31% 31% 28% 31%
CG ADH ACGK BDHL G ACG DH ACG KBDH
.link
774 852 50 51 67 72 72 88 49 49 536 59213% 16% 5% 6% 11% 14% 7% 9% 12% 13% 17% 21%
CG ADH CG DH GD CG DH ACEGI KBDFHJ
.club
647 646 55 67 90 72 40 70 63 65 399 37211% 12% 6% 8% 15% 14% 4% 7% 15% 17% 13% 13%
CG ADH G ACG DH G ACG BDHL ACG BDH
.guru
534 587 26 48 70 75 61 83 36 41 341 3409% 11% 3% 6% 12% 15% 6% 9% 9% 11% 11% 12%
CG ADH C ACG BDH C GD CG D ACG BDH
.photography
309 482 19 23 29 27 21 67 15 33 225 3325% 9% 2% 3% 5% 5% 2% 7% 4% 9% 7% 12%
CG ADFH CG D GD IDF ACEGI KBDFH
.xyz
352 306 69 70 27 11 19 21 17 20 220 1846% 6% 7% 8% 5% 2% 2% 2% 4% 5% 7% 7%G FH AEGI BFH FG G FH AEGI BFH
.realtor
_________________________________________________________________________________________________________________Proportions/Means: Columns Tested (5% risk level) - A/B - C/D - E/F - G/H - I/J - K/L - A/C/E/G/I/K - B/D/F/H/J/LOverlap formulae used.
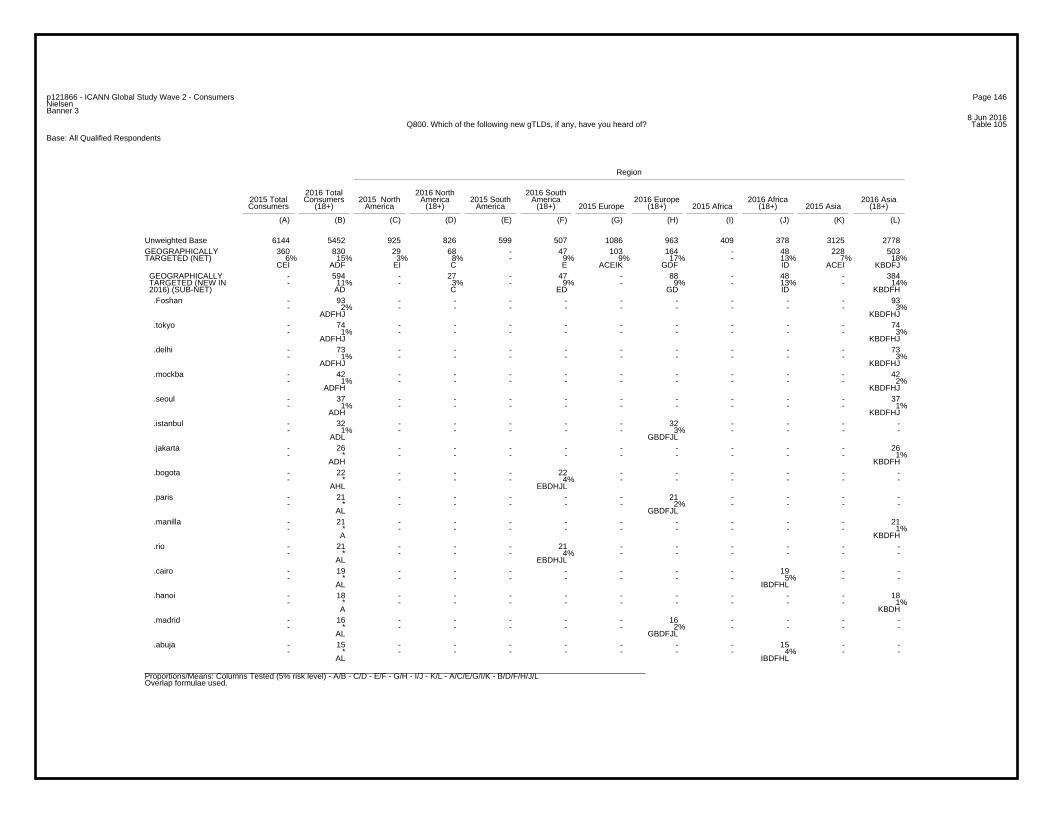
Page 146p121866 - ICANN Global Study Wave 2 - ConsumersNielsenBanner 3
8 Jun 2016Table 105Q800. Which of the following new gTLDs, if any, have you heard of?
Base: All Qualified Respondents
Region
2016 Total 2016 North 2016 South2015 Total Consumers 2015 North America 2015 South America 2016 Europe 2016 Africa 2016 AsiaConsumers (18+) America (18+) America (18+) 2015 Europe (18+) 2015 Africa (18+) 2015 Asia (18+)
(A) (B) (C) (D) (E) (F) (G) (H) (I) (J) (K) (L)
6144 5452 925 826 599 507 1086 963 409 378 3125 2778Unweighted Base360 830 29 68 - 47 103 164 - 48 228 503
6% 15% 3% 8% - 9% 9% 17% - 13% 7% 18%CEI ADF EI C E ACEIK GDF ID ACEI KBDFJ
GEOGRAPHICALLYTARGETED (NET)
- 594 - 27 - 47 - 88 - 48 - 384- 11% - 3% - 9% - 9% - 13% - 14%
AD C ED GD ID KBDFH
GEOGRAPHICALLY TARGETED (NEW IN 2016) (SUB-NET)
- 93 - - - - - - - - - 93- 2% - - - - - - - - - 3%
ADFHJ KBDFHJ
.Foshan
- 74 - - - - - - - - - 74- 1% - - - - - - - - - 3%
ADFHJ KBDFHJ
.tokyo
- 73 - - - - - - - - - 73- 1% - - - - - - - - - 3%
ADFHJ KBDFHJ
.delhi
- 42 - - - - - - - - - 42- 1% - - - - - - - - - 2%
ADFH KBDFHJ
.mockba
- 37 - - - - - - - - - 37- 1% - - - - - - - - - 1%
ADH KBDFHJ
.seoul
- 32 - - - - - 32 - - - -- 1% - - - - - 3% - - - -
ADL GBDFJL
.istanbul
- 26 - - - - - - - - - 26- * - - - - - - - - - 1%
ADH KBDFH
.jakarta
- 22 - - - 22 - - - - - -- * - - - 4% - - - - - -
AHL EBDHJL
.bogota
- 21 - - - - - 21 - - - -- * - - - - - 2% - - - -
AL GBDFJL
.paris
- 21 - - - - - - - - - 21- * - - - - - - - - - 1%
A KBDFH
.manilla
- 21 - - - 21 - - - - - -- * - - - 4% - - - - - -
AL EBDHJL
.rio
- 19 - - - - - - - 19 - -- * - - - - - - - 5% - -
AL IBDFHL
.cairo
- 18 - - - - - - - - - 18- * - - - - - - - - - 1%
A KBDH
.hanoi
- 16 - - - - - 16 - - - -- * - - - - - 2% - - - -
AL GBDFJL
.madrid
- 15 - - - - - - - 15 - -- * - - - - - - - 4% - -
AL IBDFHL
.abuja
_________________________________________________________________________________________________________________Proportions/Means: Columns Tested (5% risk level) - A/B - C/D - E/F - G/H - I/J - K/L - A/C/E/G/I/K - B/D/F/H/J/LOverlap formulae used.
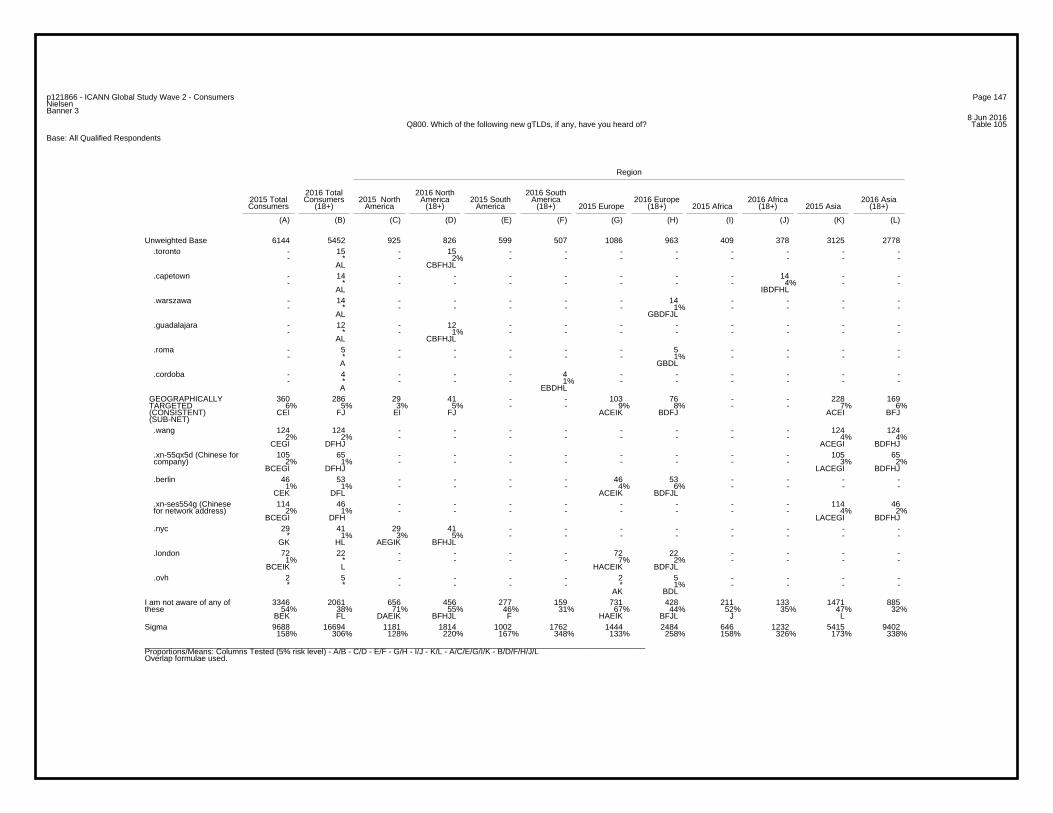
Page 147p121866 - ICANN Global Study Wave 2 - ConsumersNielsenBanner 3
8 Jun 2016Table 105Q800. Which of the following new gTLDs, if any, have you heard of?
Base: All Qualified Respondents
Region
2016 Total 2016 North 2016 South2015 Total Consumers 2015 North America 2015 South America 2016 Europe 2016 Africa 2016 AsiaConsumers (18+) America (18+) America (18+) 2015 Europe (18+) 2015 Africa (18+) 2015 Asia (18+)
(A) (B) (C) (D) (E) (F) (G) (H) (I) (J) (K) (L)
6144 5452 925 826 599 507 1086 963 409 378 3125 2778Unweighted Base- 15 - 15 - - - - - - - -- * - 2% - - - - - - - -
AL CBFHJL
.toronto
- 14 - - - - - - - 14 - -- * - - - - - - - 4% - -
AL IBDFHL
.capetown
- 14 - - - - - 14 - - - -- * - - - - - 1% - - - -
AL GBDFJL
.warszawa
- 12 - 12 - - - - - - - -- * - 1% - - - - - - - -
AL CBFHJL
.guadalajara
- 5 - - - - - 5 - - - -- * - - - - - 1% - - - -
A GBDL
.roma
- 4 - - - 4 - - - - - -- * - - - 1% - - - - - -
A EBDHL
.cordoba
360 286 29 41 - - 103 76 - - 228 1696% 5% 3% 5% - - 9% 8% - - 7% 6%
CEI FJ EI FJ ACEIK BDFJ ACEI BFJ
GEOGRAPHICALLY TARGETED (CONSISTENT) (SUB-NET)
124 124 - - - - - - - - 124 1242% 2% - - - - - - - - 4% 4%
CEGI DFHJ ACEGI BDFHJ
.wang
105 65 - - - - - - - - 105 652% 1% - - - - - - - - 3% 2%
BCEGI DFHJ LACEGI BDFHJ
.xn-55qx5d (Chinese for company)
46 53 - - - - 46 53 - - - -1% 1% - - - - 4% 6% - - - -
CEK DFL ACEIK BDFJL
.berlin
114 46 - - - - - - - - 114 462% 1% - - - - - - - - 4% 2%
BCEGI DFH LACEGI BDFHJ
.xn-ses554g (Chinese for network address)
29 41 29 41 - - - - - - - -* 1% 3% 5% - - - - - - - -
GK HL AEGIK BFHJL
.nyc
72 22 - - - - 72 22 - - - -1% * - - - - 7% 2% - - - -
BCEIK L HACEIK BDFJL
.london
2 5 - - - - 2 5 - - - -* * - - - - * 1% - - - -
AK BDL
.ovh
3346 2061 656 456 277 159 731 428 211 133 1471 88554% 38% 71% 55% 46% 31% 67% 44% 52% 35% 47% 32%
BEK FL DAEIK BFHJL F HAEIK BFJL J L
I am not aware of any ofthese
9688 16694 1181 1814 1002 1762 1444 2484 646 1232 5415 9402158% 306% 128% 220% 167% 348% 133% 258% 158% 326% 173% 338%
Sigma
_________________________________________________________________________________________________________________Proportions/Means: Columns Tested (5% risk level) - A/B - C/D - E/F - G/H - I/J - K/L - A/C/E/G/I/K - B/D/F/H/J/LOverlap formulae used.
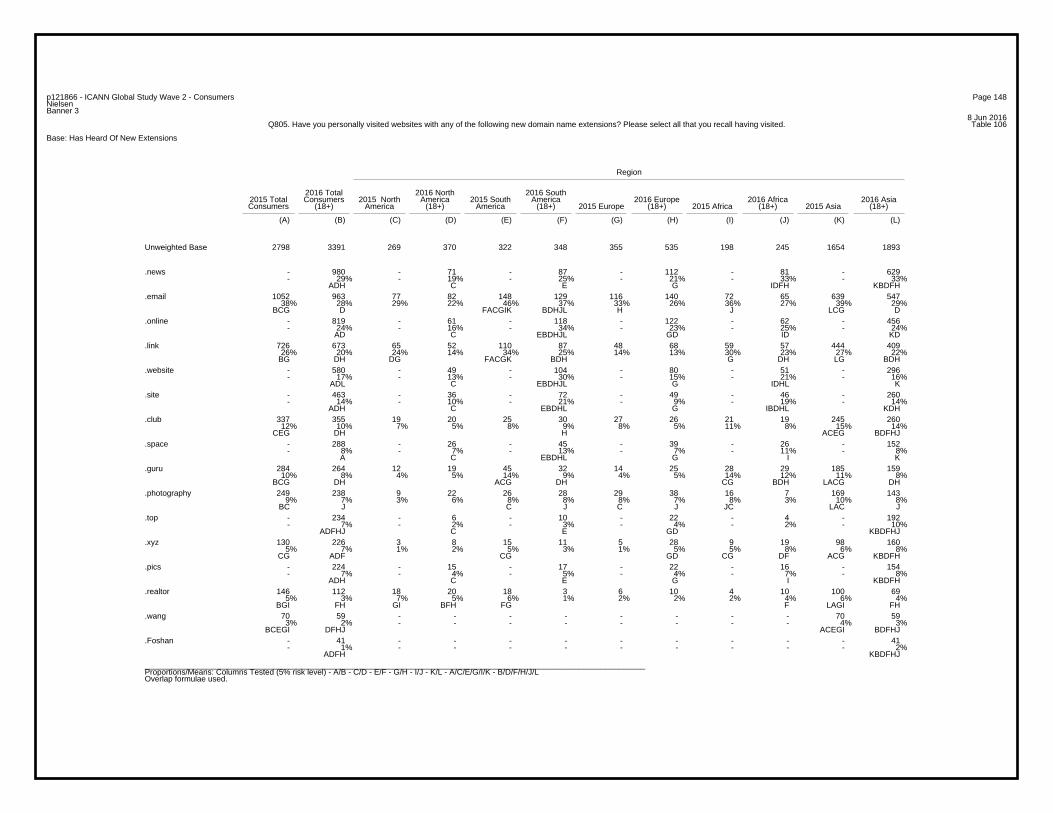
Page 148p121866 - ICANN Global Study Wave 2 - ConsumersNielsenBanner 3
8 Jun 2016Table 106Q805. Have you personally visited websites with any of the following new domain name extensions? Please select all that you recall having visited.
Base: Has Heard Of New Extensions
Region
2016 Total 2016 North 2016 South2015 Total Consumers 2015 North America 2015 South America 2016 Europe 2016 Africa 2016 AsiaConsumers (18+) America (18+) America (18+) 2015 Europe (18+) 2015 Africa (18+) 2015 Asia (18+)
(A) (B) (C) (D) (E) (F) (G) (H) (I) (J) (K) (L)
2798 3391 269 370 322 348 355 535 198 245 1654 1893Unweighted Base
- 980 - 71 - 87 - 112 - 81 - 629- 29% - 19% - 25% - 21% - 33% - 33%
ADH C E G IDFH KBDFH
.news
1052 963 77 82 148 129 116 140 72 65 639 54738% 28% 29% 22% 46% 37% 33% 26% 36% 27% 39% 29%
BCG D FACGIK BDHJL H J LCG D
- 819 - 61 - 118 - 122 - 62 - 456- 24% - 16% - 34% - 23% - 25% - 24%
AD C EBDHJL GD ID KD
.online
726 673 65 52 110 87 48 68 59 57 444 40926% 20% 24% 14% 34% 25% 14% 13% 30% 23% 27% 22%
BG DH DG FACGK BDH G DH LG BDH
.link
- 580 - 49 - 104 - 80 - 51 - 296- 17% - 13% - 30% - 15% - 21% - 16%
ADL C EBDHJL G IDHL K
.website
- 463 - 36 - 72 - 49 - 46 - 260- 14% - 10% - 21% - 9% - 19% - 14%
ADH C EBDHL G IBDHL KDH
.site
337 355 19 20 25 30 27 26 21 19 245 26012% 10% 7% 5% 8% 9% 8% 5% 11% 8% 15% 14%
CEG DH H ACEG BDFHJ
.club
- 288 - 26 - 45 - 39 - 26 - 152- 8% - 7% - 13% - 7% - 11% - 8%
A C EBDHL G I K
.space
284 264 12 19 45 32 14 25 28 29 185 15910% 8% 4% 5% 14% 9% 4% 5% 14% 12% 11% 8%
BCG DH ACG DH CG BDH LACG DH
.guru
249 238 9 22 26 28 29 38 16 7 169 1439% 7% 3% 6% 8% 8% 8% 7% 8% 3% 10% 8%
BC J C J C J JC LAC J
.photography
- 234 - 6 - 10 - 22 - 4 - 192- 7% - 2% - 3% - 4% - 2% - 10%
ADFHJ C E GD KBDFHJ
.top
130 226 3 8 15 11 5 28 9 19 98 1605% 7% 1% 2% 5% 3% 1% 5% 5% 8% 6% 8%
CG ADF CG GD CG DF ACG KBDFH
.xyz
- 224 - 15 - 17 - 22 - 16 - 154- 7% - 4% - 5% - 4% - 7% - 8%
ADH C E G I KBDFH
.pics
146 112 18 20 18 3 6 10 4 10 100 695% 3% 7% 5% 6% 1% 2% 2% 2% 4% 6% 4%
BGI FH GI BFH FG F LAGI FH
.realtor
70 59 - - - - - - - - 70 593% 2% - - - - - - - - 4% 3%
BCEGI DFHJ ACEGI BDFHJ
.wang
- 41 - - - - - - - - - 41- 1% - - - - - - - - - 2%
ADFH KBDFHJ
.Foshan
_________________________________________________________________________________________________________________Proportions/Means: Columns Tested (5% risk level) - A/B - C/D - E/F - G/H - I/J - K/L - A/C/E/G/I/K - B/D/F/H/J/LOverlap formulae used.
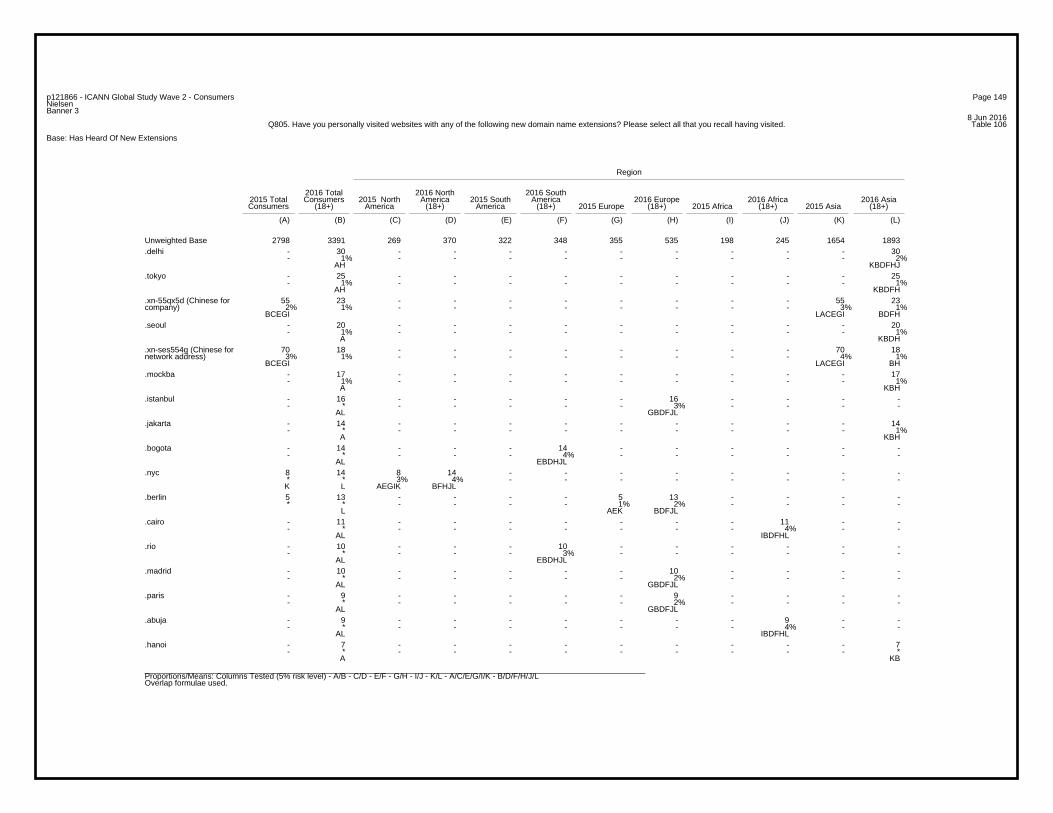
Page 149p121866 - ICANN Global Study Wave 2 - ConsumersNielsenBanner 3
8 Jun 2016Table 106Q805. Have you personally visited websites with any of the following new domain name extensions? Please select all that you recall having visited.
Base: Has Heard Of New Extensions
Region
2016 Total 2016 North 2016 South2015 Total Consumers 2015 North America 2015 South America 2016 Europe 2016 Africa 2016 AsiaConsumers (18+) America (18+) America (18+) 2015 Europe (18+) 2015 Africa (18+) 2015 Asia (18+)
(A) (B) (C) (D) (E) (F) (G) (H) (I) (J) (K) (L)
2798 3391 269 370 322 348 355 535 198 245 1654 1893Unweighted Base- 30 - - - - - - - - - 30- 1% - - - - - - - - - 2%
AH KBDFHJ
.delhi
- 25 - - - - - - - - - 25- 1% - - - - - - - - - 1%
AH KBDFH
.tokyo
55 23 - - - - - - - - 55 232% 1% - - - - - - - - 3% 1%
BCEGI LACEGI BDFH
.xn-55qx5d (Chinese forcompany)
- 20 - - - - - - - - - 20- 1% - - - - - - - - - 1%
A KBDH
.seoul
70 18 - - - - - - - - 70 183% 1% - - - - - - - - 4% 1%
BCEGI LACEGI BH
.xn-ses554g (Chinese fornetwork address)
- 17 - - - - - - - - - 17- 1% - - - - - - - - - 1%
A KBH
.mockba
- 16 - - - - - 16 - - - -- * - - - - - 3% - - - -
AL GBDFJL
.istanbul
- 14 - - - - - - - - - 14- * - - - - - - - - - 1%
A KBH
.jakarta
- 14 - - - 14 - - - - - -- * - - - 4% - - - - - -
AL EBDHJL
.bogota
8 14 8 14 - - - - - - - -* * 3% 4% - - - - - - - - K L AEGIK BFHJL
.nyc
5 13 - - - - 5 13 - - - -* * - - - - 1% 2% - - - -
L AEK BDFJL
.berlin
- 11 - - - - - - - 11 - -- * - - - - - - - 4% - -
AL IBDFHL
.cairo
- 10 - - - 10 - - - - - -- * - - - 3% - - - - - -
AL EBDHJL
.rio
- 10 - - - - - 10 - - - -- * - - - - - 2% - - - -
AL GBDFJL
.madrid
- 9 - - - - - 9 - - - -- * - - - - - 2% - - - -
AL GBDFJL
.paris
- 9 - - - - - - - 9 - -- * - - - - - - - 4% - -
AL IBDFHL
.abuja
- 7 - - - - - - - - - 7- * - - - - - - - - - *
A KB
.hanoi
_________________________________________________________________________________________________________________Proportions/Means: Columns Tested (5% risk level) - A/B - C/D - E/F - G/H - I/J - K/L - A/C/E/G/I/K - B/D/F/H/J/LOverlap formulae used.
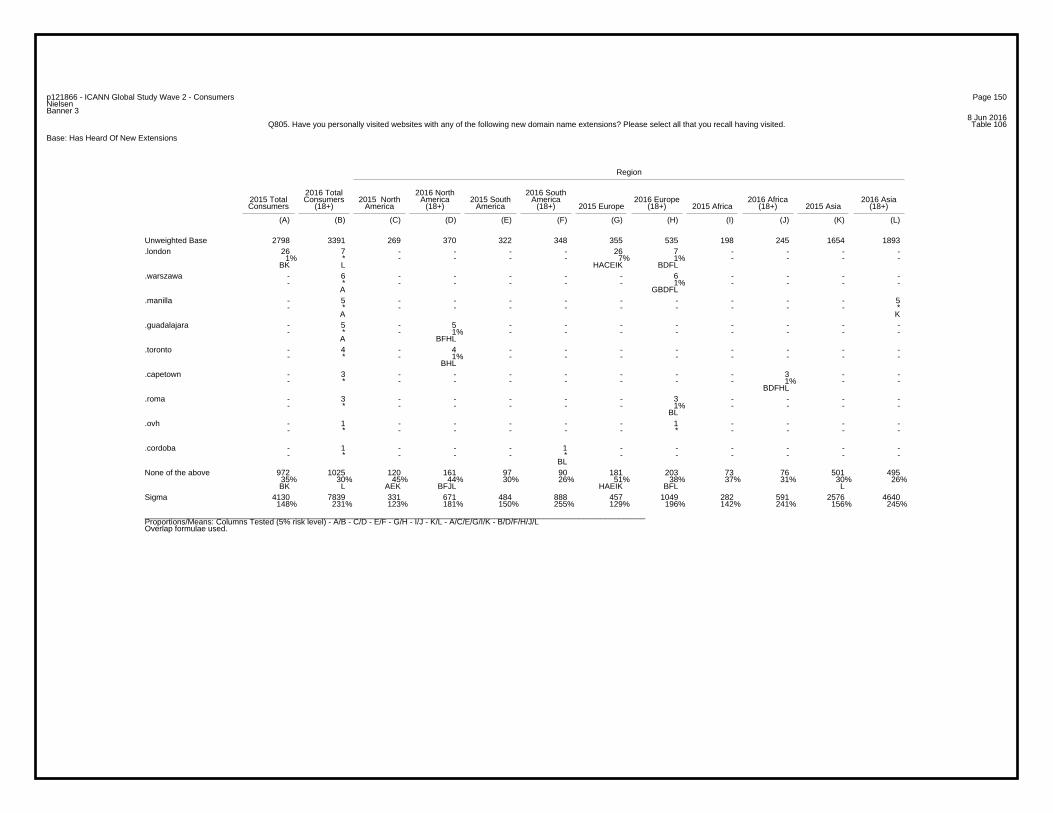
Page 150p121866 - ICANN Global Study Wave 2 - ConsumersNielsenBanner 3
8 Jun 2016Table 106Q805. Have you personally visited websites with any of the following new domain name extensions? Please select all that you recall having visited.
Base: Has Heard Of New Extensions
Region
2016 Total 2016 North 2016 South2015 Total Consumers 2015 North America 2015 South America 2016 Europe 2016 Africa 2016 AsiaConsumers (18+) America (18+) America (18+) 2015 Europe (18+) 2015 Africa (18+) 2015 Asia (18+)
(A) (B) (C) (D) (E) (F) (G) (H) (I) (J) (K) (L)
2798 3391 269 370 322 348 355 535 198 245 1654 1893Unweighted Base26 7 - - - - 26 7 - - - -
1% * - - - - 7% 1% - - - - BK L HACEIK BDFL
.london
- 6 - - - - - 6 - - - -- * - - - - - 1% - - - -
A GBDFL
.warszawa
- 5 - - - - - - - - - 5- * - - - - - - - - - *
A K
.manilla
- 5 - 5 - - - - - - - -- * - 1% - - - - - - - -
A BFHL
.guadalajara
- 4 - 4 - - - - - - - -- * - 1% - - - - - - - -
BHL
.toronto
- 3 - - - - - - - 3 - -- * - - - - - - - 1% - -
BDFHL
.capetown
- 3 - - - - - 3 - - - -- * - - - - - 1% - - - -
BL
.roma
- 1 - - - - - 1 - - - -- * - - - - - * - - - -
.ovh
- 1 - - - 1 - - - - - -- * - - - * - - - - - -
BL
.cordoba
972 1025 120 161 97 90 181 203 73 76 501 49535% 30% 45% 44% 30% 26% 51% 38% 37% 31% 30% 26%BK L AEK BFJL HAEIK BFL L
None of the above
4130 7839 331 671 484 888 457 1049 282 591 2576 4640148% 231% 123% 181% 150% 255% 129% 196% 142% 241% 156% 245%
Sigma
_________________________________________________________________________________________________________________Proportions/Means: Columns Tested (5% risk level) - A/B - C/D - E/F - G/H - I/J - K/L - A/C/E/G/I/K - B/D/F/H/J/LOverlap formulae used.
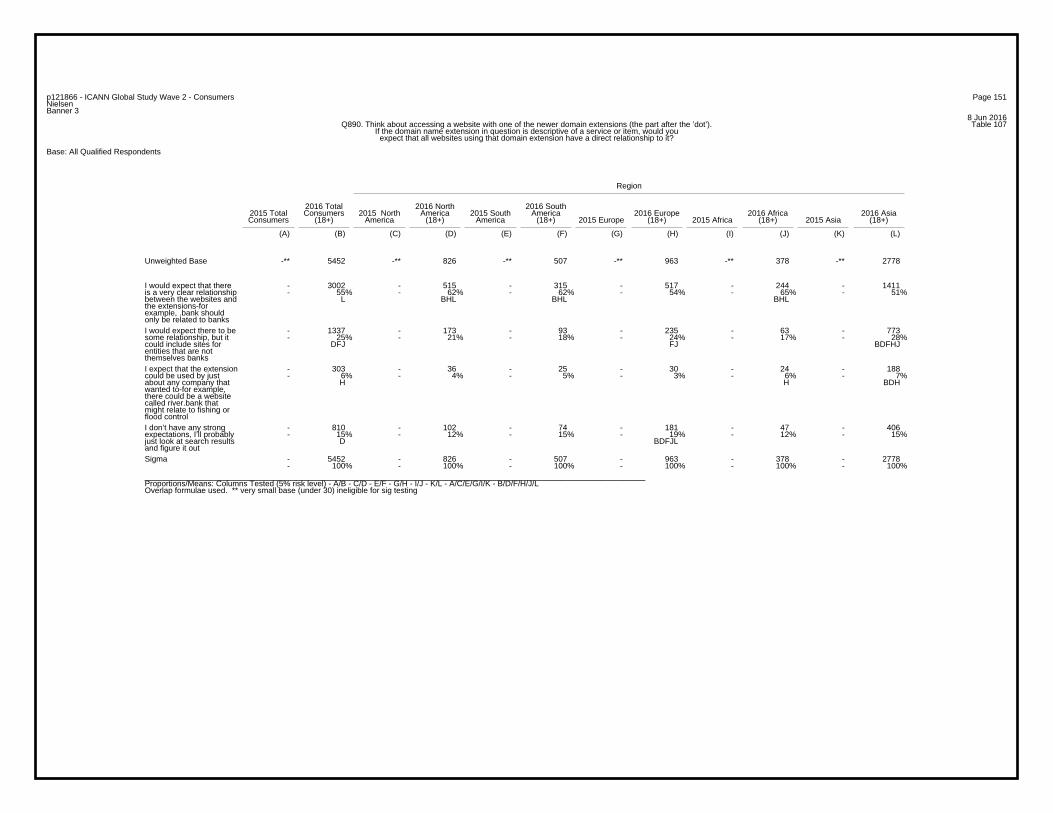
Page 151p121866 - ICANN Global Study Wave 2 - ConsumersNielsenBanner 3
8 Jun 2016Table 107Q890. Think about accessing a website with one of the newer domain extensions (the part after the ’dot’).
If the domain name extension in question is descriptive of a service or item, would youexpect that all websites using that domain extension have a direct relationship to it?
Base: All Qualified Respondents
Region
2016 Total 2016 North 2016 South2015 Total Consumers 2015 North America 2015 South America 2016 Europe 2016 Africa 2016 AsiaConsumers (18+) America (18+) America (18+) 2015 Europe (18+) 2015 Africa (18+) 2015 Asia (18+)
(A) (B) (C) (D) (E) (F) (G) (H) (I) (J) (K) (L)
-** 5452 -** 826 -** 507 -** 963 -** 378 -** 2778Unweighted Base
- 3002 - 515 - 315 - 517 - 244 - 1411- 55% - 62% - 62% - 54% - 65% - 51%
L BHL BHL BHL
I would expect that thereis a very clear relationshipbetween the websites andthe extensions-forexample, .bank shouldonly be related to banks
- 1337 - 173 - 93 - 235 - 63 - 773- 25% - 21% - 18% - 24% - 17% - 28%
DFJ FJ BDFHJ
I would expect there to besome relationship, but itcould include sites forentities that are notthemselves banks
- 303 - 36 - 25 - 30 - 24 - 188- 6% - 4% - 5% - 3% - 6% - 7%
H H BDH
I expect that the extensioncould be used by justabout any company thatwanted to-for example,there could be a websitecalled river.bank thatmight relate to fishing orflood control
- 810 - 102 - 74 - 181 - 47 - 406- 15% - 12% - 15% - 19% - 12% - 15%
D BDFJL
I don’t have any strongexpectations, I’ll probablyjust look at search resultsand figure it out
- 5452 - 826 - 507 - 963 - 378 - 2778- 100% - 100% - 100% - 100% - 100% - 100%
Sigma
_________________________________________________________________________________________________________________Proportions/Means: Columns Tested (5% risk level) - A/B - C/D - E/F - G/H - I/J - K/L - A/C/E/G/I/K - B/D/F/H/J/LOverlap formulae used. ** very small base (under 30) ineligible for sig testing
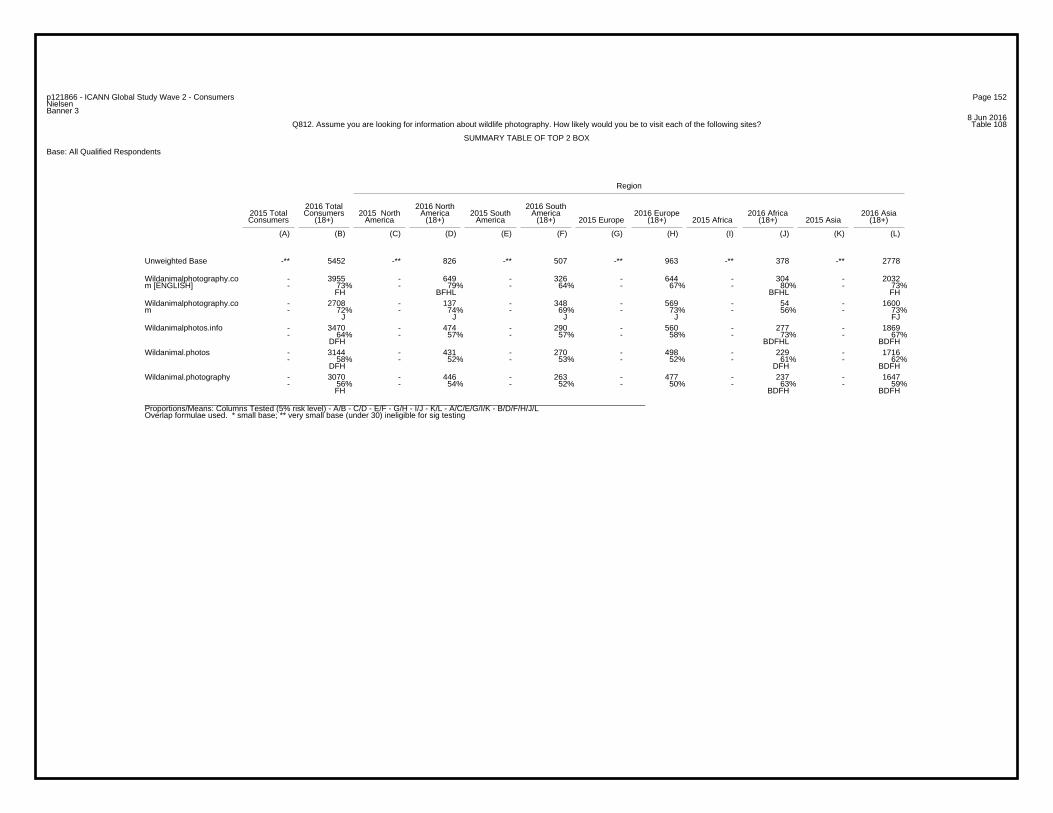
Page 152p121866 - ICANN Global Study Wave 2 - ConsumersNielsenBanner 3
8 Jun 2016Table 108Q812. Assume you are looking for information about wildlife photography. How likely would you be to visit each of the following sites?
SUMMARY TABLE OF TOP 2 BOX
Base: All Qualified Respondents
Region
2016 Total 2016 North 2016 South2015 Total Consumers 2015 North America 2015 South America 2016 Europe 2016 Africa 2016 AsiaConsumers (18+) America (18+) America (18+) 2015 Europe (18+) 2015 Africa (18+) 2015 Asia (18+)
(A) (B) (C) (D) (E) (F) (G) (H) (I) (J) (K) (L)
-** 5452 -** 826 -** 507 -** 963 -** 378 -** 2778Unweighted Base
- 3955 - 649 - 326 - 644 - 304 - 2032- 73% - 79% - 64% - 67% - 80% - 73%
FH BFHL BFHL FH
Wildanimalphotography.com [ENGLISH]
- 2708 - 137 - 348 - 569 - 54 - 1600- 72% - 74% - 69% - 73% - 56% - 73%
J J J J FJ
Wildanimalphotography.com
- 3470 - 474 - 290 - 560 - 277 - 1869- 64% - 57% - 57% - 58% - 73% - 67%
DFH BDFHL BDFH
Wildanimalphotos.info
- 3144 - 431 - 270 - 498 - 229 - 1716- 58% - 52% - 53% - 52% - 61% - 62%
DFH DFH BDFH
Wildanimal.photos
- 3070 - 446 - 263 - 477 - 237 - 1647- 56% - 54% - 52% - 50% - 63% - 59%
FH BDFH BDFH
Wildanimal.photography
_________________________________________________________________________________________________________________Proportions/Means: Columns Tested (5% risk level) - A/B - C/D - E/F - G/H - I/J - K/L - A/C/E/G/I/K - B/D/F/H/J/LOverlap formulae used. * small base; ** very small base (under 30) ineligible for sig testing
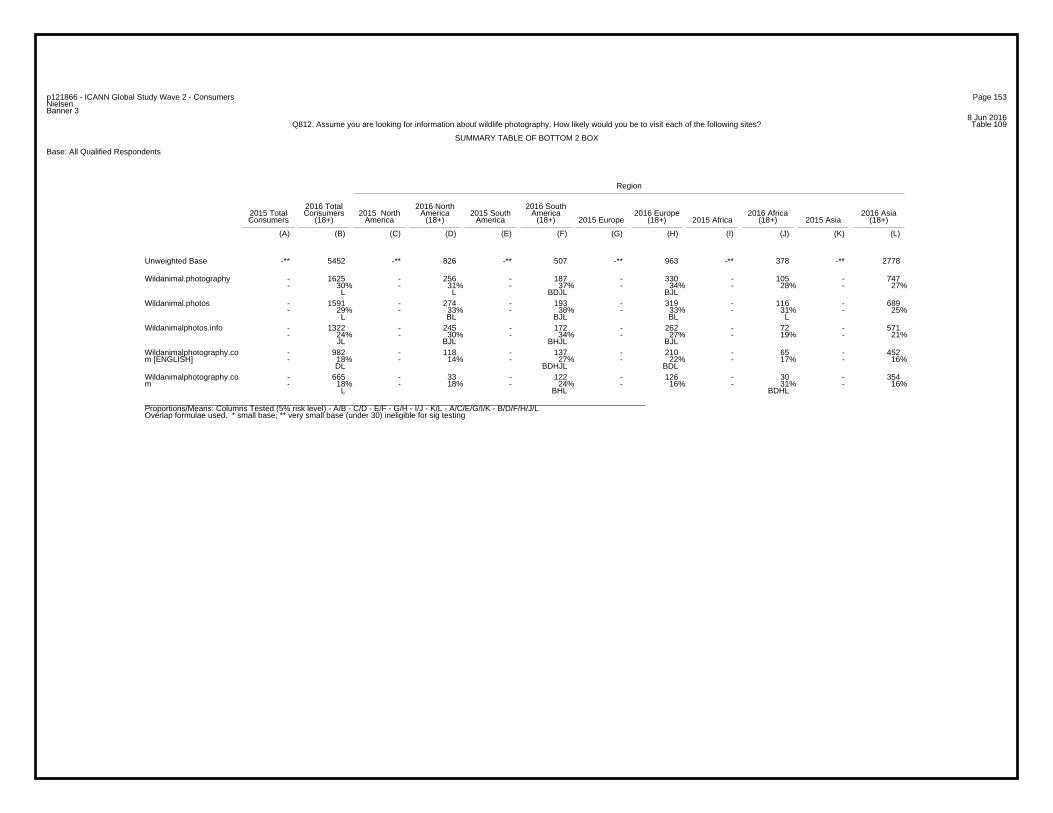
Page 153p121866 - ICANN Global Study Wave 2 - ConsumersNielsenBanner 3
8 Jun 2016Table 109Q812. Assume you are looking for information about wildlife photography. How likely would you be to visit each of the following sites?
SUMMARY TABLE OF BOTTOM 2 BOX
Base: All Qualified Respondents
Region
2016 Total 2016 North 2016 South2015 Total Consumers 2015 North America 2015 South America 2016 Europe 2016 Africa 2016 AsiaConsumers (18+) America (18+) America (18+) 2015 Europe (18+) 2015 Africa (18+) 2015 Asia (18+)
(A) (B) (C) (D) (E) (F) (G) (H) (I) (J) (K) (L)
-** 5452 -** 826 -** 507 -** 963 -** 378 -** 2778Unweighted Base
- 1625 - 256 - 187 - 330 - 105 - 747- 30% - 31% - 37% - 34% - 28% - 27%
L L BDJL BJL
Wildanimal.photography
- 1591 - 274 - 193 - 319 - 116 - 689- 29% - 33% - 38% - 33% - 31% - 25%
L BL BJL BL L
Wildanimal.photos
- 1322 - 245 - 172 - 262 - 72 - 571- 24% - 30% - 34% - 27% - 19% - 21%
JL BJL BHJL BJL
Wildanimalphotos.info
- 982 - 118 - 137 - 210 - 65 - 452- 18% - 14% - 27% - 22% - 17% - 16%
DL BDHJL BDL
Wildanimalphotography.com [ENGLISH]
- 665 - 33 - 122 - 126 - 30 - 354- 18% - 18% - 24% - 16% - 31% - 16%
L BHL BDHL
Wildanimalphotography.com
_________________________________________________________________________________________________________________Proportions/Means: Columns Tested (5% risk level) - A/B - C/D - E/F - G/H - I/J - K/L - A/C/E/G/I/K - B/D/F/H/J/LOverlap formulae used. * small base; ** very small base (under 30) ineligible for sig testing
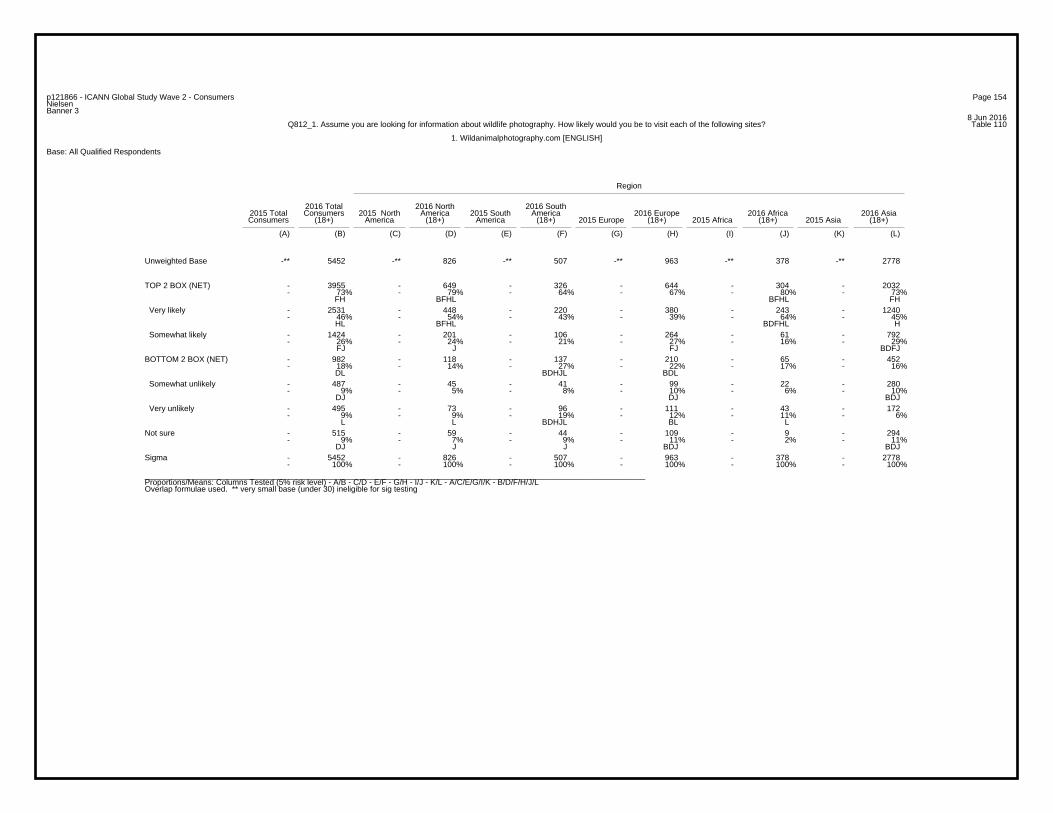
Page 154p121866 - ICANN Global Study Wave 2 - ConsumersNielsenBanner 3
8 Jun 2016Table 110Q812_1. Assume you are looking for information about wildlife photography. How likely would you be to visit each of the following sites?
1. Wildanimalphotography.com [ENGLISH]
Base: All Qualified Respondents
Region
2016 Total 2016 North 2016 South2015 Total Consumers 2015 North America 2015 South America 2016 Europe 2016 Africa 2016 AsiaConsumers (18+) America (18+) America (18+) 2015 Europe (18+) 2015 Africa (18+) 2015 Asia (18+)
(A) (B) (C) (D) (E) (F) (G) (H) (I) (J) (K) (L)
-** 5452 -** 826 -** 507 -** 963 -** 378 -** 2778Unweighted Base
- 3955 - 649 - 326 - 644 - 304 - 2032- 73% - 79% - 64% - 67% - 80% - 73%
FH BFHL BFHL FH
TOP 2 BOX (NET)
- 2531 - 448 - 220 - 380 - 243 - 1240- 46% - 54% - 43% - 39% - 64% - 45%
HL BFHL BDFHL H
Very likely
- 1424 - 201 - 106 - 264 - 61 - 792- 26% - 24% - 21% - 27% - 16% - 29%
FJ J FJ BDFJ
Somewhat likely
- 982 - 118 - 137 - 210 - 65 - 452- 18% - 14% - 27% - 22% - 17% - 16%
DL BDHJL BDL
BOTTOM 2 BOX (NET)
- 487 - 45 - 41 - 99 - 22 - 280- 9% - 5% - 8% - 10% - 6% - 10%
DJ DJ BDJ
Somewhat unlikely
- 495 - 73 - 96 - 111 - 43 - 172- 9% - 9% - 19% - 12% - 11% - 6%
L L BDHJL BL L
Very unlikely
- 515 - 59 - 44 - 109 - 9 - 294- 9% - 7% - 9% - 11% - 2% - 11%
DJ J J BDJ BDJ
Not sure
- 5452 - 826 - 507 - 963 - 378 - 2778- 100% - 100% - 100% - 100% - 100% - 100%
Sigma
_________________________________________________________________________________________________________________Proportions/Means: Columns Tested (5% risk level) - A/B - C/D - E/F - G/H - I/J - K/L - A/C/E/G/I/K - B/D/F/H/J/LOverlap formulae used. ** very small base (under 30) ineligible for sig testing
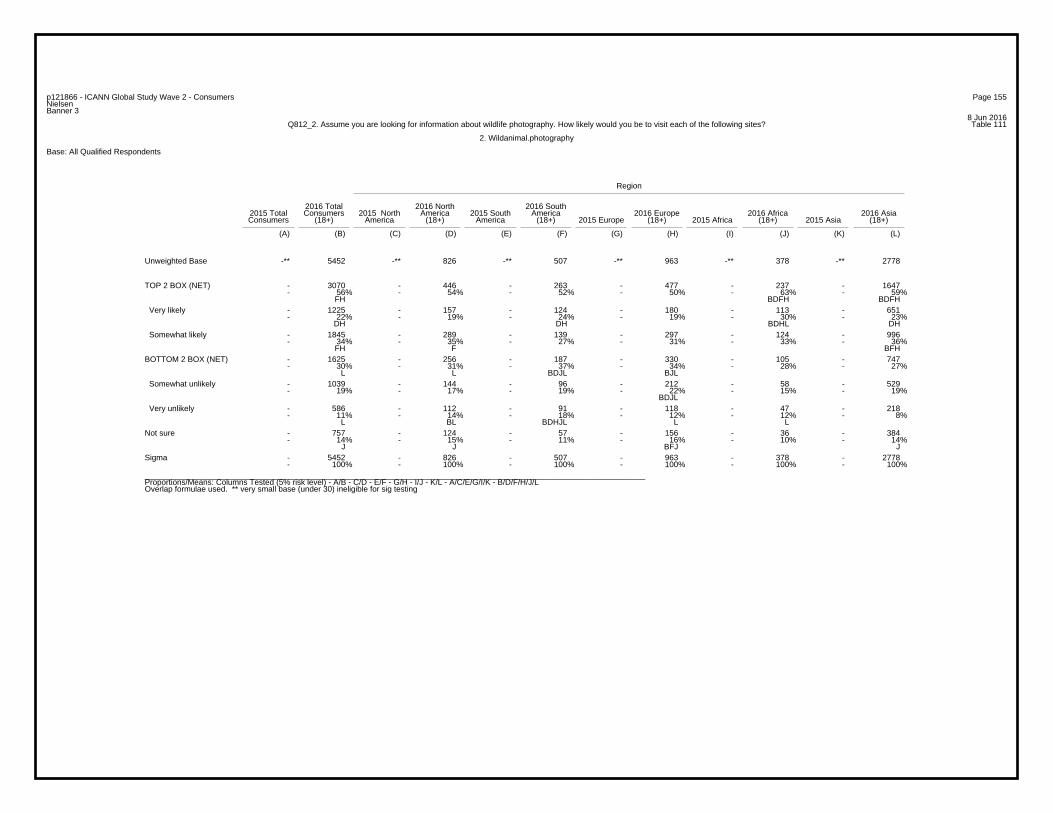
Page 155p121866 - ICANN Global Study Wave 2 - ConsumersNielsenBanner 3
8 Jun 2016Table 111Q812_2. Assume you are looking for information about wildlife photography. How likely would you be to visit each of the following sites?
2. Wildanimal.photography
Base: All Qualified Respondents
Region
2016 Total 2016 North 2016 South2015 Total Consumers 2015 North America 2015 South America 2016 Europe 2016 Africa 2016 AsiaConsumers (18+) America (18+) America (18+) 2015 Europe (18+) 2015 Africa (18+) 2015 Asia (18+)
(A) (B) (C) (D) (E) (F) (G) (H) (I) (J) (K) (L)
-** 5452 -** 826 -** 507 -** 963 -** 378 -** 2778Unweighted Base
- 3070 - 446 - 263 - 477 - 237 - 1647- 56% - 54% - 52% - 50% - 63% - 59%
FH BDFH BDFH
TOP 2 BOX (NET)
- 1225 - 157 - 124 - 180 - 113 - 651- 22% - 19% - 24% - 19% - 30% - 23%
DH DH BDHL DH
Very likely
- 1845 - 289 - 139 - 297 - 124 - 996- 34% - 35% - 27% - 31% - 33% - 36%
FH F BFH
Somewhat likely
- 1625 - 256 - 187 - 330 - 105 - 747- 30% - 31% - 37% - 34% - 28% - 27%
L L BDJL BJL
BOTTOM 2 BOX (NET)
- 1039 - 144 - 96 - 212 - 58 - 529- 19% - 17% - 19% - 22% - 15% - 19%
BDJL
Somewhat unlikely
- 586 - 112 - 91 - 118 - 47 - 218- 11% - 14% - 18% - 12% - 12% - 8%
L BL BDHJL L L
Very unlikely
- 757 - 124 - 57 - 156 - 36 - 384- 14% - 15% - 11% - 16% - 10% - 14%
J J BFJ J
Not sure
- 5452 - 826 - 507 - 963 - 378 - 2778- 100% - 100% - 100% - 100% - 100% - 100%
Sigma
_________________________________________________________________________________________________________________Proportions/Means: Columns Tested (5% risk level) - A/B - C/D - E/F - G/H - I/J - K/L - A/C/E/G/I/K - B/D/F/H/J/LOverlap formulae used. ** very small base (under 30) ineligible for sig testing

Page 156p121866 - ICANN Global Study Wave 2 - ConsumersNielsenBanner 3
8 Jun 2016Table 112Q812_3. Assume you are looking for information about wildlife photography. How likely would you be to visit each of the following sites?
3. Wildanimal.photos
Base: All Qualified Respondents
Region
2016 Total 2016 North 2016 South2015 Total Consumers 2015 North America 2015 South America 2016 Europe 2016 Africa 2016 AsiaConsumers (18+) America (18+) America (18+) 2015 Europe (18+) 2015 Africa (18+) 2015 Asia (18+)
(A) (B) (C) (D) (E) (F) (G) (H) (I) (J) (K) (L)
-** 5452 -** 826 -** 507 -** 963 -** 378 -** 2778Unweighted Base
- 3144 - 431 - 270 - 498 - 229 - 1716- 58% - 52% - 53% - 52% - 61% - 62%
DFH DFH BDFH
TOP 2 BOX (NET)
- 1317 - 165 - 130 - 188 - 99 - 735- 24% - 20% - 26% - 20% - 26% - 26%
DH DH DH BDH
Very likely
- 1827 - 266 - 140 - 310 - 130 - 981- 34% - 32% - 28% - 32% - 34% - 35%
F F BF
Somewhat likely
- 1591 - 274 - 193 - 319 - 116 - 689- 29% - 33% - 38% - 33% - 31% - 25%
L BL BJL BL L
BOTTOM 2 BOX (NET)
- 1007 - 161 - 93 - 197 - 69 - 487- 18% - 19% - 18% - 20% - 18% - 18%
L
Somewhat unlikely
- 584 - 113 - 100 - 122 - 47 - 202- 11% - 14% - 20% - 13% - 12% - 7%
L BL BDHJL BL L
Very unlikely
- 717 - 121 - 44 - 146 - 33 - 373- 13% - 15% - 9% - 15% - 9% - 13%
FJ FJ BFJ FJ
Not sure
- 5452 - 826 - 507 - 963 - 378 - 2778- 100% - 100% - 100% - 100% - 100% - 100%
Sigma
_________________________________________________________________________________________________________________Proportions/Means: Columns Tested (5% risk level) - A/B - C/D - E/F - G/H - I/J - K/L - A/C/E/G/I/K - B/D/F/H/J/LOverlap formulae used. ** very small base (under 30) ineligible for sig testing

Page 157p121866 - ICANN Global Study Wave 2 - ConsumersNielsenBanner 3
8 Jun 2016Table 113Q812_4. Assume you are looking for information about wildlife photography. How likely would you be to visit each of the following sites?
4. Wildanimalphotos.info
Base: All Qualified Respondents
Region
2016 Total 2016 North 2016 South2015 Total Consumers 2015 North America 2015 South America 2016 Europe 2016 Africa 2016 AsiaConsumers (18+) America (18+) America (18+) 2015 Europe (18+) 2015 Africa (18+) 2015 Asia (18+)
(A) (B) (C) (D) (E) (F) (G) (H) (I) (J) (K) (L)
-** 5452 -** 826 -** 507 -** 963 -** 378 -** 2778Unweighted Base
- 3470 - 474 - 290 - 560 - 277 - 1869- 64% - 57% - 57% - 58% - 73% - 67%
DFH BDFHL BDFH
TOP 2 BOX (NET)
- 1504 - 180 - 142 - 217 - 162 - 803- 28% - 22% - 28% - 23% - 43% - 29%
DH DH BDFHL BDH
Very likely
- 1966 - 294 - 148 - 343 - 115 - 1066- 36% - 36% - 29% - 36% - 30% - 38%
FJ F F BFJ
Somewhat likely
- 1322 - 245 - 172 - 262 - 72 - 571- 24% - 30% - 34% - 27% - 19% - 21%
JL BJL BHJL BJL
BOTTOM 2 BOX (NET)
- 856 - 142 - 91 - 169 - 44 - 410- 16% - 17% - 18% - 18% - 12% - 15%
JL J J JL
Somewhat unlikely
- 466 - 103 - 81 - 93 - 28 - 161- 9% - 12% - 16% - 10% - 7% - 6%
L BJL BHJL L
Very unlikely
- 660 - 107 - 45 - 141 - 29 - 338- 12% - 13% - 9% - 15% - 8% - 12%
FJ FJ BFJL FJ
Not sure
- 5452 - 826 - 507 - 963 - 378 - 2778- 100% - 100% - 100% - 100% - 100% - 100%
Sigma
_________________________________________________________________________________________________________________Proportions/Means: Columns Tested (5% risk level) - A/B - C/D - E/F - G/H - I/J - K/L - A/C/E/G/I/K - B/D/F/H/J/LOverlap formulae used. ** very small base (under 30) ineligible for sig testing
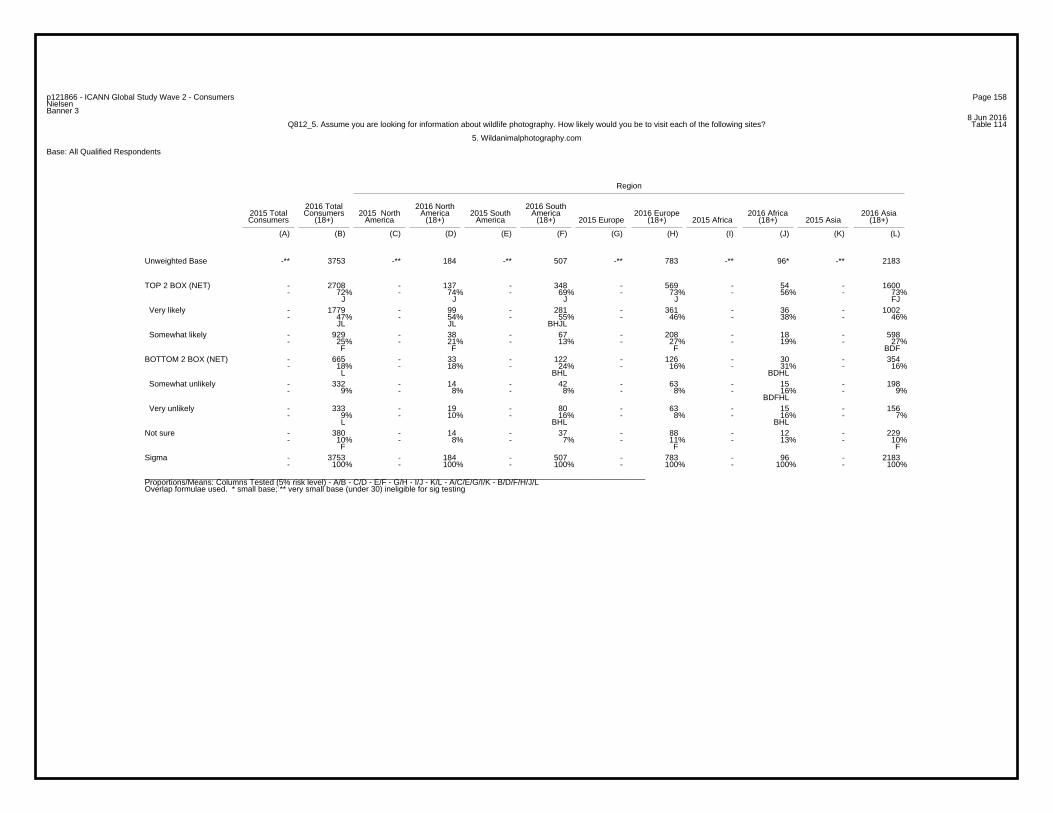
Page 158p121866 - ICANN Global Study Wave 2 - ConsumersNielsenBanner 3
8 Jun 2016Table 114Q812_5. Assume you are looking for information about wildlife photography. How likely would you be to visit each of the following sites?
5. Wildanimalphotography.com
Base: All Qualified Respondents
Region
2016 Total 2016 North 2016 South2015 Total Consumers 2015 North America 2015 South America 2016 Europe 2016 Africa 2016 AsiaConsumers (18+) America (18+) America (18+) 2015 Europe (18+) 2015 Africa (18+) 2015 Asia (18+)
(A) (B) (C) (D) (E) (F) (G) (H) (I) (J) (K) (L)
-** 3753 -** 184 -** 507 -** 783 -** 96* -** 2183Unweighted Base
- 2708 - 137 - 348 - 569 - 54 - 1600- 72% - 74% - 69% - 73% - 56% - 73%
J J J J FJ
TOP 2 BOX (NET)
- 1779 - 99 - 281 - 361 - 36 - 1002- 47% - 54% - 55% - 46% - 38% - 46%
JL JL BHJL
Very likely
- 929 - 38 - 67 - 208 - 18 - 598- 25% - 21% - 13% - 27% - 19% - 27%
F F F BDF
Somewhat likely
- 665 - 33 - 122 - 126 - 30 - 354- 18% - 18% - 24% - 16% - 31% - 16%
L BHL BDHL
BOTTOM 2 BOX (NET)
- 332 - 14 - 42 - 63 - 15 - 198- 9% - 8% - 8% - 8% - 16% - 9%
BDFHL
Somewhat unlikely
- 333 - 19 - 80 - 63 - 15 - 156- 9% - 10% - 16% - 8% - 16% - 7%
L BHL BHL
Very unlikely
- 380 - 14 - 37 - 88 - 12 - 229- 10% - 8% - 7% - 11% - 13% - 10%
F F F
Not sure
- 3753 - 184 - 507 - 783 - 96 - 2183- 100% - 100% - 100% - 100% - 100% - 100%
Sigma
_________________________________________________________________________________________________________________Proportions/Means: Columns Tested (5% risk level) - A/B - C/D - E/F - G/H - I/J - K/L - A/C/E/G/I/K - B/D/F/H/J/LOverlap formulae used. * small base; ** very small base (under 30) ineligible for sig testing
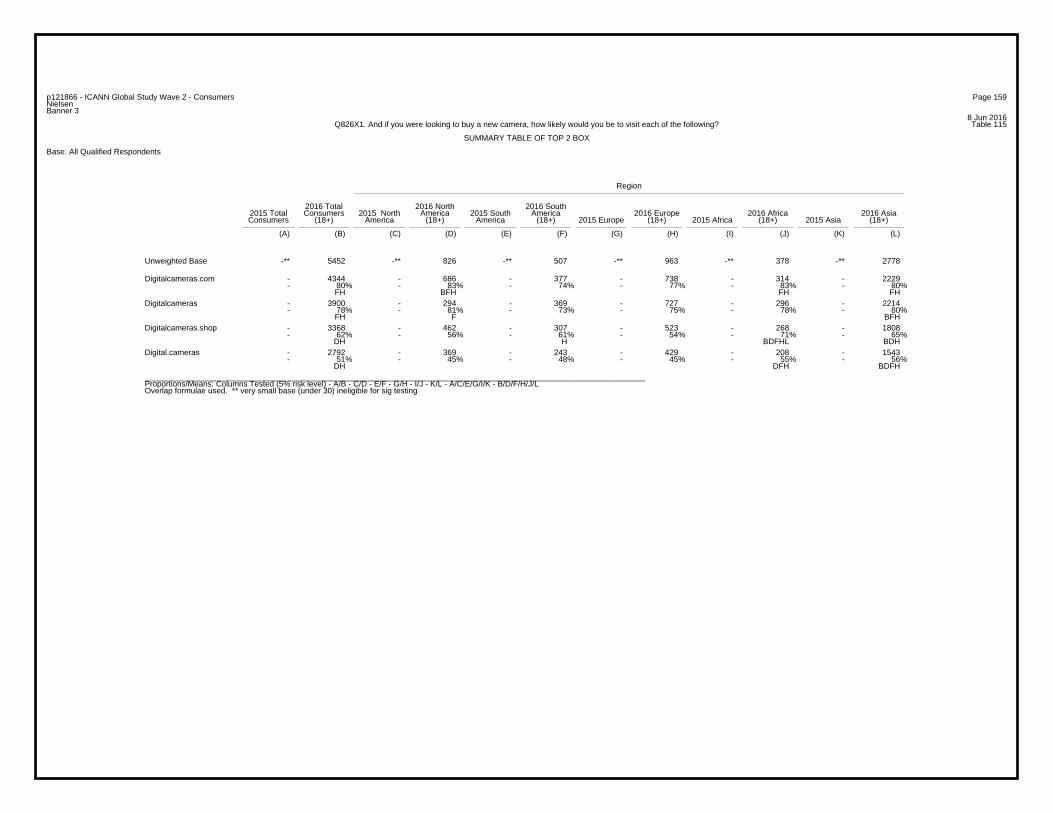
Page 159p121866 - ICANN Global Study Wave 2 - ConsumersNielsenBanner 3
8 Jun 2016Table 115Q826X1. And if you were looking to buy a new camera, how likely would you be to visit each of the following?
SUMMARY TABLE OF TOP 2 BOX
Base: All Qualified Respondents
Region
2016 Total 2016 North 2016 South2015 Total Consumers 2015 North America 2015 South America 2016 Europe 2016 Africa 2016 AsiaConsumers (18+) America (18+) America (18+) 2015 Europe (18+) 2015 Africa (18+) 2015 Asia (18+)
(A) (B) (C) (D) (E) (F) (G) (H) (I) (J) (K) (L)
-** 5452 -** 826 -** 507 -** 963 -** 378 -** 2778Unweighted Base
- 4344 - 686 - 377 - 738 - 314 - 2229- 80% - 83% - 74% - 77% - 83% - 80%
FH BFH FH FH
Digitalcameras.com
- 3900 - 294 - 369 - 727 - 296 - 2214- 78% - 81% - 73% - 75% - 78% - 80%
FH F BFH
Digitalcameras
- 3368 - 462 - 307 - 523 - 268 - 1808- 62% - 56% - 61% - 54% - 71% - 65%
DH H BDFHL BDH
Digitalcameras.shop
- 2792 - 369 - 243 - 429 - 208 - 1543- 51% - 45% - 48% - 45% - 55% - 56%
DH DFH BDFH
Digital.cameras
_________________________________________________________________________________________________________________Proportions/Means: Columns Tested (5% risk level) - A/B - C/D - E/F - G/H - I/J - K/L - A/C/E/G/I/K - B/D/F/H/J/LOverlap formulae used. ** very small base (under 30) ineligible for sig testing
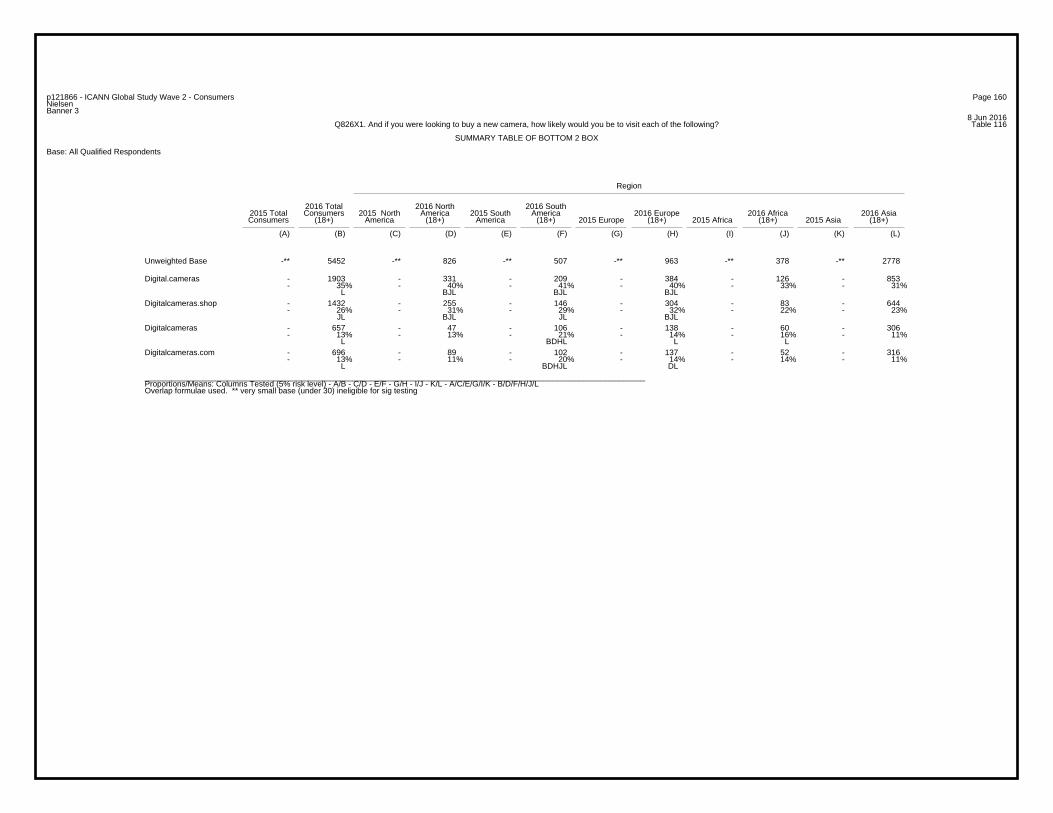
Page 160p121866 - ICANN Global Study Wave 2 - ConsumersNielsenBanner 3
8 Jun 2016Table 116Q826X1. And if you were looking to buy a new camera, how likely would you be to visit each of the following?
SUMMARY TABLE OF BOTTOM 2 BOX
Base: All Qualified Respondents
Region
2016 Total 2016 North 2016 South2015 Total Consumers 2015 North America 2015 South America 2016 Europe 2016 Africa 2016 AsiaConsumers (18+) America (18+) America (18+) 2015 Europe (18+) 2015 Africa (18+) 2015 Asia (18+)
(A) (B) (C) (D) (E) (F) (G) (H) (I) (J) (K) (L)
-** 5452 -** 826 -** 507 -** 963 -** 378 -** 2778Unweighted Base
- 1903 - 331 - 209 - 384 - 126 - 853- 35% - 40% - 41% - 40% - 33% - 31%
L BJL BJL BJL
Digital.cameras
- 1432 - 255 - 146 - 304 - 83 - 644- 26% - 31% - 29% - 32% - 22% - 23%
JL BJL JL BJL
Digitalcameras.shop
- 657 - 47 - 106 - 138 - 60 - 306- 13% - 13% - 21% - 14% - 16% - 11%
L BDHL L L
Digitalcameras
- 696 - 89 - 102 - 137 - 52 - 316- 13% - 11% - 20% - 14% - 14% - 11%
L BDHJL DL
Digitalcameras.com
_________________________________________________________________________________________________________________Proportions/Means: Columns Tested (5% risk level) - A/B - C/D - E/F - G/H - I/J - K/L - A/C/E/G/I/K - B/D/F/H/J/LOverlap formulae used. ** very small base (under 30) ineligible for sig testing

Page 161p121866 - ICANN Global Study Wave 2 - ConsumersNielsenBanner 3
8 Jun 2016Table 117Q826X1_1. And if you were looking to buy a new camera, how likely would you be to visit each of the following?
1. Digitalcameras.com
Base: All Qualified Respondents
Region
2016 Total 2016 North 2016 South2015 Total Consumers 2015 North America 2015 South America 2016 Europe 2016 Africa 2016 AsiaConsumers (18+) America (18+) America (18+) 2015 Europe (18+) 2015 Africa (18+) 2015 Asia (18+)
(A) (B) (C) (D) (E) (F) (G) (H) (I) (J) (K) (L)
-** 5452 -** 826 -** 507 -** 963 -** 378 -** 2778Unweighted Base
- 4344 - 686 - 377 - 738 - 314 - 2229- 80% - 83% - 74% - 77% - 83% - 80%
FH BFH FH FH
TOP 2 BOX (NET)
- 2955 - 493 - 301 - 443 - 261 - 1457- 54% - 60% - 59% - 46% - 69% - 52%
HL BHL BHL BDFHL H
Very likely
- 1389 - 193 - 76 - 295 - 53 - 772- 25% - 23% - 15% - 31% - 14% - 28%
FJ FJ BDFJ BDFJ
Somewhat likely
- 696 - 89 - 102 - 137 - 52 - 316- 13% - 11% - 20% - 14% - 14% - 11%
L BDHJL DL
BOTTOM 2 BOX (NET)
- 351 - 38 - 27 - 63 - 19 - 204- 6% - 5% - 5% - 7% - 5% - 7%
D BD
Somewhat unlikely
- 345 - 51 - 75 - 74 - 33 - 112- 6% - 6% - 15% - 8% - 9% - 4%
L L BDHJL L BL
Very unlikely
- 412 - 51 - 28 - 88 - 12 - 233- 8% - 6% - 6% - 9% - 3% - 8%
J J BDFJ BDFJ
Not sure
- 5452 - 826 - 507 - 963 - 378 - 2778- 100% - 100% - 100% - 100% - 100% - 100%
Sigma
_________________________________________________________________________________________________________________Proportions/Means: Columns Tested (5% risk level) - A/B - C/D - E/F - G/H - I/J - K/L - A/C/E/G/I/K - B/D/F/H/J/LOverlap formulae used. ** very small base (under 30) ineligible for sig testing
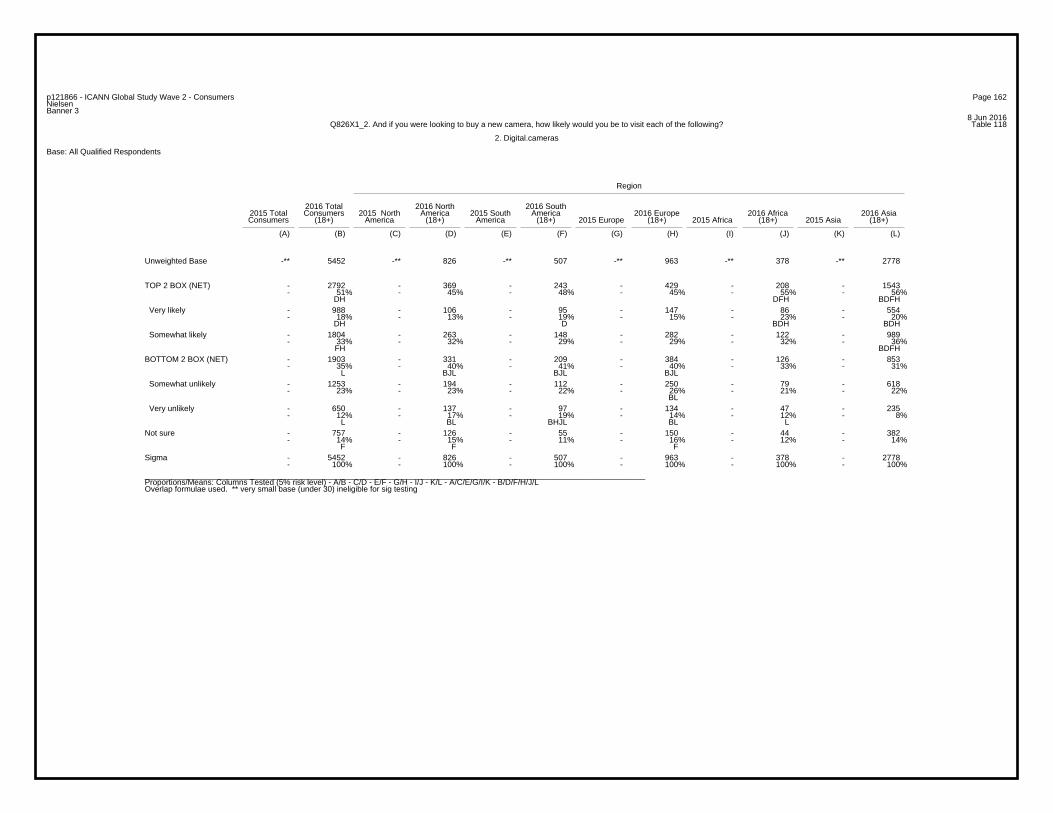
Page 162p121866 - ICANN Global Study Wave 2 - ConsumersNielsenBanner 3
8 Jun 2016Table 118Q826X1_2. And if you were looking to buy a new camera, how likely would you be to visit each of the following?
2. Digital.cameras
Base: All Qualified Respondents
Region
2016 Total 2016 North 2016 South2015 Total Consumers 2015 North America 2015 South America 2016 Europe 2016 Africa 2016 AsiaConsumers (18+) America (18+) America (18+) 2015 Europe (18+) 2015 Africa (18+) 2015 Asia (18+)
(A) (B) (C) (D) (E) (F) (G) (H) (I) (J) (K) (L)
-** 5452 -** 826 -** 507 -** 963 -** 378 -** 2778Unweighted Base
- 2792 - 369 - 243 - 429 - 208 - 1543- 51% - 45% - 48% - 45% - 55% - 56%
DH DFH BDFH
TOP 2 BOX (NET)
- 988 - 106 - 95 - 147 - 86 - 554- 18% - 13% - 19% - 15% - 23% - 20%
DH D BDH BDH
Very likely
- 1804 - 263 - 148 - 282 - 122 - 989- 33% - 32% - 29% - 29% - 32% - 36%
FH BDFH
Somewhat likely
- 1903 - 331 - 209 - 384 - 126 - 853- 35% - 40% - 41% - 40% - 33% - 31%
L BJL BJL BJL
BOTTOM 2 BOX (NET)
- 1253 - 194 - 112 - 250 - 79 - 618- 23% - 23% - 22% - 26% - 21% - 22%
BL
Somewhat unlikely
- 650 - 137 - 97 - 134 - 47 - 235- 12% - 17% - 19% - 14% - 12% - 8%
L BL BHJL BL L
Very unlikely
- 757 - 126 - 55 - 150 - 44 - 382- 14% - 15% - 11% - 16% - 12% - 14%
F F F
Not sure
- 5452 - 826 - 507 - 963 - 378 - 2778- 100% - 100% - 100% - 100% - 100% - 100%
Sigma
_________________________________________________________________________________________________________________Proportions/Means: Columns Tested (5% risk level) - A/B - C/D - E/F - G/H - I/J - K/L - A/C/E/G/I/K - B/D/F/H/J/LOverlap formulae used. ** very small base (under 30) ineligible for sig testing

Page 163p121866 - ICANN Global Study Wave 2 - ConsumersNielsenBanner 3
8 Jun 2016Table 119Q826X1_3. And if you were looking to buy a new camera, how likely would you be to visit each of the following?
3. Digitalcameras.shop
Base: All Qualified Respondents
Region
2016 Total 2016 North 2016 South2015 Total Consumers 2015 North America 2015 South America 2016 Europe 2016 Africa 2016 AsiaConsumers (18+) America (18+) America (18+) 2015 Europe (18+) 2015 Africa (18+) 2015 Asia (18+)
(A) (B) (C) (D) (E) (F) (G) (H) (I) (J) (K) (L)
-** 5452 -** 826 -** 507 -** 963 -** 378 -** 2778Unweighted Base
- 3368 - 462 - 307 - 523 - 268 - 1808- 62% - 56% - 61% - 54% - 71% - 65%
DH H BDFHL BDH
TOP 2 BOX (NET)
- 1496 - 192 - 166 - 223 - 152 - 763- 27% - 23% - 33% - 23% - 40% - 27%
DH BDHL BDFHL DH
Very likely
- 1872 - 270 - 141 - 300 - 116 - 1045- 34% - 33% - 28% - 31% - 31% - 38%
FH BDFHJ
Somewhat likely
- 1432 - 255 - 146 - 304 - 83 - 644- 26% - 31% - 29% - 32% - 22% - 23%
JL BJL JL BJL
BOTTOM 2 BOX (NET)
- 925 - 149 - 78 - 197 - 51 - 450- 17% - 18% - 15% - 20% - 13% - 16%
J BFJL
Somewhat unlikely
- 507 - 106 - 68 - 107 - 32 - 194- 9% - 13% - 13% - 11% - 8% - 7%
L BJL BJL BL
Very unlikely
- 652 - 109 - 54 - 136 - 27 - 326- 12% - 13% - 11% - 14% - 7% - 12%
J J BJ J
Not sure
- 5452 - 826 - 507 - 963 - 378 - 2778- 100% - 100% - 100% - 100% - 100% - 100%
Sigma
_________________________________________________________________________________________________________________Proportions/Means: Columns Tested (5% risk level) - A/B - C/D - E/F - G/H - I/J - K/L - A/C/E/G/I/K - B/D/F/H/J/LOverlap formulae used. ** very small base (under 30) ineligible for sig testing
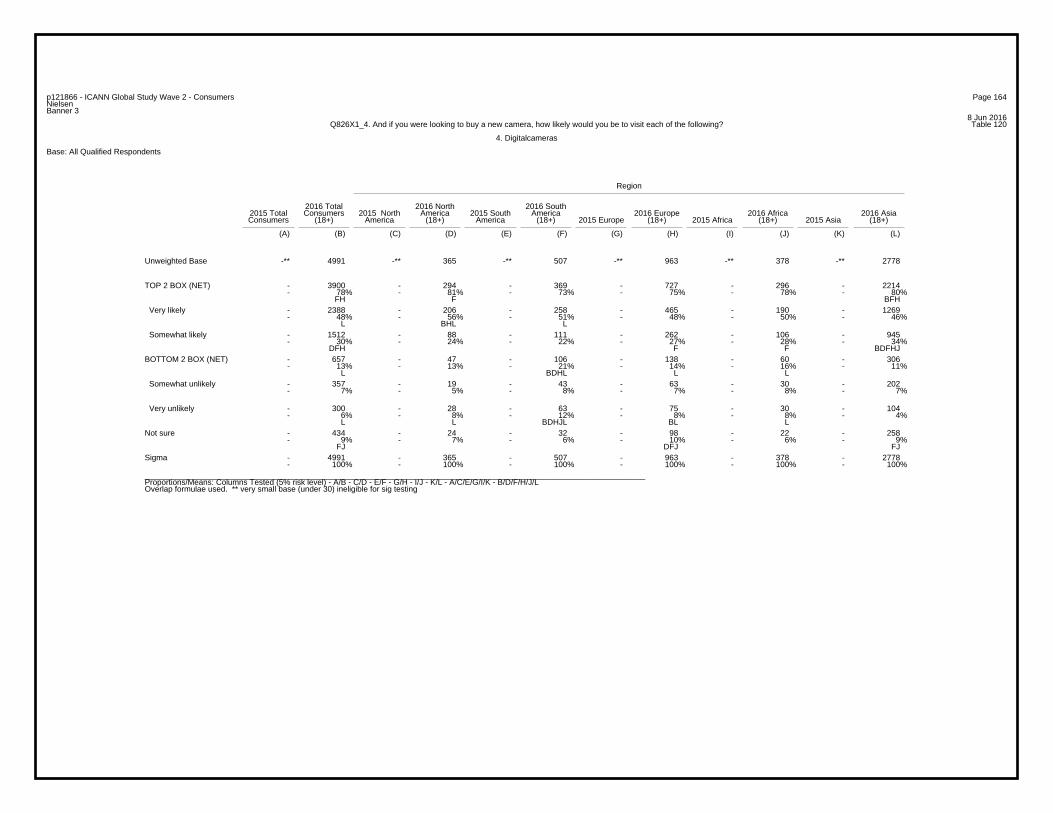
Page 164p121866 - ICANN Global Study Wave 2 - ConsumersNielsenBanner 3
8 Jun 2016Table 120Q826X1_4. And if you were looking to buy a new camera, how likely would you be to visit each of the following?
4. Digitalcameras
Base: All Qualified Respondents
Region
2016 Total 2016 North 2016 South2015 Total Consumers 2015 North America 2015 South America 2016 Europe 2016 Africa 2016 AsiaConsumers (18+) America (18+) America (18+) 2015 Europe (18+) 2015 Africa (18+) 2015 Asia (18+)
(A) (B) (C) (D) (E) (F) (G) (H) (I) (J) (K) (L)
-** 4991 -** 365 -** 507 -** 963 -** 378 -** 2778Unweighted Base
- 3900 - 294 - 369 - 727 - 296 - 2214- 78% - 81% - 73% - 75% - 78% - 80%
FH F BFH
TOP 2 BOX (NET)
- 2388 - 206 - 258 - 465 - 190 - 1269- 48% - 56% - 51% - 48% - 50% - 46%
L BHL L
Very likely
- 1512 - 88 - 111 - 262 - 106 - 945- 30% - 24% - 22% - 27% - 28% - 34%
DFH F F BDFHJ
Somewhat likely
- 657 - 47 - 106 - 138 - 60 - 306- 13% - 13% - 21% - 14% - 16% - 11%
L BDHL L L
BOTTOM 2 BOX (NET)
- 357 - 19 - 43 - 63 - 30 - 202- 7% - 5% - 8% - 7% - 8% - 7%
Somewhat unlikely
- 300 - 28 - 63 - 75 - 30 - 104- 6% - 8% - 12% - 8% - 8% - 4%
L L BDHJL BL L
Very unlikely
- 434 - 24 - 32 - 98 - 22 - 258- 9% - 7% - 6% - 10% - 6% - 9%
FJ DFJ FJ
Not sure
- 4991 - 365 - 507 - 963 - 378 - 2778- 100% - 100% - 100% - 100% - 100% - 100%
Sigma
_________________________________________________________________________________________________________________Proportions/Means: Columns Tested (5% risk level) - A/B - C/D - E/F - G/H - I/J - K/L - A/C/E/G/I/K - B/D/F/H/J/LOverlap formulae used. ** very small base (under 30) ineligible for sig testing
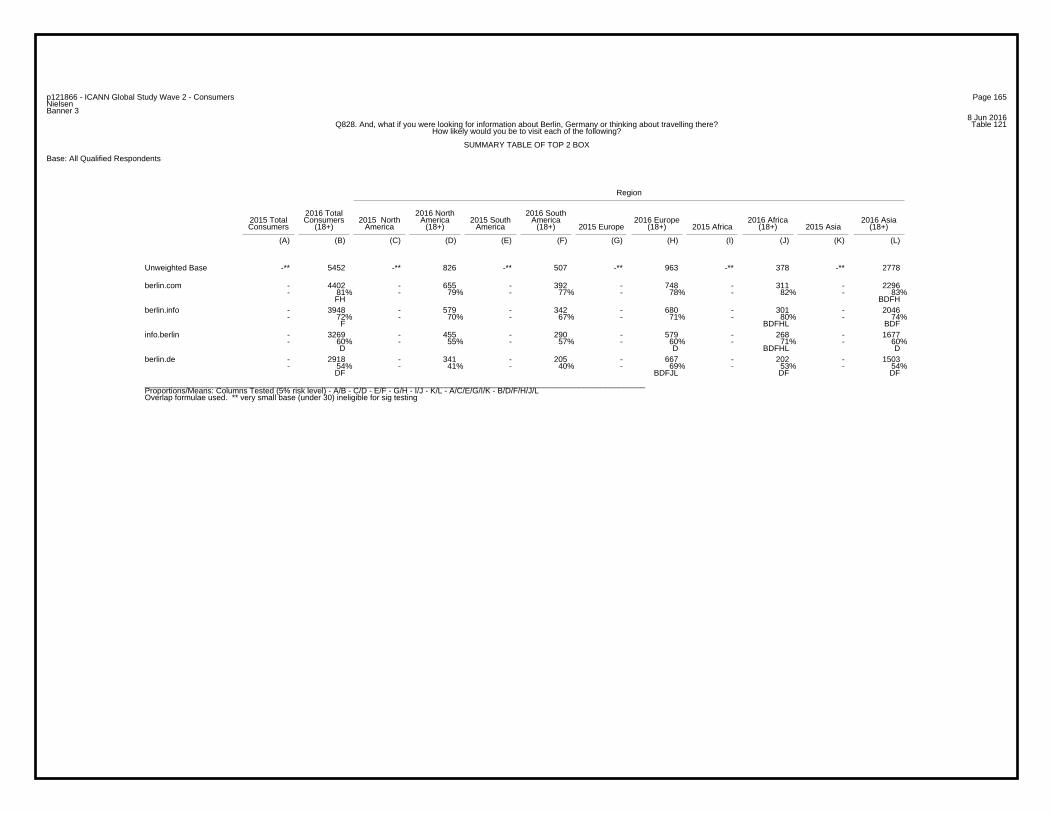
Page 165p121866 - ICANN Global Study Wave 2 - ConsumersNielsenBanner 3
8 Jun 2016Table 121Q828. And, what if you were looking for information about Berlin, Germany or thinking about travelling there?
How likely would you be to visit each of the following?
SUMMARY TABLE OF TOP 2 BOX
Base: All Qualified Respondents
Region
2016 Total 2016 North 2016 South2015 Total Consumers 2015 North America 2015 South America 2016 Europe 2016 Africa 2016 AsiaConsumers (18+) America (18+) America (18+) 2015 Europe (18+) 2015 Africa (18+) 2015 Asia (18+)
(A) (B) (C) (D) (E) (F) (G) (H) (I) (J) (K) (L)
-** 5452 -** 826 -** 507 -** 963 -** 378 -** 2778Unweighted Base
- 4402 - 655 - 392 - 748 - 311 - 2296- 81% - 79% - 77% - 78% - 82% - 83%
FH BDFH
berlin.com
- 3948 - 579 - 342 - 680 - 301 - 2046- 72% - 70% - 67% - 71% - 80% - 74%
F BDFHL BDF
berlin.info
- 3269 - 455 - 290 - 579 - 268 - 1677- 60% - 55% - 57% - 60% - 71% - 60%
D D BDFHL D
info.berlin
- 2918 - 341 - 205 - 667 - 202 - 1503- 54% - 41% - 40% - 69% - 53% - 54%
DF BDFJL DF DF
berlin.de
_________________________________________________________________________________________________________________Proportions/Means: Columns Tested (5% risk level) - A/B - C/D - E/F - G/H - I/J - K/L - A/C/E/G/I/K - B/D/F/H/J/LOverlap formulae used. ** very small base (under 30) ineligible for sig testing
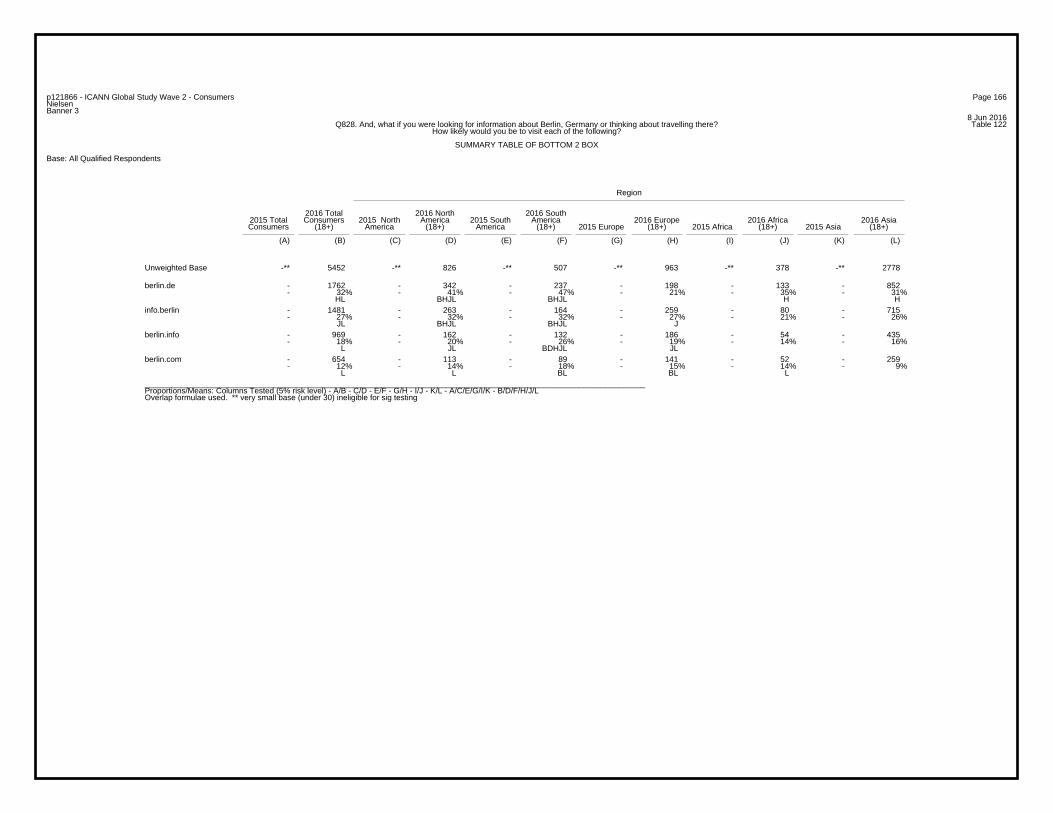
Page 166p121866 - ICANN Global Study Wave 2 - ConsumersNielsenBanner 3
8 Jun 2016Table 122Q828. And, what if you were looking for information about Berlin, Germany or thinking about travelling there?
How likely would you be to visit each of the following?
SUMMARY TABLE OF BOTTOM 2 BOX
Base: All Qualified Respondents
Region
2016 Total 2016 North 2016 South2015 Total Consumers 2015 North America 2015 South America 2016 Europe 2016 Africa 2016 AsiaConsumers (18+) America (18+) America (18+) 2015 Europe (18+) 2015 Africa (18+) 2015 Asia (18+)
(A) (B) (C) (D) (E) (F) (G) (H) (I) (J) (K) (L)
-** 5452 -** 826 -** 507 -** 963 -** 378 -** 2778Unweighted Base
- 1762 - 342 - 237 - 198 - 133 - 852- 32% - 41% - 47% - 21% - 35% - 31%
HL BHJL BHJL H H
berlin.de
- 1481 - 263 - 164 - 259 - 80 - 715- 27% - 32% - 32% - 27% - 21% - 26%
JL BHJL BHJL J
info.berlin
- 969 - 162 - 132 - 186 - 54 - 435- 18% - 20% - 26% - 19% - 14% - 16%
L JL BDHJL JL
berlin.info
- 654 - 113 - 89 - 141 - 52 - 259- 12% - 14% - 18% - 15% - 14% - 9%
L L BL BL L
berlin.com
_________________________________________________________________________________________________________________Proportions/Means: Columns Tested (5% risk level) - A/B - C/D - E/F - G/H - I/J - K/L - A/C/E/G/I/K - B/D/F/H/J/LOverlap formulae used. ** very small base (under 30) ineligible for sig testing
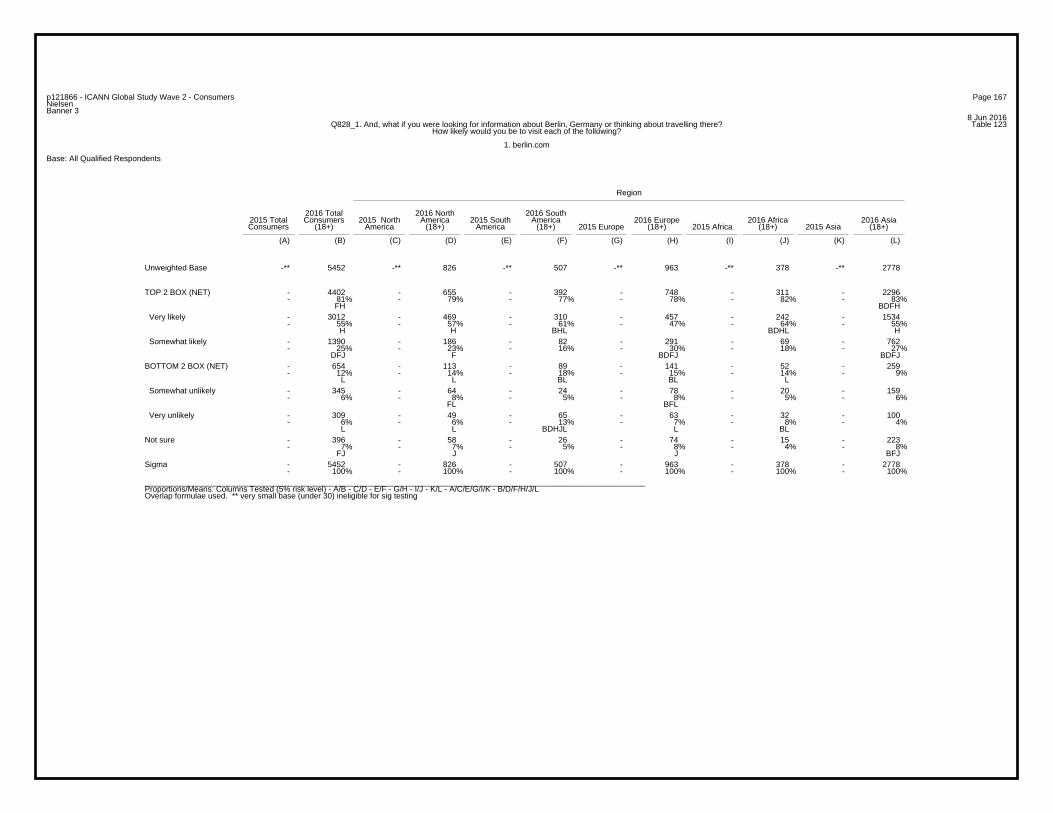
Page 167p121866 - ICANN Global Study Wave 2 - ConsumersNielsenBanner 3
8 Jun 2016Table 123Q828_1. And, what if you were looking for information about Berlin, Germany or thinking about travelling there?
How likely would you be to visit each of the following?
1. berlin.com
Base: All Qualified Respondents
Region
2016 Total 2016 North 2016 South2015 Total Consumers 2015 North America 2015 South America 2016 Europe 2016 Africa 2016 AsiaConsumers (18+) America (18+) America (18+) 2015 Europe (18+) 2015 Africa (18+) 2015 Asia (18+)
(A) (B) (C) (D) (E) (F) (G) (H) (I) (J) (K) (L)
-** 5452 -** 826 -** 507 -** 963 -** 378 -** 2778Unweighted Base
- 4402 - 655 - 392 - 748 - 311 - 2296- 81% - 79% - 77% - 78% - 82% - 83%
FH BDFH
TOP 2 BOX (NET)
- 3012 - 469 - 310 - 457 - 242 - 1534- 55% - 57% - 61% - 47% - 64% - 55%
H H BHL BDHL H
Very likely
- 1390 - 186 - 82 - 291 - 69 - 762- 25% - 23% - 16% - 30% - 18% - 27%
DFJ F BDFJ BDFJ
Somewhat likely
- 654 - 113 - 89 - 141 - 52 - 259- 12% - 14% - 18% - 15% - 14% - 9%
L L BL BL L
BOTTOM 2 BOX (NET)
- 345 - 64 - 24 - 78 - 20 - 159- 6% - 8% - 5% - 8% - 5% - 6%
FL BFL
Somewhat unlikely
- 309 - 49 - 65 - 63 - 32 - 100- 6% - 6% - 13% - 7% - 8% - 4%
L L BDHJL L BL
Very unlikely
- 396 - 58 - 26 - 74 - 15 - 223- 7% - 7% - 5% - 8% - 4% - 8%
FJ J J BFJ
Not sure
- 5452 - 826 - 507 - 963 - 378 - 2778- 100% - 100% - 100% - 100% - 100% - 100%
Sigma
_________________________________________________________________________________________________________________Proportions/Means: Columns Tested (5% risk level) - A/B - C/D - E/F - G/H - I/J - K/L - A/C/E/G/I/K - B/D/F/H/J/LOverlap formulae used. ** very small base (under 30) ineligible for sig testing
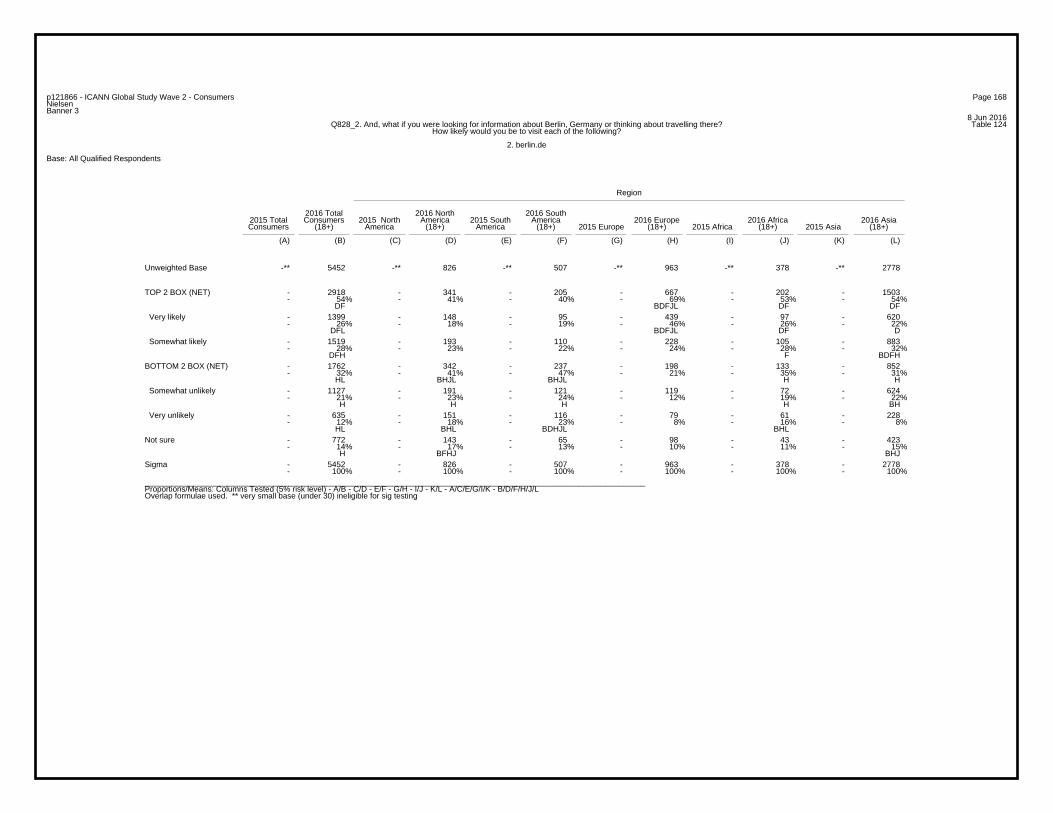
Page 168p121866 - ICANN Global Study Wave 2 - ConsumersNielsenBanner 3
8 Jun 2016Table 124Q828_2. And, what if you were looking for information about Berlin, Germany or thinking about travelling there?
How likely would you be to visit each of the following?
2. berlin.de
Base: All Qualified Respondents
Region
2016 Total 2016 North 2016 South2015 Total Consumers 2015 North America 2015 South America 2016 Europe 2016 Africa 2016 AsiaConsumers (18+) America (18+) America (18+) 2015 Europe (18+) 2015 Africa (18+) 2015 Asia (18+)
(A) (B) (C) (D) (E) (F) (G) (H) (I) (J) (K) (L)
-** 5452 -** 826 -** 507 -** 963 -** 378 -** 2778Unweighted Base
- 2918 - 341 - 205 - 667 - 202 - 1503- 54% - 41% - 40% - 69% - 53% - 54%
DF BDFJL DF DF
TOP 2 BOX (NET)
- 1399 - 148 - 95 - 439 - 97 - 620- 26% - 18% - 19% - 46% - 26% - 22%
DFL BDFJL DF D
Very likely
- 1519 - 193 - 110 - 228 - 105 - 883- 28% - 23% - 22% - 24% - 28% - 32%
DFH F BDFH
Somewhat likely
- 1762 - 342 - 237 - 198 - 133 - 852- 32% - 41% - 47% - 21% - 35% - 31%
HL BHJL BHJL H H
BOTTOM 2 BOX (NET)
- 1127 - 191 - 121 - 119 - 72 - 624- 21% - 23% - 24% - 12% - 19% - 22%
H H H H BH
Somewhat unlikely
- 635 - 151 - 116 - 79 - 61 - 228- 12% - 18% - 23% - 8% - 16% - 8%
HL BHL BDHJL BHL
Very unlikely
- 772 - 143 - 65 - 98 - 43 - 423- 14% - 17% - 13% - 10% - 11% - 15%
H BFHJ BHJ
Not sure
- 5452 - 826 - 507 - 963 - 378 - 2778- 100% - 100% - 100% - 100% - 100% - 100%
Sigma
_________________________________________________________________________________________________________________Proportions/Means: Columns Tested (5% risk level) - A/B - C/D - E/F - G/H - I/J - K/L - A/C/E/G/I/K - B/D/F/H/J/LOverlap formulae used. ** very small base (under 30) ineligible for sig testing
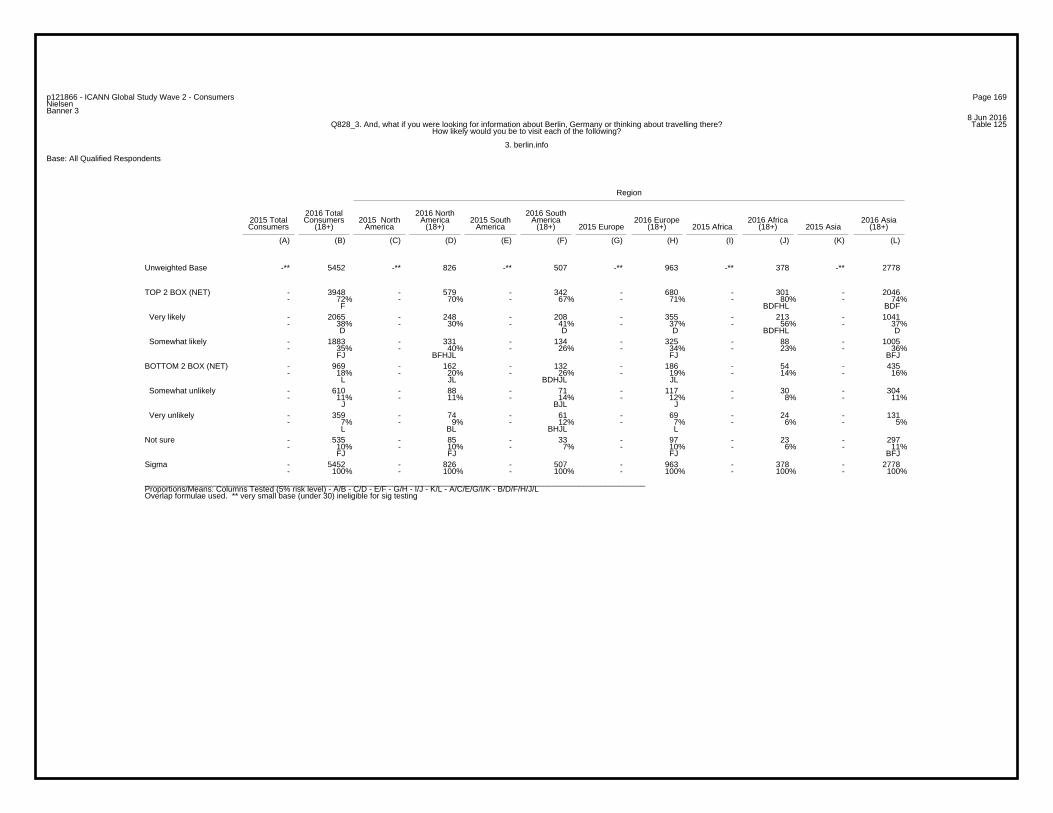
Page 169p121866 - ICANN Global Study Wave 2 - ConsumersNielsenBanner 3
8 Jun 2016Table 125Q828_3. And, what if you were looking for information about Berlin, Germany or thinking about travelling there?
How likely would you be to visit each of the following?
3. berlin.info
Base: All Qualified Respondents
Region
2016 Total 2016 North 2016 South2015 Total Consumers 2015 North America 2015 South America 2016 Europe 2016 Africa 2016 AsiaConsumers (18+) America (18+) America (18+) 2015 Europe (18+) 2015 Africa (18+) 2015 Asia (18+)
(A) (B) (C) (D) (E) (F) (G) (H) (I) (J) (K) (L)
-** 5452 -** 826 -** 507 -** 963 -** 378 -** 2778Unweighted Base
- 3948 - 579 - 342 - 680 - 301 - 2046- 72% - 70% - 67% - 71% - 80% - 74%
F BDFHL BDF
TOP 2 BOX (NET)
- 2065 - 248 - 208 - 355 - 213 - 1041- 38% - 30% - 41% - 37% - 56% - 37%
D D D BDFHL D
Very likely
- 1883 - 331 - 134 - 325 - 88 - 1005- 35% - 40% - 26% - 34% - 23% - 36%
FJ BFHJL FJ BFJ
Somewhat likely
- 969 - 162 - 132 - 186 - 54 - 435- 18% - 20% - 26% - 19% - 14% - 16%
L JL BDHJL JL
BOTTOM 2 BOX (NET)
- 610 - 88 - 71 - 117 - 30 - 304- 11% - 11% - 14% - 12% - 8% - 11%
J BJL J
Somewhat unlikely
- 359 - 74 - 61 - 69 - 24 - 131- 7% - 9% - 12% - 7% - 6% - 5%
L BL BHJL L
Very unlikely
- 535 - 85 - 33 - 97 - 23 - 297- 10% - 10% - 7% - 10% - 6% - 11%
FJ FJ FJ BFJ
Not sure
- 5452 - 826 - 507 - 963 - 378 - 2778- 100% - 100% - 100% - 100% - 100% - 100%
Sigma
_________________________________________________________________________________________________________________Proportions/Means: Columns Tested (5% risk level) - A/B - C/D - E/F - G/H - I/J - K/L - A/C/E/G/I/K - B/D/F/H/J/LOverlap formulae used. ** very small base (under 30) ineligible for sig testing
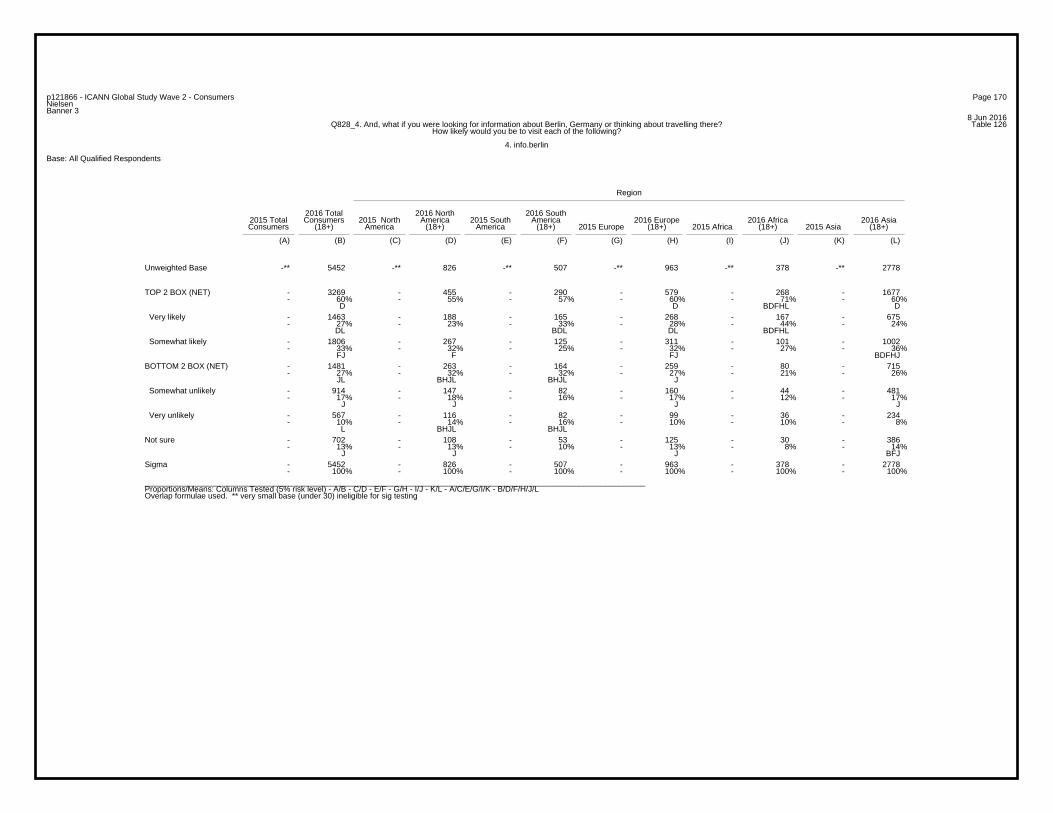
Page 170p121866 - ICANN Global Study Wave 2 - ConsumersNielsenBanner 3
8 Jun 2016Table 126Q828_4. And, what if you were looking for information about Berlin, Germany or thinking about travelling there?
How likely would you be to visit each of the following?
4. info.berlin
Base: All Qualified Respondents
Region
2016 Total 2016 North 2016 South2015 Total Consumers 2015 North America 2015 South America 2016 Europe 2016 Africa 2016 AsiaConsumers (18+) America (18+) America (18+) 2015 Europe (18+) 2015 Africa (18+) 2015 Asia (18+)
(A) (B) (C) (D) (E) (F) (G) (H) (I) (J) (K) (L)
-** 5452 -** 826 -** 507 -** 963 -** 378 -** 2778Unweighted Base
- 3269 - 455 - 290 - 579 - 268 - 1677- 60% - 55% - 57% - 60% - 71% - 60%
D D BDFHL D
TOP 2 BOX (NET)
- 1463 - 188 - 165 - 268 - 167 - 675- 27% - 23% - 33% - 28% - 44% - 24%
DL BDL DL BDFHL
Very likely
- 1806 - 267 - 125 - 311 - 101 - 1002- 33% - 32% - 25% - 32% - 27% - 36%
FJ F FJ BDFHJ
Somewhat likely
- 1481 - 263 - 164 - 259 - 80 - 715- 27% - 32% - 32% - 27% - 21% - 26%
JL BHJL BHJL J
BOTTOM 2 BOX (NET)
- 914 - 147 - 82 - 160 - 44 - 481- 17% - 18% - 16% - 17% - 12% - 17%
J J J J
Somewhat unlikely
- 567 - 116 - 82 - 99 - 36 - 234- 10% - 14% - 16% - 10% - 10% - 8%
L BHJL BHJL
Very unlikely
- 702 - 108 - 53 - 125 - 30 - 386- 13% - 13% - 10% - 13% - 8% - 14%
J J J BFJ
Not sure
- 5452 - 826 - 507 - 963 - 378 - 2778- 100% - 100% - 100% - 100% - 100% - 100%
Sigma
_________________________________________________________________________________________________________________Proportions/Means: Columns Tested (5% risk level) - A/B - C/D - E/F - G/H - I/J - K/L - A/C/E/G/I/K - B/D/F/H/J/LOverlap formulae used. ** very small base (under 30) ineligible for sig testing
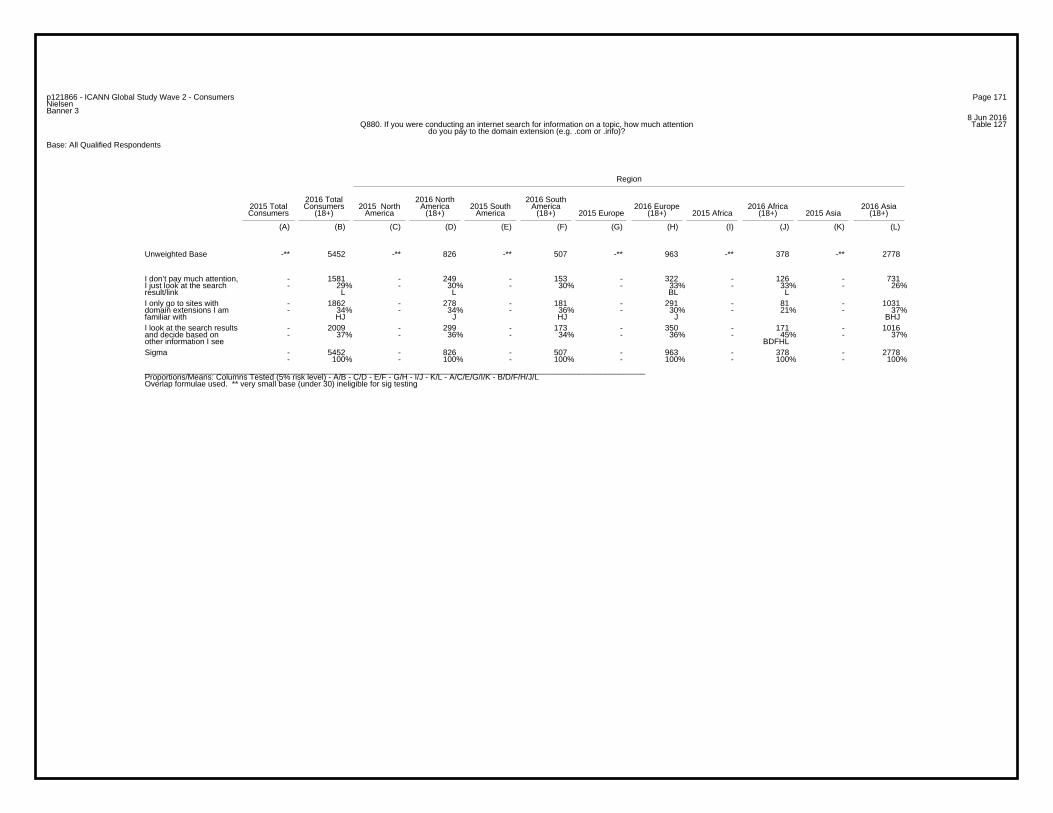
Page 171p121866 - ICANN Global Study Wave 2 - ConsumersNielsenBanner 3
8 Jun 2016Table 127Q880. If you were conducting an internet search for information on a topic, how much attention
do you pay to the domain extension (e.g. .com or .info)?
Base: All Qualified Respondents
Region
2016 Total 2016 North 2016 South2015 Total Consumers 2015 North America 2015 South America 2016 Europe 2016 Africa 2016 AsiaConsumers (18+) America (18+) America (18+) 2015 Europe (18+) 2015 Africa (18+) 2015 Asia (18+)
(A) (B) (C) (D) (E) (F) (G) (H) (I) (J) (K) (L)
-** 5452 -** 826 -** 507 -** 963 -** 378 -** 2778Unweighted Base
- 1581 - 249 - 153 - 322 - 126 - 731- 29% - 30% - 30% - 33% - 33% - 26%
L L BL L
I don’t pay much attention,I just look at the searchresult/link
- 1862 - 278 - 181 - 291 - 81 - 1031- 34% - 34% - 36% - 30% - 21% - 37%
HJ J HJ J BHJ
I only go to sites withdomain extensions I amfamiliar with
- 2009 - 299 - 173 - 350 - 171 - 1016- 37% - 36% - 34% - 36% - 45% - 37%
BDFHL
I look at the search resultsand decide based onother information I see
- 5452 - 826 - 507 - 963 - 378 - 2778- 100% - 100% - 100% - 100% - 100% - 100%
Sigma
_________________________________________________________________________________________________________________Proportions/Means: Columns Tested (5% risk level) - A/B - C/D - E/F - G/H - I/J - K/L - A/C/E/G/I/K - B/D/F/H/J/LOverlap formulae used. ** very small base (under 30) ineligible for sig testing
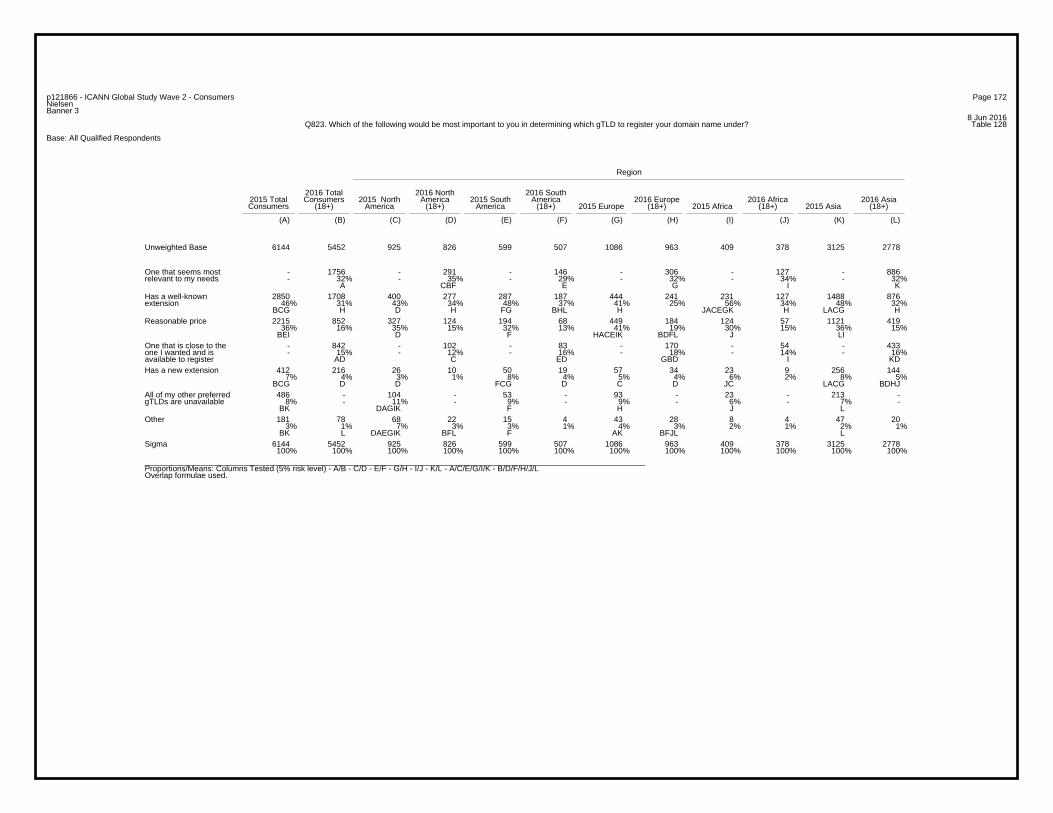
Page 172p121866 - ICANN Global Study Wave 2 - ConsumersNielsenBanner 3
8 Jun 2016Table 128Q823. Which of the following would be most important to you in determining which gTLD to register your domain name under?
Base: All Qualified Respondents
Region
2016 Total 2016 North 2016 South2015 Total Consumers 2015 North America 2015 South America 2016 Europe 2016 Africa 2016 AsiaConsumers (18+) America (18+) America (18+) 2015 Europe (18+) 2015 Africa (18+) 2015 Asia (18+)
(A) (B) (C) (D) (E) (F) (G) (H) (I) (J) (K) (L)
6144 5452 925 826 599 507 1086 963 409 378 3125 2778Unweighted Base
- 1756 - 291 - 146 - 306 - 127 - 886- 32% - 35% - 29% - 32% - 34% - 32%
A CBF E G I K
One that seems mostrelevant to my needs
2850 1708 400 277 287 187 444 241 231 127 1488 87646% 31% 43% 34% 48% 37% 41% 25% 56% 34% 48% 32%
BCG H D H FG BHL H JACEGK H LACG H
Has a well-knownextension
2215 852 327 124 194 68 449 184 124 57 1121 41936% 16% 35% 15% 32% 13% 41% 19% 30% 15% 36% 15%
BEI D F HACEIK BDFL J LI
Reasonable price
- 842 - 102 - 83 - 170 - 54 - 433- 15% - 12% - 16% - 18% - 14% - 16%
AD C ED GBD I KD
One that is close to theone I wanted and isavailable to register
412 216 26 10 50 19 57 34 23 9 256 1447% 4% 3% 1% 8% 4% 5% 4% 6% 2% 8% 5%
BCG D D FCG D C D JC LACG BDHJ
Has a new extension
486 - 104 - 53 - 93 - 23 - 213 -8% - 11% - 9% - 9% - 6% - 7% -
BK DAGIK F H J L
All of my other preferredgTLDs are unavailable
181 78 68 22 15 4 43 28 8 4 47 203% 1% 7% 3% 3% 1% 4% 3% 2% 1% 2% 1%
BK L DAEGIK BFL F AK BFJL L
Other
6144 5452 925 826 599 507 1086 963 409 378 3125 2778100% 100% 100% 100% 100% 100% 100% 100% 100% 100% 100% 100%
Sigma
_________________________________________________________________________________________________________________Proportions/Means: Columns Tested (5% risk level) - A/B - C/D - E/F - G/H - I/J - K/L - A/C/E/G/I/K - B/D/F/H/J/LOverlap formulae used.
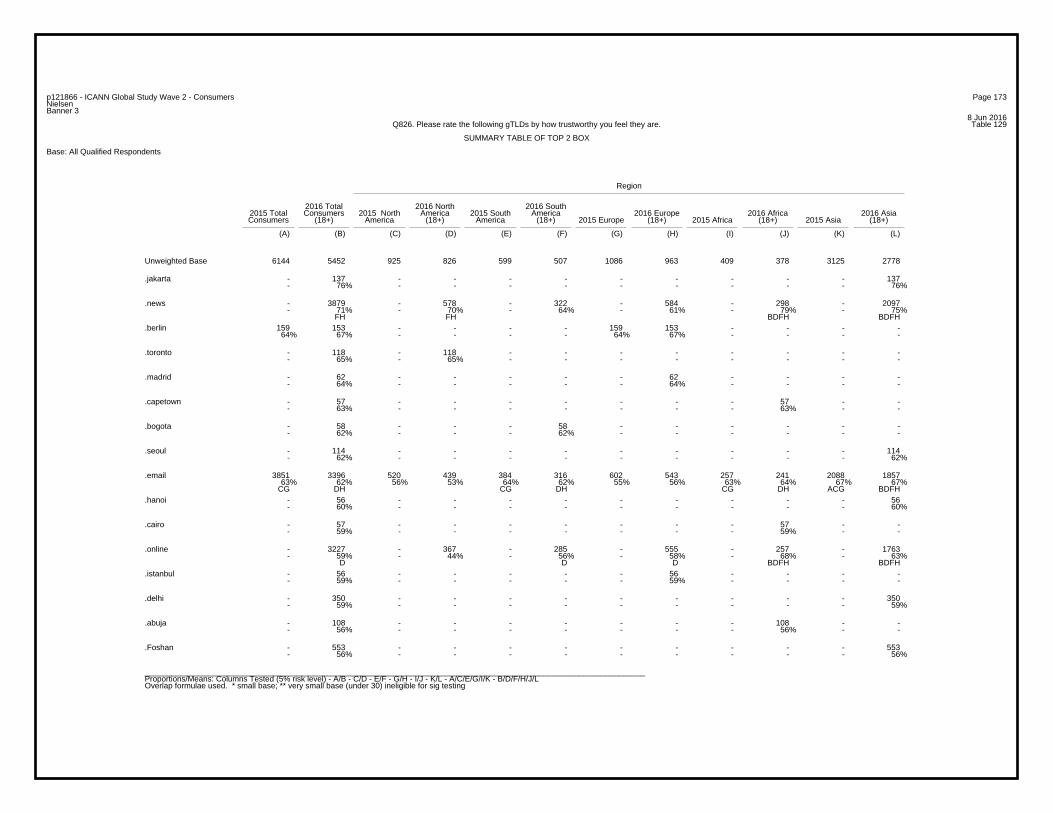
Page 173p121866 - ICANN Global Study Wave 2 - ConsumersNielsenBanner 3
8 Jun 2016Table 129Q826. Please rate the following gTLDs by how trustworthy you feel they are.
SUMMARY TABLE OF TOP 2 BOX
Base: All Qualified Respondents
Region
2016 Total 2016 North 2016 South2015 Total Consumers 2015 North America 2015 South America 2016 Europe 2016 Africa 2016 AsiaConsumers (18+) America (18+) America (18+) 2015 Europe (18+) 2015 Africa (18+) 2015 Asia (18+)
(A) (B) (C) (D) (E) (F) (G) (H) (I) (J) (K) (L)
6144 5452 925 826 599 507 1086 963 409 378 3125 2778Unweighted Base
- 137 - - - - - - - - - 137- 76% - - - - - - - - - 76%
.jakarta
- 3879 - 578 - 322 - 584 - 298 - 2097- 71% - 70% - 64% - 61% - 79% - 75%
FH FH BDFH BDFH
.news
159 153 - - - - 159 153 - - - -64% 67% - - - - 64% 67% - - - -
.berlin
- 118 - 118 - - - - - - - -- 65% - 65% - - - - - - - -
.toronto
- 62 - - - - - 62 - - - -- 64% - - - - - 64% - - - -
.madrid
- 57 - - - - - - - 57 - -- 63% - - - - - - - 63% - -
.capetown
- 58 - - - 58 - - - - - -- 62% - - - 62% - - - - - -
.bogota
- 114 - - - - - - - - - 114- 62% - - - - - - - - - 62%
.seoul
3851 3396 520 439 384 316 602 543 257 241 2088 185763% 62% 56% 53% 64% 62% 55% 56% 63% 64% 67% 67%
CG DH CG DH CG DH ACG BDFH
- 56 - - - - - - - - - 56- 60% - - - - - - - - - 60%
.hanoi
- 57 - - - - - - - 57 - -- 59% - - - - - - - 59% - -
.cairo
- 3227 - 367 - 285 - 555 - 257 - 1763- 59% - 44% - 56% - 58% - 68% - 63%
D D D BDFH BDFH
.online
- 56 - - - - - 56 - - - -- 59% - - - - - 59% - - - -
.istanbul
- 350 - - - - - - - - - 350- 59% - - - - - - - - - 59%
.delhi
- 108 - - - - - - - 108 - -- 56% - - - - - - - 56% - -
.abuja
- 553 - - - - - - - - - 553- 56% - - - - - - - - - 56%
.Foshan
_________________________________________________________________________________________________________________Proportions/Means: Columns Tested (5% risk level) - A/B - C/D - E/F - G/H - I/J - K/L - A/C/E/G/I/K - B/D/F/H/J/LOverlap formulae used. * small base; ** very small base (under 30) ineligible for sig testing
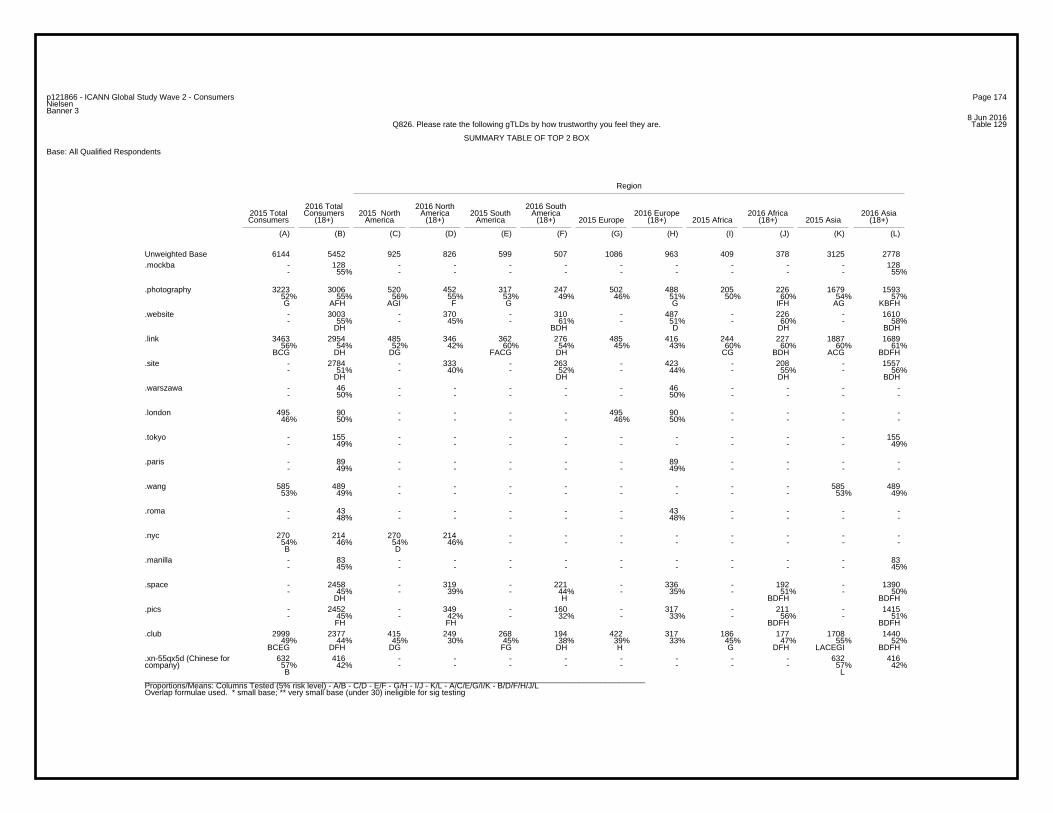
Page 174p121866 - ICANN Global Study Wave 2 - ConsumersNielsenBanner 3
8 Jun 2016Table 129Q826. Please rate the following gTLDs by how trustworthy you feel they are.
SUMMARY TABLE OF TOP 2 BOX
Base: All Qualified Respondents
Region
2016 Total 2016 North 2016 South2015 Total Consumers 2015 North America 2015 South America 2016 Europe 2016 Africa 2016 AsiaConsumers (18+) America (18+) America (18+) 2015 Europe (18+) 2015 Africa (18+) 2015 Asia (18+)
(A) (B) (C) (D) (E) (F) (G) (H) (I) (J) (K) (L)
6144 5452 925 826 599 507 1086 963 409 378 3125 2778Unweighted Base- 128 - - - - - - - - - 128- 55% - - - - - - - - - 55%
.mockba
3223 3006 520 452 317 247 502 488 205 226 1679 159352% 55% 56% 55% 53% 49% 46% 51% 50% 60% 54% 57%G AFH AGI F G G IFH AG KBFH
.photography
- 3003 - 370 - 310 - 487 - 226 - 1610- 55% - 45% - 61% - 51% - 60% - 58%
DH BDH D DH BDH
.website
3463 2954 485 346 362 276 485 416 244 227 1887 168956% 54% 52% 42% 60% 54% 45% 43% 60% 60% 60% 61%
BCG DH DG FACG DH CG BDH ACG BDFH
.link
- 2784 - 333 - 263 - 423 - 208 - 1557- 51% - 40% - 52% - 44% - 55% - 56%
DH DH DH BDH
.site
- 46 - - - - - 46 - - - -- 50% - - - - - 50% - - - -
.warszawa
495 90 - - - - 495 90 - - - -46% 50% - - - - 46% 50% - - - -
.london
- 155 - - - - - - - - - 155- 49% - - - - - - - - - 49%
.tokyo
- 89 - - - - - 89 - - - -- 49% - - - - - 49% - - - -
.paris
585 489 - - - - - - - - 585 48953% 49% - - - - - - - - 53% 49%
.wang
- 43 - - - - - 43 - - - -- 48% - - - - - 48% - - - -
.roma
270 214 270 214 - - - - - - - -54% 46% 54% 46% - - - - - - - - B D
.nyc
- 83 - - - - - - - - - 83- 45% - - - - - - - - - 45%
.manilla
- 2458 - 319 - 221 - 336 - 192 - 1390- 45% - 39% - 44% - 35% - 51% - 50%
DH H BDFH BDFH
.space
- 2452 - 349 - 160 - 317 - 211 - 1415- 45% - 42% - 32% - 33% - 56% - 51%
FH FH BDFH BDFH
.pics
2999 2377 415 249 268 194 422 317 186 177 1708 144049% 44% 45% 30% 45% 38% 39% 33% 45% 47% 55% 52%
BCEG DFH DG FG DH H G DFH LACEGI BDFH
.club
632 416 - - - - - - - - 632 41657% 42% - - - - - - - - 57% 42%B L
.xn-55qx5d (Chinese forcompany)
_________________________________________________________________________________________________________________Proportions/Means: Columns Tested (5% risk level) - A/B - C/D - E/F - G/H - I/J - K/L - A/C/E/G/I/K - B/D/F/H/J/LOverlap formulae used. * small base; ** very small base (under 30) ineligible for sig testing
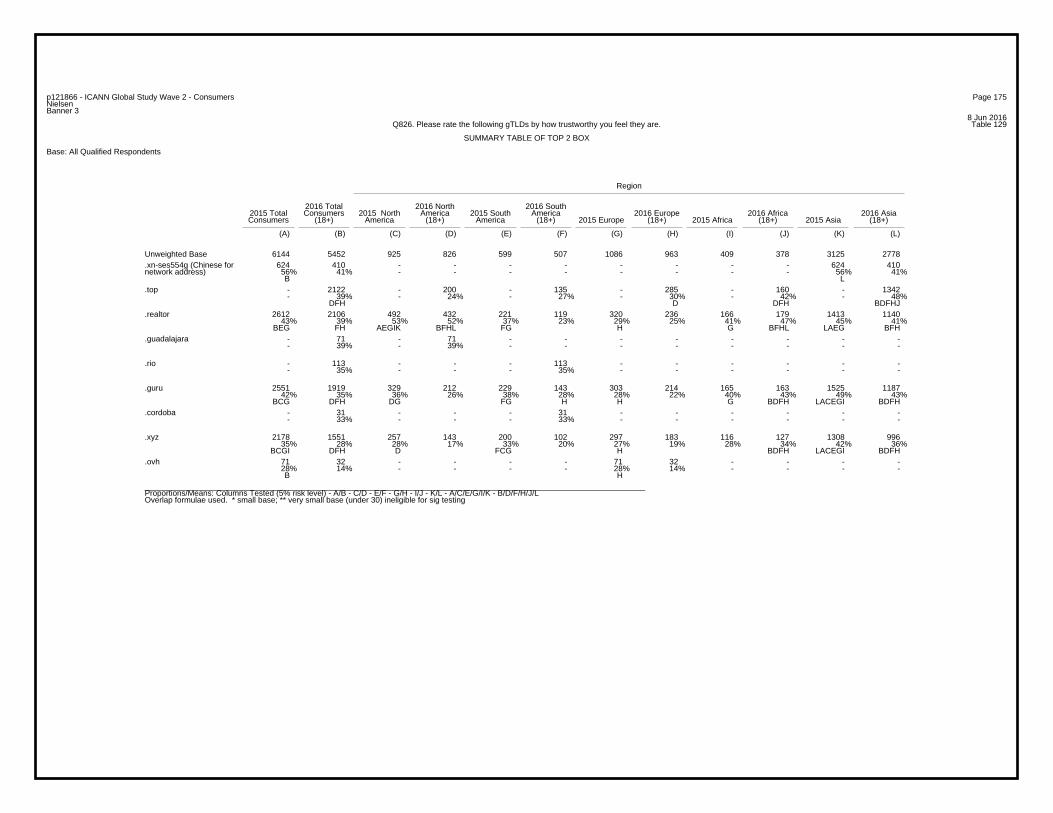
Page 175p121866 - ICANN Global Study Wave 2 - ConsumersNielsenBanner 3
8 Jun 2016Table 129Q826. Please rate the following gTLDs by how trustworthy you feel they are.
SUMMARY TABLE OF TOP 2 BOX
Base: All Qualified Respondents
Region
2016 Total 2016 North 2016 South2015 Total Consumers 2015 North America 2015 South America 2016 Europe 2016 Africa 2016 AsiaConsumers (18+) America (18+) America (18+) 2015 Europe (18+) 2015 Africa (18+) 2015 Asia (18+)
(A) (B) (C) (D) (E) (F) (G) (H) (I) (J) (K) (L)
6144 5452 925 826 599 507 1086 963 409 378 3125 2778Unweighted Base624 410 - - - - - - - - 624 410
56% 41% - - - - - - - - 56% 41%B L
.xn-ses554g (Chinese fornetwork address)
- 2122 - 200 - 135 - 285 - 160 - 1342- 39% - 24% - 27% - 30% - 42% - 48%
DFH D DFH BDFHJ
.top
2612 2106 492 432 221 119 320 236 166 179 1413 114043% 39% 53% 52% 37% 23% 29% 25% 41% 47% 45% 41%
BEG FH AEGIK BFHL FG H G BFHL LAEG BFH
.realtor
- 71 - 71 - - - - - - - -- 39% - 39% - - - - - - - -
.guadalajara
- 113 - - - 113 - - - - - -- 35% - - - 35% - - - - - -
.rio
2551 1919 329 212 229 143 303 214 165 163 1525 118742% 35% 36% 26% 38% 28% 28% 22% 40% 43% 49% 43%
BCG DFH DG FG H H G BDFH LACEGI BDFH
.guru
- 31 - - - 31 - - - - - -- 33% - - - 33% - - - - - -
.cordoba
2178 1551 257 143 200 102 297 183 116 127 1308 99635% 28% 28% 17% 33% 20% 27% 19% 28% 34% 42% 36%
BCGI DFH D FCG H BDFH LACEGI BDFH
.xyz
71 32 - - - - 71 32 - - - -28% 14% - - - - 28% 14% - - - - B H
.ovh
_________________________________________________________________________________________________________________Proportions/Means: Columns Tested (5% risk level) - A/B - C/D - E/F - G/H - I/J - K/L - A/C/E/G/I/K - B/D/F/H/J/LOverlap formulae used. * small base; ** very small base (under 30) ineligible for sig testing
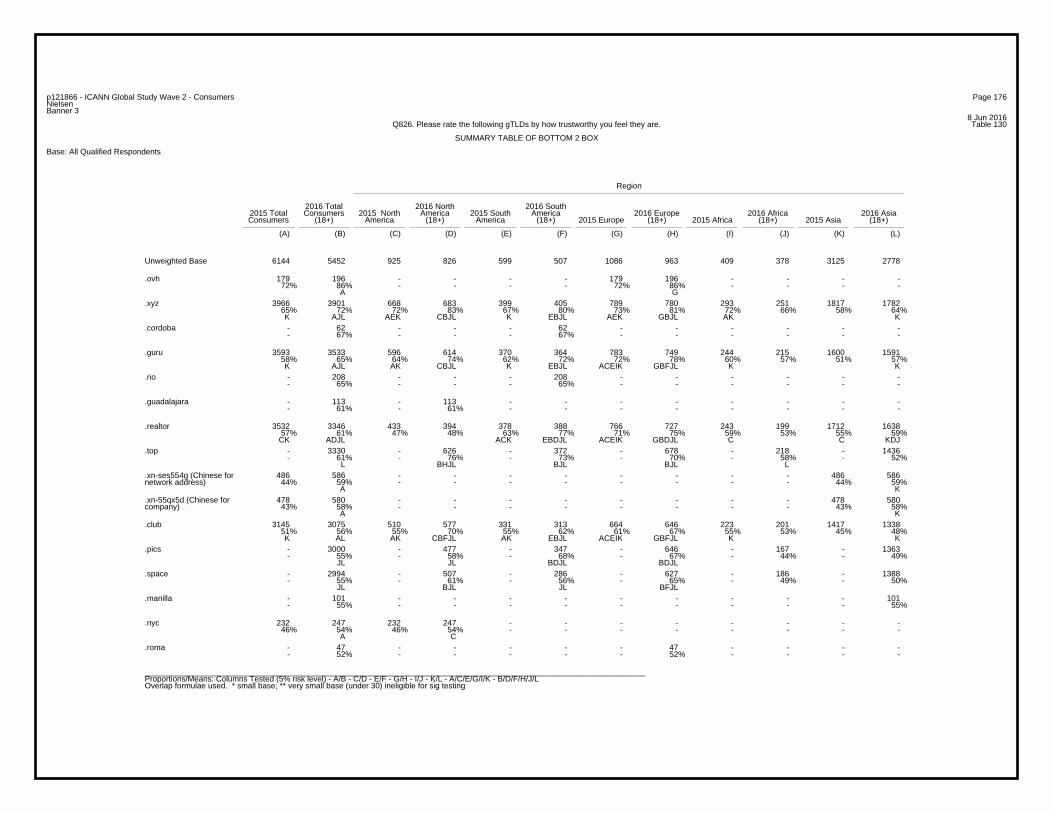
Page 176p121866 - ICANN Global Study Wave 2 - ConsumersNielsenBanner 3
8 Jun 2016Table 130Q826. Please rate the following gTLDs by how trustworthy you feel they are.
SUMMARY TABLE OF BOTTOM 2 BOX
Base: All Qualified Respondents
Region
2016 Total 2016 North 2016 South2015 Total Consumers 2015 North America 2015 South America 2016 Europe 2016 Africa 2016 AsiaConsumers (18+) America (18+) America (18+) 2015 Europe (18+) 2015 Africa (18+) 2015 Asia (18+)
(A) (B) (C) (D) (E) (F) (G) (H) (I) (J) (K) (L)
6144 5452 925 826 599 507 1086 963 409 378 3125 2778Unweighted Base
179 196 - - - - 179 196 - - - -72% 86% - - - - 72% 86% - - - -
A G
.ovh
3966 3901 668 683 399 405 789 780 293 251 1817 178265% 72% 72% 83% 67% 80% 73% 81% 72% 66% 58% 64%K AJL AEK CBJL K EBJL AEK GBJL AK K
.xyz
- 62 - - - 62 - - - - - -- 67% - - - 67% - - - - - -
.cordoba
3593 3533 596 614 370 364 783 749 244 215 1600 159158% 65% 64% 74% 62% 72% 72% 78% 60% 57% 51% 57%K AJL AK CBJL K EBJL ACEIK GBFJL K K
.guru
- 208 - - - 208 - - - - - -- 65% - - - 65% - - - - - -
.rio
- 113 - 113 - - - - - - - -- 61% - 61% - - - - - - - -
.guadalajara
3532 3346 433 394 378 388 766 727 243 199 1712 163857% 61% 47% 48% 63% 77% 71% 75% 59% 53% 55% 59%CK ADJL ACK EBDJL ACEIK GBDJL C C KDJ
.realtor
- 3330 - 626 - 372 - 678 - 218 - 1436- 61% - 76% - 73% - 70% - 58% - 52%
L BHJL BJL BJL L
.top
486 586 - - - - - - - - 486 58644% 59% - - - - - - - - 44% 59%
A K
.xn-ses554g (Chinese fornetwork address)
478 580 - - - - - - - - 478 58043% 58% - - - - - - - - 43% 58%
A K
.xn-55qx5d (Chinese forcompany)
3145 3075 510 577 331 313 664 646 223 201 1417 133851% 56% 55% 70% 55% 62% 61% 67% 55% 53% 45% 48%K AL AK CBFJL AK EBJL ACEIK GBFJL K K
.club
- 3000 - 477 - 347 - 646 - 167 - 1363- 55% - 58% - 68% - 67% - 44% - 49%
JL JL BDJL BDJL
.pics
- 2994 - 507 - 286 - 627 - 186 - 1388- 55% - 61% - 56% - 65% - 49% - 50%
JL BJL JL BFJL
.space
- 101 - - - - - - - - - 101- 55% - - - - - - - - - 55%
.manilla
232 247 232 247 - - - - - - - -46% 54% 46% 54% - - - - - - - -
A C
.nyc
- 47 - - - - - 47 - - - -- 52% - - - - - 52% - - - -
.roma
_________________________________________________________________________________________________________________Proportions/Means: Columns Tested (5% risk level) - A/B - C/D - E/F - G/H - I/J - K/L - A/C/E/G/I/K - B/D/F/H/J/LOverlap formulae used. * small base; ** very small base (under 30) ineligible for sig testing
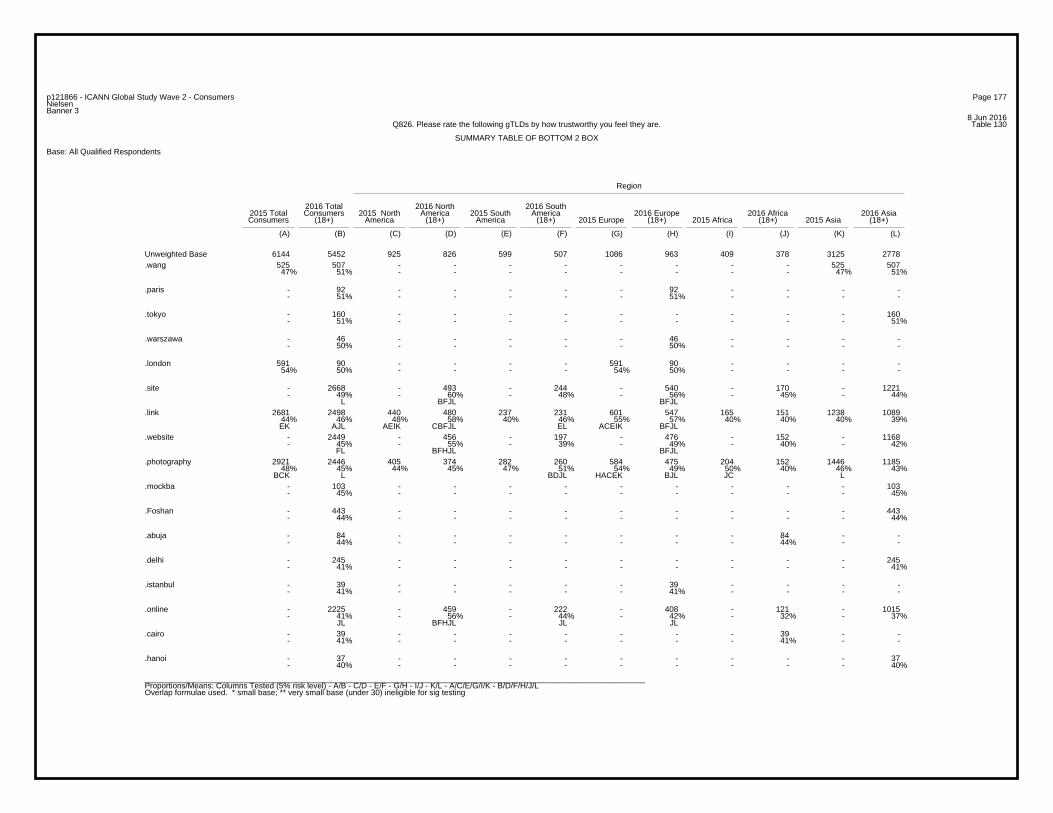
Page 177p121866 - ICANN Global Study Wave 2 - ConsumersNielsenBanner 3
8 Jun 2016Table 130Q826. Please rate the following gTLDs by how trustworthy you feel they are.
SUMMARY TABLE OF BOTTOM 2 BOX
Base: All Qualified Respondents
Region
2016 Total 2016 North 2016 South2015 Total Consumers 2015 North America 2015 South America 2016 Europe 2016 Africa 2016 AsiaConsumers (18+) America (18+) America (18+) 2015 Europe (18+) 2015 Africa (18+) 2015 Asia (18+)
(A) (B) (C) (D) (E) (F) (G) (H) (I) (J) (K) (L)
6144 5452 925 826 599 507 1086 963 409 378 3125 2778Unweighted Base525 507 - - - - - - - - 525 507
47% 51% - - - - - - - - 47% 51%.wang
- 92 - - - - - 92 - - - -- 51% - - - - - 51% - - - -
.paris
- 160 - - - - - - - - - 160- 51% - - - - - - - - - 51%
.tokyo
- 46 - - - - - 46 - - - -- 50% - - - - - 50% - - - -
.warszawa
591 90 - - - - 591 90 - - - -54% 50% - - - - 54% 50% - - - -
.london
- 2668 - 493 - 244 - 540 - 170 - 1221- 49% - 60% - 48% - 56% - 45% - 44%
L BFJL BFJL
.site
2681 2498 440 480 237 231 601 547 165 151 1238 108944% 46% 48% 58% 40% 46% 55% 57% 40% 40% 40% 39%EK AJL AEIK CBFJL EL ACEIK BFJL
.link
- 2449 - 456 - 197 - 476 - 152 - 1168- 45% - 55% - 39% - 49% - 40% - 42%
FL BFHJL BFJL
.website
2921 2446 405 374 282 260 584 475 204 152 1446 118548% 45% 44% 45% 47% 51% 54% 49% 50% 40% 46% 43%
BCK L BDJL HACEK BJL JC L
.photography
- 103 - - - - - - - - - 103- 45% - - - - - - - - - 45%
.mockba
- 443 - - - - - - - - - 443- 44% - - - - - - - - - 44%
.Foshan
- 84 - - - - - - - 84 - -- 44% - - - - - - - 44% - -
.abuja
- 245 - - - - - - - - - 245- 41% - - - - - - - - - 41%
.delhi
- 39 - - - - - 39 - - - -- 41% - - - - - 41% - - - -
.istanbul
- 2225 - 459 - 222 - 408 - 121 - 1015- 41% - 56% - 44% - 42% - 32% - 37%
JL BFHJL JL JL
.online
- 39 - - - - - - - 39 - -- 41% - - - - - - - 41% - -
.cairo
- 37 - - - - - - - - - 37- 40% - - - - - - - - - 40%
.hanoi
_________________________________________________________________________________________________________________Proportions/Means: Columns Tested (5% risk level) - A/B - C/D - E/F - G/H - I/J - K/L - A/C/E/G/I/K - B/D/F/H/J/LOverlap formulae used. * small base; ** very small base (under 30) ineligible for sig testing
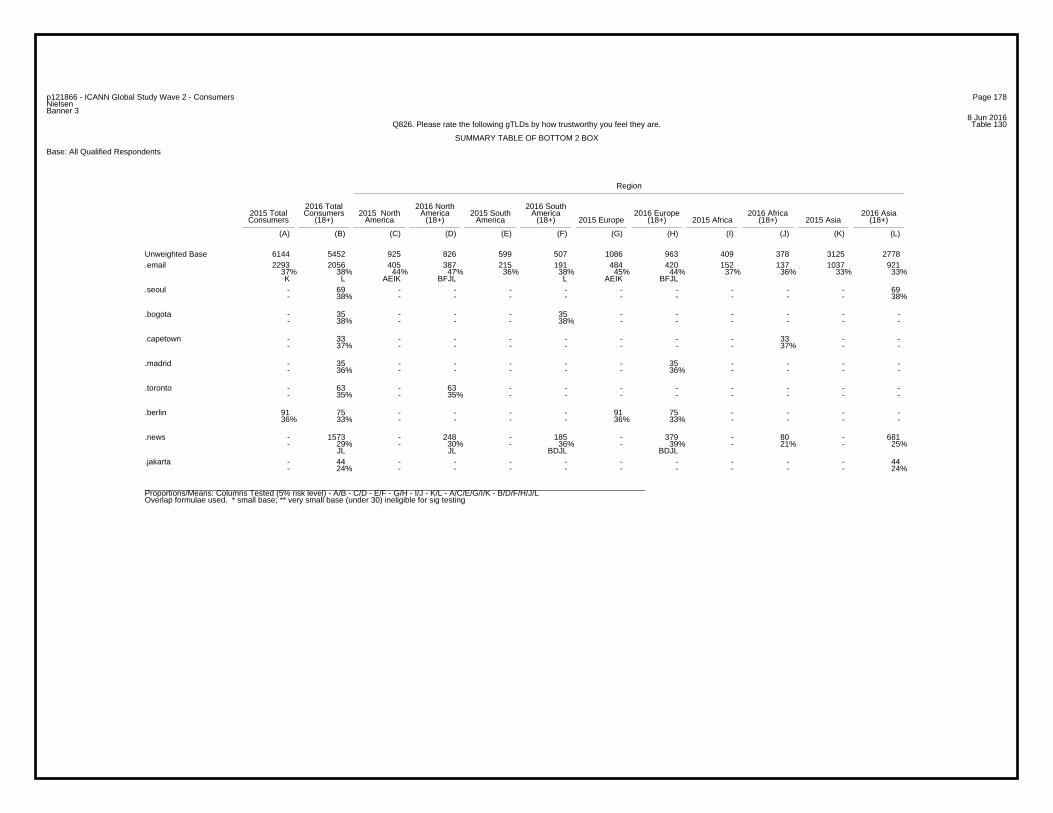
Page 178p121866 - ICANN Global Study Wave 2 - ConsumersNielsenBanner 3
8 Jun 2016Table 130Q826. Please rate the following gTLDs by how trustworthy you feel they are.
SUMMARY TABLE OF BOTTOM 2 BOX
Base: All Qualified Respondents
Region
2016 Total 2016 North 2016 South2015 Total Consumers 2015 North America 2015 South America 2016 Europe 2016 Africa 2016 AsiaConsumers (18+) America (18+) America (18+) 2015 Europe (18+) 2015 Africa (18+) 2015 Asia (18+)
(A) (B) (C) (D) (E) (F) (G) (H) (I) (J) (K) (L)
6144 5452 925 826 599 507 1086 963 409 378 3125 2778Unweighted Base2293 2056 405 387 215 191 484 420 152 137 1037 921
37% 38% 44% 47% 36% 38% 45% 44% 37% 36% 33% 33%K L AEIK BFJL L AEIK BFJL
- 69 - - - - - - - - - 69- 38% - - - - - - - - - 38%
.seoul
- 35 - - - 35 - - - - - -- 38% - - - 38% - - - - - -
.bogota
- 33 - - - - - - - 33 - -- 37% - - - - - - - 37% - -
.capetown
- 35 - - - - - 35 - - - -- 36% - - - - - 36% - - - -
.madrid
- 63 - 63 - - - - - - - -- 35% - 35% - - - - - - - -
.toronto
91 75 - - - - 91 75 - - - -36% 33% - - - - 36% 33% - - - -
.berlin
- 1573 - 248 - 185 - 379 - 80 - 681- 29% - 30% - 36% - 39% - 21% - 25%
JL JL BDJL BDJL
.news
- 44 - - - - - - - - - 44- 24% - - - - - - - - - 24%
.jakarta
_________________________________________________________________________________________________________________Proportions/Means: Columns Tested (5% risk level) - A/B - C/D - E/F - G/H - I/J - K/L - A/C/E/G/I/K - B/D/F/H/J/LOverlap formulae used. * small base; ** very small base (under 30) ineligible for sig testing
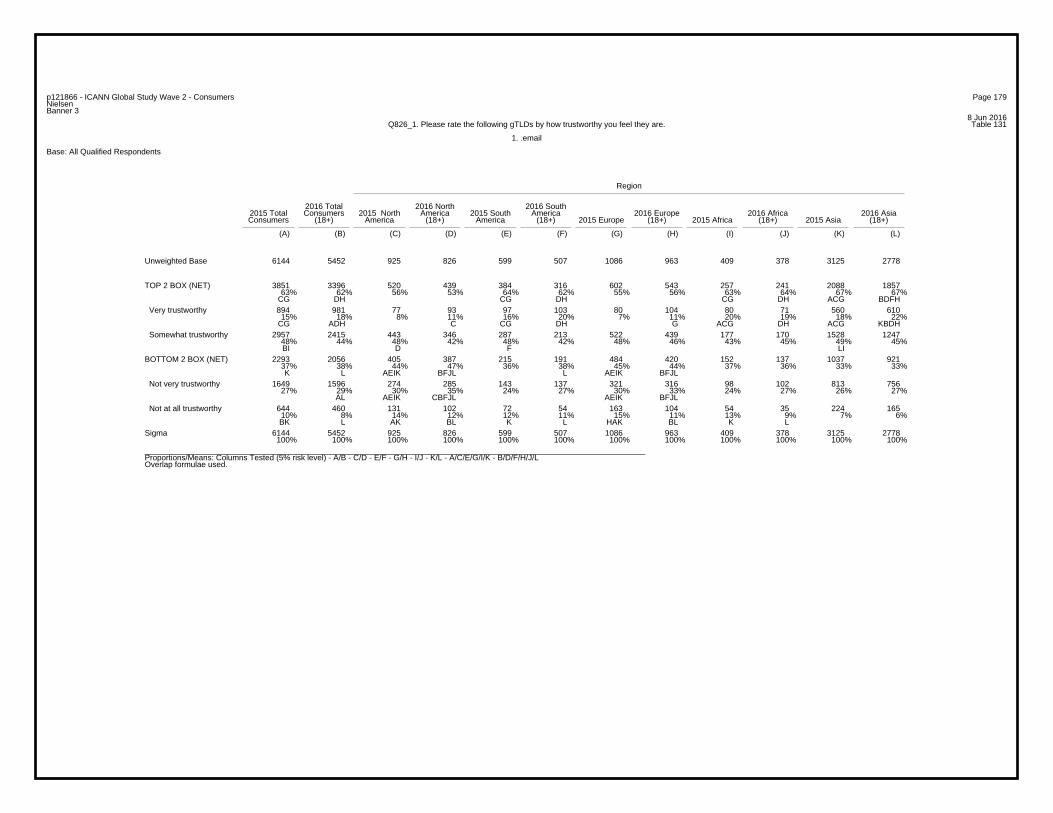
Page 179p121866 - ICANN Global Study Wave 2 - ConsumersNielsenBanner 3
8 Jun 2016Table 131Q826_1. Please rate the following gTLDs by how trustworthy you feel they are.
1. .email
Base: All Qualified Respondents
Region
2016 Total 2016 North 2016 South2015 Total Consumers 2015 North America 2015 South America 2016 Europe 2016 Africa 2016 AsiaConsumers (18+) America (18+) America (18+) 2015 Europe (18+) 2015 Africa (18+) 2015 Asia (18+)
(A) (B) (C) (D) (E) (F) (G) (H) (I) (J) (K) (L)
6144 5452 925 826 599 507 1086 963 409 378 3125 2778Unweighted Base
3851 3396 520 439 384 316 602 543 257 241 2088 185763% 62% 56% 53% 64% 62% 55% 56% 63% 64% 67% 67%
CG DH CG DH CG DH ACG BDFH
TOP 2 BOX (NET)
894 981 77 93 97 103 80 104 80 71 560 61015% 18% 8% 11% 16% 20% 7% 11% 20% 19% 18% 22%
CG ADH C CG DH G ACG DH ACG KBDH
Very trustworthy
2957 2415 443 346 287 213 522 439 177 170 1528 124748% 44% 48% 42% 48% 42% 48% 46% 43% 45% 49% 45%BI D F LI
Somewhat trustworthy
2293 2056 405 387 215 191 484 420 152 137 1037 92137% 38% 44% 47% 36% 38% 45% 44% 37% 36% 33% 33%K L AEIK BFJL L AEIK BFJL
BOTTOM 2 BOX (NET)
1649 1596 274 285 143 137 321 316 98 102 813 75627% 29% 30% 35% 24% 27% 30% 33% 24% 27% 26% 27%
AL AEIK CBFJL AEIK BFJL
Not very trustworthy
644 460 131 102 72 54 163 104 54 35 224 16510% 8% 14% 12% 12% 11% 15% 11% 13% 9% 7% 6%BK L AK BL K L HAK BL K L
Not at all trustworthy
6144 5452 925 826 599 507 1086 963 409 378 3125 2778100% 100% 100% 100% 100% 100% 100% 100% 100% 100% 100% 100%
Sigma
_________________________________________________________________________________________________________________Proportions/Means: Columns Tested (5% risk level) - A/B - C/D - E/F - G/H - I/J - K/L - A/C/E/G/I/K - B/D/F/H/J/LOverlap formulae used.
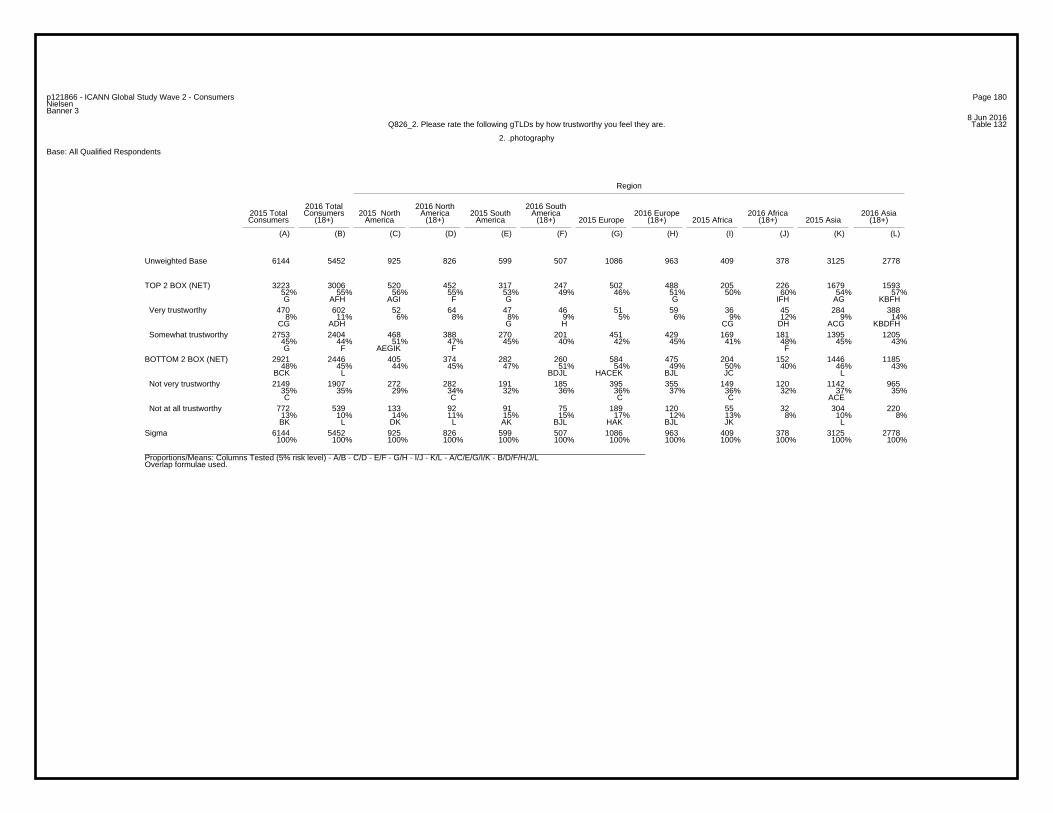
Page 180p121866 - ICANN Global Study Wave 2 - ConsumersNielsenBanner 3
8 Jun 2016Table 132Q826_2. Please rate the following gTLDs by how trustworthy you feel they are.
2. .photography
Base: All Qualified Respondents
Region
2016 Total 2016 North 2016 South2015 Total Consumers 2015 North America 2015 South America 2016 Europe 2016 Africa 2016 AsiaConsumers (18+) America (18+) America (18+) 2015 Europe (18+) 2015 Africa (18+) 2015 Asia (18+)
(A) (B) (C) (D) (E) (F) (G) (H) (I) (J) (K) (L)
6144 5452 925 826 599 507 1086 963 409 378 3125 2778Unweighted Base
3223 3006 520 452 317 247 502 488 205 226 1679 159352% 55% 56% 55% 53% 49% 46% 51% 50% 60% 54% 57%G AFH AGI F G G IFH AG KBFH
TOP 2 BOX (NET)
470 602 52 64 47 46 51 59 36 45 284 3888% 11% 6% 8% 8% 9% 5% 6% 9% 12% 9% 14%
CG ADH G H CG DH ACG KBDFH
Very trustworthy
2753 2404 468 388 270 201 451 429 169 181 1395 120545% 44% 51% 47% 45% 40% 42% 45% 41% 48% 45% 43%G F AEGIK F F
Somewhat trustworthy
2921 2446 405 374 282 260 584 475 204 152 1446 118548% 45% 44% 45% 47% 51% 54% 49% 50% 40% 46% 43%
BCK L BDJL HACEK BJL JC L
BOTTOM 2 BOX (NET)
2149 1907 272 282 191 185 395 355 149 120 1142 96535% 35% 29% 34% 32% 36% 36% 37% 36% 32% 37% 35%C C C C ACE
Not very trustworthy
772 539 133 92 91 75 189 120 55 32 304 22013% 10% 14% 11% 15% 15% 17% 12% 13% 8% 10% 8%BK L DK L AK BJL HAK BJL JK L
Not at all trustworthy
6144 5452 925 826 599 507 1086 963 409 378 3125 2778100% 100% 100% 100% 100% 100% 100% 100% 100% 100% 100% 100%
Sigma
_________________________________________________________________________________________________________________Proportions/Means: Columns Tested (5% risk level) - A/B - C/D - E/F - G/H - I/J - K/L - A/C/E/G/I/K - B/D/F/H/J/LOverlap formulae used.
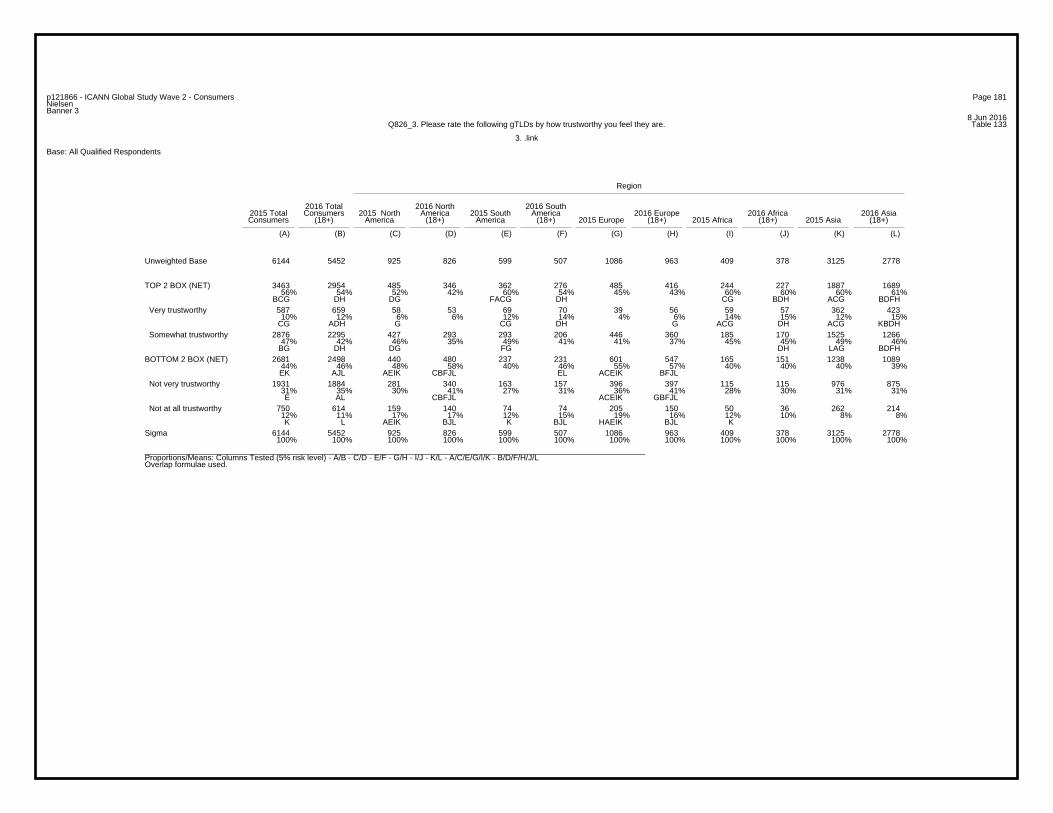
Page 181p121866 - ICANN Global Study Wave 2 - ConsumersNielsenBanner 3
8 Jun 2016Table 133Q826_3. Please rate the following gTLDs by how trustworthy you feel they are.
3. .link
Base: All Qualified Respondents
Region
2016 Total 2016 North 2016 South2015 Total Consumers 2015 North America 2015 South America 2016 Europe 2016 Africa 2016 AsiaConsumers (18+) America (18+) America (18+) 2015 Europe (18+) 2015 Africa (18+) 2015 Asia (18+)
(A) (B) (C) (D) (E) (F) (G) (H) (I) (J) (K) (L)
6144 5452 925 826 599 507 1086 963 409 378 3125 2778Unweighted Base
3463 2954 485 346 362 276 485 416 244 227 1887 168956% 54% 52% 42% 60% 54% 45% 43% 60% 60% 60% 61%
BCG DH DG FACG DH CG BDH ACG BDFH
TOP 2 BOX (NET)
587 659 58 53 69 70 39 56 59 57 362 42310% 12% 6% 6% 12% 14% 4% 6% 14% 15% 12% 15%
CG ADH G CG DH G ACG DH ACG KBDH
Very trustworthy
2876 2295 427 293 293 206 446 360 185 170 1525 126647% 42% 46% 35% 49% 41% 41% 37% 45% 45% 49% 46%
BG DH DG FG DH LAG BDFH
Somewhat trustworthy
2681 2498 440 480 237 231 601 547 165 151 1238 108944% 46% 48% 58% 40% 46% 55% 57% 40% 40% 40% 39%EK AJL AEIK CBFJL EL ACEIK BFJL
BOTTOM 2 BOX (NET)
1931 1884 281 340 163 157 396 397 115 115 976 87531% 35% 30% 41% 27% 31% 36% 41% 28% 30% 31% 31%E AL CBFJL ACEIK GBFJL
Not very trustworthy
750 614 159 140 74 74 205 150 50 36 262 21412% 11% 17% 17% 12% 15% 19% 16% 12% 10% 8% 8%K L AEIK BJL K BJL HAEIK BJL K
Not at all trustworthy
6144 5452 925 826 599 507 1086 963 409 378 3125 2778100% 100% 100% 100% 100% 100% 100% 100% 100% 100% 100% 100%
Sigma
_________________________________________________________________________________________________________________Proportions/Means: Columns Tested (5% risk level) - A/B - C/D - E/F - G/H - I/J - K/L - A/C/E/G/I/K - B/D/F/H/J/LOverlap formulae used.

Page 182p121866 - ICANN Global Study Wave 2 - ConsumersNielsenBanner 3
8 Jun 2016Table 134Q826_4. Please rate the following gTLDs by how trustworthy you feel they are.
4. .guru
Base: All Qualified Respondents
Region
2016 Total 2016 North 2016 South2015 Total Consumers 2015 North America 2015 South America 2016 Europe 2016 Africa 2016 AsiaConsumers (18+) America (18+) America (18+) 2015 Europe (18+) 2015 Africa (18+) 2015 Asia (18+)
(A) (B) (C) (D) (E) (F) (G) (H) (I) (J) (K) (L)
6144 5452 925 826 599 507 1086 963 409 378 3125 2778Unweighted Base
2551 1919 329 212 229 143 303 214 165 163 1525 118742% 35% 36% 26% 38% 28% 28% 22% 40% 43% 49% 43%
BCG DFH DG FG H H G BDFH LACEGI BDFH
TOP 2 BOX (NET)
367 361 28 26 39 30 25 28 25 24 250 2536% 7% 3% 3% 7% 6% 2% 3% 6% 6% 8% 9%
CG DH CG DH CG DH ACG BDFH
Very trustworthy
2184 1558 301 186 190 113 278 186 140 139 1275 93436% 29% 33% 23% 32% 22% 26% 19% 34% 37% 41% 34%
BCEG DFH DG FG H G BDFH LACEGI BDFH
Somewhat trustworthy
3593 3533 596 614 370 364 783 749 244 215 1600 159158% 65% 64% 74% 62% 72% 72% 78% 60% 57% 51% 57%K AJL AK CBJL K EBJL ACEIK GBFJL K K
BOTTOM 2 BOX (NET)
2440 2424 363 388 220 204 443 451 161 156 1253 122540% 44% 39% 47% 37% 40% 41% 47% 39% 41% 40% 44%
AF CF GF K
Not very trustworthy
1153 1109 233 226 150 160 340 298 83 59 347 36619% 20% 25% 27% 25% 32% 31% 31% 20% 16% 11% 13%K AJL AK BJL AK EBJL ACEIK BJL K K
Not at all trustworthy
6144 5452 925 826 599 507 1086 963 409 378 3125 2778100% 100% 100% 100% 100% 100% 100% 100% 100% 100% 100% 100%
Sigma
_________________________________________________________________________________________________________________Proportions/Means: Columns Tested (5% risk level) - A/B - C/D - E/F - G/H - I/J - K/L - A/C/E/G/I/K - B/D/F/H/J/LOverlap formulae used.
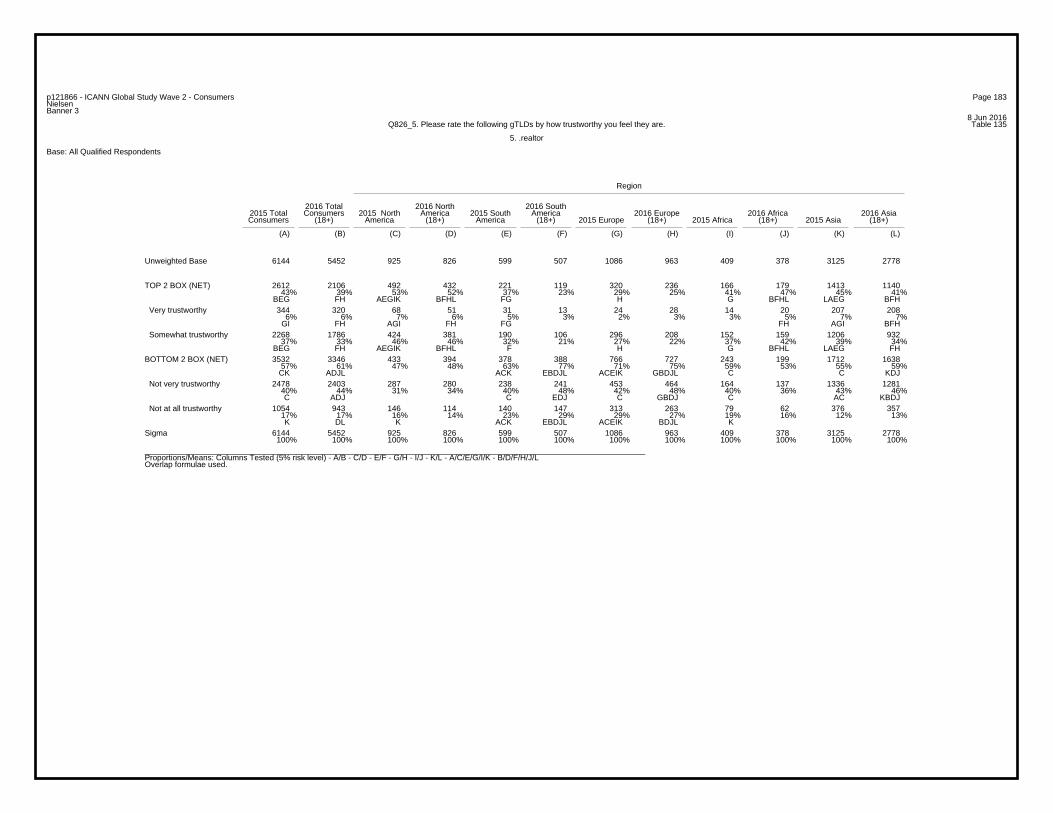
Page 183p121866 - ICANN Global Study Wave 2 - ConsumersNielsenBanner 3
8 Jun 2016Table 135Q826_5. Please rate the following gTLDs by how trustworthy you feel they are.
5. .realtor
Base: All Qualified Respondents
Region
2016 Total 2016 North 2016 South2015 Total Consumers 2015 North America 2015 South America 2016 Europe 2016 Africa 2016 AsiaConsumers (18+) America (18+) America (18+) 2015 Europe (18+) 2015 Africa (18+) 2015 Asia (18+)
(A) (B) (C) (D) (E) (F) (G) (H) (I) (J) (K) (L)
6144 5452 925 826 599 507 1086 963 409 378 3125 2778Unweighted Base
2612 2106 492 432 221 119 320 236 166 179 1413 114043% 39% 53% 52% 37% 23% 29% 25% 41% 47% 45% 41%
BEG FH AEGIK BFHL FG H G BFHL LAEG BFH
TOP 2 BOX (NET)
344 320 68 51 31 13 24 28 14 20 207 2086% 6% 7% 6% 5% 3% 2% 3% 3% 5% 7% 7%
GI FH AGI FH FG FH AGI BFH
Very trustworthy
2268 1786 424 381 190 106 296 208 152 159 1206 93237% 33% 46% 46% 32% 21% 27% 22% 37% 42% 39% 34%
BEG FH AEGIK BFHL F H G BFHL LAEG FH
Somewhat trustworthy
3532 3346 433 394 378 388 766 727 243 199 1712 163857% 61% 47% 48% 63% 77% 71% 75% 59% 53% 55% 59%CK ADJL ACK EBDJL ACEIK GBDJL C C KDJ
BOTTOM 2 BOX (NET)
2478 2403 287 280 238 241 453 464 164 137 1336 128140% 44% 31% 34% 40% 48% 42% 48% 40% 36% 43% 46%C ADJ C EDJ C GBDJ C AC KBDJ
Not very trustworthy
1054 943 146 114 140 147 313 263 79 62 376 35717% 17% 16% 14% 23% 29% 29% 27% 19% 16% 12% 13%K DL K ACK EBDJL ACEIK BDJL K
Not at all trustworthy
6144 5452 925 826 599 507 1086 963 409 378 3125 2778100% 100% 100% 100% 100% 100% 100% 100% 100% 100% 100% 100%
Sigma
_________________________________________________________________________________________________________________Proportions/Means: Columns Tested (5% risk level) - A/B - C/D - E/F - G/H - I/J - K/L - A/C/E/G/I/K - B/D/F/H/J/LOverlap formulae used.
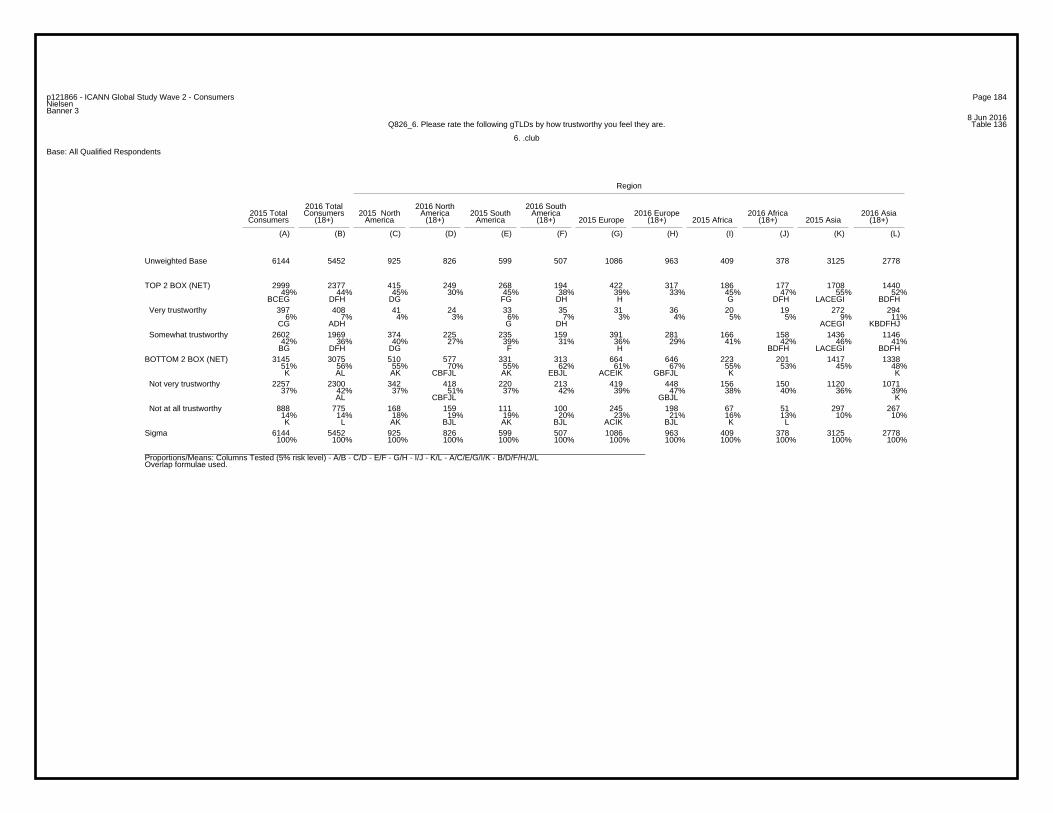
Page 184p121866 - ICANN Global Study Wave 2 - ConsumersNielsenBanner 3
8 Jun 2016Table 136Q826_6. Please rate the following gTLDs by how trustworthy you feel they are.
6. .club
Base: All Qualified Respondents
Region
2016 Total 2016 North 2016 South2015 Total Consumers 2015 North America 2015 South America 2016 Europe 2016 Africa 2016 AsiaConsumers (18+) America (18+) America (18+) 2015 Europe (18+) 2015 Africa (18+) 2015 Asia (18+)
(A) (B) (C) (D) (E) (F) (G) (H) (I) (J) (K) (L)
6144 5452 925 826 599 507 1086 963 409 378 3125 2778Unweighted Base
2999 2377 415 249 268 194 422 317 186 177 1708 144049% 44% 45% 30% 45% 38% 39% 33% 45% 47% 55% 52%
BCEG DFH DG FG DH H G DFH LACEGI BDFH
TOP 2 BOX (NET)
397 408 41 24 33 35 31 36 20 19 272 2946% 7% 4% 3% 6% 7% 3% 4% 5% 5% 9% 11%
CG ADH G DH ACEGI KBDFHJ
Very trustworthy
2602 1969 374 225 235 159 391 281 166 158 1436 114642% 36% 40% 27% 39% 31% 36% 29% 41% 42% 46% 41%
BG DFH DG F H BDFH LACEGI BDFH
Somewhat trustworthy
3145 3075 510 577 331 313 664 646 223 201 1417 133851% 56% 55% 70% 55% 62% 61% 67% 55% 53% 45% 48%K AL AK CBFJL AK EBJL ACEIK GBFJL K K
BOTTOM 2 BOX (NET)
2257 2300 342 418 220 213 419 448 156 150 1120 107137% 42% 37% 51% 37% 42% 39% 47% 38% 40% 36% 39%
AL CBFJL GBJL K
Not very trustworthy
888 775 168 159 111 100 245 198 67 51 297 26714% 14% 18% 19% 19% 20% 23% 21% 16% 13% 10% 10%K L AK BJL AK BJL ACIK BJL K L
Not at all trustworthy
6144 5452 925 826 599 507 1086 963 409 378 3125 2778100% 100% 100% 100% 100% 100% 100% 100% 100% 100% 100% 100%
Sigma
_________________________________________________________________________________________________________________Proportions/Means: Columns Tested (5% risk level) - A/B - C/D - E/F - G/H - I/J - K/L - A/C/E/G/I/K - B/D/F/H/J/LOverlap formulae used.

Page 185p121866 - ICANN Global Study Wave 2 - ConsumersNielsenBanner 3
8 Jun 2016Table 137Q826_7. Please rate the following gTLDs by how trustworthy you feel they are.
7. .xyz
Base: All Qualified Respondents
Region
2016 Total 2016 North 2016 South2015 Total Consumers 2015 North America 2015 South America 2016 Europe 2016 Africa 2016 AsiaConsumers (18+) America (18+) America (18+) 2015 Europe (18+) 2015 Africa (18+) 2015 Asia (18+)
(A) (B) (C) (D) (E) (F) (G) (H) (I) (J) (K) (L)
6144 5452 925 826 599 507 1086 963 409 378 3125 2778Unweighted Base
2178 1551 257 143 200 102 297 183 116 127 1308 99635% 28% 28% 17% 33% 20% 27% 19% 28% 34% 42% 36%
BCGI DFH D FCG H BDFH LACEGI BDFH
TOP 2 BOX (NET)
274 280 20 22 24 11 25 25 11 18 194 2044% 5% 2% 3% 4% 2% 2% 3% 3% 5% 6% 7%
CG DFH CG FH ACEGI BDFH
Very trustworthy
1904 1271 237 121 176 91 272 158 105 109 1114 79231% 23% 26% 15% 29% 18% 25% 16% 26% 29% 36% 29%
BCGI DFH D F H BDFH LACEGI BDFH
Somewhat trustworthy
3966 3901 668 683 399 405 789 780 293 251 1817 178265% 72% 72% 83% 67% 80% 73% 81% 72% 66% 58% 64%K AJL AEK CBJL K EBJL AEK GBJL AK K
BOTTOM 2 BOX (NET)
2552 2370 386 368 241 212 427 438 168 150 1330 120242% 43% 42% 45% 40% 42% 39% 45% 41% 40% 43% 43%
A G
Not very trustworthy
1414 1531 282 315 158 193 362 342 125 101 487 58023% 28% 30% 38% 26% 38% 33% 36% 31% 27% 16% 21%K AL AK CBJL AK EBJL AEK BJL AK L K
Not at all trustworthy
6144 5452 925 826 599 507 1086 963 409 378 3125 2778100% 100% 100% 100% 100% 100% 100% 100% 100% 100% 100% 100%
Sigma
_________________________________________________________________________________________________________________Proportions/Means: Columns Tested (5% risk level) - A/B - C/D - E/F - G/H - I/J - K/L - A/C/E/G/I/K - B/D/F/H/J/LOverlap formulae used.

Page 186p121866 - ICANN Global Study Wave 2 - ConsumersNielsenBanner 3
8 Jun 2016Table 138Q826_16. Please rate the following gTLDs by how trustworthy you feel they are.
16. .top
Base: All Qualified Respondents
Region
2016 Total 2016 North 2016 South2015 Total Consumers 2015 North America 2015 South America 2016 Europe 2016 Africa 2016 AsiaConsumers (18+) America (18+) America (18+) 2015 Europe (18+) 2015 Africa (18+) 2015 Asia (18+)
(A) (B) (C) (D) (E) (F) (G) (H) (I) (J) (K) (L)
-** 5452 -** 826 -** 507 -** 963 -** 378 -** 2778Unweighted Base
- 2122 - 200 - 135 - 285 - 160 - 1342- 39% - 24% - 27% - 30% - 42% - 48%
DFH D DFH BDFHJ
TOP 2 BOX (NET)
- 360 - 21 - 20 - 36 - 23 - 260- 7% - 3% - 4% - 4% - 6% - 9%
DFH D BDFHJ
Very trustworthy
- 1762 - 179 - 115 - 249 - 137 - 1082- 32% - 22% - 23% - 26% - 36% - 39%
DFH D DFH BDFH
Somewhat trustworthy
- 3330 - 626 - 372 - 678 - 218 - 1436- 61% - 76% - 73% - 70% - 58% - 52%
L BHJL BJL BJL L
BOTTOM 2 BOX (NET)
- 2431 - 413 - 236 - 472 - 153 - 1157- 45% - 50% - 47% - 49% - 40% - 42%
L BJL L BJL
Not very trustworthy
- 899 - 213 - 136 - 206 - 65 - 279- 16% - 26% - 27% - 21% - 17% - 10%
L BHJL BHJL BL L
Not at all trustworthy
- 5452 - 826 - 507 - 963 - 378 - 2778- 100% - 100% - 100% - 100% - 100% - 100%
Sigma
_________________________________________________________________________________________________________________Proportions/Means: Columns Tested (5% risk level) - A/B - C/D - E/F - G/H - I/J - K/L - A/C/E/G/I/K - B/D/F/H/J/LOverlap formulae used. ** very small base (under 30) ineligible for sig testing

Page 187p121866 - ICANN Global Study Wave 2 - ConsumersNielsenBanner 3
8 Jun 2016Table 139Q826_17. Please rate the following gTLDs by how trustworthy you feel they are.
17. .pics
Base: All Qualified Respondents
Region
2016 Total 2016 North 2016 South2015 Total Consumers 2015 North America 2015 South America 2016 Europe 2016 Africa 2016 AsiaConsumers (18+) America (18+) America (18+) 2015 Europe (18+) 2015 Africa (18+) 2015 Asia (18+)
(A) (B) (C) (D) (E) (F) (G) (H) (I) (J) (K) (L)
-** 5452 -** 826 -** 507 -** 963 -** 378 -** 2778Unweighted Base
- 2452 - 349 - 160 - 317 - 211 - 1415- 45% - 42% - 32% - 33% - 56% - 51%
FH FH BDFH BDFH
TOP 2 BOX (NET)
- 434 - 38 - 17 - 48 - 37 - 294- 8% - 5% - 3% - 5% - 10% - 11%
DFH DFH BDFH
Very trustworthy
- 2018 - 311 - 143 - 269 - 174 - 1121- 37% - 38% - 28% - 28% - 46% - 40%
FH FH BDFHL BFH
Somewhat trustworthy
- 3000 - 477 - 347 - 646 - 167 - 1363- 55% - 58% - 68% - 67% - 44% - 49%
JL JL BDJL BDJL
BOTTOM 2 BOX (NET)
- 2219 - 336 - 230 - 439 - 126 - 1088- 41% - 41% - 45% - 46% - 33% - 39%
JL J BJL BDJL J
Not very trustworthy
- 781 - 141 - 117 - 207 - 41 - 275- 14% - 17% - 23% - 21% - 11% - 10%
JL BJL BDJL BDJL
Not at all trustworthy
- 5452 - 826 - 507 - 963 - 378 - 2778- 100% - 100% - 100% - 100% - 100% - 100%
Sigma
_________________________________________________________________________________________________________________Proportions/Means: Columns Tested (5% risk level) - A/B - C/D - E/F - G/H - I/J - K/L - A/C/E/G/I/K - B/D/F/H/J/LOverlap formulae used. ** very small base (under 30) ineligible for sig testing

Page 188p121866 - ICANN Global Study Wave 2 - ConsumersNielsenBanner 3
8 Jun 2016Table 140Q826_18. Please rate the following gTLDs by how trustworthy you feel they are.
18. .online
Base: All Qualified Respondents
Region
2016 Total 2016 North 2016 South2015 Total Consumers 2015 North America 2015 South America 2016 Europe 2016 Africa 2016 AsiaConsumers (18+) America (18+) America (18+) 2015 Europe (18+) 2015 Africa (18+) 2015 Asia (18+)
(A) (B) (C) (D) (E) (F) (G) (H) (I) (J) (K) (L)
-** 5452 -** 826 -** 507 -** 963 -** 378 -** 2778Unweighted Base
- 3227 - 367 - 285 - 555 - 257 - 1763- 59% - 44% - 56% - 58% - 68% - 63%
D D D BDFH BDFH
TOP 2 BOX (NET)
- 821 - 73 - 93 - 106 - 77 - 472- 15% - 9% - 18% - 11% - 20% - 17%
DH BDH BDH BDH
Very trustworthy
- 2406 - 294 - 192 - 449 - 180 - 1291- 44% - 36% - 38% - 47% - 48% - 46%
DF DF DF BDF
Somewhat trustworthy
- 2225 - 459 - 222 - 408 - 121 - 1015- 41% - 56% - 44% - 42% - 32% - 37%
JL BFHJL JL JL
BOTTOM 2 BOX (NET)
- 1727 - 325 - 163 - 308 - 94 - 837- 32% - 39% - 32% - 32% - 25% - 30%
JL BFHJL J J J
Not very trustworthy
- 498 - 134 - 59 - 100 - 27 - 178- 9% - 16% - 12% - 10% - 7% - 6%
L BFHJL BJL L
Not at all trustworthy
- 5452 - 826 - 507 - 963 - 378 - 2778- 100% - 100% - 100% - 100% - 100% - 100%
Sigma
_________________________________________________________________________________________________________________Proportions/Means: Columns Tested (5% risk level) - A/B - C/D - E/F - G/H - I/J - K/L - A/C/E/G/I/K - B/D/F/H/J/LOverlap formulae used. ** very small base (under 30) ineligible for sig testing
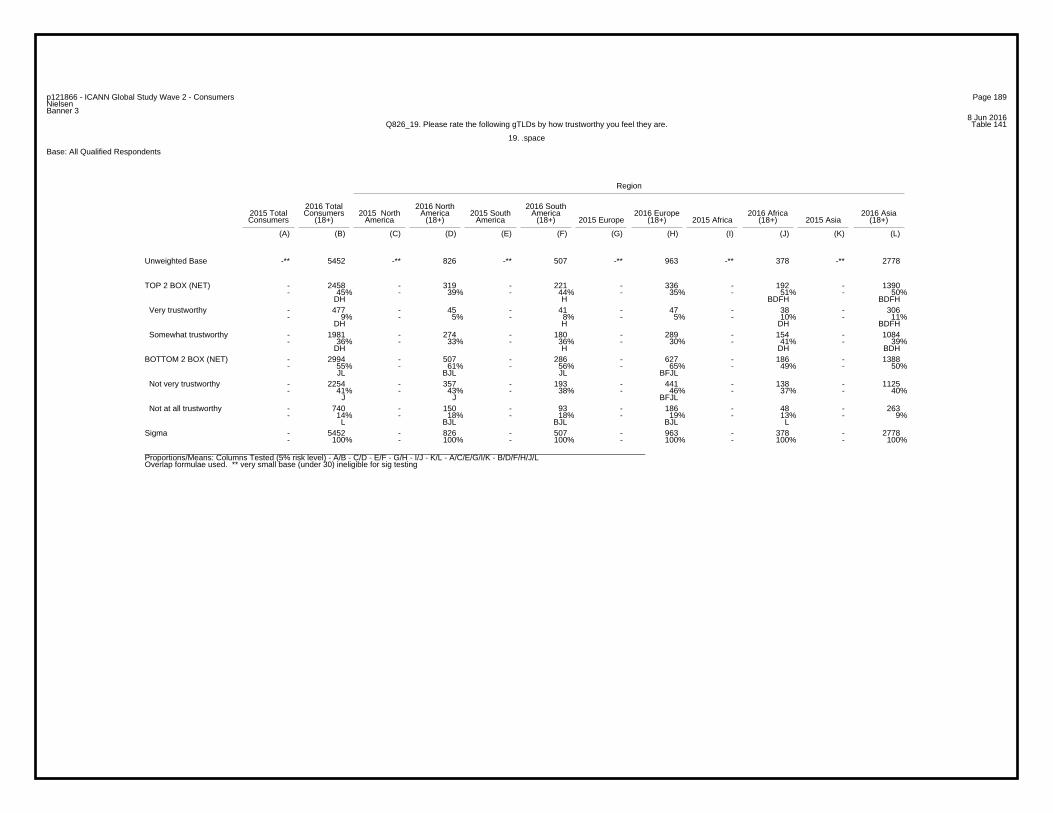
Page 189p121866 - ICANN Global Study Wave 2 - ConsumersNielsenBanner 3
8 Jun 2016Table 141Q826_19. Please rate the following gTLDs by how trustworthy you feel they are.
19. .space
Base: All Qualified Respondents
Region
2016 Total 2016 North 2016 South2015 Total Consumers 2015 North America 2015 South America 2016 Europe 2016 Africa 2016 AsiaConsumers (18+) America (18+) America (18+) 2015 Europe (18+) 2015 Africa (18+) 2015 Asia (18+)
(A) (B) (C) (D) (E) (F) (G) (H) (I) (J) (K) (L)
-** 5452 -** 826 -** 507 -** 963 -** 378 -** 2778Unweighted Base
- 2458 - 319 - 221 - 336 - 192 - 1390- 45% - 39% - 44% - 35% - 51% - 50%
DH H BDFH BDFH
TOP 2 BOX (NET)
- 477 - 45 - 41 - 47 - 38 - 306- 9% - 5% - 8% - 5% - 10% - 11%
DH H DH BDFH
Very trustworthy
- 1981 - 274 - 180 - 289 - 154 - 1084- 36% - 33% - 36% - 30% - 41% - 39%
DH H DH BDH
Somewhat trustworthy
- 2994 - 507 - 286 - 627 - 186 - 1388- 55% - 61% - 56% - 65% - 49% - 50%
JL BJL JL BFJL
BOTTOM 2 BOX (NET)
- 2254 - 357 - 193 - 441 - 138 - 1125- 41% - 43% - 38% - 46% - 37% - 40%
J J BFJL
Not very trustworthy
- 740 - 150 - 93 - 186 - 48 - 263- 14% - 18% - 18% - 19% - 13% - 9%
L BJL BJL BJL L
Not at all trustworthy
- 5452 - 826 - 507 - 963 - 378 - 2778- 100% - 100% - 100% - 100% - 100% - 100%
Sigma
_________________________________________________________________________________________________________________Proportions/Means: Columns Tested (5% risk level) - A/B - C/D - E/F - G/H - I/J - K/L - A/C/E/G/I/K - B/D/F/H/J/LOverlap formulae used. ** very small base (under 30) ineligible for sig testing

Page 190p121866 - ICANN Global Study Wave 2 - ConsumersNielsenBanner 3
8 Jun 2016Table 142Q826_20. Please rate the following gTLDs by how trustworthy you feel they are.
20. .website
Base: All Qualified Respondents
Region
2016 Total 2016 North 2016 South2015 Total Consumers 2015 North America 2015 South America 2016 Europe 2016 Africa 2016 AsiaConsumers (18+) America (18+) America (18+) 2015 Europe (18+) 2015 Africa (18+) 2015 Asia (18+)
(A) (B) (C) (D) (E) (F) (G) (H) (I) (J) (K) (L)
-** 5452 -** 826 -** 507 -** 963 -** 378 -** 2778Unweighted Base
- 3003 - 370 - 310 - 487 - 226 - 1610- 55% - 45% - 61% - 51% - 60% - 58%
DH BDH D DH BDH
TOP 2 BOX (NET)
- 699 - 62 - 88 - 77 - 66 - 406- 13% - 8% - 17% - 8% - 17% - 15%
DH BDH BDH BDH
Very trustworthy
- 2304 - 308 - 222 - 410 - 160 - 1204- 42% - 37% - 44% - 43% - 42% - 43%
D D D D
Somewhat trustworthy
- 2449 - 456 - 197 - 476 - 152 - 1168- 45% - 55% - 39% - 49% - 40% - 42%
FL BFHJL BFJL
BOTTOM 2 BOX (NET)
- 1861 - 320 - 135 - 346 - 118 - 942- 34% - 39% - 27% - 36% - 31% - 34%
F BFJL F F
Not very trustworthy
- 588 - 136 - 62 - 130 - 34 - 226- 11% - 16% - 12% - 13% - 9% - 8%
L BFJL L BJL
Not at all trustworthy
- 5452 - 826 - 507 - 963 - 378 - 2778- 100% - 100% - 100% - 100% - 100% - 100%
Sigma
_________________________________________________________________________________________________________________Proportions/Means: Columns Tested (5% risk level) - A/B - C/D - E/F - G/H - I/J - K/L - A/C/E/G/I/K - B/D/F/H/J/LOverlap formulae used. ** very small base (under 30) ineligible for sig testing

Page 191p121866 - ICANN Global Study Wave 2 - ConsumersNielsenBanner 3
8 Jun 2016Table 143Q826_21. Please rate the following gTLDs by how trustworthy you feel they are.
21. .news
Base: All Qualified Respondents
Region
2016 Total 2016 North 2016 South2015 Total Consumers 2015 North America 2015 South America 2016 Europe 2016 Africa 2016 AsiaConsumers (18+) America (18+) America (18+) 2015 Europe (18+) 2015 Africa (18+) 2015 Asia (18+)
(A) (B) (C) (D) (E) (F) (G) (H) (I) (J) (K) (L)
-** 5452 -** 826 -** 507 -** 963 -** 378 -** 2778Unweighted Base
- 3879 - 578 - 322 - 584 - 298 - 2097- 71% - 70% - 64% - 61% - 79% - 75%
FH FH BDFH BDFH
TOP 2 BOX (NET)
- 1071 - 109 - 89 - 106 - 97 - 670- 20% - 13% - 18% - 11% - 26% - 24%
DH DH BDFH BDFH
Very trustworthy
- 2808 - 469 - 233 - 478 - 201 - 1427- 52% - 57% - 46% - 50% - 53% - 51%
F BFHL F F
Somewhat trustworthy
- 1573 - 248 - 185 - 379 - 80 - 681- 29% - 30% - 36% - 39% - 21% - 25%
JL JL BDJL BDJL
BOTTOM 2 BOX (NET)
- 1231 - 183 - 125 - 293 - 61 - 569- 23% - 22% - 25% - 30% - 16% - 20%
JL J JL BDFJL J
Not very trustworthy
- 342 - 65 - 60 - 86 - 19 - 112- 6% - 8% - 12% - 9% - 5% - 4%
L BL BDJL BJL
Not at all trustworthy
- 5452 - 826 - 507 - 963 - 378 - 2778- 100% - 100% - 100% - 100% - 100% - 100%
Sigma
_________________________________________________________________________________________________________________Proportions/Means: Columns Tested (5% risk level) - A/B - C/D - E/F - G/H - I/J - K/L - A/C/E/G/I/K - B/D/F/H/J/LOverlap formulae used. ** very small base (under 30) ineligible for sig testing

Page 192p121866 - ICANN Global Study Wave 2 - ConsumersNielsenBanner 3
8 Jun 2016Table 144Q826_22. Please rate the following gTLDs by how trustworthy you feel they are.
22. .site
Base: All Qualified Respondents
Region
2016 Total 2016 North 2016 South2015 Total Consumers 2015 North America 2015 South America 2016 Europe 2016 Africa 2016 AsiaConsumers (18+) America (18+) America (18+) 2015 Europe (18+) 2015 Africa (18+) 2015 Asia (18+)
(A) (B) (C) (D) (E) (F) (G) (H) (I) (J) (K) (L)
-** 5452 -** 826 -** 507 -** 963 -** 378 -** 2778Unweighted Base
- 2784 - 333 - 263 - 423 - 208 - 1557- 51% - 40% - 52% - 44% - 55% - 56%
DH DH DH BDH
TOP 2 BOX (NET)
- 563 - 43 - 58 - 56 - 49 - 357- 10% - 5% - 11% - 6% - 13% - 13%
DH DH DH BDH
Very trustworthy
- 2221 - 290 - 205 - 367 - 159 - 1200- 41% - 35% - 40% - 38% - 42% - 43%
D D BDH
Somewhat trustworthy
- 2668 - 493 - 244 - 540 - 170 - 1221- 49% - 60% - 48% - 56% - 45% - 44%
L BFJL BFJL
BOTTOM 2 BOX (NET)
- 2019 - 352 - 172 - 390 - 135 - 970- 37% - 43% - 34% - 40% - 36% - 35%
L BFJL BFL
Not very trustworthy
- 649 - 141 - 72 - 150 - 35 - 251- 12% - 17% - 14% - 16% - 9% - 9%
L BJL JL BJL
Not at all trustworthy
- 5452 - 826 - 507 - 963 - 378 - 2778- 100% - 100% - 100% - 100% - 100% - 100%
Sigma
_________________________________________________________________________________________________________________Proportions/Means: Columns Tested (5% risk level) - A/B - C/D - E/F - G/H - I/J - K/L - A/C/E/G/I/K - B/D/F/H/J/LOverlap formulae used. ** very small base (under 30) ineligible for sig testing
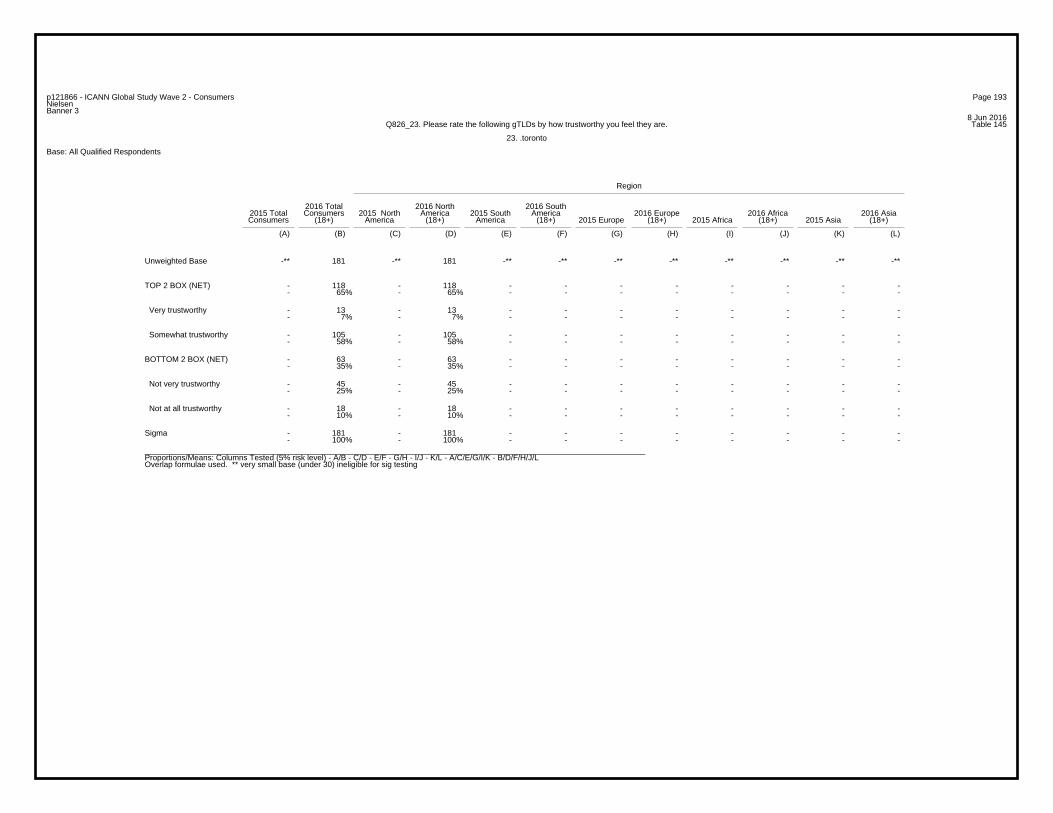
Page 193p121866 - ICANN Global Study Wave 2 - ConsumersNielsenBanner 3
8 Jun 2016Table 145Q826_23. Please rate the following gTLDs by how trustworthy you feel they are.
23. .toronto
Base: All Qualified Respondents
Region
2016 Total 2016 North 2016 South2015 Total Consumers 2015 North America 2015 South America 2016 Europe 2016 Africa 2016 AsiaConsumers (18+) America (18+) America (18+) 2015 Europe (18+) 2015 Africa (18+) 2015 Asia (18+)
(A) (B) (C) (D) (E) (F) (G) (H) (I) (J) (K) (L)
-** 181 -** 181 -** -** -** -** -** -** -** -**Unweighted Base
- 118 - 118 - - - - - - - -- 65% - 65% - - - - - - - -
TOP 2 BOX (NET)
- 13 - 13 - - - - - - - -- 7% - 7% - - - - - - - -
Very trustworthy
- 105 - 105 - - - - - - - -- 58% - 58% - - - - - - - -
Somewhat trustworthy
- 63 - 63 - - - - - - - -- 35% - 35% - - - - - - - -
BOTTOM 2 BOX (NET)
- 45 - 45 - - - - - - - -- 25% - 25% - - - - - - - -
Not very trustworthy
- 18 - 18 - - - - - - - -- 10% - 10% - - - - - - - -
Not at all trustworthy
- 181 - 181 - - - - - - - -- 100% - 100% - - - - - - - -
Sigma
_________________________________________________________________________________________________________________Proportions/Means: Columns Tested (5% risk level) - A/B - C/D - E/F - G/H - I/J - K/L - A/C/E/G/I/K - B/D/F/H/J/LOverlap formulae used. ** very small base (under 30) ineligible for sig testing

Page 194p121866 - ICANN Global Study Wave 2 - ConsumersNielsenBanner 3
8 Jun 2016Table 146Q826_24. Please rate the following gTLDs by how trustworthy you feel they are.
24. .guadalajara
Base: All Qualified Respondents
Region
2016 Total 2016 North 2016 South2015 Total Consumers 2015 North America 2015 South America 2016 Europe 2016 Africa 2016 AsiaConsumers (18+) America (18+) America (18+) 2015 Europe (18+) 2015 Africa (18+) 2015 Asia (18+)
(A) (B) (C) (D) (E) (F) (G) (H) (I) (J) (K) (L)
-** 184 -** 184 -** -** -** -** -** -** -** -**Unweighted Base
- 71 - 71 - - - - - - - -- 39% - 39% - - - - - - - -
TOP 2 BOX (NET)
- 14 - 14 - - - - - - - -- 8% - 8% - - - - - - - -
Very trustworthy
- 57 - 57 - - - - - - - -- 31% - 31% - - - - - - - -
Somewhat trustworthy
- 113 - 113 - - - - - - - -- 61% - 61% - - - - - - - -
BOTTOM 2 BOX (NET)
- 66 - 66 - - - - - - - -- 36% - 36% - - - - - - - -
Not very trustworthy
- 47 - 47 - - - - - - - -- 26% - 26% - - - - - - - -
Not at all trustworthy
- 184 - 184 - - - - - - - -- 100% - 100% - - - - - - - -
Sigma
_________________________________________________________________________________________________________________Proportions/Means: Columns Tested (5% risk level) - A/B - C/D - E/F - G/H - I/J - K/L - A/C/E/G/I/K - B/D/F/H/J/LOverlap formulae used. ** very small base (under 30) ineligible for sig testing
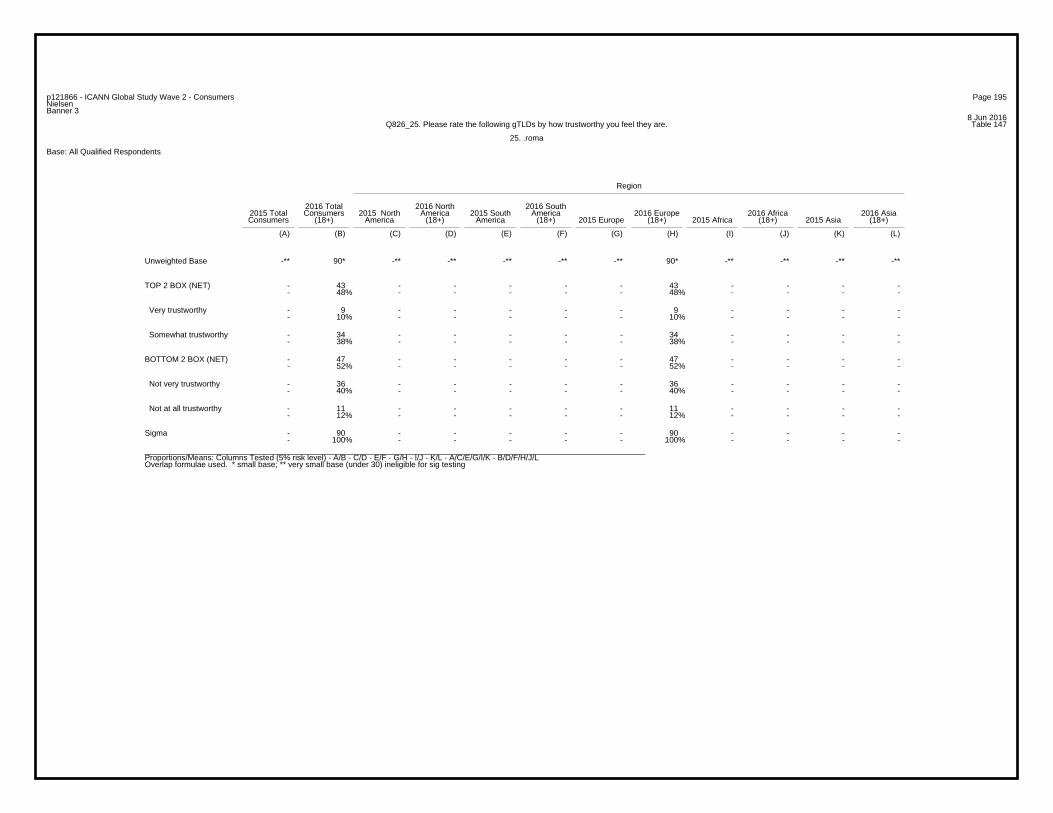
Page 195p121866 - ICANN Global Study Wave 2 - ConsumersNielsenBanner 3
8 Jun 2016Table 147Q826_25. Please rate the following gTLDs by how trustworthy you feel they are.
25. .roma
Base: All Qualified Respondents
Region
2016 Total 2016 North 2016 South2015 Total Consumers 2015 North America 2015 South America 2016 Europe 2016 Africa 2016 AsiaConsumers (18+) America (18+) America (18+) 2015 Europe (18+) 2015 Africa (18+) 2015 Asia (18+)
(A) (B) (C) (D) (E) (F) (G) (H) (I) (J) (K) (L)
-** 90* -** -** -** -** -** 90* -** -** -** -**Unweighted Base
- 43 - - - - - 43 - - - -- 48% - - - - - 48% - - - -
TOP 2 BOX (NET)
- 9 - - - - - 9 - - - -- 10% - - - - - 10% - - - -
Very trustworthy
- 34 - - - - - 34 - - - -- 38% - - - - - 38% - - - -
Somewhat trustworthy
- 47 - - - - - 47 - - - -- 52% - - - - - 52% - - - -
BOTTOM 2 BOX (NET)
- 36 - - - - - 36 - - - -- 40% - - - - - 40% - - - -
Not very trustworthy
- 11 - - - - - 11 - - - -- 12% - - - - - 12% - - - -
Not at all trustworthy
- 90 - - - - - 90 - - - -- 100% - - - - - 100% - - - -
Sigma
_________________________________________________________________________________________________________________Proportions/Means: Columns Tested (5% risk level) - A/B - C/D - E/F - G/H - I/J - K/L - A/C/E/G/I/K - B/D/F/H/J/LOverlap formulae used. * small base; ** very small base (under 30) ineligible for sig testing

Page 196p121866 - ICANN Global Study Wave 2 - ConsumersNielsenBanner 3
8 Jun 2016Table 148Q826_26. Please rate the following gTLDs by how trustworthy you feel they are.
26. .istanbul
Base: All Qualified Respondents
Region
2016 Total 2016 North 2016 South2015 Total Consumers 2015 North America 2015 South America 2016 Europe 2016 Africa 2016 AsiaConsumers (18+) America (18+) America (18+) 2015 Europe (18+) 2015 Africa (18+) 2015 Asia (18+)
(A) (B) (C) (D) (E) (F) (G) (H) (I) (J) (K) (L)
-** 95* -** -** -** -** -** 95* -** -** -** -**Unweighted Base
- 56 - - - - - 56 - - - -- 59% - - - - - 59% - - - -
TOP 2 BOX (NET)
- 19 - - - - - 19 - - - -- 20% - - - - - 20% - - - -
Very trustworthy
- 37 - - - - - 37 - - - -- 39% - - - - - 39% - - - -
Somewhat trustworthy
- 39 - - - - - 39 - - - -- 41% - - - - - 41% - - - -
BOTTOM 2 BOX (NET)
- 33 - - - - - 33 - - - -- 35% - - - - - 35% - - - -
Not very trustworthy
- 6 - - - - - 6 - - - -- 6% - - - - - 6% - - - -
Not at all trustworthy
- 95 - - - - - 95 - - - -- 100% - - - - - 100% - - - -
Sigma
_________________________________________________________________________________________________________________Proportions/Means: Columns Tested (5% risk level) - A/B - C/D - E/F - G/H - I/J - K/L - A/C/E/G/I/K - B/D/F/H/J/LOverlap formulae used. * small base; ** very small base (under 30) ineligible for sig testing

Page 197p121866 - ICANN Global Study Wave 2 - ConsumersNielsenBanner 3
8 Jun 2016Table 149Q826_27. Please rate the following gTLDs by how trustworthy you feel they are.
27. .madrid
Base: All Qualified Respondents
Region
2016 Total 2016 North 2016 South2015 Total Consumers 2015 North America 2015 South America 2016 Europe 2016 Africa 2016 AsiaConsumers (18+) America (18+) America (18+) 2015 Europe (18+) 2015 Africa (18+) 2015 Asia (18+)
(A) (B) (C) (D) (E) (F) (G) (H) (I) (J) (K) (L)
-** 97* -** -** -** -** -** 97* -** -** -** -**Unweighted Base
- 62 - - - - - 62 - - - -- 64% - - - - - 64% - - - -
TOP 2 BOX (NET)
- 9 - - - - - 9 - - - -- 9% - - - - - 9% - - - -
Very trustworthy
- 53 - - - - - 53 - - - -- 55% - - - - - 55% - - - -
Somewhat trustworthy
- 35 - - - - - 35 - - - -- 36% - - - - - 36% - - - -
BOTTOM 2 BOX (NET)
- 29 - - - - - 29 - - - -- 30% - - - - - 30% - - - -
Not very trustworthy
- 6 - - - - - 6 - - - -- 6% - - - - - 6% - - - -
Not at all trustworthy
- 97 - - - - - 97 - - - -- 100% - - - - - 100% - - - -
Sigma
_________________________________________________________________________________________________________________Proportions/Means: Columns Tested (5% risk level) - A/B - C/D - E/F - G/H - I/J - K/L - A/C/E/G/I/K - B/D/F/H/J/LOverlap formulae used. * small base; ** very small base (under 30) ineligible for sig testing

Page 198p121866 - ICANN Global Study Wave 2 - ConsumersNielsenBanner 3
8 Jun 2016Table 150Q826_28. Please rate the following gTLDs by how trustworthy you feel they are.
28. .warszawa
Base: All Qualified Respondents
Region
2016 Total 2016 North 2016 South2015 Total Consumers 2015 North America 2015 South America 2016 Europe 2016 Africa 2016 AsiaConsumers (18+) America (18+) America (18+) 2015 Europe (18+) 2015 Africa (18+) 2015 Asia (18+)
(A) (B) (C) (D) (E) (F) (G) (H) (I) (J) (K) (L)
-** 92* -** -** -** -** -** 92* -** -** -** -**Unweighted Base
- 46 - - - - - 46 - - - -- 50% - - - - - 50% - - - -
TOP 2 BOX (NET)
- 4 - - - - - 4 - - - -- 4% - - - - - 4% - - - -
Very trustworthy
- 42 - - - - - 42 - - - -- 46% - - - - - 46% - - - -
Somewhat trustworthy
- 46 - - - - - 46 - - - -- 50% - - - - - 50% - - - -
BOTTOM 2 BOX (NET)
- 30 - - - - - 30 - - - -- 33% - - - - - 33% - - - -
Not very trustworthy
- 16 - - - - - 16 - - - -- 17% - - - - - 17% - - - -
Not at all trustworthy
- 92 - - - - - 92 - - - -- 100% - - - - - 100% - - - -
Sigma
_________________________________________________________________________________________________________________Proportions/Means: Columns Tested (5% risk level) - A/B - C/D - E/F - G/H - I/J - K/L - A/C/E/G/I/K - B/D/F/H/J/LOverlap formulae used. * small base; ** very small base (under 30) ineligible for sig testing
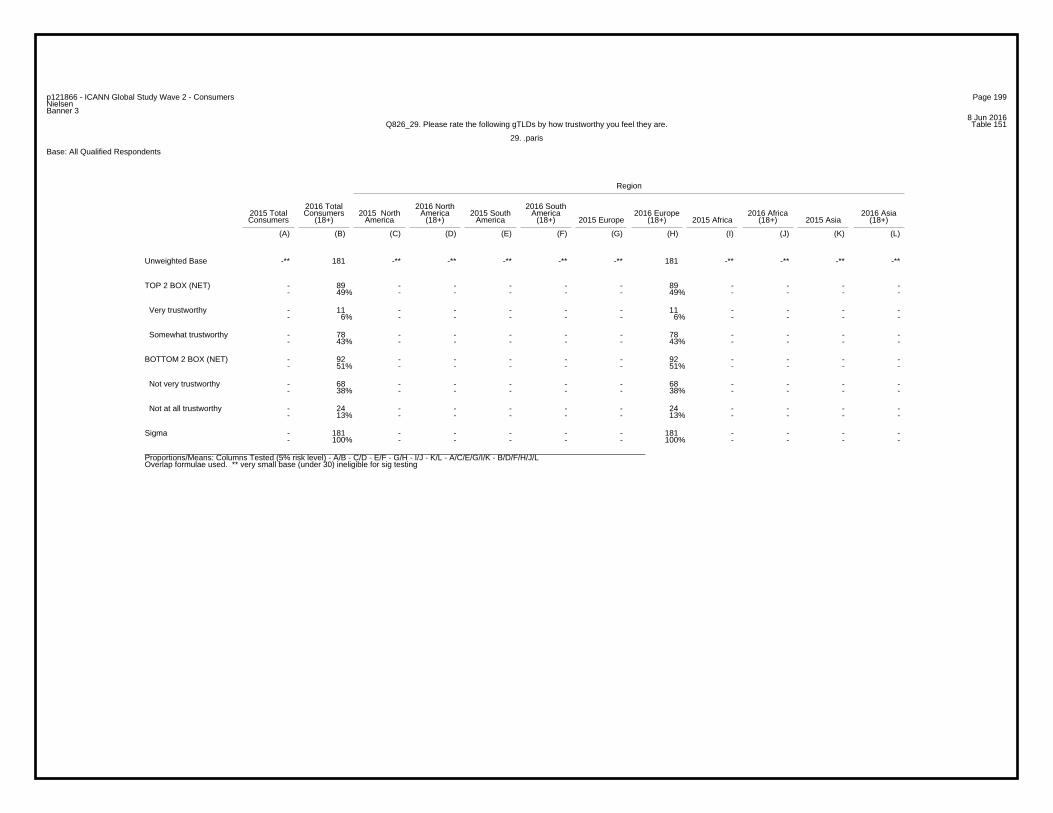
Page 199p121866 - ICANN Global Study Wave 2 - ConsumersNielsenBanner 3
8 Jun 2016Table 151Q826_29. Please rate the following gTLDs by how trustworthy you feel they are.
29. .paris
Base: All Qualified Respondents
Region
2016 Total 2016 North 2016 South2015 Total Consumers 2015 North America 2015 South America 2016 Europe 2016 Africa 2016 AsiaConsumers (18+) America (18+) America (18+) 2015 Europe (18+) 2015 Africa (18+) 2015 Asia (18+)
(A) (B) (C) (D) (E) (F) (G) (H) (I) (J) (K) (L)
-** 181 -** -** -** -** -** 181 -** -** -** -**Unweighted Base
- 89 - - - - - 89 - - - -- 49% - - - - - 49% - - - -
TOP 2 BOX (NET)
- 11 - - - - - 11 - - - -- 6% - - - - - 6% - - - -
Very trustworthy
- 78 - - - - - 78 - - - -- 43% - - - - - 43% - - - -
Somewhat trustworthy
- 92 - - - - - 92 - - - -- 51% - - - - - 51% - - - -
BOTTOM 2 BOX (NET)
- 68 - - - - - 68 - - - -- 38% - - - - - 38% - - - -
Not very trustworthy
- 24 - - - - - 24 - - - -- 13% - - - - - 13% - - - -
Not at all trustworthy
- 181 - - - - - 181 - - - -- 100% - - - - - 100% - - - -
Sigma
_________________________________________________________________________________________________________________Proportions/Means: Columns Tested (5% risk level) - A/B - C/D - E/F - G/H - I/J - K/L - A/C/E/G/I/K - B/D/F/H/J/LOverlap formulae used. ** very small base (under 30) ineligible for sig testing

Page 200p121866 - ICANN Global Study Wave 2 - ConsumersNielsenBanner 3
8 Jun 2016Table 152Q826_30. Please rate the following gTLDs by how trustworthy you feel they are.
30. .Foshan
Base: All Qualified Respondents
Region
2016 Total 2016 North 2016 South2015 Total Consumers 2015 North America 2015 South America 2016 Europe 2016 Africa 2016 AsiaConsumers (18+) America (18+) America (18+) 2015 Europe (18+) 2015 Africa (18+) 2015 Asia (18+)
(A) (B) (C) (D) (E) (F) (G) (H) (I) (J) (K) (L)
-** 996 -** -** -** -** -** -** -** -** -** 996Unweighted Base
- 553 - - - - - - - - - 553- 56% - - - - - - - - - 56%
TOP 2 BOX (NET)
- 118 - - - - - - - - - 118- 12% - - - - - - - - - 12%
Very trustworthy
- 435 - - - - - - - - - 435- 44% - - - - - - - - - 44%
Somewhat trustworthy
- 443 - - - - - - - - - 443- 44% - - - - - - - - - 44%
BOTTOM 2 BOX (NET)
- 354 - - - - - - - - - 354- 36% - - - - - - - - - 36%
Not very trustworthy
- 89 - - - - - - - - - 89- 9% - - - - - - - - - 9%
Not at all trustworthy
- 996 - - - - - - - - - 996- 100% - - - - - - - - - 100%
Sigma
_________________________________________________________________________________________________________________Proportions/Means: Columns Tested (5% risk level) - A/B - C/D - E/F - G/H - I/J - K/L - A/C/E/G/I/K - B/D/F/H/J/LOverlap formulae used. ** very small base (under 30) ineligible for sig testing
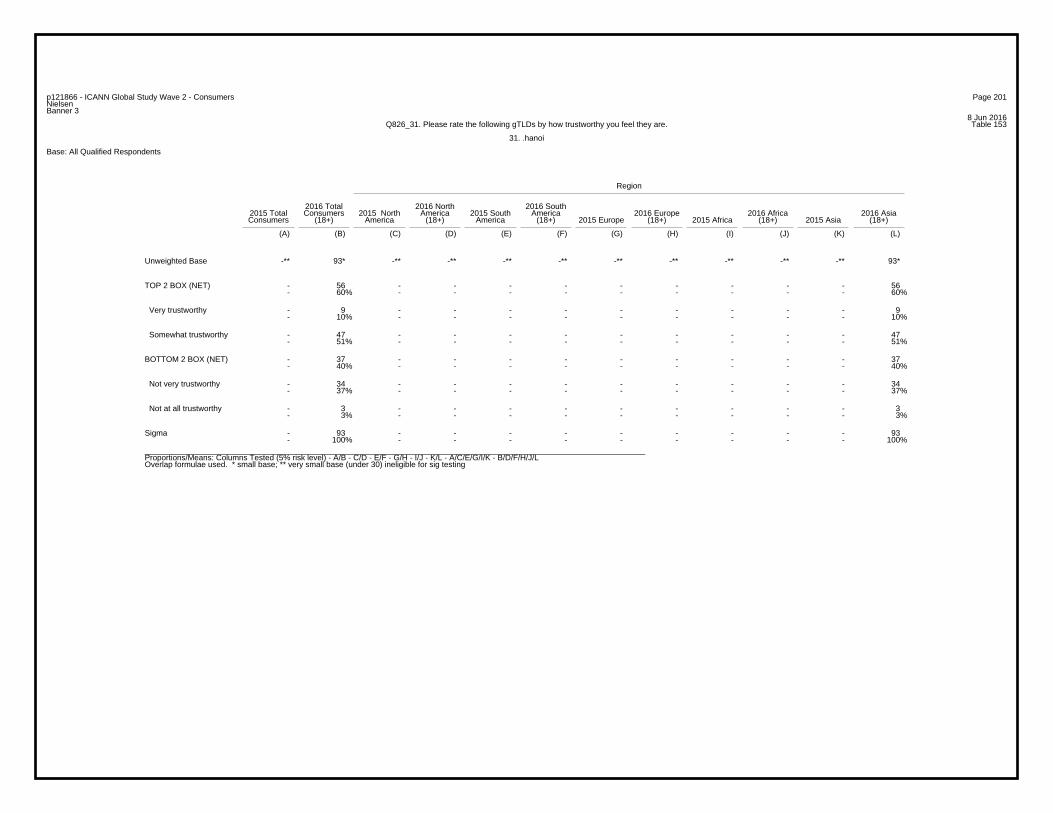
Page 201p121866 - ICANN Global Study Wave 2 - ConsumersNielsenBanner 3
8 Jun 2016Table 153Q826_31. Please rate the following gTLDs by how trustworthy you feel they are.
31. .hanoi
Base: All Qualified Respondents
Region
2016 Total 2016 North 2016 South2015 Total Consumers 2015 North America 2015 South America 2016 Europe 2016 Africa 2016 AsiaConsumers (18+) America (18+) America (18+) 2015 Europe (18+) 2015 Africa (18+) 2015 Asia (18+)
(A) (B) (C) (D) (E) (F) (G) (H) (I) (J) (K) (L)
-** 93* -** -** -** -** -** -** -** -** -** 93*Unweighted Base
- 56 - - - - - - - - - 56- 60% - - - - - - - - - 60%
TOP 2 BOX (NET)
- 9 - - - - - - - - - 9- 10% - - - - - - - - - 10%
Very trustworthy
- 47 - - - - - - - - - 47- 51% - - - - - - - - - 51%
Somewhat trustworthy
- 37 - - - - - - - - - 37- 40% - - - - - - - - - 40%
BOTTOM 2 BOX (NET)
- 34 - - - - - - - - - 34- 37% - - - - - - - - - 37%
Not very trustworthy
- 3 - - - - - - - - - 3- 3% - - - - - - - - - 3%
Not at all trustworthy
- 93 - - - - - - - - - 93- 100% - - - - - - - - - 100%
Sigma
_________________________________________________________________________________________________________________Proportions/Means: Columns Tested (5% risk level) - A/B - C/D - E/F - G/H - I/J - K/L - A/C/E/G/I/K - B/D/F/H/J/LOverlap formulae used. * small base; ** very small base (under 30) ineligible for sig testing

Page 202p121866 - ICANN Global Study Wave 2 - ConsumersNielsenBanner 3
8 Jun 2016Table 154Q826_32. Please rate the following gTLDs by how trustworthy you feel they are.
32. .manilla
Base: All Qualified Respondents
Region
2016 Total 2016 North 2016 South2015 Total Consumers 2015 North America 2015 South America 2016 Europe 2016 Africa 2016 AsiaConsumers (18+) America (18+) America (18+) 2015 Europe (18+) 2015 Africa (18+) 2015 Asia (18+)
(A) (B) (C) (D) (E) (F) (G) (H) (I) (J) (K) (L)
-** 184 -** -** -** -** -** -** -** -** -** 184Unweighted Base
- 83 - - - - - - - - - 83- 45% - - - - - - - - - 45%
TOP 2 BOX (NET)
- 21 - - - - - - - - - 21- 11% - - - - - - - - - 11%
Very trustworthy
- 62 - - - - - - - - - 62- 34% - - - - - - - - - 34%
Somewhat trustworthy
- 101 - - - - - - - - - 101- 55% - - - - - - - - - 55%
BOTTOM 2 BOX (NET)
- 73 - - - - - - - - - 73- 40% - - - - - - - - - 40%
Not very trustworthy
- 28 - - - - - - - - - 28- 15% - - - - - - - - - 15%
Not at all trustworthy
- 184 - - - - - - - - - 184- 100% - - - - - - - - - 100%
Sigma
_________________________________________________________________________________________________________________Proportions/Means: Columns Tested (5% risk level) - A/B - C/D - E/F - G/H - I/J - K/L - A/C/E/G/I/K - B/D/F/H/J/LOverlap formulae used. ** very small base (under 30) ineligible for sig testing

Page 203p121866 - ICANN Global Study Wave 2 - ConsumersNielsenBanner 3
8 Jun 2016Table 155Q826_33. Please rate the following gTLDs by how trustworthy you feel they are.
33. .tokyo
Base: All Qualified Respondents
Region
2016 Total 2016 North 2016 South2015 Total Consumers 2015 North America 2015 South America 2016 Europe 2016 Africa 2016 AsiaConsumers (18+) America (18+) America (18+) 2015 Europe (18+) 2015 Africa (18+) 2015 Asia (18+)
(A) (B) (C) (D) (E) (F) (G) (H) (I) (J) (K) (L)
-** 315 -** -** -** -** -** -** -** -** -** 315Unweighted Base
- 155 - - - - - - - - - 155- 49% - - - - - - - - - 49%
TOP 2 BOX (NET)
- 19 - - - - - - - - - 19- 6% - - - - - - - - - 6%
Very trustworthy
- 136 - - - - - - - - - 136- 43% - - - - - - - - - 43%
Somewhat trustworthy
- 160 - - - - - - - - - 160- 51% - - - - - - - - - 51%
BOTTOM 2 BOX (NET)
- 142 - - - - - - - - - 142- 45% - - - - - - - - - 45%
Not very trustworthy
- 18 - - - - - - - - - 18- 6% - - - - - - - - - 6%
Not at all trustworthy
- 315 - - - - - - - - - 315- 100% - - - - - - - - - 100%
Sigma
_________________________________________________________________________________________________________________Proportions/Means: Columns Tested (5% risk level) - A/B - C/D - E/F - G/H - I/J - K/L - A/C/E/G/I/K - B/D/F/H/J/LOverlap formulae used. ** very small base (under 30) ineligible for sig testing

Page 204p121866 - ICANN Global Study Wave 2 - ConsumersNielsenBanner 3
8 Jun 2016Table 156Q826_34. Please rate the following gTLDs by how trustworthy you feel they are.
34. .seoul
Base: All Qualified Respondents
Region
2016 Total 2016 North 2016 South2015 Total Consumers 2015 North America 2015 South America 2016 Europe 2016 Africa 2016 AsiaConsumers (18+) America (18+) America (18+) 2015 Europe (18+) 2015 Africa (18+) 2015 Asia (18+)
(A) (B) (C) (D) (E) (F) (G) (H) (I) (J) (K) (L)
-** 183 -** -** -** -** -** -** -** -** -** 183Unweighted Base
- 114 - - - - - - - - - 114- 62% - - - - - - - - - 62%
TOP 2 BOX (NET)
- 26 - - - - - - - - - 26- 14% - - - - - - - - - 14%
Very trustworthy
- 88 - - - - - - - - - 88- 48% - - - - - - - - - 48%
Somewhat trustworthy
- 69 - - - - - - - - - 69- 38% - - - - - - - - - 38%
BOTTOM 2 BOX (NET)
- 59 - - - - - - - - - 59- 32% - - - - - - - - - 32%
Not very trustworthy
- 10 - - - - - - - - - 10- 5% - - - - - - - - - 5%
Not at all trustworthy
- 183 - - - - - - - - - 183- 100% - - - - - - - - - 100%
Sigma
_________________________________________________________________________________________________________________Proportions/Means: Columns Tested (5% risk level) - A/B - C/D - E/F - G/H - I/J - K/L - A/C/E/G/I/K - B/D/F/H/J/LOverlap formulae used. ** very small base (under 30) ineligible for sig testing
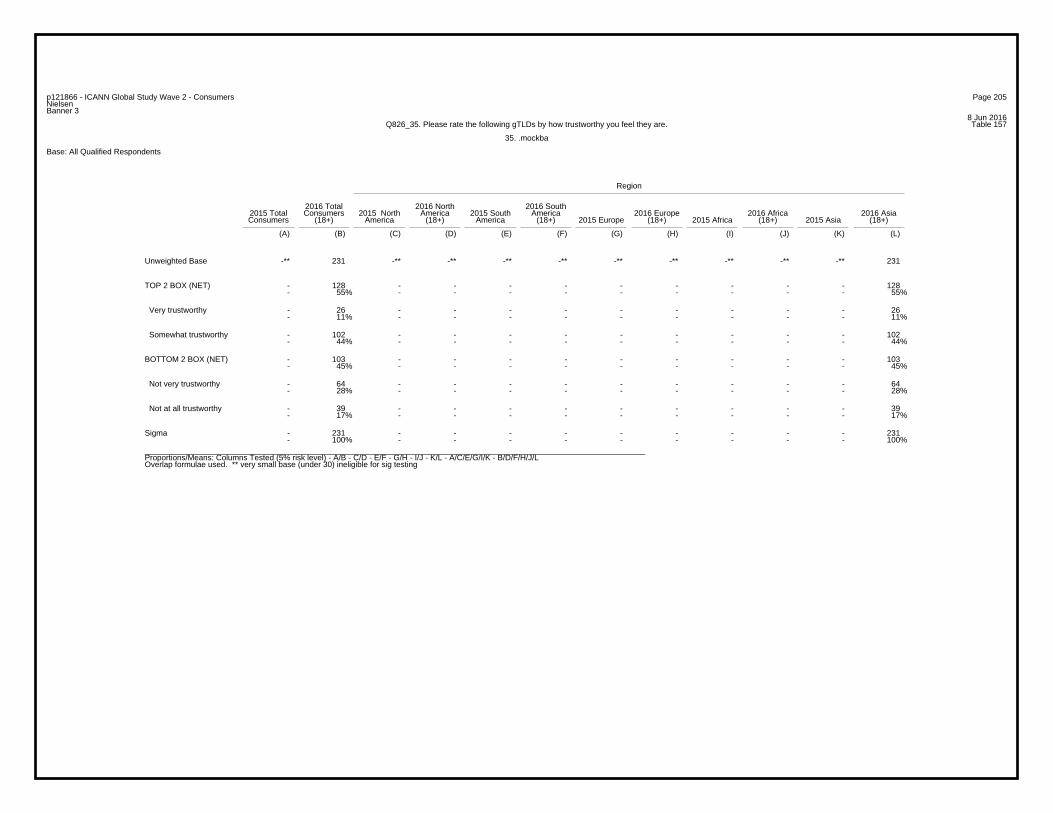
Page 205p121866 - ICANN Global Study Wave 2 - ConsumersNielsenBanner 3
8 Jun 2016Table 157Q826_35. Please rate the following gTLDs by how trustworthy you feel they are.
35. .mockba
Base: All Qualified Respondents
Region
2016 Total 2016 North 2016 South2015 Total Consumers 2015 North America 2015 South America 2016 Europe 2016 Africa 2016 AsiaConsumers (18+) America (18+) America (18+) 2015 Europe (18+) 2015 Africa (18+) 2015 Asia (18+)
(A) (B) (C) (D) (E) (F) (G) (H) (I) (J) (K) (L)
-** 231 -** -** -** -** -** -** -** -** -** 231Unweighted Base
- 128 - - - - - - - - - 128- 55% - - - - - - - - - 55%
TOP 2 BOX (NET)
- 26 - - - - - - - - - 26- 11% - - - - - - - - - 11%
Very trustworthy
- 102 - - - - - - - - - 102- 44% - - - - - - - - - 44%
Somewhat trustworthy
- 103 - - - - - - - - - 103- 45% - - - - - - - - - 45%
BOTTOM 2 BOX (NET)
- 64 - - - - - - - - - 64- 28% - - - - - - - - - 28%
Not very trustworthy
- 39 - - - - - - - - - 39- 17% - - - - - - - - - 17%
Not at all trustworthy
- 231 - - - - - - - - - 231- 100% - - - - - - - - - 100%
Sigma
_________________________________________________________________________________________________________________Proportions/Means: Columns Tested (5% risk level) - A/B - C/D - E/F - G/H - I/J - K/L - A/C/E/G/I/K - B/D/F/H/J/LOverlap formulae used. ** very small base (under 30) ineligible for sig testing

Page 206p121866 - ICANN Global Study Wave 2 - ConsumersNielsenBanner 3
8 Jun 2016Table 158Q826_36. Please rate the following gTLDs by how trustworthy you feel they are.
36. .delhi
Base: All Qualified Respondents
Region
2016 Total 2016 North 2016 South2015 Total Consumers 2015 North America 2015 South America 2016 Europe 2016 Africa 2016 AsiaConsumers (18+) America (18+) America (18+) 2015 Europe (18+) 2015 Africa (18+) 2015 Asia (18+)
(A) (B) (C) (D) (E) (F) (G) (H) (I) (J) (K) (L)
-** 595 -** -** -** -** -** -** -** -** -** 595Unweighted Base
- 350 - - - - - - - - - 350- 59% - - - - - - - - - 59%
TOP 2 BOX (NET)
- 100 - - - - - - - - - 100- 17% - - - - - - - - - 17%
Very trustworthy
- 250 - - - - - - - - - 250- 42% - - - - - - - - - 42%
Somewhat trustworthy
- 245 - - - - - - - - - 245- 41% - - - - - - - - - 41%
BOTTOM 2 BOX (NET)
- 177 - - - - - - - - - 177- 30% - - - - - - - - - 30%
Not very trustworthy
- 68 - - - - - - - - - 68- 11% - - - - - - - - - 11%
Not at all trustworthy
- 595 - - - - - - - - - 595- 100% - - - - - - - - - 100%
Sigma
_________________________________________________________________________________________________________________Proportions/Means: Columns Tested (5% risk level) - A/B - C/D - E/F - G/H - I/J - K/L - A/C/E/G/I/K - B/D/F/H/J/LOverlap formulae used. ** very small base (under 30) ineligible for sig testing

Page 207p121866 - ICANN Global Study Wave 2 - ConsumersNielsenBanner 3
8 Jun 2016Table 159Q826_37. Please rate the following gTLDs by how trustworthy you feel they are.
37. .jakarta
Base: All Qualified Respondents
Region
2016 Total 2016 North 2016 South2015 Total Consumers 2015 North America 2015 South America 2016 Europe 2016 Africa 2016 AsiaConsumers (18+) America (18+) America (18+) 2015 Europe (18+) 2015 Africa (18+) 2015 Asia (18+)
(A) (B) (C) (D) (E) (F) (G) (H) (I) (J) (K) (L)
-** 181 -** -** -** -** -** -** -** -** -** 181Unweighted Base
- 137 - - - - - - - - - 137- 76% - - - - - - - - - 76%
TOP 2 BOX (NET)
- 32 - - - - - - - - - 32- 18% - - - - - - - - - 18%
Very trustworthy
- 105 - - - - - - - - - 105- 58% - - - - - - - - - 58%
Somewhat trustworthy
- 44 - - - - - - - - - 44- 24% - - - - - - - - - 24%
BOTTOM 2 BOX (NET)
- 39 - - - - - - - - - 39- 22% - - - - - - - - - 22%
Not very trustworthy
- 5 - - - - - - - - - 5- 3% - - - - - - - - - 3%
Not at all trustworthy
- 181 - - - - - - - - - 181- 100% - - - - - - - - - 100%
Sigma
_________________________________________________________________________________________________________________Proportions/Means: Columns Tested (5% risk level) - A/B - C/D - E/F - G/H - I/J - K/L - A/C/E/G/I/K - B/D/F/H/J/LOverlap formulae used. ** very small base (under 30) ineligible for sig testing
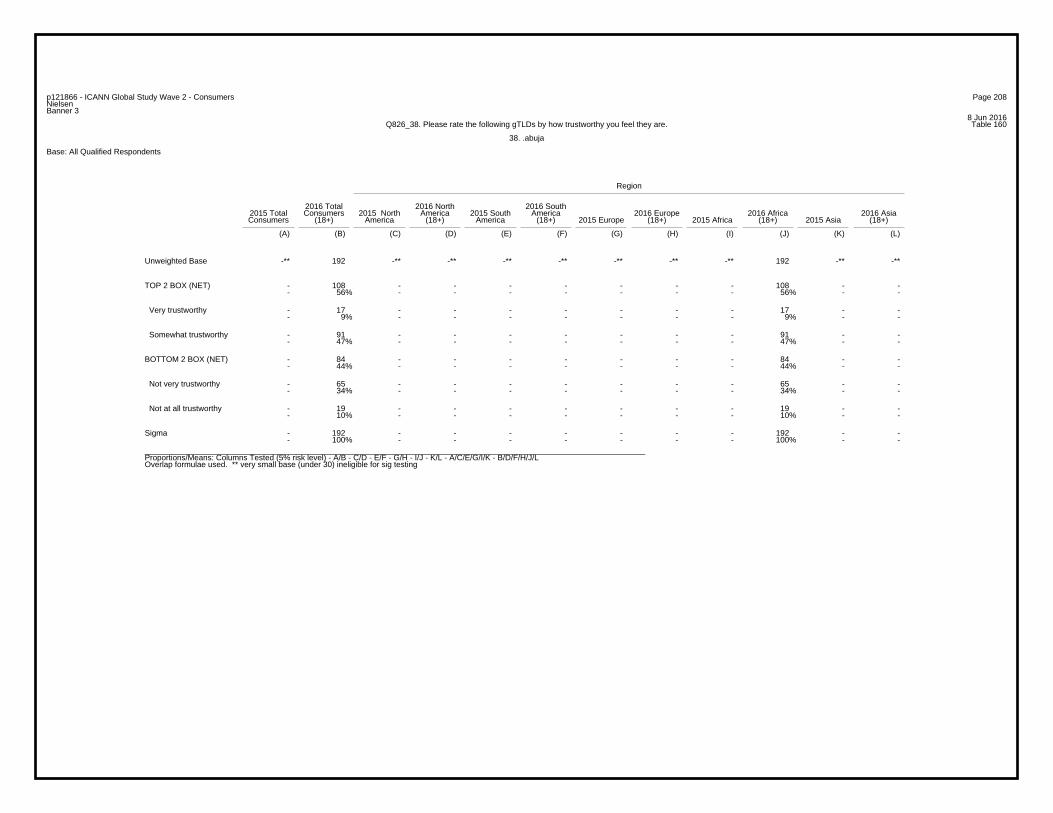
Page 208p121866 - ICANN Global Study Wave 2 - ConsumersNielsenBanner 3
8 Jun 2016Table 160Q826_38. Please rate the following gTLDs by how trustworthy you feel they are.
38. .abuja
Base: All Qualified Respondents
Region
2016 Total 2016 North 2016 South2015 Total Consumers 2015 North America 2015 South America 2016 Europe 2016 Africa 2016 AsiaConsumers (18+) America (18+) America (18+) 2015 Europe (18+) 2015 Africa (18+) 2015 Asia (18+)
(A) (B) (C) (D) (E) (F) (G) (H) (I) (J) (K) (L)
-** 192 -** -** -** -** -** -** -** 192 -** -**Unweighted Base
- 108 - - - - - - - 108 - -- 56% - - - - - - - 56% - -
TOP 2 BOX (NET)
- 17 - - - - - - - 17 - -- 9% - - - - - - - 9% - -
Very trustworthy
- 91 - - - - - - - 91 - -- 47% - - - - - - - 47% - -
Somewhat trustworthy
- 84 - - - - - - - 84 - -- 44% - - - - - - - 44% - -
BOTTOM 2 BOX (NET)
- 65 - - - - - - - 65 - -- 34% - - - - - - - 34% - -
Not very trustworthy
- 19 - - - - - - - 19 - -- 10% - - - - - - - 10% - -
Not at all trustworthy
- 192 - - - - - - - 192 - -- 100% - - - - - - - 100% - -
Sigma
_________________________________________________________________________________________________________________Proportions/Means: Columns Tested (5% risk level) - A/B - C/D - E/F - G/H - I/J - K/L - A/C/E/G/I/K - B/D/F/H/J/LOverlap formulae used. ** very small base (under 30) ineligible for sig testing

Page 209p121866 - ICANN Global Study Wave 2 - ConsumersNielsenBanner 3
8 Jun 2016Table 161Q826_39. Please rate the following gTLDs by how trustworthy you feel they are.
39. .capetown
Base: All Qualified Respondents
Region
2016 Total 2016 North 2016 South2015 Total Consumers 2015 North America 2015 South America 2016 Europe 2016 Africa 2016 AsiaConsumers (18+) America (18+) America (18+) 2015 Europe (18+) 2015 Africa (18+) 2015 Asia (18+)
(A) (B) (C) (D) (E) (F) (G) (H) (I) (J) (K) (L)
-** 90* -** -** -** -** -** -** -** 90* -** -**Unweighted Base
- 57 - - - - - - - 57 - -- 63% - - - - - - - 63% - -
TOP 2 BOX (NET)
- 7 - - - - - - - 7 - -- 8% - - - - - - - 8% - -
Very trustworthy
- 50 - - - - - - - 50 - -- 56% - - - - - - - 56% - -
Somewhat trustworthy
- 33 - - - - - - - 33 - -- 37% - - - - - - - 37% - -
BOTTOM 2 BOX (NET)
- 24 - - - - - - - 24 - -- 27% - - - - - - - 27% - -
Not very trustworthy
- 9 - - - - - - - 9 - -- 10% - - - - - - - 10% - -
Not at all trustworthy
- 90 - - - - - - - 90 - -- 100% - - - - - - - 100% - -
Sigma
_________________________________________________________________________________________________________________Proportions/Means: Columns Tested (5% risk level) - A/B - C/D - E/F - G/H - I/J - K/L - A/C/E/G/I/K - B/D/F/H/J/LOverlap formulae used. * small base; ** very small base (under 30) ineligible for sig testing

Page 210p121866 - ICANN Global Study Wave 2 - ConsumersNielsenBanner 3
8 Jun 2016Table 162Q826_40. Please rate the following gTLDs by how trustworthy you feel they are.
40. .cairo
Base: All Qualified Respondents
Region
2016 Total 2016 North 2016 South2015 Total Consumers 2015 North America 2015 South America 2016 Europe 2016 Africa 2016 AsiaConsumers (18+) America (18+) America (18+) 2015 Europe (18+) 2015 Africa (18+) 2015 Asia (18+)
(A) (B) (C) (D) (E) (F) (G) (H) (I) (J) (K) (L)
-** 96* -** -** -** -** -** -** -** 96* -** -**Unweighted Base
- 57 - - - - - - - 57 - -- 59% - - - - - - - 59% - -
TOP 2 BOX (NET)
- 11 - - - - - - - 11 - -- 11% - - - - - - - 11% - -
Very trustworthy
- 46 - - - - - - - 46 - -- 48% - - - - - - - 48% - -
Somewhat trustworthy
- 39 - - - - - - - 39 - -- 41% - - - - - - - 41% - -
BOTTOM 2 BOX (NET)
- 28 - - - - - - - 28 - -- 29% - - - - - - - 29% - -
Not very trustworthy
- 11 - - - - - - - 11 - -- 11% - - - - - - - 11% - -
Not at all trustworthy
- 96 - - - - - - - 96 - -- 100% - - - - - - - 100% - -
Sigma
_________________________________________________________________________________________________________________Proportions/Means: Columns Tested (5% risk level) - A/B - C/D - E/F - G/H - I/J - K/L - A/C/E/G/I/K - B/D/F/H/J/LOverlap formulae used. * small base; ** very small base (under 30) ineligible for sig testing
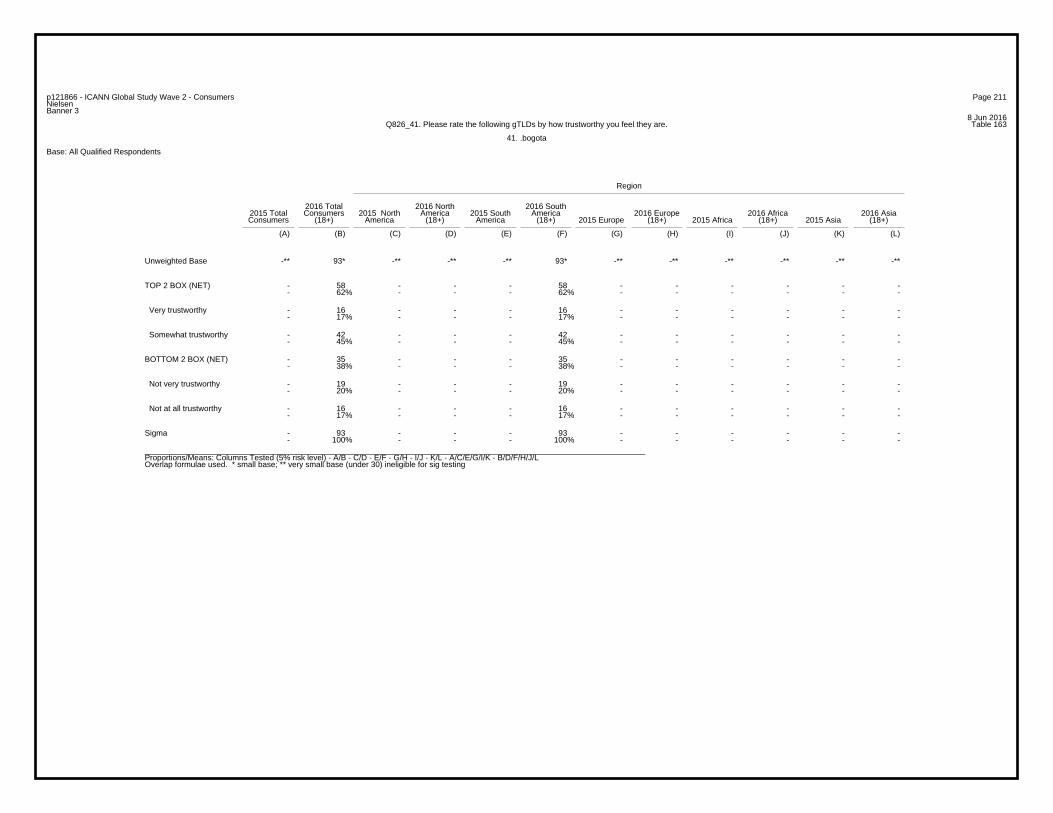
Page 211p121866 - ICANN Global Study Wave 2 - ConsumersNielsenBanner 3
8 Jun 2016Table 163Q826_41. Please rate the following gTLDs by how trustworthy you feel they are.
41. .bogota
Base: All Qualified Respondents
Region
2016 Total 2016 North 2016 South2015 Total Consumers 2015 North America 2015 South America 2016 Europe 2016 Africa 2016 AsiaConsumers (18+) America (18+) America (18+) 2015 Europe (18+) 2015 Africa (18+) 2015 Asia (18+)
(A) (B) (C) (D) (E) (F) (G) (H) (I) (J) (K) (L)
-** 93* -** -** -** 93* -** -** -** -** -** -**Unweighted Base
- 58 - - - 58 - - - - - -- 62% - - - 62% - - - - - -
TOP 2 BOX (NET)
- 16 - - - 16 - - - - - -- 17% - - - 17% - - - - - -
Very trustworthy
- 42 - - - 42 - - - - - -- 45% - - - 45% - - - - - -
Somewhat trustworthy
- 35 - - - 35 - - - - - -- 38% - - - 38% - - - - - -
BOTTOM 2 BOX (NET)
- 19 - - - 19 - - - - - -- 20% - - - 20% - - - - - -
Not very trustworthy
- 16 - - - 16 - - - - - -- 17% - - - 17% - - - - - -
Not at all trustworthy
- 93 - - - 93 - - - - - -- 100% - - - 100% - - - - - -
Sigma
_________________________________________________________________________________________________________________Proportions/Means: Columns Tested (5% risk level) - A/B - C/D - E/F - G/H - I/J - K/L - A/C/E/G/I/K - B/D/F/H/J/LOverlap formulae used. * small base; ** very small base (under 30) ineligible for sig testing

Page 212p121866 - ICANN Global Study Wave 2 - ConsumersNielsenBanner 3
8 Jun 2016Table 164Q826_42. Please rate the following gTLDs by how trustworthy you feel they are.
42. .cordoba
Base: All Qualified Respondents
Region
2016 Total 2016 North 2016 South2015 Total Consumers 2015 North America 2015 South America 2016 Europe 2016 Africa 2016 AsiaConsumers (18+) America (18+) America (18+) 2015 Europe (18+) 2015 Africa (18+) 2015 Asia (18+)
(A) (B) (C) (D) (E) (F) (G) (H) (I) (J) (K) (L)
-** 93* -** -** -** 93* -** -** -** -** -** -**Unweighted Base
- 31 - - - 31 - - - - - -- 33% - - - 33% - - - - - -
TOP 2 BOX (NET)
- 3 - - - 3 - - - - - -- 3% - - - 3% - - - - - -
Very trustworthy
- 28 - - - 28 - - - - - -- 30% - - - 30% - - - - - -
Somewhat trustworthy
- 62 - - - 62 - - - - - -- 67% - - - 67% - - - - - -
BOTTOM 2 BOX (NET)
- 35 - - - 35 - - - - - -- 38% - - - 38% - - - - - -
Not very trustworthy
- 27 - - - 27 - - - - - -- 29% - - - 29% - - - - - -
Not at all trustworthy
- 93 - - - 93 - - - - - -- 100% - - - 100% - - - - - -
Sigma
_________________________________________________________________________________________________________________Proportions/Means: Columns Tested (5% risk level) - A/B - C/D - E/F - G/H - I/J - K/L - A/C/E/G/I/K - B/D/F/H/J/LOverlap formulae used. * small base; ** very small base (under 30) ineligible for sig testing
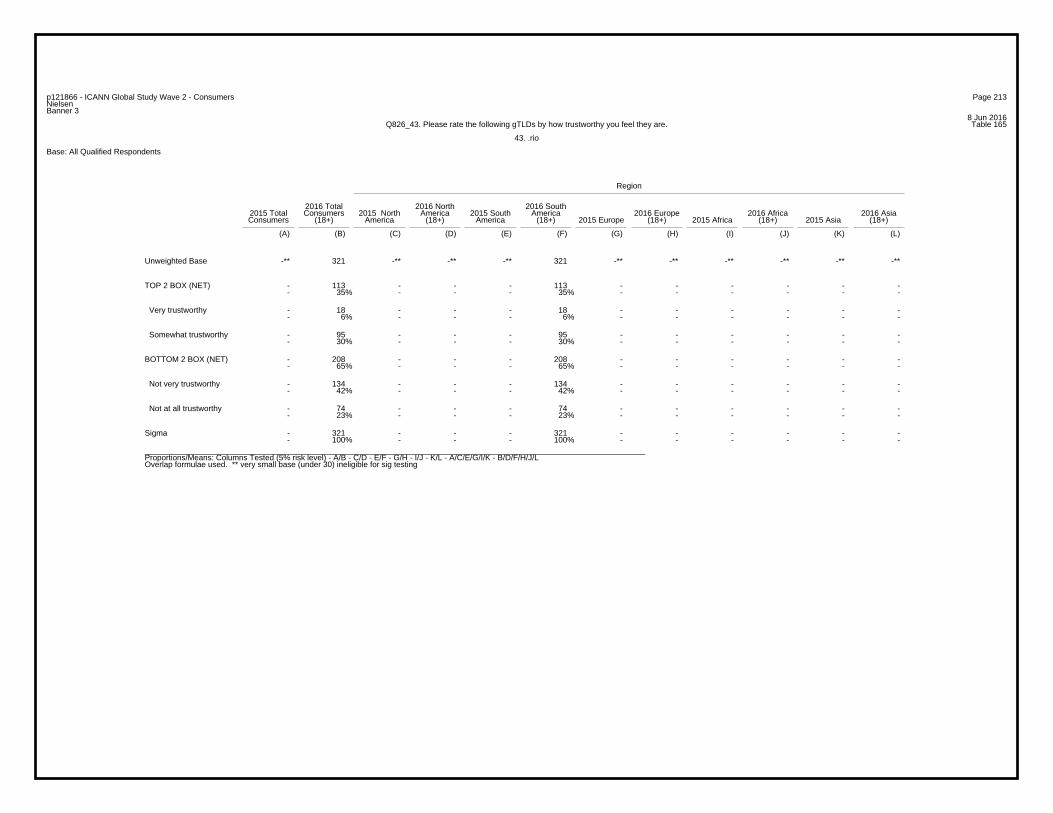
Page 213p121866 - ICANN Global Study Wave 2 - ConsumersNielsenBanner 3
8 Jun 2016Table 165Q826_43. Please rate the following gTLDs by how trustworthy you feel they are.
43. .rio
Base: All Qualified Respondents
Region
2016 Total 2016 North 2016 South2015 Total Consumers 2015 North America 2015 South America 2016 Europe 2016 Africa 2016 AsiaConsumers (18+) America (18+) America (18+) 2015 Europe (18+) 2015 Africa (18+) 2015 Asia (18+)
(A) (B) (C) (D) (E) (F) (G) (H) (I) (J) (K) (L)
-** 321 -** -** -** 321 -** -** -** -** -** -**Unweighted Base
- 113 - - - 113 - - - - - -- 35% - - - 35% - - - - - -
TOP 2 BOX (NET)
- 18 - - - 18 - - - - - -- 6% - - - 6% - - - - - -
Very trustworthy
- 95 - - - 95 - - - - - -- 30% - - - 30% - - - - - -
Somewhat trustworthy
- 208 - - - 208 - - - - - -- 65% - - - 65% - - - - - -
BOTTOM 2 BOX (NET)
- 134 - - - 134 - - - - - -- 42% - - - 42% - - - - - -
Not very trustworthy
- 74 - - - 74 - - - - - -- 23% - - - 23% - - - - - -
Not at all trustworthy
- 321 - - - 321 - - - - - -- 100% - - - 100% - - - - - -
Sigma
_________________________________________________________________________________________________________________Proportions/Means: Columns Tested (5% risk level) - A/B - C/D - E/F - G/H - I/J - K/L - A/C/E/G/I/K - B/D/F/H/J/LOverlap formulae used. ** very small base (under 30) ineligible for sig testing
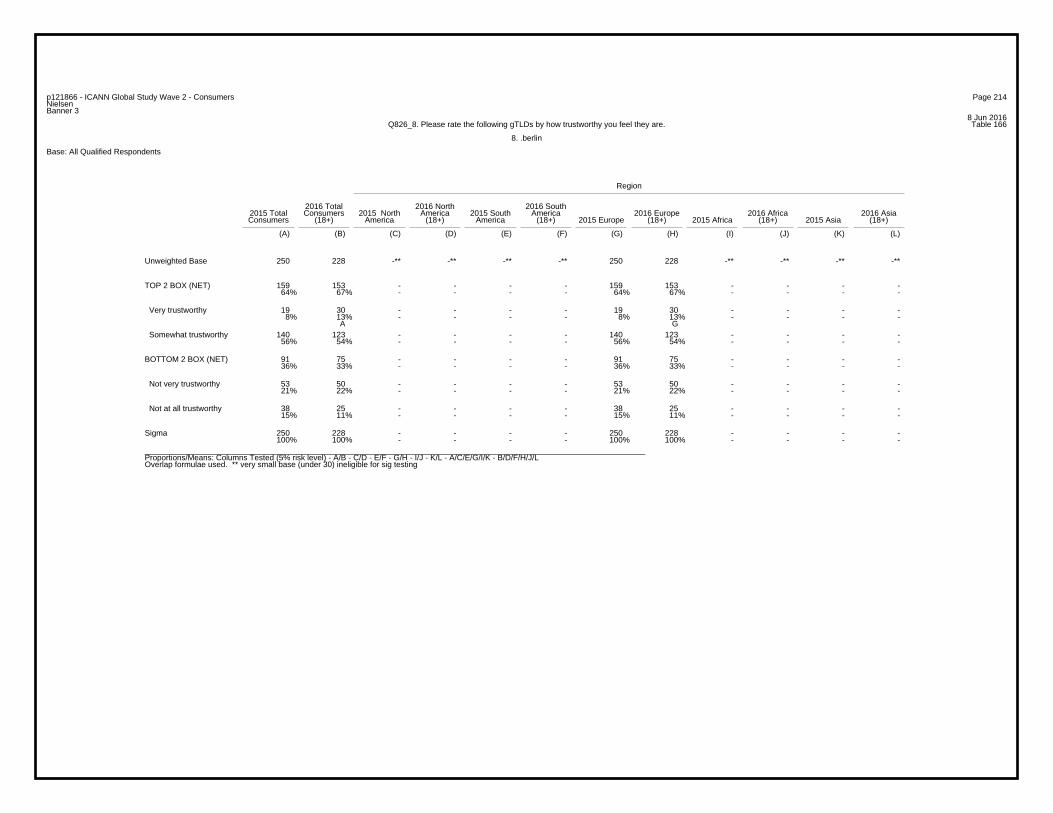
Page 214p121866 - ICANN Global Study Wave 2 - ConsumersNielsenBanner 3
8 Jun 2016Table 166Q826_8. Please rate the following gTLDs by how trustworthy you feel they are.
8. .berlin
Base: All Qualified Respondents
Region
2016 Total 2016 North 2016 South2015 Total Consumers 2015 North America 2015 South America 2016 Europe 2016 Africa 2016 AsiaConsumers (18+) America (18+) America (18+) 2015 Europe (18+) 2015 Africa (18+) 2015 Asia (18+)
(A) (B) (C) (D) (E) (F) (G) (H) (I) (J) (K) (L)
250 228 -** -** -** -** 250 228 -** -** -** -**Unweighted Base
159 153 - - - - 159 153 - - - -64% 67% - - - - 64% 67% - - - -
TOP 2 BOX (NET)
19 30 - - - - 19 30 - - - -8% 13% - - - - 8% 13% - - - -
A G
Very trustworthy
140 123 - - - - 140 123 - - - -56% 54% - - - - 56% 54% - - - -
Somewhat trustworthy
91 75 - - - - 91 75 - - - -36% 33% - - - - 36% 33% - - - -
BOTTOM 2 BOX (NET)
53 50 - - - - 53 50 - - - -21% 22% - - - - 21% 22% - - - -
Not very trustworthy
38 25 - - - - 38 25 - - - -15% 11% - - - - 15% 11% - - - -
Not at all trustworthy
250 228 - - - - 250 228 - - - -100% 100% - - - - 100% 100% - - - -
Sigma
_________________________________________________________________________________________________________________Proportions/Means: Columns Tested (5% risk level) - A/B - C/D - E/F - G/H - I/J - K/L - A/C/E/G/I/K - B/D/F/H/J/LOverlap formulae used. ** very small base (under 30) ineligible for sig testing
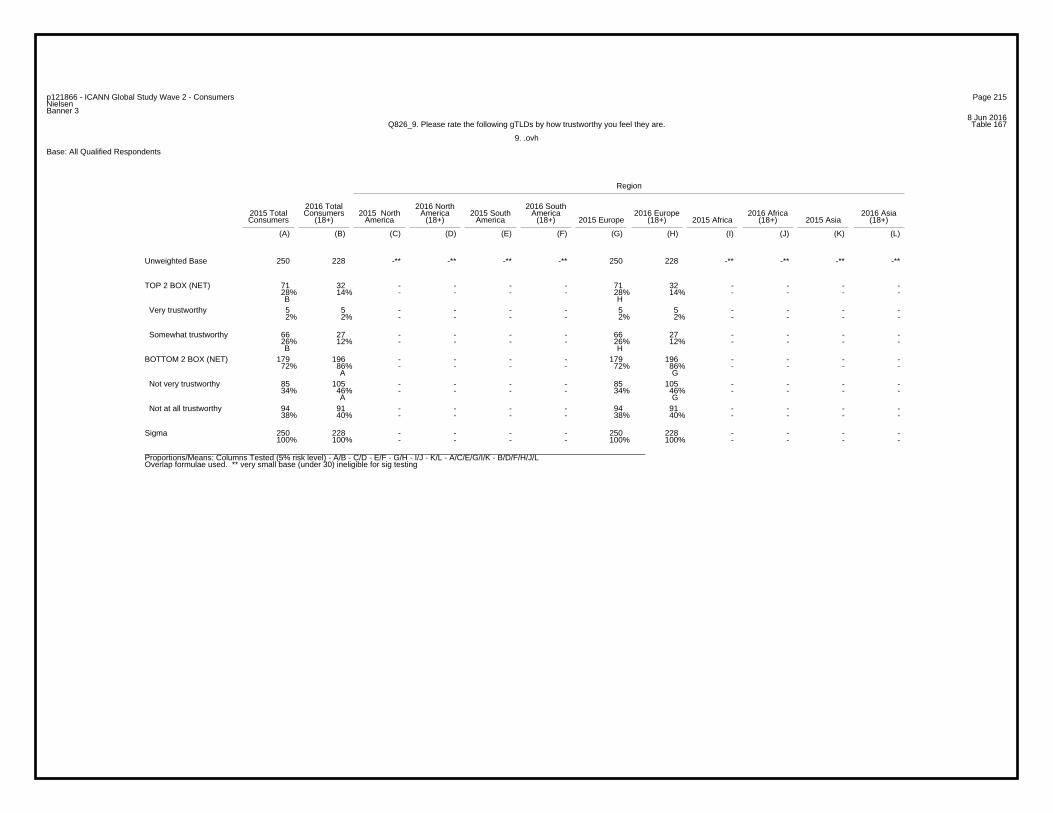
Page 215p121866 - ICANN Global Study Wave 2 - ConsumersNielsenBanner 3
8 Jun 2016Table 167Q826_9. Please rate the following gTLDs by how trustworthy you feel they are.
9. .ovh
Base: All Qualified Respondents
Region
2016 Total 2016 North 2016 South2015 Total Consumers 2015 North America 2015 South America 2016 Europe 2016 Africa 2016 AsiaConsumers (18+) America (18+) America (18+) 2015 Europe (18+) 2015 Africa (18+) 2015 Asia (18+)
(A) (B) (C) (D) (E) (F) (G) (H) (I) (J) (K) (L)
250 228 -** -** -** -** 250 228 -** -** -** -**Unweighted Base
71 32 - - - - 71 32 - - - -28% 14% - - - - 28% 14% - - - - B H
TOP 2 BOX (NET)
5 5 - - - - 5 5 - - - -2% 2% - - - - 2% 2% - - - -
Very trustworthy
66 27 - - - - 66 27 - - - -26% 12% - - - - 26% 12% - - - - B H
Somewhat trustworthy
179 196 - - - - 179 196 - - - -72% 86% - - - - 72% 86% - - - -
A G
BOTTOM 2 BOX (NET)
85 105 - - - - 85 105 - - - -34% 46% - - - - 34% 46% - - - -
A G
Not very trustworthy
94 91 - - - - 94 91 - - - -38% 40% - - - - 38% 40% - - - -
Not at all trustworthy
250 228 - - - - 250 228 - - - -100% 100% - - - - 100% 100% - - - -
Sigma
_________________________________________________________________________________________________________________Proportions/Means: Columns Tested (5% risk level) - A/B - C/D - E/F - G/H - I/J - K/L - A/C/E/G/I/K - B/D/F/H/J/LOverlap formulae used. ** very small base (under 30) ineligible for sig testing

Page 216p121866 - ICANN Global Study Wave 2 - ConsumersNielsenBanner 3
8 Jun 2016Table 168Q826_10. Please rate the following gTLDs by how trustworthy you feel they are.
10. .london
Base: All Qualified Respondents
Region
2016 Total 2016 North 2016 South2015 Total Consumers 2015 North America 2015 South America 2016 Europe 2016 Africa 2016 AsiaConsumers (18+) America (18+) America (18+) 2015 Europe (18+) 2015 Africa (18+) 2015 Asia (18+)
(A) (B) (C) (D) (E) (F) (G) (H) (I) (J) (K) (L)
1086 180 -** -** -** -** 1086 180 -** -** -** -**Unweighted Base
495 90 - - - - 495 90 - - - -46% 50% - - - - 46% 50% - - - -
TOP 2 BOX (NET)
47 17 - - - - 47 17 - - - -4% 9% - - - - 4% 9% - - - -
A G
Very trustworthy
448 73 - - - - 448 73 - - - -41% 41% - - - - 41% 41% - - - -
Somewhat trustworthy
591 90 - - - - 591 90 - - - -54% 50% - - - - 54% 50% - - - -
BOTTOM 2 BOX (NET)
383 70 - - - - 383 70 - - - -35% 39% - - - - 35% 39% - - - -
Not very trustworthy
208 20 - - - - 208 20 - - - -19% 11% - - - - 19% 11% - - - - B H
Not at all trustworthy
1086 180 - - - - 1086 180 - - - -100% 100% - - - - 100% 100% - - - -
Sigma
_________________________________________________________________________________________________________________Proportions/Means: Columns Tested (5% risk level) - A/B - C/D - E/F - G/H - I/J - K/L - A/C/E/G/I/K - B/D/F/H/J/LOverlap formulae used. ** very small base (under 30) ineligible for sig testing
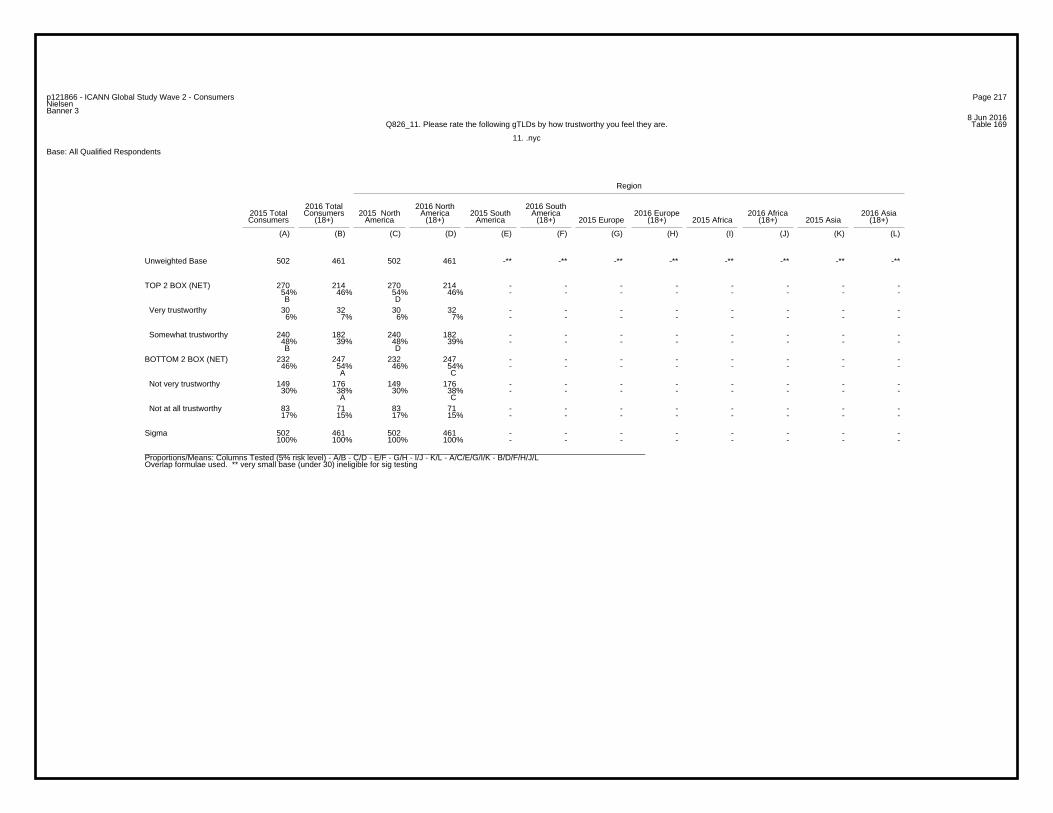
Page 217p121866 - ICANN Global Study Wave 2 - ConsumersNielsenBanner 3
8 Jun 2016Table 169Q826_11. Please rate the following gTLDs by how trustworthy you feel they are.
11. .nyc
Base: All Qualified Respondents
Region
2016 Total 2016 North 2016 South2015 Total Consumers 2015 North America 2015 South America 2016 Europe 2016 Africa 2016 AsiaConsumers (18+) America (18+) America (18+) 2015 Europe (18+) 2015 Africa (18+) 2015 Asia (18+)
(A) (B) (C) (D) (E) (F) (G) (H) (I) (J) (K) (L)
502 461 502 461 -** -** -** -** -** -** -** -**Unweighted Base
270 214 270 214 - - - - - - - -54% 46% 54% 46% - - - - - - - - B D
TOP 2 BOX (NET)
30 32 30 32 - - - - - - - -6% 7% 6% 7% - - - - - - - -
Very trustworthy
240 182 240 182 - - - - - - - -48% 39% 48% 39% - - - - - - - - B D
Somewhat trustworthy
232 247 232 247 - - - - - - - -46% 54% 46% 54% - - - - - - - -
A C
BOTTOM 2 BOX (NET)
149 176 149 176 - - - - - - - -30% 38% 30% 38% - - - - - - - -
A C
Not very trustworthy
83 71 83 71 - - - - - - - -17% 15% 17% 15% - - - - - - - -
Not at all trustworthy
502 461 502 461 - - - - - - - -100% 100% 100% 100% - - - - - - - -
Sigma
_________________________________________________________________________________________________________________Proportions/Means: Columns Tested (5% risk level) - A/B - C/D - E/F - G/H - I/J - K/L - A/C/E/G/I/K - B/D/F/H/J/LOverlap formulae used. ** very small base (under 30) ineligible for sig testing

Page 218p121866 - ICANN Global Study Wave 2 - ConsumersNielsenBanner 3
8 Jun 2016Table 170Q826_12. Please rate the following gTLDs by how trustworthy you feel they are.
12. .wang
Base: All Qualified Respondents
Region
2016 Total 2016 North 2016 South2015 Total Consumers 2015 North America 2015 South America 2016 Europe 2016 Africa 2016 AsiaConsumers (18+) America (18+) America (18+) 2015 Europe (18+) 2015 Africa (18+) 2015 Asia (18+)
(A) (B) (C) (D) (E) (F) (G) (H) (I) (J) (K) (L)
1110 996 -** -** -** -** -** -** -** -** 1110 996Unweighted Base
585 489 - - - - - - - - 585 48953% 49% - - - - - - - - 53% 49%
TOP 2 BOX (NET)
80 93 - - - - - - - - 80 937% 9% - - - - - - - - 7% 9%
Very trustworthy
505 396 - - - - - - - - 505 39645% 40% - - - - - - - - 45% 40%B L
Somewhat trustworthy
525 507 - - - - - - - - 525 50747% 51% - - - - - - - - 47% 51%
BOTTOM 2 BOX (NET)
444 419 - - - - - - - - 444 41940% 42% - - - - - - - - 40% 42%
Not very trustworthy
81 88 - - - - - - - - 81 887% 9% - - - - - - - - 7% 9%
Not at all trustworthy
1110 996 - - - - - - - - 1110 996100% 100% - - - - - - - - 100% 100%
Sigma
_________________________________________________________________________________________________________________Proportions/Means: Columns Tested (5% risk level) - A/B - C/D - E/F - G/H - I/J - K/L - A/C/E/G/I/K - B/D/F/H/J/LOverlap formulae used. ** very small base (under 30) ineligible for sig testing
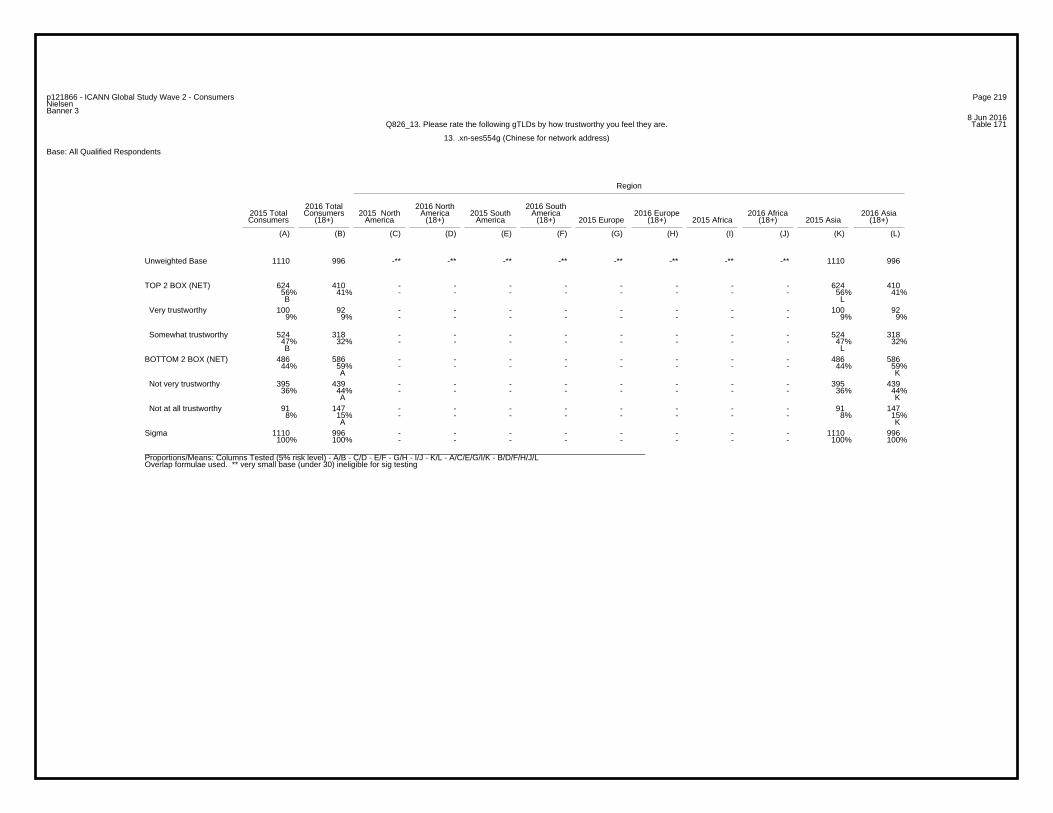
Page 219p121866 - ICANN Global Study Wave 2 - ConsumersNielsenBanner 3
8 Jun 2016Table 171Q826_13. Please rate the following gTLDs by how trustworthy you feel they are.
13. .xn-ses554g (Chinese for network address)
Base: All Qualified Respondents
Region
2016 Total 2016 North 2016 South2015 Total Consumers 2015 North America 2015 South America 2016 Europe 2016 Africa 2016 AsiaConsumers (18+) America (18+) America (18+) 2015 Europe (18+) 2015 Africa (18+) 2015 Asia (18+)
(A) (B) (C) (D) (E) (F) (G) (H) (I) (J) (K) (L)
1110 996 -** -** -** -** -** -** -** -** 1110 996Unweighted Base
624 410 - - - - - - - - 624 41056% 41% - - - - - - - - 56% 41%B L
TOP 2 BOX (NET)
100 92 - - - - - - - - 100 929% 9% - - - - - - - - 9% 9%
Very trustworthy
524 318 - - - - - - - - 524 31847% 32% - - - - - - - - 47% 32%B L
Somewhat trustworthy
486 586 - - - - - - - - 486 58644% 59% - - - - - - - - 44% 59%
A K
BOTTOM 2 BOX (NET)
395 439 - - - - - - - - 395 43936% 44% - - - - - - - - 36% 44%
A K
Not very trustworthy
91 147 - - - - - - - - 91 1478% 15% - - - - - - - - 8% 15%
A K
Not at all trustworthy
1110 996 - - - - - - - - 1110 996100% 100% - - - - - - - - 100% 100%
Sigma
_________________________________________________________________________________________________________________Proportions/Means: Columns Tested (5% risk level) - A/B - C/D - E/F - G/H - I/J - K/L - A/C/E/G/I/K - B/D/F/H/J/LOverlap formulae used. ** very small base (under 30) ineligible for sig testing

Page 220p121866 - ICANN Global Study Wave 2 - ConsumersNielsenBanner 3
8 Jun 2016Table 172Q826_14. Please rate the following gTLDs by how trustworthy you feel they are.
14. .xn-55qx5d (Chinese for company)
Base: All Qualified Respondents
Region
2016 Total 2016 North 2016 South2015 Total Consumers 2015 North America 2015 South America 2016 Europe 2016 Africa 2016 AsiaConsumers (18+) America (18+) America (18+) 2015 Europe (18+) 2015 Africa (18+) 2015 Asia (18+)
(A) (B) (C) (D) (E) (F) (G) (H) (I) (J) (K) (L)
1110 996 -** -** -** -** -** -** -** -** 1110 996Unweighted Base
632 416 - - - - - - - - 632 41657% 42% - - - - - - - - 57% 42%B L
TOP 2 BOX (NET)
105 95 - - - - - - - - 105 959% 10% - - - - - - - - 9% 10%
Very trustworthy
527 321 - - - - - - - - 527 32147% 32% - - - - - - - - 47% 32%B L
Somewhat trustworthy
478 580 - - - - - - - - 478 58043% 58% - - - - - - - - 43% 58%
A K
BOTTOM 2 BOX (NET)
386 438 - - - - - - - - 386 43835% 44% - - - - - - - - 35% 44%
A K
Not very trustworthy
92 142 - - - - - - - - 92 1428% 14% - - - - - - - - 8% 14%
A K
Not at all trustworthy
1110 996 - - - - - - - - 1110 996100% 100% - - - - - - - - 100% 100%
Sigma
_________________________________________________________________________________________________________________Proportions/Means: Columns Tested (5% risk level) - A/B - C/D - E/F - G/H - I/J - K/L - A/C/E/G/I/K - B/D/F/H/J/LOverlap formulae used. ** very small base (under 30) ineligible for sig testing
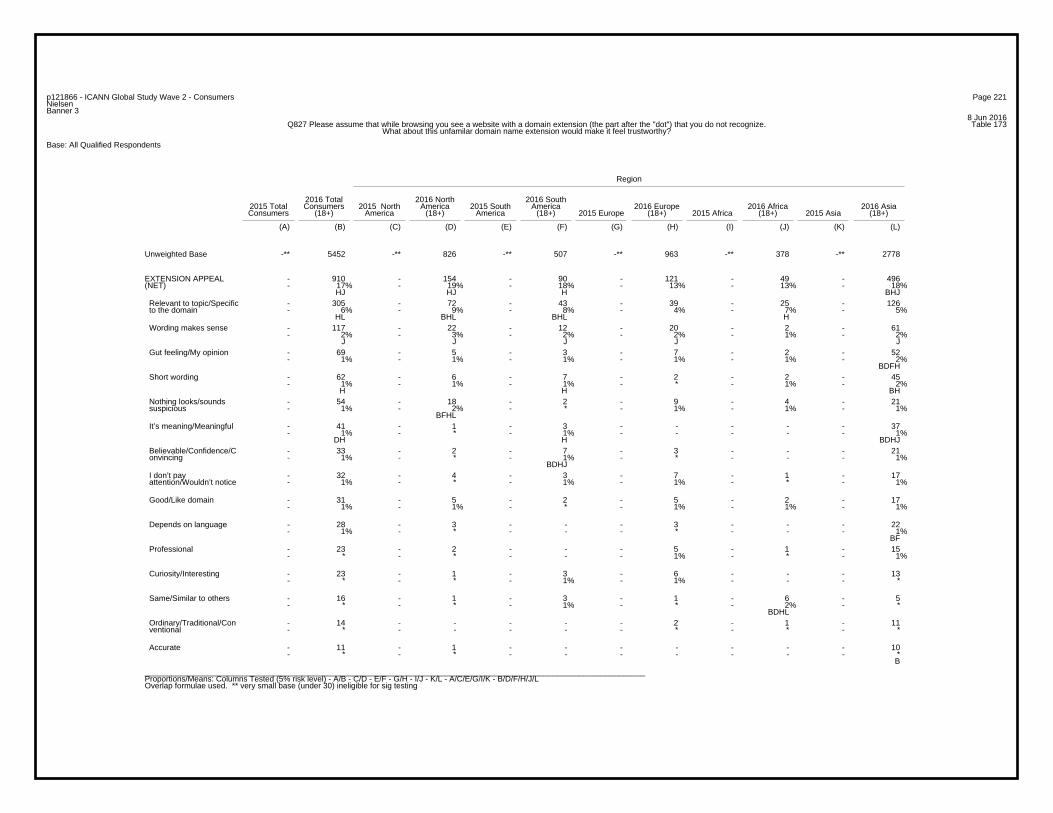
Page 221p121866 - ICANN Global Study Wave 2 - ConsumersNielsenBanner 3
8 Jun 2016Table 173Q827 Please assume that while browsing you see a website with a domain extension (the part after the "dot") that you do not recognize.
What about this unfamilar domain name extension would make it feel trustworthy?
Base: All Qualified Respondents
Region
2016 Total 2016 North 2016 South2015 Total Consumers 2015 North America 2015 South America 2016 Europe 2016 Africa 2016 AsiaConsumers (18+) America (18+) America (18+) 2015 Europe (18+) 2015 Africa (18+) 2015 Asia (18+)
(A) (B) (C) (D) (E) (F) (G) (H) (I) (J) (K) (L)
-** 5452 -** 826 -** 507 -** 963 -** 378 -** 2778Unweighted Base
- 910 - 154 - 90 - 121 - 49 - 496- 17% - 19% - 18% - 13% - 13% - 18%
HJ HJ H BHJ
EXTENSION APPEAL(NET)
- 305 - 72 - 43 - 39 - 25 - 126- 6% - 9% - 8% - 4% - 7% - 5%
HL BHL BHL H
Relevant to topic/Specific to the domain
- 117 - 22 - 12 - 20 - 2 - 61- 2% - 3% - 2% - 2% - 1% - 2%
J J J J J
Wording makes sense
- 69 - 5 - 3 - 7 - 2 - 52- 1% - 1% - 1% - 1% - 1% - 2%
BDFH
Gut feeling/My opinion
- 62 - 6 - 7 - 2 - 2 - 45- 1% - 1% - 1% - * - 1% - 2%
H H BH
Short wording
- 54 - 18 - 2 - 9 - 4 - 21- 1% - 2% - * - 1% - 1% - 1%
BFHL
Nothing looks/sounds suspicious
- 41 - 1 - 3 - - - - - 37- 1% - * - 1% - - - - - 1%
DH H BDHJ
It’s meaning/Meaningful
- 33 - 2 - 7 - 3 - - - 21- 1% - * - 1% - * - - - 1%
BDHJ
Believable/Confidence/C onvincing
- 32 - 4 - 3 - 7 - 1 - 17- 1% - * - 1% - 1% - * - 1%
I don’t pay attention/Wouldn’t notice
- 31 - 5 - 2 - 5 - 2 - 17- 1% - 1% - * - 1% - 1% - 1%
Good/Like domain
- 28 - 3 - - - 3 - - - 22- 1% - * - - - * - - - 1%
BF
Depends on language
- 23 - 2 - - - 5 - 1 - 15- * - * - - - 1% - * - 1%
Professional
- 23 - 1 - 3 - 6 - - - 13- * - * - 1% - 1% - - - *
Curiosity/Interesting
- 16 - 1 - 3 - 1 - 6 - 5- * - * - 1% - * - 2% - *
BDHL
Same/Similar to others
- 14 - - - - - 2 - 1 - 11- * - - - - - * - * - *
Ordinary/Traditional/Con ventional
- 11 - 1 - - - - - - - 10- * - * - - - - - - - *
B
Accurate
_________________________________________________________________________________________________________________Proportions/Means: Columns Tested (5% risk level) - A/B - C/D - E/F - G/H - I/J - K/L - A/C/E/G/I/K - B/D/F/H/J/LOverlap formulae used. ** very small base (under 30) ineligible for sig testing
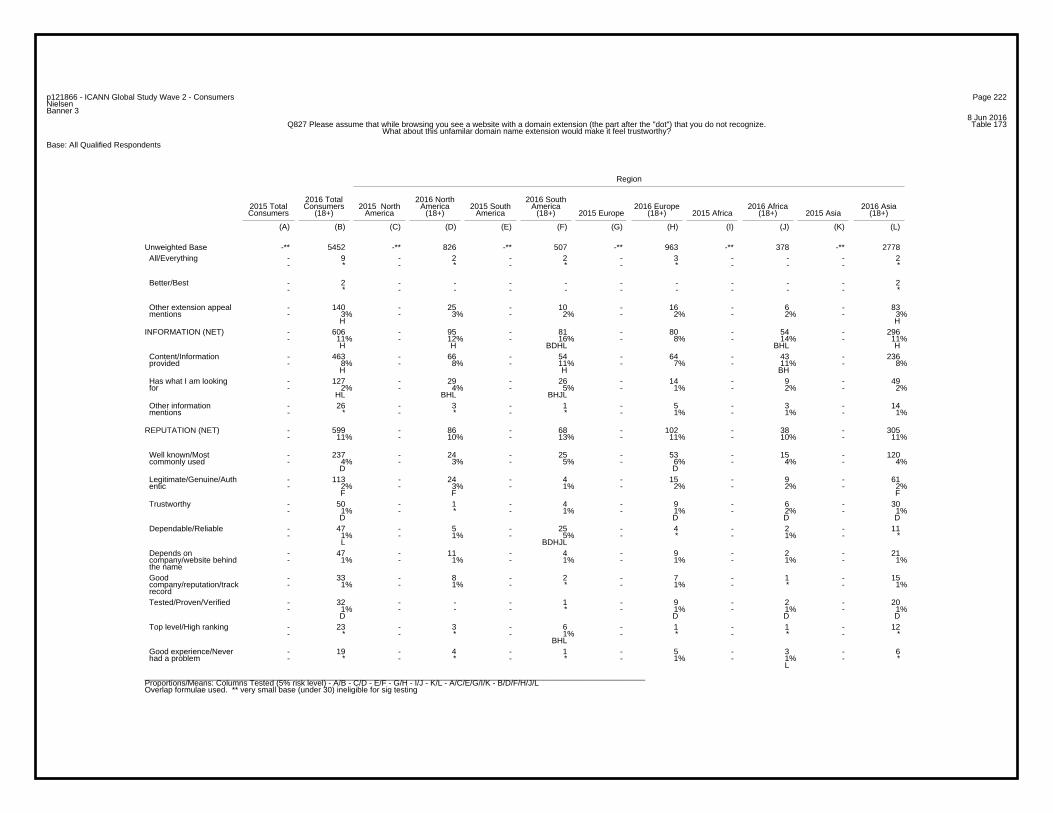
Page 222p121866 - ICANN Global Study Wave 2 - ConsumersNielsenBanner 3
8 Jun 2016Table 173Q827 Please assume that while browsing you see a website with a domain extension (the part after the "dot") that you do not recognize.
What about this unfamilar domain name extension would make it feel trustworthy?
Base: All Qualified Respondents
Region
2016 Total 2016 North 2016 South2015 Total Consumers 2015 North America 2015 South America 2016 Europe 2016 Africa 2016 AsiaConsumers (18+) America (18+) America (18+) 2015 Europe (18+) 2015 Africa (18+) 2015 Asia (18+)
(A) (B) (C) (D) (E) (F) (G) (H) (I) (J) (K) (L)
-** 5452 -** 826 -** 507 -** 963 -** 378 -** 2778Unweighted Base- 9 - 2 - 2 - 3 - - - 2- * - * - * - * - - - *
All/Everything
- 2 - - - - - - - - - 2- * - - - - - - - - - *
Better/Best
- 140 - 25 - 10 - 16 - 6 - 83- 3% - 3% - 2% - 2% - 2% - 3%
H H
Other extension appeal mentions
- 606 - 95 - 81 - 80 - 54 - 296- 11% - 12% - 16% - 8% - 14% - 11%
H H BDHL BHL H
INFORMATION (NET)
- 463 - 66 - 54 - 64 - 43 - 236- 8% - 8% - 11% - 7% - 11% - 8%
H H BH
Content/Information provided
- 127 - 29 - 26 - 14 - 9 - 49- 2% - 4% - 5% - 1% - 2% - 2%
HL BHL BHJL
Has what I am looking for
- 26 - 3 - 1 - 5 - 3 - 14- * - * - * - 1% - 1% - 1%
Other information mentions
- 599 - 86 - 68 - 102 - 38 - 305- 11% - 10% - 13% - 11% - 10% - 11%
REPUTATION (NET)
- 237 - 24 - 25 - 53 - 15 - 120- 4% - 3% - 5% - 6% - 4% - 4%
D D
Well known/Most commonly used
- 113 - 24 - 4 - 15 - 9 - 61- 2% - 3% - 1% - 2% - 2% - 2%
F F F
Legitimate/Genuine/Auth entic
- 50 - 1 - 4 - 9 - 6 - 30- 1% - * - 1% - 1% - 2% - 1%
D D D D
Trustworthy
- 47 - 5 - 25 - 4 - 2 - 11- 1% - 1% - 5% - * - 1% - *
L BDHJL
Dependable/Reliable
- 47 - 11 - 4 - 9 - 2 - 21- 1% - 1% - 1% - 1% - 1% - 1%
Depends on company/website behind the name
- 33 - 8 - 2 - 7 - 1 - 15- 1% - 1% - * - 1% - * - 1%
Good company/reputation/track record
- 32 - - - 1 - 9 - 2 - 20- 1% - - - * - 1% - 1% - 1%
D D D D
Tested/Proven/Verified
- 23 - 3 - 6 - 1 - 1 - 12- * - * - 1% - * - * - *
BHL
Top level/High ranking
- 19 - 4 - 1 - 5 - 3 - 6- * - * - * - 1% - 1% - *
L
Good experience/Never had a problem
_________________________________________________________________________________________________________________Proportions/Means: Columns Tested (5% risk level) - A/B - C/D - E/F - G/H - I/J - K/L - A/C/E/G/I/K - B/D/F/H/J/LOverlap formulae used. ** very small base (under 30) ineligible for sig testing
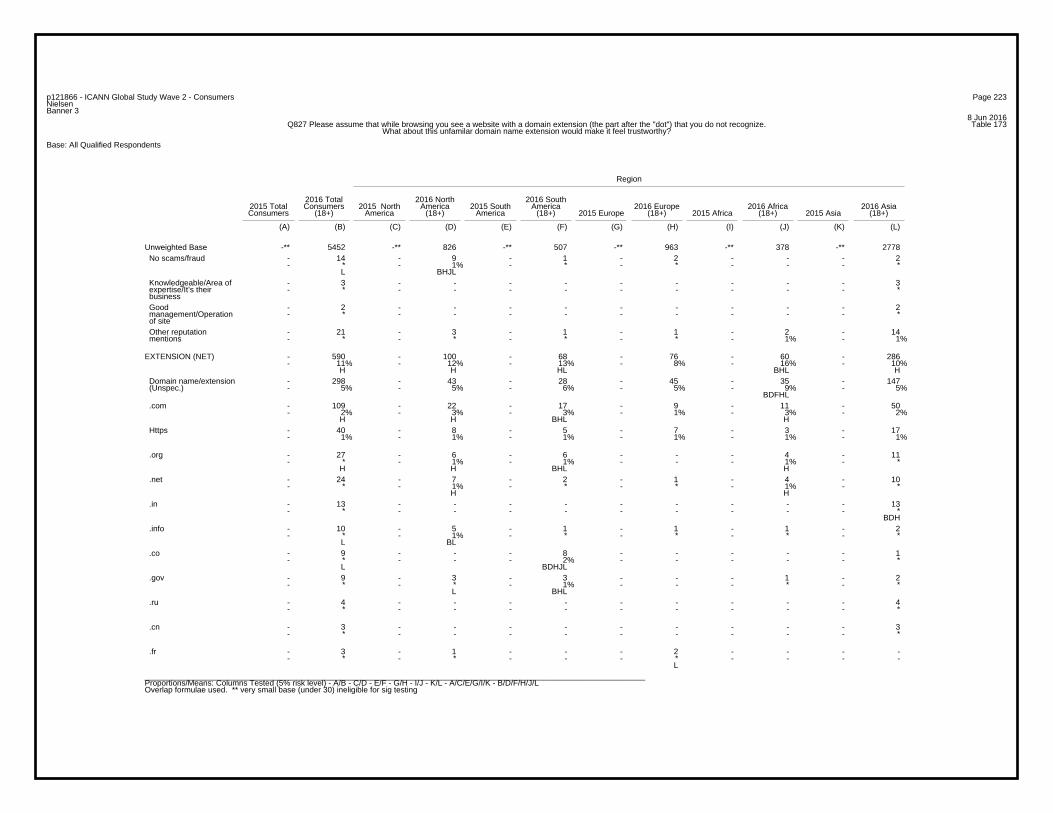
Page 223p121866 - ICANN Global Study Wave 2 - ConsumersNielsenBanner 3
8 Jun 2016Table 173Q827 Please assume that while browsing you see a website with a domain extension (the part after the "dot") that you do not recognize.
What about this unfamilar domain name extension would make it feel trustworthy?
Base: All Qualified Respondents
Region
2016 Total 2016 North 2016 South2015 Total Consumers 2015 North America 2015 South America 2016 Europe 2016 Africa 2016 AsiaConsumers (18+) America (18+) America (18+) 2015 Europe (18+) 2015 Africa (18+) 2015 Asia (18+)
(A) (B) (C) (D) (E) (F) (G) (H) (I) (J) (K) (L)
-** 5452 -** 826 -** 507 -** 963 -** 378 -** 2778Unweighted Base- 14 - 9 - 1 - 2 - - - 2- * - 1% - * - * - - - *
L BHJL
No scams/fraud
- 3 - - - - - - - - - 3- * - - - - - - - - - *
Knowledgeable/Area of expertise/It’s their business
- 2 - - - - - - - - - 2- * - - - - - - - - - *
Good management/Operation of site
- 21 - 3 - 1 - 1 - 2 - 14- * - * - * - * - 1% - 1%
Other reputation mentions
- 590 - 100 - 68 - 76 - 60 - 286- 11% - 12% - 13% - 8% - 16% - 10%
H H HL BHL H
EXTENSION (NET)
- 298 - 43 - 28 - 45 - 35 - 147- 5% - 5% - 6% - 5% - 9% - 5%
BDFHL
Domain name/extension (Unspec.)
- 109 - 22 - 17 - 9 - 11 - 50- 2% - 3% - 3% - 1% - 3% - 2%
H H BHL H
.com
- 40 - 8 - 5 - 7 - 3 - 17- 1% - 1% - 1% - 1% - 1% - 1%
Https
- 27 - 6 - 6 - - - 4 - 11- * - 1% - 1% - - - 1% - *
H H BHL H
.org
- 24 - 7 - 2 - 1 - 4 - 10- * - 1% - * - * - 1% - *
H H
.net
- 13 - - - - - - - - - 13- * - - - - - - - - - *
BDH
.in
- 10 - 5 - 1 - 1 - 1 - 2- * - 1% - * - * - * - *
L BL
.info
- 9 - - - 8 - - - - - 1- * - - - 2% - - - - - *
L BDHJL
.co
- 9 - 3 - 3 - - - 1 - 2- * - * - 1% - - - * - *
L BHL
.gov
- 4 - - - - - - - - - 4- * - - - - - - - - - *
.ru
- 3 - - - - - - - - - 3- * - - - - - - - - - *
.cn
- 3 - 1 - - - 2 - - - -- * - * - - - * - - - -
L
.fr
_________________________________________________________________________________________________________________Proportions/Means: Columns Tested (5% risk level) - A/B - C/D - E/F - G/H - I/J - K/L - A/C/E/G/I/K - B/D/F/H/J/LOverlap formulae used. ** very small base (under 30) ineligible for sig testing
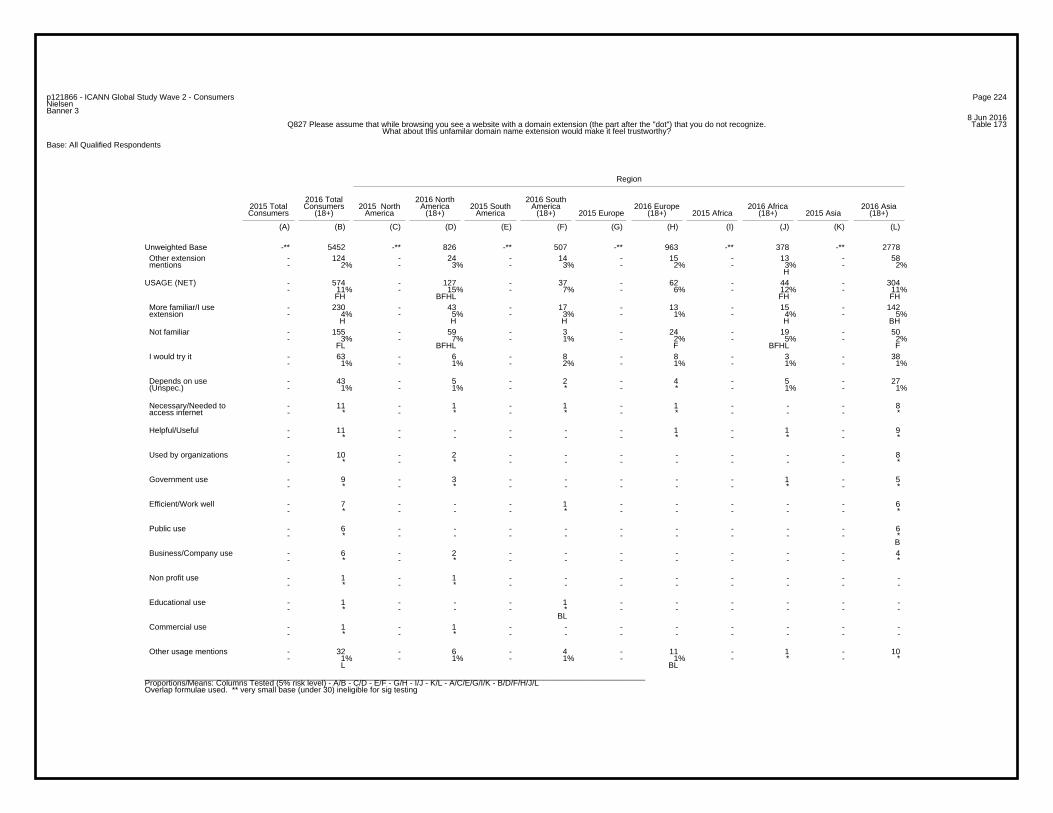
Page 224p121866 - ICANN Global Study Wave 2 - ConsumersNielsenBanner 3
8 Jun 2016Table 173Q827 Please assume that while browsing you see a website with a domain extension (the part after the "dot") that you do not recognize.
What about this unfamilar domain name extension would make it feel trustworthy?
Base: All Qualified Respondents
Region
2016 Total 2016 North 2016 South2015 Total Consumers 2015 North America 2015 South America 2016 Europe 2016 Africa 2016 AsiaConsumers (18+) America (18+) America (18+) 2015 Europe (18+) 2015 Africa (18+) 2015 Asia (18+)
(A) (B) (C) (D) (E) (F) (G) (H) (I) (J) (K) (L)
-** 5452 -** 826 -** 507 -** 963 -** 378 -** 2778Unweighted Base- 124 - 24 - 14 - 15 - 13 - 58- 2% - 3% - 3% - 2% - 3% - 2%
H
Other extension mentions
- 574 - 127 - 37 - 62 - 44 - 304- 11% - 15% - 7% - 6% - 12% - 11%
FH BFHL FH FH
USAGE (NET)
- 230 - 43 - 17 - 13 - 15 - 142- 4% - 5% - 3% - 1% - 4% - 5%
H H H H BH
More familiar/I use extension
- 155 - 59 - 3 - 24 - 19 - 50- 3% - 7% - 1% - 2% - 5% - 2%
FL BFHL F BFHL F
Not familiar
- 63 - 6 - 8 - 8 - 3 - 38- 1% - 1% - 2% - 1% - 1% - 1%
I would try it
- 43 - 5 - 2 - 4 - 5 - 27- 1% - 1% - * - * - 1% - 1%
Depends on use (Unspec.)
- 11 - 1 - 1 - 1 - - - 8- * - * - * - * - - - *
Necessary/Needed to access internet
- 11 - - - - - 1 - 1 - 9- * - - - - - * - * - *
Helpful/Useful
- 10 - 2 - - - - - - - 8- * - * - - - - - - - *
Used by organizations
- 9 - 3 - - - - - 1 - 5- * - * - - - - - * - *
Government use
- 7 - - - 1 - - - - - 6- * - - - * - - - - - *
Efficient/Work well
- 6 - - - - - - - - - 6- * - - - - - - - - - *
B
Public use
- 6 - 2 - - - - - - - 4- * - * - - - - - - - *
Business/Company use
- 1 - 1 - - - - - - - -- * - * - - - - - - - -
Non profit use
- 1 - - - 1 - - - - - -- * - - - * - - - - - -
BL
Educational use
- 1 - 1 - - - - - - - -- * - * - - - - - - - -
Commercial use
- 32 - 6 - 4 - 11 - 1 - 10- 1% - 1% - 1% - 1% - * - *
L BL
Other usage mentions
_________________________________________________________________________________________________________________Proportions/Means: Columns Tested (5% risk level) - A/B - C/D - E/F - G/H - I/J - K/L - A/C/E/G/I/K - B/D/F/H/J/LOverlap formulae used. ** very small base (under 30) ineligible for sig testing

Page 225p121866 - ICANN Global Study Wave 2 - ConsumersNielsenBanner 3
8 Jun 2016Table 173Q827 Please assume that while browsing you see a website with a domain extension (the part after the "dot") that you do not recognize.
What about this unfamilar domain name extension would make it feel trustworthy?
Base: All Qualified Respondents
Region
2016 Total 2016 North 2016 South2015 Total Consumers 2015 North America 2015 South America 2016 Europe 2016 Africa 2016 AsiaConsumers (18+) America (18+) America (18+) 2015 Europe (18+) 2015 Africa (18+) 2015 Asia (18+)
(A) (B) (C) (D) (E) (F) (G) (H) (I) (J) (K) (L)
-** 5452 -** 826 -** 507 -** 963 -** 378 -** 2778Unweighted Base- 319 - 44 - 34 - 62 - 24 - 155- 6% - 5% - 7% - 6% - 6% - 6%
SEARCH (NET)
- 156 - 22 - 20 - 25 - 11 - 78- 3% - 3% - 4% - 3% - 3% - 3%
Researched it/Check out source first
- 95 - 14 - 6 - 18 - 9 - 48- 2% - 2% - 1% - 2% - 2% - 2%
Search engine/Found through searching
- 64 - 9 - 9 - 18 - 7 - 21- 1% - 1% - 2% - 2% - 2% - 1%
L L BL L
Google search
- 12 - 1 - - - 1 - - - 10- * - * - - - * - - - *
B
Other search mentions
- 258 - 40 - 29 - 45 - 30 - 114- 5% - 5% - 6% - 5% - 8% - 4%
L BDHL
SAFETY/SECURITY(NET)
- 136 - 21 - 16 - 26 - 19 - 54- 2% - 3% - 3% - 3% - 5% - 2%
L BDHL
Safety/Security/Padlock
- 86 - 14 - 10 - 12 - 6 - 44- 2% - 2% - 2% - 1% - 2% - 2%
Check with anti virus software
- 28 - 4 - 2 - 7 - 2 - 13- 1% - * - * - 1% - 1% - *
Not being exposed to virus
- 9 - 3 - - - 2 - 1 - 3- * - * - - - * - * - *
Ensures privacy of personal information
- 5 - 1 - 1 - 1 - 2 - -- * - * - * - * - 1% - -
L BL
Other safety/security mentions
- 220 - 21 - 14 - 69 - 10 - 106- 4% - 3% - 3% - 7% - 3% - 4%
D BDFJL
Illegible data
- 183 - 22 - 13 - 21 - 5 - 122- 3% - 3% - 3% - 2% - 1% - 4%
HJ BDHJ
CONVENIENCE (NET)
- 146 - 17 - 11 - 18 - 1 - 99- 3% - 2% - 2% - 2% - * - 4%
J J J J BDHJ
Clear/Easy to understand/differentiate
- 13 - 3 - 1 - 1 - 2 - 6- * - * - * - * - 1% - *
Easy to use/access
- 8 - 2 - - - 1 - 1 - 4- * - * - - - * - * - *
Harder to obtain/Requires certain criteria
- 5 - - - 1 - - - - - 4- * - - - * - - - - - *
Faster/Quicker service
_________________________________________________________________________________________________________________Proportions/Means: Columns Tested (5% risk level) - A/B - C/D - E/F - G/H - I/J - K/L - A/C/E/G/I/K - B/D/F/H/J/LOverlap formulae used. ** very small base (under 30) ineligible for sig testing
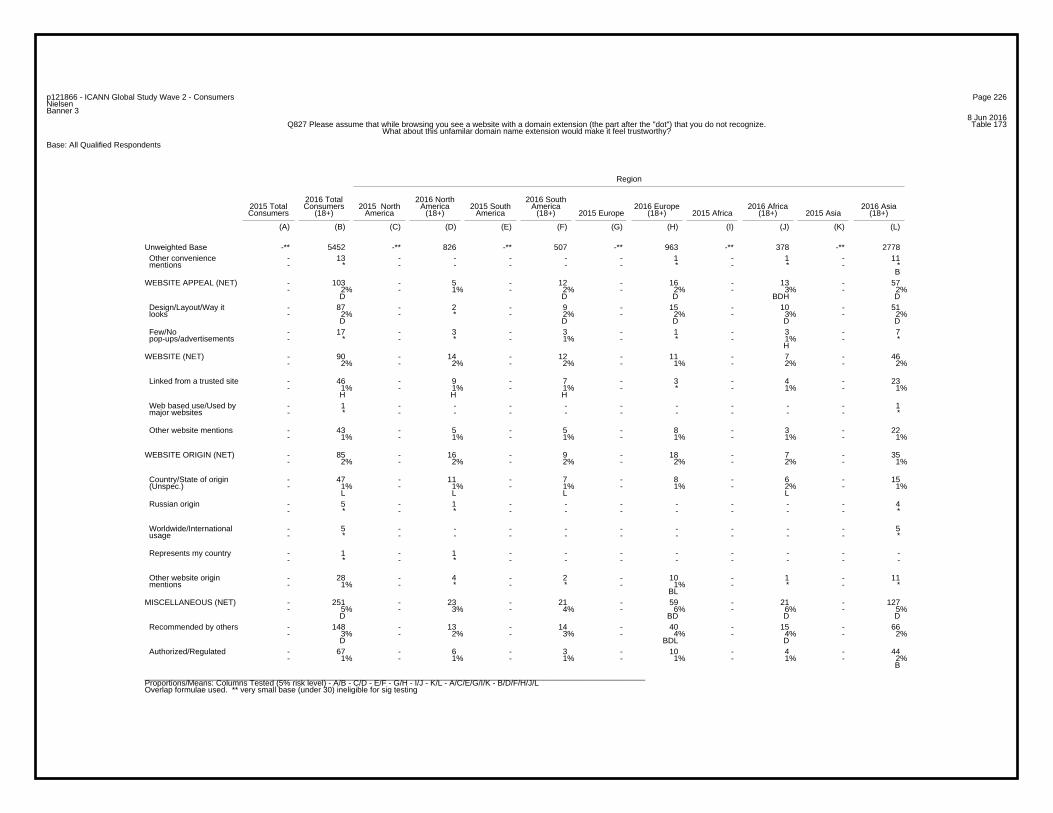
Page 226p121866 - ICANN Global Study Wave 2 - ConsumersNielsenBanner 3
8 Jun 2016Table 173Q827 Please assume that while browsing you see a website with a domain extension (the part after the "dot") that you do not recognize.
What about this unfamilar domain name extension would make it feel trustworthy?
Base: All Qualified Respondents
Region
2016 Total 2016 North 2016 South2015 Total Consumers 2015 North America 2015 South America 2016 Europe 2016 Africa 2016 AsiaConsumers (18+) America (18+) America (18+) 2015 Europe (18+) 2015 Africa (18+) 2015 Asia (18+)
(A) (B) (C) (D) (E) (F) (G) (H) (I) (J) (K) (L)
-** 5452 -** 826 -** 507 -** 963 -** 378 -** 2778Unweighted Base- 13 - - - - - 1 - 1 - 11- * - - - - - * - * - *
B
Other convenience mentions
- 103 - 5 - 12 - 16 - 13 - 57- 2% - 1% - 2% - 2% - 3% - 2%
D D D BDH D
WEBSITE APPEAL (NET)
- 87 - 2 - 9 - 15 - 10 - 51- 2% - * - 2% - 2% - 3% - 2%
D D D D D
Design/Layout/Way it looks
- 17 - 3 - 3 - 1 - 3 - 7- * - * - 1% - * - 1% - *
H
Few/No pop-ups/advertisements
- 90 - 14 - 12 - 11 - 7 - 46- 2% - 2% - 2% - 1% - 2% - 2%
WEBSITE (NET)
- 46 - 9 - 7 - 3 - 4 - 23- 1% - 1% - 1% - * - 1% - 1%
H H H
Linked from a trusted site
- 1 - - - - - - - - - 1- * - - - - - - - - - *
Web based use/Used by major websites
- 43 - 5 - 5 - 8 - 3 - 22- 1% - 1% - 1% - 1% - 1% - 1%
Other website mentions
- 85 - 16 - 9 - 18 - 7 - 35- 2% - 2% - 2% - 2% - 2% - 1%
WEBSITE ORIGIN (NET)
- 47 - 11 - 7 - 8 - 6 - 15- 1% - 1% - 1% - 1% - 2% - 1%
L L L L
Country/State of origin (Unspec.)
- 5 - 1 - - - - - - - 4- * - * - - - - - - - *
Russian origin
- 5 - - - - - - - - - 5- * - - - - - - - - - *
Worldwide/International usage
- 1 - 1 - - - - - - - -- * - * - - - - - - - -
Represents my country
- 28 - 4 - 2 - 10 - 1 - 11- 1% - * - * - 1% - * - *
BL
Other website origin mentions
- 251 - 23 - 21 - 59 - 21 - 127- 5% - 3% - 4% - 6% - 6% - 5%
D BD D D
MISCELLANEOUS (NET)
- 148 - 13 - 14 - 40 - 15 - 66- 3% - 2% - 3% - 4% - 4% - 2%
D BDL D
Recommended by others
- 67 - 6 - 3 - 10 - 4 - 44- 1% - 1% - 1% - 1% - 1% - 2%
B
Authorized/Regulated
_________________________________________________________________________________________________________________Proportions/Means: Columns Tested (5% risk level) - A/B - C/D - E/F - G/H - I/J - K/L - A/C/E/G/I/K - B/D/F/H/J/LOverlap formulae used. ** very small base (under 30) ineligible for sig testing
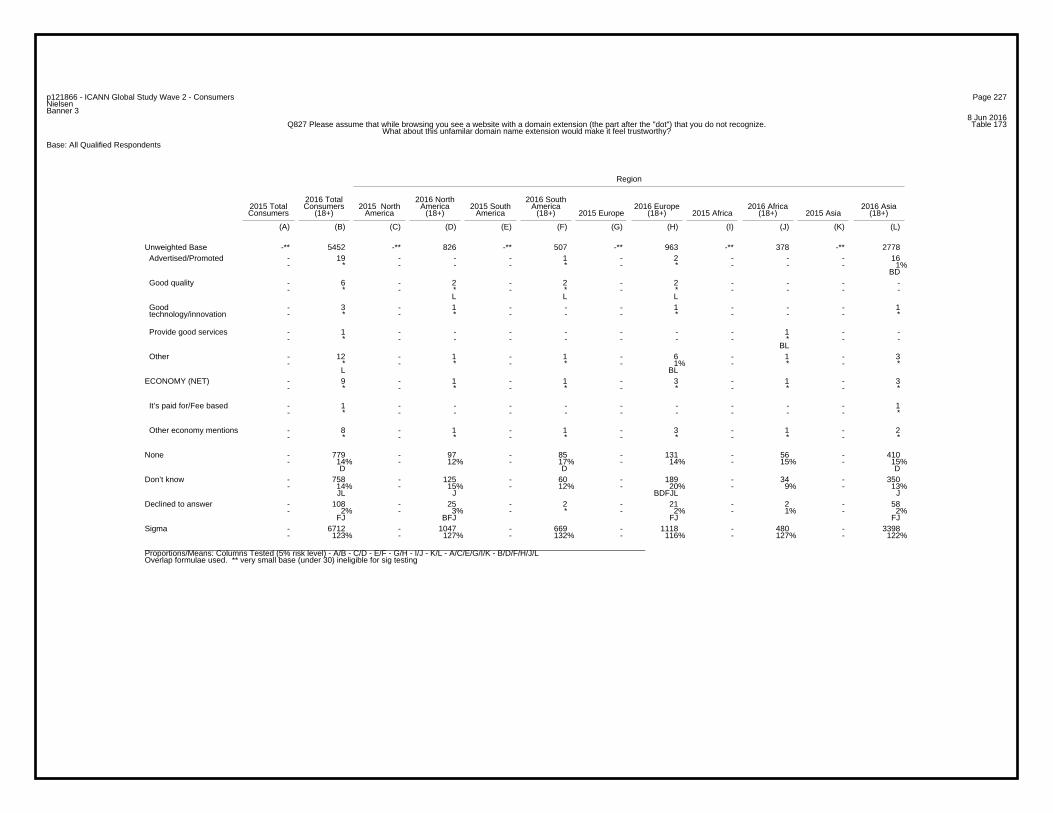
Page 227p121866 - ICANN Global Study Wave 2 - ConsumersNielsenBanner 3
8 Jun 2016Table 173Q827 Please assume that while browsing you see a website with a domain extension (the part after the "dot") that you do not recognize.
What about this unfamilar domain name extension would make it feel trustworthy?
Base: All Qualified Respondents
Region
2016 Total 2016 North 2016 South2015 Total Consumers 2015 North America 2015 South America 2016 Europe 2016 Africa 2016 AsiaConsumers (18+) America (18+) America (18+) 2015 Europe (18+) 2015 Africa (18+) 2015 Asia (18+)
(A) (B) (C) (D) (E) (F) (G) (H) (I) (J) (K) (L)
-** 5452 -** 826 -** 507 -** 963 -** 378 -** 2778Unweighted Base- 19 - - - 1 - 2 - - - 16- * - - - * - * - - - 1%
BD
Advertised/Promoted
- 6 - 2 - 2 - 2 - - - -- * - * - * - * - - - -
L L L
Good quality
- 3 - 1 - - - 1 - - - 1- * - * - - - * - - - *
Good technology/innovation
- 1 - - - - - - - 1 - -- * - - - - - - - * - -
BL
Provide good services
- 12 - 1 - 1 - 6 - 1 - 3- * - * - * - 1% - * - *
L BL
Other
- 9 - 1 - 1 - 3 - 1 - 3- * - * - * - * - * - *
ECONOMY (NET)
- 1 - - - - - - - - - 1- * - - - - - - - - - *
It’s paid for/Fee based
- 8 - 1 - 1 - 3 - 1 - 2- * - * - * - * - * - *
Other economy mentions
- 779 - 97 - 85 - 131 - 56 - 410- 14% - 12% - 17% - 14% - 15% - 15%
D D D
None
- 758 - 125 - 60 - 189 - 34 - 350- 14% - 15% - 12% - 20% - 9% - 13%
JL J BDFJL J
Don’t know
- 108 - 25 - 2 - 21 - 2 - 58- 2% - 3% - * - 2% - 1% - 2%
FJ BFJ FJ FJ
Declined to answer
- 6712 - 1047 - 669 - 1118 - 480 - 3398- 123% - 127% - 132% - 116% - 127% - 122%
Sigma
_________________________________________________________________________________________________________________Proportions/Means: Columns Tested (5% risk level) - A/B - C/D - E/F - G/H - I/J - K/L - A/C/E/G/I/K - B/D/F/H/J/LOverlap formulae used. ** very small base (under 30) ineligible for sig testing
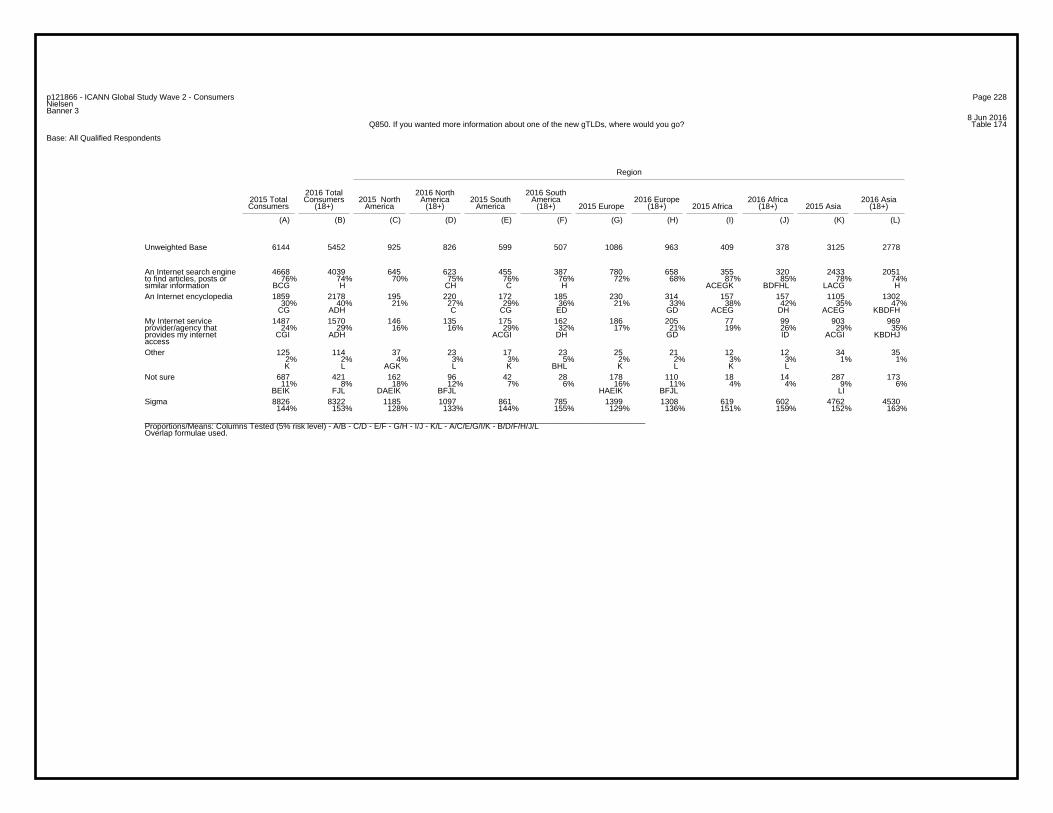
Page 228p121866 - ICANN Global Study Wave 2 - ConsumersNielsenBanner 3
8 Jun 2016Table 174Q850. If you wanted more information about one of the new gTLDs, where would you go?
Base: All Qualified Respondents
Region
2016 Total 2016 North 2016 South2015 Total Consumers 2015 North America 2015 South America 2016 Europe 2016 Africa 2016 AsiaConsumers (18+) America (18+) America (18+) 2015 Europe (18+) 2015 Africa (18+) 2015 Asia (18+)
(A) (B) (C) (D) (E) (F) (G) (H) (I) (J) (K) (L)
6144 5452 925 826 599 507 1086 963 409 378 3125 2778Unweighted Base
4668 4039 645 623 455 387 780 658 355 320 2433 205176% 74% 70% 75% 76% 76% 72% 68% 87% 85% 78% 74%
BCG H CH C H ACEGK BDFHL LACG H
An Internet search engineto find articles, posts orsimilar information
1859 2178 195 220 172 185 230 314 157 157 1105 130230% 40% 21% 27% 29% 36% 21% 33% 38% 42% 35% 47%
CG ADH C CG ED GD ACEG DH ACEG KBDFH
An Internet encyclopedia
1487 1570 146 135 175 162 186 205 77 99 903 96924% 29% 16% 16% 29% 32% 17% 21% 19% 26% 29% 35%
CGI ADH ACGI DH GD ID ACGI KBDHJ
My Internet serviceprovider/agency thatprovides my internetaccess
125 114 37 23 17 23 25 21 12 12 34 352% 2% 4% 3% 3% 5% 2% 2% 3% 3% 1% 1%K L AGK L K BHL K L K L
Other
687 421 162 96 42 28 178 110 18 14 287 17311% 8% 18% 12% 7% 6% 16% 11% 4% 4% 9% 6%
BEIK FJL DAEIK BFJL HAEIK BFJL LI
Not sure
8826 8322 1185 1097 861 785 1399 1308 619 602 4762 4530144% 153% 128% 133% 144% 155% 129% 136% 151% 159% 152% 163%
Sigma
_________________________________________________________________________________________________________________Proportions/Means: Columns Tested (5% risk level) - A/B - C/D - E/F - G/H - I/J - K/L - A/C/E/G/I/K - B/D/F/H/J/LOverlap formulae used.
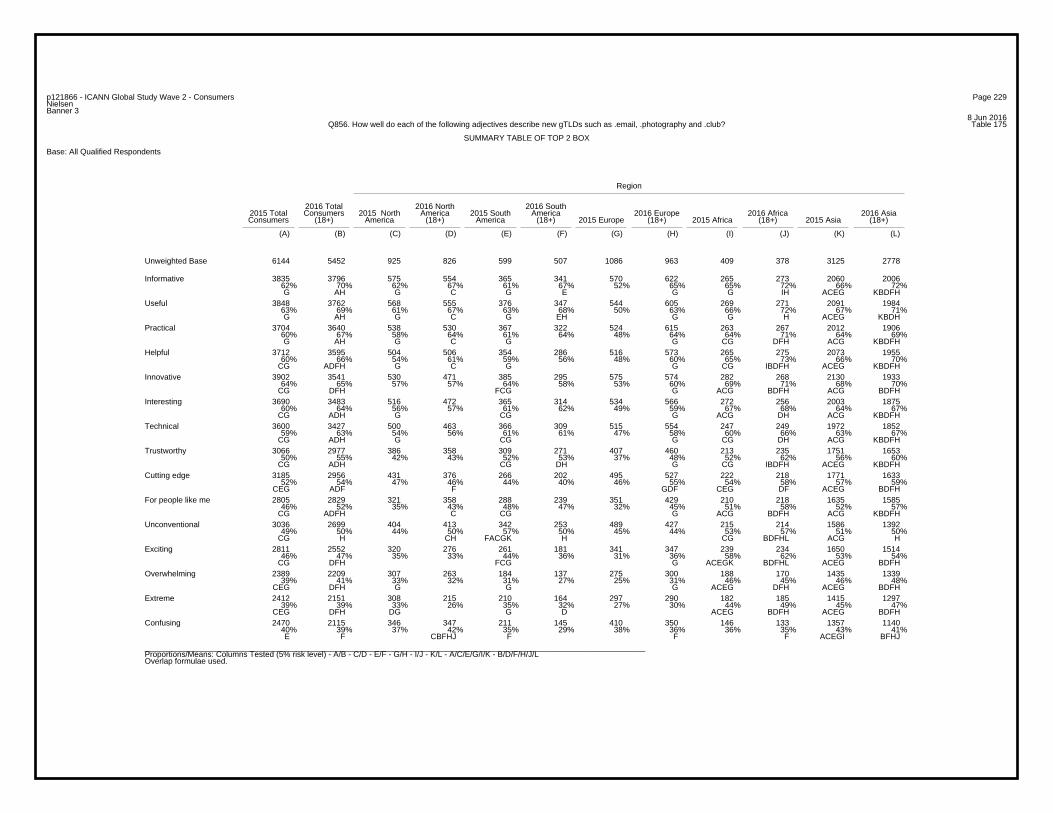
Page 229p121866 - ICANN Global Study Wave 2 - ConsumersNielsenBanner 3
8 Jun 2016Table 175Q856. How well do each of the following adjectives describe new gTLDs such as .email, .photography and .club?
SUMMARY TABLE OF TOP 2 BOX
Base: All Qualified Respondents
Region
2016 Total 2016 North 2016 South2015 Total Consumers 2015 North America 2015 South America 2016 Europe 2016 Africa 2016 AsiaConsumers (18+) America (18+) America (18+) 2015 Europe (18+) 2015 Africa (18+) 2015 Asia (18+)
(A) (B) (C) (D) (E) (F) (G) (H) (I) (J) (K) (L)
6144 5452 925 826 599 507 1086 963 409 378 3125 2778Unweighted Base
3835 3796 575 554 365 341 570 622 265 273 2060 200662% 70% 62% 67% 61% 67% 52% 65% 65% 72% 66% 72%G AH G C G E G G IH ACEG KBDFH
Informative
3848 3762 568 555 376 347 544 605 269 271 2091 198463% 69% 61% 67% 63% 68% 50% 63% 66% 72% 67% 71%G AH G C G EH G G H ACEG KBDH
Useful
3704 3640 538 530 367 322 524 615 263 267 2012 190660% 67% 58% 64% 61% 64% 48% 64% 64% 71% 64% 69%G AH G C G G CG DFH ACG KBDFH
Practical
3712 3595 504 506 354 286 516 573 265 275 2073 195560% 66% 54% 61% 59% 56% 48% 60% 65% 73% 66% 70%
CG ADFH G C G G CG IBDFH ACEG KBDFH
Helpful
3902 3541 530 471 385 295 575 574 282 268 2130 193364% 65% 57% 57% 64% 58% 53% 60% 69% 71% 68% 70%
CG DFH FCG G ACG BDFH ACG BDFH
Innovative
3690 3483 516 472 365 314 534 566 272 256 2003 187560% 64% 56% 57% 61% 62% 49% 59% 67% 68% 64% 67%
CG ADH G CG G ACG DH ACG KBDFH
Interesting
3600 3427 500 463 366 309 515 554 247 249 1972 185259% 63% 54% 56% 61% 61% 47% 58% 60% 66% 63% 67%
CG ADH G CG G CG DH ACG KBDFH
Technical
3066 2977 386 358 309 271 407 460 213 235 1751 165350% 55% 42% 43% 52% 53% 37% 48% 52% 62% 56% 60%
CG ADH CG DH G CG IBDFH ACEG KBDFH
Trustworthy
3185 2956 431 376 266 202 495 527 222 218 1771 163352% 54% 47% 46% 44% 40% 46% 55% 54% 58% 57% 59%
CEG ADF F GDF CEG DF ACEG BDFH
Cutting edge
2805 2829 321 358 288 239 351 429 210 218 1635 158546% 52% 35% 43% 48% 47% 32% 45% 51% 58% 52% 57%
CG ADFH C CG G ACG BDFH ACG KBDFH
For people like me
3036 2699 404 413 342 253 489 427 215 214 1586 139249% 50% 44% 50% 57% 50% 45% 44% 53% 57% 51% 50%
CG H CH FACGK H CG BDFHL ACG H
Unconventional
2811 2552 320 276 261 181 341 347 239 234 1650 151446% 47% 35% 33% 44% 36% 31% 36% 58% 62% 53% 54%
CG DFH FCG G ACEGK BDFHL ACEG BDFH
Exciting
2389 2209 307 263 184 137 275 300 188 170 1435 133939% 41% 33% 32% 31% 27% 25% 31% 46% 45% 46% 48%
CEG DFH G G G ACEG DFH ACEG BDFH
Overwhelming
2412 2151 308 215 210 164 297 290 182 185 1415 129739% 39% 33% 26% 35% 32% 27% 30% 44% 49% 45% 47%
CEG DFH DG G D ACEG BDFH ACEG BDFH
Extreme
2470 2115 346 347 211 145 410 350 146 133 1357 114040% 39% 37% 42% 35% 29% 38% 36% 36% 35% 43% 41%E F CBFHJ F F F ACEGI BFHJ
Confusing
_________________________________________________________________________________________________________________Proportions/Means: Columns Tested (5% risk level) - A/B - C/D - E/F - G/H - I/J - K/L - A/C/E/G/I/K - B/D/F/H/J/LOverlap formulae used.
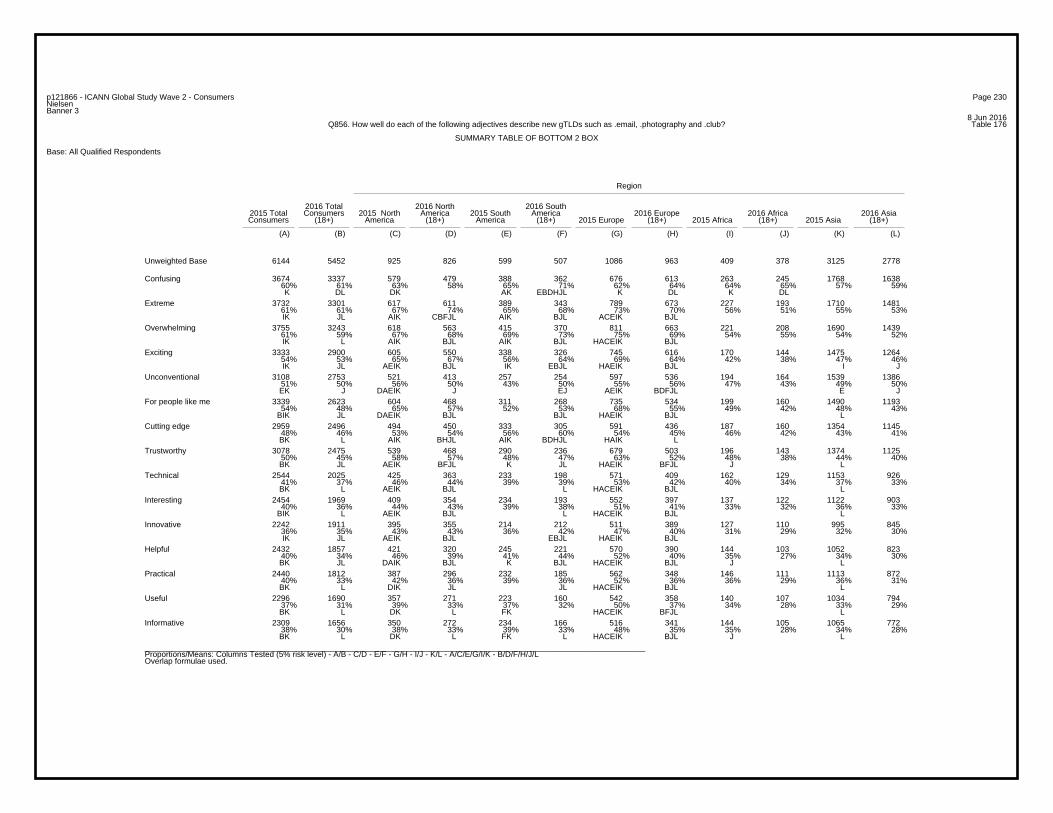
Page 230p121866 - ICANN Global Study Wave 2 - ConsumersNielsenBanner 3
8 Jun 2016Table 176Q856. How well do each of the following adjectives describe new gTLDs such as .email, .photography and .club?
SUMMARY TABLE OF BOTTOM 2 BOX
Base: All Qualified Respondents
Region
2016 Total 2016 North 2016 South2015 Total Consumers 2015 North America 2015 South America 2016 Europe 2016 Africa 2016 AsiaConsumers (18+) America (18+) America (18+) 2015 Europe (18+) 2015 Africa (18+) 2015 Asia (18+)
(A) (B) (C) (D) (E) (F) (G) (H) (I) (J) (K) (L)
6144 5452 925 826 599 507 1086 963 409 378 3125 2778Unweighted Base
3674 3337 579 479 388 362 676 613 263 245 1768 163860% 61% 63% 58% 65% 71% 62% 64% 64% 65% 57% 59%K DL DK AK EBDHJL K DL K DL
Confusing
3732 3301 617 611 389 343 789 673 227 193 1710 148161% 61% 67% 74% 65% 68% 73% 70% 56% 51% 55% 53%IK JL AIK CBFJL AIK BJL ACEIK BJL
Extreme
3755 3243 618 563 415 370 811 663 221 208 1690 143961% 59% 67% 68% 69% 73% 75% 69% 54% 55% 54% 52%IK L AIK BJL AIK BJL HACEIK BJL
Overwhelming
3333 2900 605 550 338 326 745 616 170 144 1475 126454% 53% 65% 67% 56% 64% 69% 64% 42% 38% 47% 46%IK JL AEIK BJL IK EBJL HAEIK BJL I J
Exciting
3108 2753 521 413 257 254 597 536 194 164 1539 138651% 50% 56% 50% 43% 50% 55% 56% 47% 43% 49% 50%EK J DAEIK J EJ AEIK BDFJL E J
Unconventional
3339 2623 604 468 311 268 735 534 199 160 1490 119354% 48% 65% 57% 52% 53% 68% 55% 49% 42% 48% 43%
BIK JL DAEIK BJL BJL HAEIK BJL L
For people like me
2959 2496 494 450 333 305 591 436 187 160 1354 114548% 46% 53% 54% 56% 60% 54% 45% 46% 42% 43% 41%BK L AIK BHJL AIK BDHJL HAIK L
Cutting edge
3078 2475 539 468 290 236 679 503 196 143 1374 112550% 45% 58% 57% 48% 47% 63% 52% 48% 38% 44% 40%BK JL AEIK BFJL K JL HAEIK BFJL J L
Trustworthy
2544 2025 425 363 233 198 571 409 162 129 1153 92641% 37% 46% 44% 39% 39% 53% 42% 40% 34% 37% 33%BK L AEIK BJL L HACEIK BJL L
Technical
2454 1969 409 354 234 193 552 397 137 122 1122 90340% 36% 44% 43% 39% 38% 51% 41% 33% 32% 36% 33%
BIK L AEIK BJL L HACEIK BJL L
Interesting
2242 1911 395 355 214 212 511 389 127 110 995 84536% 35% 43% 43% 36% 42% 47% 40% 31% 29% 32% 30%IK JL AEIK BJL EBJL HAEIK BJL
Innovative
2432 1857 421 320 245 221 570 390 144 103 1052 82340% 34% 46% 39% 41% 44% 52% 40% 35% 27% 34% 30%BK JL DAIK BJL K BJL HACEIK BJL J L
Helpful
2440 1812 387 296 232 185 562 348 146 111 1113 87240% 33% 42% 36% 39% 36% 52% 36% 36% 29% 36% 31%BK L DIK JL JL HACEIK BJL L
Practical
2296 1690 357 271 223 160 542 358 140 107 1034 79437% 31% 39% 33% 37% 32% 50% 37% 34% 28% 33% 29%BK L DK L FK HACEIK BFJL L
Useful
2309 1656 350 272 234 166 516 341 144 105 1065 77238% 30% 38% 33% 39% 33% 48% 35% 35% 28% 34% 28%BK L DK L FK L HACEIK BJL J L
Informative
_________________________________________________________________________________________________________________Proportions/Means: Columns Tested (5% risk level) - A/B - C/D - E/F - G/H - I/J - K/L - A/C/E/G/I/K - B/D/F/H/J/LOverlap formulae used.

Page 231p121866 - ICANN Global Study Wave 2 - ConsumersNielsenBanner 3
8 Jun 2016Table 177Q856_1. How well do each of the following adjectives describe new gTLDs such as .email, .photography and .club?
1. Innovative
Base: All Qualified Respondents
Region
2016 Total 2016 North 2016 South2015 Total Consumers 2015 North America 2015 South America 2016 Europe 2016 Africa 2016 AsiaConsumers (18+) America (18+) America (18+) 2015 Europe (18+) 2015 Africa (18+) 2015 Asia (18+)
(A) (B) (C) (D) (E) (F) (G) (H) (I) (J) (K) (L)
6144 5452 925 826 599 507 1086 963 409 378 3125 2778Unweighted Base
3902 3541 530 471 385 295 575 574 282 268 2130 193364% 65% 57% 57% 64% 58% 53% 60% 69% 71% 68% 70%
CG DFH FCG G ACG BDFH ACG BDFH
TOP 2 BOX (NET)
1019 998 87 95 121 101 80 89 113 103 618 61017% 18% 9% 12% 20% 20% 7% 9% 28% 27% 20% 22%
CG ADH ACG DH ACEGK BDFHL ACG KBDH
Describes very well
2883 2543 443 376 264 194 495 485 169 165 1512 132347% 47% 48% 46% 44% 38% 46% 50% 41% 44% 48% 48%
I F I F GBDFJ AI F
Describes somewhat well
2242 1911 395 355 214 212 511 389 127 110 995 84536% 35% 43% 43% 36% 42% 47% 40% 31% 29% 32% 30%IK JL AEIK BJL EBJL HAEIK BJL
BOTTOM 2 BOX (NET)
1505 1391 238 256 133 130 324 273 85 75 725 65724% 26% 26% 31% 22% 26% 30% 28% 21% 20% 23% 24%K JL CBFJL J ACEIK BJL
Does not describe very well
737 520 157 99 81 82 187 116 42 35 270 18812% 10% 17% 12% 14% 16% 17% 12% 10% 9% 9% 7%BK L DAIK BL K BDHJL HAEIK BL L
Does not describe at all
6144 5452 925 826 599 507 1086 963 409 378 3125 2778100% 100% 100% 100% 100% 100% 100% 100% 100% 100% 100% 100%
Sigma
_________________________________________________________________________________________________________________Proportions/Means: Columns Tested (5% risk level) - A/B - C/D - E/F - G/H - I/J - K/L - A/C/E/G/I/K - B/D/F/H/J/LOverlap formulae used.

Page 232p121866 - ICANN Global Study Wave 2 - ConsumersNielsenBanner 3
8 Jun 2016Table 178Q856_2. How well do each of the following adjectives describe new gTLDs such as .email, .photography and .club?
2. Cutting edge
Base: All Qualified Respondents
Region
2016 Total 2016 North 2016 South2015 Total Consumers 2015 North America 2015 South America 2016 Europe 2016 Africa 2016 AsiaConsumers (18+) America (18+) America (18+) 2015 Europe (18+) 2015 Africa (18+) 2015 Asia (18+)
(A) (B) (C) (D) (E) (F) (G) (H) (I) (J) (K) (L)
6144 5452 925 826 599 507 1086 963 409 378 3125 2778Unweighted Base
3185 2956 431 376 266 202 495 527 222 218 1771 163352% 54% 47% 46% 44% 40% 46% 55% 54% 58% 57% 59%
CEG ADF F GDF CEG DF ACEG BDFH
TOP 2 BOX (NET)
760 746 80 81 68 53 91 88 72 70 449 45412% 14% 9% 10% 11% 10% 8% 9% 18% 19% 14% 16%
CG ADFH G ACEG BDFH ACG KBDFH
Describes very well
2425 2210 351 295 198 149 404 439 150 148 1322 117939% 41% 38% 36% 33% 29% 37% 46% 37% 39% 42% 42%E DF F GBDFJ F ACEGI BDF
Describes somewhat well
2959 2496 494 450 333 305 591 436 187 160 1354 114548% 46% 53% 54% 56% 60% 54% 45% 46% 42% 43% 41%BK L AIK BHJL AIK BDHJL HAIK L
BOTTOM 2 BOX (NET)
2018 1769 297 295 201 163 363 299 125 109 1032 90333% 32% 32% 36% 34% 32% 33% 31% 31% 29% 33% 33%
BHJ
Does not describe very well
941 727 197 155 132 142 228 137 62 51 322 24215% 13% 21% 19% 22% 28% 21% 14% 15% 13% 10% 9%BK L AIK BHJL AIK EBDHJL HAIK L K L L
Does not describe at all
6144 5452 925 826 599 507 1086 963 409 378 3125 2778100% 100% 100% 100% 100% 100% 100% 100% 100% 100% 100% 100%
Sigma
_________________________________________________________________________________________________________________Proportions/Means: Columns Tested (5% risk level) - A/B - C/D - E/F - G/H - I/J - K/L - A/C/E/G/I/K - B/D/F/H/J/LOverlap formulae used.
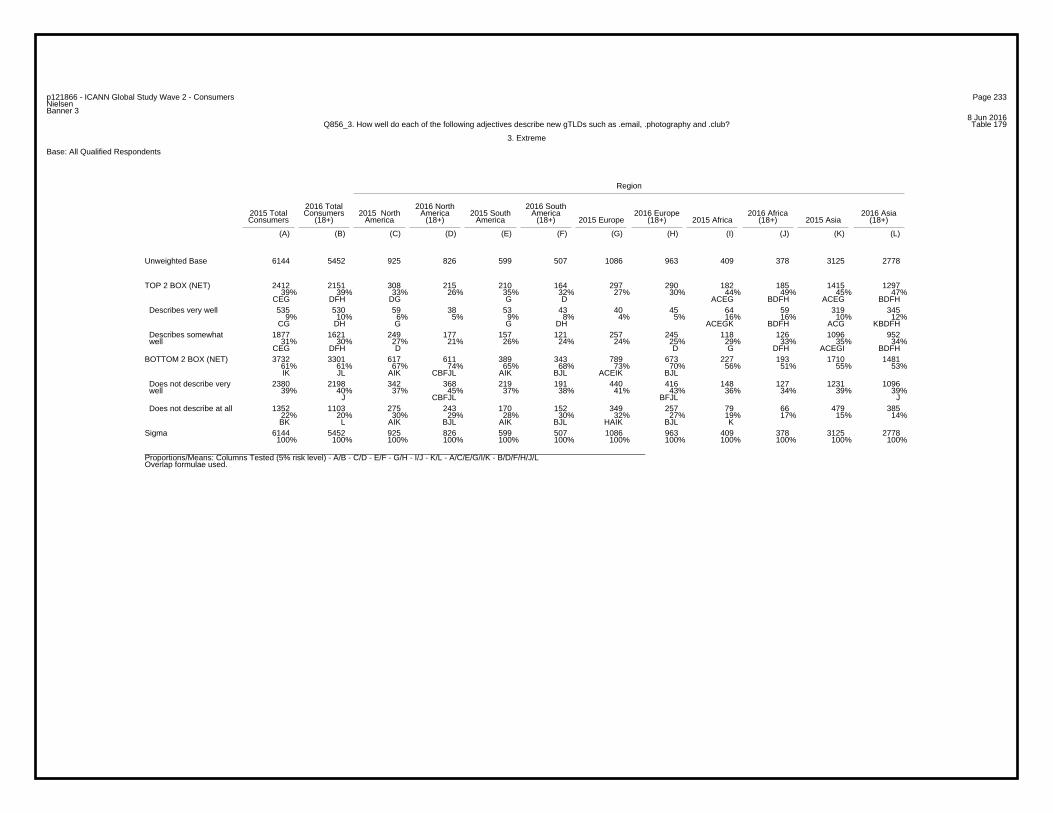
Page 233p121866 - ICANN Global Study Wave 2 - ConsumersNielsenBanner 3
8 Jun 2016Table 179Q856_3. How well do each of the following adjectives describe new gTLDs such as .email, .photography and .club?
3. Extreme
Base: All Qualified Respondents
Region
2016 Total 2016 North 2016 South2015 Total Consumers 2015 North America 2015 South America 2016 Europe 2016 Africa 2016 AsiaConsumers (18+) America (18+) America (18+) 2015 Europe (18+) 2015 Africa (18+) 2015 Asia (18+)
(A) (B) (C) (D) (E) (F) (G) (H) (I) (J) (K) (L)
6144 5452 925 826 599 507 1086 963 409 378 3125 2778Unweighted Base
2412 2151 308 215 210 164 297 290 182 185 1415 129739% 39% 33% 26% 35% 32% 27% 30% 44% 49% 45% 47%
CEG DFH DG G D ACEG BDFH ACEG BDFH
TOP 2 BOX (NET)
535 530 59 38 53 43 40 45 64 59 319 3459% 10% 6% 5% 9% 8% 4% 5% 16% 16% 10% 12%
CG DH G G DH ACEGK BDFH ACG KBDFH
Describes very well
1877 1621 249 177 157 121 257 245 118 126 1096 95231% 30% 27% 21% 26% 24% 24% 25% 29% 33% 35% 34%
CEG DFH D D G DFH ACEGI BDFH
Describes somewhat well
3732 3301 617 611 389 343 789 673 227 193 1710 148161% 61% 67% 74% 65% 68% 73% 70% 56% 51% 55% 53%IK JL AIK CBFJL AIK BJL ACEIK BJL
BOTTOM 2 BOX (NET)
2380 2198 342 368 219 191 440 416 148 127 1231 109639% 40% 37% 45% 37% 38% 41% 43% 36% 34% 39% 39%
J CBFJL BFJL J
Does not describe very well
1352 1103 275 243 170 152 349 257 79 66 479 38522% 20% 30% 29% 28% 30% 32% 27% 19% 17% 15% 14%BK L AIK BJL AIK BJL HAIK BJL K
Does not describe at all
6144 5452 925 826 599 507 1086 963 409 378 3125 2778100% 100% 100% 100% 100% 100% 100% 100% 100% 100% 100% 100%
Sigma
_________________________________________________________________________________________________________________Proportions/Means: Columns Tested (5% risk level) - A/B - C/D - E/F - G/H - I/J - K/L - A/C/E/G/I/K - B/D/F/H/J/LOverlap formulae used.

Page 234p121866 - ICANN Global Study Wave 2 - ConsumersNielsenBanner 3
8 Jun 2016Table 180Q856_4. How well do each of the following adjectives describe new gTLDs such as .email, .photography and .club?
4. Trustworthy
Base: All Qualified Respondents
Region
2016 Total 2016 North 2016 South2015 Total Consumers 2015 North America 2015 South America 2016 Europe 2016 Africa 2016 AsiaConsumers (18+) America (18+) America (18+) 2015 Europe (18+) 2015 Africa (18+) 2015 Asia (18+)
(A) (B) (C) (D) (E) (F) (G) (H) (I) (J) (K) (L)
6144 5452 925 826 599 507 1086 963 409 378 3125 2778Unweighted Base
3066 2977 386 358 309 271 407 460 213 235 1751 165350% 55% 42% 43% 52% 53% 37% 48% 52% 62% 56% 60%
CG ADH CG DH G CG IBDFH ACEG KBDFH
TOP 2 BOX (NET)
694 791 49 73 86 88 48 70 72 70 439 49011% 15% 5% 9% 14% 17% 4% 7% 18% 19% 14% 18%
CG ADH C ACG DH G ACG BDH ACG KBDH
Describes very well
2372 2186 337 285 223 183 359 390 141 165 1312 116339% 40% 36% 35% 37% 36% 33% 40% 34% 44% 42% 42%G D GD IDF ACEGI BDF
Describes somewhat well
3078 2475 539 468 290 236 679 503 196 143 1374 112550% 45% 58% 57% 48% 47% 63% 52% 48% 38% 44% 40%BK JL AEIK BFJL K JL HAEIK BFJL J L
BOTTOM 2 BOX (NET)
2142 1890 343 334 190 151 436 375 130 107 1043 92335% 35% 37% 40% 32% 30% 40% 39% 32% 28% 33% 33%K FJL EK BFJL AEIK BFJL
Does not describe very well
936 585 196 134 100 85 243 128 66 36 331 20215% 11% 21% 16% 17% 17% 22% 13% 16% 10% 11% 7%BK L DAEIK BJL K BJL HAEIK BL JK L
Does not describe at all
6144 5452 925 826 599 507 1086 963 409 378 3125 2778100% 100% 100% 100% 100% 100% 100% 100% 100% 100% 100% 100%
Sigma
_________________________________________________________________________________________________________________Proportions/Means: Columns Tested (5% risk level) - A/B - C/D - E/F - G/H - I/J - K/L - A/C/E/G/I/K - B/D/F/H/J/LOverlap formulae used.
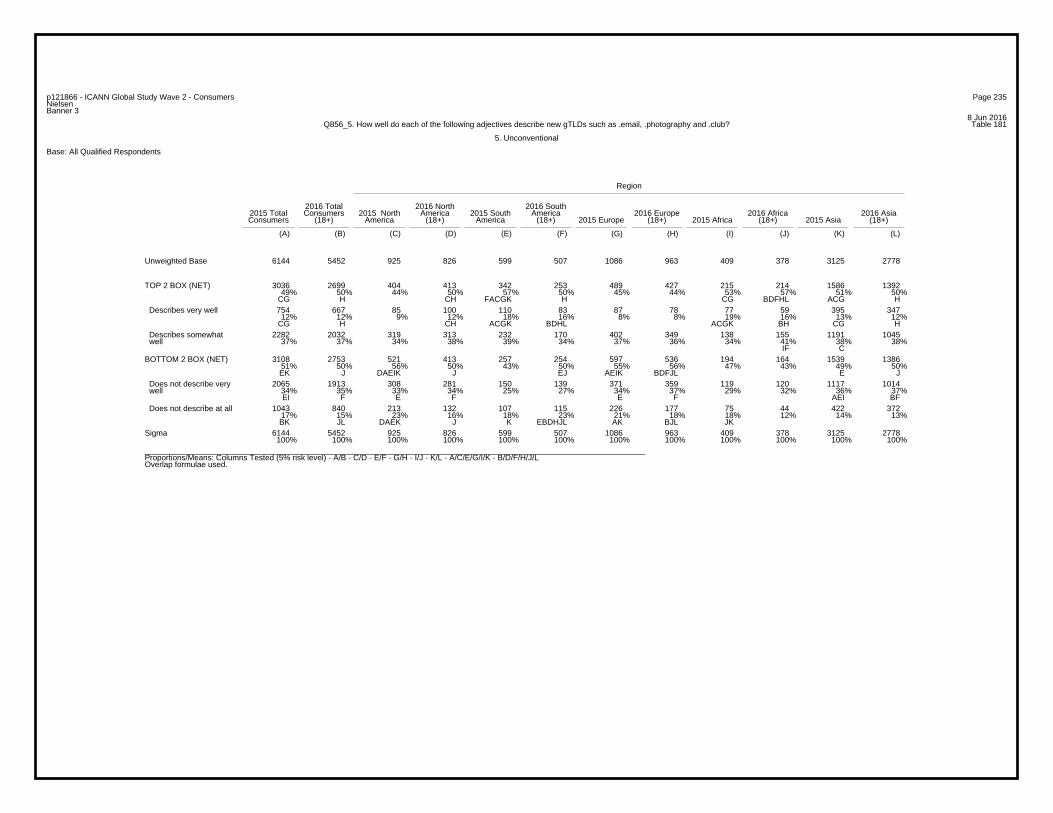
Page 235p121866 - ICANN Global Study Wave 2 - ConsumersNielsenBanner 3
8 Jun 2016Table 181Q856_5. How well do each of the following adjectives describe new gTLDs such as .email, .photography and .club?
5. Unconventional
Base: All Qualified Respondents
Region
2016 Total 2016 North 2016 South2015 Total Consumers 2015 North America 2015 South America 2016 Europe 2016 Africa 2016 AsiaConsumers (18+) America (18+) America (18+) 2015 Europe (18+) 2015 Africa (18+) 2015 Asia (18+)
(A) (B) (C) (D) (E) (F) (G) (H) (I) (J) (K) (L)
6144 5452 925 826 599 507 1086 963 409 378 3125 2778Unweighted Base
3036 2699 404 413 342 253 489 427 215 214 1586 139249% 50% 44% 50% 57% 50% 45% 44% 53% 57% 51% 50%
CG H CH FACGK H CG BDFHL ACG H
TOP 2 BOX (NET)
754 667 85 100 110 83 87 78 77 59 395 34712% 12% 9% 12% 18% 16% 8% 8% 19% 16% 13% 12%
CG H CH ACGK BDHL ACGK BH CG H
Describes very well
2282 2032 319 313 232 170 402 349 138 155 1191 104537% 37% 34% 38% 39% 34% 37% 36% 34% 41% 38% 38%
IF C
Describes somewhat well
3108 2753 521 413 257 254 597 536 194 164 1539 138651% 50% 56% 50% 43% 50% 55% 56% 47% 43% 49% 50%EK J DAEIK J EJ AEIK BDFJL E J
BOTTOM 2 BOX (NET)
2065 1913 308 281 150 139 371 359 119 120 1117 101434% 35% 33% 34% 25% 27% 34% 37% 29% 32% 36% 37%EI F E F E F AEI BF
Does not describe very well
1043 840 213 132 107 115 226 177 75 44 422 37217% 15% 23% 16% 18% 23% 21% 18% 18% 12% 14% 13%BK JL DAEK J K EBDHJL AK BJL JK
Does not describe at all
6144 5452 925 826 599 507 1086 963 409 378 3125 2778100% 100% 100% 100% 100% 100% 100% 100% 100% 100% 100% 100%
Sigma
_________________________________________________________________________________________________________________Proportions/Means: Columns Tested (5% risk level) - A/B - C/D - E/F - G/H - I/J - K/L - A/C/E/G/I/K - B/D/F/H/J/LOverlap formulae used.
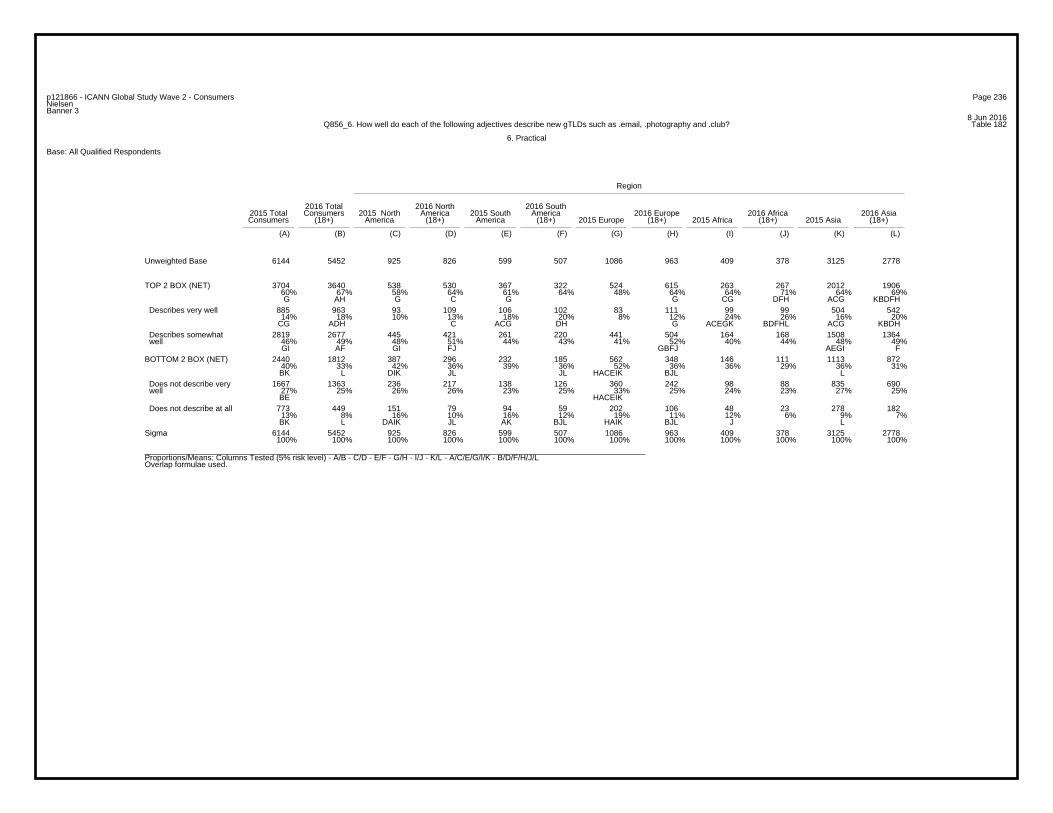
Page 236p121866 - ICANN Global Study Wave 2 - ConsumersNielsenBanner 3
8 Jun 2016Table 182Q856_6. How well do each of the following adjectives describe new gTLDs such as .email, .photography and .club?
6. Practical
Base: All Qualified Respondents
Region
2016 Total 2016 North 2016 South2015 Total Consumers 2015 North America 2015 South America 2016 Europe 2016 Africa 2016 AsiaConsumers (18+) America (18+) America (18+) 2015 Europe (18+) 2015 Africa (18+) 2015 Asia (18+)
(A) (B) (C) (D) (E) (F) (G) (H) (I) (J) (K) (L)
6144 5452 925 826 599 507 1086 963 409 378 3125 2778Unweighted Base
3704 3640 538 530 367 322 524 615 263 267 2012 190660% 67% 58% 64% 61% 64% 48% 64% 64% 71% 64% 69%G AH G C G G CG DFH ACG KBDFH
TOP 2 BOX (NET)
885 963 93 109 106 102 83 111 99 99 504 54214% 18% 10% 13% 18% 20% 8% 12% 24% 26% 16% 20%
CG ADH C ACG DH G ACEGK BDFHL ACG KBDH
Describes very well
2819 2677 445 421 261 220 441 504 164 168 1508 136446% 49% 48% 51% 44% 43% 41% 52% 40% 44% 48% 49%GI AF GI FJ GBFJ AEGI F
Describes somewhat well
2440 1812 387 296 232 185 562 348 146 111 1113 87240% 33% 42% 36% 39% 36% 52% 36% 36% 29% 36% 31%BK L DIK JL JL HACEIK BJL L
BOTTOM 2 BOX (NET)
1667 1363 236 217 138 126 360 242 98 88 835 69027% 25% 26% 26% 23% 25% 33% 25% 24% 23% 27% 25%BE HACEIK
Does not describe very well
773 449 151 79 94 59 202 106 48 23 278 18213% 8% 16% 10% 16% 12% 19% 11% 12% 6% 9% 7%BK L DAIK JL AK BJL HAIK BJL J L
Does not describe at all
6144 5452 925 826 599 507 1086 963 409 378 3125 2778100% 100% 100% 100% 100% 100% 100% 100% 100% 100% 100% 100%
Sigma
_________________________________________________________________________________________________________________Proportions/Means: Columns Tested (5% risk level) - A/B - C/D - E/F - G/H - I/J - K/L - A/C/E/G/I/K - B/D/F/H/J/LOverlap formulae used.

Page 237p121866 - ICANN Global Study Wave 2 - ConsumersNielsenBanner 3
8 Jun 2016Table 183Q856_7. How well do each of the following adjectives describe new gTLDs such as .email, .photography and .club?
7. Technical
Base: All Qualified Respondents
Region
2016 Total 2016 North 2016 South2015 Total Consumers 2015 North America 2015 South America 2016 Europe 2016 Africa 2016 AsiaConsumers (18+) America (18+) America (18+) 2015 Europe (18+) 2015 Africa (18+) 2015 Asia (18+)
(A) (B) (C) (D) (E) (F) (G) (H) (I) (J) (K) (L)
6144 5452 925 826 599 507 1086 963 409 378 3125 2778Unweighted Base
3600 3427 500 463 366 309 515 554 247 249 1972 185259% 63% 54% 56% 61% 61% 47% 58% 60% 66% 63% 67%
CG ADH G CG G CG DH ACG KBDFH
TOP 2 BOX (NET)
891 917 100 106 100 114 83 89 84 76 524 53215% 17% 11% 13% 17% 22% 8% 9% 21% 20% 17% 19%
CG ADH G H CG EBDH ACG DH ACG KBDH
Describes very well
2709 2510 400 357 266 195 432 465 163 173 1448 132044% 46% 43% 43% 44% 38% 40% 48% 40% 46% 46% 48%G AF F GDF F AGI BDF
Describes somewhat well
2544 2025 425 363 233 198 571 409 162 129 1153 92641% 37% 46% 44% 39% 39% 53% 42% 40% 34% 37% 33%BK L AEIK BJL L HACEIK BJL L
BOTTOM 2 BOX (NET)
1773 1516 269 250 144 124 376 287 112 98 872 75729% 28% 29% 30% 24% 24% 35% 30% 27% 26% 28% 27%E E F HACEIK F
Does not describe very well
771 509 156 113 89 74 195 122 50 31 281 16913% 9% 17% 14% 15% 15% 18% 13% 12% 8% 9% 6%BK L AIK BJL K BJL HAIK BJL K L
Does not describe at all
6144 5452 925 826 599 507 1086 963 409 378 3125 2778100% 100% 100% 100% 100% 100% 100% 100% 100% 100% 100% 100%
Sigma
_________________________________________________________________________________________________________________Proportions/Means: Columns Tested (5% risk level) - A/B - C/D - E/F - G/H - I/J - K/L - A/C/E/G/I/K - B/D/F/H/J/LOverlap formulae used.
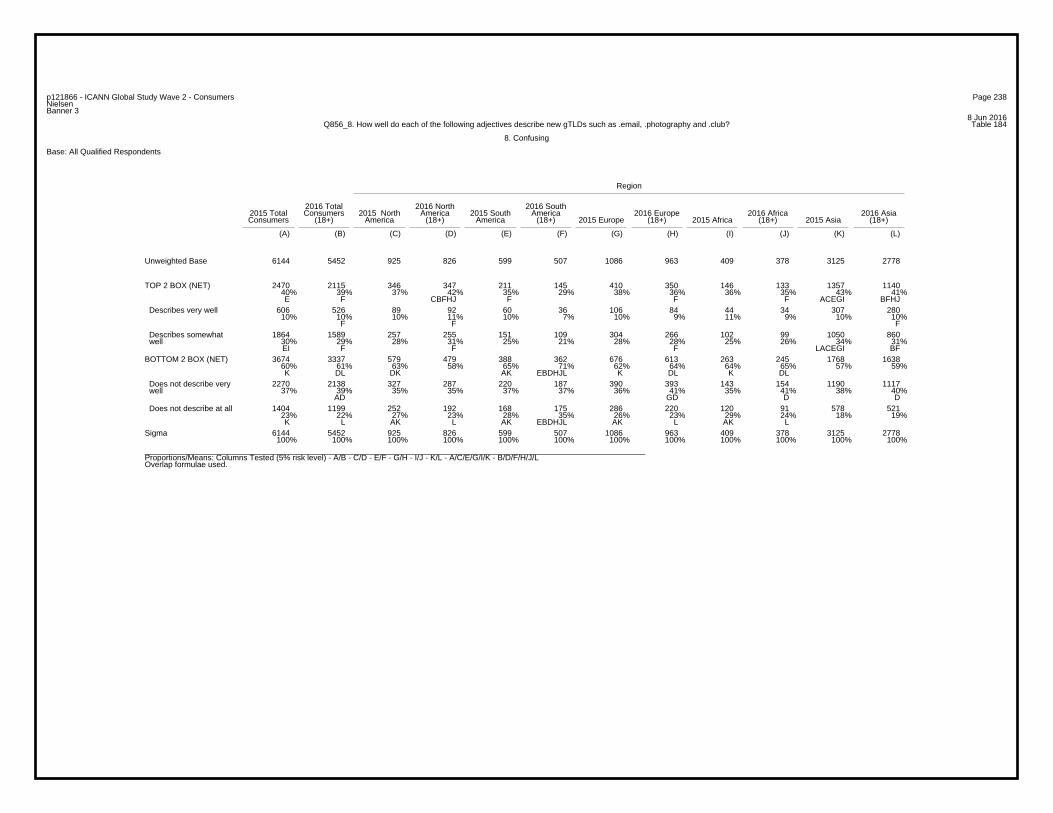
Page 238p121866 - ICANN Global Study Wave 2 - ConsumersNielsenBanner 3
8 Jun 2016Table 184Q856_8. How well do each of the following adjectives describe new gTLDs such as .email, .photography and .club?
8. Confusing
Base: All Qualified Respondents
Region
2016 Total 2016 North 2016 South2015 Total Consumers 2015 North America 2015 South America 2016 Europe 2016 Africa 2016 AsiaConsumers (18+) America (18+) America (18+) 2015 Europe (18+) 2015 Africa (18+) 2015 Asia (18+)
(A) (B) (C) (D) (E) (F) (G) (H) (I) (J) (K) (L)
6144 5452 925 826 599 507 1086 963 409 378 3125 2778Unweighted Base
2470 2115 346 347 211 145 410 350 146 133 1357 114040% 39% 37% 42% 35% 29% 38% 36% 36% 35% 43% 41%E F CBFHJ F F F ACEGI BFHJ
TOP 2 BOX (NET)
606 526 89 92 60 36 106 84 44 34 307 28010% 10% 10% 11% 10% 7% 10% 9% 11% 9% 10% 10%
F F F
Describes very well
1864 1589 257 255 151 109 304 266 102 99 1050 86030% 29% 28% 31% 25% 21% 28% 28% 25% 26% 34% 31%EI F F F LACEGI BF
Describes somewhat well
3674 3337 579 479 388 362 676 613 263 245 1768 163860% 61% 63% 58% 65% 71% 62% 64% 64% 65% 57% 59%K DL DK AK EBDHJL K DL K DL
BOTTOM 2 BOX (NET)
2270 2138 327 287 220 187 390 393 143 154 1190 111737% 39% 35% 35% 37% 37% 36% 41% 35% 41% 38% 40%
AD GD D D
Does not describe very well
1404 1199 252 192 168 175 286 220 120 91 578 52123% 22% 27% 23% 28% 35% 26% 23% 29% 24% 18% 19%K L AK L AK EBDHJL AK L AK L
Does not describe at all
6144 5452 925 826 599 507 1086 963 409 378 3125 2778100% 100% 100% 100% 100% 100% 100% 100% 100% 100% 100% 100%
Sigma
_________________________________________________________________________________________________________________Proportions/Means: Columns Tested (5% risk level) - A/B - C/D - E/F - G/H - I/J - K/L - A/C/E/G/I/K - B/D/F/H/J/LOverlap formulae used.

Page 239p121866 - ICANN Global Study Wave 2 - ConsumersNielsenBanner 3
8 Jun 2016Table 185Q856_9. How well do each of the following adjectives describe new gTLDs such as .email, .photography and .club?
9. Overwhelming
Base: All Qualified Respondents
Region
2016 Total 2016 North 2016 South2015 Total Consumers 2015 North America 2015 South America 2016 Europe 2016 Africa 2016 AsiaConsumers (18+) America (18+) America (18+) 2015 Europe (18+) 2015 Africa (18+) 2015 Asia (18+)
(A) (B) (C) (D) (E) (F) (G) (H) (I) (J) (K) (L)
6144 5452 925 826 599 507 1086 963 409 378 3125 2778Unweighted Base
2389 2209 307 263 184 137 275 300 188 170 1435 133939% 41% 33% 32% 31% 27% 25% 31% 46% 45% 46% 48%
CEG DFH G G G ACEG DFH ACEG BDFH
TOP 2 BOX (NET)
559 558 64 58 42 30 55 65 60 52 338 3539% 10% 7% 7% 7% 6% 5% 7% 15% 14% 11% 13%
CG ADFH ACEGK BDFH ACEG KBDFH
Describes very well
1830 1651 243 205 142 107 220 235 128 118 1097 98630% 30% 26% 25% 24% 21% 20% 24% 31% 31% 35% 35%
CEG DFH G G EG DFH ACEG BDFH
Describes somewhat well
3755 3243 618 563 415 370 811 663 221 208 1690 143961% 59% 67% 68% 69% 73% 75% 69% 54% 55% 54% 52%IK L AIK BJL AIK BJL HACEIK BJL
BOTTOM 2 BOX (NET)
2324 2087 338 329 210 197 426 374 140 136 1210 105138% 38% 37% 40% 35% 39% 39% 39% 34% 36% 39% 38%
Does not describe very well
1431 1156 280 234 205 173 385 289 81 72 480 38823% 21% 30% 28% 34% 34% 35% 30% 20% 19% 15% 14%BK L AIK BJL AIK BDJL HACIK BJL K L
Does not describe at all
6144 5452 925 826 599 507 1086 963 409 378 3125 2778100% 100% 100% 100% 100% 100% 100% 100% 100% 100% 100% 100%
Sigma
_________________________________________________________________________________________________________________Proportions/Means: Columns Tested (5% risk level) - A/B - C/D - E/F - G/H - I/J - K/L - A/C/E/G/I/K - B/D/F/H/J/LOverlap formulae used.
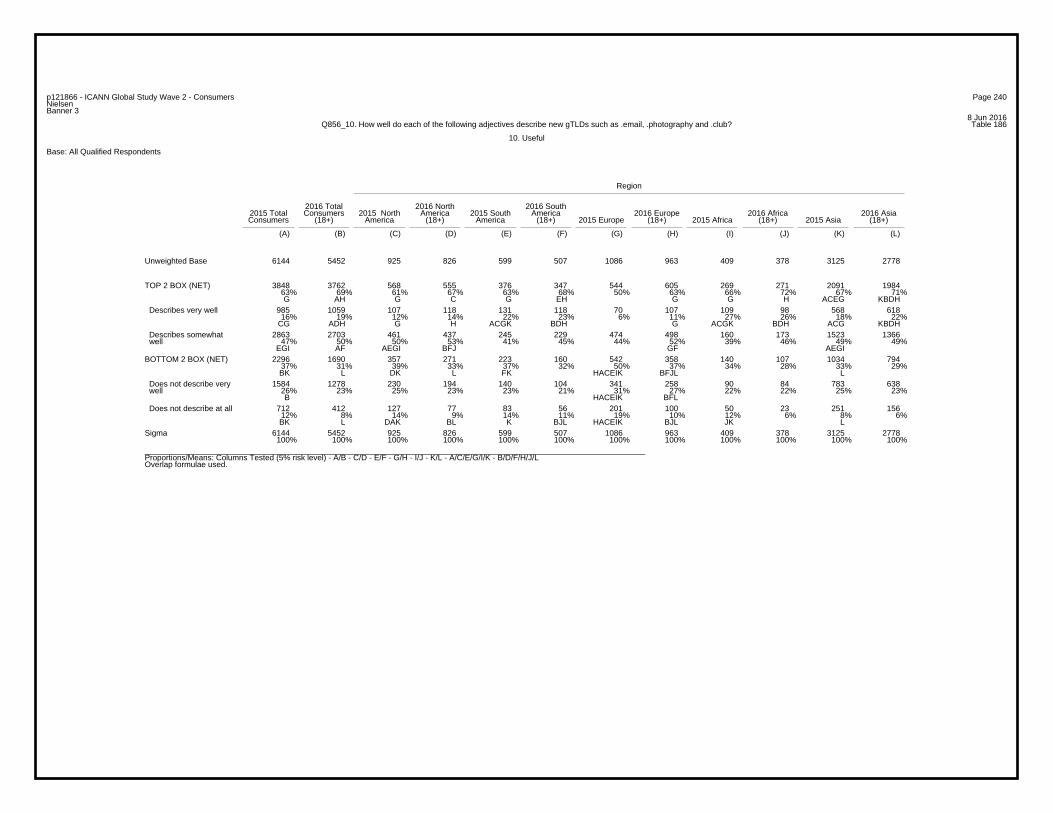
Page 240p121866 - ICANN Global Study Wave 2 - ConsumersNielsenBanner 3
8 Jun 2016Table 186Q856_10. How well do each of the following adjectives describe new gTLDs such as .email, .photography and .club?
10. Useful
Base: All Qualified Respondents
Region
2016 Total 2016 North 2016 South2015 Total Consumers 2015 North America 2015 South America 2016 Europe 2016 Africa 2016 AsiaConsumers (18+) America (18+) America (18+) 2015 Europe (18+) 2015 Africa (18+) 2015 Asia (18+)
(A) (B) (C) (D) (E) (F) (G) (H) (I) (J) (K) (L)
6144 5452 925 826 599 507 1086 963 409 378 3125 2778Unweighted Base
3848 3762 568 555 376 347 544 605 269 271 2091 198463% 69% 61% 67% 63% 68% 50% 63% 66% 72% 67% 71%G AH G C G EH G G H ACEG KBDH
TOP 2 BOX (NET)
985 1059 107 118 131 118 70 107 109 98 568 61816% 19% 12% 14% 22% 23% 6% 11% 27% 26% 18% 22%
CG ADH G H ACGK BDH G ACGK BDH ACG KBDH
Describes very well
2863 2703 461 437 245 229 474 498 160 173 1523 136647% 50% 50% 53% 41% 45% 44% 52% 39% 46% 49% 49%
EGI AF AEGI BFJ GF AEGI
Describes somewhat well
2296 1690 357 271 223 160 542 358 140 107 1034 79437% 31% 39% 33% 37% 32% 50% 37% 34% 28% 33% 29%BK L DK L FK HACEIK BFJL L
BOTTOM 2 BOX (NET)
1584 1278 230 194 140 104 341 258 90 84 783 63826% 23% 25% 23% 23% 21% 31% 27% 22% 22% 25% 23%B HACEIK BFL
Does not describe very well
712 412 127 77 83 56 201 100 50 23 251 15612% 8% 14% 9% 14% 11% 19% 10% 12% 6% 8% 6%BK L DAK BL K BJL HACEIK BJL JK L
Does not describe at all
6144 5452 925 826 599 507 1086 963 409 378 3125 2778100% 100% 100% 100% 100% 100% 100% 100% 100% 100% 100% 100%
Sigma
_________________________________________________________________________________________________________________Proportions/Means: Columns Tested (5% risk level) - A/B - C/D - E/F - G/H - I/J - K/L - A/C/E/G/I/K - B/D/F/H/J/LOverlap formulae used.

Page 241p121866 - ICANN Global Study Wave 2 - ConsumersNielsenBanner 3
8 Jun 2016Table 187Q856_11. How well do each of the following adjectives describe new gTLDs such as .email, .photography and .club?
11. For people like me
Base: All Qualified Respondents
Region
2016 Total 2016 North 2016 South2015 Total Consumers 2015 North America 2015 South America 2016 Europe 2016 Africa 2016 AsiaConsumers (18+) America (18+) America (18+) 2015 Europe (18+) 2015 Africa (18+) 2015 Asia (18+)
(A) (B) (C) (D) (E) (F) (G) (H) (I) (J) (K) (L)
6144 5452 925 826 599 507 1086 963 409 378 3125 2778Unweighted Base
2805 2829 321 358 288 239 351 429 210 218 1635 158546% 52% 35% 43% 48% 47% 32% 45% 51% 58% 52% 57%
CG ADFH C CG G ACG BDFH ACG KBDFH
TOP 2 BOX (NET)
674 749 49 70 73 86 48 71 81 83 423 43911% 14% 5% 8% 12% 17% 4% 7% 20% 22% 14% 16%
CG ADH C CG EBDH G ACEGK BDHL ACG KBDH
Describes very well
2131 2080 272 288 215 153 303 358 129 135 1212 114635% 38% 29% 35% 36% 30% 28% 37% 32% 36% 39% 41%
CG ADF C FCG GF ACGI BDFHJ
Describes somewhat well
3339 2623 604 468 311 268 735 534 199 160 1490 119354% 48% 65% 57% 52% 53% 68% 55% 49% 42% 48% 43%
BIK JL DAEIK BJL BJL HAEIK BJL L
BOTTOM 2 BOX (NET)
2130 1832 360 310 172 159 420 349 122 109 1056 90535% 34% 39% 38% 29% 31% 39% 36% 30% 29% 34% 33%EI J AEIK BFJL AEIK JL E
Does not describe very well
1209 791 244 158 139 109 315 185 77 51 434 28820% 15% 26% 19% 23% 21% 29% 19% 19% 13% 14% 10%BK L DAIK BJL AK BJL HAEIK BJL JK L
Does not describe at all
6144 5452 925 826 599 507 1086 963 409 378 3125 2778100% 100% 100% 100% 100% 100% 100% 100% 100% 100% 100% 100%
Sigma
_________________________________________________________________________________________________________________Proportions/Means: Columns Tested (5% risk level) - A/B - C/D - E/F - G/H - I/J - K/L - A/C/E/G/I/K - B/D/F/H/J/LOverlap formulae used.

Page 242p121866 - ICANN Global Study Wave 2 - ConsumersNielsenBanner 3
8 Jun 2016Table 188Q856_12. How well do each of the following adjectives describe new gTLDs such as .email, .photography and .club?
12. Interesting
Base: All Qualified Respondents
Region
2016 Total 2016 North 2016 South2015 Total Consumers 2015 North America 2015 South America 2016 Europe 2016 Africa 2016 AsiaConsumers (18+) America (18+) America (18+) 2015 Europe (18+) 2015 Africa (18+) 2015 Asia (18+)
(A) (B) (C) (D) (E) (F) (G) (H) (I) (J) (K) (L)
6144 5452 925 826 599 507 1086 963 409 378 3125 2778Unweighted Base
3690 3483 516 472 365 314 534 566 272 256 2003 187560% 64% 56% 57% 61% 62% 49% 59% 67% 68% 64% 67%
CG ADH G CG G ACG DH ACG KBDFH
TOP 2 BOX (NET)
884 922 79 79 103 95 68 91 105 98 529 55914% 17% 9% 10% 17% 19% 6% 9% 26% 26% 17% 20%
CG ADH ACG DH G ACEGK BDFHL ACG KBDH
Describes very well
2806 2561 437 393 262 219 466 475 167 158 1474 131646% 47% 47% 48% 44% 43% 43% 49% 41% 42% 47% 47%GI J I GFJ AGI J
Describes somewhat well
2454 1969 409 354 234 193 552 397 137 122 1122 90340% 36% 44% 43% 39% 38% 51% 41% 33% 32% 36% 33%
BIK L AEIK BJL L HACEIK BJL L
BOTTOM 2 BOX (NET)
1670 1444 243 248 151 124 341 275 90 87 845 71027% 26% 26% 30% 25% 24% 31% 29% 22% 23% 27% 26%
I BFJL ACEIK J I
Does not describe very well
784 525 166 106 83 69 211 122 47 35 277 19313% 10% 18% 13% 14% 14% 19% 13% 11% 9% 9% 7%BK L DAEIK BL K BJL HAEIK BL L
Does not describe at all
6144 5452 925 826 599 507 1086 963 409 378 3125 2778100% 100% 100% 100% 100% 100% 100% 100% 100% 100% 100% 100%
Sigma
_________________________________________________________________________________________________________________Proportions/Means: Columns Tested (5% risk level) - A/B - C/D - E/F - G/H - I/J - K/L - A/C/E/G/I/K - B/D/F/H/J/LOverlap formulae used.

Page 243p121866 - ICANN Global Study Wave 2 - ConsumersNielsenBanner 3
8 Jun 2016Table 189Q856_13. How well do each of the following adjectives describe new gTLDs such as .email, .photography and .club?
13. Exciting
Base: All Qualified Respondents
Region
2016 Total 2016 North 2016 South2015 Total Consumers 2015 North America 2015 South America 2016 Europe 2016 Africa 2016 AsiaConsumers (18+) America (18+) America (18+) 2015 Europe (18+) 2015 Africa (18+) 2015 Asia (18+)
(A) (B) (C) (D) (E) (F) (G) (H) (I) (J) (K) (L)
6144 5452 925 826 599 507 1086 963 409 378 3125 2778Unweighted Base
2811 2552 320 276 261 181 341 347 239 234 1650 151446% 47% 35% 33% 44% 36% 31% 36% 58% 62% 53% 54%
CG DFH FCG G ACEGK BDFHL ACEG BDFH
TOP 2 BOX (NET)
677 660 45 50 74 54 47 54 85 73 426 42911% 12% 5% 6% 12% 11% 4% 6% 21% 19% 14% 15%
CG DH CG DH ACEGK BDFH ACG KBDFH
Describes very well
2134 1892 275 226 187 127 294 293 154 161 1224 108535% 35% 30% 27% 31% 25% 27% 30% 38% 43% 39% 39%
CG DFH F F CEG BDFH ACEG BDFH
Describes somewhat well
3333 2900 605 550 338 326 745 616 170 144 1475 126454% 53% 65% 67% 56% 64% 69% 64% 42% 38% 47% 46%IK JL AEIK BJL IK EBJL HAEIK BJL I J
BOTTOM 2 BOX (NET)
2146 1977 343 355 204 187 435 382 110 107 1054 94635% 36% 37% 43% 34% 37% 40% 40% 27% 28% 34% 34%IK JL I CBFJL I J AEIK BJL I J
Does not describe very well
1187 923 262 195 134 139 310 234 60 37 421 31819% 17% 28% 24% 22% 27% 29% 24% 15% 10% 13% 11%
BIK JL DAEIK BJL AIK BJL HAEIK BJL J L
Does not describe at all
6144 5452 925 826 599 507 1086 963 409 378 3125 2778100% 100% 100% 100% 100% 100% 100% 100% 100% 100% 100% 100%
Sigma
_________________________________________________________________________________________________________________Proportions/Means: Columns Tested (5% risk level) - A/B - C/D - E/F - G/H - I/J - K/L - A/C/E/G/I/K - B/D/F/H/J/LOverlap formulae used.

Page 244p121866 - ICANN Global Study Wave 2 - ConsumersNielsenBanner 3
8 Jun 2016Table 190Q856_14. How well do each of the following adjectives describe new gTLDs such as .email, .photography and .club?
14. Helpful
Base: All Qualified Respondents
Region
2016 Total 2016 North 2016 South2015 Total Consumers 2015 North America 2015 South America 2016 Europe 2016 Africa 2016 AsiaConsumers (18+) America (18+) America (18+) 2015 Europe (18+) 2015 Africa (18+) 2015 Asia (18+)
(A) (B) (C) (D) (E) (F) (G) (H) (I) (J) (K) (L)
6144 5452 925 826 599 507 1086 963 409 378 3125 2778Unweighted Base
3712 3595 504 506 354 286 516 573 265 275 2073 195560% 66% 54% 61% 59% 56% 48% 60% 65% 73% 66% 70%
CG ADFH G C G G CG IBDFH ACEG KBDFH
TOP 2 BOX (NET)
914 982 85 100 116 82 67 97 104 95 542 60815% 18% 9% 12% 19% 16% 6% 10% 25% 25% 17% 22%
CG ADH G C ACG DH G ACEGK BDFH ACG KBDFH
Describes very well
2798 2613 419 406 238 204 449 476 161 180 1531 134746% 48% 45% 49% 40% 40% 41% 49% 39% 48% 49% 48%
EGI AF EI F GF IF ACEGI F
Describes somewhat well
2432 1857 421 320 245 221 570 390 144 103 1052 82340% 34% 46% 39% 41% 44% 52% 40% 35% 27% 34% 30%BK JL DAIK BJL K BJL HACEIK BJL J L
BOTTOM 2 BOX (NET)
1645 1387 271 228 157 138 350 279 92 81 775 66127% 25% 29% 28% 26% 27% 32% 29% 22% 21% 25% 24%IK L IK JL J AEIK BJL
Does not describe very well
787 470 150 92 88 83 220 111 52 22 277 16213% 9% 16% 11% 15% 16% 20% 12% 13% 6% 9% 6%BK JL DAK BJL K BDHJL HACEIK BJL JK L
Does not describe at all
6144 5452 925 826 599 507 1086 963 409 378 3125 2778100% 100% 100% 100% 100% 100% 100% 100% 100% 100% 100% 100%
Sigma
_________________________________________________________________________________________________________________Proportions/Means: Columns Tested (5% risk level) - A/B - C/D - E/F - G/H - I/J - K/L - A/C/E/G/I/K - B/D/F/H/J/LOverlap formulae used.

Page 245p121866 - ICANN Global Study Wave 2 - ConsumersNielsenBanner 3
8 Jun 2016Table 191Q856_15. How well do each of the following adjectives describe new gTLDs such as .email, .photography and .club?
15. Informative
Base: All Qualified Respondents
Region
2016 Total 2016 North 2016 South2015 Total Consumers 2015 North America 2015 South America 2016 Europe 2016 Africa 2016 AsiaConsumers (18+) America (18+) America (18+) 2015 Europe (18+) 2015 Africa (18+) 2015 Asia (18+)
(A) (B) (C) (D) (E) (F) (G) (H) (I) (J) (K) (L)
6144 5452 925 826 599 507 1086 963 409 378 3125 2778Unweighted Base
3835 3796 575 554 365 341 570 622 265 273 2060 200662% 70% 62% 67% 61% 67% 52% 65% 65% 72% 66% 72%G AH G C G E G G IH ACEG KBDFH
TOP 2 BOX (NET)
1020 1114 101 130 123 134 93 121 112 116 591 61317% 20% 11% 16% 21% 26% 9% 13% 27% 31% 19% 22%
CG ADH C ACG EBDHL G ACEGK BDHL ACG KBDH
Describes very well
2815 2682 474 424 242 207 477 501 153 157 1469 139346% 49% 51% 51% 40% 41% 44% 52% 37% 42% 47% 50%EI AFJ AEGIK FJ I GFJ EI KFJ
Describes somewhat well
2309 1656 350 272 234 166 516 341 144 105 1065 77238% 30% 38% 33% 39% 33% 48% 35% 35% 28% 34% 28%BK L DK L FK L HACEIK BJL J L
BOTTOM 2 BOX (NET)
1581 1253 212 198 150 107 312 236 98 79 809 63326% 23% 23% 24% 25% 21% 29% 25% 24% 21% 26% 23%BC HAC L
Does not describe very well
728 403 138 74 84 59 204 105 46 26 256 13912% 7% 15% 9% 14% 12% 19% 11% 11% 7% 8% 5%BK L DAK L K BJL HACEIK BJL JK L
Does not describe at all
6144 5452 925 826 599 507 1086 963 409 378 3125 2778100% 100% 100% 100% 100% 100% 100% 100% 100% 100% 100% 100%
Sigma
_________________________________________________________________________________________________________________Proportions/Means: Columns Tested (5% risk level) - A/B - C/D - E/F - G/H - I/J - K/L - A/C/E/G/I/K - B/D/F/H/J/LOverlap formulae used.
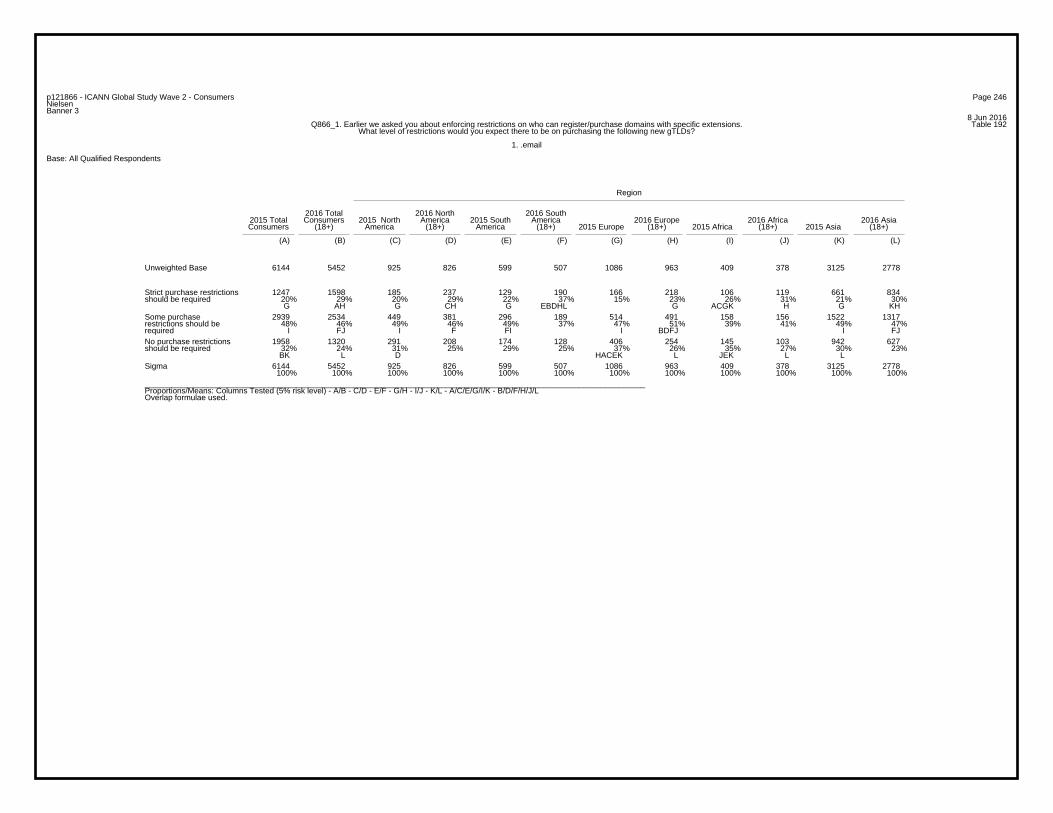
Page 246p121866 - ICANN Global Study Wave 2 - ConsumersNielsenBanner 3
8 Jun 2016Table 192Q866_1. Earlier we asked you about enforcing restrictions on who can register/purchase domains with specific extensions.
What level of restrictions would you expect there to be on purchasing the following new gTLDs?
1. .email
Base: All Qualified Respondents
Region
2016 Total 2016 North 2016 South2015 Total Consumers 2015 North America 2015 South America 2016 Europe 2016 Africa 2016 AsiaConsumers (18+) America (18+) America (18+) 2015 Europe (18+) 2015 Africa (18+) 2015 Asia (18+)
(A) (B) (C) (D) (E) (F) (G) (H) (I) (J) (K) (L)
6144 5452 925 826 599 507 1086 963 409 378 3125 2778Unweighted Base
1247 1598 185 237 129 190 166 218 106 119 661 83420% 29% 20% 29% 22% 37% 15% 23% 26% 31% 21% 30%G AH G CH G EBDHL G ACGK H G KH
Strict purchase restrictionsshould be required
2939 2534 449 381 296 189 514 491 158 156 1522 131748% 46% 49% 46% 49% 37% 47% 51% 39% 41% 49% 47%
I FJ I F FI I BDFJ I FJ
Some purchaserestrictions should berequired
1958 1320 291 208 174 128 406 254 145 103 942 62732% 24% 31% 25% 29% 25% 37% 26% 35% 27% 30% 23%BK L D HACEK L JEK L L
No purchase restrictionsshould be required
6144 5452 925 826 599 507 1086 963 409 378 3125 2778100% 100% 100% 100% 100% 100% 100% 100% 100% 100% 100% 100%
Sigma
_________________________________________________________________________________________________________________Proportions/Means: Columns Tested (5% risk level) - A/B - C/D - E/F - G/H - I/J - K/L - A/C/E/G/I/K - B/D/F/H/J/LOverlap formulae used.
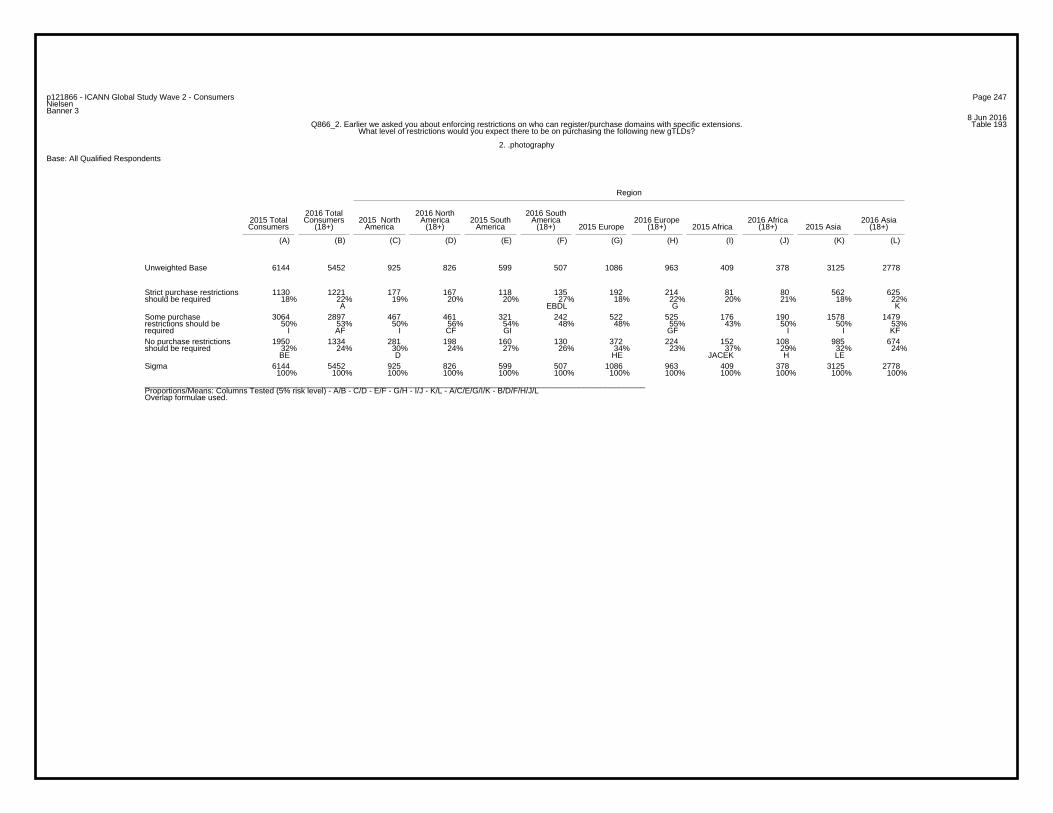
Page 247p121866 - ICANN Global Study Wave 2 - ConsumersNielsenBanner 3
8 Jun 2016Table 193Q866_2. Earlier we asked you about enforcing restrictions on who can register/purchase domains with specific extensions.
What level of restrictions would you expect there to be on purchasing the following new gTLDs?
2. .photography
Base: All Qualified Respondents
Region
2016 Total 2016 North 2016 South2015 Total Consumers 2015 North America 2015 South America 2016 Europe 2016 Africa 2016 AsiaConsumers (18+) America (18+) America (18+) 2015 Europe (18+) 2015 Africa (18+) 2015 Asia (18+)
(A) (B) (C) (D) (E) (F) (G) (H) (I) (J) (K) (L)
6144 5452 925 826 599 507 1086 963 409 378 3125 2778Unweighted Base
1130 1221 177 167 118 135 192 214 81 80 562 62518% 22% 19% 20% 20% 27% 18% 22% 20% 21% 18% 22%
A EBDL G K
Strict purchase restrictionsshould be required
3064 2897 467 461 321 242 522 525 176 190 1578 147950% 53% 50% 56% 54% 48% 48% 55% 43% 50% 50% 53%
I AF I CF GI GF I I KF
Some purchaserestrictions should berequired
1950 1334 281 198 160 130 372 224 152 108 985 67432% 24% 30% 24% 27% 26% 34% 23% 37% 29% 32% 24%BE D HE JACEK H LE
No purchase restrictionsshould be required
6144 5452 925 826 599 507 1086 963 409 378 3125 2778100% 100% 100% 100% 100% 100% 100% 100% 100% 100% 100% 100%
Sigma
_________________________________________________________________________________________________________________Proportions/Means: Columns Tested (5% risk level) - A/B - C/D - E/F - G/H - I/J - K/L - A/C/E/G/I/K - B/D/F/H/J/LOverlap formulae used.

Page 248p121866 - ICANN Global Study Wave 2 - ConsumersNielsenBanner 3
8 Jun 2016Table 194Q866_3. Earlier we asked you about enforcing restrictions on who can register/purchase domains with specific extensions.
What level of restrictions would you expect there to be on purchasing the following new gTLDs?
3. .link
Base: All Qualified Respondents
Region
2016 Total 2016 North 2016 South2015 Total Consumers 2015 North America 2015 South America 2016 Europe 2016 Africa 2016 AsiaConsumers (18+) America (18+) America (18+) 2015 Europe (18+) 2015 Africa (18+) 2015 Asia (18+)
(A) (B) (C) (D) (E) (F) (G) (H) (I) (J) (K) (L)
6144 5452 925 826 599 507 1086 963 409 378 3125 2778Unweighted Base
1115 1201 149 142 117 134 166 197 89 80 594 64818% 22% 16% 17% 20% 26% 15% 20% 22% 21% 19% 23%G AD G EBDH G CG CG KBD
Strict purchase restrictionsshould be required
2988 2714 440 418 305 214 504 478 165 181 1574 142349% 50% 48% 51% 51% 42% 46% 50% 40% 48% 50% 51%
I F I F FI I F I AGI BF
Some purchaserestrictions should berequired
2041 1537 336 266 177 159 416 288 155 117 957 70733% 28% 36% 32% 30% 31% 38% 30% 38% 31% 31% 25%
BEK L AEK BL L HAEK L JAEK L L
No purchase restrictionsshould be required
6144 5452 925 826 599 507 1086 963 409 378 3125 2778100% 100% 100% 100% 100% 100% 100% 100% 100% 100% 100% 100%
Sigma
_________________________________________________________________________________________________________________Proportions/Means: Columns Tested (5% risk level) - A/B - C/D - E/F - G/H - I/J - K/L - A/C/E/G/I/K - B/D/F/H/J/LOverlap formulae used.

Page 249p121866 - ICANN Global Study Wave 2 - ConsumersNielsenBanner 3
8 Jun 2016Table 195Q866_4. Earlier we asked you about enforcing restrictions on who can register/purchase domains with specific extensions.
What level of restrictions would you expect there to be on purchasing the following new gTLDs?
4. .guru
Base: All Qualified Respondents
Region
2016 Total 2016 North 2016 South2015 Total Consumers 2015 North America 2015 South America 2016 Europe 2016 Africa 2016 AsiaConsumers (18+) America (18+) America (18+) 2015 Europe (18+) 2015 Africa (18+) 2015 Asia (18+)
(A) (B) (C) (D) (E) (F) (G) (H) (I) (J) (K) (L)
6144 5452 925 826 599 507 1086 963 409 378 3125 2778Unweighted Base
1105 1181 150 164 117 145 190 234 82 73 566 56518% 22% 16% 20% 20% 29% 17% 24% 20% 19% 18% 20%
AL C EBDJL GBDL K
Strict purchase restrictionsshould be required
2969 2662 445 391 316 197 492 470 163 160 1553 144448% 49% 48% 47% 53% 39% 45% 49% 40% 42% 50% 52%GI FJ I F FAGI FJ AGI BDFJ
Some purchaserestrictions should berequired
2070 1609 330 271 166 165 404 259 164 145 1006 76934% 30% 36% 33% 28% 33% 37% 27% 40% 38% 32% 28%
BEK HL EK BHL HL HAEK AEK BHL LE
No purchase restrictionsshould be required
6144 5452 925 826 599 507 1086 963 409 378 3125 2778100% 100% 100% 100% 100% 100% 100% 100% 100% 100% 100% 100%
Sigma
_________________________________________________________________________________________________________________Proportions/Means: Columns Tested (5% risk level) - A/B - C/D - E/F - G/H - I/J - K/L - A/C/E/G/I/K - B/D/F/H/J/LOverlap formulae used.
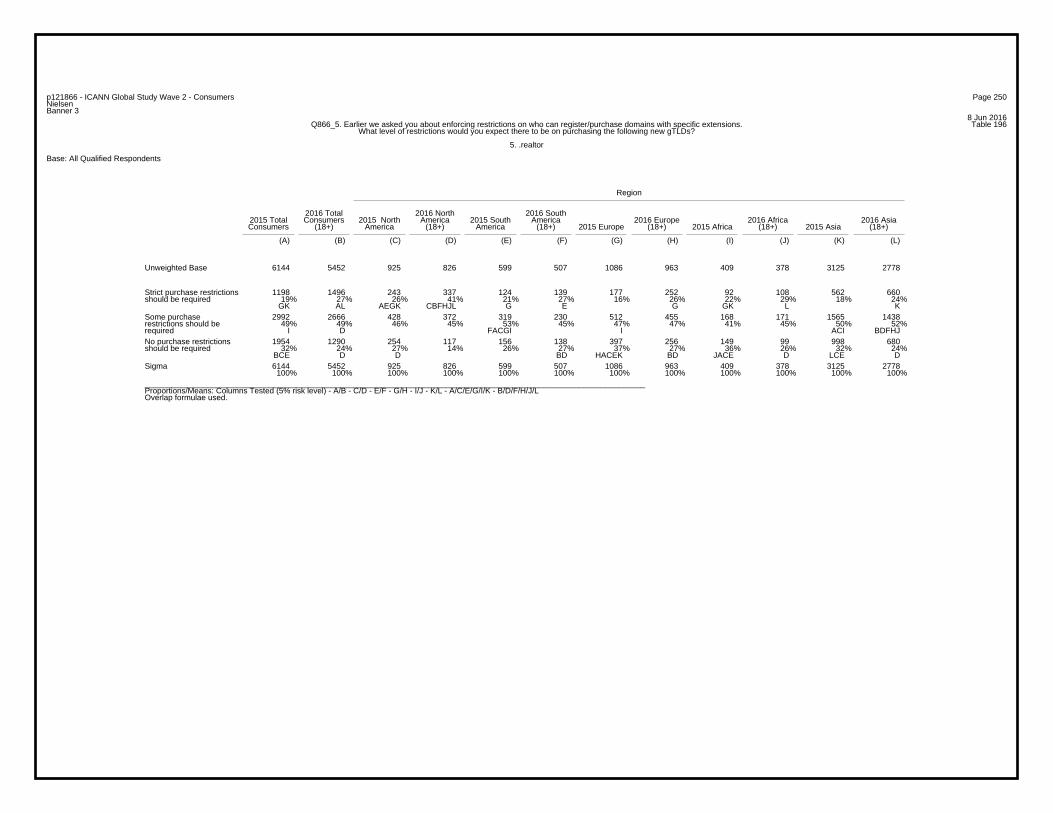
Page 250p121866 - ICANN Global Study Wave 2 - ConsumersNielsenBanner 3
8 Jun 2016Table 196Q866_5. Earlier we asked you about enforcing restrictions on who can register/purchase domains with specific extensions.
What level of restrictions would you expect there to be on purchasing the following new gTLDs?
5. .realtor
Base: All Qualified Respondents
Region
2016 Total 2016 North 2016 South2015 Total Consumers 2015 North America 2015 South America 2016 Europe 2016 Africa 2016 AsiaConsumers (18+) America (18+) America (18+) 2015 Europe (18+) 2015 Africa (18+) 2015 Asia (18+)
(A) (B) (C) (D) (E) (F) (G) (H) (I) (J) (K) (L)
6144 5452 925 826 599 507 1086 963 409 378 3125 2778Unweighted Base
1198 1496 243 337 124 139 177 252 92 108 562 66019% 27% 26% 41% 21% 27% 16% 26% 22% 29% 18% 24%
GK AL AEGK CBFHJL G E G GK L K
Strict purchase restrictionsshould be required
2992 2666 428 372 319 230 512 455 168 171 1565 143849% 49% 46% 45% 53% 45% 47% 47% 41% 45% 50% 52%
I D FACGI I ACI BDFHJ
Some purchaserestrictions should berequired
1954 1290 254 117 156 138 397 256 149 99 998 68032% 24% 27% 14% 26% 27% 37% 27% 36% 26% 32% 24%
BCE D D BD HACEK BD JACE D LCE D
No purchase restrictionsshould be required
6144 5452 925 826 599 507 1086 963 409 378 3125 2778100% 100% 100% 100% 100% 100% 100% 100% 100% 100% 100% 100%
Sigma
_________________________________________________________________________________________________________________Proportions/Means: Columns Tested (5% risk level) - A/B - C/D - E/F - G/H - I/J - K/L - A/C/E/G/I/K - B/D/F/H/J/LOverlap formulae used.

Page 251p121866 - ICANN Global Study Wave 2 - ConsumersNielsenBanner 3
8 Jun 2016Table 197Q866_6. Earlier we asked you about enforcing restrictions on who can register/purchase domains with specific extensions.
What level of restrictions would you expect there to be on purchasing the following new gTLDs?
6. .club
Base: All Qualified Respondents
Region
2016 Total 2016 North 2016 South2015 Total Consumers 2015 North America 2015 South America 2016 Europe 2016 Africa 2016 AsiaConsumers (18+) America (18+) America (18+) 2015 Europe (18+) 2015 Africa (18+) 2015 Asia (18+)
(A) (B) (C) (D) (E) (F) (G) (H) (I) (J) (K) (L)
6144 5452 925 826 599 507 1086 963 409 378 3125 2778Unweighted Base
1113 1228 173 158 114 151 178 207 81 71 567 64118% 23% 19% 19% 19% 30% 16% 21% 20% 19% 18% 23%
AD EBDHJL G KD
Strict purchase restrictionsshould be required
3059 2879 448 451 321 237 517 531 165 184 1608 147650% 53% 48% 55% 54% 47% 48% 55% 40% 49% 51% 53%
I AF I CF FCGI I GFJ I AGI F
Some purchaserestrictions should berequired
1972 1345 304 217 164 119 391 225 163 123 950 66132% 25% 33% 26% 27% 23% 36% 23% 40% 33% 30% 24%
BEK DE HAEK JACEK BDFHL L
No purchase restrictionsshould be required
6144 5452 925 826 599 507 1086 963 409 378 3125 2778100% 100% 100% 100% 100% 100% 100% 100% 100% 100% 100% 100%
Sigma
_________________________________________________________________________________________________________________Proportions/Means: Columns Tested (5% risk level) - A/B - C/D - E/F - G/H - I/J - K/L - A/C/E/G/I/K - B/D/F/H/J/LOverlap formulae used.

Page 252p121866 - ICANN Global Study Wave 2 - ConsumersNielsenBanner 3
8 Jun 2016Table 198Q866_7. Earlier we asked you about enforcing restrictions on who can register/purchase domains with specific extensions.
What level of restrictions would you expect there to be on purchasing the following new gTLDs?
7. .xyz
Base: All Qualified Respondents
Region
2016 Total 2016 North 2016 South2015 Total Consumers 2015 North America 2015 South America 2016 Europe 2016 Africa 2016 AsiaConsumers (18+) America (18+) America (18+) 2015 Europe (18+) 2015 Africa (18+) 2015 Asia (18+)
(A) (B) (C) (D) (E) (F) (G) (H) (I) (J) (K) (L)
6144 5452 925 826 599 507 1086 963 409 378 3125 2778Unweighted Base
1076 1130 146 155 120 141 174 221 79 59 557 55418% 21% 16% 19% 20% 28% 16% 23% 19% 16% 18% 20%
AJ CG EBDHJL GDJL KJ
Strict purchase restrictionsshould be required
2823 2408 403 339 307 195 481 418 136 151 1496 130546% 44% 44% 41% 51% 38% 44% 43% 33% 40% 48% 47%
I DF I FACGI I ACGI BDFJ
Some purchaserestrictions should berequired
2245 1914 376 332 172 171 431 324 194 168 1072 91937% 35% 41% 40% 29% 34% 40% 34% 47% 44% 34% 33%EK L AEK BFHL HAEK ACEGK BFHL E
No purchase restrictionsshould be required
6144 5452 925 826 599 507 1086 963 409 378 3125 2778100% 100% 100% 100% 100% 100% 100% 100% 100% 100% 100% 100%
Sigma
_________________________________________________________________________________________________________________Proportions/Means: Columns Tested (5% risk level) - A/B - C/D - E/F - G/H - I/J - K/L - A/C/E/G/I/K - B/D/F/H/J/LOverlap formulae used.
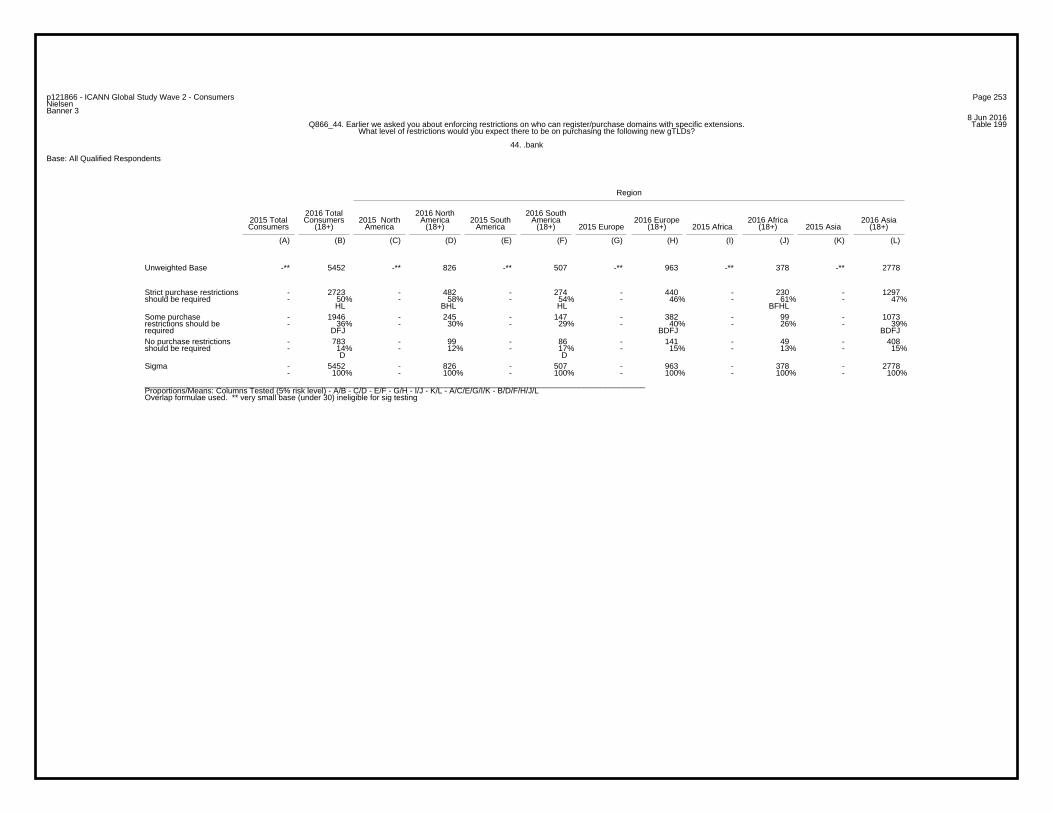
Page 253p121866 - ICANN Global Study Wave 2 - ConsumersNielsenBanner 3
8 Jun 2016Table 199Q866_44. Earlier we asked you about enforcing restrictions on who can register/purchase domains with specific extensions.
What level of restrictions would you expect there to be on purchasing the following new gTLDs?
44. .bank
Base: All Qualified Respondents
Region
2016 Total 2016 North 2016 South2015 Total Consumers 2015 North America 2015 South America 2016 Europe 2016 Africa 2016 AsiaConsumers (18+) America (18+) America (18+) 2015 Europe (18+) 2015 Africa (18+) 2015 Asia (18+)
(A) (B) (C) (D) (E) (F) (G) (H) (I) (J) (K) (L)
-** 5452 -** 826 -** 507 -** 963 -** 378 -** 2778Unweighted Base
- 2723 - 482 - 274 - 440 - 230 - 1297- 50% - 58% - 54% - 46% - 61% - 47%
HL BHL HL BFHL
Strict purchase restrictionsshould be required
- 1946 - 245 - 147 - 382 - 99 - 1073- 36% - 30% - 29% - 40% - 26% - 39%
DFJ BDFJ BDFJ
Some purchaserestrictions should berequired
- 783 - 99 - 86 - 141 - 49 - 408- 14% - 12% - 17% - 15% - 13% - 15%
D D
No purchase restrictionsshould be required
- 5452 - 826 - 507 - 963 - 378 - 2778- 100% - 100% - 100% - 100% - 100% - 100%
Sigma
_________________________________________________________________________________________________________________Proportions/Means: Columns Tested (5% risk level) - A/B - C/D - E/F - G/H - I/J - K/L - A/C/E/G/I/K - B/D/F/H/J/LOverlap formulae used. ** very small base (under 30) ineligible for sig testing
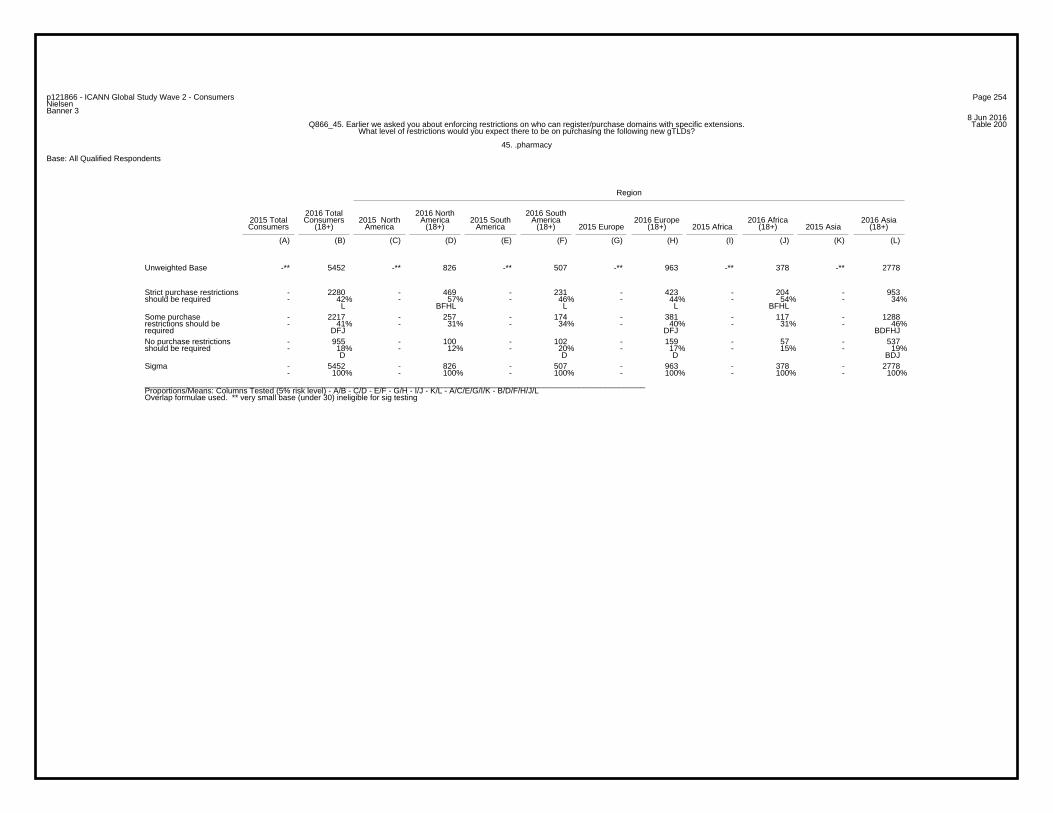
Page 254p121866 - ICANN Global Study Wave 2 - ConsumersNielsenBanner 3
8 Jun 2016Table 200Q866_45. Earlier we asked you about enforcing restrictions on who can register/purchase domains with specific extensions.
What level of restrictions would you expect there to be on purchasing the following new gTLDs?
45. .pharmacy
Base: All Qualified Respondents
Region
2016 Total 2016 North 2016 South2015 Total Consumers 2015 North America 2015 South America 2016 Europe 2016 Africa 2016 AsiaConsumers (18+) America (18+) America (18+) 2015 Europe (18+) 2015 Africa (18+) 2015 Asia (18+)
(A) (B) (C) (D) (E) (F) (G) (H) (I) (J) (K) (L)
-** 5452 -** 826 -** 507 -** 963 -** 378 -** 2778Unweighted Base
- 2280 - 469 - 231 - 423 - 204 - 953- 42% - 57% - 46% - 44% - 54% - 34%
L BFHL L L BFHL
Strict purchase restrictionsshould be required
- 2217 - 257 - 174 - 381 - 117 - 1288- 41% - 31% - 34% - 40% - 31% - 46%
DFJ DFJ BDFHJ
Some purchaserestrictions should berequired
- 955 - 100 - 102 - 159 - 57 - 537- 18% - 12% - 20% - 17% - 15% - 19%
D D D BDJ
No purchase restrictionsshould be required
- 5452 - 826 - 507 - 963 - 378 - 2778- 100% - 100% - 100% - 100% - 100% - 100%
Sigma
_________________________________________________________________________________________________________________Proportions/Means: Columns Tested (5% risk level) - A/B - C/D - E/F - G/H - I/J - K/L - A/C/E/G/I/K - B/D/F/H/J/LOverlap formulae used. ** very small base (under 30) ineligible for sig testing
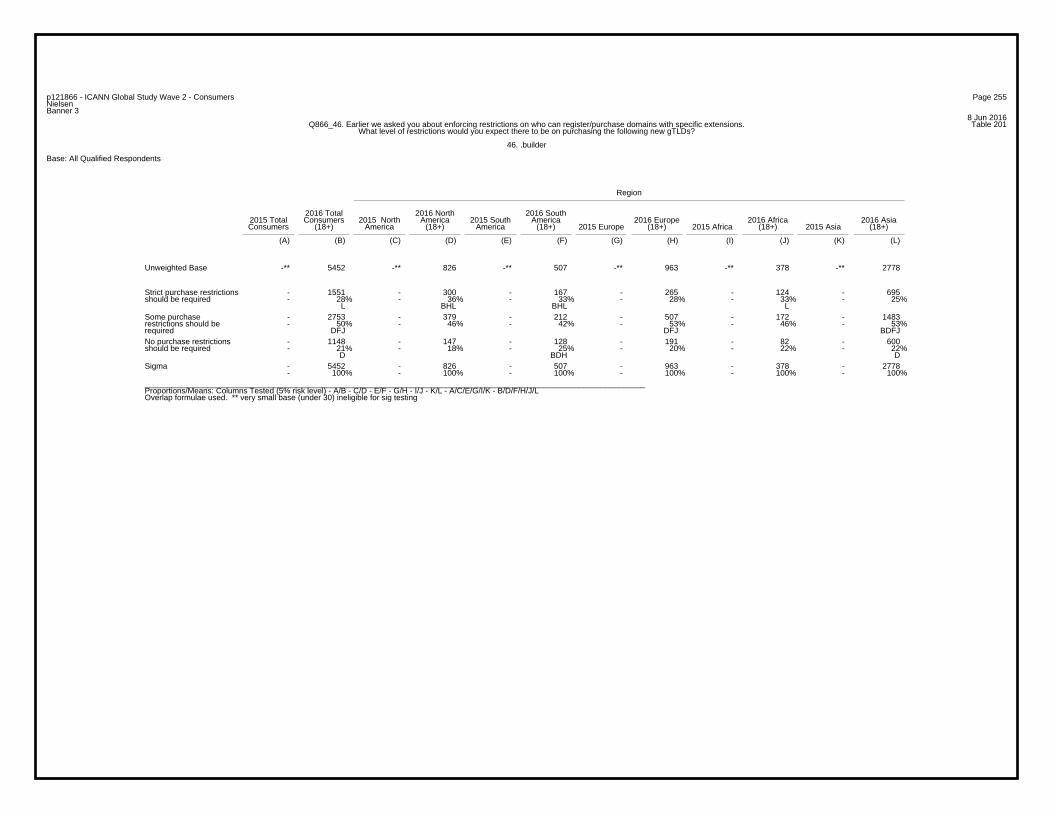
Page 255p121866 - ICANN Global Study Wave 2 - ConsumersNielsenBanner 3
8 Jun 2016Table 201Q866_46. Earlier we asked you about enforcing restrictions on who can register/purchase domains with specific extensions.
What level of restrictions would you expect there to be on purchasing the following new gTLDs?
46. .builder
Base: All Qualified Respondents
Region
2016 Total 2016 North 2016 South2015 Total Consumers 2015 North America 2015 South America 2016 Europe 2016 Africa 2016 AsiaConsumers (18+) America (18+) America (18+) 2015 Europe (18+) 2015 Africa (18+) 2015 Asia (18+)
(A) (B) (C) (D) (E) (F) (G) (H) (I) (J) (K) (L)
-** 5452 -** 826 -** 507 -** 963 -** 378 -** 2778Unweighted Base
- 1551 - 300 - 167 - 265 - 124 - 695- 28% - 36% - 33% - 28% - 33% - 25%
L BHL BHL L
Strict purchase restrictionsshould be required
- 2753 - 379 - 212 - 507 - 172 - 1483- 50% - 46% - 42% - 53% - 46% - 53%
DFJ DFJ BDFJ
Some purchaserestrictions should berequired
- 1148 - 147 - 128 - 191 - 82 - 600- 21% - 18% - 25% - 20% - 22% - 22%
D BDH D
No purchase restrictionsshould be required
- 5452 - 826 - 507 - 963 - 378 - 2778- 100% - 100% - 100% - 100% - 100% - 100%
Sigma
_________________________________________________________________________________________________________________Proportions/Means: Columns Tested (5% risk level) - A/B - C/D - E/F - G/H - I/J - K/L - A/C/E/G/I/K - B/D/F/H/J/LOverlap formulae used. ** very small base (under 30) ineligible for sig testing

Page 256p121866 - ICANN Global Study Wave 2 - ConsumersNielsenBanner 3
8 Jun 2016Table 202Q866_23. Earlier we asked you about enforcing restrictions on who can register/purchase domains with specific extensions.
What level of restrictions would you expect there to be on purchasing the following new gTLDs?
23. .toronto
Base: All Qualified Respondents
Region
2016 Total 2016 North 2016 South2015 Total Consumers 2015 North America 2015 South America 2016 Europe 2016 Africa 2016 AsiaConsumers (18+) America (18+) America (18+) 2015 Europe (18+) 2015 Africa (18+) 2015 Asia (18+)
(A) (B) (C) (D) (E) (F) (G) (H) (I) (J) (K) (L)
-** 181 -** 181 -** -** -** -** -** -** -** -**Unweighted Base
- 62 - 62 - - - - - - - -- 34% - 34% - - - - - - - -
Strict purchase restrictionsshould be required
- 94 - 94 - - - - - - - -- 52% - 52% - - - - - - - -
Some purchaserestrictions should berequired
- 25 - 25 - - - - - - - -- 14% - 14% - - - - - - - -
No purchase restrictionsshould be required
- 181 - 181 - - - - - - - -- 100% - 100% - - - - - - - -
Sigma
_________________________________________________________________________________________________________________Proportions/Means: Columns Tested (5% risk level) - A/B - C/D - E/F - G/H - I/J - K/L - A/C/E/G/I/K - B/D/F/H/J/LOverlap formulae used. ** very small base (under 30) ineligible for sig testing
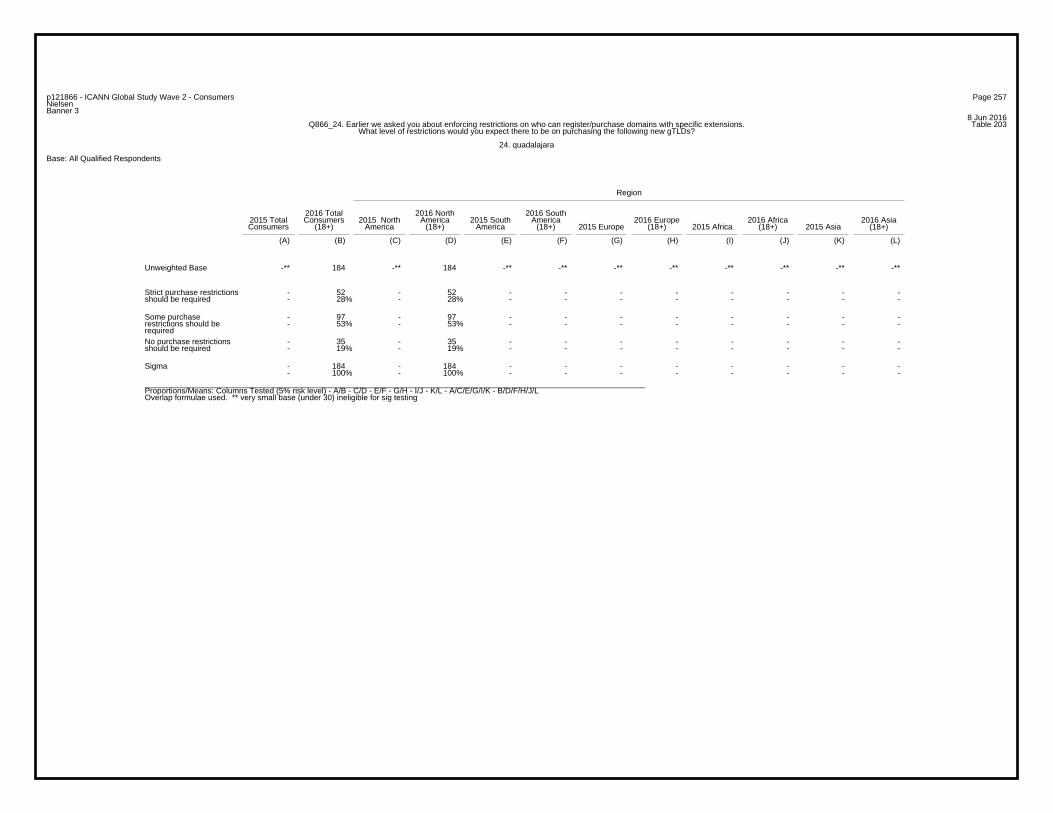
Page 257p121866 - ICANN Global Study Wave 2 - ConsumersNielsenBanner 3
8 Jun 2016Table 203Q866_24. Earlier we asked you about enforcing restrictions on who can register/purchase domains with specific extensions.
What level of restrictions would you expect there to be on purchasing the following new gTLDs?
24. quadalajara
Base: All Qualified Respondents
Region
2016 Total 2016 North 2016 South2015 Total Consumers 2015 North America 2015 South America 2016 Europe 2016 Africa 2016 AsiaConsumers (18+) America (18+) America (18+) 2015 Europe (18+) 2015 Africa (18+) 2015 Asia (18+)
(A) (B) (C) (D) (E) (F) (G) (H) (I) (J) (K) (L)
-** 184 -** 184 -** -** -** -** -** -** -** -**Unweighted Base
- 52 - 52 - - - - - - - -- 28% - 28% - - - - - - - -
Strict purchase restrictionsshould be required
- 97 - 97 - - - - - - - -- 53% - 53% - - - - - - - -
Some purchaserestrictions should berequired
- 35 - 35 - - - - - - - -- 19% - 19% - - - - - - - -
No purchase restrictionsshould be required
- 184 - 184 - - - - - - - -- 100% - 100% - - - - - - - -
Sigma
_________________________________________________________________________________________________________________Proportions/Means: Columns Tested (5% risk level) - A/B - C/D - E/F - G/H - I/J - K/L - A/C/E/G/I/K - B/D/F/H/J/LOverlap formulae used. ** very small base (under 30) ineligible for sig testing

Page 258p121866 - ICANN Global Study Wave 2 - ConsumersNielsenBanner 3
8 Jun 2016Table 204Q866_25. Earlier we asked you about enforcing restrictions on who can register/purchase domains with specific extensions.
What level of restrictions would you expect there to be on purchasing the following new gTLDs?
25. .roma
Base: All Qualified Respondents
Region
2016 Total 2016 North 2016 South2015 Total Consumers 2015 North America 2015 South America 2016 Europe 2016 Africa 2016 AsiaConsumers (18+) America (18+) America (18+) 2015 Europe (18+) 2015 Africa (18+) 2015 Asia (18+)
(A) (B) (C) (D) (E) (F) (G) (H) (I) (J) (K) (L)
-** 90* -** -** -** -** -** 90* -** -** -** -**Unweighted Base
- 13 - - - - - 13 - - - -- 14% - - - - - 14% - - - -
Strict purchase restrictionsshould be required
- 57 - - - - - 57 - - - -- 63% - - - - - 63% - - - -
Some purchaserestrictions should berequired
- 20 - - - - - 20 - - - -- 22% - - - - - 22% - - - -
No purchase restrictionsshould be required
- 90 - - - - - 90 - - - -- 100% - - - - - 100% - - - -
Sigma
_________________________________________________________________________________________________________________Proportions/Means: Columns Tested (5% risk level) - A/B - C/D - E/F - G/H - I/J - K/L - A/C/E/G/I/K - B/D/F/H/J/LOverlap formulae used. * small base; ** very small base (under 30) ineligible for sig testing

Page 259p121866 - ICANN Global Study Wave 2 - ConsumersNielsenBanner 3
8 Jun 2016Table 205Q866_26. Earlier we asked you about enforcing restrictions on who can register/purchase domains with specific extensions.
What level of restrictions would you expect there to be on purchasing the following new gTLDs?
26. .istanbul
Base: All Qualified Respondents
Region
2016 Total 2016 North 2016 South2015 Total Consumers 2015 North America 2015 South America 2016 Europe 2016 Africa 2016 AsiaConsumers (18+) America (18+) America (18+) 2015 Europe (18+) 2015 Africa (18+) 2015 Asia (18+)
(A) (B) (C) (D) (E) (F) (G) (H) (I) (J) (K) (L)
-** 95* -** -** -** -** -** 95* -** -** -** -**Unweighted Base
- 31 - - - - - 31 - - - -- 33% - - - - - 33% - - - -
Strict purchase restrictionsshould be required
- 44 - - - - - 44 - - - -- 46% - - - - - 46% - - - -
Some purchaserestrictions should berequired
- 20 - - - - - 20 - - - -- 21% - - - - - 21% - - - -
No purchase restrictionsshould be required
- 95 - - - - - 95 - - - -- 100% - - - - - 100% - - - -
Sigma
_________________________________________________________________________________________________________________Proportions/Means: Columns Tested (5% risk level) - A/B - C/D - E/F - G/H - I/J - K/L - A/C/E/G/I/K - B/D/F/H/J/LOverlap formulae used. * small base; ** very small base (under 30) ineligible for sig testing
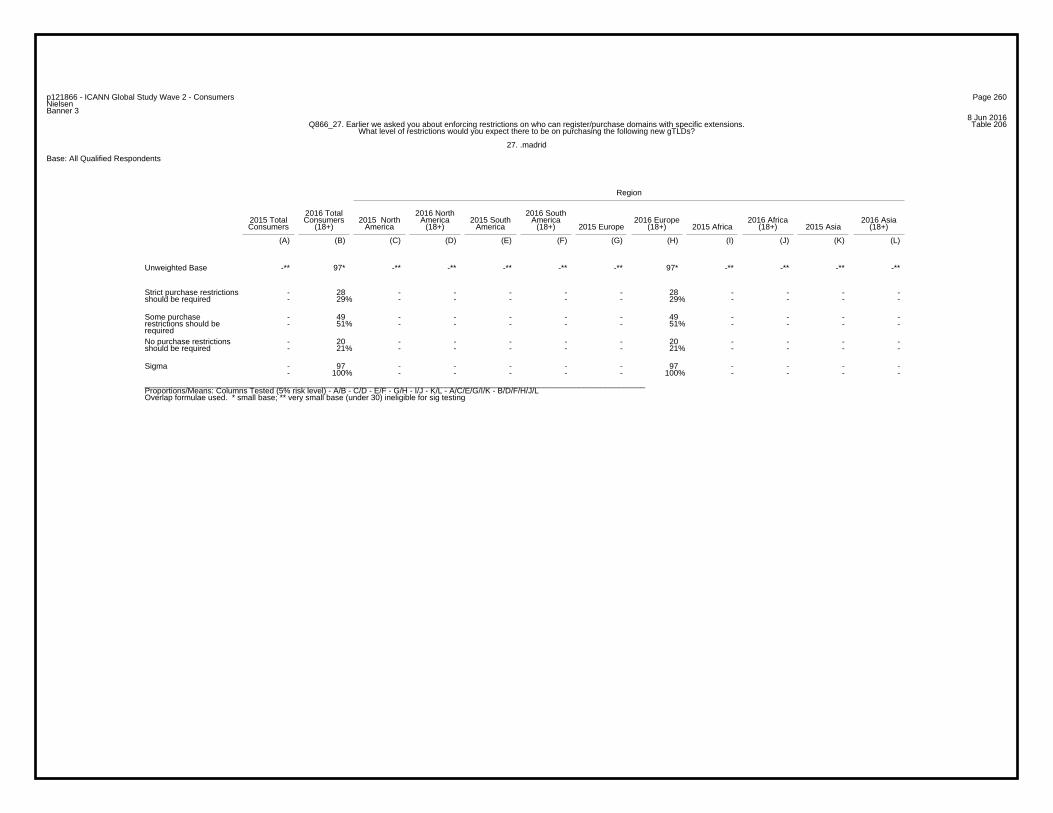
Page 260p121866 - ICANN Global Study Wave 2 - ConsumersNielsenBanner 3
8 Jun 2016Table 206Q866_27. Earlier we asked you about enforcing restrictions on who can register/purchase domains with specific extensions.
What level of restrictions would you expect there to be on purchasing the following new gTLDs?
27. .madrid
Base: All Qualified Respondents
Region
2016 Total 2016 North 2016 South2015 Total Consumers 2015 North America 2015 South America 2016 Europe 2016 Africa 2016 AsiaConsumers (18+) America (18+) America (18+) 2015 Europe (18+) 2015 Africa (18+) 2015 Asia (18+)
(A) (B) (C) (D) (E) (F) (G) (H) (I) (J) (K) (L)
-** 97* -** -** -** -** -** 97* -** -** -** -**Unweighted Base
- 28 - - - - - 28 - - - -- 29% - - - - - 29% - - - -
Strict purchase restrictionsshould be required
- 49 - - - - - 49 - - - -- 51% - - - - - 51% - - - -
Some purchaserestrictions should berequired
- 20 - - - - - 20 - - - -- 21% - - - - - 21% - - - -
No purchase restrictionsshould be required
- 97 - - - - - 97 - - - -- 100% - - - - - 100% - - - -
Sigma
_________________________________________________________________________________________________________________Proportions/Means: Columns Tested (5% risk level) - A/B - C/D - E/F - G/H - I/J - K/L - A/C/E/G/I/K - B/D/F/H/J/LOverlap formulae used. * small base; ** very small base (under 30) ineligible for sig testing

Page 261p121866 - ICANN Global Study Wave 2 - ConsumersNielsenBanner 3
8 Jun 2016Table 207Q866_28. Earlier we asked you about enforcing restrictions on who can register/purchase domains with specific extensions.
What level of restrictions would you expect there to be on purchasing the following new gTLDs?
28. .warszawa
Base: All Qualified Respondents
Region
2016 Total 2016 North 2016 South2015 Total Consumers 2015 North America 2015 South America 2016 Europe 2016 Africa 2016 AsiaConsumers (18+) America (18+) America (18+) 2015 Europe (18+) 2015 Africa (18+) 2015 Asia (18+)
(A) (B) (C) (D) (E) (F) (G) (H) (I) (J) (K) (L)
-** 92* -** -** -** -** -** 92* -** -** -** -**Unweighted Base
- 24 - - - - - 24 - - - -- 26% - - - - - 26% - - - -
Strict purchase restrictionsshould be required
- 51 - - - - - 51 - - - -- 55% - - - - - 55% - - - -
Some purchaserestrictions should berequired
- 17 - - - - - 17 - - - -- 18% - - - - - 18% - - - -
No purchase restrictionsshould be required
- 92 - - - - - 92 - - - -- 100% - - - - - 100% - - - -
Sigma
_________________________________________________________________________________________________________________Proportions/Means: Columns Tested (5% risk level) - A/B - C/D - E/F - G/H - I/J - K/L - A/C/E/G/I/K - B/D/F/H/J/LOverlap formulae used. * small base; ** very small base (under 30) ineligible for sig testing

Page 262p121866 - ICANN Global Study Wave 2 - ConsumersNielsenBanner 3
8 Jun 2016Table 208Q866_29. Earlier we asked you about enforcing restrictions on who can register/purchase domains with specific extensions.
What level of restrictions would you expect there to be on purchasing the following new gTLDs?
29. .paris
Base: All Qualified Respondents
Region
2016 Total 2016 North 2016 South2015 Total Consumers 2015 North America 2015 South America 2016 Europe 2016 Africa 2016 AsiaConsumers (18+) America (18+) America (18+) 2015 Europe (18+) 2015 Africa (18+) 2015 Asia (18+)
(A) (B) (C) (D) (E) (F) (G) (H) (I) (J) (K) (L)
-** 181 -** -** -** -** -** 181 -** -** -** -**Unweighted Base
- 55 - - - - - 55 - - - -- 30% - - - - - 30% - - - -
Strict purchase restrictionsshould be required
- 89 - - - - - 89 - - - -- 49% - - - - - 49% - - - -
Some purchaserestrictions should berequired
- 37 - - - - - 37 - - - -- 20% - - - - - 20% - - - -
No purchase restrictionsshould be required
- 181 - - - - - 181 - - - -- 100% - - - - - 100% - - - -
Sigma
_________________________________________________________________________________________________________________Proportions/Means: Columns Tested (5% risk level) - A/B - C/D - E/F - G/H - I/J - K/L - A/C/E/G/I/K - B/D/F/H/J/LOverlap formulae used. ** very small base (under 30) ineligible for sig testing

Page 263p121866 - ICANN Global Study Wave 2 - ConsumersNielsenBanner 3
8 Jun 2016Table 209Q866_30. Earlier we asked you about enforcing restrictions on who can register/purchase domains with specific extensions.
What level of restrictions would you expect there to be on purchasing the following new gTLDs?
30. Foshan
Base: All Qualified Respondents
Region
2016 Total 2016 North 2016 South2015 Total Consumers 2015 North America 2015 South America 2016 Europe 2016 Africa 2016 AsiaConsumers (18+) America (18+) America (18+) 2015 Europe (18+) 2015 Africa (18+) 2015 Asia (18+)
(A) (B) (C) (D) (E) (F) (G) (H) (I) (J) (K) (L)
-** 996 -** -** -** -** -** -** -** -** -** 996Unweighted Base
- 258 - - - - - - - - - 258- 26% - - - - - - - - - 26%
Strict purchase restrictionsshould be required
- 504 - - - - - - - - - 504- 51% - - - - - - - - - 51%
Some purchaserestrictions should berequired
- 234 - - - - - - - - - 234- 23% - - - - - - - - - 23%
No purchase restrictionsshould be required
- 996 - - - - - - - - - 996- 100% - - - - - - - - - 100%
Sigma
_________________________________________________________________________________________________________________Proportions/Means: Columns Tested (5% risk level) - A/B - C/D - E/F - G/H - I/J - K/L - A/C/E/G/I/K - B/D/F/H/J/LOverlap formulae used. ** very small base (under 30) ineligible for sig testing

Page 264p121866 - ICANN Global Study Wave 2 - ConsumersNielsenBanner 3
8 Jun 2016Table 210Q866_31. Earlier we asked you about enforcing restrictions on who can register/purchase domains with specific extensions.
What level of restrictions would you expect there to be on purchasing the following new gTLDs?
31. .hanoi
Base: All Qualified Respondents
Region
2016 Total 2016 North 2016 South2015 Total Consumers 2015 North America 2015 South America 2016 Europe 2016 Africa 2016 AsiaConsumers (18+) America (18+) America (18+) 2015 Europe (18+) 2015 Africa (18+) 2015 Asia (18+)
(A) (B) (C) (D) (E) (F) (G) (H) (I) (J) (K) (L)
-** 93* -** -** -** -** -** -** -** -** -** 93*Unweighted Base
- 26 - - - - - - - - - 26- 28% - - - - - - - - - 28%
Strict purchase restrictionsshould be required
- 50 - - - - - - - - - 50- 54% - - - - - - - - - 54%
Some purchaserestrictions should berequired
- 17 - - - - - - - - - 17- 18% - - - - - - - - - 18%
No purchase restrictionsshould be required
- 93 - - - - - - - - - 93- 100% - - - - - - - - - 100%
Sigma
_________________________________________________________________________________________________________________Proportions/Means: Columns Tested (5% risk level) - A/B - C/D - E/F - G/H - I/J - K/L - A/C/E/G/I/K - B/D/F/H/J/LOverlap formulae used. * small base; ** very small base (under 30) ineligible for sig testing

Page 265p121866 - ICANN Global Study Wave 2 - ConsumersNielsenBanner 3
8 Jun 2016Table 211Q866_32. Earlier we asked you about enforcing restrictions on who can register/purchase domains with specific extensions.
What level of restrictions would you expect there to be on purchasing the following new gTLDs?
32. .manilla
Base: All Qualified Respondents
Region
2016 Total 2016 North 2016 South2015 Total Consumers 2015 North America 2015 South America 2016 Europe 2016 Africa 2016 AsiaConsumers (18+) America (18+) America (18+) 2015 Europe (18+) 2015 Africa (18+) 2015 Asia (18+)
(A) (B) (C) (D) (E) (F) (G) (H) (I) (J) (K) (L)
-** 184 -** -** -** -** -** -** -** -** -** 184Unweighted Base
- 69 - - - - - - - - - 69- 38% - - - - - - - - - 38%
Strict purchase restrictionsshould be required
- 83 - - - - - - - - - 83- 45% - - - - - - - - - 45%
Some purchaserestrictions should berequired
- 32 - - - - - - - - - 32- 17% - - - - - - - - - 17%
No purchase restrictionsshould be required
- 184 - - - - - - - - - 184- 100% - - - - - - - - - 100%
Sigma
_________________________________________________________________________________________________________________Proportions/Means: Columns Tested (5% risk level) - A/B - C/D - E/F - G/H - I/J - K/L - A/C/E/G/I/K - B/D/F/H/J/LOverlap formulae used. ** very small base (under 30) ineligible for sig testing

Page 266p121866 - ICANN Global Study Wave 2 - ConsumersNielsenBanner 3
8 Jun 2016Table 212Q866_33. Earlier we asked you about enforcing restrictions on who can register/purchase domains with specific extensions.
What level of restrictions would you expect there to be on purchasing the following new gTLDs?
33. .tokyo
Base: All Qualified Respondents
Region
2016 Total 2016 North 2016 South2015 Total Consumers 2015 North America 2015 South America 2016 Europe 2016 Africa 2016 AsiaConsumers (18+) America (18+) America (18+) 2015 Europe (18+) 2015 Africa (18+) 2015 Asia (18+)
(A) (B) (C) (D) (E) (F) (G) (H) (I) (J) (K) (L)
-** 315 -** -** -** -** -** -** -** -** -** 315Unweighted Base
- 80 - - - - - - - - - 80- 25% - - - - - - - - - 25%
Strict purchase restrictionsshould be required
- 174 - - - - - - - - - 174- 55% - - - - - - - - - 55%
Some purchaserestrictions should berequired
- 61 - - - - - - - - - 61- 19% - - - - - - - - - 19%
No purchase restrictionsshould be required
- 315 - - - - - - - - - 315- 100% - - - - - - - - - 100%
Sigma
_________________________________________________________________________________________________________________Proportions/Means: Columns Tested (5% risk level) - A/B - C/D - E/F - G/H - I/J - K/L - A/C/E/G/I/K - B/D/F/H/J/LOverlap formulae used. ** very small base (under 30) ineligible for sig testing

Page 267p121866 - ICANN Global Study Wave 2 - ConsumersNielsenBanner 3
8 Jun 2016Table 213Q866_34. Earlier we asked you about enforcing restrictions on who can register/purchase domains with specific extensions.
What level of restrictions would you expect there to be on purchasing the following new gTLDs?
34. .seoul
Base: All Qualified Respondents
Region
2016 Total 2016 North 2016 South2015 Total Consumers 2015 North America 2015 South America 2016 Europe 2016 Africa 2016 AsiaConsumers (18+) America (18+) America (18+) 2015 Europe (18+) 2015 Africa (18+) 2015 Asia (18+)
(A) (B) (C) (D) (E) (F) (G) (H) (I) (J) (K) (L)
-** 183 -** -** -** -** -** -** -** -** -** 183Unweighted Base
- 69 - - - - - - - - - 69- 38% - - - - - - - - - 38%
Strict purchase restrictionsshould be required
- 82 - - - - - - - - - 82- 45% - - - - - - - - - 45%
Some purchaserestrictions should berequired
- 32 - - - - - - - - - 32- 17% - - - - - - - - - 17%
No purchase restrictionsshould be required
- 183 - - - - - - - - - 183- 100% - - - - - - - - - 100%
Sigma
_________________________________________________________________________________________________________________Proportions/Means: Columns Tested (5% risk level) - A/B - C/D - E/F - G/H - I/J - K/L - A/C/E/G/I/K - B/D/F/H/J/LOverlap formulae used. ** very small base (under 30) ineligible for sig testing

Page 268p121866 - ICANN Global Study Wave 2 - ConsumersNielsenBanner 3
8 Jun 2016Table 214Q866_35. Earlier we asked you about enforcing restrictions on who can register/purchase domains with specific extensions.
What level of restrictions would you expect there to be on purchasing the following new gTLDs?
35. .mockba
Base: All Qualified Respondents
Region
2016 Total 2016 North 2016 South2015 Total Consumers 2015 North America 2015 South America 2016 Europe 2016 Africa 2016 AsiaConsumers (18+) America (18+) America (18+) 2015 Europe (18+) 2015 Africa (18+) 2015 Asia (18+)
(A) (B) (C) (D) (E) (F) (G) (H) (I) (J) (K) (L)
-** 231 -** -** -** -** -** -** -** -** -** 231Unweighted Base
- 49 - - - - - - - - - 49- 21% - - - - - - - - - 21%
Strict purchase restrictionsshould be required
- 118 - - - - - - - - - 118- 51% - - - - - - - - - 51%
Some purchaserestrictions should berequired
- 64 - - - - - - - - - 64- 28% - - - - - - - - - 28%
No purchase restrictionsshould be required
- 231 - - - - - - - - - 231- 100% - - - - - - - - - 100%
Sigma
_________________________________________________________________________________________________________________Proportions/Means: Columns Tested (5% risk level) - A/B - C/D - E/F - G/H - I/J - K/L - A/C/E/G/I/K - B/D/F/H/J/LOverlap formulae used. ** very small base (under 30) ineligible for sig testing

Page 269p121866 - ICANN Global Study Wave 2 - ConsumersNielsenBanner 3
8 Jun 2016Table 215Q866_36. Earlier we asked you about enforcing restrictions on who can register/purchase domains with specific extensions.
What level of restrictions would you expect there to be on purchasing the following new gTLDs?
36. .delhi
Base: All Qualified Respondents
Region
2016 Total 2016 North 2016 South2015 Total Consumers 2015 North America 2015 South America 2016 Europe 2016 Africa 2016 AsiaConsumers (18+) America (18+) America (18+) 2015 Europe (18+) 2015 Africa (18+) 2015 Asia (18+)
(A) (B) (C) (D) (E) (F) (G) (H) (I) (J) (K) (L)
-** 595 -** -** -** -** -** -** -** -** -** 595Unweighted Base
- 179 - - - - - - - - - 179- 30% - - - - - - - - - 30%
Strict purchase restrictionsshould be required
- 302 - - - - - - - - - 302- 51% - - - - - - - - - 51%
Some purchaserestrictions should berequired
- 114 - - - - - - - - - 114- 19% - - - - - - - - - 19%
No purchase restrictionsshould be required
- 595 - - - - - - - - - 595- 100% - - - - - - - - - 100%
Sigma
_________________________________________________________________________________________________________________Proportions/Means: Columns Tested (5% risk level) - A/B - C/D - E/F - G/H - I/J - K/L - A/C/E/G/I/K - B/D/F/H/J/LOverlap formulae used. ** very small base (under 30) ineligible for sig testing

Page 270p121866 - ICANN Global Study Wave 2 - ConsumersNielsenBanner 3
8 Jun 2016Table 216Q866_37. Earlier we asked you about enforcing restrictions on who can register/purchase domains with specific extensions.
What level of restrictions would you expect there to be on purchasing the following new gTLDs?
37. .jakarta
Base: All Qualified Respondents
Region
2016 Total 2016 North 2016 South2015 Total Consumers 2015 North America 2015 South America 2016 Europe 2016 Africa 2016 AsiaConsumers (18+) America (18+) America (18+) 2015 Europe (18+) 2015 Africa (18+) 2015 Asia (18+)
(A) (B) (C) (D) (E) (F) (G) (H) (I) (J) (K) (L)
-** 181 -** -** -** -** -** -** -** -** -** 181Unweighted Base
- 47 - - - - - - - - - 47- 26% - - - - - - - - - 26%
Strict purchase restrictionsshould be required
- 90 - - - - - - - - - 90- 50% - - - - - - - - - 50%
Some purchaserestrictions should berequired
- 44 - - - - - - - - - 44- 24% - - - - - - - - - 24%
No purchase restrictionsshould be required
- 181 - - - - - - - - - 181- 100% - - - - - - - - - 100%
Sigma
_________________________________________________________________________________________________________________Proportions/Means: Columns Tested (5% risk level) - A/B - C/D - E/F - G/H - I/J - K/L - A/C/E/G/I/K - B/D/F/H/J/LOverlap formulae used. ** very small base (under 30) ineligible for sig testing
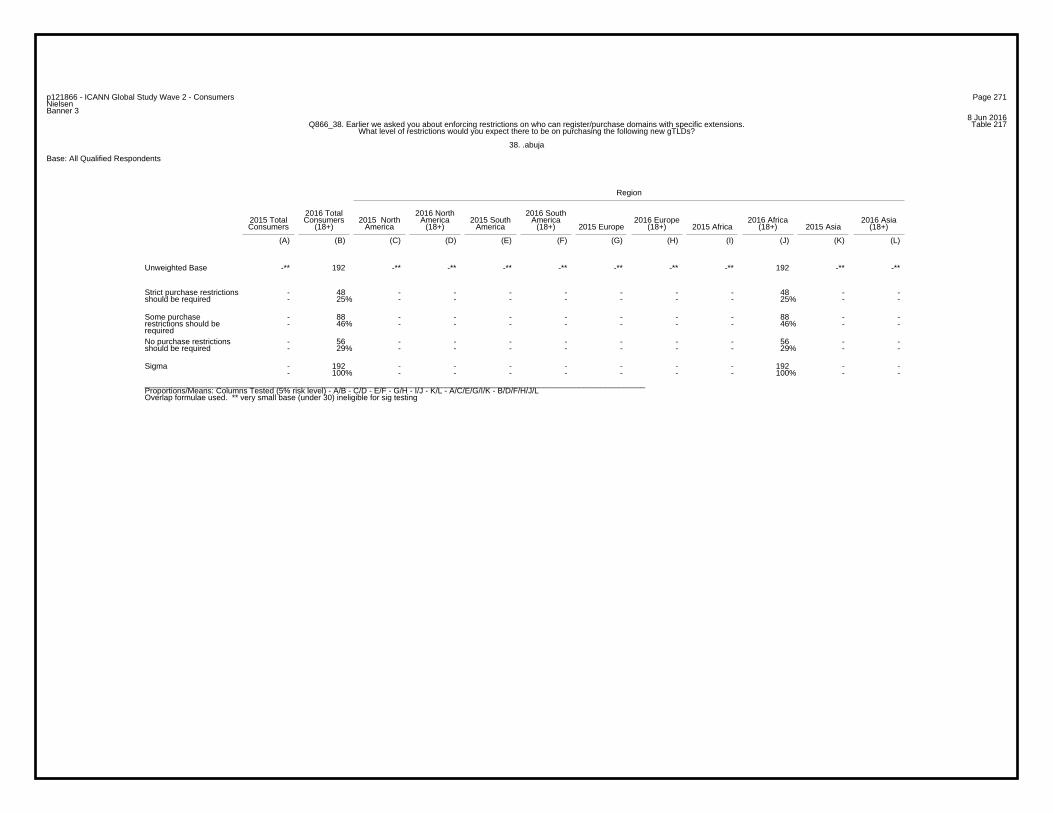
Page 271p121866 - ICANN Global Study Wave 2 - ConsumersNielsenBanner 3
8 Jun 2016Table 217Q866_38. Earlier we asked you about enforcing restrictions on who can register/purchase domains with specific extensions.
What level of restrictions would you expect there to be on purchasing the following new gTLDs?
38. .abuja
Base: All Qualified Respondents
Region
2016 Total 2016 North 2016 South2015 Total Consumers 2015 North America 2015 South America 2016 Europe 2016 Africa 2016 AsiaConsumers (18+) America (18+) America (18+) 2015 Europe (18+) 2015 Africa (18+) 2015 Asia (18+)
(A) (B) (C) (D) (E) (F) (G) (H) (I) (J) (K) (L)
-** 192 -** -** -** -** -** -** -** 192 -** -**Unweighted Base
- 48 - - - - - - - 48 - -- 25% - - - - - - - 25% - -
Strict purchase restrictionsshould be required
- 88 - - - - - - - 88 - -- 46% - - - - - - - 46% - -
Some purchaserestrictions should berequired
- 56 - - - - - - - 56 - -- 29% - - - - - - - 29% - -
No purchase restrictionsshould be required
- 192 - - - - - - - 192 - -- 100% - - - - - - - 100% - -
Sigma
_________________________________________________________________________________________________________________Proportions/Means: Columns Tested (5% risk level) - A/B - C/D - E/F - G/H - I/J - K/L - A/C/E/G/I/K - B/D/F/H/J/LOverlap formulae used. ** very small base (under 30) ineligible for sig testing

Page 272p121866 - ICANN Global Study Wave 2 - ConsumersNielsenBanner 3
8 Jun 2016Table 218Q866_39. Earlier we asked you about enforcing restrictions on who can register/purchase domains with specific extensions.
What level of restrictions would you expect there to be on purchasing the following new gTLDs?
39. .capetown
Base: All Qualified Respondents
Region
2016 Total 2016 North 2016 South2015 Total Consumers 2015 North America 2015 South America 2016 Europe 2016 Africa 2016 AsiaConsumers (18+) America (18+) America (18+) 2015 Europe (18+) 2015 Africa (18+) 2015 Asia (18+)
(A) (B) (C) (D) (E) (F) (G) (H) (I) (J) (K) (L)
-** 90* -** -** -** -** -** -** -** 90* -** -**Unweighted Base
- 27 - - - - - - - 27 - -- 30% - - - - - - - 30% - -
Strict purchase restrictionsshould be required
- 40 - - - - - - - 40 - -- 44% - - - - - - - 44% - -
Some purchaserestrictions should berequired
- 23 - - - - - - - 23 - -- 26% - - - - - - - 26% - -
No purchase restrictionsshould be required
- 90 - - - - - - - 90 - -- 100% - - - - - - - 100% - -
Sigma
_________________________________________________________________________________________________________________Proportions/Means: Columns Tested (5% risk level) - A/B - C/D - E/F - G/H - I/J - K/L - A/C/E/G/I/K - B/D/F/H/J/LOverlap formulae used. * small base; ** very small base (under 30) ineligible for sig testing

Page 273p121866 - ICANN Global Study Wave 2 - ConsumersNielsenBanner 3
8 Jun 2016Table 219Q866_40. Earlier we asked you about enforcing restrictions on who can register/purchase domains with specific extensions.
What level of restrictions would you expect there to be on purchasing the following new gTLDs?
40. .cairo
Base: All Qualified Respondents
Region
2016 Total 2016 North 2016 South2015 Total Consumers 2015 North America 2015 South America 2016 Europe 2016 Africa 2016 AsiaConsumers (18+) America (18+) America (18+) 2015 Europe (18+) 2015 Africa (18+) 2015 Asia (18+)
(A) (B) (C) (D) (E) (F) (G) (H) (I) (J) (K) (L)
-** 96* -** -** -** -** -** -** -** 96* -** -**Unweighted Base
- 20 - - - - - - - 20 - -- 21% - - - - - - - 21% - -
Strict purchase restrictionsshould be required
- 47 - - - - - - - 47 - -- 49% - - - - - - - 49% - -
Some purchaserestrictions should berequired
- 29 - - - - - - - 29 - -- 30% - - - - - - - 30% - -
No purchase restrictionsshould be required
- 96 - - - - - - - 96 - -- 100% - - - - - - - 100% - -
Sigma
_________________________________________________________________________________________________________________Proportions/Means: Columns Tested (5% risk level) - A/B - C/D - E/F - G/H - I/J - K/L - A/C/E/G/I/K - B/D/F/H/J/LOverlap formulae used. * small base; ** very small base (under 30) ineligible for sig testing

Page 274p121866 - ICANN Global Study Wave 2 - ConsumersNielsenBanner 3
8 Jun 2016Table 220Q866_41. Earlier we asked you about enforcing restrictions on who can register/purchase domains with specific extensions.
What level of restrictions would you expect there to be on purchasing the following new gTLDs?
41. .bogota
Base: All Qualified Respondents
Region
2016 Total 2016 North 2016 South2015 Total Consumers 2015 North America 2015 South America 2016 Europe 2016 Africa 2016 AsiaConsumers (18+) America (18+) America (18+) 2015 Europe (18+) 2015 Africa (18+) 2015 Asia (18+)
(A) (B) (C) (D) (E) (F) (G) (H) (I) (J) (K) (L)
-** 93* -** -** -** 93* -** -** -** -** -** -**Unweighted Base
- 31 - - - 31 - - - - - -- 33% - - - 33% - - - - - -
Strict purchase restrictionsshould be required
- 42 - - - 42 - - - - - -- 45% - - - 45% - - - - - -
Some purchaserestrictions should berequired
- 20 - - - 20 - - - - - -- 22% - - - 22% - - - - - -
No purchase restrictionsshould be required
- 93 - - - 93 - - - - - -- 100% - - - 100% - - - - - -
Sigma
_________________________________________________________________________________________________________________Proportions/Means: Columns Tested (5% risk level) - A/B - C/D - E/F - G/H - I/J - K/L - A/C/E/G/I/K - B/D/F/H/J/LOverlap formulae used. * small base; ** very small base (under 30) ineligible for sig testing

Page 275p121866 - ICANN Global Study Wave 2 - ConsumersNielsenBanner 3
8 Jun 2016Table 221Q866_42. Earlier we asked you about enforcing restrictions on who can register/purchase domains with specific extensions.
What level of restrictions would you expect there to be on purchasing the following new gTLDs?
42. .cordoba
Base: All Qualified Respondents
Region
2016 Total 2016 North 2016 South2015 Total Consumers 2015 North America 2015 South America 2016 Europe 2016 Africa 2016 AsiaConsumers (18+) America (18+) America (18+) 2015 Europe (18+) 2015 Africa (18+) 2015 Asia (18+)
(A) (B) (C) (D) (E) (F) (G) (H) (I) (J) (K) (L)
-** 93* -** -** -** 93* -** -** -** -** -** -**Unweighted Base
- 26 - - - 26 - - - - - -- 28% - - - 28% - - - - - -
Strict purchase restrictionsshould be required
- 43 - - - 43 - - - - - -- 46% - - - 46% - - - - - -
Some purchaserestrictions should berequired
- 24 - - - 24 - - - - - -- 26% - - - 26% - - - - - -
No purchase restrictionsshould be required
- 93 - - - 93 - - - - - -- 100% - - - 100% - - - - - -
Sigma
_________________________________________________________________________________________________________________Proportions/Means: Columns Tested (5% risk level) - A/B - C/D - E/F - G/H - I/J - K/L - A/C/E/G/I/K - B/D/F/H/J/LOverlap formulae used. * small base; ** very small base (under 30) ineligible for sig testing
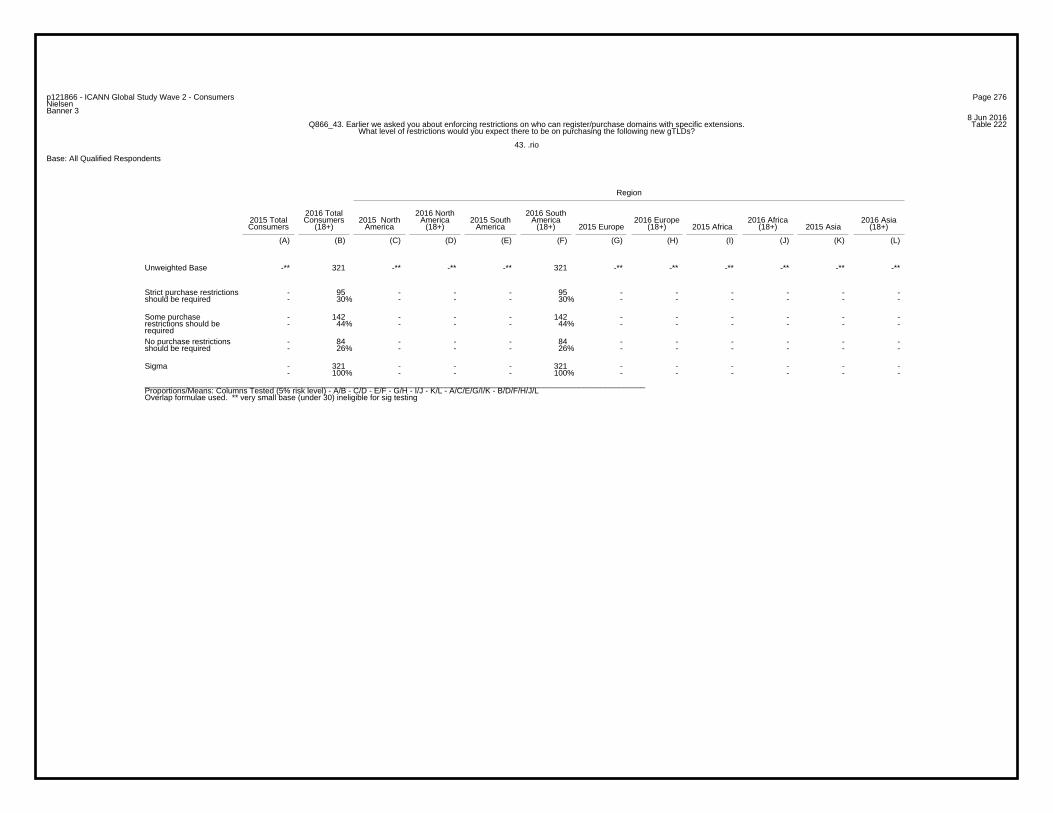
Page 276p121866 - ICANN Global Study Wave 2 - ConsumersNielsenBanner 3
8 Jun 2016Table 222Q866_43. Earlier we asked you about enforcing restrictions on who can register/purchase domains with specific extensions.
What level of restrictions would you expect there to be on purchasing the following new gTLDs?
43. .rio
Base: All Qualified Respondents
Region
2016 Total 2016 North 2016 South2015 Total Consumers 2015 North America 2015 South America 2016 Europe 2016 Africa 2016 AsiaConsumers (18+) America (18+) America (18+) 2015 Europe (18+) 2015 Africa (18+) 2015 Asia (18+)
(A) (B) (C) (D) (E) (F) (G) (H) (I) (J) (K) (L)
-** 321 -** -** -** 321 -** -** -** -** -** -**Unweighted Base
- 95 - - - 95 - - - - - -- 30% - - - 30% - - - - - -
Strict purchase restrictionsshould be required
- 142 - - - 142 - - - - - -- 44% - - - 44% - - - - - -
Some purchaserestrictions should berequired
- 84 - - - 84 - - - - - -- 26% - - - 26% - - - - - -
No purchase restrictionsshould be required
- 321 - - - 321 - - - - - -- 100% - - - 100% - - - - - -
Sigma
_________________________________________________________________________________________________________________Proportions/Means: Columns Tested (5% risk level) - A/B - C/D - E/F - G/H - I/J - K/L - A/C/E/G/I/K - B/D/F/H/J/LOverlap formulae used. ** very small base (under 30) ineligible for sig testing
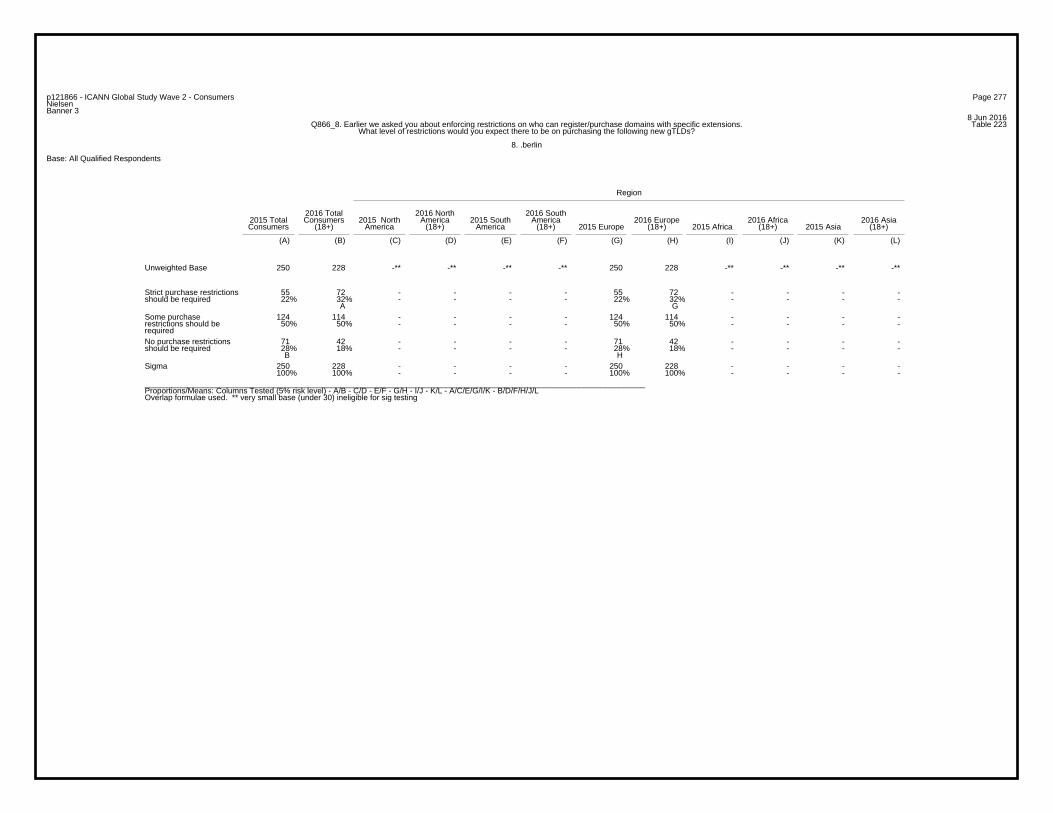
Page 277p121866 - ICANN Global Study Wave 2 - ConsumersNielsenBanner 3
8 Jun 2016Table 223Q866_8. Earlier we asked you about enforcing restrictions on who can register/purchase domains with specific extensions.
What level of restrictions would you expect there to be on purchasing the following new gTLDs?
8. .berlin
Base: All Qualified Respondents
Region
2016 Total 2016 North 2016 South2015 Total Consumers 2015 North America 2015 South America 2016 Europe 2016 Africa 2016 AsiaConsumers (18+) America (18+) America (18+) 2015 Europe (18+) 2015 Africa (18+) 2015 Asia (18+)
(A) (B) (C) (D) (E) (F) (G) (H) (I) (J) (K) (L)
250 228 -** -** -** -** 250 228 -** -** -** -**Unweighted Base
55 72 - - - - 55 72 - - - -22% 32% - - - - 22% 32% - - - -
A G
Strict purchase restrictionsshould be required
124 114 - - - - 124 114 - - - -50% 50% - - - - 50% 50% - - - -
Some purchaserestrictions should berequired
71 42 - - - - 71 42 - - - -28% 18% - - - - 28% 18% - - - - B H
No purchase restrictionsshould be required
250 228 - - - - 250 228 - - - -100% 100% - - - - 100% 100% - - - -
Sigma
_________________________________________________________________________________________________________________Proportions/Means: Columns Tested (5% risk level) - A/B - C/D - E/F - G/H - I/J - K/L - A/C/E/G/I/K - B/D/F/H/J/LOverlap formulae used. ** very small base (under 30) ineligible for sig testing

Page 278p121866 - ICANN Global Study Wave 2 - ConsumersNielsenBanner 3
8 Jun 2016Table 224Q866_9. Earlier we asked you about enforcing restrictions on who can register/purchase domains with specific extensions.
What level of restrictions would you expect there to be on purchasing the following new gTLDs?
9. .ovh
Base: All Qualified Respondents
Region
2016 Total 2016 North 2016 South2015 Total Consumers 2015 North America 2015 South America 2016 Europe 2016 Africa 2016 AsiaConsumers (18+) America (18+) America (18+) 2015 Europe (18+) 2015 Africa (18+) 2015 Asia (18+)
(A) (B) (C) (D) (E) (F) (G) (H) (I) (J) (K) (L)
250 228 -** -** -** -** 250 228 -** -** -** -**Unweighted Base
47 59 - - - - 47 59 - - - -19% 26% - - - - 19% 26% - - - -
Strict purchase restrictionsshould be required
109 90 - - - - 109 90 - - - -44% 39% - - - - 44% 39% - - - -
Some purchaserestrictions should berequired
94 79 - - - - 94 79 - - - -38% 35% - - - - 38% 35% - - - -
No purchase restrictionsshould be required
250 228 - - - - 250 228 - - - -100% 100% - - - - 100% 100% - - - -
Sigma
_________________________________________________________________________________________________________________Proportions/Means: Columns Tested (5% risk level) - A/B - C/D - E/F - G/H - I/J - K/L - A/C/E/G/I/K - B/D/F/H/J/LOverlap formulae used. ** very small base (under 30) ineligible for sig testing
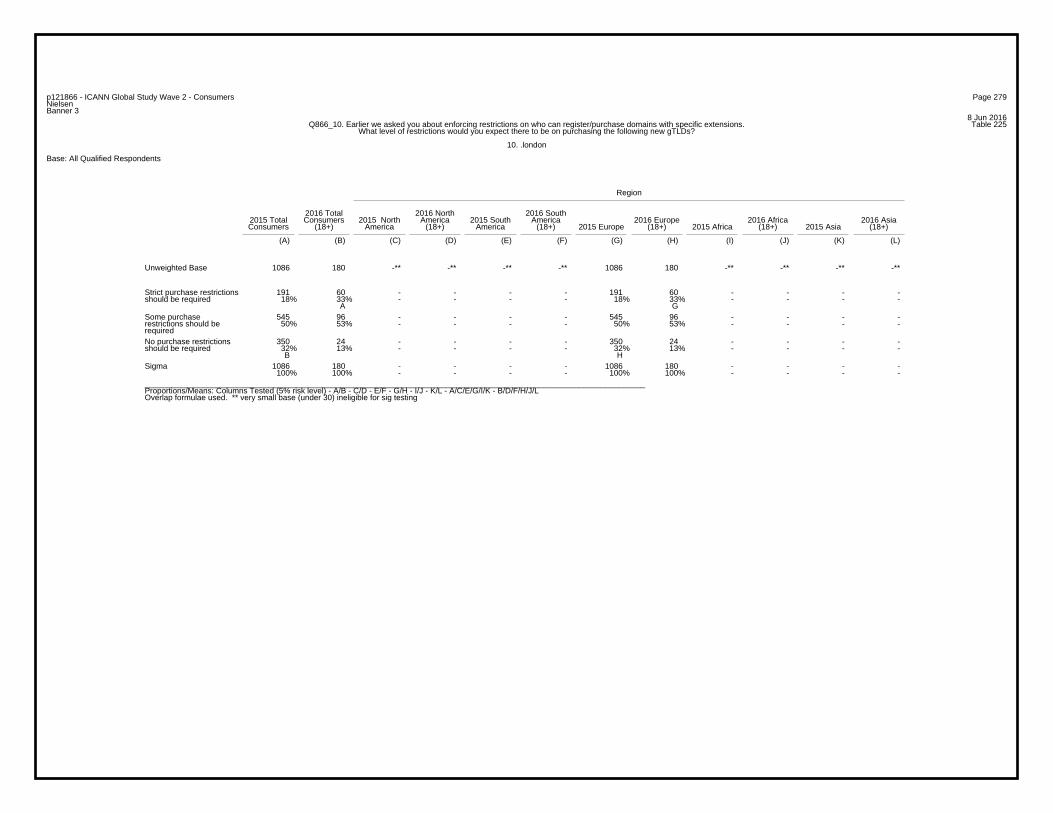
Page 279p121866 - ICANN Global Study Wave 2 - ConsumersNielsenBanner 3
8 Jun 2016Table 225Q866_10. Earlier we asked you about enforcing restrictions on who can register/purchase domains with specific extensions.
What level of restrictions would you expect there to be on purchasing the following new gTLDs?
10. .london
Base: All Qualified Respondents
Region
2016 Total 2016 North 2016 South2015 Total Consumers 2015 North America 2015 South America 2016 Europe 2016 Africa 2016 AsiaConsumers (18+) America (18+) America (18+) 2015 Europe (18+) 2015 Africa (18+) 2015 Asia (18+)
(A) (B) (C) (D) (E) (F) (G) (H) (I) (J) (K) (L)
1086 180 -** -** -** -** 1086 180 -** -** -** -**Unweighted Base
191 60 - - - - 191 60 - - - -18% 33% - - - - 18% 33% - - - -
A G
Strict purchase restrictionsshould be required
545 96 - - - - 545 96 - - - -50% 53% - - - - 50% 53% - - - -
Some purchaserestrictions should berequired
350 24 - - - - 350 24 - - - -32% 13% - - - - 32% 13% - - - - B H
No purchase restrictionsshould be required
1086 180 - - - - 1086 180 - - - -100% 100% - - - - 100% 100% - - - -
Sigma
_________________________________________________________________________________________________________________Proportions/Means: Columns Tested (5% risk level) - A/B - C/D - E/F - G/H - I/J - K/L - A/C/E/G/I/K - B/D/F/H/J/LOverlap formulae used. ** very small base (under 30) ineligible for sig testing

Page 280p121866 - ICANN Global Study Wave 2 - ConsumersNielsenBanner 3
8 Jun 2016Table 226Q866_11. Earlier we asked you about enforcing restrictions on who can register/purchase domains with specific extensions.
What level of restrictions would you expect there to be on purchasing the following new gTLDs?
11. .nyc
Base: All Qualified Respondents
Region
2016 Total 2016 North 2016 South2015 Total Consumers 2015 North America 2015 South America 2016 Europe 2016 Africa 2016 AsiaConsumers (18+) America (18+) America (18+) 2015 Europe (18+) 2015 Africa (18+) 2015 Asia (18+)
(A) (B) (C) (D) (E) (F) (G) (H) (I) (J) (K) (L)
502 461 502 461 -** -** -** -** -** -** -** -**Unweighted Base
107 129 107 129 - - - - - - - -21% 28% 21% 28% - - - - - - - -
A C
Strict purchase restrictionsshould be required
248 228 248 228 - - - - - - - -49% 49% 49% 49% - - - - - - - -
Some purchaserestrictions should berequired
147 104 147 104 - - - - - - - -29% 23% 29% 23% - - - - - - - - B D
No purchase restrictionsshould be required
502 461 502 461 - - - - - - - -100% 100% 100% 100% - - - - - - - -
Sigma
_________________________________________________________________________________________________________________Proportions/Means: Columns Tested (5% risk level) - A/B - C/D - E/F - G/H - I/J - K/L - A/C/E/G/I/K - B/D/F/H/J/LOverlap formulae used. ** very small base (under 30) ineligible for sig testing

Page 281p121866 - ICANN Global Study Wave 2 - ConsumersNielsenBanner 3
8 Jun 2016Table 227Q866_12. Earlier we asked you about enforcing restrictions on who can register/purchase domains with specific extensions.
What level of restrictions would you expect there to be on purchasing the following new gTLDs?
12. .wang
Base: All Qualified Respondents
Region
2016 Total 2016 North 2016 South2015 Total Consumers 2015 North America 2015 South America 2016 Europe 2016 Africa 2016 AsiaConsumers (18+) America (18+) America (18+) 2015 Europe (18+) 2015 Africa (18+) 2015 Asia (18+)
(A) (B) (C) (D) (E) (F) (G) (H) (I) (J) (K) (L)
1110 996 -** -** -** -** -** -** -** -** 1110 996Unweighted Base
182 190 - - - - - - - - 182 19016% 19% - - - - - - - - 16% 19%
Strict purchase restrictionsshould be required
523 484 - - - - - - - - 523 48447% 49% - - - - - - - - 47% 49%
Some purchaserestrictions should berequired
405 322 - - - - - - - - 405 32236% 32% - - - - - - - - 36% 32%B L
No purchase restrictionsshould be required
1110 996 - - - - - - - - 1110 996100% 100% - - - - - - - - 100% 100%
Sigma
_________________________________________________________________________________________________________________Proportions/Means: Columns Tested (5% risk level) - A/B - C/D - E/F - G/H - I/J - K/L - A/C/E/G/I/K - B/D/F/H/J/LOverlap formulae used. ** very small base (under 30) ineligible for sig testing
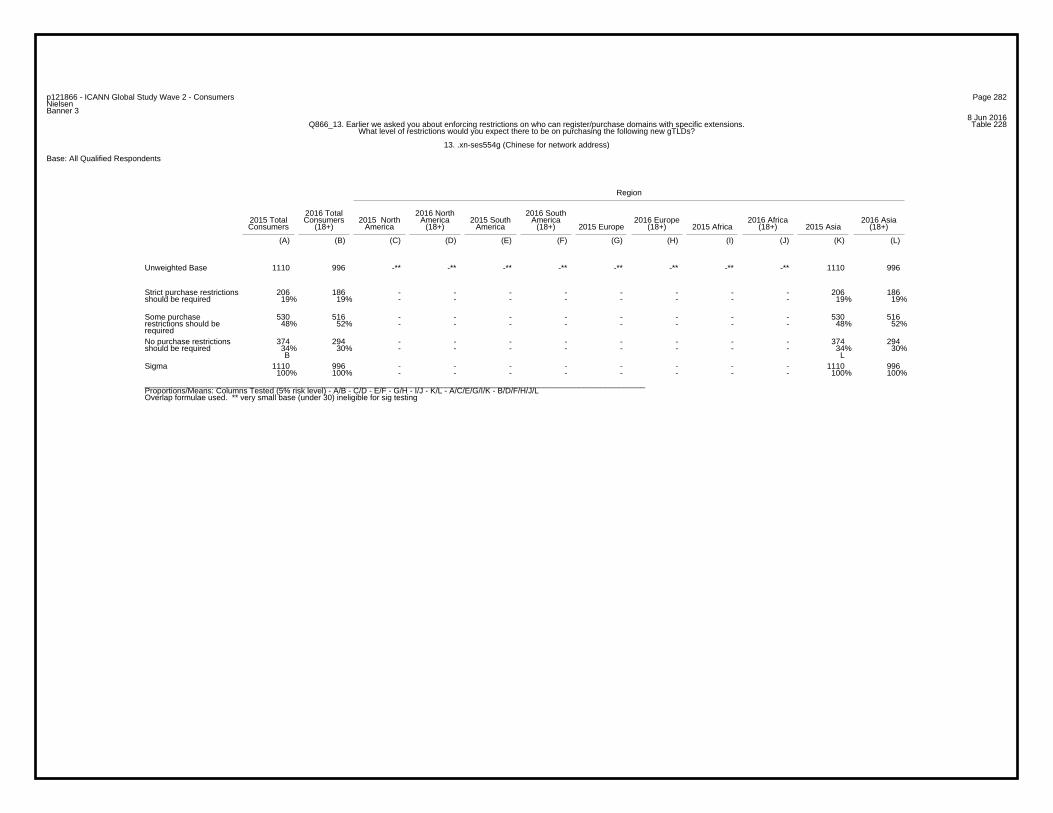
Page 282p121866 - ICANN Global Study Wave 2 - ConsumersNielsenBanner 3
8 Jun 2016Table 228Q866_13. Earlier we asked you about enforcing restrictions on who can register/purchase domains with specific extensions.
What level of restrictions would you expect there to be on purchasing the following new gTLDs?
13. .xn-ses554g (Chinese for network address)
Base: All Qualified Respondents
Region
2016 Total 2016 North 2016 South2015 Total Consumers 2015 North America 2015 South America 2016 Europe 2016 Africa 2016 AsiaConsumers (18+) America (18+) America (18+) 2015 Europe (18+) 2015 Africa (18+) 2015 Asia (18+)
(A) (B) (C) (D) (E) (F) (G) (H) (I) (J) (K) (L)
1110 996 -** -** -** -** -** -** -** -** 1110 996Unweighted Base
206 186 - - - - - - - - 206 18619% 19% - - - - - - - - 19% 19%
Strict purchase restrictionsshould be required
530 516 - - - - - - - - 530 51648% 52% - - - - - - - - 48% 52%
Some purchaserestrictions should berequired
374 294 - - - - - - - - 374 29434% 30% - - - - - - - - 34% 30%B L
No purchase restrictionsshould be required
1110 996 - - - - - - - - 1110 996100% 100% - - - - - - - - 100% 100%
Sigma
_________________________________________________________________________________________________________________Proportions/Means: Columns Tested (5% risk level) - A/B - C/D - E/F - G/H - I/J - K/L - A/C/E/G/I/K - B/D/F/H/J/LOverlap formulae used. ** very small base (under 30) ineligible for sig testing

Page 283p121866 - ICANN Global Study Wave 2 - ConsumersNielsenBanner 3
8 Jun 2016Table 229Q866_14. Earlier we asked you about enforcing restrictions on who can register/purchase domains with specific extensions.
What level of restrictions would you expect there to be on purchasing the following new gTLDs?
14. .xn-55qx5d (Chinese for company)
Base: All Qualified Respondents
Region
2016 Total 2016 North 2016 South2015 Total Consumers 2015 North America 2015 South America 2016 Europe 2016 Africa 2016 AsiaConsumers (18+) America (18+) America (18+) 2015 Europe (18+) 2015 Africa (18+) 2015 Asia (18+)
(A) (B) (C) (D) (E) (F) (G) (H) (I) (J) (K) (L)
1110 996 -** -** -** -** -** -** -** -** 1110 996Unweighted Base
216 198 - - - - - - - - 216 19819% 20% - - - - - - - - 19% 20%
Strict purchase restrictionsshould be required
504 507 - - - - - - - - 504 50745% 51% - - - - - - - - 45% 51%
A K
Some purchaserestrictions should berequired
390 291 - - - - - - - - 390 29135% 29% - - - - - - - - 35% 29%B L
No purchase restrictionsshould be required
1110 996 - - - - - - - - 1110 996100% 100% - - - - - - - - 100% 100%
Sigma
_________________________________________________________________________________________________________________Proportions/Means: Columns Tested (5% risk level) - A/B - C/D - E/F - G/H - I/J - K/L - A/C/E/G/I/K - B/D/F/H/J/LOverlap formulae used. ** very small base (under 30) ineligible for sig testing
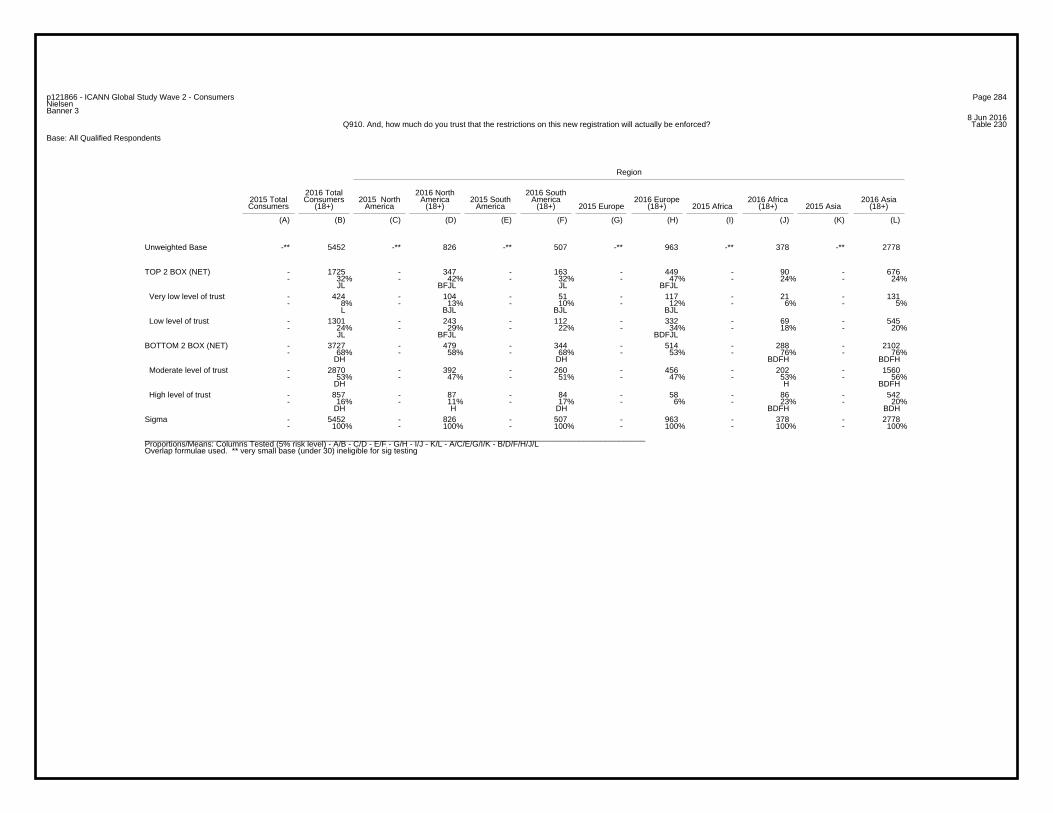
Page 284p121866 - ICANN Global Study Wave 2 - ConsumersNielsenBanner 3
8 Jun 2016Table 230Q910. And, how much do you trust that the restrictions on this new registration will actually be enforced?
Base: All Qualified Respondents
Region
2016 Total 2016 North 2016 South2015 Total Consumers 2015 North America 2015 South America 2016 Europe 2016 Africa 2016 AsiaConsumers (18+) America (18+) America (18+) 2015 Europe (18+) 2015 Africa (18+) 2015 Asia (18+)
(A) (B) (C) (D) (E) (F) (G) (H) (I) (J) (K) (L)
-** 5452 -** 826 -** 507 -** 963 -** 378 -** 2778Unweighted Base
- 1725 - 347 - 163 - 449 - 90 - 676- 32% - 42% - 32% - 47% - 24% - 24%
JL BFJL JL BFJL
TOP 2 BOX (NET)
- 424 - 104 - 51 - 117 - 21 - 131- 8% - 13% - 10% - 12% - 6% - 5%
L BJL BJL BJL
Very low level of trust
- 1301 - 243 - 112 - 332 - 69 - 545- 24% - 29% - 22% - 34% - 18% - 20%
JL BFJL BDFJL
Low level of trust
- 3727 - 479 - 344 - 514 - 288 - 2102- 68% - 58% - 68% - 53% - 76% - 76%
DH DH BDFH BDFH
BOTTOM 2 BOX (NET)
- 2870 - 392 - 260 - 456 - 202 - 1560- 53% - 47% - 51% - 47% - 53% - 56%
DH H BDFH
Moderate level of trust
- 857 - 87 - 84 - 58 - 86 - 542- 16% - 11% - 17% - 6% - 23% - 20%
DH H DH BDFH BDH
High level of trust
- 5452 - 826 - 507 - 963 - 378 - 2778- 100% - 100% - 100% - 100% - 100% - 100%
Sigma
_________________________________________________________________________________________________________________Proportions/Means: Columns Tested (5% risk level) - A/B - C/D - E/F - G/H - I/J - K/L - A/C/E/G/I/K - B/D/F/H/J/LOverlap formulae used. ** very small base (under 30) ineligible for sig testing
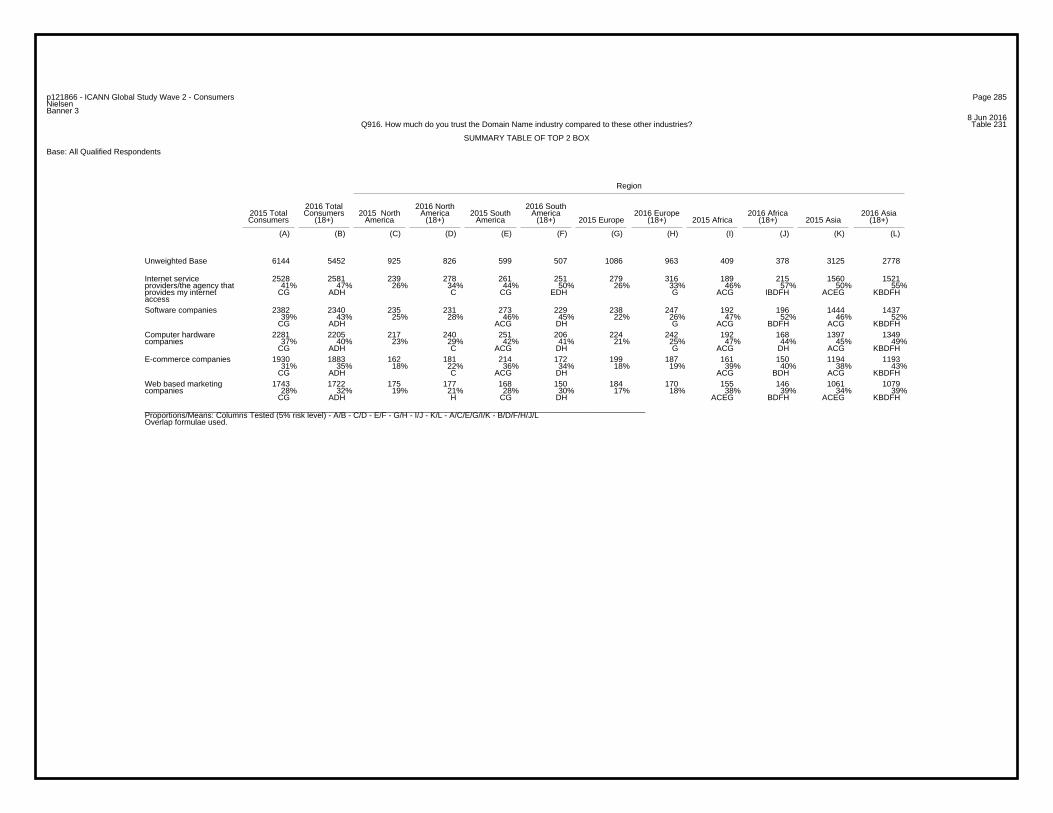
Page 285p121866 - ICANN Global Study Wave 2 - ConsumersNielsenBanner 3
8 Jun 2016Table 231Q916. How much do you trust the Domain Name industry compared to these other industries?
SUMMARY TABLE OF TOP 2 BOX
Base: All Qualified Respondents
Region
2016 Total 2016 North 2016 South2015 Total Consumers 2015 North America 2015 South America 2016 Europe 2016 Africa 2016 AsiaConsumers (18+) America (18+) America (18+) 2015 Europe (18+) 2015 Africa (18+) 2015 Asia (18+)
(A) (B) (C) (D) (E) (F) (G) (H) (I) (J) (K) (L)
6144 5452 925 826 599 507 1086 963 409 378 3125 2778Unweighted Base
2528 2581 239 278 261 251 279 316 189 215 1560 152141% 47% 26% 34% 44% 50% 26% 33% 46% 57% 50% 55%
CG ADH C CG EDH G ACG IBDFH ACEG KBDFH
Internet serviceproviders/the agency thatprovides my internetaccess
2382 2340 235 231 273 229 238 247 192 196 1444 143739% 43% 25% 28% 46% 45% 22% 26% 47% 52% 46% 52%
CG ADH ACG DH G ACG BDFH ACG KBDFH
Software companies
2281 2205 217 240 251 206 224 242 192 168 1397 134937% 40% 23% 29% 42% 41% 21% 25% 47% 44% 45% 49%
CG ADH C ACG DH G ACG DH ACG KBDFH
Computer hardwarecompanies
1930 1883 162 181 214 172 199 187 161 150 1194 119331% 35% 18% 22% 36% 34% 18% 19% 39% 40% 38% 43%
CG ADH C ACG DH ACG BDH ACG KBDFH
E-commerce companies
1743 1722 175 177 168 150 184 170 155 146 1061 107928% 32% 19% 21% 28% 30% 17% 18% 38% 39% 34% 39%
CG ADH H CG DH ACEG BDFH ACEG KBDFH
Web based marketingcompanies
_________________________________________________________________________________________________________________Proportions/Means: Columns Tested (5% risk level) - A/B - C/D - E/F - G/H - I/J - K/L - A/C/E/G/I/K - B/D/F/H/J/LOverlap formulae used.

Page 286p121866 - ICANN Global Study Wave 2 - ConsumersNielsenBanner 3
8 Jun 2016Table 232Q916. How much do you trust the Domain Name industry compared to these other industries?
SUMMARY TABLE OF BOTTOM 2 BOX
Base: All Qualified Respondents
Region
2016 Total 2016 North 2016 South2015 Total Consumers 2015 North America 2015 South America 2016 Europe 2016 Africa 2016 AsiaConsumers (18+) America (18+) America (18+) 2015 Europe (18+) 2015 Africa (18+) 2015 Asia (18+)
(A) (B) (C) (D) (E) (F) (G) (H) (I) (J) (K) (L)
6144 5452 925 826 599 507 1086 963 409 378 3125 2778Unweighted Base
1559 1365 233 237 181 172 354 285 86 95 705 57625% 25% 25% 29% 30% 34% 33% 30% 21% 25% 23% 21%IK L BL ACIK BDJL ACIK BL
Web based marketingcompanies
1342 1156 236 207 138 146 318 252 81 83 569 46822% 21% 26% 25% 23% 29% 29% 26% 20% 22% 18% 17%K L AIK BL K EBJL AEIK BL L
E-commerce companies
1146 950 250 180 108 106 268 206 66 71 454 38719% 17% 27% 22% 18% 21% 25% 21% 16% 19% 15% 14%K L DAEIK BL K BL AEIK BL L
Computer hardwarecompanies
1061 880 239 173 94 96 243 207 63 61 422 34317% 16% 26% 21% 16% 19% 22% 21% 15% 16% 14% 12%K L DAEIK BL L AEIK BJL L
Software companies
1034 777 229 152 102 89 249 179 55 48 399 30917% 14% 25% 18% 17% 18% 23% 19% 13% 13% 13% 11%BK L DAEIK BJL K BJL HAEIK BJL
Internet serviceproviders/the agency thatprovides my internetaccess_________________________________________________________________________________________________________________Proportions/Means: Columns Tested (5% risk level) - A/B - C/D - E/F - G/H - I/J - K/L - A/C/E/G/I/K - B/D/F/H/J/LOverlap formulae used.
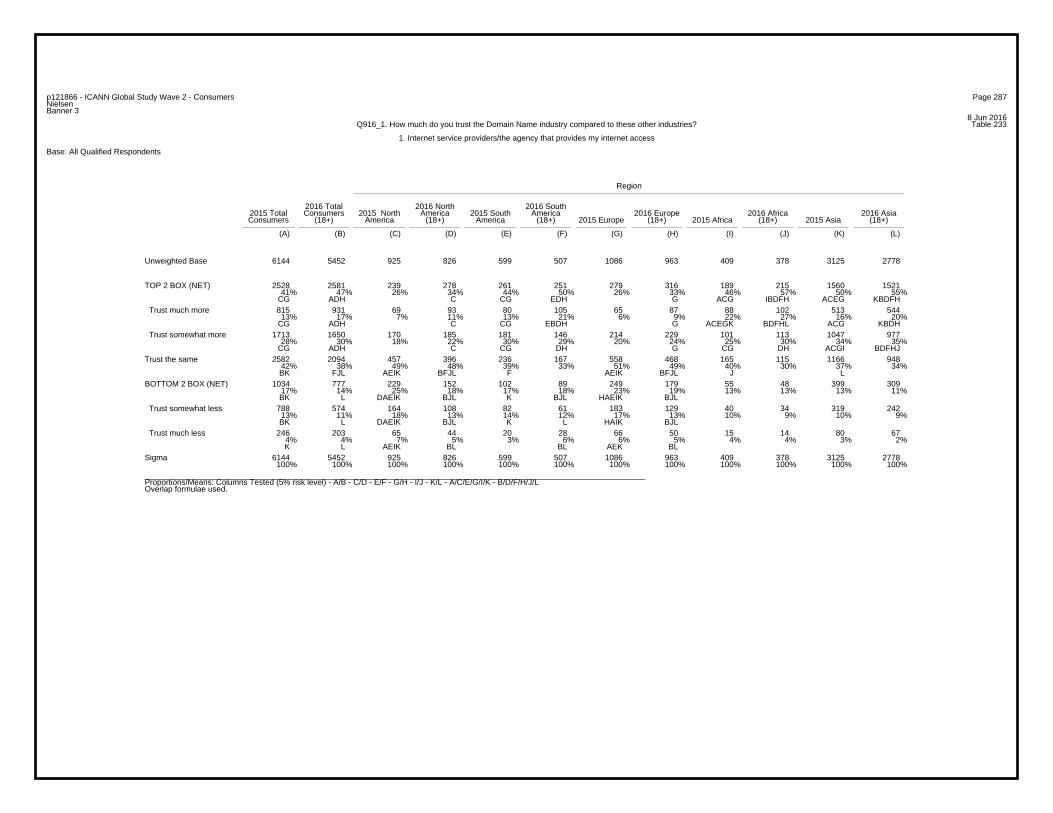
Page 287p121866 - ICANN Global Study Wave 2 - ConsumersNielsenBanner 3
8 Jun 2016Table 233Q916_1. How much do you trust the Domain Name industry compared to these other industries?
1. Internet service providers/the agency that provides my internet access
Base: All Qualified Respondents
Region
2016 Total 2016 North 2016 South2015 Total Consumers 2015 North America 2015 South America 2016 Europe 2016 Africa 2016 AsiaConsumers (18+) America (18+) America (18+) 2015 Europe (18+) 2015 Africa (18+) 2015 Asia (18+)
(A) (B) (C) (D) (E) (F) (G) (H) (I) (J) (K) (L)
6144 5452 925 826 599 507 1086 963 409 378 3125 2778Unweighted Base
2528 2581 239 278 261 251 279 316 189 215 1560 152141% 47% 26% 34% 44% 50% 26% 33% 46% 57% 50% 55%
CG ADH C CG EDH G ACG IBDFH ACEG KBDFH
TOP 2 BOX (NET)
815 931 69 93 80 105 65 87 88 102 513 54413% 17% 7% 11% 13% 21% 6% 9% 22% 27% 16% 20%
CG ADH C CG EBDH G ACEGK BDFHL ACG KBDH
Trust much more
1713 1650 170 185 181 146 214 229 101 113 1047 97728% 30% 18% 22% 30% 29% 20% 24% 25% 30% 34% 35%
CG ADH C CG DH G CG DH ACGI BDFHJ
Trust somewhat more
2582 2094 457 396 236 167 558 468 165 115 1166 94842% 38% 49% 48% 39% 33% 51% 49% 40% 30% 37% 34%BK FJL AEIK BFJL F AEIK BFJL J L
Trust the same
1034 777 229 152 102 89 249 179 55 48 399 30917% 14% 25% 18% 17% 18% 23% 19% 13% 13% 13% 11%BK L DAEIK BJL K BJL HAEIK BJL
BOTTOM 2 BOX (NET)
788 574 164 108 82 61 183 129 40 34 319 24213% 11% 18% 13% 14% 12% 17% 13% 10% 9% 10% 9%BK L DAEIK BJL K L HAIK BJL
Trust somewhat less
246 203 65 44 20 28 66 50 15 14 80 674% 4% 7% 5% 3% 6% 6% 5% 4% 4% 3% 2%K L AEIK BL BL AEK BL
Trust much less
6144 5452 925 826 599 507 1086 963 409 378 3125 2778100% 100% 100% 100% 100% 100% 100% 100% 100% 100% 100% 100%
Sigma
_________________________________________________________________________________________________________________Proportions/Means: Columns Tested (5% risk level) - A/B - C/D - E/F - G/H - I/J - K/L - A/C/E/G/I/K - B/D/F/H/J/LOverlap formulae used.
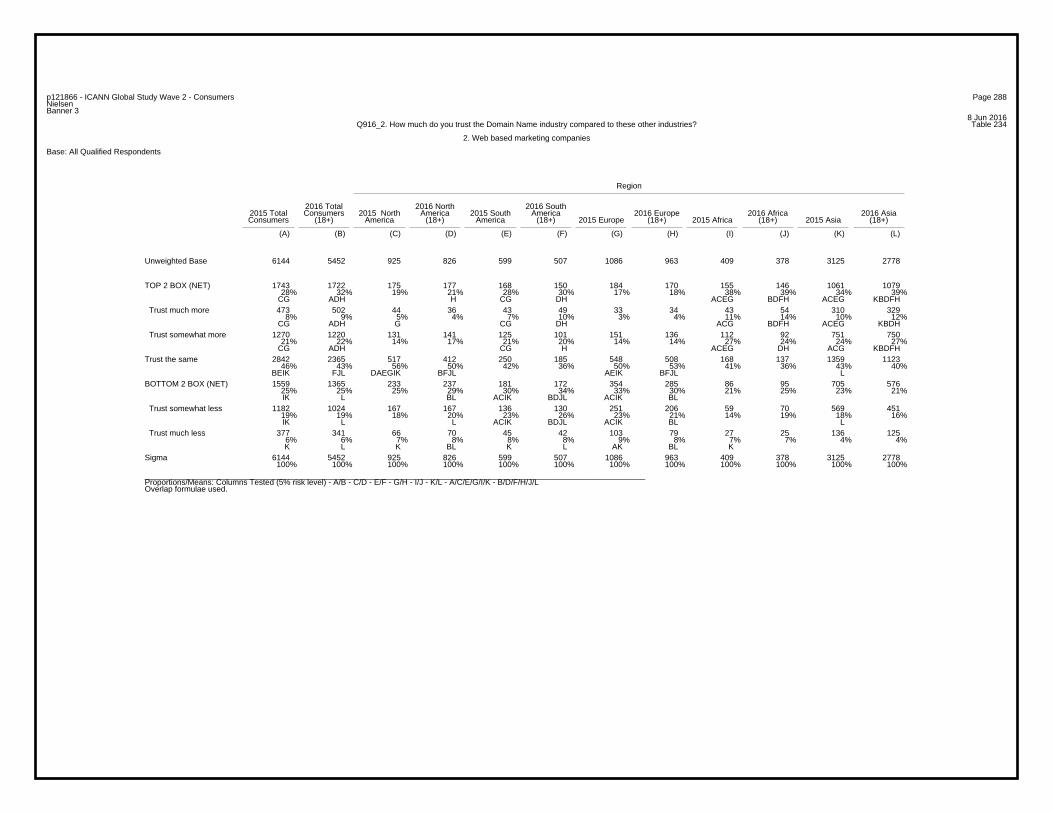
Page 288p121866 - ICANN Global Study Wave 2 - ConsumersNielsenBanner 3
8 Jun 2016Table 234Q916_2. How much do you trust the Domain Name industry compared to these other industries?
2. Web based marketing companies
Base: All Qualified Respondents
Region
2016 Total 2016 North 2016 South2015 Total Consumers 2015 North America 2015 South America 2016 Europe 2016 Africa 2016 AsiaConsumers (18+) America (18+) America (18+) 2015 Europe (18+) 2015 Africa (18+) 2015 Asia (18+)
(A) (B) (C) (D) (E) (F) (G) (H) (I) (J) (K) (L)
6144 5452 925 826 599 507 1086 963 409 378 3125 2778Unweighted Base
1743 1722 175 177 168 150 184 170 155 146 1061 107928% 32% 19% 21% 28% 30% 17% 18% 38% 39% 34% 39%
CG ADH H CG DH ACEG BDFH ACEG KBDFH
TOP 2 BOX (NET)
473 502 44 36 43 49 33 34 43 54 310 3298% 9% 5% 4% 7% 10% 3% 4% 11% 14% 10% 12%
CG ADH G CG DH ACG BDFH ACEG KBDH
Trust much more
1270 1220 131 141 125 101 151 136 112 92 751 75021% 22% 14% 17% 21% 20% 14% 14% 27% 24% 24% 27%
CG ADH CG H ACEG DH ACG KBDFH
Trust somewhat more
2842 2365 517 412 250 185 548 508 168 137 1359 112346% 43% 56% 50% 42% 36% 50% 53% 41% 36% 43% 40%
BEIK FJL DAEGIK BFJL AEIK BFJL L
Trust the same
1559 1365 233 237 181 172 354 285 86 95 705 57625% 25% 25% 29% 30% 34% 33% 30% 21% 25% 23% 21%IK L BL ACIK BDJL ACIK BL
BOTTOM 2 BOX (NET)
1182 1024 167 167 136 130 251 206 59 70 569 45119% 19% 18% 20% 23% 26% 23% 21% 14% 19% 18% 16%IK L L ACIK BDJL ACIK BL L
Trust somewhat less
377 341 66 70 45 42 103 79 27 25 136 1256% 6% 7% 8% 8% 8% 9% 8% 7% 7% 4% 4%K L K BL K L AK BL K
Trust much less
6144 5452 925 826 599 507 1086 963 409 378 3125 2778100% 100% 100% 100% 100% 100% 100% 100% 100% 100% 100% 100%
Sigma
_________________________________________________________________________________________________________________Proportions/Means: Columns Tested (5% risk level) - A/B - C/D - E/F - G/H - I/J - K/L - A/C/E/G/I/K - B/D/F/H/J/LOverlap formulae used.
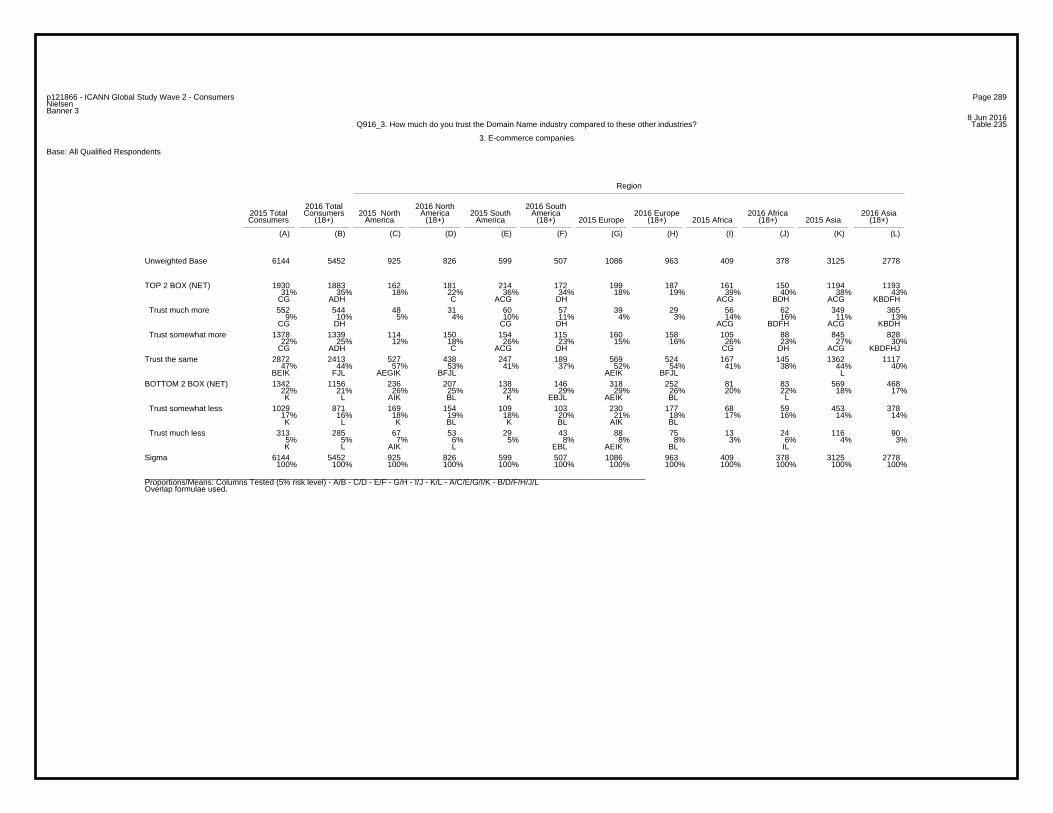
Page 289p121866 - ICANN Global Study Wave 2 - ConsumersNielsenBanner 3
8 Jun 2016Table 235Q916_3. How much do you trust the Domain Name industry compared to these other industries?
3. E-commerce companies
Base: All Qualified Respondents
Region
2016 Total 2016 North 2016 South2015 Total Consumers 2015 North America 2015 South America 2016 Europe 2016 Africa 2016 AsiaConsumers (18+) America (18+) America (18+) 2015 Europe (18+) 2015 Africa (18+) 2015 Asia (18+)
(A) (B) (C) (D) (E) (F) (G) (H) (I) (J) (K) (L)
6144 5452 925 826 599 507 1086 963 409 378 3125 2778Unweighted Base
1930 1883 162 181 214 172 199 187 161 150 1194 119331% 35% 18% 22% 36% 34% 18% 19% 39% 40% 38% 43%
CG ADH C ACG DH ACG BDH ACG KBDFH
TOP 2 BOX (NET)
552 544 48 31 60 57 39 29 56 62 349 3659% 10% 5% 4% 10% 11% 4% 3% 14% 16% 11% 13%
CG DH CG DH ACG BDFH ACG KBDH
Trust much more
1378 1339 114 150 154 115 160 158 105 88 845 82822% 25% 12% 18% 26% 23% 15% 16% 26% 23% 27% 30%
CG ADH C ACG DH CG DH ACG KBDFHJ
Trust somewhat more
2872 2413 527 438 247 189 569 524 167 145 1362 111747% 44% 57% 53% 41% 37% 52% 54% 41% 38% 44% 40%
BEIK FJL AEGIK BFJL AEIK BFJL L
Trust the same
1342 1156 236 207 138 146 318 252 81 83 569 46822% 21% 26% 25% 23% 29% 29% 26% 20% 22% 18% 17%K L AIK BL K EBJL AEIK BL L
BOTTOM 2 BOX (NET)
1029 871 169 154 109 103 230 177 68 59 453 37817% 16% 18% 19% 18% 20% 21% 18% 17% 16% 14% 14%K L K BL K BL AIK BL
Trust somewhat less
313 285 67 53 29 43 88 75 13 24 116 905% 5% 7% 6% 5% 8% 8% 8% 3% 6% 4% 3%K L AIK L EBL AEIK BL IL
Trust much less
6144 5452 925 826 599 507 1086 963 409 378 3125 2778100% 100% 100% 100% 100% 100% 100% 100% 100% 100% 100% 100%
Sigma
_________________________________________________________________________________________________________________Proportions/Means: Columns Tested (5% risk level) - A/B - C/D - E/F - G/H - I/J - K/L - A/C/E/G/I/K - B/D/F/H/J/LOverlap formulae used.
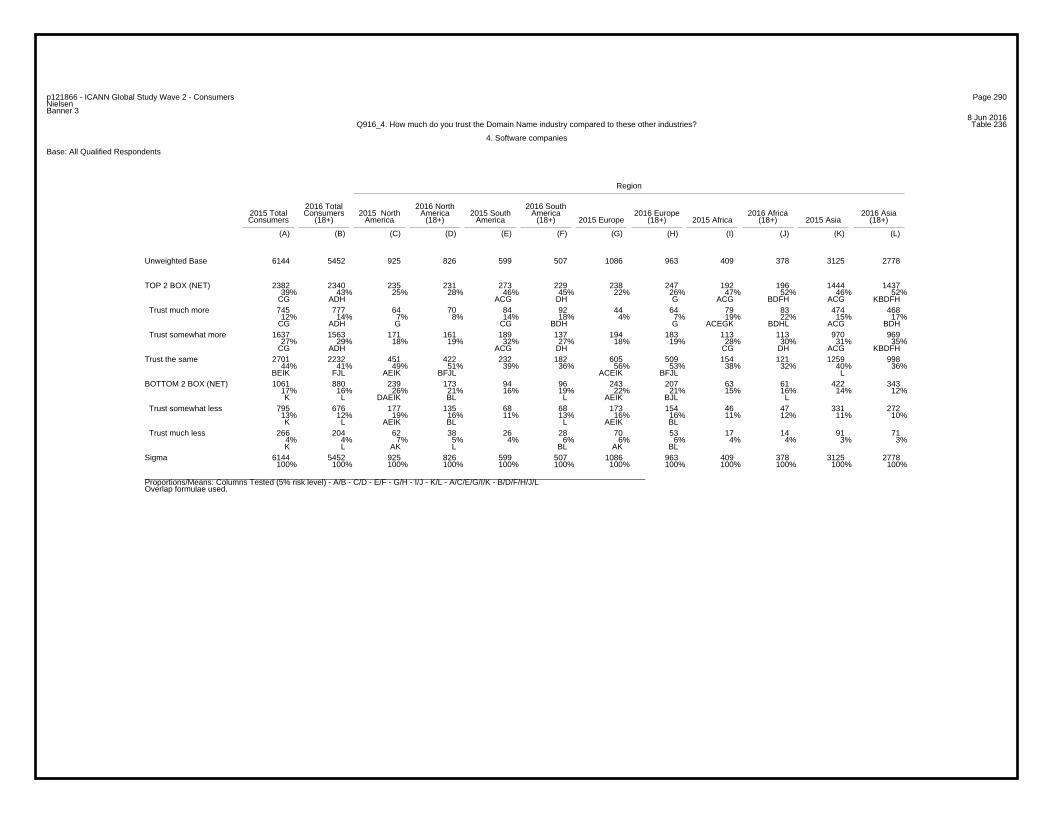
Page 290p121866 - ICANN Global Study Wave 2 - ConsumersNielsenBanner 3
8 Jun 2016Table 236Q916_4. How much do you trust the Domain Name industry compared to these other industries?
4. Software companies
Base: All Qualified Respondents
Region
2016 Total 2016 North 2016 South2015 Total Consumers 2015 North America 2015 South America 2016 Europe 2016 Africa 2016 AsiaConsumers (18+) America (18+) America (18+) 2015 Europe (18+) 2015 Africa (18+) 2015 Asia (18+)
(A) (B) (C) (D) (E) (F) (G) (H) (I) (J) (K) (L)
6144 5452 925 826 599 507 1086 963 409 378 3125 2778Unweighted Base
2382 2340 235 231 273 229 238 247 192 196 1444 143739% 43% 25% 28% 46% 45% 22% 26% 47% 52% 46% 52%
CG ADH ACG DH G ACG BDFH ACG KBDFH
TOP 2 BOX (NET)
745 777 64 70 84 92 44 64 79 83 474 46812% 14% 7% 8% 14% 18% 4% 7% 19% 22% 15% 17%
CG ADH G CG BDH G ACEGK BDHL ACG BDH
Trust much more
1637 1563 171 161 189 137 194 183 113 113 970 96927% 29% 18% 19% 32% 27% 18% 19% 28% 30% 31% 35%
CG ADH ACG DH CG DH ACG KBDFH
Trust somewhat more
2701 2232 451 422 232 182 605 509 154 121 1259 99844% 41% 49% 51% 39% 36% 56% 53% 38% 32% 40% 36%
BEIK FJL AEIK BFJL ACEIK BFJL L
Trust the same
1061 880 239 173 94 96 243 207 63 61 422 34317% 16% 26% 21% 16% 19% 22% 21% 15% 16% 14% 12%K L DAEIK BL L AEIK BJL L
BOTTOM 2 BOX (NET)
795 676 177 135 68 68 173 154 46 47 331 27213% 12% 19% 16% 11% 13% 16% 16% 11% 12% 11% 10%K L AEIK BL L AEIK BL
Trust somewhat less
266 204 62 38 26 28 70 53 17 14 91 714% 4% 7% 5% 4% 6% 6% 6% 4% 4% 3% 3%K L AK L BL AK BL
Trust much less
6144 5452 925 826 599 507 1086 963 409 378 3125 2778100% 100% 100% 100% 100% 100% 100% 100% 100% 100% 100% 100%
Sigma
_________________________________________________________________________________________________________________Proportions/Means: Columns Tested (5% risk level) - A/B - C/D - E/F - G/H - I/J - K/L - A/C/E/G/I/K - B/D/F/H/J/LOverlap formulae used.
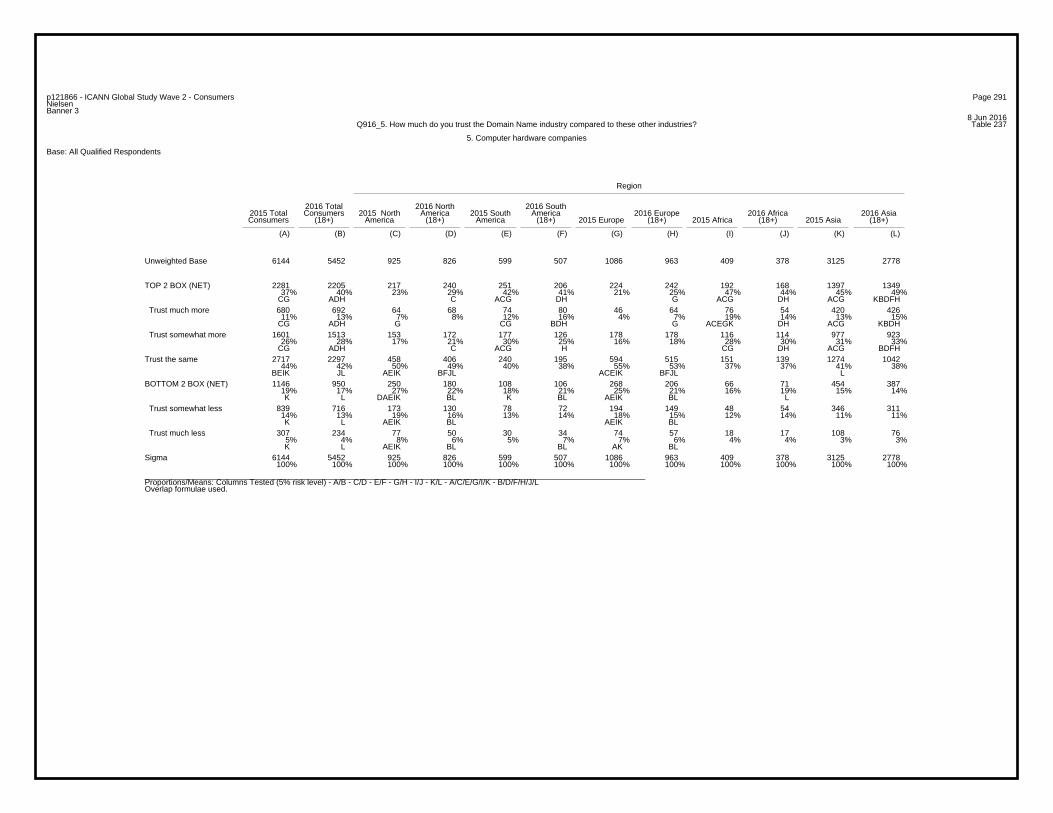
Page 291p121866 - ICANN Global Study Wave 2 - ConsumersNielsenBanner 3
8 Jun 2016Table 237Q916_5. How much do you trust the Domain Name industry compared to these other industries?
5. Computer hardware companies
Base: All Qualified Respondents
Region
2016 Total 2016 North 2016 South2015 Total Consumers 2015 North America 2015 South America 2016 Europe 2016 Africa 2016 AsiaConsumers (18+) America (18+) America (18+) 2015 Europe (18+) 2015 Africa (18+) 2015 Asia (18+)
(A) (B) (C) (D) (E) (F) (G) (H) (I) (J) (K) (L)
6144 5452 925 826 599 507 1086 963 409 378 3125 2778Unweighted Base
2281 2205 217 240 251 206 224 242 192 168 1397 134937% 40% 23% 29% 42% 41% 21% 25% 47% 44% 45% 49%
CG ADH C ACG DH G ACG DH ACG KBDFH
TOP 2 BOX (NET)
680 692 64 68 74 80 46 64 76 54 420 42611% 13% 7% 8% 12% 16% 4% 7% 19% 14% 13% 15%
CG ADH G CG BDH G ACEGK DH ACG KBDH
Trust much more
1601 1513 153 172 177 126 178 178 116 114 977 92326% 28% 17% 21% 30% 25% 16% 18% 28% 30% 31% 33%
CG ADH C ACG H CG DH ACG BDFH
Trust somewhat more
2717 2297 458 406 240 195 594 515 151 139 1274 104244% 42% 50% 49% 40% 38% 55% 53% 37% 37% 41% 38%
BEIK JL AEIK BFJL ACEIK BFJL L
Trust the same
1146 950 250 180 108 106 268 206 66 71 454 38719% 17% 27% 22% 18% 21% 25% 21% 16% 19% 15% 14%K L DAEIK BL K BL AEIK BL L
BOTTOM 2 BOX (NET)
839 716 173 130 78 72 194 149 48 54 346 31114% 13% 19% 16% 13% 14% 18% 15% 12% 14% 11% 11%K L AEIK BL AEIK BL
Trust somewhat less
307 234 77 50 30 34 74 57 18 17 108 765% 4% 8% 6% 5% 7% 7% 6% 4% 4% 3% 3%K L AEIK BL BL AK BL
Trust much less
6144 5452 925 826 599 507 1086 963 409 378 3125 2778100% 100% 100% 100% 100% 100% 100% 100% 100% 100% 100% 100%
Sigma
_________________________________________________________________________________________________________________Proportions/Means: Columns Tested (5% risk level) - A/B - C/D - E/F - G/H - I/J - K/L - A/C/E/G/I/K - B/D/F/H/J/LOverlap formulae used.
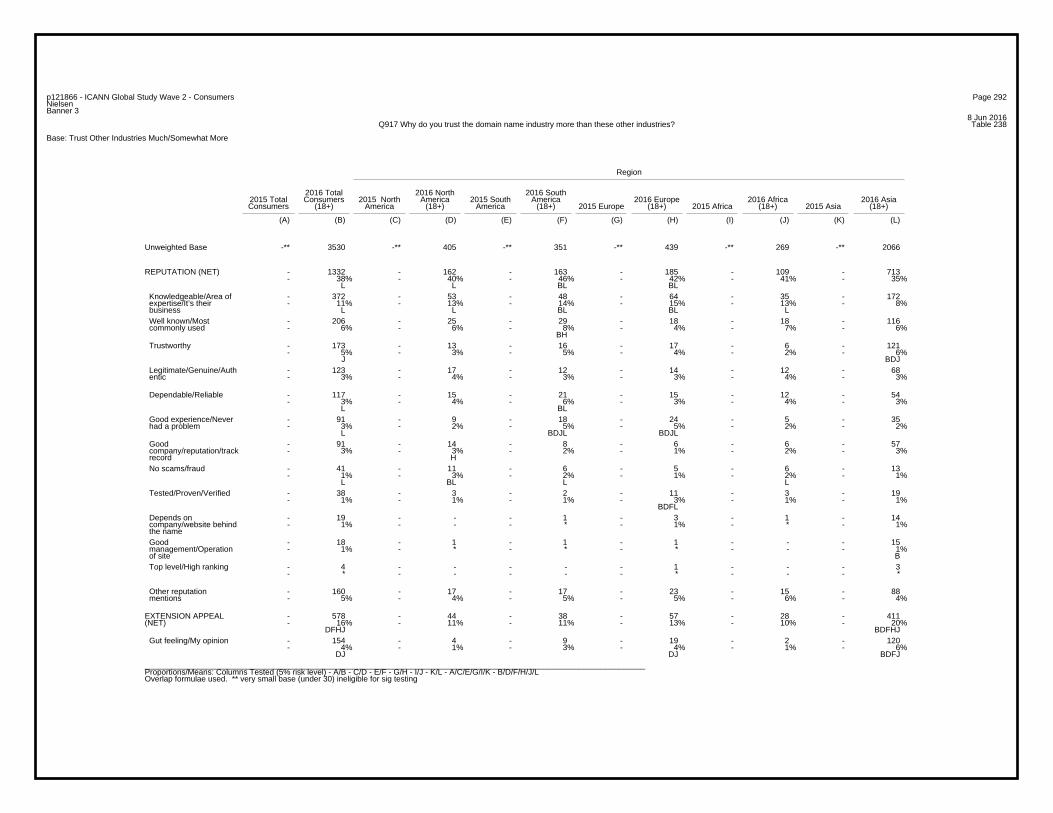
Page 292p121866 - ICANN Global Study Wave 2 - ConsumersNielsenBanner 3
8 Jun 2016Table 238Q917 Why do you trust the domain name industry more than these other industries?
Base: Trust Other Industries Much/Somewhat More
Region
2016 Total 2016 North 2016 South2015 Total Consumers 2015 North America 2015 South America 2016 Europe 2016 Africa 2016 AsiaConsumers (18+) America (18+) America (18+) 2015 Europe (18+) 2015 Africa (18+) 2015 Asia (18+)
(A) (B) (C) (D) (E) (F) (G) (H) (I) (J) (K) (L)
-** 3530 -** 405 -** 351 -** 439 -** 269 -** 2066Unweighted Base
- 1332 - 162 - 163 - 185 - 109 - 713- 38% - 40% - 46% - 42% - 41% - 35%
L L BL BL
REPUTATION (NET)
- 372 - 53 - 48 - 64 - 35 - 172- 11% - 13% - 14% - 15% - 13% - 8%
L L BL BL L
Knowledgeable/Area of expertise/It’s their business
- 206 - 25 - 29 - 18 - 18 - 116- 6% - 6% - 8% - 4% - 7% - 6%
BH
Well known/Most commonly used
- 173 - 13 - 16 - 17 - 6 - 121- 5% - 3% - 5% - 4% - 2% - 6%
J BDJ
Trustworthy
- 123 - 17 - 12 - 14 - 12 - 68- 3% - 4% - 3% - 3% - 4% - 3%
Legitimate/Genuine/Auth entic
- 117 - 15 - 21 - 15 - 12 - 54- 3% - 4% - 6% - 3% - 4% - 3%
L BL
Dependable/Reliable
- 91 - 9 - 18 - 24 - 5 - 35- 3% - 2% - 5% - 5% - 2% - 2%
L BDJL BDJL
Good experience/Never had a problem
- 91 - 14 - 8 - 6 - 6 - 57- 3% - 3% - 2% - 1% - 2% - 3%
H
Good company/reputation/track record
- 41 - 11 - 6 - 5 - 6 - 13- 1% - 3% - 2% - 1% - 2% - 1%
L BL L L
No scams/fraud
- 38 - 3 - 2 - 11 - 3 - 19- 1% - 1% - 1% - 3% - 1% - 1%
BDFL
Tested/Proven/Verified
- 19 - - - 1 - 3 - 1 - 14- 1% - - - * - 1% - * - 1%
Depends on company/website behind the name
- 18 - 1 - 1 - 1 - - - 15- 1% - * - * - * - - - 1%
B
Good management/Operation of site
- 4 - - - - - 1 - - - 3- * - - - - - * - - - *
Top level/High ranking
- 160 - 17 - 17 - 23 - 15 - 88- 5% - 4% - 5% - 5% - 6% - 4%
Other reputation mentions
- 578 - 44 - 38 - 57 - 28 - 411- 16% - 11% - 11% - 13% - 10% - 20%
DFHJ BDFHJ
EXTENSION APPEAL(NET)
- 154 - 4 - 9 - 19 - 2 - 120- 4% - 1% - 3% - 4% - 1% - 6%
DJ DJ BDFJ
Gut feeling/My opinion
_________________________________________________________________________________________________________________Proportions/Means: Columns Tested (5% risk level) - A/B - C/D - E/F - G/H - I/J - K/L - A/C/E/G/I/K - B/D/F/H/J/LOverlap formulae used. ** very small base (under 30) ineligible for sig testing

Page 293p121866 - ICANN Global Study Wave 2 - ConsumersNielsenBanner 3
8 Jun 2016Table 238Q917 Why do you trust the domain name industry more than these other industries?
Base: Trust Other Industries Much/Somewhat More
Region
2016 Total 2016 North 2016 South2015 Total Consumers 2015 North America 2015 South America 2016 Europe 2016 Africa 2016 AsiaConsumers (18+) America (18+) America (18+) 2015 Europe (18+) 2015 Africa (18+) 2015 Asia (18+)
(A) (B) (C) (D) (E) (F) (G) (H) (I) (J) (K) (L)
-** 3530 -** 405 -** 351 -** 439 -** 269 -** 2066Unweighted Base- 132 - - - 2 - 10 - 4 - 116- 4% - - - 1% - 2% - 1% - 6%
DFJ D D BDFHJ
Professional
- 50 - 9 - 3 - 3 - 1 - 34- 1% - 2% - 1% - 1% - * - 2%
Good/Like domain
- 50 - 3 - 4 - 6 - 5 - 32- 1% - 1% - 1% - 1% - 2% - 2%
Relevant to topic/Specific to the domain
- 33 - 9 - 8 - 6 - 2 - 8- 1% - 2% - 2% - 1% - 1% - *
L BL BL L
Believable/Confidence/C onvincing
- 13 - 1 - 1 - 1 - 2 - 8- * - * - * - * - 1% - *
Accurate
- 11 - 2 - 1 - - - 1 - 7- * - * - * - - - * - *
Better/Best
- 11 - 2 - - - 2 - - - 7- * - * - - - * - - - *
Ordinary/Traditional/Con ventional
- 10 - - - 1 - 1 - - - 8- * - - - * - * - - - *
Curiosity/Interesting
- 8 - 1 - 1 - - - 1 - 5- * - * - * - - - * - *
Same/Similar to others
- 4 - 1 - - - - - - - 3- * - * - - - - - - - *
Nothing looks/sounds suspicious
- 4 - - - - - - - - - 4- * - - - - - - - - - *
Wording makes sense
- 3 - - - 1 - 1 - - - 1- * - - - * - * - - - *
All/Everything
- 2 - - - - - - - - - 2- * - - - - - - - - - *
It’s meaning/Meaningful
- - - - - - - - - - - -- - - - - - - - - - - -
I don’t pay attention/Wouldn’t notice
- - - - - - - - - - - -- - - - - - - - - - - -
Short wording
- - - - - - - - - - - -- - - - - - - - - - - -
Depends on language
- 105 - 13 - 8 - 12 - 10 - 62- 3% - 3% - 2% - 3% - 4% - 3%
Other extension appeal mentions
_________________________________________________________________________________________________________________Proportions/Means: Columns Tested (5% risk level) - A/B - C/D - E/F - G/H - I/J - K/L - A/C/E/G/I/K - B/D/F/H/J/LOverlap formulae used. ** very small base (under 30) ineligible for sig testing
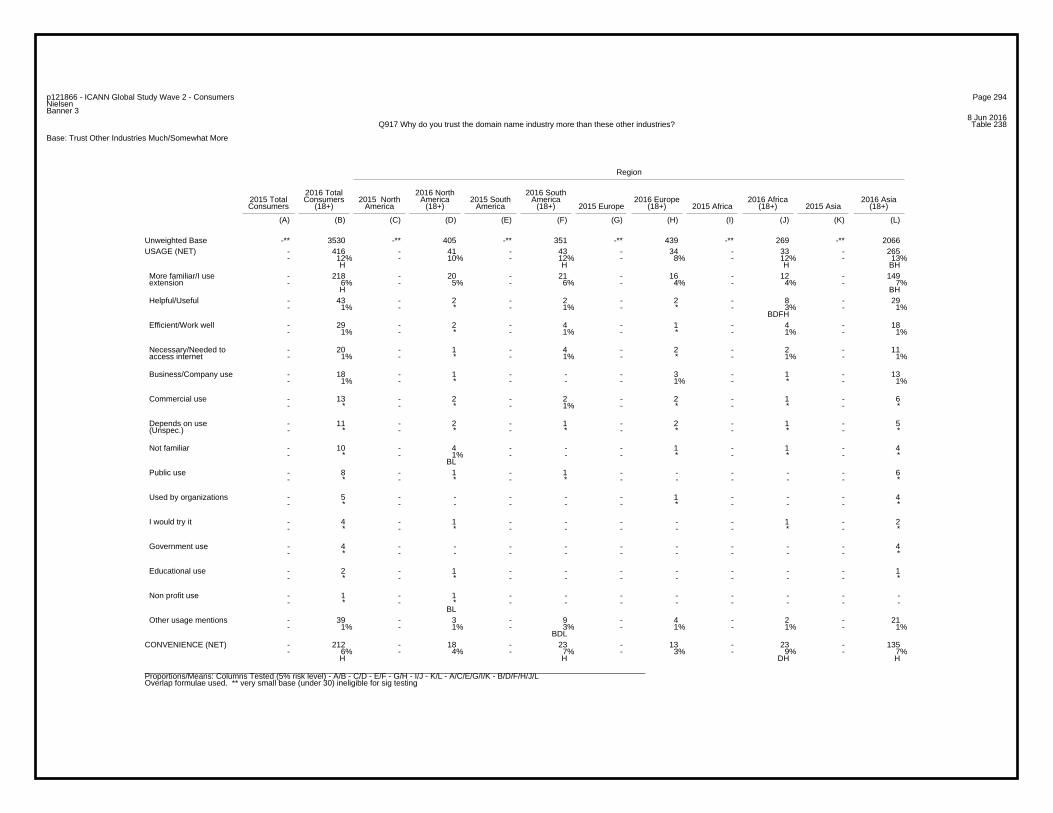
Page 294p121866 - ICANN Global Study Wave 2 - ConsumersNielsenBanner 3
8 Jun 2016Table 238Q917 Why do you trust the domain name industry more than these other industries?
Base: Trust Other Industries Much/Somewhat More
Region
2016 Total 2016 North 2016 South2015 Total Consumers 2015 North America 2015 South America 2016 Europe 2016 Africa 2016 AsiaConsumers (18+) America (18+) America (18+) 2015 Europe (18+) 2015 Africa (18+) 2015 Asia (18+)
(A) (B) (C) (D) (E) (F) (G) (H) (I) (J) (K) (L)
-** 3530 -** 405 -** 351 -** 439 -** 269 -** 2066Unweighted Base- 416 - 41 - 43 - 34 - 33 - 265- 12% - 10% - 12% - 8% - 12% - 13%
H H H BH
USAGE (NET)
- 218 - 20 - 21 - 16 - 12 - 149- 6% - 5% - 6% - 4% - 4% - 7%
H BH
More familiar/I use extension
- 43 - 2 - 2 - 2 - 8 - 29- 1% - * - 1% - * - 3% - 1%
BDFH
Helpful/Useful
- 29 - 2 - 4 - 1 - 4 - 18- 1% - * - 1% - * - 1% - 1%
Efficient/Work well
- 20 - 1 - 4 - 2 - 2 - 11- 1% - * - 1% - * - 1% - 1%
Necessary/Needed to access internet
- 18 - 1 - - - 3 - 1 - 13- 1% - * - - - 1% - * - 1%
Business/Company use
- 13 - 2 - 2 - 2 - 1 - 6- * - * - 1% - * - * - *
Commercial use
- 11 - 2 - 1 - 2 - 1 - 5- * - * - * - * - * - *
Depends on use (Unspec.)
- 10 - 4 - - - 1 - 1 - 4- * - 1% - - - * - * - *
BL
Not familiar
- 8 - 1 - 1 - - - - - 6- * - * - * - - - - - *
Public use
- 5 - - - - - 1 - - - 4- * - - - - - * - - - *
Used by organizations
- 4 - 1 - - - - - 1 - 2- * - * - - - - - * - *
I would try it
- 4 - - - - - - - - - 4- * - - - - - - - - - *
Government use
- 2 - 1 - - - - - - - 1- * - * - - - - - - - *
Educational use
- 1 - 1 - - - - - - - -- * - * - - - - - - - -
BL
Non profit use
- 39 - 3 - 9 - 4 - 2 - 21- 1% - 1% - 3% - 1% - 1% - 1%
BDL
Other usage mentions
- 212 - 18 - 23 - 13 - 23 - 135- 6% - 4% - 7% - 3% - 9% - 7%
H H DH H
CONVENIENCE (NET)
_________________________________________________________________________________________________________________Proportions/Means: Columns Tested (5% risk level) - A/B - C/D - E/F - G/H - I/J - K/L - A/C/E/G/I/K - B/D/F/H/J/LOverlap formulae used. ** very small base (under 30) ineligible for sig testing
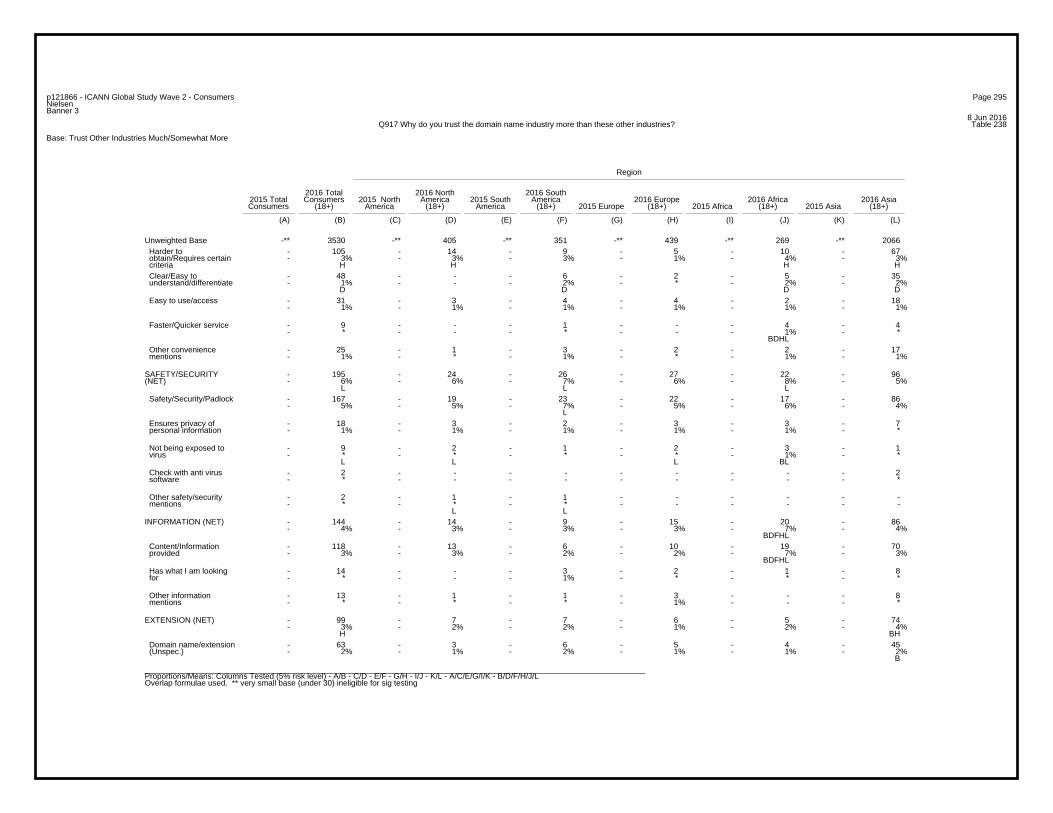
Page 295p121866 - ICANN Global Study Wave 2 - ConsumersNielsenBanner 3
8 Jun 2016Table 238Q917 Why do you trust the domain name industry more than these other industries?
Base: Trust Other Industries Much/Somewhat More
Region
2016 Total 2016 North 2016 South2015 Total Consumers 2015 North America 2015 South America 2016 Europe 2016 Africa 2016 AsiaConsumers (18+) America (18+) America (18+) 2015 Europe (18+) 2015 Africa (18+) 2015 Asia (18+)
(A) (B) (C) (D) (E) (F) (G) (H) (I) (J) (K) (L)
-** 3530 -** 405 -** 351 -** 439 -** 269 -** 2066Unweighted Base- 105 - 14 - 9 - 5 - 10 - 67- 3% - 3% - 3% - 1% - 4% - 3%
H H H H
Harder to obtain/Requires certain criteria
- 48 - - - 6 - 2 - 5 - 35- 1% - - - 2% - * - 2% - 2%
D D D D
Clear/Easy to understand/differentiate
- 31 - 3 - 4 - 4 - 2 - 18- 1% - 1% - 1% - 1% - 1% - 1%
Easy to use/access
- 9 - - - 1 - - - 4 - 4- * - - - * - - - 1% - *
BDHL
Faster/Quicker service
- 25 - 1 - 3 - 2 - 2 - 17- 1% - * - 1% - * - 1% - 1%
Other convenience mentions
- 195 - 24 - 26 - 27 - 22 - 96- 6% - 6% - 7% - 6% - 8% - 5%
L L L
SAFETY/SECURITY(NET)
- 167 - 19 - 23 - 22 - 17 - 86- 5% - 5% - 7% - 5% - 6% - 4%
L
Safety/Security/Padlock
- 18 - 3 - 2 - 3 - 3 - 7- 1% - 1% - 1% - 1% - 1% - *
Ensures privacy of personal information
- 9 - 2 - 1 - 2 - 3 - 1- * - * - * - * - 1% - *
L L L BL
Not being exposed to virus
- 2 - - - - - - - - - 2- * - - - - - - - - - *
Check with anti virus software
- 2 - 1 - 1 - - - - - -- * - * - * - - - - - -
L L
Other safety/security mentions
- 144 - 14 - 9 - 15 - 20 - 86- 4% - 3% - 3% - 3% - 7% - 4%
BDFHL
INFORMATION (NET)
- 118 - 13 - 6 - 10 - 19 - 70- 3% - 3% - 2% - 2% - 7% - 3%
BDFHL
Content/Information provided
- 14 - - - 3 - 2 - 1 - 8- * - - - 1% - * - * - *
Has what I am looking for
- 13 - 1 - 1 - 3 - - - 8- * - * - * - 1% - - - *
Other information mentions
- 99 - 7 - 7 - 6 - 5 - 74- 3% - 2% - 2% - 1% - 2% - 4%
H BH
EXTENSION (NET)
- 63 - 3 - 6 - 5 - 4 - 45- 2% - 1% - 2% - 1% - 1% - 2%
B
Domain name/extension (Unspec.)
_________________________________________________________________________________________________________________Proportions/Means: Columns Tested (5% risk level) - A/B - C/D - E/F - G/H - I/J - K/L - A/C/E/G/I/K - B/D/F/H/J/LOverlap formulae used. ** very small base (under 30) ineligible for sig testing
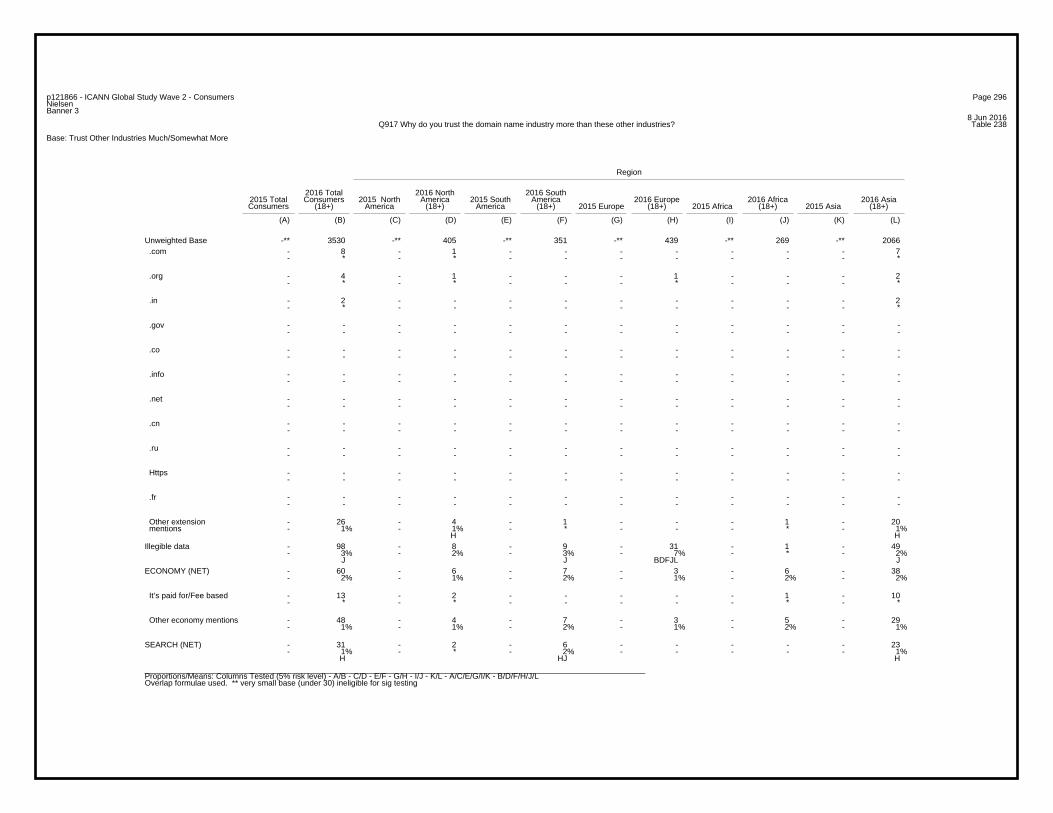
Page 296p121866 - ICANN Global Study Wave 2 - ConsumersNielsenBanner 3
8 Jun 2016Table 238Q917 Why do you trust the domain name industry more than these other industries?
Base: Trust Other Industries Much/Somewhat More
Region
2016 Total 2016 North 2016 South2015 Total Consumers 2015 North America 2015 South America 2016 Europe 2016 Africa 2016 AsiaConsumers (18+) America (18+) America (18+) 2015 Europe (18+) 2015 Africa (18+) 2015 Asia (18+)
(A) (B) (C) (D) (E) (F) (G) (H) (I) (J) (K) (L)
-** 3530 -** 405 -** 351 -** 439 -** 269 -** 2066Unweighted Base- 8 - 1 - - - - - - - 7- * - * - - - - - - - *
.com
- 4 - 1 - - - 1 - - - 2- * - * - - - * - - - *
.org
- 2 - - - - - - - - - 2- * - - - - - - - - - *
.in
- - - - - - - - - - - -- - - - - - - - - - - -
.gov
- - - - - - - - - - - -- - - - - - - - - - - -
.co
- - - - - - - - - - - -- - - - - - - - - - - -
.info
- - - - - - - - - - - -- - - - - - - - - - - -
.net
- - - - - - - - - - - -- - - - - - - - - - - -
.cn
- - - - - - - - - - - -- - - - - - - - - - - -
.ru
- - - - - - - - - - - -- - - - - - - - - - - -
Https
- - - - - - - - - - - -- - - - - - - - - - - -
.fr
- 26 - 4 - 1 - - - 1 - 20- 1% - 1% - * - - - * - 1%
H H
Other extension mentions
- 98 - 8 - 9 - 31 - 1 - 49- 3% - 2% - 3% - 7% - * - 2%
J J BDFJL J
Illegible data
- 60 - 6 - 7 - 3 - 6 - 38- 2% - 1% - 2% - 1% - 2% - 2%
ECONOMY (NET)
- 13 - 2 - - - - - 1 - 10- * - * - - - - - * - *
It’s paid for/Fee based
- 48 - 4 - 7 - 3 - 5 - 29- 1% - 1% - 2% - 1% - 2% - 1%
Other economy mentions
- 31 - 2 - 6 - - - - - 23- 1% - * - 2% - - - - - 1%
H HJ H
SEARCH (NET)
_________________________________________________________________________________________________________________Proportions/Means: Columns Tested (5% risk level) - A/B - C/D - E/F - G/H - I/J - K/L - A/C/E/G/I/K - B/D/F/H/J/LOverlap formulae used. ** very small base (under 30) ineligible for sig testing
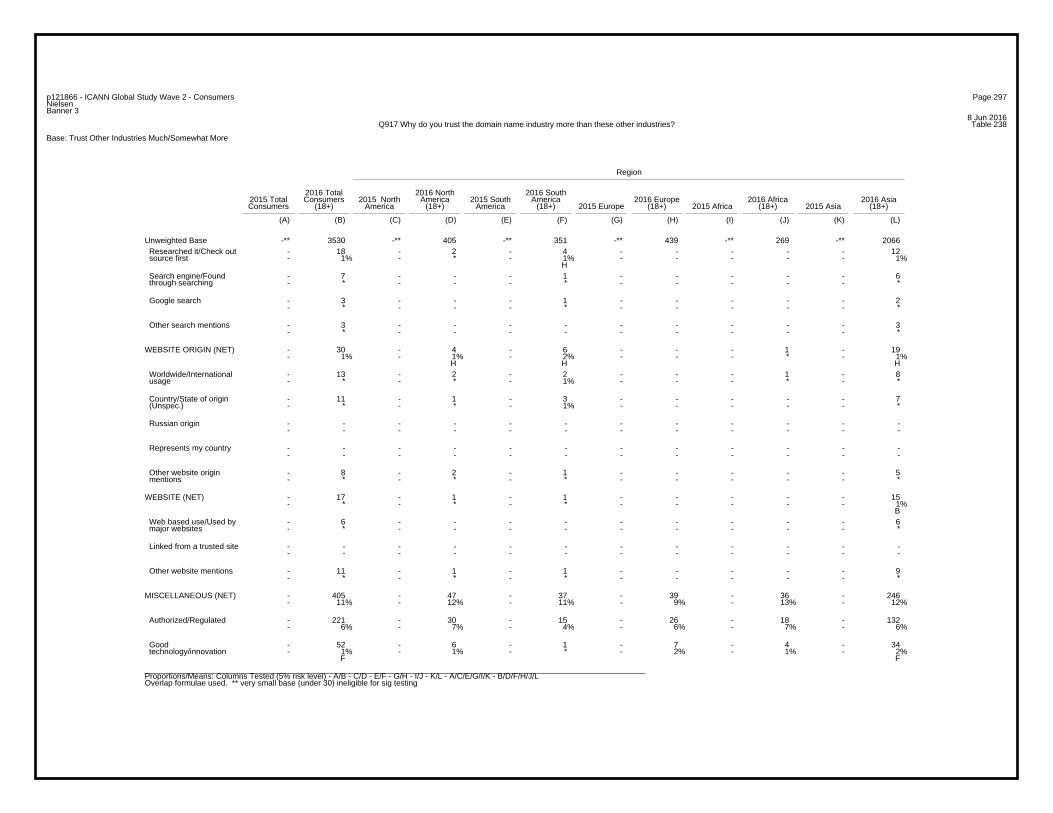
Page 297p121866 - ICANN Global Study Wave 2 - ConsumersNielsenBanner 3
8 Jun 2016Table 238Q917 Why do you trust the domain name industry more than these other industries?
Base: Trust Other Industries Much/Somewhat More
Region
2016 Total 2016 North 2016 South2015 Total Consumers 2015 North America 2015 South America 2016 Europe 2016 Africa 2016 AsiaConsumers (18+) America (18+) America (18+) 2015 Europe (18+) 2015 Africa (18+) 2015 Asia (18+)
(A) (B) (C) (D) (E) (F) (G) (H) (I) (J) (K) (L)
-** 3530 -** 405 -** 351 -** 439 -** 269 -** 2066Unweighted Base- 18 - 2 - 4 - - - - - 12- 1% - * - 1% - - - - - 1%
H
Researched it/Check out source first
- 7 - - - 1 - - - - - 6- * - - - * - - - - - *
Search engine/Found through searching
- 3 - - - 1 - - - - - 2- * - - - * - - - - - *
Google search
- 3 - - - - - - - - - 3- * - - - - - - - - - *
Other search mentions
- 30 - 4 - 6 - - - 1 - 19- 1% - 1% - 2% - - - * - 1%
H H H
WEBSITE ORIGIN (NET)
- 13 - 2 - 2 - - - 1 - 8- * - * - 1% - - - * - *
Worldwide/International usage
- 11 - 1 - 3 - - - - - 7- * - * - 1% - - - - - *
Country/State of origin (Unspec.)
- - - - - - - - - - - -- - - - - - - - - - - -
Russian origin
- - - - - - - - - - - -- - - - - - - - - - - -
Represents my country
- 8 - 2 - 1 - - - - - 5- * - * - * - - - - - *
Other website origin mentions
- 17 - 1 - 1 - - - - - 15- * - * - * - - - - - 1%
B
WEBSITE (NET)
- 6 - - - - - - - - - 6- * - - - - - - - - - *
Web based use/Used by major websites
- - - - - - - - - - - -- - - - - - - - - - - -
Linked from a trusted site
- 11 - 1 - 1 - - - - - 9- * - * - * - - - - - *
Other website mentions
- 405 - 47 - 37 - 39 - 36 - 246- 11% - 12% - 11% - 9% - 13% - 12%
MISCELLANEOUS (NET)
- 221 - 30 - 15 - 26 - 18 - 132- 6% - 7% - 4% - 6% - 7% - 6%
Authorized/Regulated
- 52 - 6 - 1 - 7 - 4 - 34- 1% - 1% - * - 2% - 1% - 2%
F F
Good technology/innovation
_________________________________________________________________________________________________________________Proportions/Means: Columns Tested (5% risk level) - A/B - C/D - E/F - G/H - I/J - K/L - A/C/E/G/I/K - B/D/F/H/J/LOverlap formulae used. ** very small base (under 30) ineligible for sig testing
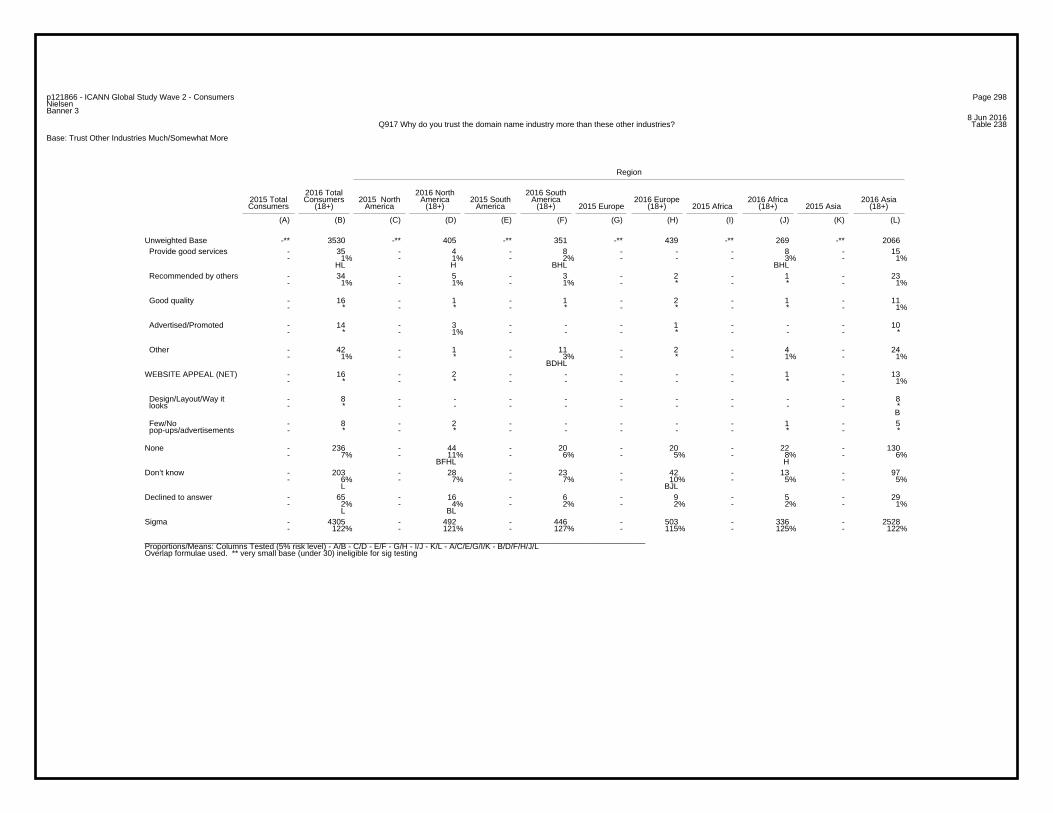
Page 298p121866 - ICANN Global Study Wave 2 - ConsumersNielsenBanner 3
8 Jun 2016Table 238Q917 Why do you trust the domain name industry more than these other industries?
Base: Trust Other Industries Much/Somewhat More
Region
2016 Total 2016 North 2016 South2015 Total Consumers 2015 North America 2015 South America 2016 Europe 2016 Africa 2016 AsiaConsumers (18+) America (18+) America (18+) 2015 Europe (18+) 2015 Africa (18+) 2015 Asia (18+)
(A) (B) (C) (D) (E) (F) (G) (H) (I) (J) (K) (L)
-** 3530 -** 405 -** 351 -** 439 -** 269 -** 2066Unweighted Base- 35 - 4 - 8 - - - 8 - 15- 1% - 1% - 2% - - - 3% - 1%
HL H BHL BHL
Provide good services
- 34 - 5 - 3 - 2 - 1 - 23- 1% - 1% - 1% - * - * - 1%
Recommended by others
- 16 - 1 - 1 - 2 - 1 - 11- * - * - * - * - * - 1%
Good quality
- 14 - 3 - - - 1 - - - 10- * - 1% - - - * - - - *
Advertised/Promoted
- 42 - 1 - 11 - 2 - 4 - 24- 1% - * - 3% - * - 1% - 1%
BDHL
Other
- 16 - 2 - - - - - 1 - 13- * - * - - - - - * - 1%
WEBSITE APPEAL (NET)
- 8 - - - - - - - - - 8- * - - - - - - - - - *
B
Design/Layout/Way it looks
- 8 - 2 - - - - - 1 - 5- * - * - - - - - * - *
Few/No pop-ups/advertisements
- 236 - 44 - 20 - 20 - 22 - 130- 7% - 11% - 6% - 5% - 8% - 6%
BFHL H
None
- 203 - 28 - 23 - 42 - 13 - 97- 6% - 7% - 7% - 10% - 5% - 5%
L BJL
Don’t know
- 65 - 16 - 6 - 9 - 5 - 29- 2% - 4% - 2% - 2% - 2% - 1%
L BL
Declined to answer
- 4305 - 492 - 446 - 503 - 336 - 2528- 122% - 121% - 127% - 115% - 125% - 122%
Sigma
_________________________________________________________________________________________________________________Proportions/Means: Columns Tested (5% risk level) - A/B - C/D - E/F - G/H - I/J - K/L - A/C/E/G/I/K - B/D/F/H/J/LOverlap formulae used. ** very small base (under 30) ineligible for sig testing
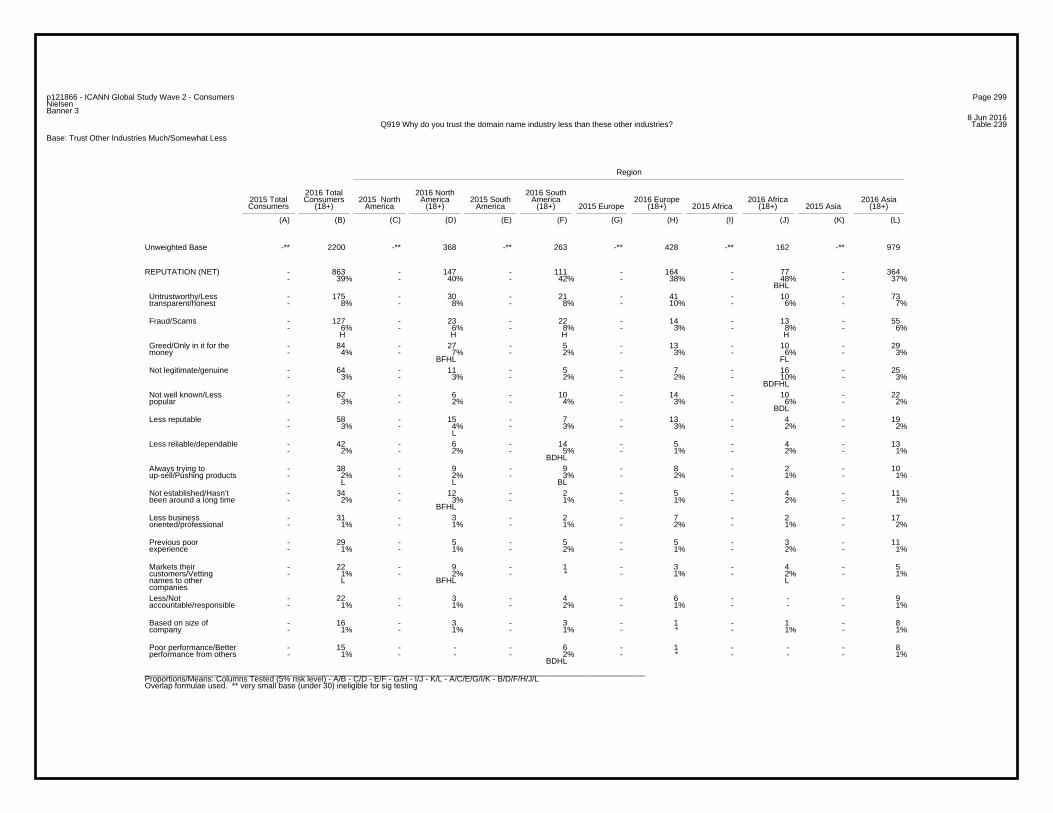
Page 299p121866 - ICANN Global Study Wave 2 - ConsumersNielsenBanner 3
8 Jun 2016Table 239Q919 Why do you trust the domain name industry less than these other industries?
Base: Trust Other Industries Much/Somewhat Less
Region
2016 Total 2016 North 2016 South2015 Total Consumers 2015 North America 2015 South America 2016 Europe 2016 Africa 2016 AsiaConsumers (18+) America (18+) America (18+) 2015 Europe (18+) 2015 Africa (18+) 2015 Asia (18+)
(A) (B) (C) (D) (E) (F) (G) (H) (I) (J) (K) (L)
-** 2200 -** 368 -** 263 -** 428 -** 162 -** 979Unweighted Base
- 863 - 147 - 111 - 164 - 77 - 364- 39% - 40% - 42% - 38% - 48% - 37%
BHL
REPUTATION (NET)
- 175 - 30 - 21 - 41 - 10 - 73- 8% - 8% - 8% - 10% - 6% - 7%
Untrustworthy/Less transparent/honest
- 127 - 23 - 22 - 14 - 13 - 55- 6% - 6% - 8% - 3% - 8% - 6%
H H H H
Fraud/Scams
- 84 - 27 - 5 - 13 - 10 - 29- 4% - 7% - 2% - 3% - 6% - 3%
BFHL FL
Greed/Only in it for the money
- 64 - 11 - 5 - 7 - 16 - 25- 3% - 3% - 2% - 2% - 10% - 3%
BDFHL
Not legitimate/genuine
- 62 - 6 - 10 - 14 - 10 - 22- 3% - 2% - 4% - 3% - 6% - 2%
BDL
Not well known/Less popular
- 58 - 15 - 7 - 13 - 4 - 19- 3% - 4% - 3% - 3% - 2% - 2%
L
Less reputable
- 42 - 6 - 14 - 5 - 4 - 13- 2% - 2% - 5% - 1% - 2% - 1%
BDHL
Less reliable/dependable
- 38 - 9 - 9 - 8 - 2 - 10- 2% - 2% - 3% - 2% - 1% - 1%
L L BL
Always trying to up-sell/Pushing products
- 34 - 12 - 2 - 5 - 4 - 11- 2% - 3% - 1% - 1% - 2% - 1%
BFHL
Not established/Hasn’t been around a long time
- 31 - 3 - 2 - 7 - 2 - 17- 1% - 1% - 1% - 2% - 1% - 2%
Less business oriented/professional
- 29 - 5 - 5 - 5 - 3 - 11- 1% - 1% - 2% - 1% - 2% - 1%
Previous poor experience
- 22 - 9 - 1 - 3 - 4 - 5- 1% - 2% - * - 1% - 2% - 1%
L BFHL L
Markets their customers/Vetting names to other companies
- 22 - 3 - 4 - 6 - - - 9- 1% - 1% - 2% - 1% - - - 1%
Less/Not accountable/responsible
- 16 - 3 - 3 - 1 - 1 - 8- 1% - 1% - 1% - * - 1% - 1%
Based on size of company
- 15 - - - 6 - 1 - - - 8- 1% - - - 2% - * - - - 1%
BDHL
Poor performance/Better performance from others
_________________________________________________________________________________________________________________Proportions/Means: Columns Tested (5% risk level) - A/B - C/D - E/F - G/H - I/J - K/L - A/C/E/G/I/K - B/D/F/H/J/LOverlap formulae used. ** very small base (under 30) ineligible for sig testing
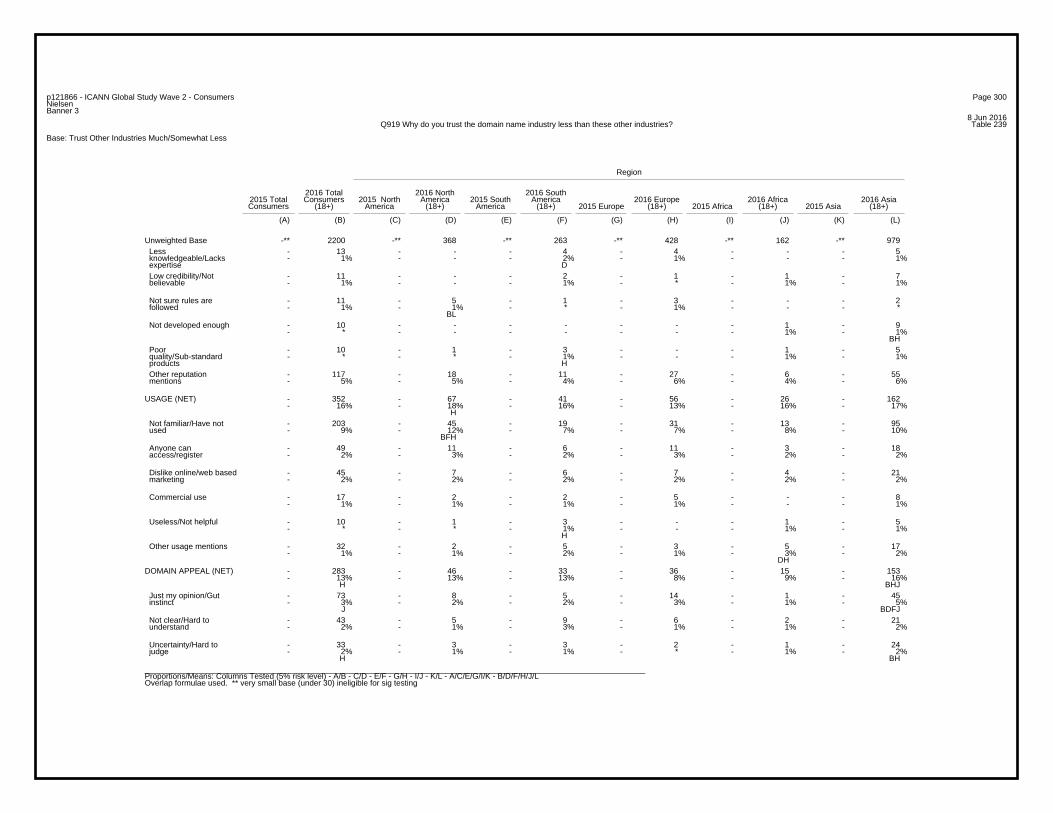
Page 300p121866 - ICANN Global Study Wave 2 - ConsumersNielsenBanner 3
8 Jun 2016Table 239Q919 Why do you trust the domain name industry less than these other industries?
Base: Trust Other Industries Much/Somewhat Less
Region
2016 Total 2016 North 2016 South2015 Total Consumers 2015 North America 2015 South America 2016 Europe 2016 Africa 2016 AsiaConsumers (18+) America (18+) America (18+) 2015 Europe (18+) 2015 Africa (18+) 2015 Asia (18+)
(A) (B) (C) (D) (E) (F) (G) (H) (I) (J) (K) (L)
-** 2200 -** 368 -** 263 -** 428 -** 162 -** 979Unweighted Base- 13 - - - 4 - 4 - - - 5- 1% - - - 2% - 1% - - - 1%
D
Less knowledgeable/Lacks expertise
- 11 - - - 2 - 1 - 1 - 7- 1% - - - 1% - * - 1% - 1%
Low credibility/Not believable
- 11 - 5 - 1 - 3 - - - 2- 1% - 1% - * - 1% - - - *
BL
Not sure rules are followed
- 10 - - - - - - - 1 - 9- * - - - - - - - 1% - 1%
BH
Not developed enough
- 10 - 1 - 3 - - - 1 - 5- * - * - 1% - - - 1% - 1%
H
Poor quality/Sub-standard products
- 117 - 18 - 11 - 27 - 6 - 55- 5% - 5% - 4% - 6% - 4% - 6%
Other reputation mentions
- 352 - 67 - 41 - 56 - 26 - 162- 16% - 18% - 16% - 13% - 16% - 17%
H
USAGE (NET)
- 203 - 45 - 19 - 31 - 13 - 95- 9% - 12% - 7% - 7% - 8% - 10%
BFH
Not familiar/Have not used
- 49 - 11 - 6 - 11 - 3 - 18- 2% - 3% - 2% - 3% - 2% - 2%
Anyone can access/register
- 45 - 7 - 6 - 7 - 4 - 21- 2% - 2% - 2% - 2% - 2% - 2%
Dislike online/web based marketing
- 17 - 2 - 2 - 5 - - - 8- 1% - 1% - 1% - 1% - - - 1%
Commercial use
- 10 - 1 - 3 - - - 1 - 5- * - * - 1% - - - 1% - 1%
H
Useless/Not helpful
- 32 - 2 - 5 - 3 - 5 - 17- 1% - 1% - 2% - 1% - 3% - 2%
DH
Other usage mentions
- 283 - 46 - 33 - 36 - 15 - 153- 13% - 13% - 13% - 8% - 9% - 16%
H BHJ
DOMAIN APPEAL (NET)
- 73 - 8 - 5 - 14 - 1 - 45- 3% - 2% - 2% - 3% - 1% - 5%
J BDFJ
Just my opinion/Gut instinct
- 43 - 5 - 9 - 6 - 2 - 21- 2% - 1% - 3% - 1% - 1% - 2%
Not clear/Hard to understand
- 33 - 3 - 3 - 2 - 1 - 24- 2% - 1% - 1% - * - 1% - 2%
H BH
Uncertainty/Hard to judge
_________________________________________________________________________________________________________________Proportions/Means: Columns Tested (5% risk level) - A/B - C/D - E/F - G/H - I/J - K/L - A/C/E/G/I/K - B/D/F/H/J/LOverlap formulae used. ** very small base (under 30) ineligible for sig testing
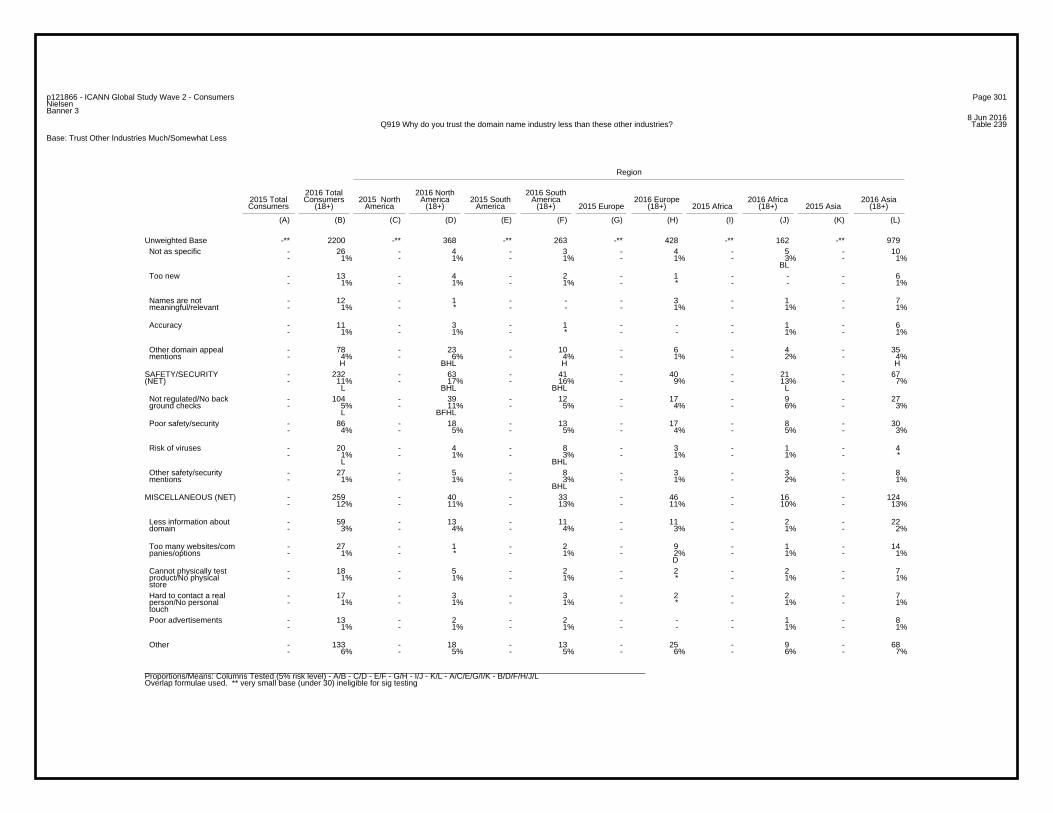
Page 301p121866 - ICANN Global Study Wave 2 - ConsumersNielsenBanner 3
8 Jun 2016Table 239Q919 Why do you trust the domain name industry less than these other industries?
Base: Trust Other Industries Much/Somewhat Less
Region
2016 Total 2016 North 2016 South2015 Total Consumers 2015 North America 2015 South America 2016 Europe 2016 Africa 2016 AsiaConsumers (18+) America (18+) America (18+) 2015 Europe (18+) 2015 Africa (18+) 2015 Asia (18+)
(A) (B) (C) (D) (E) (F) (G) (H) (I) (J) (K) (L)
-** 2200 -** 368 -** 263 -** 428 -** 162 -** 979Unweighted Base- 26 - 4 - 3 - 4 - 5 - 10- 1% - 1% - 1% - 1% - 3% - 1%
BL
Not as specific
- 13 - 4 - 2 - 1 - - - 6- 1% - 1% - 1% - * - - - 1%
Too new
- 12 - 1 - - - 3 - 1 - 7- 1% - * - - - 1% - 1% - 1%
Names are not meaningful/relevant
- 11 - 3 - 1 - - - 1 - 6- 1% - 1% - * - - - 1% - 1%
Accuracy
- 78 - 23 - 10 - 6 - 4 - 35- 4% - 6% - 4% - 1% - 2% - 4%
H BHL H H
Other domain appeal mentions
- 232 - 63 - 41 - 40 - 21 - 67- 11% - 17% - 16% - 9% - 13% - 7%
L BHL BHL L
SAFETY/SECURITY(NET)
- 104 - 39 - 12 - 17 - 9 - 27- 5% - 11% - 5% - 4% - 6% - 3%
L BFHL
Not regulated/No back ground checks
- 86 - 18 - 13 - 17 - 8 - 30- 4% - 5% - 5% - 4% - 5% - 3%
Poor safety/security
- 20 - 4 - 8 - 3 - 1 - 4- 1% - 1% - 3% - 1% - 1% - *
L BHL
Risk of viruses
- 27 - 5 - 8 - 3 - 3 - 8- 1% - 1% - 3% - 1% - 2% - 1%
BHL
Other safety/security mentions
- 259 - 40 - 33 - 46 - 16 - 124- 12% - 11% - 13% - 11% - 10% - 13%
MISCELLANEOUS (NET)
- 59 - 13 - 11 - 11 - 2 - 22- 3% - 4% - 4% - 3% - 1% - 2%
Less information about domain
- 27 - 1 - 2 - 9 - 1 - 14- 1% - * - 1% - 2% - 1% - 1%
D
Too many websites/com panies/options
- 18 - 5 - 2 - 2 - 2 - 7- 1% - 1% - 1% - * - 1% - 1%
Cannot physically test product/No physical store
- 17 - 3 - 3 - 2 - 2 - 7- 1% - 1% - 1% - * - 1% - 1%
Hard to contact a real person/No personal touch
- 13 - 2 - 2 - - - 1 - 8- 1% - 1% - 1% - - - 1% - 1%
Poor advertisements
- 133 - 18 - 13 - 25 - 9 - 68- 6% - 5% - 5% - 6% - 6% - 7%
Other
_________________________________________________________________________________________________________________Proportions/Means: Columns Tested (5% risk level) - A/B - C/D - E/F - G/H - I/J - K/L - A/C/E/G/I/K - B/D/F/H/J/LOverlap formulae used. ** very small base (under 30) ineligible for sig testing
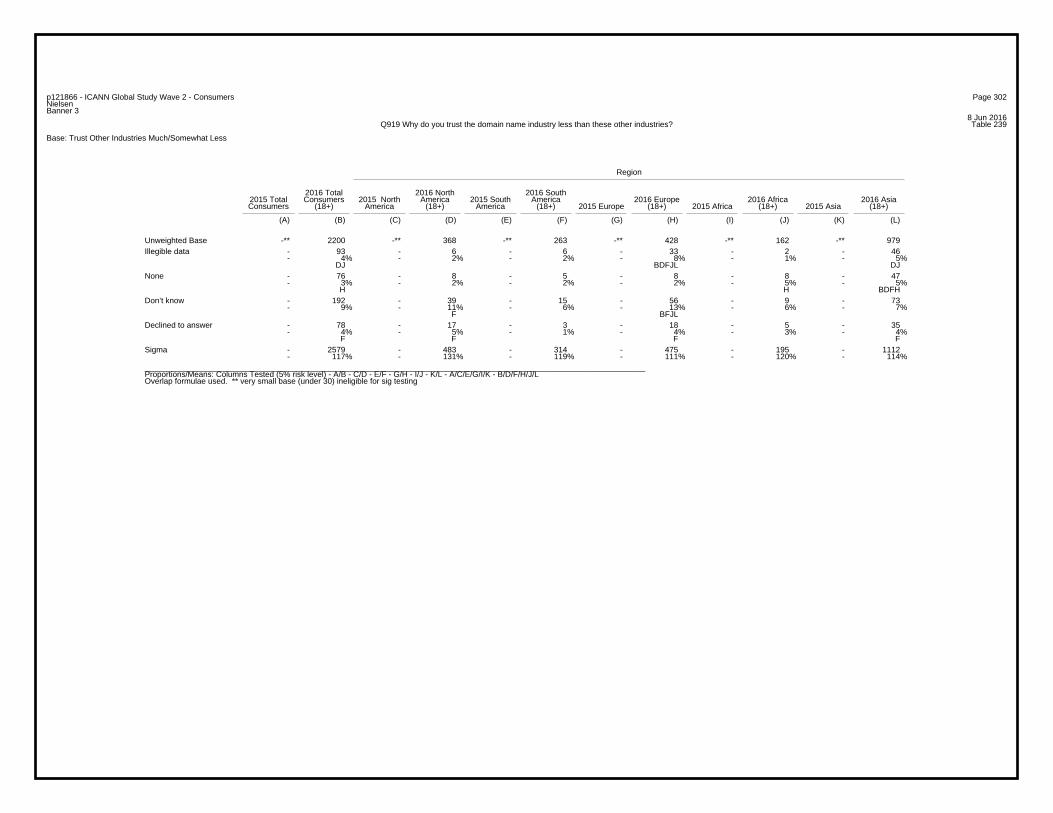
Page 302p121866 - ICANN Global Study Wave 2 - ConsumersNielsenBanner 3
8 Jun 2016Table 239Q919 Why do you trust the domain name industry less than these other industries?
Base: Trust Other Industries Much/Somewhat Less
Region
2016 Total 2016 North 2016 South2015 Total Consumers 2015 North America 2015 South America 2016 Europe 2016 Africa 2016 AsiaConsumers (18+) America (18+) America (18+) 2015 Europe (18+) 2015 Africa (18+) 2015 Asia (18+)
(A) (B) (C) (D) (E) (F) (G) (H) (I) (J) (K) (L)
-** 2200 -** 368 -** 263 -** 428 -** 162 -** 979Unweighted Base- 93 - 6 - 6 - 33 - 2 - 46- 4% - 2% - 2% - 8% - 1% - 5%
DJ BDFJL DJ
Illegible data
- 76 - 8 - 5 - 8 - 8 - 47- 3% - 2% - 2% - 2% - 5% - 5%
H H BDFH
None
- 192 - 39 - 15 - 56 - 9 - 73- 9% - 11% - 6% - 13% - 6% - 7%
F BFJL
Don’t know
- 78 - 17 - 3 - 18 - 5 - 35- 4% - 5% - 1% - 4% - 3% - 4%
F F F F
Declined to answer
- 2579 - 483 - 314 - 475 - 195 - 1112- 117% - 131% - 119% - 111% - 120% - 114%
Sigma
_________________________________________________________________________________________________________________Proportions/Means: Columns Tested (5% risk level) - A/B - C/D - E/F - G/H - I/J - K/L - A/C/E/G/I/K - B/D/F/H/J/LOverlap formulae used. ** very small base (under 30) ineligible for sig testing
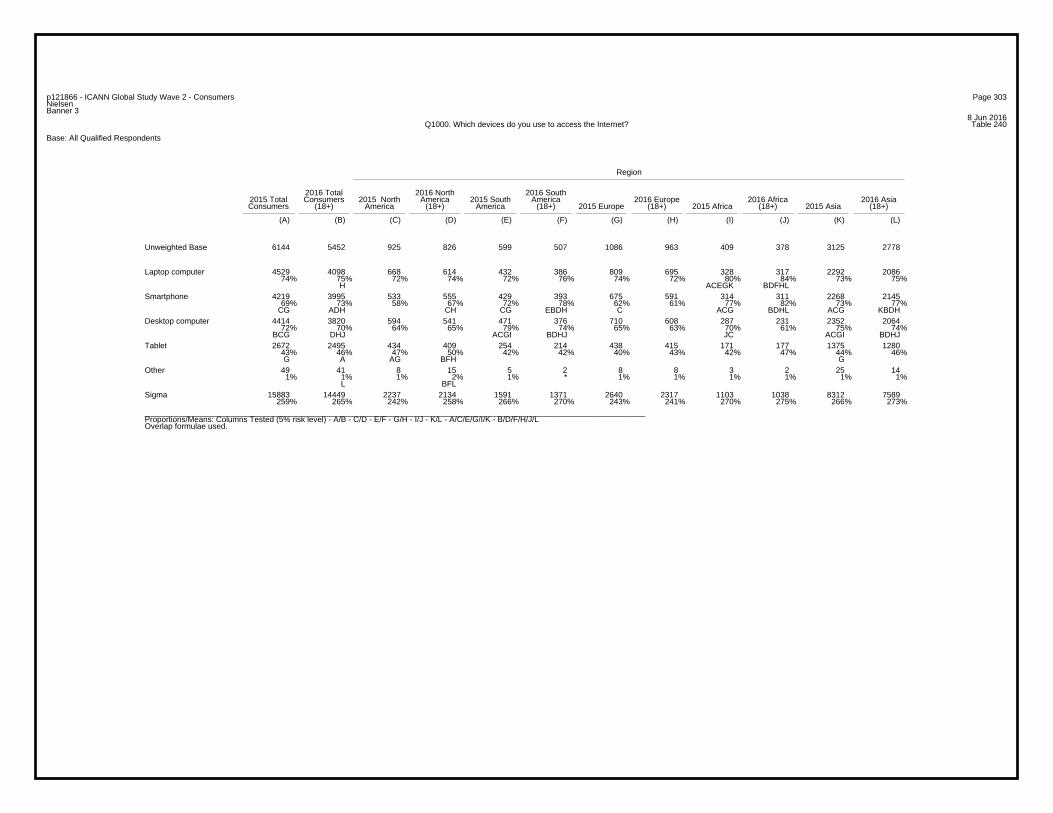
Page 303p121866 - ICANN Global Study Wave 2 - ConsumersNielsenBanner 3
8 Jun 2016Table 240Q1000. Which devices do you use to access the Internet?
Base: All Qualified Respondents
Region
2016 Total 2016 North 2016 South2015 Total Consumers 2015 North America 2015 South America 2016 Europe 2016 Africa 2016 AsiaConsumers (18+) America (18+) America (18+) 2015 Europe (18+) 2015 Africa (18+) 2015 Asia (18+)
(A) (B) (C) (D) (E) (F) (G) (H) (I) (J) (K) (L)
6144 5452 925 826 599 507 1086 963 409 378 3125 2778Unweighted Base
4529 4098 668 614 432 386 809 695 328 317 2292 208674% 75% 72% 74% 72% 76% 74% 72% 80% 84% 73% 75%
H ACEGK BDFHL
Laptop computer
4219 3995 533 555 429 393 675 591 314 311 2268 214569% 73% 58% 67% 72% 78% 62% 61% 77% 82% 73% 77%
CG ADH CH CG EBDH C ACG BDHL ACG KBDH
Smartphone
4414 3820 594 541 471 376 710 608 287 231 2352 206472% 70% 64% 65% 79% 74% 65% 63% 70% 61% 75% 74%
BCG DHJ ACGI BDHJ JC ACGI BDHJ
Desktop computer
2672 2495 434 409 254 214 438 415 171 177 1375 128043% 46% 47% 50% 42% 42% 40% 43% 42% 47% 44% 46%G A AG BFH G
Tablet
49 41 8 15 5 2 8 8 3 2 25 141% 1% 1% 2% 1% * 1% 1% 1% 1% 1% 1%
L BFL
Other
15883 14449 2237 2134 1591 1371 2640 2317 1103 1038 8312 7589259% 265% 242% 258% 266% 270% 243% 241% 270% 275% 266% 273%
Sigma
_________________________________________________________________________________________________________________Proportions/Means: Columns Tested (5% risk level) - A/B - C/D - E/F - G/H - I/J - K/L - A/C/E/G/I/K - B/D/F/H/J/LOverlap formulae used.
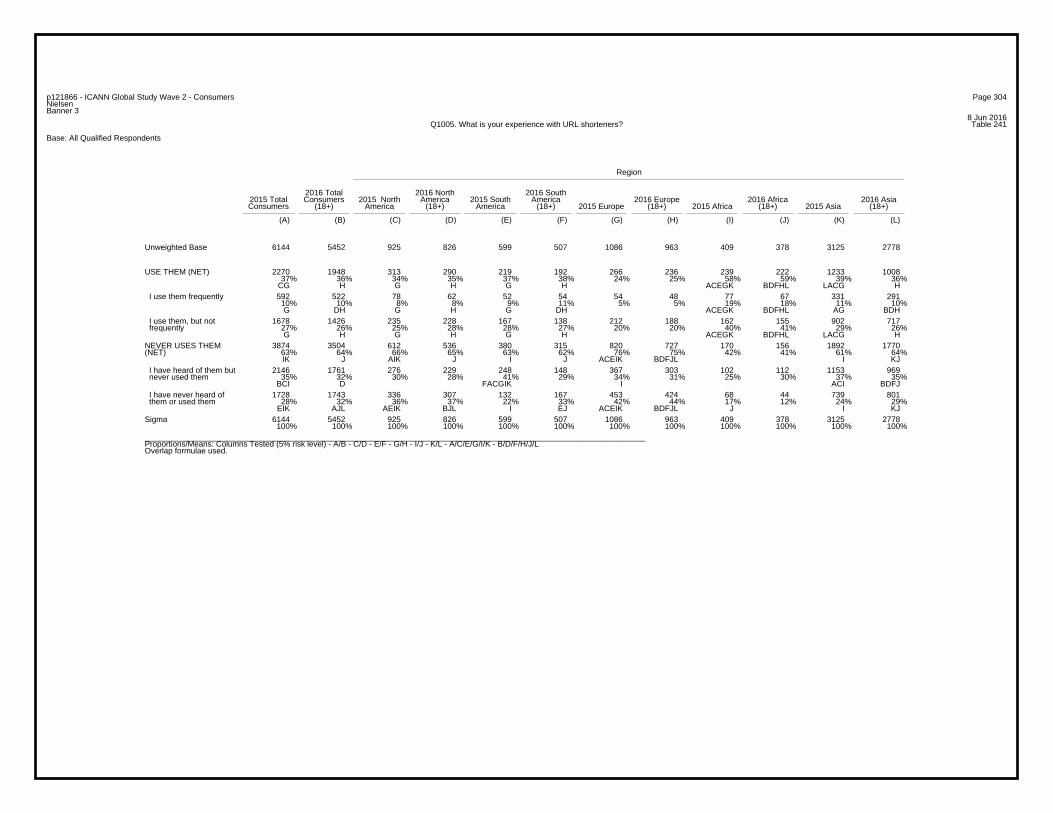
Page 304p121866 - ICANN Global Study Wave 2 - ConsumersNielsenBanner 3
8 Jun 2016Table 241Q1005. What is your experience with URL shorteners?
Base: All Qualified Respondents
Region
2016 Total 2016 North 2016 South2015 Total Consumers 2015 North America 2015 South America 2016 Europe 2016 Africa 2016 AsiaConsumers (18+) America (18+) America (18+) 2015 Europe (18+) 2015 Africa (18+) 2015 Asia (18+)
(A) (B) (C) (D) (E) (F) (G) (H) (I) (J) (K) (L)
6144 5452 925 826 599 507 1086 963 409 378 3125 2778Unweighted Base
2270 1948 313 290 219 192 266 236 239 222 1233 100837% 36% 34% 35% 37% 38% 24% 25% 58% 59% 39% 36%
CG H G H G H ACEGK BDFHL LACG H
USE THEM (NET)
592 522 78 62 52 54 54 48 77 67 331 29110% 10% 8% 8% 9% 11% 5% 5% 19% 18% 11% 10%G DH G H G DH ACEGK BDFHL AG BDH
I use them frequently
1678 1426 235 228 167 138 212 188 162 155 902 71727% 26% 25% 28% 28% 27% 20% 20% 40% 41% 29% 26%G H G H G H ACEGK BDFHL LACG H
I use them, but not frequently
3874 3504 612 536 380 315 820 727 170 156 1892 177063% 64% 66% 65% 63% 62% 76% 75% 42% 41% 61% 64%IK J AIK J I J ACEIK BDFJL I KJ
NEVER USES THEM(NET)
2146 1761 276 229 248 148 367 303 102 112 1153 96935% 32% 30% 28% 41% 29% 34% 31% 25% 30% 37% 35%
BCI D FACGIK I ACI BDFJ
I have heard of them but never used them
1728 1743 336 307 132 167 453 424 68 44 739 80128% 32% 36% 37% 22% 33% 42% 44% 17% 12% 24% 29%
EIK AJL AEIK BJL I EJ ACEIK BDFJL J I KJ
I have never heard of them or used them
6144 5452 925 826 599 507 1086 963 409 378 3125 2778100% 100% 100% 100% 100% 100% 100% 100% 100% 100% 100% 100%
Sigma
_________________________________________________________________________________________________________________Proportions/Means: Columns Tested (5% risk level) - A/B - C/D - E/F - G/H - I/J - K/L - A/C/E/G/I/K - B/D/F/H/J/LOverlap formulae used.
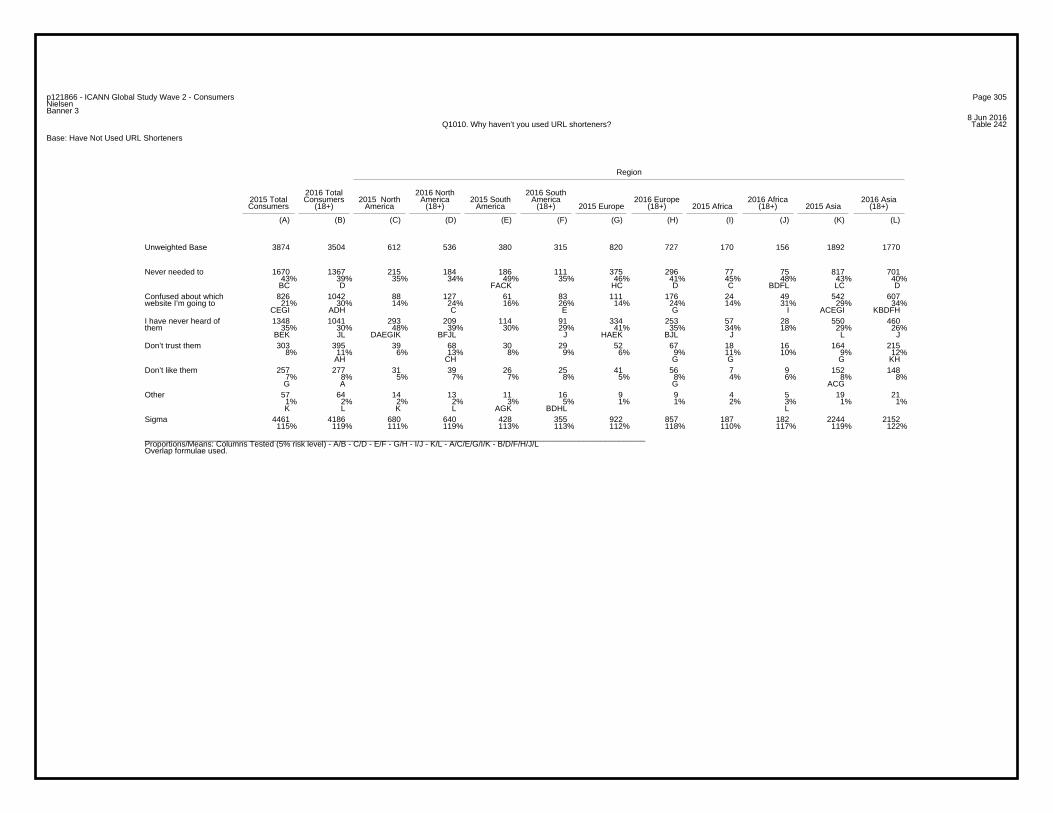
Page 305p121866 - ICANN Global Study Wave 2 - ConsumersNielsenBanner 3
8 Jun 2016Table 242Q1010. Why haven’t you used URL shorteners?
Base: Have Not Used URL Shorteners
Region
2016 Total 2016 North 2016 South2015 Total Consumers 2015 North America 2015 South America 2016 Europe 2016 Africa 2016 AsiaConsumers (18+) America (18+) America (18+) 2015 Europe (18+) 2015 Africa (18+) 2015 Asia (18+)
(A) (B) (C) (D) (E) (F) (G) (H) (I) (J) (K) (L)
3874 3504 612 536 380 315 820 727 170 156 1892 1770Unweighted Base
1670 1367 215 184 186 111 375 296 77 75 817 70143% 39% 35% 34% 49% 35% 46% 41% 45% 48% 43% 40%BC D FACK HC D C BDFL LC D
Never needed to
826 1042 88 127 61 83 111 176 24 49 542 60721% 30% 14% 24% 16% 26% 14% 24% 14% 31% 29% 34%
CEGI ADH C E G I ACEGI KBDFH
Confused about whichwebsite I’m going to
1348 1041 293 209 114 91 334 253 57 28 550 46035% 30% 48% 39% 30% 29% 41% 35% 34% 18% 29% 26%
BEK JL DAEGIK BFJL J HAEK BJL J L J
I have never heard ofthem
303 395 39 68 30 29 52 67 18 16 164 2158% 11% 6% 13% 8% 9% 6% 9% 11% 10% 9% 12%
AH CH G G G KH
Don’t trust them
257 277 31 39 26 25 41 56 7 9 152 1487% 8% 5% 7% 7% 8% 5% 8% 4% 6% 8% 8%G A G ACG
Don’t like them
57 64 14 13 11 16 9 9 4 5 19 211% 2% 2% 2% 3% 5% 1% 1% 2% 3% 1% 1%K L K L AGK BDHL L
Other
4461 4186 680 640 428 355 922 857 187 182 2244 2152115% 119% 111% 119% 113% 113% 112% 118% 110% 117% 119% 122%
Sigma
_________________________________________________________________________________________________________________Proportions/Means: Columns Tested (5% risk level) - A/B - C/D - E/F - G/H - I/J - K/L - A/C/E/G/I/K - B/D/F/H/J/LOverlap formulae used.
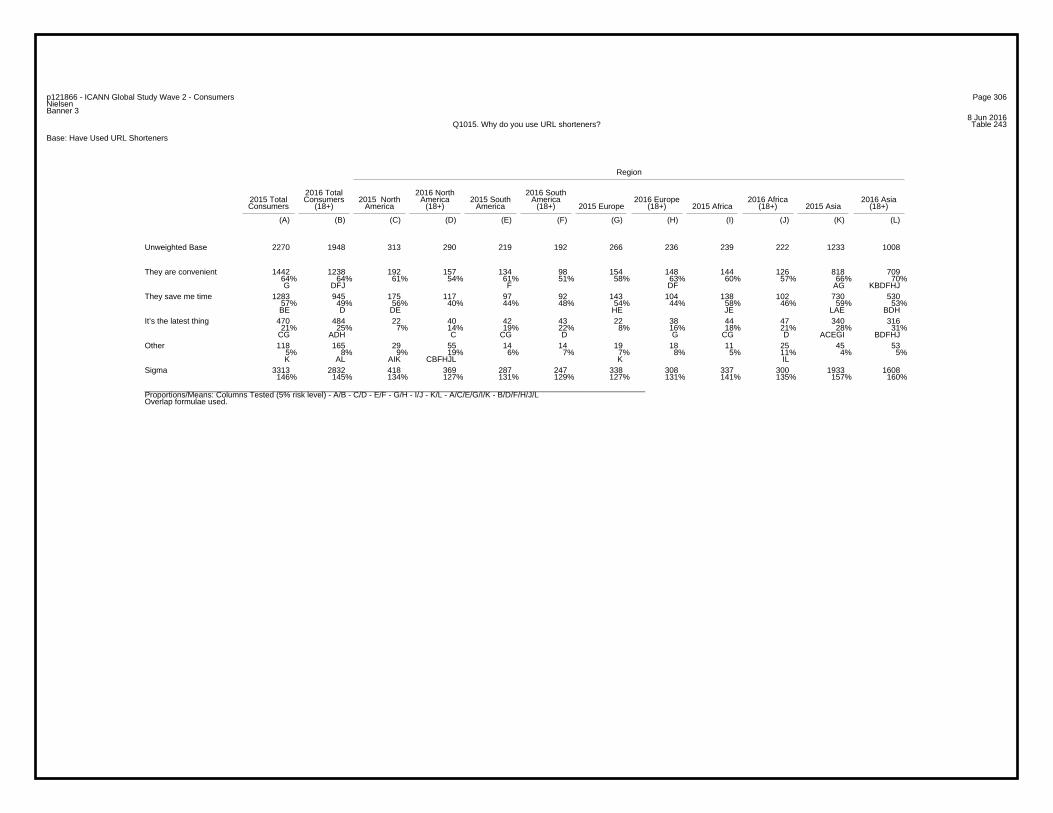
Page 306p121866 - ICANN Global Study Wave 2 - ConsumersNielsenBanner 3
8 Jun 2016Table 243Q1015. Why do you use URL shorteners?
Base: Have Used URL Shorteners
Region
2016 Total 2016 North 2016 South2015 Total Consumers 2015 North America 2015 South America 2016 Europe 2016 Africa 2016 AsiaConsumers (18+) America (18+) America (18+) 2015 Europe (18+) 2015 Africa (18+) 2015 Asia (18+)
(A) (B) (C) (D) (E) (F) (G) (H) (I) (J) (K) (L)
2270 1948 313 290 219 192 266 236 239 222 1233 1008Unweighted Base
1442 1238 192 157 134 98 154 148 144 126 818 70964% 64% 61% 54% 61% 51% 58% 63% 60% 57% 66% 70%G DFJ F DF AG KBDFHJ
They are convenient
1283 945 175 117 97 92 143 104 138 102 730 53057% 49% 56% 40% 44% 48% 54% 44% 58% 46% 59% 53%BE D DE HE JE LAE BDH
They save me time
470 484 22 40 42 43 22 38 44 47 340 31621% 25% 7% 14% 19% 22% 8% 16% 18% 21% 28% 31%
CG ADH C CG D G CG D ACEGI BDFHJ
It’s the latest thing
118 165 29 55 14 14 19 18 11 25 45 535% 8% 9% 19% 6% 7% 7% 8% 5% 11% 4% 5%K AL AIK CBFHJL K IL
Other
3313 2832 418 369 287 247 338 308 337 300 1933 1608146% 145% 134% 127% 131% 129% 127% 131% 141% 135% 157% 160%
Sigma
_________________________________________________________________________________________________________________Proportions/Means: Columns Tested (5% risk level) - A/B - C/D - E/F - G/H - I/J - K/L - A/C/E/G/I/K - B/D/F/H/J/LOverlap formulae used.
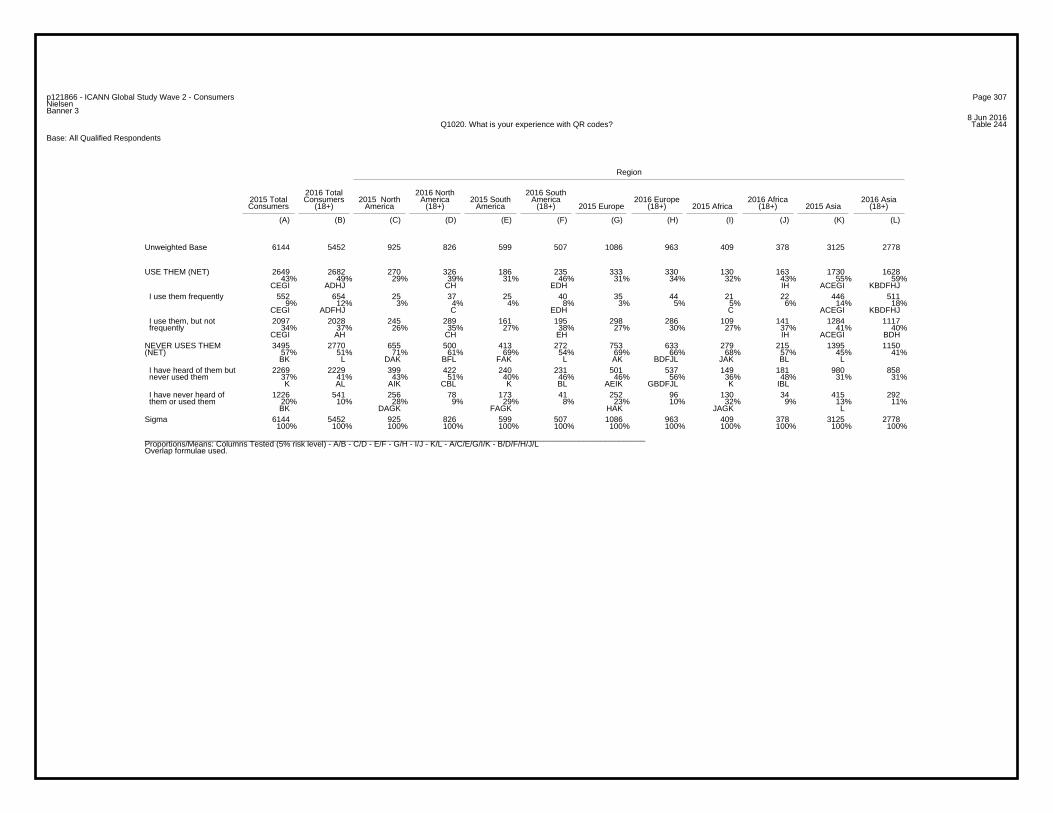
Page 307p121866 - ICANN Global Study Wave 2 - ConsumersNielsenBanner 3
8 Jun 2016Table 244Q1020. What is your experience with QR codes?
Base: All Qualified Respondents
Region
2016 Total 2016 North 2016 South2015 Total Consumers 2015 North America 2015 South America 2016 Europe 2016 Africa 2016 AsiaConsumers (18+) America (18+) America (18+) 2015 Europe (18+) 2015 Africa (18+) 2015 Asia (18+)
(A) (B) (C) (D) (E) (F) (G) (H) (I) (J) (K) (L)
6144 5452 925 826 599 507 1086 963 409 378 3125 2778Unweighted Base
2649 2682 270 326 186 235 333 330 130 163 1730 162843% 49% 29% 39% 31% 46% 31% 34% 32% 43% 55% 59%
CEGI ADHJ CH EDH IH ACEGI KBDFHJ
USE THEM (NET)
552 654 25 37 25 40 35 44 21 22 446 5119% 12% 3% 4% 4% 8% 3% 5% 5% 6% 14% 18%
CEGI ADFHJ C EDH C ACEGI KBDFHJ
I use them frequently
2097 2028 245 289 161 195 298 286 109 141 1284 111734% 37% 26% 35% 27% 38% 27% 30% 27% 37% 41% 40%
CEGI AH CH EH IH ACEGI BDH
I use them, but not frequently
3495 2770 655 500 413 272 753 633 279 215 1395 115057% 51% 71% 61% 69% 54% 69% 66% 68% 57% 45% 41%BK L DAK BFL FAK L AK BDFJL JAK BL L
NEVER USES THEM(NET)
2269 2229 399 422 240 231 501 537 149 181 980 85837% 41% 43% 51% 40% 46% 46% 56% 36% 48% 31% 31%K AL AIK CBL K BL AEIK GBDFJL K IBL
I have heard of them but never used them
1226 541 256 78 173 41 252 96 130 34 415 29220% 10% 28% 9% 29% 8% 23% 10% 32% 9% 13% 11%BK DAGK FAGK HAK JAGK L
I have never heard of them or used them
6144 5452 925 826 599 507 1086 963 409 378 3125 2778100% 100% 100% 100% 100% 100% 100% 100% 100% 100% 100% 100%
Sigma
_________________________________________________________________________________________________________________Proportions/Means: Columns Tested (5% risk level) - A/B - C/D - E/F - G/H - I/J - K/L - A/C/E/G/I/K - B/D/F/H/J/LOverlap formulae used.
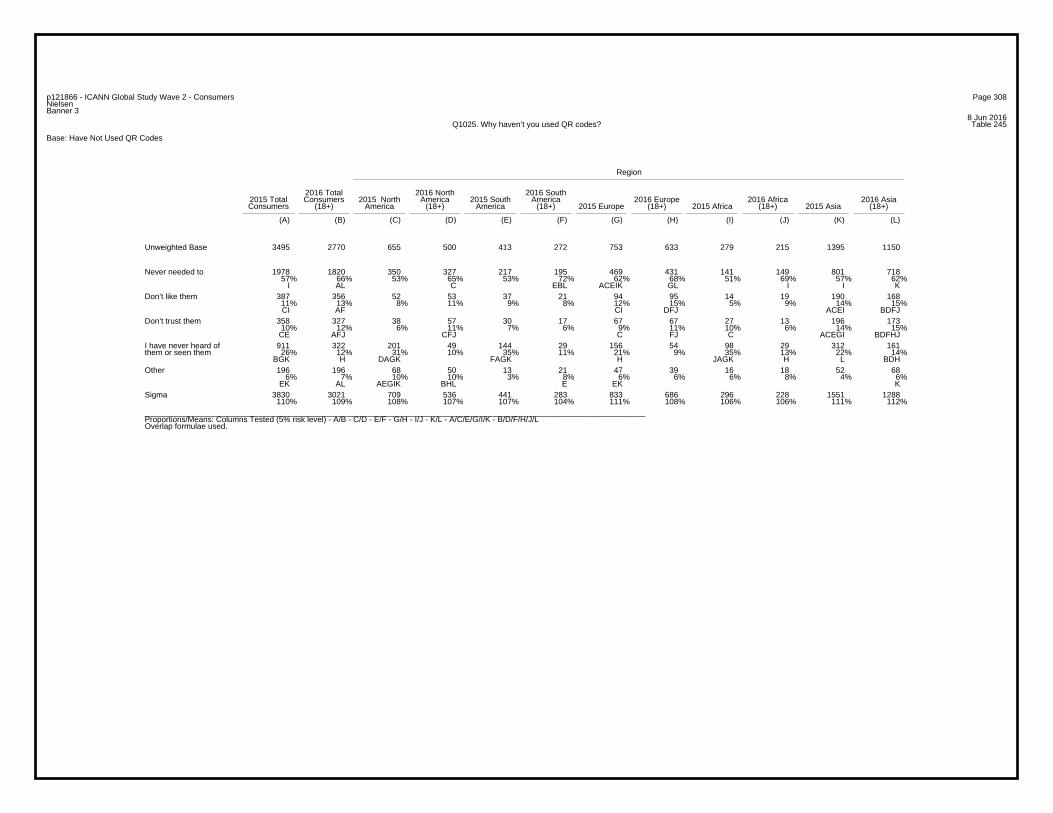
Page 308p121866 - ICANN Global Study Wave 2 - ConsumersNielsenBanner 3
8 Jun 2016Table 245Q1025. Why haven’t you used QR codes?
Base: Have Not Used QR Codes
Region
2016 Total 2016 North 2016 South2015 Total Consumers 2015 North America 2015 South America 2016 Europe 2016 Africa 2016 AsiaConsumers (18+) America (18+) America (18+) 2015 Europe (18+) 2015 Africa (18+) 2015 Asia (18+)
(A) (B) (C) (D) (E) (F) (G) (H) (I) (J) (K) (L)
3495 2770 655 500 413 272 753 633 279 215 1395 1150Unweighted Base
1978 1820 350 327 217 195 469 431 141 149 801 71857% 66% 53% 65% 53% 72% 62% 68% 51% 69% 57% 62%
I AL C EBL ACEIK GL I I K
Never needed to
387 356 52 53 37 21 94 95 14 19 190 16811% 13% 8% 11% 9% 8% 12% 15% 5% 9% 14% 15%CI AF CI DFJ ACEI BDFJ
Don’t like them
358 327 38 57 30 17 67 67 27 13 196 17310% 12% 6% 11% 7% 6% 9% 11% 10% 6% 14% 15%CE AFJ CFJ C FJ C ACEGI BDFHJ
Don’t trust them
911 322 201 49 144 29 156 54 98 29 312 16126% 12% 31% 10% 35% 11% 21% 9% 35% 13% 22% 14%
BGK H DAGK FAGK H JAGK H L BDH
I have never heard ofthem or seen them
196 196 68 50 13 21 47 39 16 18 52 686% 7% 10% 10% 3% 8% 6% 6% 6% 8% 4% 6%
EK AL AEGIK BHL E EK K
Other
3830 3021 709 536 441 283 833 686 296 228 1551 1288110% 109% 108% 107% 107% 104% 111% 108% 106% 106% 111% 112%
Sigma
_________________________________________________________________________________________________________________Proportions/Means: Columns Tested (5% risk level) - A/B - C/D - E/F - G/H - I/J - K/L - A/C/E/G/I/K - B/D/F/H/J/LOverlap formulae used.
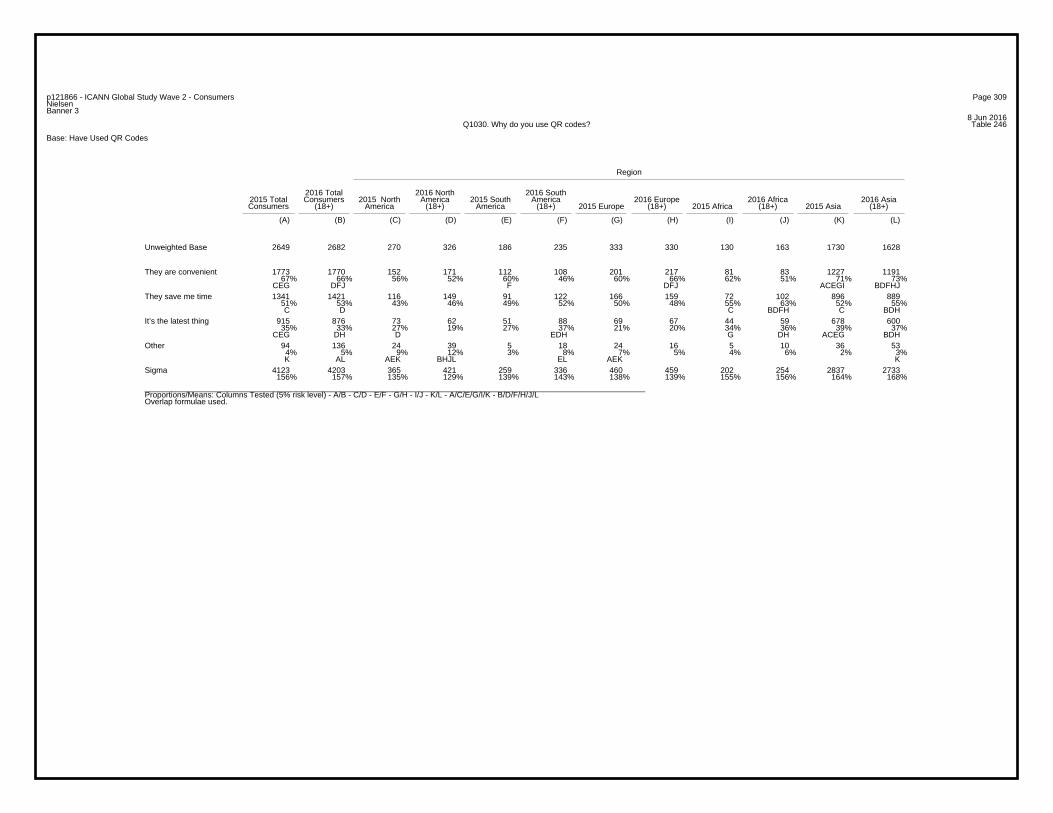
Page 309p121866 - ICANN Global Study Wave 2 - ConsumersNielsenBanner 3
8 Jun 2016Table 246Q1030. Why do you use QR codes?
Base: Have Used QR Codes
Region
2016 Total 2016 North 2016 South2015 Total Consumers 2015 North America 2015 South America 2016 Europe 2016 Africa 2016 AsiaConsumers (18+) America (18+) America (18+) 2015 Europe (18+) 2015 Africa (18+) 2015 Asia (18+)
(A) (B) (C) (D) (E) (F) (G) (H) (I) (J) (K) (L)
2649 2682 270 326 186 235 333 330 130 163 1730 1628Unweighted Base
1773 1770 152 171 112 108 201 217 81 83 1227 119167% 66% 56% 52% 60% 46% 60% 66% 62% 51% 71% 73%
CEG DFJ F DFJ ACEGI BDFHJ
They are convenient
1341 1421 116 149 91 122 166 159 72 102 896 88951% 53% 43% 46% 49% 52% 50% 48% 55% 63% 52% 55%C D C BDFH C BDH
They save me time
915 876 73 62 51 88 69 67 44 59 678 60035% 33% 27% 19% 27% 37% 21% 20% 34% 36% 39% 37%
CEG DH D EDH G DH ACEG BDH
It’s the latest thing
94 136 24 39 5 18 24 16 5 10 36 534% 5% 9% 12% 3% 8% 7% 5% 4% 6% 2% 3%K AL AEK BHJL EL AEK K
Other
4123 4203 365 421 259 336 460 459 202 254 2837 2733156% 157% 135% 129% 139% 143% 138% 139% 155% 156% 164% 168%
Sigma
_________________________________________________________________________________________________________________Proportions/Means: Columns Tested (5% risk level) - A/B - C/D - E/F - G/H - I/J - K/L - A/C/E/G/I/K - B/D/F/H/J/LOverlap formulae used.
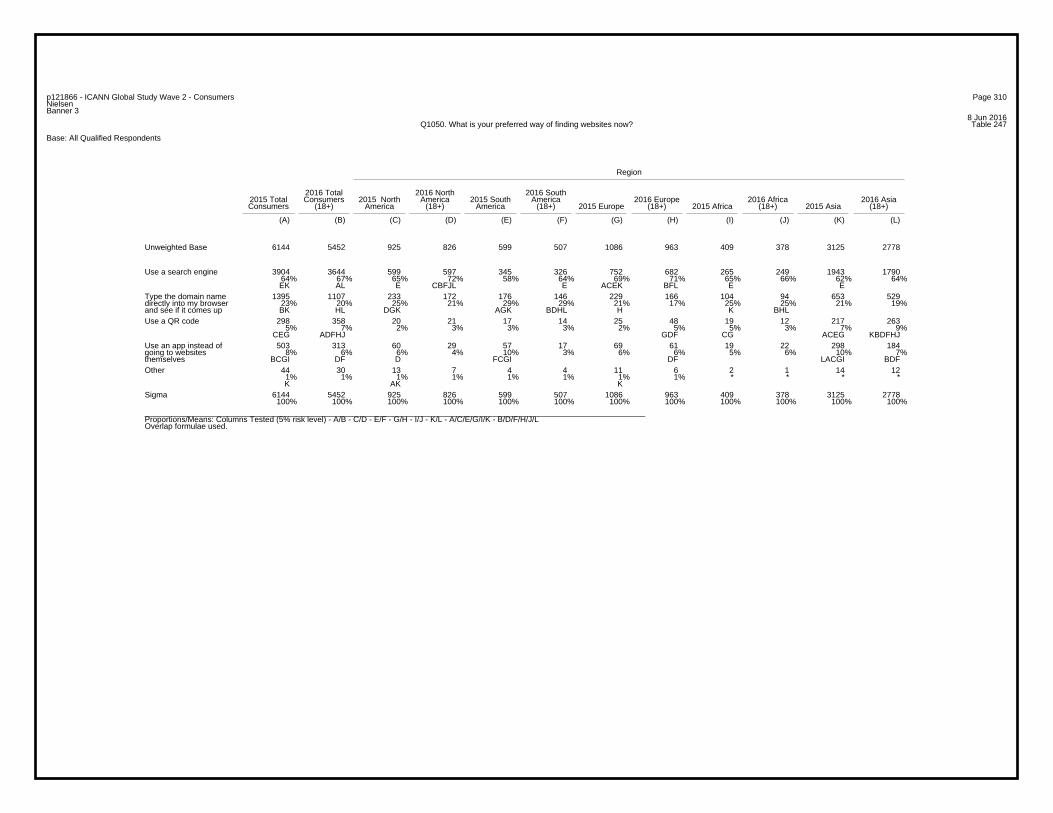
Page 310p121866 - ICANN Global Study Wave 2 - ConsumersNielsenBanner 3
8 Jun 2016Table 247Q1050. What is your preferred way of finding websites now?
Base: All Qualified Respondents
Region
2016 Total 2016 North 2016 South2015 Total Consumers 2015 North America 2015 South America 2016 Europe 2016 Africa 2016 AsiaConsumers (18+) America (18+) America (18+) 2015 Europe (18+) 2015 Africa (18+) 2015 Asia (18+)
(A) (B) (C) (D) (E) (F) (G) (H) (I) (J) (K) (L)
6144 5452 925 826 599 507 1086 963 409 378 3125 2778Unweighted Base
3904 3644 599 597 345 326 752 682 265 249 1943 179064% 67% 65% 72% 58% 64% 69% 71% 65% 66% 62% 64%EK AL E CBFJL E ACEK BFL E E
Use a search engine
1395 1107 233 172 176 146 229 166 104 94 653 52923% 20% 25% 21% 29% 29% 21% 17% 25% 25% 21% 19%BK HL DGK AGK BDHL H K BHL
Type the domain namedirectly into my browserand see if it comes up
298 358 20 21 17 14 25 48 19 12 217 2635% 7% 2% 3% 3% 3% 2% 5% 5% 3% 7% 9%
CEG ADFHJ GDF CG ACEG KBDFHJ
Use a QR code
503 313 60 29 57 17 69 61 19 22 298 1848% 6% 6% 4% 10% 3% 6% 6% 5% 6% 10% 7%
BCGI DF D FCGI DF LACGI BDF
Use an app instead ofgoing to websitesthemselves
44 30 13 7 4 4 11 6 2 1 14 121% 1% 1% 1% 1% 1% 1% 1% * * * * K AK K
Other
6144 5452 925 826 599 507 1086 963 409 378 3125 2778100% 100% 100% 100% 100% 100% 100% 100% 100% 100% 100% 100%
Sigma
_________________________________________________________________________________________________________________Proportions/Means: Columns Tested (5% risk level) - A/B - C/D - E/F - G/H - I/J - K/L - A/C/E/G/I/K - B/D/F/H/J/LOverlap formulae used.
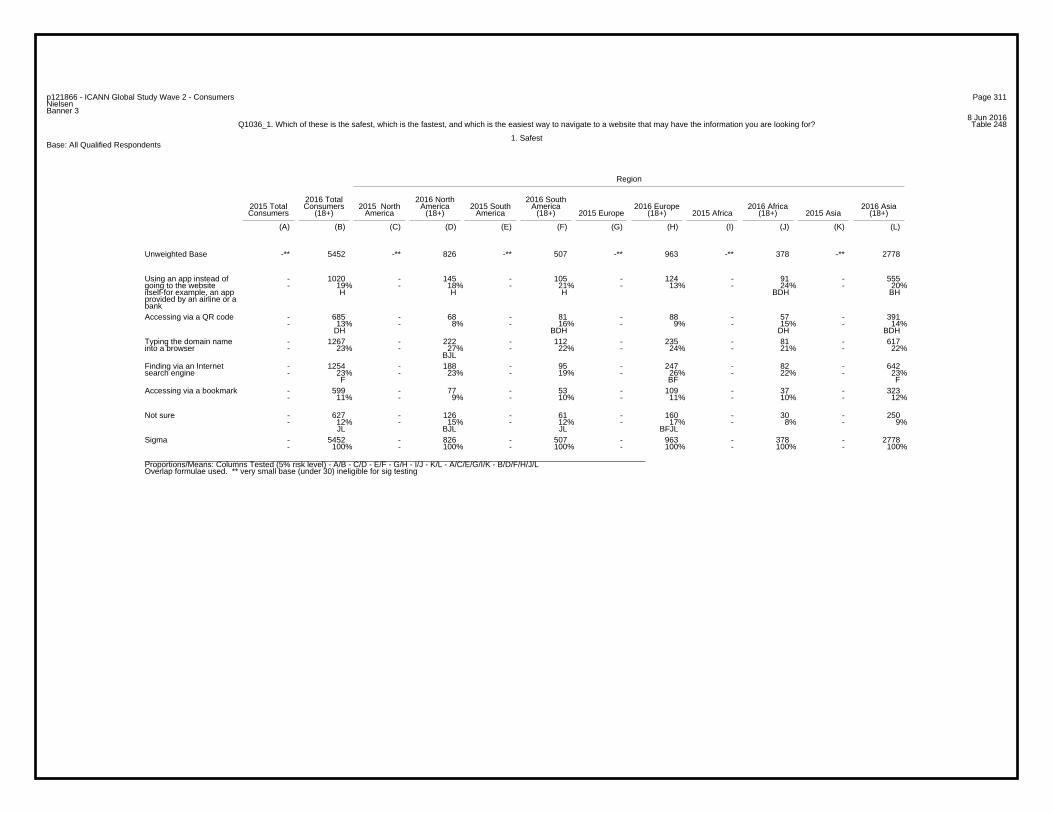
Page 311p121866 - ICANN Global Study Wave 2 - ConsumersNielsenBanner 3
8 Jun 2016Table 248Q1036_1. Which of these is the safest, which is the fastest, and which is the easiest way to navigate to a website that may have the information you are looking for?
1. SafestBase: All Qualified Respondents
Region
2016 Total 2016 North 2016 South2015 Total Consumers 2015 North America 2015 South America 2016 Europe 2016 Africa 2016 AsiaConsumers (18+) America (18+) America (18+) 2015 Europe (18+) 2015 Africa (18+) 2015 Asia (18+)
(A) (B) (C) (D) (E) (F) (G) (H) (I) (J) (K) (L)
-** 5452 -** 826 -** 507 -** 963 -** 378 -** 2778Unweighted Base
- 1020 - 145 - 105 - 124 - 91 - 555- 19% - 18% - 21% - 13% - 24% - 20%
H H H BDH BH
Using an app instead ofgoing to the websiteitself-for example, an appprovided by an airline or abank
- 685 - 68 - 81 - 88 - 57 - 391- 13% - 8% - 16% - 9% - 15% - 14%
DH BDH DH BDH
Accessing via a QR code
- 1267 - 222 - 112 - 235 - 81 - 617- 23% - 27% - 22% - 24% - 21% - 22%
BJL
Typing the domain nameinto a browser
- 1254 - 188 - 95 - 247 - 82 - 642- 23% - 23% - 19% - 26% - 22% - 23%
F BF F
Finding via an Internetsearch engine
- 599 - 77 - 53 - 109 - 37 - 323- 11% - 9% - 10% - 11% - 10% - 12%
Accessing via a bookmark
- 627 - 126 - 61 - 160 - 30 - 250- 12% - 15% - 12% - 17% - 8% - 9%
JL BJL JL BFJL
Not sure
- 5452 - 826 - 507 - 963 - 378 - 2778- 100% - 100% - 100% - 100% - 100% - 100%
Sigma
_________________________________________________________________________________________________________________Proportions/Means: Columns Tested (5% risk level) - A/B - C/D - E/F - G/H - I/J - K/L - A/C/E/G/I/K - B/D/F/H/J/LOverlap formulae used. ** very small base (under 30) ineligible for sig testing
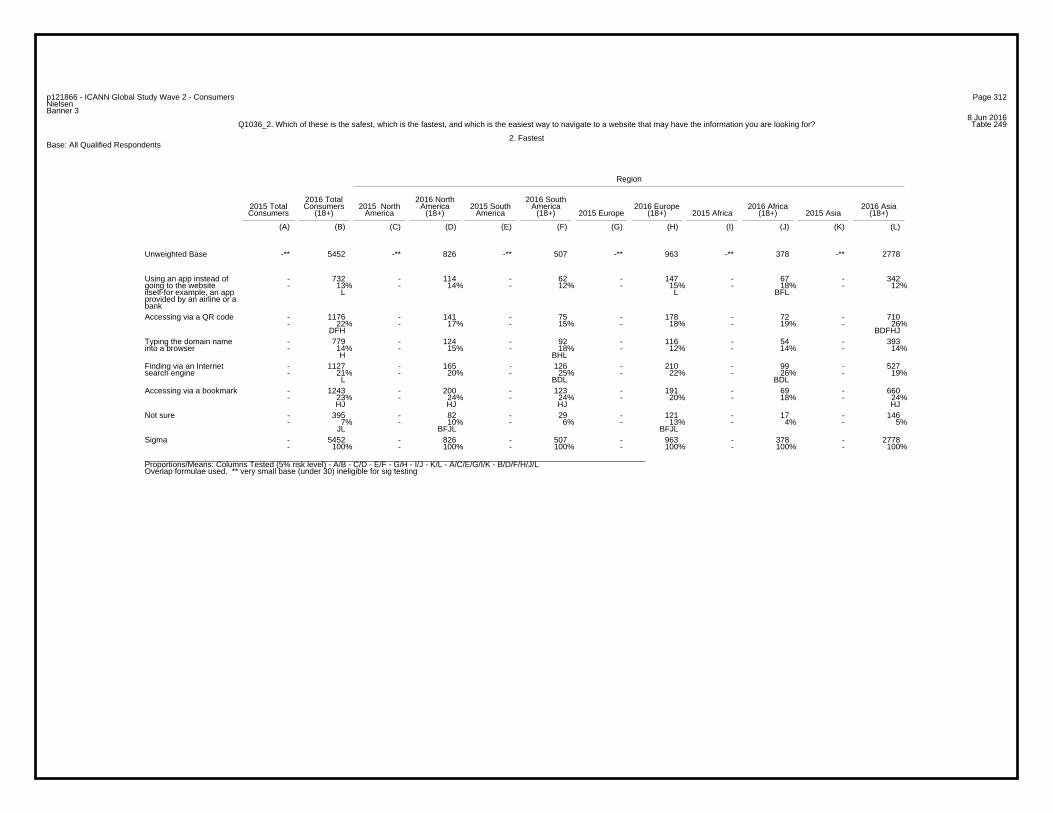
Page 312p121866 - ICANN Global Study Wave 2 - ConsumersNielsenBanner 3
8 Jun 2016Table 249Q1036_2. Which of these is the safest, which is the fastest, and which is the easiest way to navigate to a website that may have the information you are looking for?
2. FastestBase: All Qualified Respondents
Region
2016 Total 2016 North 2016 South2015 Total Consumers 2015 North America 2015 South America 2016 Europe 2016 Africa 2016 AsiaConsumers (18+) America (18+) America (18+) 2015 Europe (18+) 2015 Africa (18+) 2015 Asia (18+)
(A) (B) (C) (D) (E) (F) (G) (H) (I) (J) (K) (L)
-** 5452 -** 826 -** 507 -** 963 -** 378 -** 2778Unweighted Base
- 732 - 114 - 62 - 147 - 67 - 342- 13% - 14% - 12% - 15% - 18% - 12%
L L BFL
Using an app instead ofgoing to the websiteitself-for example, an appprovided by an airline or abank
- 1176 - 141 - 75 - 178 - 72 - 710- 22% - 17% - 15% - 18% - 19% - 26%
DFH BDFHJ
Accessing via a QR code
- 779 - 124 - 92 - 116 - 54 - 393- 14% - 15% - 18% - 12% - 14% - 14%
H BHL
Typing the domain nameinto a browser
- 1127 - 165 - 126 - 210 - 99 - 527- 21% - 20% - 25% - 22% - 26% - 19%
L BDL BDL
Finding via an Internetsearch engine
- 1243 - 200 - 123 - 191 - 69 - 660- 23% - 24% - 24% - 20% - 18% - 24%
HJ HJ HJ HJ
Accessing via a bookmark
- 395 - 82 - 29 - 121 - 17 - 146- 7% - 10% - 6% - 13% - 4% - 5%
JL BFJL BFJL
Not sure
- 5452 - 826 - 507 - 963 - 378 - 2778- 100% - 100% - 100% - 100% - 100% - 100%
Sigma
_________________________________________________________________________________________________________________Proportions/Means: Columns Tested (5% risk level) - A/B - C/D - E/F - G/H - I/J - K/L - A/C/E/G/I/K - B/D/F/H/J/LOverlap formulae used. ** very small base (under 30) ineligible for sig testing

Page 313p121866 - ICANN Global Study Wave 2 - ConsumersNielsenBanner 3
8 Jun 2016Table 250Q1036_3. Which of these is the safest, which is the fastest, and which is the easiest way to navigate to a website that may have the information you are looking for?
3. EasiestBase: All Qualified Respondents
Region
2016 Total 2016 North 2016 South2015 Total Consumers 2015 North America 2015 South America 2016 Europe 2016 Africa 2016 AsiaConsumers (18+) America (18+) America (18+) 2015 Europe (18+) 2015 Africa (18+) 2015 Asia (18+)
(A) (B) (C) (D) (E) (F) (G) (H) (I) (J) (K) (L)
-** 5452 -** 826 -** 507 -** 963 -** 378 -** 2778Unweighted Base
- 744 - 134 - 78 - 133 - 68 - 331- 14% - 16% - 15% - 14% - 18% - 12%
L BL L BL
Using an app instead ofgoing to the websiteitself-for example, an appprovided by an airline or abank
- 852 - 110 - 61 - 124 - 45 - 512- 16% - 13% - 12% - 13% - 12% - 18%
DFHJ BDFHJ
Accessing via a QR code
- 751 - 86 - 91 - 117 - 67 - 390- 14% - 10% - 18% - 12% - 18% - 14%
D BDHL BDH D
Typing the domain nameinto a browser
- 1620 - 235 - 155 - 308 - 113 - 809- 30% - 28% - 31% - 32% - 30% - 29%
Finding via an Internetsearch engine
- 1029 - 159 - 84 - 145 - 68 - 573- 19% - 19% - 17% - 15% - 18% - 21%
H H BFH
Accessing via a bookmark
- 456 - 102 - 38 - 136 - 17 - 163- 8% - 12% - 7% - 14% - 4% - 6%
JL BFJL BFJL
Not sure
- 5452 - 826 - 507 - 963 - 378 - 2778- 100% - 100% - 100% - 100% - 100% - 100%
Sigma
_________________________________________________________________________________________________________________Proportions/Means: Columns Tested (5% risk level) - A/B - C/D - E/F - G/H - I/J - K/L - A/C/E/G/I/K - B/D/F/H/J/LOverlap formulae used. ** very small base (under 30) ineligible for sig testing
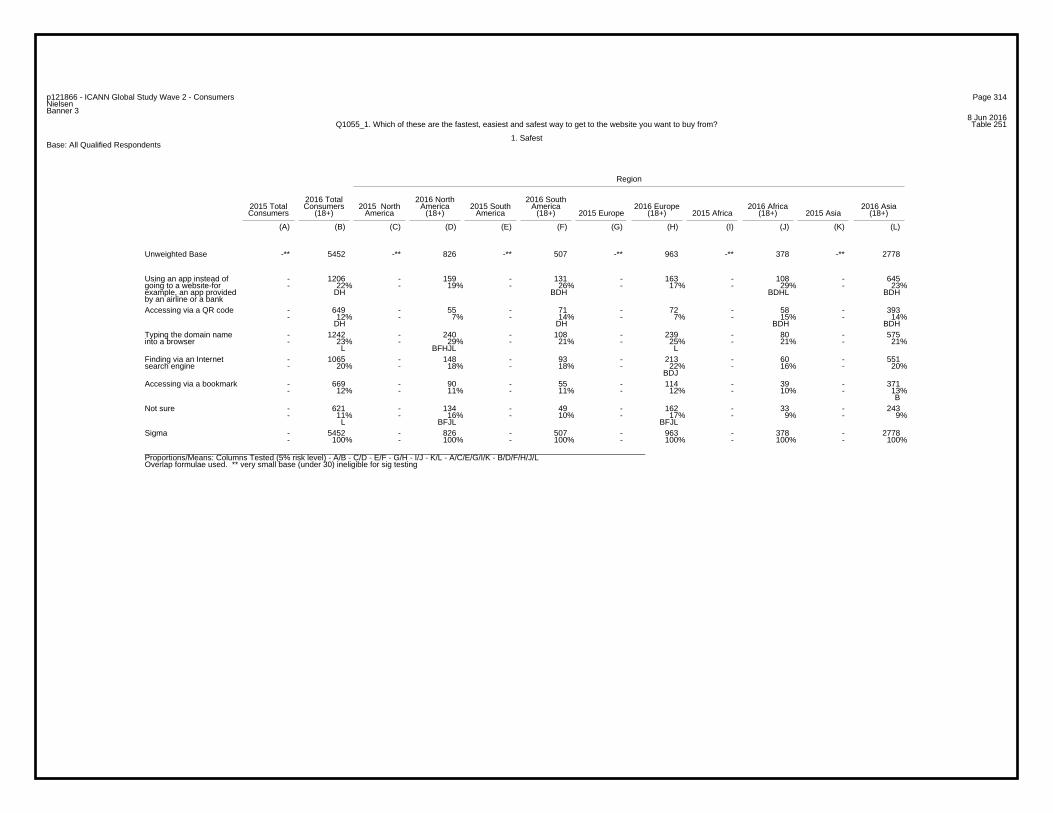
Page 314p121866 - ICANN Global Study Wave 2 - ConsumersNielsenBanner 3
8 Jun 2016Table 251Q1055_1. Which of these are the fastest, easiest and safest way to get to the website you want to buy from?
1. SafestBase: All Qualified Respondents
Region
2016 Total 2016 North 2016 South2015 Total Consumers 2015 North America 2015 South America 2016 Europe 2016 Africa 2016 AsiaConsumers (18+) America (18+) America (18+) 2015 Europe (18+) 2015 Africa (18+) 2015 Asia (18+)
(A) (B) (C) (D) (E) (F) (G) (H) (I) (J) (K) (L)
-** 5452 -** 826 -** 507 -** 963 -** 378 -** 2778Unweighted Base
- 1206 - 159 - 131 - 163 - 108 - 645- 22% - 19% - 26% - 17% - 29% - 23%
DH BDH BDHL BDH
Using an app instead ofgoing to a website-forexample, an app providedby an airline or a bank
- 649 - 55 - 71 - 72 - 58 - 393- 12% - 7% - 14% - 7% - 15% - 14%
DH DH BDH BDH
Accessing via a QR code
- 1242 - 240 - 108 - 239 - 80 - 575- 23% - 29% - 21% - 25% - 21% - 21%
L BFHJL L
Typing the domain nameinto a browser
- 1065 - 148 - 93 - 213 - 60 - 551- 20% - 18% - 18% - 22% - 16% - 20%
BDJ
Finding via an Internetsearch engine
- 669 - 90 - 55 - 114 - 39 - 371- 12% - 11% - 11% - 12% - 10% - 13%
B
Accessing via a bookmark
- 621 - 134 - 49 - 162 - 33 - 243- 11% - 16% - 10% - 17% - 9% - 9%
L BFJL BFJL
Not sure
- 5452 - 826 - 507 - 963 - 378 - 2778- 100% - 100% - 100% - 100% - 100% - 100%
Sigma
_________________________________________________________________________________________________________________Proportions/Means: Columns Tested (5% risk level) - A/B - C/D - E/F - G/H - I/J - K/L - A/C/E/G/I/K - B/D/F/H/J/LOverlap formulae used. ** very small base (under 30) ineligible for sig testing
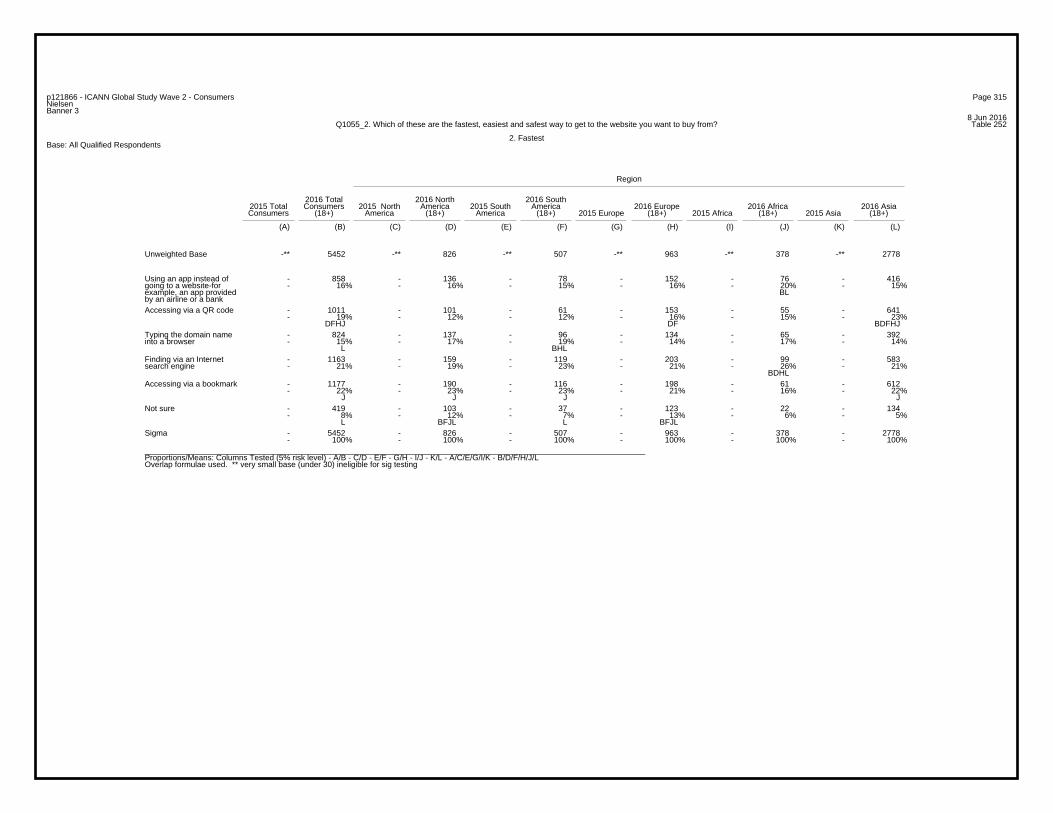
Page 315p121866 - ICANN Global Study Wave 2 - ConsumersNielsenBanner 3
8 Jun 2016Table 252Q1055_2. Which of these are the fastest, easiest and safest way to get to the website you want to buy from?
2. FastestBase: All Qualified Respondents
Region
2016 Total 2016 North 2016 South2015 Total Consumers 2015 North America 2015 South America 2016 Europe 2016 Africa 2016 AsiaConsumers (18+) America (18+) America (18+) 2015 Europe (18+) 2015 Africa (18+) 2015 Asia (18+)
(A) (B) (C) (D) (E) (F) (G) (H) (I) (J) (K) (L)
-** 5452 -** 826 -** 507 -** 963 -** 378 -** 2778Unweighted Base
- 858 - 136 - 78 - 152 - 76 - 416- 16% - 16% - 15% - 16% - 20% - 15%
BL
Using an app instead ofgoing to a website-forexample, an app providedby an airline or a bank
- 1011 - 101 - 61 - 153 - 55 - 641- 19% - 12% - 12% - 16% - 15% - 23%
DFHJ DF BDFHJ
Accessing via a QR code
- 824 - 137 - 96 - 134 - 65 - 392- 15% - 17% - 19% - 14% - 17% - 14%
L BHL
Typing the domain nameinto a browser
- 1163 - 159 - 119 - 203 - 99 - 583- 21% - 19% - 23% - 21% - 26% - 21%
BDHL
Finding via an Internetsearch engine
- 1177 - 190 - 116 - 198 - 61 - 612- 22% - 23% - 23% - 21% - 16% - 22%
J J J J
Accessing via a bookmark
- 419 - 103 - 37 - 123 - 22 - 134- 8% - 12% - 7% - 13% - 6% - 5%
L BFJL L BFJL
Not sure
- 5452 - 826 - 507 - 963 - 378 - 2778- 100% - 100% - 100% - 100% - 100% - 100%
Sigma
_________________________________________________________________________________________________________________Proportions/Means: Columns Tested (5% risk level) - A/B - C/D - E/F - G/H - I/J - K/L - A/C/E/G/I/K - B/D/F/H/J/LOverlap formulae used. ** very small base (under 30) ineligible for sig testing

Page 316p121866 - ICANN Global Study Wave 2 - ConsumersNielsenBanner 3
8 Jun 2016Table 253Q1055_3. Which of these are the fastest, easiest and safest way to get to the website you want to buy from?
3. EasiestBase: All Qualified Respondents
Region
2016 Total 2016 North 2016 South2015 Total Consumers 2015 North America 2015 South America 2016 Europe 2016 Africa 2016 AsiaConsumers (18+) America (18+) America (18+) 2015 Europe (18+) 2015 Africa (18+) 2015 Asia (18+)
(A) (B) (C) (D) (E) (F) (G) (H) (I) (J) (K) (L)
-** 5452 -** 826 -** 507 -** 963 -** 378 -** 2778Unweighted Base
- 850 - 139 - 66 - 139 - 92 - 414- 16% - 17% - 13% - 14% - 24% - 15%
BDFHL
Using an app instead ofgoing to a website-forexample, an app providedby an airline or a bank
- 798 - 91 - 49 - 111 - 40 - 507- 15% - 11% - 10% - 12% - 11% - 18%
DFHJ BDFHJ
Accessing via a QR code
- 809 - 109 - 93 - 148 - 53 - 406- 15% - 13% - 18% - 15% - 14% - 15%
BDL
Typing the domain nameinto a browser
- 1498 - 199 - 156 - 284 - 107 - 752- 27% - 24% - 31% - 29% - 28% - 27%
D D D
Finding via an Internetsearch engine
- 982 - 167 - 93 - 129 - 62 - 531- 18% - 20% - 18% - 13% - 16% - 19%
H H H BH
Accessing via a bookmark
- 515 - 121 - 50 - 152 - 24 - 168- 9% - 15% - 10% - 16% - 6% - 6%
JL BFJL L BFJL
Not sure
- 5452 - 826 - 507 - 963 - 378 - 2778- 100% - 100% - 100% - 100% - 100% - 100%
Sigma
_________________________________________________________________________________________________________________Proportions/Means: Columns Tested (5% risk level) - A/B - C/D - E/F - G/H - I/J - K/L - A/C/E/G/I/K - B/D/F/H/J/LOverlap formulae used. ** very small base (under 30) ineligible for sig testing

Page 317p121866 - ICANN Global Study Wave 2 - ConsumersNielsenBanner 3
8 Jun 2016Table 254Q1060_1. Lastly, think about a website you go to regularly and where you will access your personal information, like banking or healthcare information?
Which of these is the safest, which is the easiest, and which is the fastest method?
1. SafestBase: All Qualified Respondents
Region
2016 Total 2016 North 2016 South2015 Total Consumers 2015 North America 2015 South America 2016 Europe 2016 Africa 2016 AsiaConsumers (18+) America (18+) America (18+) 2015 Europe (18+) 2015 Africa (18+) 2015 Asia (18+)
(A) (B) (C) (D) (E) (F) (G) (H) (I) (J) (K) (L)
-** 5452 -** 826 -** 507 -** 963 -** 378 -** 2778Unweighted Base
- 1409 - 217 - 148 - 203 - 133 - 708- 26% - 26% - 29% - 21% - 35% - 25%
H H H BDHL H
Using an app provided bythe website owner-forexample, an app providedby an airline or a bank
- 643 - 55 - 65 - 82 - 48 - 393- 12% - 7% - 13% - 9% - 13% - 14%
DH DH DH BDH
Accessing via a QR code
- 1158 - 197 - 121 - 216 - 87 - 537- 21% - 24% - 24% - 22% - 23% - 19%
L BL L L
Typing the domain nameinto a browser
- 869 - 92 - 54 - 180 - 50 - 493- 16% - 11% - 11% - 19% - 13% - 18%
DF BDFJ BDFJ
Finding via an Internetsearch engine
- 763 - 136 - 68 - 127 - 37 - 395- 14% - 16% - 13% - 13% - 10% - 14%
J BJ J
Accessing via a bookmark
- 610 - 129 - 51 - 155 - 23 - 252- 11% - 16% - 10% - 16% - 6% - 9%
JL BFJL J BFJL
Not sure
- 5452 - 826 - 507 - 963 - 378 - 2778- 100% - 100% - 100% - 100% - 100% - 100%
Sigma
_________________________________________________________________________________________________________________Proportions/Means: Columns Tested (5% risk level) - A/B - C/D - E/F - G/H - I/J - K/L - A/C/E/G/I/K - B/D/F/H/J/LOverlap formulae used. ** very small base (under 30) ineligible for sig testing

Page 318p121866 - ICANN Global Study Wave 2 - ConsumersNielsenBanner 3
8 Jun 2016Table 255Q1060_2. Lastly, think about a website you go to regularly and where you will access your personal information, like banking or healthcare information?
Which of these is the safest, which is the easiest, and which is the fastest method?
2. FastestBase: All Qualified Respondents
Region
2016 Total 2016 North 2016 South2015 Total Consumers 2015 North America 2015 South America 2016 Europe 2016 Africa 2016 AsiaConsumers (18+) America (18+) America (18+) 2015 Europe (18+) 2015 Africa (18+) 2015 Asia (18+)
(A) (B) (C) (D) (E) (F) (G) (H) (I) (J) (K) (L)
-** 5452 -** 826 -** 507 -** 963 -** 378 -** 2778Unweighted Base
- 885 - 143 - 80 - 156 - 79 - 427- 16% - 17% - 16% - 16% - 21% - 15%
BHL
Using an app provided bythe website owner-forexample, an app providedby an airline or a bank
- 927 - 85 - 66 - 131 - 46 - 599- 17% - 10% - 13% - 14% - 12% - 22%
DFHJ D BDFHJ
Accessing via a QR code
- 850 - 117 - 102 - 147 - 63 - 421- 16% - 14% - 20% - 15% - 17% - 15%
BDHL
Typing the domain nameinto a browser
- 1016 - 141 - 101 - 188 - 80 - 506- 19% - 17% - 20% - 20% - 21% - 18%
Finding via an Internetsearch engine
- 1285 - 225 - 116 - 208 - 87 - 649- 24% - 27% - 23% - 22% - 23% - 23%
BHL
Accessing via a bookmark
- 489 - 115 - 42 - 133 - 23 - 176- 9% - 14% - 8% - 14% - 6% - 6%
JL BFJL BFJL
Not sure
- 5452 - 826 - 507 - 963 - 378 - 2778- 100% - 100% - 100% - 100% - 100% - 100%
Sigma
_________________________________________________________________________________________________________________Proportions/Means: Columns Tested (5% risk level) - A/B - C/D - E/F - G/H - I/J - K/L - A/C/E/G/I/K - B/D/F/H/J/LOverlap formulae used. ** very small base (under 30) ineligible for sig testing
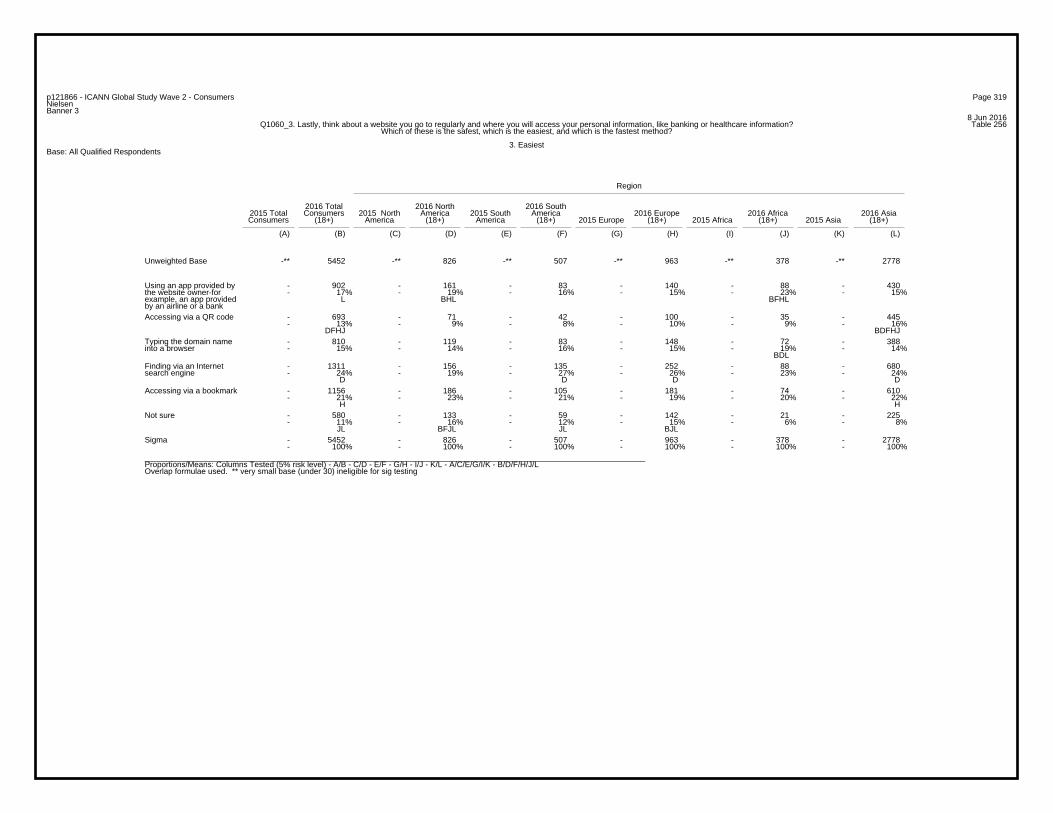
Page 319p121866 - ICANN Global Study Wave 2 - ConsumersNielsenBanner 3
8 Jun 2016Table 256Q1060_3. Lastly, think about a website you go to regularly and where you will access your personal information, like banking or healthcare information?
Which of these is the safest, which is the easiest, and which is the fastest method?
3. EasiestBase: All Qualified Respondents
Region
2016 Total 2016 North 2016 South2015 Total Consumers 2015 North America 2015 South America 2016 Europe 2016 Africa 2016 AsiaConsumers (18+) America (18+) America (18+) 2015 Europe (18+) 2015 Africa (18+) 2015 Asia (18+)
(A) (B) (C) (D) (E) (F) (G) (H) (I) (J) (K) (L)
-** 5452 -** 826 -** 507 -** 963 -** 378 -** 2778Unweighted Base
- 902 - 161 - 83 - 140 - 88 - 430- 17% - 19% - 16% - 15% - 23% - 15%
L BHL BFHL
Using an app provided bythe website owner-forexample, an app providedby an airline or a bank
- 693 - 71 - 42 - 100 - 35 - 445- 13% - 9% - 8% - 10% - 9% - 16%
DFHJ BDFHJ
Accessing via a QR code
- 810 - 119 - 83 - 148 - 72 - 388- 15% - 14% - 16% - 15% - 19% - 14%
BDL
Typing the domain nameinto a browser
- 1311 - 156 - 135 - 252 - 88 - 680- 24% - 19% - 27% - 26% - 23% - 24%
D D D D
Finding via an Internetsearch engine
- 1156 - 186 - 105 - 181 - 74 - 610- 21% - 23% - 21% - 19% - 20% - 22%
H H
Accessing via a bookmark
- 580 - 133 - 59 - 142 - 21 - 225- 11% - 16% - 12% - 15% - 6% - 8%
JL BFJL JL BJL
Not sure
- 5452 - 826 - 507 - 963 - 378 - 2778- 100% - 100% - 100% - 100% - 100% - 100%
Sigma
_________________________________________________________________________________________________________________Proportions/Means: Columns Tested (5% risk level) - A/B - C/D - E/F - G/H - I/J - K/L - A/C/E/G/I/K - B/D/F/H/J/LOverlap formulae used. ** very small base (under 30) ineligible for sig testing
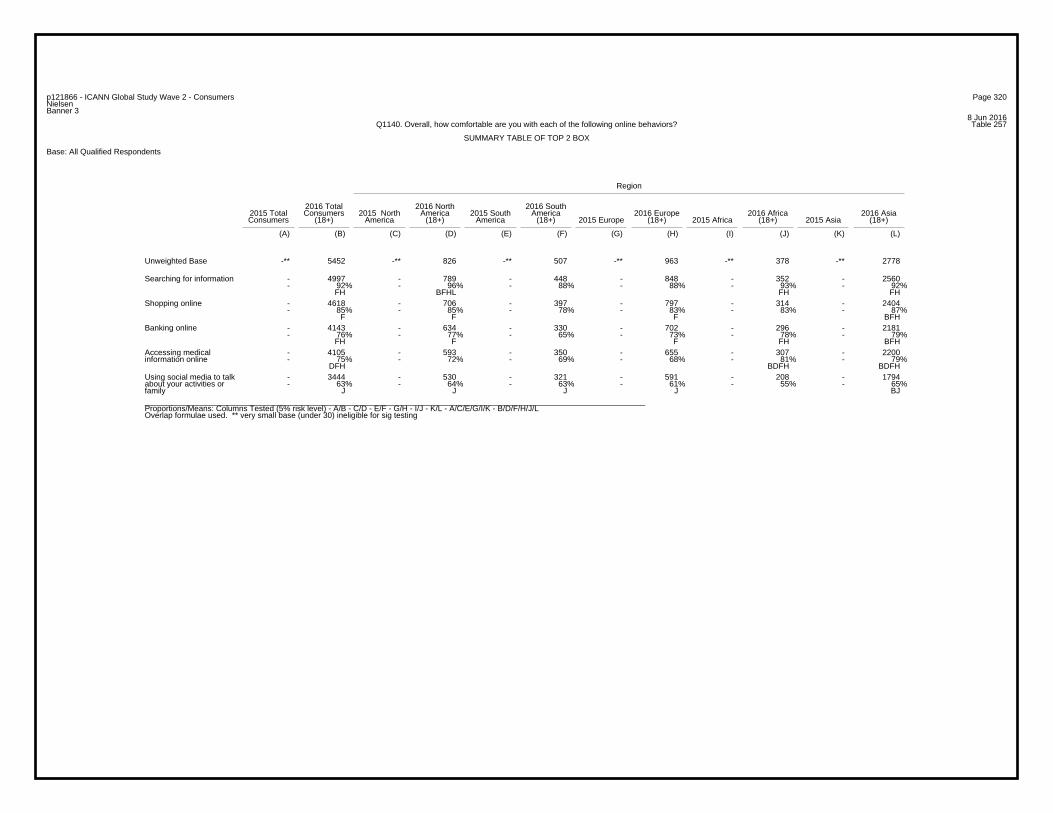
Page 320p121866 - ICANN Global Study Wave 2 - ConsumersNielsenBanner 3
8 Jun 2016Table 257Q1140. Overall, how comfortable are you with each of the following online behaviors?
SUMMARY TABLE OF TOP 2 BOX
Base: All Qualified Respondents
Region
2016 Total 2016 North 2016 South2015 Total Consumers 2015 North America 2015 South America 2016 Europe 2016 Africa 2016 AsiaConsumers (18+) America (18+) America (18+) 2015 Europe (18+) 2015 Africa (18+) 2015 Asia (18+)
(A) (B) (C) (D) (E) (F) (G) (H) (I) (J) (K) (L)
-** 5452 -** 826 -** 507 -** 963 -** 378 -** 2778Unweighted Base
- 4997 - 789 - 448 - 848 - 352 - 2560- 92% - 96% - 88% - 88% - 93% - 92%
FH BFHL FH FH
Searching for information
- 4618 - 706 - 397 - 797 - 314 - 2404- 85% - 85% - 78% - 83% - 83% - 87%
F F F BFH
Shopping online
- 4143 - 634 - 330 - 702 - 296 - 2181- 76% - 77% - 65% - 73% - 78% - 79%
FH F F FH BFH
Banking online
- 4105 - 593 - 350 - 655 - 307 - 2200- 75% - 72% - 69% - 68% - 81% - 79%
DFH BDFH BDFH
Accessing medicalinformation online
- 3444 - 530 - 321 - 591 - 208 - 1794- 63% - 64% - 63% - 61% - 55% - 65%
J J J J BJ
Using social media to talkabout your activities orfamily_________________________________________________________________________________________________________________Proportions/Means: Columns Tested (5% risk level) - A/B - C/D - E/F - G/H - I/J - K/L - A/C/E/G/I/K - B/D/F/H/J/LOverlap formulae used. ** very small base (under 30) ineligible for sig testing
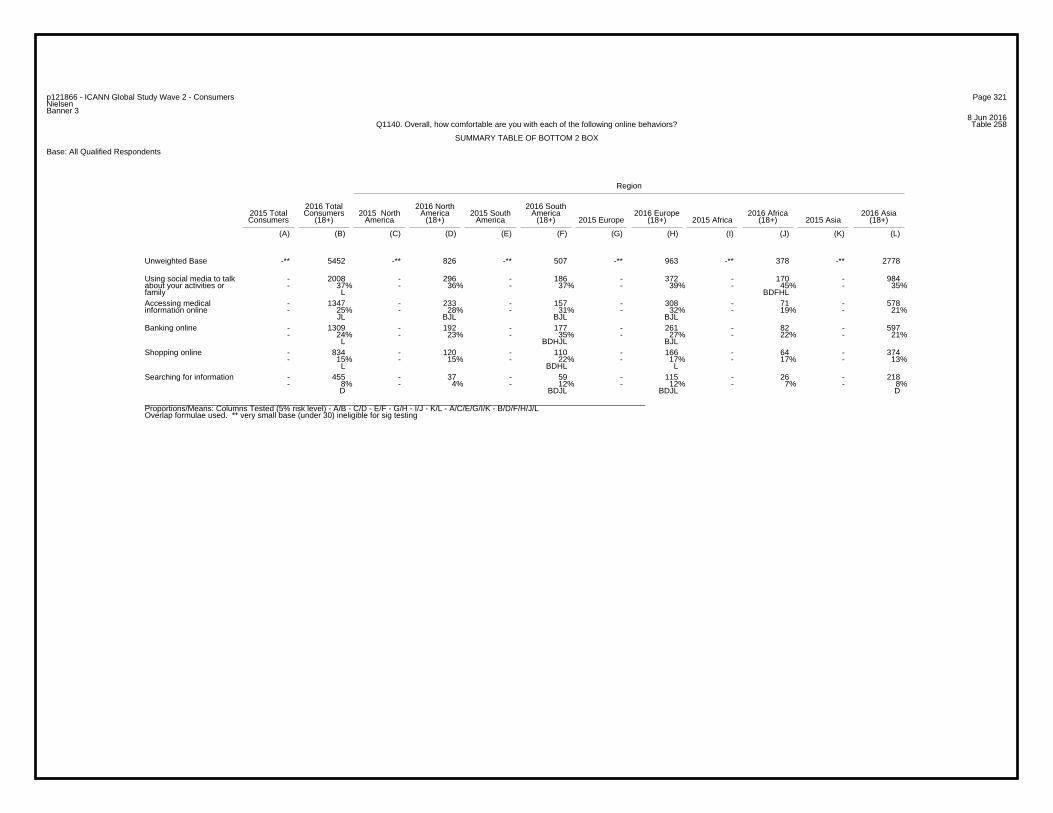
Page 321p121866 - ICANN Global Study Wave 2 - ConsumersNielsenBanner 3
8 Jun 2016Table 258Q1140. Overall, how comfortable are you with each of the following online behaviors?
SUMMARY TABLE OF BOTTOM 2 BOX
Base: All Qualified Respondents
Region
2016 Total 2016 North 2016 South2015 Total Consumers 2015 North America 2015 South America 2016 Europe 2016 Africa 2016 AsiaConsumers (18+) America (18+) America (18+) 2015 Europe (18+) 2015 Africa (18+) 2015 Asia (18+)
(A) (B) (C) (D) (E) (F) (G) (H) (I) (J) (K) (L)
-** 5452 -** 826 -** 507 -** 963 -** 378 -** 2778Unweighted Base
- 2008 - 296 - 186 - 372 - 170 - 984- 37% - 36% - 37% - 39% - 45% - 35%
L BDFHL
Using social media to talkabout your activities orfamily
- 1347 - 233 - 157 - 308 - 71 - 578- 25% - 28% - 31% - 32% - 19% - 21%
JL BJL BJL BJL
Accessing medicalinformation online
- 1309 - 192 - 177 - 261 - 82 - 597- 24% - 23% - 35% - 27% - 22% - 21%
L BDHJL BJL
Banking online
- 834 - 120 - 110 - 166 - 64 - 374- 15% - 15% - 22% - 17% - 17% - 13%
L BDHL L
Shopping online
- 455 - 37 - 59 - 115 - 26 - 218- 8% - 4% - 12% - 12% - 7% - 8%
D BDJL BDJL D
Searching for information
_________________________________________________________________________________________________________________Proportions/Means: Columns Tested (5% risk level) - A/B - C/D - E/F - G/H - I/J - K/L - A/C/E/G/I/K - B/D/F/H/J/LOverlap formulae used. ** very small base (under 30) ineligible for sig testing
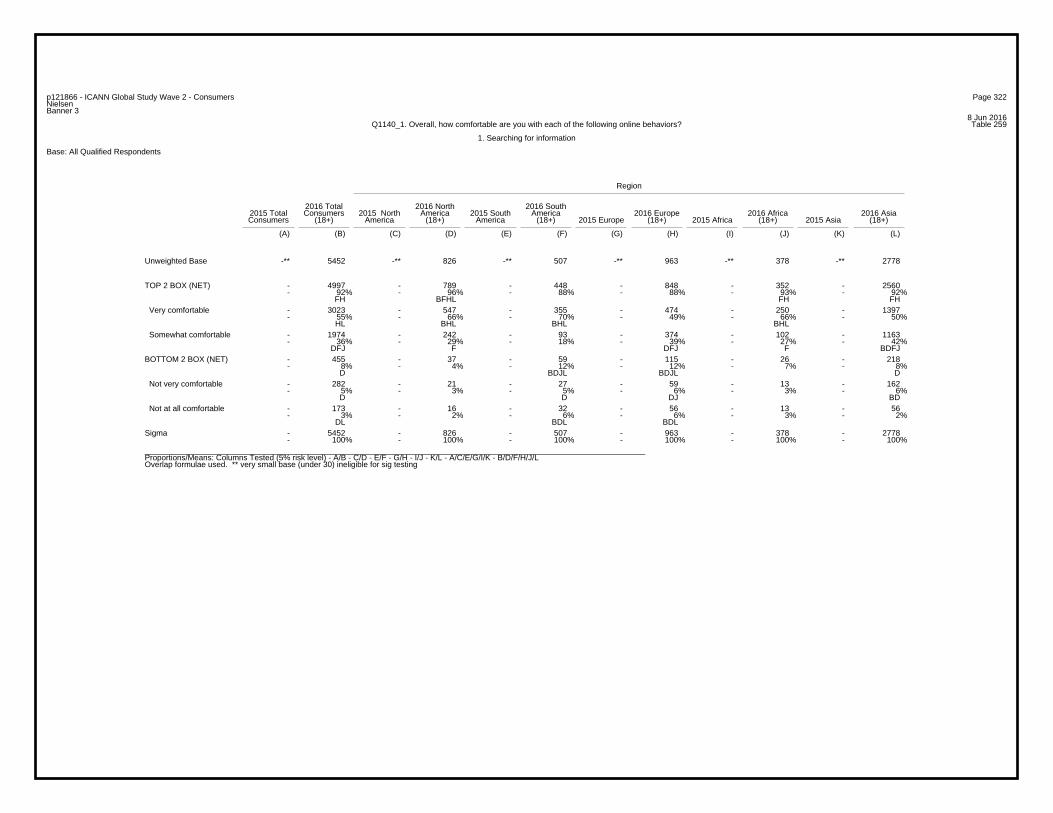
Page 322p121866 - ICANN Global Study Wave 2 - ConsumersNielsenBanner 3
8 Jun 2016Table 259Q1140_1. Overall, how comfortable are you with each of the following online behaviors?
1. Searching for information
Base: All Qualified Respondents
Region
2016 Total 2016 North 2016 South2015 Total Consumers 2015 North America 2015 South America 2016 Europe 2016 Africa 2016 AsiaConsumers (18+) America (18+) America (18+) 2015 Europe (18+) 2015 Africa (18+) 2015 Asia (18+)
(A) (B) (C) (D) (E) (F) (G) (H) (I) (J) (K) (L)
-** 5452 -** 826 -** 507 -** 963 -** 378 -** 2778Unweighted Base
- 4997 - 789 - 448 - 848 - 352 - 2560- 92% - 96% - 88% - 88% - 93% - 92%
FH BFHL FH FH
TOP 2 BOX (NET)
- 3023 - 547 - 355 - 474 - 250 - 1397- 55% - 66% - 70% - 49% - 66% - 50%
HL BHL BHL BHL
Very comfortable
- 1974 - 242 - 93 - 374 - 102 - 1163- 36% - 29% - 18% - 39% - 27% - 42%
DFJ F DFJ F BDFJ
Somewhat comfortable
- 455 - 37 - 59 - 115 - 26 - 218- 8% - 4% - 12% - 12% - 7% - 8%
D BDJL BDJL D
BOTTOM 2 BOX (NET)
- 282 - 21 - 27 - 59 - 13 - 162- 5% - 3% - 5% - 6% - 3% - 6%
D D DJ BD
Not very comfortable
- 173 - 16 - 32 - 56 - 13 - 56- 3% - 2% - 6% - 6% - 3% - 2%
DL BDL BDL
Not at all comfortable
- 5452 - 826 - 507 - 963 - 378 - 2778- 100% - 100% - 100% - 100% - 100% - 100%
Sigma
_________________________________________________________________________________________________________________Proportions/Means: Columns Tested (5% risk level) - A/B - C/D - E/F - G/H - I/J - K/L - A/C/E/G/I/K - B/D/F/H/J/LOverlap formulae used. ** very small base (under 30) ineligible for sig testing
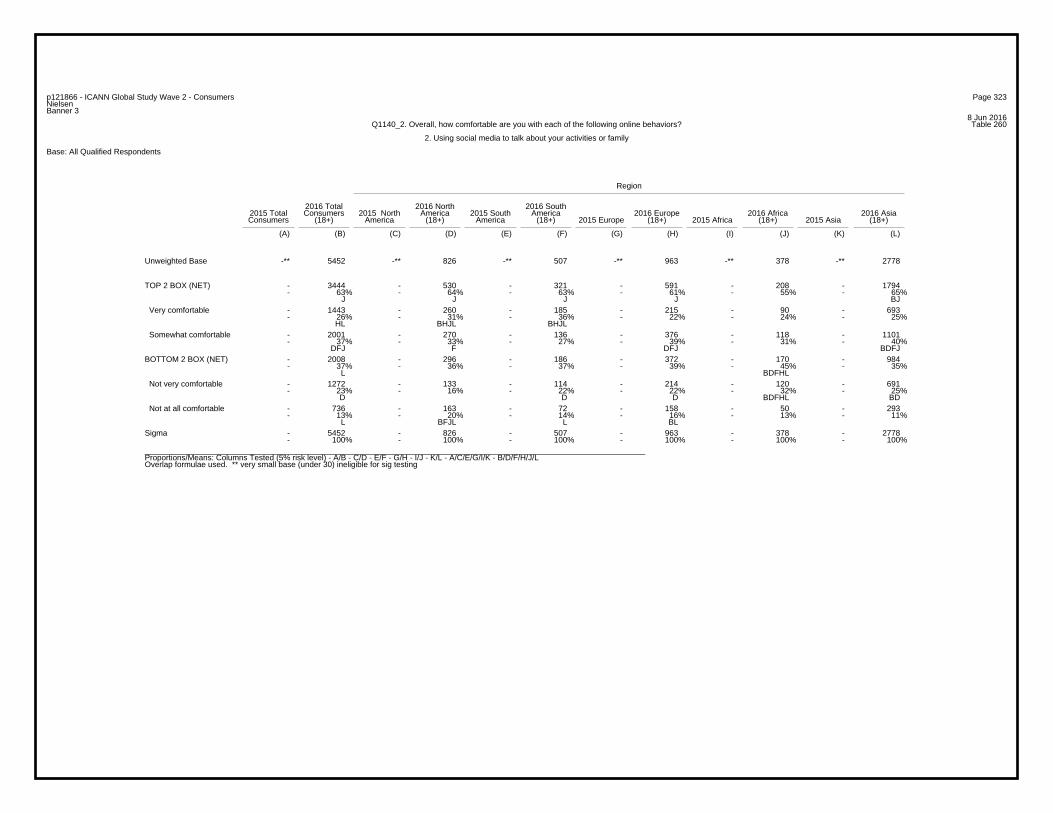
Page 323p121866 - ICANN Global Study Wave 2 - ConsumersNielsenBanner 3
8 Jun 2016Table 260Q1140_2. Overall, how comfortable are you with each of the following online behaviors?
2. Using social media to talk about your activities or family
Base: All Qualified Respondents
Region
2016 Total 2016 North 2016 South2015 Total Consumers 2015 North America 2015 South America 2016 Europe 2016 Africa 2016 AsiaConsumers (18+) America (18+) America (18+) 2015 Europe (18+) 2015 Africa (18+) 2015 Asia (18+)
(A) (B) (C) (D) (E) (F) (G) (H) (I) (J) (K) (L)
-** 5452 -** 826 -** 507 -** 963 -** 378 -** 2778Unweighted Base
- 3444 - 530 - 321 - 591 - 208 - 1794- 63% - 64% - 63% - 61% - 55% - 65%
J J J J BJ
TOP 2 BOX (NET)
- 1443 - 260 - 185 - 215 - 90 - 693- 26% - 31% - 36% - 22% - 24% - 25%
HL BHJL BHJL
Very comfortable
- 2001 - 270 - 136 - 376 - 118 - 1101- 37% - 33% - 27% - 39% - 31% - 40%
DFJ F DFJ BDFJ
Somewhat comfortable
- 2008 - 296 - 186 - 372 - 170 - 984- 37% - 36% - 37% - 39% - 45% - 35%
L BDFHL
BOTTOM 2 BOX (NET)
- 1272 - 133 - 114 - 214 - 120 - 691- 23% - 16% - 22% - 22% - 32% - 25%
D D D BDFHL BD
Not very comfortable
- 736 - 163 - 72 - 158 - 50 - 293- 13% - 20% - 14% - 16% - 13% - 11%
L BFJL L BL
Not at all comfortable
- 5452 - 826 - 507 - 963 - 378 - 2778- 100% - 100% - 100% - 100% - 100% - 100%
Sigma
_________________________________________________________________________________________________________________Proportions/Means: Columns Tested (5% risk level) - A/B - C/D - E/F - G/H - I/J - K/L - A/C/E/G/I/K - B/D/F/H/J/LOverlap formulae used. ** very small base (under 30) ineligible for sig testing

Page 324p121866 - ICANN Global Study Wave 2 - ConsumersNielsenBanner 3
8 Jun 2016Table 261Q1140_3. Overall, how comfortable are you with each of the following online behaviors?
3. Shopping online
Base: All Qualified Respondents
Region
2016 Total 2016 North 2016 South2015 Total Consumers 2015 North America 2015 South America 2016 Europe 2016 Africa 2016 AsiaConsumers (18+) America (18+) America (18+) 2015 Europe (18+) 2015 Africa (18+) 2015 Asia (18+)
(A) (B) (C) (D) (E) (F) (G) (H) (I) (J) (K) (L)
-** 5452 -** 826 -** 507 -** 963 -** 378 -** 2778Unweighted Base
- 4618 - 706 - 397 - 797 - 314 - 2404- 85% - 85% - 78% - 83% - 83% - 87%
F F F BFH
TOP 2 BOX (NET)
- 2190 - 326 - 196 - 326 - 136 - 1206- 40% - 39% - 39% - 34% - 36% - 43%
H H BDFHJ
Very comfortable
- 2428 - 380 - 201 - 471 - 178 - 1198- 45% - 46% - 40% - 49% - 47% - 43%
FL F BFL F
Somewhat comfortable
- 834 - 120 - 110 - 166 - 64 - 374- 15% - 15% - 22% - 17% - 17% - 13%
L BDHL L
BOTTOM 2 BOX (NET)
- 648 - 79 - 78 - 126 - 47 - 318- 12% - 10% - 15% - 13% - 12% - 11%
D BDL D
Not very comfortable
- 186 - 41 - 32 - 40 - 17 - 56- 3% - 5% - 6% - 4% - 4% - 2%
L BL BL L L
Not at all comfortable
- 5452 - 826 - 507 - 963 - 378 - 2778- 100% - 100% - 100% - 100% - 100% - 100%
Sigma
_________________________________________________________________________________________________________________Proportions/Means: Columns Tested (5% risk level) - A/B - C/D - E/F - G/H - I/J - K/L - A/C/E/G/I/K - B/D/F/H/J/LOverlap formulae used. ** very small base (under 30) ineligible for sig testing
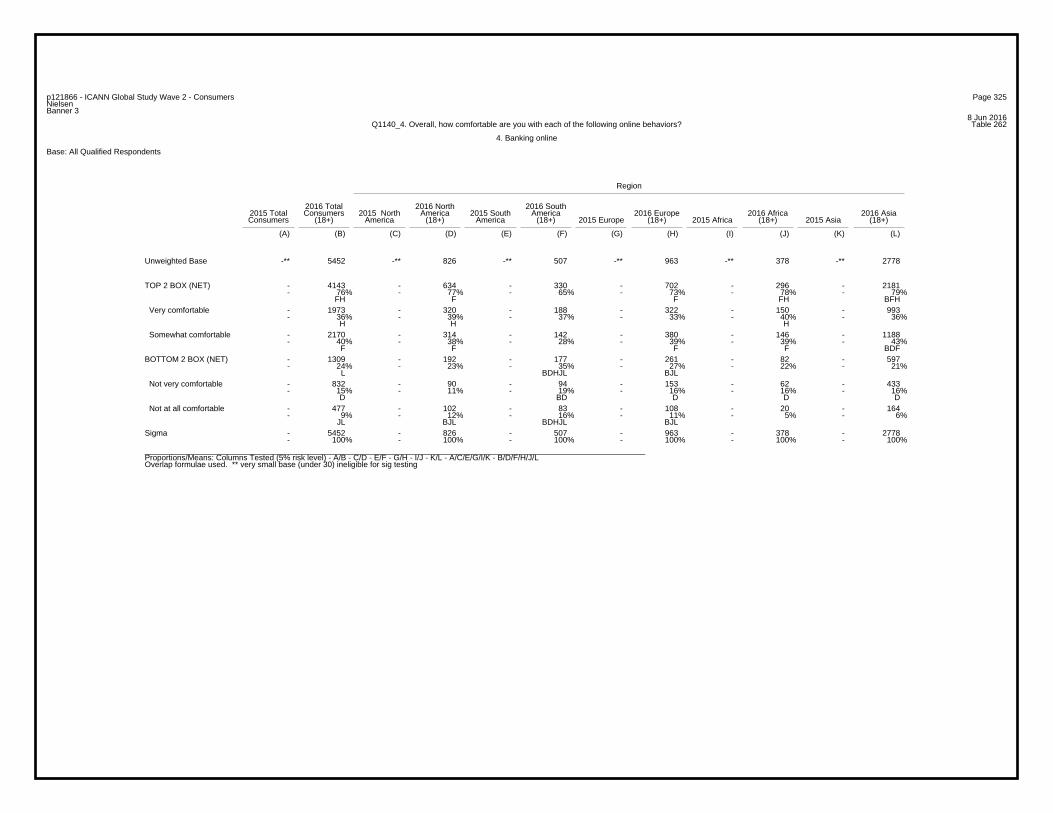
Page 325p121866 - ICANN Global Study Wave 2 - ConsumersNielsenBanner 3
8 Jun 2016Table 262Q1140_4. Overall, how comfortable are you with each of the following online behaviors?
4. Banking online
Base: All Qualified Respondents
Region
2016 Total 2016 North 2016 South2015 Total Consumers 2015 North America 2015 South America 2016 Europe 2016 Africa 2016 AsiaConsumers (18+) America (18+) America (18+) 2015 Europe (18+) 2015 Africa (18+) 2015 Asia (18+)
(A) (B) (C) (D) (E) (F) (G) (H) (I) (J) (K) (L)
-** 5452 -** 826 -** 507 -** 963 -** 378 -** 2778Unweighted Base
- 4143 - 634 - 330 - 702 - 296 - 2181- 76% - 77% - 65% - 73% - 78% - 79%
FH F F FH BFH
TOP 2 BOX (NET)
- 1973 - 320 - 188 - 322 - 150 - 993- 36% - 39% - 37% - 33% - 40% - 36%
H H H
Very comfortable
- 2170 - 314 - 142 - 380 - 146 - 1188- 40% - 38% - 28% - 39% - 39% - 43%
F F F F BDF
Somewhat comfortable
- 1309 - 192 - 177 - 261 - 82 - 597- 24% - 23% - 35% - 27% - 22% - 21%
L BDHJL BJL
BOTTOM 2 BOX (NET)
- 832 - 90 - 94 - 153 - 62 - 433- 15% - 11% - 19% - 16% - 16% - 16%
D BD D D D
Not very comfortable
- 477 - 102 - 83 - 108 - 20 - 164- 9% - 12% - 16% - 11% - 5% - 6%
JL BJL BDHJL BJL
Not at all comfortable
- 5452 - 826 - 507 - 963 - 378 - 2778- 100% - 100% - 100% - 100% - 100% - 100%
Sigma
_________________________________________________________________________________________________________________Proportions/Means: Columns Tested (5% risk level) - A/B - C/D - E/F - G/H - I/J - K/L - A/C/E/G/I/K - B/D/F/H/J/LOverlap formulae used. ** very small base (under 30) ineligible for sig testing

Page 326p121866 - ICANN Global Study Wave 2 - ConsumersNielsenBanner 3
8 Jun 2016Table 263Q1140_5. Overall, how comfortable are you with each of the following online behaviors?
5. Accessing medical information online
Base: All Qualified Respondents
Region
2016 Total 2016 North 2016 South2015 Total Consumers 2015 North America 2015 South America 2016 Europe 2016 Africa 2016 AsiaConsumers (18+) America (18+) America (18+) 2015 Europe (18+) 2015 Africa (18+) 2015 Asia (18+)
(A) (B) (C) (D) (E) (F) (G) (H) (I) (J) (K) (L)
-** 5452 -** 826 -** 507 -** 963 -** 378 -** 2778Unweighted Base
- 4105 - 593 - 350 - 655 - 307 - 2200- 75% - 72% - 69% - 68% - 81% - 79%
DFH BDFH BDFH
TOP 2 BOX (NET)
- 1518 - 237 - 176 - 222 - 141 - 742- 28% - 29% - 35% - 23% - 37% - 27%
H H BDHL BDHL H
Very comfortable
- 2587 - 356 - 174 - 433 - 166 - 1458- 47% - 43% - 34% - 45% - 44% - 52%
DF F F F BDFHJ
Somewhat comfortable
- 1347 - 233 - 157 - 308 - 71 - 578- 25% - 28% - 31% - 32% - 19% - 21%
JL BJL BJL BJL
BOTTOM 2 BOX (NET)
- 1012 - 162 - 105 - 218 - 54 - 473- 19% - 20% - 21% - 23% - 14% - 17%
JL J JL BJL
Not very comfortable
- 335 - 71 - 52 - 90 - 17 - 105- 6% - 9% - 10% - 9% - 4% - 4%
L BJL BJL BJL
Not at all comfortable
- 5452 - 826 - 507 - 963 - 378 - 2778- 100% - 100% - 100% - 100% - 100% - 100%
Sigma
_________________________________________________________________________________________________________________Proportions/Means: Columns Tested (5% risk level) - A/B - C/D - E/F - G/H - I/J - K/L - A/C/E/G/I/K - B/D/F/H/J/LOverlap formulae used. ** very small base (under 30) ineligible for sig testing

Page 327p121866 - ICANN Global Study Wave 2 - ConsumersNielsenBanner 3
8 Jun 2016Table 264Q1145_1. Please think about two/three websites. One has a .com domain extension/, one has a ... and one has one of the new gTLDs like .club or .bank.
How comfortable would you be doing each of these activities on each website?
1. Inputting your email address
SUMMARY TABLE OF TOP BOX
Base: All Qualified Respondents
Region
2016 Total 2016 North 2016 South2015 Total Consumers 2015 North America 2015 South America 2016 Europe 2016 Africa 2016 AsiaConsumers (18+) America (18+) America (18+) 2015 Europe (18+) 2015 Africa (18+) 2015 Asia (18+)
(A) (B) (C) (D) (E) (F) (G) (H) (I) (J) (K) (L)
-** 5452 -** 826 -** 507 -** 963 -** 378 -** 2778Unweighted Base
- 2907 - 452 - 335 - 357 - 261 - 1502- 53% - 55% - 66% - 37% - 69% - 54%
H H BDHL BDHL H
.com
- 2546 - 200 - 317 - 455 - 193 - 1381- 51% - 55% - 63% - 47% - 51% - 50%
HL H BDHJL
gTLDs
- 673 - 68 - 58 - 90 - 56 - 401- 12% - 8% - 11% - 9% - 15% - 14%
DH DH BDH
.club or .bank
_________________________________________________________________________________________________________________Proportions/Means: Columns Tested (5% risk level) - A/B - C/D - E/F - G/H - I/J - K/L - A/C/E/G/I/K - B/D/F/H/J/LOverlap formulae used. ** very small base (under 30) ineligible for sig testing

Page 328p121866 - ICANN Global Study Wave 2 - ConsumersNielsenBanner 3
8 Jun 2016Table 265Q1145_1. Please think about two/three websites. One has a .com domain extension/, one has a ... and one has one of the new gTLDs like .club or .bank.
How comfortable would you be doing each of these activities on each website?
1. Inputting your email address
SUMMARY TABLE OF TOP 2 BOX
Base: All Qualified Respondents
Region
2016 Total 2016 North 2016 South2015 Total Consumers 2015 North America 2015 South America 2016 Europe 2016 Africa 2016 AsiaConsumers (18+) America (18+) America (18+) 2015 Europe (18+) 2015 Africa (18+) 2015 Asia (18+)
(A) (B) (C) (D) (E) (F) (G) (H) (I) (J) (K) (L)
-** 5452 -** 826 -** 507 -** 963 -** 378 -** 2778Unweighted Base
- 4635 - 338 - 466 - 886 - 343 - 2602- 93% - 93% - 92% - 92% - 91% - 94%
BJ
gTLDs
- 5021 - 759 - 461 - 841 - 353 - 2607- 92% - 92% - 91% - 87% - 93% - 94%
H H H H BDFH
.com
- 2625 - 343 - 236 - 353 - 190 - 1503- 48% - 42% - 47% - 37% - 50% - 54%
DH H H DH BDFH
.club or .bank
_________________________________________________________________________________________________________________Proportions/Means: Columns Tested (5% risk level) - A/B - C/D - E/F - G/H - I/J - K/L - A/C/E/G/I/K - B/D/F/H/J/LOverlap formulae used. ** very small base (under 30) ineligible for sig testing

Page 329p121866 - ICANN Global Study Wave 2 - ConsumersNielsenBanner 3
8 Jun 2016Table 266Q1145_1_1. Please think about two/three websites. One has a .com domain extension/, one has a ... and one has one of the new gTLDs like .club or .bank.
How comfortable would you be doing each of these activities on each website?
1. Inputting your email address
1. .com
Base: All Qualified Respondents
Region
2016 Total 2016 North 2016 South2015 Total Consumers 2015 North America 2015 South America 2016 Europe 2016 Africa 2016 AsiaConsumers (18+) America (18+) America (18+) 2015 Europe (18+) 2015 Africa (18+) 2015 Asia (18+)
(A) (B) (C) (D) (E) (F) (G) (H) (I) (J) (K) (L)
-** 5452 -** 826 -** 507 -** 963 -** 378 -** 2778Unweighted Base
- 5021 - 759 - 461 - 841 - 353 - 2607- 92% - 92% - 91% - 87% - 93% - 94%
H H H H BDFH
TOP 2 BOX (NET)
- 2907 - 452 - 335 - 357 - 261 - 1502- 53% - 55% - 66% - 37% - 69% - 54%
H H BDHL BDHL H
Very comfortable
- 2114 - 307 - 126 - 484 - 92 - 1105- 39% - 37% - 25% - 50% - 24% - 40%
FJ FJ BDFJL FJ
Somewhat comfortable
- 431 - 67 - 46 - 122 - 25 - 171- 8% - 8% - 9% - 13% - 7% - 6%
L L L BDFJL
BOTTOM 2 BOX (NET)
- 301 - 41 - 22 - 91 - 12 - 135- 6% - 5% - 4% - 9% - 3% - 5%
JL BDFJL
Not very comfortable
- 130 - 26 - 24 - 31 - 13 - 36- 2% - 3% - 5% - 3% - 3% - 1%
L L BL L L
Not at all comfortable
- 5452 - 826 - 507 - 963 - 378 - 2778- 100% - 100% - 100% - 100% - 100% - 100%
Sigma
_________________________________________________________________________________________________________________Proportions/Means: Columns Tested (5% risk level) - A/B - C/D - E/F - G/H - I/J - K/L - A/C/E/G/I/K - B/D/F/H/J/LOverlap formulae used. ** very small base (under 30) ineligible for sig testing
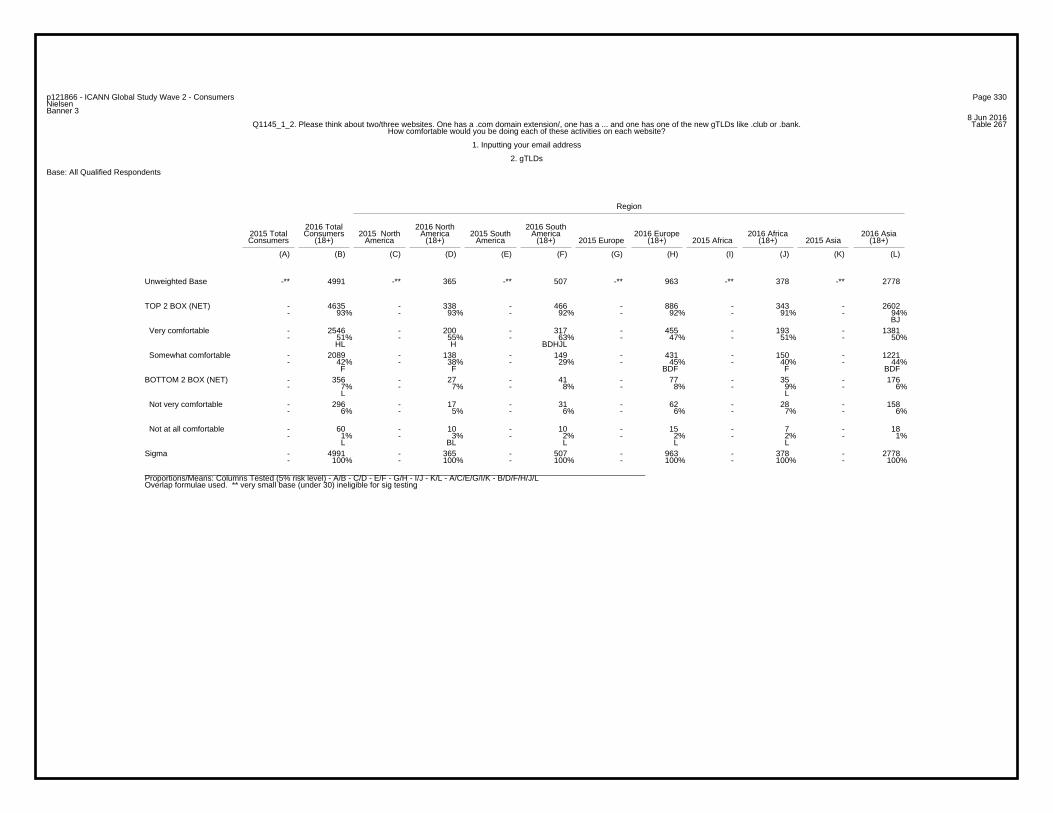
Page 330p121866 - ICANN Global Study Wave 2 - ConsumersNielsenBanner 3
8 Jun 2016Table 267Q1145_1_2. Please think about two/three websites. One has a .com domain extension/, one has a ... and one has one of the new gTLDs like .club or .bank.
How comfortable would you be doing each of these activities on each website?
1. Inputting your email address
2. gTLDs
Base: All Qualified Respondents
Region
2016 Total 2016 North 2016 South2015 Total Consumers 2015 North America 2015 South America 2016 Europe 2016 Africa 2016 AsiaConsumers (18+) America (18+) America (18+) 2015 Europe (18+) 2015 Africa (18+) 2015 Asia (18+)
(A) (B) (C) (D) (E) (F) (G) (H) (I) (J) (K) (L)
-** 4991 -** 365 -** 507 -** 963 -** 378 -** 2778Unweighted Base
- 4635 - 338 - 466 - 886 - 343 - 2602- 93% - 93% - 92% - 92% - 91% - 94%
BJ
TOP 2 BOX (NET)
- 2546 - 200 - 317 - 455 - 193 - 1381- 51% - 55% - 63% - 47% - 51% - 50%
HL H BDHJL
Very comfortable
- 2089 - 138 - 149 - 431 - 150 - 1221- 42% - 38% - 29% - 45% - 40% - 44%
F F BDF F BDF
Somewhat comfortable
- 356 - 27 - 41 - 77 - 35 - 176- 7% - 7% - 8% - 8% - 9% - 6%
L L
BOTTOM 2 BOX (NET)
- 296 - 17 - 31 - 62 - 28 - 158- 6% - 5% - 6% - 6% - 7% - 6%
Not very comfortable
- 60 - 10 - 10 - 15 - 7 - 18- 1% - 3% - 2% - 2% - 2% - 1%
L BL L L L
Not at all comfortable
- 4991 - 365 - 507 - 963 - 378 - 2778- 100% - 100% - 100% - 100% - 100% - 100%
Sigma
_________________________________________________________________________________________________________________Proportions/Means: Columns Tested (5% risk level) - A/B - C/D - E/F - G/H - I/J - K/L - A/C/E/G/I/K - B/D/F/H/J/LOverlap formulae used. ** very small base (under 30) ineligible for sig testing

Page 331p121866 - ICANN Global Study Wave 2 - ConsumersNielsenBanner 3
8 Jun 2016Table 268Q1145_1_3. Please think about two/three websites. One has a .com domain extension/, one has a ... and one has one of the new gTLDs like .club or .bank.
How comfortable would you be doing each of these activities on each website?
1. Inputting your email address
3. .club or .bank
Base: All Qualified Respondents
Region
2016 Total 2016 North 2016 South2015 Total Consumers 2015 North America 2015 South America 2016 Europe 2016 Africa 2016 AsiaConsumers (18+) America (18+) America (18+) 2015 Europe (18+) 2015 Africa (18+) 2015 Asia (18+)
(A) (B) (C) (D) (E) (F) (G) (H) (I) (J) (K) (L)
-** 5452 -** 826 -** 507 -** 963 -** 378 -** 2778Unweighted Base
- 2625 - 343 - 236 - 353 - 190 - 1503- 48% - 42% - 47% - 37% - 50% - 54%
DH H H DH BDFH
TOP 2 BOX (NET)
- 673 - 68 - 58 - 90 - 56 - 401- 12% - 8% - 11% - 9% - 15% - 14%
DH DH BDH
Very comfortable
- 1952 - 275 - 178 - 263 - 134 - 1102- 36% - 33% - 35% - 27% - 35% - 40%
H H H H BDH
Somewhat comfortable
- 2827 - 483 - 271 - 610 - 188 - 1275- 52% - 58% - 53% - 63% - 50% - 46%
L BJL L BDFJL
BOTTOM 2 BOX (NET)
- 2056 - 328 - 164 - 396 - 127 - 1041- 38% - 40% - 32% - 41% - 34% - 37%
F FJ BFJL F
Not very comfortable
- 771 - 155 - 107 - 214 - 61 - 234- 14% - 19% - 21% - 22% - 16% - 8%
L BL BL BJL L
Not at all comfortable
- 5452 - 826 - 507 - 963 - 378 - 2778- 100% - 100% - 100% - 100% - 100% - 100%
Sigma
_________________________________________________________________________________________________________________Proportions/Means: Columns Tested (5% risk level) - A/B - C/D - E/F - G/H - I/J - K/L - A/C/E/G/I/K - B/D/F/H/J/LOverlap formulae used. ** very small base (under 30) ineligible for sig testing

Page 332p121866 - ICANN Global Study Wave 2 - ConsumersNielsenBanner 3
8 Jun 2016Table 269Q1145_2. Please think about two/three websites. One has a .com domain extension/, one has a ... and one has one of the new gTLDs like .club or .bank.
How comfortable would you be doing each of these activities on each website?
2. Inputting your home address
SUMMARY TABLE OF TOP BOX
Base: All Qualified Respondents
Region
2016 Total 2016 North 2016 South2015 Total Consumers 2015 North America 2015 South America 2016 Europe 2016 Africa 2016 AsiaConsumers (18+) America (18+) America (18+) 2015 Europe (18+) 2015 Africa (18+) 2015 Asia (18+)
(A) (B) (C) (D) (E) (F) (G) (H) (I) (J) (K) (L)
-** 5452 -** 826 -** 507 -** 963 -** 378 -** 2778Unweighted Base
- 2343 - 363 - 281 - 273 - 206 - 1220- 43% - 44% - 55% - 28% - 54% - 44%
H H BDHL BDHL H
.com
- 2070 - 170 - 255 - 351 - 158 - 1136- 41% - 47% - 50% - 36% - 42% - 41%
H BHL BHJL H
gTLDs
- 607 - 72 - 52 - 66 - 50 - 367- 11% - 9% - 10% - 7% - 13% - 13%
DH H DH BDH
.club or .bank
_________________________________________________________________________________________________________________Proportions/Means: Columns Tested (5% risk level) - A/B - C/D - E/F - G/H - I/J - K/L - A/C/E/G/I/K - B/D/F/H/J/LOverlap formulae used. ** very small base (under 30) ineligible for sig testing
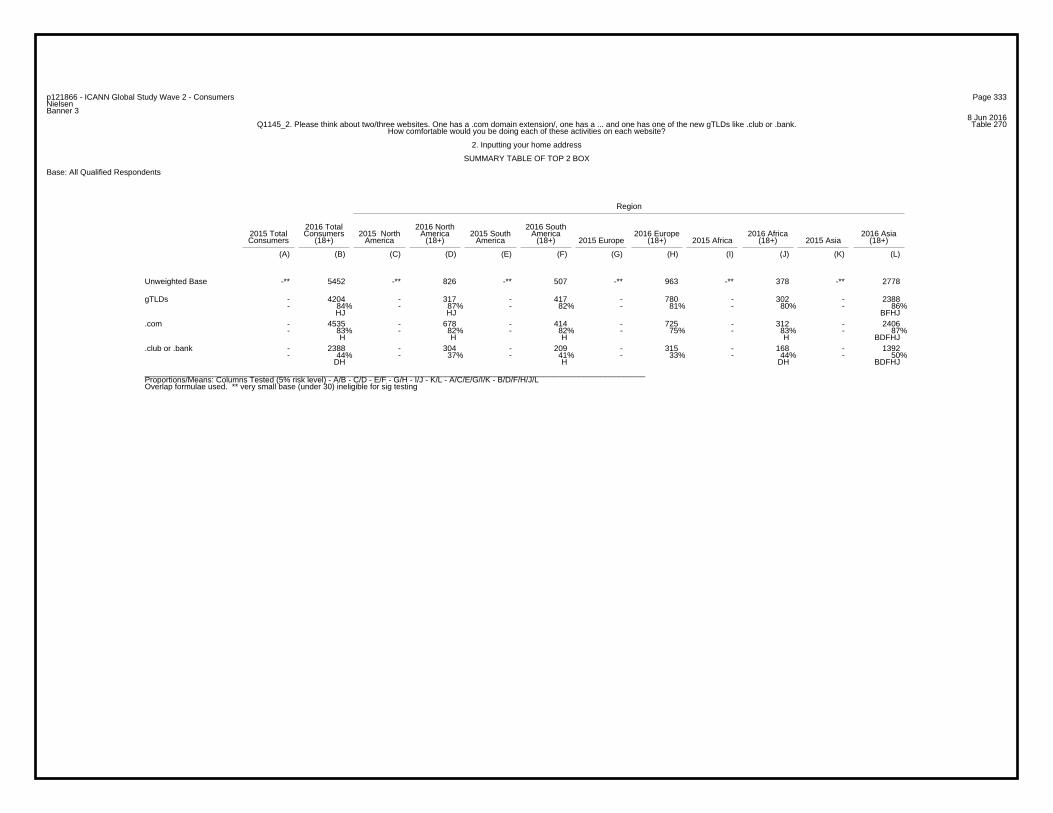
Page 333p121866 - ICANN Global Study Wave 2 - ConsumersNielsenBanner 3
8 Jun 2016Table 270Q1145_2. Please think about two/three websites. One has a .com domain extension/, one has a ... and one has one of the new gTLDs like .club or .bank.
How comfortable would you be doing each of these activities on each website?
2. Inputting your home address
SUMMARY TABLE OF TOP 2 BOX
Base: All Qualified Respondents
Region
2016 Total 2016 North 2016 South2015 Total Consumers 2015 North America 2015 South America 2016 Europe 2016 Africa 2016 AsiaConsumers (18+) America (18+) America (18+) 2015 Europe (18+) 2015 Africa (18+) 2015 Asia (18+)
(A) (B) (C) (D) (E) (F) (G) (H) (I) (J) (K) (L)
-** 5452 -** 826 -** 507 -** 963 -** 378 -** 2778Unweighted Base
- 4204 - 317 - 417 - 780 - 302 - 2388- 84% - 87% - 82% - 81% - 80% - 86%
HJ HJ BFHJ
gTLDs
- 4535 - 678 - 414 - 725 - 312 - 2406- 83% - 82% - 82% - 75% - 83% - 87%
H H H H BDFHJ
.com
- 2388 - 304 - 209 - 315 - 168 - 1392- 44% - 37% - 41% - 33% - 44% - 50%
DH H DH BDFHJ
.club or .bank
_________________________________________________________________________________________________________________Proportions/Means: Columns Tested (5% risk level) - A/B - C/D - E/F - G/H - I/J - K/L - A/C/E/G/I/K - B/D/F/H/J/LOverlap formulae used. ** very small base (under 30) ineligible for sig testing

Page 334p121866 - ICANN Global Study Wave 2 - ConsumersNielsenBanner 3
8 Jun 2016Table 271Q1145_2_1. Please think about two/three websites. One has a .com domain extension/, one has a ... and one has one of the new gTLDs like .club or .bank.
How comfortable would you be doing each of these activities on each website?
2. Inputting your home address
1. .com
Base: All Qualified Respondents
Region
2016 Total 2016 North 2016 South2015 Total Consumers 2015 North America 2015 South America 2016 Europe 2016 Africa 2016 AsiaConsumers (18+) America (18+) America (18+) 2015 Europe (18+) 2015 Africa (18+) 2015 Asia (18+)
(A) (B) (C) (D) (E) (F) (G) (H) (I) (J) (K) (L)
-** 5452 -** 826 -** 507 -** 963 -** 378 -** 2778Unweighted Base
- 4535 - 678 - 414 - 725 - 312 - 2406- 83% - 82% - 82% - 75% - 83% - 87%
H H H H BDFHJ
TOP 2 BOX (NET)
- 2343 - 363 - 281 - 273 - 206 - 1220- 43% - 44% - 55% - 28% - 54% - 44%
H H BDHL BDHL H
Very comfortable
- 2192 - 315 - 133 - 452 - 106 - 1186- 40% - 38% - 26% - 47% - 28% - 43%
FJ FJ BDFJL BDFJ
Somewhat comfortable
- 917 - 148 - 93 - 238 - 66 - 372- 17% - 18% - 18% - 25% - 17% - 13%
L L L BDFJL L
BOTTOM 2 BOX (NET)
- 626 - 91 - 58 - 160 - 36 - 281- 11% - 11% - 11% - 17% - 10% - 10%
L BDFJL
Not very comfortable
- 291 - 57 - 35 - 78 - 30 - 91- 5% - 7% - 7% - 8% - 8% - 3%
L BL L BL BL
Not at all comfortable
- 5452 - 826 - 507 - 963 - 378 - 2778- 100% - 100% - 100% - 100% - 100% - 100%
Sigma
_________________________________________________________________________________________________________________Proportions/Means: Columns Tested (5% risk level) - A/B - C/D - E/F - G/H - I/J - K/L - A/C/E/G/I/K - B/D/F/H/J/LOverlap formulae used. ** very small base (under 30) ineligible for sig testing

Page 335p121866 - ICANN Global Study Wave 2 - ConsumersNielsenBanner 3
8 Jun 2016Table 272Q1145_2_2. Please think about two/three websites. One has a .com domain extension/, one has a ... and one has one of the new gTLDs like .club or .bank.
How comfortable would you be doing each of these activities on each website?
2. Inputting your home address
2. gTLDs
Base: All Qualified Respondents
Region
2016 Total 2016 North 2016 South2015 Total Consumers 2015 North America 2015 South America 2016 Europe 2016 Africa 2016 AsiaConsumers (18+) America (18+) America (18+) 2015 Europe (18+) 2015 Africa (18+) 2015 Asia (18+)
(A) (B) (C) (D) (E) (F) (G) (H) (I) (J) (K) (L)
-** 4991 -** 365 -** 507 -** 963 -** 378 -** 2778Unweighted Base
- 4204 - 317 - 417 - 780 - 302 - 2388- 84% - 87% - 82% - 81% - 80% - 86%
HJ HJ BFHJ
TOP 2 BOX (NET)
- 2070 - 170 - 255 - 351 - 158 - 1136- 41% - 47% - 50% - 36% - 42% - 41%
H BHL BHJL H
Very comfortable
- 2134 - 147 - 162 - 429 - 144 - 1252- 43% - 40% - 32% - 45% - 38% - 45%
F F FJ BFJ
Somewhat comfortable
- 787 - 48 - 90 - 183 - 76 - 390- 16% - 13% - 18% - 19% - 20% - 14%
L L BDL BDL
BOTTOM 2 BOX (NET)
- 588 - 34 - 62 - 130 - 53 - 309- 12% - 9% - 12% - 13% - 14% - 11%
DL D
Not very comfortable
- 199 - 14 - 28 - 53 - 23 - 81- 4% - 4% - 6% - 6% - 6% - 3%
L L BL BL
Not at all comfortable
- 4991 - 365 - 507 - 963 - 378 - 2778- 100% - 100% - 100% - 100% - 100% - 100%
Sigma
_________________________________________________________________________________________________________________Proportions/Means: Columns Tested (5% risk level) - A/B - C/D - E/F - G/H - I/J - K/L - A/C/E/G/I/K - B/D/F/H/J/LOverlap formulae used. ** very small base (under 30) ineligible for sig testing
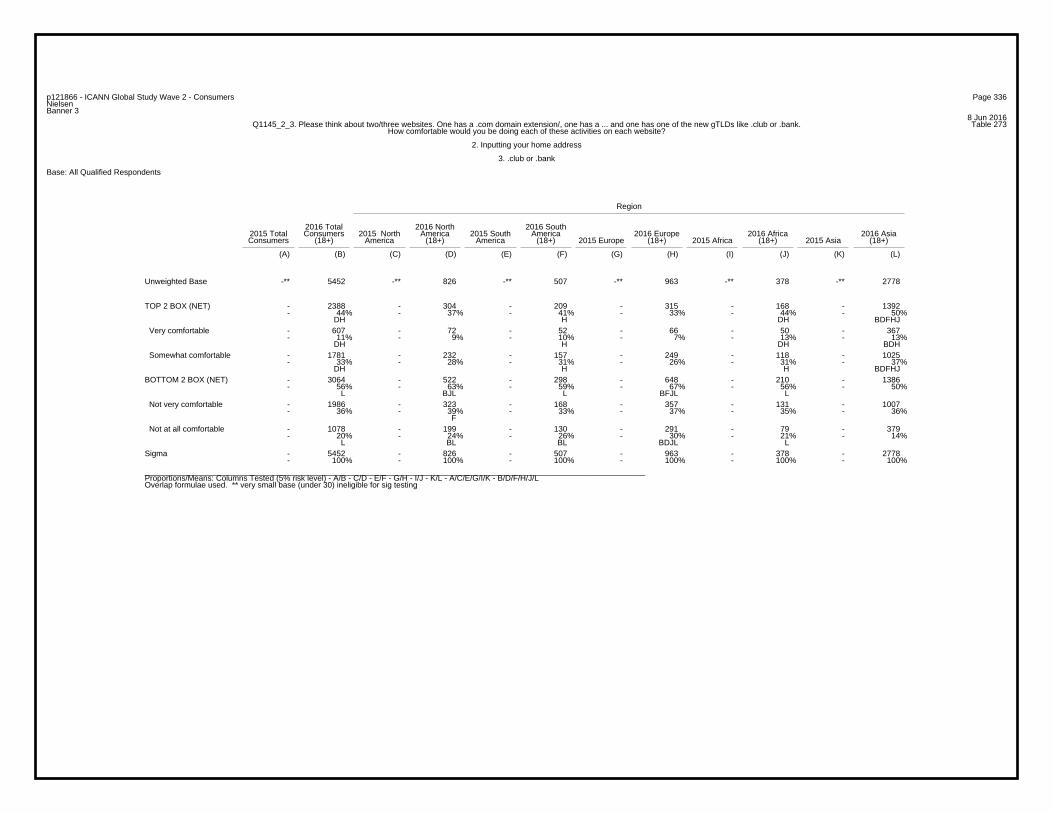
Page 336p121866 - ICANN Global Study Wave 2 - ConsumersNielsenBanner 3
8 Jun 2016Table 273Q1145_2_3. Please think about two/three websites. One has a .com domain extension/, one has a ... and one has one of the new gTLDs like .club or .bank.
How comfortable would you be doing each of these activities on each website?
2. Inputting your home address
3. .club or .bank
Base: All Qualified Respondents
Region
2016 Total 2016 North 2016 South2015 Total Consumers 2015 North America 2015 South America 2016 Europe 2016 Africa 2016 AsiaConsumers (18+) America (18+) America (18+) 2015 Europe (18+) 2015 Africa (18+) 2015 Asia (18+)
(A) (B) (C) (D) (E) (F) (G) (H) (I) (J) (K) (L)
-** 5452 -** 826 -** 507 -** 963 -** 378 -** 2778Unweighted Base
- 2388 - 304 - 209 - 315 - 168 - 1392- 44% - 37% - 41% - 33% - 44% - 50%
DH H DH BDFHJ
TOP 2 BOX (NET)
- 607 - 72 - 52 - 66 - 50 - 367- 11% - 9% - 10% - 7% - 13% - 13%
DH H DH BDH
Very comfortable
- 1781 - 232 - 157 - 249 - 118 - 1025- 33% - 28% - 31% - 26% - 31% - 37%
DH H H BDFHJ
Somewhat comfortable
- 3064 - 522 - 298 - 648 - 210 - 1386- 56% - 63% - 59% - 67% - 56% - 50%
L BJL L BFJL L
BOTTOM 2 BOX (NET)
- 1986 - 323 - 168 - 357 - 131 - 1007- 36% - 39% - 33% - 37% - 35% - 36%
F
Not very comfortable
- 1078 - 199 - 130 - 291 - 79 - 379- 20% - 24% - 26% - 30% - 21% - 14%
L BL BL BDJL L
Not at all comfortable
- 5452 - 826 - 507 - 963 - 378 - 2778- 100% - 100% - 100% - 100% - 100% - 100%
Sigma
_________________________________________________________________________________________________________________Proportions/Means: Columns Tested (5% risk level) - A/B - C/D - E/F - G/H - I/J - K/L - A/C/E/G/I/K - B/D/F/H/J/LOverlap formulae used. ** very small base (under 30) ineligible for sig testing

Page 337p121866 - ICANN Global Study Wave 2 - ConsumersNielsenBanner 3
8 Jun 2016Table 274Q1145_3. Please think about two/three websites. One has a .com domain extension/, one has a ... and one has one of the new gTLDs like .club or .bank.
How comfortable would you be doing each of these activities on each website?
3. Inputting your telephone number
SUMMARY TABLE OF TOP BOX
Base: All Qualified Respondents
Region
2016 Total 2016 North 2016 South2015 Total Consumers 2015 North America 2015 South America 2016 Europe 2016 Africa 2016 AsiaConsumers (18+) America (18+) America (18+) 2015 Europe (18+) 2015 Africa (18+) 2015 Asia (18+)
(A) (B) (C) (D) (E) (F) (G) (H) (I) (J) (K) (L)
-** 5452 -** 826 -** 507 -** 963 -** 378 -** 2778Unweighted Base
- 1966 - 283 - 244 - 196 - 189 - 1054- 36% - 34% - 48% - 20% - 50% - 38%
H H BDHL BDHL BH
.com
- 1716 - 140 - 205 - 251 - 146 - 974- 34% - 38% - 40% - 26% - 39% - 35%
H H BHL H H
gTLDs
- 617 - 68 - 63 - 61 - 65 - 360- 11% - 8% - 12% - 6% - 17% - 13%
DH DH BDFHL BDH
.club or .bank
_________________________________________________________________________________________________________________Proportions/Means: Columns Tested (5% risk level) - A/B - C/D - E/F - G/H - I/J - K/L - A/C/E/G/I/K - B/D/F/H/J/LOverlap formulae used. ** very small base (under 30) ineligible for sig testing

Page 338p121866 - ICANN Global Study Wave 2 - ConsumersNielsenBanner 3
8 Jun 2016Table 275Q1145_3. Please think about two/three websites. One has a .com domain extension/, one has a ... and one has one of the new gTLDs like .club or .bank.
How comfortable would you be doing each of these activities on each website?
3. Inputting your telephone number
SUMMARY TABLE OF TOP 2 BOX
Base: All Qualified Respondents
Region
2016 Total 2016 North 2016 South2015 Total Consumers 2015 North America 2015 South America 2016 Europe 2016 Africa 2016 AsiaConsumers (18+) America (18+) America (18+) 2015 Europe (18+) 2015 Africa (18+) 2015 Asia (18+)
(A) (B) (C) (D) (E) (F) (G) (H) (I) (J) (K) (L)
-** 5452 -** 826 -** 507 -** 963 -** 378 -** 2778Unweighted Base
- 3765 - 267 - 368 - 639 - 291 - 2200- 75% - 73% - 73% - 66% - 77% - 79%
H H H H BDFH
gTLDs
- 4100 - 587 - 369 - 599 - 305 - 2240- 75% - 71% - 73% - 62% - 81% - 81%
DH H H BDFH BDFH
.com
- 2201 - 269 - 189 - 269 - 171 - 1303- 40% - 33% - 37% - 28% - 45% - 47%
DH H H BDFH BDFH
.club or .bank
_________________________________________________________________________________________________________________Proportions/Means: Columns Tested (5% risk level) - A/B - C/D - E/F - G/H - I/J - K/L - A/C/E/G/I/K - B/D/F/H/J/LOverlap formulae used. ** very small base (under 30) ineligible for sig testing
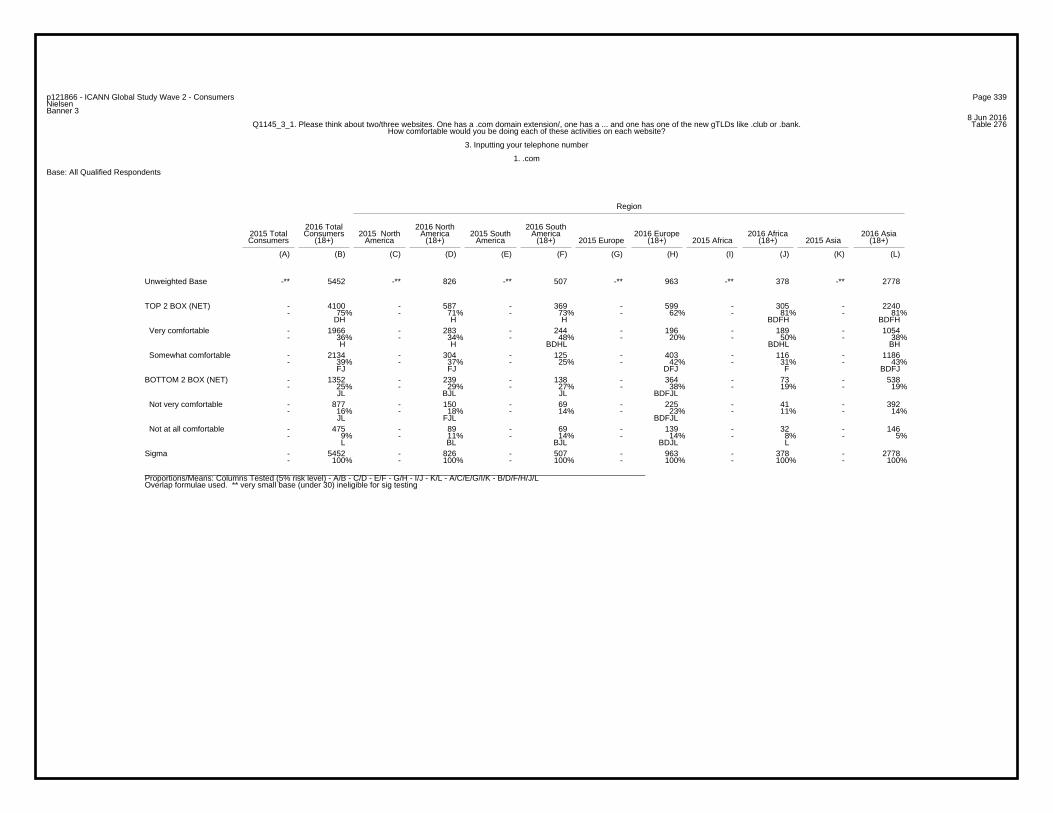
Page 339p121866 - ICANN Global Study Wave 2 - ConsumersNielsenBanner 3
8 Jun 2016Table 276Q1145_3_1. Please think about two/three websites. One has a .com domain extension/, one has a ... and one has one of the new gTLDs like .club or .bank.
How comfortable would you be doing each of these activities on each website?
3. Inputting your telephone number
1. .com
Base: All Qualified Respondents
Region
2016 Total 2016 North 2016 South2015 Total Consumers 2015 North America 2015 South America 2016 Europe 2016 Africa 2016 AsiaConsumers (18+) America (18+) America (18+) 2015 Europe (18+) 2015 Africa (18+) 2015 Asia (18+)
(A) (B) (C) (D) (E) (F) (G) (H) (I) (J) (K) (L)
-** 5452 -** 826 -** 507 -** 963 -** 378 -** 2778Unweighted Base
- 4100 - 587 - 369 - 599 - 305 - 2240- 75% - 71% - 73% - 62% - 81% - 81%
DH H H BDFH BDFH
TOP 2 BOX (NET)
- 1966 - 283 - 244 - 196 - 189 - 1054- 36% - 34% - 48% - 20% - 50% - 38%
H H BDHL BDHL BH
Very comfortable
- 2134 - 304 - 125 - 403 - 116 - 1186- 39% - 37% - 25% - 42% - 31% - 43%
FJ FJ DFJ F BDFJ
Somewhat comfortable
- 1352 - 239 - 138 - 364 - 73 - 538- 25% - 29% - 27% - 38% - 19% - 19%
JL BJL JL BDFJL
BOTTOM 2 BOX (NET)
- 877 - 150 - 69 - 225 - 41 - 392- 16% - 18% - 14% - 23% - 11% - 14%
JL FJL BDFJL
Not very comfortable
- 475 - 89 - 69 - 139 - 32 - 146- 9% - 11% - 14% - 14% - 8% - 5%
L BL BJL BDJL L
Not at all comfortable
- 5452 - 826 - 507 - 963 - 378 - 2778- 100% - 100% - 100% - 100% - 100% - 100%
Sigma
_________________________________________________________________________________________________________________Proportions/Means: Columns Tested (5% risk level) - A/B - C/D - E/F - G/H - I/J - K/L - A/C/E/G/I/K - B/D/F/H/J/LOverlap formulae used. ** very small base (under 30) ineligible for sig testing

Page 340p121866 - ICANN Global Study Wave 2 - ConsumersNielsenBanner 3
8 Jun 2016Table 277Q1145_3_2. Please think about two/three websites. One has a .com domain extension/, one has a ... and one has one of the new gTLDs like .club or .bank.
How comfortable would you be doing each of these activities on each website?
3. Inputting your telephone number
2. gTLDs
Base: All Qualified Respondents
Region
2016 Total 2016 North 2016 South2015 Total Consumers 2015 North America 2015 South America 2016 Europe 2016 Africa 2016 AsiaConsumers (18+) America (18+) America (18+) 2015 Europe (18+) 2015 Africa (18+) 2015 Asia (18+)
(A) (B) (C) (D) (E) (F) (G) (H) (I) (J) (K) (L)
-** 4991 -** 365 -** 507 -** 963 -** 378 -** 2778Unweighted Base
- 3765 - 267 - 368 - 639 - 291 - 2200- 75% - 73% - 73% - 66% - 77% - 79%
H H H H BDFH
TOP 2 BOX (NET)
- 1716 - 140 - 205 - 251 - 146 - 974- 34% - 38% - 40% - 26% - 39% - 35%
H H BHL H H
Very comfortable
- 2049 - 127 - 163 - 388 - 145 - 1226- 41% - 35% - 32% - 40% - 38% - 44%
DF F BDFHJ
Somewhat comfortable
- 1226 - 98 - 139 - 324 - 87 - 578- 25% - 27% - 27% - 34% - 23% - 21%
L L L BDFJL
BOTTOM 2 BOX (NET)
- 841 - 61 - 81 - 202 - 54 - 443- 17% - 17% - 16% - 21% - 14% - 16%
BFJL
Not very comfortable
- 385 - 37 - 58 - 122 - 33 - 135- 8% - 10% - 11% - 13% - 9% - 5%
L L BL BJL L
Not at all comfortable
- 4991 - 365 - 507 - 963 - 378 - 2778- 100% - 100% - 100% - 100% - 100% - 100%
Sigma
_________________________________________________________________________________________________________________Proportions/Means: Columns Tested (5% risk level) - A/B - C/D - E/F - G/H - I/J - K/L - A/C/E/G/I/K - B/D/F/H/J/LOverlap formulae used. ** very small base (under 30) ineligible for sig testing

Page 341p121866 - ICANN Global Study Wave 2 - ConsumersNielsenBanner 3
8 Jun 2016Table 278Q1145_3_3. Please think about two/three websites. One has a .com domain extension/, one has a ... and one has one of the new gTLDs like .club or .bank.
How comfortable would you be doing each of these activities on each website?
3. Inputting your telephone number
3. .club or .bank
Base: All Qualified Respondents
Region
2016 Total 2016 North 2016 South2015 Total Consumers 2015 North America 2015 South America 2016 Europe 2016 Africa 2016 AsiaConsumers (18+) America (18+) America (18+) 2015 Europe (18+) 2015 Africa (18+) 2015 Asia (18+)
(A) (B) (C) (D) (E) (F) (G) (H) (I) (J) (K) (L)
-** 5452 -** 826 -** 507 -** 963 -** 378 -** 2778Unweighted Base
- 2201 - 269 - 189 - 269 - 171 - 1303- 40% - 33% - 37% - 28% - 45% - 47%
DH H H BDFH BDFH
TOP 2 BOX (NET)
- 617 - 68 - 63 - 61 - 65 - 360- 11% - 8% - 12% - 6% - 17% - 13%
DH DH BDFHL BDH
Very comfortable
- 1584 - 201 - 126 - 208 - 106 - 943- 29% - 24% - 25% - 22% - 28% - 34%
DFH H BDFHJ
Somewhat comfortable
- 3251 - 557 - 318 - 694 - 207 - 1475- 60% - 67% - 63% - 72% - 55% - 53%
JL BJL JL BDFJL
BOTTOM 2 BOX (NET)
- 1963 - 306 - 146 - 353 - 124 - 1034- 36% - 37% - 29% - 37% - 33% - 37%
F F F F
Not very comfortable
- 1288 - 251 - 172 - 341 - 83 - 441- 24% - 30% - 34% - 35% - 22% - 16%
L BJL BJL BDJL L
Not at all comfortable
- 5452 - 826 - 507 - 963 - 378 - 2778- 100% - 100% - 100% - 100% - 100% - 100%
Sigma
_________________________________________________________________________________________________________________Proportions/Means: Columns Tested (5% risk level) - A/B - C/D - E/F - G/H - I/J - K/L - A/C/E/G/I/K - B/D/F/H/J/LOverlap formulae used. ** very small base (under 30) ineligible for sig testing
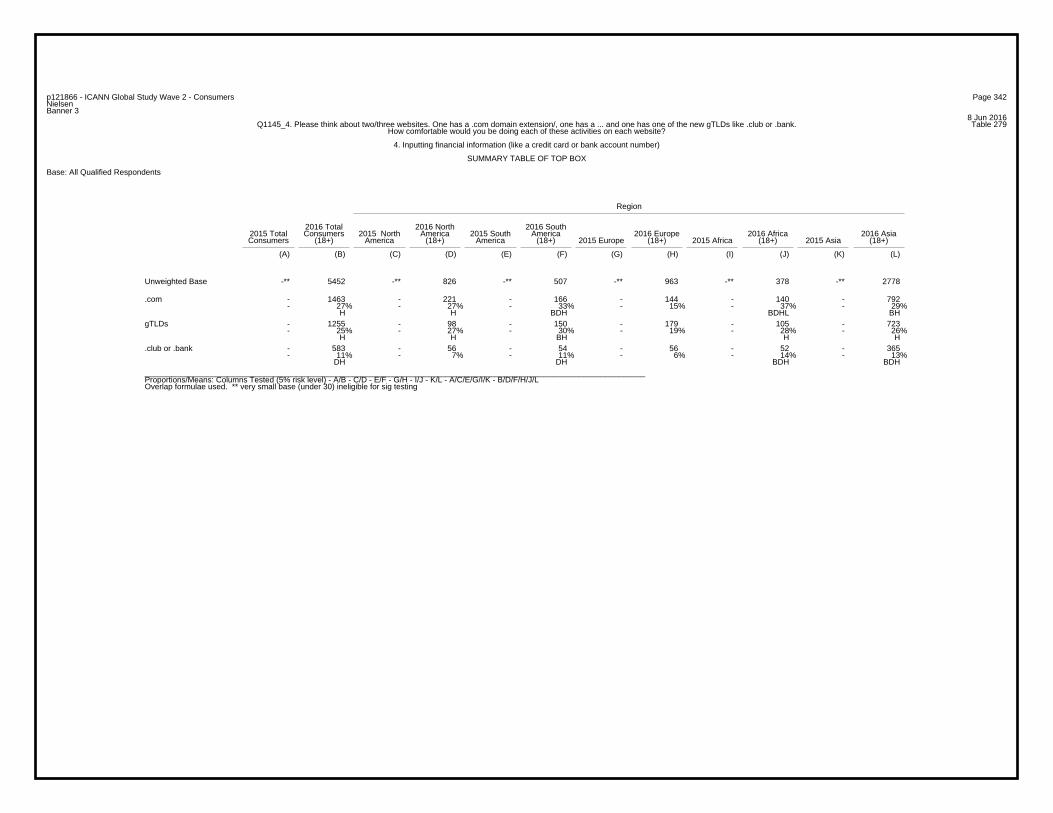
Page 342p121866 - ICANN Global Study Wave 2 - ConsumersNielsenBanner 3
8 Jun 2016Table 279Q1145_4. Please think about two/three websites. One has a .com domain extension/, one has a ... and one has one of the new gTLDs like .club or .bank.
How comfortable would you be doing each of these activities on each website?
4. Inputting financial information (like a credit card or bank account number)
SUMMARY TABLE OF TOP BOX
Base: All Qualified Respondents
Region
2016 Total 2016 North 2016 South2015 Total Consumers 2015 North America 2015 South America 2016 Europe 2016 Africa 2016 AsiaConsumers (18+) America (18+) America (18+) 2015 Europe (18+) 2015 Africa (18+) 2015 Asia (18+)
(A) (B) (C) (D) (E) (F) (G) (H) (I) (J) (K) (L)
-** 5452 -** 826 -** 507 -** 963 -** 378 -** 2778Unweighted Base
- 1463 - 221 - 166 - 144 - 140 - 792- 27% - 27% - 33% - 15% - 37% - 29%
H H BDH BDHL BH
.com
- 1255 - 98 - 150 - 179 - 105 - 723- 25% - 27% - 30% - 19% - 28% - 26%
H H BH H H
gTLDs
- 583 - 56 - 54 - 56 - 52 - 365- 11% - 7% - 11% - 6% - 14% - 13%
DH DH BDH BDH
.club or .bank
_________________________________________________________________________________________________________________Proportions/Means: Columns Tested (5% risk level) - A/B - C/D - E/F - G/H - I/J - K/L - A/C/E/G/I/K - B/D/F/H/J/LOverlap formulae used. ** very small base (under 30) ineligible for sig testing

Page 343p121866 - ICANN Global Study Wave 2 - ConsumersNielsenBanner 3
8 Jun 2016Table 280Q1145_4. Please think about two/three websites. One has a .com domain extension/, one has a ... and one has one of the new gTLDs like .club or .bank.
How comfortable would you be doing each of these activities on each website?
4. Inputting financial information (like a credit card or bank account number)
SUMMARY TABLE OF TOP 2 BOX
Base: All Qualified Respondents
Region
2016 Total 2016 North 2016 South2015 Total Consumers 2015 North America 2015 South America 2016 Europe 2016 Africa 2016 AsiaConsumers (18+) America (18+) America (18+) 2015 Europe (18+) 2015 Africa (18+) 2015 Asia (18+)
(A) (B) (C) (D) (E) (F) (G) (H) (I) (J) (K) (L)
-** 5452 -** 826 -** 507 -** 963 -** 378 -** 2778Unweighted Base
- 3114 - 220 - 288 - 560 - 211 - 1835- 62% - 60% - 57% - 58% - 56% - 66%
FHJ BDFHJ
gTLDs
- 3395 - 509 - 296 - 498 - 236 - 1856- 62% - 62% - 58% - 52% - 62% - 67%
H H H H BDFH
.com
- 1974 - 221 - 162 - 229 - 145 - 1217- 36% - 27% - 32% - 24% - 38% - 44%
DFH DH DFH BDFHJ
.club or .bank
_________________________________________________________________________________________________________________Proportions/Means: Columns Tested (5% risk level) - A/B - C/D - E/F - G/H - I/J - K/L - A/C/E/G/I/K - B/D/F/H/J/LOverlap formulae used. ** very small base (under 30) ineligible for sig testing

Page 344p121866 - ICANN Global Study Wave 2 - ConsumersNielsenBanner 3
8 Jun 2016Table 281Q1145_4_1. Please think about two/three websites. One has a .com domain extension/, one has a ... and one has one of the new gTLDs like .club or .bank.
How comfortable would you be doing each of these activities on each website?
4. Inputting financial information (like a credit card or bank account number)
1. .com
Base: All Qualified Respondents
Region
2016 Total 2016 North 2016 South2015 Total Consumers 2015 North America 2015 South America 2016 Europe 2016 Africa 2016 AsiaConsumers (18+) America (18+) America (18+) 2015 Europe (18+) 2015 Africa (18+) 2015 Asia (18+)
(A) (B) (C) (D) (E) (F) (G) (H) (I) (J) (K) (L)
-** 5452 -** 826 -** 507 -** 963 -** 378 -** 2778Unweighted Base
- 3395 - 509 - 296 - 498 - 236 - 1856- 62% - 62% - 58% - 52% - 62% - 67%
H H H H BDFH
TOP 2 BOX (NET)
- 1463 - 221 - 166 - 144 - 140 - 792- 27% - 27% - 33% - 15% - 37% - 29%
H H BDH BDHL BH
Very comfortable
- 1932 - 288 - 130 - 354 - 96 - 1064- 35% - 35% - 26% - 37% - 25% - 38%
FJ FJ FJ BFJ
Somewhat comfortable
- 2057 - 317 - 211 - 465 - 142 - 922- 38% - 38% - 42% - 48% - 38% - 33%
L L L BDFJL
BOTTOM 2 BOX (NET)
- 1116 - 176 - 92 - 230 - 73 - 545- 20% - 21% - 18% - 24% - 19% - 20%
BFL
Not very comfortable
- 941 - 141 - 119 - 235 - 69 - 377- 17% - 17% - 23% - 24% - 18% - 14%
L L BDL BDJL L
Not at all comfortable
- 5452 - 826 - 507 - 963 - 378 - 2778- 100% - 100% - 100% - 100% - 100% - 100%
Sigma
_________________________________________________________________________________________________________________Proportions/Means: Columns Tested (5% risk level) - A/B - C/D - E/F - G/H - I/J - K/L - A/C/E/G/I/K - B/D/F/H/J/LOverlap formulae used. ** very small base (under 30) ineligible for sig testing

Page 345p121866 - ICANN Global Study Wave 2 - ConsumersNielsenBanner 3
8 Jun 2016Table 282Q1145_4_2. Please think about two/three websites. One has a .com domain extension/, one has a ... and one has one of the new gTLDs like .club or .bank.
How comfortable would you be doing each of these activities on each website?
4. Inputting financial information (like a credit card or bank account number)
2. gTLDs
Base: All Qualified Respondents
Region
2016 Total 2016 North 2016 South2015 Total Consumers 2015 North America 2015 South America 2016 Europe 2016 Africa 2016 AsiaConsumers (18+) America (18+) America (18+) 2015 Europe (18+) 2015 Africa (18+) 2015 Asia (18+)
(A) (B) (C) (D) (E) (F) (G) (H) (I) (J) (K) (L)
-** 4991 -** 365 -** 507 -** 963 -** 378 -** 2778Unweighted Base
- 3114 - 220 - 288 - 560 - 211 - 1835- 62% - 60% - 57% - 58% - 56% - 66%
FHJ BDFHJ
TOP 2 BOX (NET)
- 1255 - 98 - 150 - 179 - 105 - 723- 25% - 27% - 30% - 19% - 28% - 26%
H H BH H H
Very comfortable
- 1859 - 122 - 138 - 381 - 106 - 1112- 37% - 33% - 27% - 40% - 28% - 40%
FJ F DFJ BDFJ
Somewhat comfortable
- 1877 - 145 - 219 - 403 - 167 - 943- 38% - 40% - 43% - 42% - 44% - 34%
L L BL BL BL
BOTTOM 2 BOX (NET)
- 1061 - 76 - 107 - 203 - 91 - 584- 21% - 21% - 21% - 21% - 24% - 21%
Not very comfortable
- 816 - 69 - 112 - 200 - 76 - 359- 16% - 19% - 22% - 21% - 20% - 13%
L L BL BL BL
Not at all comfortable
- 4991 - 365 - 507 - 963 - 378 - 2778- 100% - 100% - 100% - 100% - 100% - 100%
Sigma
_________________________________________________________________________________________________________________Proportions/Means: Columns Tested (5% risk level) - A/B - C/D - E/F - G/H - I/J - K/L - A/C/E/G/I/K - B/D/F/H/J/LOverlap formulae used. ** very small base (under 30) ineligible for sig testing

Page 346p121866 - ICANN Global Study Wave 2 - ConsumersNielsenBanner 3
8 Jun 2016Table 283Q1145_4_3. Please think about two/three websites. One has a .com domain extension/, one has a ... and one has one of the new gTLDs like .club or .bank.
How comfortable would you be doing each of these activities on each website?
4. Inputting financial information (like a credit card or bank account number)
3. .club or .bank
Base: All Qualified Respondents
Region
2016 Total 2016 North 2016 South2015 Total Consumers 2015 North America 2015 South America 2016 Europe 2016 Africa 2016 AsiaConsumers (18+) America (18+) America (18+) 2015 Europe (18+) 2015 Africa (18+) 2015 Asia (18+)
(A) (B) (C) (D) (E) (F) (G) (H) (I) (J) (K) (L)
-** 5452 -** 826 -** 507 -** 963 -** 378 -** 2778Unweighted Base
- 1974 - 221 - 162 - 229 - 145 - 1217- 36% - 27% - 32% - 24% - 38% - 44%
DFH DH DFH BDFHJ
TOP 2 BOX (NET)
- 583 - 56 - 54 - 56 - 52 - 365- 11% - 7% - 11% - 6% - 14% - 13%
DH DH BDH BDH
Very comfortable
- 1391 - 165 - 108 - 173 - 93 - 852- 26% - 20% - 21% - 18% - 25% - 31%
DFH H BDFHJ
Somewhat comfortable
- 3478 - 605 - 345 - 734 - 233 - 1561- 64% - 73% - 68% - 76% - 62% - 56%
L BFJL BJL BFJL L
BOTTOM 2 BOX (NET)
- 1679 - 270 - 128 - 302 - 103 - 876- 31% - 33% - 25% - 31% - 27% - 32%
F F F F
Not very comfortable
- 1799 - 335 - 217 - 432 - 130 - 685- 33% - 41% - 43% - 45% - 34% - 25%
L BJL BJL BJL L
Not at all comfortable
- 5452 - 826 - 507 - 963 - 378 - 2778- 100% - 100% - 100% - 100% - 100% - 100%
Sigma
_________________________________________________________________________________________________________________Proportions/Means: Columns Tested (5% risk level) - A/B - C/D - E/F - G/H - I/J - K/L - A/C/E/G/I/K - B/D/F/H/J/LOverlap formulae used. ** very small base (under 30) ineligible for sig testing

Page 347p121866 - ICANN Global Study Wave 2 - ConsumersNielsenBanner 3
8 Jun 2016Table 284Q1145_5. Please think about two/three websites. One has a .com domain extension/, one has a ... and one has one of the new gTLDs like .club or .bank.
How comfortable would you be doing each of these activities on each website?
5. Inputting an ID number like a social security number, passport or government ID number
SUMMARY TABLE OF TOP BOX
Base: All Qualified Respondents
Region
2016 Total 2016 North 2016 South2015 Total Consumers 2015 North America 2015 South America 2016 Europe 2016 Africa 2016 AsiaConsumers (18+) America (18+) America (18+) 2015 Europe (18+) 2015 Africa (18+) 2015 Asia (18+)
(A) (B) (C) (D) (E) (F) (G) (H) (I) (J) (K) (L)
-** 5452 -** 826 -** 507 -** 963 -** 378 -** 2778Unweighted Base
- 1442 - 173 - 162 - 148 - 151 - 808- 26% - 21% - 32% - 15% - 40% - 29%
DH H BDH BDFHL BDH
.com
- 1314 - 92 - 150 - 178 - 124 - 770- 26% - 25% - 30% - 18% - 33% - 28%
H H H BDHL BH
gTLDs
- 577 - 45 - 48 - 57 - 47 - 380- 11% - 5% - 9% - 6% - 12% - 14%
DH DH DH BDFH
.club or .bank
_________________________________________________________________________________________________________________Proportions/Means: Columns Tested (5% risk level) - A/B - C/D - E/F - G/H - I/J - K/L - A/C/E/G/I/K - B/D/F/H/J/LOverlap formulae used. ** very small base (under 30) ineligible for sig testing

Page 348p121866 - ICANN Global Study Wave 2 - ConsumersNielsenBanner 3
8 Jun 2016Table 285Q1145_5. Please think about two/three websites. One has a .com domain extension/, one has a ... and one has one of the new gTLDs like .club or .bank.
How comfortable would you be doing each of these activities on each website?
5. Inputting an ID number like a social security number, passport or government ID number
SUMMARY TABLE OF TOP 2 BOX
Base: All Qualified Respondents
Region
2016 Total 2016 North 2016 South2015 Total Consumers 2015 North America 2015 South America 2016 Europe 2016 Africa 2016 AsiaConsumers (18+) America (18+) America (18+) 2015 Europe (18+) 2015 Africa (18+) 2015 Asia (18+)
(A) (B) (C) (D) (E) (F) (G) (H) (I) (J) (K) (L)
-** 5452 -** 826 -** 507 -** 963 -** 378 -** 2778Unweighted Base
- 3063 - 197 - 295 - 515 - 241 - 1815- 61% - 54% - 58% - 53% - 64% - 65%
DH DH BDFH
gTLDs
- 3231 - 385 - 298 - 464 - 252 - 1832- 59% - 47% - 59% - 48% - 67% - 66%
DH DH BDFH BDFH
.com
- 1869 - 169 - 159 - 221 - 135 - 1185- 34% - 20% - 31% - 23% - 36% - 43%
DH DH DH BDFHJ
.club or .bank
_________________________________________________________________________________________________________________Proportions/Means: Columns Tested (5% risk level) - A/B - C/D - E/F - G/H - I/J - K/L - A/C/E/G/I/K - B/D/F/H/J/LOverlap formulae used. ** very small base (under 30) ineligible for sig testing
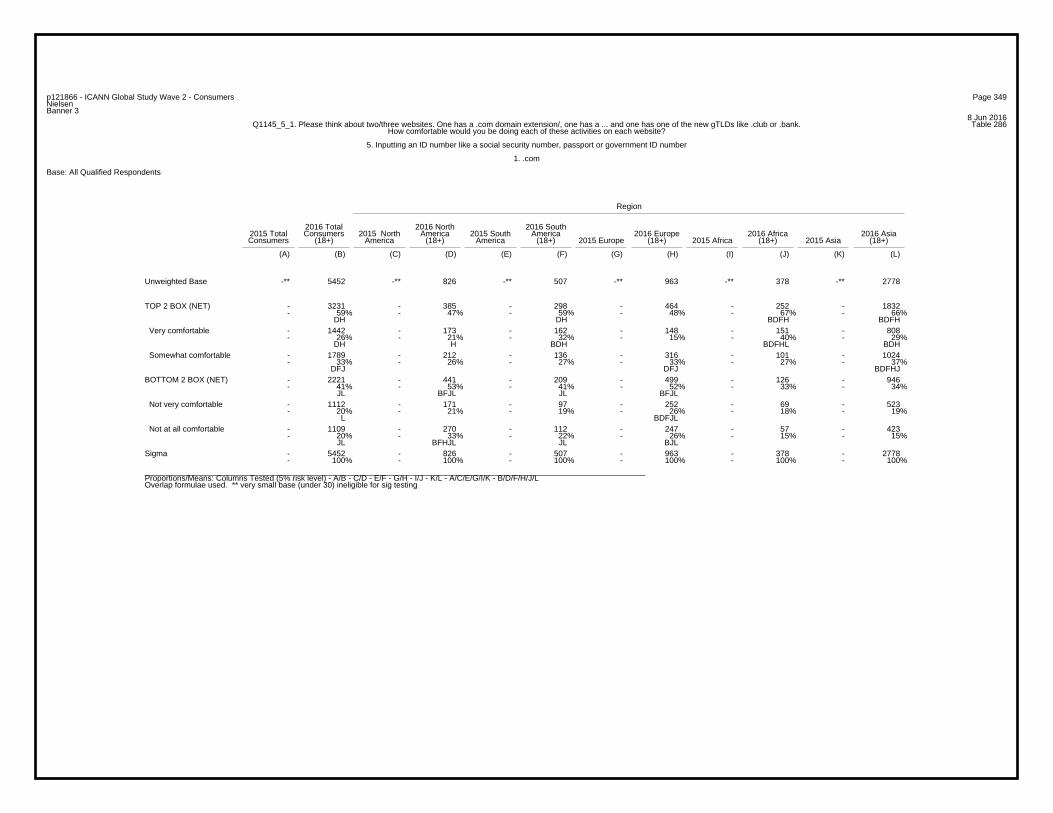
Page 349p121866 - ICANN Global Study Wave 2 - ConsumersNielsenBanner 3
8 Jun 2016Table 286Q1145_5_1. Please think about two/three websites. One has a .com domain extension/, one has a ... and one has one of the new gTLDs like .club or .bank.
How comfortable would you be doing each of these activities on each website?
5. Inputting an ID number like a social security number, passport or government ID number
1. .com
Base: All Qualified Respondents
Region
2016 Total 2016 North 2016 South2015 Total Consumers 2015 North America 2015 South America 2016 Europe 2016 Africa 2016 AsiaConsumers (18+) America (18+) America (18+) 2015 Europe (18+) 2015 Africa (18+) 2015 Asia (18+)
(A) (B) (C) (D) (E) (F) (G) (H) (I) (J) (K) (L)
-** 5452 -** 826 -** 507 -** 963 -** 378 -** 2778Unweighted Base
- 3231 - 385 - 298 - 464 - 252 - 1832- 59% - 47% - 59% - 48% - 67% - 66%
DH DH BDFH BDFH
TOP 2 BOX (NET)
- 1442 - 173 - 162 - 148 - 151 - 808- 26% - 21% - 32% - 15% - 40% - 29%
DH H BDH BDFHL BDH
Very comfortable
- 1789 - 212 - 136 - 316 - 101 - 1024- 33% - 26% - 27% - 33% - 27% - 37%
DFJ DFJ BDFHJ
Somewhat comfortable
- 2221 - 441 - 209 - 499 - 126 - 946- 41% - 53% - 41% - 52% - 33% - 34%
JL BFJL JL BFJL
BOTTOM 2 BOX (NET)
- 1112 - 171 - 97 - 252 - 69 - 523- 20% - 21% - 19% - 26% - 18% - 19%
L BDFJL
Not very comfortable
- 1109 - 270 - 112 - 247 - 57 - 423- 20% - 33% - 22% - 26% - 15% - 15%
JL BFHJL JL BJL
Not at all comfortable
- 5452 - 826 - 507 - 963 - 378 - 2778- 100% - 100% - 100% - 100% - 100% - 100%
Sigma
_________________________________________________________________________________________________________________Proportions/Means: Columns Tested (5% risk level) - A/B - C/D - E/F - G/H - I/J - K/L - A/C/E/G/I/K - B/D/F/H/J/LOverlap formulae used. ** very small base (under 30) ineligible for sig testing

Page 350p121866 - ICANN Global Study Wave 2 - ConsumersNielsenBanner 3
8 Jun 2016Table 287Q1145_5_2. Please think about two/three websites. One has a .com domain extension/, one has a ... and one has one of the new gTLDs like .club or .bank.
How comfortable would you be doing each of these activities on each website?
5. Inputting an ID number like a social security number, passport or government ID number
2. gTLDs
Base: All Qualified Respondents
Region
2016 Total 2016 North 2016 South2015 Total Consumers 2015 North America 2015 South America 2016 Europe 2016 Africa 2016 AsiaConsumers (18+) America (18+) America (18+) 2015 Europe (18+) 2015 Africa (18+) 2015 Asia (18+)
(A) (B) (C) (D) (E) (F) (G) (H) (I) (J) (K) (L)
-** 4991 -** 365 -** 507 -** 963 -** 378 -** 2778Unweighted Base
- 3063 - 197 - 295 - 515 - 241 - 1815- 61% - 54% - 58% - 53% - 64% - 65%
DH DH BDFH
TOP 2 BOX (NET)
- 1314 - 92 - 150 - 178 - 124 - 770- 26% - 25% - 30% - 18% - 33% - 28%
H H H BDHL BH
Very comfortable
- 1749 - 105 - 145 - 337 - 117 - 1045- 35% - 29% - 29% - 35% - 31% - 38%
DF DF BDFJ
Somewhat comfortable
- 1928 - 168 - 212 - 448 - 137 - 963- 39% - 46% - 42% - 47% - 36% - 35%
L BJL L BJL
BOTTOM 2 BOX (NET)
- 1053 - 73 - 107 - 228 - 82 - 563- 21% - 20% - 21% - 24% - 22% - 20%
BL
Not very comfortable
- 875 - 95 - 105 - 220 - 55 - 400- 18% - 26% - 21% - 23% - 15% - 14%
L BJL BJL BJL
Not at all comfortable
- 4991 - 365 - 507 - 963 - 378 - 2778- 100% - 100% - 100% - 100% - 100% - 100%
Sigma
_________________________________________________________________________________________________________________Proportions/Means: Columns Tested (5% risk level) - A/B - C/D - E/F - G/H - I/J - K/L - A/C/E/G/I/K - B/D/F/H/J/LOverlap formulae used. ** very small base (under 30) ineligible for sig testing

Page 351p121866 - ICANN Global Study Wave 2 - ConsumersNielsenBanner 3
8 Jun 2016Table 288Q1145_5_3. Please think about two/three websites. One has a .com domain extension/, one has a ... and one has one of the new gTLDs like .club or .bank.
How comfortable would you be doing each of these activities on each website?
5. Inputting an ID number like a social security number, passport or government ID number
3. .club or .bank
Base: All Qualified Respondents
Region
2016 Total 2016 North 2016 South2015 Total Consumers 2015 North America 2015 South America 2016 Europe 2016 Africa 2016 AsiaConsumers (18+) America (18+) America (18+) 2015 Europe (18+) 2015 Africa (18+) 2015 Asia (18+)
(A) (B) (C) (D) (E) (F) (G) (H) (I) (J) (K) (L)
-** 5452 -** 826 -** 507 -** 963 -** 378 -** 2778Unweighted Base
- 1869 - 169 - 159 - 221 - 135 - 1185- 34% - 20% - 31% - 23% - 36% - 43%
DH DH DH BDFHJ
TOP 2 BOX (NET)
- 577 - 45 - 48 - 57 - 47 - 380- 11% - 5% - 9% - 6% - 12% - 14%
DH DH DH BDFH
Very comfortable
- 1292 - 124 - 111 - 164 - 88 - 805- 24% - 15% - 22% - 17% - 23% - 29%
DH DH DH BDFHJ
Somewhat comfortable
- 3583 - 657 - 348 - 742 - 243 - 1593- 66% - 80% - 69% - 77% - 64% - 57%
L BFJL L BFJL L
BOTTOM 2 BOX (NET)
- 1710 - 224 - 135 - 331 - 124 - 896- 31% - 27% - 27% - 34% - 33% - 32%
DF BDF DF DF
Not very comfortable
- 1873 - 433 - 213 - 411 - 119 - 697- 34% - 52% - 42% - 43% - 31% - 25%
L BFHJL BJL BJL L
Not at all comfortable
- 5452 - 826 - 507 - 963 - 378 - 2778- 100% - 100% - 100% - 100% - 100% - 100%
Sigma
_________________________________________________________________________________________________________________Proportions/Means: Columns Tested (5% risk level) - A/B - C/D - E/F - G/H - I/J - K/L - A/C/E/G/I/K - B/D/F/H/J/LOverlap formulae used. ** very small base (under 30) ineligible for sig testing

Page 352p121866 - ICANN Global Study Wave 2 - ConsumersNielsenBanner 3
8 Jun 2016Table 289Q1145_6. Please think about two/three websites. One has a .com domain extension/, one has a ... and one has one of the new gTLDs like .club or .bank.
How comfortable would you be doing each of these activities on each website?
6. Inputting healthcare information, like inputting a list of prescription drugs you use, or your medical history
SUMMARY TABLE OF TOP BOX
Base: All Qualified Respondents
Region
2016 Total 2016 North 2016 South2015 Total Consumers 2015 North America 2015 South America 2016 Europe 2016 Africa 2016 AsiaConsumers (18+) America (18+) America (18+) 2015 Europe (18+) 2015 Africa (18+) 2015 Asia (18+)
(A) (B) (C) (D) (E) (F) (G) (H) (I) (J) (K) (L)
-** 5452 -** 826 -** 507 -** 963 -** 378 -** 2778Unweighted Base
- 1618 - 206 - 195 - 159 - 163 - 895- 30% - 25% - 38% - 17% - 43% - 32%
DH H BDHL BDHL BDH
.com
- 1432 - 98 - 182 - 181 - 135 - 836- 29% - 27% - 36% - 19% - 36% - 30%
H H BDHL BDHL BH
gTLDs
- 614 - 51 - 73 - 65 - 56 - 369- 11% - 6% - 14% - 7% - 15% - 13%
DH BDH BDH BDH
.club or .bank
_________________________________________________________________________________________________________________Proportions/Means: Columns Tested (5% risk level) - A/B - C/D - E/F - G/H - I/J - K/L - A/C/E/G/I/K - B/D/F/H/J/LOverlap formulae used. ** very small base (under 30) ineligible for sig testing

Page 353p121866 - ICANN Global Study Wave 2 - ConsumersNielsenBanner 3
8 Jun 2016Table 290Q1145_6. Please think about two/three websites. One has a .com domain extension/, one has a ... and one has one of the new gTLDs like .club or .bank.
How comfortable would you be doing each of these activities on each website?
6. Inputting healthcare information, like inputting a list of prescription drugs you use, or your medical history
SUMMARY TABLE OF TOP 2 BOX
Base: All Qualified Respondents
Region
2016 Total 2016 North 2016 South2015 Total Consumers 2015 North America 2015 South America 2016 Europe 2016 Africa 2016 AsiaConsumers (18+) America (18+) America (18+) 2015 Europe (18+) 2015 Africa (18+) 2015 Asia (18+)
(A) (B) (C) (D) (E) (F) (G) (H) (I) (J) (K) (L)
-** 5452 -** 826 -** 507 -** 963 -** 378 -** 2778Unweighted Base
- 3485 - 233 - 349 - 543 - 278 - 2082- 70% - 64% - 69% - 56% - 74% - 75%
DH H H DH BDFH
gTLDs
- 3724 - 498 - 346 - 507 - 283 - 2090- 68% - 60% - 68% - 53% - 75% - 75%
DH H DH BDFH BDFH
.com
- 2183 - 230 - 193 - 239 - 172 - 1349- 40% - 28% - 38% - 25% - 46% - 49%
DH DH BDFH BDFH
.club or .bank
_________________________________________________________________________________________________________________Proportions/Means: Columns Tested (5% risk level) - A/B - C/D - E/F - G/H - I/J - K/L - A/C/E/G/I/K - B/D/F/H/J/LOverlap formulae used. ** very small base (under 30) ineligible for sig testing
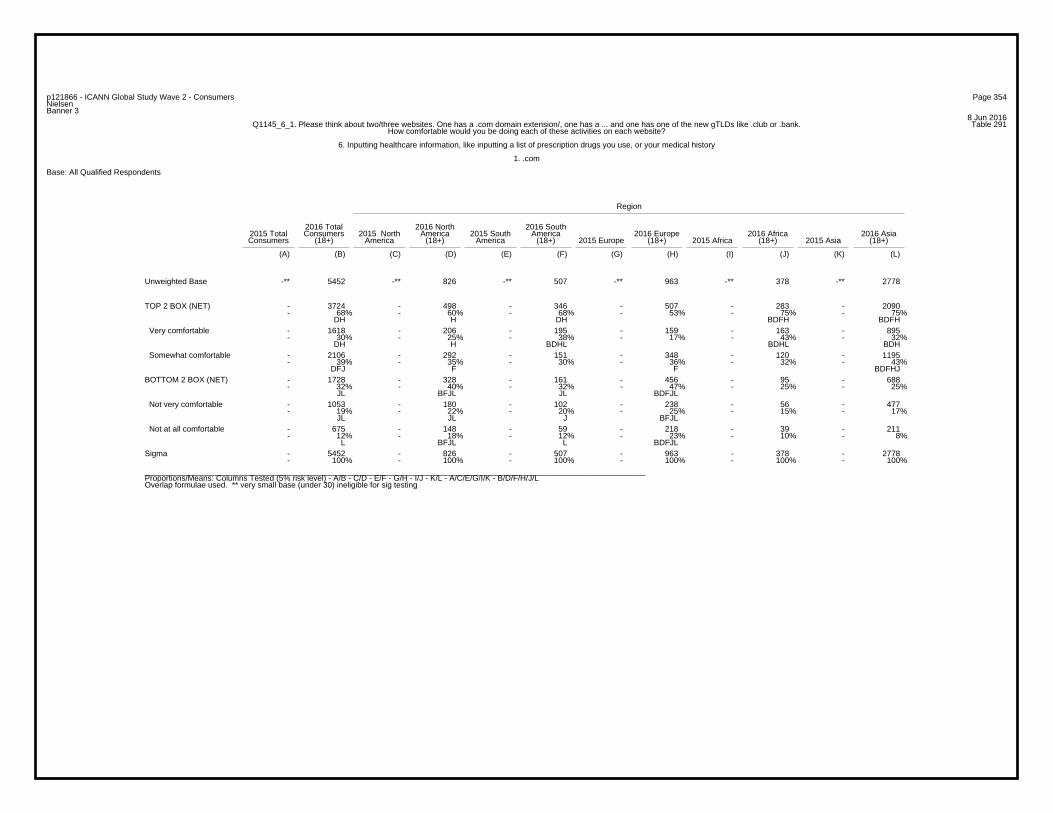
Page 354p121866 - ICANN Global Study Wave 2 - ConsumersNielsenBanner 3
8 Jun 2016Table 291Q1145_6_1. Please think about two/three websites. One has a .com domain extension/, one has a ... and one has one of the new gTLDs like .club or .bank.
How comfortable would you be doing each of these activities on each website?
6. Inputting healthcare information, like inputting a list of prescription drugs you use, or your medical history
1. .com
Base: All Qualified Respondents
Region
2016 Total 2016 North 2016 South2015 Total Consumers 2015 North America 2015 South America 2016 Europe 2016 Africa 2016 AsiaConsumers (18+) America (18+) America (18+) 2015 Europe (18+) 2015 Africa (18+) 2015 Asia (18+)
(A) (B) (C) (D) (E) (F) (G) (H) (I) (J) (K) (L)
-** 5452 -** 826 -** 507 -** 963 -** 378 -** 2778Unweighted Base
- 3724 - 498 - 346 - 507 - 283 - 2090- 68% - 60% - 68% - 53% - 75% - 75%
DH H DH BDFH BDFH
TOP 2 BOX (NET)
- 1618 - 206 - 195 - 159 - 163 - 895- 30% - 25% - 38% - 17% - 43% - 32%
DH H BDHL BDHL BDH
Very comfortable
- 2106 - 292 - 151 - 348 - 120 - 1195- 39% - 35% - 30% - 36% - 32% - 43%
DFJ F F BDFHJ
Somewhat comfortable
- 1728 - 328 - 161 - 456 - 95 - 688- 32% - 40% - 32% - 47% - 25% - 25%
JL BFJL JL BDFJL
BOTTOM 2 BOX (NET)
- 1053 - 180 - 102 - 238 - 56 - 477- 19% - 22% - 20% - 25% - 15% - 17%
JL JL J BFJL
Not very comfortable
- 675 - 148 - 59 - 218 - 39 - 211- 12% - 18% - 12% - 23% - 10% - 8%
L BFJL L BDFJL
Not at all comfortable
- 5452 - 826 - 507 - 963 - 378 - 2778- 100% - 100% - 100% - 100% - 100% - 100%
Sigma
_________________________________________________________________________________________________________________Proportions/Means: Columns Tested (5% risk level) - A/B - C/D - E/F - G/H - I/J - K/L - A/C/E/G/I/K - B/D/F/H/J/LOverlap formulae used. ** very small base (under 30) ineligible for sig testing

Page 355p121866 - ICANN Global Study Wave 2 - ConsumersNielsenBanner 3
8 Jun 2016Table 292Q1145_6_2. Please think about two/three websites. One has a .com domain extension/, one has a ... and one has one of the new gTLDs like .club or .bank.
How comfortable would you be doing each of these activities on each website?
6. Inputting healthcare information, like inputting a list of prescription drugs you use, or your medical history
2. gTLDs
Base: All Qualified Respondents
Region
2016 Total 2016 North 2016 South2015 Total Consumers 2015 North America 2015 South America 2016 Europe 2016 Africa 2016 AsiaConsumers (18+) America (18+) America (18+) 2015 Europe (18+) 2015 Africa (18+) 2015 Asia (18+)
(A) (B) (C) (D) (E) (F) (G) (H) (I) (J) (K) (L)
-** 4991 -** 365 -** 507 -** 963 -** 378 -** 2778Unweighted Base
- 3485 - 233 - 349 - 543 - 278 - 2082- 70% - 64% - 69% - 56% - 74% - 75%
DH H H DH BDFH
TOP 2 BOX (NET)
- 1432 - 98 - 182 - 181 - 135 - 836- 29% - 27% - 36% - 19% - 36% - 30%
H H BDHL BDHL BH
Very comfortable
- 2053 - 135 - 167 - 362 - 143 - 1246- 41% - 37% - 33% - 38% - 38% - 45%
FH BDFHJ
Somewhat comfortable
- 1506 - 132 - 158 - 420 - 100 - 696- 30% - 36% - 31% - 44% - 26% - 25%
L BJL L BDFJL
BOTTOM 2 BOX (NET)
- 945 - 72 - 99 - 218 - 62 - 494- 19% - 20% - 20% - 23% - 16% - 18%
L BJL
Not very comfortable
- 561 - 60 - 59 - 202 - 38 - 202- 11% - 16% - 12% - 21% - 10% - 7%
L BFJL L BFJL
Not at all comfortable
- 4991 - 365 - 507 - 963 - 378 - 2778- 100% - 100% - 100% - 100% - 100% - 100%
Sigma
_________________________________________________________________________________________________________________Proportions/Means: Columns Tested (5% risk level) - A/B - C/D - E/F - G/H - I/J - K/L - A/C/E/G/I/K - B/D/F/H/J/LOverlap formulae used. ** very small base (under 30) ineligible for sig testing

Page 356p121866 - ICANN Global Study Wave 2 - ConsumersNielsenBanner 3
8 Jun 2016Table 293Q1145_6_3. Please think about two/three websites. One has a .com domain extension/, one has a ... and one has one of the new gTLDs like .club or .bank.
How comfortable would you be doing each of these activities on each website?
6. Inputting healthcare information, like inputting a list of prescription drugs you use, or your medical history
3. .club or .bank
Base: All Qualified Respondents
Region
2016 Total 2016 North 2016 South2015 Total Consumers 2015 North America 2015 South America 2016 Europe 2016 Africa 2016 AsiaConsumers (18+) America (18+) America (18+) 2015 Europe (18+) 2015 Africa (18+) 2015 Asia (18+)
(A) (B) (C) (D) (E) (F) (G) (H) (I) (J) (K) (L)
-** 5452 -** 826 -** 507 -** 963 -** 378 -** 2778Unweighted Base
- 2183 - 230 - 193 - 239 - 172 - 1349- 40% - 28% - 38% - 25% - 46% - 49%
DH DH BDFH BDFH
TOP 2 BOX (NET)
- 614 - 51 - 73 - 65 - 56 - 369- 11% - 6% - 14% - 7% - 15% - 13%
DH BDH BDH BDH
Very comfortable
- 1569 - 179 - 120 - 174 - 116 - 980- 29% - 22% - 24% - 18% - 31% - 35%
DFH H DFH BDFH
Somewhat comfortable
- 3269 - 596 - 314 - 724 - 206 - 1429- 60% - 72% - 62% - 75% - 54% - 51%
JL BFJL JL BFJL
BOTTOM 2 BOX (NET)
- 1839 - 279 - 150 - 338 - 125 - 947- 34% - 34% - 30% - 35% - 33% - 34%
F F F
Not very comfortable
- 1430 - 317 - 164 - 386 - 81 - 482- 26% - 38% - 32% - 40% - 21% - 17%
JL BFJL BJL BFJL
Not at all comfortable
- 5452 - 826 - 507 - 963 - 378 - 2778- 100% - 100% - 100% - 100% - 100% - 100%
Sigma
_________________________________________________________________________________________________________________Proportions/Means: Columns Tested (5% risk level) - A/B - C/D - E/F - G/H - I/J - K/L - A/C/E/G/I/K - B/D/F/H/J/LOverlap formulae used. ** very small base (under 30) ineligible for sig testing
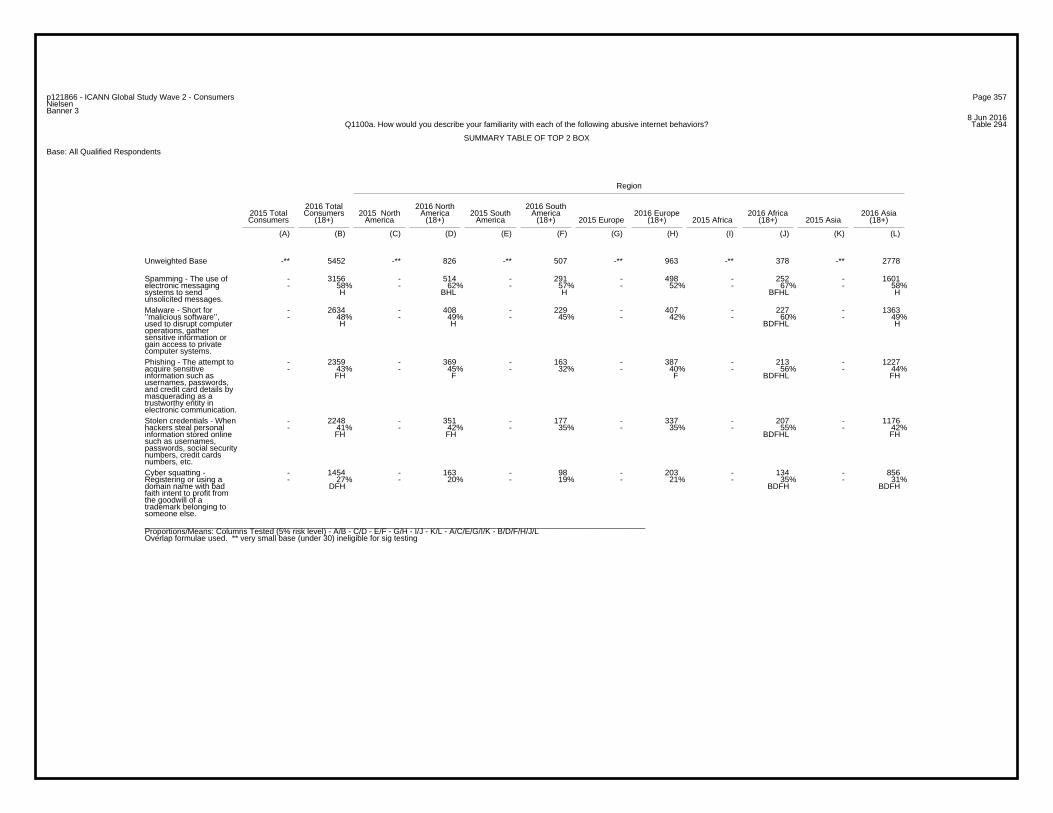
Page 357p121866 - ICANN Global Study Wave 2 - ConsumersNielsenBanner 3
8 Jun 2016Table 294Q1100a. How would you describe your familiarity with each of the following abusive internet behaviors?
SUMMARY TABLE OF TOP 2 BOX
Base: All Qualified Respondents
Region
2016 Total 2016 North 2016 South2015 Total Consumers 2015 North America 2015 South America 2016 Europe 2016 Africa 2016 AsiaConsumers (18+) America (18+) America (18+) 2015 Europe (18+) 2015 Africa (18+) 2015 Asia (18+)
(A) (B) (C) (D) (E) (F) (G) (H) (I) (J) (K) (L)
-** 5452 -** 826 -** 507 -** 963 -** 378 -** 2778Unweighted Base
- 3156 - 514 - 291 - 498 - 252 - 1601- 58% - 62% - 57% - 52% - 67% - 58%
H BHL H BFHL H
Spamming - The use ofelectronic messagingsystems to sendunsolicited messages.
- 2634 - 408 - 229 - 407 - 227 - 1363- 48% - 49% - 45% - 42% - 60% - 49%
H H BDFHL H
Malware - Short for’’malicious software’’,used to disrupt computeroperations, gathersensitive information orgain access to privatecomputer systems.
- 2359 - 369 - 163 - 387 - 213 - 1227- 43% - 45% - 32% - 40% - 56% - 44%
FH F F BDFHL FH
Phishing - The attempt toacquire sensitiveinformation such asusernames, passwords,and credit card details bymasquerading as atrustworthy entity inelectronic communication.
- 2248 - 351 - 177 - 337 - 207 - 1176- 41% - 42% - 35% - 35% - 55% - 42%
FH FH BDFHL FH
Stolen credentials - Whenhackers steal personalinformation stored onlinesuch as usernames,passwords, social securitynumbers, credit cardsnumbers, etc.
- 1454 - 163 - 98 - 203 - 134 - 856- 27% - 20% - 19% - 21% - 35% - 31%
DFH BDFH BDFH
Cyber squatting -Registering or using adomain name with badfaith intent to profit fromthe goodwill of atrademark belonging tosomeone else._________________________________________________________________________________________________________________Proportions/Means: Columns Tested (5% risk level) - A/B - C/D - E/F - G/H - I/J - K/L - A/C/E/G/I/K - B/D/F/H/J/LOverlap formulae used. ** very small base (under 30) ineligible for sig testing
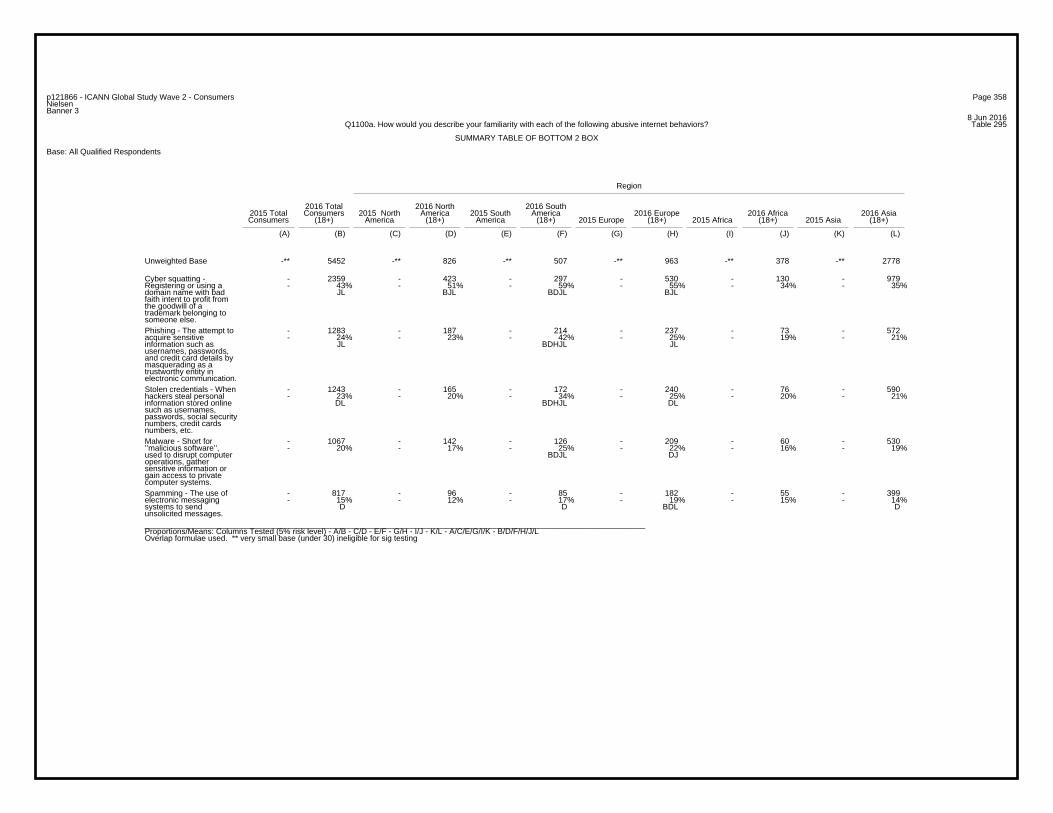
Page 358p121866 - ICANN Global Study Wave 2 - ConsumersNielsenBanner 3
8 Jun 2016Table 295Q1100a. How would you describe your familiarity with each of the following abusive internet behaviors?
SUMMARY TABLE OF BOTTOM 2 BOX
Base: All Qualified Respondents
Region
2016 Total 2016 North 2016 South2015 Total Consumers 2015 North America 2015 South America 2016 Europe 2016 Africa 2016 AsiaConsumers (18+) America (18+) America (18+) 2015 Europe (18+) 2015 Africa (18+) 2015 Asia (18+)
(A) (B) (C) (D) (E) (F) (G) (H) (I) (J) (K) (L)
-** 5452 -** 826 -** 507 -** 963 -** 378 -** 2778Unweighted Base
- 2359 - 423 - 297 - 530 - 130 - 979- 43% - 51% - 59% - 55% - 34% - 35%
JL BJL BDJL BJL
Cyber squatting -Registering or using adomain name with badfaith intent to profit fromthe goodwill of atrademark belonging tosomeone else.
- 1283 - 187 - 214 - 237 - 73 - 572- 24% - 23% - 42% - 25% - 19% - 21%
JL BDHJL JL
Phishing - The attempt toacquire sensitiveinformation such asusernames, passwords,and credit card details bymasquerading as atrustworthy entity inelectronic communication.
- 1243 - 165 - 172 - 240 - 76 - 590- 23% - 20% - 34% - 25% - 20% - 21%
DL BDHJL DL
Stolen credentials - Whenhackers steal personalinformation stored onlinesuch as usernames,passwords, social securitynumbers, credit cardsnumbers, etc.
- 1067 - 142 - 126 - 209 - 60 - 530- 20% - 17% - 25% - 22% - 16% - 19%
BDJL DJ
Malware - Short for’’malicious software’’,used to disrupt computeroperations, gathersensitive information orgain access to privatecomputer systems.
- 817 - 96 - 85 - 182 - 55 - 399- 15% - 12% - 17% - 19% - 15% - 14%
D D BDL D
Spamming - The use ofelectronic messagingsystems to sendunsolicited messages._________________________________________________________________________________________________________________Proportions/Means: Columns Tested (5% risk level) - A/B - C/D - E/F - G/H - I/J - K/L - A/C/E/G/I/K - B/D/F/H/J/LOverlap formulae used. ** very small base (under 30) ineligible for sig testing
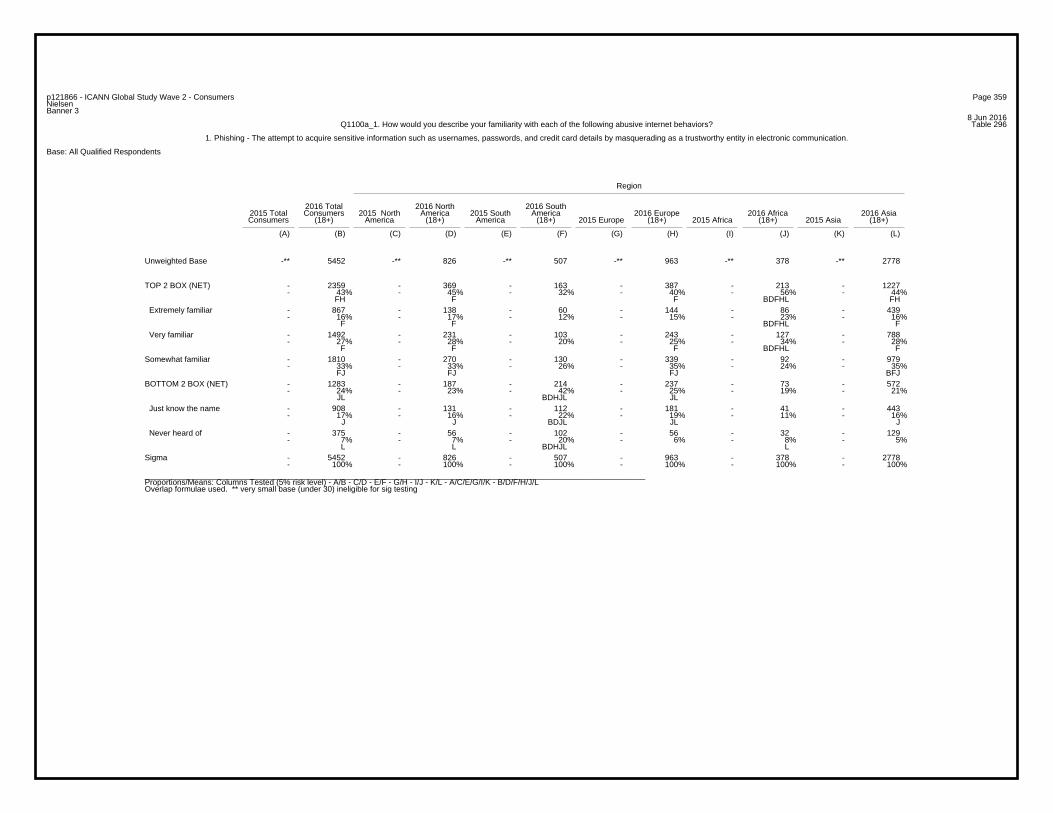
Page 359p121866 - ICANN Global Study Wave 2 - ConsumersNielsenBanner 3
8 Jun 2016Table 296Q1100a_1. How would you describe your familiarity with each of the following abusive internet behaviors?
1. Phishing - The attempt to acquire sensitive information such as usernames, passwords, and credit card details by masquerading as a trustworthy entity in electronic communication.
Base: All Qualified Respondents
Region
2016 Total 2016 North 2016 South2015 Total Consumers 2015 North America 2015 South America 2016 Europe 2016 Africa 2016 AsiaConsumers (18+) America (18+) America (18+) 2015 Europe (18+) 2015 Africa (18+) 2015 Asia (18+)
(A) (B) (C) (D) (E) (F) (G) (H) (I) (J) (K) (L)
-** 5452 -** 826 -** 507 -** 963 -** 378 -** 2778Unweighted Base
- 2359 - 369 - 163 - 387 - 213 - 1227- 43% - 45% - 32% - 40% - 56% - 44%
FH F F BDFHL FH
TOP 2 BOX (NET)
- 867 - 138 - 60 - 144 - 86 - 439- 16% - 17% - 12% - 15% - 23% - 16%
F F BDFHL F
Extremely familiar
- 1492 - 231 - 103 - 243 - 127 - 788- 27% - 28% - 20% - 25% - 34% - 28%
F F F BDFHL F
Very familiar
- 1810 - 270 - 130 - 339 - 92 - 979- 33% - 33% - 26% - 35% - 24% - 35%
FJ FJ FJ BFJ
Somewhat familiar
- 1283 - 187 - 214 - 237 - 73 - 572- 24% - 23% - 42% - 25% - 19% - 21%
JL BDHJL JL
BOTTOM 2 BOX (NET)
- 908 - 131 - 112 - 181 - 41 - 443- 17% - 16% - 22% - 19% - 11% - 16%
J J BDJL JL J
Just know the name
- 375 - 56 - 102 - 56 - 32 - 129- 7% - 7% - 20% - 6% - 8% - 5%
L L BDHJL L
Never heard of
- 5452 - 826 - 507 - 963 - 378 - 2778- 100% - 100% - 100% - 100% - 100% - 100%
Sigma
_________________________________________________________________________________________________________________Proportions/Means: Columns Tested (5% risk level) - A/B - C/D - E/F - G/H - I/J - K/L - A/C/E/G/I/K - B/D/F/H/J/LOverlap formulae used. ** very small base (under 30) ineligible for sig testing
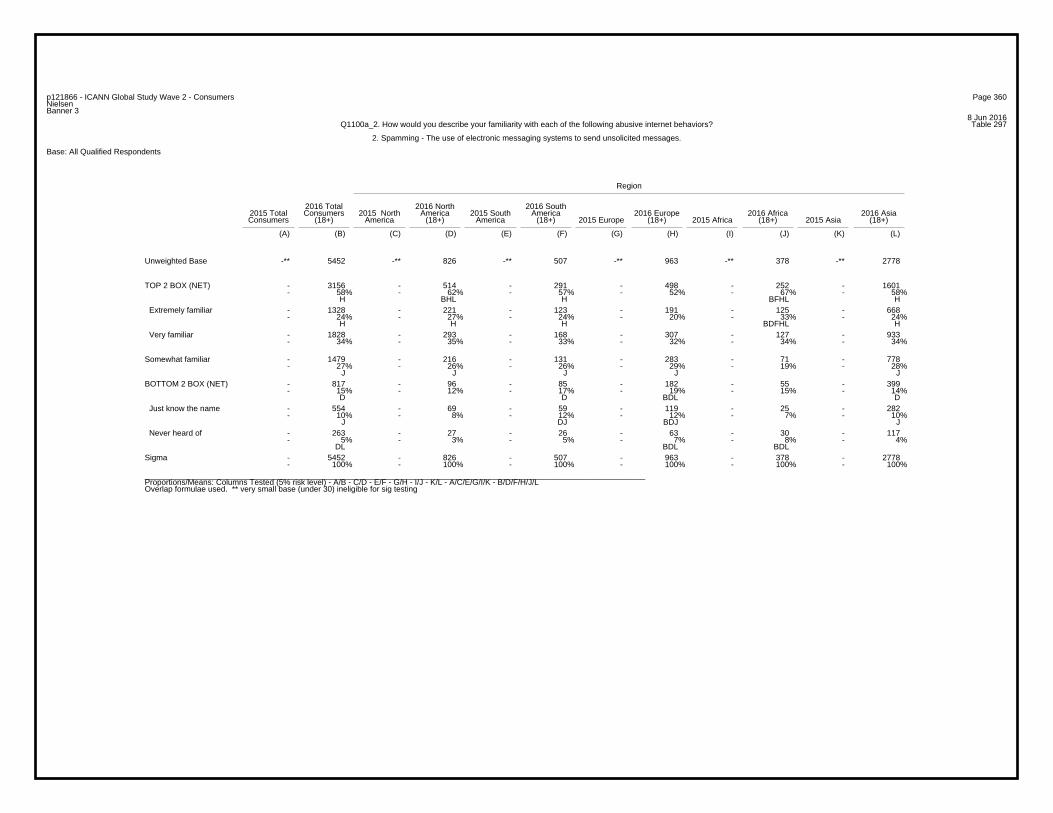
Page 360p121866 - ICANN Global Study Wave 2 - ConsumersNielsenBanner 3
8 Jun 2016Table 297Q1100a_2. How would you describe your familiarity with each of the following abusive internet behaviors?
2. Spamming - The use of electronic messaging systems to send unsolicited messages.
Base: All Qualified Respondents
Region
2016 Total 2016 North 2016 South2015 Total Consumers 2015 North America 2015 South America 2016 Europe 2016 Africa 2016 AsiaConsumers (18+) America (18+) America (18+) 2015 Europe (18+) 2015 Africa (18+) 2015 Asia (18+)
(A) (B) (C) (D) (E) (F) (G) (H) (I) (J) (K) (L)
-** 5452 -** 826 -** 507 -** 963 -** 378 -** 2778Unweighted Base
- 3156 - 514 - 291 - 498 - 252 - 1601- 58% - 62% - 57% - 52% - 67% - 58%
H BHL H BFHL H
TOP 2 BOX (NET)
- 1328 - 221 - 123 - 191 - 125 - 668- 24% - 27% - 24% - 20% - 33% - 24%
H H H BDFHL H
Extremely familiar
- 1828 - 293 - 168 - 307 - 127 - 933- 34% - 35% - 33% - 32% - 34% - 34%
Very familiar
- 1479 - 216 - 131 - 283 - 71 - 778- 27% - 26% - 26% - 29% - 19% - 28%
J J J J J
Somewhat familiar
- 817 - 96 - 85 - 182 - 55 - 399- 15% - 12% - 17% - 19% - 15% - 14%
D D BDL D
BOTTOM 2 BOX (NET)
- 554 - 69 - 59 - 119 - 25 - 282- 10% - 8% - 12% - 12% - 7% - 10%
J DJ BDJ J
Just know the name
- 263 - 27 - 26 - 63 - 30 - 117- 5% - 3% - 5% - 7% - 8% - 4%
DL BDL BDL
Never heard of
- 5452 - 826 - 507 - 963 - 378 - 2778- 100% - 100% - 100% - 100% - 100% - 100%
Sigma
_________________________________________________________________________________________________________________Proportions/Means: Columns Tested (5% risk level) - A/B - C/D - E/F - G/H - I/J - K/L - A/C/E/G/I/K - B/D/F/H/J/LOverlap formulae used. ** very small base (under 30) ineligible for sig testing

Page 361p121866 - ICANN Global Study Wave 2 - ConsumersNielsenBanner 3
8 Jun 2016Table 298Q1100a_3. How would you describe your familiarity with each of the following abusive internet behaviors?
3. Cyber squatting - Registering or using a domain name with bad faith intent to profit from the goodwill of a trademark belonging to someone else.
Base: All Qualified Respondents
Region
2016 Total 2016 North 2016 South2015 Total Consumers 2015 North America 2015 South America 2016 Europe 2016 Africa 2016 AsiaConsumers (18+) America (18+) America (18+) 2015 Europe (18+) 2015 Africa (18+) 2015 Asia (18+)
(A) (B) (C) (D) (E) (F) (G) (H) (I) (J) (K) (L)
-** 5452 -** 826 -** 507 -** 963 -** 378 -** 2778Unweighted Base
- 1454 - 163 - 98 - 203 - 134 - 856- 27% - 20% - 19% - 21% - 35% - 31%
DFH BDFH BDFH
TOP 2 BOX (NET)
- 487 - 60 - 37 - 64 - 55 - 271- 9% - 7% - 7% - 7% - 15% - 10%
H BDFHL BDH
Extremely familiar
- 967 - 103 - 61 - 139 - 79 - 585- 18% - 12% - 12% - 14% - 21% - 21%
DFH DFH BDFH
Very familiar
- 1639 - 240 - 112 - 230 - 114 - 943- 30% - 29% - 22% - 24% - 30% - 34%
FH FH FH BDFH
Somewhat familiar
- 2359 - 423 - 297 - 530 - 130 - 979- 43% - 51% - 59% - 55% - 34% - 35%
JL BJL BDJL BJL
BOTTOM 2 BOX (NET)
- 1079 - 151 - 106 - 237 - 47 - 538- 20% - 18% - 21% - 25% - 12% - 19%
J J J BDJL J
Just know the name
- 1280 - 272 - 191 - 293 - 83 - 441- 23% - 33% - 38% - 30% - 22% - 16%
L BJL BHJL BJL L
Never heard of
- 5452 - 826 - 507 - 963 - 378 - 2778- 100% - 100% - 100% - 100% - 100% - 100%
Sigma
_________________________________________________________________________________________________________________Proportions/Means: Columns Tested (5% risk level) - A/B - C/D - E/F - G/H - I/J - K/L - A/C/E/G/I/K - B/D/F/H/J/LOverlap formulae used. ** very small base (under 30) ineligible for sig testing

Page 362p121866 - ICANN Global Study Wave 2 - ConsumersNielsenBanner 3
8 Jun 2016Table 299Q1100a_4. How would you describe your familiarity with each of the following abusive internet behaviors?
4. Stolen credentials - When hackers steal personal information stored online such as usernames, passwords, social security numbers, credit cards numbers, etc.
Base: All Qualified Respondents
Region
2016 Total 2016 North 2016 South2015 Total Consumers 2015 North America 2015 South America 2016 Europe 2016 Africa 2016 AsiaConsumers (18+) America (18+) America (18+) 2015 Europe (18+) 2015 Africa (18+) 2015 Asia (18+)
(A) (B) (C) (D) (E) (F) (G) (H) (I) (J) (K) (L)
-** 5452 -** 826 -** 507 -** 963 -** 378 -** 2778Unweighted Base
- 2248 - 351 - 177 - 337 - 207 - 1176- 41% - 42% - 35% - 35% - 55% - 42%
FH FH BDFHL FH
TOP 2 BOX (NET)
- 809 - 129 - 61 - 109 - 86 - 424- 15% - 16% - 12% - 11% - 23% - 15%
H H BDFHL H
Extremely familiar
- 1439 - 222 - 116 - 228 - 121 - 752- 26% - 27% - 23% - 24% - 32% - 27%
H BFHL FH
Very familiar
- 1961 - 310 - 158 - 386 - 95 - 1012- 36% - 38% - 31% - 40% - 25% - 36%
FJ FJ J BFJL FJ
Somewhat familiar
- 1243 - 165 - 172 - 240 - 76 - 590- 23% - 20% - 34% - 25% - 20% - 21%
DL BDHJL DL
BOTTOM 2 BOX (NET)
- 953 - 121 - 125 - 188 - 52 - 467- 17% - 15% - 25% - 20% - 14% - 17%
DJ BDHJL DJ
Just know the name
- 290 - 44 - 47 - 52 - 24 - 123- 5% - 5% - 9% - 5% - 6% - 4%
L BDHL
Never heard of
- 5452 - 826 - 507 - 963 - 378 - 2778- 100% - 100% - 100% - 100% - 100% - 100%
Sigma
_________________________________________________________________________________________________________________Proportions/Means: Columns Tested (5% risk level) - A/B - C/D - E/F - G/H - I/J - K/L - A/C/E/G/I/K - B/D/F/H/J/LOverlap formulae used. ** very small base (under 30) ineligible for sig testing
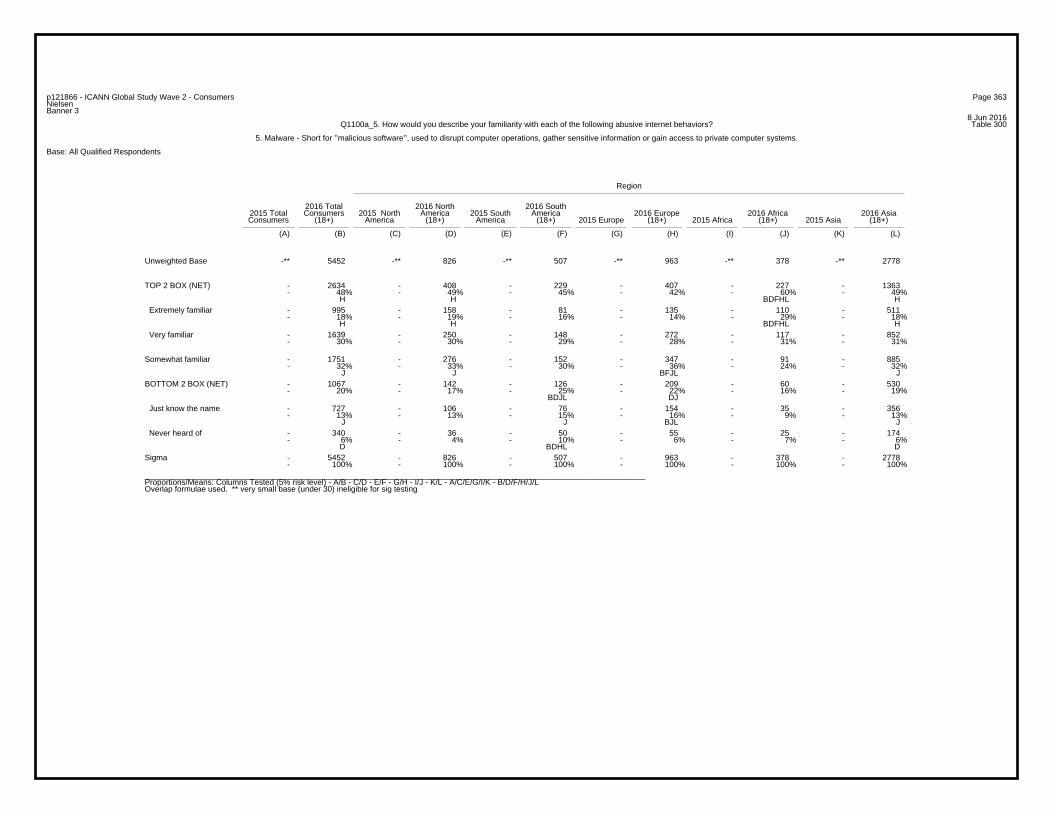
Page 363p121866 - ICANN Global Study Wave 2 - ConsumersNielsenBanner 3
8 Jun 2016Table 300Q1100a_5. How would you describe your familiarity with each of the following abusive internet behaviors?
5. Malware - Short for ’’malicious software’’, used to disrupt computer operations, gather sensitive information or gain access to private computer systems.
Base: All Qualified Respondents
Region
2016 Total 2016 North 2016 South2015 Total Consumers 2015 North America 2015 South America 2016 Europe 2016 Africa 2016 AsiaConsumers (18+) America (18+) America (18+) 2015 Europe (18+) 2015 Africa (18+) 2015 Asia (18+)
(A) (B) (C) (D) (E) (F) (G) (H) (I) (J) (K) (L)
-** 5452 -** 826 -** 507 -** 963 -** 378 -** 2778Unweighted Base
- 2634 - 408 - 229 - 407 - 227 - 1363- 48% - 49% - 45% - 42% - 60% - 49%
H H BDFHL H
TOP 2 BOX (NET)
- 995 - 158 - 81 - 135 - 110 - 511- 18% - 19% - 16% - 14% - 29% - 18%
H H BDFHL H
Extremely familiar
- 1639 - 250 - 148 - 272 - 117 - 852- 30% - 30% - 29% - 28% - 31% - 31%
Very familiar
- 1751 - 276 - 152 - 347 - 91 - 885- 32% - 33% - 30% - 36% - 24% - 32%
J J BFJL J
Somewhat familiar
- 1067 - 142 - 126 - 209 - 60 - 530- 20% - 17% - 25% - 22% - 16% - 19%
BDJL DJ
BOTTOM 2 BOX (NET)
- 727 - 106 - 76 - 154 - 35 - 356- 13% - 13% - 15% - 16% - 9% - 13%
J J BJL J
Just know the name
- 340 - 36 - 50 - 55 - 25 - 174- 6% - 4% - 10% - 6% - 7% - 6%
D BDHL D
Never heard of
- 5452 - 826 - 507 - 963 - 378 - 2778- 100% - 100% - 100% - 100% - 100% - 100%
Sigma
_________________________________________________________________________________________________________________Proportions/Means: Columns Tested (5% risk level) - A/B - C/D - E/F - G/H - I/J - K/L - A/C/E/G/I/K - B/D/F/H/J/LOverlap formulae used. ** very small base (under 30) ineligible for sig testing
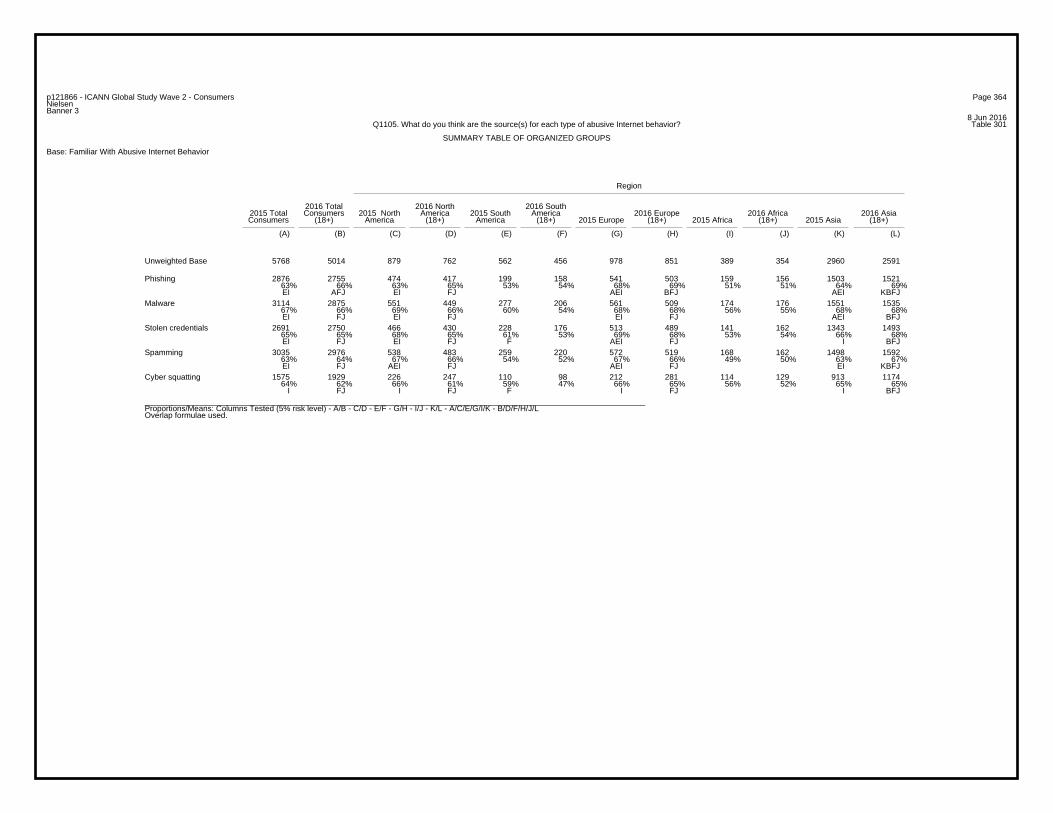
Page 364p121866 - ICANN Global Study Wave 2 - ConsumersNielsenBanner 3
8 Jun 2016Table 301Q1105. What do you think are the source(s) for each type of abusive Internet behavior?
SUMMARY TABLE OF ORGANIZED GROUPS
Base: Familiar With Abusive Internet Behavior
Region
2016 Total 2016 North 2016 South2015 Total Consumers 2015 North America 2015 South America 2016 Europe 2016 Africa 2016 AsiaConsumers (18+) America (18+) America (18+) 2015 Europe (18+) 2015 Africa (18+) 2015 Asia (18+)
(A) (B) (C) (D) (E) (F) (G) (H) (I) (J) (K) (L)
5768 5014 879 762 562 456 978 851 389 354 2960 2591Unweighted Base
2876 2755 474 417 199 158 541 503 159 156 1503 152163% 66% 63% 65% 53% 54% 68% 69% 51% 51% 64% 69%EI AFJ EI FJ AEI BFJ AEI KBFJ
Phishing
3114 2875 551 449 277 206 561 509 174 176 1551 153567% 66% 69% 66% 60% 54% 68% 68% 56% 55% 68% 68%EI FJ EI FJ EI FJ AEI BFJ
Malware
2691 2750 466 430 228 176 513 489 141 162 1343 149365% 65% 68% 65% 61% 53% 69% 68% 53% 54% 66% 68%EI FJ EI FJ F AEI FJ I BFJ
Stolen credentials
3035 2976 538 483 259 220 572 519 168 162 1498 159263% 64% 67% 66% 54% 52% 67% 66% 49% 50% 63% 67%EI FJ AEI FJ AEI FJ EI KBFJ
Spamming
1575 1929 226 247 110 98 212 281 114 129 913 117464% 62% 66% 61% 59% 47% 66% 65% 56% 52% 65% 65%
I FJ I FJ F I FJ I BFJ
Cyber squatting
_________________________________________________________________________________________________________________Proportions/Means: Columns Tested (5% risk level) - A/B - C/D - E/F - G/H - I/J - K/L - A/C/E/G/I/K - B/D/F/H/J/LOverlap formulae used.
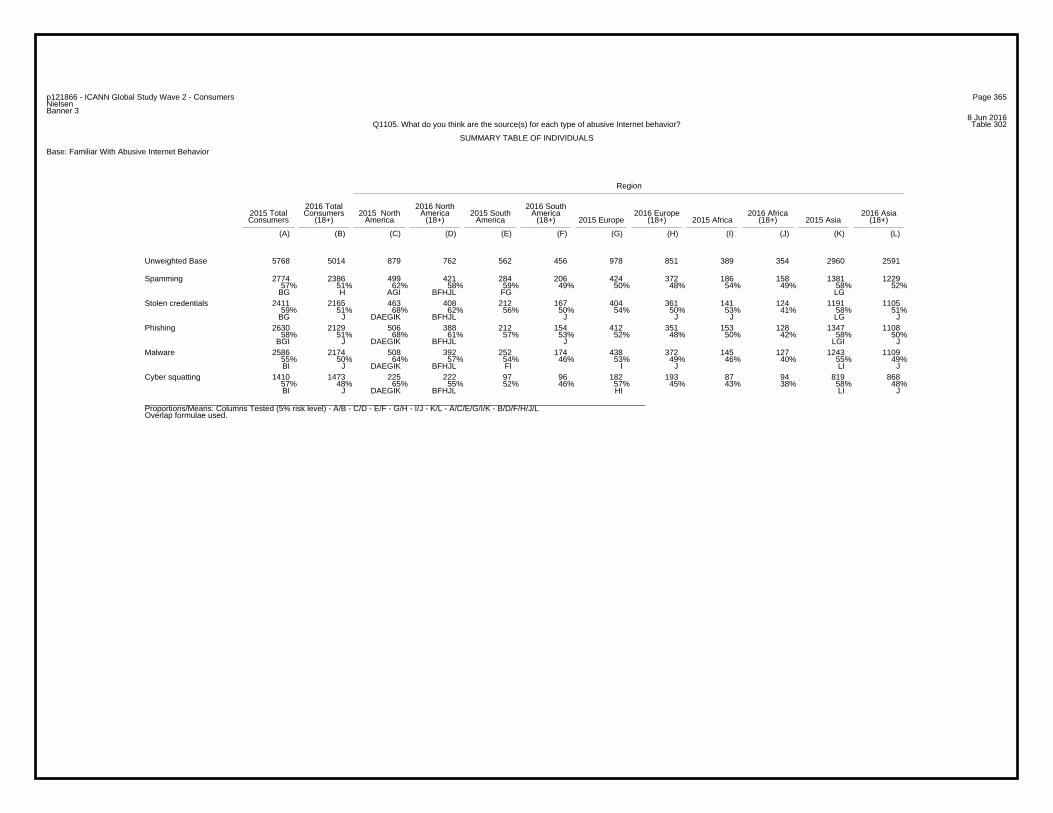
Page 365p121866 - ICANN Global Study Wave 2 - ConsumersNielsenBanner 3
8 Jun 2016Table 302Q1105. What do you think are the source(s) for each type of abusive Internet behavior?
SUMMARY TABLE OF INDIVIDUALS
Base: Familiar With Abusive Internet Behavior
Region
2016 Total 2016 North 2016 South2015 Total Consumers 2015 North America 2015 South America 2016 Europe 2016 Africa 2016 AsiaConsumers (18+) America (18+) America (18+) 2015 Europe (18+) 2015 Africa (18+) 2015 Asia (18+)
(A) (B) (C) (D) (E) (F) (G) (H) (I) (J) (K) (L)
5768 5014 879 762 562 456 978 851 389 354 2960 2591Unweighted Base
2774 2386 499 421 284 206 424 372 186 158 1381 122957% 51% 62% 58% 59% 49% 50% 48% 54% 49% 58% 52%
BG H AGI BFHJL FG LG
Spamming
2411 2165 463 408 212 167 404 361 141 124 1191 110559% 51% 68% 62% 56% 50% 54% 50% 53% 41% 58% 51%
BG J DAEGIK BFHJL J J J LG J
Stolen credentials
2630 2129 506 388 212 154 412 351 153 128 1347 110858% 51% 68% 61% 57% 53% 52% 48% 50% 42% 58% 50%
BGI J DAEGIK BFHJL J LGI J
Phishing
2586 2174 508 392 252 174 438 372 145 127 1243 110955% 50% 64% 57% 54% 46% 53% 49% 46% 40% 55% 49%BI J DAEGIK BFHJL FI I J LI J
Malware
1410 1473 225 222 97 96 182 193 87 94 819 86857% 48% 65% 55% 52% 46% 57% 45% 43% 38% 58% 48%BI J DAEGIK BFHJL HI LI J
Cyber squatting
_________________________________________________________________________________________________________________Proportions/Means: Columns Tested (5% risk level) - A/B - C/D - E/F - G/H - I/J - K/L - A/C/E/G/I/K - B/D/F/H/J/LOverlap formulae used.

Page 366p121866 - ICANN Global Study Wave 2 - ConsumersNielsenBanner 3
8 Jun 2016Table 303Q1105_1. What do you think are the source(s) for each type of abusive Internet behavior?
1. Phishing
Base: Familiar With Abusive Internet Behavior
Region
2016 Total 2016 North 2016 South2015 Total Consumers 2015 North America 2015 South America 2016 Europe 2016 Africa 2016 AsiaConsumers (18+) America (18+) America (18+) 2015 Europe (18+) 2015 Africa (18+) 2015 Asia (18+)
(A) (B) (C) (D) (E) (F) (G) (H) (I) (J) (K) (L)
4558 4169 747 639 372 293 799 726 309 305 2331 2206Unweighted Base
2876 2755 474 417 199 158 541 503 159 156 1503 152163% 66% 63% 65% 53% 54% 68% 69% 51% 51% 64% 69%EI AFJ EI FJ AEI BFJ AEI KBFJ
ORGANIZED GROUPS(NET)
2185 2091 386 342 144 114 404 396 99 101 1152 113848% 50% 52% 54% 39% 39% 51% 55% 32% 33% 49% 52%EI AFJ AEI FJ EI BFJ AEI FJ
Organized groups from within my country
2370 2009 430 331 157 109 480 403 125 110 1178 105652% 48% 58% 52% 42% 37% 60% 56% 40% 36% 51% 48%
BEIK FJ DAEIK BFJ AEIK BFJL EI FJ
Organized groups from outside my country
2630 2129 506 388 212 154 412 351 153 128 1347 110858% 51% 68% 61% 57% 53% 52% 48% 50% 42% 58% 50%
BGI J DAEGIK BFHJL J LGI J
INDIVIDUALS (NET)
2160 1738 452 337 159 106 379 310 123 99 1047 88647% 42% 61% 53% 43% 36% 47% 43% 40% 32% 45% 40%
BIK FJL DAEGIK BFHJL I J L J
Individuals from outside my country
2026 1539 420 303 162 110 321 268 97 78 1026 78044% 37% 56% 47% 44% 38% 40% 37% 31% 26% 44% 35%
BGI JL DAEGIK BFHJL I J I J LI J
Individuals from my country
770 641 127 111 72 53 151 120 73 82 347 27517% 15% 17% 17% 19% 18% 19% 17% 24% 27% 15% 12%K L L K L K L ACK BDFHL L
Don’t know
9511 8018 1815 1424 694 492 1735 1497 517 470 4750 4135209% 192% 243% 223% 187% 168% 217% 206% 167% 154% 204% 187%
Sigma
_________________________________________________________________________________________________________________Proportions/Means: Columns Tested (5% risk level) - A/B - C/D - E/F - G/H - I/J - K/L - A/C/E/G/I/K - B/D/F/H/J/LOverlap formulae used.
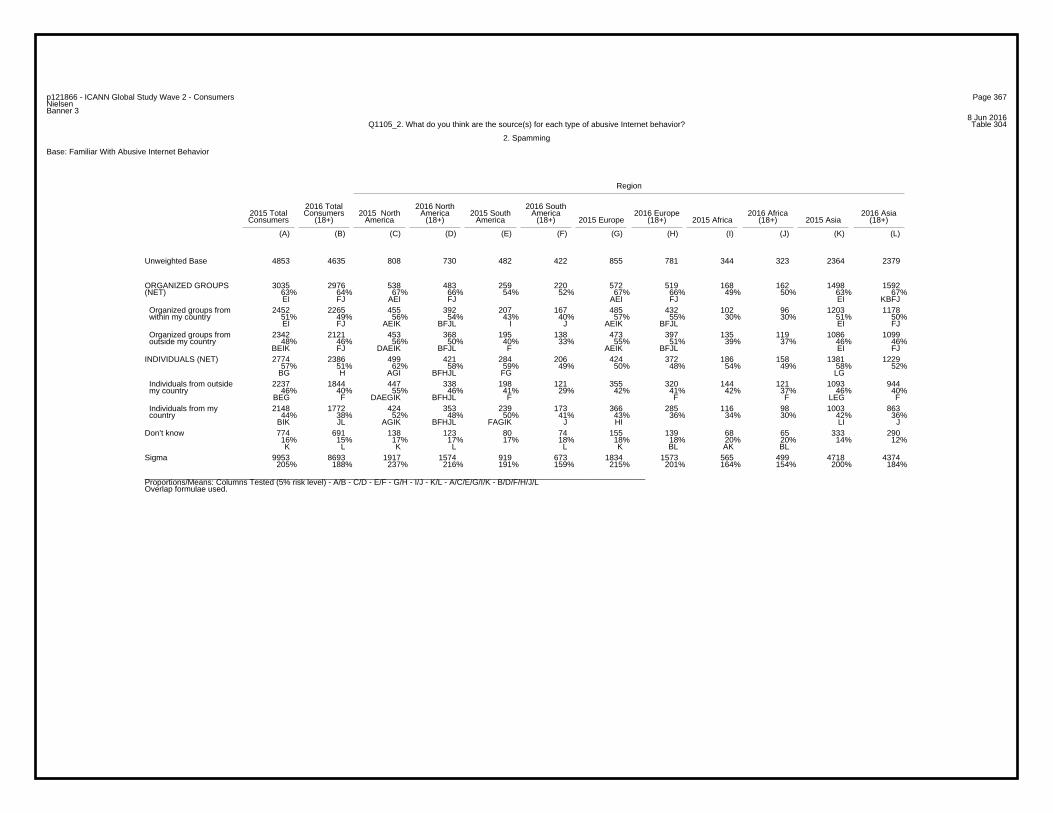
Page 367p121866 - ICANN Global Study Wave 2 - ConsumersNielsenBanner 3
8 Jun 2016Table 304Q1105_2. What do you think are the source(s) for each type of abusive Internet behavior?
2. Spamming
Base: Familiar With Abusive Internet Behavior
Region
2016 Total 2016 North 2016 South2015 Total Consumers 2015 North America 2015 South America 2016 Europe 2016 Africa 2016 AsiaConsumers (18+) America (18+) America (18+) 2015 Europe (18+) 2015 Africa (18+) 2015 Asia (18+)
(A) (B) (C) (D) (E) (F) (G) (H) (I) (J) (K) (L)
4853 4635 808 730 482 422 855 781 344 323 2364 2379Unweighted Base
3035 2976 538 483 259 220 572 519 168 162 1498 159263% 64% 67% 66% 54% 52% 67% 66% 49% 50% 63% 67%EI FJ AEI FJ AEI FJ EI KBFJ
ORGANIZED GROUPS(NET)
2452 2265 455 392 207 167 485 432 102 96 1203 117851% 49% 56% 54% 43% 40% 57% 55% 30% 30% 51% 50%EI FJ AEIK BFJL I J AEIK BFJL EI FJ
Organized groups from within my country
2342 2121 453 368 195 138 473 397 135 119 1086 109948% 46% 56% 50% 40% 33% 55% 51% 39% 37% 46% 46%
BEIK FJ DAEIK BFJL F AEIK BFJL EI FJ
Organized groups from outside my country
2774 2386 499 421 284 206 424 372 186 158 1381 122957% 51% 62% 58% 59% 49% 50% 48% 54% 49% 58% 52%
BG H AGI BFHJL FG LG
INDIVIDUALS (NET)
2237 1844 447 338 198 121 355 320 144 121 1093 94446% 40% 55% 46% 41% 29% 42% 41% 42% 37% 46% 40%
BEG F DAEGIK BFHJL F F F LEG F
Individuals from outside my country
2148 1772 424 353 239 173 366 285 116 98 1003 86344% 38% 52% 48% 50% 41% 43% 36% 34% 30% 42% 36%
BIK JL AGIK BFHJL FAGIK J HI LI J
Individuals from my country
774 691 138 123 80 74 155 139 68 65 333 29016% 15% 17% 17% 17% 18% 18% 18% 20% 20% 14% 12%K L K L L K BL AK BL
Don’t know
9953 8693 1917 1574 919 673 1834 1573 565 499 4718 4374205% 188% 237% 216% 191% 159% 215% 201% 164% 154% 200% 184%
Sigma
_________________________________________________________________________________________________________________Proportions/Means: Columns Tested (5% risk level) - A/B - C/D - E/F - G/H - I/J - K/L - A/C/E/G/I/K - B/D/F/H/J/LOverlap formulae used.
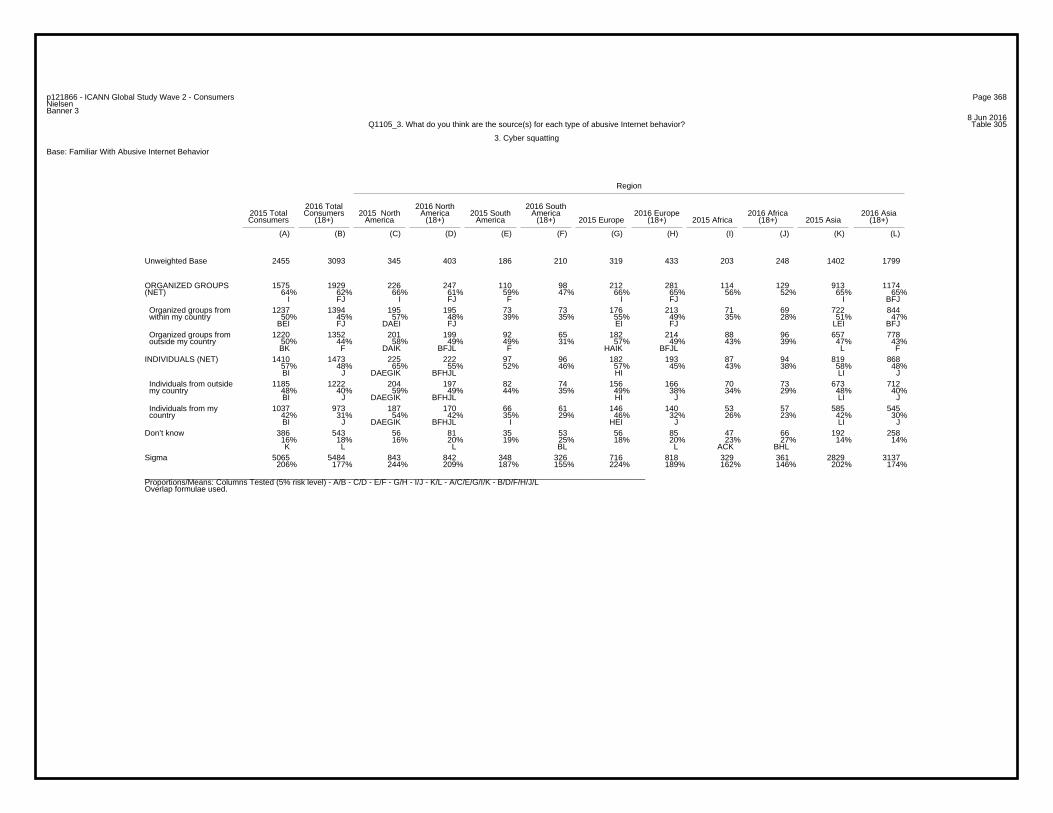
Page 368p121866 - ICANN Global Study Wave 2 - ConsumersNielsenBanner 3
8 Jun 2016Table 305Q1105_3. What do you think are the source(s) for each type of abusive Internet behavior?
3. Cyber squatting
Base: Familiar With Abusive Internet Behavior
Region
2016 Total 2016 North 2016 South2015 Total Consumers 2015 North America 2015 South America 2016 Europe 2016 Africa 2016 AsiaConsumers (18+) America (18+) America (18+) 2015 Europe (18+) 2015 Africa (18+) 2015 Asia (18+)
(A) (B) (C) (D) (E) (F) (G) (H) (I) (J) (K) (L)
2455 3093 345 403 186 210 319 433 203 248 1402 1799Unweighted Base
1575 1929 226 247 110 98 212 281 114 129 913 117464% 62% 66% 61% 59% 47% 66% 65% 56% 52% 65% 65%
I FJ I FJ F I FJ I BFJ
ORGANIZED GROUPS(NET)
1237 1394 195 195 73 73 176 213 71 69 722 84450% 45% 57% 48% 39% 35% 55% 49% 35% 28% 51% 47%
BEI FJ DAEI FJ EI FJ LEI BFJ
Organized groups from within my country
1220 1352 201 199 92 65 182 214 88 96 657 77850% 44% 58% 49% 49% 31% 57% 49% 43% 39% 47% 43%BK F DAIK BFJL F HAIK BFJL L F
Organized groups from outside my country
1410 1473 225 222 97 96 182 193 87 94 819 86857% 48% 65% 55% 52% 46% 57% 45% 43% 38% 58% 48%BI J DAEGIK BFHJL HI LI J
INDIVIDUALS (NET)
1185 1222 204 197 82 74 156 166 70 73 673 71248% 40% 59% 49% 44% 35% 49% 38% 34% 29% 48% 40%BI J DAEGIK BFHJL HI J LI J
Individuals from outside my country
1037 973 187 170 66 61 146 140 53 57 585 54542% 31% 54% 42% 35% 29% 46% 32% 26% 23% 42% 30%BI J DAEGIK BFHJL I HEI J LI J
Individuals from my country
386 543 56 81 35 53 56 85 47 66 192 25816% 18% 16% 20% 19% 25% 18% 20% 23% 27% 14% 14%K L L BL L ACK BHL
Don’t know
5065 5484 843 842 348 326 716 818 329 361 2829 3137206% 177% 244% 209% 187% 155% 224% 189% 162% 146% 202% 174%
Sigma
_________________________________________________________________________________________________________________Proportions/Means: Columns Tested (5% risk level) - A/B - C/D - E/F - G/H - I/J - K/L - A/C/E/G/I/K - B/D/F/H/J/LOverlap formulae used.
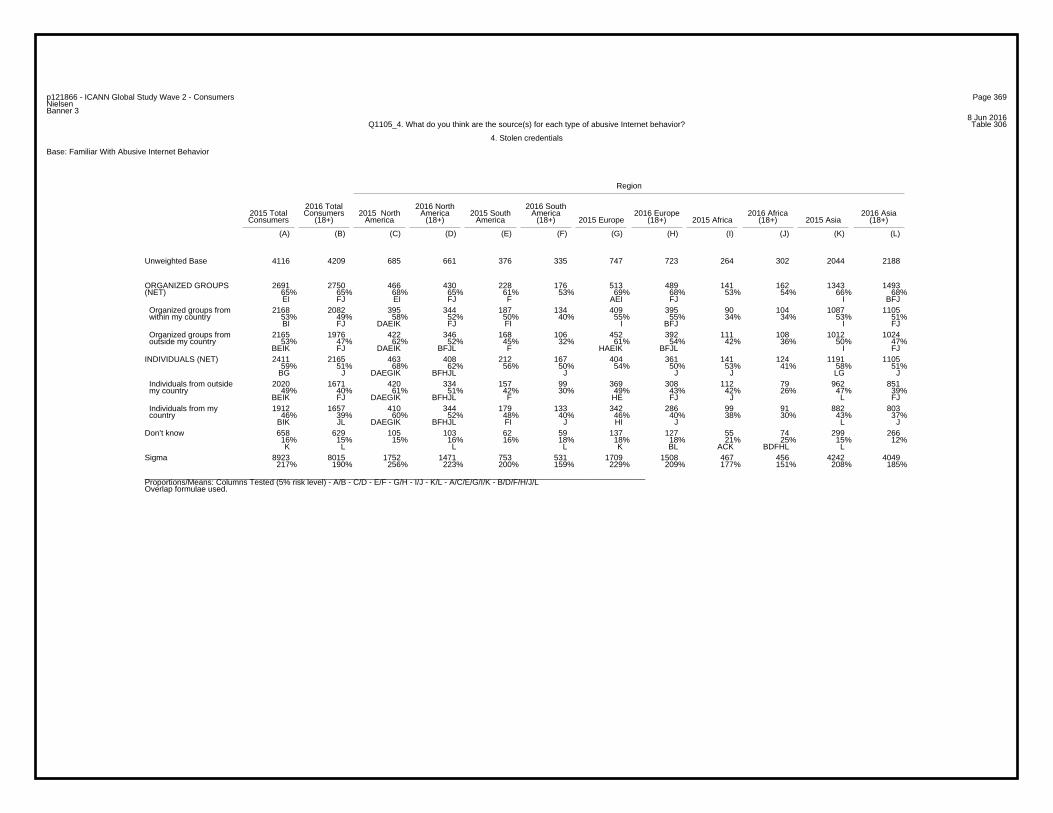
Page 369p121866 - ICANN Global Study Wave 2 - ConsumersNielsenBanner 3
8 Jun 2016Table 306Q1105_4. What do you think are the source(s) for each type of abusive Internet behavior?
4. Stolen credentials
Base: Familiar With Abusive Internet Behavior
Region
2016 Total 2016 North 2016 South2015 Total Consumers 2015 North America 2015 South America 2016 Europe 2016 Africa 2016 AsiaConsumers (18+) America (18+) America (18+) 2015 Europe (18+) 2015 Africa (18+) 2015 Asia (18+)
(A) (B) (C) (D) (E) (F) (G) (H) (I) (J) (K) (L)
4116 4209 685 661 376 335 747 723 264 302 2044 2188Unweighted Base
2691 2750 466 430 228 176 513 489 141 162 1343 149365% 65% 68% 65% 61% 53% 69% 68% 53% 54% 66% 68%EI FJ EI FJ F AEI FJ I BFJ
ORGANIZED GROUPS(NET)
2168 2082 395 344 187 134 409 395 90 104 1087 110553% 49% 58% 52% 50% 40% 55% 55% 34% 34% 53% 51%BI FJ DAEIK FJ FI I BFJ I FJ
Organized groups from within my country
2165 1976 422 346 168 106 452 392 111 108 1012 102453% 47% 62% 52% 45% 32% 61% 54% 42% 36% 50% 47%
BEIK FJ DAEIK BFJL F HAEIK BFJL I FJ
Organized groups from outside my country
2411 2165 463 408 212 167 404 361 141 124 1191 110559% 51% 68% 62% 56% 50% 54% 50% 53% 41% 58% 51%
BG J DAEGIK BFHJL J J J LG J
INDIVIDUALS (NET)
2020 1671 420 334 157 99 369 308 112 79 962 85149% 40% 61% 51% 42% 30% 49% 43% 42% 26% 47% 39%
BEIK FJ DAEGIK BFHJL F HE FJ J L FJ
Individuals from outside my country
1912 1657 410 344 179 133 342 286 99 91 882 80346% 39% 60% 52% 48% 40% 46% 40% 38% 30% 43% 37%
BIK JL DAEGIK BFHJL FI J HI J L J
Individuals from my country
658 629 105 103 62 59 137 127 55 74 299 26616% 15% 15% 16% 16% 18% 18% 18% 21% 25% 15% 12%K L L L K BL ACK BDFHL L
Don’t know
8923 8015 1752 1471 753 531 1709 1508 467 456 4242 4049217% 190% 256% 223% 200% 159% 229% 209% 177% 151% 208% 185%
Sigma
_________________________________________________________________________________________________________________Proportions/Means: Columns Tested (5% risk level) - A/B - C/D - E/F - G/H - I/J - K/L - A/C/E/G/I/K - B/D/F/H/J/LOverlap formulae used.

Page 370p121866 - ICANN Global Study Wave 2 - ConsumersNielsenBanner 3
8 Jun 2016Table 307Q1105_5. What do you think are the source(s) for each type of abusive Internet behavior?
5. Malware
Base: Familiar With Abusive Internet Behavior
Region
2016 Total 2016 North 2016 South2015 Total Consumers 2015 North America 2015 South America 2016 Europe 2016 Africa 2016 AsiaConsumers (18+) America (18+) America (18+) 2015 Europe (18+) 2015 Africa (18+) 2015 Asia (18+)
(A) (B) (C) (D) (E) (F) (G) (H) (I) (J) (K) (L)
4670 4385 794 684 463 381 823 754 313 318 2277 2248Unweighted Base
3114 2875 551 449 277 206 561 509 174 176 1551 153567% 66% 69% 66% 60% 54% 68% 68% 56% 55% 68% 68%EI FJ EI FJ EI FJ AEI BFJ
ORGANIZED GROUPS(NET)
2585 2225 493 377 230 153 492 415 154 146 1216 113455% 51% 62% 55% 50% 40% 60% 55% 49% 46% 53% 50%
BEIK F DAEIK BFJL F AEIK BFJL L F
Organized groups from outside my country
2389 2026 446 329 206 130 446 410 85 82 1206 107551% 46% 56% 48% 44% 34% 54% 54% 27% 26% 53% 48%
BEI FJ DAEI FJ FI J EI BDFJL LAEI BFJ
Organized groups from within my country
2586 2174 508 392 252 174 438 372 145 127 1243 110955% 50% 64% 57% 54% 46% 53% 49% 46% 40% 55% 49%BI J DAEGIK BFHJL FI I J LI J
INDIVIDUALS (NET)
2236 1807 459 346 205 124 397 325 129 109 1046 90348% 41% 58% 51% 44% 33% 48% 43% 41% 34% 46% 40%
BIK FJ DAEGIK BFHJL F HI FJ L FJ
Individuals from outside my country
1984 1533 432 306 200 123 362 286 85 61 905 75742% 35% 54% 45% 43% 32% 44% 38% 27% 19% 40% 34%
BIK J DAEGIK BFHJL FI J HIK JL J LI J
Individuals from my country
811 701 129 120 85 79 160 132 71 76 366 29417% 16% 16% 18% 18% 21% 19% 18% 23% 24% 16% 13%K L L BL K L ACK BDHL L
Don’t know
10005 8292 1959 1478 926 609 1857 1568 524 474 4739 4163214% 189% 247% 216% 200% 160% 226% 208% 167% 149% 208% 185%
Sigma
_________________________________________________________________________________________________________________Proportions/Means: Columns Tested (5% risk level) - A/B - C/D - E/F - G/H - I/J - K/L - A/C/E/G/I/K - B/D/F/H/J/LOverlap formulae used.
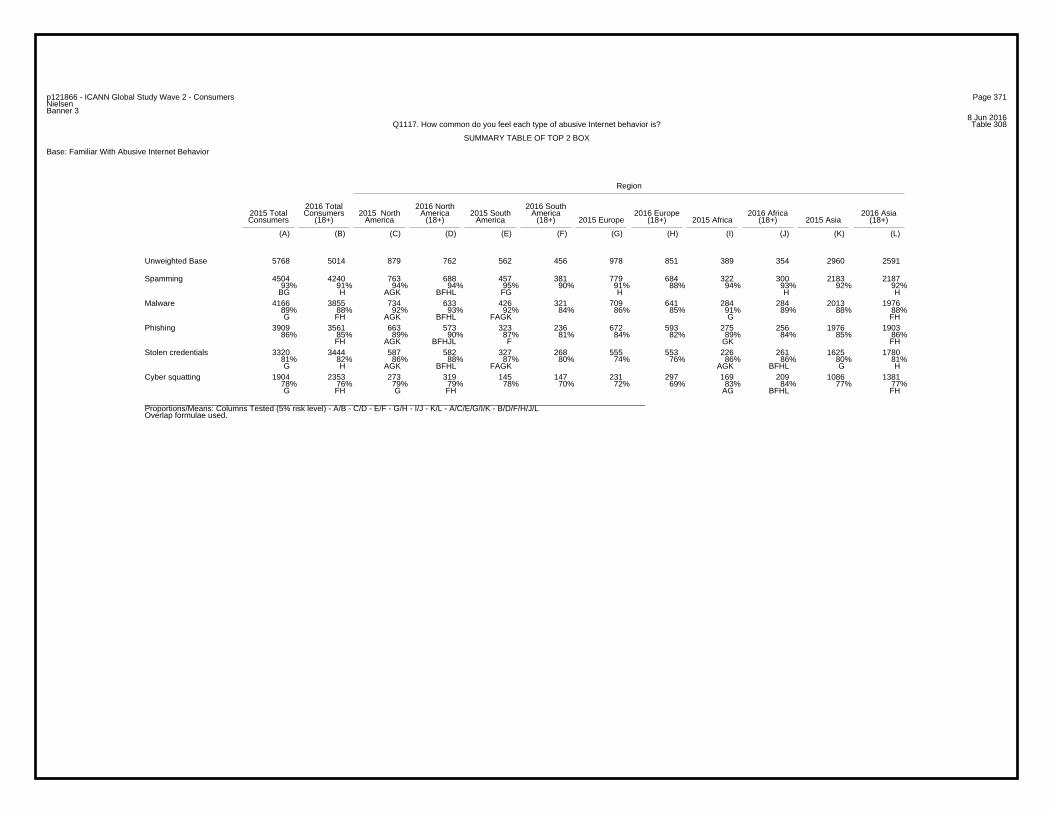
Page 371p121866 - ICANN Global Study Wave 2 - ConsumersNielsenBanner 3
8 Jun 2016Table 308Q1117. How common do you feel each type of abusive Internet behavior is?
SUMMARY TABLE OF TOP 2 BOX
Base: Familiar With Abusive Internet Behavior
Region
2016 Total 2016 North 2016 South2015 Total Consumers 2015 North America 2015 South America 2016 Europe 2016 Africa 2016 AsiaConsumers (18+) America (18+) America (18+) 2015 Europe (18+) 2015 Africa (18+) 2015 Asia (18+)
(A) (B) (C) (D) (E) (F) (G) (H) (I) (J) (K) (L)
5768 5014 879 762 562 456 978 851 389 354 2960 2591Unweighted Base
4504 4240 763 688 457 381 779 684 322 300 2183 218793% 91% 94% 94% 95% 90% 91% 88% 94% 93% 92% 92%
BG H AGK BFHL FG H H H
Spamming
4166 3855 734 633 426 321 709 641 284 284 2013 197689% 88% 92% 93% 92% 84% 86% 85% 91% 89% 88% 88%G FH AGK BFHL FAGK G FH
Malware
3909 3561 663 573 323 236 672 593 275 256 1976 190386% 85% 89% 90% 87% 81% 84% 82% 89% 84% 85% 86%
FH AGK BFHJL F GK FH
Phishing
3320 3444 587 582 327 268 555 553 226 261 1625 178081% 82% 86% 88% 87% 80% 74% 76% 86% 86% 80% 81%G H AGK BFHL FAGK AGK BFHL G H
Stolen credentials
1904 2353 273 319 145 147 231 297 169 209 1086 138178% 76% 79% 79% 78% 70% 72% 69% 83% 84% 77% 77%G FH G FH AG BFHL FH
Cyber squatting
_________________________________________________________________________________________________________________Proportions/Means: Columns Tested (5% risk level) - A/B - C/D - E/F - G/H - I/J - K/L - A/C/E/G/I/K - B/D/F/H/J/LOverlap formulae used.
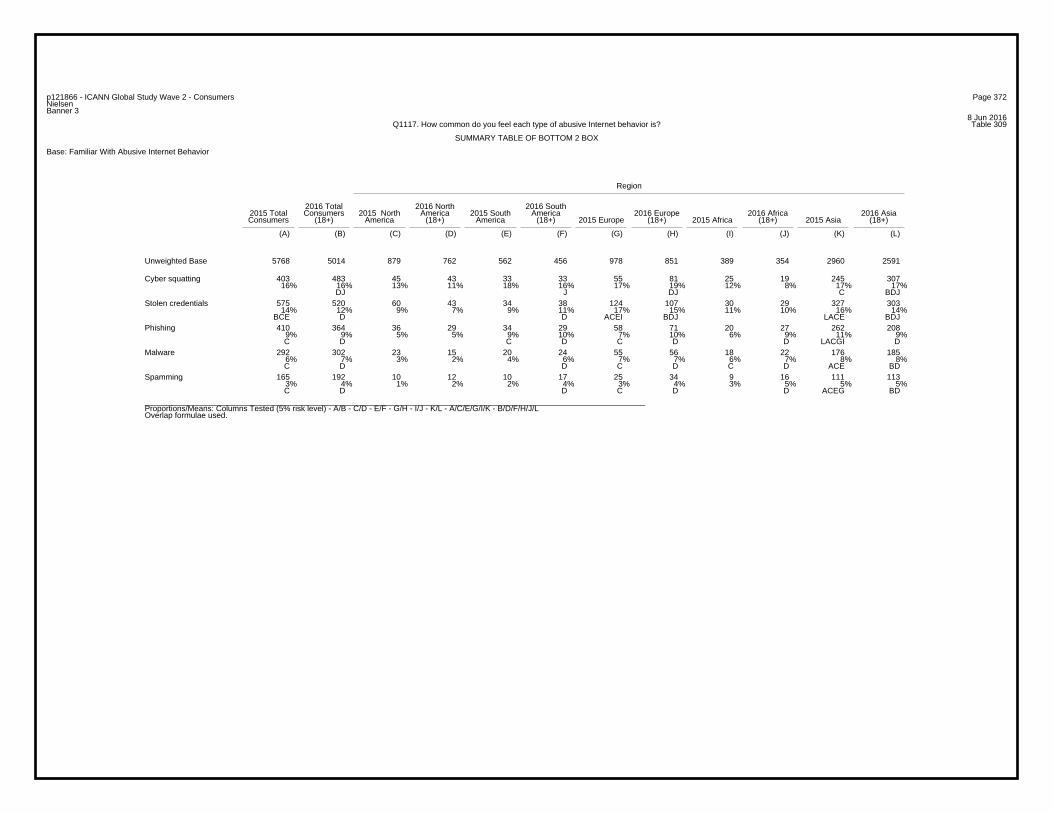
Page 372p121866 - ICANN Global Study Wave 2 - ConsumersNielsenBanner 3
8 Jun 2016Table 309Q1117. How common do you feel each type of abusive Internet behavior is?
SUMMARY TABLE OF BOTTOM 2 BOX
Base: Familiar With Abusive Internet Behavior
Region
2016 Total 2016 North 2016 South2015 Total Consumers 2015 North America 2015 South America 2016 Europe 2016 Africa 2016 AsiaConsumers (18+) America (18+) America (18+) 2015 Europe (18+) 2015 Africa (18+) 2015 Asia (18+)
(A) (B) (C) (D) (E) (F) (G) (H) (I) (J) (K) (L)
5768 5014 879 762 562 456 978 851 389 354 2960 2591Unweighted Base
403 483 45 43 33 33 55 81 25 19 245 30716% 16% 13% 11% 18% 16% 17% 19% 12% 8% 17% 17%
DJ J DJ C BDJ
Cyber squatting
575 520 60 43 34 38 124 107 30 29 327 30314% 12% 9% 7% 9% 11% 17% 15% 11% 10% 16% 14%
BCE D D ACEI BDJ LACE BDJ
Stolen credentials
410 364 36 29 34 29 58 71 20 27 262 2089% 9% 5% 5% 9% 10% 7% 10% 6% 9% 11% 9%C D C D C D D LACGI D
Phishing
292 302 23 15 20 24 55 56 18 22 176 1856% 7% 3% 2% 4% 6% 7% 7% 6% 7% 8% 8%C D D C D C D ACE BD
Malware
165 192 10 12 10 17 25 34 9 16 111 1133% 4% 1% 2% 2% 4% 3% 4% 3% 5% 5% 5%C D D C D D ACEG BD
Spamming
_________________________________________________________________________________________________________________Proportions/Means: Columns Tested (5% risk level) - A/B - C/D - E/F - G/H - I/J - K/L - A/C/E/G/I/K - B/D/F/H/J/LOverlap formulae used.
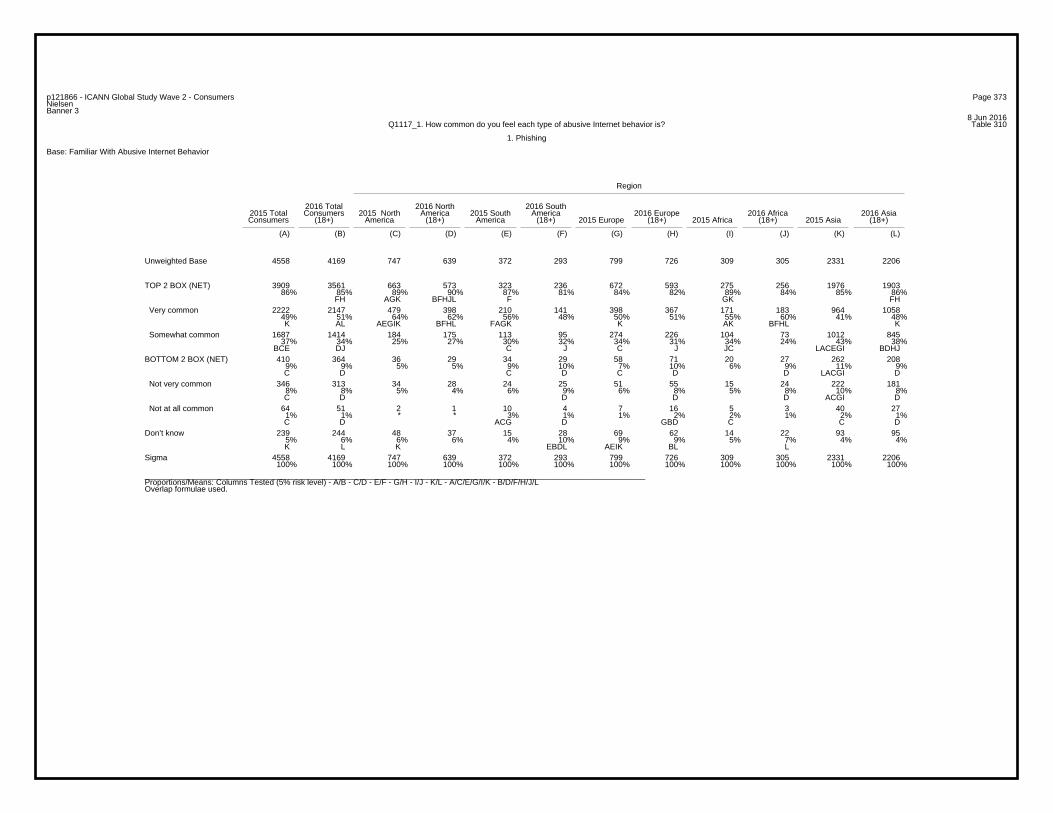
Page 373p121866 - ICANN Global Study Wave 2 - ConsumersNielsenBanner 3
8 Jun 2016Table 310Q1117_1. How common do you feel each type of abusive Internet behavior is?
1. Phishing
Base: Familiar With Abusive Internet Behavior
Region
2016 Total 2016 North 2016 South2015 Total Consumers 2015 North America 2015 South America 2016 Europe 2016 Africa 2016 AsiaConsumers (18+) America (18+) America (18+) 2015 Europe (18+) 2015 Africa (18+) 2015 Asia (18+)
(A) (B) (C) (D) (E) (F) (G) (H) (I) (J) (K) (L)
4558 4169 747 639 372 293 799 726 309 305 2331 2206Unweighted Base
3909 3561 663 573 323 236 672 593 275 256 1976 190386% 85% 89% 90% 87% 81% 84% 82% 89% 84% 85% 86%
FH AGK BFHJL F GK FH
TOP 2 BOX (NET)
2222 2147 479 398 210 141 398 367 171 183 964 105849% 51% 64% 62% 56% 48% 50% 51% 55% 60% 41% 48%K AL AEGIK BFHL FAGK K AK BFHL K
Very common
1687 1414 184 175 113 95 274 226 104 73 1012 84537% 34% 25% 27% 30% 32% 34% 31% 34% 24% 43% 38%
BCE DJ C J C J JC LACEGI BDHJ
Somewhat common
410 364 36 29 34 29 58 71 20 27 262 2089% 9% 5% 5% 9% 10% 7% 10% 6% 9% 11% 9%C D C D C D D LACGI D
BOTTOM 2 BOX (NET)
346 313 34 28 24 25 51 55 15 24 222 1818% 8% 5% 4% 6% 9% 6% 8% 5% 8% 10% 8%C D D D D ACGI D
Not very common
64 51 2 1 10 4 7 16 5 3 40 271% 1% * * 3% 1% 1% 2% 2% 1% 2% 1%C D ACG D GBD C C D
Not at all common
239 244 48 37 15 28 69 62 14 22 93 955% 6% 6% 6% 4% 10% 9% 9% 5% 7% 4% 4%K L K EBDL AEIK BL L
Don’t know
4558 4169 747 639 372 293 799 726 309 305 2331 2206100% 100% 100% 100% 100% 100% 100% 100% 100% 100% 100% 100%
Sigma
_________________________________________________________________________________________________________________Proportions/Means: Columns Tested (5% risk level) - A/B - C/D - E/F - G/H - I/J - K/L - A/C/E/G/I/K - B/D/F/H/J/LOverlap formulae used.
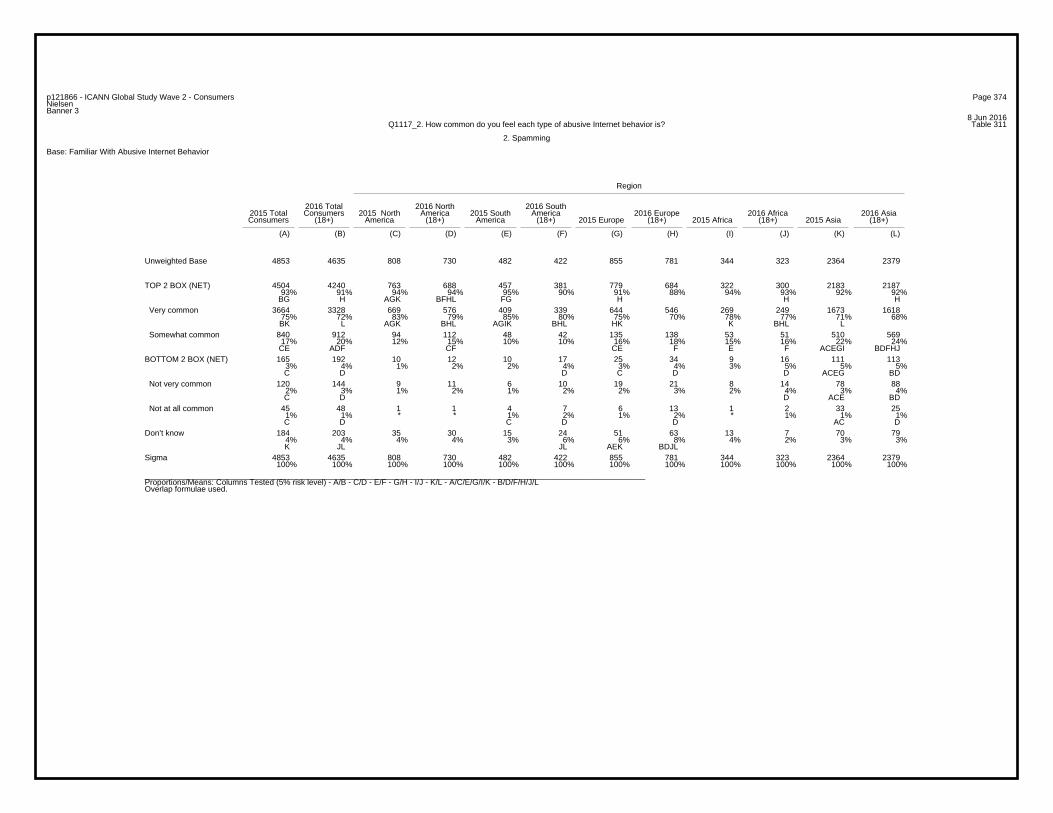
Page 374p121866 - ICANN Global Study Wave 2 - ConsumersNielsenBanner 3
8 Jun 2016Table 311Q1117_2. How common do you feel each type of abusive Internet behavior is?
2. Spamming
Base: Familiar With Abusive Internet Behavior
Region
2016 Total 2016 North 2016 South2015 Total Consumers 2015 North America 2015 South America 2016 Europe 2016 Africa 2016 AsiaConsumers (18+) America (18+) America (18+) 2015 Europe (18+) 2015 Africa (18+) 2015 Asia (18+)
(A) (B) (C) (D) (E) (F) (G) (H) (I) (J) (K) (L)
4853 4635 808 730 482 422 855 781 344 323 2364 2379Unweighted Base
4504 4240 763 688 457 381 779 684 322 300 2183 218793% 91% 94% 94% 95% 90% 91% 88% 94% 93% 92% 92%
BG H AGK BFHL FG H H H
TOP 2 BOX (NET)
3664 3328 669 576 409 339 644 546 269 249 1673 161875% 72% 83% 79% 85% 80% 75% 70% 78% 77% 71% 68%BK L AGK BHL AGIK BHL HK K BHL L
Very common
840 912 94 112 48 42 135 138 53 51 510 56917% 20% 12% 15% 10% 10% 16% 18% 15% 16% 22% 24%CE ADF CF CE F E F ACEGI BDFHJ
Somewhat common
165 192 10 12 10 17 25 34 9 16 111 1133% 4% 1% 2% 2% 4% 3% 4% 3% 5% 5% 5%C D D C D D ACEG BD
BOTTOM 2 BOX (NET)
120 144 9 11 6 10 19 21 8 14 78 882% 3% 1% 2% 1% 2% 2% 3% 2% 4% 3% 4%C D D ACE BD
Not very common
45 48 1 1 4 7 6 13 1 2 33 251% 1% * * 1% 2% 1% 2% * 1% 1% 1%C D C D D AC D
Not at all common
184 203 35 30 15 24 51 63 13 7 70 794% 4% 4% 4% 3% 6% 6% 8% 4% 2% 3% 3%K JL JL AEK BDJL
Don’t know
4853 4635 808 730 482 422 855 781 344 323 2364 2379100% 100% 100% 100% 100% 100% 100% 100% 100% 100% 100% 100%
Sigma
_________________________________________________________________________________________________________________Proportions/Means: Columns Tested (5% risk level) - A/B - C/D - E/F - G/H - I/J - K/L - A/C/E/G/I/K - B/D/F/H/J/LOverlap formulae used.
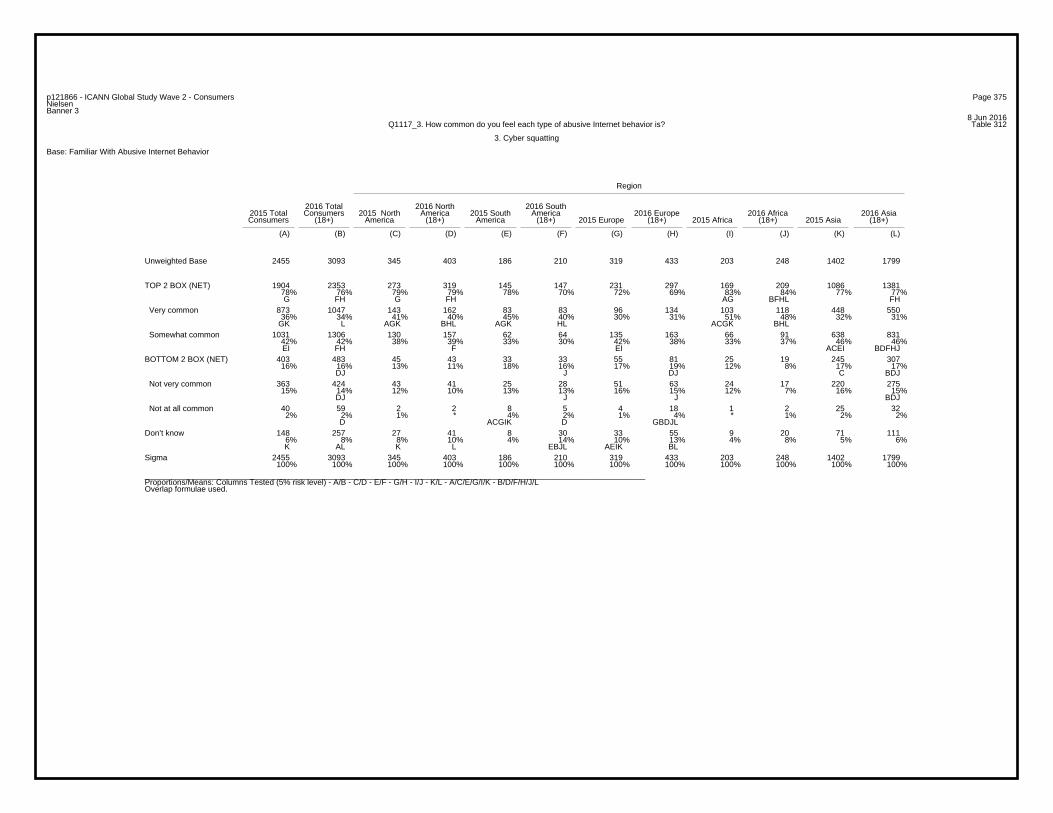
Page 375p121866 - ICANN Global Study Wave 2 - ConsumersNielsenBanner 3
8 Jun 2016Table 312Q1117_3. How common do you feel each type of abusive Internet behavior is?
3. Cyber squatting
Base: Familiar With Abusive Internet Behavior
Region
2016 Total 2016 North 2016 South2015 Total Consumers 2015 North America 2015 South America 2016 Europe 2016 Africa 2016 AsiaConsumers (18+) America (18+) America (18+) 2015 Europe (18+) 2015 Africa (18+) 2015 Asia (18+)
(A) (B) (C) (D) (E) (F) (G) (H) (I) (J) (K) (L)
2455 3093 345 403 186 210 319 433 203 248 1402 1799Unweighted Base
1904 2353 273 319 145 147 231 297 169 209 1086 138178% 76% 79% 79% 78% 70% 72% 69% 83% 84% 77% 77%G FH G FH AG BFHL FH
TOP 2 BOX (NET)
873 1047 143 162 83 83 96 134 103 118 448 55036% 34% 41% 40% 45% 40% 30% 31% 51% 48% 32% 31%
GK L AGK BHL AGK HL ACGK BHL
Very common
1031 1306 130 157 62 64 135 163 66 91 638 83142% 42% 38% 39% 33% 30% 42% 38% 33% 37% 46% 46%EI FH F EI ACEI BDFHJ
Somewhat common
403 483 45 43 33 33 55 81 25 19 245 30716% 16% 13% 11% 18% 16% 17% 19% 12% 8% 17% 17%
DJ J DJ C BDJ
BOTTOM 2 BOX (NET)
363 424 43 41 25 28 51 63 24 17 220 27515% 14% 12% 10% 13% 13% 16% 15% 12% 7% 16% 15%
DJ J J BDJ
Not very common
40 59 2 2 8 5 4 18 1 2 25 322% 2% 1% * 4% 2% 1% 4% * 1% 2% 2%
D ACGIK D GBDJL
Not at all common
148 257 27 41 8 30 33 55 9 20 71 1116% 8% 8% 10% 4% 14% 10% 13% 4% 8% 5% 6%K AL K L EBJL AEIK BL
Don’t know
2455 3093 345 403 186 210 319 433 203 248 1402 1799100% 100% 100% 100% 100% 100% 100% 100% 100% 100% 100% 100%
Sigma
_________________________________________________________________________________________________________________Proportions/Means: Columns Tested (5% risk level) - A/B - C/D - E/F - G/H - I/J - K/L - A/C/E/G/I/K - B/D/F/H/J/LOverlap formulae used.
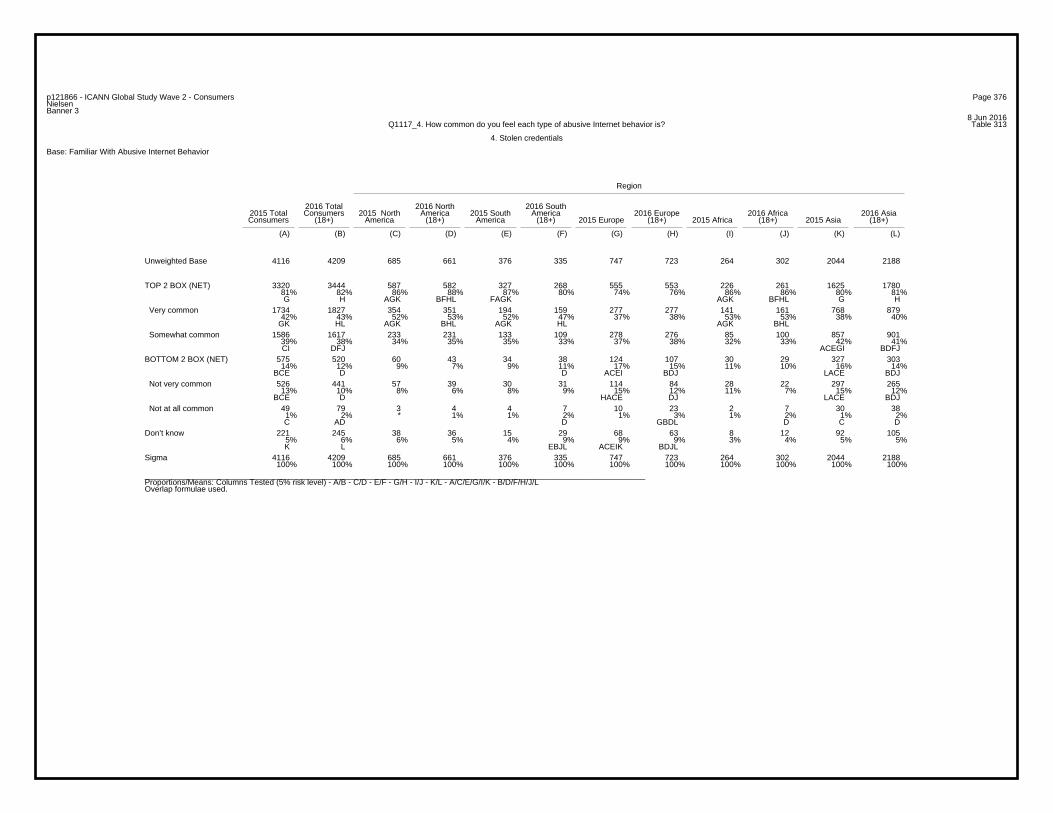
Page 376p121866 - ICANN Global Study Wave 2 - ConsumersNielsenBanner 3
8 Jun 2016Table 313Q1117_4. How common do you feel each type of abusive Internet behavior is?
4. Stolen credentials
Base: Familiar With Abusive Internet Behavior
Region
2016 Total 2016 North 2016 South2015 Total Consumers 2015 North America 2015 South America 2016 Europe 2016 Africa 2016 AsiaConsumers (18+) America (18+) America (18+) 2015 Europe (18+) 2015 Africa (18+) 2015 Asia (18+)
(A) (B) (C) (D) (E) (F) (G) (H) (I) (J) (K) (L)
4116 4209 685 661 376 335 747 723 264 302 2044 2188Unweighted Base
3320 3444 587 582 327 268 555 553 226 261 1625 178081% 82% 86% 88% 87% 80% 74% 76% 86% 86% 80% 81%G H AGK BFHL FAGK AGK BFHL G H
TOP 2 BOX (NET)
1734 1827 354 351 194 159 277 277 141 161 768 87942% 43% 52% 53% 52% 47% 37% 38% 53% 53% 38% 40%
GK HL AGK BHL AGK HL AGK BHL
Very common
1586 1617 233 231 133 109 278 276 85 100 857 90139% 38% 34% 35% 35% 33% 37% 38% 32% 33% 42% 41%CI DFJ ACEGI BDFJ
Somewhat common
575 520 60 43 34 38 124 107 30 29 327 30314% 12% 9% 7% 9% 11% 17% 15% 11% 10% 16% 14%
BCE D D ACEI BDJ LACE BDJ
BOTTOM 2 BOX (NET)
526 441 57 39 30 31 114 84 28 22 297 26513% 10% 8% 6% 8% 9% 15% 12% 11% 7% 15% 12%
BCE D HACE DJ LACE BDJ
Not very common
49 79 3 4 4 7 10 23 2 7 30 381% 2% * 1% 1% 2% 1% 3% 1% 2% 1% 2%C AD D GBDL D C D
Not at all common
221 245 38 36 15 29 68 63 8 12 92 1055% 6% 6% 5% 4% 9% 9% 9% 3% 4% 5% 5%K L EBJL ACEIK BDJL
Don’t know
4116 4209 685 661 376 335 747 723 264 302 2044 2188100% 100% 100% 100% 100% 100% 100% 100% 100% 100% 100% 100%
Sigma
_________________________________________________________________________________________________________________Proportions/Means: Columns Tested (5% risk level) - A/B - C/D - E/F - G/H - I/J - K/L - A/C/E/G/I/K - B/D/F/H/J/LOverlap formulae used.
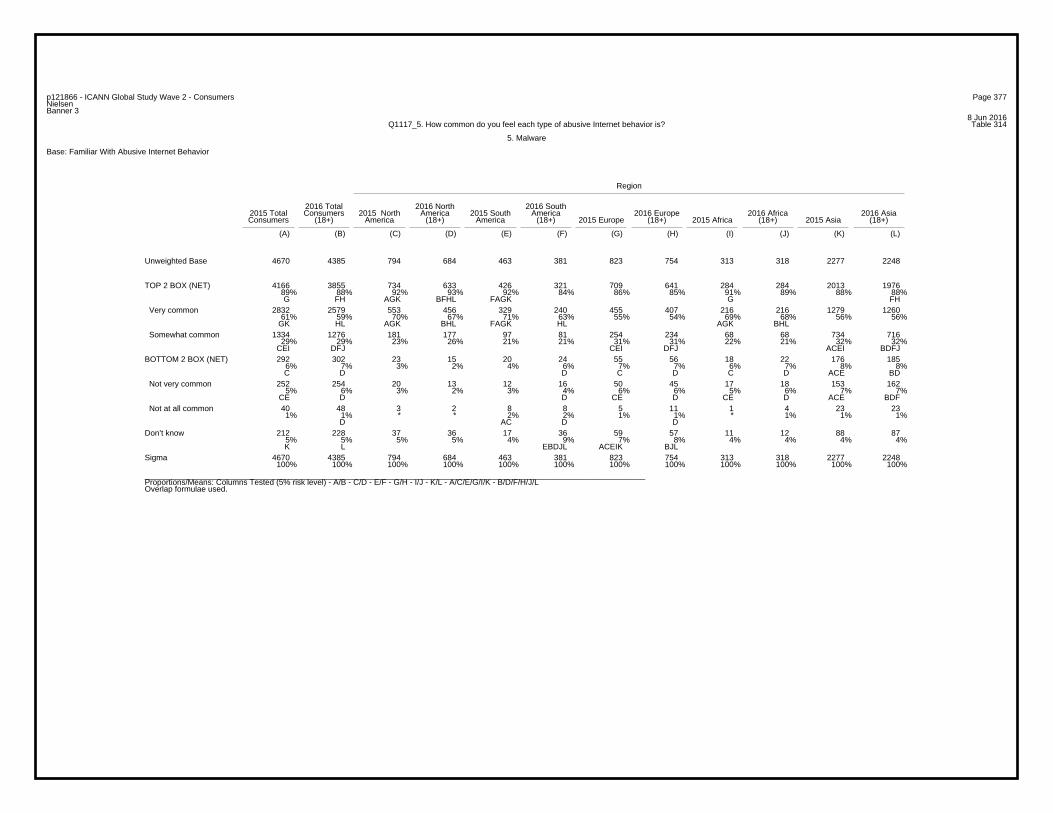
Page 377p121866 - ICANN Global Study Wave 2 - ConsumersNielsenBanner 3
8 Jun 2016Table 314Q1117_5. How common do you feel each type of abusive Internet behavior is?
5. Malware
Base: Familiar With Abusive Internet Behavior
Region
2016 Total 2016 North 2016 South2015 Total Consumers 2015 North America 2015 South America 2016 Europe 2016 Africa 2016 AsiaConsumers (18+) America (18+) America (18+) 2015 Europe (18+) 2015 Africa (18+) 2015 Asia (18+)
(A) (B) (C) (D) (E) (F) (G) (H) (I) (J) (K) (L)
4670 4385 794 684 463 381 823 754 313 318 2277 2248Unweighted Base
4166 3855 734 633 426 321 709 641 284 284 2013 197689% 88% 92% 93% 92% 84% 86% 85% 91% 89% 88% 88%G FH AGK BFHL FAGK G FH
TOP 2 BOX (NET)
2832 2579 553 456 329 240 455 407 216 216 1279 126061% 59% 70% 67% 71% 63% 55% 54% 69% 68% 56% 56%
GK HL AGK BHL FAGK HL AGK BHL
Very common
1334 1276 181 177 97 81 254 234 68 68 734 71629% 29% 23% 26% 21% 21% 31% 31% 22% 21% 32% 32%
CEI DFJ CEI DFJ ACEI BDFJ
Somewhat common
292 302 23 15 20 24 55 56 18 22 176 1856% 7% 3% 2% 4% 6% 7% 7% 6% 7% 8% 8%C D D C D C D ACE BD
BOTTOM 2 BOX (NET)
252 254 20 13 12 16 50 45 17 18 153 1625% 6% 3% 2% 3% 4% 6% 6% 5% 6% 7% 7%
CE D D CE D CE D ACE BDF
Not very common
40 48 3 2 8 8 5 11 1 4 23 231% 1% * * 2% 2% 1% 1% * 1% 1% 1%
D AC D D
Not at all common
212 228 37 36 17 36 59 57 11 12 88 875% 5% 5% 5% 4% 9% 7% 8% 4% 4% 4% 4%K L EBDJL ACEIK BJL
Don’t know
4670 4385 794 684 463 381 823 754 313 318 2277 2248100% 100% 100% 100% 100% 100% 100% 100% 100% 100% 100% 100%
Sigma
_________________________________________________________________________________________________________________Proportions/Means: Columns Tested (5% risk level) - A/B - C/D - E/F - G/H - I/J - K/L - A/C/E/G/I/K - B/D/F/H/J/LOverlap formulae used.
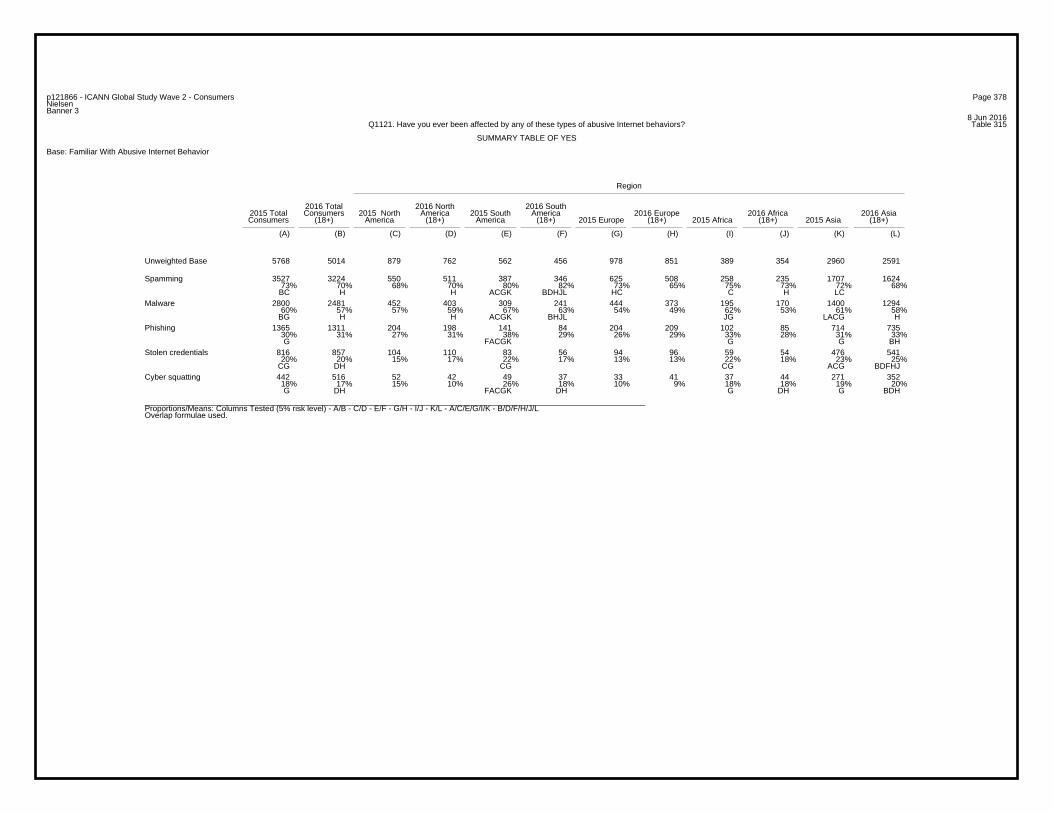
Page 378p121866 - ICANN Global Study Wave 2 - ConsumersNielsenBanner 3
8 Jun 2016Table 315Q1121. Have you ever been affected by any of these types of abusive Internet behaviors?
SUMMARY TABLE OF YES
Base: Familiar With Abusive Internet Behavior
Region
2016 Total 2016 North 2016 South2015 Total Consumers 2015 North America 2015 South America 2016 Europe 2016 Africa 2016 AsiaConsumers (18+) America (18+) America (18+) 2015 Europe (18+) 2015 Africa (18+) 2015 Asia (18+)
(A) (B) (C) (D) (E) (F) (G) (H) (I) (J) (K) (L)
5768 5014 879 762 562 456 978 851 389 354 2960 2591Unweighted Base
3527 3224 550 511 387 346 625 508 258 235 1707 162473% 70% 68% 70% 80% 82% 73% 65% 75% 73% 72% 68%BC H H ACGK BDHJL HC C H LC
Spamming
2800 2481 452 403 309 241 444 373 195 170 1400 129460% 57% 57% 59% 67% 63% 54% 49% 62% 53% 61% 58%
BG H H ACGK BHJL JG LACG H
Malware
1365 1311 204 198 141 84 204 209 102 85 714 73530% 31% 27% 31% 38% 29% 26% 29% 33% 28% 31% 33%G FACGK G G BH
Phishing
816 857 104 110 83 56 94 96 59 54 476 54120% 20% 15% 17% 22% 17% 13% 13% 22% 18% 23% 25%
CG DH CG CG ACG BDFHJ
Stolen credentials
442 516 52 42 49 37 33 41 37 44 271 35218% 17% 15% 10% 26% 18% 10% 9% 18% 18% 19% 20%G DH FACGK DH G DH G BDH
Cyber squatting
_________________________________________________________________________________________________________________Proportions/Means: Columns Tested (5% risk level) - A/B - C/D - E/F - G/H - I/J - K/L - A/C/E/G/I/K - B/D/F/H/J/LOverlap formulae used.
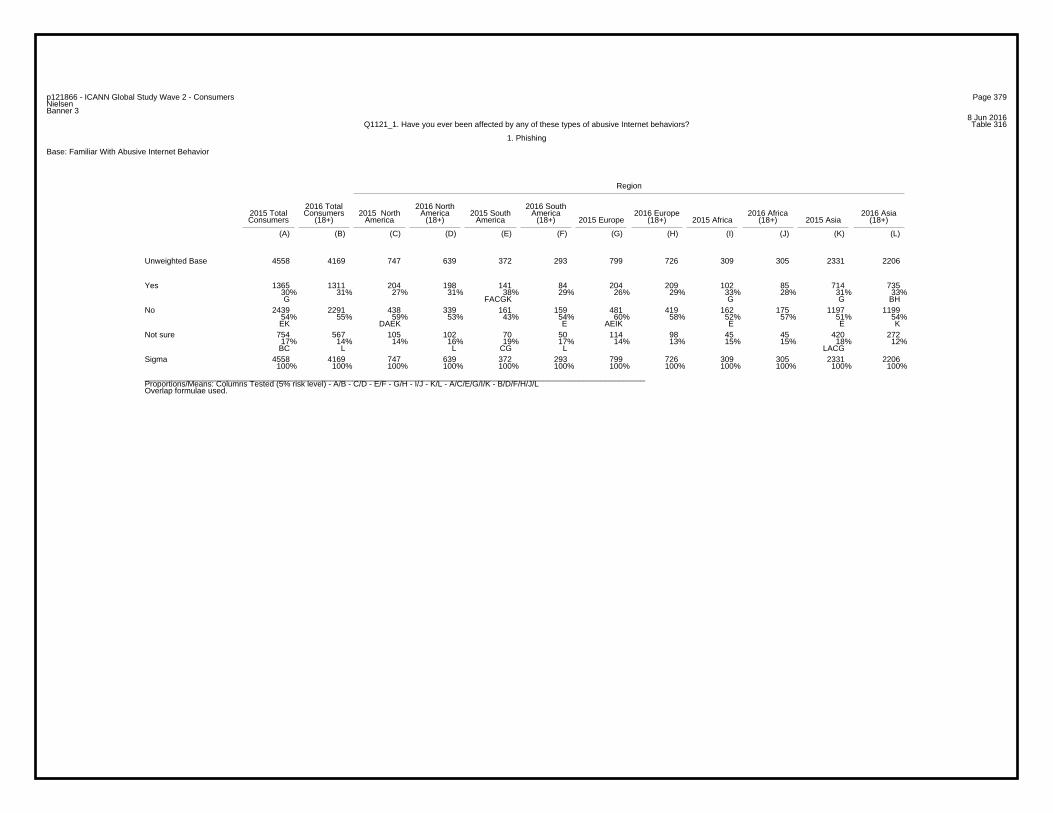
Page 379p121866 - ICANN Global Study Wave 2 - ConsumersNielsenBanner 3
8 Jun 2016Table 316Q1121_1. Have you ever been affected by any of these types of abusive Internet behaviors?
1. Phishing
Base: Familiar With Abusive Internet Behavior
Region
2016 Total 2016 North 2016 South2015 Total Consumers 2015 North America 2015 South America 2016 Europe 2016 Africa 2016 AsiaConsumers (18+) America (18+) America (18+) 2015 Europe (18+) 2015 Africa (18+) 2015 Asia (18+)
(A) (B) (C) (D) (E) (F) (G) (H) (I) (J) (K) (L)
4558 4169 747 639 372 293 799 726 309 305 2331 2206Unweighted Base
1365 1311 204 198 141 84 204 209 102 85 714 73530% 31% 27% 31% 38% 29% 26% 29% 33% 28% 31% 33%G FACGK G G BH
Yes
2439 2291 438 339 161 159 481 419 162 175 1197 119954% 55% 59% 53% 43% 54% 60% 58% 52% 57% 51% 54%EK DAEK E AEIK E E K
No
754 567 105 102 70 50 114 98 45 45 420 27217% 14% 14% 16% 19% 17% 14% 13% 15% 15% 18% 12%BC L L CG L LACG
Not sure
4558 4169 747 639 372 293 799 726 309 305 2331 2206100% 100% 100% 100% 100% 100% 100% 100% 100% 100% 100% 100%
Sigma
_________________________________________________________________________________________________________________Proportions/Means: Columns Tested (5% risk level) - A/B - C/D - E/F - G/H - I/J - K/L - A/C/E/G/I/K - B/D/F/H/J/LOverlap formulae used.
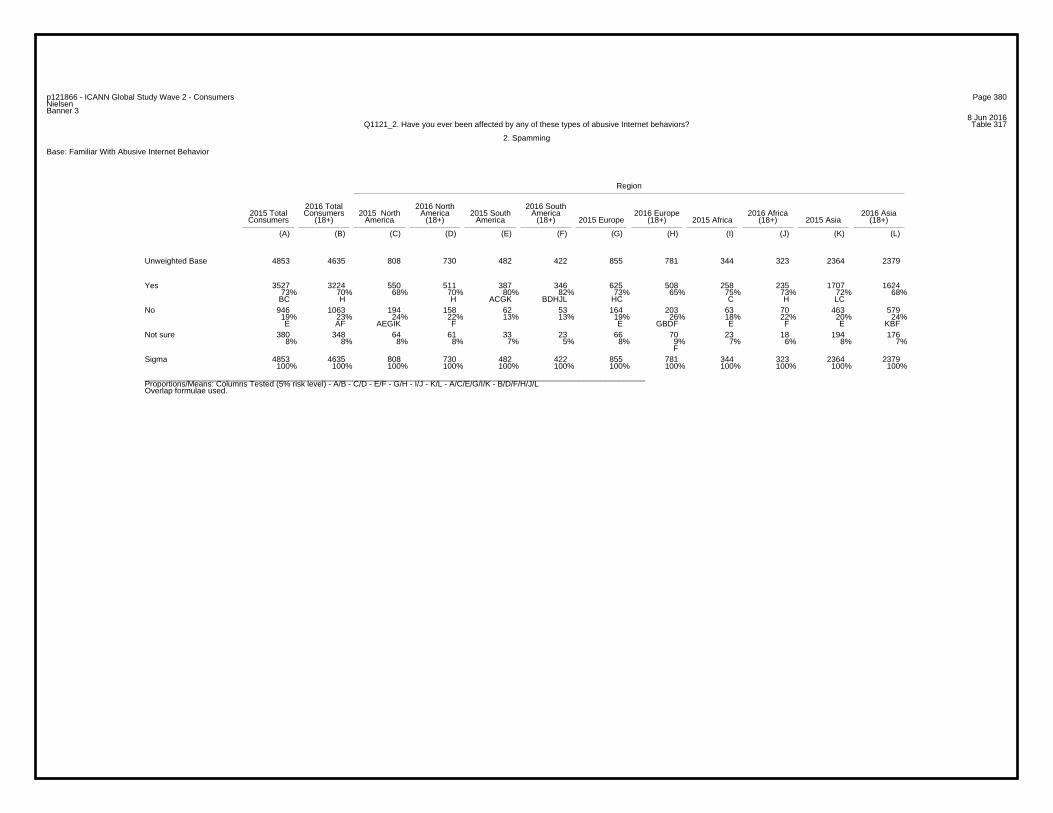
Page 380p121866 - ICANN Global Study Wave 2 - ConsumersNielsenBanner 3
8 Jun 2016Table 317Q1121_2. Have you ever been affected by any of these types of abusive Internet behaviors?
2. Spamming
Base: Familiar With Abusive Internet Behavior
Region
2016 Total 2016 North 2016 South2015 Total Consumers 2015 North America 2015 South America 2016 Europe 2016 Africa 2016 AsiaConsumers (18+) America (18+) America (18+) 2015 Europe (18+) 2015 Africa (18+) 2015 Asia (18+)
(A) (B) (C) (D) (E) (F) (G) (H) (I) (J) (K) (L)
4853 4635 808 730 482 422 855 781 344 323 2364 2379Unweighted Base
3527 3224 550 511 387 346 625 508 258 235 1707 162473% 70% 68% 70% 80% 82% 73% 65% 75% 73% 72% 68%BC H H ACGK BDHJL HC C H LC
Yes
946 1063 194 158 62 53 164 203 63 70 463 57919% 23% 24% 22% 13% 13% 19% 26% 18% 22% 20% 24%E AF AEGIK F E GBDF E F E KBF
No
380 348 64 61 33 23 66 70 23 18 194 1768% 8% 8% 8% 7% 5% 8% 9% 7% 6% 8% 7%
F
Not sure
4853 4635 808 730 482 422 855 781 344 323 2364 2379100% 100% 100% 100% 100% 100% 100% 100% 100% 100% 100% 100%
Sigma
_________________________________________________________________________________________________________________Proportions/Means: Columns Tested (5% risk level) - A/B - C/D - E/F - G/H - I/J - K/L - A/C/E/G/I/K - B/D/F/H/J/LOverlap formulae used.
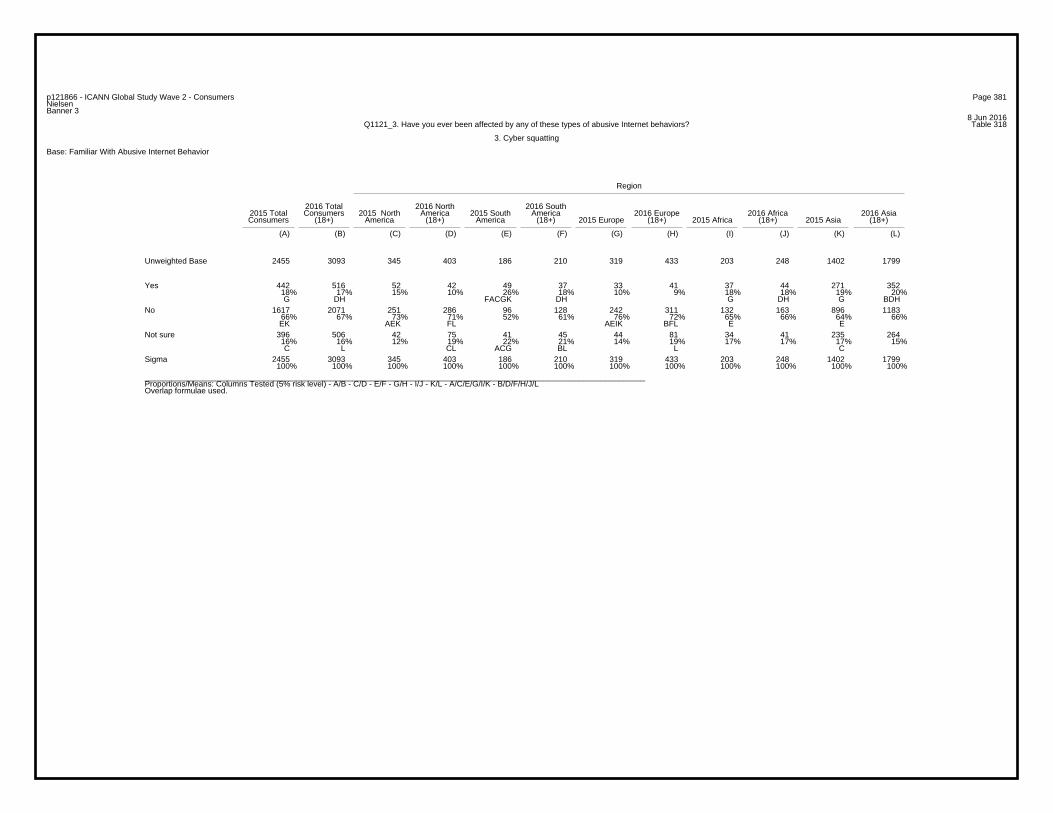
Page 381p121866 - ICANN Global Study Wave 2 - ConsumersNielsenBanner 3
8 Jun 2016Table 318Q1121_3. Have you ever been affected by any of these types of abusive Internet behaviors?
3. Cyber squatting
Base: Familiar With Abusive Internet Behavior
Region
2016 Total 2016 North 2016 South2015 Total Consumers 2015 North America 2015 South America 2016 Europe 2016 Africa 2016 AsiaConsumers (18+) America (18+) America (18+) 2015 Europe (18+) 2015 Africa (18+) 2015 Asia (18+)
(A) (B) (C) (D) (E) (F) (G) (H) (I) (J) (K) (L)
2455 3093 345 403 186 210 319 433 203 248 1402 1799Unweighted Base
442 516 52 42 49 37 33 41 37 44 271 35218% 17% 15% 10% 26% 18% 10% 9% 18% 18% 19% 20%G DH FACGK DH G DH G BDH
Yes
1617 2071 251 286 96 128 242 311 132 163 896 118366% 67% 73% 71% 52% 61% 76% 72% 65% 66% 64% 66%EK AEK FL AEIK BFL E E
No
396 506 42 75 41 45 44 81 34 41 235 26416% 16% 12% 19% 22% 21% 14% 19% 17% 17% 17% 15%C L CL ACG BL L C
Not sure
2455 3093 345 403 186 210 319 433 203 248 1402 1799100% 100% 100% 100% 100% 100% 100% 100% 100% 100% 100% 100%
Sigma
_________________________________________________________________________________________________________________Proportions/Means: Columns Tested (5% risk level) - A/B - C/D - E/F - G/H - I/J - K/L - A/C/E/G/I/K - B/D/F/H/J/LOverlap formulae used.
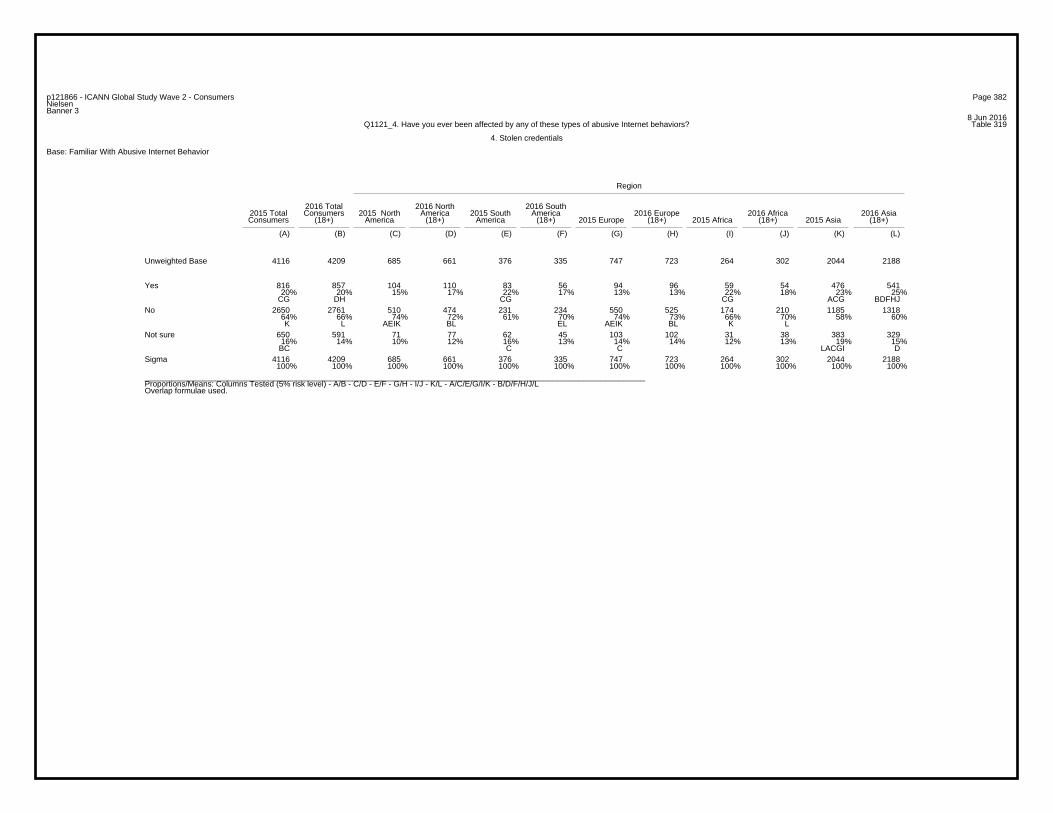
Page 382p121866 - ICANN Global Study Wave 2 - ConsumersNielsenBanner 3
8 Jun 2016Table 319Q1121_4. Have you ever been affected by any of these types of abusive Internet behaviors?
4. Stolen credentials
Base: Familiar With Abusive Internet Behavior
Region
2016 Total 2016 North 2016 South2015 Total Consumers 2015 North America 2015 South America 2016 Europe 2016 Africa 2016 AsiaConsumers (18+) America (18+) America (18+) 2015 Europe (18+) 2015 Africa (18+) 2015 Asia (18+)
(A) (B) (C) (D) (E) (F) (G) (H) (I) (J) (K) (L)
4116 4209 685 661 376 335 747 723 264 302 2044 2188Unweighted Base
816 857 104 110 83 56 94 96 59 54 476 54120% 20% 15% 17% 22% 17% 13% 13% 22% 18% 23% 25%
CG DH CG CG ACG BDFHJ
Yes
2650 2761 510 474 231 234 550 525 174 210 1185 131864% 66% 74% 72% 61% 70% 74% 73% 66% 70% 58% 60%K L AEIK BL EL AEIK BL K L
No
650 591 71 77 62 45 103 102 31 38 383 32916% 14% 10% 12% 16% 13% 14% 14% 12% 13% 19% 15%BC C C LACGI D
Not sure
4116 4209 685 661 376 335 747 723 264 302 2044 2188100% 100% 100% 100% 100% 100% 100% 100% 100% 100% 100% 100%
Sigma
_________________________________________________________________________________________________________________Proportions/Means: Columns Tested (5% risk level) - A/B - C/D - E/F - G/H - I/J - K/L - A/C/E/G/I/K - B/D/F/H/J/LOverlap formulae used.

Page 383p121866 - ICANN Global Study Wave 2 - ConsumersNielsenBanner 3
8 Jun 2016Table 320Q1121_5. Have you ever been affected by any of these types of abusive Internet behaviors?
5. Malware
Base: Familiar With Abusive Internet Behavior
Region
2016 Total 2016 North 2016 South2015 Total Consumers 2015 North America 2015 South America 2016 Europe 2016 Africa 2016 AsiaConsumers (18+) America (18+) America (18+) 2015 Europe (18+) 2015 Africa (18+) 2015 Asia (18+)
(A) (B) (C) (D) (E) (F) (G) (H) (I) (J) (K) (L)
4670 4385 794 684 463 381 823 754 313 318 2277 2248Unweighted Base
2800 2481 452 403 309 241 444 373 195 170 1400 129460% 57% 57% 59% 67% 63% 54% 49% 62% 53% 61% 58%
BG H H ACGK BHJL JG LACG H
Yes
1279 1413 255 199 92 93 279 286 78 105 575 73027% 32% 32% 29% 20% 24% 34% 38% 25% 33% 25% 32%EK AF AEIK AEIK BDFL IF E KF
No
591 491 87 82 62 47 100 95 40 43 302 22413% 11% 11% 12% 13% 12% 12% 13% 13% 14% 13% 10%B L L L
Not sure
4670 4385 794 684 463 381 823 754 313 318 2277 2248100% 100% 100% 100% 100% 100% 100% 100% 100% 100% 100% 100%
Sigma
_________________________________________________________________________________________________________________Proportions/Means: Columns Tested (5% risk level) - A/B - C/D - E/F - G/H - I/J - K/L - A/C/E/G/I/K - B/D/F/H/J/LOverlap formulae used.
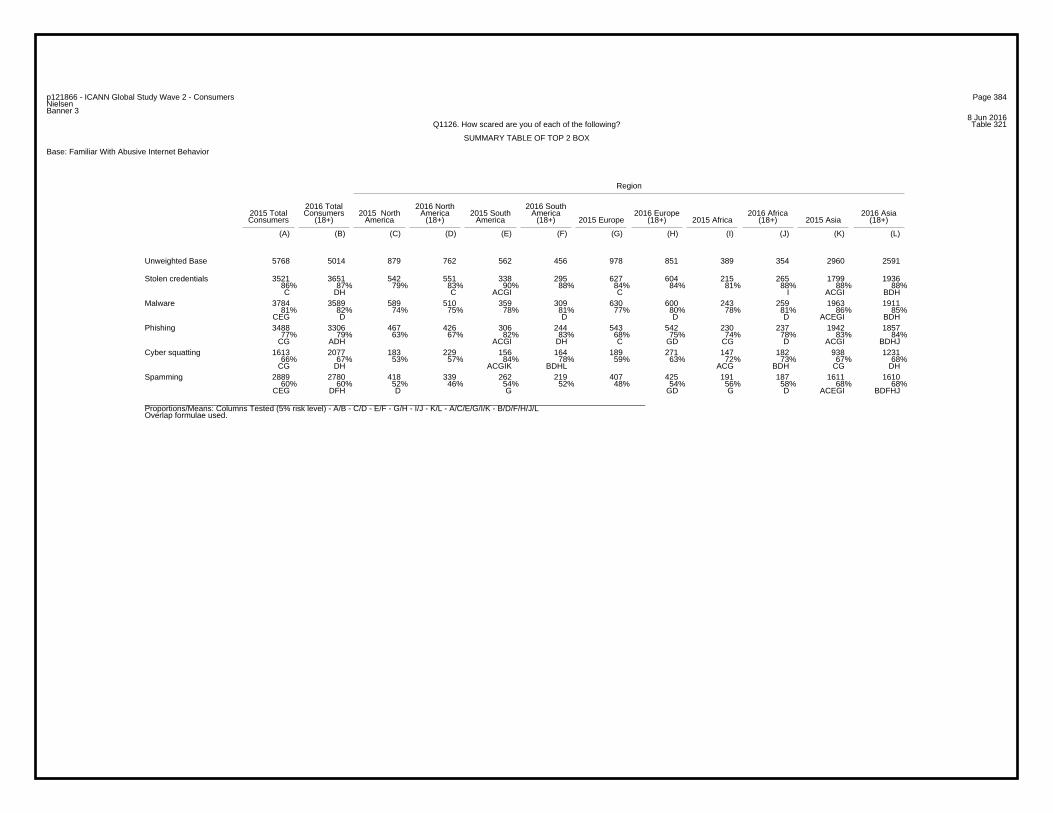
Page 384p121866 - ICANN Global Study Wave 2 - ConsumersNielsenBanner 3
8 Jun 2016Table 321Q1126. How scared are you of each of the following?
SUMMARY TABLE OF TOP 2 BOX
Base: Familiar With Abusive Internet Behavior
Region
2016 Total 2016 North 2016 South2015 Total Consumers 2015 North America 2015 South America 2016 Europe 2016 Africa 2016 AsiaConsumers (18+) America (18+) America (18+) 2015 Europe (18+) 2015 Africa (18+) 2015 Asia (18+)
(A) (B) (C) (D) (E) (F) (G) (H) (I) (J) (K) (L)
5768 5014 879 762 562 456 978 851 389 354 2960 2591Unweighted Base
3521 3651 542 551 338 295 627 604 215 265 1799 193686% 87% 79% 83% 90% 88% 84% 84% 81% 88% 88% 88%C DH C ACGI C I ACGI BDH
Stolen credentials
3784 3589 589 510 359 309 630 600 243 259 1963 191181% 82% 74% 75% 78% 81% 77% 80% 78% 81% 86% 85%
CEG D D D D ACEGI BDH
Malware
3488 3306 467 426 306 244 543 542 230 237 1942 185777% 79% 63% 67% 82% 83% 68% 75% 74% 78% 83% 84%
CG ADH ACGI DH C GD CG D ACGI BDHJ
Phishing
1613 2077 183 229 156 164 189 271 147 182 938 123166% 67% 53% 57% 84% 78% 59% 63% 72% 73% 67% 68%
CG DH ACGIK BDHL ACG BDH CG DH
Cyber squatting
2889 2780 418 339 262 219 407 425 191 187 1611 161060% 60% 52% 46% 54% 52% 48% 54% 56% 58% 68% 68%
CEG DFH D G GD G D ACEGI BDFHJ
Spamming
_________________________________________________________________________________________________________________Proportions/Means: Columns Tested (5% risk level) - A/B - C/D - E/F - G/H - I/J - K/L - A/C/E/G/I/K - B/D/F/H/J/LOverlap formulae used.
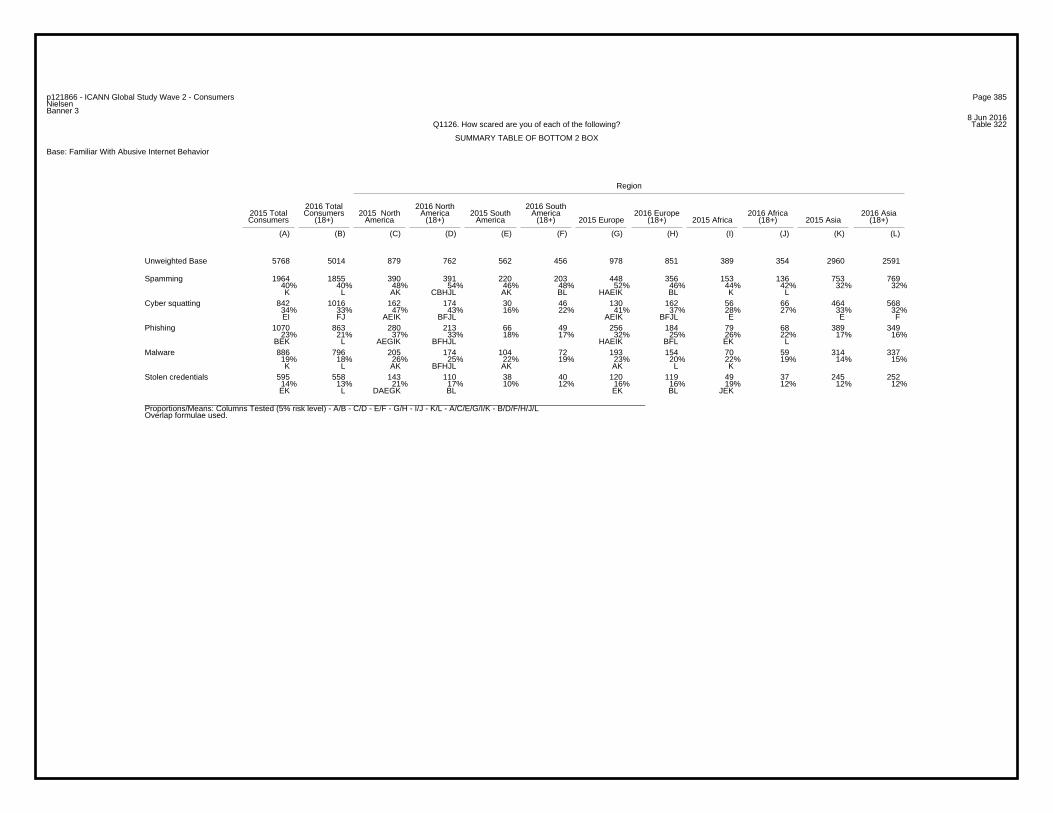
Page 385p121866 - ICANN Global Study Wave 2 - ConsumersNielsenBanner 3
8 Jun 2016Table 322Q1126. How scared are you of each of the following?
SUMMARY TABLE OF BOTTOM 2 BOX
Base: Familiar With Abusive Internet Behavior
Region
2016 Total 2016 North 2016 South2015 Total Consumers 2015 North America 2015 South America 2016 Europe 2016 Africa 2016 AsiaConsumers (18+) America (18+) America (18+) 2015 Europe (18+) 2015 Africa (18+) 2015 Asia (18+)
(A) (B) (C) (D) (E) (F) (G) (H) (I) (J) (K) (L)
5768 5014 879 762 562 456 978 851 389 354 2960 2591Unweighted Base
1964 1855 390 391 220 203 448 356 153 136 753 76940% 40% 48% 54% 46% 48% 52% 46% 44% 42% 32% 32%K L AK CBHJL AK BL HAEIK BL K L
Spamming
842 1016 162 174 30 46 130 162 56 66 464 56834% 33% 47% 43% 16% 22% 41% 37% 28% 27% 33% 32%EI FJ AEIK BFJL AEIK BFJL E E F
Cyber squatting
1070 863 280 213 66 49 256 184 79 68 389 34923% 21% 37% 33% 18% 17% 32% 25% 26% 22% 17% 16%
BEK L AEGIK BFHJL HAEIK BFL EK L
Phishing
886 796 205 174 104 72 193 154 70 59 314 33719% 18% 26% 25% 22% 19% 23% 20% 22% 19% 14% 15%K L AK BFHJL AK AK L K
Malware
595 558 143 110 38 40 120 119 49 37 245 25214% 13% 21% 17% 10% 12% 16% 16% 19% 12% 12% 12%EK L DAEGK BL EK BL JEK
Stolen credentials
_________________________________________________________________________________________________________________Proportions/Means: Columns Tested (5% risk level) - A/B - C/D - E/F - G/H - I/J - K/L - A/C/E/G/I/K - B/D/F/H/J/LOverlap formulae used.

Page 386p121866 - ICANN Global Study Wave 2 - ConsumersNielsenBanner 3
8 Jun 2016Table 323Q1126_1. How scared are you of each of the following?
1. Phishing
Base: Familiar With Abusive Internet Behavior
Region
2016 Total 2016 North 2016 South2015 Total Consumers 2015 North America 2015 South America 2016 Europe 2016 Africa 2016 AsiaConsumers (18+) America (18+) America (18+) 2015 Europe (18+) 2015 Africa (18+) 2015 Asia (18+)
(A) (B) (C) (D) (E) (F) (G) (H) (I) (J) (K) (L)
4558 4169 747 639 372 293 799 726 309 305 2331 2206Unweighted Base
3488 3306 467 426 306 244 543 542 230 237 1942 185777% 79% 63% 67% 82% 83% 68% 75% 74% 78% 83% 84%
CG ADH ACGI DH C GD CG D ACGI BDHJ
TOP 2 BOX (NET)
1542 1671 185 179 183 147 216 251 109 116 849 97834% 40% 25% 28% 49% 50% 27% 35% 35% 38% 36% 44%
CG ADH ACGIK BDHJ GD CG D ACG KBDHJ
Very scared
1946 1635 282 247 123 97 327 291 121 121 1093 87943% 39% 38% 39% 33% 33% 41% 40% 39% 40% 47% 40%
BCE F E F LACEGI F
Somewhat scared
1070 863 280 213 66 49 256 184 79 68 389 34923% 21% 37% 33% 18% 17% 32% 25% 26% 22% 17% 16%
BEK L AEGIK BFHJL HAEIK BFL EK L
BOTTOM 2 BOX (NET)
786 651 206 165 44 33 197 127 52 45 287 28117% 16% 28% 26% 12% 11% 25% 17% 17% 15% 12% 13%
BEK FL AEIK BFHJL HAEIK FL K
Not very scared
284 212 74 48 22 16 59 57 27 23 102 686% 5% 10% 8% 6% 5% 7% 8% 9% 8% 4% 3%
BK L AEK BL L K BL K BL L
Not at all scared
4558 4169 747 639 372 293 799 726 309 305 2331 2206100% 100% 100% 100% 100% 100% 100% 100% 100% 100% 100% 100%
Sigma
_________________________________________________________________________________________________________________Proportions/Means: Columns Tested (5% risk level) - A/B - C/D - E/F - G/H - I/J - K/L - A/C/E/G/I/K - B/D/F/H/J/LOverlap formulae used.

Page 387p121866 - ICANN Global Study Wave 2 - ConsumersNielsenBanner 3
8 Jun 2016Table 324Q1126_2. How scared are you of each of the following?
2. Spamming
Base: Familiar With Abusive Internet Behavior
Region
2016 Total 2016 North 2016 South2015 Total Consumers 2015 North America 2015 South America 2016 Europe 2016 Africa 2016 AsiaConsumers (18+) America (18+) America (18+) 2015 Europe (18+) 2015 Africa (18+) 2015 Asia (18+)
(A) (B) (C) (D) (E) (F) (G) (H) (I) (J) (K) (L)
4853 4635 808 730 482 422 855 781 344 323 2364 2379Unweighted Base
2889 2780 418 339 262 219 407 425 191 187 1611 161060% 60% 52% 46% 54% 52% 48% 54% 56% 58% 68% 68%
CEG DFH D G GD G D ACEGI BDFHJ
TOP 2 BOX (NET)
1041 1011 137 98 112 87 132 130 80 79 580 61721% 22% 17% 13% 23% 21% 15% 17% 23% 24% 25% 26%
CG DH CG D CG DH ACG BDFH
Very scared
1848 1769 281 241 150 132 275 295 111 108 1031 99338% 38% 35% 33% 31% 31% 32% 38% 32% 33% 44% 42%
CEGI DF GF ACEGI BDFJ
Somewhat scared
1964 1855 390 391 220 203 448 356 153 136 753 76940% 40% 48% 54% 46% 48% 52% 46% 44% 42% 32% 32%K L AK CBHJL AK BL HAEIK BL K L
BOTTOM 2 BOX (NET)
1432 1304 277 265 151 127 328 252 96 80 580 58030% 28% 34% 36% 31% 30% 38% 32% 28% 25% 25% 24%K L AIK BFJL K L HAEIK BJL
Not very scared
532 551 113 126 69 76 120 104 57 56 173 18911% 12% 14% 17% 14% 18% 14% 13% 17% 17% 7% 8%K L AK BHL AK BHL AK L AK BL
Not at all scared
4853 4635 808 730 482 422 855 781 344 323 2364 2379100% 100% 100% 100% 100% 100% 100% 100% 100% 100% 100% 100%
Sigma
_________________________________________________________________________________________________________________Proportions/Means: Columns Tested (5% risk level) - A/B - C/D - E/F - G/H - I/J - K/L - A/C/E/G/I/K - B/D/F/H/J/LOverlap formulae used.
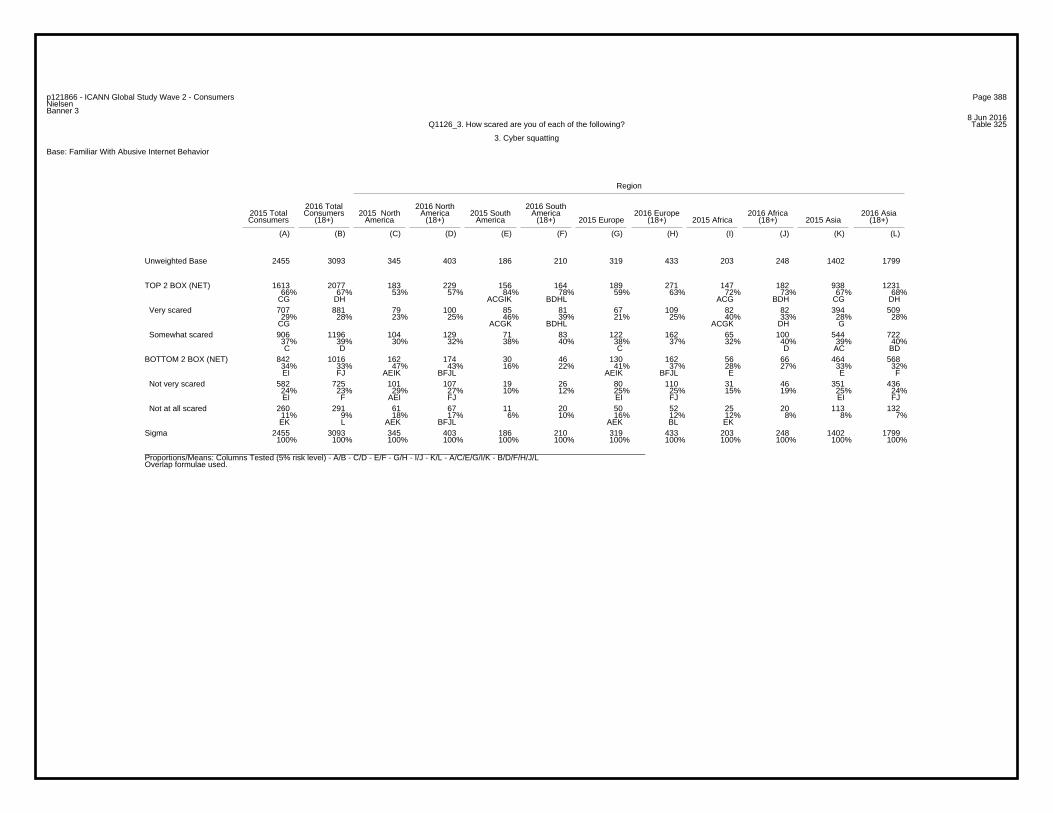
Page 388p121866 - ICANN Global Study Wave 2 - ConsumersNielsenBanner 3
8 Jun 2016Table 325Q1126_3. How scared are you of each of the following?
3. Cyber squatting
Base: Familiar With Abusive Internet Behavior
Region
2016 Total 2016 North 2016 South2015 Total Consumers 2015 North America 2015 South America 2016 Europe 2016 Africa 2016 AsiaConsumers (18+) America (18+) America (18+) 2015 Europe (18+) 2015 Africa (18+) 2015 Asia (18+)
(A) (B) (C) (D) (E) (F) (G) (H) (I) (J) (K) (L)
2455 3093 345 403 186 210 319 433 203 248 1402 1799Unweighted Base
1613 2077 183 229 156 164 189 271 147 182 938 123166% 67% 53% 57% 84% 78% 59% 63% 72% 73% 67% 68%
CG DH ACGIK BDHL ACG BDH CG DH
TOP 2 BOX (NET)
707 881 79 100 85 81 67 109 82 82 394 50929% 28% 23% 25% 46% 39% 21% 25% 40% 33% 28% 28%
CG ACGK BDHL ACGK DH G
Very scared
906 1196 104 129 71 83 122 162 65 100 544 72237% 39% 30% 32% 38% 40% 38% 37% 32% 40% 39% 40%C D C D AC BD
Somewhat scared
842 1016 162 174 30 46 130 162 56 66 464 56834% 33% 47% 43% 16% 22% 41% 37% 28% 27% 33% 32%EI FJ AEIK BFJL AEIK BFJL E E F
BOTTOM 2 BOX (NET)
582 725 101 107 19 26 80 110 31 46 351 43624% 23% 29% 27% 10% 12% 25% 25% 15% 19% 25% 24%EI F AEI FJ EI FJ EI FJ
Not very scared
260 291 61 67 11 20 50 52 25 20 113 13211% 9% 18% 17% 6% 10% 16% 12% 12% 8% 8% 7%EK L AEK BFJL AEK BL EK
Not at all scared
2455 3093 345 403 186 210 319 433 203 248 1402 1799100% 100% 100% 100% 100% 100% 100% 100% 100% 100% 100% 100%
Sigma
_________________________________________________________________________________________________________________Proportions/Means: Columns Tested (5% risk level) - A/B - C/D - E/F - G/H - I/J - K/L - A/C/E/G/I/K - B/D/F/H/J/LOverlap formulae used.

Page 389p121866 - ICANN Global Study Wave 2 - ConsumersNielsenBanner 3
8 Jun 2016Table 326Q1126_4. How scared are you of each of the following?
4. Stolen credentials
Base: Familiar With Abusive Internet Behavior
Region
2016 Total 2016 North 2016 South2015 Total Consumers 2015 North America 2015 South America 2016 Europe 2016 Africa 2016 AsiaConsumers (18+) America (18+) America (18+) 2015 Europe (18+) 2015 Africa (18+) 2015 Asia (18+)
(A) (B) (C) (D) (E) (F) (G) (H) (I) (J) (K) (L)
4116 4209 685 661 376 335 747 723 264 302 2044 2188Unweighted Base
3521 3651 542 551 338 295 627 604 215 265 1799 193686% 87% 79% 83% 90% 88% 84% 84% 81% 88% 88% 88%C DH C ACGI C I ACGI BDH
TOP 2 BOX (NET)
2055 2191 306 318 234 204 338 356 143 164 1034 114950% 52% 45% 48% 62% 61% 45% 49% 54% 54% 51% 53%
CG D ACGIK BDHL CG CG D
Very scared
1466 1460 236 233 104 91 289 248 72 101 765 78736% 35% 34% 35% 28% 27% 39% 34% 27% 33% 37% 36%EI F EI F EI F AEI F
Somewhat scared
595 558 143 110 38 40 120 119 49 37 245 25214% 13% 21% 17% 10% 12% 16% 16% 19% 12% 12% 12%EK L DAEGK BL EK BL JEK
BOTTOM 2 BOX (NET)
455 416 115 86 24 28 93 79 30 24 193 19911% 10% 17% 13% 6% 8% 12% 11% 11% 8% 9% 9%EK AEGIK BFJL EK E
Not very scared
140 142 28 24 14 12 27 40 19 13 52 533% 3% 4% 4% 4% 4% 4% 6% 7% 4% 3% 2%K L K BL ACGK
Not at all scared
4116 4209 685 661 376 335 747 723 264 302 2044 2188100% 100% 100% 100% 100% 100% 100% 100% 100% 100% 100% 100%
Sigma
_________________________________________________________________________________________________________________Proportions/Means: Columns Tested (5% risk level) - A/B - C/D - E/F - G/H - I/J - K/L - A/C/E/G/I/K - B/D/F/H/J/LOverlap formulae used.
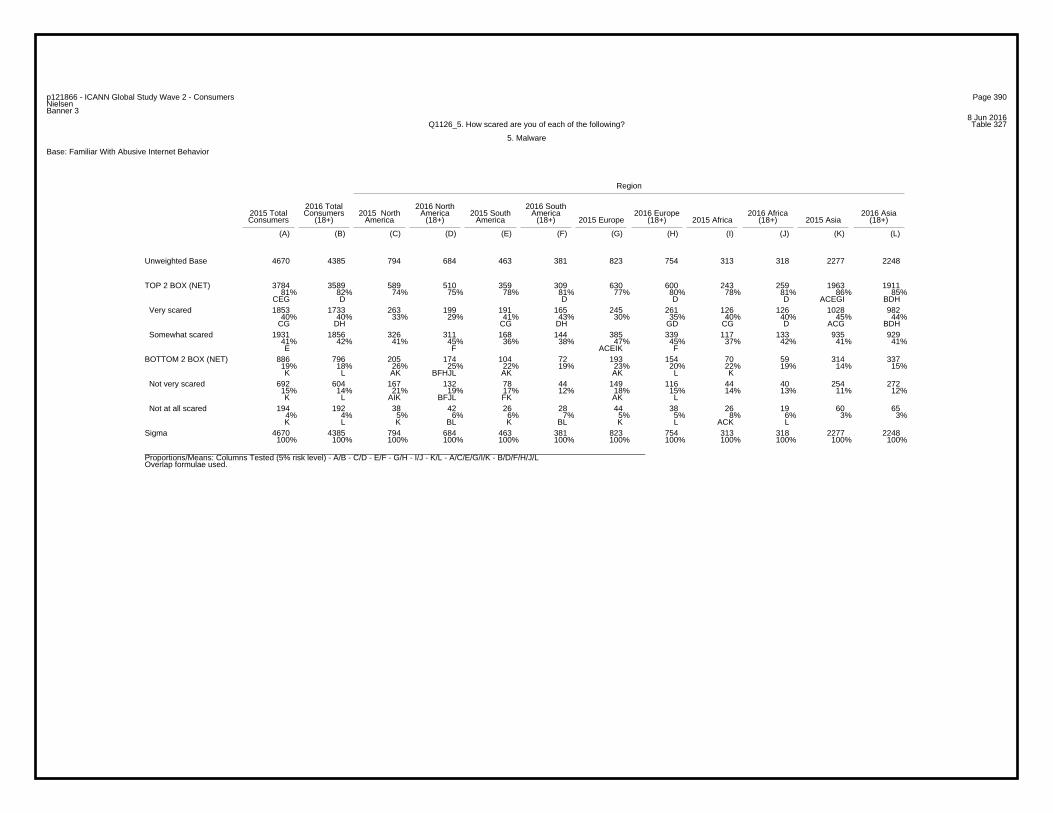
Page 390p121866 - ICANN Global Study Wave 2 - ConsumersNielsenBanner 3
8 Jun 2016Table 327Q1126_5. How scared are you of each of the following?
5. Malware
Base: Familiar With Abusive Internet Behavior
Region
2016 Total 2016 North 2016 South2015 Total Consumers 2015 North America 2015 South America 2016 Europe 2016 Africa 2016 AsiaConsumers (18+) America (18+) America (18+) 2015 Europe (18+) 2015 Africa (18+) 2015 Asia (18+)
(A) (B) (C) (D) (E) (F) (G) (H) (I) (J) (K) (L)
4670 4385 794 684 463 381 823 754 313 318 2277 2248Unweighted Base
3784 3589 589 510 359 309 630 600 243 259 1963 191181% 82% 74% 75% 78% 81% 77% 80% 78% 81% 86% 85%
CEG D D D D ACEGI BDH
TOP 2 BOX (NET)
1853 1733 263 199 191 165 245 261 126 126 1028 98240% 40% 33% 29% 41% 43% 30% 35% 40% 40% 45% 44%
CG DH CG DH GD CG D ACG BDH
Very scared
1931 1856 326 311 168 144 385 339 117 133 935 92941% 42% 41% 45% 36% 38% 47% 45% 37% 42% 41% 41%E F ACEIK F
Somewhat scared
886 796 205 174 104 72 193 154 70 59 314 33719% 18% 26% 25% 22% 19% 23% 20% 22% 19% 14% 15%K L AK BFHJL AK AK L K
BOTTOM 2 BOX (NET)
692 604 167 132 78 44 149 116 44 40 254 27215% 14% 21% 19% 17% 12% 18% 15% 14% 13% 11% 12%K L AIK BFJL FK AK L
Not very scared
194 192 38 42 26 28 44 38 26 19 60 654% 4% 5% 6% 6% 7% 5% 5% 8% 6% 3% 3%K L K BL K BL K L ACK L
Not at all scared
4670 4385 794 684 463 381 823 754 313 318 2277 2248100% 100% 100% 100% 100% 100% 100% 100% 100% 100% 100% 100%
Sigma
_________________________________________________________________________________________________________________Proportions/Means: Columns Tested (5% risk level) - A/B - C/D - E/F - G/H - I/J - K/L - A/C/E/G/I/K - B/D/F/H/J/LOverlap formulae used.
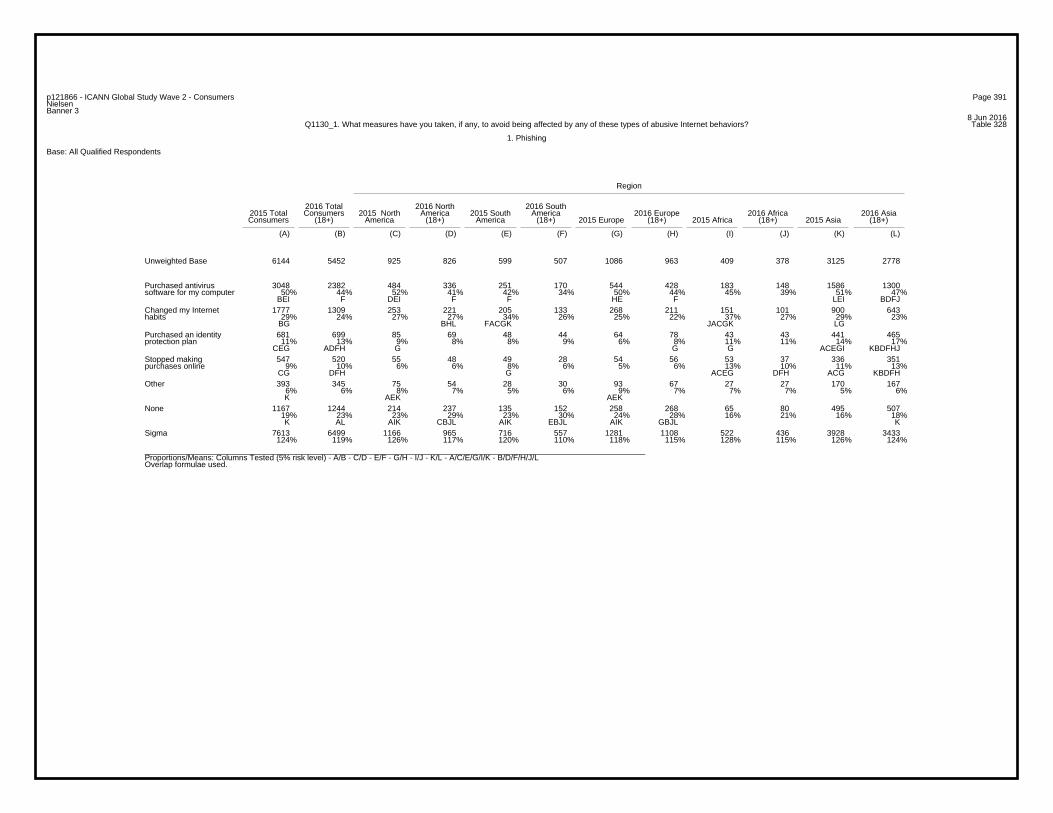
Page 391p121866 - ICANN Global Study Wave 2 - ConsumersNielsenBanner 3
8 Jun 2016Table 328Q1130_1. What measures have you taken, if any, to avoid being affected by any of these types of abusive Internet behaviors?
1. Phishing
Base: All Qualified Respondents
Region
2016 Total 2016 North 2016 South2015 Total Consumers 2015 North America 2015 South America 2016 Europe 2016 Africa 2016 AsiaConsumers (18+) America (18+) America (18+) 2015 Europe (18+) 2015 Africa (18+) 2015 Asia (18+)
(A) (B) (C) (D) (E) (F) (G) (H) (I) (J) (K) (L)
6144 5452 925 826 599 507 1086 963 409 378 3125 2778Unweighted Base
3048 2382 484 336 251 170 544 428 183 148 1586 130050% 44% 52% 41% 42% 34% 50% 44% 45% 39% 51% 47%
BEI F DEI F F HE F LEI BDFJ
Purchased antivirussoftware for my computer
1777 1309 253 221 205 133 268 211 151 101 900 64329% 24% 27% 27% 34% 26% 25% 22% 37% 27% 29% 23%
BG BHL FACGK JACGK LG
Changed my Internethabits
681 699 85 69 48 44 64 78 43 43 441 46511% 13% 9% 8% 8% 9% 6% 8% 11% 11% 14% 17%
CEG ADFH G G G ACEGI KBDFHJ
Purchased an identityprotection plan
547 520 55 48 49 28 54 56 53 37 336 3519% 10% 6% 6% 8% 6% 5% 6% 13% 10% 11% 13%
CG DFH G ACEG DFH ACG KBDFH
Stopped makingpurchases online
393 345 75 54 28 30 93 67 27 27 170 1676% 6% 8% 7% 5% 6% 9% 7% 7% 7% 5% 6%K AEK AEK
Other
1167 1244 214 237 135 152 258 268 65 80 495 50719% 23% 23% 29% 23% 30% 24% 28% 16% 21% 16% 18%K AL AIK CBJL AIK EBJL AIK GBJL K
None
7613 6499 1166 965 716 557 1281 1108 522 436 3928 3433124% 119% 126% 117% 120% 110% 118% 115% 128% 115% 126% 124%
Sigma
_________________________________________________________________________________________________________________Proportions/Means: Columns Tested (5% risk level) - A/B - C/D - E/F - G/H - I/J - K/L - A/C/E/G/I/K - B/D/F/H/J/LOverlap formulae used.
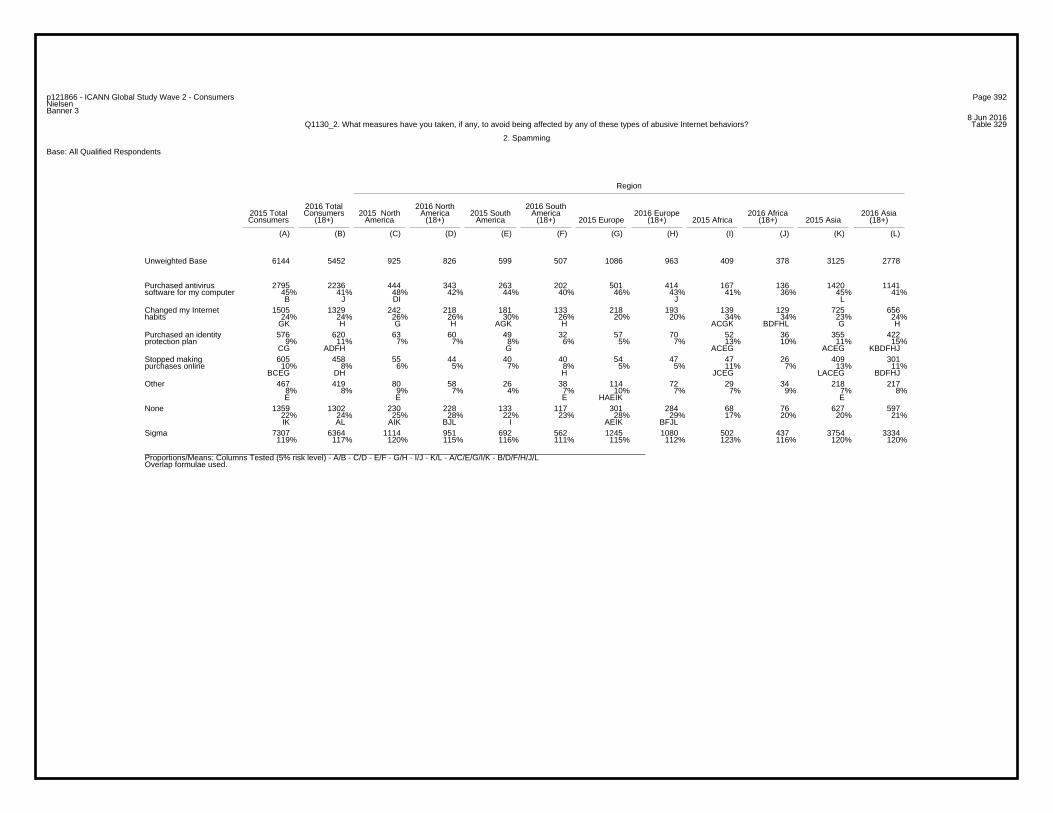
Page 392p121866 - ICANN Global Study Wave 2 - ConsumersNielsenBanner 3
8 Jun 2016Table 329Q1130_2. What measures have you taken, if any, to avoid being affected by any of these types of abusive Internet behaviors?
2. Spamming
Base: All Qualified Respondents
Region
2016 Total 2016 North 2016 South2015 Total Consumers 2015 North America 2015 South America 2016 Europe 2016 Africa 2016 AsiaConsumers (18+) America (18+) America (18+) 2015 Europe (18+) 2015 Africa (18+) 2015 Asia (18+)
(A) (B) (C) (D) (E) (F) (G) (H) (I) (J) (K) (L)
6144 5452 925 826 599 507 1086 963 409 378 3125 2778Unweighted Base
2795 2236 444 343 263 202 501 414 167 136 1420 114145% 41% 48% 42% 44% 40% 46% 43% 41% 36% 45% 41%B J DI J L
Purchased antivirussoftware for my computer
1505 1329 242 218 181 133 218 193 139 129 725 65624% 24% 26% 26% 30% 26% 20% 20% 34% 34% 23% 24%
GK H G H AGK H ACGK BDFHL G H
Changed my Internethabits
576 620 63 60 49 32 57 70 52 36 355 4229% 11% 7% 7% 8% 6% 5% 7% 13% 10% 11% 15%
CG ADFH G ACEG ACEG KBDFHJ
Purchased an identityprotection plan
605 458 55 44 40 40 54 47 47 26 409 30110% 8% 6% 5% 7% 8% 5% 5% 11% 7% 13% 11%
BCEG DH H JCEG LACEG BDFHJ
Stopped makingpurchases online
467 419 80 58 26 38 114 72 29 34 218 2178% 8% 9% 7% 4% 7% 10% 7% 7% 9% 7% 8%E E E HAEIK E
Other
1359 1302 230 228 133 117 301 284 68 76 627 59722% 24% 25% 28% 22% 23% 28% 29% 17% 20% 20% 21%IK AL AIK BJL I AEIK BFJL
None
7307 6364 1114 951 692 562 1245 1080 502 437 3754 3334119% 117% 120% 115% 116% 111% 115% 112% 123% 116% 120% 120%
Sigma
_________________________________________________________________________________________________________________Proportions/Means: Columns Tested (5% risk level) - A/B - C/D - E/F - G/H - I/J - K/L - A/C/E/G/I/K - B/D/F/H/J/LOverlap formulae used.
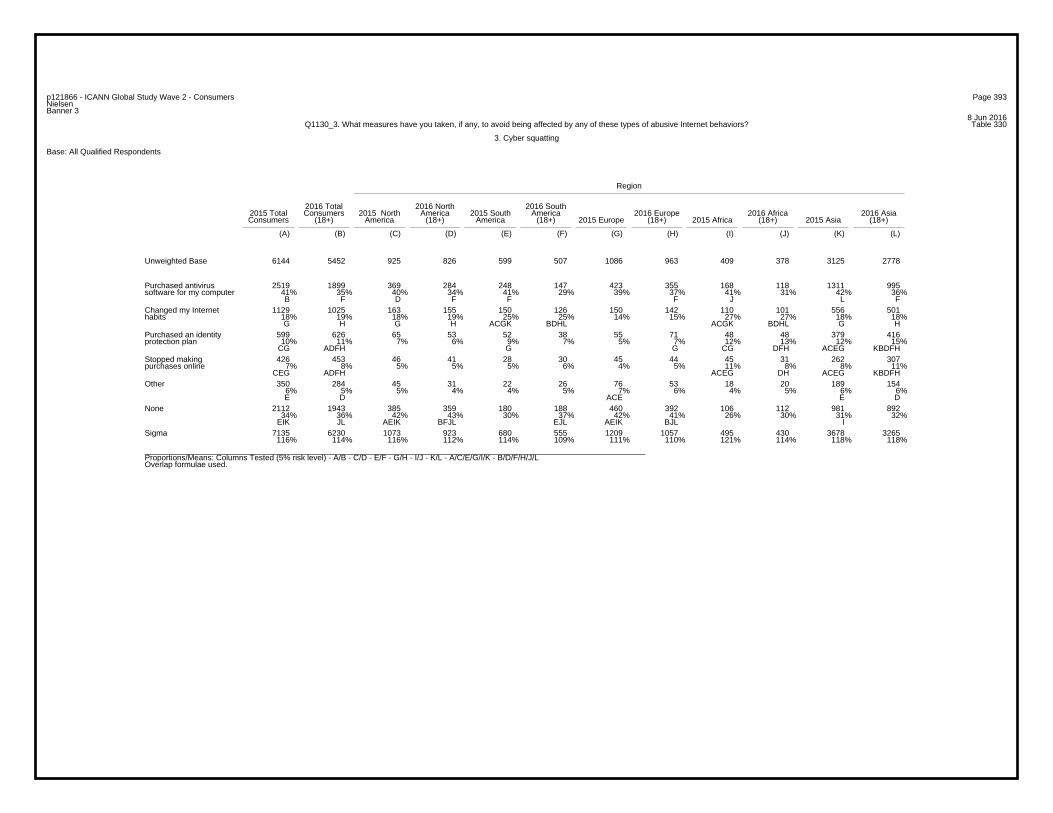
Page 393p121866 - ICANN Global Study Wave 2 - ConsumersNielsenBanner 3
8 Jun 2016Table 330Q1130_3. What measures have you taken, if any, to avoid being affected by any of these types of abusive Internet behaviors?
3. Cyber squatting
Base: All Qualified Respondents
Region
2016 Total 2016 North 2016 South2015 Total Consumers 2015 North America 2015 South America 2016 Europe 2016 Africa 2016 AsiaConsumers (18+) America (18+) America (18+) 2015 Europe (18+) 2015 Africa (18+) 2015 Asia (18+)
(A) (B) (C) (D) (E) (F) (G) (H) (I) (J) (K) (L)
6144 5452 925 826 599 507 1086 963 409 378 3125 2778Unweighted Base
2519 1899 369 284 248 147 423 355 168 118 1311 99541% 35% 40% 34% 41% 29% 39% 37% 41% 31% 42% 36%B F D F F F J L F
Purchased antivirussoftware for my computer
1129 1025 163 155 150 126 150 142 110 101 556 50118% 19% 18% 19% 25% 25% 14% 15% 27% 27% 18% 18%G H G H ACGK BDHL ACGK BDHL G H
Changed my Internethabits
599 626 65 53 52 38 55 71 48 48 379 41610% 11% 7% 6% 9% 7% 5% 7% 12% 13% 12% 15%
CG ADFH G G CG DFH ACEG KBDFH
Purchased an identityprotection plan
426 453 46 41 28 30 45 44 45 31 262 3077% 8% 5% 5% 5% 6% 4% 5% 11% 8% 8% 11%
CEG ADFH ACEG DH ACEG KBDFH
Stopped makingpurchases online
350 284 45 31 22 26 76 53 18 20 189 1546% 5% 5% 4% 4% 5% 7% 6% 4% 5% 6% 6%E D ACE E D
Other
2112 1943 385 359 180 188 460 392 106 112 981 89234% 36% 42% 43% 30% 37% 42% 41% 26% 30% 31% 32%
EIK JL AEIK BFJL EJL AEIK BJL I
None
7135 6230 1073 923 680 555 1209 1057 495 430 3678 3265116% 114% 116% 112% 114% 109% 111% 110% 121% 114% 118% 118%
Sigma
_________________________________________________________________________________________________________________Proportions/Means: Columns Tested (5% risk level) - A/B - C/D - E/F - G/H - I/J - K/L - A/C/E/G/I/K - B/D/F/H/J/LOverlap formulae used.
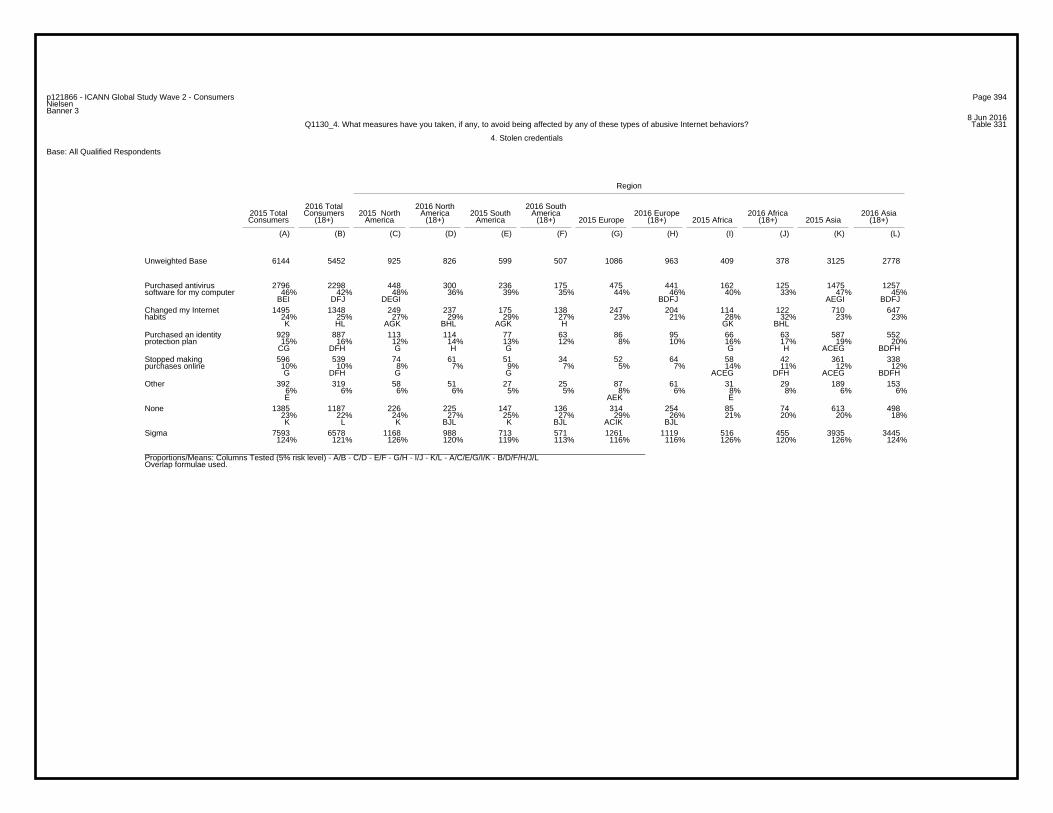
Page 394p121866 - ICANN Global Study Wave 2 - ConsumersNielsenBanner 3
8 Jun 2016Table 331Q1130_4. What measures have you taken, if any, to avoid being affected by any of these types of abusive Internet behaviors?
4. Stolen credentials
Base: All Qualified Respondents
Region
2016 Total 2016 North 2016 South2015 Total Consumers 2015 North America 2015 South America 2016 Europe 2016 Africa 2016 AsiaConsumers (18+) America (18+) America (18+) 2015 Europe (18+) 2015 Africa (18+) 2015 Asia (18+)
(A) (B) (C) (D) (E) (F) (G) (H) (I) (J) (K) (L)
6144 5452 925 826 599 507 1086 963 409 378 3125 2778Unweighted Base
2796 2298 448 300 236 175 475 441 162 125 1475 125746% 42% 48% 36% 39% 35% 44% 46% 40% 33% 47% 45%
BEI DFJ DEGI BDFJ AEGI BDFJ
Purchased antivirussoftware for my computer
1495 1348 249 237 175 138 247 204 114 122 710 64724% 25% 27% 29% 29% 27% 23% 21% 28% 32% 23% 23%K HL AGK BHL AGK H GK BHL
Changed my Internethabits
929 887 113 114 77 63 86 95 66 63 587 55215% 16% 12% 14% 13% 12% 8% 10% 16% 17% 19% 20%
CG DFH G H G G H ACEG BDFH
Purchased an identityprotection plan
596 539 74 61 51 34 52 64 58 42 361 33810% 10% 8% 7% 9% 7% 5% 7% 14% 11% 12% 12%G DFH G G ACEG DFH ACEG BDFH
Stopped makingpurchases online
392 319 58 51 27 25 87 61 31 29 189 1536% 6% 6% 6% 5% 5% 8% 6% 8% 8% 6% 6%E AEK E
Other
1385 1187 226 225 147 136 314 254 85 74 613 49823% 22% 24% 27% 25% 27% 29% 26% 21% 20% 20% 18%K L K BJL K BJL ACIK BJL
None
7593 6578 1168 988 713 571 1261 1119 516 455 3935 3445124% 121% 126% 120% 119% 113% 116% 116% 126% 120% 126% 124%
Sigma
_________________________________________________________________________________________________________________Proportions/Means: Columns Tested (5% risk level) - A/B - C/D - E/F - G/H - I/J - K/L - A/C/E/G/I/K - B/D/F/H/J/LOverlap formulae used.
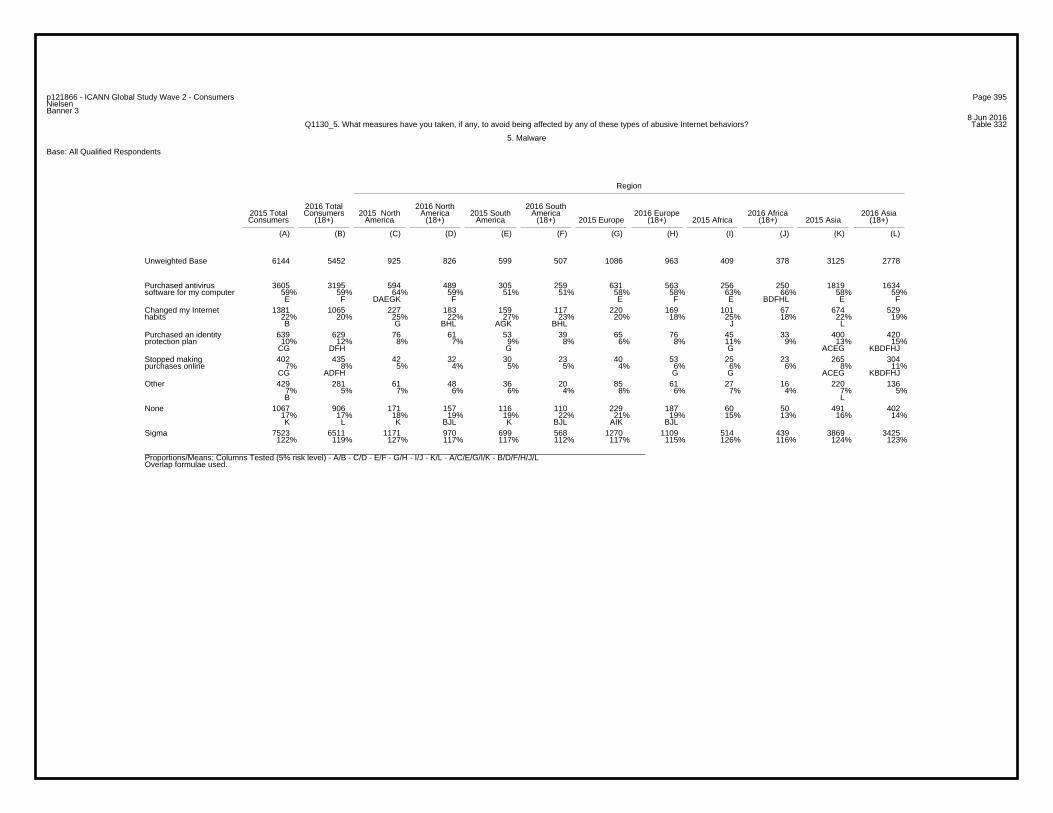
Page 395p121866 - ICANN Global Study Wave 2 - ConsumersNielsenBanner 3
8 Jun 2016Table 332Q1130_5. What measures have you taken, if any, to avoid being affected by any of these types of abusive Internet behaviors?
5. Malware
Base: All Qualified Respondents
Region
2016 Total 2016 North 2016 South2015 Total Consumers 2015 North America 2015 South America 2016 Europe 2016 Africa 2016 AsiaConsumers (18+) America (18+) America (18+) 2015 Europe (18+) 2015 Africa (18+) 2015 Asia (18+)
(A) (B) (C) (D) (E) (F) (G) (H) (I) (J) (K) (L)
6144 5452 925 826 599 507 1086 963 409 378 3125 2778Unweighted Base
3605 3195 594 489 305 259 631 563 256 250 1819 163459% 59% 64% 59% 51% 51% 58% 58% 63% 66% 58% 59%E F DAEGK F E F E BDFHL E F
Purchased antivirussoftware for my computer
1381 1065 227 183 159 117 220 169 101 67 674 52922% 20% 25% 22% 27% 23% 20% 18% 25% 18% 22% 19%B G BHL AGK BHL J L
Changed my Internethabits
639 629 76 61 53 39 65 76 45 33 400 42010% 12% 8% 7% 9% 8% 6% 8% 11% 9% 13% 15%
CG DFH G G ACEG KBDFHJ
Purchased an identityprotection plan
402 435 42 32 30 23 40 53 25 23 265 3047% 8% 5% 4% 5% 5% 4% 6% 6% 6% 8% 11%
CG ADFH G G ACEG KBDFHJ
Stopped makingpurchases online
429 281 61 48 36 20 85 61 27 16 220 1367% 5% 7% 6% 6% 4% 8% 6% 7% 4% 7% 5%B L
Other
1067 906 171 157 116 110 229 187 60 50 491 40217% 17% 18% 19% 19% 22% 21% 19% 15% 13% 16% 14%K L K BJL K BJL AIK BJL
None
7523 6511 1171 970 699 568 1270 1109 514 439 3869 3425122% 119% 127% 117% 117% 112% 117% 115% 126% 116% 124% 123%
Sigma
_________________________________________________________________________________________________________________Proportions/Means: Columns Tested (5% risk level) - A/B - C/D - E/F - G/H - I/J - K/L - A/C/E/G/I/K - B/D/F/H/J/LOverlap formulae used.
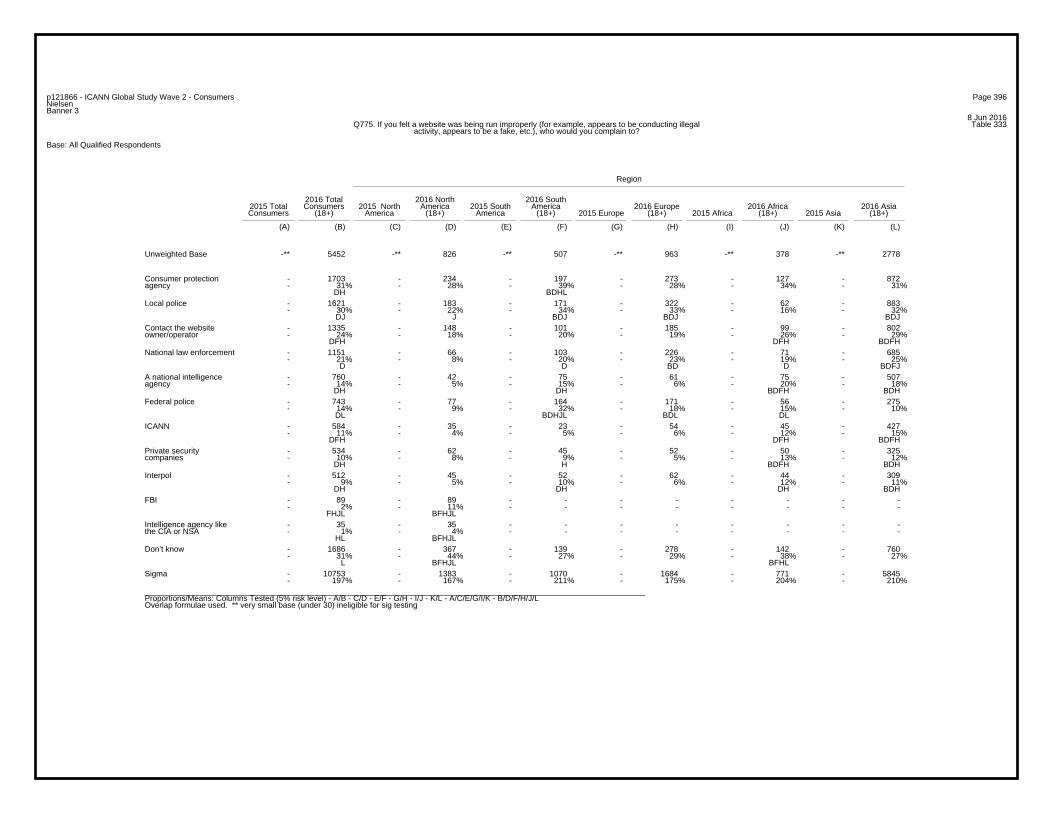
Page 396p121866 - ICANN Global Study Wave 2 - ConsumersNielsenBanner 3
8 Jun 2016Table 333Q775. If you felt a website was being run improperly (for example, appears to be conducting illegal
activity, appears to be a fake, etc.), who would you complain to?
Base: All Qualified Respondents
Region
2016 Total 2016 North 2016 South2015 Total Consumers 2015 North America 2015 South America 2016 Europe 2016 Africa 2016 AsiaConsumers (18+) America (18+) America (18+) 2015 Europe (18+) 2015 Africa (18+) 2015 Asia (18+)
(A) (B) (C) (D) (E) (F) (G) (H) (I) (J) (K) (L)
-** 5452 -** 826 -** 507 -** 963 -** 378 -** 2778Unweighted Base
- 1703 - 234 - 197 - 273 - 127 - 872- 31% - 28% - 39% - 28% - 34% - 31%
DH BDHL
Consumer protectionagency
- 1621 - 183 - 171 - 322 - 62 - 883- 30% - 22% - 34% - 33% - 16% - 32%
DJ J BDJ BDJ BDJ
Local police
- 1335 - 148 - 101 - 185 - 99 - 802- 24% - 18% - 20% - 19% - 26% - 29%
DFH DFH BDFH
Contact the websiteowner/operator
- 1151 - 66 - 103 - 226 - 71 - 685- 21% - 8% - 20% - 23% - 19% - 25%
D D BD D BDFJ
National law enforcement
- 760 - 42 - 75 - 61 - 75 - 507- 14% - 5% - 15% - 6% - 20% - 18%
DH DH BDFH BDH
A national intelligenceagency
- 743 - 77 - 164 - 171 - 56 - 275- 14% - 9% - 32% - 18% - 15% - 10%
DL BDHJL BDL DL
Federal police
- 584 - 35 - 23 - 54 - 45 - 427- 11% - 4% - 5% - 6% - 12% - 15%
DFH DFH BDFH
ICANN
- 534 - 62 - 45 - 52 - 50 - 325- 10% - 8% - 9% - 5% - 13% - 12%
DH H BDFH BDH
Private securitycompanies
- 512 - 45 - 52 - 62 - 44 - 309- 9% - 5% - 10% - 6% - 12% - 11%
DH DH DH BDH
Interpol
- 89 - 89 - - - - - - - -- 2% - 11% - - - - - - - -
FHJL BFHJL
FBI
- 35 - 35 - - - - - - - -- 1% - 4% - - - - - - - -
HL BFHJL
Intelligence agency likethe CIA or NSA
- 1686 - 367 - 139 - 278 - 142 - 760- 31% - 44% - 27% - 29% - 38% - 27%
L BFHJL BFHL
Don’t know
- 10753 - 1383 - 1070 - 1684 - 771 - 5845- 197% - 167% - 211% - 175% - 204% - 210%
Sigma
_________________________________________________________________________________________________________________Proportions/Means: Columns Tested (5% risk level) - A/B - C/D - E/F - G/H - I/J - K/L - A/C/E/G/I/K - B/D/F/H/J/LOverlap formulae used. ** very small base (under 30) ineligible for sig testing
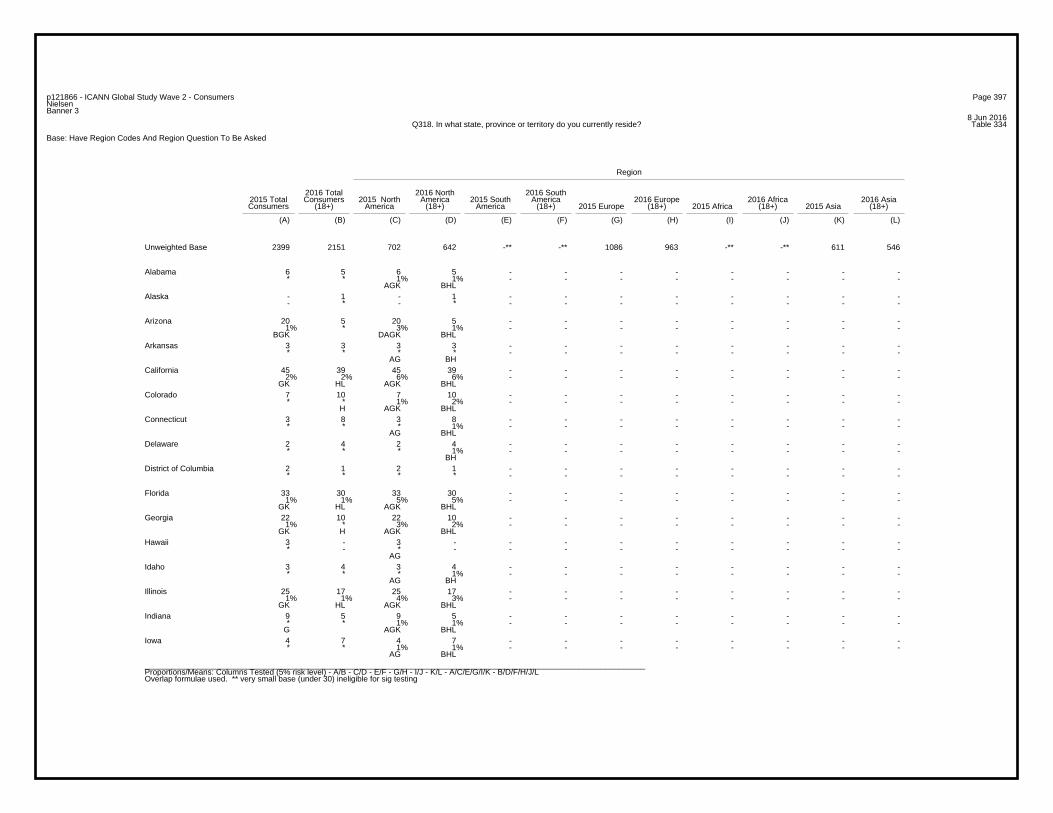
Page 397p121866 - ICANN Global Study Wave 2 - ConsumersNielsenBanner 3
8 Jun 2016Table 334Q318. In what state, province or territory do you currently reside?
Base: Have Region Codes And Region Question To Be Asked
Region
2016 Total 2016 North 2016 South2015 Total Consumers 2015 North America 2015 South America 2016 Europe 2016 Africa 2016 AsiaConsumers (18+) America (18+) America (18+) 2015 Europe (18+) 2015 Africa (18+) 2015 Asia (18+)
(A) (B) (C) (D) (E) (F) (G) (H) (I) (J) (K) (L)
2399 2151 702 642 -** -** 1086 963 -** -** 611 546Unweighted Base
6 5 6 5 - - - - - - - -* * 1% 1% - - - - - - - -
AGK BHL
Alabama
- 1 - 1 - - - - - - - -- * - * - - - - - - - -
Alaska
20 5 20 5 - - - - - - - -1% * 3% 1% - - - - - - - -
BGK DAGK BHL
Arizona
3 3 3 3 - - - - - - - -* * * * - - - - - - - -
AG BH
Arkansas
45 39 45 39 - - - - - - - -2% 2% 6% 6% - - - - - - - -
GK HL AGK BHL
California
7 10 7 10 - - - - - - - -* * 1% 2% - - - - - - - -
H AGK BHL
Colorado
3 8 3 8 - - - - - - - -* * * 1% - - - - - - - -
AG BHL
Connecticut
2 4 2 4 - - - - - - - -* * * 1% - - - - - - - -
BH
Delaware
2 1 2 1 - - - - - - - -* * * * - - - - - - - -
District of Columbia
33 30 33 30 - - - - - - - -1% 1% 5% 5% - - - - - - - -
GK HL AGK BHL
Florida
22 10 22 10 - - - - - - - -1% * 3% 2% - - - - - - - -
GK H AGK BHL
Georgia
3 - 3 - - - - - - - - -* - * - - - - - - - - -
AG
Hawaii
3 4 3 4 - - - - - - - -* * * 1% - - - - - - - -
AG BH
Idaho
25 17 25 17 - - - - - - - -1% 1% 4% 3% - - - - - - - -
GK HL AGK BHL
Illinois
9 5 9 5 - - - - - - - -* * 1% 1% - - - - - - - -
G AGK BHL
Indiana
4 7 4 7 - - - - - - - -* * 1% 1% - - - - - - - -
AG BHL
Iowa
_________________________________________________________________________________________________________________Proportions/Means: Columns Tested (5% risk level) - A/B - C/D - E/F - G/H - I/J - K/L - A/C/E/G/I/K - B/D/F/H/J/LOverlap formulae used. ** very small base (under 30) ineligible for sig testing
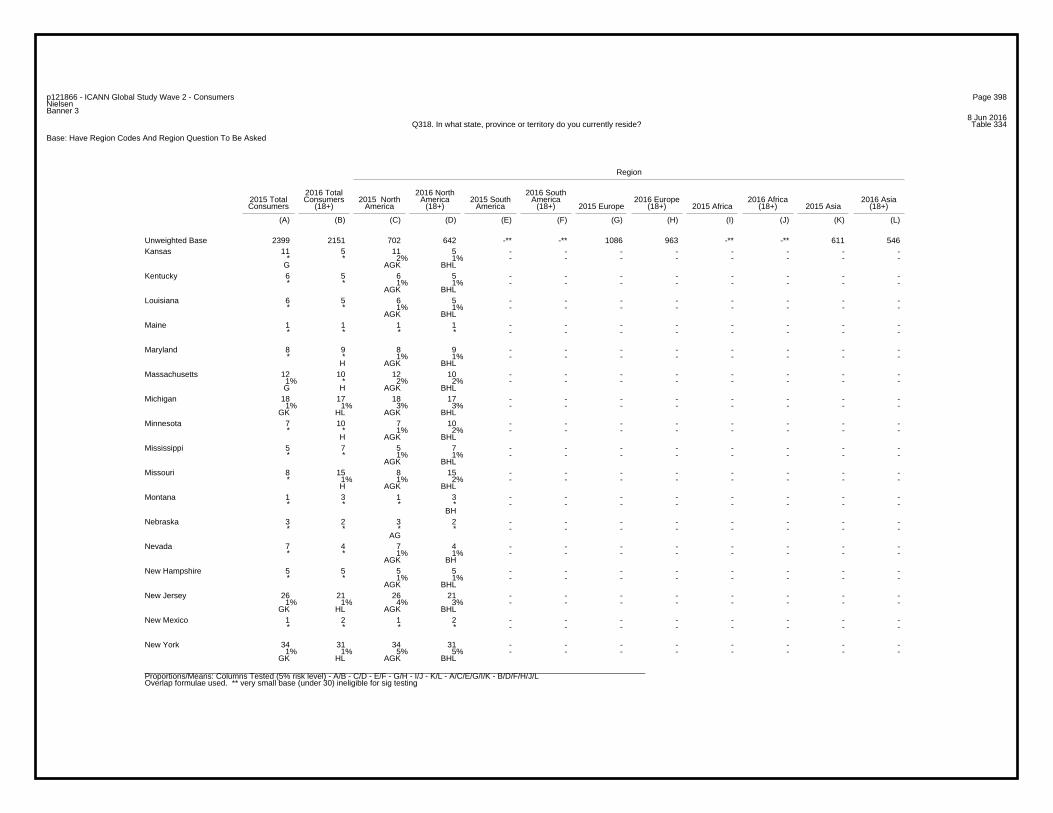
Page 398p121866 - ICANN Global Study Wave 2 - ConsumersNielsenBanner 3
8 Jun 2016Table 334Q318. In what state, province or territory do you currently reside?
Base: Have Region Codes And Region Question To Be Asked
Region
2016 Total 2016 North 2016 South2015 Total Consumers 2015 North America 2015 South America 2016 Europe 2016 Africa 2016 AsiaConsumers (18+) America (18+) America (18+) 2015 Europe (18+) 2015 Africa (18+) 2015 Asia (18+)
(A) (B) (C) (D) (E) (F) (G) (H) (I) (J) (K) (L)
2399 2151 702 642 -** -** 1086 963 -** -** 611 546Unweighted Base11 5 11 5 - - - - - - - -
* * 2% 1% - - - - - - - - G AGK BHL
Kansas
6 5 6 5 - - - - - - - -* * 1% 1% - - - - - - - -
AGK BHL
Kentucky
6 5 6 5 - - - - - - - -* * 1% 1% - - - - - - - -
AGK BHL
Louisiana
1 1 1 1 - - - - - - - -* * * * - - - - - - - -
Maine
8 9 8 9 - - - - - - - -* * 1% 1% - - - - - - - -
H AGK BHL
Maryland
12 10 12 10 - - - - - - - -1% * 2% 2% - - - - - - - - G H AGK BHL
Massachusetts
18 17 18 17 - - - - - - - -1% 1% 3% 3% - - - - - - - -
GK HL AGK BHL
Michigan
7 10 7 10 - - - - - - - -* * 1% 2% - - - - - - - -
H AGK BHL
Minnesota
5 7 5 7 - - - - - - - -* * 1% 1% - - - - - - - -
AGK BHL
Mississippi
8 15 8 15 - - - - - - - -* 1% 1% 2% - - - - - - - -
H AGK BHL
Missouri
1 3 1 3 - - - - - - - -* * * * - - - - - - - -
BH
Montana
3 2 3 2 - - - - - - - -* * * * - - - - - - - -
AG
Nebraska
7 4 7 4 - - - - - - - -* * 1% 1% - - - - - - - -
AGK BH
Nevada
5 5 5 5 - - - - - - - -* * 1% 1% - - - - - - - -
AGK BHL
New Hampshire
26 21 26 21 - - - - - - - -1% 1% 4% 3% - - - - - - - -
GK HL AGK BHL
New Jersey
1 2 1 2 - - - - - - - -* * * * - - - - - - - -
New Mexico
34 31 34 31 - - - - - - - -1% 1% 5% 5% - - - - - - - -
GK HL AGK BHL
New York
_________________________________________________________________________________________________________________Proportions/Means: Columns Tested (5% risk level) - A/B - C/D - E/F - G/H - I/J - K/L - A/C/E/G/I/K - B/D/F/H/J/LOverlap formulae used. ** very small base (under 30) ineligible for sig testing
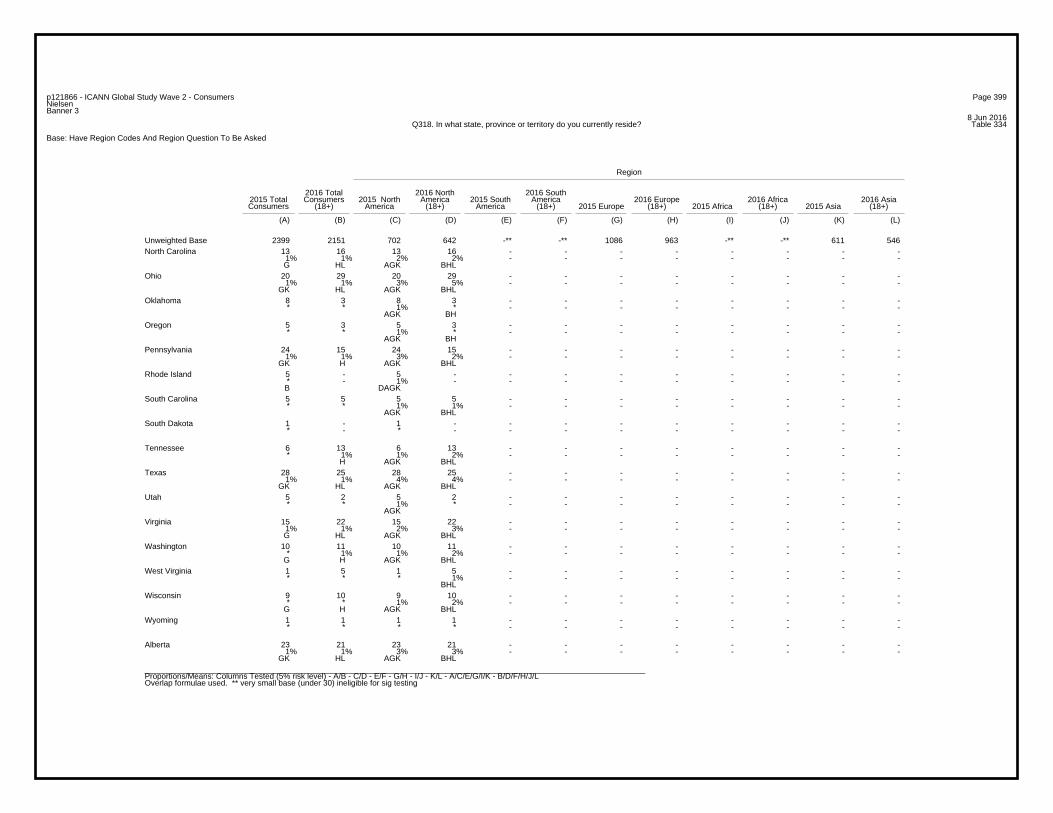
Page 399p121866 - ICANN Global Study Wave 2 - ConsumersNielsenBanner 3
8 Jun 2016Table 334Q318. In what state, province or territory do you currently reside?
Base: Have Region Codes And Region Question To Be Asked
Region
2016 Total 2016 North 2016 South2015 Total Consumers 2015 North America 2015 South America 2016 Europe 2016 Africa 2016 AsiaConsumers (18+) America (18+) America (18+) 2015 Europe (18+) 2015 Africa (18+) 2015 Asia (18+)
(A) (B) (C) (D) (E) (F) (G) (H) (I) (J) (K) (L)
2399 2151 702 642 -** -** 1086 963 -** -** 611 546Unweighted Base13 16 13 16 - - - - - - - -
1% 1% 2% 2% - - - - - - - - G HL AGK BHL
North Carolina
20 29 20 29 - - - - - - - -1% 1% 3% 5% - - - - - - - -
GK HL AGK BHL
Ohio
8 3 8 3 - - - - - - - -* * 1% * - - - - - - - -
AGK BH
Oklahoma
5 3 5 3 - - - - - - - -* * 1% * - - - - - - - -
AGK BH
Oregon
24 15 24 15 - - - - - - - -1% 1% 3% 2% - - - - - - - -
GK H AGK BHL
Pennsylvania
5 - 5 - - - - - - - - -* - 1% - - - - - - - - - B DAGK
Rhode Island
5 5 5 5 - - - - - - - -* * 1% 1% - - - - - - - -
AGK BHL
South Carolina
1 - 1 - - - - - - - - -* - * - - - - - - - - -
South Dakota
6 13 6 13 - - - - - - - -* 1% 1% 2% - - - - - - - -
H AGK BHL
Tennessee
28 25 28 25 - - - - - - - -1% 1% 4% 4% - - - - - - - -
GK HL AGK BHL
Texas
5 2 5 2 - - - - - - - -* * 1% * - - - - - - - -
AGK
Utah
15 22 15 22 - - - - - - - -1% 1% 2% 3% - - - - - - - - G HL AGK BHL
Virginia
10 11 10 11 - - - - - - - -* 1% 1% 2% - - - - - - - -
G H AGK BHL
Washington
1 5 1 5 - - - - - - - -* * * 1% - - - - - - - -
BHL
West Virginia
9 10 9 10 - - - - - - - -* * 1% 2% - - - - - - - -
G H AGK BHL
Wisconsin
1 1 1 1 - - - - - - - -* * * * - - - - - - - -
Wyoming
23 21 23 21 - - - - - - - -1% 1% 3% 3% - - - - - - - -
GK HL AGK BHL
Alberta
_________________________________________________________________________________________________________________Proportions/Means: Columns Tested (5% risk level) - A/B - C/D - E/F - G/H - I/J - K/L - A/C/E/G/I/K - B/D/F/H/J/LOverlap formulae used. ** very small base (under 30) ineligible for sig testing
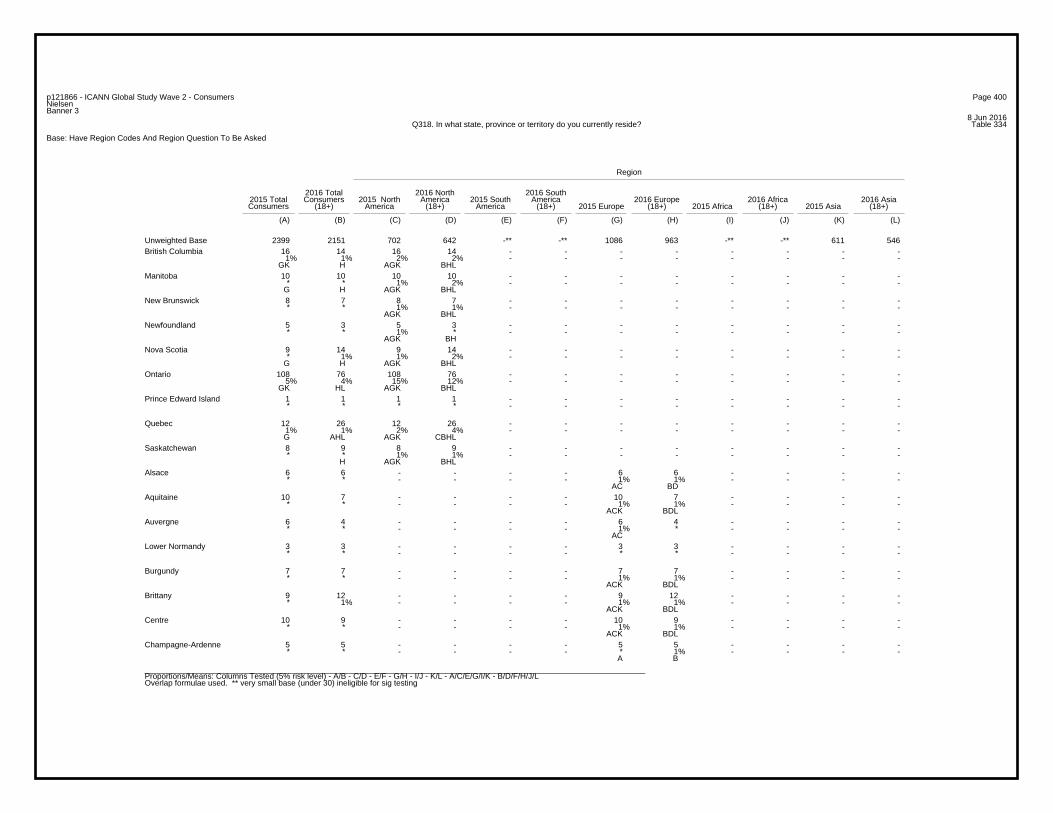
Page 400p121866 - ICANN Global Study Wave 2 - ConsumersNielsenBanner 3
8 Jun 2016Table 334Q318. In what state, province or territory do you currently reside?
Base: Have Region Codes And Region Question To Be Asked
Region
2016 Total 2016 North 2016 South2015 Total Consumers 2015 North America 2015 South America 2016 Europe 2016 Africa 2016 AsiaConsumers (18+) America (18+) America (18+) 2015 Europe (18+) 2015 Africa (18+) 2015 Asia (18+)
(A) (B) (C) (D) (E) (F) (G) (H) (I) (J) (K) (L)
2399 2151 702 642 -** -** 1086 963 -** -** 611 546Unweighted Base16 14 16 14 - - - - - - - -
1% 1% 2% 2% - - - - - - - - GK H AGK BHL
British Columbia
10 10 10 10 - - - - - - - -* * 1% 2% - - - - - - - -
G H AGK BHL
Manitoba
8 7 8 7 - - - - - - - -* * 1% 1% - - - - - - - -
AGK BHL
New Brunswick
5 3 5 3 - - - - - - - -* * 1% * - - - - - - - -
AGK BH
Newfoundland
9 14 9 14 - - - - - - - -* 1% 1% 2% - - - - - - - -
G H AGK BHL
Nova Scotia
108 76 108 76 - - - - - - - -5% 4% 15% 12% - - - - - - - -
GK HL AGK BHL
Ontario
1 1 1 1 - - - - - - - -* * * * - - - - - - - -
Prince Edward Island
12 26 12 26 - - - - - - - -1% 1% 2% 4% - - - - - - - - G AHL AGK CBHL
Quebec
8 9 8 9 - - - - - - - -* * 1% 1% - - - - - - - -
H AGK BHL
Saskatchewan
6 6 - - - - 6 6 - - - -* * - - - - 1% 1% - - - -
AC BD
Alsace
10 7 - - - - 10 7 - - - -* * - - - - 1% 1% - - - -
ACK BDL
Aquitaine
6 4 - - - - 6 4 - - - -* * - - - - 1% * - - - -
AC
Auvergne
3 3 - - - - 3 3 - - - -* * - - - - * * - - - -
Lower Normandy
7 7 - - - - 7 7 - - - -* * - - - - 1% 1% - - - -
ACK BDL
Burgundy
9 12 - - - - 9 12 - - - -* 1% - - - - 1% 1% - - - -
ACK BDL
Brittany
10 9 - - - - 10 9 - - - -* * - - - - 1% 1% - - - -
ACK BDL
Centre
5 5 - - - - 5 5 - - - -* * - - - - * 1% - - - -
A B
Champagne-Ardenne
_________________________________________________________________________________________________________________Proportions/Means: Columns Tested (5% risk level) - A/B - C/D - E/F - G/H - I/J - K/L - A/C/E/G/I/K - B/D/F/H/J/LOverlap formulae used. ** very small base (under 30) ineligible for sig testing
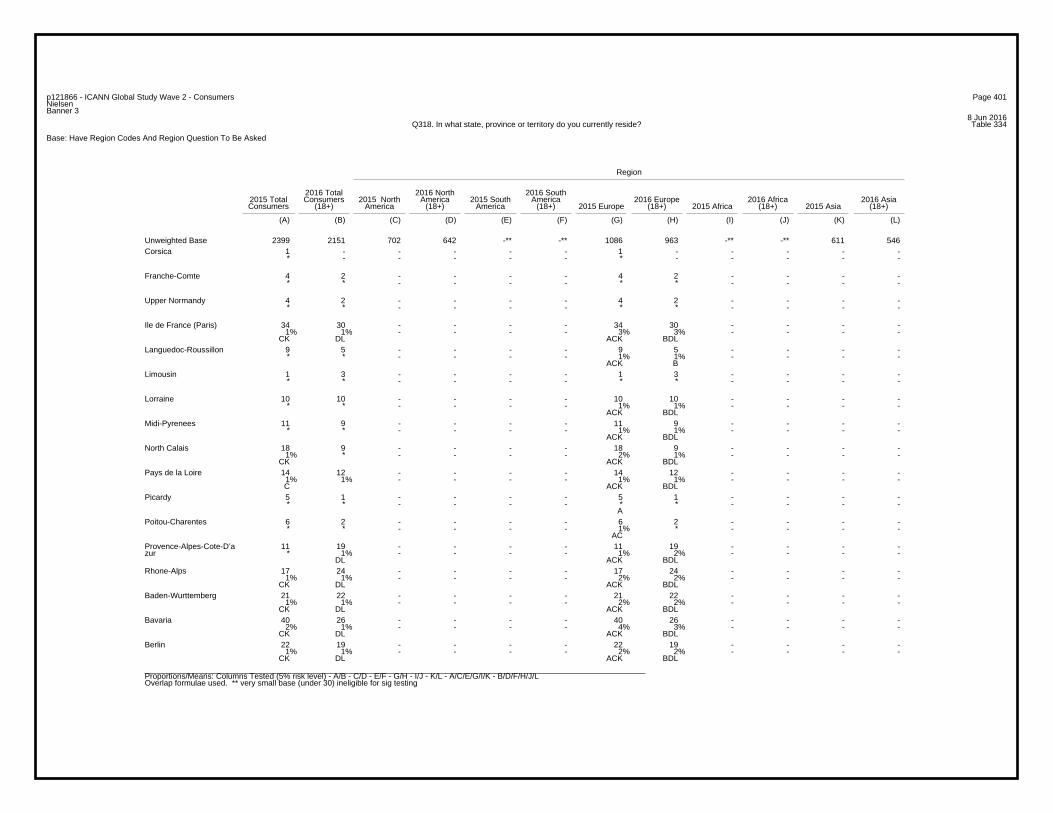
Page 401p121866 - ICANN Global Study Wave 2 - ConsumersNielsenBanner 3
8 Jun 2016Table 334Q318. In what state, province or territory do you currently reside?
Base: Have Region Codes And Region Question To Be Asked
Region
2016 Total 2016 North 2016 South2015 Total Consumers 2015 North America 2015 South America 2016 Europe 2016 Africa 2016 AsiaConsumers (18+) America (18+) America (18+) 2015 Europe (18+) 2015 Africa (18+) 2015 Asia (18+)
(A) (B) (C) (D) (E) (F) (G) (H) (I) (J) (K) (L)
2399 2151 702 642 -** -** 1086 963 -** -** 611 546Unweighted Base1 - - - - - 1 - - - - -* - - - - - * - - - - -
Corsica
4 2 - - - - 4 2 - - - -* * - - - - * * - - - -
Franche-Comte
4 2 - - - - 4 2 - - - -* * - - - - * * - - - -
Upper Normandy
34 30 - - - - 34 30 - - - -1% 1% - - - - 3% 3% - - - -
CK DL ACK BDL
Ile de France (Paris)
9 5 - - - - 9 5 - - - -* * - - - - 1% 1% - - - -
ACK B
Languedoc-Roussillon
1 3 - - - - 1 3 - - - -* * - - - - * * - - - -
Limousin
10 10 - - - - 10 10 - - - -* * - - - - 1% 1% - - - -
ACK BDL
Lorraine
11 9 - - - - 11 9 - - - -* * - - - - 1% 1% - - - -
ACK BDL
Midi-Pyrenees
18 9 - - - - 18 9 - - - -1% * - - - - 2% 1% - - - -
CK ACK BDL
North Calais
14 12 - - - - 14 12 - - - -1% 1% - - - - 1% 1% - - - - C ACK BDL
Pays de la Loire
5 1 - - - - 5 1 - - - -* * - - - - * * - - - -
A
Picardy
6 2 - - - - 6 2 - - - -* * - - - - 1% * - - - -
AC
Poitou-Charentes
11 19 - - - - 11 19 - - - -* 1% - - - - 1% 2% - - - -
DL ACK BDL
Provence-Alpes-Cote-D’azur
17 24 - - - - 17 24 - - - -1% 1% - - - - 2% 2% - - - -
CK DL ACK BDL
Rhone-Alps
21 22 - - - - 21 22 - - - -1% 1% - - - - 2% 2% - - - -
CK DL ACK BDL
Baden-Wurttemberg
40 26 - - - - 40 26 - - - -2% 1% - - - - 4% 3% - - - -
CK DL ACK BDL
Bavaria
22 19 - - - - 22 19 - - - -1% 1% - - - - 2% 2% - - - -
CK DL ACK BDL
Berlin
_________________________________________________________________________________________________________________Proportions/Means: Columns Tested (5% risk level) - A/B - C/D - E/F - G/H - I/J - K/L - A/C/E/G/I/K - B/D/F/H/J/LOverlap formulae used. ** very small base (under 30) ineligible for sig testing
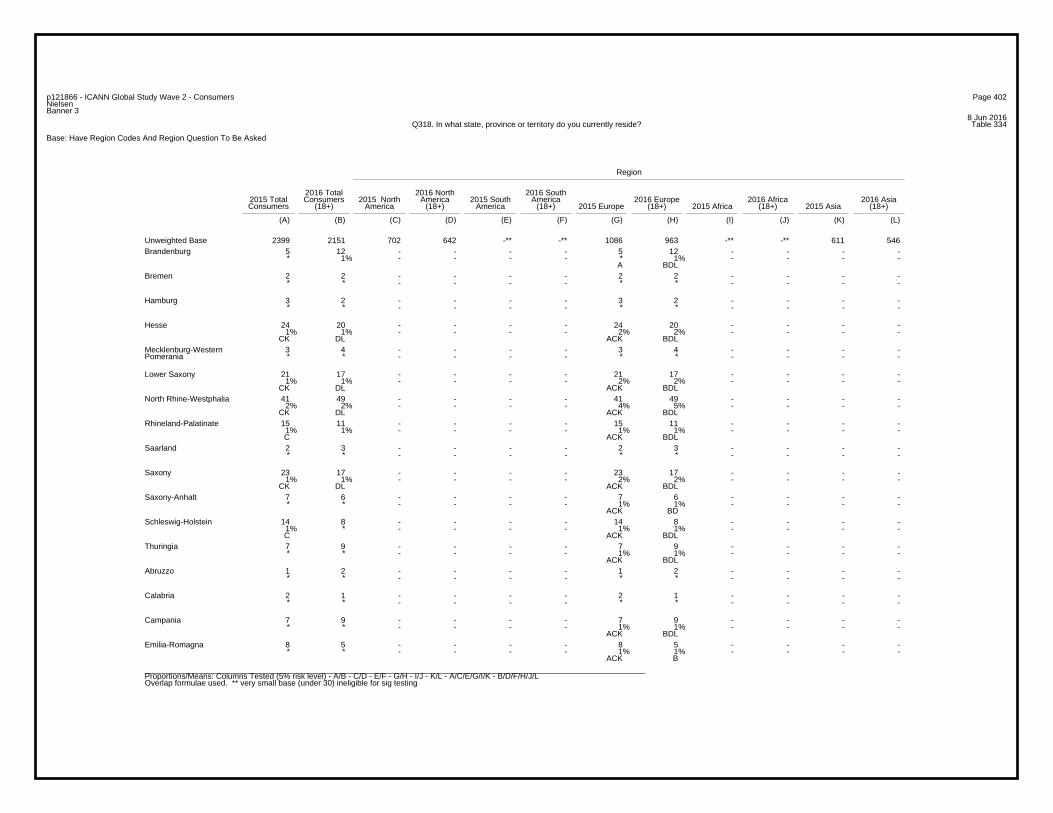
Page 402p121866 - ICANN Global Study Wave 2 - ConsumersNielsenBanner 3
8 Jun 2016Table 334Q318. In what state, province or territory do you currently reside?
Base: Have Region Codes And Region Question To Be Asked
Region
2016 Total 2016 North 2016 South2015 Total Consumers 2015 North America 2015 South America 2016 Europe 2016 Africa 2016 AsiaConsumers (18+) America (18+) America (18+) 2015 Europe (18+) 2015 Africa (18+) 2015 Asia (18+)
(A) (B) (C) (D) (E) (F) (G) (H) (I) (J) (K) (L)
2399 2151 702 642 -** -** 1086 963 -** -** 611 546Unweighted Base5 12 - - - - 5 12 - - - -* 1% - - - - * 1% - - - -
A BDL
Brandenburg
2 2 - - - - 2 2 - - - -* * - - - - * * - - - -
Bremen
3 2 - - - - 3 2 - - - -* * - - - - * * - - - -
Hamburg
24 20 - - - - 24 20 - - - -1% 1% - - - - 2% 2% - - - -
CK DL ACK BDL
Hesse
3 4 - - - - 3 4 - - - -* * - - - - * * - - - -
Mecklenburg-WesternPomerania
21 17 - - - - 21 17 - - - -1% 1% - - - - 2% 2% - - - -
CK DL ACK BDL
Lower Saxony
41 49 - - - - 41 49 - - - -2% 2% - - - - 4% 5% - - - -
CK DL ACK BDL
North Rhine-Westphalia
15 11 - - - - 15 11 - - - -1% 1% - - - - 1% 1% - - - - C ACK BDL
Rhineland-Palatinate
2 3 - - - - 2 3 - - - -* * - - - - * * - - - -
Saarland
23 17 - - - - 23 17 - - - -1% 1% - - - - 2% 2% - - - -
CK DL ACK BDL
Saxony
7 6 - - - - 7 6 - - - -* * - - - - 1% 1% - - - -
ACK BD
Saxony-Anhalt
14 8 - - - - 14 8 - - - -1% * - - - - 1% 1% - - - - C ACK BDL
Schleswig-Holstein
7 9 - - - - 7 9 - - - -* * - - - - 1% 1% - - - -
ACK BDL
Thuringia
1 2 - - - - 1 2 - - - -* * - - - - * * - - - -
Abruzzo
2 1 - - - - 2 1 - - - -* * - - - - * * - - - -
Calabria
7 9 - - - - 7 9 - - - -* * - - - - 1% 1% - - - -
ACK BDL
Campania
8 5 - - - - 8 5 - - - -* * - - - - 1% 1% - - - -
ACK B
Emilia-Romagna
_________________________________________________________________________________________________________________Proportions/Means: Columns Tested (5% risk level) - A/B - C/D - E/F - G/H - I/J - K/L - A/C/E/G/I/K - B/D/F/H/J/LOverlap formulae used. ** very small base (under 30) ineligible for sig testing
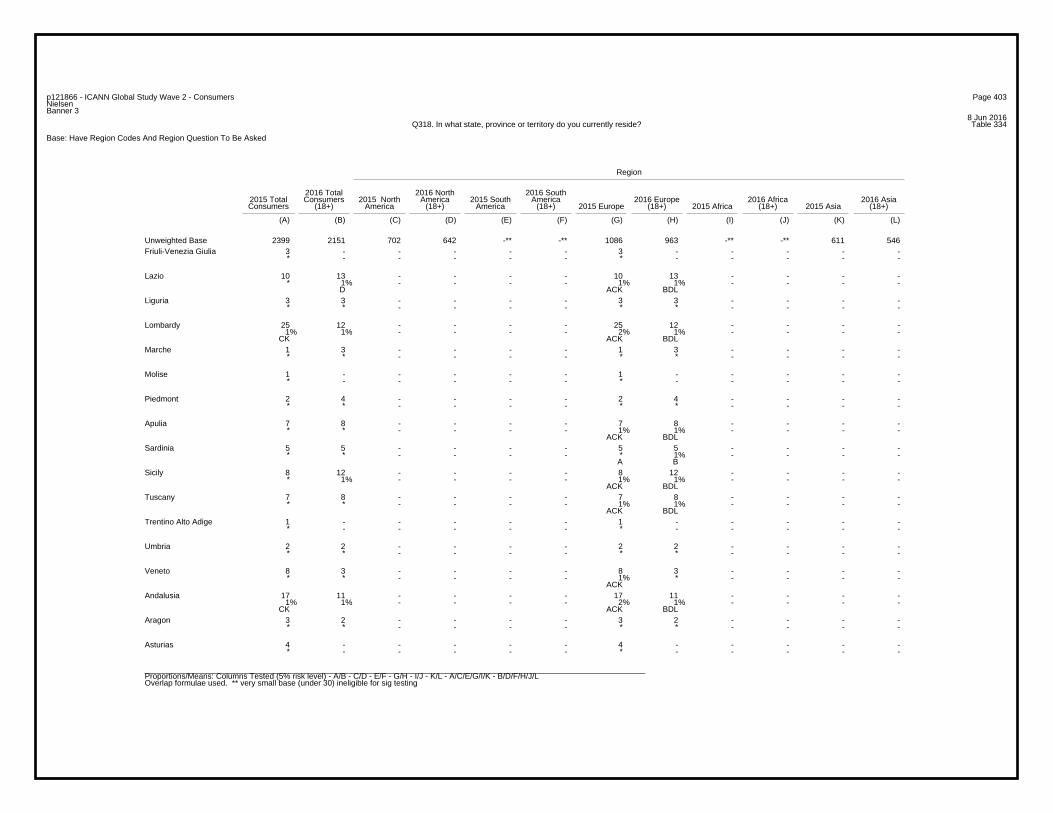
Page 403p121866 - ICANN Global Study Wave 2 - ConsumersNielsenBanner 3
8 Jun 2016Table 334Q318. In what state, province or territory do you currently reside?
Base: Have Region Codes And Region Question To Be Asked
Region
2016 Total 2016 North 2016 South2015 Total Consumers 2015 North America 2015 South America 2016 Europe 2016 Africa 2016 AsiaConsumers (18+) America (18+) America (18+) 2015 Europe (18+) 2015 Africa (18+) 2015 Asia (18+)
(A) (B) (C) (D) (E) (F) (G) (H) (I) (J) (K) (L)
2399 2151 702 642 -** -** 1086 963 -** -** 611 546Unweighted Base3 - - - - - 3 - - - - -* - - - - - * - - - - -
Friuli-Venezia Giulia
10 13 - - - - 10 13 - - - -* 1% - - - - 1% 1% - - - -
D ACK BDL
Lazio
3 3 - - - - 3 3 - - - -* * - - - - * * - - - -
Liguria
25 12 - - - - 25 12 - - - -1% 1% - - - - 2% 1% - - - -
CK ACK BDL
Lombardy
1 3 - - - - 1 3 - - - -* * - - - - * * - - - -
Marche
1 - - - - - 1 - - - - -* - - - - - * - - - - -
Molise
2 4 - - - - 2 4 - - - -* * - - - - * * - - - -
Piedmont
7 8 - - - - 7 8 - - - -* * - - - - 1% 1% - - - -
ACK BDL
Apulia
5 5 - - - - 5 5 - - - -* * - - - - * 1% - - - -
A B
Sardinia
8 12 - - - - 8 12 - - - -* 1% - - - - 1% 1% - - - -
ACK BDL
Sicily
7 8 - - - - 7 8 - - - -* * - - - - 1% 1% - - - -
ACK BDL
Tuscany
1 - - - - - 1 - - - - -* - - - - - * - - - - -
Trentino Alto Adige
2 2 - - - - 2 2 - - - -* * - - - - * * - - - -
Umbria
8 3 - - - - 8 3 - - - -* * - - - - 1% * - - - -
ACK
Veneto
17 11 - - - - 17 11 - - - -1% 1% - - - - 2% 1% - - - -
CK ACK BDL
Andalusia
3 2 - - - - 3 2 - - - -* * - - - - * * - - - -
Aragon
4 - - - - - 4 - - - - -* - - - - - * - - - - -
Asturias
_________________________________________________________________________________________________________________Proportions/Means: Columns Tested (5% risk level) - A/B - C/D - E/F - G/H - I/J - K/L - A/C/E/G/I/K - B/D/F/H/J/LOverlap formulae used. ** very small base (under 30) ineligible for sig testing
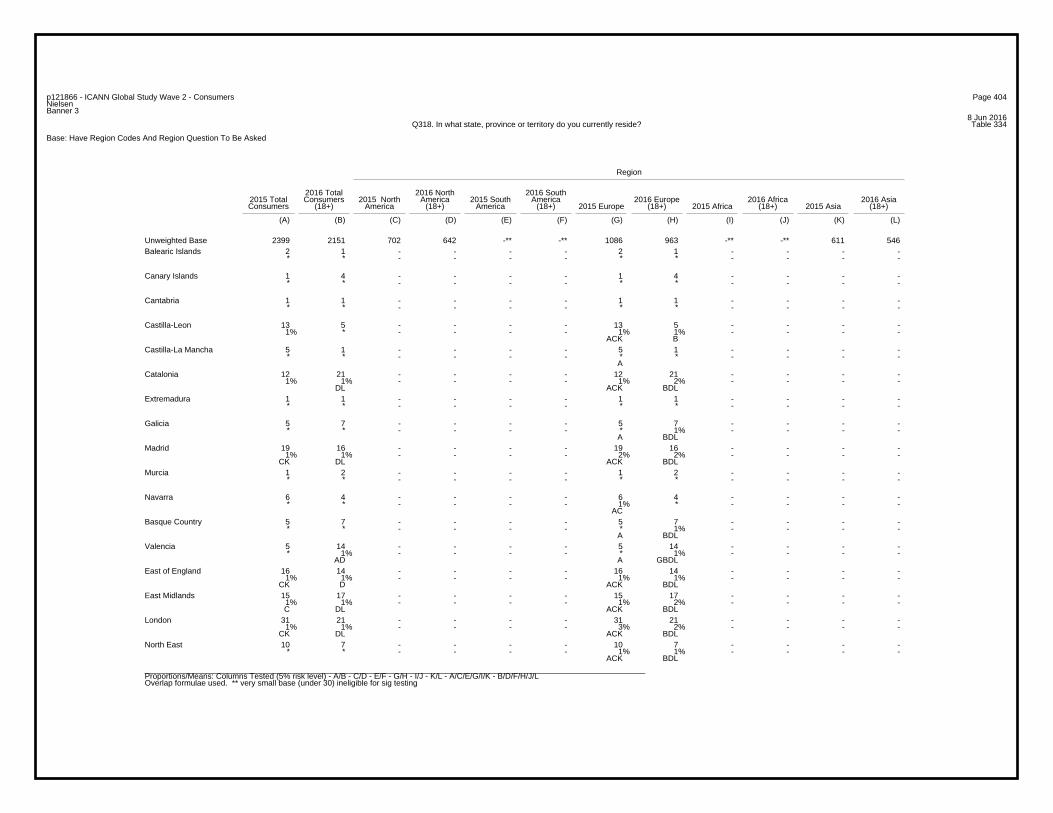
Page 404p121866 - ICANN Global Study Wave 2 - ConsumersNielsenBanner 3
8 Jun 2016Table 334Q318. In what state, province or territory do you currently reside?
Base: Have Region Codes And Region Question To Be Asked
Region
2016 Total 2016 North 2016 South2015 Total Consumers 2015 North America 2015 South America 2016 Europe 2016 Africa 2016 AsiaConsumers (18+) America (18+) America (18+) 2015 Europe (18+) 2015 Africa (18+) 2015 Asia (18+)
(A) (B) (C) (D) (E) (F) (G) (H) (I) (J) (K) (L)
2399 2151 702 642 -** -** 1086 963 -** -** 611 546Unweighted Base2 1 - - - - 2 1 - - - -* * - - - - * * - - - -
Balearic Islands
1 4 - - - - 1 4 - - - -* * - - - - * * - - - -
Canary Islands
1 1 - - - - 1 1 - - - -* * - - - - * * - - - -
Cantabria
13 5 - - - - 13 5 - - - -1% * - - - - 1% 1% - - - -
ACK B
Castilla-Leon
5 1 - - - - 5 1 - - - -* * - - - - * * - - - -
A
Castilla-La Mancha
12 21 - - - - 12 21 - - - -1% 1% - - - - 1% 2% - - - -
DL ACK BDL
Catalonia
1 1 - - - - 1 1 - - - -* * - - - - * * - - - -
Extremadura
5 7 - - - - 5 7 - - - -* * - - - - * 1% - - - -
A BDL
Galicia
19 16 - - - - 19 16 - - - -1% 1% - - - - 2% 2% - - - -
CK DL ACK BDL
Madrid
1 2 - - - - 1 2 - - - -* * - - - - * * - - - -
Murcia
6 4 - - - - 6 4 - - - -* * - - - - 1% * - - - -
AC
Navarra
5 7 - - - - 5 7 - - - -* * - - - - * 1% - - - -
A BDL
Basque Country
5 14 - - - - 5 14 - - - -* 1% - - - - * 1% - - - -
AD A GBDL
Valencia
16 14 - - - - 16 14 - - - -1% 1% - - - - 1% 1% - - - -
CK D ACK BDL
East of England
15 17 - - - - 15 17 - - - -1% 1% - - - - 1% 2% - - - - C DL ACK BDL
East Midlands
31 21 - - - - 31 21 - - - -1% 1% - - - - 3% 2% - - - -
CK DL ACK BDL
London
10 7 - - - - 10 7 - - - -* * - - - - 1% 1% - - - -
ACK BDL
North East
_________________________________________________________________________________________________________________Proportions/Means: Columns Tested (5% risk level) - A/B - C/D - E/F - G/H - I/J - K/L - A/C/E/G/I/K - B/D/F/H/J/LOverlap formulae used. ** very small base (under 30) ineligible for sig testing
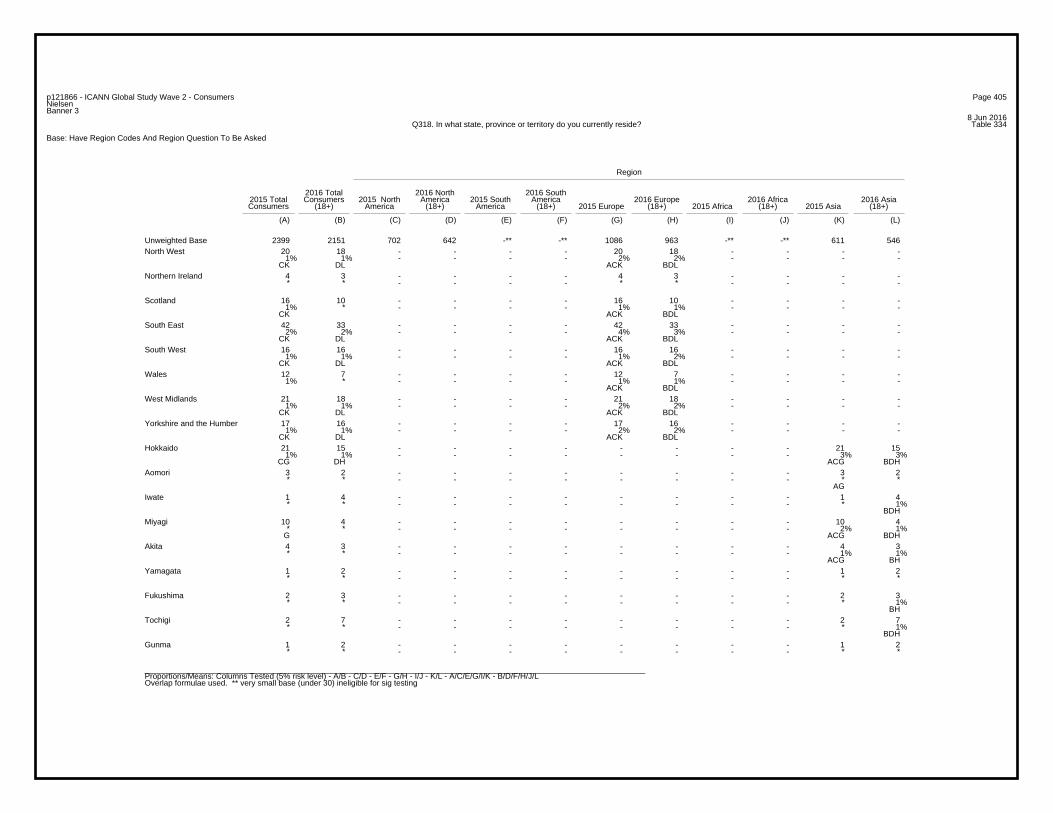
Page 405p121866 - ICANN Global Study Wave 2 - ConsumersNielsenBanner 3
8 Jun 2016Table 334Q318. In what state, province or territory do you currently reside?
Base: Have Region Codes And Region Question To Be Asked
Region
2016 Total 2016 North 2016 South2015 Total Consumers 2015 North America 2015 South America 2016 Europe 2016 Africa 2016 AsiaConsumers (18+) America (18+) America (18+) 2015 Europe (18+) 2015 Africa (18+) 2015 Asia (18+)
(A) (B) (C) (D) (E) (F) (G) (H) (I) (J) (K) (L)
2399 2151 702 642 -** -** 1086 963 -** -** 611 546Unweighted Base20 18 - - - - 20 18 - - - -
1% 1% - - - - 2% 2% - - - - CK DL ACK BDL
North West
4 3 - - - - 4 3 - - - -* * - - - - * * - - - -
Northern Ireland
16 10 - - - - 16 10 - - - -1% * - - - - 1% 1% - - - -
CK ACK BDL
Scotland
42 33 - - - - 42 33 - - - -2% 2% - - - - 4% 3% - - - -
CK DL ACK BDL
South East
16 16 - - - - 16 16 - - - -1% 1% - - - - 1% 2% - - - -
CK DL ACK BDL
South West
12 7 - - - - 12 7 - - - -1% * - - - - 1% 1% - - - -
ACK BDL
Wales
21 18 - - - - 21 18 - - - -1% 1% - - - - 2% 2% - - - -
CK DL ACK BDL
West Midlands
17 16 - - - - 17 16 - - - -1% 1% - - - - 2% 2% - - - -
CK DL ACK BDL
Yorkshire and the Humber
21 15 - - - - - - - - 21 151% 1% - - - - - - - - 3% 3%
CG DH ACG BDH
Hokkaido
3 2 - - - - - - - - 3 2* * - - - - - - - - * *
AG
Aomori
1 4 - - - - - - - - 1 4* * - - - - - - - - * 1%
BDH
Iwate
10 4 - - - - - - - - 10 4* * - - - - - - - - 2% 1%
G ACG BDH
Miyagi
4 3 - - - - - - - - 4 3* * - - - - - - - - 1% 1%
ACG BH
Akita
1 2 - - - - - - - - 1 2* * - - - - - - - - * *
Yamagata
2 3 - - - - - - - - 2 3* * - - - - - - - - * 1%
BH
Fukushima
2 7 - - - - - - - - 2 7* * - - - - - - - - * 1%
BDH
Tochigi
1 2 - - - - - - - - 1 2* * - - - - - - - - * *
Gunma
_________________________________________________________________________________________________________________Proportions/Means: Columns Tested (5% risk level) - A/B - C/D - E/F - G/H - I/J - K/L - A/C/E/G/I/K - B/D/F/H/J/LOverlap formulae used. ** very small base (under 30) ineligible for sig testing
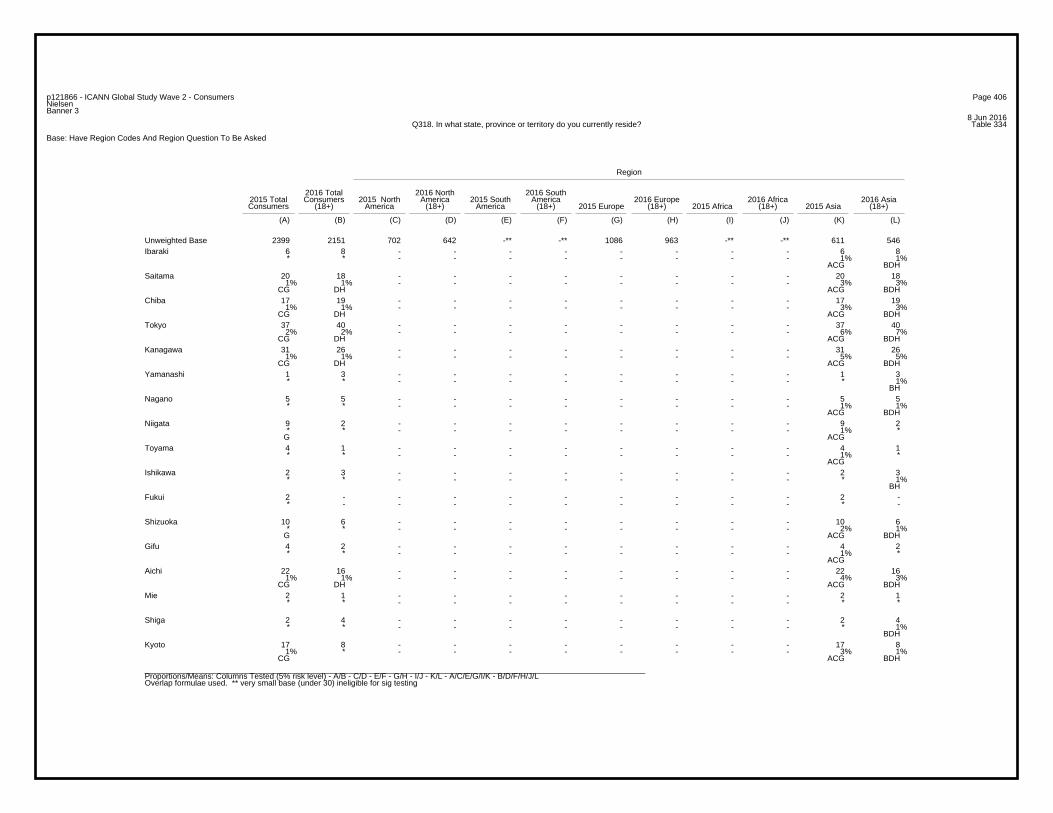
Page 406p121866 - ICANN Global Study Wave 2 - ConsumersNielsenBanner 3
8 Jun 2016Table 334Q318. In what state, province or territory do you currently reside?
Base: Have Region Codes And Region Question To Be Asked
Region
2016 Total 2016 North 2016 South2015 Total Consumers 2015 North America 2015 South America 2016 Europe 2016 Africa 2016 AsiaConsumers (18+) America (18+) America (18+) 2015 Europe (18+) 2015 Africa (18+) 2015 Asia (18+)
(A) (B) (C) (D) (E) (F) (G) (H) (I) (J) (K) (L)
2399 2151 702 642 -** -** 1086 963 -** -** 611 546Unweighted Base6 8 - - - - - - - - 6 8* * - - - - - - - - 1% 1%
ACG BDH
Ibaraki
20 18 - - - - - - - - 20 181% 1% - - - - - - - - 3% 3%
CG DH ACG BDH
Saitama
17 19 - - - - - - - - 17 191% 1% - - - - - - - - 3% 3%
CG DH ACG BDH
Chiba
37 40 - - - - - - - - 37 402% 2% - - - - - - - - 6% 7%
CG DH ACG BDH
Tokyo
31 26 - - - - - - - - 31 261% 1% - - - - - - - - 5% 5%
CG DH ACG BDH
Kanagawa
1 3 - - - - - - - - 1 3* * - - - - - - - - * 1%
BH
Yamanashi
5 5 - - - - - - - - 5 5* * - - - - - - - - 1% 1%
ACG BDH
Nagano
9 2 - - - - - - - - 9 2* * - - - - - - - - 1% *
G ACG
Niigata
4 1 - - - - - - - - 4 1* * - - - - - - - - 1% *
ACG
Toyama
2 3 - - - - - - - - 2 3* * - - - - - - - - * 1%
BH
Ishikawa
2 - - - - - - - - - 2 -* - - - - - - - - - * -
Fukui
10 6 - - - - - - - - 10 6* * - - - - - - - - 2% 1%
G ACG BDH
Shizuoka
4 2 - - - - - - - - 4 2* * - - - - - - - - 1% *
ACG
Gifu
22 16 - - - - - - - - 22 161% 1% - - - - - - - - 4% 3%
CG DH ACG BDH
Aichi
2 1 - - - - - - - - 2 1* * - - - - - - - - * *
Mie
2 4 - - - - - - - - 2 4* * - - - - - - - - * 1%
BDH
Shiga
17 8 - - - - - - - - 17 81% * - - - - - - - - 3% 1%
CG ACG BDH
Kyoto
_________________________________________________________________________________________________________________Proportions/Means: Columns Tested (5% risk level) - A/B - C/D - E/F - G/H - I/J - K/L - A/C/E/G/I/K - B/D/F/H/J/LOverlap formulae used. ** very small base (under 30) ineligible for sig testing
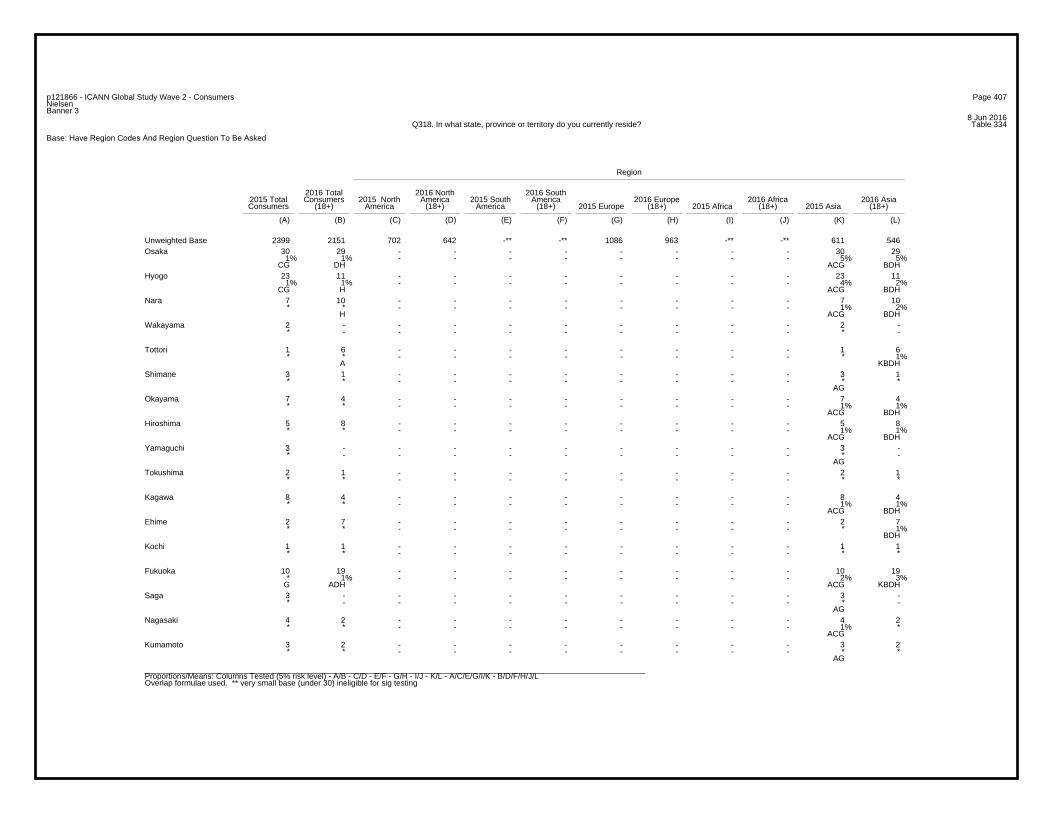
Page 407p121866 - ICANN Global Study Wave 2 - ConsumersNielsenBanner 3
8 Jun 2016Table 334Q318. In what state, province or territory do you currently reside?
Base: Have Region Codes And Region Question To Be Asked
Region
2016 Total 2016 North 2016 South2015 Total Consumers 2015 North America 2015 South America 2016 Europe 2016 Africa 2016 AsiaConsumers (18+) America (18+) America (18+) 2015 Europe (18+) 2015 Africa (18+) 2015 Asia (18+)
(A) (B) (C) (D) (E) (F) (G) (H) (I) (J) (K) (L)
2399 2151 702 642 -** -** 1086 963 -** -** 611 546Unweighted Base30 29 - - - - - - - - 30 29
1% 1% - - - - - - - - 5% 5%CG DH ACG BDH
Osaka
23 11 - - - - - - - - 23 111% 1% - - - - - - - - 4% 2%
CG H ACG BDH
Hyogo
7 10 - - - - - - - - 7 10* * - - - - - - - - 1% 2%
H ACG BDH
Nara
2 - - - - - - - - - 2 -* - - - - - - - - - * -
Wakayama
1 6 - - - - - - - - 1 6* * - - - - - - - - * 1%
A KBDH
Tottori
3 1 - - - - - - - - 3 1* * - - - - - - - - * *
AG
Shimane
7 4 - - - - - - - - 7 4* * - - - - - - - - 1% 1%
ACG BDH
Okayama
5 8 - - - - - - - - 5 8* * - - - - - - - - 1% 1%
ACG BDH
Hiroshima
3 - - - - - - - - - 3 -* - - - - - - - - - * -
AG
Yamaguchi
2 1 - - - - - - - - 2 1* * - - - - - - - - * *
Tokushima
8 4 - - - - - - - - 8 4* * - - - - - - - - 1% 1%
ACG BDH
Kagawa
2 7 - - - - - - - - 2 7* * - - - - - - - - * 1%
BDH
Ehime
1 1 - - - - - - - - 1 1* * - - - - - - - - * *
Kochi
10 19 - - - - - - - - 10 19* 1% - - - - - - - - 2% 3%
G ADH ACG KBDH
Fukuoka
3 - - - - - - - - - 3 -* - - - - - - - - - * -
AG
Saga
4 2 - - - - - - - - 4 2* * - - - - - - - - 1% *
ACG
Nagasaki
3 2 - - - - - - - - 3 2* * - - - - - - - - * *
AG
Kumamoto
_________________________________________________________________________________________________________________Proportions/Means: Columns Tested (5% risk level) - A/B - C/D - E/F - G/H - I/J - K/L - A/C/E/G/I/K - B/D/F/H/J/LOverlap formulae used. ** very small base (under 30) ineligible for sig testing
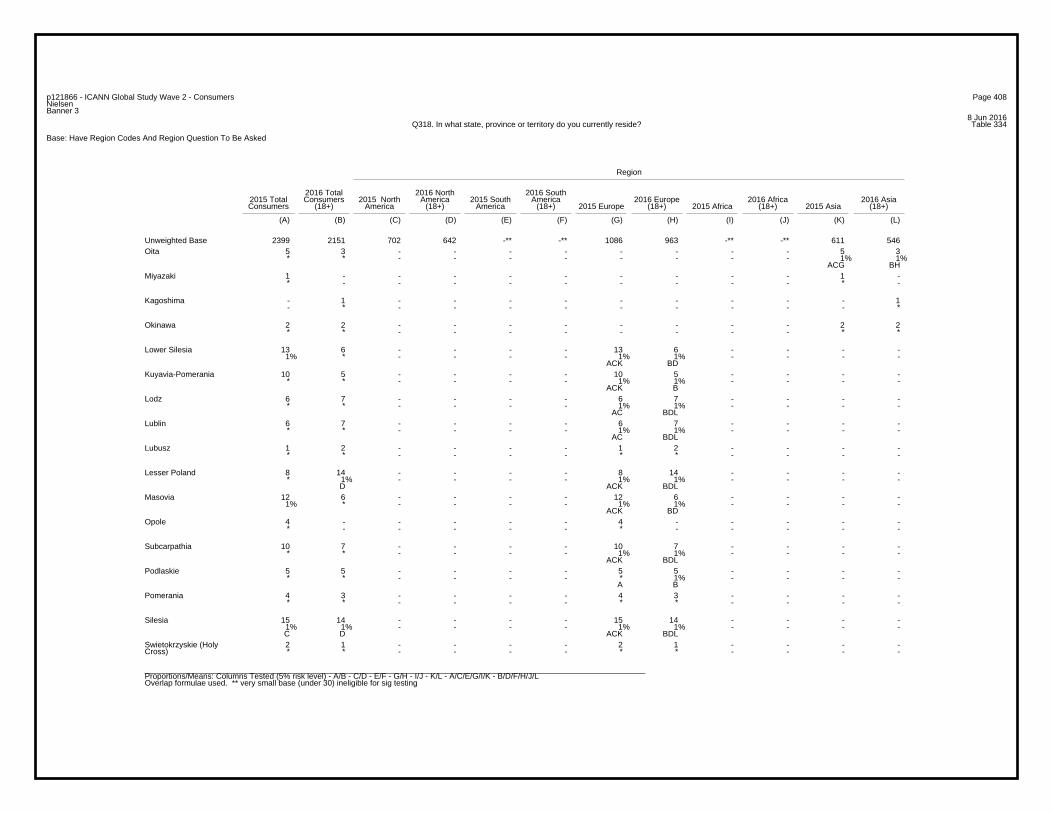
Page 408p121866 - ICANN Global Study Wave 2 - ConsumersNielsenBanner 3
8 Jun 2016Table 334Q318. In what state, province or territory do you currently reside?
Base: Have Region Codes And Region Question To Be Asked
Region
2016 Total 2016 North 2016 South2015 Total Consumers 2015 North America 2015 South America 2016 Europe 2016 Africa 2016 AsiaConsumers (18+) America (18+) America (18+) 2015 Europe (18+) 2015 Africa (18+) 2015 Asia (18+)
(A) (B) (C) (D) (E) (F) (G) (H) (I) (J) (K) (L)
2399 2151 702 642 -** -** 1086 963 -** -** 611 546Unweighted Base5 3 - - - - - - - - 5 3* * - - - - - - - - 1% 1%
ACG BH
Oita
1 - - - - - - - - - 1 -* - - - - - - - - - * -
Miyazaki
- 1 - - - - - - - - - 1- * - - - - - - - - - *
Kagoshima
2 2 - - - - - - - - 2 2* * - - - - - - - - * *
Okinawa
13 6 - - - - 13 6 - - - -1% * - - - - 1% 1% - - - -
ACK BD
Lower Silesia
10 5 - - - - 10 5 - - - -* * - - - - 1% 1% - - - -
ACK B
Kuyavia-Pomerania
6 7 - - - - 6 7 - - - -* * - - - - 1% 1% - - - -
AC BDL
Lodz
6 7 - - - - 6 7 - - - -* * - - - - 1% 1% - - - -
AC BDL
Lublin
1 2 - - - - 1 2 - - - -* * - - - - * * - - - -
Lubusz
8 14 - - - - 8 14 - - - -* 1% - - - - 1% 1% - - - -
D ACK BDL
Lesser Poland
12 6 - - - - 12 6 - - - -1% * - - - - 1% 1% - - - -
ACK BD
Masovia
4 - - - - - 4 - - - - -* - - - - - * - - - - -
Opole
10 7 - - - - 10 7 - - - -* * - - - - 1% 1% - - - -
ACK BDL
Subcarpathia
5 5 - - - - 5 5 - - - -* * - - - - * 1% - - - -
A B
Podlaskie
4 3 - - - - 4 3 - - - -* * - - - - * * - - - -
Pomerania
15 14 - - - - 15 14 - - - -1% 1% - - - - 1% 1% - - - - C D ACK BDL
Silesia
2 1 - - - - 2 1 - - - -* * - - - - * * - - - -
Swietokrzyskie (HolyCross)
_________________________________________________________________________________________________________________Proportions/Means: Columns Tested (5% risk level) - A/B - C/D - E/F - G/H - I/J - K/L - A/C/E/G/I/K - B/D/F/H/J/LOverlap formulae used. ** very small base (under 30) ineligible for sig testing
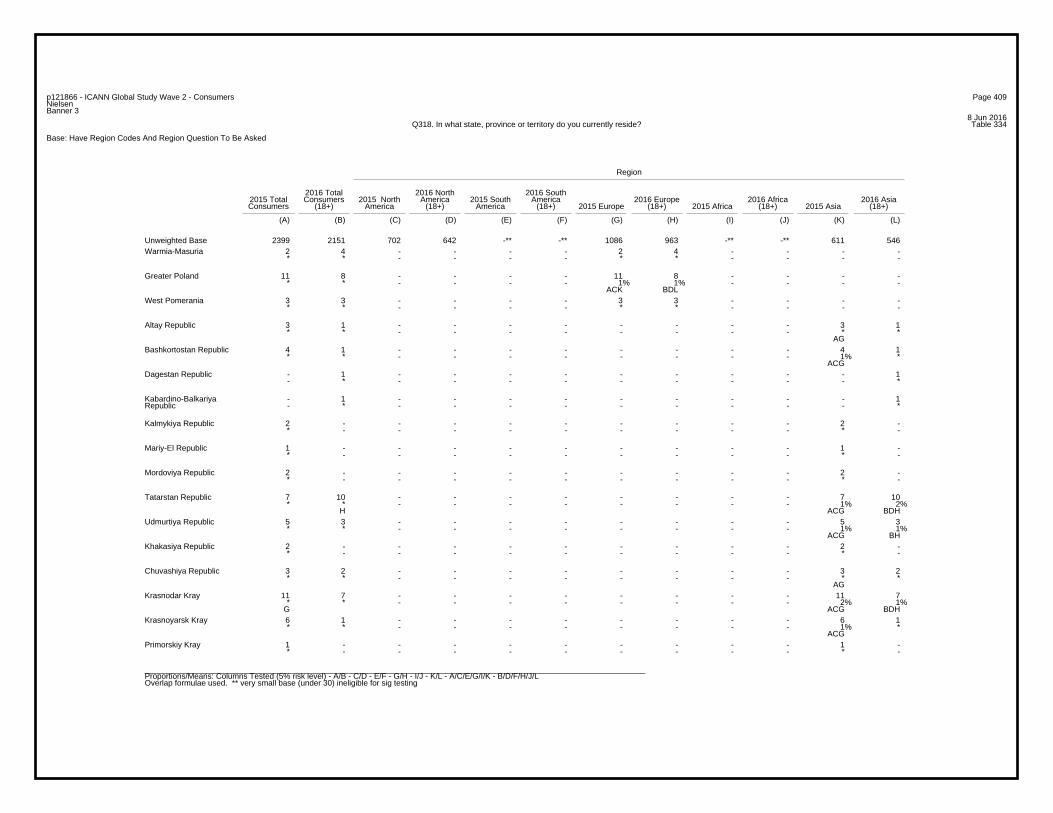
Page 409p121866 - ICANN Global Study Wave 2 - ConsumersNielsenBanner 3
8 Jun 2016Table 334Q318. In what state, province or territory do you currently reside?
Base: Have Region Codes And Region Question To Be Asked
Region
2016 Total 2016 North 2016 South2015 Total Consumers 2015 North America 2015 South America 2016 Europe 2016 Africa 2016 AsiaConsumers (18+) America (18+) America (18+) 2015 Europe (18+) 2015 Africa (18+) 2015 Asia (18+)
(A) (B) (C) (D) (E) (F) (G) (H) (I) (J) (K) (L)
2399 2151 702 642 -** -** 1086 963 -** -** 611 546Unweighted Base2 4 - - - - 2 4 - - - -* * - - - - * * - - - -
Warmia-Masuria
11 8 - - - - 11 8 - - - -* * - - - - 1% 1% - - - -
ACK BDL
Greater Poland
3 3 - - - - 3 3 - - - -* * - - - - * * - - - -
West Pomerania
3 1 - - - - - - - - 3 1* * - - - - - - - - * *
AG
Altay Republic
4 1 - - - - - - - - 4 1* * - - - - - - - - 1% *
ACG
Bashkortostan Republic
- 1 - - - - - - - - - 1- * - - - - - - - - - *
Dagestan Republic
- 1 - - - - - - - - - 1- * - - - - - - - - - *
Kabardino-BalkariyaRepublic
2 - - - - - - - - - 2 -* - - - - - - - - - * -
Kalmykiya Republic
1 - - - - - - - - - 1 -* - - - - - - - - - * -
Mariy-El Republic
2 - - - - - - - - - 2 -* - - - - - - - - - * -
Mordoviya Republic
7 10 - - - - - - - - 7 10* * - - - - - - - - 1% 2%
H ACG BDH
Tatarstan Republic
5 3 - - - - - - - - 5 3* * - - - - - - - - 1% 1%
ACG BH
Udmurtiya Republic
2 - - - - - - - - - 2 -* - - - - - - - - - * -
Khakasiya Republic
3 2 - - - - - - - - 3 2* * - - - - - - - - * *
AG
Chuvashiya Republic
11 7 - - - - - - - - 11 7* * - - - - - - - - 2% 1%
G ACG BDH
Krasnodar Kray
6 1 - - - - - - - - 6 1* * - - - - - - - - 1% *
ACG
Krasnoyarsk Kray
1 - - - - - - - - - 1 -* - - - - - - - - - * -
Primorskiy Kray
_________________________________________________________________________________________________________________Proportions/Means: Columns Tested (5% risk level) - A/B - C/D - E/F - G/H - I/J - K/L - A/C/E/G/I/K - B/D/F/H/J/LOverlap formulae used. ** very small base (under 30) ineligible for sig testing
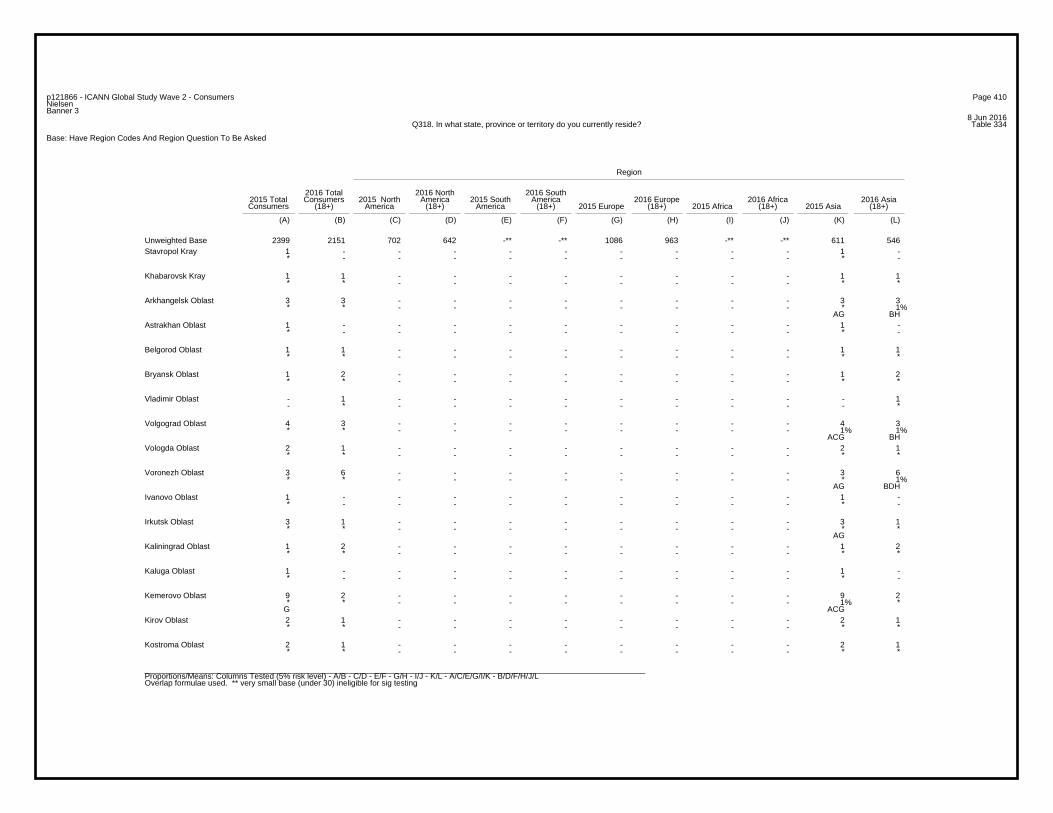
Page 410p121866 - ICANN Global Study Wave 2 - ConsumersNielsenBanner 3
8 Jun 2016Table 334Q318. In what state, province or territory do you currently reside?
Base: Have Region Codes And Region Question To Be Asked
Region
2016 Total 2016 North 2016 South2015 Total Consumers 2015 North America 2015 South America 2016 Europe 2016 Africa 2016 AsiaConsumers (18+) America (18+) America (18+) 2015 Europe (18+) 2015 Africa (18+) 2015 Asia (18+)
(A) (B) (C) (D) (E) (F) (G) (H) (I) (J) (K) (L)
2399 2151 702 642 -** -** 1086 963 -** -** 611 546Unweighted Base1 - - - - - - - - - 1 -* - - - - - - - - - * -
Stavropol Kray
1 1 - - - - - - - - 1 1* * - - - - - - - - * *
Khabarovsk Kray
3 3 - - - - - - - - 3 3* * - - - - - - - - * 1%
AG BH
Arkhangelsk Oblast
1 - - - - - - - - - 1 -* - - - - - - - - - * -
Astrakhan Oblast
1 1 - - - - - - - - 1 1* * - - - - - - - - * *
Belgorod Oblast
1 2 - - - - - - - - 1 2* * - - - - - - - - * *
Bryansk Oblast
- 1 - - - - - - - - - 1- * - - - - - - - - - *
Vladimir Oblast
4 3 - - - - - - - - 4 3* * - - - - - - - - 1% 1%
ACG BH
Volgograd Oblast
2 1 - - - - - - - - 2 1* * - - - - - - - - * *
Vologda Oblast
3 6 - - - - - - - - 3 6* * - - - - - - - - * 1%
AG BDH
Voronezh Oblast
1 - - - - - - - - - 1 -* - - - - - - - - - * -
Ivanovo Oblast
3 1 - - - - - - - - 3 1* * - - - - - - - - * *
AG
Irkutsk Oblast
1 2 - - - - - - - - 1 2* * - - - - - - - - * *
Kaliningrad Oblast
1 - - - - - - - - - 1 -* - - - - - - - - - * -
Kaluga Oblast
9 2 - - - - - - - - 9 2* * - - - - - - - - 1% *
G ACG
Kemerovo Oblast
2 1 - - - - - - - - 2 1* * - - - - - - - - * *
Kirov Oblast
2 1 - - - - - - - - 2 1* * - - - - - - - - * *
Kostroma Oblast
_________________________________________________________________________________________________________________Proportions/Means: Columns Tested (5% risk level) - A/B - C/D - E/F - G/H - I/J - K/L - A/C/E/G/I/K - B/D/F/H/J/LOverlap formulae used. ** very small base (under 30) ineligible for sig testing
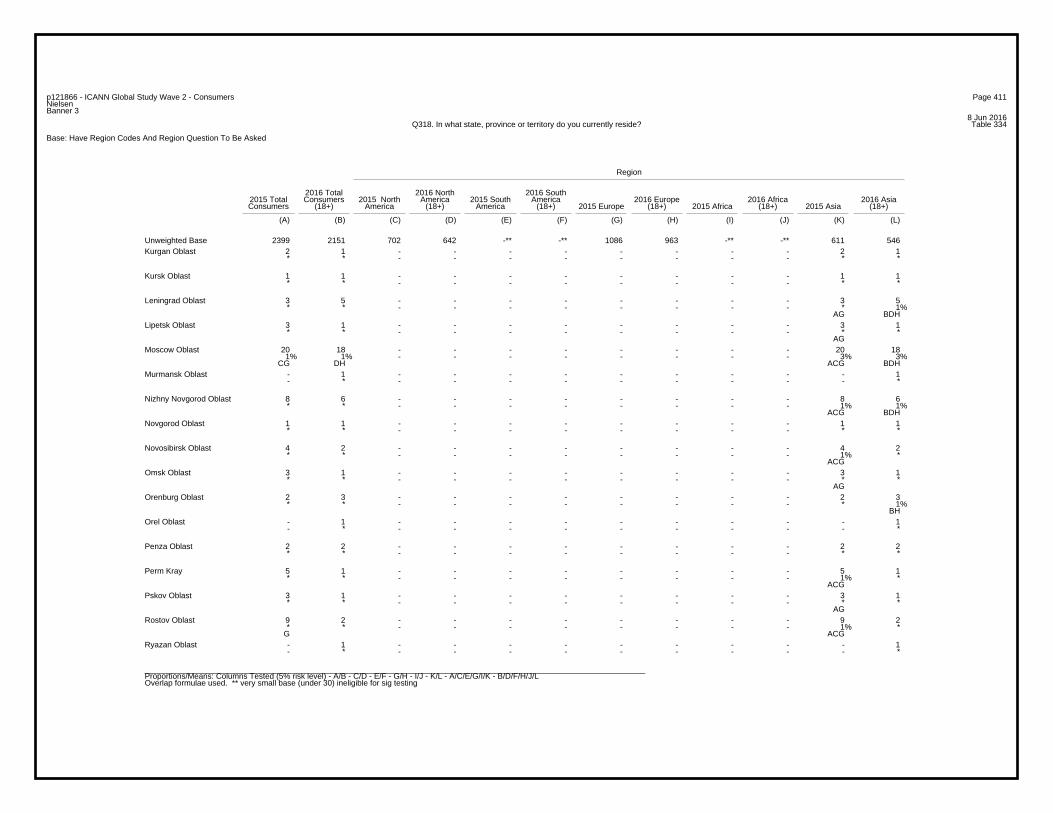
Page 411p121866 - ICANN Global Study Wave 2 - ConsumersNielsenBanner 3
8 Jun 2016Table 334Q318. In what state, province or territory do you currently reside?
Base: Have Region Codes And Region Question To Be Asked
Region
2016 Total 2016 North 2016 South2015 Total Consumers 2015 North America 2015 South America 2016 Europe 2016 Africa 2016 AsiaConsumers (18+) America (18+) America (18+) 2015 Europe (18+) 2015 Africa (18+) 2015 Asia (18+)
(A) (B) (C) (D) (E) (F) (G) (H) (I) (J) (K) (L)
2399 2151 702 642 -** -** 1086 963 -** -** 611 546Unweighted Base2 1 - - - - - - - - 2 1* * - - - - - - - - * *
Kurgan Oblast
1 1 - - - - - - - - 1 1* * - - - - - - - - * *
Kursk Oblast
3 5 - - - - - - - - 3 5* * - - - - - - - - * 1%
AG BDH
Leningrad Oblast
3 1 - - - - - - - - 3 1* * - - - - - - - - * *
AG
Lipetsk Oblast
20 18 - - - - - - - - 20 181% 1% - - - - - - - - 3% 3%
CG DH ACG BDH
Moscow Oblast
- 1 - - - - - - - - - 1- * - - - - - - - - - *
Murmansk Oblast
8 6 - - - - - - - - 8 6* * - - - - - - - - 1% 1%
ACG BDH
Nizhny Novgorod Oblast
1 1 - - - - - - - - 1 1* * - - - - - - - - * *
Novgorod Oblast
4 2 - - - - - - - - 4 2* * - - - - - - - - 1% *
ACG
Novosibirsk Oblast
3 1 - - - - - - - - 3 1* * - - - - - - - - * *
AG
Omsk Oblast
2 3 - - - - - - - - 2 3* * - - - - - - - - * 1%
BH
Orenburg Oblast
- 1 - - - - - - - - - 1- * - - - - - - - - - *
Orel Oblast
2 2 - - - - - - - - 2 2* * - - - - - - - - * *
Penza Oblast
5 1 - - - - - - - - 5 1* * - - - - - - - - 1% *
ACG
Perm Kray
3 1 - - - - - - - - 3 1* * - - - - - - - - * *
AG
Pskov Oblast
9 2 - - - - - - - - 9 2* * - - - - - - - - 1% *
G ACG
Rostov Oblast
- 1 - - - - - - - - - 1- * - - - - - - - - - *
Ryazan Oblast
_________________________________________________________________________________________________________________Proportions/Means: Columns Tested (5% risk level) - A/B - C/D - E/F - G/H - I/J - K/L - A/C/E/G/I/K - B/D/F/H/J/LOverlap formulae used. ** very small base (under 30) ineligible for sig testing
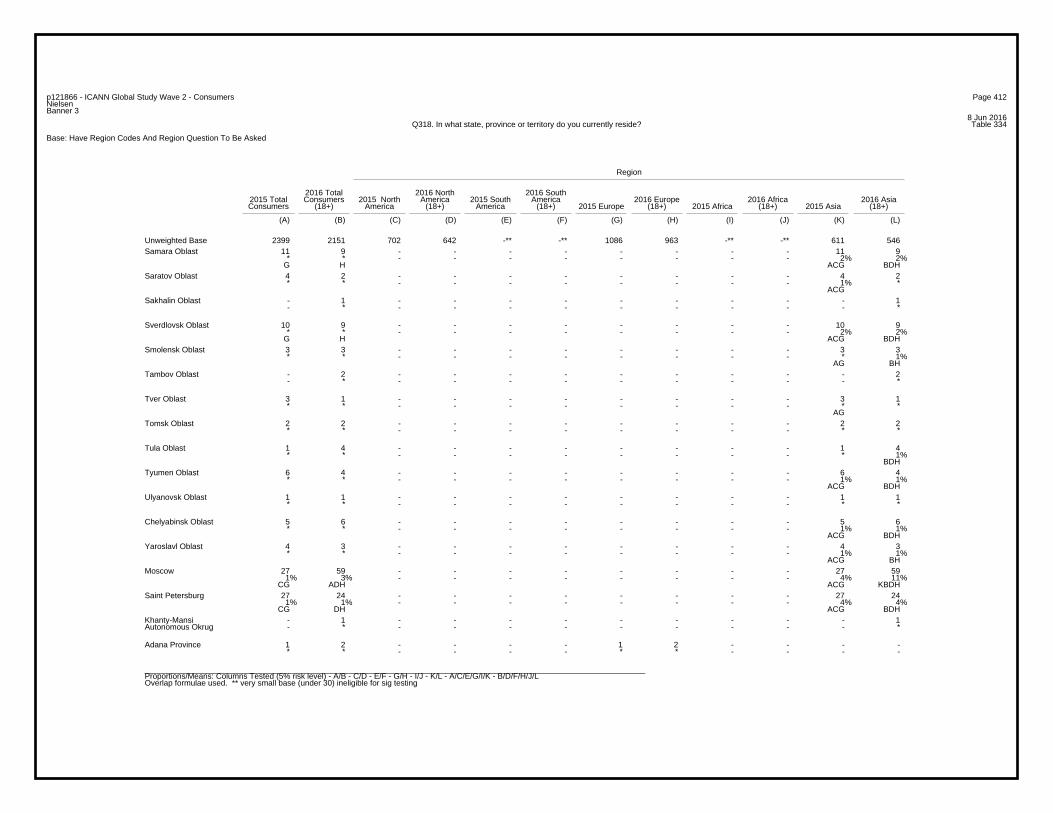
Page 412p121866 - ICANN Global Study Wave 2 - ConsumersNielsenBanner 3
8 Jun 2016Table 334Q318. In what state, province or territory do you currently reside?
Base: Have Region Codes And Region Question To Be Asked
Region
2016 Total 2016 North 2016 South2015 Total Consumers 2015 North America 2015 South America 2016 Europe 2016 Africa 2016 AsiaConsumers (18+) America (18+) America (18+) 2015 Europe (18+) 2015 Africa (18+) 2015 Asia (18+)
(A) (B) (C) (D) (E) (F) (G) (H) (I) (J) (K) (L)
2399 2151 702 642 -** -** 1086 963 -** -** 611 546Unweighted Base11 9 - - - - - - - - 11 9
* * - - - - - - - - 2% 2%G H ACG BDH
Samara Oblast
4 2 - - - - - - - - 4 2* * - - - - - - - - 1% *
ACG
Saratov Oblast
- 1 - - - - - - - - - 1- * - - - - - - - - - *
Sakhalin Oblast
10 9 - - - - - - - - 10 9* * - - - - - - - - 2% 2%
G H ACG BDH
Sverdlovsk Oblast
3 3 - - - - - - - - 3 3* * - - - - - - - - * 1%
AG BH
Smolensk Oblast
- 2 - - - - - - - - - 2- * - - - - - - - - - *
Tambov Oblast
3 1 - - - - - - - - 3 1* * - - - - - - - - * *
AG
Tver Oblast
2 2 - - - - - - - - 2 2* * - - - - - - - - * *
Tomsk Oblast
1 4 - - - - - - - - 1 4* * - - - - - - - - * 1%
BDH
Tula Oblast
6 4 - - - - - - - - 6 4* * - - - - - - - - 1% 1%
ACG BDH
Tyumen Oblast
1 1 - - - - - - - - 1 1* * - - - - - - - - * *
Ulyanovsk Oblast
5 6 - - - - - - - - 5 6* * - - - - - - - - 1% 1%
ACG BDH
Chelyabinsk Oblast
4 3 - - - - - - - - 4 3* * - - - - - - - - 1% 1%
ACG BH
Yaroslavl Oblast
27 59 - - - - - - - - 27 591% 3% - - - - - - - - 4% 11%
CG ADH ACG KBDH
Moscow
27 24 - - - - - - - - 27 241% 1% - - - - - - - - 4% 4%
CG DH ACG BDH
Saint Petersburg
- 1 - - - - - - - - - 1- * - - - - - - - - - *
Khanty-MansiAutonomous Okrug
1 2 - - - - 1 2 - - - -* * - - - - * * - - - -
Adana Province
_________________________________________________________________________________________________________________Proportions/Means: Columns Tested (5% risk level) - A/B - C/D - E/F - G/H - I/J - K/L - A/C/E/G/I/K - B/D/F/H/J/LOverlap formulae used. ** very small base (under 30) ineligible for sig testing
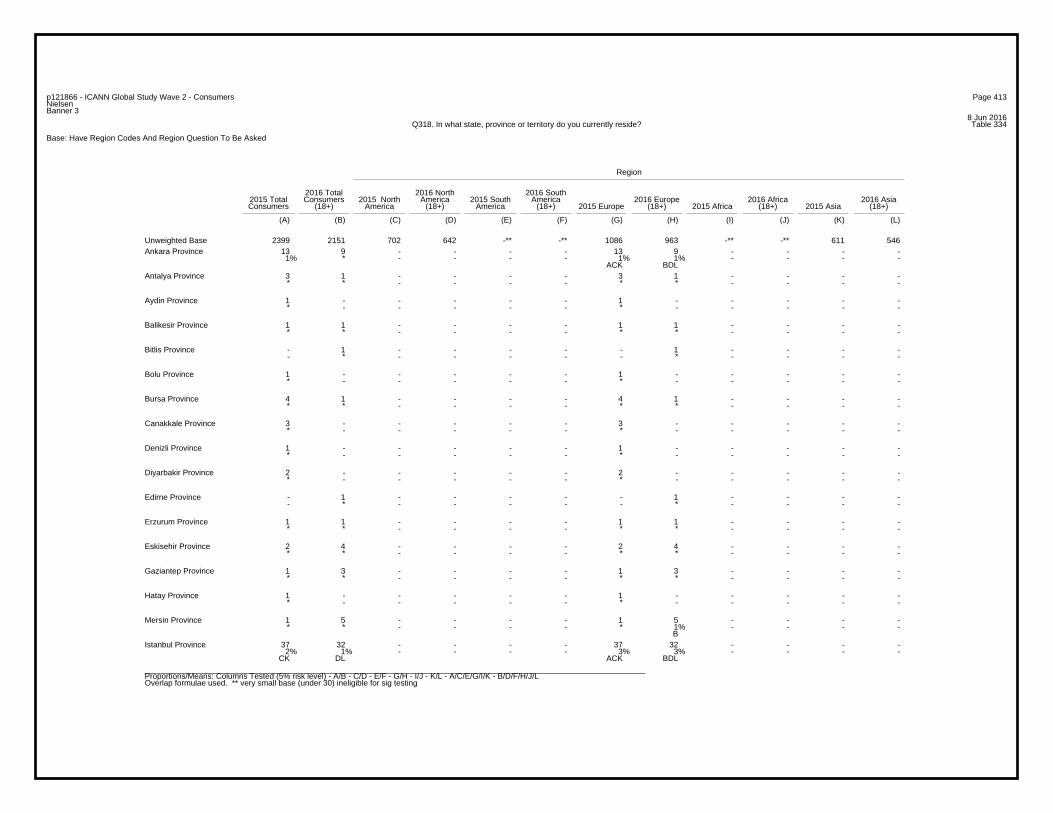
Page 413p121866 - ICANN Global Study Wave 2 - ConsumersNielsenBanner 3
8 Jun 2016Table 334Q318. In what state, province or territory do you currently reside?
Base: Have Region Codes And Region Question To Be Asked
Region
2016 Total 2016 North 2016 South2015 Total Consumers 2015 North America 2015 South America 2016 Europe 2016 Africa 2016 AsiaConsumers (18+) America (18+) America (18+) 2015 Europe (18+) 2015 Africa (18+) 2015 Asia (18+)
(A) (B) (C) (D) (E) (F) (G) (H) (I) (J) (K) (L)
2399 2151 702 642 -** -** 1086 963 -** -** 611 546Unweighted Base13 9 - - - - 13 9 - - - -
1% * - - - - 1% 1% - - - - ACK BDL
Ankara Province
3 1 - - - - 3 1 - - - -* * - - - - * * - - - -
Antalya Province
1 - - - - - 1 - - - - -* - - - - - * - - - - -
Aydin Province
1 1 - - - - 1 1 - - - -* * - - - - * * - - - -
Balikesir Province
- 1 - - - - - 1 - - - -- * - - - - - * - - - -
Bitlis Province
1 - - - - - 1 - - - - -* - - - - - * - - - - -
Bolu Province
4 1 - - - - 4 1 - - - -* * - - - - * * - - - -
Bursa Province
3 - - - - - 3 - - - - -* - - - - - * - - - - -
Canakkale Province
1 - - - - - 1 - - - - -* - - - - - * - - - - -
Denizli Province
2 - - - - - 2 - - - - -* - - - - - * - - - - -
Diyarbakir Province
- 1 - - - - - 1 - - - -- * - - - - - * - - - -
Edirne Province
1 1 - - - - 1 1 - - - -* * - - - - * * - - - -
Erzurum Province
2 4 - - - - 2 4 - - - -* * - - - - * * - - - -
Eskisehir Province
1 3 - - - - 1 3 - - - -* * - - - - * * - - - -
Gaziantep Province
1 - - - - - 1 - - - - -* - - - - - * - - - - -
Hatay Province
1 5 - - - - 1 5 - - - -* * - - - - * 1% - - - -
B
Mersin Province
37 32 - - - - 37 32 - - - -2% 1% - - - - 3% 3% - - - -
CK DL ACK BDL
Istanbul Province
_________________________________________________________________________________________________________________Proportions/Means: Columns Tested (5% risk level) - A/B - C/D - E/F - G/H - I/J - K/L - A/C/E/G/I/K - B/D/F/H/J/LOverlap formulae used. ** very small base (under 30) ineligible for sig testing
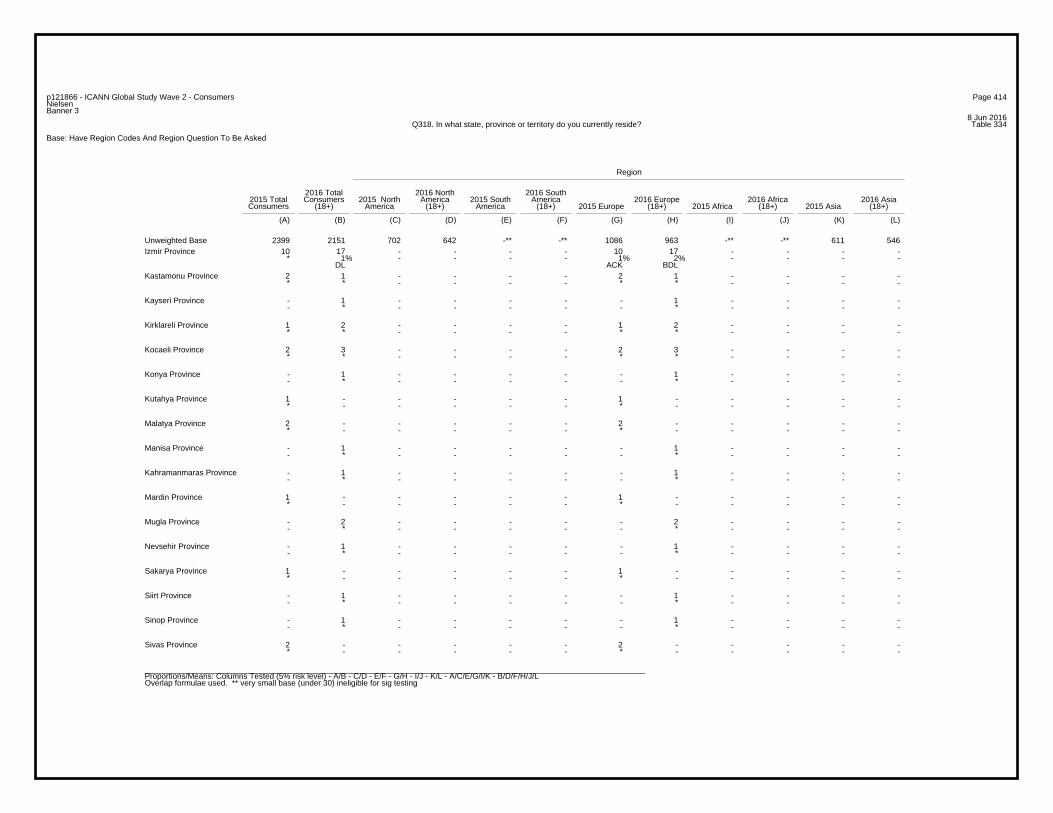
Page 414p121866 - ICANN Global Study Wave 2 - ConsumersNielsenBanner 3
8 Jun 2016Table 334Q318. In what state, province or territory do you currently reside?
Base: Have Region Codes And Region Question To Be Asked
Region
2016 Total 2016 North 2016 South2015 Total Consumers 2015 North America 2015 South America 2016 Europe 2016 Africa 2016 AsiaConsumers (18+) America (18+) America (18+) 2015 Europe (18+) 2015 Africa (18+) 2015 Asia (18+)
(A) (B) (C) (D) (E) (F) (G) (H) (I) (J) (K) (L)
2399 2151 702 642 -** -** 1086 963 -** -** 611 546Unweighted Base10 17 - - - - 10 17 - - - -
* 1% - - - - 1% 2% - - - - DL ACK BDL
Izmir Province
2 1 - - - - 2 1 - - - -* * - - - - * * - - - -
Kastamonu Province
- 1 - - - - - 1 - - - -- * - - - - - * - - - -
Kayseri Province
1 2 - - - - 1 2 - - - -* * - - - - * * - - - -
Kirklareli Province
2 3 - - - - 2 3 - - - -* * - - - - * * - - - -
Kocaeli Province
- 1 - - - - - 1 - - - -- * - - - - - * - - - -
Konya Province
1 - - - - - 1 - - - - -* - - - - - * - - - - -
Kutahya Province
2 - - - - - 2 - - - - -* - - - - - * - - - - -
Malatya Province
- 1 - - - - - 1 - - - -- * - - - - - * - - - -
Manisa Province
- 1 - - - - - 1 - - - -- * - - - - - * - - - -
Kahramanmaras Province
1 - - - - - 1 - - - - -* - - - - - * - - - - -
Mardin Province
- 2 - - - - - 2 - - - -- * - - - - - * - - - -
Mugla Province
- 1 - - - - - 1 - - - -- * - - - - - * - - - -
Nevsehir Province
1 - - - - - 1 - - - - -* - - - - - * - - - - -
Sakarya Province
- 1 - - - - - 1 - - - -- * - - - - - * - - - -
Siirt Province
- 1 - - - - - 1 - - - -- * - - - - - * - - - -
Sinop Province
2 - - - - - 2 - - - - -* - - - - - * - - - - -
Sivas Province
_________________________________________________________________________________________________________________Proportions/Means: Columns Tested (5% risk level) - A/B - C/D - E/F - G/H - I/J - K/L - A/C/E/G/I/K - B/D/F/H/J/LOverlap formulae used. ** very small base (under 30) ineligible for sig testing
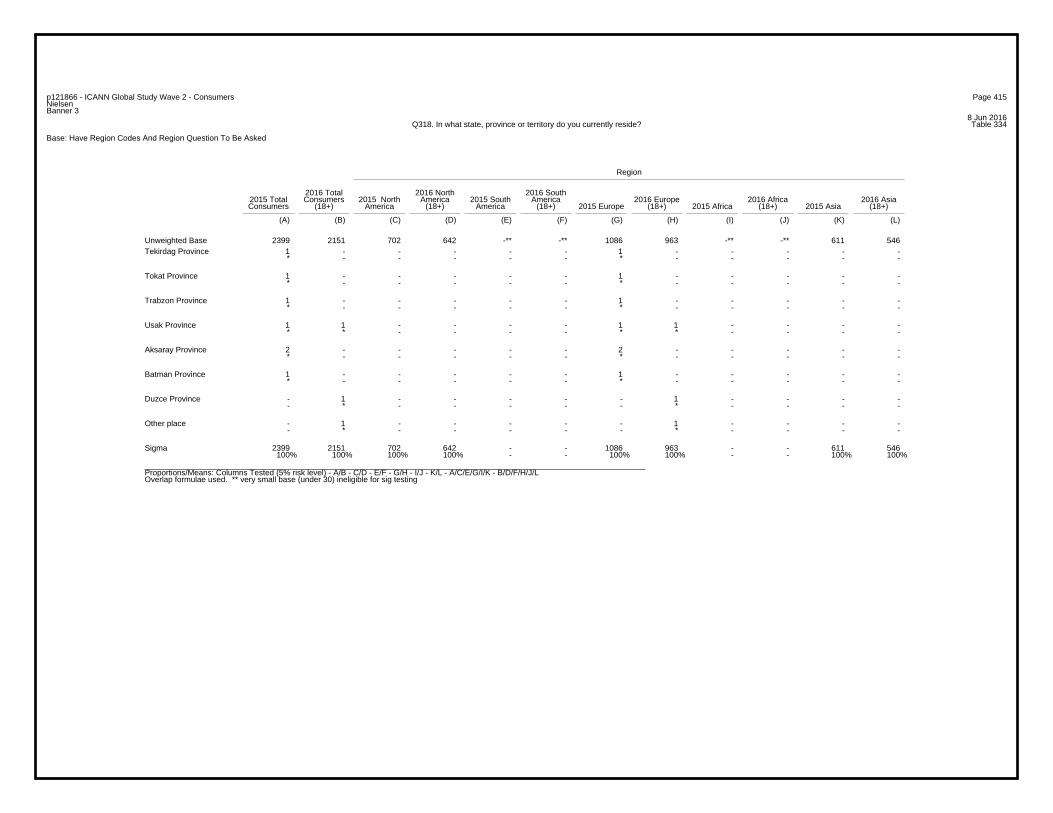
Page 415p121866 - ICANN Global Study Wave 2 - ConsumersNielsenBanner 3
8 Jun 2016Table 334Q318. In what state, province or territory do you currently reside?
Base: Have Region Codes And Region Question To Be Asked
Region
2016 Total 2016 North 2016 South2015 Total Consumers 2015 North America 2015 South America 2016 Europe 2016 Africa 2016 AsiaConsumers (18+) America (18+) America (18+) 2015 Europe (18+) 2015 Africa (18+) 2015 Asia (18+)
(A) (B) (C) (D) (E) (F) (G) (H) (I) (J) (K) (L)
2399 2151 702 642 -** -** 1086 963 -** -** 611 546Unweighted Base1 - - - - - 1 - - - - -* - - - - - * - - - - -
Tekirdag Province
1 - - - - - 1 - - - - -* - - - - - * - - - - -
Tokat Province
1 - - - - - 1 - - - - -* - - - - - * - - - - -
Trabzon Province
1 1 - - - - 1 1 - - - -* * - - - - * * - - - -
Usak Province
2 - - - - - 2 - - - - -* - - - - - * - - - - -
Aksaray Province
1 - - - - - 1 - - - - -* - - - - - * - - - - -
Batman Province
- 1 - - - - - 1 - - - -- * - - - - - * - - - -
Duzce Province
- 1 - - - - - 1 - - - -- * - - - - - * - - - -
Other place
2399 2151 702 642 - - 1086 963 - - 611 546100% 100% 100% 100% - - 100% 100% - - 100% 100%
Sigma
_________________________________________________________________________________________________________________Proportions/Means: Columns Tested (5% risk level) - A/B - C/D - E/F - G/H - I/J - K/L - A/C/E/G/I/K - B/D/F/H/J/LOverlap formulae used. ** very small base (under 30) ineligible for sig testing
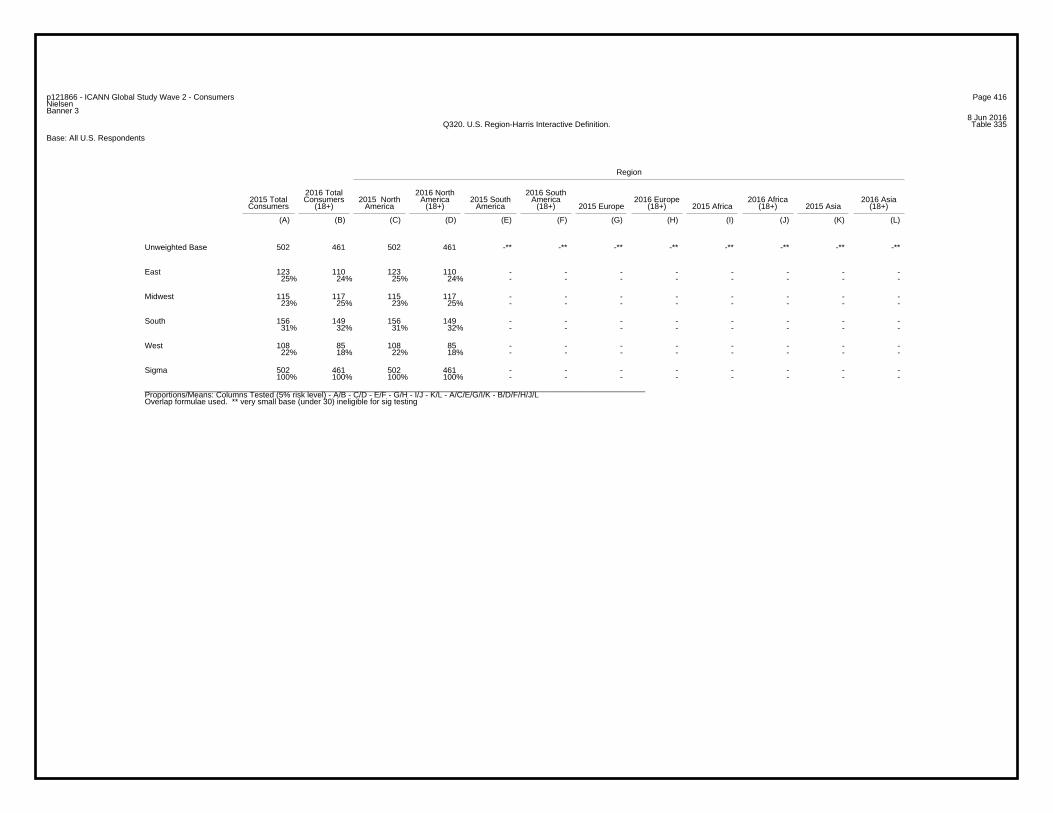
Page 416p121866 - ICANN Global Study Wave 2 - ConsumersNielsenBanner 3
8 Jun 2016Table 335Q320. U.S. Region-Harris Interactive Definition.
Base: All U.S. Respondents
Region
2016 Total 2016 North 2016 South2015 Total Consumers 2015 North America 2015 South America 2016 Europe 2016 Africa 2016 AsiaConsumers (18+) America (18+) America (18+) 2015 Europe (18+) 2015 Africa (18+) 2015 Asia (18+)
(A) (B) (C) (D) (E) (F) (G) (H) (I) (J) (K) (L)
502 461 502 461 -** -** -** -** -** -** -** -**Unweighted Base
123 110 123 110 - - - - - - - -25% 24% 25% 24% - - - - - - - -
East
115 117 115 117 - - - - - - - -23% 25% 23% 25% - - - - - - - -
Midwest
156 149 156 149 - - - - - - - -31% 32% 31% 32% - - - - - - - -
South
108 85 108 85 - - - - - - - -22% 18% 22% 18% - - - - - - - -
West
502 461 502 461 - - - - - - - -100% 100% 100% 100% - - - - - - - -
Sigma
_________________________________________________________________________________________________________________Proportions/Means: Columns Tested (5% risk level) - A/B - C/D - E/F - G/H - I/J - K/L - A/C/E/G/I/K - B/D/F/H/J/LOverlap formulae used. ** very small base (under 30) ineligible for sig testing
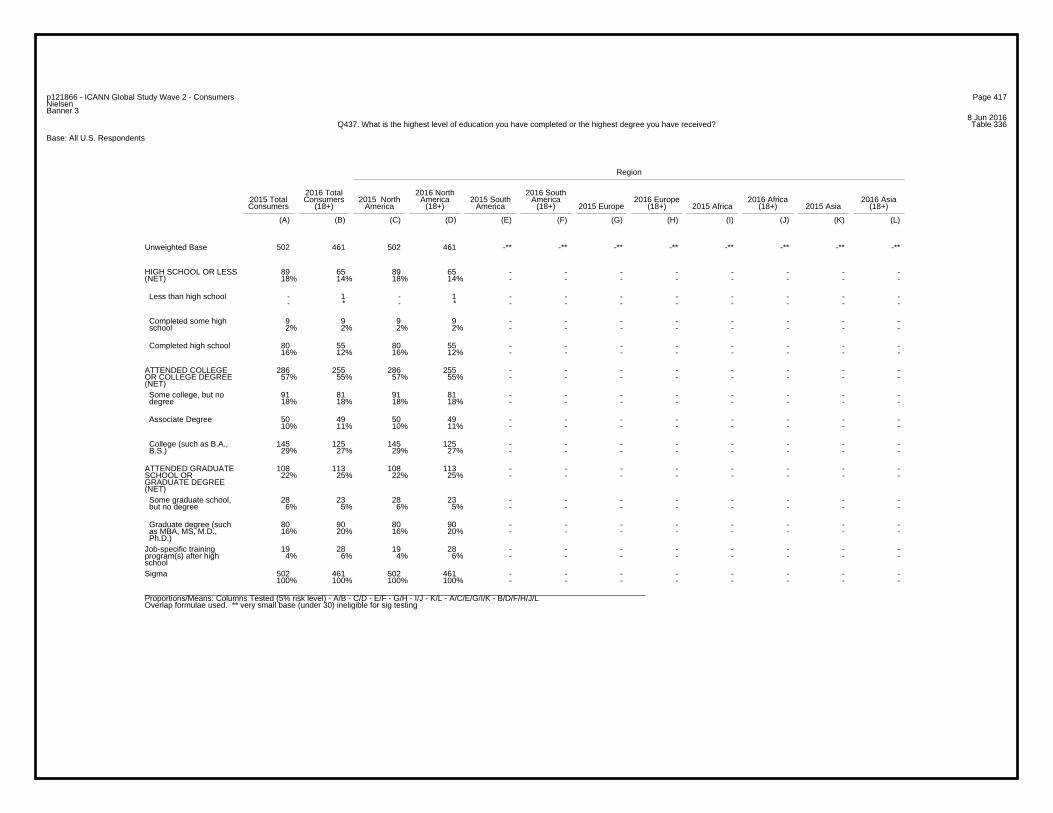
Page 417p121866 - ICANN Global Study Wave 2 - ConsumersNielsenBanner 3
8 Jun 2016Table 336Q437. What is the highest level of education you have completed or the highest degree you have received?
Base: All U.S. Respondents
Region
2016 Total 2016 North 2016 South2015 Total Consumers 2015 North America 2015 South America 2016 Europe 2016 Africa 2016 AsiaConsumers (18+) America (18+) America (18+) 2015 Europe (18+) 2015 Africa (18+) 2015 Asia (18+)
(A) (B) (C) (D) (E) (F) (G) (H) (I) (J) (K) (L)
502 461 502 461 -** -** -** -** -** -** -** -**Unweighted Base
89 65 89 65 - - - - - - - -18% 14% 18% 14% - - - - - - - -
HIGH SCHOOL OR LESS(NET)
- 1 - 1 - - - - - - - -- * - * - - - - - - - -
Less than high school
9 9 9 9 - - - - - - - -2% 2% 2% 2% - - - - - - - -
Completed some high school
80 55 80 55 - - - - - - - -16% 12% 16% 12% - - - - - - - -
Completed high school
286 255 286 255 - - - - - - - -57% 55% 57% 55% - - - - - - - -
ATTENDED COLLEGEOR COLLEGE DEGREE(NET)
91 81 91 81 - - - - - - - -18% 18% 18% 18% - - - - - - - -
Some college, but no degree
50 49 50 49 - - - - - - - -10% 11% 10% 11% - - - - - - - -
Associate Degree
145 125 145 125 - - - - - - - -29% 27% 29% 27% - - - - - - - -
College (such as B.A., B.S.)
108 113 108 113 - - - - - - - -22% 25% 22% 25% - - - - - - - -
ATTENDED GRADUATESCHOOL ORGRADUATE DEGREE(NET)
28 23 28 23 - - - - - - - -6% 5% 6% 5% - - - - - - - -
Some graduate school, but no degree
80 90 80 90 - - - - - - - -16% 20% 16% 20% - - - - - - - -
Graduate degree (such as MBA, MS, M.D., Ph.D.)
19 28 19 28 - - - - - - - -4% 6% 4% 6% - - - - - - - -
Job-specific trainingprogram(s) after highschool
502 461 502 461 - - - - - - - -100% 100% 100% 100% - - - - - - - -
Sigma
_________________________________________________________________________________________________________________Proportions/Means: Columns Tested (5% risk level) - A/B - C/D - E/F - G/H - I/J - K/L - A/C/E/G/I/K - B/D/F/H/J/LOverlap formulae used. ** very small base (under 30) ineligible for sig testing
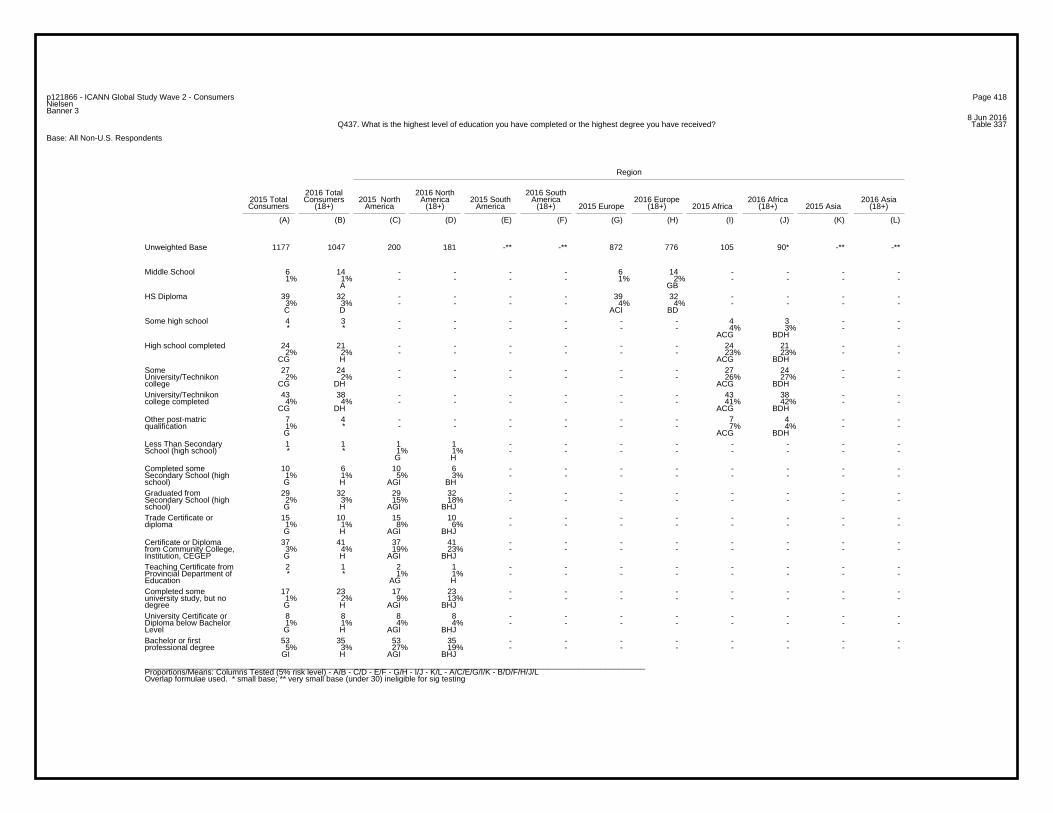
Page 418p121866 - ICANN Global Study Wave 2 - ConsumersNielsenBanner 3
8 Jun 2016Table 337Q437. What is the highest level of education you have completed or the highest degree you have received?
Base: All Non-U.S. Respondents
Region
2016 Total 2016 North 2016 South2015 Total Consumers 2015 North America 2015 South America 2016 Europe 2016 Africa 2016 AsiaConsumers (18+) America (18+) America (18+) 2015 Europe (18+) 2015 Africa (18+) 2015 Asia (18+)
(A) (B) (C) (D) (E) (F) (G) (H) (I) (J) (K) (L)
1177 1047 200 181 -** -** 872 776 105 90* -** -**Unweighted Base
6 14 - - - - 6 14 - - - -1% 1% - - - - 1% 2% - - - -
A GB
Middle School
39 32 - - - - 39 32 - - - -3% 3% - - - - 4% 4% - - - - C D ACI BD
HS Diploma
4 3 - - - - - - 4 3 - -* * - - - - - - 4% 3% - -
ACG BDH
Some high school
24 21 - - - - - - 24 21 - -2% 2% - - - - - - 23% 23% - -
CG H ACG BDH
High school completed
27 24 - - - - - - 27 24 - -2% 2% - - - - - - 26% 27% - -
CG DH ACG BDH
SomeUniversity/Technikoncollege
43 38 - - - - - - 43 38 - -4% 4% - - - - - - 41% 42% - -
CG DH ACG BDH
University/Technikoncollege completed
7 4 - - - - - - 7 4 - -1% * - - - - - - 7% 4% - - G ACG BDH
Other post-matricqualification
1 1 1 1 - - - - - - - -* * 1% 1% - - - - - - - -
G H
Less Than SecondarySchool (high school)
10 6 10 6 - - - - - - - -1% 1% 5% 3% - - - - - - - - G H AGI BH
Completed someSecondary School (highschool)
29 32 29 32 - - - - - - - -2% 3% 15% 18% - - - - - - - - G H AGI BHJ
Graduated fromSecondary School (highschool)
15 10 15 10 - - - - - - - -1% 1% 8% 6% - - - - - - - - G H AGI BHJ
Trade Certificate ordiploma
37 41 37 41 - - - - - - - -3% 4% 19% 23% - - - - - - - - G H AGI BHJ
Certificate or Diplomafrom Community College,Institution, CEGEP
2 1 2 1 - - - - - - - -* * 1% 1% - - - - - - - -
AG H
Teaching Certificate fromProvincial Department ofEducation
17 23 17 23 - - - - - - - -1% 2% 9% 13% - - - - - - - - G H AGI BHJ
Completed someuniversity study, but nodegree
8 8 8 8 - - - - - - - -1% 1% 4% 4% - - - - - - - - G H AGI BHJ
University Certificate orDiploma below BachelorLevel
53 35 53 35 - - - - - - - -5% 3% 27% 19% - - - - - - - -
GI H AGI BHJ
Bachelor or firstprofessional degree
_________________________________________________________________________________________________________________Proportions/Means: Columns Tested (5% risk level) - A/B - C/D - E/F - G/H - I/J - K/L - A/C/E/G/I/K - B/D/F/H/J/LOverlap formulae used. * small base; ** very small base (under 30) ineligible for sig testing
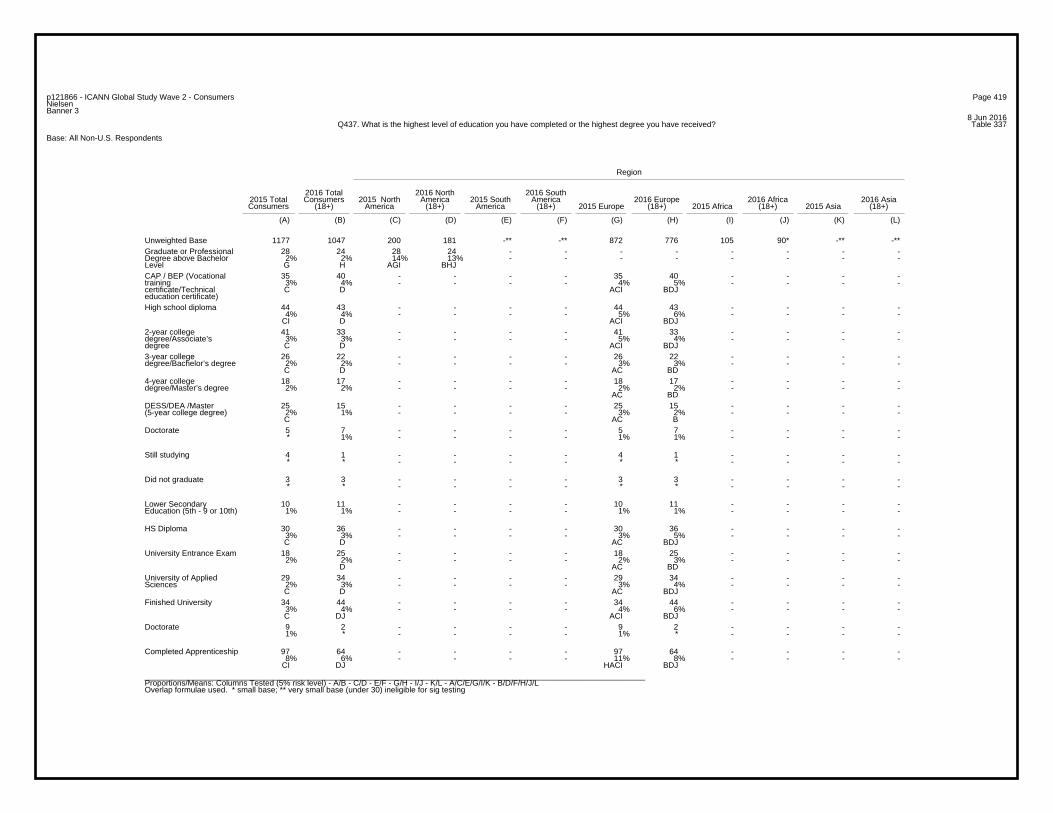
Page 419p121866 - ICANN Global Study Wave 2 - ConsumersNielsenBanner 3
8 Jun 2016Table 337Q437. What is the highest level of education you have completed or the highest degree you have received?
Base: All Non-U.S. Respondents
Region
2016 Total 2016 North 2016 South2015 Total Consumers 2015 North America 2015 South America 2016 Europe 2016 Africa 2016 AsiaConsumers (18+) America (18+) America (18+) 2015 Europe (18+) 2015 Africa (18+) 2015 Asia (18+)
(A) (B) (C) (D) (E) (F) (G) (H) (I) (J) (K) (L)
1177 1047 200 181 -** -** 872 776 105 90* -** -**Unweighted Base28 24 28 24 - - - - - - - -
2% 2% 14% 13% - - - - - - - - G H AGI BHJ
Graduate or ProfessionalDegree above BachelorLevel
35 40 - - - - 35 40 - - - -3% 4% - - - - 4% 5% - - - - C D ACI BDJ
CAP / BEP (Vocationaltrainingcertificate/Technicaleducation certificate)
44 43 - - - - 44 43 - - - -4% 4% - - - - 5% 6% - - - -
CI D ACI BDJ
High school diploma
41 33 - - - - 41 33 - - - -3% 3% - - - - 5% 4% - - - - C D ACI BDJ
2-year collegedegree/Associate’sdegree
26 22 - - - - 26 22 - - - -2% 2% - - - - 3% 3% - - - - C D AC BD
3-year collegedegree/Bachelor’s degree
18 17 - - - - 18 17 - - - -2% 2% - - - - 2% 2% - - - -
AC BD
4-year collegedegree/Master’s degree
25 15 - - - - 25 15 - - - -2% 1% - - - - 3% 2% - - - - C AC B
DESS/DEA /Master(5-year college degree)
5 7 - - - - 5 7 - - - -* 1% - - - - 1% 1% - - - -
Doctorate
4 1 - - - - 4 1 - - - -* * - - - - * * - - - -
Still studying
3 3 - - - - 3 3 - - - -* * - - - - * * - - - -
Did not graduate
10 11 - - - - 10 11 - - - -1% 1% - - - - 1% 1% - - - -
Lower SecondaryEducation (5th - 9 or 10th)
30 36 - - - - 30 36 - - - -3% 3% - - - - 3% 5% - - - - C D AC BDJ
HS Diploma
18 25 - - - - 18 25 - - - -2% 2% - - - - 2% 3% - - - -
D AC BD
University Entrance Exam
29 34 - - - - 29 34 - - - -2% 3% - - - - 3% 4% - - - - C D AC BDJ
University of AppliedSciences
34 44 - - - - 34 44 - - - -3% 4% - - - - 4% 6% - - - - C DJ ACI BDJ
Finished University
9 2 - - - - 9 2 - - - -1% * - - - - 1% * - - - -
Doctorate
97 64 - - - - 97 64 - - - -8% 6% - - - - 11% 8% - - - -
CI DJ HACI BDJ
Completed Apprenticeship
_________________________________________________________________________________________________________________Proportions/Means: Columns Tested (5% risk level) - A/B - C/D - E/F - G/H - I/J - K/L - A/C/E/G/I/K - B/D/F/H/J/LOverlap formulae used. * small base; ** very small base (under 30) ineligible for sig testing
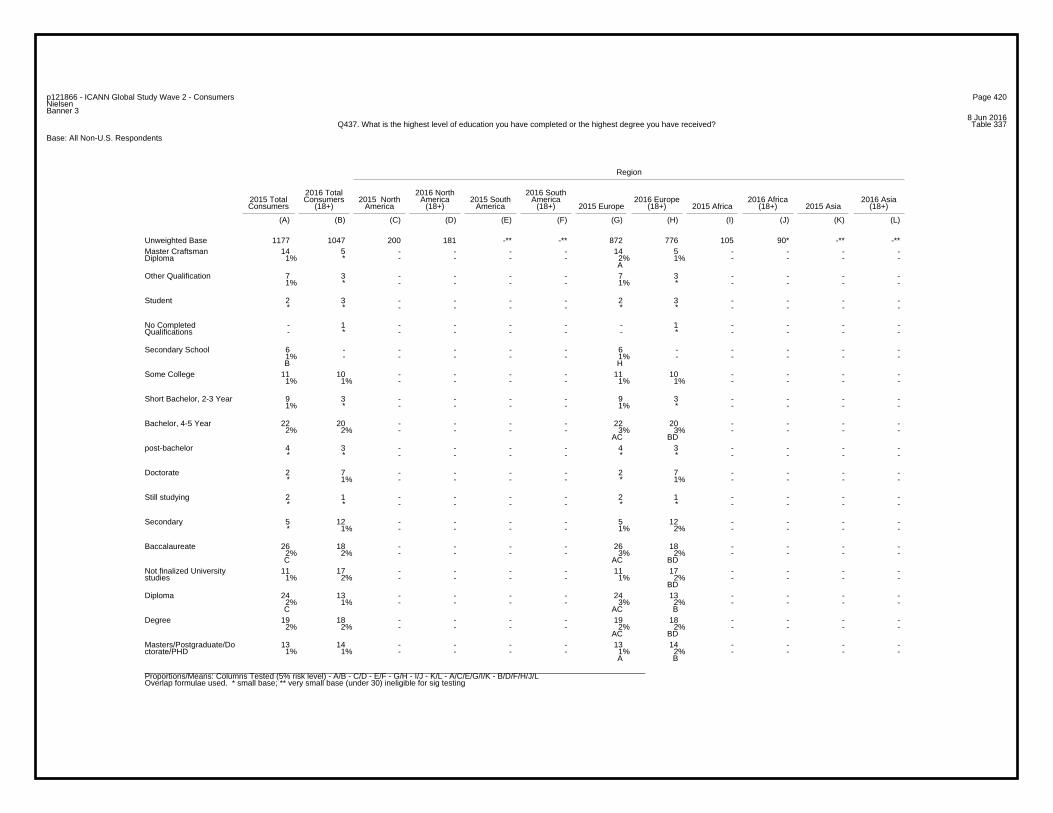
Page 420p121866 - ICANN Global Study Wave 2 - ConsumersNielsenBanner 3
8 Jun 2016Table 337Q437. What is the highest level of education you have completed or the highest degree you have received?
Base: All Non-U.S. Respondents
Region
2016 Total 2016 North 2016 South2015 Total Consumers 2015 North America 2015 South America 2016 Europe 2016 Africa 2016 AsiaConsumers (18+) America (18+) America (18+) 2015 Europe (18+) 2015 Africa (18+) 2015 Asia (18+)
(A) (B) (C) (D) (E) (F) (G) (H) (I) (J) (K) (L)
1177 1047 200 181 -** -** 872 776 105 90* -** -**Unweighted Base14 5 - - - - 14 5 - - - -
1% * - - - - 2% 1% - - - - A
Master CraftsmanDiploma
7 3 - - - - 7 3 - - - -1% * - - - - 1% * - - - -
Other Qualification
2 3 - - - - 2 3 - - - -* * - - - - * * - - - -
Student
- 1 - - - - - 1 - - - -- * - - - - - * - - - -
No CompletedQualifications
6 - - - - - 6 - - - - -1% - - - - - 1% - - - - - B H
Secondary School
11 10 - - - - 11 10 - - - -1% 1% - - - - 1% 1% - - - -
Some College
9 3 - - - - 9 3 - - - -1% * - - - - 1% * - - - -
Short Bachelor, 2-3 Year
22 20 - - - - 22 20 - - - -2% 2% - - - - 3% 3% - - - -
AC BD
Bachelor, 4-5 Year
4 3 - - - - 4 3 - - - -* * - - - - * * - - - -
post-bachelor
2 7 - - - - 2 7 - - - -* 1% - - - - * 1% - - - -
Doctorate
2 1 - - - - 2 1 - - - -* * - - - - * * - - - -
Still studying
5 12 - - - - 5 12 - - - -* 1% - - - - 1% 2% - - - -
Secondary
26 18 - - - - 26 18 - - - -2% 2% - - - - 3% 2% - - - - C AC BD
Baccalaureate
11 17 - - - - 11 17 - - - -1% 2% - - - - 1% 2% - - - -
BD
Not finalized Universitystudies
24 13 - - - - 24 13 - - - -2% 1% - - - - 3% 2% - - - - C AC B
Diploma
19 18 - - - - 19 18 - - - -2% 2% - - - - 2% 2% - - - -
AC BD
Degree
13 14 - - - - 13 14 - - - -1% 1% - - - - 1% 2% - - - -
A B
Masters/Postgraduate/Doctorate/PHD
_________________________________________________________________________________________________________________Proportions/Means: Columns Tested (5% risk level) - A/B - C/D - E/F - G/H - I/J - K/L - A/C/E/G/I/K - B/D/F/H/J/LOverlap formulae used. * small base; ** very small base (under 30) ineligible for sig testing
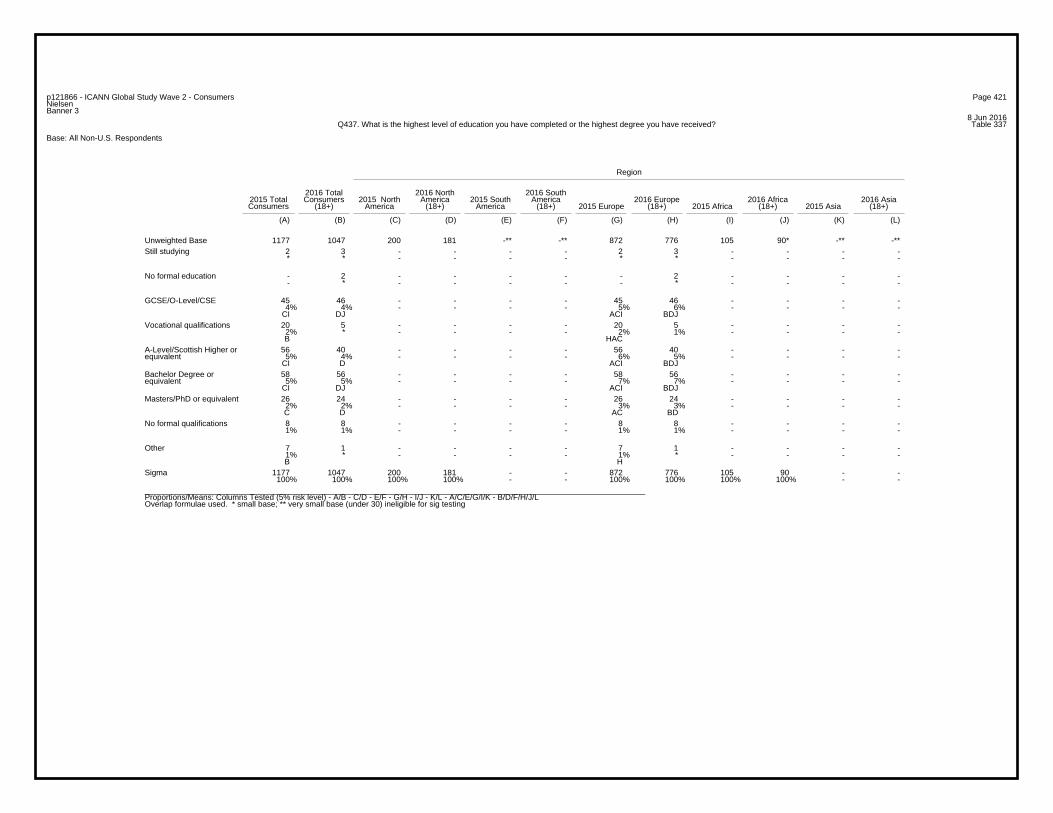
Page 421p121866 - ICANN Global Study Wave 2 - ConsumersNielsenBanner 3
8 Jun 2016Table 337Q437. What is the highest level of education you have completed or the highest degree you have received?
Base: All Non-U.S. Respondents
Region
2016 Total 2016 North 2016 South2015 Total Consumers 2015 North America 2015 South America 2016 Europe 2016 Africa 2016 AsiaConsumers (18+) America (18+) America (18+) 2015 Europe (18+) 2015 Africa (18+) 2015 Asia (18+)
(A) (B) (C) (D) (E) (F) (G) (H) (I) (J) (K) (L)
1177 1047 200 181 -** -** 872 776 105 90* -** -**Unweighted Base2 3 - - - - 2 3 - - - -* * - - - - * * - - - -
Still studying
- 2 - - - - - 2 - - - -- * - - - - - * - - - -
No formal education
45 46 - - - - 45 46 - - - -4% 4% - - - - 5% 6% - - - -
CI DJ ACI BDJ
GCSE/O-Level/CSE
20 5 - - - - 20 5 - - - -2% * - - - - 2% 1% - - - - B HAC
Vocational qualifications
56 40 - - - - 56 40 - - - -5% 4% - - - - 6% 5% - - - -
CI D ACI BDJ
A-Level/Scottish Higher orequivalent
58 56 - - - - 58 56 - - - -5% 5% - - - - 7% 7% - - - -
CI DJ ACI BDJ
Bachelor Degree orequivalent
26 24 - - - - 26 24 - - - -2% 2% - - - - 3% 3% - - - - C D AC BD
Masters/PhD or equivalent
8 8 - - - - 8 8 - - - -1% 1% - - - - 1% 1% - - - -
No formal qualifications
7 1 - - - - 7 1 - - - -1% * - - - - 1% * - - - - B H
Other
1177 1047 200 181 - - 872 776 105 90 - -100% 100% 100% 100% - - 100% 100% 100% 100% - -
Sigma
_________________________________________________________________________________________________________________Proportions/Means: Columns Tested (5% risk level) - A/B - C/D - E/F - G/H - I/J - K/L - A/C/E/G/I/K - B/D/F/H/J/LOverlap formulae used. * small base; ** very small base (under 30) ineligible for sig testing
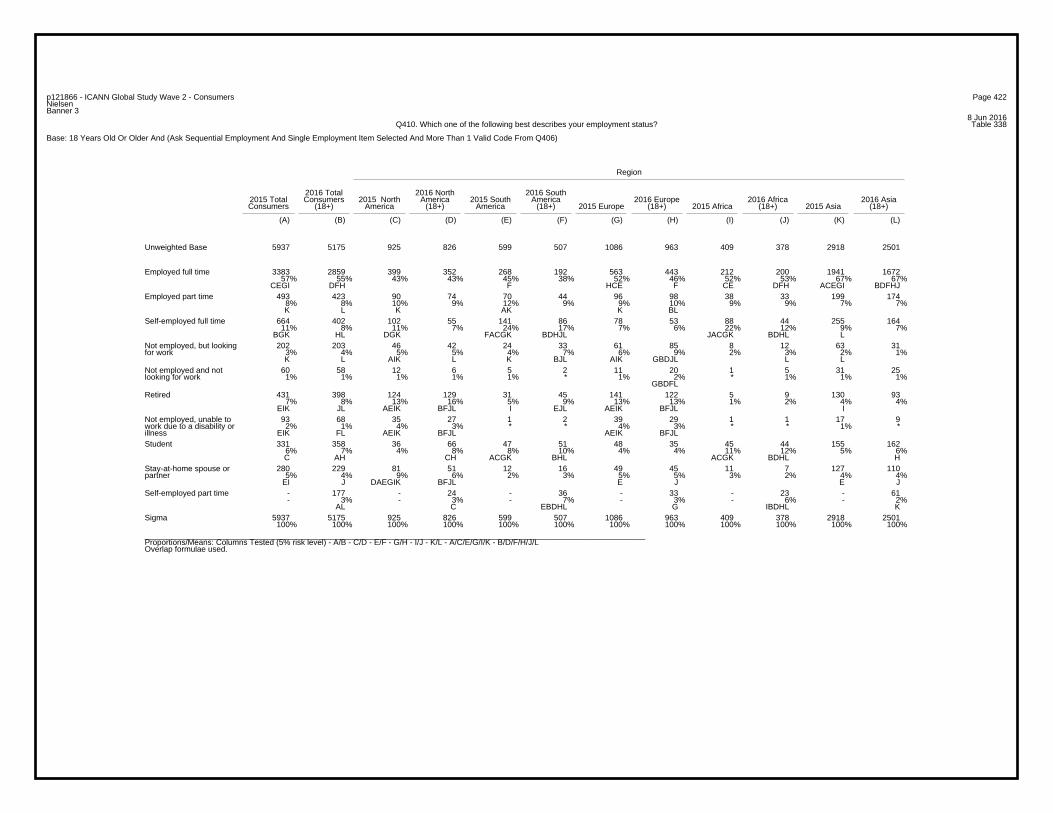
Page 422p121866 - ICANN Global Study Wave 2 - ConsumersNielsenBanner 3
8 Jun 2016Table 338Q410. Which one of the following best describes your employment status?
Base: 18 Years Old Or Older And (Ask Sequential Employment And Single Employment Item Selected And More Than 1 Valid Code From Q406)
Region
2016 Total 2016 North 2016 South2015 Total Consumers 2015 North America 2015 South America 2016 Europe 2016 Africa 2016 AsiaConsumers (18+) America (18+) America (18+) 2015 Europe (18+) 2015 Africa (18+) 2015 Asia (18+)
(A) (B) (C) (D) (E) (F) (G) (H) (I) (J) (K) (L)
5937 5175 925 826 599 507 1086 963 409 378 2918 2501Unweighted Base
3383 2859 399 352 268 192 563 443 212 200 1941 167257% 55% 43% 43% 45% 38% 52% 46% 52% 53% 67% 67%
CEGI DFH F HCE F CE DFH ACEGI BDFHJ
Employed full time
493 423 90 74 70 44 96 98 38 33 199 1748% 8% 10% 9% 12% 9% 9% 10% 9% 9% 7% 7%K L K AK K BL
Employed part time
664 402 102 55 141 86 78 53 88 44 255 16411% 8% 11% 7% 24% 17% 7% 6% 22% 12% 9% 7%
BGK HL DGK FACGK BDHJL JACGK BDHL L
Self-employed full time
202 203 46 42 24 33 61 85 8 12 63 313% 4% 5% 5% 4% 7% 6% 9% 2% 3% 2% 1%K L AIK L K BJL AIK GBDJL L L
Not employed, but lookingfor work
60 58 12 6 5 2 11 20 1 5 31 251% 1% 1% 1% 1% * 1% 2% * 1% 1% 1%
GBDFL
Not employed and notlooking for work
431 398 124 129 31 45 141 122 5 9 130 937% 8% 13% 16% 5% 9% 13% 13% 1% 2% 4% 4%
EIK JL AEIK BFJL I EJL AEIK BFJL I
Retired
93 68 35 27 1 2 39 29 1 1 17 92% 1% 4% 3% * * 4% 3% * * 1% *
EIK FL AEIK BFJL AEIK BFJL
Not employed, unable towork due to a disability orillness
331 358 36 66 47 51 48 35 45 44 155 1626% 7% 4% 8% 8% 10% 4% 4% 11% 12% 5% 6%C AH CH ACGK BHL ACGK BDHL H
Student
280 229 81 51 12 16 49 45 11 7 127 1105% 4% 9% 6% 2% 3% 5% 5% 3% 2% 4% 4%
EI J DAEGIK BFJL E J E J
Stay-at-home spouse orpartner
- 177 - 24 - 36 - 33 - 23 - 61- 3% - 3% - 7% - 3% - 6% - 2%
AL C EBDHL G IBDHL K
Self-employed part time
5937 5175 925 826 599 507 1086 963 409 378 2918 2501100% 100% 100% 100% 100% 100% 100% 100% 100% 100% 100% 100%
Sigma
_________________________________________________________________________________________________________________Proportions/Means: Columns Tested (5% risk level) - A/B - C/D - E/F - G/H - I/J - K/L - A/C/E/G/I/K - B/D/F/H/J/LOverlap formulae used.
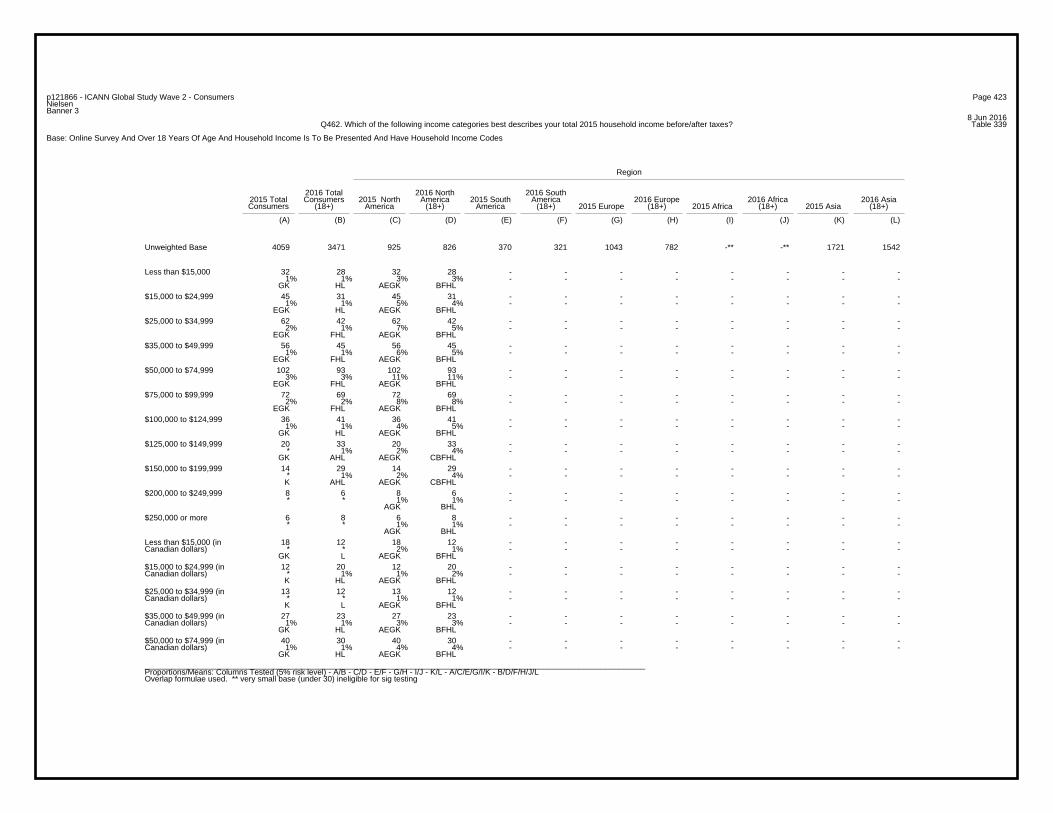
Page 423p121866 - ICANN Global Study Wave 2 - ConsumersNielsenBanner 3
8 Jun 2016Table 339Q462. Which of the following income categories best describes your total 2015 household income before/after taxes?
Base: Online Survey And Over 18 Years Of Age And Household Income Is To Be Presented And Have Household Income Codes
Region
2016 Total 2016 North 2016 South2015 Total Consumers 2015 North America 2015 South America 2016 Europe 2016 Africa 2016 AsiaConsumers (18+) America (18+) America (18+) 2015 Europe (18+) 2015 Africa (18+) 2015 Asia (18+)
(A) (B) (C) (D) (E) (F) (G) (H) (I) (J) (K) (L)
4059 3471 925 826 370 321 1043 782 -** -** 1721 1542Unweighted Base
32 28 32 28 - - - - - - - -1% 1% 3% 3% - - - - - - - -
GK HL AEGK BFHL
Less than $15,000
45 31 45 31 - - - - - - - -1% 1% 5% 4% - - - - - - - -
EGK HL AEGK BFHL
$15,000 to $24,999
62 42 62 42 - - - - - - - -2% 1% 7% 5% - - - - - - - -
EGK FHL AEGK BFHL
$25,000 to $34,999
56 45 56 45 - - - - - - - -1% 1% 6% 5% - - - - - - - -
EGK FHL AEGK BFHL
$35,000 to $49,999
102 93 102 93 - - - - - - - -3% 3% 11% 11% - - - - - - - -
EGK FHL AEGK BFHL
$50,000 to $74,999
72 69 72 69 - - - - - - - -2% 2% 8% 8% - - - - - - - -
EGK FHL AEGK BFHL
$75,000 to $99,999
36 41 36 41 - - - - - - - -1% 1% 4% 5% - - - - - - - -
GK HL AEGK BFHL
$100,000 to $124,999
20 33 20 33 - - - - - - - -* 1% 2% 4% - - - - - - - -
GK AHL AEGK CBFHL
$125,000 to $149,999
14 29 14 29 - - - - - - - -* 1% 2% 4% - - - - - - - - K AHL AEGK CBFHL
$150,000 to $199,999
8 6 8 6 - - - - - - - -* * 1% 1% - - - - - - - -
AGK BHL
$200,000 to $249,999
6 8 6 8 - - - - - - - -* * 1% 1% - - - - - - - -
AGK BHL
$250,000 or more
18 12 18 12 - - - - - - - -* * 2% 1% - - - - - - - -
GK L AEGK BFHL
Less than $15,000 (inCanadian dollars)
12 20 12 20 - - - - - - - -* 1% 1% 2% - - - - - - - - K HL AEGK BFHL
$15,000 to $24,999 (inCanadian dollars)
13 12 13 12 - - - - - - - -* * 1% 1% - - - - - - - - K L AEGK BFHL
$25,000 to $34,999 (inCanadian dollars)
27 23 27 23 - - - - - - - -1% 1% 3% 3% - - - - - - - -
GK HL AEGK BFHL
$35,000 to $49,999 (inCanadian dollars)
40 30 40 30 - - - - - - - -1% 1% 4% 4% - - - - - - - -
GK HL AEGK BFHL
$50,000 to $74,999 (inCanadian dollars)
_________________________________________________________________________________________________________________Proportions/Means: Columns Tested (5% risk level) - A/B - C/D - E/F - G/H - I/J - K/L - A/C/E/G/I/K - B/D/F/H/J/LOverlap formulae used. ** very small base (under 30) ineligible for sig testing
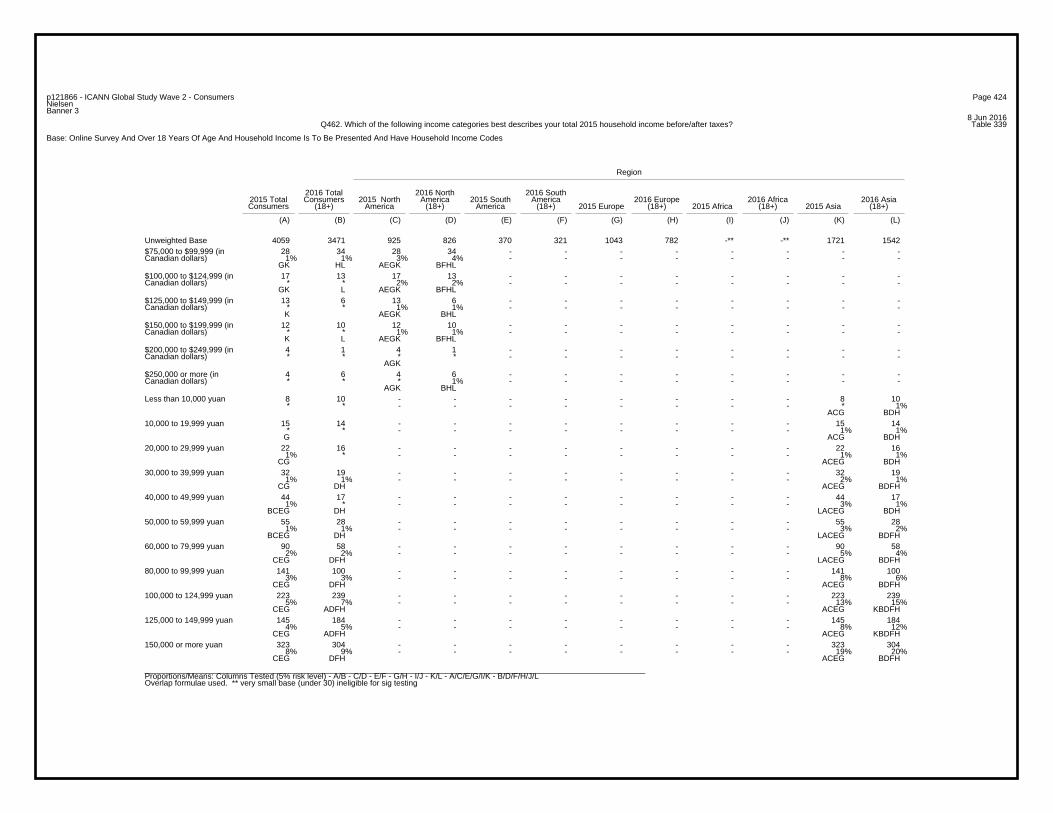
Page 424p121866 - ICANN Global Study Wave 2 - ConsumersNielsenBanner 3
8 Jun 2016Table 339Q462. Which of the following income categories best describes your total 2015 household income before/after taxes?
Base: Online Survey And Over 18 Years Of Age And Household Income Is To Be Presented And Have Household Income Codes
Region
2016 Total 2016 North 2016 South2015 Total Consumers 2015 North America 2015 South America 2016 Europe 2016 Africa 2016 AsiaConsumers (18+) America (18+) America (18+) 2015 Europe (18+) 2015 Africa (18+) 2015 Asia (18+)
(A) (B) (C) (D) (E) (F) (G) (H) (I) (J) (K) (L)
4059 3471 925 826 370 321 1043 782 -** -** 1721 1542Unweighted Base28 34 28 34 - - - - - - - -
1% 1% 3% 4% - - - - - - - - GK HL AEGK BFHL
$75,000 to $99,999 (inCanadian dollars)
17 13 17 13 - - - - - - - -* * 2% 2% - - - - - - - -
GK L AEGK BFHL
$100,000 to $124,999 (inCanadian dollars)
13 6 13 6 - - - - - - - -* * 1% 1% - - - - - - - - K AEGK BHL
$125,000 to $149,999 (inCanadian dollars)
12 10 12 10 - - - - - - - -* * 1% 1% - - - - - - - - K L AEGK BFHL
$150,000 to $199,999 (inCanadian dollars)
4 1 4 1 - - - - - - - -* * * * - - - - - - - -
AGK
$200,000 to $249,999 (inCanadian dollars)
4 6 4 6 - - - - - - - -* * * 1% - - - - - - - -
AGK BHL
$250,000 or more (inCanadian dollars)
8 10 - - - - - - - - 8 10* * - - - - - - - - * 1%
ACG BDH
Less than 10,000 yuan
15 14 - - - - - - - - 15 14* * - - - - - - - - 1% 1%
G ACG BDH
10,000 to 19,999 yuan
22 16 - - - - - - - - 22 161% * - - - - - - - - 1% 1%
CG ACEG BDH
20,000 to 29,999 yuan
32 19 - - - - - - - - 32 191% 1% - - - - - - - - 2% 1%
CG DH ACEG BDFH
30,000 to 39,999 yuan
44 17 - - - - - - - - 44 171% * - - - - - - - - 3% 1%
BCEG DH LACEG BDH
40,000 to 49,999 yuan
55 28 - - - - - - - - 55 281% 1% - - - - - - - - 3% 2%
BCEG DH LACEG BDFH
50,000 to 59,999 yuan
90 58 - - - - - - - - 90 582% 2% - - - - - - - - 5% 4%
CEG DFH LACEG BDFH
60,000 to 79,999 yuan
141 100 - - - - - - - - 141 1003% 3% - - - - - - - - 8% 6%
CEG DFH ACEG BDFH
80,000 to 99,999 yuan
223 239 - - - - - - - - 223 2395% 7% - - - - - - - - 13% 15%
CEG ADFH ACEG KBDFH
100,000 to 124,999 yuan
145 184 - - - - - - - - 145 1844% 5% - - - - - - - - 8% 12%
CEG ADFH ACEG KBDFH
125,000 to 149,999 yuan
323 304 - - - - - - - - 323 3048% 9% - - - - - - - - 19% 20%
CEG DFH ACEG BDFH
150,000 or more yuan
_________________________________________________________________________________________________________________Proportions/Means: Columns Tested (5% risk level) - A/B - C/D - E/F - G/H - I/J - K/L - A/C/E/G/I/K - B/D/F/H/J/LOverlap formulae used. ** very small base (under 30) ineligible for sig testing
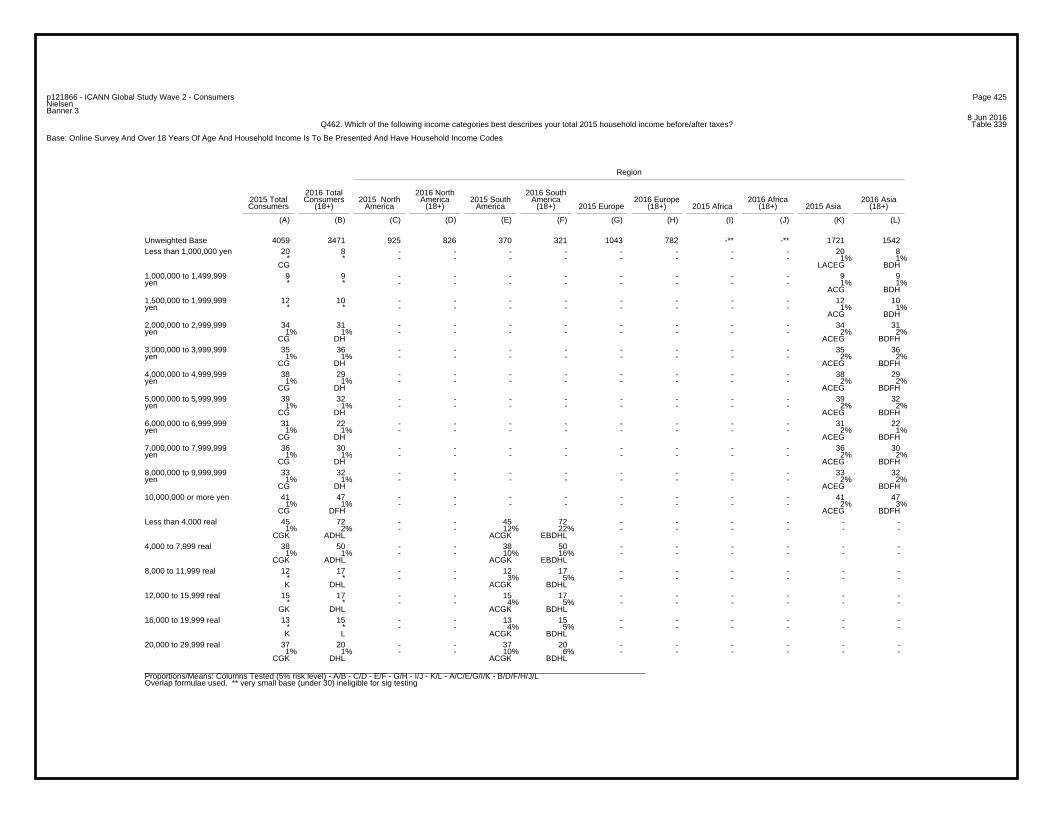
Page 425p121866 - ICANN Global Study Wave 2 - ConsumersNielsenBanner 3
8 Jun 2016Table 339Q462. Which of the following income categories best describes your total 2015 household income before/after taxes?
Base: Online Survey And Over 18 Years Of Age And Household Income Is To Be Presented And Have Household Income Codes
Region
2016 Total 2016 North 2016 South2015 Total Consumers 2015 North America 2015 South America 2016 Europe 2016 Africa 2016 AsiaConsumers (18+) America (18+) America (18+) 2015 Europe (18+) 2015 Africa (18+) 2015 Asia (18+)
(A) (B) (C) (D) (E) (F) (G) (H) (I) (J) (K) (L)
4059 3471 925 826 370 321 1043 782 -** -** 1721 1542Unweighted Base20 8 - - - - - - - - 20 8
* * - - - - - - - - 1% 1%CG LACEG BDH
Less than 1,000,000 yen
9 9 - - - - - - - - 9 9* * - - - - - - - - 1% 1%
ACG BDH
1,000,000 to 1,499,999yen
12 10 - - - - - - - - 12 10* * - - - - - - - - 1% 1%
ACG BDH
1,500,000 to 1,999,999yen
34 31 - - - - - - - - 34 311% 1% - - - - - - - - 2% 2%
CG DH ACEG BDFH
2,000,000 to 2,999,999yen
35 36 - - - - - - - - 35 361% 1% - - - - - - - - 2% 2%
CG DH ACEG BDFH
3,000,000 to 3,999,999yen
38 29 - - - - - - - - 38 291% 1% - - - - - - - - 2% 2%
CG DH ACEG BDFH
4,000,000 to 4,999,999yen
39 32 - - - - - - - - 39 321% 1% - - - - - - - - 2% 2%
CG DH ACEG BDFH
5,000,000 to 5,999,999yen
31 22 - - - - - - - - 31 221% 1% - - - - - - - - 2% 1%
CG DH ACEG BDFH
6,000,000 to 6,999,999yen
36 30 - - - - - - - - 36 301% 1% - - - - - - - - 2% 2%
CG DH ACEG BDFH
7,000,000 to 7,999,999yen
33 32 - - - - - - - - 33 321% 1% - - - - - - - - 2% 2%
CG DH ACEG BDFH
8,000,000 to 9,999,999yen
41 47 - - - - - - - - 41 471% 1% - - - - - - - - 2% 3%
CG DFH ACEG BDFH
10,000,000 or more yen
45 72 - - 45 72 - - - - - -1% 2% - - 12% 22% - - - - - -
CGK ADHL ACGK EBDHL
Less than 4,000 real
38 50 - - 38 50 - - - - - -1% 1% - - 10% 16% - - - - - -
CGK ADHL ACGK EBDHL
4,000 to 7,999 real
12 17 - - 12 17 - - - - - -* * - - 3% 5% - - - - - - K DHL ACGK BDHL
8,000 to 11,999 real
15 17 - - 15 17 - - - - - -* * - - 4% 5% - - - - - -
GK DHL ACGK BDHL
12,000 to 15,999 real
13 15 - - 13 15 - - - - - -* * - - 4% 5% - - - - - - K L ACGK BDHL
16,000 to 19,999 real
37 20 - - 37 20 - - - - - -1% 1% - - 10% 6% - - - - - -
CGK DHL ACGK BDHL
20,000 to 29,999 real
_________________________________________________________________________________________________________________Proportions/Means: Columns Tested (5% risk level) - A/B - C/D - E/F - G/H - I/J - K/L - A/C/E/G/I/K - B/D/F/H/J/LOverlap formulae used. ** very small base (under 30) ineligible for sig testing
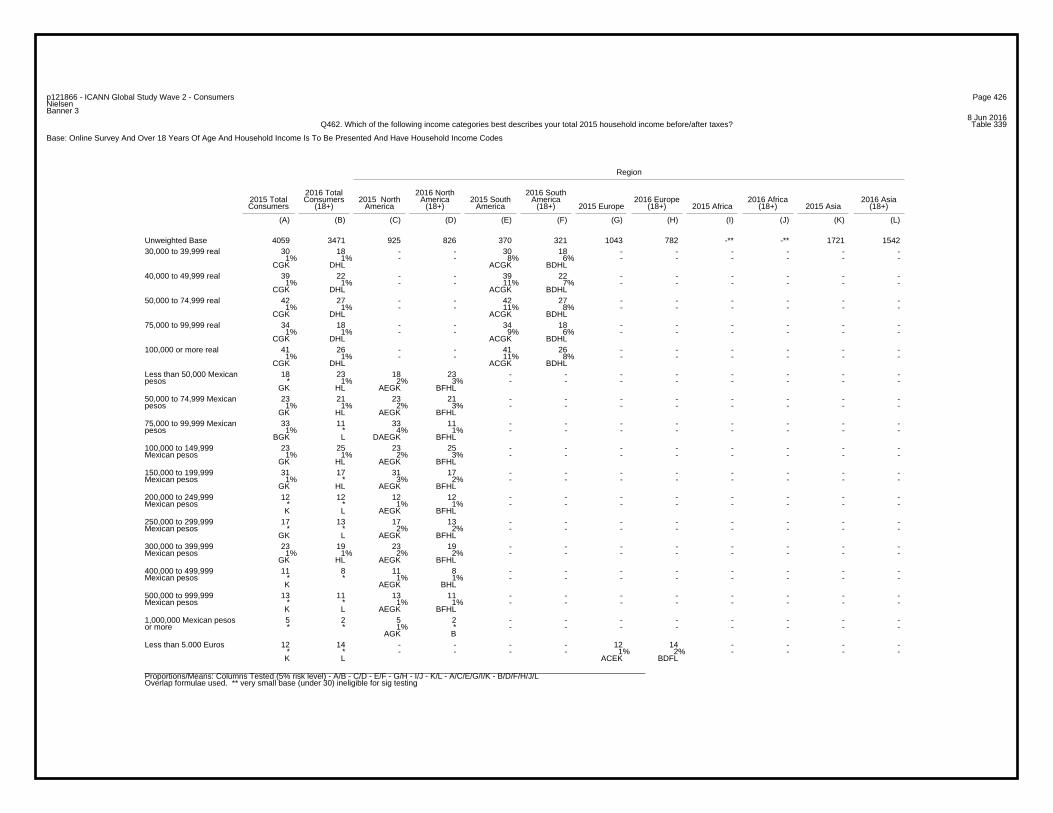
Page 426p121866 - ICANN Global Study Wave 2 - ConsumersNielsenBanner 3
8 Jun 2016Table 339Q462. Which of the following income categories best describes your total 2015 household income before/after taxes?
Base: Online Survey And Over 18 Years Of Age And Household Income Is To Be Presented And Have Household Income Codes
Region
2016 Total 2016 North 2016 South2015 Total Consumers 2015 North America 2015 South America 2016 Europe 2016 Africa 2016 AsiaConsumers (18+) America (18+) America (18+) 2015 Europe (18+) 2015 Africa (18+) 2015 Asia (18+)
(A) (B) (C) (D) (E) (F) (G) (H) (I) (J) (K) (L)
4059 3471 925 826 370 321 1043 782 -** -** 1721 1542Unweighted Base30 18 - - 30 18 - - - - - -
1% 1% - - 8% 6% - - - - - - CGK DHL ACGK BDHL
30,000 to 39,999 real
39 22 - - 39 22 - - - - - -1% 1% - - 11% 7% - - - - - -
CGK DHL ACGK BDHL
40,000 to 49,999 real
42 27 - - 42 27 - - - - - -1% 1% - - 11% 8% - - - - - -
CGK DHL ACGK BDHL
50,000 to 74,999 real
34 18 - - 34 18 - - - - - -1% 1% - - 9% 6% - - - - - -
CGK DHL ACGK BDHL
75,000 to 99,999 real
41 26 - - 41 26 - - - - - -1% 1% - - 11% 8% - - - - - -
CGK DHL ACGK BDHL
100,000 or more real
18 23 18 23 - - - - - - - -* 1% 2% 3% - - - - - - - -
GK HL AEGK BFHL
Less than 50,000 Mexicanpesos
23 21 23 21 - - - - - - - -1% 1% 2% 3% - - - - - - - -
GK HL AEGK BFHL
50,000 to 74,999 Mexicanpesos
33 11 33 11 - - - - - - - -1% * 4% 1% - - - - - - - -
BGK L DAEGK BFHL
75,000 to 99,999 Mexicanpesos
23 25 23 25 - - - - - - - -1% 1% 2% 3% - - - - - - - -
GK HL AEGK BFHL
100,000 to 149,999Mexican pesos
31 17 31 17 - - - - - - - -1% * 3% 2% - - - - - - - -
GK HL AEGK BFHL
150,000 to 199,999Mexican pesos
12 12 12 12 - - - - - - - -* * 1% 1% - - - - - - - - K L AEGK BFHL
200,000 to 249,999Mexican pesos
17 13 17 13 - - - - - - - -* * 2% 2% - - - - - - - -
GK L AEGK BFHL
250,000 to 299,999Mexican pesos
23 19 23 19 - - - - - - - -1% 1% 2% 2% - - - - - - - -
GK HL AEGK BFHL
300,000 to 399,999Mexican pesos
11 8 11 8 - - - - - - - -* * 1% 1% - - - - - - - - K AEGK BHL
400,000 to 499,999Mexican pesos
13 11 13 11 - - - - - - - -* * 1% 1% - - - - - - - - K L AEGK BFHL
500,000 to 999,999Mexican pesos
5 2 5 2 - - - - - - - -* * 1% * - - - - - - - -
AGK B
1,000,000 Mexican pesosor more
12 14 - - - - 12 14 - - - -* * - - - - 1% 2% - - - - K L ACEK BDFL
Less than 5.000 Euros
_________________________________________________________________________________________________________________Proportions/Means: Columns Tested (5% risk level) - A/B - C/D - E/F - G/H - I/J - K/L - A/C/E/G/I/K - B/D/F/H/J/LOverlap formulae used. ** very small base (under 30) ineligible for sig testing
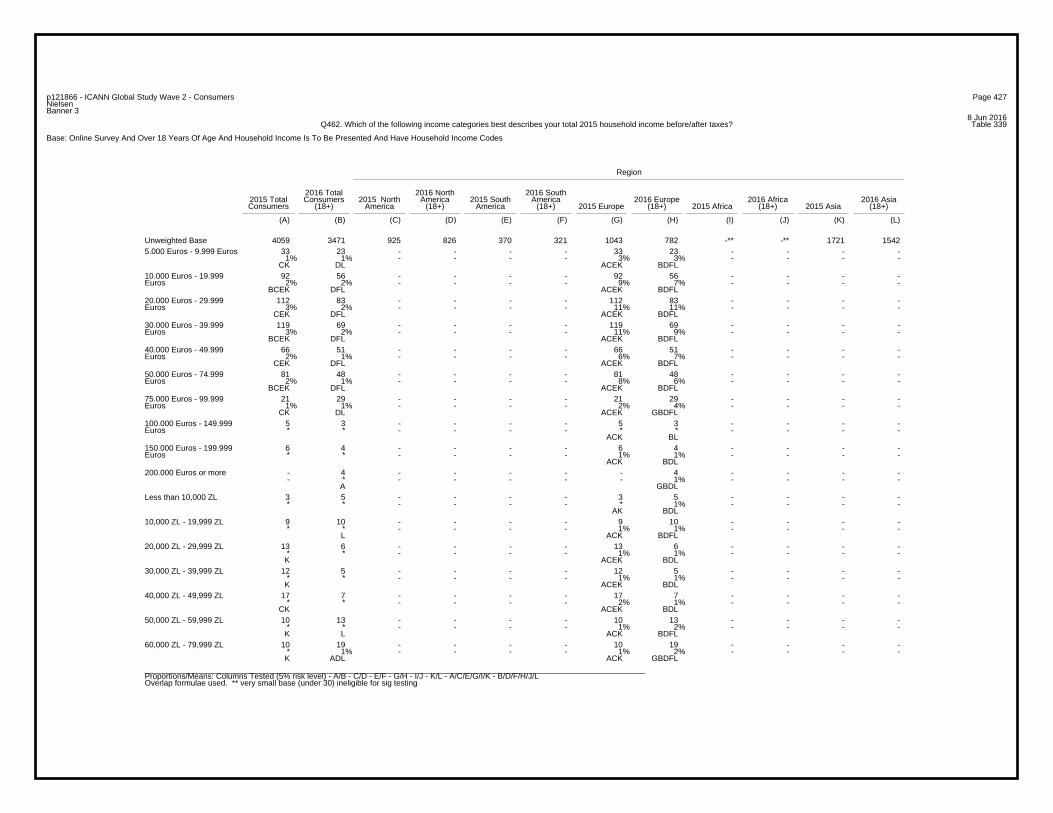
Page 427p121866 - ICANN Global Study Wave 2 - ConsumersNielsenBanner 3
8 Jun 2016Table 339Q462. Which of the following income categories best describes your total 2015 household income before/after taxes?
Base: Online Survey And Over 18 Years Of Age And Household Income Is To Be Presented And Have Household Income Codes
Region
2016 Total 2016 North 2016 South2015 Total Consumers 2015 North America 2015 South America 2016 Europe 2016 Africa 2016 AsiaConsumers (18+) America (18+) America (18+) 2015 Europe (18+) 2015 Africa (18+) 2015 Asia (18+)
(A) (B) (C) (D) (E) (F) (G) (H) (I) (J) (K) (L)
4059 3471 925 826 370 321 1043 782 -** -** 1721 1542Unweighted Base33 23 - - - - 33 23 - - - -
1% 1% - - - - 3% 3% - - - - CK DL ACEK BDFL
5.000 Euros - 9.999 Euros
92 56 - - - - 92 56 - - - -2% 2% - - - - 9% 7% - - - -
BCEK DFL ACEK BDFL
10.000 Euros - 19.999Euros
112 83 - - - - 112 83 - - - -3% 2% - - - - 11% 11% - - - -
CEK DFL ACEK BDFL
20.000 Euros - 29.999Euros
119 69 - - - - 119 69 - - - -3% 2% - - - - 11% 9% - - - -
BCEK DFL ACEK BDFL
30.000 Euros - 39.999Euros
66 51 - - - - 66 51 - - - -2% 1% - - - - 6% 7% - - - -
CEK DFL ACEK BDFL
40.000 Euros - 49.999Euros
81 48 - - - - 81 48 - - - -2% 1% - - - - 8% 6% - - - -
BCEK DFL ACEK BDFL
50.000 Euros - 74.999Euros
21 29 - - - - 21 29 - - - -1% 1% - - - - 2% 4% - - - -
CK DL ACEK GBDFL
75.000 Euros - 99.999Euros
5 3 - - - - 5 3 - - - -* * - - - - * * - - - -
ACK BL
100.000 Euros - 149.999Euros
6 4 - - - - 6 4 - - - -* * - - - - 1% 1% - - - -
ACK BDL
150.000 Euros - 199.999Euros
- 4 - - - - - 4 - - - -- * - - - - - 1% - - - -
A GBDL
200.000 Euros or more
3 5 - - - - 3 5 - - - -* * - - - - * 1% - - - -
AK BDL
Less than 10,000 ZL
9 10 - - - - 9 10 - - - -* * - - - - 1% 1% - - - -
L ACK BDFL
10,000 ZL - 19,999 ZL
13 6 - - - - 13 6 - - - -* * - - - - 1% 1% - - - - K ACEK BDL
20,000 ZL - 29,999 ZL
12 5 - - - - 12 5 - - - -* * - - - - 1% 1% - - - - K ACEK BDL
30,000 ZL - 39,999 ZL
17 7 - - - - 17 7 - - - -* * - - - - 2% 1% - - - -
CK ACEK BDL
40,000 ZL - 49,999 ZL
10 13 - - - - 10 13 - - - -* * - - - - 1% 2% - - - - K L ACK BDFL
50,000 ZL - 59,999 ZL
10 19 - - - - 10 19 - - - -* 1% - - - - 1% 2% - - - - K ADL ACK GBDFL
60,000 ZL - 79,999 ZL
_________________________________________________________________________________________________________________Proportions/Means: Columns Tested (5% risk level) - A/B - C/D - E/F - G/H - I/J - K/L - A/C/E/G/I/K - B/D/F/H/J/LOverlap formulae used. ** very small base (under 30) ineligible for sig testing
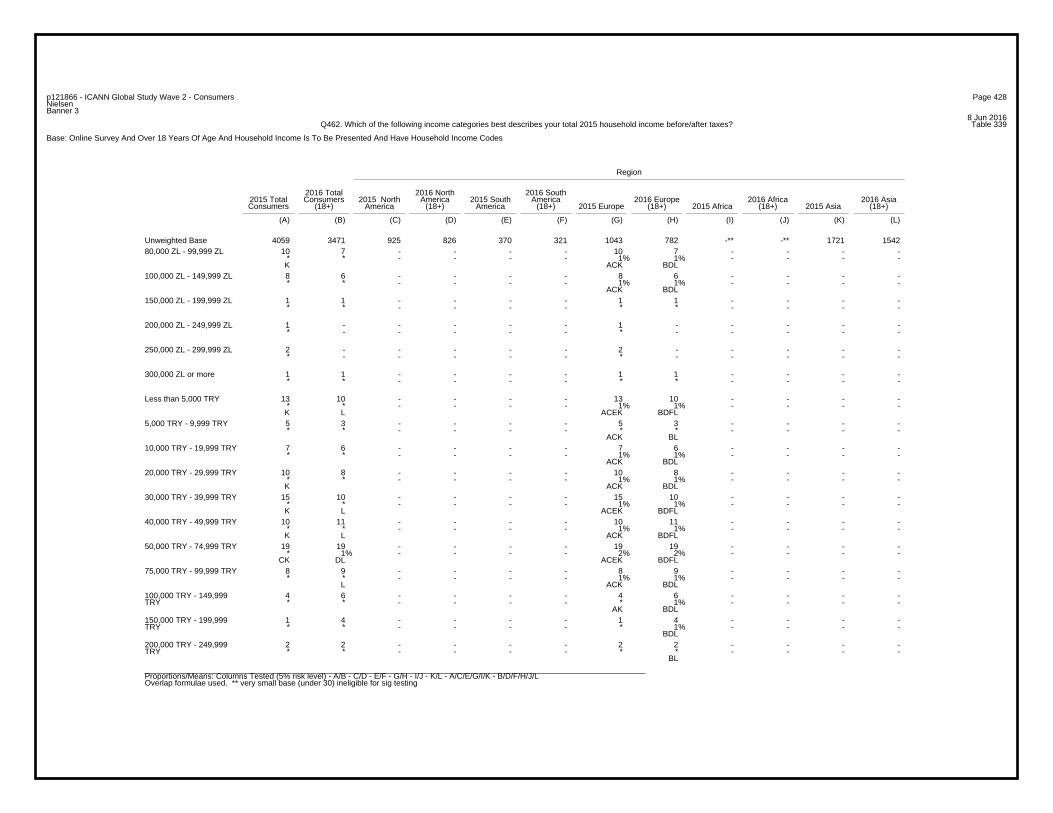
Page 428p121866 - ICANN Global Study Wave 2 - ConsumersNielsenBanner 3
8 Jun 2016Table 339Q462. Which of the following income categories best describes your total 2015 household income before/after taxes?
Base: Online Survey And Over 18 Years Of Age And Household Income Is To Be Presented And Have Household Income Codes
Region
2016 Total 2016 North 2016 South2015 Total Consumers 2015 North America 2015 South America 2016 Europe 2016 Africa 2016 AsiaConsumers (18+) America (18+) America (18+) 2015 Europe (18+) 2015 Africa (18+) 2015 Asia (18+)
(A) (B) (C) (D) (E) (F) (G) (H) (I) (J) (K) (L)
4059 3471 925 826 370 321 1043 782 -** -** 1721 1542Unweighted Base10 7 - - - - 10 7 - - - -
* * - - - - 1% 1% - - - - K ACK BDL
80,000 ZL - 99,999 ZL
8 6 - - - - 8 6 - - - -* * - - - - 1% 1% - - - -
ACK BDL
100,000 ZL - 149,999 ZL
1 1 - - - - 1 1 - - - -* * - - - - * * - - - -
150,000 ZL - 199,999 ZL
1 - - - - - 1 - - - - -* - - - - - * - - - - -
200,000 ZL - 249,999 ZL
2 - - - - - 2 - - - - -* - - - - - * - - - - -
250,000 ZL - 299,999 ZL
1 1 - - - - 1 1 - - - -* * - - - - * * - - - -
300,000 ZL or more
13 10 - - - - 13 10 - - - -* * - - - - 1% 1% - - - - K L ACEK BDFL
Less than 5,000 TRY
5 3 - - - - 5 3 - - - -* * - - - - * * - - - -
ACK BL
5,000 TRY - 9,999 TRY
7 6 - - - - 7 6 - - - -* * - - - - 1% 1% - - - -
ACK BDL
10,000 TRY - 19,999 TRY
10 8 - - - - 10 8 - - - -* * - - - - 1% 1% - - - - K ACK BDL
20,000 TRY - 29,999 TRY
15 10 - - - - 15 10 - - - -* * - - - - 1% 1% - - - - K L ACEK BDFL
30,000 TRY - 39,999 TRY
10 11 - - - - 10 11 - - - -* * - - - - 1% 1% - - - - K L ACK BDFL
40,000 TRY - 49,999 TRY
19 19 - - - - 19 19 - - - -* 1% - - - - 2% 2% - - - -
CK DL ACEK BDFL
50,000 TRY - 74,999 TRY
8 9 - - - - 8 9 - - - -* * - - - - 1% 1% - - - -
L ACK BDL
75,000 TRY - 99,999 TRY
4 6 - - - - 4 6 - - - -* * - - - - * 1% - - - -
AK BDL
100,000 TRY - 149,999TRY
1 4 - - - - 1 4 - - - -* * - - - - * 1% - - - -
BDL
150,000 TRY - 199,999TRY
2 2 - - - - 2 2 - - - -* * - - - - * * - - - -
BL
200,000 TRY - 249,999TRY
_________________________________________________________________________________________________________________Proportions/Means: Columns Tested (5% risk level) - A/B - C/D - E/F - G/H - I/J - K/L - A/C/E/G/I/K - B/D/F/H/J/LOverlap formulae used. ** very small base (under 30) ineligible for sig testing
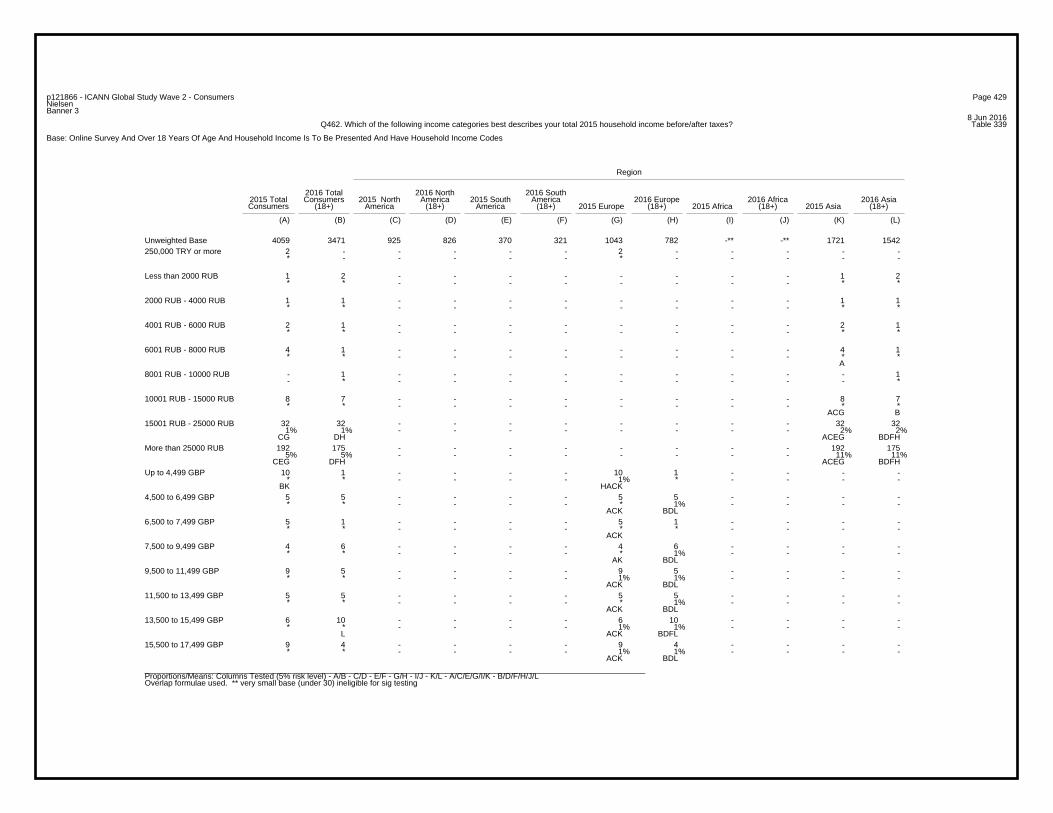
Page 429p121866 - ICANN Global Study Wave 2 - ConsumersNielsenBanner 3
8 Jun 2016Table 339Q462. Which of the following income categories best describes your total 2015 household income before/after taxes?
Base: Online Survey And Over 18 Years Of Age And Household Income Is To Be Presented And Have Household Income Codes
Region
2016 Total 2016 North 2016 South2015 Total Consumers 2015 North America 2015 South America 2016 Europe 2016 Africa 2016 AsiaConsumers (18+) America (18+) America (18+) 2015 Europe (18+) 2015 Africa (18+) 2015 Asia (18+)
(A) (B) (C) (D) (E) (F) (G) (H) (I) (J) (K) (L)
4059 3471 925 826 370 321 1043 782 -** -** 1721 1542Unweighted Base2 - - - - - 2 - - - - -* - - - - - * - - - - -
250,000 TRY or more
1 2 - - - - - - - - 1 2* * - - - - - - - - * *
Less than 2000 RUB
1 1 - - - - - - - - 1 1* * - - - - - - - - * *
2000 RUB - 4000 RUB
2 1 - - - - - - - - 2 1* * - - - - - - - - * *
4001 RUB - 6000 RUB
4 1 - - - - - - - - 4 1* * - - - - - - - - * *
A
6001 RUB - 8000 RUB
- 1 - - - - - - - - - 1- * - - - - - - - - - *
8001 RUB - 10000 RUB
8 7 - - - - - - - - 8 7* * - - - - - - - - * *
ACG B
10001 RUB - 15000 RUB
32 32 - - - - - - - - 32 321% 1% - - - - - - - - 2% 2%
CG DH ACEG BDFH
15001 RUB - 25000 RUB
192 175 - - - - - - - - 192 1755% 5% - - - - - - - - 11% 11%
CEG DFH ACEG BDFH
More than 25000 RUB
10 1 - - - - 10 1 - - - -* * - - - - 1% * - - - -
BK HACK
Up to 4,499 GBP
5 5 - - - - 5 5 - - - -* * - - - - * 1% - - - -
ACK BDL
4,500 to 6,499 GBP
5 1 - - - - 5 1 - - - -* * - - - - * * - - - -
ACK
6,500 to 7,499 GBP
4 6 - - - - 4 6 - - - -* * - - - - * 1% - - - -
AK BDL
7,500 to 9,499 GBP
9 5 - - - - 9 5 - - - -* * - - - - 1% 1% - - - -
ACK BDL
9,500 to 11,499 GBP
5 5 - - - - 5 5 - - - -* * - - - - * 1% - - - -
ACK BDL
11,500 to 13,499 GBP
6 10 - - - - 6 10 - - - -* * - - - - 1% 1% - - - -
L ACK BDFL
13,500 to 15,499 GBP
9 4 - - - - 9 4 - - - -* * - - - - 1% 1% - - - -
ACK BDL
15,500 to 17,499 GBP
_________________________________________________________________________________________________________________Proportions/Means: Columns Tested (5% risk level) - A/B - C/D - E/F - G/H - I/J - K/L - A/C/E/G/I/K - B/D/F/H/J/LOverlap formulae used. ** very small base (under 30) ineligible for sig testing
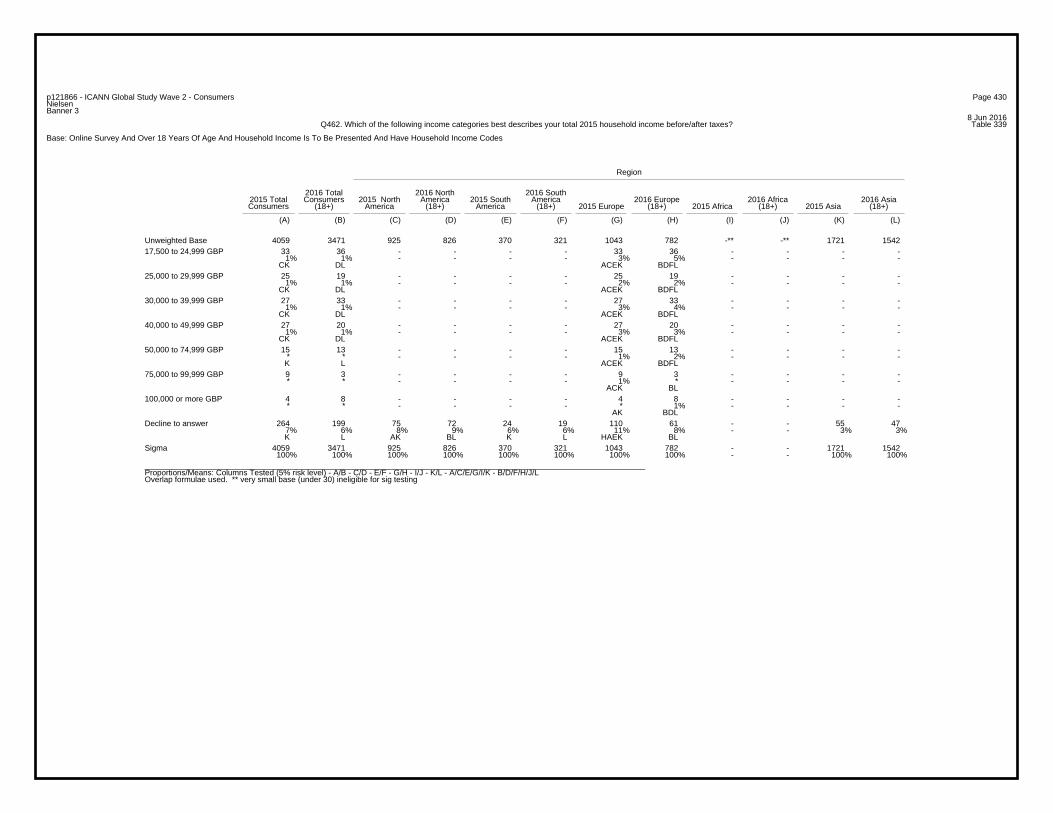
Page 430p121866 - ICANN Global Study Wave 2 - ConsumersNielsenBanner 3
8 Jun 2016Table 339Q462. Which of the following income categories best describes your total 2015 household income before/after taxes?
Base: Online Survey And Over 18 Years Of Age And Household Income Is To Be Presented And Have Household Income Codes
Region
2016 Total 2016 North 2016 South2015 Total Consumers 2015 North America 2015 South America 2016 Europe 2016 Africa 2016 AsiaConsumers (18+) America (18+) America (18+) 2015 Europe (18+) 2015 Africa (18+) 2015 Asia (18+)
(A) (B) (C) (D) (E) (F) (G) (H) (I) (J) (K) (L)
4059 3471 925 826 370 321 1043 782 -** -** 1721 1542Unweighted Base33 36 - - - - 33 36 - - - -
1% 1% - - - - 3% 5% - - - - CK DL ACEK BDFL
17,500 to 24,999 GBP
25 19 - - - - 25 19 - - - -1% 1% - - - - 2% 2% - - - -
CK DL ACEK BDFL
25,000 to 29,999 GBP
27 33 - - - - 27 33 - - - -1% 1% - - - - 3% 4% - - - -
CK DL ACEK BDFL
30,000 to 39,999 GBP
27 20 - - - - 27 20 - - - -1% 1% - - - - 3% 3% - - - -
CK DL ACEK BDFL
40,000 to 49,999 GBP
15 13 - - - - 15 13 - - - -* * - - - - 1% 2% - - - - K L ACEK BDFL
50,000 to 74,999 GBP
9 3 - - - - 9 3 - - - -* * - - - - 1% * - - - -
ACK BL
75,000 to 99,999 GBP
4 8 - - - - 4 8 - - - -* * - - - - * 1% - - - -
AK BDL
100,000 or more GBP
264 199 75 72 24 19 110 61 - - 55 477% 6% 8% 9% 6% 6% 11% 8% - - 3% 3%K L AK BL K L HAEK BL
Decline to answer
4059 3471 925 826 370 321 1043 782 - - 1721 1542100% 100% 100% 100% 100% 100% 100% 100% - - 100% 100%
Sigma
_________________________________________________________________________________________________________________Proportions/Means: Columns Tested (5% risk level) - A/B - C/D - E/F - G/H - I/J - K/L - A/C/E/G/I/K - B/D/F/H/J/LOverlap formulae used. ** very small base (under 30) ineligible for sig testing
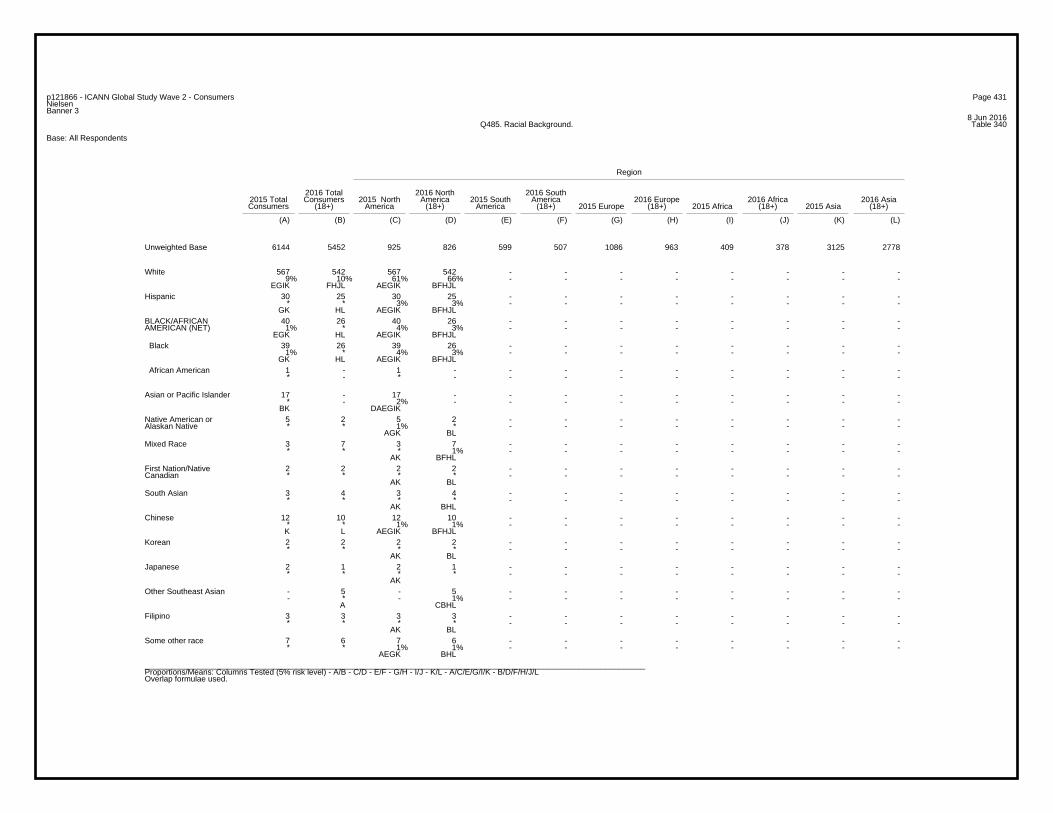
Page 431p121866 - ICANN Global Study Wave 2 - ConsumersNielsenBanner 3
8 Jun 2016Table 340Q485. Racial Background.
Base: All Respondents
Region
2016 Total 2016 North 2016 South2015 Total Consumers 2015 North America 2015 South America 2016 Europe 2016 Africa 2016 AsiaConsumers (18+) America (18+) America (18+) 2015 Europe (18+) 2015 Africa (18+) 2015 Asia (18+)
(A) (B) (C) (D) (E) (F) (G) (H) (I) (J) (K) (L)
6144 5452 925 826 599 507 1086 963 409 378 3125 2778Unweighted Base
567 542 567 542 - - - - - - - -9% 10% 61% 66% - - - - - - - -
EGIK FHJL AEGIK BFHJL
White
30 25 30 25 - - - - - - - -* * 3% 3% - - - - - - - -
GK HL AEGIK BFHJL
Hispanic
40 26 40 26 - - - - - - - -1% * 4% 3% - - - - - - - -
EGK HL AEGIK BFHJL
BLACK/AFRICANAMERICAN (NET)
39 26 39 26 - - - - - - - -1% * 4% 3% - - - - - - - -
GK HL AEGIK BFHJL
Black
1 - 1 - - - - - - - - -* - * - - - - - - - - -
African American
17 - 17 - - - - - - - - -* - 2% - - - - - - - - -
BK DAEGIK
Asian or Pacific Islander
5 2 5 2 - - - - - - - -* * 1% * - - - - - - - -
AGK BL
Native American orAlaskan Native
3 7 3 7 - - - - - - - -* * * 1% - - - - - - - -
AK BFHL
Mixed Race
2 2 2 2 - - - - - - - -* * * * - - - - - - - -
AK BL
First Nation/NativeCanadian
3 4 3 4 - - - - - - - -* * * * - - - - - - - -
AK BHL
South Asian
12 10 12 10 - - - - - - - -* * 1% 1% - - - - - - - - K L AEGIK BFHJL
Chinese
2 2 2 2 - - - - - - - -* * * * - - - - - - - -
AK BL
Korean
2 1 2 1 - - - - - - - -* * * * - - - - - - - -
AK
Japanese
- 5 - 5 - - - - - - - -- * - 1% - - - - - - - -
A CBHL
Other Southeast Asian
3 3 3 3 - - - - - - - -* * * * - - - - - - - -
AK BL
Filipino
7 6 7 6 - - - - - - - -* * 1% 1% - - - - - - - -
AEGK BHL
Some other race
_________________________________________________________________________________________________________________Proportions/Means: Columns Tested (5% risk level) - A/B - C/D - E/F - G/H - I/J - K/L - A/C/E/G/I/K - B/D/F/H/J/LOverlap formulae used.
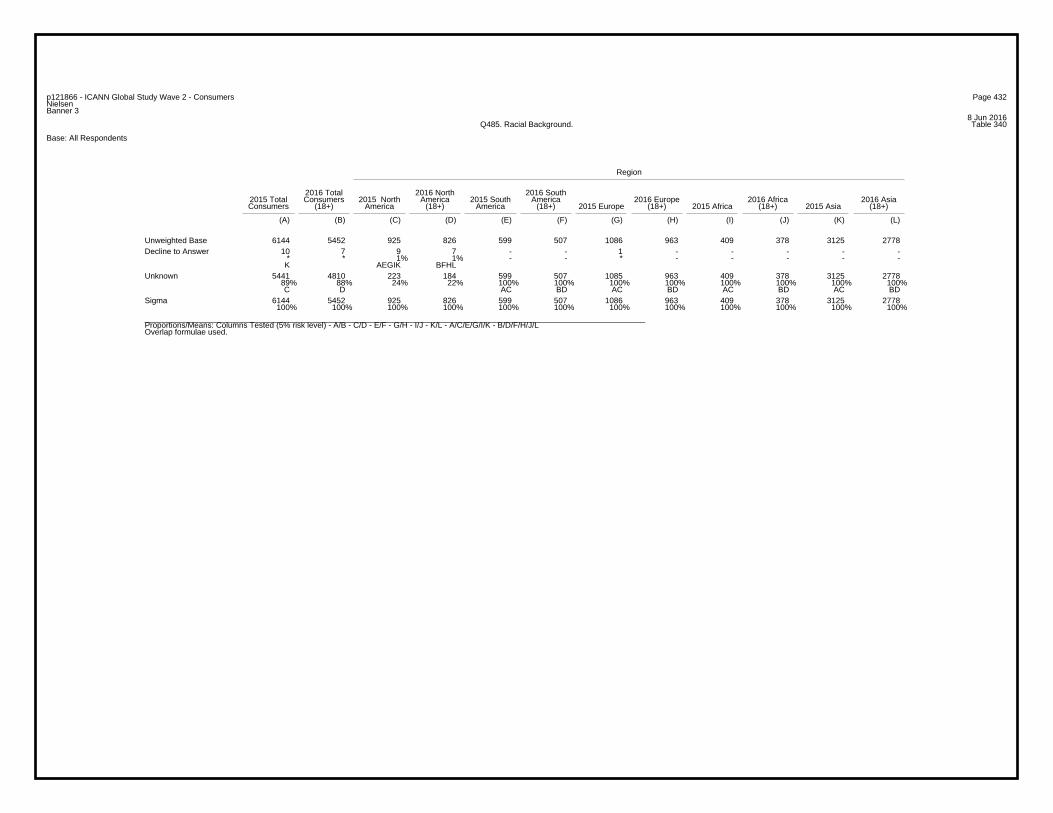
Page 432p121866 - ICANN Global Study Wave 2 - ConsumersNielsenBanner 3
8 Jun 2016Table 340Q485. Racial Background.
Base: All Respondents
Region
2016 Total 2016 North 2016 South2015 Total Consumers 2015 North America 2015 South America 2016 Europe 2016 Africa 2016 AsiaConsumers (18+) America (18+) America (18+) 2015 Europe (18+) 2015 Africa (18+) 2015 Asia (18+)
(A) (B) (C) (D) (E) (F) (G) (H) (I) (J) (K) (L)
6144 5452 925 826 599 507 1086 963 409 378 3125 2778Unweighted Base10 7 9 7 - - 1 - - - - -
* * 1% 1% - - * - - - - - K AEGIK BFHL
Decline to Answer
5441 4810 223 184 599 507 1085 963 409 378 3125 277889% 88% 24% 22% 100% 100% 100% 100% 100% 100% 100% 100%C D AC BD AC BD AC BD AC BD
Unknown
6144 5452 925 826 599 507 1086 963 409 378 3125 2778100% 100% 100% 100% 100% 100% 100% 100% 100% 100% 100% 100%
Sigma
_________________________________________________________________________________________________________________Proportions/Means: Columns Tested (5% risk level) - A/B - C/D - E/F - G/H - I/J - K/L - A/C/E/G/I/K - B/D/F/H/J/LOverlap formulae used.
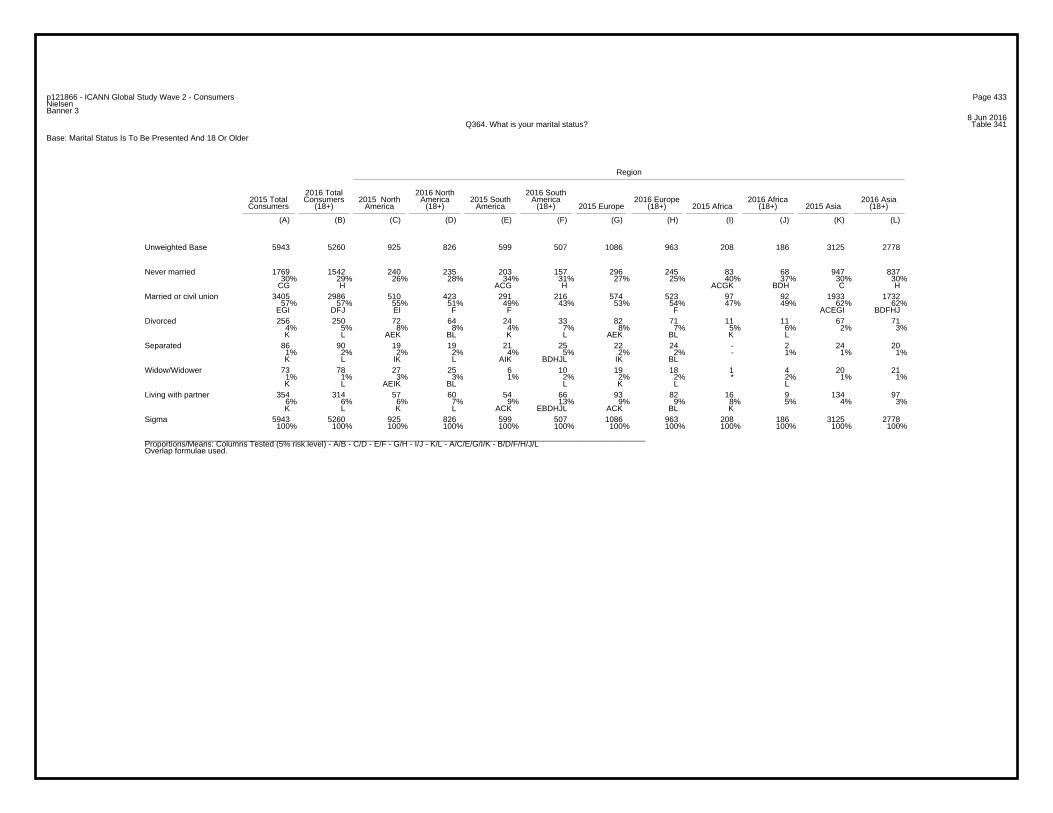
Page 433p121866 - ICANN Global Study Wave 2 - ConsumersNielsenBanner 3
8 Jun 2016Table 341Q364. What is your marital status?
Base: Marital Status Is To Be Presented And 18 Or Older
Region
2016 Total 2016 North 2016 South2015 Total Consumers 2015 North America 2015 South America 2016 Europe 2016 Africa 2016 AsiaConsumers (18+) America (18+) America (18+) 2015 Europe (18+) 2015 Africa (18+) 2015 Asia (18+)
(A) (B) (C) (D) (E) (F) (G) (H) (I) (J) (K) (L)
5943 5260 925 826 599 507 1086 963 208 186 3125 2778Unweighted Base
1769 1542 240 235 203 157 296 245 83 68 947 83730% 29% 26% 28% 34% 31% 27% 25% 40% 37% 30% 30%
CG H ACG H ACGK BDH C H
Never married
3405 2986 510 423 291 216 574 523 97 92 1933 173257% 57% 55% 51% 49% 43% 53% 54% 47% 49% 62% 62%
EGI DFJ EI F F F ACEGI BDFHJ
Married or civil union
256 250 72 64 24 33 82 71 11 11 67 714% 5% 8% 8% 4% 7% 8% 7% 5% 6% 2% 3%K L AEK BL K L AEK BL K L
Divorced
86 90 19 19 21 25 22 24 - 2 24 201% 2% 2% 2% 4% 5% 2% 2% - 1% 1% 1%K L IK L AIK BDHJL IK BL
Separated
73 78 27 25 6 10 19 18 1 4 20 211% 1% 3% 3% 1% 2% 2% 2% * 2% 1% 1%K L AEIK BL L K L L
Widow/Widower
354 314 57 60 54 66 93 82 16 9 134 976% 6% 6% 7% 9% 13% 9% 9% 8% 5% 4% 3%K L K L ACK EBDHJL ACK BL K
Living with partner
5943 5260 925 826 599 507 1086 963 208 186 3125 2778100% 100% 100% 100% 100% 100% 100% 100% 100% 100% 100% 100%
Sigma
_________________________________________________________________________________________________________________Proportions/Means: Columns Tested (5% risk level) - A/B - C/D - E/F - G/H - I/J - K/L - A/C/E/G/I/K - B/D/F/H/J/LOverlap formulae used.
Page 434p121866 - ICANN Global Study Wave 2 - ConsumersNielsenBanner 3
8 Jun 2016Table 342QTEENINTUSE. Overall, how often do you use the Internet?
Base: US Age 15-17
Region
2016 Total 2016 North 2016 South2015 Total Consumers 2015 North America 2015 South America 2016 Europe 2016 Africa 2016 AsiaConsumers (18+) America (18+) America (18+) 2015 Europe (18+) 2015 Africa (18+) 2015 Asia (18+)
(A) (B) (C) (D) (E) (F) (G) (H) (I) (J) (K) (L)
-** -** -** -** -** -** -** -** -** -** -** -**Unweighted Base
- - - - - - - - - - - -- - - - - - - - - - - -
Almost constantly
- - - - - - - - - - - -- - - - - - - - - - - -
Several times a day
- - - - - - - - - - - -- - - - - - - - - - - -
About once a day
- - - - - - - - - - - -- - - - - - - - - - - -
Several times a week
- - - - - - - - - - - -- - - - - - - - - - - -
Once a week
- - - - - - - - - - - -- - - - - - - - - - - -
Less often
- - - - - - - - - - - -- - - - - - - - - - - -
Sigma
_________________________________________________________________________________________________________________Proportions/Means: Columns Tested (5% risk level) - A/B - C/D - E/F - G/H - I/J - K/L - A/C/E/G/I/K - B/D/F/H/J/LOverlap formulae used. ** very small base (under 30) ineligible for sig testing
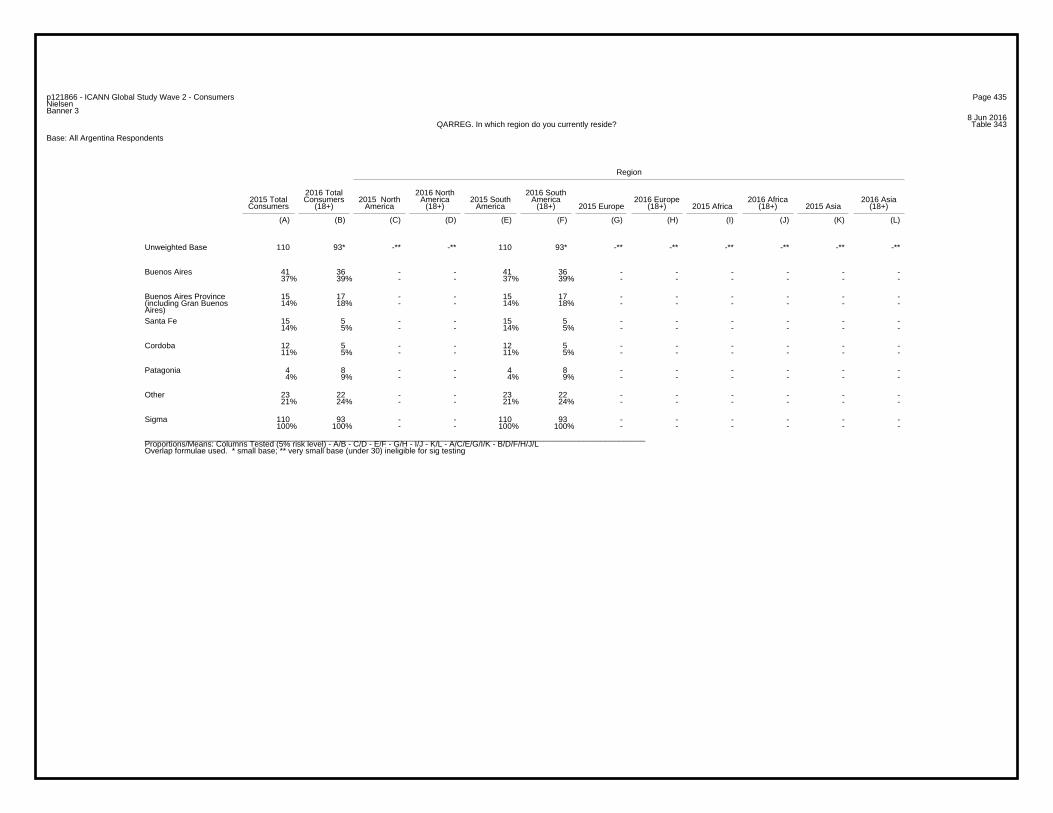
Page 435p121866 - ICANN Global Study Wave 2 - ConsumersNielsenBanner 3
8 Jun 2016Table 343QARREG. In which region do you currently reside?
Base: All Argentina Respondents
Region
2016 Total 2016 North 2016 South2015 Total Consumers 2015 North America 2015 South America 2016 Europe 2016 Africa 2016 AsiaConsumers (18+) America (18+) America (18+) 2015 Europe (18+) 2015 Africa (18+) 2015 Asia (18+)
(A) (B) (C) (D) (E) (F) (G) (H) (I) (J) (K) (L)
110 93* -** -** 110 93* -** -** -** -** -** -**Unweighted Base
41 36 - - 41 36 - - - - - -37% 39% - - 37% 39% - - - - - -
Buenos Aires
15 17 - - 15 17 - - - - - -14% 18% - - 14% 18% - - - - - -
Buenos Aires Province(including Gran BuenosAires)
15 5 - - 15 5 - - - - - -14% 5% - - 14% 5% - - - - - -
Santa Fe
12 5 - - 12 5 - - - - - -11% 5% - - 11% 5% - - - - - -
Cordoba
4 8 - - 4 8 - - - - - -4% 9% - - 4% 9% - - - - - -
Patagonia
23 22 - - 23 22 - - - - - -21% 24% - - 21% 24% - - - - - -
Other
110 93 - - 110 93 - - - - - -100% 100% - - 100% 100% - - - - - -
Sigma
_________________________________________________________________________________________________________________Proportions/Means: Columns Tested (5% risk level) - A/B - C/D - E/F - G/H - I/J - K/L - A/C/E/G/I/K - B/D/F/H/J/LOverlap formulae used. * small base; ** very small base (under 30) ineligible for sig testing
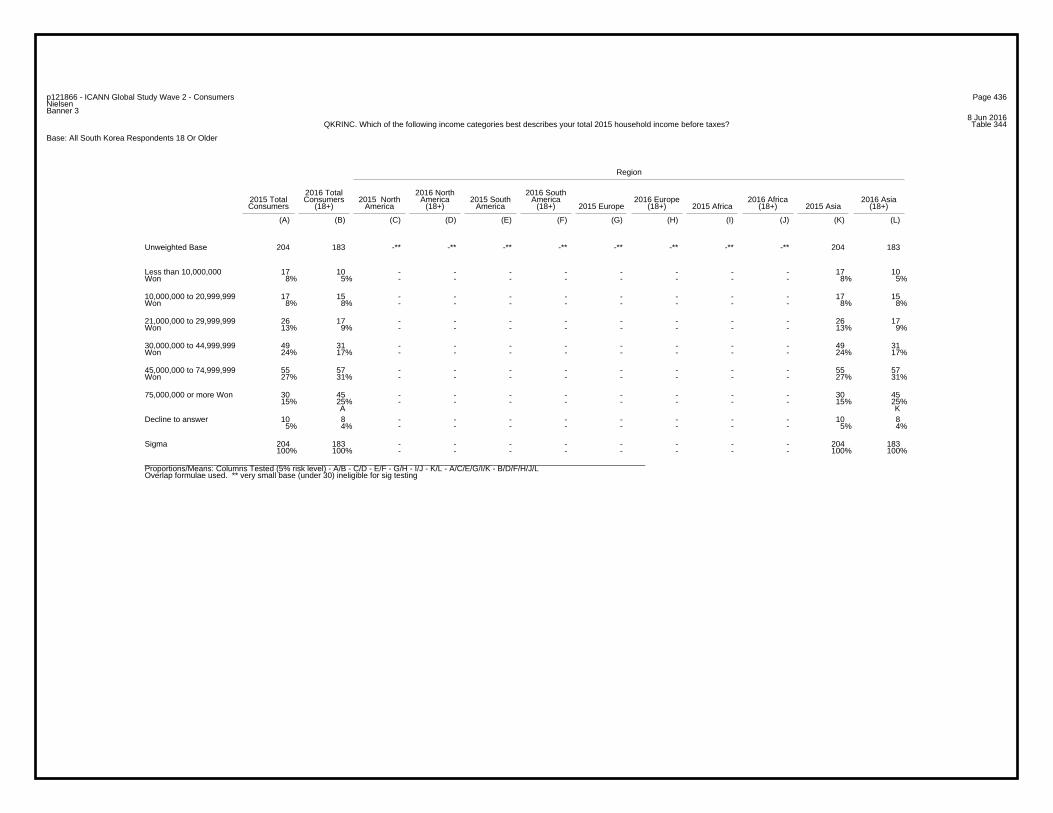
Page 436p121866 - ICANN Global Study Wave 2 - ConsumersNielsenBanner 3
8 Jun 2016Table 344QKRINC. Which of the following income categories best describes your total 2015 household income before taxes?
Base: All South Korea Respondents 18 Or Older
Region
2016 Total 2016 North 2016 South2015 Total Consumers 2015 North America 2015 South America 2016 Europe 2016 Africa 2016 AsiaConsumers (18+) America (18+) America (18+) 2015 Europe (18+) 2015 Africa (18+) 2015 Asia (18+)
(A) (B) (C) (D) (E) (F) (G) (H) (I) (J) (K) (L)
204 183 -** -** -** -** -** -** -** -** 204 183Unweighted Base
17 10 - - - - - - - - 17 108% 5% - - - - - - - - 8% 5%
Less than 10,000,000Won
17 15 - - - - - - - - 17 158% 8% - - - - - - - - 8% 8%
10,000,000 to 20,999,999Won
26 17 - - - - - - - - 26 1713% 9% - - - - - - - - 13% 9%
21,000,000 to 29,999,999Won
49 31 - - - - - - - - 49 3124% 17% - - - - - - - - 24% 17%
30,000,000 to 44,999,999Won
55 57 - - - - - - - - 55 5727% 31% - - - - - - - - 27% 31%
45,000,000 to 74,999,999Won
30 45 - - - - - - - - 30 4515% 25% - - - - - - - - 15% 25%
A K
75,000,000 or more Won
10 8 - - - - - - - - 10 85% 4% - - - - - - - - 5% 4%
Decline to answer
204 183 - - - - - - - - 204 183100% 100% - - - - - - - - 100% 100%
Sigma
_________________________________________________________________________________________________________________Proportions/Means: Columns Tested (5% risk level) - A/B - C/D - E/F - G/H - I/J - K/L - A/C/E/G/I/K - B/D/F/H/J/LOverlap formulae used. ** very small base (under 30) ineligible for sig testing

Page 437p121866 - ICANN Global Study Wave 2 - ConsumersNielsenBanner 3
8 Jun 2016Table 345QKRBUY. In the past 12 months, did you purchase any products or services over the Internet?
Base: All South Korea Respondents 18 Or Older
Region
2016 Total 2016 North 2016 South2015 Total Consumers 2015 North America 2015 South America 2016 Europe 2016 Africa 2016 AsiaConsumers (18+) America (18+) America (18+) 2015 Europe (18+) 2015 Africa (18+) 2015 Asia (18+)
(A) (B) (C) (D) (E) (F) (G) (H) (I) (J) (K) (L)
204 183 -** -** -** -** -** -** -** -** 204 183Unweighted Base
196 179 - - - - - - - - 196 17996% 98% - - - - - - - - 96% 98%
Yes
8 4 - - - - - - - - 8 44% 2% - - - - - - - - 4% 2%
No
204 183 - - - - - - - - 204 183100% 100% - - - - - - - - 100% 100%
Sigma
_________________________________________________________________________________________________________________Proportions/Means: Columns Tested (5% risk level) - A/B - C/D - E/F - G/H - I/J - K/L - A/C/E/G/I/K - B/D/F/H/J/LOverlap formulae used. ** very small base (under 30) ineligible for sig testing
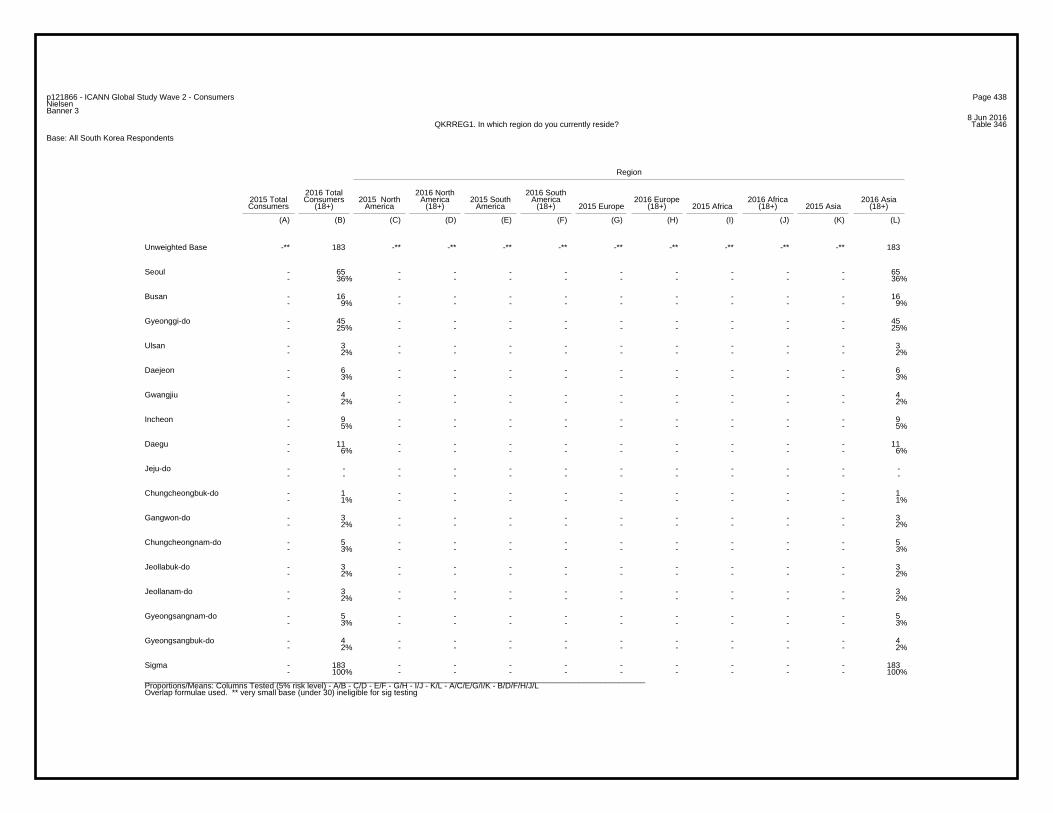
Page 438p121866 - ICANN Global Study Wave 2 - ConsumersNielsenBanner 3
8 Jun 2016Table 346QKRREG1. In which region do you currently reside?
Base: All South Korea Respondents
Region
2016 Total 2016 North 2016 South2015 Total Consumers 2015 North America 2015 South America 2016 Europe 2016 Africa 2016 AsiaConsumers (18+) America (18+) America (18+) 2015 Europe (18+) 2015 Africa (18+) 2015 Asia (18+)
(A) (B) (C) (D) (E) (F) (G) (H) (I) (J) (K) (L)
-** 183 -** -** -** -** -** -** -** -** -** 183Unweighted Base
- 65 - - - - - - - - - 65- 36% - - - - - - - - - 36%
Seoul
- 16 - - - - - - - - - 16- 9% - - - - - - - - - 9%
Busan
- 45 - - - - - - - - - 45- 25% - - - - - - - - - 25%
Gyeonggi-do
- 3 - - - - - - - - - 3- 2% - - - - - - - - - 2%
Ulsan
- 6 - - - - - - - - - 6- 3% - - - - - - - - - 3%
Daejeon
- 4 - - - - - - - - - 4- 2% - - - - - - - - - 2%
Gwangjiu
- 9 - - - - - - - - - 9- 5% - - - - - - - - - 5%
Incheon
- 11 - - - - - - - - - 11- 6% - - - - - - - - - 6%
Daegu
- - - - - - - - - - - -- - - - - - - - - - - -
Jeju-do
- 1 - - - - - - - - - 1- 1% - - - - - - - - - 1%
Chungcheongbuk-do
- 3 - - - - - - - - - 3- 2% - - - - - - - - - 2%
Gangwon-do
- 5 - - - - - - - - - 5- 3% - - - - - - - - - 3%
Chungcheongnam-do
- 3 - - - - - - - - - 3- 2% - - - - - - - - - 2%
Jeollabuk-do
- 3 - - - - - - - - - 3- 2% - - - - - - - - - 2%
Jeollanam-do
- 5 - - - - - - - - - 5- 3% - - - - - - - - - 3%
Gyeongsangnam-do
- 4 - - - - - - - - - 4- 2% - - - - - - - - - 2%
Gyeongsangbuk-do
- 183 - - - - - - - - - 183- 100% - - - - - - - - - 100%
Sigma
_________________________________________________________________________________________________________________Proportions/Means: Columns Tested (5% risk level) - A/B - C/D - E/F - G/H - I/J - K/L - A/C/E/G/I/K - B/D/F/H/J/LOverlap formulae used. ** very small base (under 30) ineligible for sig testing
Page 439p121866 - ICANN Global Study Wave 2 - ConsumersNielsenBanner 3
8 Jun 2016Table 346QKRREG1. In which region do you currently reside?
Base: All South Korea Respondents
Region
2016 Total 2016 North 2016 South2015 Total Consumers 2015 North America 2015 South America 2016 Europe 2016 Africa 2016 AsiaConsumers (18+) America (18+) America (18+) 2015 Europe (18+) 2015 Africa (18+) 2015 Asia (18+)
(A) (B) (C) (D) (E) (F) (G) (H) (I) (J) (K) (L)
-** 183 -** -** -** -** -** -** -** -** -** 183Unweighted Base_________________________________________________________________________________________________________________Proportions/Means: Columns Tested (5% risk level) - A/B - C/D - E/F - G/H - I/J - K/L - A/C/E/G/I/K - B/D/F/H/J/LOverlap formulae used. ** very small base (under 30) ineligible for sig testing
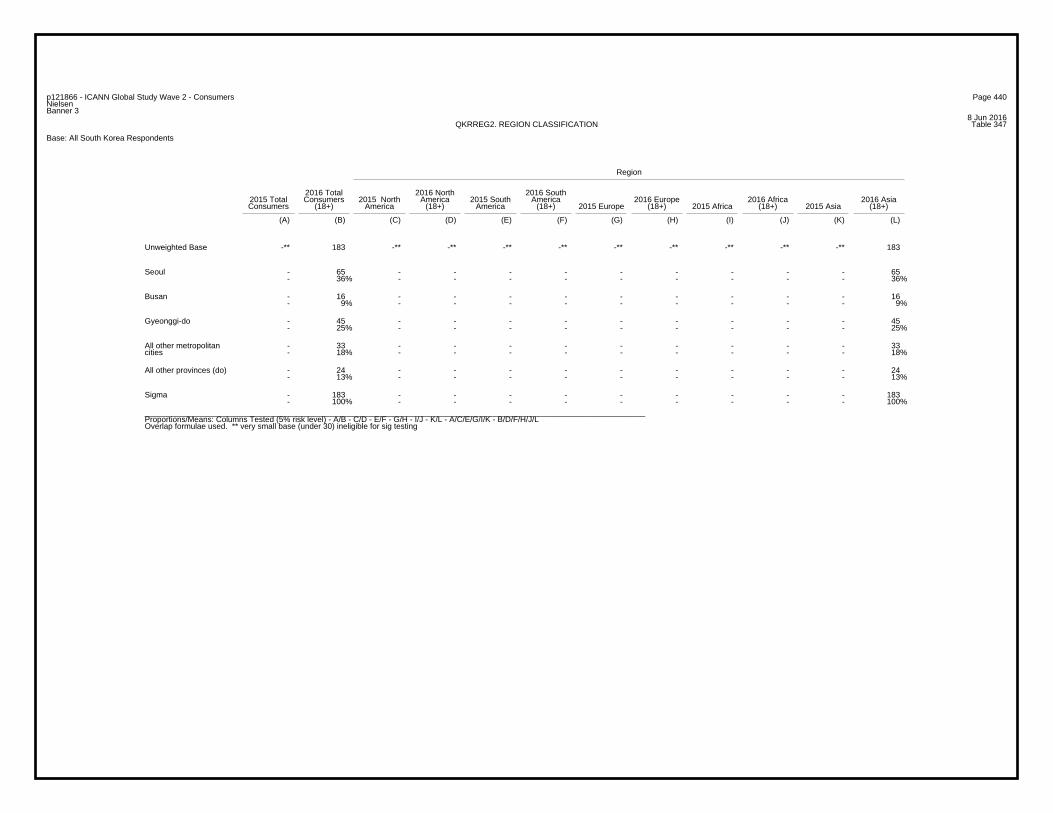
Page 440p121866 - ICANN Global Study Wave 2 - ConsumersNielsenBanner 3
8 Jun 2016Table 347QKRREG2. REGION CLASSIFICATION
Base: All South Korea Respondents
Region
2016 Total 2016 North 2016 South2015 Total Consumers 2015 North America 2015 South America 2016 Europe 2016 Africa 2016 AsiaConsumers (18+) America (18+) America (18+) 2015 Europe (18+) 2015 Africa (18+) 2015 Asia (18+)
(A) (B) (C) (D) (E) (F) (G) (H) (I) (J) (K) (L)
-** 183 -** -** -** -** -** -** -** -** -** 183Unweighted Base
- 65 - - - - - - - - - 65- 36% - - - - - - - - - 36%
Seoul
- 16 - - - - - - - - - 16- 9% - - - - - - - - - 9%
Busan
- 45 - - - - - - - - - 45- 25% - - - - - - - - - 25%
Gyeonggi-do
- 33 - - - - - - - - - 33- 18% - - - - - - - - - 18%
All other metropolitancities
- 24 - - - - - - - - - 24- 13% - - - - - - - - - 13%
All other provinces (do)
- 183 - - - - - - - - - 183- 100% - - - - - - - - - 100%
Sigma
_________________________________________________________________________________________________________________Proportions/Means: Columns Tested (5% risk level) - A/B - C/D - E/F - G/H - I/J - K/L - A/C/E/G/I/K - B/D/F/H/J/LOverlap formulae used. ** very small base (under 30) ineligible for sig testing
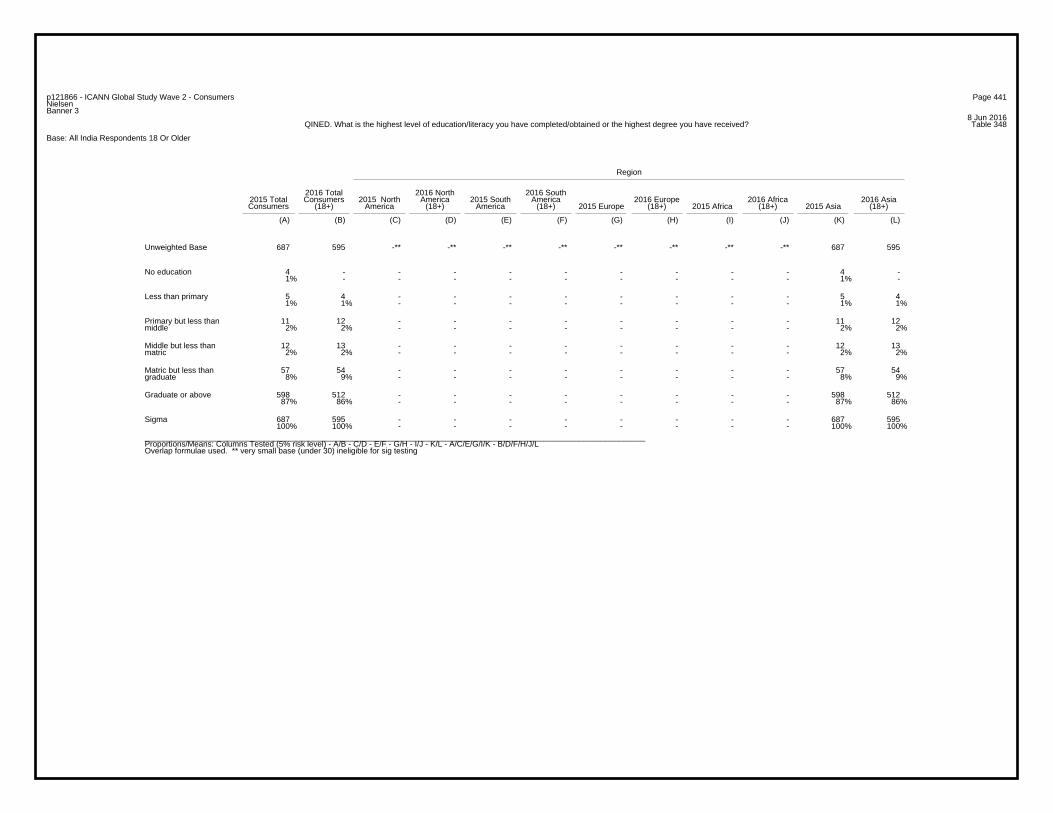
Page 441p121866 - ICANN Global Study Wave 2 - ConsumersNielsenBanner 3
8 Jun 2016Table 348QINED. What is the highest level of education/literacy you have completed/obtained or the highest degree you have received?
Base: All India Respondents 18 Or Older
Region
2016 Total 2016 North 2016 South2015 Total Consumers 2015 North America 2015 South America 2016 Europe 2016 Africa 2016 AsiaConsumers (18+) America (18+) America (18+) 2015 Europe (18+) 2015 Africa (18+) 2015 Asia (18+)
(A) (B) (C) (D) (E) (F) (G) (H) (I) (J) (K) (L)
687 595 -** -** -** -** -** -** -** -** 687 595Unweighted Base
4 - - - - - - - - - 4 -1% - - - - - - - - - 1% -
No education
5 4 - - - - - - - - 5 41% 1% - - - - - - - - 1% 1%
Less than primary
11 12 - - - - - - - - 11 122% 2% - - - - - - - - 2% 2%
Primary but less thanmiddle
12 13 - - - - - - - - 12 132% 2% - - - - - - - - 2% 2%
Middle but less thanmatric
57 54 - - - - - - - - 57 548% 9% - - - - - - - - 8% 9%
Matric but less thangraduate
598 512 - - - - - - - - 598 51287% 86% - - - - - - - - 87% 86%
Graduate or above
687 595 - - - - - - - - 687 595100% 100% - - - - - - - - 100% 100%
Sigma
_________________________________________________________________________________________________________________Proportions/Means: Columns Tested (5% risk level) - A/B - C/D - E/F - G/H - I/J - K/L - A/C/E/G/I/K - B/D/F/H/J/LOverlap formulae used. ** very small base (under 30) ineligible for sig testing

Page 442p121866 - ICANN Global Study Wave 2 - ConsumersNielsenBanner 3
8 Jun 2016Table 349QININC2. Which of the following income categories best describes your total 2015 household income before taxes?
Base: All India Respondents 18 Or Older
Region
2016 Total 2016 North 2016 South2015 Total Consumers 2015 North America 2015 South America 2016 Europe 2016 Africa 2016 AsiaConsumers (18+) America (18+) America (18+) 2015 Europe (18+) 2015 Africa (18+) 2015 Asia (18+)
(A) (B) (C) (D) (E) (F) (G) (H) (I) (J) (K) (L)
687 595 -** -** -** -** -** -** -** -** 687 595Unweighted Base
104 87 - - - - - - - - 104 8715% 15% - - - - - - - - 15% 15%
Less than 120,000 rupees
520 466 - - - - - - - - 520 46676% 78% - - - - - - - - 76% 78%
120,000 rupees or more
63 42 - - - - - - - - 63 429% 7% - - - - - - - - 9% 7%
Decline to answer
687 595 - - - - - - - - 687 595100% 100% - - - - - - - - 100% 100%
Sigma
_________________________________________________________________________________________________________________Proportions/Means: Columns Tested (5% risk level) - A/B - C/D - E/F - G/H - I/J - K/L - A/C/E/G/I/K - B/D/F/H/J/LOverlap formulae used. ** very small base (under 30) ineligible for sig testing
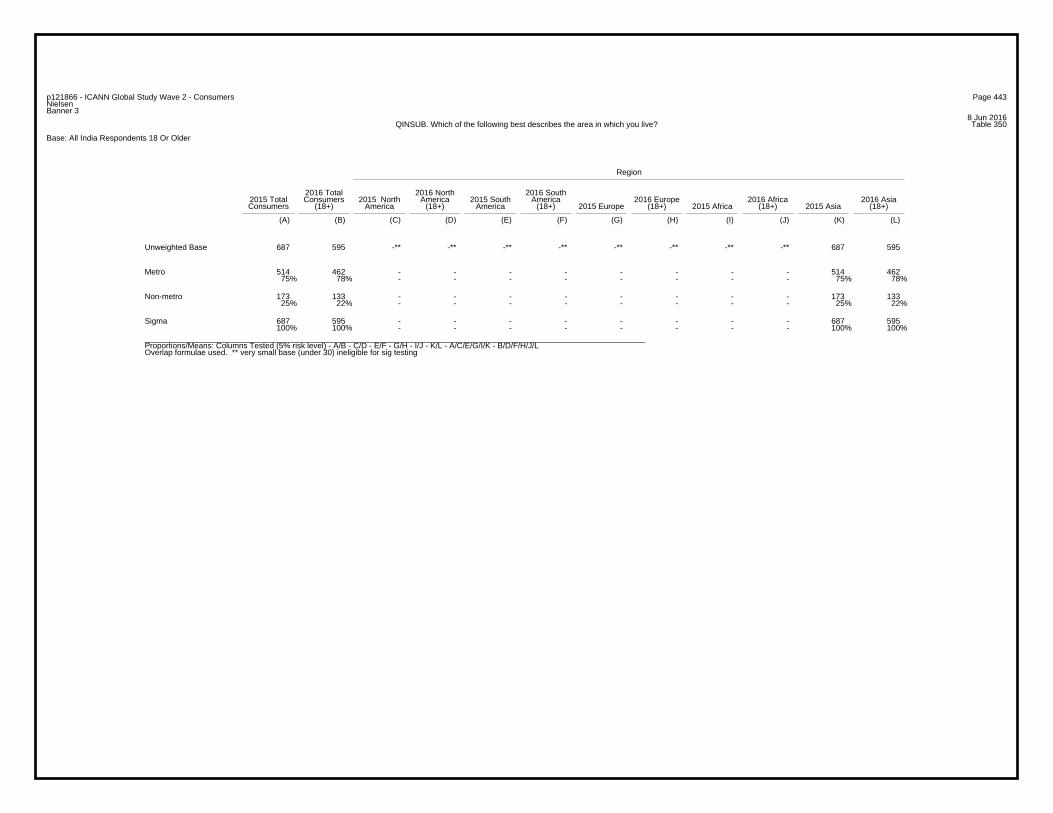
Page 443p121866 - ICANN Global Study Wave 2 - ConsumersNielsenBanner 3
8 Jun 2016Table 350QINSUB. Which of the following best describes the area in which you live?
Base: All India Respondents 18 Or Older
Region
2016 Total 2016 North 2016 South2015 Total Consumers 2015 North America 2015 South America 2016 Europe 2016 Africa 2016 AsiaConsumers (18+) America (18+) America (18+) 2015 Europe (18+) 2015 Africa (18+) 2015 Asia (18+)
(A) (B) (C) (D) (E) (F) (G) (H) (I) (J) (K) (L)
687 595 -** -** -** -** -** -** -** -** 687 595Unweighted Base
514 462 - - - - - - - - 514 46275% 78% - - - - - - - - 75% 78%
Metro
173 133 - - - - - - - - 173 13325% 22% - - - - - - - - 25% 22%
Non-metro
687 595 - - - - - - - - 687 595100% 100% - - - - - - - - 100% 100%
Sigma
_________________________________________________________________________________________________________________Proportions/Means: Columns Tested (5% risk level) - A/B - C/D - E/F - G/H - I/J - K/L - A/C/E/G/I/K - B/D/F/H/J/LOverlap formulae used. ** very small base (under 30) ineligible for sig testing

Page 444p121866 - ICANN Global Study Wave 2 - ConsumersNielsenBanner 3
8 Jun 2016Table 351QINBUY. In the past month, did you purchase any products or services over the Internet?
Base: All India Respondents 18 Or Older
Region
2016 Total 2016 North 2016 South2015 Total Consumers 2015 North America 2015 South America 2016 Europe 2016 Africa 2016 AsiaConsumers (18+) America (18+) America (18+) 2015 Europe (18+) 2015 Africa (18+) 2015 Asia (18+)
(A) (B) (C) (D) (E) (F) (G) (H) (I) (J) (K) (L)
687 595 -** -** -** -** -** -** -** -** 687 595Unweighted Base
621 536 - - - - - - - - 621 53690% 90% - - - - - - - - 90% 90%
Yes
66 59 - - - - - - - - 66 5910% 10% - - - - - - - - 10% 10%
No
687 595 - - - - - - - - 687 595100% 100% - - - - - - - - 100% 100%
Sigma
_________________________________________________________________________________________________________________Proportions/Means: Columns Tested (5% risk level) - A/B - C/D - E/F - G/H - I/J - K/L - A/C/E/G/I/K - B/D/F/H/J/LOverlap formulae used. ** very small base (under 30) ineligible for sig testing
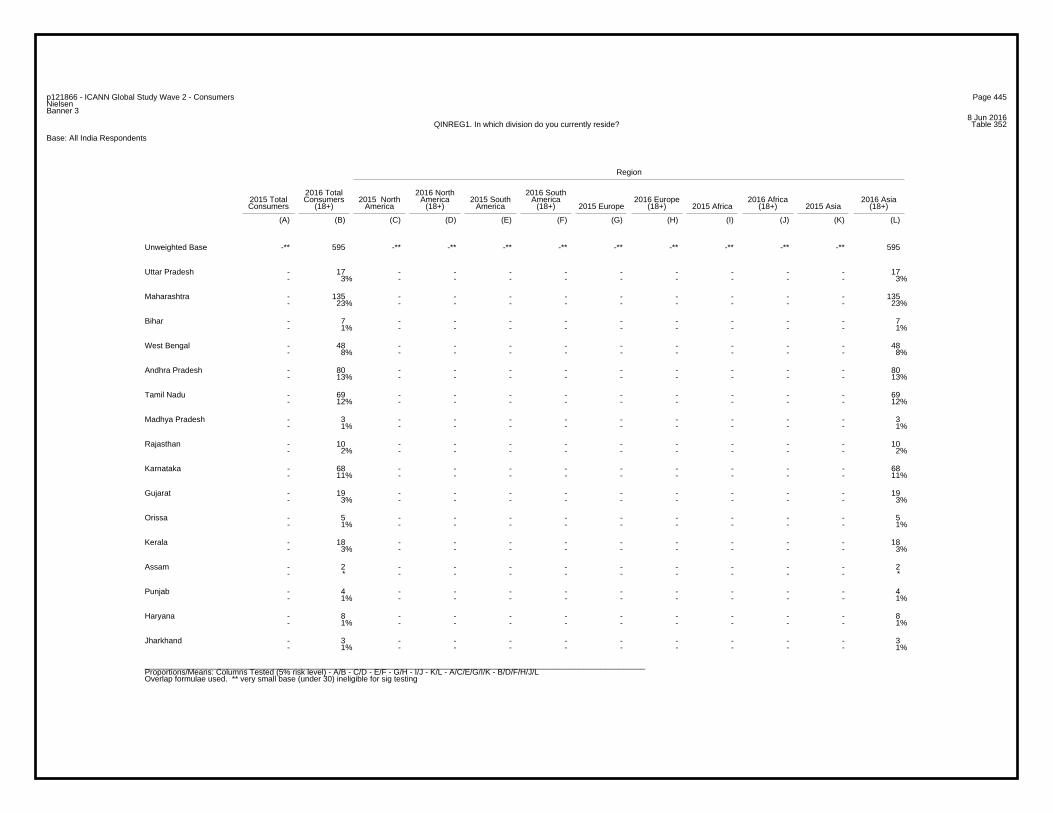
Page 445p121866 - ICANN Global Study Wave 2 - ConsumersNielsenBanner 3
8 Jun 2016Table 352QINREG1. In which division do you currently reside?
Base: All India Respondents
Region
2016 Total 2016 North 2016 South2015 Total Consumers 2015 North America 2015 South America 2016 Europe 2016 Africa 2016 AsiaConsumers (18+) America (18+) America (18+) 2015 Europe (18+) 2015 Africa (18+) 2015 Asia (18+)
(A) (B) (C) (D) (E) (F) (G) (H) (I) (J) (K) (L)
-** 595 -** -** -** -** -** -** -** -** -** 595Unweighted Base
- 17 - - - - - - - - - 17- 3% - - - - - - - - - 3%
Uttar Pradesh
- 135 - - - - - - - - - 135- 23% - - - - - - - - - 23%
Maharashtra
- 7 - - - - - - - - - 7- 1% - - - - - - - - - 1%
Bihar
- 48 - - - - - - - - - 48- 8% - - - - - - - - - 8%
West Bengal
- 80 - - - - - - - - - 80- 13% - - - - - - - - - 13%
Andhra Pradesh
- 69 - - - - - - - - - 69- 12% - - - - - - - - - 12%
Tamil Nadu
- 3 - - - - - - - - - 3- 1% - - - - - - - - - 1%
Madhya Pradesh
- 10 - - - - - - - - - 10- 2% - - - - - - - - - 2%
Rajasthan
- 68 - - - - - - - - - 68- 11% - - - - - - - - - 11%
Karnataka
- 19 - - - - - - - - - 19- 3% - - - - - - - - - 3%
Gujarat
- 5 - - - - - - - - - 5- 1% - - - - - - - - - 1%
Orissa
- 18 - - - - - - - - - 18- 3% - - - - - - - - - 3%
Kerala
- 2 - - - - - - - - - 2- * - - - - - - - - - *
Assam
- 4 - - - - - - - - - 4- 1% - - - - - - - - - 1%
Punjab
- 8 - - - - - - - - - 8- 1% - - - - - - - - - 1%
Haryana
- 3 - - - - - - - - - 3- 1% - - - - - - - - - 1%
Jharkhand
_________________________________________________________________________________________________________________Proportions/Means: Columns Tested (5% risk level) - A/B - C/D - E/F - G/H - I/J - K/L - A/C/E/G/I/K - B/D/F/H/J/LOverlap formulae used. ** very small base (under 30) ineligible for sig testing
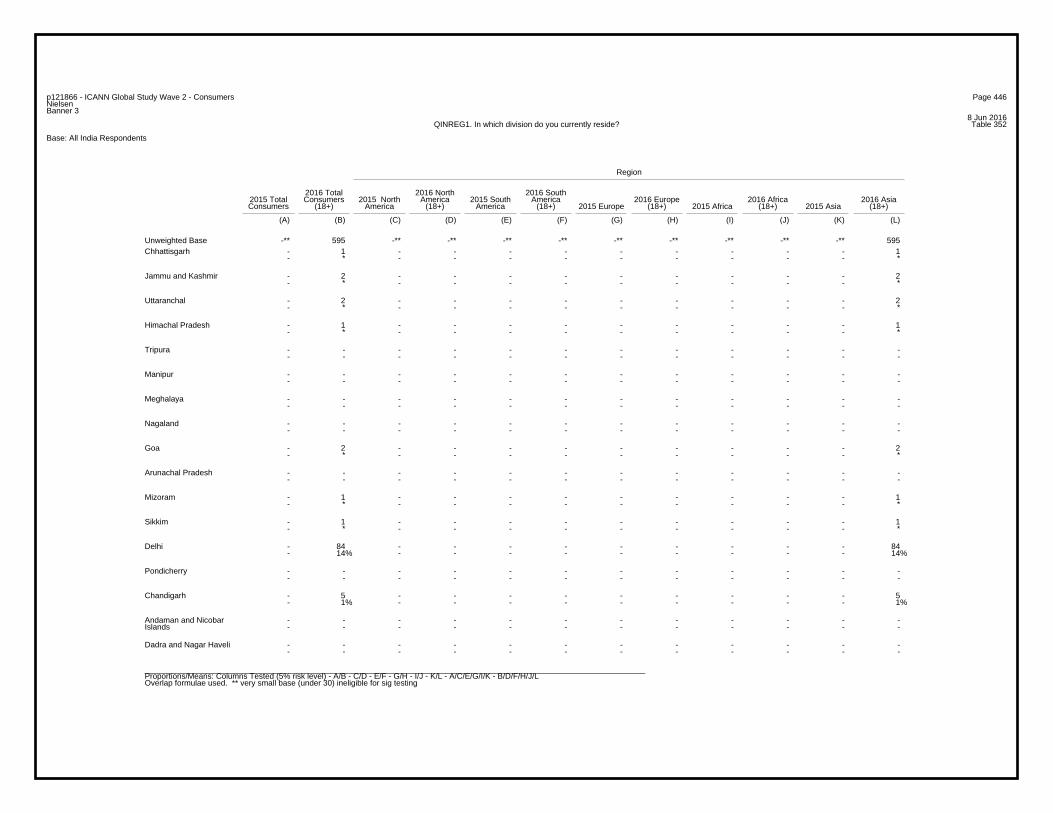
Page 446p121866 - ICANN Global Study Wave 2 - ConsumersNielsenBanner 3
8 Jun 2016Table 352QINREG1. In which division do you currently reside?
Base: All India Respondents
Region
2016 Total 2016 North 2016 South2015 Total Consumers 2015 North America 2015 South America 2016 Europe 2016 Africa 2016 AsiaConsumers (18+) America (18+) America (18+) 2015 Europe (18+) 2015 Africa (18+) 2015 Asia (18+)
(A) (B) (C) (D) (E) (F) (G) (H) (I) (J) (K) (L)
-** 595 -** -** -** -** -** -** -** -** -** 595Unweighted Base- 1 - - - - - - - - - 1- * - - - - - - - - - *
Chhattisgarh
- 2 - - - - - - - - - 2- * - - - - - - - - - *
Jammu and Kashmir
- 2 - - - - - - - - - 2- * - - - - - - - - - *
Uttaranchal
- 1 - - - - - - - - - 1- * - - - - - - - - - *
Himachal Pradesh
- - - - - - - - - - - -- - - - - - - - - - - -
Tripura
- - - - - - - - - - - -- - - - - - - - - - - -
Manipur
- - - - - - - - - - - -- - - - - - - - - - - -
Meghalaya
- - - - - - - - - - - -- - - - - - - - - - - -
Nagaland
- 2 - - - - - - - - - 2- * - - - - - - - - - *
Goa
- - - - - - - - - - - -- - - - - - - - - - - -
Arunachal Pradesh
- 1 - - - - - - - - - 1- * - - - - - - - - - *
Mizoram
- 1 - - - - - - - - - 1- * - - - - - - - - - *
Sikkim
- 84 - - - - - - - - - 84- 14% - - - - - - - - - 14%
Delhi
- - - - - - - - - - - -- - - - - - - - - - - -
Pondicherry
- 5 - - - - - - - - - 5- 1% - - - - - - - - - 1%
Chandigarh
- - - - - - - - - - - -- - - - - - - - - - - -
Andaman and NicobarIslands
- - - - - - - - - - - -- - - - - - - - - - - -
Dadra and Nagar Haveli
_________________________________________________________________________________________________________________Proportions/Means: Columns Tested (5% risk level) - A/B - C/D - E/F - G/H - I/J - K/L - A/C/E/G/I/K - B/D/F/H/J/LOverlap formulae used. ** very small base (under 30) ineligible for sig testing
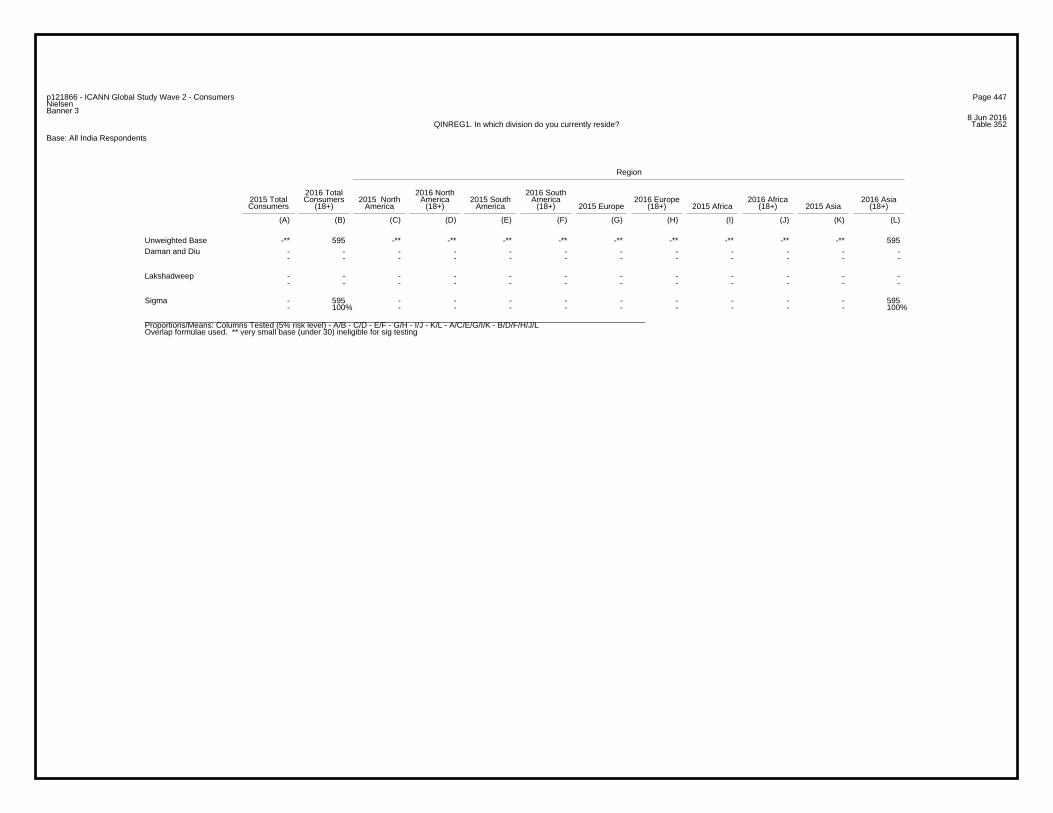
Page 447p121866 - ICANN Global Study Wave 2 - ConsumersNielsenBanner 3
8 Jun 2016Table 352QINREG1. In which division do you currently reside?
Base: All India Respondents
Region
2016 Total 2016 North 2016 South2015 Total Consumers 2015 North America 2015 South America 2016 Europe 2016 Africa 2016 AsiaConsumers (18+) America (18+) America (18+) 2015 Europe (18+) 2015 Africa (18+) 2015 Asia (18+)
(A) (B) (C) (D) (E) (F) (G) (H) (I) (J) (K) (L)
-** 595 -** -** -** -** -** -** -** -** -** 595Unweighted Base- - - - - - - - - - - -- - - - - - - - - - - -
Daman and Diu
- - - - - - - - - - - -- - - - - - - - - - - -
Lakshadweep
- 595 - - - - - - - - - 595- 100% - - - - - - - - - 100%
Sigma
_________________________________________________________________________________________________________________Proportions/Means: Columns Tested (5% risk level) - A/B - C/D - E/F - G/H - I/J - K/L - A/C/E/G/I/K - B/D/F/H/J/LOverlap formulae used. ** very small base (under 30) ineligible for sig testing
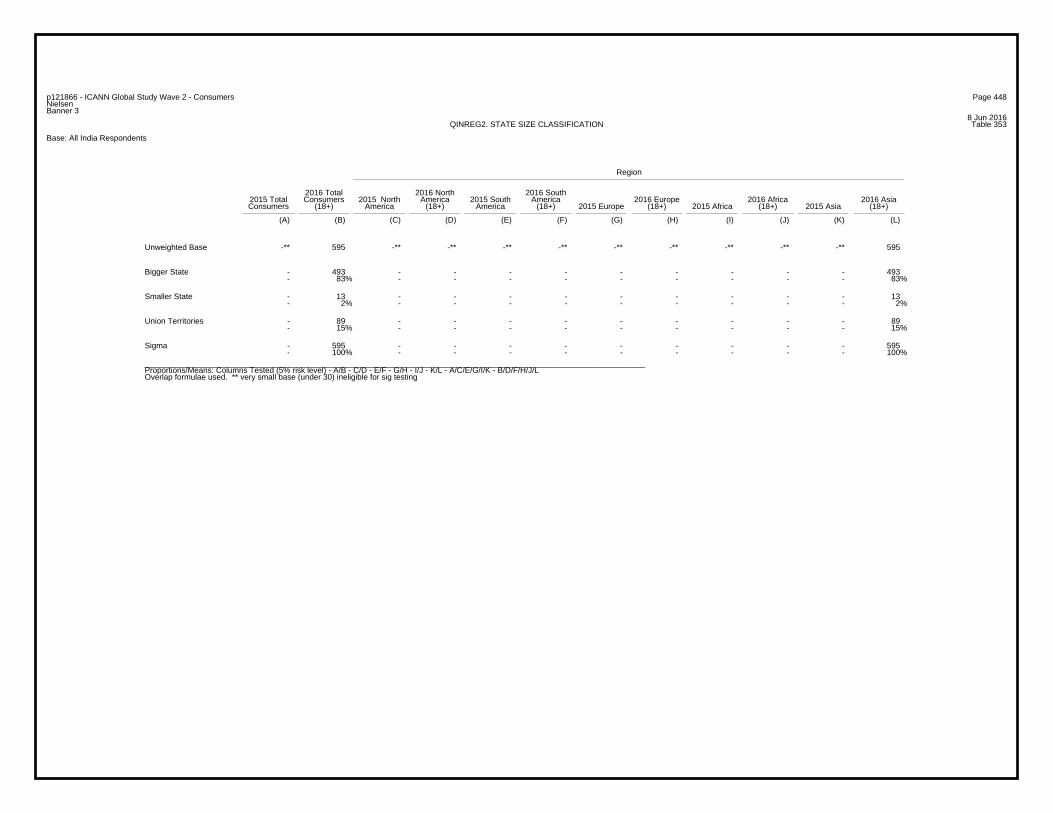
Page 448p121866 - ICANN Global Study Wave 2 - ConsumersNielsenBanner 3
8 Jun 2016Table 353QINREG2. STATE SIZE CLASSIFICATION
Base: All India Respondents
Region
2016 Total 2016 North 2016 South2015 Total Consumers 2015 North America 2015 South America 2016 Europe 2016 Africa 2016 AsiaConsumers (18+) America (18+) America (18+) 2015 Europe (18+) 2015 Africa (18+) 2015 Asia (18+)
(A) (B) (C) (D) (E) (F) (G) (H) (I) (J) (K) (L)
-** 595 -** -** -** -** -** -** -** -** -** 595Unweighted Base
- 493 - - - - - - - - - 493- 83% - - - - - - - - - 83%
Bigger State
- 13 - - - - - - - - - 13- 2% - - - - - - - - - 2%
Smaller State
- 89 - - - - - - - - - 89- 15% - - - - - - - - - 15%
Union Territories
- 595 - - - - - - - - - 595- 100% - - - - - - - - - 100%
Sigma
_________________________________________________________________________________________________________________Proportions/Means: Columns Tested (5% risk level) - A/B - C/D - E/F - G/H - I/J - K/L - A/C/E/G/I/K - B/D/F/H/J/LOverlap formulae used. ** very small base (under 30) ineligible for sig testing
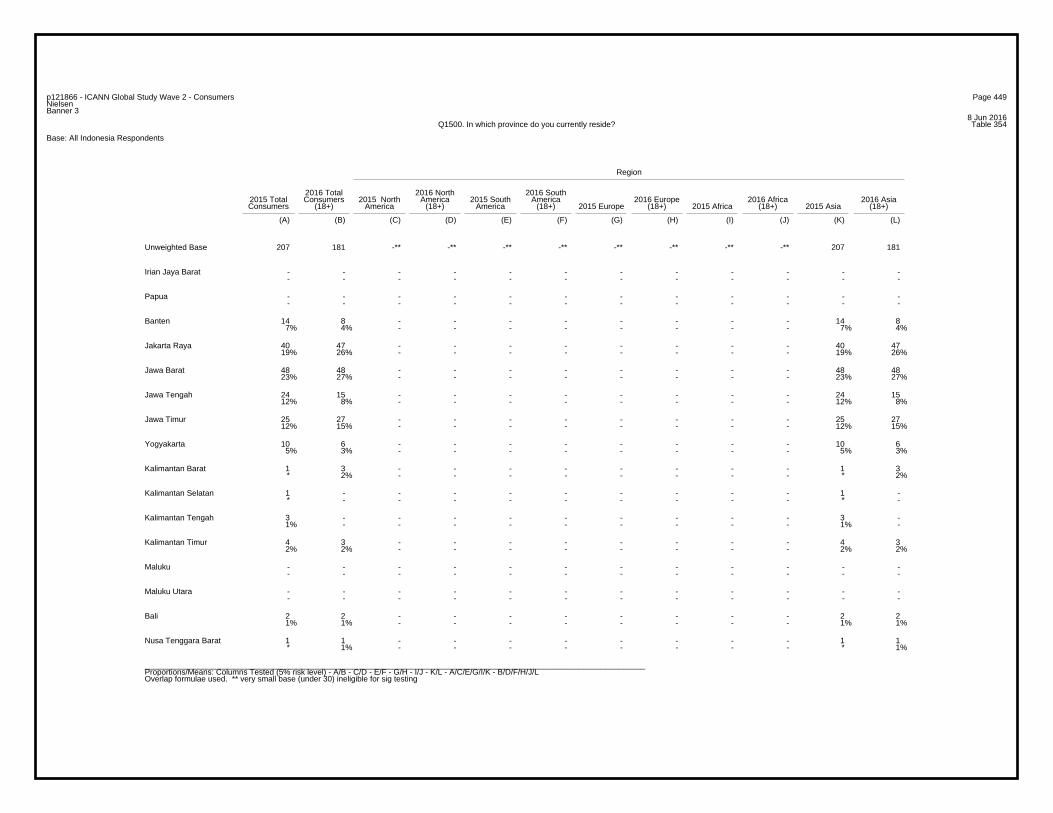
Page 449p121866 - ICANN Global Study Wave 2 - ConsumersNielsenBanner 3
8 Jun 2016Table 354Q1500. In which province do you currently reside?
Base: All Indonesia Respondents
Region
2016 Total 2016 North 2016 South2015 Total Consumers 2015 North America 2015 South America 2016 Europe 2016 Africa 2016 AsiaConsumers (18+) America (18+) America (18+) 2015 Europe (18+) 2015 Africa (18+) 2015 Asia (18+)
(A) (B) (C) (D) (E) (F) (G) (H) (I) (J) (K) (L)
207 181 -** -** -** -** -** -** -** -** 207 181Unweighted Base
- - - - - - - - - - - -- - - - - - - - - - - -
Irian Jaya Barat
- - - - - - - - - - - -- - - - - - - - - - - -
Papua
14 8 - - - - - - - - 14 87% 4% - - - - - - - - 7% 4%
Banten
40 47 - - - - - - - - 40 4719% 26% - - - - - - - - 19% 26%
Jakarta Raya
48 48 - - - - - - - - 48 4823% 27% - - - - - - - - 23% 27%
Jawa Barat
24 15 - - - - - - - - 24 1512% 8% - - - - - - - - 12% 8%
Jawa Tengah
25 27 - - - - - - - - 25 2712% 15% - - - - - - - - 12% 15%
Jawa Timur
10 6 - - - - - - - - 10 65% 3% - - - - - - - - 5% 3%
Yogyakarta
1 3 - - - - - - - - 1 3* 2% - - - - - - - - * 2%
Kalimantan Barat
1 - - - - - - - - - 1 -* - - - - - - - - - * -
Kalimantan Selatan
3 - - - - - - - - - 3 -1% - - - - - - - - - 1% -
Kalimantan Tengah
4 3 - - - - - - - - 4 32% 2% - - - - - - - - 2% 2%
Kalimantan Timur
- - - - - - - - - - - -- - - - - - - - - - - -
Maluku
- - - - - - - - - - - -- - - - - - - - - - - -
Maluku Utara
2 2 - - - - - - - - 2 21% 1% - - - - - - - - 1% 1%
Bali
1 1 - - - - - - - - 1 1* 1% - - - - - - - - * 1%
Nusa Tenggara Barat
_________________________________________________________________________________________________________________Proportions/Means: Columns Tested (5% risk level) - A/B - C/D - E/F - G/H - I/J - K/L - A/C/E/G/I/K - B/D/F/H/J/LOverlap formulae used. ** very small base (under 30) ineligible for sig testing
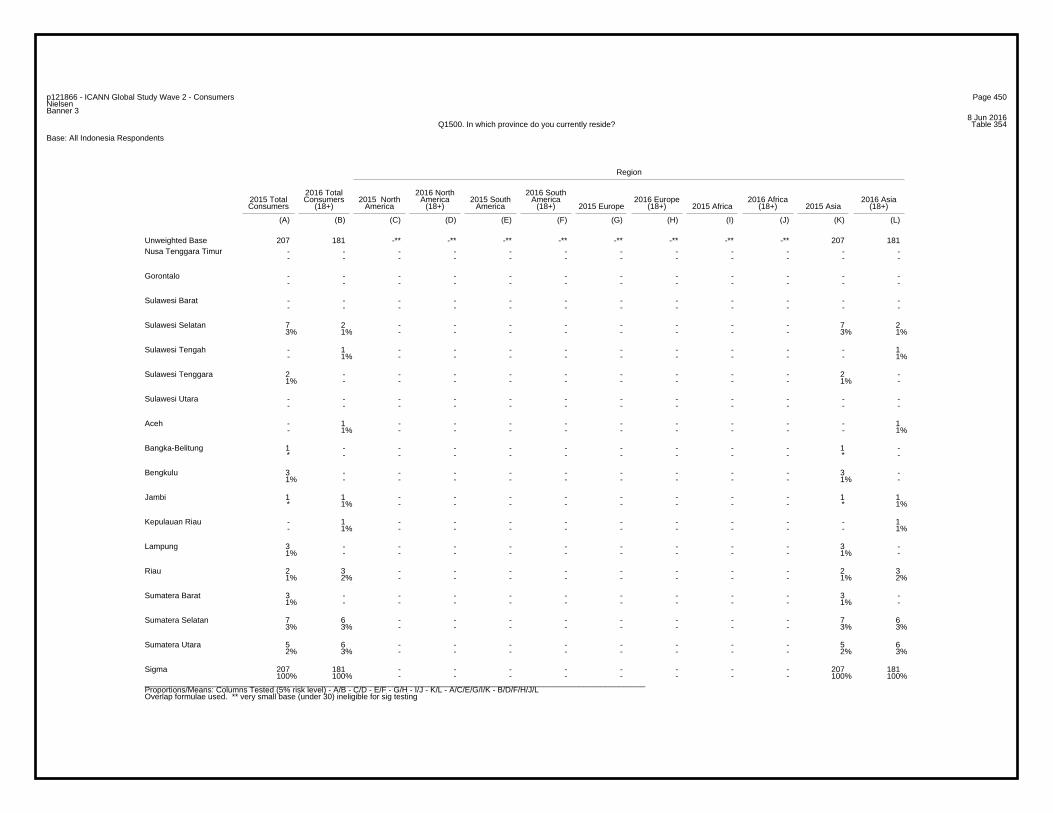
Page 450p121866 - ICANN Global Study Wave 2 - ConsumersNielsenBanner 3
8 Jun 2016Table 354Q1500. In which province do you currently reside?
Base: All Indonesia Respondents
Region
2016 Total 2016 North 2016 South2015 Total Consumers 2015 North America 2015 South America 2016 Europe 2016 Africa 2016 AsiaConsumers (18+) America (18+) America (18+) 2015 Europe (18+) 2015 Africa (18+) 2015 Asia (18+)
(A) (B) (C) (D) (E) (F) (G) (H) (I) (J) (K) (L)
207 181 -** -** -** -** -** -** -** -** 207 181Unweighted Base- - - - - - - - - - - -- - - - - - - - - - - -
Nusa Tenggara Timur
- - - - - - - - - - - -- - - - - - - - - - - -
Gorontalo
- - - - - - - - - - - -- - - - - - - - - - - -
Sulawesi Barat
7 2 - - - - - - - - 7 23% 1% - - - - - - - - 3% 1%
Sulawesi Selatan
- 1 - - - - - - - - - 1- 1% - - - - - - - - - 1%
Sulawesi Tengah
2 - - - - - - - - - 2 -1% - - - - - - - - - 1% -
Sulawesi Tenggara
- - - - - - - - - - - -- - - - - - - - - - - -
Sulawesi Utara
- 1 - - - - - - - - - 1- 1% - - - - - - - - - 1%
Aceh
1 - - - - - - - - - 1 -* - - - - - - - - - * -
Bangka-Belitung
3 - - - - - - - - - 3 -1% - - - - - - - - - 1% -
Bengkulu
1 1 - - - - - - - - 1 1* 1% - - - - - - - - * 1%
Jambi
- 1 - - - - - - - - - 1- 1% - - - - - - - - - 1%
Kepulauan Riau
3 - - - - - - - - - 3 -1% - - - - - - - - - 1% -
Lampung
2 3 - - - - - - - - 2 31% 2% - - - - - - - - 1% 2%
Riau
3 - - - - - - - - - 3 -1% - - - - - - - - - 1% -
Sumatera Barat
7 6 - - - - - - - - 7 63% 3% - - - - - - - - 3% 3%
Sumatera Selatan
5 6 - - - - - - - - 5 62% 3% - - - - - - - - 2% 3%
Sumatera Utara
207 181 - - - - - - - - 207 181100% 100% - - - - - - - - 100% 100%
Sigma
_________________________________________________________________________________________________________________Proportions/Means: Columns Tested (5% risk level) - A/B - C/D - E/F - G/H - I/J - K/L - A/C/E/G/I/K - B/D/F/H/J/LOverlap formulae used. ** very small base (under 30) ineligible for sig testing
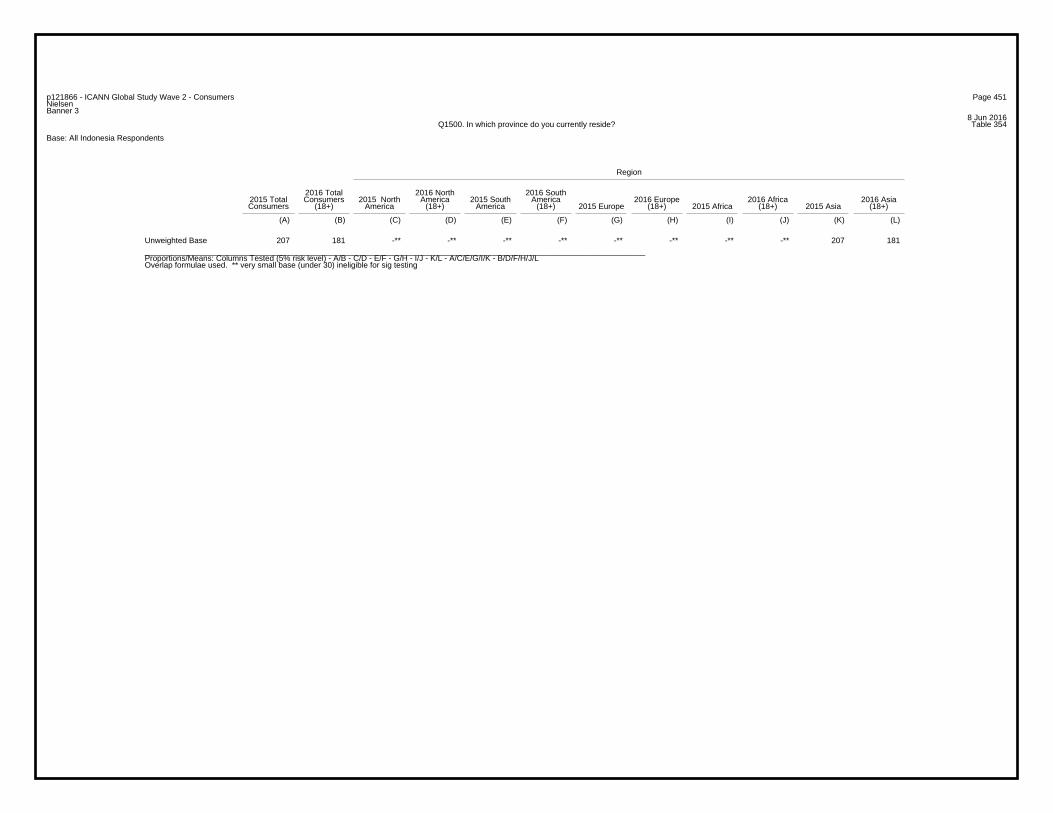
Page 451p121866 - ICANN Global Study Wave 2 - ConsumersNielsenBanner 3
8 Jun 2016Table 354Q1500. In which province do you currently reside?
Base: All Indonesia Respondents
Region
2016 Total 2016 North 2016 South2015 Total Consumers 2015 North America 2015 South America 2016 Europe 2016 Africa 2016 AsiaConsumers (18+) America (18+) America (18+) 2015 Europe (18+) 2015 Africa (18+) 2015 Asia (18+)
(A) (B) (C) (D) (E) (F) (G) (H) (I) (J) (K) (L)
207 181 -** -** -** -** -** -** -** -** 207 181Unweighted Base_________________________________________________________________________________________________________________Proportions/Means: Columns Tested (5% risk level) - A/B - C/D - E/F - G/H - I/J - K/L - A/C/E/G/I/K - B/D/F/H/J/LOverlap formulae used. ** very small base (under 30) ineligible for sig testing
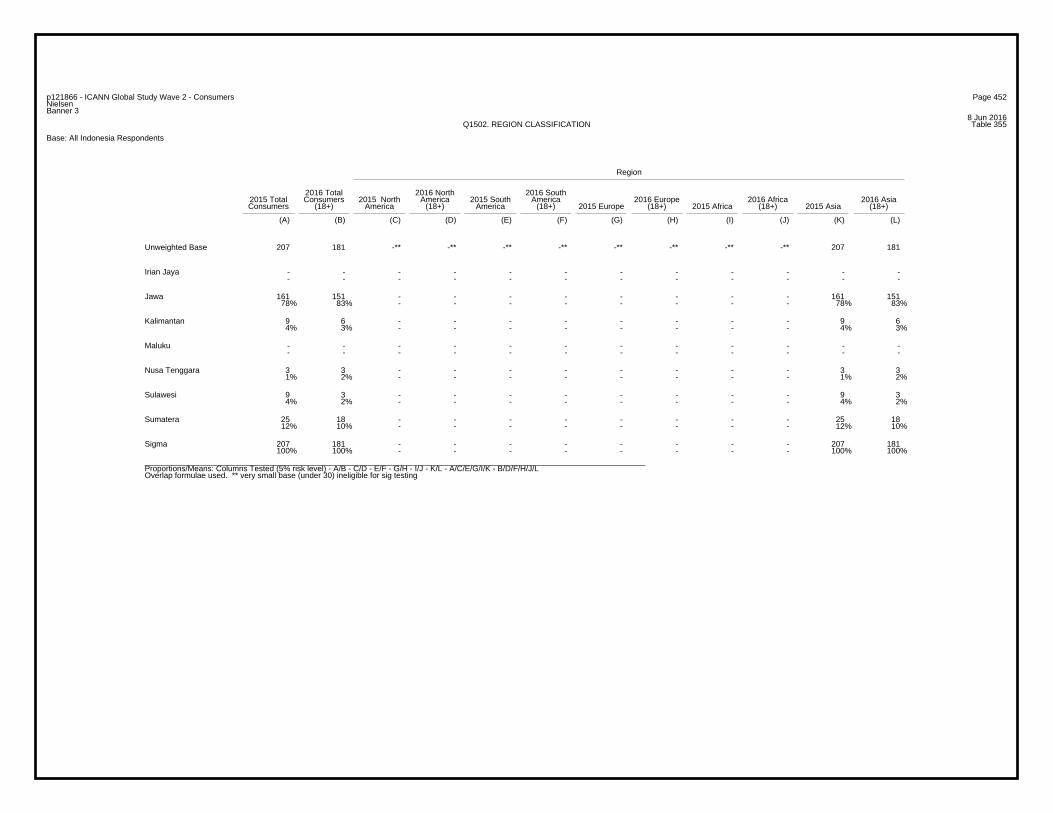
Page 452p121866 - ICANN Global Study Wave 2 - ConsumersNielsenBanner 3
8 Jun 2016Table 355Q1502. REGION CLASSIFICATION
Base: All Indonesia Respondents
Region
2016 Total 2016 North 2016 South2015 Total Consumers 2015 North America 2015 South America 2016 Europe 2016 Africa 2016 AsiaConsumers (18+) America (18+) America (18+) 2015 Europe (18+) 2015 Africa (18+) 2015 Asia (18+)
(A) (B) (C) (D) (E) (F) (G) (H) (I) (J) (K) (L)
207 181 -** -** -** -** -** -** -** -** 207 181Unweighted Base
- - - - - - - - - - - -- - - - - - - - - - - -
Irian Jaya
161 151 - - - - - - - - 161 15178% 83% - - - - - - - - 78% 83%
Jawa
9 6 - - - - - - - - 9 64% 3% - - - - - - - - 4% 3%
Kalimantan
- - - - - - - - - - - -- - - - - - - - - - - -
Maluku
3 3 - - - - - - - - 3 31% 2% - - - - - - - - 1% 2%
Nusa Tenggara
9 3 - - - - - - - - 9 34% 2% - - - - - - - - 4% 2%
Sulawesi
25 18 - - - - - - - - 25 1812% 10% - - - - - - - - 12% 10%
Sumatera
207 181 - - - - - - - - 207 181100% 100% - - - - - - - - 100% 100%
Sigma
_________________________________________________________________________________________________________________Proportions/Means: Columns Tested (5% risk level) - A/B - C/D - E/F - G/H - I/J - K/L - A/C/E/G/I/K - B/D/F/H/J/LOverlap formulae used. ** very small base (under 30) ineligible for sig testing
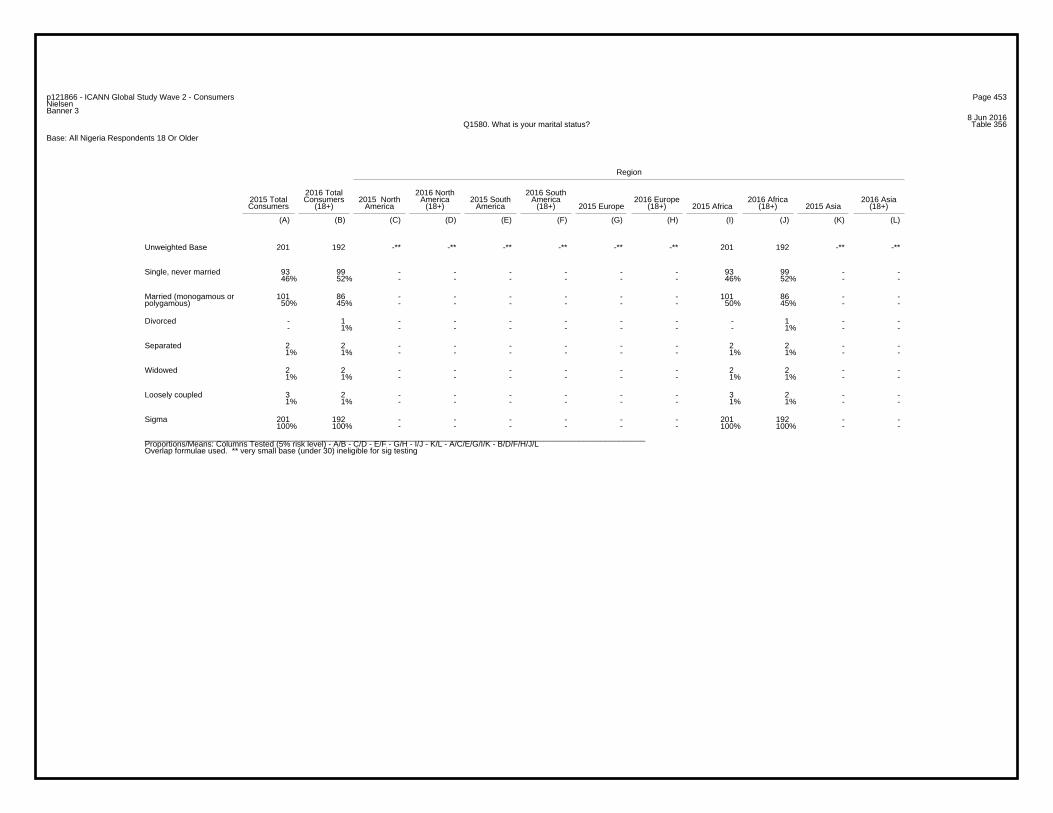
Page 453p121866 - ICANN Global Study Wave 2 - ConsumersNielsenBanner 3
8 Jun 2016Table 356Q1580. What is your marital status?
Base: All Nigeria Respondents 18 Or Older
Region
2016 Total 2016 North 2016 South2015 Total Consumers 2015 North America 2015 South America 2016 Europe 2016 Africa 2016 AsiaConsumers (18+) America (18+) America (18+) 2015 Europe (18+) 2015 Africa (18+) 2015 Asia (18+)
(A) (B) (C) (D) (E) (F) (G) (H) (I) (J) (K) (L)
201 192 -** -** -** -** -** -** 201 192 -** -**Unweighted Base
93 99 - - - - - - 93 99 - -46% 52% - - - - - - 46% 52% - -
Single, never married
101 86 - - - - - - 101 86 - -50% 45% - - - - - - 50% 45% - -
Married (monogamous orpolygamous)
- 1 - - - - - - - 1 - -- 1% - - - - - - - 1% - -
Divorced
2 2 - - - - - - 2 2 - -1% 1% - - - - - - 1% 1% - -
Separated
2 2 - - - - - - 2 2 - -1% 1% - - - - - - 1% 1% - -
Widowed
3 2 - - - - - - 3 2 - -1% 1% - - - - - - 1% 1% - -
Loosely coupled
201 192 - - - - - - 201 192 - -100% 100% - - - - - - 100% 100% - -
Sigma
_________________________________________________________________________________________________________________Proportions/Means: Columns Tested (5% risk level) - A/B - C/D - E/F - G/H - I/J - K/L - A/C/E/G/I/K - B/D/F/H/J/LOverlap formulae used. ** very small base (under 30) ineligible for sig testing
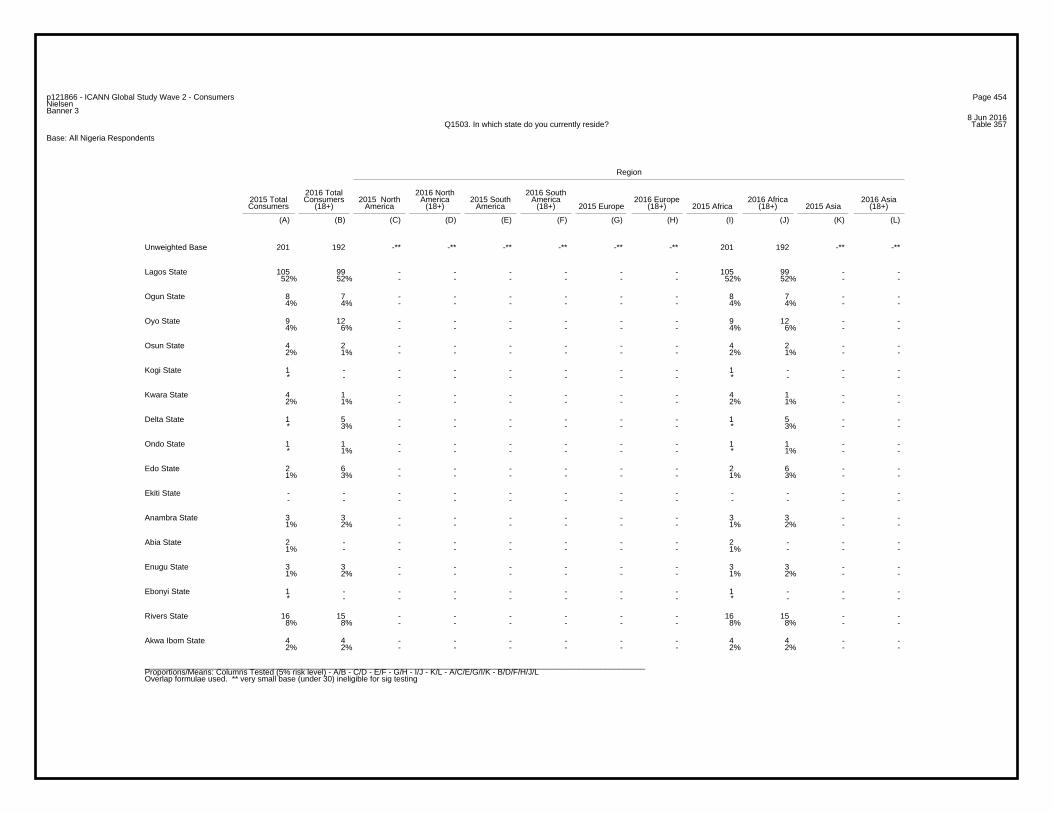
Page 454p121866 - ICANN Global Study Wave 2 - ConsumersNielsenBanner 3
8 Jun 2016Table 357Q1503. In which state do you currently reside?
Base: All Nigeria Respondents
Region
2016 Total 2016 North 2016 South2015 Total Consumers 2015 North America 2015 South America 2016 Europe 2016 Africa 2016 AsiaConsumers (18+) America (18+) America (18+) 2015 Europe (18+) 2015 Africa (18+) 2015 Asia (18+)
(A) (B) (C) (D) (E) (F) (G) (H) (I) (J) (K) (L)
201 192 -** -** -** -** -** -** 201 192 -** -**Unweighted Base
105 99 - - - - - - 105 99 - -52% 52% - - - - - - 52% 52% - -
Lagos State
8 7 - - - - - - 8 7 - -4% 4% - - - - - - 4% 4% - -
Ogun State
9 12 - - - - - - 9 12 - -4% 6% - - - - - - 4% 6% - -
Oyo State
4 2 - - - - - - 4 2 - -2% 1% - - - - - - 2% 1% - -
Osun State
1 - - - - - - - 1 - - -* - - - - - - - * - - -
Kogi State
4 1 - - - - - - 4 1 - -2% 1% - - - - - - 2% 1% - -
Kwara State
1 5 - - - - - - 1 5 - -* 3% - - - - - - * 3% - -
Delta State
1 1 - - - - - - 1 1 - -* 1% - - - - - - * 1% - -
Ondo State
2 6 - - - - - - 2 6 - -1% 3% - - - - - - 1% 3% - -
Edo State
- - - - - - - - - - - -- - - - - - - - - - - -
Ekiti State
3 3 - - - - - - 3 3 - -1% 2% - - - - - - 1% 2% - -
Anambra State
2 - - - - - - - 2 - - -1% - - - - - - - 1% - - -
Abia State
3 3 - - - - - - 3 3 - -1% 2% - - - - - - 1% 2% - -
Enugu State
1 - - - - - - - 1 - - -* - - - - - - - * - - -
Ebonyi State
16 15 - - - - - - 16 15 - -8% 8% - - - - - - 8% 8% - -
Rivers State
4 4 - - - - - - 4 4 - -2% 2% - - - - - - 2% 2% - -
Akwa Ibom State
_________________________________________________________________________________________________________________Proportions/Means: Columns Tested (5% risk level) - A/B - C/D - E/F - G/H - I/J - K/L - A/C/E/G/I/K - B/D/F/H/J/LOverlap formulae used. ** very small base (under 30) ineligible for sig testing
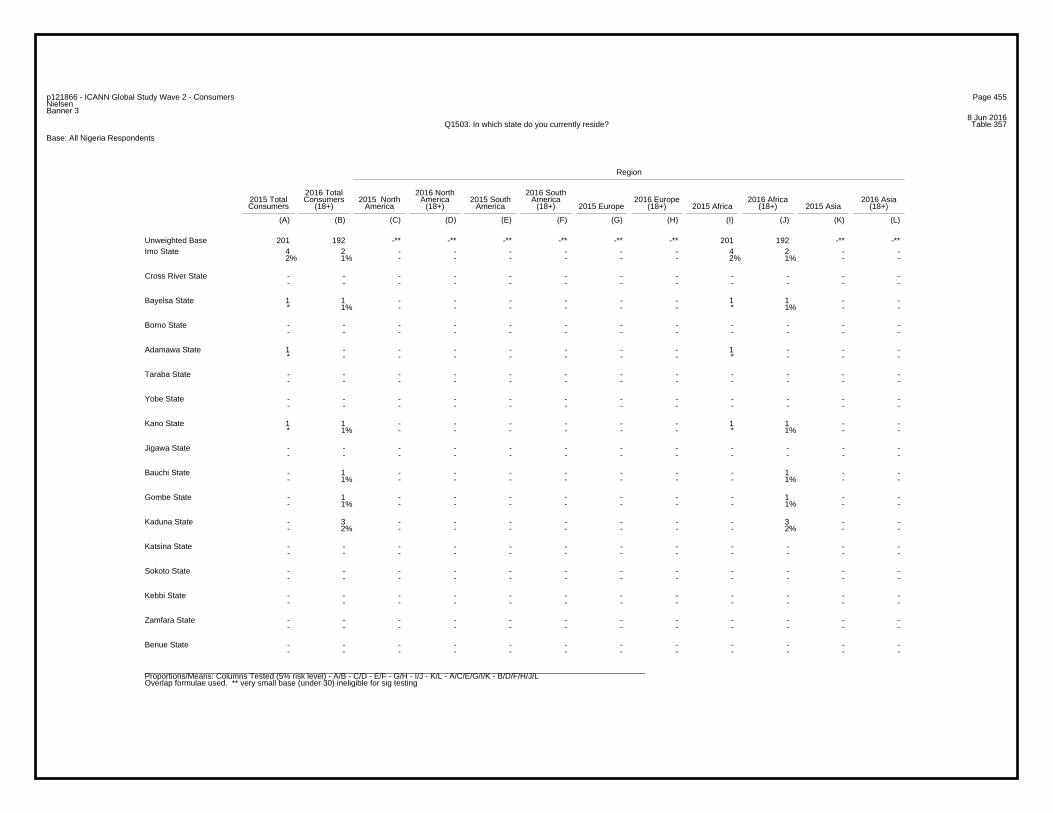
Page 455p121866 - ICANN Global Study Wave 2 - ConsumersNielsenBanner 3
8 Jun 2016Table 357Q1503. In which state do you currently reside?
Base: All Nigeria Respondents
Region
2016 Total 2016 North 2016 South2015 Total Consumers 2015 North America 2015 South America 2016 Europe 2016 Africa 2016 AsiaConsumers (18+) America (18+) America (18+) 2015 Europe (18+) 2015 Africa (18+) 2015 Asia (18+)
(A) (B) (C) (D) (E) (F) (G) (H) (I) (J) (K) (L)
201 192 -** -** -** -** -** -** 201 192 -** -**Unweighted Base4 2 - - - - - - 4 2 - -2% 1% - - - - - - 2% 1% - -
Imo State
- - - - - - - - - - - -- - - - - - - - - - - -
Cross River State
1 1 - - - - - - 1 1 - -* 1% - - - - - - * 1% - -
Bayelsa State
- - - - - - - - - - - -- - - - - - - - - - - -
Borno State
1 - - - - - - - 1 - - -* - - - - - - - * - - -
Adamawa State
- - - - - - - - - - - -- - - - - - - - - - - -
Taraba State
- - - - - - - - - - - -- - - - - - - - - - - -
Yobe State
1 1 - - - - - - 1 1 - -* 1% - - - - - - * 1% - -
Kano State
- - - - - - - - - - - -- - - - - - - - - - - -
Jigawa State
- 1 - - - - - - - 1 - -- 1% - - - - - - - 1% - -
Bauchi State
- 1 - - - - - - - 1 - -- 1% - - - - - - - 1% - -
Gombe State
- 3 - - - - - - - 3 - -- 2% - - - - - - - 2% - -
Kaduna State
- - - - - - - - - - - -- - - - - - - - - - - -
Katsina State
- - - - - - - - - - - -- - - - - - - - - - - -
Sokoto State
- - - - - - - - - - - -- - - - - - - - - - - -
Kebbi State
- - - - - - - - - - - -- - - - - - - - - - - -
Zamfara State
- - - - - - - - - - - -- - - - - - - - - - - -
Benue State
_________________________________________________________________________________________________________________Proportions/Means: Columns Tested (5% risk level) - A/B - C/D - E/F - G/H - I/J - K/L - A/C/E/G/I/K - B/D/F/H/J/LOverlap formulae used. ** very small base (under 30) ineligible for sig testing
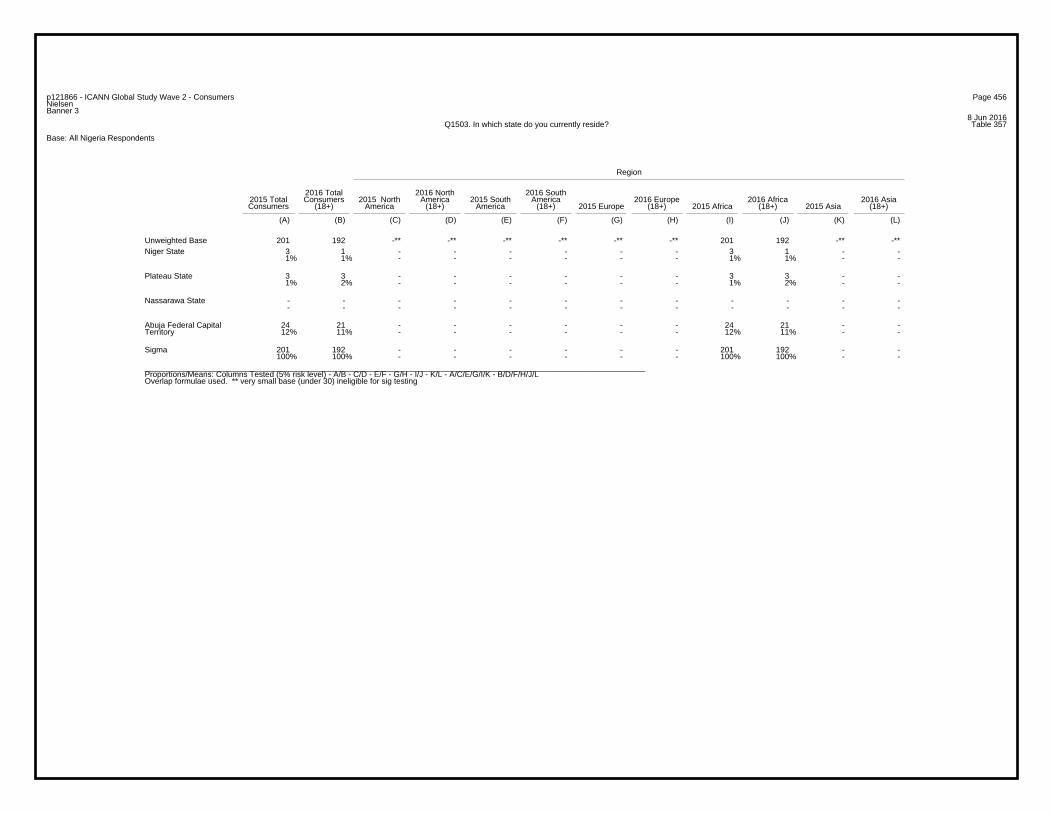
Page 456p121866 - ICANN Global Study Wave 2 - ConsumersNielsenBanner 3
8 Jun 2016Table 357Q1503. In which state do you currently reside?
Base: All Nigeria Respondents
Region
2016 Total 2016 North 2016 South2015 Total Consumers 2015 North America 2015 South America 2016 Europe 2016 Africa 2016 AsiaConsumers (18+) America (18+) America (18+) 2015 Europe (18+) 2015 Africa (18+) 2015 Asia (18+)
(A) (B) (C) (D) (E) (F) (G) (H) (I) (J) (K) (L)
201 192 -** -** -** -** -** -** 201 192 -** -**Unweighted Base3 1 - - - - - - 3 1 - -1% 1% - - - - - - 1% 1% - -
Niger State
3 3 - - - - - - 3 3 - -1% 2% - - - - - - 1% 2% - -
Plateau State
- - - - - - - - - - - -- - - - - - - - - - - -
Nassarawa State
24 21 - - - - - - 24 21 - -12% 11% - - - - - - 12% 11% - -
Abuja Federal CapitalTerritory
201 192 - - - - - - 201 192 - -100% 100% - - - - - - 100% 100% - -
Sigma
_________________________________________________________________________________________________________________Proportions/Means: Columns Tested (5% risk level) - A/B - C/D - E/F - G/H - I/J - K/L - A/C/E/G/I/K - B/D/F/H/J/LOverlap formulae used. ** very small base (under 30) ineligible for sig testing
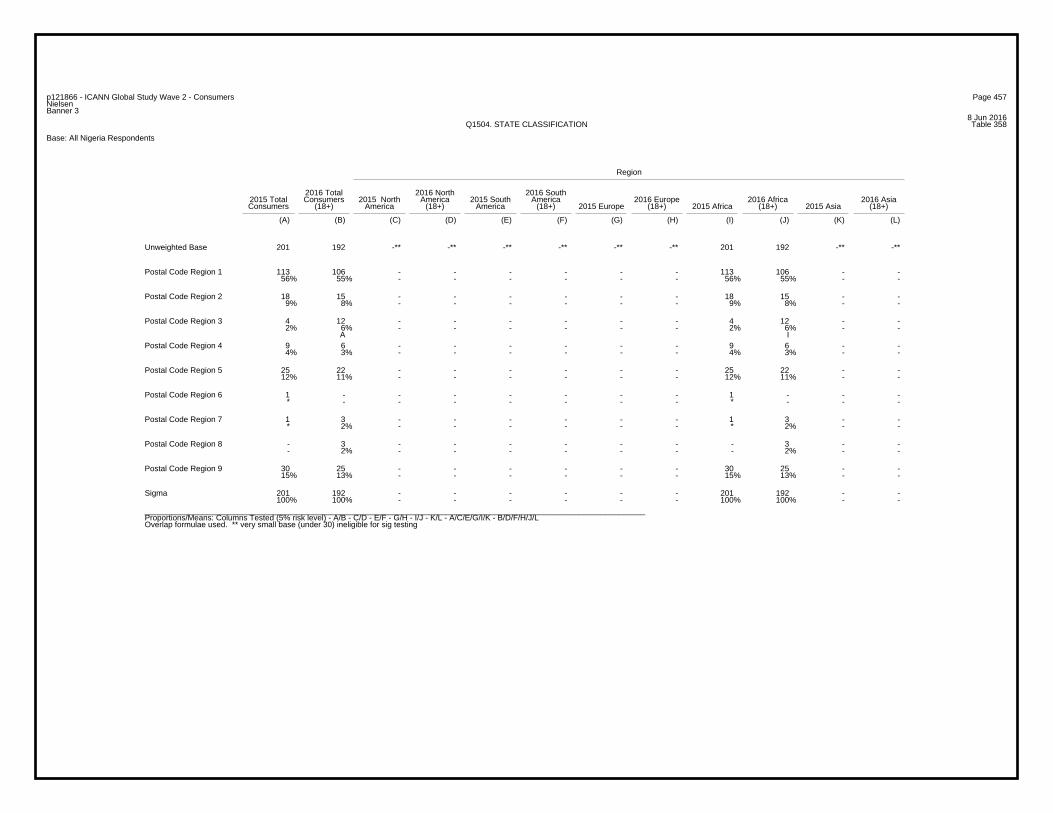
Page 457p121866 - ICANN Global Study Wave 2 - ConsumersNielsenBanner 3
8 Jun 2016Table 358Q1504. STATE CLASSIFICATION
Base: All Nigeria Respondents
Region
2016 Total 2016 North 2016 South2015 Total Consumers 2015 North America 2015 South America 2016 Europe 2016 Africa 2016 AsiaConsumers (18+) America (18+) America (18+) 2015 Europe (18+) 2015 Africa (18+) 2015 Asia (18+)
(A) (B) (C) (D) (E) (F) (G) (H) (I) (J) (K) (L)
201 192 -** -** -** -** -** -** 201 192 -** -**Unweighted Base
113 106 - - - - - - 113 106 - -56% 55% - - - - - - 56% 55% - -
Postal Code Region 1
18 15 - - - - - - 18 15 - -9% 8% - - - - - - 9% 8% - -
Postal Code Region 2
4 12 - - - - - - 4 12 - -2% 6% - - - - - - 2% 6% - -
A I
Postal Code Region 3
9 6 - - - - - - 9 6 - -4% 3% - - - - - - 4% 3% - -
Postal Code Region 4
25 22 - - - - - - 25 22 - -12% 11% - - - - - - 12% 11% - -
Postal Code Region 5
1 - - - - - - - 1 - - -* - - - - - - - * - - -
Postal Code Region 6
1 3 - - - - - - 1 3 - -* 2% - - - - - - * 2% - -
Postal Code Region 7
- 3 - - - - - - - 3 - -- 2% - - - - - - - 2% - -
Postal Code Region 8
30 25 - - - - - - 30 25 - -15% 13% - - - - - - 15% 13% - -
Postal Code Region 9
201 192 - - - - - - 201 192 - -100% 100% - - - - - - 100% 100% - -
Sigma
_________________________________________________________________________________________________________________Proportions/Means: Columns Tested (5% risk level) - A/B - C/D - E/F - G/H - I/J - K/L - A/C/E/G/I/K - B/D/F/H/J/LOverlap formulae used. ** very small base (under 30) ineligible for sig testing
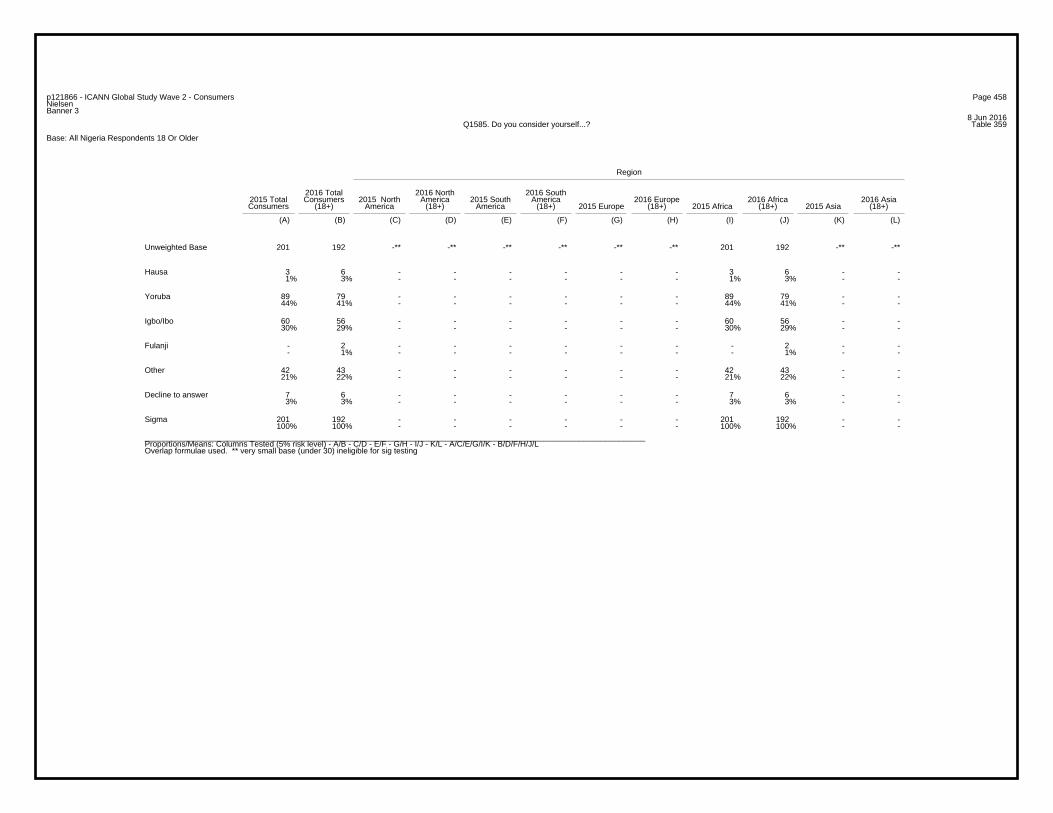
Page 458p121866 - ICANN Global Study Wave 2 - ConsumersNielsenBanner 3
8 Jun 2016Table 359Q1585. Do you consider yourself...?
Base: All Nigeria Respondents 18 Or Older
Region
2016 Total 2016 North 2016 South2015 Total Consumers 2015 North America 2015 South America 2016 Europe 2016 Africa 2016 AsiaConsumers (18+) America (18+) America (18+) 2015 Europe (18+) 2015 Africa (18+) 2015 Asia (18+)
(A) (B) (C) (D) (E) (F) (G) (H) (I) (J) (K) (L)
201 192 -** -** -** -** -** -** 201 192 -** -**Unweighted Base
3 6 - - - - - - 3 6 - -1% 3% - - - - - - 1% 3% - -
Hausa
89 79 - - - - - - 89 79 - -44% 41% - - - - - - 44% 41% - -
Yoruba
60 56 - - - - - - 60 56 - -30% 29% - - - - - - 30% 29% - -
Igbo/Ibo
- 2 - - - - - - - 2 - -- 1% - - - - - - - 1% - -
Fulanji
42 43 - - - - - - 42 43 - -21% 22% - - - - - - 21% 22% - -
Other
7 6 - - - - - - 7 6 - -3% 3% - - - - - - 3% 3% - -
Decline to answer
201 192 - - - - - - 201 192 - -100% 100% - - - - - - 100% 100% - -
Sigma
_________________________________________________________________________________________________________________Proportions/Means: Columns Tested (5% risk level) - A/B - C/D - E/F - G/H - I/J - K/L - A/C/E/G/I/K - B/D/F/H/J/LOverlap formulae used. ** very small base (under 30) ineligible for sig testing
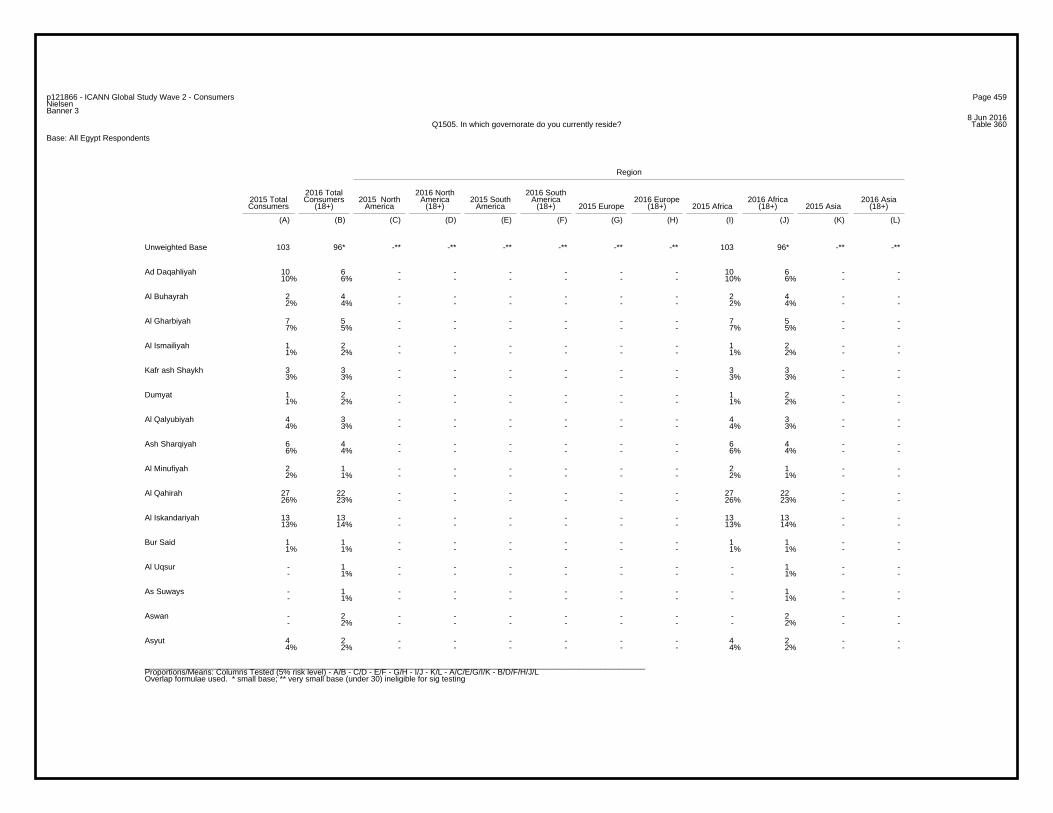
Page 459p121866 - ICANN Global Study Wave 2 - ConsumersNielsenBanner 3
8 Jun 2016Table 360Q1505. In which governorate do you currently reside?
Base: All Egypt Respondents
Region
2016 Total 2016 North 2016 South2015 Total Consumers 2015 North America 2015 South America 2016 Europe 2016 Africa 2016 AsiaConsumers (18+) America (18+) America (18+) 2015 Europe (18+) 2015 Africa (18+) 2015 Asia (18+)
(A) (B) (C) (D) (E) (F) (G) (H) (I) (J) (K) (L)
103 96* -** -** -** -** -** -** 103 96* -** -**Unweighted Base
10 6 - - - - - - 10 6 - -10% 6% - - - - - - 10% 6% - -
Ad Daqahliyah
2 4 - - - - - - 2 4 - -2% 4% - - - - - - 2% 4% - -
Al Buhayrah
7 5 - - - - - - 7 5 - -7% 5% - - - - - - 7% 5% - -
Al Gharbiyah
1 2 - - - - - - 1 2 - -1% 2% - - - - - - 1% 2% - -
Al Ismailiyah
3 3 - - - - - - 3 3 - -3% 3% - - - - - - 3% 3% - -
Kafr ash Shaykh
1 2 - - - - - - 1 2 - -1% 2% - - - - - - 1% 2% - -
Dumyat
4 3 - - - - - - 4 3 - -4% 3% - - - - - - 4% 3% - -
Al Qalyubiyah
6 4 - - - - - - 6 4 - -6% 4% - - - - - - 6% 4% - -
Ash Sharqiyah
2 1 - - - - - - 2 1 - -2% 1% - - - - - - 2% 1% - -
Al Minufiyah
27 22 - - - - - - 27 22 - -26% 23% - - - - - - 26% 23% - -
Al Qahirah
13 13 - - - - - - 13 13 - -13% 14% - - - - - - 13% 14% - -
Al Iskandariyah
1 1 - - - - - - 1 1 - -1% 1% - - - - - - 1% 1% - -
Bur Said
- 1 - - - - - - - 1 - -- 1% - - - - - - - 1% - -
Al Uqsur
- 1 - - - - - - - 1 - -- 1% - - - - - - - 1% - -
As Suways
- 2 - - - - - - - 2 - -- 2% - - - - - - - 2% - -
Aswan
4 2 - - - - - - 4 2 - -4% 2% - - - - - - 4% 2% - -
Asyut
_________________________________________________________________________________________________________________Proportions/Means: Columns Tested (5% risk level) - A/B - C/D - E/F - G/H - I/J - K/L - A/C/E/G/I/K - B/D/F/H/J/LOverlap formulae used. * small base; ** very small base (under 30) ineligible for sig testing
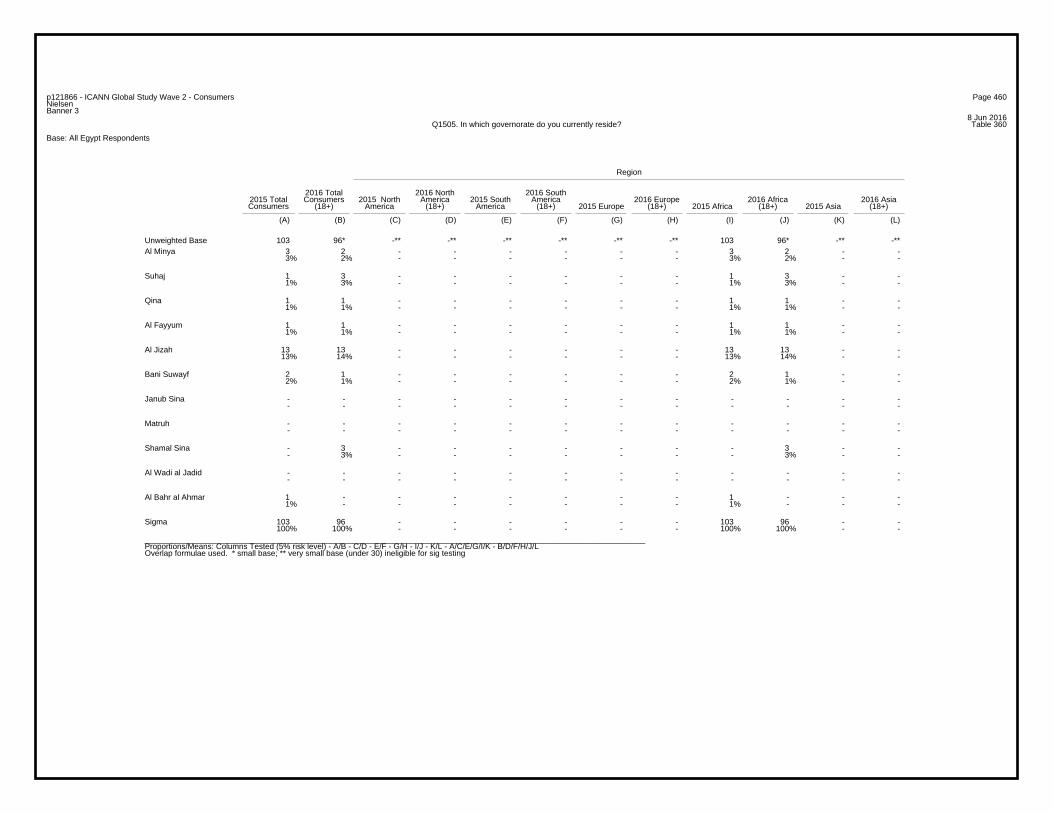
Page 460p121866 - ICANN Global Study Wave 2 - ConsumersNielsenBanner 3
8 Jun 2016Table 360Q1505. In which governorate do you currently reside?
Base: All Egypt Respondents
Region
2016 Total 2016 North 2016 South2015 Total Consumers 2015 North America 2015 South America 2016 Europe 2016 Africa 2016 AsiaConsumers (18+) America (18+) America (18+) 2015 Europe (18+) 2015 Africa (18+) 2015 Asia (18+)
(A) (B) (C) (D) (E) (F) (G) (H) (I) (J) (K) (L)
103 96* -** -** -** -** -** -** 103 96* -** -**Unweighted Base3 2 - - - - - - 3 2 - -3% 2% - - - - - - 3% 2% - -
Al Minya
1 3 - - - - - - 1 3 - -1% 3% - - - - - - 1% 3% - -
Suhaj
1 1 - - - - - - 1 1 - -1% 1% - - - - - - 1% 1% - -
Qina
1 1 - - - - - - 1 1 - -1% 1% - - - - - - 1% 1% - -
Al Fayyum
13 13 - - - - - - 13 13 - -13% 14% - - - - - - 13% 14% - -
Al Jizah
2 1 - - - - - - 2 1 - -2% 1% - - - - - - 2% 1% - -
Bani Suwayf
- - - - - - - - - - - -- - - - - - - - - - - -
Janub Sina
- - - - - - - - - - - -- - - - - - - - - - - -
Matruh
- 3 - - - - - - - 3 - -- 3% - - - - - - - 3% - -
Shamal Sina
- - - - - - - - - - - -- - - - - - - - - - - -
Al Wadi al Jadid
1 - - - - - - - 1 - - -1% - - - - - - - 1% - - -
Al Bahr al Ahmar
103 96 - - - - - - 103 96 - -100% 100% - - - - - - 100% 100% - -
Sigma
_________________________________________________________________________________________________________________Proportions/Means: Columns Tested (5% risk level) - A/B - C/D - E/F - G/H - I/J - K/L - A/C/E/G/I/K - B/D/F/H/J/LOverlap formulae used. * small base; ** very small base (under 30) ineligible for sig testing
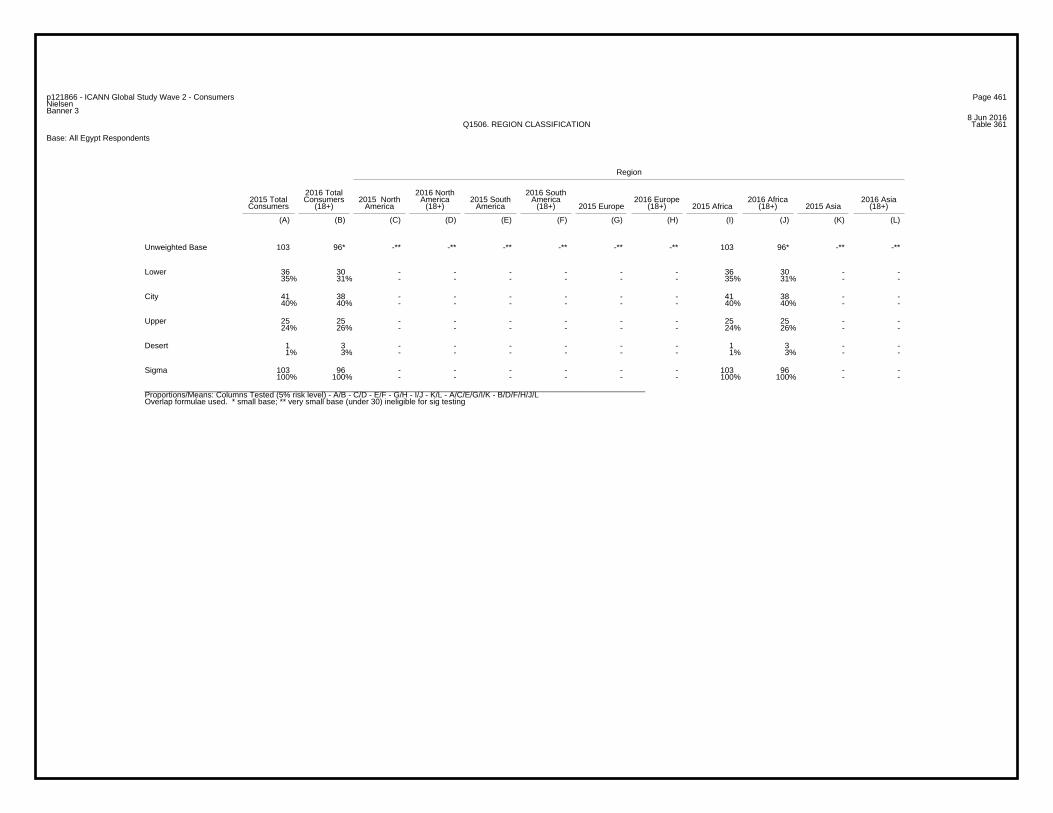
Page 461p121866 - ICANN Global Study Wave 2 - ConsumersNielsenBanner 3
8 Jun 2016Table 361Q1506. REGION CLASSIFICATION
Base: All Egypt Respondents
Region
2016 Total 2016 North 2016 South2015 Total Consumers 2015 North America 2015 South America 2016 Europe 2016 Africa 2016 AsiaConsumers (18+) America (18+) America (18+) 2015 Europe (18+) 2015 Africa (18+) 2015 Asia (18+)
(A) (B) (C) (D) (E) (F) (G) (H) (I) (J) (K) (L)
103 96* -** -** -** -** -** -** 103 96* -** -**Unweighted Base
36 30 - - - - - - 36 30 - -35% 31% - - - - - - 35% 31% - -
Lower
41 38 - - - - - - 41 38 - -40% 40% - - - - - - 40% 40% - -
City
25 25 - - - - - - 25 25 - -24% 26% - - - - - - 24% 26% - -
Upper
1 3 - - - - - - 1 3 - -1% 3% - - - - - - 1% 3% - -
Desert
103 96 - - - - - - 103 96 - -100% 100% - - - - - - 100% 100% - -
Sigma
_________________________________________________________________________________________________________________Proportions/Means: Columns Tested (5% risk level) - A/B - C/D - E/F - G/H - I/J - K/L - A/C/E/G/I/K - B/D/F/H/J/LOverlap formulae used. * small base; ** very small base (under 30) ineligible for sig testing
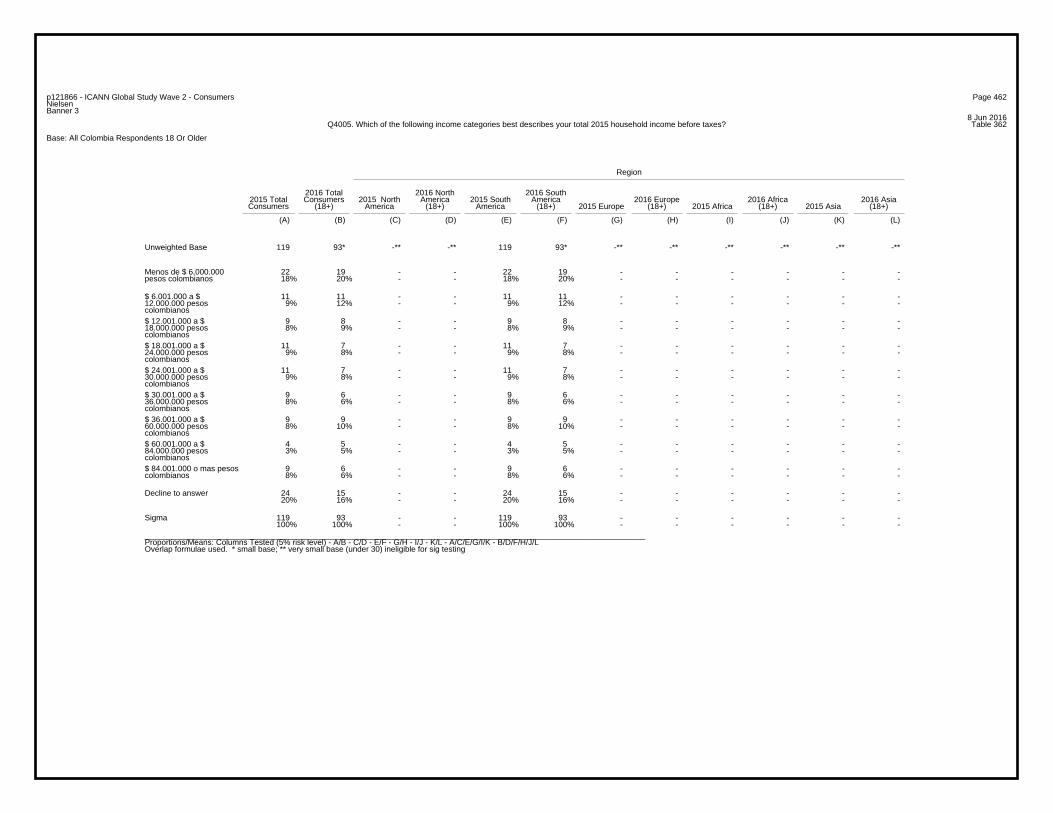
Page 462p121866 - ICANN Global Study Wave 2 - ConsumersNielsenBanner 3
8 Jun 2016Table 362Q4005. Which of the following income categories best describes your total 2015 household income before taxes?
Base: All Colombia Respondents 18 Or Older
Region
2016 Total 2016 North 2016 South2015 Total Consumers 2015 North America 2015 South America 2016 Europe 2016 Africa 2016 AsiaConsumers (18+) America (18+) America (18+) 2015 Europe (18+) 2015 Africa (18+) 2015 Asia (18+)
(A) (B) (C) (D) (E) (F) (G) (H) (I) (J) (K) (L)
119 93* -** -** 119 93* -** -** -** -** -** -**Unweighted Base
22 19 - - 22 19 - - - - - -18% 20% - - 18% 20% - - - - - -
Menos de $ 6,000.000pesos colombianos
11 11 - - 11 11 - - - - - -9% 12% - - 9% 12% - - - - - -
$ 6.001.000 a $12.000.000 pesoscolombianos
9 8 - - 9 8 - - - - - -8% 9% - - 8% 9% - - - - - -
$ 12.001.000 a $18.000.000 pesoscolombianos
11 7 - - 11 7 - - - - - -9% 8% - - 9% 8% - - - - - -
$ 18.001.000 a $24.000.000 pesoscolombianos
11 7 - - 11 7 - - - - - -9% 8% - - 9% 8% - - - - - -
$ 24.001.000 a $30.000.000 pesoscolombianos
9 6 - - 9 6 - - - - - -8% 6% - - 8% 6% - - - - - -
$ 30.001.000 a $36.000.000 pesoscolombianos
9 9 - - 9 9 - - - - - -8% 10% - - 8% 10% - - - - - -
$ 36.001.000 a $60.000.000 pesoscolombianos
4 5 - - 4 5 - - - - - -3% 5% - - 3% 5% - - - - - -
$ 60.001.000 a $84.000.000 pesoscolombianos
9 6 - - 9 6 - - - - - -8% 6% - - 8% 6% - - - - - -
$ 84.001.000 o mas pesoscolombianos
24 15 - - 24 15 - - - - - -20% 16% - - 20% 16% - - - - - -
Decline to answer
119 93 - - 119 93 - - - - - -100% 100% - - 100% 100% - - - - - -
Sigma
_________________________________________________________________________________________________________________Proportions/Means: Columns Tested (5% risk level) - A/B - C/D - E/F - G/H - I/J - K/L - A/C/E/G/I/K - B/D/F/H/J/LOverlap formulae used. * small base; ** very small base (under 30) ineligible for sig testing
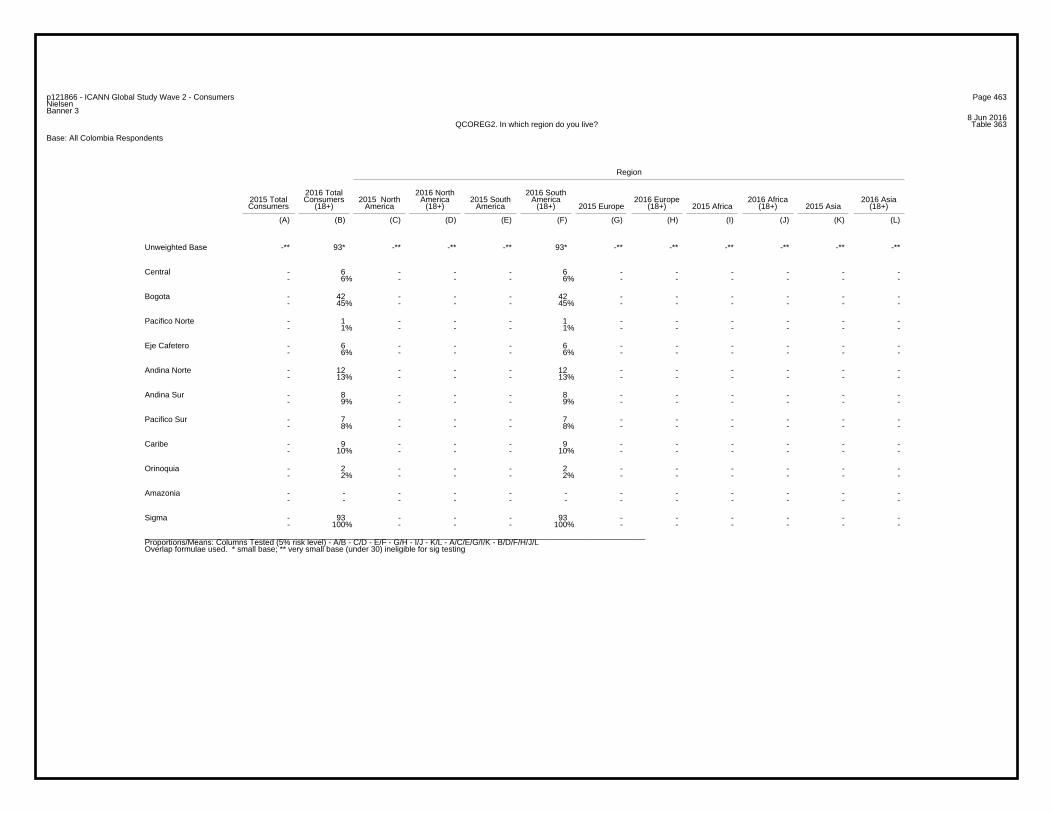
Page 463p121866 - ICANN Global Study Wave 2 - ConsumersNielsenBanner 3
8 Jun 2016Table 363QCOREG2. In which region do you live?
Base: All Colombia Respondents
Region
2016 Total 2016 North 2016 South2015 Total Consumers 2015 North America 2015 South America 2016 Europe 2016 Africa 2016 AsiaConsumers (18+) America (18+) America (18+) 2015 Europe (18+) 2015 Africa (18+) 2015 Asia (18+)
(A) (B) (C) (D) (E) (F) (G) (H) (I) (J) (K) (L)
-** 93* -** -** -** 93* -** -** -** -** -** -**Unweighted Base
- 6 - - - 6 - - - - - -- 6% - - - 6% - - - - - -
Central
- 42 - - - 42 - - - - - -- 45% - - - 45% - - - - - -
Bogota
- 1 - - - 1 - - - - - -- 1% - - - 1% - - - - - -
Pacifico Norte
- 6 - - - 6 - - - - - -- 6% - - - 6% - - - - - -
Eje Cafetero
- 12 - - - 12 - - - - - -- 13% - - - 13% - - - - - -
Andina Norte
- 8 - - - 8 - - - - - -- 9% - - - 9% - - - - - -
Andina Sur
- 7 - - - 7 - - - - - -- 8% - - - 8% - - - - - -
Pacifico Sur
- 9 - - - 9 - - - - - -- 10% - - - 10% - - - - - -
Caribe
- 2 - - - 2 - - - - - -- 2% - - - 2% - - - - - -
Orinoquia
- - - - - - - - - - - -- - - - - - - - - - - -
Amazonia
- 93 - - - 93 - - - - - -- 100% - - - 100% - - - - - -
Sigma
_________________________________________________________________________________________________________________Proportions/Means: Columns Tested (5% risk level) - A/B - C/D - E/F - G/H - I/J - K/L - A/C/E/G/I/K - B/D/F/H/J/LOverlap formulae used. * small base; ** very small base (under 30) ineligible for sig testing
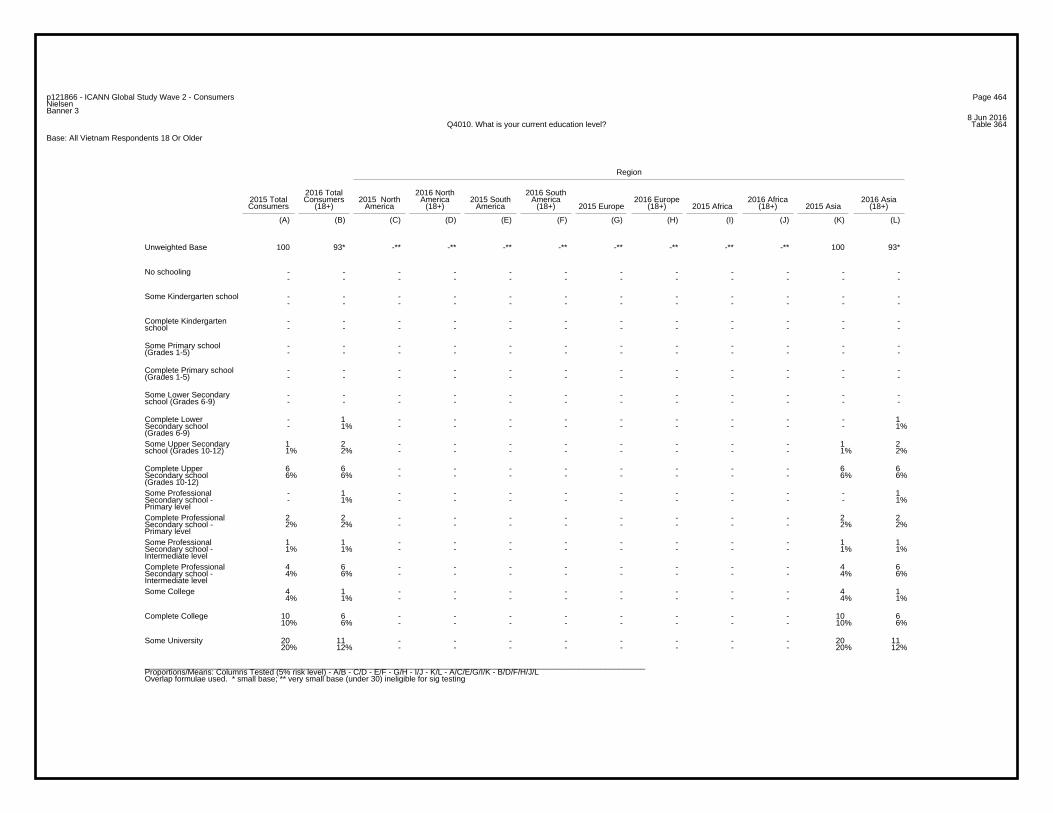
Page 464p121866 - ICANN Global Study Wave 2 - ConsumersNielsenBanner 3
8 Jun 2016Table 364Q4010. What is your current education level?
Base: All Vietnam Respondents 18 Or Older
Region
2016 Total 2016 North 2016 South2015 Total Consumers 2015 North America 2015 South America 2016 Europe 2016 Africa 2016 AsiaConsumers (18+) America (18+) America (18+) 2015 Europe (18+) 2015 Africa (18+) 2015 Asia (18+)
(A) (B) (C) (D) (E) (F) (G) (H) (I) (J) (K) (L)
100 93* -** -** -** -** -** -** -** -** 100 93*Unweighted Base
- - - - - - - - - - - -- - - - - - - - - - - -
No schooling
- - - - - - - - - - - -- - - - - - - - - - - -
Some Kindergarten school
- - - - - - - - - - - -- - - - - - - - - - - -
Complete Kindergartenschool
- - - - - - - - - - - -- - - - - - - - - - - -
Some Primary school(Grades 1-5)
- - - - - - - - - - - -- - - - - - - - - - - -
Complete Primary school(Grades 1-5)
- - - - - - - - - - - -- - - - - - - - - - - -
Some Lower Secondaryschool (Grades 6-9)
- 1 - - - - - - - - - 1- 1% - - - - - - - - - 1%
Complete LowerSecondary school(Grades 6-9)
1 2 - - - - - - - - 1 21% 2% - - - - - - - - 1% 2%
Some Upper Secondaryschool (Grades 10-12)
6 6 - - - - - - - - 6 66% 6% - - - - - - - - 6% 6%
Complete UpperSecondary school(Grades 10-12)
- 1 - - - - - - - - - 1- 1% - - - - - - - - - 1%
Some ProfessionalSecondary school -Primary level
2 2 - - - - - - - - 2 22% 2% - - - - - - - - 2% 2%
Complete ProfessionalSecondary school -Primary level
1 1 - - - - - - - - 1 11% 1% - - - - - - - - 1% 1%
Some ProfessionalSecondary school -Intermediate level
4 6 - - - - - - - - 4 64% 6% - - - - - - - - 4% 6%
Complete ProfessionalSecondary school -Intermediate level
4 1 - - - - - - - - 4 14% 1% - - - - - - - - 4% 1%
Some College
10 6 - - - - - - - - 10 610% 6% - - - - - - - - 10% 6%
Complete College
20 11 - - - - - - - - 20 1120% 12% - - - - - - - - 20% 12%
Some University
_________________________________________________________________________________________________________________Proportions/Means: Columns Tested (5% risk level) - A/B - C/D - E/F - G/H - I/J - K/L - A/C/E/G/I/K - B/D/F/H/J/LOverlap formulae used. * small base; ** very small base (under 30) ineligible for sig testing
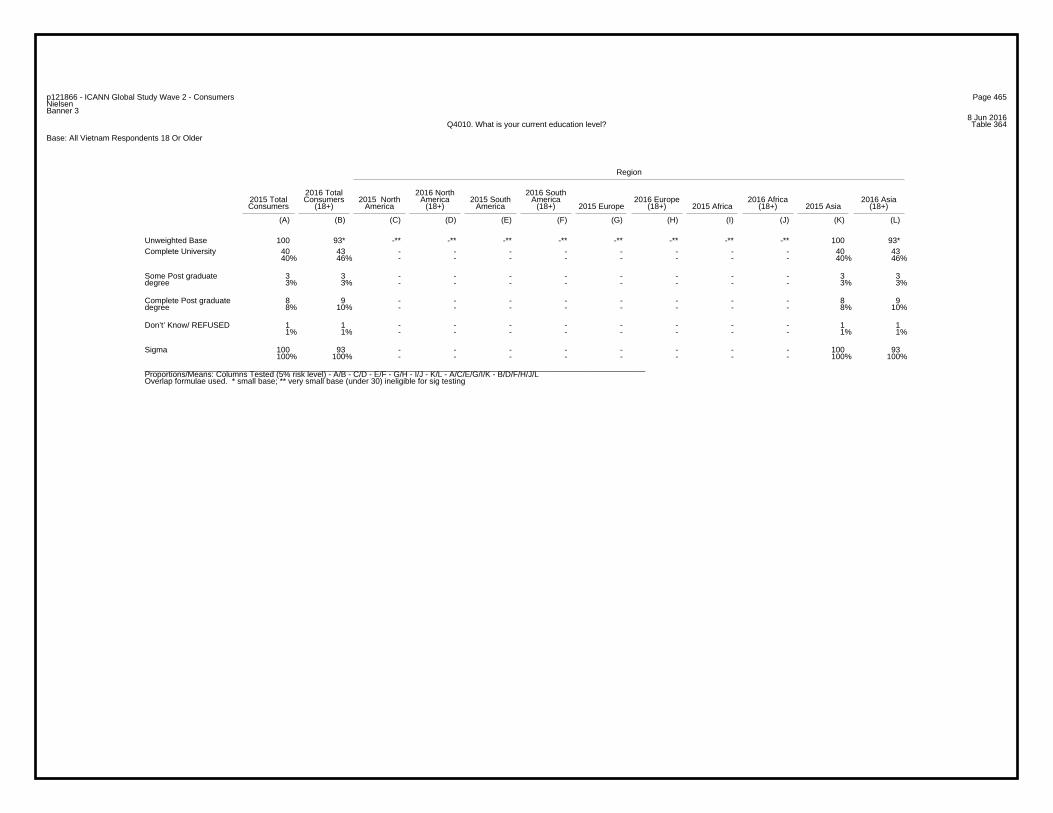
Page 465p121866 - ICANN Global Study Wave 2 - ConsumersNielsenBanner 3
8 Jun 2016Table 364Q4010. What is your current education level?
Base: All Vietnam Respondents 18 Or Older
Region
2016 Total 2016 North 2016 South2015 Total Consumers 2015 North America 2015 South America 2016 Europe 2016 Africa 2016 AsiaConsumers (18+) America (18+) America (18+) 2015 Europe (18+) 2015 Africa (18+) 2015 Asia (18+)
(A) (B) (C) (D) (E) (F) (G) (H) (I) (J) (K) (L)
100 93* -** -** -** -** -** -** -** -** 100 93*Unweighted Base40 43 - - - - - - - - 40 4340% 46% - - - - - - - - 40% 46%
Complete University
3 3 - - - - - - - - 3 33% 3% - - - - - - - - 3% 3%
Some Post graduatedegree
8 9 - - - - - - - - 8 98% 10% - - - - - - - - 8% 10%
Complete Post graduatedegree
1 1 - - - - - - - - 1 11% 1% - - - - - - - - 1% 1%
Don’t’ Know/ REFUSED
100 93 - - - - - - - - 100 93100% 100% - - - - - - - - 100% 100%
Sigma
_________________________________________________________________________________________________________________Proportions/Means: Columns Tested (5% risk level) - A/B - C/D - E/F - G/H - I/J - K/L - A/C/E/G/I/K - B/D/F/H/J/LOverlap formulae used. * small base; ** very small base (under 30) ineligible for sig testing
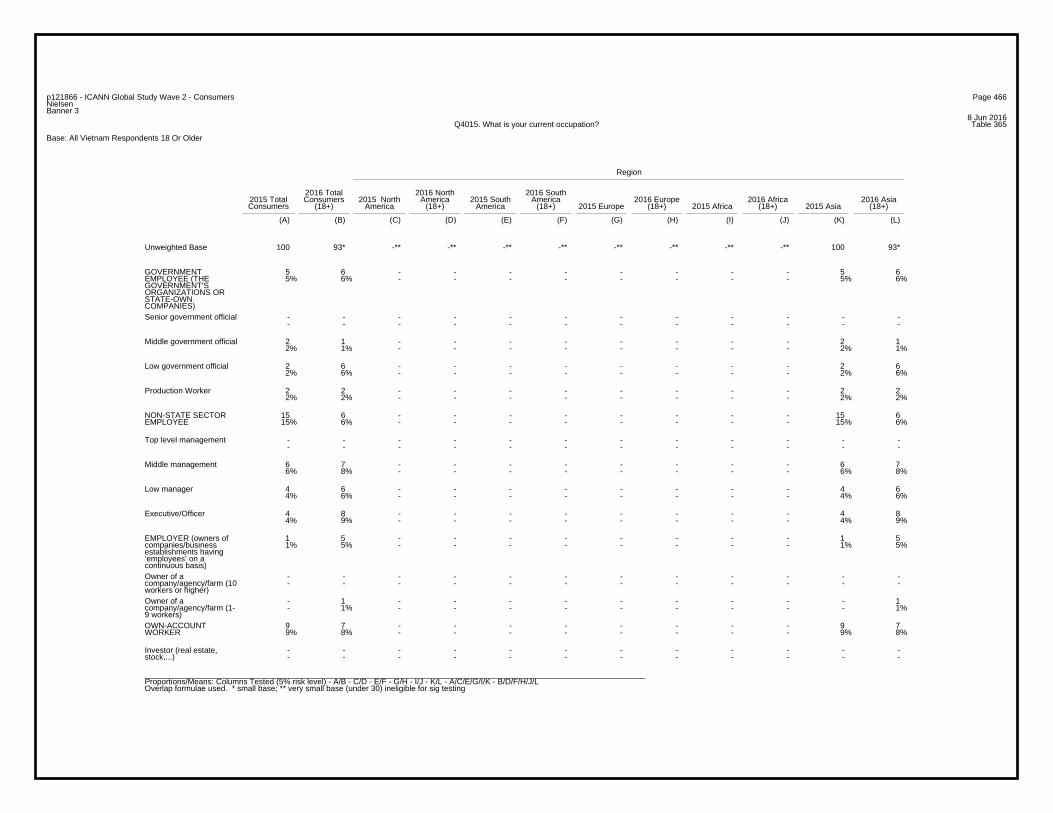
Page 466p121866 - ICANN Global Study Wave 2 - ConsumersNielsenBanner 3
8 Jun 2016Table 365Q4015. What is your current occupation?
Base: All Vietnam Respondents 18 Or Older
Region
2016 Total 2016 North 2016 South2015 Total Consumers 2015 North America 2015 South America 2016 Europe 2016 Africa 2016 AsiaConsumers (18+) America (18+) America (18+) 2015 Europe (18+) 2015 Africa (18+) 2015 Asia (18+)
(A) (B) (C) (D) (E) (F) (G) (H) (I) (J) (K) (L)
100 93* -** -** -** -** -** -** -** -** 100 93*Unweighted Base
5 6 - - - - - - - - 5 65% 6% - - - - - - - - 5% 6%
GOVERNMENTEMPLOYEE (THEGOVERNMENT’SORGANIZATIONS ORSTATE-OWNCOMPANIES)
- - - - - - - - - - - -- - - - - - - - - - - -
Senior government official
2 1 - - - - - - - - 2 12% 1% - - - - - - - - 2% 1%
Middle government official
2 6 - - - - - - - - 2 62% 6% - - - - - - - - 2% 6%
Low government official
2 2 - - - - - - - - 2 22% 2% - - - - - - - - 2% 2%
Production Worker
15 6 - - - - - - - - 15 615% 6% - - - - - - - - 15% 6%
NON-STATE SECTOREMPLOYEE
- - - - - - - - - - - -- - - - - - - - - - - -
Top level management
6 7 - - - - - - - - 6 76% 8% - - - - - - - - 6% 8%
Middle management
4 6 - - - - - - - - 4 64% 6% - - - - - - - - 4% 6%
Low manager
4 8 - - - - - - - - 4 84% 9% - - - - - - - - 4% 9%
Executive/Officer
1 5 - - - - - - - - 1 51% 5% - - - - - - - - 1% 5%
EMPLOYER (owners ofcompanies/businessestablishments having’employees’ on acontinuous basis)
- - - - - - - - - - - -- - - - - - - - - - - -
Owner of acompany/agency/farm (10workers or higher)
- 1 - - - - - - - - - 1- 1% - - - - - - - - - 1%
Owner of acompany/agency/farm (1-9 workers)
9 7 - - - - - - - - 9 79% 8% - - - - - - - - 9% 8%
OWN-ACCOUNTWORKER
- - - - - - - - - - - -- - - - - - - - - - - -
Investor (real estate,stock,...)
_________________________________________________________________________________________________________________Proportions/Means: Columns Tested (5% risk level) - A/B - C/D - E/F - G/H - I/J - K/L - A/C/E/G/I/K - B/D/F/H/J/LOverlap formulae used. * small base; ** very small base (under 30) ineligible for sig testing
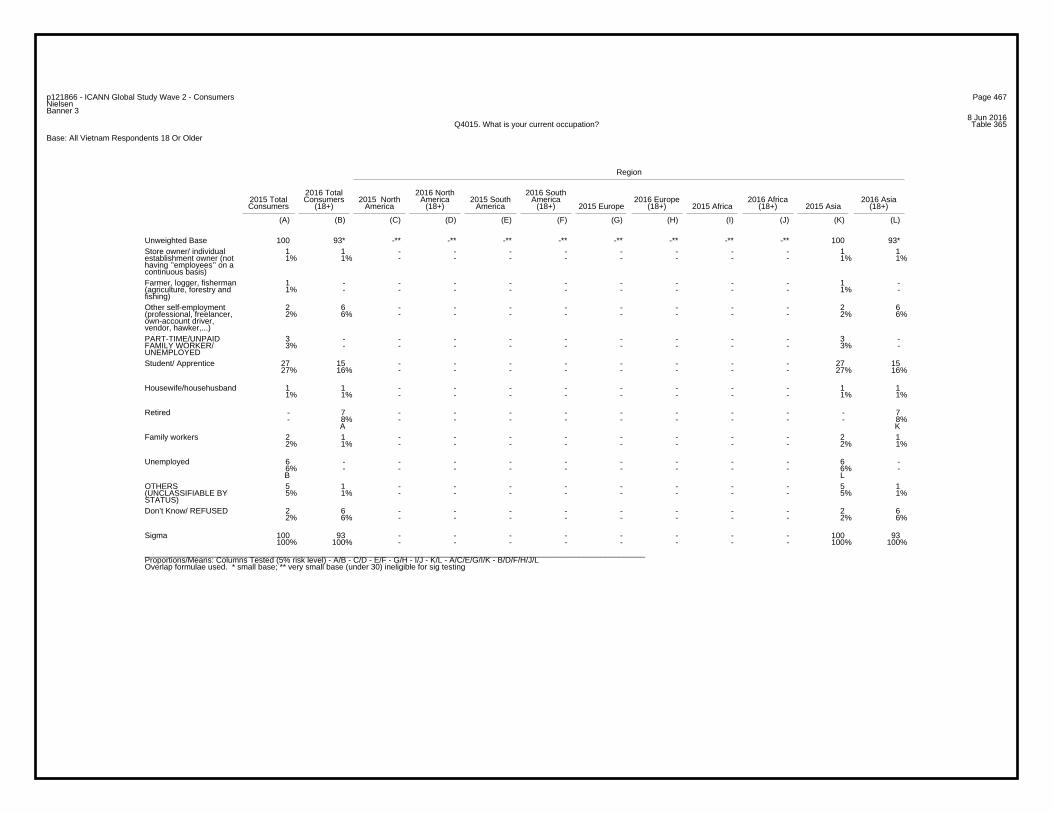
Page 467p121866 - ICANN Global Study Wave 2 - ConsumersNielsenBanner 3
8 Jun 2016Table 365Q4015. What is your current occupation?
Base: All Vietnam Respondents 18 Or Older
Region
2016 Total 2016 North 2016 South2015 Total Consumers 2015 North America 2015 South America 2016 Europe 2016 Africa 2016 AsiaConsumers (18+) America (18+) America (18+) 2015 Europe (18+) 2015 Africa (18+) 2015 Asia (18+)
(A) (B) (C) (D) (E) (F) (G) (H) (I) (J) (K) (L)
100 93* -** -** -** -** -** -** -** -** 100 93*Unweighted Base1 1 - - - - - - - - 1 11% 1% - - - - - - - - 1% 1%
Store owner/ individualestablishment owner (nothaving ’’employees’’ on acontinuous basis)
1 - - - - - - - - - 1 -1% - - - - - - - - - 1% -
Farmer, logger, fisherman(agriculture, forestry andfishing)
2 6 - - - - - - - - 2 62% 6% - - - - - - - - 2% 6%
Other self-employment(professional, freelancer,own-account driver,vendor, hawker,...)
3 - - - - - - - - - 3 -3% - - - - - - - - - 3% -
PART-TIME/UNPAIDFAMILY WORKER/UNEMPLOYED
27 15 - - - - - - - - 27 1527% 16% - - - - - - - - 27% 16%
Student/ Apprentice
1 1 - - - - - - - - 1 11% 1% - - - - - - - - 1% 1%
Housewife/househusband
- 7 - - - - - - - - - 7- 8% - - - - - - - - - 8%
A K
Retired
2 1 - - - - - - - - 2 12% 1% - - - - - - - - 2% 1%
Family workers
6 - - - - - - - - - 6 -6% - - - - - - - - - 6% - B L
Unemployed
5 1 - - - - - - - - 5 15% 1% - - - - - - - - 5% 1%
OTHERS(UNCLASSIFIABLE BYSTATUS)
2 6 - - - - - - - - 2 62% 6% - - - - - - - - 2% 6%
Don’t Know/ REFUSED
100 93 - - - - - - - - 100 93100% 100% - - - - - - - - 100% 100%
Sigma
_________________________________________________________________________________________________________________Proportions/Means: Columns Tested (5% risk level) - A/B - C/D - E/F - G/H - I/J - K/L - A/C/E/G/I/K - B/D/F/H/J/LOverlap formulae used. * small base; ** very small base (under 30) ineligible for sig testing
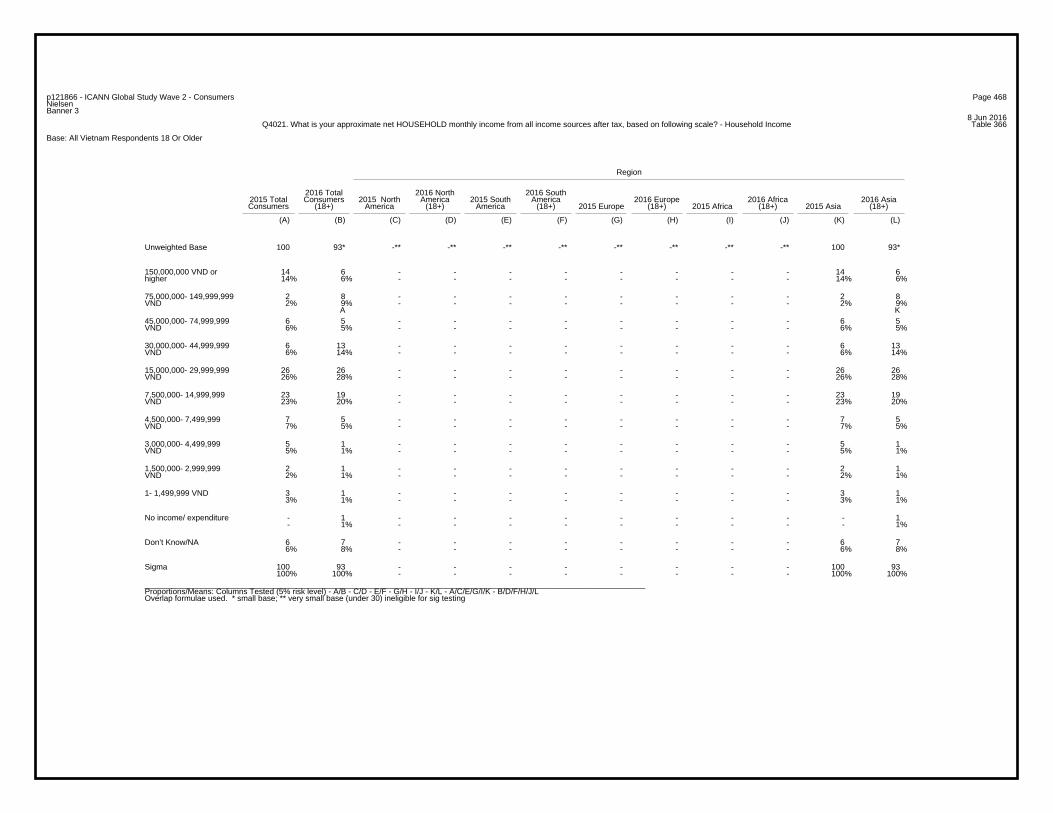
Page 468p121866 - ICANN Global Study Wave 2 - ConsumersNielsenBanner 3
8 Jun 2016Table 366Q4021. What is your approximate net HOUSEHOLD monthly income from all income sources after tax, based on following scale? - Household Income
Base: All Vietnam Respondents 18 Or Older
Region
2016 Total 2016 North 2016 South2015 Total Consumers 2015 North America 2015 South America 2016 Europe 2016 Africa 2016 AsiaConsumers (18+) America (18+) America (18+) 2015 Europe (18+) 2015 Africa (18+) 2015 Asia (18+)
(A) (B) (C) (D) (E) (F) (G) (H) (I) (J) (K) (L)
100 93* -** -** -** -** -** -** -** -** 100 93*Unweighted Base
14 6 - - - - - - - - 14 614% 6% - - - - - - - - 14% 6%
150,000,000 VND orhigher
2 8 - - - - - - - - 2 82% 9% - - - - - - - - 2% 9%
A K
75,000,000- 149,999,999VND
6 5 - - - - - - - - 6 56% 5% - - - - - - - - 6% 5%
45,000,000- 74,999,999VND
6 13 - - - - - - - - 6 136% 14% - - - - - - - - 6% 14%
30,000,000- 44,999,999VND
26 26 - - - - - - - - 26 2626% 28% - - - - - - - - 26% 28%
15,000,000- 29,999,999VND
23 19 - - - - - - - - 23 1923% 20% - - - - - - - - 23% 20%
7,500,000- 14,999,999VND
7 5 - - - - - - - - 7 57% 5% - - - - - - - - 7% 5%
4,500,000- 7,499,999VND
5 1 - - - - - - - - 5 15% 1% - - - - - - - - 5% 1%
3,000,000- 4,499,999VND
2 1 - - - - - - - - 2 12% 1% - - - - - - - - 2% 1%
1,500,000- 2,999,999VND
3 1 - - - - - - - - 3 13% 1% - - - - - - - - 3% 1%
1- 1,499,999 VND
- 1 - - - - - - - - - 1- 1% - - - - - - - - - 1%
No income/ expenditure
6 7 - - - - - - - - 6 76% 8% - - - - - - - - 6% 8%
Don’t Know/NA
100 93 - - - - - - - - 100 93100% 100% - - - - - - - - 100% 100%
Sigma
_________________________________________________________________________________________________________________Proportions/Means: Columns Tested (5% risk level) - A/B - C/D - E/F - G/H - I/J - K/L - A/C/E/G/I/K - B/D/F/H/J/LOverlap formulae used. * small base; ** very small base (under 30) ineligible for sig testing
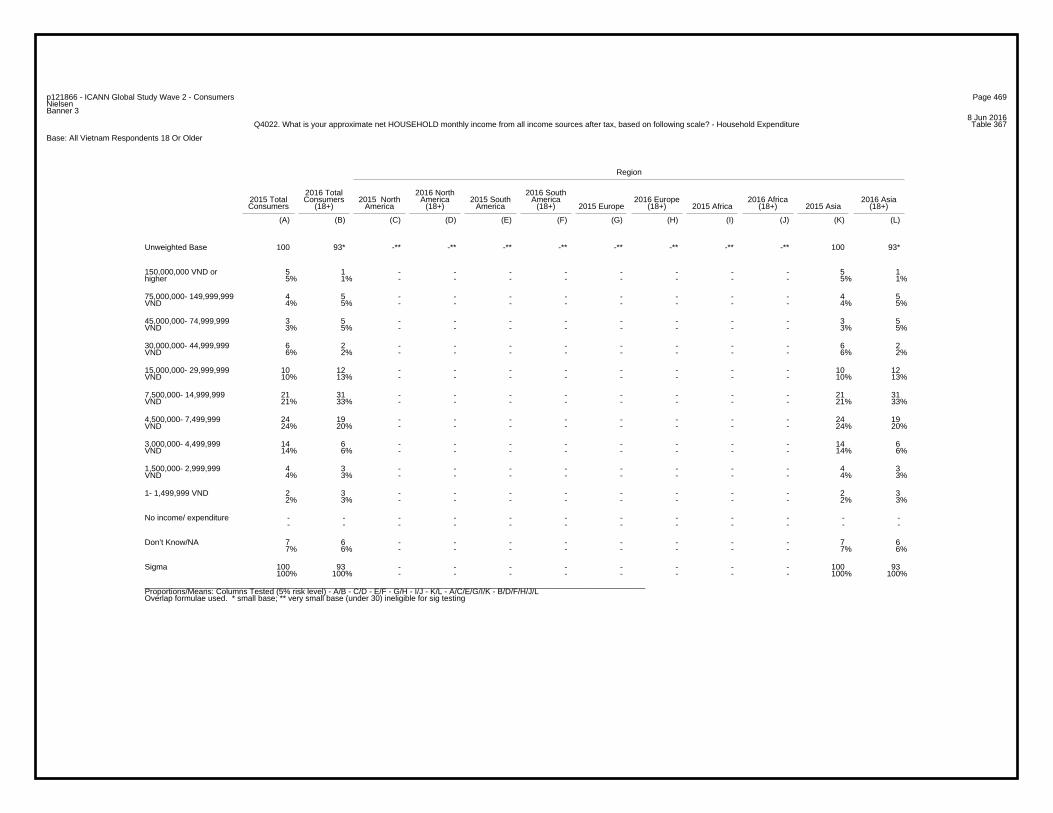
Page 469p121866 - ICANN Global Study Wave 2 - ConsumersNielsenBanner 3
8 Jun 2016Table 367Q4022. What is your approximate net HOUSEHOLD monthly income from all income sources after tax, based on following scale? - Household Expenditure
Base: All Vietnam Respondents 18 Or Older
Region
2016 Total 2016 North 2016 South2015 Total Consumers 2015 North America 2015 South America 2016 Europe 2016 Africa 2016 AsiaConsumers (18+) America (18+) America (18+) 2015 Europe (18+) 2015 Africa (18+) 2015 Asia (18+)
(A) (B) (C) (D) (E) (F) (G) (H) (I) (J) (K) (L)
100 93* -** -** -** -** -** -** -** -** 100 93*Unweighted Base
5 1 - - - - - - - - 5 15% 1% - - - - - - - - 5% 1%
150,000,000 VND orhigher
4 5 - - - - - - - - 4 54% 5% - - - - - - - - 4% 5%
75,000,000- 149,999,999VND
3 5 - - - - - - - - 3 53% 5% - - - - - - - - 3% 5%
45,000,000- 74,999,999VND
6 2 - - - - - - - - 6 26% 2% - - - - - - - - 6% 2%
30,000,000- 44,999,999VND
10 12 - - - - - - - - 10 1210% 13% - - - - - - - - 10% 13%
15,000,000- 29,999,999VND
21 31 - - - - - - - - 21 3121% 33% - - - - - - - - 21% 33%
7,500,000- 14,999,999VND
24 19 - - - - - - - - 24 1924% 20% - - - - - - - - 24% 20%
4,500,000- 7,499,999VND
14 6 - - - - - - - - 14 614% 6% - - - - - - - - 14% 6%
3,000,000- 4,499,999VND
4 3 - - - - - - - - 4 34% 3% - - - - - - - - 4% 3%
1,500,000- 2,999,999VND
2 3 - - - - - - - - 2 32% 3% - - - - - - - - 2% 3%
1- 1,499,999 VND
- - - - - - - - - - - -- - - - - - - - - - - -
No income/ expenditure
7 6 - - - - - - - - 7 67% 6% - - - - - - - - 7% 6%
Don’t Know/NA
100 93 - - - - - - - - 100 93100% 100% - - - - - - - - 100% 100%
Sigma
_________________________________________________________________________________________________________________Proportions/Means: Columns Tested (5% risk level) - A/B - C/D - E/F - G/H - I/J - K/L - A/C/E/G/I/K - B/D/F/H/J/LOverlap formulae used. * small base; ** very small base (under 30) ineligible for sig testing
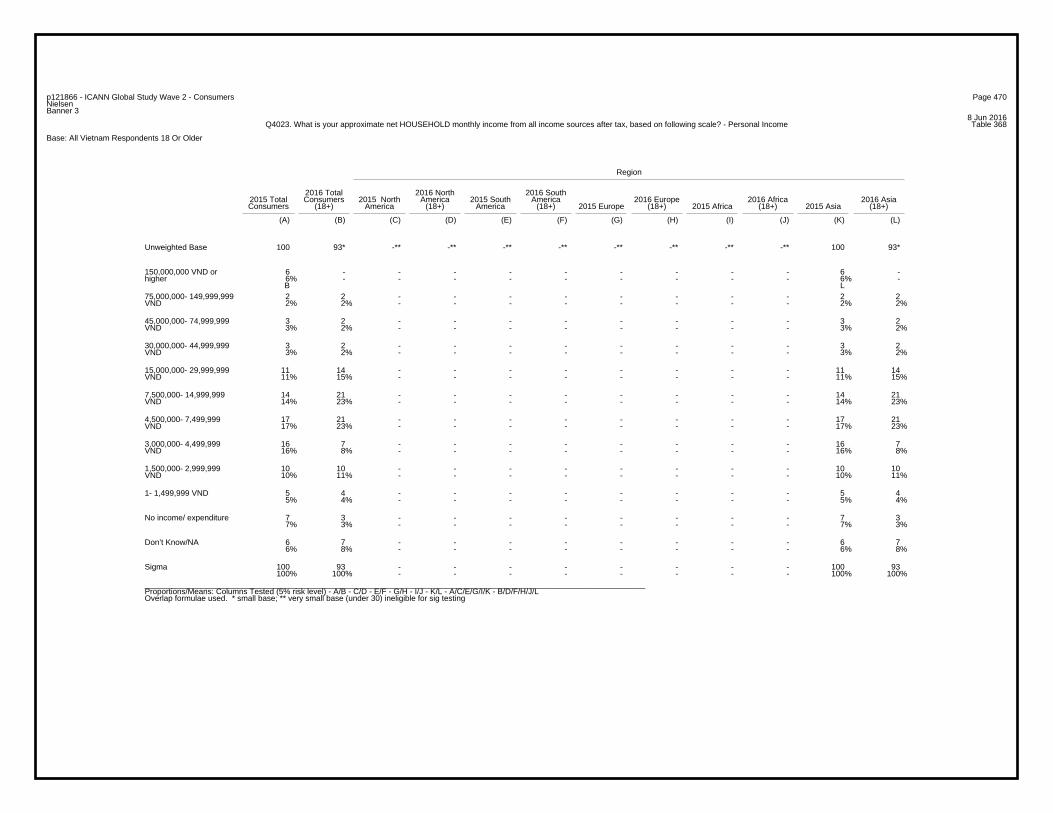
Page 470p121866 - ICANN Global Study Wave 2 - ConsumersNielsenBanner 3
8 Jun 2016Table 368Q4023. What is your approximate net HOUSEHOLD monthly income from all income sources after tax, based on following scale? - Personal Income
Base: All Vietnam Respondents 18 Or Older
Region
2016 Total 2016 North 2016 South2015 Total Consumers 2015 North America 2015 South America 2016 Europe 2016 Africa 2016 AsiaConsumers (18+) America (18+) America (18+) 2015 Europe (18+) 2015 Africa (18+) 2015 Asia (18+)
(A) (B) (C) (D) (E) (F) (G) (H) (I) (J) (K) (L)
100 93* -** -** -** -** -** -** -** -** 100 93*Unweighted Base
6 - - - - - - - - - 6 -6% - - - - - - - - - 6% - B L
150,000,000 VND orhigher
2 2 - - - - - - - - 2 22% 2% - - - - - - - - 2% 2%
75,000,000- 149,999,999VND
3 2 - - - - - - - - 3 23% 2% - - - - - - - - 3% 2%
45,000,000- 74,999,999VND
3 2 - - - - - - - - 3 23% 2% - - - - - - - - 3% 2%
30,000,000- 44,999,999VND
11 14 - - - - - - - - 11 1411% 15% - - - - - - - - 11% 15%
15,000,000- 29,999,999VND
14 21 - - - - - - - - 14 2114% 23% - - - - - - - - 14% 23%
7,500,000- 14,999,999VND
17 21 - - - - - - - - 17 2117% 23% - - - - - - - - 17% 23%
4,500,000- 7,499,999VND
16 7 - - - - - - - - 16 716% 8% - - - - - - - - 16% 8%
3,000,000- 4,499,999VND
10 10 - - - - - - - - 10 1010% 11% - - - - - - - - 10% 11%
1,500,000- 2,999,999VND
5 4 - - - - - - - - 5 45% 4% - - - - - - - - 5% 4%
1- 1,499,999 VND
7 3 - - - - - - - - 7 37% 3% - - - - - - - - 7% 3%
No income/ expenditure
6 7 - - - - - - - - 6 76% 8% - - - - - - - - 6% 8%
Don’t Know/NA
100 93 - - - - - - - - 100 93100% 100% - - - - - - - - 100% 100%
Sigma
_________________________________________________________________________________________________________________Proportions/Means: Columns Tested (5% risk level) - A/B - C/D - E/F - G/H - I/J - K/L - A/C/E/G/I/K - B/D/F/H/J/LOverlap formulae used. * small base; ** very small base (under 30) ineligible for sig testing
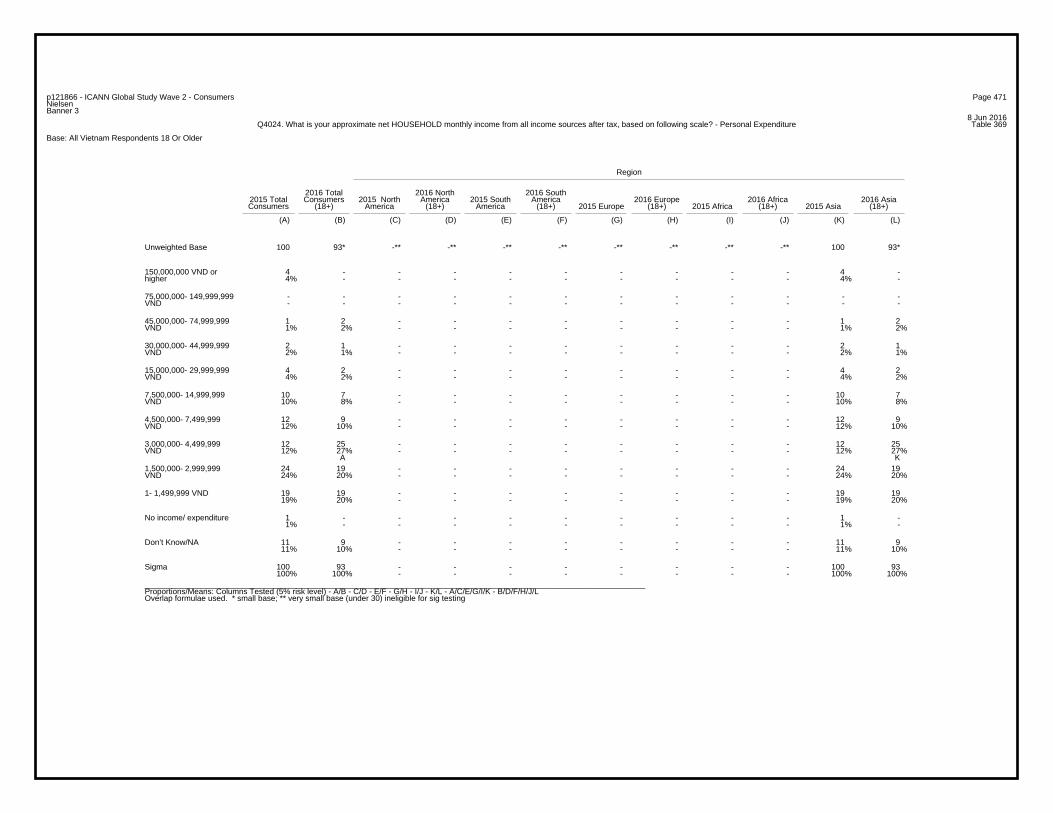
Page 471p121866 - ICANN Global Study Wave 2 - ConsumersNielsenBanner 3
8 Jun 2016Table 369Q4024. What is your approximate net HOUSEHOLD monthly income from all income sources after tax, based on following scale? - Personal Expenditure
Base: All Vietnam Respondents 18 Or Older
Region
2016 Total 2016 North 2016 South2015 Total Consumers 2015 North America 2015 South America 2016 Europe 2016 Africa 2016 AsiaConsumers (18+) America (18+) America (18+) 2015 Europe (18+) 2015 Africa (18+) 2015 Asia (18+)
(A) (B) (C) (D) (E) (F) (G) (H) (I) (J) (K) (L)
100 93* -** -** -** -** -** -** -** -** 100 93*Unweighted Base
4 - - - - - - - - - 4 -4% - - - - - - - - - 4% -
150,000,000 VND orhigher
- - - - - - - - - - - -- - - - - - - - - - - -
75,000,000- 149,999,999VND
1 2 - - - - - - - - 1 21% 2% - - - - - - - - 1% 2%
45,000,000- 74,999,999VND
2 1 - - - - - - - - 2 12% 1% - - - - - - - - 2% 1%
30,000,000- 44,999,999VND
4 2 - - - - - - - - 4 24% 2% - - - - - - - - 4% 2%
15,000,000- 29,999,999VND
10 7 - - - - - - - - 10 710% 8% - - - - - - - - 10% 8%
7,500,000- 14,999,999VND
12 9 - - - - - - - - 12 912% 10% - - - - - - - - 12% 10%
4,500,000- 7,499,999VND
12 25 - - - - - - - - 12 2512% 27% - - - - - - - - 12% 27%
A K
3,000,000- 4,499,999VND
24 19 - - - - - - - - 24 1924% 20% - - - - - - - - 24% 20%
1,500,000- 2,999,999VND
19 19 - - - - - - - - 19 1919% 20% - - - - - - - - 19% 20%
1- 1,499,999 VND
1 - - - - - - - - - 1 -1% - - - - - - - - - 1% -
No income/ expenditure
11 9 - - - - - - - - 11 911% 10% - - - - - - - - 11% 10%
Don’t Know/NA
100 93 - - - - - - - - 100 93100% 100% - - - - - - - - 100% 100%
Sigma
_________________________________________________________________________________________________________________Proportions/Means: Columns Tested (5% risk level) - A/B - C/D - E/F - G/H - I/J - K/L - A/C/E/G/I/K - B/D/F/H/J/LOverlap formulae used. * small base; ** very small base (under 30) ineligible for sig testing
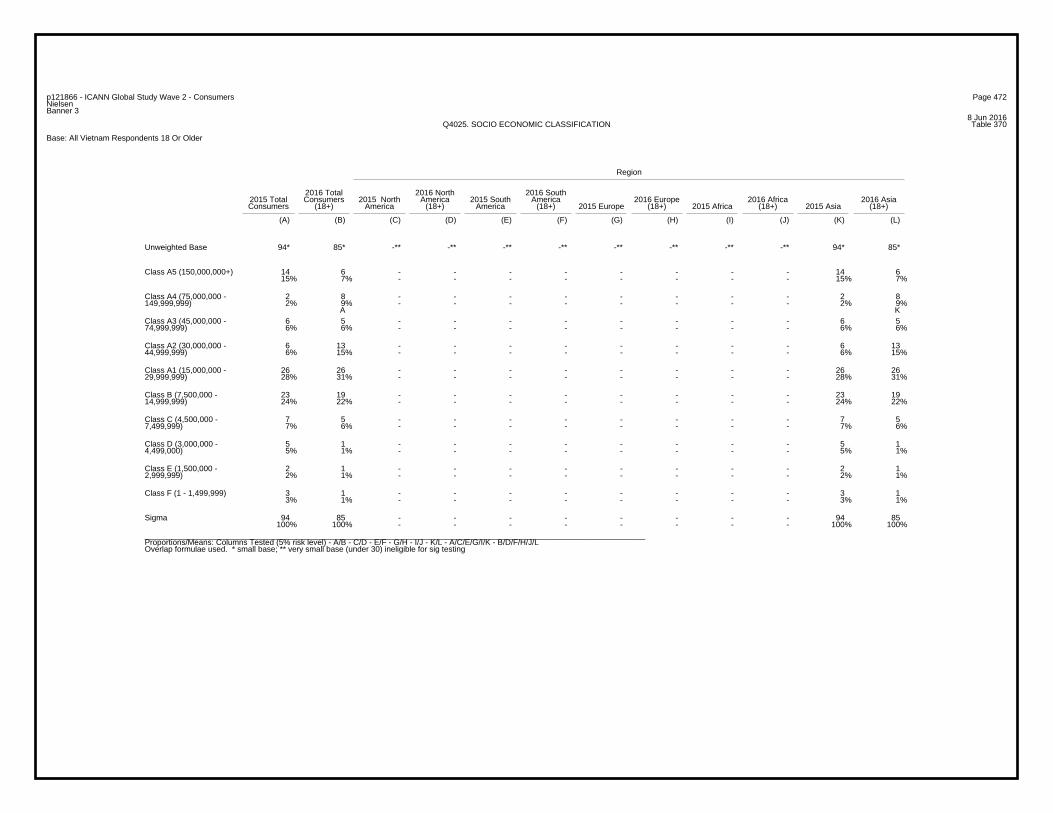
Page 472p121866 - ICANN Global Study Wave 2 - ConsumersNielsenBanner 3
8 Jun 2016Table 370Q4025. SOCIO ECONOMIC CLASSIFICATION
Base: All Vietnam Respondents 18 Or Older
Region
2016 Total 2016 North 2016 South2015 Total Consumers 2015 North America 2015 South America 2016 Europe 2016 Africa 2016 AsiaConsumers (18+) America (18+) America (18+) 2015 Europe (18+) 2015 Africa (18+) 2015 Asia (18+)
(A) (B) (C) (D) (E) (F) (G) (H) (I) (J) (K) (L)
94* 85* -** -** -** -** -** -** -** -** 94* 85*Unweighted Base
14 6 - - - - - - - - 14 615% 7% - - - - - - - - 15% 7%
Class A5 (150,000,000+)
2 8 - - - - - - - - 2 82% 9% - - - - - - - - 2% 9%
A K
Class A4 (75,000,000 -149,999,999)
6 5 - - - - - - - - 6 56% 6% - - - - - - - - 6% 6%
Class A3 (45,000,000 -74,999,999)
6 13 - - - - - - - - 6 136% 15% - - - - - - - - 6% 15%
Class A2 (30,000,000 -44,999,999)
26 26 - - - - - - - - 26 2628% 31% - - - - - - - - 28% 31%
Class A1 (15,000,000 -29,999,999)
23 19 - - - - - - - - 23 1924% 22% - - - - - - - - 24% 22%
Class B (7,500,000 -14,999,999)
7 5 - - - - - - - - 7 57% 6% - - - - - - - - 7% 6%
Class C (4,500,000 -7,499,999)
5 1 - - - - - - - - 5 15% 1% - - - - - - - - 5% 1%
Class D (3,000,000 -4,499,000)
2 1 - - - - - - - - 2 12% 1% - - - - - - - - 2% 1%
Class E (1,500,000 -2,999,999)
3 1 - - - - - - - - 3 13% 1% - - - - - - - - 3% 1%
Class F (1 - 1,499,999)
94 85 - - - - - - - - 94 85100% 100% - - - - - - - - 100% 100%
Sigma
_________________________________________________________________________________________________________________Proportions/Means: Columns Tested (5% risk level) - A/B - C/D - E/F - G/H - I/J - K/L - A/C/E/G/I/K - B/D/F/H/J/LOverlap formulae used. * small base; ** very small base (under 30) ineligible for sig testing
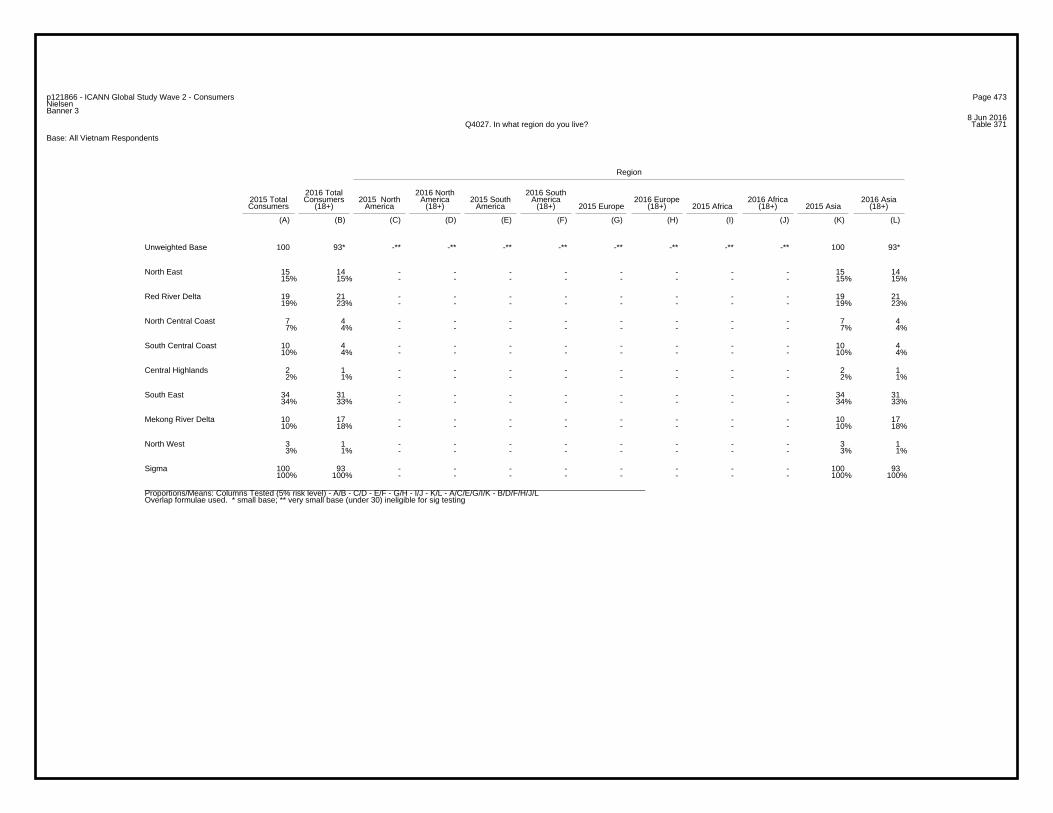
Page 473p121866 - ICANN Global Study Wave 2 - ConsumersNielsenBanner 3
8 Jun 2016Table 371Q4027. In what region do you live?
Base: All Vietnam Respondents
Region
2016 Total 2016 North 2016 South2015 Total Consumers 2015 North America 2015 South America 2016 Europe 2016 Africa 2016 AsiaConsumers (18+) America (18+) America (18+) 2015 Europe (18+) 2015 Africa (18+) 2015 Asia (18+)
(A) (B) (C) (D) (E) (F) (G) (H) (I) (J) (K) (L)
100 93* -** -** -** -** -** -** -** -** 100 93*Unweighted Base
15 14 - - - - - - - - 15 1415% 15% - - - - - - - - 15% 15%
North East
19 21 - - - - - - - - 19 2119% 23% - - - - - - - - 19% 23%
Red River Delta
7 4 - - - - - - - - 7 47% 4% - - - - - - - - 7% 4%
North Central Coast
10 4 - - - - - - - - 10 410% 4% - - - - - - - - 10% 4%
South Central Coast
2 1 - - - - - - - - 2 12% 1% - - - - - - - - 2% 1%
Central Highlands
34 31 - - - - - - - - 34 3134% 33% - - - - - - - - 34% 33%
South East
10 17 - - - - - - - - 10 1710% 18% - - - - - - - - 10% 18%
Mekong River Delta
3 1 - - - - - - - - 3 13% 1% - - - - - - - - 3% 1%
North West
100 93 - - - - - - - - 100 93100% 100% - - - - - - - - 100% 100%
Sigma
_________________________________________________________________________________________________________________Proportions/Means: Columns Tested (5% risk level) - A/B - C/D - E/F - G/H - I/J - K/L - A/C/E/G/I/K - B/D/F/H/J/LOverlap formulae used. * small base; ** very small base (under 30) ineligible for sig testing
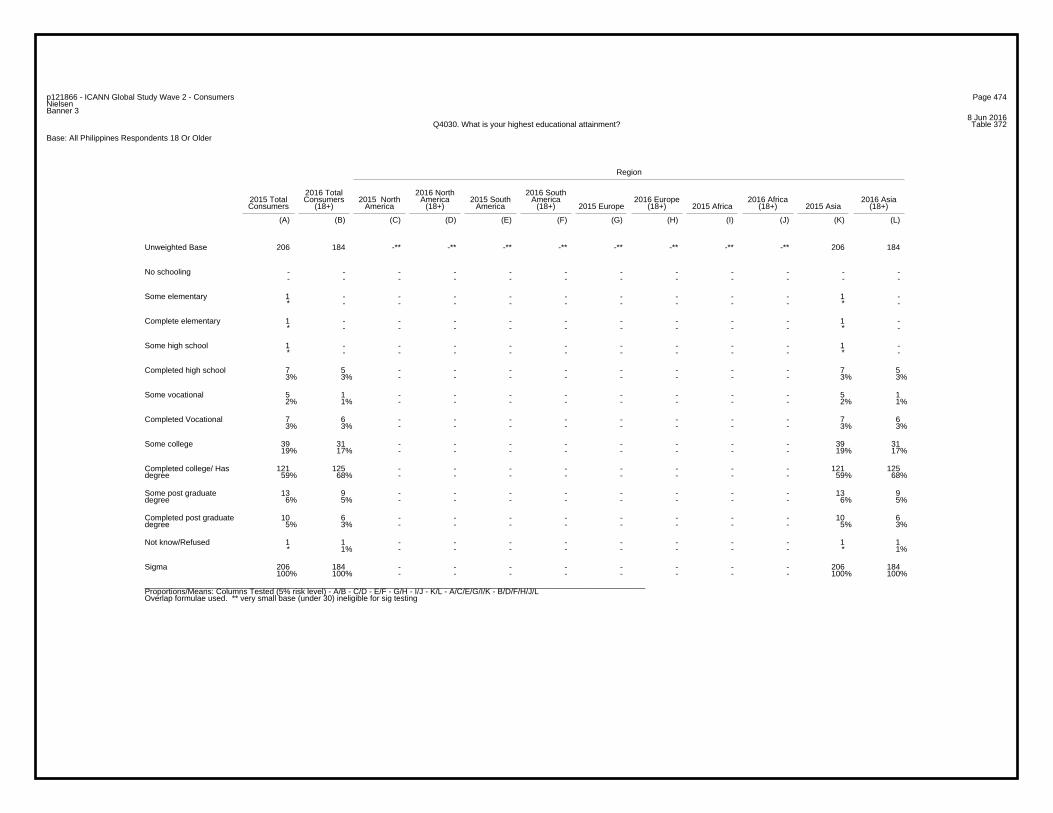
Page 474p121866 - ICANN Global Study Wave 2 - ConsumersNielsenBanner 3
8 Jun 2016Table 372Q4030. What is your highest educational attainment?
Base: All Philippines Respondents 18 Or Older
Region
2016 Total 2016 North 2016 South2015 Total Consumers 2015 North America 2015 South America 2016 Europe 2016 Africa 2016 AsiaConsumers (18+) America (18+) America (18+) 2015 Europe (18+) 2015 Africa (18+) 2015 Asia (18+)
(A) (B) (C) (D) (E) (F) (G) (H) (I) (J) (K) (L)
206 184 -** -** -** -** -** -** -** -** 206 184Unweighted Base
- - - - - - - - - - - -- - - - - - - - - - - -
No schooling
1 - - - - - - - - - 1 -* - - - - - - - - - * -
Some elementary
1 - - - - - - - - - 1 -* - - - - - - - - - * -
Complete elementary
1 - - - - - - - - - 1 -* - - - - - - - - - * -
Some high school
7 5 - - - - - - - - 7 53% 3% - - - - - - - - 3% 3%
Completed high school
5 1 - - - - - - - - 5 12% 1% - - - - - - - - 2% 1%
Some vocational
7 6 - - - - - - - - 7 63% 3% - - - - - - - - 3% 3%
Completed Vocational
39 31 - - - - - - - - 39 3119% 17% - - - - - - - - 19% 17%
Some college
121 125 - - - - - - - - 121 12559% 68% - - - - - - - - 59% 68%
Completed college/ Hasdegree
13 9 - - - - - - - - 13 96% 5% - - - - - - - - 6% 5%
Some post graduatedegree
10 6 - - - - - - - - 10 65% 3% - - - - - - - - 5% 3%
Completed post graduatedegree
1 1 - - - - - - - - 1 1* 1% - - - - - - - - * 1%
Not know/Refused
206 184 - - - - - - - - 206 184100% 100% - - - - - - - - 100% 100%
Sigma
_________________________________________________________________________________________________________________Proportions/Means: Columns Tested (5% risk level) - A/B - C/D - E/F - G/H - I/J - K/L - A/C/E/G/I/K - B/D/F/H/J/LOverlap formulae used. ** very small base (under 30) ineligible for sig testing
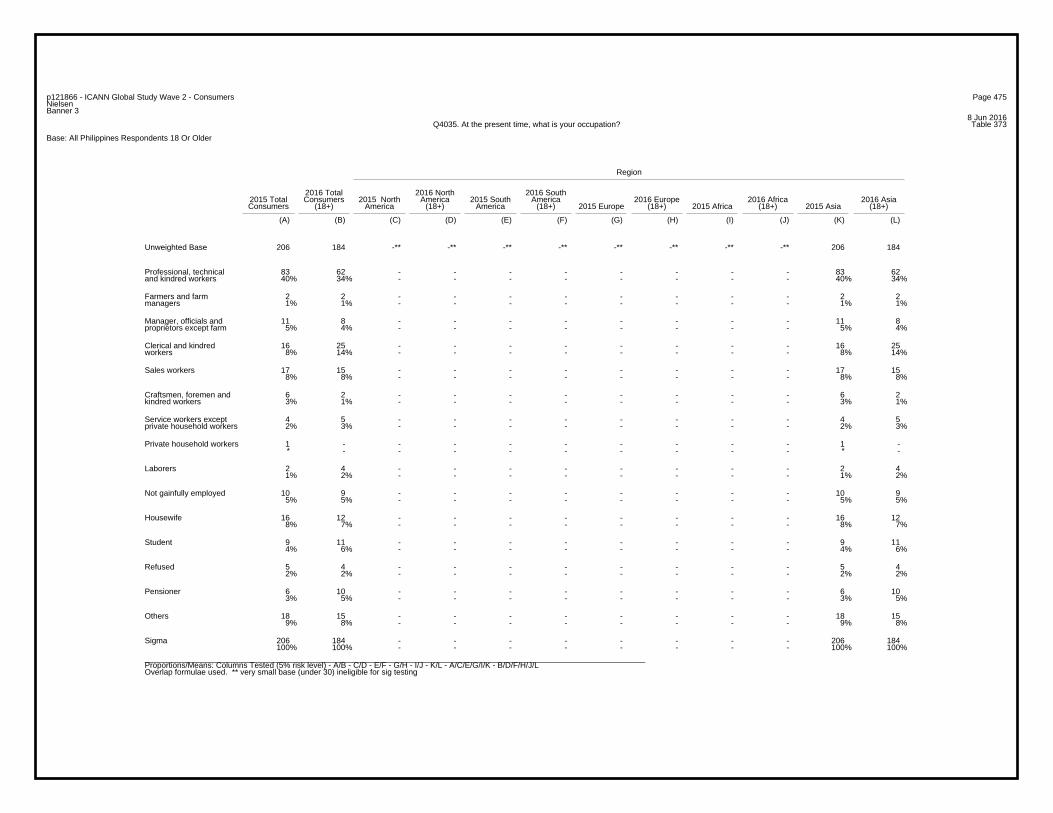
Page 475p121866 - ICANN Global Study Wave 2 - ConsumersNielsenBanner 3
8 Jun 2016Table 373Q4035. At the present time, what is your occupation?
Base: All Philippines Respondents 18 Or Older
Region
2016 Total 2016 North 2016 South2015 Total Consumers 2015 North America 2015 South America 2016 Europe 2016 Africa 2016 AsiaConsumers (18+) America (18+) America (18+) 2015 Europe (18+) 2015 Africa (18+) 2015 Asia (18+)
(A) (B) (C) (D) (E) (F) (G) (H) (I) (J) (K) (L)
206 184 -** -** -** -** -** -** -** -** 206 184Unweighted Base
83 62 - - - - - - - - 83 6240% 34% - - - - - - - - 40% 34%
Professional, technicaland kindred workers
2 2 - - - - - - - - 2 21% 1% - - - - - - - - 1% 1%
Farmers and farmmanagers
11 8 - - - - - - - - 11 85% 4% - - - - - - - - 5% 4%
Manager, officials andproprietors except farm
16 25 - - - - - - - - 16 258% 14% - - - - - - - - 8% 14%
Clerical and kindredworkers
17 15 - - - - - - - - 17 158% 8% - - - - - - - - 8% 8%
Sales workers
6 2 - - - - - - - - 6 23% 1% - - - - - - - - 3% 1%
Craftsmen, foremen andkindred workers
4 5 - - - - - - - - 4 52% 3% - - - - - - - - 2% 3%
Service workers exceptprivate household workers
1 - - - - - - - - - 1 -* - - - - - - - - - * -
Private household workers
2 4 - - - - - - - - 2 41% 2% - - - - - - - - 1% 2%
Laborers
10 9 - - - - - - - - 10 95% 5% - - - - - - - - 5% 5%
Not gainfully employed
16 12 - - - - - - - - 16 128% 7% - - - - - - - - 8% 7%
Housewife
9 11 - - - - - - - - 9 114% 6% - - - - - - - - 4% 6%
Student
5 4 - - - - - - - - 5 42% 2% - - - - - - - - 2% 2%
Refused
6 10 - - - - - - - - 6 103% 5% - - - - - - - - 3% 5%
Pensioner
18 15 - - - - - - - - 18 159% 8% - - - - - - - - 9% 8%
Others
206 184 - - - - - - - - 206 184100% 100% - - - - - - - - 100% 100%
Sigma
_________________________________________________________________________________________________________________Proportions/Means: Columns Tested (5% risk level) - A/B - C/D - E/F - G/H - I/J - K/L - A/C/E/G/I/K - B/D/F/H/J/LOverlap formulae used. ** very small base (under 30) ineligible for sig testing
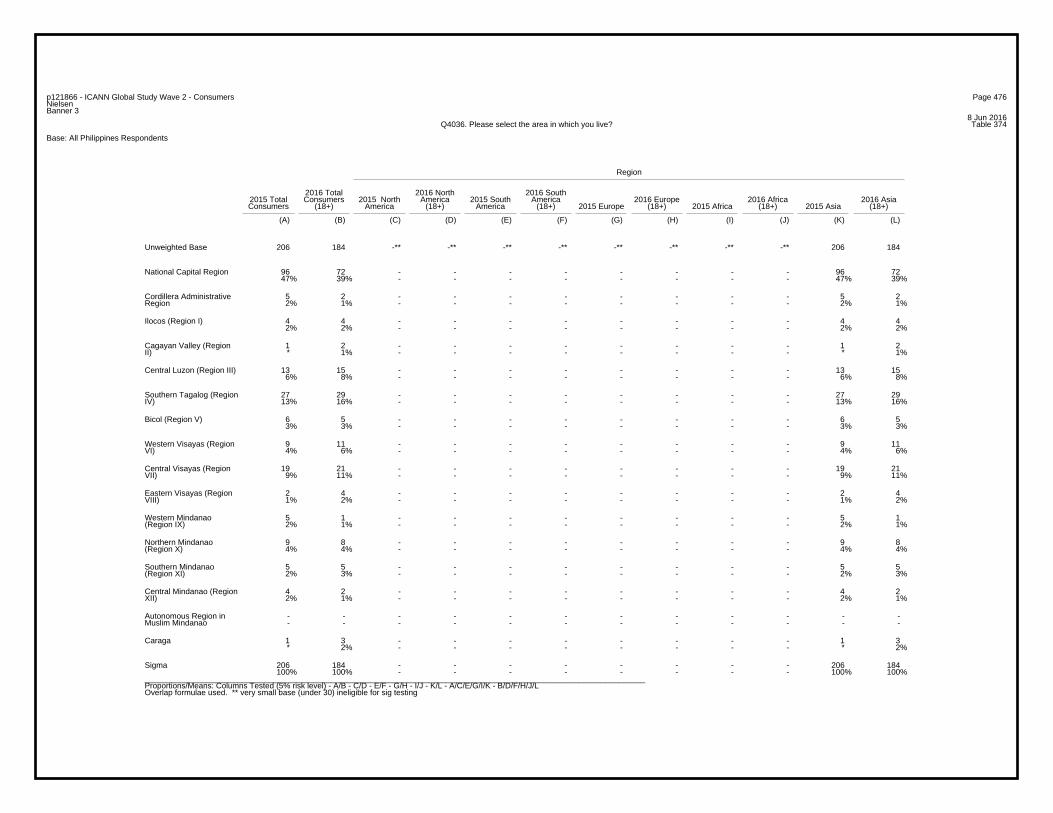
Page 476p121866 - ICANN Global Study Wave 2 - ConsumersNielsenBanner 3
8 Jun 2016Table 374Q4036. Please select the area in which you live?
Base: All Philippines Respondents
Region
2016 Total 2016 North 2016 South2015 Total Consumers 2015 North America 2015 South America 2016 Europe 2016 Africa 2016 AsiaConsumers (18+) America (18+) America (18+) 2015 Europe (18+) 2015 Africa (18+) 2015 Asia (18+)
(A) (B) (C) (D) (E) (F) (G) (H) (I) (J) (K) (L)
206 184 -** -** -** -** -** -** -** -** 206 184Unweighted Base
96 72 - - - - - - - - 96 7247% 39% - - - - - - - - 47% 39%
National Capital Region
5 2 - - - - - - - - 5 22% 1% - - - - - - - - 2% 1%
Cordillera AdministrativeRegion
4 4 - - - - - - - - 4 42% 2% - - - - - - - - 2% 2%
Ilocos (Region I)
1 2 - - - - - - - - 1 2* 1% - - - - - - - - * 1%
Cagayan Valley (RegionII)
13 15 - - - - - - - - 13 156% 8% - - - - - - - - 6% 8%
Central Luzon (Region III)
27 29 - - - - - - - - 27 2913% 16% - - - - - - - - 13% 16%
Southern Tagalog (RegionIV)
6 5 - - - - - - - - 6 53% 3% - - - - - - - - 3% 3%
Bicol (Region V)
9 11 - - - - - - - - 9 114% 6% - - - - - - - - 4% 6%
Western Visayas (RegionVI)
19 21 - - - - - - - - 19 219% 11% - - - - - - - - 9% 11%
Central Visayas (RegionVII)
2 4 - - - - - - - - 2 41% 2% - - - - - - - - 1% 2%
Eastern Visayas (RegionVIII)
5 1 - - - - - - - - 5 12% 1% - - - - - - - - 2% 1%
Western Mindanao(Region IX)
9 8 - - - - - - - - 9 84% 4% - - - - - - - - 4% 4%
Northern Mindanao(Region X)
5 5 - - - - - - - - 5 52% 3% - - - - - - - - 2% 3%
Southern Mindanao(Region XI)
4 2 - - - - - - - - 4 22% 1% - - - - - - - - 2% 1%
Central Mindanao (RegionXII)
- - - - - - - - - - - -- - - - - - - - - - - -
Autonomous Region inMuslim Mindanao
1 3 - - - - - - - - 1 3* 2% - - - - - - - - * 2%
Caraga
206 184 - - - - - - - - 206 184100% 100% - - - - - - - - 100% 100%
Sigma
_________________________________________________________________________________________________________________Proportions/Means: Columns Tested (5% risk level) - A/B - C/D - E/F - G/H - I/J - K/L - A/C/E/G/I/K - B/D/F/H/J/LOverlap formulae used. ** very small base (under 30) ineligible for sig testing
Page 477p121866 - ICANN Global Study Wave 2 - ConsumersNielsenBanner 3
8 Jun 2016Table 374Q4036. Please select the area in which you live?
Base: All Philippines Respondents
Region
2016 Total 2016 North 2016 South2015 Total Consumers 2015 North America 2015 South America 2016 Europe 2016 Africa 2016 AsiaConsumers (18+) America (18+) America (18+) 2015 Europe (18+) 2015 Africa (18+) 2015 Asia (18+)
(A) (B) (C) (D) (E) (F) (G) (H) (I) (J) (K) (L)
206 184 -** -** -** -** -** -** -** -** 206 184Unweighted Base_________________________________________________________________________________________________________________Proportions/Means: Columns Tested (5% risk level) - A/B - C/D - E/F - G/H - I/J - K/L - A/C/E/G/I/K - B/D/F/H/J/LOverlap formulae used. ** very small base (under 30) ineligible for sig testing
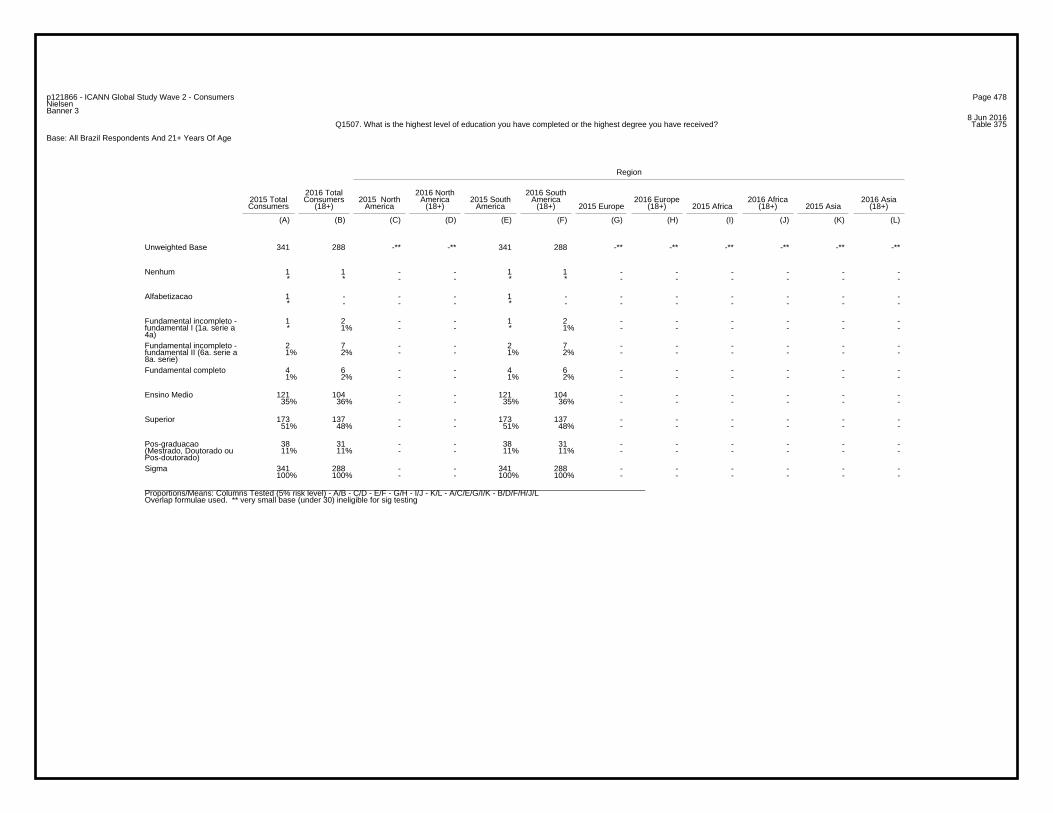
Page 478p121866 - ICANN Global Study Wave 2 - ConsumersNielsenBanner 3
8 Jun 2016Table 375Q1507. What is the highest level of education you have completed or the highest degree you have received?
Base: All Brazil Respondents And 21+ Years Of Age
Region
2016 Total 2016 North 2016 South2015 Total Consumers 2015 North America 2015 South America 2016 Europe 2016 Africa 2016 AsiaConsumers (18+) America (18+) America (18+) 2015 Europe (18+) 2015 Africa (18+) 2015 Asia (18+)
(A) (B) (C) (D) (E) (F) (G) (H) (I) (J) (K) (L)
341 288 -** -** 341 288 -** -** -** -** -** -**Unweighted Base
1 1 - - 1 1 - - - - - -* * - - * * - - - - - -
Nenhum
1 - - - 1 - - - - - - -* - - - * - - - - - - -
Alfabetizacao
1 2 - - 1 2 - - - - - -* 1% - - * 1% - - - - - -
Fundamental incompleto -fundamental I (1a. serie a4a)
2 7 - - 2 7 - - - - - -1% 2% - - 1% 2% - - - - - -
Fundamental incompleto -fundamental II (6a. serie a8a. serie)
4 6 - - 4 6 - - - - - -1% 2% - - 1% 2% - - - - - -
Fundamental completo
121 104 - - 121 104 - - - - - -35% 36% - - 35% 36% - - - - - -
Ensino Medio
173 137 - - 173 137 - - - - - -51% 48% - - 51% 48% - - - - - -
Superior
38 31 - - 38 31 - - - - - -11% 11% - - 11% 11% - - - - - -
Pos-graduacao(Mestrado, Doutorado ouPos-doutorado)
341 288 - - 341 288 - - - - - -100% 100% - - 100% 100% - - - - - -
Sigma
_________________________________________________________________________________________________________________Proportions/Means: Columns Tested (5% risk level) - A/B - C/D - E/F - G/H - I/J - K/L - A/C/E/G/I/K - B/D/F/H/J/LOverlap formulae used. ** very small base (under 30) ineligible for sig testing
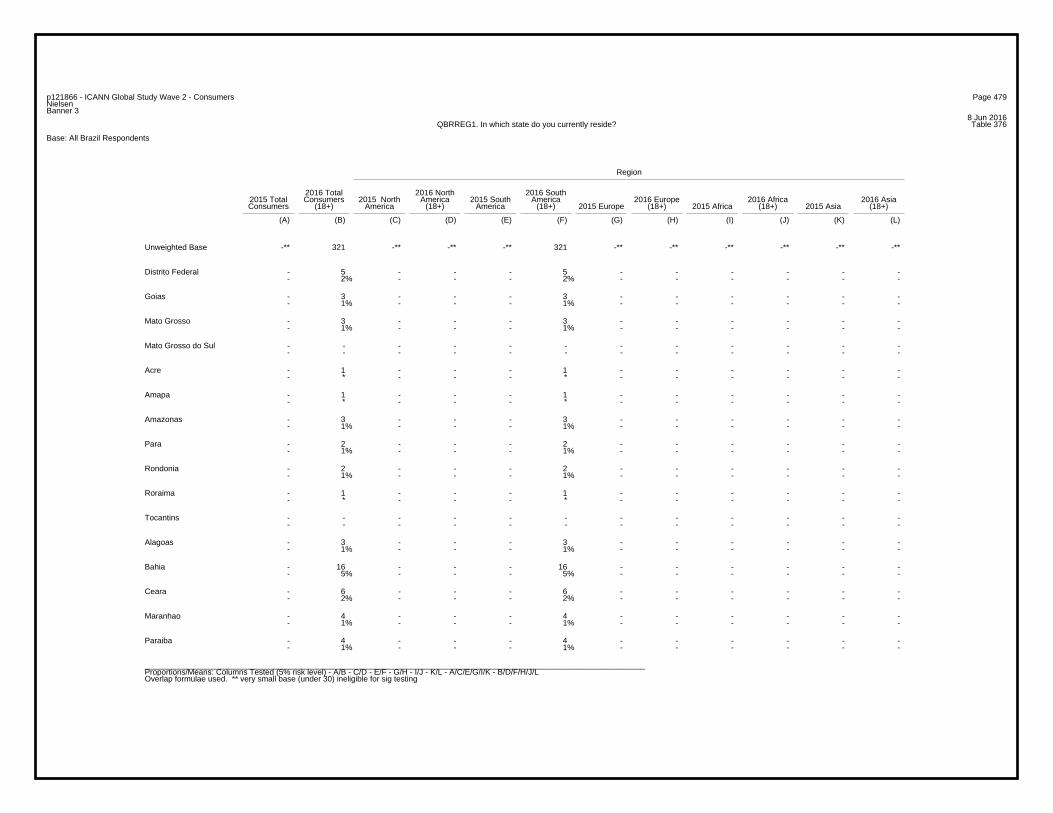
Page 479p121866 - ICANN Global Study Wave 2 - ConsumersNielsenBanner 3
8 Jun 2016Table 376QBRREG1. In which state do you currently reside?
Base: All Brazil Respondents
Region
2016 Total 2016 North 2016 South2015 Total Consumers 2015 North America 2015 South America 2016 Europe 2016 Africa 2016 AsiaConsumers (18+) America (18+) America (18+) 2015 Europe (18+) 2015 Africa (18+) 2015 Asia (18+)
(A) (B) (C) (D) (E) (F) (G) (H) (I) (J) (K) (L)
-** 321 -** -** -** 321 -** -** -** -** -** -**Unweighted Base
- 5 - - - 5 - - - - - -- 2% - - - 2% - - - - - -
Distrito Federal
- 3 - - - 3 - - - - - -- 1% - - - 1% - - - - - -
Goias
- 3 - - - 3 - - - - - -- 1% - - - 1% - - - - - -
Mato Grosso
- - - - - - - - - - - -- - - - - - - - - - - -
Mato Grosso do Sul
- 1 - - - 1 - - - - - -- * - - - * - - - - - -
Acre
- 1 - - - 1 - - - - - -- * - - - * - - - - - -
Amapa
- 3 - - - 3 - - - - - -- 1% - - - 1% - - - - - -
Amazonas
- 2 - - - 2 - - - - - -- 1% - - - 1% - - - - - -
Para
- 2 - - - 2 - - - - - -- 1% - - - 1% - - - - - -
Rondonia
- 1 - - - 1 - - - - - -- * - - - * - - - - - -
Roraima
- - - - - - - - - - - -- - - - - - - - - - - -
Tocantins
- 3 - - - 3 - - - - - -- 1% - - - 1% - - - - - -
Alagoas
- 16 - - - 16 - - - - - -- 5% - - - 5% - - - - - -
Bahia
- 6 - - - 6 - - - - - -- 2% - - - 2% - - - - - -
Ceara
- 4 - - - 4 - - - - - -- 1% - - - 1% - - - - - -
Maranhao
- 4 - - - 4 - - - - - -- 1% - - - 1% - - - - - -
Paraiba
_________________________________________________________________________________________________________________Proportions/Means: Columns Tested (5% risk level) - A/B - C/D - E/F - G/H - I/J - K/L - A/C/E/G/I/K - B/D/F/H/J/LOverlap formulae used. ** very small base (under 30) ineligible for sig testing
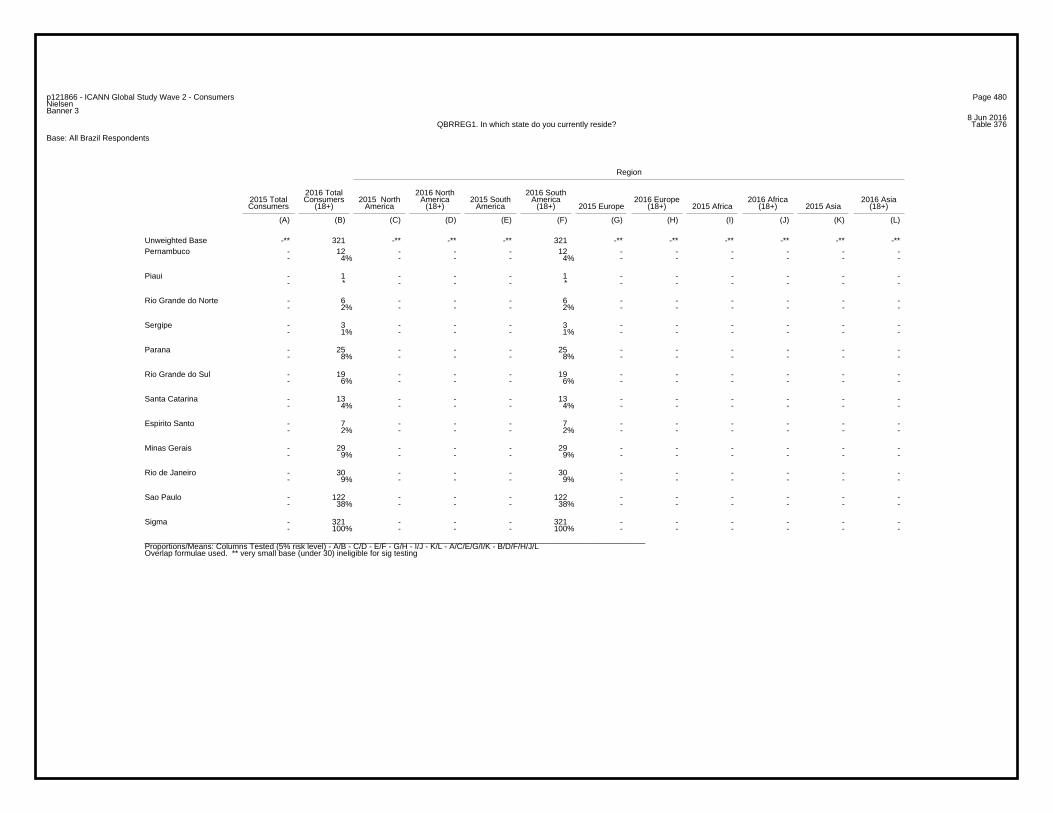
Page 480p121866 - ICANN Global Study Wave 2 - ConsumersNielsenBanner 3
8 Jun 2016Table 376QBRREG1. In which state do you currently reside?
Base: All Brazil Respondents
Region
2016 Total 2016 North 2016 South2015 Total Consumers 2015 North America 2015 South America 2016 Europe 2016 Africa 2016 AsiaConsumers (18+) America (18+) America (18+) 2015 Europe (18+) 2015 Africa (18+) 2015 Asia (18+)
(A) (B) (C) (D) (E) (F) (G) (H) (I) (J) (K) (L)
-** 321 -** -** -** 321 -** -** -** -** -** -**Unweighted Base- 12 - - - 12 - - - - - -- 4% - - - 4% - - - - - -
Pernambuco
- 1 - - - 1 - - - - - -- * - - - * - - - - - -
Piaui
- 6 - - - 6 - - - - - -- 2% - - - 2% - - - - - -
Rio Grande do Norte
- 3 - - - 3 - - - - - -- 1% - - - 1% - - - - - -
Sergipe
- 25 - - - 25 - - - - - -- 8% - - - 8% - - - - - -
Parana
- 19 - - - 19 - - - - - -- 6% - - - 6% - - - - - -
Rio Grande do Sul
- 13 - - - 13 - - - - - -- 4% - - - 4% - - - - - -
Santa Catarina
- 7 - - - 7 - - - - - -- 2% - - - 2% - - - - - -
Espirito Santo
- 29 - - - 29 - - - - - -- 9% - - - 9% - - - - - -
Minas Gerais
- 30 - - - 30 - - - - - -- 9% - - - 9% - - - - - -
Rio de Janeiro
- 122 - - - 122 - - - - - -- 38% - - - 38% - - - - - -
Sao Paulo
- 321 - - - 321 - - - - - -- 100% - - - 100% - - - - - -
Sigma
_________________________________________________________________________________________________________________Proportions/Means: Columns Tested (5% risk level) - A/B - C/D - E/F - G/H - I/J - K/L - A/C/E/G/I/K - B/D/F/H/J/LOverlap formulae used. ** very small base (under 30) ineligible for sig testing
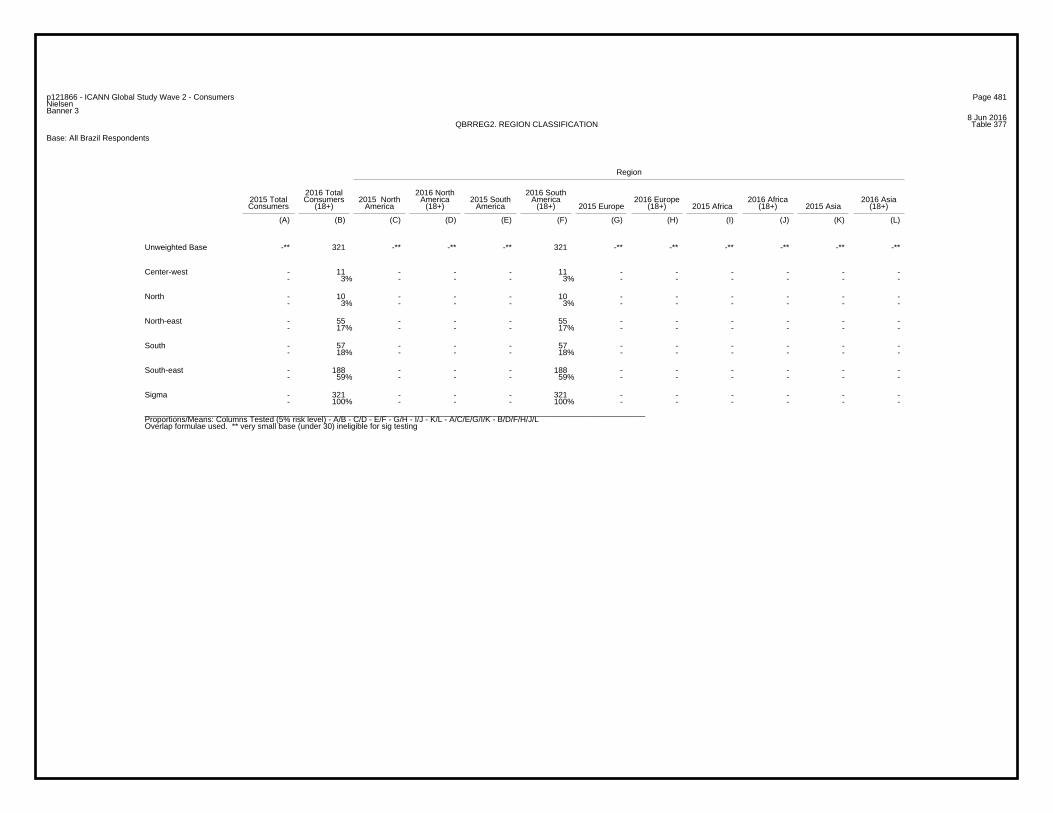
Page 481p121866 - ICANN Global Study Wave 2 - ConsumersNielsenBanner 3
8 Jun 2016Table 377QBRREG2. REGION CLASSIFICATION
Base: All Brazil Respondents
Region
2016 Total 2016 North 2016 South2015 Total Consumers 2015 North America 2015 South America 2016 Europe 2016 Africa 2016 AsiaConsumers (18+) America (18+) America (18+) 2015 Europe (18+) 2015 Africa (18+) 2015 Asia (18+)
(A) (B) (C) (D) (E) (F) (G) (H) (I) (J) (K) (L)
-** 321 -** -** -** 321 -** -** -** -** -** -**Unweighted Base
- 11 - - - 11 - - - - - -- 3% - - - 3% - - - - - -
Center-west
- 10 - - - 10 - - - - - -- 3% - - - 3% - - - - - -
North
- 55 - - - 55 - - - - - -- 17% - - - 17% - - - - - -
North-east
- 57 - - - 57 - - - - - -- 18% - - - 18% - - - - - -
South
- 188 - - - 188 - - - - - -- 59% - - - 59% - - - - - -
South-east
- 321 - - - 321 - - - - - -- 100% - - - 100% - - - - - -
Sigma
_________________________________________________________________________________________________________________Proportions/Means: Columns Tested (5% risk level) - A/B - C/D - E/F - G/H - I/J - K/L - A/C/E/G/I/K - B/D/F/H/J/LOverlap formulae used. ** very small base (under 30) ineligible for sig testing
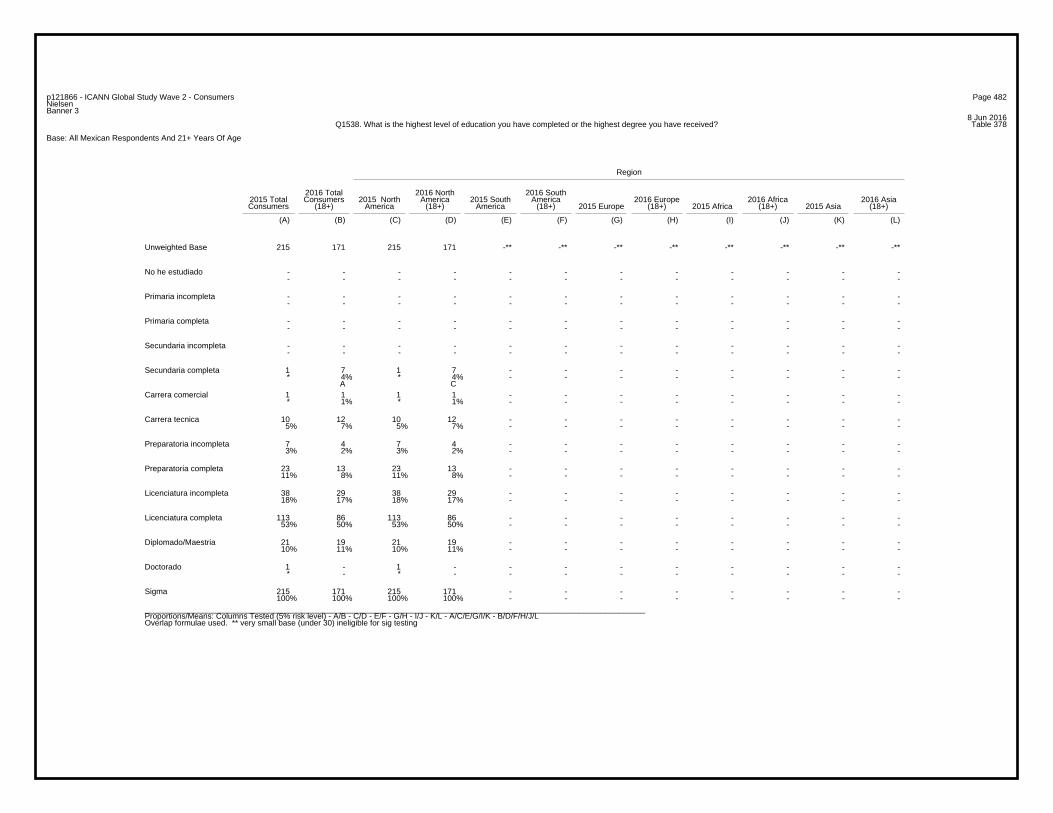
Page 482p121866 - ICANN Global Study Wave 2 - ConsumersNielsenBanner 3
8 Jun 2016Table 378Q1538. What is the highest level of education you have completed or the highest degree you have received?
Base: All Mexican Respondents And 21+ Years Of Age
Region
2016 Total 2016 North 2016 South2015 Total Consumers 2015 North America 2015 South America 2016 Europe 2016 Africa 2016 AsiaConsumers (18+) America (18+) America (18+) 2015 Europe (18+) 2015 Africa (18+) 2015 Asia (18+)
(A) (B) (C) (D) (E) (F) (G) (H) (I) (J) (K) (L)
215 171 215 171 -** -** -** -** -** -** -** -**Unweighted Base
- - - - - - - - - - - -- - - - - - - - - - - -
No he estudiado
- - - - - - - - - - - -- - - - - - - - - - - -
Primaria incompleta
- - - - - - - - - - - -- - - - - - - - - - - -
Primaria completa
- - - - - - - - - - - -- - - - - - - - - - - -
Secundaria incompleta
1 7 1 7 - - - - - - - -* 4% * 4% - - - - - - - -
A C
Secundaria completa
1 1 1 1 - - - - - - - -* 1% * 1% - - - - - - - -
Carrera comercial
10 12 10 12 - - - - - - - -5% 7% 5% 7% - - - - - - - -
Carrera tecnica
7 4 7 4 - - - - - - - -3% 2% 3% 2% - - - - - - - -
Preparatoria incompleta
23 13 23 13 - - - - - - - -11% 8% 11% 8% - - - - - - - -
Preparatoria completa
38 29 38 29 - - - - - - - -18% 17% 18% 17% - - - - - - - -
Licenciatura incompleta
113 86 113 86 - - - - - - - -53% 50% 53% 50% - - - - - - - -
Licenciatura completa
21 19 21 19 - - - - - - - -10% 11% 10% 11% - - - - - - - -
Diplomado/Maestria
1 - 1 - - - - - - - - -* - * - - - - - - - - -
Doctorado
215 171 215 171 - - - - - - - -100% 100% 100% 100% - - - - - - - -
Sigma
_________________________________________________________________________________________________________________Proportions/Means: Columns Tested (5% risk level) - A/B - C/D - E/F - G/H - I/J - K/L - A/C/E/G/I/K - B/D/F/H/J/LOverlap formulae used. ** very small base (under 30) ineligible for sig testing
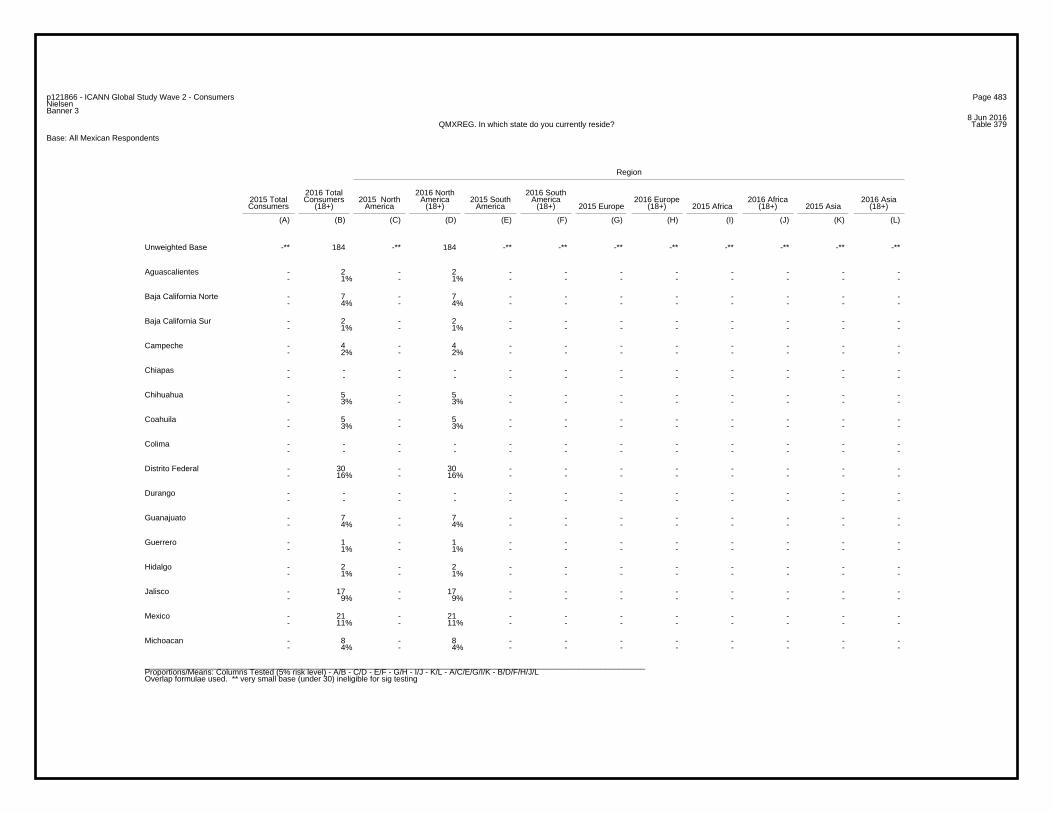
Page 483p121866 - ICANN Global Study Wave 2 - ConsumersNielsenBanner 3
8 Jun 2016Table 379QMXREG. In which state do you currently reside?
Base: All Mexican Respondents
Region
2016 Total 2016 North 2016 South2015 Total Consumers 2015 North America 2015 South America 2016 Europe 2016 Africa 2016 AsiaConsumers (18+) America (18+) America (18+) 2015 Europe (18+) 2015 Africa (18+) 2015 Asia (18+)
(A) (B) (C) (D) (E) (F) (G) (H) (I) (J) (K) (L)
-** 184 -** 184 -** -** -** -** -** -** -** -**Unweighted Base
- 2 - 2 - - - - - - - -- 1% - 1% - - - - - - - -
Aguascalientes
- 7 - 7 - - - - - - - -- 4% - 4% - - - - - - - -
Baja California Norte
- 2 - 2 - - - - - - - -- 1% - 1% - - - - - - - -
Baja California Sur
- 4 - 4 - - - - - - - -- 2% - 2% - - - - - - - -
Campeche
- - - - - - - - - - - -- - - - - - - - - - - -
Chiapas
- 5 - 5 - - - - - - - -- 3% - 3% - - - - - - - -
Chihuahua
- 5 - 5 - - - - - - - -- 3% - 3% - - - - - - - -
Coahuila
- - - - - - - - - - - -- - - - - - - - - - - -
Colima
- 30 - 30 - - - - - - - -- 16% - 16% - - - - - - - -
Distrito Federal
- - - - - - - - - - - -- - - - - - - - - - - -
Durango
- 7 - 7 - - - - - - - -- 4% - 4% - - - - - - - -
Guanajuato
- 1 - 1 - - - - - - - -- 1% - 1% - - - - - - - -
Guerrero
- 2 - 2 - - - - - - - -- 1% - 1% - - - - - - - -
Hidalgo
- 17 - 17 - - - - - - - -- 9% - 9% - - - - - - - -
Jalisco
- 21 - 21 - - - - - - - -- 11% - 11% - - - - - - - -
Mexico
- 8 - 8 - - - - - - - -- 4% - 4% - - - - - - - -
Michoacan
_________________________________________________________________________________________________________________Proportions/Means: Columns Tested (5% risk level) - A/B - C/D - E/F - G/H - I/J - K/L - A/C/E/G/I/K - B/D/F/H/J/LOverlap formulae used. ** very small base (under 30) ineligible for sig testing
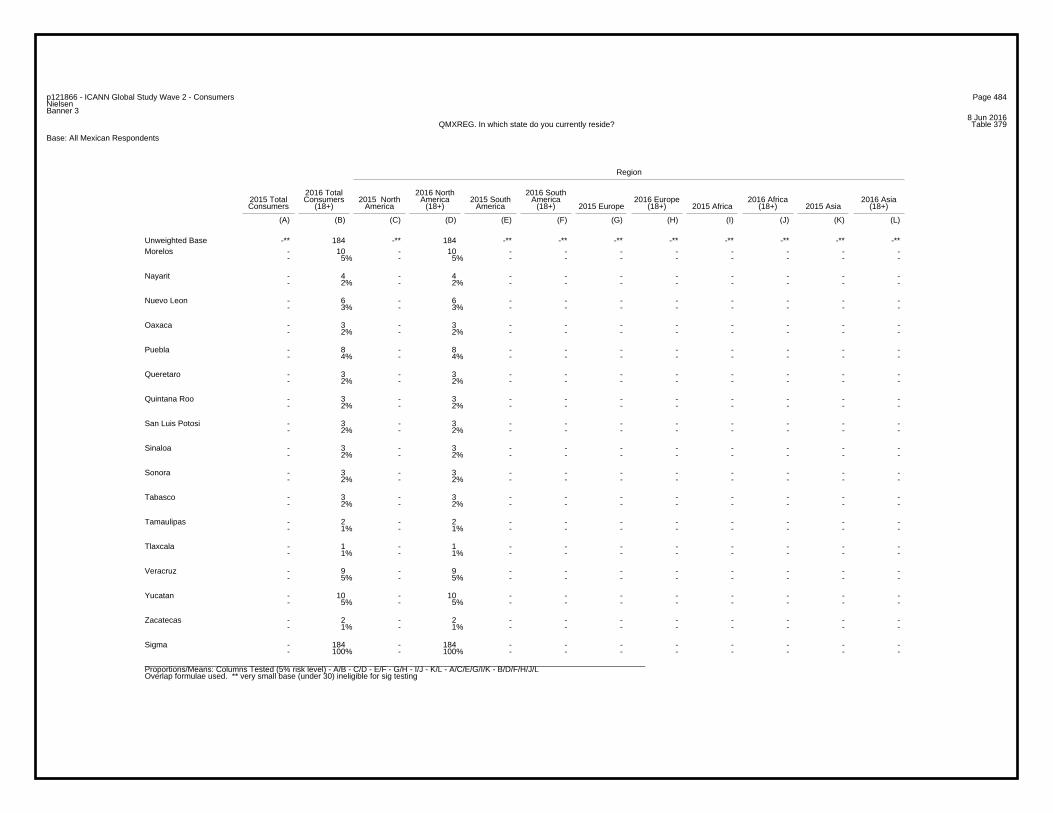
Page 484p121866 - ICANN Global Study Wave 2 - ConsumersNielsenBanner 3
8 Jun 2016Table 379QMXREG. In which state do you currently reside?
Base: All Mexican Respondents
Region
2016 Total 2016 North 2016 South2015 Total Consumers 2015 North America 2015 South America 2016 Europe 2016 Africa 2016 AsiaConsumers (18+) America (18+) America (18+) 2015 Europe (18+) 2015 Africa (18+) 2015 Asia (18+)
(A) (B) (C) (D) (E) (F) (G) (H) (I) (J) (K) (L)
-** 184 -** 184 -** -** -** -** -** -** -** -**Unweighted Base- 10 - 10 - - - - - - - -- 5% - 5% - - - - - - - -
Morelos
- 4 - 4 - - - - - - - -- 2% - 2% - - - - - - - -
Nayarit
- 6 - 6 - - - - - - - -- 3% - 3% - - - - - - - -
Nuevo Leon
- 3 - 3 - - - - - - - -- 2% - 2% - - - - - - - -
Oaxaca
- 8 - 8 - - - - - - - -- 4% - 4% - - - - - - - -
Puebla
- 3 - 3 - - - - - - - -- 2% - 2% - - - - - - - -
Queretaro
- 3 - 3 - - - - - - - -- 2% - 2% - - - - - - - -
Quintana Roo
- 3 - 3 - - - - - - - -- 2% - 2% - - - - - - - -
San Luis Potosi
- 3 - 3 - - - - - - - -- 2% - 2% - - - - - - - -
Sinaloa
- 3 - 3 - - - - - - - -- 2% - 2% - - - - - - - -
Sonora
- 3 - 3 - - - - - - - -- 2% - 2% - - - - - - - -
Tabasco
- 2 - 2 - - - - - - - -- 1% - 1% - - - - - - - -
Tamaulipas
- 1 - 1 - - - - - - - -- 1% - 1% - - - - - - - -
Tlaxcala
- 9 - 9 - - - - - - - -- 5% - 5% - - - - - - - -
Veracruz
- 10 - 10 - - - - - - - -- 5% - 5% - - - - - - - -
Yucatan
- 2 - 2 - - - - - - - -- 1% - 1% - - - - - - - -
Zacatecas
- 184 - 184 - - - - - - - -- 100% - 100% - - - - - - - -
Sigma
_________________________________________________________________________________________________________________Proportions/Means: Columns Tested (5% risk level) - A/B - C/D - E/F - G/H - I/J - K/L - A/C/E/G/I/K - B/D/F/H/J/LOverlap formulae used. ** very small base (under 30) ineligible for sig testing
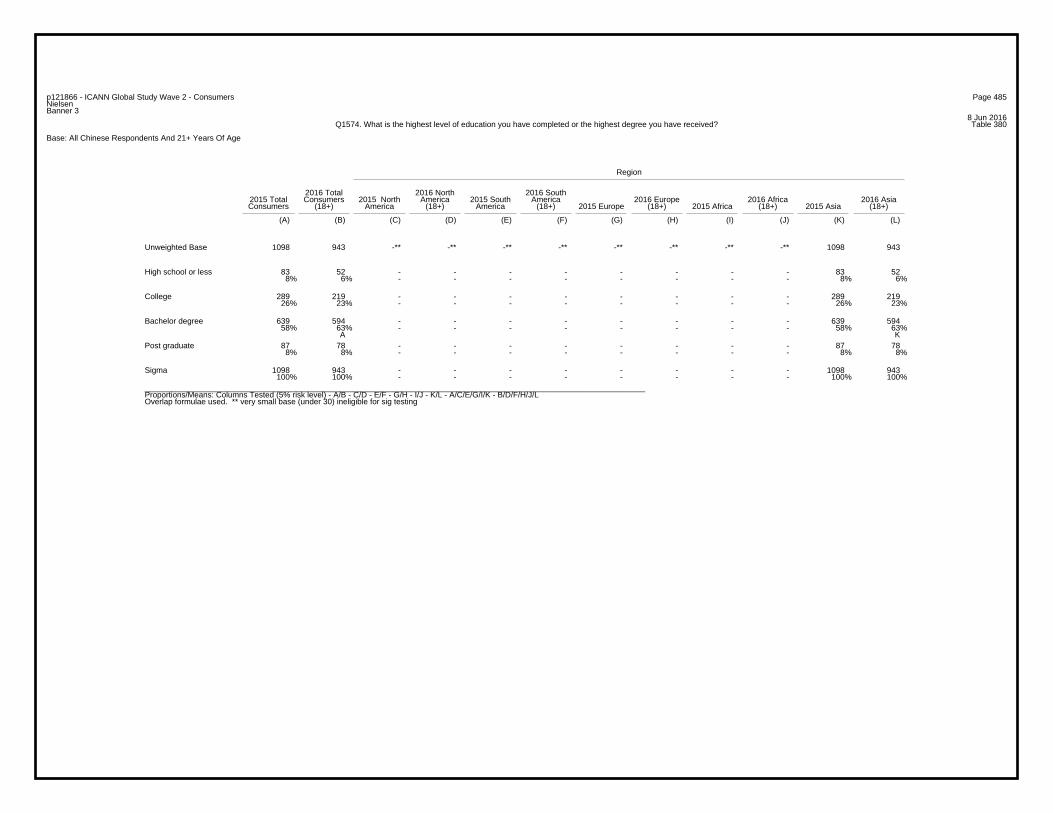
Page 485p121866 - ICANN Global Study Wave 2 - ConsumersNielsenBanner 3
8 Jun 2016Table 380Q1574. What is the highest level of education you have completed or the highest degree you have received?
Base: All Chinese Respondents And 21+ Years Of Age
Region
2016 Total 2016 North 2016 South2015 Total Consumers 2015 North America 2015 South America 2016 Europe 2016 Africa 2016 AsiaConsumers (18+) America (18+) America (18+) 2015 Europe (18+) 2015 Africa (18+) 2015 Asia (18+)
(A) (B) (C) (D) (E) (F) (G) (H) (I) (J) (K) (L)
1098 943 -** -** -** -** -** -** -** -** 1098 943Unweighted Base
83 52 - - - - - - - - 83 528% 6% - - - - - - - - 8% 6%
High school or less
289 219 - - - - - - - - 289 21926% 23% - - - - - - - - 26% 23%
College
639 594 - - - - - - - - 639 59458% 63% - - - - - - - - 58% 63%
A K
Bachelor degree
87 78 - - - - - - - - 87 788% 8% - - - - - - - - 8% 8%
Post graduate
1098 943 - - - - - - - - 1098 943100% 100% - - - - - - - - 100% 100%
Sigma
_________________________________________________________________________________________________________________Proportions/Means: Columns Tested (5% risk level) - A/B - C/D - E/F - G/H - I/J - K/L - A/C/E/G/I/K - B/D/F/H/J/LOverlap formulae used. ** very small base (under 30) ineligible for sig testing
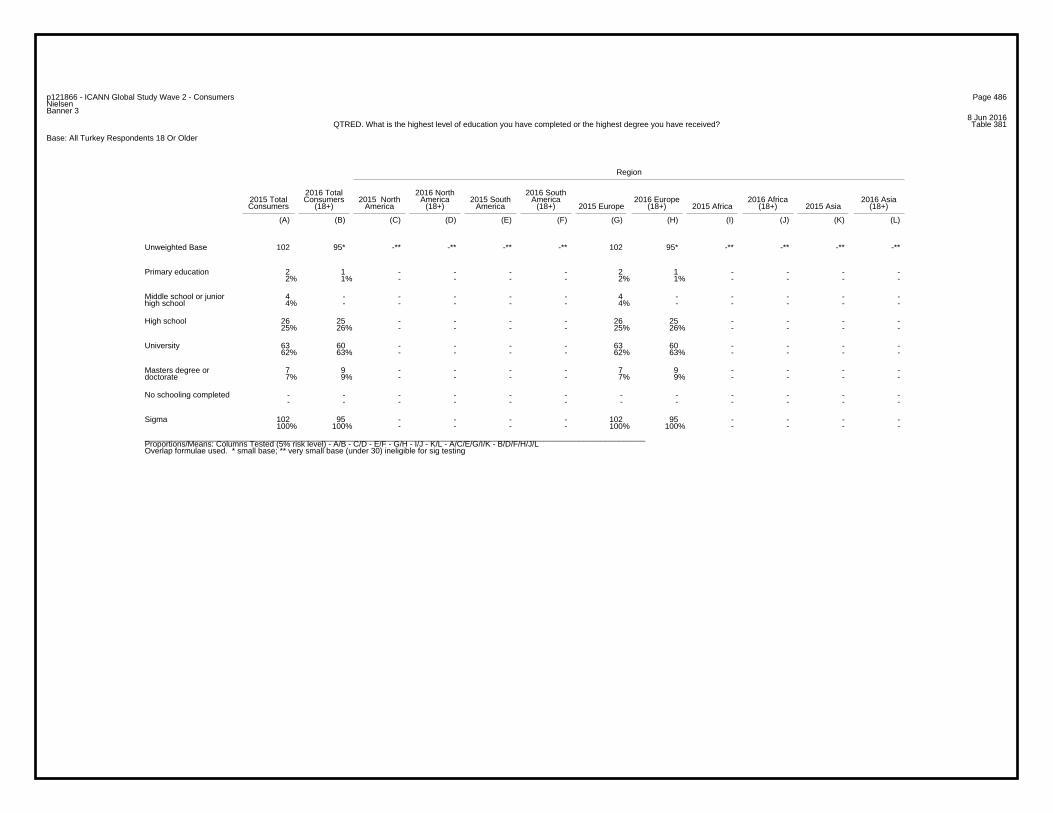
Page 486p121866 - ICANN Global Study Wave 2 - ConsumersNielsenBanner 3
8 Jun 2016Table 381QTRED. What is the highest level of education you have completed or the highest degree you have received?
Base: All Turkey Respondents 18 Or Older
Region
2016 Total 2016 North 2016 South2015 Total Consumers 2015 North America 2015 South America 2016 Europe 2016 Africa 2016 AsiaConsumers (18+) America (18+) America (18+) 2015 Europe (18+) 2015 Africa (18+) 2015 Asia (18+)
(A) (B) (C) (D) (E) (F) (G) (H) (I) (J) (K) (L)
102 95* -** -** -** -** 102 95* -** -** -** -**Unweighted Base
2 1 - - - - 2 1 - - - -2% 1% - - - - 2% 1% - - - -
Primary education
4 - - - - - 4 - - - - -4% - - - - - 4% - - - - -
Middle school or juniorhigh school
26 25 - - - - 26 25 - - - -25% 26% - - - - 25% 26% - - - -
High school
63 60 - - - - 63 60 - - - -62% 63% - - - - 62% 63% - - - -
University
7 9 - - - - 7 9 - - - -7% 9% - - - - 7% 9% - - - -
Masters degree ordoctorate
- - - - - - - - - - - -- - - - - - - - - - - -
No schooling completed
102 95 - - - - 102 95 - - - -100% 100% - - - - 100% 100% - - - -
Sigma
_________________________________________________________________________________________________________________Proportions/Means: Columns Tested (5% risk level) - A/B - C/D - E/F - G/H - I/J - K/L - A/C/E/G/I/K - B/D/F/H/J/LOverlap formulae used. * small base; ** very small base (under 30) ineligible for sig testing
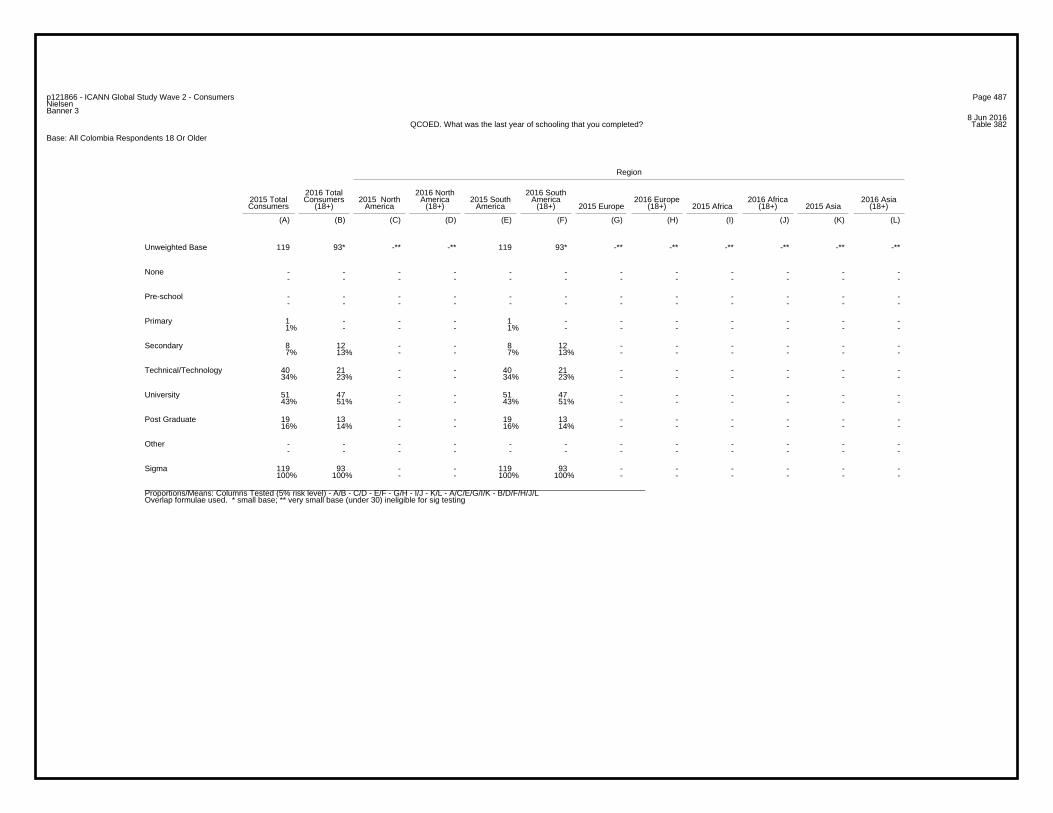
Page 487p121866 - ICANN Global Study Wave 2 - ConsumersNielsenBanner 3
8 Jun 2016Table 382QCOED. What was the last year of schooling that you completed?
Base: All Colombia Respondents 18 Or Older
Region
2016 Total 2016 North 2016 South2015 Total Consumers 2015 North America 2015 South America 2016 Europe 2016 Africa 2016 AsiaConsumers (18+) America (18+) America (18+) 2015 Europe (18+) 2015 Africa (18+) 2015 Asia (18+)
(A) (B) (C) (D) (E) (F) (G) (H) (I) (J) (K) (L)
119 93* -** -** 119 93* -** -** -** -** -** -**Unweighted Base
- - - - - - - - - - - -- - - - - - - - - - - -
None
- - - - - - - - - - - -- - - - - - - - - - - -
Pre-school
1 - - - 1 - - - - - - -1% - - - 1% - - - - - - -
Primary
8 12 - - 8 12 - - - - - -7% 13% - - 7% 13% - - - - - -
Secondary
40 21 - - 40 21 - - - - - -34% 23% - - 34% 23% - - - - - -
Technical/Technology
51 47 - - 51 47 - - - - - -43% 51% - - 43% 51% - - - - - -
University
19 13 - - 19 13 - - - - - -16% 14% - - 16% 14% - - - - - -
Post Graduate
- - - - - - - - - - - -- - - - - - - - - - - -
Other
119 93 - - 119 93 - - - - - -100% 100% - - 100% 100% - - - - - -
Sigma
_________________________________________________________________________________________________________________Proportions/Means: Columns Tested (5% risk level) - A/B - C/D - E/F - G/H - I/J - K/L - A/C/E/G/I/K - B/D/F/H/J/LOverlap formulae used. * small base; ** very small base (under 30) ineligible for sig testing
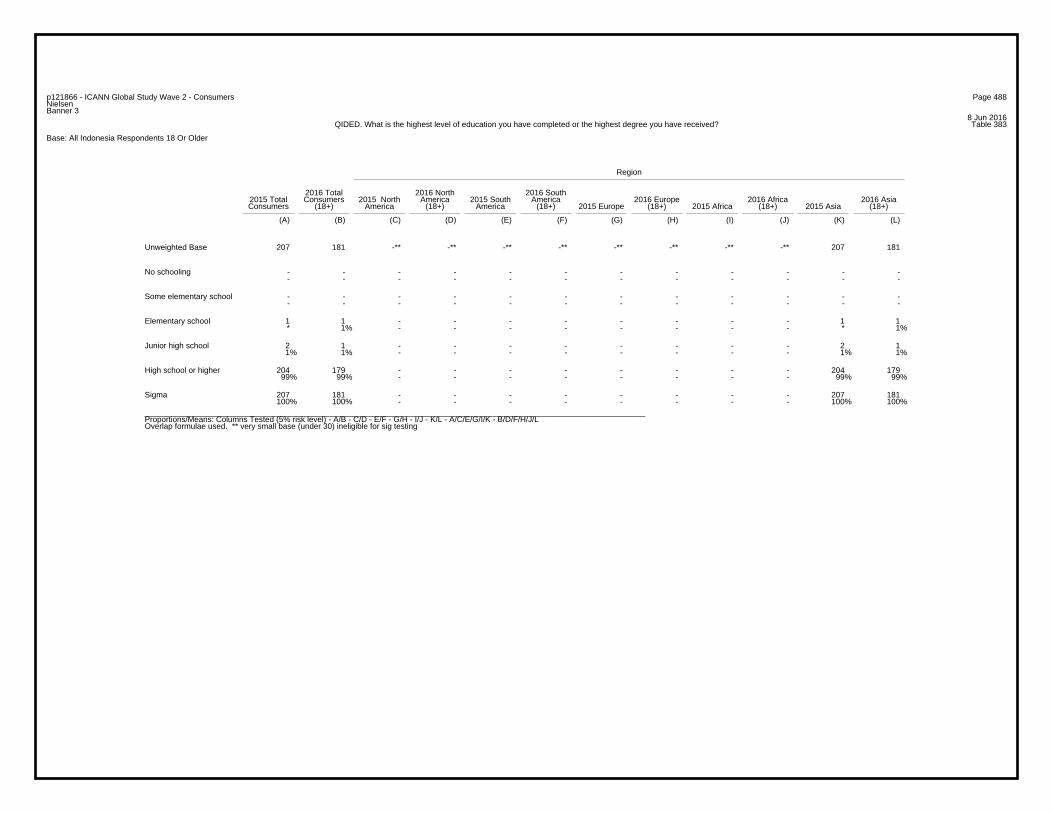
Page 488p121866 - ICANN Global Study Wave 2 - ConsumersNielsenBanner 3
8 Jun 2016Table 383QIDED. What is the highest level of education you have completed or the highest degree you have received?
Base: All Indonesia Respondents 18 Or Older
Region
2016 Total 2016 North 2016 South2015 Total Consumers 2015 North America 2015 South America 2016 Europe 2016 Africa 2016 AsiaConsumers (18+) America (18+) America (18+) 2015 Europe (18+) 2015 Africa (18+) 2015 Asia (18+)
(A) (B) (C) (D) (E) (F) (G) (H) (I) (J) (K) (L)
207 181 -** -** -** -** -** -** -** -** 207 181Unweighted Base
- - - - - - - - - - - -- - - - - - - - - - - -
No schooling
- - - - - - - - - - - -- - - - - - - - - - - -
Some elementary school
1 1 - - - - - - - - 1 1* 1% - - - - - - - - * 1%
Elementary school
2 1 - - - - - - - - 2 11% 1% - - - - - - - - 1% 1%
Junior high school
204 179 - - - - - - - - 204 17999% 99% - - - - - - - - 99% 99%
High school or higher
207 181 - - - - - - - - 207 181100% 100% - - - - - - - - 100% 100%
Sigma
_________________________________________________________________________________________________________________Proportions/Means: Columns Tested (5% risk level) - A/B - C/D - E/F - G/H - I/J - K/L - A/C/E/G/I/K - B/D/F/H/J/LOverlap formulae used. ** very small base (under 30) ineligible for sig testing
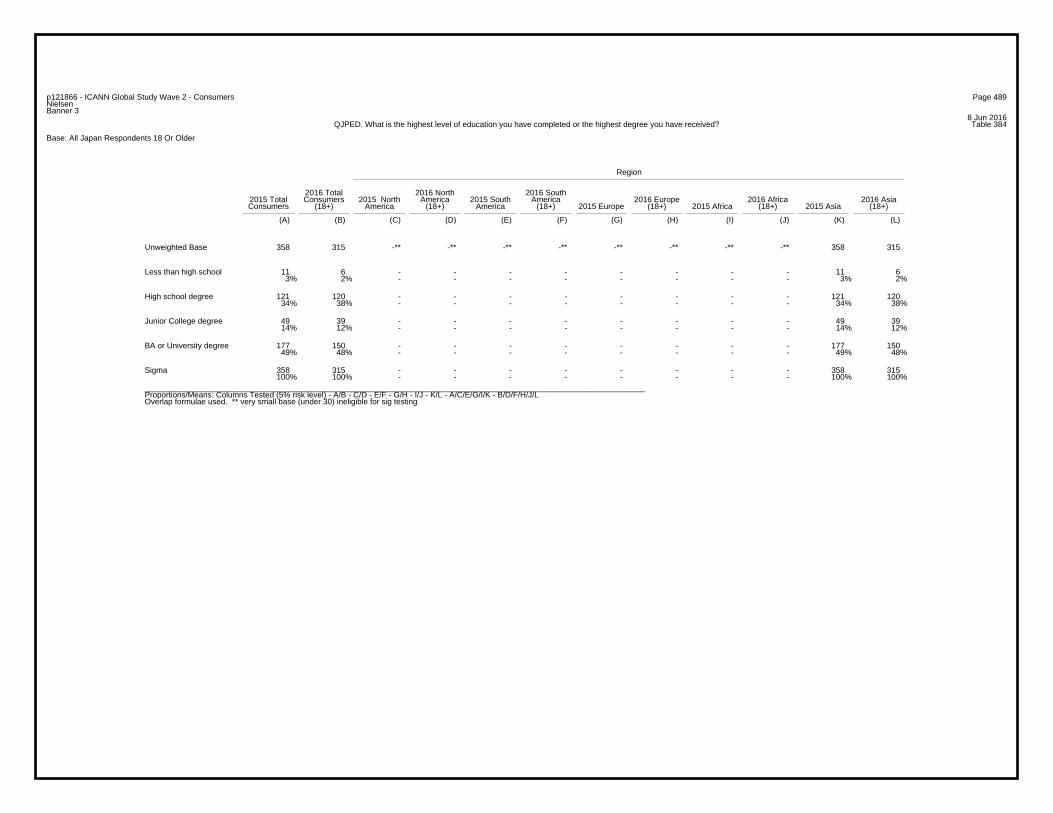
Page 489p121866 - ICANN Global Study Wave 2 - ConsumersNielsenBanner 3
8 Jun 2016Table 384QJPED. What is the highest level of education you have completed or the highest degree you have received?
Base: All Japan Respondents 18 Or Older
Region
2016 Total 2016 North 2016 South2015 Total Consumers 2015 North America 2015 South America 2016 Europe 2016 Africa 2016 AsiaConsumers (18+) America (18+) America (18+) 2015 Europe (18+) 2015 Africa (18+) 2015 Asia (18+)
(A) (B) (C) (D) (E) (F) (G) (H) (I) (J) (K) (L)
358 315 -** -** -** -** -** -** -** -** 358 315Unweighted Base
11 6 - - - - - - - - 11 63% 2% - - - - - - - - 3% 2%
Less than high school
121 120 - - - - - - - - 121 12034% 38% - - - - - - - - 34% 38%
High school degree
49 39 - - - - - - - - 49 3914% 12% - - - - - - - - 14% 12%
Junior College degree
177 150 - - - - - - - - 177 15049% 48% - - - - - - - - 49% 48%
BA or University degree
358 315 - - - - - - - - 358 315100% 100% - - - - - - - - 100% 100%
Sigma
_________________________________________________________________________________________________________________Proportions/Means: Columns Tested (5% risk level) - A/B - C/D - E/F - G/H - I/J - K/L - A/C/E/G/I/K - B/D/F/H/J/LOverlap formulae used. ** very small base (under 30) ineligible for sig testing
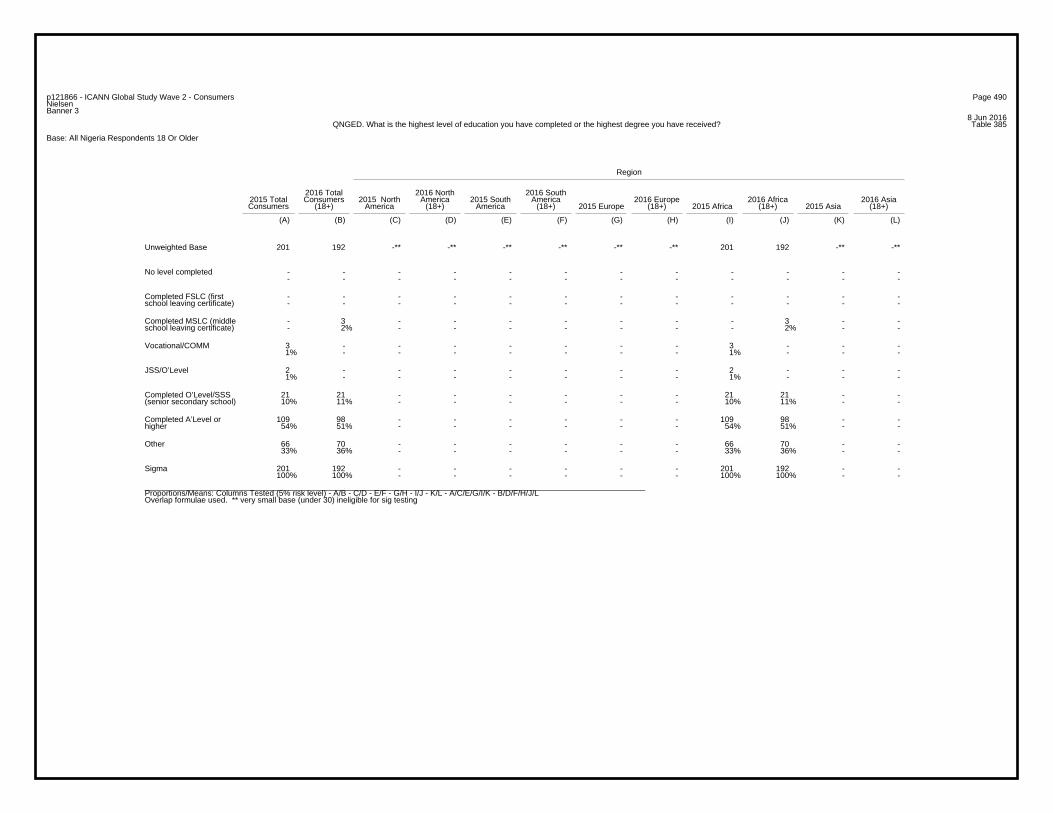
Page 490p121866 - ICANN Global Study Wave 2 - ConsumersNielsenBanner 3
8 Jun 2016Table 385QNGED. What is the highest level of education you have completed or the highest degree you have received?
Base: All Nigeria Respondents 18 Or Older
Region
2016 Total 2016 North 2016 South2015 Total Consumers 2015 North America 2015 South America 2016 Europe 2016 Africa 2016 AsiaConsumers (18+) America (18+) America (18+) 2015 Europe (18+) 2015 Africa (18+) 2015 Asia (18+)
(A) (B) (C) (D) (E) (F) (G) (H) (I) (J) (K) (L)
201 192 -** -** -** -** -** -** 201 192 -** -**Unweighted Base
- - - - - - - - - - - -- - - - - - - - - - - -
No level completed
- - - - - - - - - - - -- - - - - - - - - - - -
Completed FSLC (firstschool leaving certificate)
- 3 - - - - - - - 3 - -- 2% - - - - - - - 2% - -
Completed MSLC (middleschool leaving certificate)
3 - - - - - - - 3 - - -1% - - - - - - - 1% - - -
Vocational/COMM
2 - - - - - - - 2 - - -1% - - - - - - - 1% - - -
JSS/O’Level
21 21 - - - - - - 21 21 - -10% 11% - - - - - - 10% 11% - -
Completed O’Level/SSS(senior secondary school)
109 98 - - - - - - 109 98 - -54% 51% - - - - - - 54% 51% - -
Completed A’Level orhigher
66 70 - - - - - - 66 70 - -33% 36% - - - - - - 33% 36% - -
Other
201 192 - - - - - - 201 192 - -100% 100% - - - - - - 100% 100% - -
Sigma
_________________________________________________________________________________________________________________Proportions/Means: Columns Tested (5% risk level) - A/B - C/D - E/F - G/H - I/J - K/L - A/C/E/G/I/K - B/D/F/H/J/LOverlap formulae used. ** very small base (under 30) ineligible for sig testing
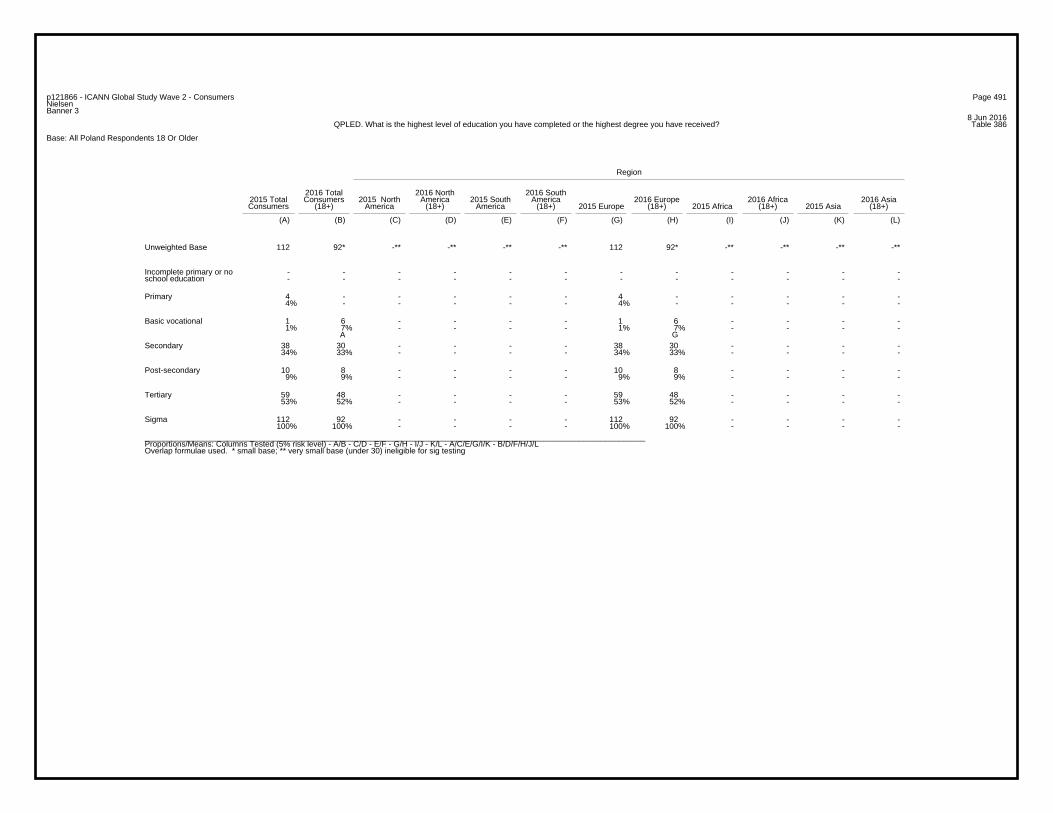
Page 491p121866 - ICANN Global Study Wave 2 - ConsumersNielsenBanner 3
8 Jun 2016Table 386QPLED. What is the highest level of education you have completed or the highest degree you have received?
Base: All Poland Respondents 18 Or Older
Region
2016 Total 2016 North 2016 South2015 Total Consumers 2015 North America 2015 South America 2016 Europe 2016 Africa 2016 AsiaConsumers (18+) America (18+) America (18+) 2015 Europe (18+) 2015 Africa (18+) 2015 Asia (18+)
(A) (B) (C) (D) (E) (F) (G) (H) (I) (J) (K) (L)
112 92* -** -** -** -** 112 92* -** -** -** -**Unweighted Base
- - - - - - - - - - - -- - - - - - - - - - - -
Incomplete primary or noschool education
4 - - - - - 4 - - - - -4% - - - - - 4% - - - - -
Primary
1 6 - - - - 1 6 - - - -1% 7% - - - - 1% 7% - - - -
A G
Basic vocational
38 30 - - - - 38 30 - - - -34% 33% - - - - 34% 33% - - - -
Secondary
10 8 - - - - 10 8 - - - -9% 9% - - - - 9% 9% - - - -
Post-secondary
59 48 - - - - 59 48 - - - -53% 52% - - - - 53% 52% - - - -
Tertiary
112 92 - - - - 112 92 - - - -100% 100% - - - - 100% 100% - - - -
Sigma
_________________________________________________________________________________________________________________Proportions/Means: Columns Tested (5% risk level) - A/B - C/D - E/F - G/H - I/J - K/L - A/C/E/G/I/K - B/D/F/H/J/LOverlap formulae used. * small base; ** very small base (under 30) ineligible for sig testing
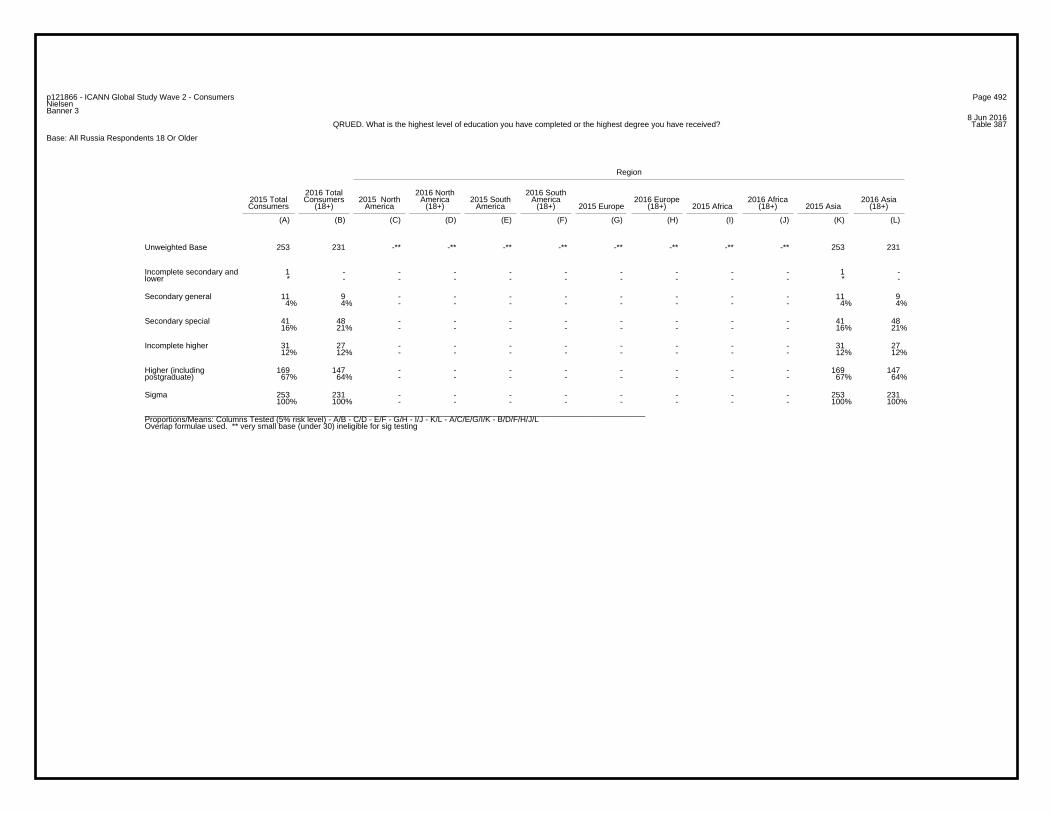
Page 492p121866 - ICANN Global Study Wave 2 - ConsumersNielsenBanner 3
8 Jun 2016Table 387QRUED. What is the highest level of education you have completed or the highest degree you have received?
Base: All Russia Respondents 18 Or Older
Region
2016 Total 2016 North 2016 South2015 Total Consumers 2015 North America 2015 South America 2016 Europe 2016 Africa 2016 AsiaConsumers (18+) America (18+) America (18+) 2015 Europe (18+) 2015 Africa (18+) 2015 Asia (18+)
(A) (B) (C) (D) (E) (F) (G) (H) (I) (J) (K) (L)
253 231 -** -** -** -** -** -** -** -** 253 231Unweighted Base
1 - - - - - - - - - 1 -* - - - - - - - - - * -
Incomplete secondary andlower
11 9 - - - - - - - - 11 94% 4% - - - - - - - - 4% 4%
Secondary general
41 48 - - - - - - - - 41 4816% 21% - - - - - - - - 16% 21%
Secondary special
31 27 - - - - - - - - 31 2712% 12% - - - - - - - - 12% 12%
Incomplete higher
169 147 - - - - - - - - 169 14767% 64% - - - - - - - - 67% 64%
Higher (includingpostgraduate)
253 231 - - - - - - - - 253 231100% 100% - - - - - - - - 100% 100%
Sigma
_________________________________________________________________________________________________________________Proportions/Means: Columns Tested (5% risk level) - A/B - C/D - E/F - G/H - I/J - K/L - A/C/E/G/I/K - B/D/F/H/J/LOverlap formulae used. ** very small base (under 30) ineligible for sig testing
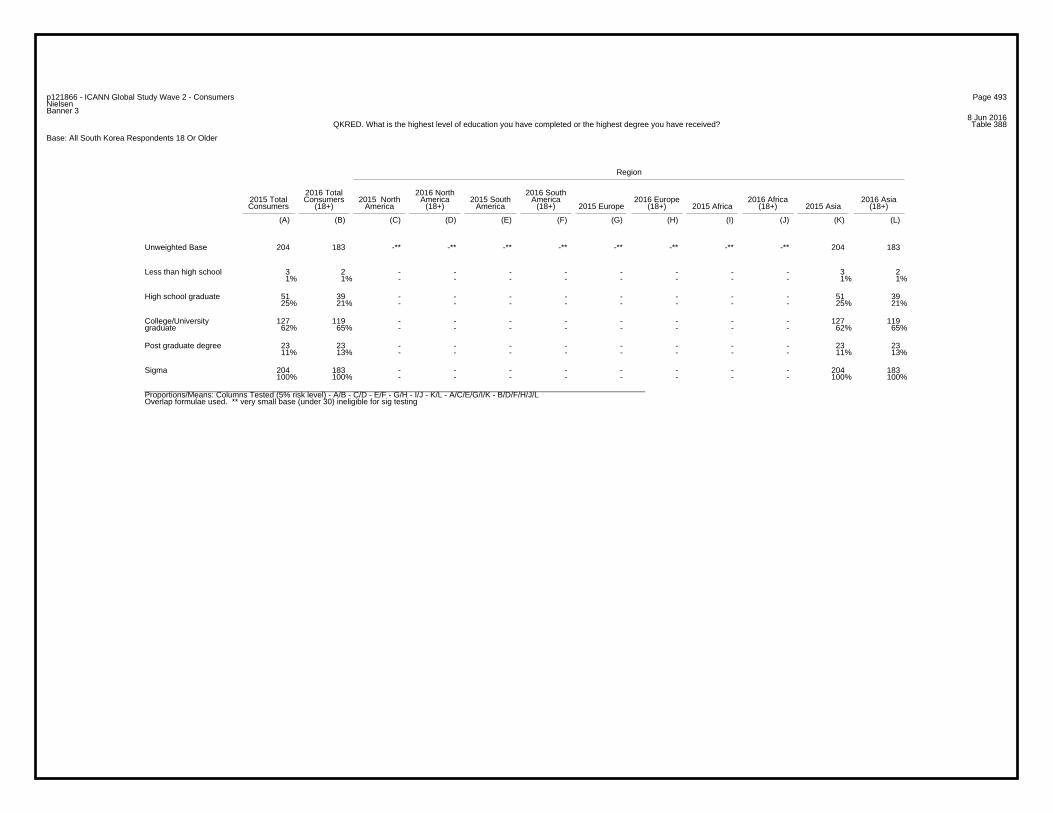
Page 493p121866 - ICANN Global Study Wave 2 - ConsumersNielsenBanner 3
8 Jun 2016Table 388QKRED. What is the highest level of education you have completed or the highest degree you have received?
Base: All South Korea Respondents 18 Or Older
Region
2016 Total 2016 North 2016 South2015 Total Consumers 2015 North America 2015 South America 2016 Europe 2016 Africa 2016 AsiaConsumers (18+) America (18+) America (18+) 2015 Europe (18+) 2015 Africa (18+) 2015 Asia (18+)
(A) (B) (C) (D) (E) (F) (G) (H) (I) (J) (K) (L)
204 183 -** -** -** -** -** -** -** -** 204 183Unweighted Base
3 2 - - - - - - - - 3 21% 1% - - - - - - - - 1% 1%
Less than high school
51 39 - - - - - - - - 51 3925% 21% - - - - - - - - 25% 21%
High school graduate
127 119 - - - - - - - - 127 11962% 65% - - - - - - - - 62% 65%
College/Universitygraduate
23 23 - - - - - - - - 23 2311% 13% - - - - - - - - 11% 13%
Post graduate degree
204 183 - - - - - - - - 204 183100% 100% - - - - - - - - 100% 100%
Sigma
_________________________________________________________________________________________________________________Proportions/Means: Columns Tested (5% risk level) - A/B - C/D - E/F - G/H - I/J - K/L - A/C/E/G/I/K - B/D/F/H/J/LOverlap formulae used. ** very small base (under 30) ineligible for sig testing
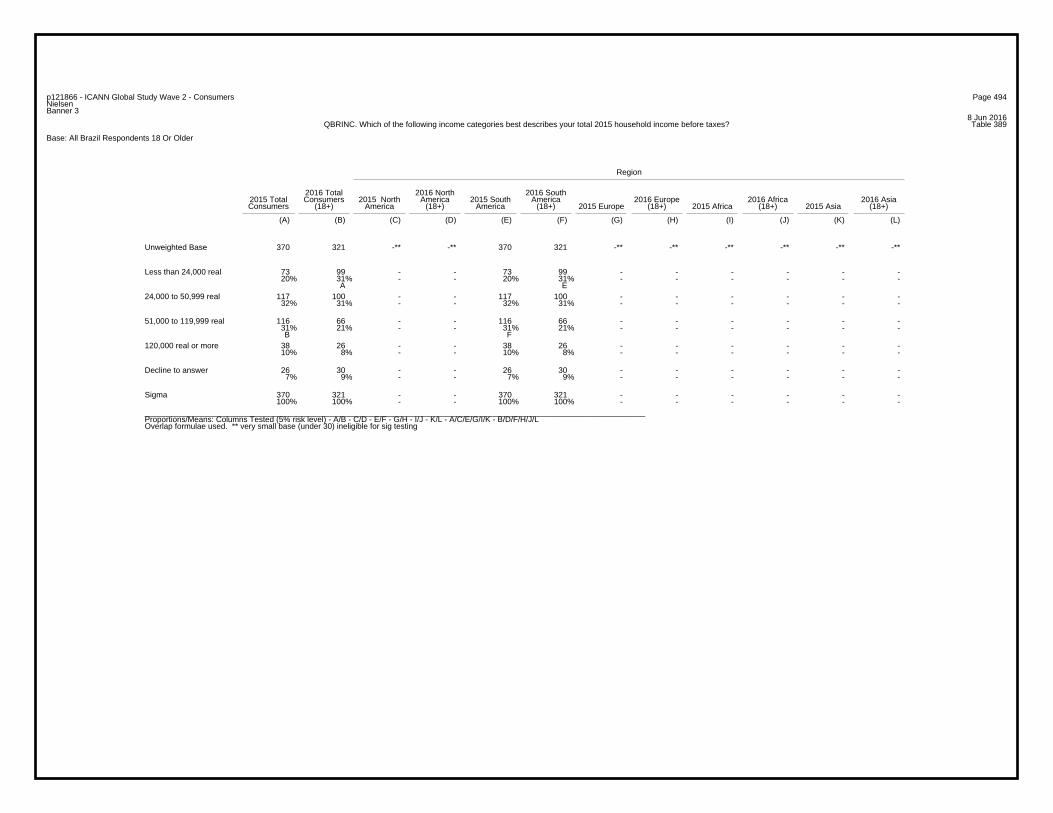
Page 494p121866 - ICANN Global Study Wave 2 - ConsumersNielsenBanner 3
8 Jun 2016Table 389QBRINC. Which of the following income categories best describes your total 2015 household income before taxes?
Base: All Brazil Respondents 18 Or Older
Region
2016 Total 2016 North 2016 South2015 Total Consumers 2015 North America 2015 South America 2016 Europe 2016 Africa 2016 AsiaConsumers (18+) America (18+) America (18+) 2015 Europe (18+) 2015 Africa (18+) 2015 Asia (18+)
(A) (B) (C) (D) (E) (F) (G) (H) (I) (J) (K) (L)
370 321 -** -** 370 321 -** -** -** -** -** -**Unweighted Base
73 99 - - 73 99 - - - - - -20% 31% - - 20% 31% - - - - - -
A E
Less than 24,000 real
117 100 - - 117 100 - - - - - -32% 31% - - 32% 31% - - - - - -
24,000 to 50,999 real
116 66 - - 116 66 - - - - - -31% 21% - - 31% 21% - - - - - - B F
51,000 to 119,999 real
38 26 - - 38 26 - - - - - -10% 8% - - 10% 8% - - - - - -
120,000 real or more
26 30 - - 26 30 - - - - - -7% 9% - - 7% 9% - - - - - -
Decline to answer
370 321 - - 370 321 - - - - - -100% 100% - - 100% 100% - - - - - -
Sigma
_________________________________________________________________________________________________________________Proportions/Means: Columns Tested (5% risk level) - A/B - C/D - E/F - G/H - I/J - K/L - A/C/E/G/I/K - B/D/F/H/J/LOverlap formulae used. ** very small base (under 30) ineligible for sig testing
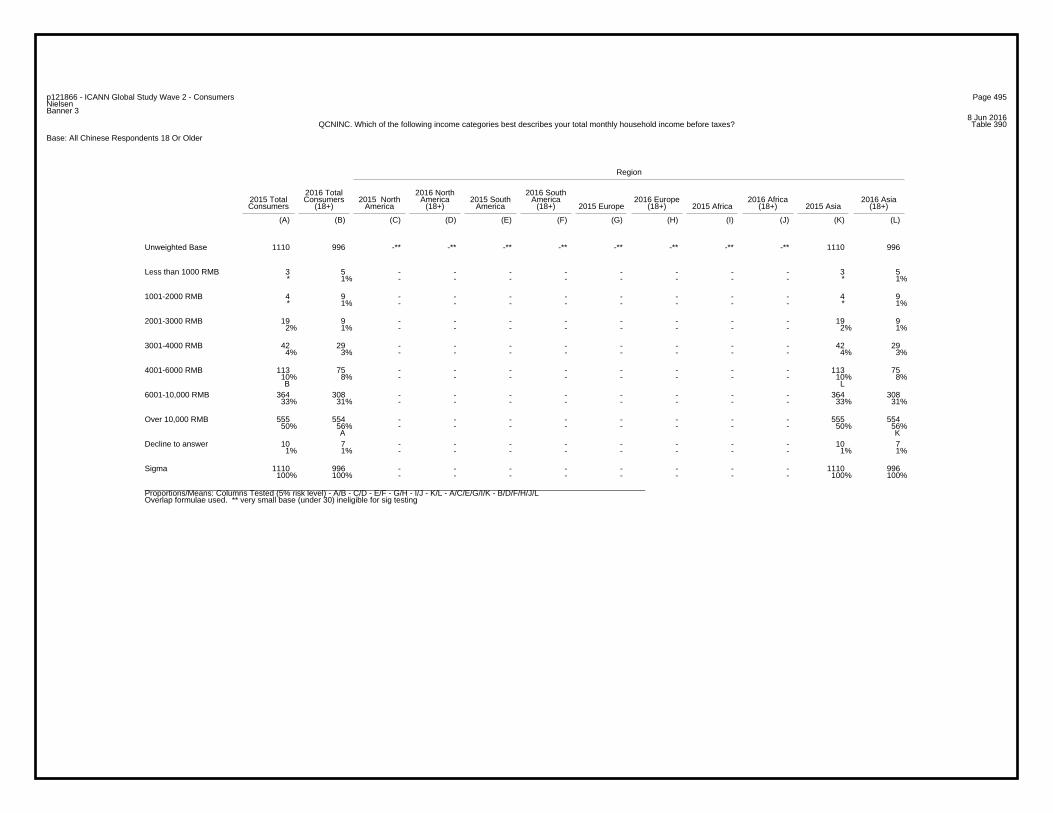
Page 495p121866 - ICANN Global Study Wave 2 - ConsumersNielsenBanner 3
8 Jun 2016Table 390QCNINC. Which of the following income categories best describes your total monthly household income before taxes?
Base: All Chinese Respondents 18 Or Older
Region
2016 Total 2016 North 2016 South2015 Total Consumers 2015 North America 2015 South America 2016 Europe 2016 Africa 2016 AsiaConsumers (18+) America (18+) America (18+) 2015 Europe (18+) 2015 Africa (18+) 2015 Asia (18+)
(A) (B) (C) (D) (E) (F) (G) (H) (I) (J) (K) (L)
1110 996 -** -** -** -** -** -** -** -** 1110 996Unweighted Base
3 5 - - - - - - - - 3 5* 1% - - - - - - - - * 1%
Less than 1000 RMB
4 9 - - - - - - - - 4 9* 1% - - - - - - - - * 1%
1001-2000 RMB
19 9 - - - - - - - - 19 92% 1% - - - - - - - - 2% 1%
2001-3000 RMB
42 29 - - - - - - - - 42 294% 3% - - - - - - - - 4% 3%
3001-4000 RMB
113 75 - - - - - - - - 113 7510% 8% - - - - - - - - 10% 8%B L
4001-6000 RMB
364 308 - - - - - - - - 364 30833% 31% - - - - - - - - 33% 31%
6001-10,000 RMB
555 554 - - - - - - - - 555 55450% 56% - - - - - - - - 50% 56%
A K
Over 10,000 RMB
10 7 - - - - - - - - 10 71% 1% - - - - - - - - 1% 1%
Decline to answer
1110 996 - - - - - - - - 1110 996100% 100% - - - - - - - - 100% 100%
Sigma
_________________________________________________________________________________________________________________Proportions/Means: Columns Tested (5% risk level) - A/B - C/D - E/F - G/H - I/J - K/L - A/C/E/G/I/K - B/D/F/H/J/LOverlap formulae used. ** very small base (under 30) ineligible for sig testing
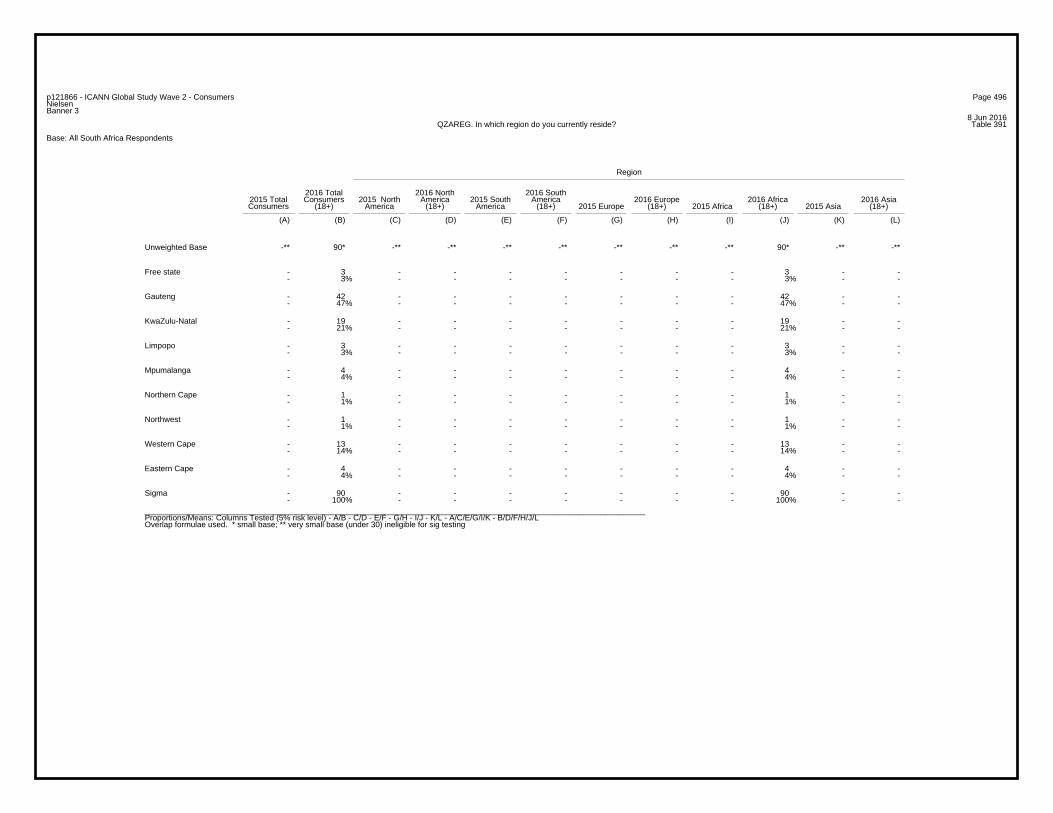
Page 496p121866 - ICANN Global Study Wave 2 - ConsumersNielsenBanner 3
8 Jun 2016Table 391QZAREG. In which region do you currently reside?
Base: All South Africa Respondents
Region
2016 Total 2016 North 2016 South2015 Total Consumers 2015 North America 2015 South America 2016 Europe 2016 Africa 2016 AsiaConsumers (18+) America (18+) America (18+) 2015 Europe (18+) 2015 Africa (18+) 2015 Asia (18+)
(A) (B) (C) (D) (E) (F) (G) (H) (I) (J) (K) (L)
-** 90* -** -** -** -** -** -** -** 90* -** -**Unweighted Base
- 3 - - - - - - - 3 - -- 3% - - - - - - - 3% - -
Free state
- 42 - - - - - - - 42 - -- 47% - - - - - - - 47% - -
Gauteng
- 19 - - - - - - - 19 - -- 21% - - - - - - - 21% - -
KwaZulu-Natal
- 3 - - - - - - - 3 - -- 3% - - - - - - - 3% - -
Limpopo
- 4 - - - - - - - 4 - -- 4% - - - - - - - 4% - -
Mpumalanga
- 1 - - - - - - - 1 - -- 1% - - - - - - - 1% - -
Northern Cape
- 1 - - - - - - - 1 - -- 1% - - - - - - - 1% - -
Northwest
- 13 - - - - - - - 13 - -- 14% - - - - - - - 14% - -
Western Cape
- 4 - - - - - - - 4 - -- 4% - - - - - - - 4% - -
Eastern Cape
- 90 - - - - - - - 90 - -- 100% - - - - - - - 100% - -
Sigma
_________________________________________________________________________________________________________________Proportions/Means: Columns Tested (5% risk level) - A/B - C/D - E/F - G/H - I/J - K/L - A/C/E/G/I/K - B/D/F/H/J/LOverlap formulae used. * small base; ** very small base (under 30) ineligible for sig testing
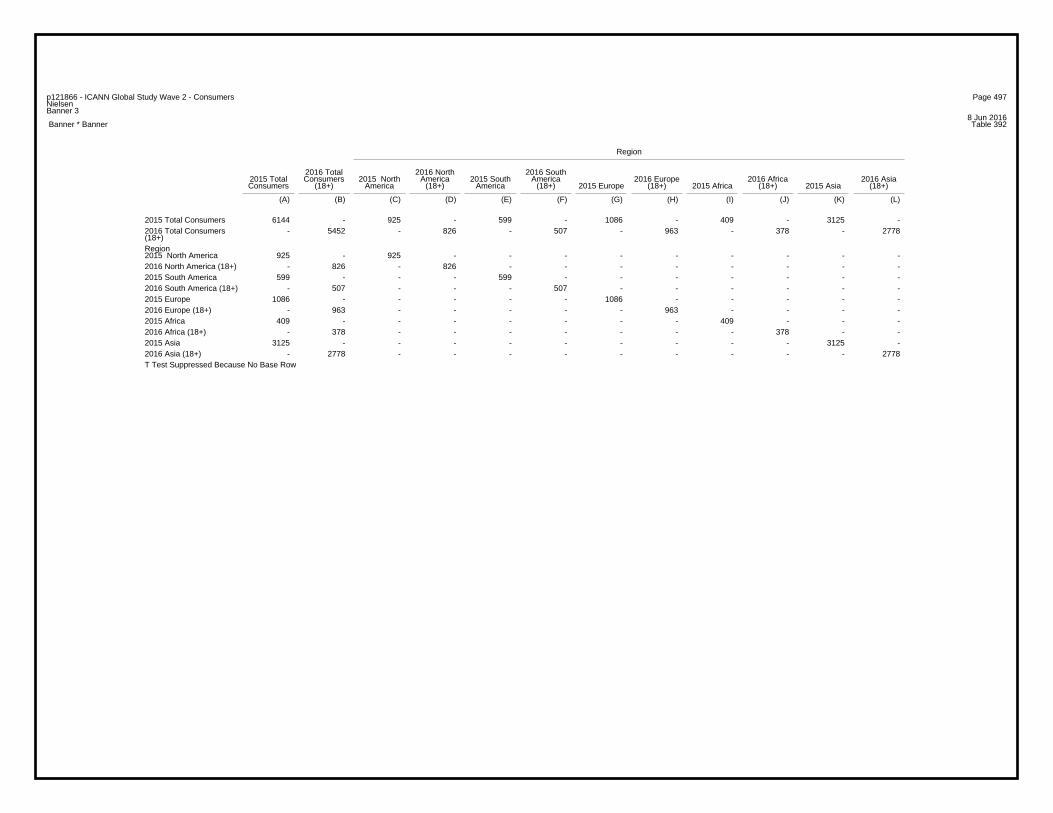
Page 497p121866 - ICANN Global Study Wave 2 - ConsumersNielsenBanner 3
8 Jun 2016 Banner * Banner Table 392
Region
2016 Total 2016 North 2016 South2015 Total Consumers 2015 North America 2015 South America 2016 Europe 2016 Africa 2016 AsiaConsumers (18+) America (18+) America (18+) 2015 Europe (18+) 2015 Africa (18+) 2015 Asia (18+)
(A) (B) (C) (D) (E) (F) (G) (H) (I) (J) (K) (L)
6144 - 925 - 599 - 1086 - 409 - 3125 -2015 Total Consumers- 5452 - 826 - 507 - 963 - 378 - 27782016 Total Consumers
(18+)Region
925 - 925 - - - - - - - - -2015 North America- 826 - 826 - - - - - - - -2016 North America (18+)
599 - - - 599 - - - - - - -2015 South America- 507 - - - 507 - - - - - -2016 South America (18+)
1086 - - - - - 1086 - - - - -2015 Europe- 963 - - - - - 963 - - - -2016 Europe (18+)
409 - - - - - - - 409 - - -2015 Africa- 378 - - - - - - - 378 - -2016 Africa (18+)
3125 - - - - - - - - - 3125 -2015 Asia- 2778 - - - - - - - - - 27782016 Asia (18+)
T Test Suppressed Because No Base Row
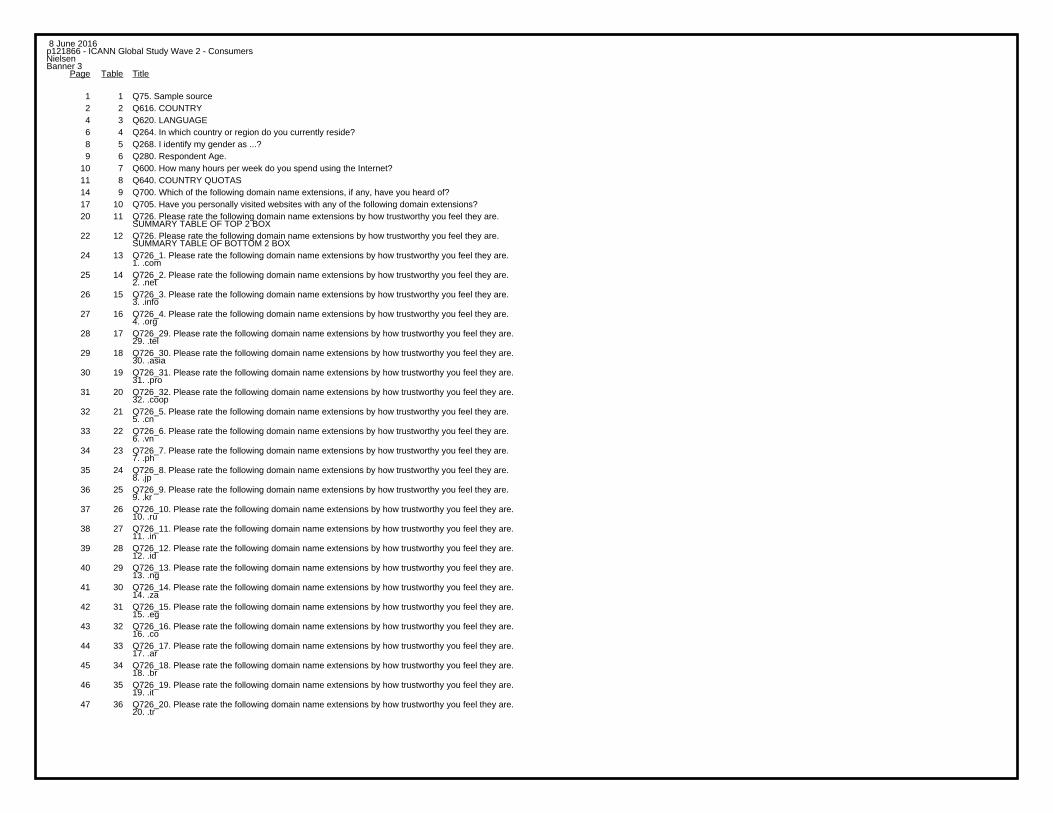
8 June 2016p121866 - ICANN Global Study Wave 2 - ConsumersNielsenBanner 3
TitleTablePage
1 1 Q75. Sample source2 2 Q616. COUNTRY4 3 Q620. LANGUAGE6 4 Q264. In which country or region do you currently reside?8 5 Q268. I identify my gender as ...?9 6 Q280. Respondent Age.
10 7 Q600. How many hours per week do you spend using the Internet?11 8 Q640. COUNTRY QUOTAS14 9 Q700. Which of the following domain name extensions, if any, have you heard of?17 10 Q705. Have you personally visited websites with any of the following domain extensions?20 11 Q726. Please rate the following domain name extensions by how trustworthy you feel they are.
SUMMARY TABLE OF TOP 2 BOX22 12 Q726. Please rate the following domain name extensions by how trustworthy you feel they are.
SUMMARY TABLE OF BOTTOM 2 BOX24 13 Q726_1. Please rate the following domain name extensions by how trustworthy you feel they are.
1. .com25 14 Q726_2. Please rate the following domain name extensions by how trustworthy you feel they are.
2. .net26 15 Q726_3. Please rate the following domain name extensions by how trustworthy you feel they are.
3. .info27 16 Q726_4. Please rate the following domain name extensions by how trustworthy you feel they are.
4. .org28 17 Q726_29. Please rate the following domain name extensions by how trustworthy you feel they are.
29. .tel29 18 Q726_30. Please rate the following domain name extensions by how trustworthy you feel they are.
30. .asia30 19 Q726_31. Please rate the following domain name extensions by how trustworthy you feel they are.
31. .pro31 20 Q726_32. Please rate the following domain name extensions by how trustworthy you feel they are.
32. .coop32 21 Q726_5. Please rate the following domain name extensions by how trustworthy you feel they are.
5. .cn33 22 Q726_6. Please rate the following domain name extensions by how trustworthy you feel they are.
6. .vn34 23 Q726_7. Please rate the following domain name extensions by how trustworthy you feel they are.
7. .ph35 24 Q726_8. Please rate the following domain name extensions by how trustworthy you feel they are.
8. .jp36 25 Q726_9. Please rate the following domain name extensions by how trustworthy you feel they are.
9. .kr37 26 Q726_10. Please rate the following domain name extensions by how trustworthy you feel they are.
10. .ru38 27 Q726_11. Please rate the following domain name extensions by how trustworthy you feel they are.
11. .in39 28 Q726_12. Please rate the following domain name extensions by how trustworthy you feel they are.
12. .id40 29 Q726_13. Please rate the following domain name extensions by how trustworthy you feel they are.
13. .ng41 30 Q726_14. Please rate the following domain name extensions by how trustworthy you feel they are.
14. .za42 31 Q726_15. Please rate the following domain name extensions by how trustworthy you feel they are.
15. .eg43 32 Q726_16. Please rate the following domain name extensions by how trustworthy you feel they are.
16. .co44 33 Q726_17. Please rate the following domain name extensions by how trustworthy you feel they are.
17. .ar45 34 Q726_18. Please rate the following domain name extensions by how trustworthy you feel they are.
18. .br46 35 Q726_19. Please rate the following domain name extensions by how trustworthy you feel they are.
19. .it47 36 Q726_20. Please rate the following domain name extensions by how trustworthy you feel they are.
20. .tr
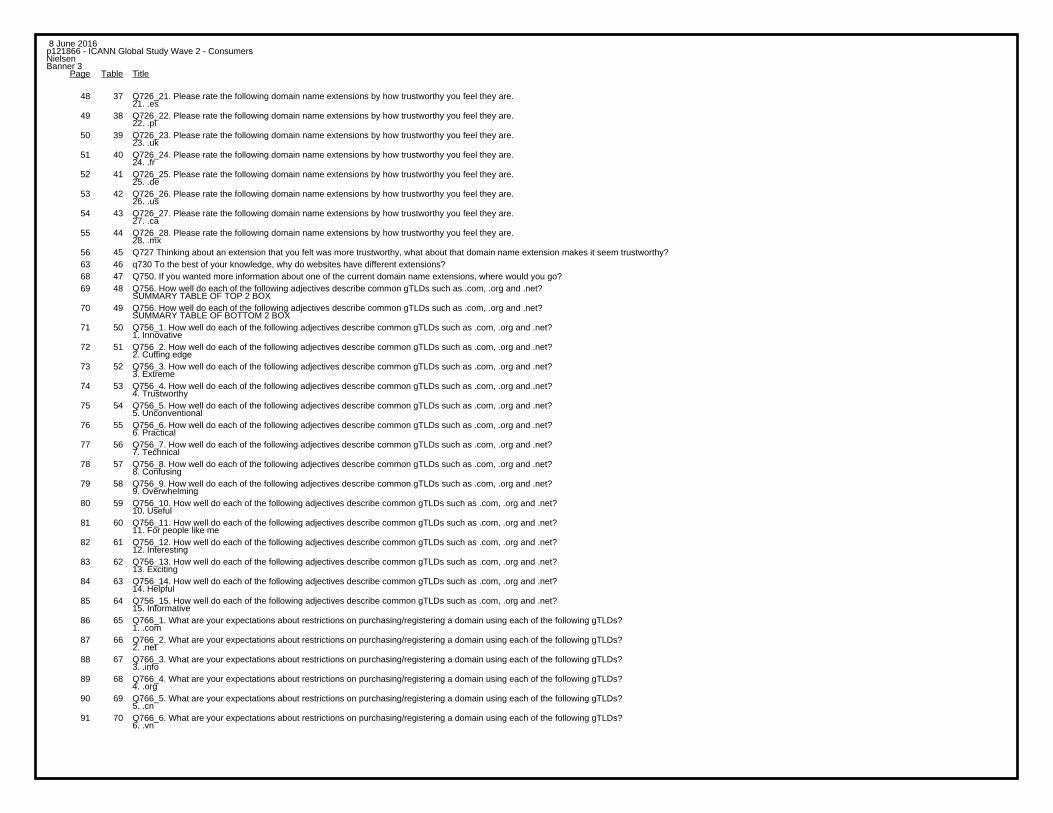
8 June 2016p121866 - ICANN Global Study Wave 2 - ConsumersNielsenBanner 3
TitleTablePage
48 37 Q726_21. Please rate the following domain name extensions by how trustworthy you feel they are.21. .es
49 38 Q726_22. Please rate the following domain name extensions by how trustworthy you feel they are.22. .pl
50 39 Q726_23. Please rate the following domain name extensions by how trustworthy you feel they are.23. .uk
51 40 Q726_24. Please rate the following domain name extensions by how trustworthy you feel they are.24. .fr
52 41 Q726_25. Please rate the following domain name extensions by how trustworthy you feel they are.25. .de
53 42 Q726_26. Please rate the following domain name extensions by how trustworthy you feel they are.26. .us
54 43 Q726_27. Please rate the following domain name extensions by how trustworthy you feel they are.27. .ca
55 44 Q726_28. Please rate the following domain name extensions by how trustworthy you feel they are.28. .mx
56 45 Q727 Thinking about an extension that you felt was more trustworthy, what about that domain name extension makes it seem trustworthy?63 46 q730 To the best of your knowledge, why do websites have different extensions?68 47 Q750. If you wanted more information about one of the current domain name extensions, where would you go?69 48 Q756. How well do each of the following adjectives describe common gTLDs such as .com, .org and .net?
SUMMARY TABLE OF TOP 2 BOX70 49 Q756. How well do each of the following adjectives describe common gTLDs such as .com, .org and .net?
SUMMARY TABLE OF BOTTOM 2 BOX71 50 Q756_1. How well do each of the following adjectives describe common gTLDs such as .com, .org and .net?
1. Innovative72 51 Q756_2. How well do each of the following adjectives describe common gTLDs such as .com, .org and .net?
2. Cutting edge73 52 Q756_3. How well do each of the following adjectives describe common gTLDs such as .com, .org and .net?
3. Extreme74 53 Q756_4. How well do each of the following adjectives describe common gTLDs such as .com, .org and .net?
4. Trustworthy75 54 Q756_5. How well do each of the following adjectives describe common gTLDs such as .com, .org and .net?
5. Unconventional76 55 Q756_6. How well do each of the following adjectives describe common gTLDs such as .com, .org and .net?
6. Practical77 56 Q756_7. How well do each of the following adjectives describe common gTLDs such as .com, .org and .net?
7. Technical78 57 Q756_8. How well do each of the following adjectives describe common gTLDs such as .com, .org and .net?
8. Confusing79 58 Q756_9. How well do each of the following adjectives describe common gTLDs such as .com, .org and .net?
9. Overwhelming80 59 Q756_10. How well do each of the following adjectives describe common gTLDs such as .com, .org and .net?
10. Useful81 60 Q756_11. How well do each of the following adjectives describe common gTLDs such as .com, .org and .net?
11. For people like me82 61 Q756_12. How well do each of the following adjectives describe common gTLDs such as .com, .org and .net?
12. Interesting83 62 Q756_13. How well do each of the following adjectives describe common gTLDs such as .com, .org and .net?
13. Exciting84 63 Q756_14. How well do each of the following adjectives describe common gTLDs such as .com, .org and .net?
14. Helpful85 64 Q756_15. How well do each of the following adjectives describe common gTLDs such as .com, .org and .net?
15. Informative86 65 Q766_1. What are your expectations about restrictions on purchasing/registering a domain using each of the following gTLDs?
1. .com87 66 Q766_2. What are your expectations about restrictions on purchasing/registering a domain using each of the following gTLDs?
2. .net88 67 Q766_3. What are your expectations about restrictions on purchasing/registering a domain using each of the following gTLDs?
3. .info89 68 Q766_4. What are your expectations about restrictions on purchasing/registering a domain using each of the following gTLDs?
4. .org90 69 Q766_5. What are your expectations about restrictions on purchasing/registering a domain using each of the following gTLDs?
5. .cn91 70 Q766_6. What are your expectations about restrictions on purchasing/registering a domain using each of the following gTLDs?
6. .vn
8 June 2016p121866 - ICANN Global Study Wave 2 - ConsumersNielsenBanner 3
TitleTablePage
92 71 Q766_7. What are your expectations about restrictions on purchasing/registering a domain using each of the following gTLDs?7. .ph
93 72 Q766_8. What are your expectations about restrictions on purchasing/registering a domain using each of the following gTLDs?8. .jp
94 73 Q766_9. What are your expectations about restrictions on purchasing/registering a domain using each of the following gTLDs?9. .kr
95 74 Q766_10. What are your expectations about restrictions on purchasing/registering a domain using each of the following gTLDs?10. .ru
96 75 Q766_11. What are your expectations about restrictions on purchasing/registering a domain using each of the following gTLDs?11. .in
97 76 Q766_12. What are your expectations about restrictions on purchasing/registering a domain using each of the following gTLDs?12. .id
98 77 Q766_13. What are your expectations about restrictions on purchasing/registering a domain using each of the following gTLDs?13. .ng
99 78 Q766_14. What are your expectations about restrictions on purchasing/registering a domain using each of the following gTLDs?14. .za
100 79 Q766_15. What are your expectations about restrictions on purchasing/registering a domain using each of the following gTLDs?15. .eg
101 80 Q766_16. What are your expectations about restrictions on purchasing/registering a domain using each of the following gTLDs?16. .co
102 81 Q766_17. What are your expectations about restrictions on purchasing/registering a domain using each of the following gTLDs?17. .ar
103 82 Q766_18. What are your expectations about restrictions on purchasing/registering a domain using each of the following gTLDs?18. .br
104 83 Q766_19. What are your expectations about restrictions on purchasing/registering a domain using each of the following gTLDs?19. .it
105 84 Q766_20. What are your expectations about restrictions on purchasing/registering a domain using each of the following gTLDs?20. .tr
106 85 Q766_21. What are your expectations about restrictions on purchasing/registering a domain using each of the following gTLDs?21. .es
107 86 Q766_22. What are your expectations about restrictions on purchasing/registering a domain using each of the following gTLDs?22. .pl
108 87 Q766_23. What are your expectations about restrictions on purchasing/registering a domain using each of the following gTLDs?23. .uk
109 88 Q766_24. What are your expectations about restrictions on purchasing/registering a domain using each of the following gTLDs?24. .fr
110 89 Q766_25. What are your expectations about restrictions on purchasing/registering a domain using each of the following gTLDs?25. .de
111 90 Q766_26. What are your expectations about restrictions on purchasing/registering a domain using each of the following gTLDs?26. .us
112 91 Q766_27. What are your expectations about restrictions on purchasing/registering a domain using each of the following gTLDs?27. .ca
113 92 Q766_28. What are your expectations about restrictions on purchasing/registering a domain using each of the following gTLDs?28. .mx
114 93 Q767. Do you feel each of the following restrictions should be enforced?SUMMARY TABLE OF YES
115 94 Q767_1. Do you feel each of the following restrictions should be enforced?1. Requirements for validated credentials related to the gTLD (e.g., must be a licensed contractor to register a .builder domain)
116 95 Q767_2. Do you feel each of the following restrictions should be enforced?2. Validation that the person or company registering the site meets intended parameters (e.g. must be involved in the pharmaceutical industry to register a .pharmacy domain
117 96 Q767_3. Do you feel each of the following restrictions should be enforced?3. Requirements for local presence within a specific city, country, or region for a domain related to that place.
118 97 Q767_4. Do you feel each of the following restrictions should be enforced?4. Requirements for use of the name to be consistent with the meaning of the gTLD (e.g., use of a .net name must be for network operations purposes)
119 98 Q770. Does having purchase restrictions or requirements on a particular gTLD make it...?120 99 Q780 How do you determine whether a website is legitimate or not?125 100 Q785. Have you ever tried to identify who created a particular website?126 101 Q790 What did you use to try and figure this out?130 102 Q830x1 To the best of your knowledge, why have new gTLDs been created?134 103 Q870 What criteria or situations might make you decide to visit websites with a domain name extension you have not seen before?140 104 Q875 What, if anything, might cause you to avoid a website with an unfamiliar domain name extension?145 105 Q800. Which of the following new gTLDs, if any, have you heard of?
8 June 2016p121866 - ICANN Global Study Wave 2 - ConsumersNielsenBanner 3
TitleTablePage
148 106 Q805. Have you personally visited websites with any of the following new domain name extensions? Please select all that you recall having visited.151 107 Q890. Think about accessing a website with one of the newer domain extensions (the part after the ’dot’).
If the domain name extension in question is descriptive of a service or item, would youexpect that all websites using that domain extension have a direct relationship to it?
152 108 Q812. Assume you are looking for information about wildlife photography. How likely would you be to visit each of the following sites?SUMMARY TABLE OF TOP 2 BOX
153 109 Q812. Assume you are looking for information about wildlife photography. How likely would you be to visit each of the following sites?SUMMARY TABLE OF BOTTOM 2 BOX
154 110 Q812_1. Assume you are looking for information about wildlife photography. How likely would you be to visit each of the following sites?1. Wildanimalphotography.com [ENGLISH]
155 111 Q812_2. Assume you are looking for information about wildlife photography. How likely would you be to visit each of the following sites?2. Wildanimal.photography
156 112 Q812_3. Assume you are looking for information about wildlife photography. How likely would you be to visit each of the following sites?3. Wildanimal.photos
157 113 Q812_4. Assume you are looking for information about wildlife photography. How likely would you be to visit each of the following sites?4. Wildanimalphotos.info
158 114 Q812_5. Assume you are looking for information about wildlife photography. How likely would you be to visit each of the following sites?5. Wildanimalphotography.com
159 115 Q826X1. And if you were looking to buy a new camera, how likely would you be to visit each of the following?SUMMARY TABLE OF TOP 2 BOX
160 116 Q826X1. And if you were looking to buy a new camera, how likely would you be to visit each of the following?SUMMARY TABLE OF BOTTOM 2 BOX
161 117 Q826X1_1. And if you were looking to buy a new camera, how likely would you be to visit each of the following?1. Digitalcameras.com
162 118 Q826X1_2. And if you were looking to buy a new camera, how likely would you be to visit each of the following?2. Digital.cameras
163 119 Q826X1_3. And if you were looking to buy a new camera, how likely would you be to visit each of the following?3. Digitalcameras.shop
164 120 Q826X1_4. And if you were looking to buy a new camera, how likely would you be to visit each of the following?4. Digitalcameras
165 121 Q828. And, what if you were looking for information about Berlin, Germany or thinking about travelling there?How likely would you be to visit each of the following?SUMMARY TABLE OF TOP 2 BOX
166 122 Q828. And, what if you were looking for information about Berlin, Germany or thinking about travelling there?How likely would you be to visit each of the following?SUMMARY TABLE OF BOTTOM 2 BOX
167 123 Q828_1. And, what if you were looking for information about Berlin, Germany or thinking about travelling there?How likely would you be to visit each of the following?1. berlin.com
168 124 Q828_2. And, what if you were looking for information about Berlin, Germany or thinking about travelling there?How likely would you be to visit each of the following?2. berlin.de
169 125 Q828_3. And, what if you were looking for information about Berlin, Germany or thinking about travelling there?How likely would you be to visit each of the following?3. berlin.info
170 126 Q828_4. And, what if you were looking for information about Berlin, Germany or thinking about travelling there?How likely would you be to visit each of the following?4. info.berlin
171 127 Q880. If you were conducting an internet search for information on a topic, how much attentiondo you pay to the domain extension (e.g. .com or .info)?
172 128 Q823. Which of the following would be most important to you in determining which gTLD to register your domain name under?173 129 Q826. Please rate the following gTLDs by how trustworthy you feel they are.
SUMMARY TABLE OF TOP 2 BOX176 130 Q826. Please rate the following gTLDs by how trustworthy you feel they are.
SUMMARY TABLE OF BOTTOM 2 BOX179 131 Q826_1. Please rate the following gTLDs by how trustworthy you feel they are.
1. .email180 132 Q826_2. Please rate the following gTLDs by how trustworthy you feel they are.
2. .photography181 133 Q826_3. Please rate the following gTLDs by how trustworthy you feel they are.
3. .link182 134 Q826_4. Please rate the following gTLDs by how trustworthy you feel they are.
4. .guru183 135 Q826_5. Please rate the following gTLDs by how trustworthy you feel they are.
5. .realtor

8 June 2016p121866 - ICANN Global Study Wave 2 - ConsumersNielsenBanner 3
TitleTablePage
184 136 Q826_6. Please rate the following gTLDs by how trustworthy you feel they are.6. .club
185 137 Q826_7. Please rate the following gTLDs by how trustworthy you feel they are.7. .xyz
186 138 Q826_16. Please rate the following gTLDs by how trustworthy you feel they are.16. .top
187 139 Q826_17. Please rate the following gTLDs by how trustworthy you feel they are.17. .pics
188 140 Q826_18. Please rate the following gTLDs by how trustworthy you feel they are.18. .online
189 141 Q826_19. Please rate the following gTLDs by how trustworthy you feel they are.19. .space
190 142 Q826_20. Please rate the following gTLDs by how trustworthy you feel they are.20. .website
191 143 Q826_21. Please rate the following gTLDs by how trustworthy you feel they are.21. .news
192 144 Q826_22. Please rate the following gTLDs by how trustworthy you feel they are.22. .site
193 145 Q826_23. Please rate the following gTLDs by how trustworthy you feel they are.23. .toronto
194 146 Q826_24. Please rate the following gTLDs by how trustworthy you feel they are.24. .guadalajara
195 147 Q826_25. Please rate the following gTLDs by how trustworthy you feel they are.25. .roma
196 148 Q826_26. Please rate the following gTLDs by how trustworthy you feel they are.26. .istanbul
197 149 Q826_27. Please rate the following gTLDs by how trustworthy you feel they are.27. .madrid
198 150 Q826_28. Please rate the following gTLDs by how trustworthy you feel they are.28. .warszawa
199 151 Q826_29. Please rate the following gTLDs by how trustworthy you feel they are.29. .paris
200 152 Q826_30. Please rate the following gTLDs by how trustworthy you feel they are.30. .Foshan
201 153 Q826_31. Please rate the following gTLDs by how trustworthy you feel they are.31. .hanoi
202 154 Q826_32. Please rate the following gTLDs by how trustworthy you feel they are.32. .manilla
203 155 Q826_33. Please rate the following gTLDs by how trustworthy you feel they are.33. .tokyo
204 156 Q826_34. Please rate the following gTLDs by how trustworthy you feel they are.34. .seoul
205 157 Q826_35. Please rate the following gTLDs by how trustworthy you feel they are.35. .mockba
206 158 Q826_36. Please rate the following gTLDs by how trustworthy you feel they are.36. .delhi
207 159 Q826_37. Please rate the following gTLDs by how trustworthy you feel they are.37. .jakarta
208 160 Q826_38. Please rate the following gTLDs by how trustworthy you feel they are.38. .abuja
209 161 Q826_39. Please rate the following gTLDs by how trustworthy you feel they are.39. .capetown
210 162 Q826_40. Please rate the following gTLDs by how trustworthy you feel they are.40. .cairo
211 163 Q826_41. Please rate the following gTLDs by how trustworthy you feel they are.41. .bogota
212 164 Q826_42. Please rate the following gTLDs by how trustworthy you feel they are.42. .cordoba
213 165 Q826_43. Please rate the following gTLDs by how trustworthy you feel they are.43. .rio
214 166 Q826_8. Please rate the following gTLDs by how trustworthy you feel they are.8. .berlin
215 167 Q826_9. Please rate the following gTLDs by how trustworthy you feel they are.9. .ovh
8 June 2016p121866 - ICANN Global Study Wave 2 - ConsumersNielsenBanner 3
TitleTablePage
216 168 Q826_10. Please rate the following gTLDs by how trustworthy you feel they are.10. .london
217 169 Q826_11. Please rate the following gTLDs by how trustworthy you feel they are.11. .nyc
218 170 Q826_12. Please rate the following gTLDs by how trustworthy you feel they are.12. .wang
219 171 Q826_13. Please rate the following gTLDs by how trustworthy you feel they are.13. .xn-ses554g (Chinese for network address)
220 172 Q826_14. Please rate the following gTLDs by how trustworthy you feel they are.14. .xn-55qx5d (Chinese for company)
221 173 Q827 Please assume that while browsing you see a website with a domain extension (the part after the "dot") that you do not recognize.What about this unfamilar domain name extension would make it feel trustworthy?
228 174 Q850. If you wanted more information about one of the new gTLDs, where would you go?229 175 Q856. How well do each of the following adjectives describe new gTLDs such as .email, .photography and .club?
SUMMARY TABLE OF TOP 2 BOX230 176 Q856. How well do each of the following adjectives describe new gTLDs such as .email, .photography and .club?
SUMMARY TABLE OF BOTTOM 2 BOX231 177 Q856_1. How well do each of the following adjectives describe new gTLDs such as .email, .photography and .club?
1. Innovative232 178 Q856_2. How well do each of the following adjectives describe new gTLDs such as .email, .photography and .club?
2. Cutting edge233 179 Q856_3. How well do each of the following adjectives describe new gTLDs such as .email, .photography and .club?
3. Extreme234 180 Q856_4. How well do each of the following adjectives describe new gTLDs such as .email, .photography and .club?
4. Trustworthy235 181 Q856_5. How well do each of the following adjectives describe new gTLDs such as .email, .photography and .club?
5. Unconventional236 182 Q856_6. How well do each of the following adjectives describe new gTLDs such as .email, .photography and .club?
6. Practical237 183 Q856_7. How well do each of the following adjectives describe new gTLDs such as .email, .photography and .club?
7. Technical238 184 Q856_8. How well do each of the following adjectives describe new gTLDs such as .email, .photography and .club?
8. Confusing239 185 Q856_9. How well do each of the following adjectives describe new gTLDs such as .email, .photography and .club?
9. Overwhelming240 186 Q856_10. How well do each of the following adjectives describe new gTLDs such as .email, .photography and .club?
10. Useful241 187 Q856_11. How well do each of the following adjectives describe new gTLDs such as .email, .photography and .club?
11. For people like me242 188 Q856_12. How well do each of the following adjectives describe new gTLDs such as .email, .photography and .club?
12. Interesting243 189 Q856_13. How well do each of the following adjectives describe new gTLDs such as .email, .photography and .club?
13. Exciting244 190 Q856_14. How well do each of the following adjectives describe new gTLDs such as .email, .photography and .club?
14. Helpful245 191 Q856_15. How well do each of the following adjectives describe new gTLDs such as .email, .photography and .club?
15. Informative246 192 Q866_1. Earlier we asked you about enforcing restrictions on who can register/purchase domains with specific extensions.
What level of restrictions would you expect there to be on purchasing the following new gTLDs?1. .email
247 193 Q866_2. Earlier we asked you about enforcing restrictions on who can register/purchase domains with specific extensions.What level of restrictions would you expect there to be on purchasing the following new gTLDs?2. .photography
248 194 Q866_3. Earlier we asked you about enforcing restrictions on who can register/purchase domains with specific extensions.What level of restrictions would you expect there to be on purchasing the following new gTLDs?3. .link
249 195 Q866_4. Earlier we asked you about enforcing restrictions on who can register/purchase domains with specific extensions.What level of restrictions would you expect there to be on purchasing the following new gTLDs?4. .guru
250 196 Q866_5. Earlier we asked you about enforcing restrictions on who can register/purchase domains with specific extensions.What level of restrictions would you expect there to be on purchasing the following new gTLDs?5. .realtor
251 197 Q866_6. Earlier we asked you about enforcing restrictions on who can register/purchase domains with specific extensions.What level of restrictions would you expect there to be on purchasing the following new gTLDs?6. .club
8 June 2016p121866 - ICANN Global Study Wave 2 - ConsumersNielsenBanner 3
TitleTablePage
252 198 Q866_7. Earlier we asked you about enforcing restrictions on who can register/purchase domains with specific extensions.What level of restrictions would you expect there to be on purchasing the following new gTLDs?7. .xyz
253 199 Q866_44. Earlier we asked you about enforcing restrictions on who can register/purchase domains with specific extensions.What level of restrictions would you expect there to be on purchasing the following new gTLDs?44. .bank
254 200 Q866_45. Earlier we asked you about enforcing restrictions on who can register/purchase domains with specific extensions.What level of restrictions would you expect there to be on purchasing the following new gTLDs?45. .pharmacy
255 201 Q866_46. Earlier we asked you about enforcing restrictions on who can register/purchase domains with specific extensions.What level of restrictions would you expect there to be on purchasing the following new gTLDs?46. .builder
256 202 Q866_23. Earlier we asked you about enforcing restrictions on who can register/purchase domains with specific extensions.What level of restrictions would you expect there to be on purchasing the following new gTLDs?23. .toronto
257 203 Q866_24. Earlier we asked you about enforcing restrictions on who can register/purchase domains with specific extensions.What level of restrictions would you expect there to be on purchasing the following new gTLDs?24. quadalajara
258 204 Q866_25. Earlier we asked you about enforcing restrictions on who can register/purchase domains with specific extensions.What level of restrictions would you expect there to be on purchasing the following new gTLDs?25. .roma
259 205 Q866_26. Earlier we asked you about enforcing restrictions on who can register/purchase domains with specific extensions.What level of restrictions would you expect there to be on purchasing the following new gTLDs?26. .istanbul
260 206 Q866_27. Earlier we asked you about enforcing restrictions on who can register/purchase domains with specific extensions.What level of restrictions would you expect there to be on purchasing the following new gTLDs?27. .madrid
261 207 Q866_28. Earlier we asked you about enforcing restrictions on who can register/purchase domains with specific extensions.What level of restrictions would you expect there to be on purchasing the following new gTLDs?28. .warszawa
262 208 Q866_29. Earlier we asked you about enforcing restrictions on who can register/purchase domains with specific extensions.What level of restrictions would you expect there to be on purchasing the following new gTLDs?29. .paris
263 209 Q866_30. Earlier we asked you about enforcing restrictions on who can register/purchase domains with specific extensions.What level of restrictions would you expect there to be on purchasing the following new gTLDs?30. Foshan
264 210 Q866_31. Earlier we asked you about enforcing restrictions on who can register/purchase domains with specific extensions.What level of restrictions would you expect there to be on purchasing the following new gTLDs?31. .hanoi
265 211 Q866_32. Earlier we asked you about enforcing restrictions on who can register/purchase domains with specific extensions.What level of restrictions would you expect there to be on purchasing the following new gTLDs?32. .manilla
266 212 Q866_33. Earlier we asked you about enforcing restrictions on who can register/purchase domains with specific extensions.What level of restrictions would you expect there to be on purchasing the following new gTLDs?33. .tokyo
267 213 Q866_34. Earlier we asked you about enforcing restrictions on who can register/purchase domains with specific extensions.What level of restrictions would you expect there to be on purchasing the following new gTLDs?34. .seoul
268 214 Q866_35. Earlier we asked you about enforcing restrictions on who can register/purchase domains with specific extensions.What level of restrictions would you expect there to be on purchasing the following new gTLDs?35. .mockba
269 215 Q866_36. Earlier we asked you about enforcing restrictions on who can register/purchase domains with specific extensions.What level of restrictions would you expect there to be on purchasing the following new gTLDs?36. .delhi
270 216 Q866_37. Earlier we asked you about enforcing restrictions on who can register/purchase domains with specific extensions.What level of restrictions would you expect there to be on purchasing the following new gTLDs?37. .jakarta
271 217 Q866_38. Earlier we asked you about enforcing restrictions on who can register/purchase domains with specific extensions.What level of restrictions would you expect there to be on purchasing the following new gTLDs?38. .abuja
272 218 Q866_39. Earlier we asked you about enforcing restrictions on who can register/purchase domains with specific extensions.What level of restrictions would you expect there to be on purchasing the following new gTLDs?39. .capetown
273 219 Q866_40. Earlier we asked you about enforcing restrictions on who can register/purchase domains with specific extensions.What level of restrictions would you expect there to be on purchasing the following new gTLDs?40. .cairo
274 220 Q866_41. Earlier we asked you about enforcing restrictions on who can register/purchase domains with specific extensions.What level of restrictions would you expect there to be on purchasing the following new gTLDs?41. .bogota
275 221 Q866_42. Earlier we asked you about enforcing restrictions on who can register/purchase domains with specific extensions.What level of restrictions would you expect there to be on purchasing the following new gTLDs?42. .cordoba
8 June 2016p121866 - ICANN Global Study Wave 2 - ConsumersNielsenBanner 3
TitleTablePage
276 222 Q866_43. Earlier we asked you about enforcing restrictions on who can register/purchase domains with specific extensions.What level of restrictions would you expect there to be on purchasing the following new gTLDs?43. .rio
277 223 Q866_8. Earlier we asked you about enforcing restrictions on who can register/purchase domains with specific extensions.What level of restrictions would you expect there to be on purchasing the following new gTLDs?8. .berlin
278 224 Q866_9. Earlier we asked you about enforcing restrictions on who can register/purchase domains with specific extensions.What level of restrictions would you expect there to be on purchasing the following new gTLDs?9. .ovh
279 225 Q866_10. Earlier we asked you about enforcing restrictions on who can register/purchase domains with specific extensions.What level of restrictions would you expect there to be on purchasing the following new gTLDs?10. .london
280 226 Q866_11. Earlier we asked you about enforcing restrictions on who can register/purchase domains with specific extensions.What level of restrictions would you expect there to be on purchasing the following new gTLDs?11. .nyc
281 227 Q866_12. Earlier we asked you about enforcing restrictions on who can register/purchase domains with specific extensions.What level of restrictions would you expect there to be on purchasing the following new gTLDs?12. .wang
282 228 Q866_13. Earlier we asked you about enforcing restrictions on who can register/purchase domains with specific extensions.What level of restrictions would you expect there to be on purchasing the following new gTLDs?13. .xn-ses554g (Chinese for network address)
283 229 Q866_14. Earlier we asked you about enforcing restrictions on who can register/purchase domains with specific extensions.What level of restrictions would you expect there to be on purchasing the following new gTLDs?14. .xn-55qx5d (Chinese for company)
284 230 Q910. And, how much do you trust that the restrictions on this new registration will actually be enforced?285 231 Q916. How much do you trust the Domain Name industry compared to these other industries?
SUMMARY TABLE OF TOP 2 BOX286 232 Q916. How much do you trust the Domain Name industry compared to these other industries?
SUMMARY TABLE OF BOTTOM 2 BOX287 233 Q916_1. How much do you trust the Domain Name industry compared to these other industries?
1. Internet service providers/the agency that provides my internet access288 234 Q916_2. How much do you trust the Domain Name industry compared to these other industries?
2. Web based marketing companies289 235 Q916_3. How much do you trust the Domain Name industry compared to these other industries?
3. E-commerce companies290 236 Q916_4. How much do you trust the Domain Name industry compared to these other industries?
4. Software companies291 237 Q916_5. How much do you trust the Domain Name industry compared to these other industries?
5. Computer hardware companies292 238 Q917 Why do you trust the domain name industry more than these other industries?299 239 Q919 Why do you trust the domain name industry less than these other industries?303 240 Q1000. Which devices do you use to access the Internet?304 241 Q1005. What is your experience with URL shorteners?305 242 Q1010. Why haven’t you used URL shorteners?306 243 Q1015. Why do you use URL shorteners?307 244 Q1020. What is your experience with QR codes?308 245 Q1025. Why haven’t you used QR codes?309 246 Q1030. Why do you use QR codes?310 247 Q1050. What is your preferred way of finding websites now?311 248 Q1036_1. Which of these is the safest, which is the fastest, and which is the easiest way to navigate to a website that may have the information you are looking for?
1. Safest312 249 Q1036_2. Which of these is the safest, which is the fastest, and which is the easiest way to navigate to a website that may have the information you are looking for?
2. Fastest313 250 Q1036_3. Which of these is the safest, which is the fastest, and which is the easiest way to navigate to a website that may have the information you are looking for?
3. Easiest314 251 Q1055_1. Which of these are the fastest, easiest and safest way to get to the website you want to buy from?
1. Safest315 252 Q1055_2. Which of these are the fastest, easiest and safest way to get to the website you want to buy from?
2. Fastest316 253 Q1055_3. Which of these are the fastest, easiest and safest way to get to the website you want to buy from?
3. Easiest317 254 Q1060_1. Lastly, think about a website you go to regularly and where you will access your personal information, like banking or healthcare information?
Which of these is the safest, which is the easiest, and which is the fastest method?1. Safest
8 June 2016p121866 - ICANN Global Study Wave 2 - ConsumersNielsenBanner 3
TitleTablePage
318 255 Q1060_2. Lastly, think about a website you go to regularly and where you will access your personal information, like banking or healthcare information?Which of these is the safest, which is the easiest, and which is the fastest method?2. Fastest
319 256 Q1060_3. Lastly, think about a website you go to regularly and where you will access your personal information, like banking or healthcare information?Which of these is the safest, which is the easiest, and which is the fastest method?3. Easiest
320 257 Q1140. Overall, how comfortable are you with each of the following online behaviors?SUMMARY TABLE OF TOP 2 BOX
321 258 Q1140. Overall, how comfortable are you with each of the following online behaviors?SUMMARY TABLE OF BOTTOM 2 BOX
322 259 Q1140_1. Overall, how comfortable are you with each of the following online behaviors?1. Searching for information
323 260 Q1140_2. Overall, how comfortable are you with each of the following online behaviors?2. Using social media to talk about your activities or family
324 261 Q1140_3. Overall, how comfortable are you with each of the following online behaviors?3. Shopping online
325 262 Q1140_4. Overall, how comfortable are you with each of the following online behaviors?4. Banking online
326 263 Q1140_5. Overall, how comfortable are you with each of the following online behaviors?5. Accessing medical information online
327 264 Q1145_1. Please think about two/three websites. One has a .com domain extension/, one has a ... and one has one of the new gTLDs like .club or .bank.How comfortable would you be doing each of these activities on each website?1. Inputting your email addressSUMMARY TABLE OF TOP BOX
328 265 Q1145_1. Please think about two/three websites. One has a .com domain extension/, one has a ... and one has one of the new gTLDs like .club or .bank.How comfortable would you be doing each of these activities on each website?1. Inputting your email addressSUMMARY TABLE OF TOP 2 BOX
329 266 Q1145_1_1. Please think about two/three websites. One has a .com domain extension/, one has a ... and one has one of the new gTLDs like .club or .bank.How comfortable would you be doing each of these activities on each website?1. Inputting your email address1. .com
330 267 Q1145_1_2. Please think about two/three websites. One has a .com domain extension/, one has a ... and one has one of the new gTLDs like .club or .bank.How comfortable would you be doing each of these activities on each website?1. Inputting your email address2. gTLDs
331 268 Q1145_1_3. Please think about two/three websites. One has a .com domain extension/, one has a ... and one has one of the new gTLDs like .club or .bank.How comfortable would you be doing each of these activities on each website?1. Inputting your email address3. .club or .bank
332 269 Q1145_2. Please think about two/three websites. One has a .com domain extension/, one has a ... and one has one of the new gTLDs like .club or .bank.How comfortable would you be doing each of these activities on each website?2. Inputting your home addressSUMMARY TABLE OF TOP BOX
333 270 Q1145_2. Please think about two/three websites. One has a .com domain extension/, one has a ... and one has one of the new gTLDs like .club or .bank.How comfortable would you be doing each of these activities on each website?2. Inputting your home addressSUMMARY TABLE OF TOP 2 BOX
334 271 Q1145_2_1. Please think about two/three websites. One has a .com domain extension/, one has a ... and one has one of the new gTLDs like .club or .bank.How comfortable would you be doing each of these activities on each website?2. Inputting your home address1. .com
335 272 Q1145_2_2. Please think about two/three websites. One has a .com domain extension/, one has a ... and one has one of the new gTLDs like .club or .bank.How comfortable would you be doing each of these activities on each website?2. Inputting your home address2. gTLDs
336 273 Q1145_2_3. Please think about two/three websites. One has a .com domain extension/, one has a ... and one has one of the new gTLDs like .club or .bank.How comfortable would you be doing each of these activities on each website?2. Inputting your home address3. .club or .bank
337 274 Q1145_3. Please think about two/three websites. One has a .com domain extension/, one has a ... and one has one of the new gTLDs like .club or .bank.How comfortable would you be doing each of these activities on each website?3. Inputting your telephone numberSUMMARY TABLE OF TOP BOX
338 275 Q1145_3. Please think about two/three websites. One has a .com domain extension/, one has a ... and one has one of the new gTLDs like .club or .bank.How comfortable would you be doing each of these activities on each website?3. Inputting your telephone numberSUMMARY TABLE OF TOP 2 BOX
339 276 Q1145_3_1. Please think about two/three websites. One has a .com domain extension/, one has a ... and one has one of the new gTLDs like .club or .bank.How comfortable would you be doing each of these activities on each website?3. Inputting your telephone number1. .com
8 June 2016p121866 - ICANN Global Study Wave 2 - ConsumersNielsenBanner 3
TitleTablePage
340 277 Q1145_3_2. Please think about two/three websites. One has a .com domain extension/, one has a ... and one has one of the new gTLDs like .club or .bank.How comfortable would you be doing each of these activities on each website?3. Inputting your telephone number2. gTLDs
341 278 Q1145_3_3. Please think about two/three websites. One has a .com domain extension/, one has a ... and one has one of the new gTLDs like .club or .bank.How comfortable would you be doing each of these activities on each website?3. Inputting your telephone number3. .club or .bank
342 279 Q1145_4. Please think about two/three websites. One has a .com domain extension/, one has a ... and one has one of the new gTLDs like .club or .bank.How comfortable would you be doing each of these activities on each website?4. Inputting financial information (like a credit card or bank account number)SUMMARY TABLE OF TOP BOX
343 280 Q1145_4. Please think about two/three websites. One has a .com domain extension/, one has a ... and one has one of the new gTLDs like .club or .bank.How comfortable would you be doing each of these activities on each website?4. Inputting financial information (like a credit card or bank account number)SUMMARY TABLE OF TOP 2 BOX
344 281 Q1145_4_1. Please think about two/three websites. One has a .com domain extension/, one has a ... and one has one of the new gTLDs like .club or .bank.How comfortable would you be doing each of these activities on each website?4. Inputting financial information (like a credit card or bank account number)1. .com
345 282 Q1145_4_2. Please think about two/three websites. One has a .com domain extension/, one has a ... and one has one of the new gTLDs like .club or .bank.How comfortable would you be doing each of these activities on each website?4. Inputting financial information (like a credit card or bank account number)2. gTLDs
346 283 Q1145_4_3. Please think about two/three websites. One has a .com domain extension/, one has a ... and one has one of the new gTLDs like .club or .bank.How comfortable would you be doing each of these activities on each website?4. Inputting financial information (like a credit card or bank account number)3. .club or .bank
347 284 Q1145_5. Please think about two/three websites. One has a .com domain extension/, one has a ... and one has one of the new gTLDs like .club or .bank.How comfortable would you be doing each of these activities on each website?5. Inputting an ID number like a social security number, passport or government ID numberSUMMARY TABLE OF TOP BOX
348 285 Q1145_5. Please think about two/three websites. One has a .com domain extension/, one has a ... and one has one of the new gTLDs like .club or .bank.How comfortable would you be doing each of these activities on each website?5. Inputting an ID number like a social security number, passport or government ID numberSUMMARY TABLE OF TOP 2 BOX
349 286 Q1145_5_1. Please think about two/three websites. One has a .com domain extension/, one has a ... and one has one of the new gTLDs like .club or .bank.How comfortable would you be doing each of these activities on each website?5. Inputting an ID number like a social security number, passport or government ID number1. .com
350 287 Q1145_5_2. Please think about two/three websites. One has a .com domain extension/, one has a ... and one has one of the new gTLDs like .club or .bank.How comfortable would you be doing each of these activities on each website?5. Inputting an ID number like a social security number, passport or government ID number2. gTLDs
351 288 Q1145_5_3. Please think about two/three websites. One has a .com domain extension/, one has a ... and one has one of the new gTLDs like .club or .bank.How comfortable would you be doing each of these activities on each website?5. Inputting an ID number like a social security number, passport or government ID number3. .club or .bank
352 289 Q1145_6. Please think about two/three websites. One has a .com domain extension/, one has a ... and one has one of the new gTLDs like .club or .bank.How comfortable would you be doing each of these activities on each website?6. Inputting healthcare information, like inputting a list of prescription drugs you use, or your medical historySUMMARY TABLE OF TOP BOX
353 290 Q1145_6. Please think about two/three websites. One has a .com domain extension/, one has a ... and one has one of the new gTLDs like .club or .bank.How comfortable would you be doing each of these activities on each website?6. Inputting healthcare information, like inputting a list of prescription drugs you use, or your medical historySUMMARY TABLE OF TOP 2 BOX
354 291 Q1145_6_1. Please think about two/three websites. One has a .com domain extension/, one has a ... and one has one of the new gTLDs like .club or .bank.How comfortable would you be doing each of these activities on each website?6. Inputting healthcare information, like inputting a list of prescription drugs you use, or your medical history1. .com
355 292 Q1145_6_2. Please think about two/three websites. One has a .com domain extension/, one has a ... and one has one of the new gTLDs like .club or .bank.How comfortable would you be doing each of these activities on each website?6. Inputting healthcare information, like inputting a list of prescription drugs you use, or your medical history2. gTLDs
356 293 Q1145_6_3. Please think about two/three websites. One has a .com domain extension/, one has a ... and one has one of the new gTLDs like .club or .bank.How comfortable would you be doing each of these activities on each website?6. Inputting healthcare information, like inputting a list of prescription drugs you use, or your medical history3. .club or .bank
357 294 Q1100a. How would you describe your familiarity with each of the following abusive internet behaviors?SUMMARY TABLE OF TOP 2 BOX
358 295 Q1100a. How would you describe your familiarity with each of the following abusive internet behaviors?SUMMARY TABLE OF BOTTOM 2 BOX
8 June 2016p121866 - ICANN Global Study Wave 2 - ConsumersNielsenBanner 3
TitleTablePage
359 296 Q1100a_1. How would you describe your familiarity with each of the following abusive internet behaviors?1. Phishing - The attempt to acquire sensitive information such as usernames, passwords, and credit card details by masquerading as a trustworthy entity in electronic communication.
360 297 Q1100a_2. How would you describe your familiarity with each of the following abusive internet behaviors?2. Spamming - The use of electronic messaging systems to send unsolicited messages.
361 298 Q1100a_3. How would you describe your familiarity with each of the following abusive internet behaviors?3. Cyber squatting - Registering or using a domain name with bad faith intent to profit from the goodwill of a trademark belonging to someone else.
362 299 Q1100a_4. How would you describe your familiarity with each of the following abusive internet behaviors?4. Stolen credentials - When hackers steal personal information stored online such as usernames, passwords, social security numbers, credit cards numbers, etc.
363 300 Q1100a_5. How would you describe your familiarity with each of the following abusive internet behaviors?5. Malware - Short for ’’malicious software’’, used to disrupt computer operations, gather sensitive information or gain access to private computer systems.
364 301 Q1105. What do you think are the source(s) for each type of abusive Internet behavior?SUMMARY TABLE OF ORGANIZED GROUPS
365 302 Q1105. What do you think are the source(s) for each type of abusive Internet behavior?SUMMARY TABLE OF INDIVIDUALS
366 303 Q1105_1. What do you think are the source(s) for each type of abusive Internet behavior?1. Phishing
367 304 Q1105_2. What do you think are the source(s) for each type of abusive Internet behavior?2. Spamming
368 305 Q1105_3. What do you think are the source(s) for each type of abusive Internet behavior?3. Cyber squatting
369 306 Q1105_4. What do you think are the source(s) for each type of abusive Internet behavior?4. Stolen credentials
370 307 Q1105_5. What do you think are the source(s) for each type of abusive Internet behavior?5. Malware
371 308 Q1117. How common do you feel each type of abusive Internet behavior is?SUMMARY TABLE OF TOP 2 BOX
372 309 Q1117. How common do you feel each type of abusive Internet behavior is?SUMMARY TABLE OF BOTTOM 2 BOX
373 310 Q1117_1. How common do you feel each type of abusive Internet behavior is?1. Phishing
374 311 Q1117_2. How common do you feel each type of abusive Internet behavior is?2. Spamming
375 312 Q1117_3. How common do you feel each type of abusive Internet behavior is?3. Cyber squatting
376 313 Q1117_4. How common do you feel each type of abusive Internet behavior is?4. Stolen credentials
377 314 Q1117_5. How common do you feel each type of abusive Internet behavior is?5. Malware
378 315 Q1121. Have you ever been affected by any of these types of abusive Internet behaviors?SUMMARY TABLE OF YES
379 316 Q1121_1. Have you ever been affected by any of these types of abusive Internet behaviors?1. Phishing
380 317 Q1121_2. Have you ever been affected by any of these types of abusive Internet behaviors?2. Spamming
381 318 Q1121_3. Have you ever been affected by any of these types of abusive Internet behaviors?3. Cyber squatting
382 319 Q1121_4. Have you ever been affected by any of these types of abusive Internet behaviors?4. Stolen credentials
383 320 Q1121_5. Have you ever been affected by any of these types of abusive Internet behaviors?5. Malware
384 321 Q1126. How scared are you of each of the following?SUMMARY TABLE OF TOP 2 BOX
385 322 Q1126. How scared are you of each of the following?SUMMARY TABLE OF BOTTOM 2 BOX
386 323 Q1126_1. How scared are you of each of the following?1. Phishing
387 324 Q1126_2. How scared are you of each of the following?2. Spamming
388 325 Q1126_3. How scared are you of each of the following?3. Cyber squatting
389 326 Q1126_4. How scared are you of each of the following?4. Stolen credentials
390 327 Q1126_5. How scared are you of each of the following?5. Malware
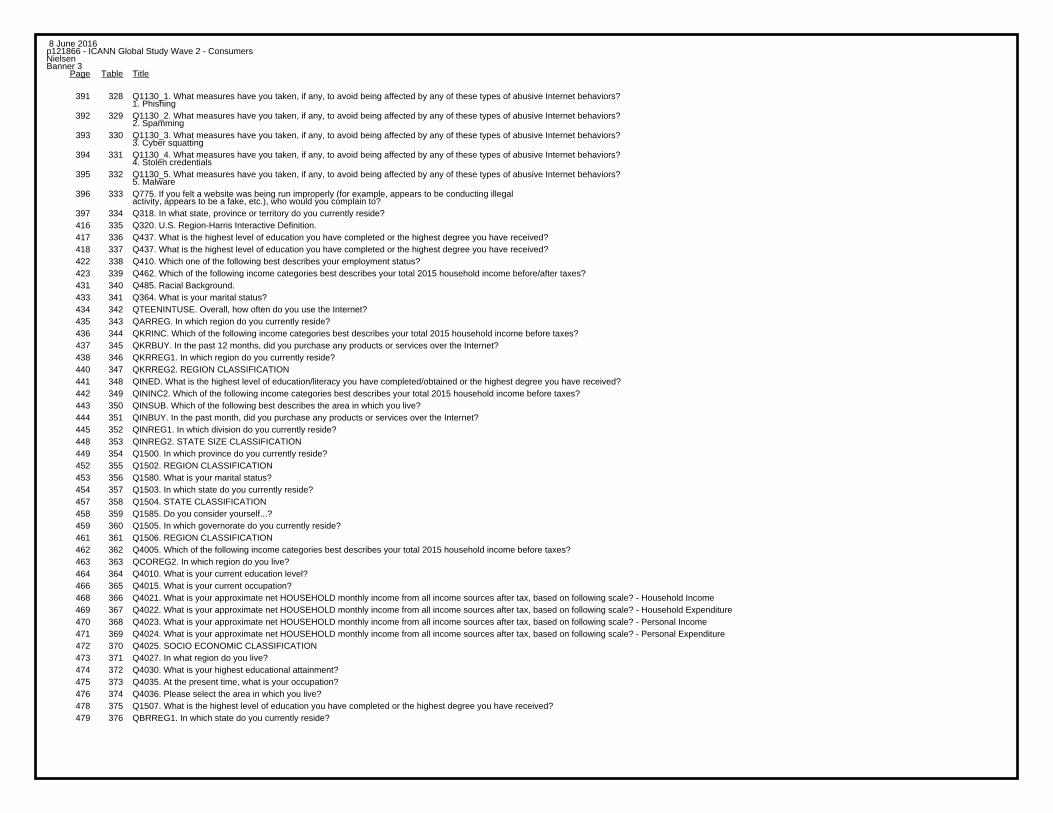
8 June 2016p121866 - ICANN Global Study Wave 2 - ConsumersNielsenBanner 3
TitleTablePage
391 328 Q1130_1. What measures have you taken, if any, to avoid being affected by any of these types of abusive Internet behaviors?1. Phishing
392 329 Q1130_2. What measures have you taken, if any, to avoid being affected by any of these types of abusive Internet behaviors?2. Spamming
393 330 Q1130_3. What measures have you taken, if any, to avoid being affected by any of these types of abusive Internet behaviors?3. Cyber squatting
394 331 Q1130_4. What measures have you taken, if any, to avoid being affected by any of these types of abusive Internet behaviors?4. Stolen credentials
395 332 Q1130_5. What measures have you taken, if any, to avoid being affected by any of these types of abusive Internet behaviors?5. Malware
396 333 Q775. If you felt a website was being run improperly (for example, appears to be conducting illegalactivity, appears to be a fake, etc.), who would you complain to?
397 334 Q318. In what state, province or territory do you currently reside?416 335 Q320. U.S. Region-Harris Interactive Definition.417 336 Q437. What is the highest level of education you have completed or the highest degree you have received?418 337 Q437. What is the highest level of education you have completed or the highest degree you have received?422 338 Q410. Which one of the following best describes your employment status?423 339 Q462. Which of the following income categories best describes your total 2015 household income before/after taxes?431 340 Q485. Racial Background.433 341 Q364. What is your marital status?434 342 QTEENINTUSE. Overall, how often do you use the Internet?435 343 QARREG. In which region do you currently reside?436 344 QKRINC. Which of the following income categories best describes your total 2015 household income before taxes?437 345 QKRBUY. In the past 12 months, did you purchase any products or services over the Internet?438 346 QKRREG1. In which region do you currently reside?440 347 QKRREG2. REGION CLASSIFICATION441 348 QINED. What is the highest level of education/literacy you have completed/obtained or the highest degree you have received?442 349 QININC2. Which of the following income categories best describes your total 2015 household income before taxes?443 350 QINSUB. Which of the following best describes the area in which you live?444 351 QINBUY. In the past month, did you purchase any products or services over the Internet?445 352 QINREG1. In which division do you currently reside?448 353 QINREG2. STATE SIZE CLASSIFICATION449 354 Q1500. In which province do you currently reside?452 355 Q1502. REGION CLASSIFICATION453 356 Q1580. What is your marital status?454 357 Q1503. In which state do you currently reside?457 358 Q1504. STATE CLASSIFICATION458 359 Q1585. Do you consider yourself...?459 360 Q1505. In which governorate do you currently reside?461 361 Q1506. REGION CLASSIFICATION462 362 Q4005. Which of the following income categories best describes your total 2015 household income before taxes?463 363 QCOREG2. In which region do you live?464 364 Q4010. What is your current education level?466 365 Q4015. What is your current occupation?468 366 Q4021. What is your approximate net HOUSEHOLD monthly income from all income sources after tax, based on following scale? - Household Income469 367 Q4022. What is your approximate net HOUSEHOLD monthly income from all income sources after tax, based on following scale? - Household Expenditure470 368 Q4023. What is your approximate net HOUSEHOLD monthly income from all income sources after tax, based on following scale? - Personal Income471 369 Q4024. What is your approximate net HOUSEHOLD monthly income from all income sources after tax, based on following scale? - Personal Expenditure472 370 Q4025. SOCIO ECONOMIC CLASSIFICATION473 371 Q4027. In what region do you live?474 372 Q4030. What is your highest educational attainment?475 373 Q4035. At the present time, what is your occupation?476 374 Q4036. Please select the area in which you live?478 375 Q1507. What is the highest level of education you have completed or the highest degree you have received?479 376 QBRREG1. In which state do you currently reside?
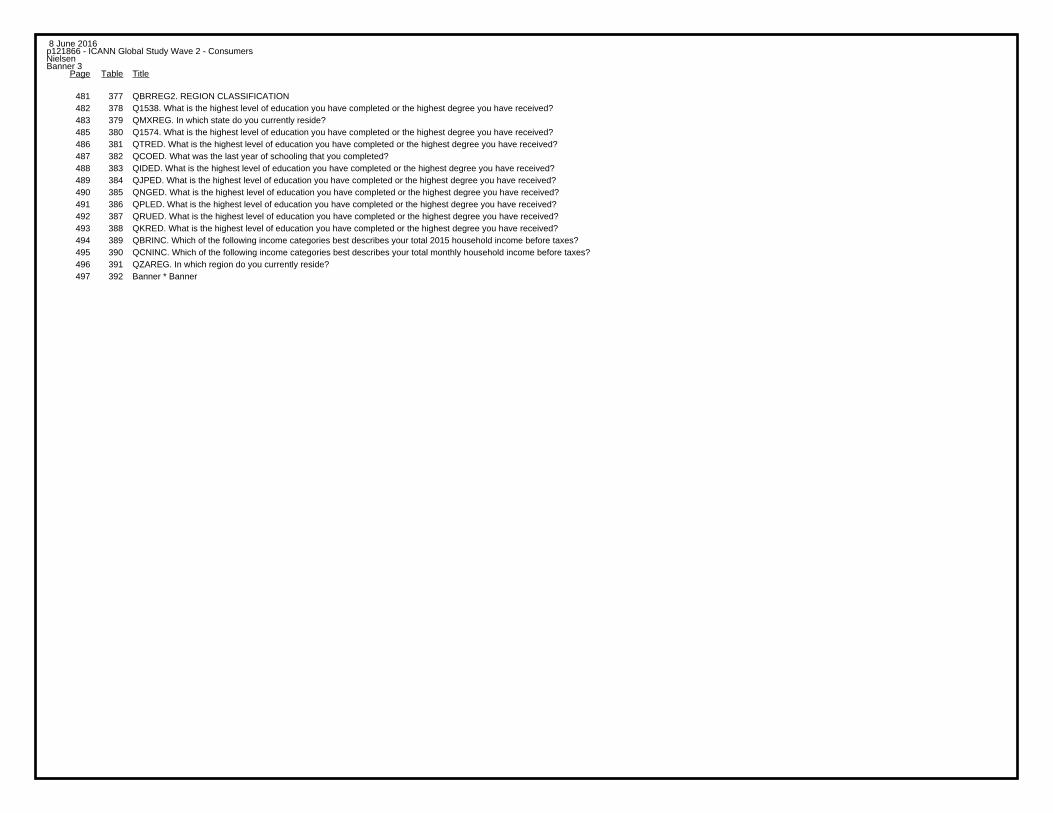
8 June 2016p121866 - ICANN Global Study Wave 2 - ConsumersNielsenBanner 3
TitleTablePage
481 377 QBRREG2. REGION CLASSIFICATION482 378 Q1538. What is the highest level of education you have completed or the highest degree you have received?483 379 QMXREG. In which state do you currently reside?485 380 Q1574. What is the highest level of education you have completed or the highest degree you have received?486 381 QTRED. What is the highest level of education you have completed or the highest degree you have received?487 382 QCOED. What was the last year of schooling that you completed?488 383 QIDED. What is the highest level of education you have completed or the highest degree you have received?489 384 QJPED. What is the highest level of education you have completed or the highest degree you have received?490 385 QNGED. What is the highest level of education you have completed or the highest degree you have received?491 386 QPLED. What is the highest level of education you have completed or the highest degree you have received?492 387 QRUED. What is the highest level of education you have completed or the highest degree you have received?493 388 QKRED. What is the highest level of education you have completed or the highest degree you have received?494 389 QBRINC. Which of the following income categories best describes your total 2015 household income before taxes?495 390 QCNINC. Which of the following income categories best describes your total monthly household income before taxes?496 391 QZAREG. In which region do you currently reside?497 392 Banner * Banner