Embed Size (px)
Citation preview

1
Plankton Community Structure in Saguling Dam Fattreza Ihsan1, Feni Hastuti1, Regina Leny1, Ika Puspitasari1, Alya Fatina Diandari1, Nisrina Sukriandi1, Beo Nada
Rezky1, and Rizkyanti Aulia1 1Institut Teknologi Bandung
Keywords: Saguling Dam, plankton biodiversity, Floating Net Cage, fisheries, organic waste
ABSTRACT Saguling Dam is a semi natural man-made ecosystem which is located at Bandung District, West Java. For the time being, the characteristic of Saguling Dam is changing because of human activity, such as floating net cage (FNC) activity. FNCs on Saguling Dam increase organic waste level at Saguling Dam. This causes plankton communities to change around the FNCs on Saguling Dam. Plankton communities can be used as an aquatic biologic parameter. Aspects that were inspected are the composition, abundance, and diversity of plankton species. This research’s goal is to compare plankton communities at 3 different state of FNC: dense, distant, and vacant; at three different lake depths: 0, 3, and 6 meter(s) below the surface. Plankton communities on each point of point sample is tested using Sorensen’s index. This research’s conclusion is that the diversity index at Saguling Lake is at medium level; the highest plankton abundance is at 3 meters depth, and the highest predominant genus for phytoplankton is Trachelomonas and for zooplankton is Paradileptus. Sorensen’s index results show that there are similiarities of plankton communities at several point samples. 1. INTRODUCTION Saguling Dam is a semi-natural man-made ecosystem which is located at Bandung District, West Java. The construction of Saguling Dam is done by stemming the flow of Citarum River. The condition of Saguling Dam is constantly changing over time, both naturally and based on human activities in the riparian (DAS) mainly due to the activity of floating net cages (FNC)[1]. The existence of FNC increases waste content of Saguling Dam, which took shape in the form of organic waste dominated by nitrogen and phosphorous compounds that derived from fish feed [2]. All accumulated organic waste can affect the community of plankton living in the Saguling Dam. These wastes can increase the content of nitrogen and phosphorus compounds in the waters that affects the abundance and plankton community structure [6]. Therefore, this study was conducted to determine the effect of FNC on plankton community structure as the biological parameter of waters in Saguling Dam. 2. METHOD Study Area The research took place at the Saguling Dam, Bandung District, West Java. In the Citarum River cascade dam system, Saguling Dam is located in the most upstream area compared to the other two Dams, namely Cirata Dam and Jatiluhur Dam. Geographically, Saguling Dam is located at 107o21'58.42” E and 6o54'46.3" S [3]. At the study area, we sampled a total of 9 sites in the three different types of FNC: dense, distant,and vacant. Description of research area is shown in Fig. 1.
Fig. 1 Map of Saguling Dam[3]
Activities Description Data sampling was done on November 14th, 2017 at three different types of FNC: dense, distant, and vacant. Data analysis was done at Laboratory of SITH ITB on 15 - 30 November 2017. Plankton Sampling & Water Sampling and Physical-Chemistry Parameter Plankton sampling was done by towing method using water sampler then filtering water using plankton nets. Sampling was conducted in 3 sites with three different lake depths: 0, 3, and 6 meter(s) below the surface. The samples were poured into the film bottle and preserved later identification. Dissolved oxygen (DO), temperature, pH, ammonium, nitrite, nitrate, and orthophosphate were measured as physical-chemistry parameter of water. Determining the Abundance, Diversity, and Dominance of the Plankton 1 mL of water sample containing plankton from each location and each depth was dropped into Sedgewick rafter, then observed under microscope. Plankton abundance was determined by the following equation that were developed by APHA [4],Plankton diversity index was determined by the formula of Shannon-Wiener index [5] .Plankton dominance index was determined by the formula of Simpson index
17th World Lake Conference, Lake Kasumigaura, Ibaraki, Japan, 2018
891
P1-1

2
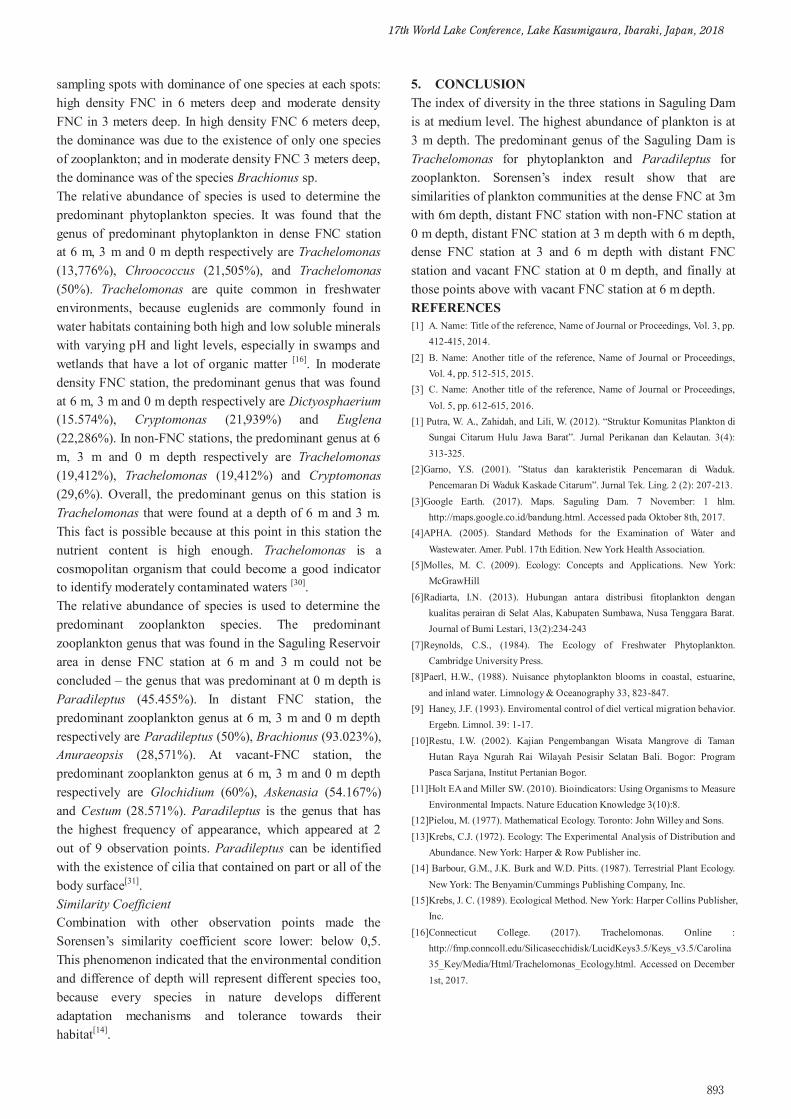
[6].The similarity of planktons in the two locations was determined with the formula of Sorensen Similarity Index (Is) [10].Further analysis was done by using multivariate analysis with MVSP software. 3. RESULTS Plankton Community Analysis Fig. 2 showed that the highest total phytoplankton abundance was found on distant stage of FNC region in 0 m depth (74.875 cell/mL).
Fig. 2 Total phytoplankton abundance in three FNC stations
Total abundance of zooplankton in Saguling Dam is shown on Fig. 3.
Fig. 2 Total phytoplankton abundance in three FNC stations
The highest total abundance of zooplankton (11 cells/mL) was found at distant stage of FNC in the depth of 3 meters. Biological indexes Phytoplankton’s biological indexes that could be analyzed from the results are shown on Table 1. Zooplankton’s biological indexes that could be analyzed from the results are shown on Table 2.
Table 1 Summary of phytoplankton biological index
Table 2 Summary of zooplankton biological index
Similarity Coefficient The points of observation which has the most similar phytoplankton are the high density FNC at 3 m depth with 6 m depth. Its similarity coefficient (Is) value is 0.691. The points of observation which has the most similar zooplankton is the dense FNC in 3 m depth with the vacant FNC in 3 m depth with 0.667 as its similarity coefficient (Is) value. Waters Physical and Chemical Condition Analysis The water temperature at Saguling Dam decreases along with usage of the water for FNC. Water temperature in Saguling Dam was approximately at 30oC. Temperature was declining at 0 m – 3 m, and at 3 m – 6 m. Water pH in
Saguling Dam was approximately at 6.5 – 7.3. The DO level at Saguling Dam was approximately at 2.5 – 5 ppm. The area with the highest DO concentration was distant FNC area. The highest concentration of ammonium was at 6 m depth in the non-FNC area and lowest ammonium concentration was at 0 m depth in the dense FNC area, and highest nitrate concentrations were found in non-FNC areas and the nitrite concentrations were not stable. 4. DISCUSSION Plankton Community Analysis The depth of 0 m in the lake ecosystem belongs to the epilimnion layer or 'mixed layer'. This layer gets the best light intensity especially during the daytime. Phytoplankton tends to move on the water surface (horizontal movement) to get enough light to support the process of photosynthesis. If supported with adequate nutrients such as in the distant type of FNC region, the phytoplankton will have a high abundance in the epilimnion layer [7][8]. The highest total abundance of zooplankton (11 cells/mL) was found in Station 2 in the depth of 3 meters. This is due to the vertical migration pattern of zooplankton; in daytime, zooplanktons tend to stay at the epilimnion layer of the lake (0-5 meters deep) and will move towards hypolimnion layer (5-10 meters deep) at nighttime [9]. Biological Indexes The three stations generally have moderate diversity. This explains that Saguling Dam’s phytoplankton community structure has enough productivity, balanced ecosystem, and currently under moderate ecological pressure [10]. This is in line with the fact that the Saguling Dam is the location of many human activities (e.g. fisheries and aquaculture, also recreation) – this may be the cause of the ‘ecological pressure’ mentioned before [11]. Index of phytoplankton evenness in all three stations indicates that all phytoplankton are distributed quite evenly until almost evenly [12]. Therefore, it can be concluded that the stability of a community in different spots and depth of sampling is moderate [12], due to no existence of a species that dominates the others [13] (equal proportions of individual numbers). There are no dominance existed – dominance exists if the value of the index of dominance is close to 1[15]. In all three stations, zooplankton community generally have low to moderate diversity. This is caused by the fact that the Saguling Dam is the location of many anthropogenic activities – the same thing that affects phytoplankton’s diversity [11]. On the other hand, zooplankton’s index of evenness is similar with phytoplankton’s. On stations with greatly even distribution of individuals, the index of evenness will be greater – and vice versa [13]. There was one spot with exactly only one species of zooplankton (High density FNC in 6 meters deep); therefore the evenness index of this spot cannot be calculated. There are also some
17th World Lake Conference, Lake Kasumigaura, Ibaraki, Japan, 2018
892
3
sampling spots with dominance of one species at each spots: high density FNC in 6 meters deep and moderate density FNC in 3 meters deep. In high density FNC 6 meters deep, the dominance was due to the existence of only one species of zooplankton; and in moderate density FNC 3 meters deep, the dominance was of the species Brachionus sp. The relative abundance of species is used to determine the predominant phytoplankton species. It was found that the genus of predominant phytoplankton in dense FNC station at 6 m, 3 m and 0 m depth respectively are Trachelomonas (13,776%), Chroococcus (21,505%), and Trachelomonas (50%). Trachelomonas are quite common in freshwater environments, because euglenids are commonly found in water habitats containing both high and low soluble minerals with varying pH and light levels, especially in swamps and wetlands that have a lot of organic matter [16]. In moderate density FNC station, the predominant genus that was found at 6 m, 3 m and 0 m depth respectively are Dictyosphaerium (15.574%), Cryptomonas (21,939%) and Euglena (22,286%). In non-FNC stations, the predominant genus at 6 m, 3 m and 0 m depth respectively are Trachelomonas (19,412%), Trachelomonas (19,412%) and Cryptomonas (29,6%). Overall, the predominant genus on this station is Trachelomonas that were found at a depth of 6 m and 3 m. This fact is possible because at this point in this station the nutrient content is high enough. Trachelomonas is a cosmopolitan organism that could become a good indicator to identify moderately contaminated waters [30]. The relative abundance of species is used to determine the predominant zooplankton species. The predominant zooplankton genus that was found in the Saguling Reservoir area in dense FNC station at 6 m and 3 m could not be concluded – the genus that was predominant at 0 m depth is Paradileptus (45.455%). In distant FNC station, the predominant zooplankton genus at 6 m, 3 m and 0 m depth respectively are Paradileptus (50%), Brachionus (93.023%), Anuraeopsis (28,571%). At vacant-FNC station, the predominant zooplankton genus at 6 m, 3 m and 0 m depth respectively are Glochidium (60%), Askenasia (54.167%) and Cestum (28.571%). Paradileptus is the genus that has the highest frequency of appearance, which appeared at 2 out of 9 observation points. Paradileptus can be identified with the existence of cilia that contained on part or all of the body surface[31]. Similarity Coefficient Combination with other observation points made the Sorensen’s similarity coefficient score lower: below 0,5. This phenomenon indicated that the environmental condition and difference of depth will represent different species too, because every species in nature develops different adaptation mechanisms and tolerance towards their habitat[14].
5. CONCLUSION The index of diversity in the three stations in Saguling Dam is at medium level. The highest abundance of plankton is at 3 m depth. The predominant genus of the Saguling Dam is Trachelomonas for phytoplankton and Paradileptus for zooplankton. Sorensen’s index result show that are similarities of plankton communities at the dense FNC at 3m with 6m depth, distant FNC station with non-FNC station at 0 m depth, distant FNC station at 3 m depth with 6 m depth, dense FNC station at 3 and 6 m depth with distant FNC station and vacant FNC station at 0 m depth, and finally at those points above with vacant FNC station at 6 m depth. REFERENCES [1] A. Name: Title of the reference, Name of Journal or Proceedings, Vol. 3, pp.
412-415, 2014. [2] B. Name: Another title of the reference, Name of Journal or Proceedings,
Vol. 4, pp. 512-515, 2015. [3] C. Name: Another title of the reference, Name of Journal or Proceedings,
Vol. 5, pp. 612-615, 2016. [1] Putra, W. A., Zahidah, and Lili, W. (2012). “Struktur Komunitas Plankton di
Sungai Citarum Hulu Jawa Barat”. Jurnal Perikanan dan Kelautan. 3(4): 313-325.
[2]Garno, Y.S. (2001). ”Status dan karakteristik Pencemaran di Waduk. Pencemaran Di Waduk Kaskade Citarum”. Jurnal Tek. Ling. 2 (2): 207-213.
[3]Google Earth. (2017). Maps. Saguling Dam. 7 November: 1 hlm. http://maps.google.co.id/bandung.html. Accessed pada Oktober 8th, 2017.
[4]APHA. (2005). Standard Methods for the Examination of Water and Wastewater. Amer. Publ. 17th Edition. New York Health Association.
[5]Molles, M. C. (2009). Ecology: Concepts and Applications. New York: McGrawHill
[6]Radiarta, I.N. (2013). Hubungan antara distribusi fitoplankton dengan kualitas perairan di Selat Alas, Kabupaten Sumbawa, Nusa Tenggara Barat. Journal of Bumi Lestari, 13(2):234-243
[7]Reynolds, C.S., (1984). The Ecology of Freshwater Phytoplankton. Cambridge University Press.
[8]Paerl, H.W., (1988). Nuisance phytoplankton blooms in coastal, estuarine, and inland water. Limnology & Oceanography 33, 823-847.
[9] Haney, J.F. (1993). Enviromental control of diel vertical migration behavior. Ergebn. Limnol. 39: 1-17.
[10] Restu, I.W. (2002). Kajian Pengembangan Wisata Mangrove di Taman Hutan Raya Ngurah Rai Wilayah Pesisir Selatan Bali. Bogor: Program Pasca Sarjana, Institut Pertanian Bogor.
[11]Holt EA and Miller SW. (2010). Bioindicators: Using Organisms to Measure Environmental Impacts. Nature Education Knowledge 3(10):8.
[12]Pielou, M. (1977). Mathematical Ecology. Toronto: John Willey and Sons. [13]Krebs, C.J. (1972). Ecology: The Experimental Analysis of Distribution and
Abundance. New York: Harper & Row Publisher inc. [14] Barbour, G.M., J.K. Burk and W.D. Pitts. (1987). Terrestrial Plant Ecology.
New York: The Benyamin/Cummings Publishing Company, Inc. [15]Krebs, J. C. (1989). Ecological Method. New York: Harper Collins Publisher,
Inc. [16]Connecticut College. (2017). Trachelomonas. Online :
http://fmp.conncoll.edu/Silicasecchidisk/LucidKeys3.5/Keys_v3.5/Carolina35_Key/Media/Html/Trachelomonas_Ecology.html. Accessed on December 1st, 2017.
2
[6].The similarity of planktons in the two locations was determined with the formula of Sorensen Similarity Index (Is) [10].Further analysis was done by using multivariate analysis with MVSP software. 3. RESULTS Plankton Community Analysis Fig. 2 showed that the highest total phytoplankton abundance was found on distant stage of FNC region in 0 m depth (74.875 cell/mL).
Fig. 2 Total phytoplankton abundance in three FNC stations
Total abundance of zooplankton in Saguling Dam is shown on Fig. 3.
Fig. 2 Total phytoplankton abundance in three FNC stations
The highest total abundance of zooplankton (11 cells/mL) was found at distant stage of FNC in the depth of 3 meters. Biological indexes Phytoplankton’s biological indexes that could be analyzed from the results are shown on Table 1. Zooplankton’s biological indexes that could be analyzed from the results are shown on Table 2.
Table 1 Summary of phytoplankton biological index
Table 2 Summary of zooplankton biological index
Similarity Coefficient The points of observation which has the most similar phytoplankton are the high density FNC at 3 m depth with 6 m depth. Its similarity coefficient (Is) value is 0.691. The points of observation which has the most similar zooplankton is the dense FNC in 3 m depth with the vacant FNC in 3 m depth with 0.667 as its similarity coefficient (Is) value. Waters Physical and Chemical Condition Analysis The water temperature at Saguling Dam decreases along with usage of the water for FNC. Water temperature in Saguling Dam was approximately at 30oC. Temperature was declining at 0 m – 3 m, and at 3 m – 6 m. Water pH in
Saguling Dam was approximately at 6.5 – 7.3. The DO level at Saguling Dam was approximately at 2.5 – 5 ppm. The area with the highest DO concentration was distant FNC area. The highest concentration of ammonium was at 6 m depth in the non-FNC area and lowest ammonium concentration was at 0 m depth in the dense FNC area, and highest nitrate concentrations were found in non-FNC areas and the nitrite concentrations were not stable. 4. DISCUSSION Plankton Community Analysis The depth of 0 m in the lake ecosystem belongs to the epilimnion layer or 'mixed layer'. This layer gets the best light intensity especially during the daytime. Phytoplankton tends to move on the water surface (horizontal movement) to get enough light to support the process of photosynthesis. If supported with adequate nutrients such as in the distant type of FNC region, the phytoplankton will have a high abundance in the epilimnion layer [7][8]. The highest total abundance of zooplankton (11 cells/mL) was found in Station 2 in the depth of 3 meters. This is due to the vertical migration pattern of zooplankton; in daytime, zooplanktons tend to stay at the epilimnion layer of the lake (0-5 meters deep) and will move towards hypolimnion layer (5-10 meters deep) at nighttime [9]. Biological Indexes The three stations generally have moderate diversity. This explains that Saguling Dam’s phytoplankton community structure has enough productivity, balanced ecosystem, and currently under moderate ecological pressure [10]. This is in line with the fact that the Saguling Dam is the location of many human activities (e.g. fisheries and aquaculture, also recreation) – this may be the cause of the ‘ecological pressure’ mentioned before [11]. Index of phytoplankton evenness in all three stations indicates that all phytoplankton are distributed quite evenly until almost evenly [12]. Therefore, it can be concluded that the stability of a community in different spots and depth of sampling is moderate [12], due to no existence of a species that dominates the others [13] (equal proportions of individual numbers). There are no dominance existed – dominance exists if the value of the index of dominance is close to 1[15]. In all three stations, zooplankton community generally have low to moderate diversity. This is caused by the fact that the Saguling Dam is the location of many anthropogenic activities – the same thing that affects phytoplankton’s diversity [11]. On the other hand, zooplankton’s index of evenness is similar with phytoplankton’s. On stations with greatly even distribution of individuals, the index of evenness will be greater – and vice versa [13]. There was one spot with exactly only one species of zooplankton (High density FNC in 6 meters deep); therefore the evenness index of this spot cannot be calculated. There are also some
17th World Lake Conference, Lake Kasumigaura, Ibaraki, Japan, 2018
893

1
Microbial competition for acetate: an important factor to mitigate methane emission from Sasa-invaded wetland soils
Tomo AOYAGI1, Cuong Tu HO2, Takashi NARIHIRO1, Daisuke MAYUMI1, Atsushi OGATA1, Hiroshi HABE1, and Tomoyuki HORI1
1 National Institute of Advanced Industrial Science and Technology (AIST), Japan, 2 Vietnam Academy of Science and Technology (VAST), Vietnam
Keywords: Sasa-invaded wetland soil; stable isotope probing; acetate; uncultured microorganism
ABSTRACT
Acetate is the most important precursor to CH4 during anaerobic degradation of organic matters. Wetland soils are a significant source of atmospheric CH4 and their invasion by Sasa (bamboo) species results in the decrease of the CH4 emission. However, the microbial interspecies competition for acetate is largely unknown. Here, we identified actively acetate-assimilating microorganisms by ultra-high-sensitivity rRNA-stable isotope probing with 13C-labeled acetate. The Sasa-invaded soil slurry was amended with 13C-acetate at a concentration of 5 mM and afterwards incubated anaerobically in the dark at 25°C for 2 weeks. A gradual degradation of the acetate amended was accompanied with the production of CH4 and CO2 during the incubation. RNA was extracted from the slurries at week 2 and density-separated by isopycnic centrifugation according to molecular weight. Microbial communities in density fractions of rRNA were comprehensively screened by high-throughput Illumina sequencing. Methanosaeta spp. responsible for aceticlastic methanogenesis were significantly labeled with the acetate 13C. Notably, 34 different species of Bacteria were identified as the active 13C-acetate assimilators. One of them was closely related to the dehalo-respiring Dehalogenimonas alkenigignens with acetate-oxidizing activity. The others were phylogenetically novel, exhibiting quite low sequence similarities (i.e., 77.8%−92.5%) of 16S rRNA genes from cultured relatives. The result of this study demonstrated for the first time that hitherto unidentified bacterial species as well as a known dehalogenating bacterium significantly assimilated acetate, thereby being competitive with aceticlastic methanogens in the Sasa-invaded wetland soils.
1. INTRODUCTION
Acetate is an important precursor to CH4 during anaerobic degradation of organic matters, and it is mostly utilized by aceticlastic methanogens [1]. Wetland soils are a significant source of atmospheric CH4 and their invasion by Sasa (bamboo) species results in the decrease of the CH4 emission (Table 1)[2] . The potential competitors of aceticlastic methanogens are microorganisms catalyzing anaerobic acetate oxidation. However, this reaction is highly endergonic (ΔGº’=+105 kJ mol−1). The diversity and ecology of the acetate-oxidizing microorganisms are largely unknown.
Table 1 Environmental characteristics in the study site [2]
Gas flux (g-C m−2 y−1)
Sasa-invaded wetland
(Vegetation type: Sasa palmata)
Wetland (Vegetation type: Sphagum spp.)
CH4 6.6 ± 6.2 13.2 ± 3.5 CO2 223.8 ± 3.5 5.8 ± 31.1
Recently, we have developed ultra-high-sensitivity
stable isotope probing of rRNA (rRNA-SIP) to thoroughly characterize the metabolic function of uncultured microorganisms in natural environments [3]. The objective of this study was to identify actively acetate-assimilating microorganisms in anoxic Sasa-invaded wetland soil by ultra-high-sensitivity rRNA-SIP with 13C-labeled acetate.
2. METHOD A Sasa-invaded wetland soil was collected in Bibai, Hokkaodo, Japan. Soil slurry was prepared by mixing the soil with sterilized water at a ratio of 1:4 (v/v). Aliquots (20ml) of the homogenized slurry were transferred anaerobically into 50-ml serum vials. The head space of each sample vial was flushed with N2. Four soils were produced: (i) a non-autoclaved soil amended with 13C-labeled acetate to a final concentration of 5 mM (13C treatment), (ii) a non-autoclaved soil with amended with unlabeled acetate to a final concentration of 5 mM (unlabeled treatment), (iii) a non-autoclaved soil with addition of sterilized water in place of acetate (no acetate addition), and (iv) an autoclaved soil amended with unlabeled acetate to a final concentration of 5 mM (heat-
17th World Lake Conference, Lake Kasumigaura, Ibaraki, Japan, 2018
894
P1-2

2
killed treatment). All treatments were run in triplicate with static incubation for 4 weeks at 25 °C in the dark. Samples of the head space gas, slurry water and solid-phase soil were taken at week 0, 1, 2, and 4 from each vial. Total CH4 and CO2 in the head space gas were analyzed by dual-detection gas chromatography (GC) with both thermal conductivity and flame ionization detectors as described previously [4]. The carbon isotopic composition of gaseous CH4 and CO2 were measured with GC-combustion-isotope ratio mass spectrometry [5]. The concentration of acetate from the slurry water was determined by high-pressure liquid chromatography [4]. RNA was extracted from the slurries at week 2 and density-separated by isopycnic centrifugation (128,000 g for >60 hours at 20°C [3]). Gradients of density-separated RNAs were fractionated in triplicate. The heaviest (1H), second-heaviest (2H), and light (L) fractions of RNA with buoyant density of 1.796–1.798, 1.788–1.791 and 1.769–1.772 g ml–1, respectively, were subjected to RT-PCR. Microbial communities in density fractions of RNA were comprehensively screened by high-throughput Illumina sequencing of V4 region of 16S rRNA transcripts. The sequences in each sample were characterized phylo-genetically using the QIIME software [6]. DNA was extracted from the slurries at week 0 of the 13C treatment and was used as PCR template for PCR amplification of the V4 region of 16S rRNA genes. Then, Illumina sequencing was conducted. 3. RESULT AND DISCUSSION Under both the 13C and the unlabeled treatments, biogeochemical activities were almost same. With respect to the slurry water of the both treatment samples, the acetate concentration decreased to 1.44−1.64 mM at week 2 and was completely depleted at the end of the incubation. On the other hand, the acetate concentration kept constant in the heat-killed treatment. In the gaseous phase of the two treatments, CH4 and CO2 were produced after the beginning of the incubation. The concentrations of CH4 and CO2 increased by 0.778−0.784 mM and 1.986−2.106 mM, respectively, at week 2. The production of CH4 and CO2 in the control treatment (no acetate addition) was less than those in the 13C and unlabeled treatments. These data indicated that acetate was converted to CH4 and CO2 by soil microbial communities. The fate of 13C-labeled acetate was traced by monitoring the 13C atom percentage of the gaseous products CH4 and CO2 over the incubation time. 13CH4 and 13CO2 were produced from the start of the incubation and increased by 1.14 mM and 0.74 mM at week 2, respectively. We phylogenetically characterized the 1H, 2H, and L
fractions of RNA from the 13C and unlabeled treatments by high-throughput Illumina sequencing. The total number of 16S rRNA molecules analyzed in 18 density fractions was around 3.1 million, corresponding to an average of 173,000 sequences per library. Phylum and class level phylogenetic analysis indicated that no significant changes with the increase in BDs were observed in either treatment. Nevertheless, high-resolution operational taxonomic unit (OTU)-level survey identified 36 microbial OTUs exhibiting significantly higher relative abundances in the 13C treatment than in the unlabeled treatment. Methanosaeta spp. responsible for aceticlastic methanogenesis were significantly labeled with the acetate 13C. Notably, 34 different species of Bacteria were identified as the active 13C-acetate assimilators. One of them was closely related to the dehalo-respiring Dehalogenimonas alkenigignens with acetate-oxidizing activity. The others were phylogenetically novel, exhibiting quite low sequence similarities (i.e., 77.8%−92.5%) of 16S rRNA genes from cultured relatives. As a result of analyzing the relative abundances of the 36 13C-incorporating OTUs at week 0, the identified acetate oxidizer OTUs were low-abundance (< 0.15% of the total). 4. CONCLUSION
This study demonstrated for the first time that hitherto unidentified low-abundance bacterial species as well as a known dehalogenating bacterium significantly assimilated acetate, thereby being highly competitive with aceticlastic methanogens in the Sasa-invaded wetland soils. REFERENCES
[1] S. Hattori: Syntrophic acetate-oxidizing microbes in methanogenic environments, Microbes Environ, Vol. 23, pp. 118-127, 2008.
[2] T. Narihiro et al,: The impact of aridification and vegetation type on changes in the community structure of methane-cycling microorganisms in Japanese wetland soils, Biosci Biotechnol Biochem, Vol. 75, pp. 1727-1734, 2011.
[3] T. Aoyagi et al,: Ultra-high-sensitivity stable-isotope probing of rRNA by high-throughput sequencing of isopycnic centrifugation gradients, Environ Microbiol Rep, Vol. 7, pp. 282-287, 2015.
[4] T. Aoyagi et al,: Dynamic transition of chemolithotrophic sulfur-oxidizing bacteria in response to amendment with nitrate in deposited marine sediments, Front in Microbiol, Vol. 6, 426, pp. 1-12, 2015.
[5] D. Mayumi et al,: Methane production from coal by a single methanogen, Science, Vol. 354, pp. 222-225, 2016.
[6] J.G. Caporaso et al,: QIIME allows analysis of high-throughput community sequencing data, Nat Methods, Vol. 7, pp. 335-336, 2010.
17th World Lake Conference, Lake Kasumigaura, Ibaraki, Japan, 2018
895

1
A New Hypothesis for the Declining Cause of the Japanese Eel. Atsunobu Hamada and Akio Kikuchi1
1Specified Nonprofit Corporation
Keywords: Japanese Eel, Declining Cause, L. Kasumigaura, The Tone R., Water gates, Water resource Development.
ABSTRACT
A hypothesis to explain the cause of the decline in Japanese eel Anguilla japonica is proposed ,based on the
analysis of catch trends and information on environments downstream of the Tone River. It was evident that the Tone
River used to contribute more than 80% of the total spawning. Spawning migration was inhibited by a water gate
constructed in 1963, and by the complete closure in 1975. Based on this, a hypothesis was proposed, stating that the
Japanese eel decline was caused by the inhibition of spawning and upstream migration of eels into lakes, which were
used as habitats, due to the water resource development projects. Support for this hypothesis was obtained by examining
the parent-child relationship and the influences of the project on catches in areas other than the gate.
1. INTRODUCTION
The catch of Japanese eel, one of the most important
fishery resources in Japan, has declined greatly since
around 1970. The causes have been studied focusing on
the three hypotheses: excessive fishing, regime shift of
the ocean [1,2], and the environmental destruction of
rivers and lakes [3], but the exact cause has not yet been
determined. .This study attempted to obtain a new
hypothesis for the causes of the resource decline in the
Japanese eel A. japonica by studying fishery information
downstream of the Tone R., the greatest fishing ground
and once shared about 30% of the eel catch and 80% of
glass eels. First, a hypothesis on the decline cause was
suggested by examining the characteristics of temporal
changes in catches in two different sections of the Tone
River system and in other areas. The hypothesis was
examined using the parent–child relationship and the
influences of development projects on catches in areas
other than the Tone Rover system..
2. METHOD The location downstream of the Tone River is shown in
Fig. 1. The Tone River is 322-km long, has a drainage
area of 16,840 km2. Lake Kasumigaura is the second
largest shallow eutrophic lake in Japan with a drainage
area of 2,157 km2.
Fig.1. Location of douwnstreem of the Tone R.
Approximately 1000 fishermen fish for eel, pond smelt,
gobies, and shrimp so on in the lake, which was
originally brackish with indirect connections to the
Pacific Ocean via the Hitachitone and Tone Rivers. In
1963, the Hitachigawa gate was constructed at the outlet
of the lake to accelerate water resource utilization The
construction of the gate started in 1959 and was
completed in 1963. The gate was occasionally closed
from 1964 to 1974, and has been completely closed to all
but downward flow since 1975. Since then, the water in
the lake has been maintained 0.3-m higher than before the
water resource was supplied, in accordance with the
development plan, from 1996.
17th World Lake Conference, Lake Kasumigaura, Ibaraki, Japan, 2018
896
P1-3

1
A New Hypothesis for the Declining Cause of the Japanese Eel. Atsunobu Hamada and Akio Kikuchi1
1Specified Nonprofit Corporation
Keywords: Japanese Eel, Declining Cause, L. Kasumigaura, The Tone R., Water gates, Water resource Development.
ABSTRACT
A hypothesis to explain the cause of the decline in Japanese eel Anguilla japonica is proposed ,based on the
analysis of catch trends and information on environments downstream of the Tone River. It was evident that the Tone
River used to contribute more than 80% of the total spawning. Spawning migration was inhibited by a water gate
constructed in 1963, and by the complete closure in 1975. Based on this, a hypothesis was proposed, stating that the
Japanese eel decline was caused by the inhibition of spawning and upstream migration of eels into lakes, which were
used as habitats, due to the water resource development projects. Support for this hypothesis was obtained by examining
the parent-child relationship and the influences of the project on catches in areas other than the gate.
1. INTRODUCTION
The catch of Japanese eel, one of the most important
fishery resources in Japan, has declined greatly since
around 1970. The causes have been studied focusing on
the three hypotheses: excessive fishing, regime shift of
the ocean [1,2], and the environmental destruction of
rivers and lakes [3], but the exact cause has not yet been
determined. .This study attempted to obtain a new
hypothesis for the causes of the resource decline in the
Japanese eel A. japonica by studying fishery information
downstream of the Tone R., the greatest fishing ground
and once shared about 30% of the eel catch and 80% of
glass eels. First, a hypothesis on the decline cause was
suggested by examining the characteristics of temporal
changes in catches in two different sections of the Tone
River system and in other areas. The hypothesis was
examined using the parent–child relationship and the
influences of development projects on catches in areas
other than the Tone Rover system..
2. METHOD The location downstream of the Tone River is shown in
Fig. 1. The Tone River is 322-km long, has a drainage
area of 16,840 km2. Lake Kasumigaura is the second
largest shallow eutrophic lake in Japan with a drainage
area of 2,157 km2.
Fig.1. Location of douwnstreem of the Tone R.
Approximately 1000 fishermen fish for eel, pond smelt,
gobies, and shrimp so on in the lake, which was
originally brackish with indirect connections to the
Pacific Ocean via the Hitachitone and Tone Rivers. In
1963, the Hitachigawa gate was constructed at the outlet
of the lake to accelerate water resource utilization The
construction of the gate started in 1959 and was
completed in 1963. The gate was occasionally closed
from 1964 to 1974, and has been completely closed to all
but downward flow since 1975. Since then, the water in
the lake has been maintained 0.3-m higher than before the
water resource was supplied, in accordance with the
development plan, from 1996.
2
Catch data. The data are from “The Annual report of
catch statistics on fishery and aquiculture” (Ministry of
Agriculture, Forestry and Fisheries..In “The Annual
report of catch statistics on fishery and aquiculture”,
catches are recorded as “eel” or “seed.” Here, “eel”
represents individuals weighing over 150 g, which are
edible, and “seed” represents glass eel.
3. RESULTS The changes in catches and the ratio of the Tone R.
system to the total catch The catches are shown in Fig. 2
and the ratio of the Tone R. system to the total catch in
Fig. 3. The proportion of the Tone River system catch to
the total eel catch fluctuated around 30% until 1975,
began to decline in 1976..The ratio of total glass eel was
84% in 1962, but declined since 1970.
Relationship between the eel catch in Lake
Kasumigaura and the total glass eel catch. The
relationship between the eel catch in Lake Kasumigaura
and the total glass eel catch is shown in Fig. 4.There was
a positive correlation between both. The relationship is
given by the following equation:
YGW = 0.69XEK + 13 (R2 = 0.92).
This suggests that Lake Kasumigaura may provide a large
proportion of parents for spawning.
4. DISCUSSION Characteristics of the Tone River system. The ratio of
the Tone River system catch to the total glass eel catch
exceeded 70% before the construction of the gates..In
addition, the total glass eel catch is proportional to the eel
catch in Lake Kasumigaura. Therefore, the main decline
cause may be attributed to the use of Lake Kasumigaura
for water resource development.
A new hypothesis. There may be another more likely
reason than conventional ones. Thus, the hypothesis
states that the decline was caused by the Kasumigaura
Development Project.
Verification of the hypothesis. Evidence to support this
is needed to verify the following two examinations.
A. Use of the Hitachigawa Gate caused the decrease in
the eel catch in areas other than the Tone River system.
B. The correlation exists between the parent of the Tone
River system and the total glass eel catch, and no
correlation between eel in other areas and the total glass
eel catch.
Examination A. The effect of the gates on catches in
other areas could be caused by the decline in glass eel
recruitment, because recruitment is dependent on a
common origin of spawning [4], which is largely
influenced by the eel resource of the Tone River system.
Therefore, the catches in other areas must have declined
in 1963 (completion of the gate), 1975 (start of complete
closure of the gate), and 1996 (start of water resource
administration). Fig. 5 shows the temporal changes in the
total eel catch in other areas except for the Tone River
system. The eel catch decreased drastically in 1970, 1982,
and 2003. The times 7 years exceed these fallings agree
with these.. Two of those 7 years are for spawning and
transportation of larvae to the Japanese archipelago, and
for growing to parents. Hence, there is evidence to
support examination A.
Examination B The second examination aims to
confirm that a correlation exists between parent fish of
the Tone River system and glass eel recruitment. The
relationship between the eel catch in the Tone River
system and the total glass eel catch 2-years later across
the whole country was examined in Fig.6 (left). In Fig. 6
the open circles represent the catches in 1964–1970,
during the construction of the Tone River Mouth Gate.
Hence, the correlation was estimated using logistic
regression, with the exception of data from the
construction period of the gate. This is given by the
following equation (R2=0.89):
Y = Y max /(1 + exp(aX + b )) (1)
where Y, Y max, X, a, and b represent the glass eel catch
2-years later, the maximum of Y, the eel catch in the Tone
River system, and coefficients. . The values X, a, and b
are 247, -0.0060, and 3.53, respectively. This relationship
confirms that the parent fish in the Tone River system
result in larvae recruitment across the whole country.
Fig.6 (right) shows the relationship between the glass eel
17th World Lake Conference, Lake Kasumigaura, Ibaraki, Japan, 2018
897

3
catch in the whole country 2-years later and the eel catch
in other areas except the Tone River system. There is no
clear correlation between the both. This shows that the
other areas have little effect on the recruitment of glass
eel. However, a detailed analysis revealed that a weak
correlation exists when the catch is below 1250 t.
This relationship can be also expressed by equation (1),
and Y max, a, and b are 24, -0.002, and 1.24, respectively.
The relationship between the eel catch and the glass eel
catch corresponds to the parent-child relationship of the
Japanese eel, and can be estimated using a logistic curve.
The Ymax values and the coefficients correspond to the
carrying capacity, and the population growth rate.
The carrying capacities of glass eel in the Tone River
system and the other areas were estimated to be 247 and
24 t. Hence, the effect of the other areas will be
essentially less. Therefore, it can be concluded that the
new hypothesis mentioned above may be effective.
REFERENCES [1] S.Kimura et al 2001. Fish Oceanography 10: 51–60.
[2] K. Zenimoto et al 2003 Journa of Fish Biology 74:
1878–1890
[3] H.Itakura et al 2011. Landscape Ecological
Engineering 11: 147–160.
[4] K.Tsukamoto et al 2011. Nature Communicatios 2:
179.
Fig.2 Changes in catches.
Fig.4. Relation between eel catch in L.Kasumigaura
and total glass eel catch.
Fig.3. [Tone R. System] / [Total] in catches.
Fig.5. Changes in total eel catch in other
areas except the Tone R. system.
Except
Fig.6. Relation between total glass eel catch and eel catch in
Tone R. System (left), and in other areas (right).
17th World Lake Conference, Lake Kasumigaura, Ibaraki, Japan, 2018
898

1
Nelumbo nucifera)
DNA HRM6
1.
DNA
Ming et al. 2013[ ], Wang et al. 2013[ ] ddRAD-seq
(SNP) DNA
2.
SNPBLAST
Primer3 PCR 80 bp 110 bp SNP
BLAST
42 2 (N. lutea) 1LightCycler 96
High Resolution Melt (HRM)DNA
Past 3.18 (Hammer 1999-2017) UPGMA
80
100, 200, 300, 400, 600, 800 ppm 750nm
FlexStation 3 Microplate Reader, Molecular Device Japan Co., Ltd. 3.
ddRAD-seq 4901 SNP1248
351 DNA 191DNADNA 6
17th World Lake Conference, Lake Kasumigaura, Ibaraki, Japan, 2018
899
P1-4

2
45 28
54
62.91 mg/100 gfw (
4.
10
6
( 41.0-131.0
5.
DNA
[1] Ming R, VanBuren R, Liu Y, Yang M, Han Y, Li L-T, Zhang Q,
Kim M-J, Schatz MC, Campbell M, Li J, Bowers JE, Tang H, Lyons E, Ferguson AA, Narzisi G, Nelson DR, Blaby-Haas CE, Gschwend AR, Jiao Y, Der JP, Zeng F, Han J, Min X, Hudson KA, Singh R, Grennan AK, Karpowicz SJ, Watling JR, Ito K, Robinson SA, Hudson ME, Yu Q, Mockler TC, Carroll A, Zheng Y, Sunkar R, Jia R, Chen N, Arro J, Wai C, Wafula E, Spence A, Han Y, Xu L, Zhang J, Peery R, Haus MJ, Xiong W, Walsh JA, Wu J, Wang M-L, Zhu YJ, Paull RE, Britt AB, Du C, Downie SR, Schuler MA, Michael TP, Long SP, Ort DR, William Schopf J, Gang DR, Jiang N, Yandell M, dePamphilis CW, Merchant SS, Paterson AH, Buchanan BB, Li S, Shen-Miller J (2013) Genome of the long-living sacred lotus (Nelumbo nucifera Gaertn.). Genome Biol 14:R41,2013
[2] Wang Y, Fan G, Liu Y, Sun F, Shi C, Liu X, Peng J, Chen W, Huang X, Cheng S, Liu Y, Liang X, Zhu H, Bian C, Zhong L, Lv T, Dong H, Liu W, Zhong X, Chen J, Quan Z, Wang Z,
Tan B, Lin C, Mu F, Xu X, Ding Y, Guo A-Y, Wang J, Ke W(2013): Genome of the long-living sacred lotus (Nelumbo nucifera Gaertn.), The sacred lotus genome provides insights into the evolution of flowering plants. Plant J 76:557–567 ,2013
[3] Koressaar T, Remm M (2007) Enhancements and modifications of primer design program Primer3 Bioinformatics 23(10):1289-91, 2007 Web site
http://bioinfo.ut.ee/primer3-0.4.0/primer3/
17th World Lake Conference, Lake Kasumigaura, Ibaraki, Japan, 2018
900
1
Water quality and fisheries of the Bui Reservoir, Ghana: Five years after impoundment
Ruby Asmah, Theodore Quarcoopome, Serapis Appiah, Edem Amedorme, Acheampong Addo and Bright Awunor
CSIR-Water Research Institute, Ghana
Keywords: Limnology, dams and reservoirs, fisheries, ecology, biology, water quality
ABSTRACT
Ghana has derived many useful benefits from reservoirs including hydroelectric power generation, potable water supply, fisheries, irrigation, transportation and raw water supply for domestic, industrial and agricultural use. The Bui Dam is the third to be created in the Volta River System for hydroelectric power generation after the Akosombo and Kpong dams and has a surface area of 444 km2. The study is the first assessment of the water quality and fisheries of the Bui Reservoir five years after impoundment. Field visits were undertaken between October and December 2016. Profiles of pH, temperature, dissolved oxygen, chlorophyll-a and turbidity were measured in situ using the YSI EXO II Sonde. Total Nitrogen and Total Phosphorus were determined using the Hach digestive methods. The fishery assessment was undertaken using a battery of multifilament and monofilament gill nets of laterally stretched mesh sizes of 12.5 mm – 40.0 mm and 38.1 mm - 177.8 mm respectively. The water quality profile assessment showed that the reservoir was thermally stratified. Mean temperature difference between surface and bottom water was 4.5º C. The water quality in the epilimnion was distinctly varied from that in the hypolimnion in relation to the physical parameters and chlorophyll-a but the nutrients showed minimal variation in concentrations between the surface and bottom water. The fisheries assessment revealed a decline in fish species composition by 57 % and a shift from riverine to lacustrine species as well as a shift in trophic dominance from piscivores to benthic omnivores when compared to the pre-impoundment results.
1. INTRODUCTION
The construction of dams for hydroelectric power and irrigation tends to alter the ecosystem from riverine to lacustrine conditions leading to major changes in water quantity, quality and flows, nutrient inputs and balances as well as fish habitats and fish assemblage [1,2]. Due to their storage, dams are believed to change river discharges to a much greater extent than any adjustment expected from global climate change [3].
The Bui Dam is the third to be created in the Volta River System for hydroelectric power generation after those at Akosombo and Kpong in Ghana, West Africa. The dam is built on the River Black Volta at the Bui Gorge and has a surface area of 444 km2 at full supply level with capacity to generate 400 Megawatts of electricity. The dam was impounded in June 2011 and commissioned for operation in December 2013. Although the dam has been in existence for about five years, very little information exists on its water quality status and impacts the modification in habitat may have had on the fisheries of the dam. The study assessed the water quality and changes in fisheries of the reservoir. The fish species composition data were compared with results obtained from the pre-
impoundment study carried just before impoundment.
2. METHOD Seven sites were selected on the Bui Reservoir (Fig 1) for water quality assessment in the post-rainy season between October 2016 to December 2016. Two water samples were collected per site: 1m below the surface and 1m from above the bottom of the reservoir using a Van Dorn water sampler. Depth profiles of water temperature, pH, dissolved oxygen (DO), conductivity, turbidity and Chlorophyll-a (Chl-a), and Total Dissolved Solids (TDS) were measured in situ using the YSI EXO II Sonde. Total Nitrogen (TN) and Total Phosphate (TP) were determined using the Hach persulphate digestion and Molybdovanadate with Acid Persulfate Digestion Methods respectively. Sampling for fish assessment was undertaken at sites 1, 2 and 3 (Fig 1) which were selected to coincide with sites for the pre-impoundment study. Multifilament and monofilament gill nets of laterally stretched mesh sizes of 12mm – 40.0 mm and 38.1 mm - 152. 4 mm were used in sampling fish. The nets were set at dusk and retrieved at
17th World Lake Conference, Lake Kasumigaura, Ibaraki, Japan, 2018
901
P1-5

2
dawn the following day at each station. The catch at the end of each sampling session was identified with the keys of [4, 5 ,6], sorted into various species, and counted. Each individual fish was weighed to the nearest 0.1 gramme (g) using a measuring scale while standard length and total length were measured to the nearest 1.0 millimetre (mm) using a measuring board. The catches of local fishermen were also observed.
Fig 1: Sampling sites on the Bui Reservoir
3. RESULTS The depth of water at the sampling sites ranged from 33.8 m to 86.0 m bringing the mean depth of the reservoir to about 50m. Results from the water quality profiles showed the dam was thermally stratified and the water quality in the epilimnion was distinctly varied from that in the hypolimnion in relation to the physical parameters. Surface water temperatures ranged from 29.1 ºC to 31.4 ºC whiles of the bottom temperature ranged from 25.3 ºC to 28.8 ºC with an average difference between surface and bottom water of about 4.5 ºC (Fig 2). The pH was slightly more alkaline at the surface than at the bottom with values ranging from 7.48 - 7.92 and 6.40 to 7.0 respectively (Fig 2). DO concentrations ranged from 7.93 to 8.78 mg/l at the surface water and declined rapidly with depth till about 20 to 30 m depth, after which the water becomes completely anoxic (Fig 3 and Fig 4). Chlorophyll-a concentrations were typically less than 5 mg/l at all the monitoring sites. Minimal variations were observed in nutrient concentrations. TN concentrations ranged from 0.56-0.87 mg/l at the surface and 0.82 to 0.87 mg/l in the bottom water (Fig 5). Whiles TP ranged from 0.07 to 0.14 at the surface and 0.07 to 0.09 mg/l at the bottom.
Fig 2: Mean water temperatures at the sites
Fig 3: Dissolved oxygen profile at one of the sites
Fig 4: Mean dissolved oxygen at the sites
Fig 5: Total Nitrogen concentrations at the sampling sites
Thirty-Six (36) fish species belonging to 23 genera and 10 families based on a total of 356 fish samples were recorded in the study area. The major families by numbers and weight are presented in Fig 6 and Fig 7. Cichlidae were dominant by number and Cyprinidae dominant by weight
0.02.04.06.08.0
10.0
1 2 3 4 5 6 7
Dis
solv
ed
Oxy
gen(
mg/
l)
Sampling Sites
Surface Bottom
0
10
20
30
40
1 2 3 4 5 6 7Wat
er te
mpe
ratu
re
(ºC)
Sampling site
Surface Bottom
00.20.40.60.8
1
1 2 3 4 5 6 7Tota
l -N
(mg/
l)
Sampling Sites
Surface Bottom
010203040506070
0 5 10
Wat
er d
epth
(m)
Dissolved Oxygen (mg/l)
17th World Lake Conference, Lake Kasumigaura, Ibaraki, Japan, 2018
902
3
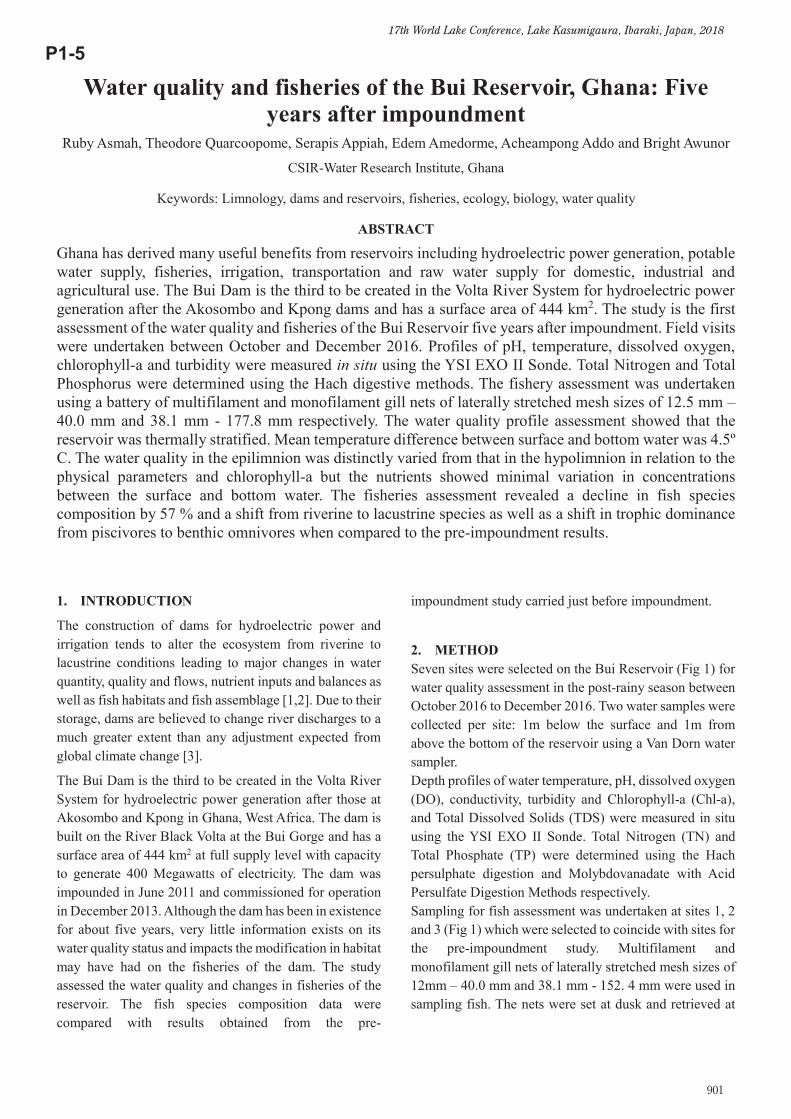
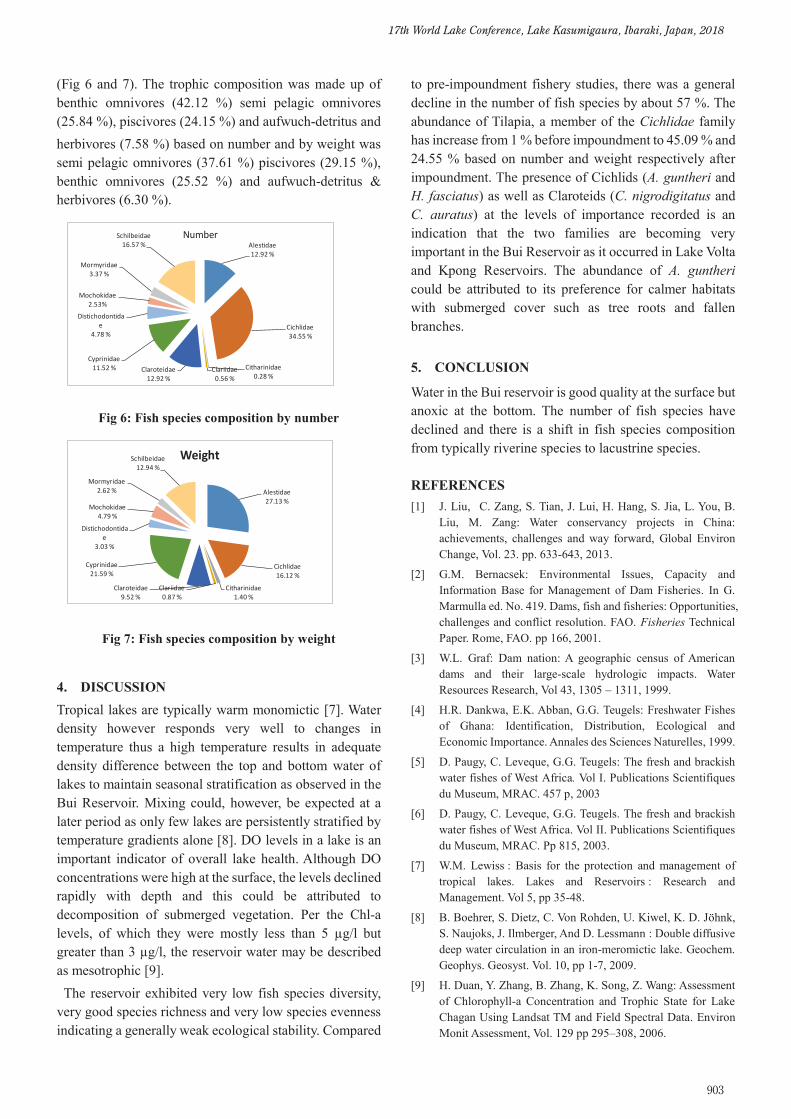
(Fig 6 and 7). The trophic composition was made up of benthic omnivores (42.12 %) semi pelagic omnivores (25.84 %), piscivores (24.15 %) and aufwuch-detritus and herbivores (7.58 %) based on number and by weight was semi pelagic omnivores (37.61 %) piscivores (29.15 %), benthic omnivores (25.52 %) and aufwuch-detritus & herbivores (6.30 %).
Fig 6: Fish species composition by number
Fig 7: Fish species composition by weight
4. DISCUSSION Tropical lakes are typically warm monomictic [7]. Water density however responds very well to changes in temperature thus a high temperature results in adequate density difference between the top and bottom water of lakes to maintain seasonal stratification as observed in the Bui Reservoir. Mixing could, however, be expected at a later period as only few lakes are persistently stratified by temperature gradients alone [8]. DO levels in a lake is an important indicator of overall lake health. Although DO concentrations were high at the surface, the levels declined rapidly with depth and this could be attributed to decomposition of submerged vegetation. Per the Chl-a levels, of which they were mostly less than 5 µg/l but greater than 3 µg/l, the reservoir water may be described as mesotrophic [9]. The reservoir exhibited very low fish species diversity, very good species richness and very low species evenness indicating a generally weak ecological stability. Compared
to pre-impoundment fishery studies, there was a general decline in the number of fish species by about 57 %. The abundance of Tilapia, a member of the Cichlidae family has increase from 1 % before impoundment to 45.09 % and 24.55 % based on number and weight respectively after impoundment. The presence of Cichlids (A. guntheri and H. fasciatus) as well as Claroteids (C. nigrodigitatus and C. auratus) at the levels of importance recorded is an indication that the two families are becoming very important in the Bui Reservoir as it occurred in Lake Volta and Kpong Reservoirs. The abundance of A. guntheri could be attributed to its preference for calmer habitats with submerged cover such as tree roots and fallen branches. 5. CONCLUSION
Water in the Bui reservoir is good quality at the surface but anoxic at the bottom. The number of fish species have declined and there is a shift in fish species composition from typically riverine species to lacustrine species. REFERENCES [1] J. Liu, C. Zang, S. Tian, J. Lui, H. Hang, S. Jia, L. You, B.
Liu, M. Zang: Water conservancy projects in China: achievements, challenges and way forward, Global Environ Change, Vol. 23. pp. 633-643, 2013.
[2] G.M. Bernacsek: Environmental Issues, Capacity and Information Base for Management of Dam Fisheries. In G. Marmulla ed. No. 419. Dams, fish and fisheries: Opportunities, challenges and conflict resolution. FAO. Fisheries Technical Paper. Rome, FAO. pp 166, 2001.
[3] W.L. Graf: Dam nation: A geographic census of American dams and their large-scale hydrologic impacts. Water Resources Research, Vol 43, 1305 – 1311, 1999.
[4] H.R. Dankwa, E.K. Abban, G.G. Teugels: Freshwater Fishes of Ghana: Identification, Distribution, Ecological and Economic Importance. Annales des Sciences Naturelles, 1999.
[5] D. Paugy, C. Leveque, G.G. Teugels: The fresh and brackish water fishes of West Africa. Vol I. Publications Scientifiques du Museum, MRAC. 457 p, 2003
[6] D. Paugy, C. Leveque, G.G. Teugels. The fresh and brackish water fishes of West Africa. Vol II. Publications Scientifiques du Museum, MRAC. Pp 815, 2003.
[7] W.M. Lewiss : Basis for the protection and management of tropical lakes. Lakes and Reservoirs : Research and Management. Vol 5, pp 35-48.
[8] B. Boehrer, S. Dietz, C. Von Rohden, U. Kiwel, K. D. Jöhnk, S. Naujoks, J. Ilmberger, And D. Lessmann : Double diffusive deep water circulation in an iron-meromictic lake. Geochem. Geophys. Geosyst. Vol. 10, pp 1-7, 2009.
[9] H. Duan, Y. Zhang, B. Zhang, K. Song, Z. Wang: Assessment of Chlorophyll-a Concentration and Trophic State for Lake Chagan Using Landsat TM and Field Spectral Data. Environ Monit Assessment, Vol. 129 pp 295–308, 2006.
Alestidae27.13 %
Cichlidae16.12 %
Citharinidae1.40 %
Clariidae0.87 %
Claroteidae9.52 %
Cyprinidae21.59 %
Distichodontidae
3.03 %
Mochokidae4.79 %
Mormyridae2.62 %
Schilbeidae12.94 %
Weight
Alestidae12.92 %
Cichlidae34.55 %
Citharinidae0.28 %
Clariidae0.56 %
Claroteidae12.92 %
Cyprinidae11.52 %
Distichodontidae
4.78 %
Mochokidae2.53%
Mormyridae3.37 %
Schilbeidae16.57 %
Number
2
dawn the following day at each station. The catch at the end of each sampling session was identified with the keys of [4, 5 ,6], sorted into various species, and counted. Each individual fish was weighed to the nearest 0.1 gramme (g) using a measuring scale while standard length and total length were measured to the nearest 1.0 millimetre (mm) using a measuring board. The catches of local fishermen were also observed.
Fig 1: Sampling sites on the Bui Reservoir
3. RESULTS The depth of water at the sampling sites ranged from 33.8 m to 86.0 m bringing the mean depth of the reservoir to about 50m. Results from the water quality profiles showed the dam was thermally stratified and the water quality in the epilimnion was distinctly varied from that in the hypolimnion in relation to the physical parameters. Surface water temperatures ranged from 29.1 ºC to 31.4 ºC whiles of the bottom temperature ranged from 25.3 ºC to 28.8 ºC with an average difference between surface and bottom water of about 4.5 ºC (Fig 2). The pH was slightly more alkaline at the surface than at the bottom with values ranging from 7.48 - 7.92 and 6.40 to 7.0 respectively (Fig 2). DO concentrations ranged from 7.93 to 8.78 mg/l at the surface water and declined rapidly with depth till about 20 to 30 m depth, after which the water becomes completely anoxic (Fig 3 and Fig 4). Chlorophyll-a concentrations were typically less than 5 mg/l at all the monitoring sites. Minimal variations were observed in nutrient concentrations. TN concentrations ranged from 0.56-0.87 mg/l at the surface and 0.82 to 0.87 mg/l in the bottom water (Fig 5). Whiles TP ranged from 0.07 to 0.14 at the surface and 0.07 to 0.09 mg/l at the bottom.
Fig 2: Mean water temperatures at the sites
Fig 3: Dissolved oxygen profile at one of the sites
Fig 4: Mean dissolved oxygen at the sites
Fig 5: Total Nitrogen concentrations at the sampling sites
Thirty-Six (36) fish species belonging to 23 genera and 10 families based on a total of 356 fish samples were recorded in the study area. The major families by numbers and weight are presented in Fig 6 and Fig 7. Cichlidae were dominant by number and Cyprinidae dominant by weight
0.02.04.06.08.0
10.0
1 2 3 4 5 6 7
Dis
solv
ed
Oxy
gen(
mg/
l)
Sampling Sites
Surface Bottom
0
10
20
30
40
1 2 3 4 5 6 7Wat
er te
mpe
ratu
re
(ºC)
Sampling site
Surface Bottom
00.20.40.60.8
1
1 2 3 4 5 6 7Tota
l -N
(mg/
l)
Sampling Sites
Surface Bottom
010203040506070
0 5 10
Wat
er d
epth
(m)
Dissolved Oxygen (mg/l)
17th World Lake Conference, Lake Kasumigaura, Ibaraki, Japan, 2018
903
1
Comparison of Environmental Condition using Biological Indicators in Yatsu Tidal Flat locating
in Tokyo Inner Bay Kazuhito Murakami, Mana Ubukata, Yuka Takagi, Yuta Tatsumi and Tomoya Tanaka
Dept of Life and Environmental Sciences, Chiba Institute of Technology
Keywords: Yatsu Tidal Flat, Environmental conditions, Green tide, Biological index, Water quality
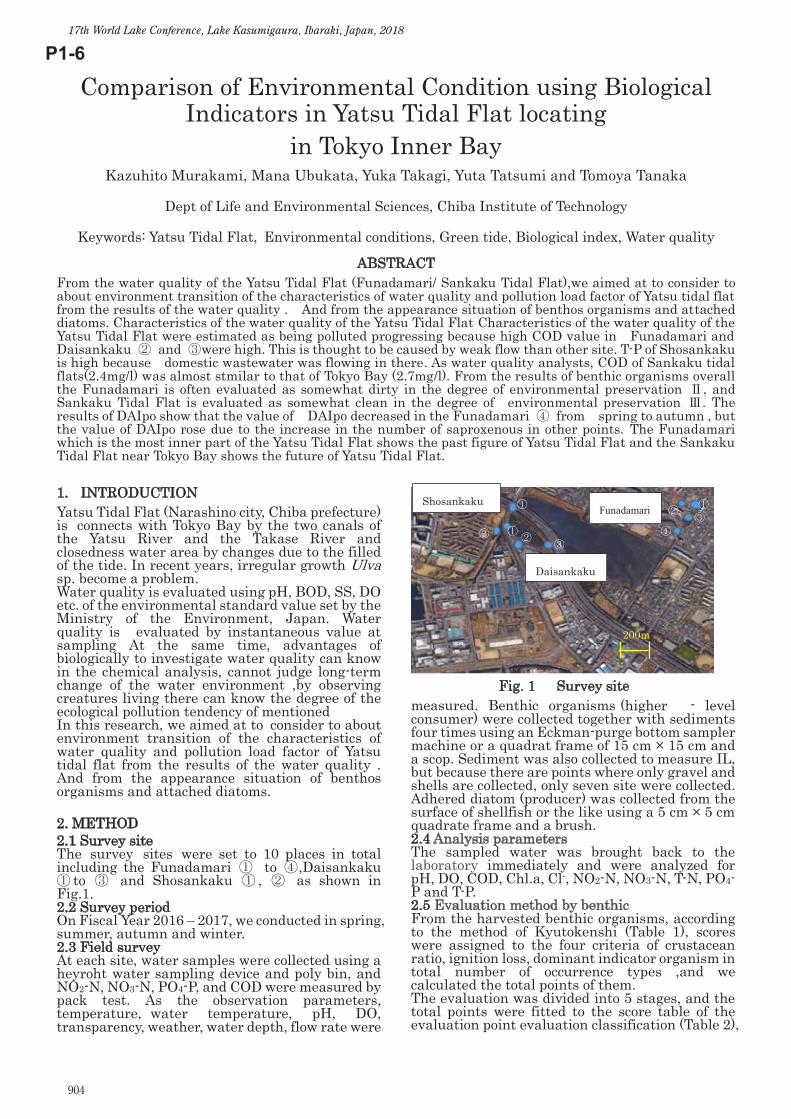
ABSTRACT From the water quality of the Yatsu Tidal Flat (Funadamari/ Sankaku Tidal Flat),we aimed at to consider to about environment transition of the characteristics of water quality and pollution load factor of Yatsu tidal flat from the results of the water quality . And from the appearance situation of benthos organisms and attached diatoms. Characteristics of the water quality of the Yatsu Tidal Flat Characteristics of the water quality of the Yatsu Tidal Flat were estimated as being polluted progressing because high COD value in Funadamari and Daisankaku and were high. This is thought to be caused by weak flow than other site. T-P of Shosankaku is high because domestic wastewater was flowing in there. As water quality analysts, COD of Sankaku tidal flats(2.4mg/l) was almost stmilar to that of Tokyo Bay (2.7mg/l). From the results of benthic organisms overall the Funadamari is often evaluated as somewhat dirty in the degree of environmental preservation , and Sankaku Tidal Flat is evaluated as somewhat clean in the degree of environmental preservation . The results of DAIpo show that the value of DAIpo decreased in the Funadamari from spring to autumn , but the value of DAIpo rose due to the increase in the number of saproxenous in other points. The Funadamari which is the most inner part of the Yatsu Tidal Flat shows the past figure of Yatsu Tidal Flat and the Sankaku Tidal Flat near Tokyo Bay shows the future of Yatsu Tidal Flat. 1. INTRODUCTION Yatsu Tidal Flat (Narashino city, Chiba prefecture) is connects with Tokyo Bay by the two canals of the Yatsu River and the Takase River and closedness water area by changes due to the filled of the tide. In recent years, irregular growth Ulva sp. become a problem. Water quality is evaluated using pH, BOD, SS, DO etc. of the environmental standard value set by the Ministry of the Environment, Japan. Water quality is evaluated by instantaneous value at sampling At the same time, advantages of biologically to investigate water quality can know in the chemical analysis, cannot judge long-term change of the water environment ,by observing creatures living there can know the degree of the ecological pollution tendency of mentioned In this research, we aimed at to consider to about environment transition of the characteristics of water quality and pollution load factor of Yatsu tidal flat from the results of the water quality .And from the appearance situation of benthos organisms and attached diatoms.
2. METHOD 2.1 Survey site The survey sites were set to 10 places in total including the Funadamari to ,Daisankaku
to and Shosankaku , as shown in Fig.1. 2.2 Survey period On Fiscal Year 2016 – 2017, we conducted in spring, summer, autumn and winter. 2.3 Field survey At each site, water samples were collected using a heyroht water sampling device and poly bin, and NO2-N, NO3-N, PO4-P, and COD were measured by pack test. As the observation parameters, temperature, water temperature, pH, DO,
transparency, weather, water depth, flow rate were
measured. Benthic organisms (higher - level consumer) were collected together with sediments four times using an Eckman-purge bottom sampler machine or a quadrat frame of 15 cm × 15 cm and a scop. Sediment was also collected to measure IL, but because there are points where only gravel and shells are collected, only seven site were collected. Adhered diatom (producer) was collected from the surface of shellfish or the like using a 5 cm × 5 cm quadrate frame and a brush. 2.4 Analysis parameters The sampled water was brought back to the laboratory immediately and were analyzed for pH, DO, COD, Chl.a, Cl-, NO2-N, NO3-N, T-N, PO4-P and T-P. 2.5 Evaluation method by benthic From the harvested benthic organisms, according to the method of Kyutokenshi (Table 1), scores were assigned to the four criteria of crustacean ratio, ignition loss, dominant indicator organism in total number of occurrence types ,and we calculated the total points of them. The evaluation was divided into 5 stages, and the total points were fitted to the score table of the evaluation point evaluation classification (Table 2),
Funadamari
Shosankaku
Daisankaku
Fig. 1 Survey site
200m
17th World Lake Conference, Lake Kasumigaura, Ibaraki, Japan, 2018
904
P1-6

1
Comparison of Environmental Condition using Biological Indicators in Yatsu Tidal Flat locating
in Tokyo Inner Bay Kazuhito Murakami, Mana Ubukata, Yuka Takagi, Yuta Tatsumi and Tomoya Tanaka
Dept of Life and Environmental Sciences, Chiba Institute of Technology
Keywords: Yatsu Tidal Flat, Environmental conditions, Green tide, Biological index, Water quality
ABSTRACT From the water quality of the Yatsu Tidal Flat (Funadamari/ Sankaku Tidal Flat),we aimed at to consider to about environment transition of the characteristics of water quality and pollution load factor of Yatsu tidal flat from the results of the water quality . And from the appearance situation of benthos organisms and attached diatoms. Characteristics of the water quality of the Yatsu Tidal Flat Characteristics of the water quality of the Yatsu Tidal Flat were estimated as being polluted progressing because high COD value in Funadamari and Daisankaku and were high. This is thought to be caused by weak flow than other site. T-P of Shosankaku is high because domestic wastewater was flowing in there. As water quality analysts, COD of Sankaku tidal flats(2.4mg/l) was almost stmilar to that of Tokyo Bay (2.7mg/l). From the results of benthic organisms overall the Funadamari is often evaluated as somewhat dirty in the degree of environmental preservation , and Sankaku Tidal Flat is evaluated as somewhat clean in the degree of environmental preservation . The results of DAIpo show that the value of DAIpo decreased in the Funadamari from spring to autumn , but the value of DAIpo rose due to the increase in the number of saproxenous in other points. The Funadamari which is the most inner part of the Yatsu Tidal Flat shows the past figure of Yatsu Tidal Flat and the Sankaku Tidal Flat near Tokyo Bay shows the future of Yatsu Tidal Flat. 1. INTRODUCTION Yatsu Tidal Flat (Narashino city, Chiba prefecture) is connects with Tokyo Bay by the two canals of the Yatsu River and the Takase River and closedness water area by changes due to the filled of the tide. In recent years, irregular growth Ulva sp. become a problem. Water quality is evaluated using pH, BOD, SS, DO etc. of the environmental standard value set by the Ministry of the Environment, Japan. Water quality is evaluated by instantaneous value at sampling At the same time, advantages of biologically to investigate water quality can know in the chemical analysis, cannot judge long-term change of the water environment ,by observing creatures living there can know the degree of the ecological pollution tendency of mentioned In this research, we aimed at to consider to about environment transition of the characteristics of water quality and pollution load factor of Yatsu tidal flat from the results of the water quality .And from the appearance situation of benthos organisms and attached diatoms.
2. METHOD 2.1 Survey site The survey sites were set to 10 places in total including the Funadamari to ,Daisankaku
to and Shosankaku , as shown in Fig.1. 2.2 Survey period On Fiscal Year 2016 – 2017, we conducted in spring, summer, autumn and winter. 2.3 Field survey At each site, water samples were collected using a heyroht water sampling device and poly bin, and NO2-N, NO3-N, PO4-P, and COD were measured by pack test. As the observation parameters, temperature, water temperature, pH, DO,
transparency, weather, water depth, flow rate were
measured. Benthic organisms (higher - level consumer) were collected together with sediments four times using an Eckman-purge bottom sampler machine or a quadrat frame of 15 cm × 15 cm and a scop. Sediment was also collected to measure IL, but because there are points where only gravel and shells are collected, only seven site were collected. Adhered diatom (producer) was collected from the surface of shellfish or the like using a 5 cm × 5 cm quadrate frame and a brush. 2.4 Analysis parameters The sampled water was brought back to the laboratory immediately and were analyzed for pH, DO, COD, Chl.a, Cl-, NO2-N, NO3-N, T-N, PO4-P and T-P. 2.5 Evaluation method by benthic From the harvested benthic organisms, according to the method of Kyutokenshi (Table 1), scores were assigned to the four criteria of crustacean ratio, ignition loss, dominant indicator organism in total number of occurrence types ,and we calculated the total points of them. The evaluation was divided into 5 stages, and the total points were fitted to the score table of the evaluation point evaluation classification (Table 2),
Funadamari
Shosankaku
Daisankaku
Fig. 1 Survey site
200m
2
and the environment condition was evaluated. The point where sediment can not be collected was evaluated by applying it to another scoring table (Table 2) excluding score by ignition loss. Table 3 shows the classification with provisional expressions each evaluation. 2.6 Evaluation method by diatom Adherent diatom was collected from the surface of shellfish using a 5 cm × 5 cm quadrate frame and a brush. DAIpo (Diatom Assemblage Index to Organic Water Pollution), which is an organic pollution index based on adherent diatom assemblage, classified, identified and counted and The river comprehensive evaluation RPId (River Pollution Index based on DCI) was calculated.
DAIpo 50+((A B)/2) (1)
A The sum of the relative frequencies of all the saproxenous that appeared at that point.
B The sum of the relative frequencies of all saprophilous that appeared at that point.
RPId A/L (2)
A The area of the part surrounded by the
vertical axis and the line connecting the plotted points.
L Extension of flow path of investigated river.
3. RESULTS AND DISCUSSION The water quality date of COD,Chl.a,Cl-, NO2-N, NO3-N, NH4-N, T-N, PO4-P in T-P in spring, summer, autumn and winter are shown in Table 5 toTable 8. Evaluation by the benthic organism at each point in spring, summer, autumn and winter are shown in Fig.2. Evaluation by the attached diatoms at each point in spring, summer, autumn and winter are shown in Fig. 3. From spring to autumn, Funadamari and Daisankaku , were polluted. At any point, there are fewer flows than other point and it is thought is easy to accumulate organic matter. The result of DAIpo value of Funadamari decreases from spring to autumn. The result of the benthic organism was less species and Environmental preservation degree was lowered. The bottom mud of Funadamari is sludge. Therefore, it is understood that it is an environment where living things are difficult to live. As a cause, it was suggested that the flow of wastewater from Funadamari may have flowed in. On the other hand, Shosankaku of Sankaku Tidal Flat is connected to Tokyo Bay, and the value of COD was the closest that of to Tokyo Bay. There is no flow in Funadamari, and nutrient salts accumulate and are polluted, but In Shosankaku and Yatsu River, it is thought that it became near the water quality of Tokyo Bay by being mixed with the purification action such as shell and Ulva .sp and water of other sites. However, the value of T-P was high. DAIpo has increased overall value to Funadamari
, and the water quality has been improved. As a result of the benthic organisms, environment al preservation degree is higher than Funadamari except for Daisankaku , and is considered to be inhabit than Funadamari. From these outcomes, an environment Funadamari which is the most inner part of Yatsu Tidal Flat is thought to represents the appearance of the past of Yatsu
considering IL not considering IL
Table 3 Evaluation Expression by Kyutokenshi Method
Table 4 Relationship of DAIpo,BOD and pollution level
Table 5 Water quality(spring)
Table 6 Water quality(summer)
Evaluation classification ScoreEnvironmental conservation degree 14Environmental conservation degree 10 13Environmental conservation degree 6 9Environmental conservation degree 3 5Environmental conservation degree 0 2
Evaluation classification ScoreEnvironmental conservation degree 12Environmental conservation degree 9 11Environmental conservation degree 6 8Environmental conservation degree 3 5Environmental conservation degree 0 2
Evaluation classification Interim(Expression)Environmental conservation d CleanEnvironmental conservation d Slightly cleanEnvironmental conservation d Slightly polluted Environmental conservation d PollutedEnvironmental conservation dExtremely polluted
Unit symbolmg/l 6.0 10.4 8.8 7.2 4.0 8.4 8.4 4.4 4.4mg/l 7.9 5.8 10.6 6.5 4.9 3.8 4.5 3.6 3.7mg/l 0.19 0.30 0.40 0.21 0.36 0.24 0.32 0.36 0.34mg/l 0.0533 0.1396 0.035 0.0825 0.0167 0.0083 0.0101 0.01 0.0094mg/l 2.5 1.5 3.1 1.6 1.0 0.8 0.9 1.3 1.2mg/l 0.36 1.66 0.40 0.41 2.02 1.43 1.43 1.15 2.05mg/l 0.93 0.92 1.58 1.46 1.87 1.94 2.05 2.24 2.00mg/l 10281.4 18081.0 12408.6 17017.4 16414.7 15953.9 19499.2 18612.8 17584.7μg/l 0.9 0.9 1.6 1.5 15.2 3.6 7.3 5.2 5.9mg/l 37.75 45.55 25.45 21.70 4.10 24.00 16.35 4.25 12.55
Unit symbolmg/l 5.2 6.4 14.8 16 6.0 5.2 5.6 6.8 6.4mg/l 10.9 6.7 7.0 7.6 4.1 2.1 2.9 3.9 3.9mg/l 0.40 0.50 0.50 0.30 0.29 0.35 0.30 0.40 0.33mg/l 0.005 0.0097 0.006 0.000 0.0377 0.0175 0.0187 0.0155 0.0349mg/l 2.2 2.8 2.1 1.1 2.0 1.3 1.5 1.1 1.4mg/l 3.33 3.25 1.10 5.53 1.09 2.32 1.80 6.90 6.30mg/l 0.97 0.96 0.88 0.30 0.30 0.63 0.49 1.88 1.72mg/l 9749.6 4077.1 5318 10104.1 5140.7 5052.1 4697.5 2481.7 2942.6μg/l 3.0 3.0 1.8 2.8 2.5 2.5 2.7 3.0 4.6mg/l 21.05 18.10 0.05 0.25 22.10 38.25 56.45 27.90 13.25
Number of occurrence types in benthic organisms
More than 30 species
20 30species 10 19species Less than 10 species No biological
Scores 4 3 2 1 0Percentage of Crustaceans in
More than 20
Less than 1020
Less than 510
Less than 5 0%
Scores 4 3 2 1 0
Loss on ignition of sediment Less than 2 Less than 2 5 Less than5 10 Less than 1015
More than 15
Scores 4 3 2 1 0
B C DLumbrineris Paraprionospi
olongiforia sp.(typeA)
Raeta Theora latarostralis
Prionospio Sigambra pulchra hanaokai
Rank B C DScores 2 1 0
Dominant pointer biology
Organisms other than B and C
A3
1 If the total number of occurrences types is less than four, the grade is 1 regardless of the ratio. 2 If the total number of occurrences types is less than two species, the rank C.
No biological
Evaluation by dominant species of the top three species
Dominant species of the top three species other than B and C
Not classified as A, C and D rank
More than two species of C
No biological
A
Table 2 Evaluation division by Kyutokenshi Method
Table 1 Evaluation by Kyutokenshi Method
17th World Lake Conference, Lake Kasumigaura, Ibaraki, Japan, 2018
905

3
Table 7 Water quality(autumn)
Table 8 Water quality(winter)
Tidal Flat, and Sankaku Tidal Flat near Tokyo Bay represents the figure of the future of Yatsu Tidal Flat. 4. CONCLUSION 1) Characteristics of the water quality of the Yatsu Tidal Flat were estimated as being polluted progressing because high COD value in Funadamari and Daisankaku and were high. This is thought to be caused by weak flow than other site. T-P of Shosankaku is high because domestic wastewater was flowing in there. 2) As water quality analysts, COD of Sankaku tidal flats(2.4mg/l) was almost stmilar to that of Tokyo Bay (2.7mg/l). 3 From the results of benthic organisms, the Funadamari is often evaluated as somewhat dirty in the degree of environmental preservation , and Sankaku Tidal Flat is evaluated as somewhat clean in the degree of environmental preservation . 4) The results of DAIpo show that the value ofDAIpo decreased in the Funadamari fromspring to autumn , but the value of DAIpo rose due to the increase in the number of saproxenous in other points. 5) The Funadamari which is the most inner part of the Yatsu Tidal Flat shows the past figure of Yatsu Tidal Flat and the Sankaku Tidal Flat near Tokyo Bay shows the future of Yatsu Tidal Flat.
5. REFERENCES [1] Mizuho Kato:(2017) Water quality characteristics of
Yatsu Tidal Flat [Funadamari Sankaku Tidal Flat] Proceedings of 44th Kanto Branch Technology and Research Seminar of JSCE.
[2] Yuta Ito:(2017) Environmental characteristics of Yatsu Tidal Flat by biological judgment using benthic organisms, Proceedings of 44th Kanto Branch Technology and Research Seminar of JSCE.
[3] Saki Hagiwara:(2017) Environmental evaluation of the Yatsu Tidal Flat (Funadamari / Sankaku Tidal Flat) viewed from the appearance situation of attached diatoms, 2017 Proceedings of 44th Kanto Branch Technology and Research Seminar of JSCE.
[4] Yusuke Iso:(2018) The Innermost part of the Yatsu Tidal Flat (environmental assessment of the Funadamari) by benthos organisms and sediments, Proceedings of 45th Kanto Branch Technology and Research Seminar of JSCE.
[5] Yuta Watanabe:(2018) Environmental evaluation of the innermost part of the Yatsu Tidal Flat (Funadamari) and the Yatsu River from the appearance situation of attached diatoms, Proceedings of 45th Kanto Branch Technology and Research Seminar of JSCE.
Unit symbolmg/l 3.2 4.4 4.4 3.2 4.4 4.0 5.6 2.4 3.2mg/l 12.9 15.4 6.4 4.1 11.0 13.7 4.9 4.7 5.3mg/l 0.58 0.37 0.32 0.19 0.44 0.51 0.16 0.16 0.16mg/l 0.0474 0.0376 0.0321 0.028 0.0293 0.0318 0.0275 0.0287 0.0457mg/l 3.8 2.3 1.7 1.7 3.0 3.4 1.3 2.5 1.6mg/l 0.36 0.52 0.28 0.26 0.09 0.09 0.48 0.39 0.31mg/l 1.50 1.67 1.59 1.59 1.37 1.32 0.03 0.03 0.03mg/l 6972.4 5790.7 8804.2 14358.5 16840.2 16072.0 16485.6 16131.1 16840.2μg/l 7.7 5.6 4.3 7.4 20.3 11.2 3.2 1.6 3.2mg/l 24.20 23.05 18.00 23.25 54.95 57.15 74.55 41.85 36.90
Unit symbolmg/l 4.4 5.2 4.8 3.2 4.0 6.4 8.4 4.0 3.6mg/l 10.3 8.3 9.1 4.3 5.7 6.1 3.9 4.1 5.0mg/l 0.65 0.57 0.64 0.20 0.31 0.19 0.15 0.16 0.24mg/l 0.0778 0.055 0.0609 0.0261 0.0351 0.0266 0.0194 0.0353 0.0296mg/l 3.8 2.9 3.1 1.6 1.1 1.5 1.4 1.6 1.6mg/l 3.32 3.68 2.44 0.60 0.48 0.15 0.19 1.51 1.98mg/l 1.81 0.96 1.61 0.22 0.48 0.15 0.19 1.51 1.98mg/l 9040.5 10547.3 10104.1 18258.3 12231.3 11699.5 14003.9 14358.5 16485.6μg/l 3.2 4.3 4.6 6.5 2.1 3.7 3.8 1.6 1.3mg/l 21.05 18.10 0.05 0.25 22.10 38.25 56.45 27.90 13.25
Fig. 2 Evaluation by benthic organism
(Kyutokenshi Method)
Fig. 3 Evaluation by adhered diatom (DAIpo)
17th World Lake Conference, Lake Kasumigaura, Ibaraki, Japan, 2018
906

1
Diversity Models of Plankton in Gold Coast Ornamental Lake, Pantai Indah Kapuk, North Jakarta
Sigid Hariyadi1, Niken TM Pratiwi1, Zulhamsyah Imran1, Muhammad Sufi Riawi1 1Bogor Agricultural University
Keywords: abundances models, plankton, Gold Coast Ornamental Lake, water quality
ABSTRACT
Plankton diversity can be calculated through a model of species abundance. This study aimed to describe the structure of plankton communities using various models of diversity and coherence of the water quality. The study was conducted from July to December 2015, using the method of APHA, 2012. Based on water quality data, the five stations are grouped into three zones. Zone 1 consists of Station 1, Zone 2 consists of stations 2, 3, and 5, Zone 3 consists of Station 4. The difference in the water quality at each station causes differences plankton diversity. The results showed that the model of geometric and broken stick was not suitable for use in all zones. Log normal model was appropriate using in Zone 1 for data phytoplankton and zooplankton all zones to the data. Log series model was an appropriate model to describe the plankton communities throughout the zone. This model describes the waters were disturbed and their dominance.
1. INTRODUCTION
Gold Coast Ornamental Lake is located in Pantai Indah Kapuk Residence, North Jakarta. The waters is relatively small with total area about 7359 m2 and 1 m in depth. It has unique net-shape, The small and shallow condition lead a dynamic physical and chemical condition that infkuence the appearance of plankton community. The combination of relationship between water quality and plankton community could show the role of plankton as bioindicator of lake water condition [1].
Density and richness (number of genera) can be used as factors in calculating diversity index. Diversity index can be determined with three approached, i.e. index of richness, index based on spesies/genera relative abundance, and model of spesies/genera abundance [2].
This study emphesized on the third approach that usualy used to describe the community structure [3], especially plankton community. The model of spesies/genera abundance consist of several models, such as geometric, log series, log normal, and broken stick model [2]. The research was aimed to describe plankton community structure in Gold Coast Ornamental Lake, based on several diversity models.
2. METHOD
The research was done in six month, from July to December 2015, with monthly sampling periods at five sites. Station 1 was close to sewage treatment plant and pump station (outlet). Station 2 set at the north western
part, before the Sewage Treatment Plant. Station 3 was inside of ‘net’ curve of waters. Station 4 was in southern part, close to inlet that receive input from next cluster residence, Bukit Golf Mediterania. Station 5 was at south eastern part of waters.
Water quality was observed and measured in situ and in laboratory, based on water quality analysis reference [4]. Identification of plankton was based on several references ([5], [6], [7], [8], [9]). The density of plankton was counted using SRC (Sedgewick Rafter Counting Chamber) [4].
Pre-analysis was done to set spatial cluster of station, based on water quality information, using clustering analysis of Canberra Index value [10]. Furthermore, for each clustered stations, there were calculation of plankton diversity with spesies/genera abundance model tah consist of geometric, log series, log normal, and broken stick models ([11]; [2]). Chi square test was used to fit the model in describing plankton Community structure in Gold Coast Ornamental Lake.
3. RESULTS Water quality that illustrated by temperatur, is relatively warm (31,22-32,30 °C); high pH (8,73-8,87), existance of salinity (3,45-4,40 ‰), and high dissolved oxygen (9,42-13,23 mg/L). The condition of dissolved oxygen expressed supersaturation condition. Based on water quality, there were clustered Three groups of stations.
17th World Lake Conference, Lake Kasumigaura, Ibaraki, Japan, 2018
907
P1-7

2
Figure 1. Abundance and number of taxa
The comparation value between χ 2 calculation (χ 2c) and χ2 table (χ2t) (Table 2) shows that values of Zone 3 are higher than other zones; related to high density of plankton. The values of χ 2c for geometric model were higher than other models. The value of χ 2c for log seriesmodel were lower than χ 2t. There were a consistance pattern of χ2t of each model of all zones.
Table 2 The comparation of �2 calculation and �2 table of each zone
Zone Geometric Model
Log series Model Log normal Model
Broken stick Model
χ2
calculation χ2
table
χ2
calculation
χ2 table χ2
calculation
χ2 table
χ2
calculation χ2
table
Phytoplankton
Zone 1 341454,6 36,4 21,2 28,9 19,3 26,3 5804,9 28,9
Zone 2 263613,1 36,4 22,6 27,6 25,3 25,0 13406,6 27,6
Zone 3 379934,6 32,7 26,6 28,9 27,8 26,3 8191,6 28,9
Zooplankton
Zone 1 36,8 9,5 3,5 12,6 4,2 9,5 17,4 12,6
Zone 2 468,3 11,1 11,6 12,6 11,4 15,5 31,6 12,6
Zone 3 476,9 9,5 10,3 19,7 11,9 16,9 108,5 19,7
Table 3 The result of fit test for models toward data of phytoplankton and zooplankton
Zone
Uji keseuaian model
geometric Model log series
Model
Log normal
Model
broken stick
Model
Phytoplankton
Zone 1 Not suit suit suit Not suit
0
10
20
30
0
1000
2000
3000
1 2 3 4 5
Jum
lah
Jeni
s
Kel
impa
han
rata
-ra
ta(s
el/m
³) x
10⁶
Stasiun
17th World Lake Conference, Lake Kasumigaura, Ibaraki, Japan, 2018
908

3
Zone 2 Not suit suit Not suit Not suit
Zone 3 Not suit suit Not suit Not suit
Zooplankton
Zone 1 Not suit suit suit Not suit
Zone 2 Not suit suit suit Not suit
Zone 3 Not suit suit suit Not suit
4. DISCUSSION
In those water quality condition, there were found 27 genus from five classes of phytoplankton and seven taxa from two groups of zooplankton (Figure 1). In detail, the richness and density of plankton of each station were varied. The highest density was found at Zone 3 (2044 x106 cell/m3) and 1177 x103 individu/m3, for phytoplankton and zooplankton, respectively. The highest number of genera was found in Zone 2 with 26 genera and Zone 1 with five genera, for phytoplankton and zooplankton, respectively. The fit test for models is shown in Table 3. If the value of 2c is lower than
2t, it means that the model is fit, vise versa. It is shown that log series model is the most suitable model for all zone of Gold Coast Ornamental Lake, while log normal model suits in Zone 1 for phytoplankton data, and in Zone 1, 2, and 3 for zooplankton data. Furthermore, geometric and broken stick model were not suit for all zones.
5. CONCLUSION
The most suitable diversity model for phytoplankton and zooplankton data in Gold Coast Ornamental Lake was log serie model REFERENCES
[1] Wulandari D. 2009. Keterkaitan Antara Kelimpahan Fitoplankton Dengan Parameter Fisika Kimia di Estuari Sungai Brantas (Porong) Jawa Timur. [Skripsi]. Institut Pertanian Bogor4.
[2] Maguran EA. 1983. Ecological Diversity and Its Measurement. North Wales: University Press Cambridge.
[3] McGill BJ, Rampal SE, Gray JS, Alonso D, Anderson MJ, Benecha HK, Dornelas M, Enquist BJ, Green JL, Fangliang
H et al. 2007. Species abundance distributions: moving beyond single prediction theories to integration within an ecological framework. Journal of Ecology Letters. 10: 995–1015.
[4] APHA, AWWA, WEF. 2012. Standard Methods for Examination of Water and Wastewater. 22nd ed. Washington (USA). American Public Health Association.
[5] Davis CC. 1955. The Marine and Freshwater Plankton. Michigan State University Press. USA. 562
[6] Prescott GW. 1970. The Fresh Water Algae. Dubuque, Iowa. WMC Brown Company Publisher.
[7] Belcher H, Erica S. 1978. A Beginner’s Guide to Freshwater Algae. Cambridge (UK). Institute of Terrestrial Ecology
[8] Mizuno T. 1979. Illustrations of The Freshwater Plankton of Japan, revised ed. Osaka (J): Hoikusha Publishing Co, LTD.
[9] Pennak RW. 1979. Freshwater Invertebrate of the United States. A Willey-Interscience Publication John Willeyand Sons, Inc. New York.
[10] Legendre L, P Legendre. 1983. Numerical Ecology. Amsterdam (NL): Elsevier Scientific Publishing Company
[11] Frontier S. 1985. Diversity And Structure In Aquatic Ecosystem. Villeneuve d Ascq, France: Aberdeen University Press
2
Figure 1. Abundance and number of taxa
The comparation value between χ 2 calculation (χ 2c) and χ2 table (χ2t) (Table 2) shows that values of Zone 3 are higher than other zones; related to high density of plankton. The values of χ 2c for geometric model were higher than other models. The value of χ 2c for log seriesmodel were lower than χ 2t. There were a consistance pattern of χ2t of each model of all zones.
Table 2 The comparation of �2 calculation and �2 table of each zone
Zone Geometric Model
Log series Model Log normal Model
Broken stick Model
χ2
calculation χ2
table
χ2
calculation
χ2 table χ2
calculation
χ2 table
χ2
calculation χ2
table
Phytoplankton
Zone 1 341454,6 36,4 21,2 28,9 19,3 26,3 5804,9 28,9
Zone 2 263613,1 36,4 22,6 27,6 25,3 25,0 13406,6 27,6
Zone 3 379934,6 32,7 26,6 28,9 27,8 26,3 8191,6 28,9
Zooplankton
Zone 1 36,8 9,5 3,5 12,6 4,2 9,5 17,4 12,6
Zone 2 468,3 11,1 11,6 12,6 11,4 15,5 31,6 12,6
Zone 3 476,9 9,5 10,3 19,7 11,9 16,9 108,5 19,7
Table 3 The result of fit test for models toward data of phytoplankton and zooplankton
Zone
Uji keseuaian model
geometric Model log series
Model
Log normal
Model
broken stick
Model
Phytoplankton
Zone 1 Not suit suit suit Not suit
0
10
20
30
0
1000
2000
3000
1 2 3 4 5
Jum
lah
Jeni
s
Kel
impa
han
rata
-ra
ta(s
el/m
³) x
10⁶
Stasiun
17th World Lake Conference, Lake Kasumigaura, Ibaraki, Japan, 2018
909

1
Antifungal Activity of Actinomycetes Isolated from Surface Sediments of Lake Lanao against Candida
albicans and Aspergillus niger Naima Sirad1, Soofiah-Ayesha Maongco1 and Beverly Amparado1
Mindanao State University, Marawi City, Philippines
Keywords: Actinomycetes, Antifungal activity, Lake Lanao
ABSTRACT
Antibiotic resistance is not only a national problem but a global dilemma. There are many reasons why this type of resistance exists including inappropriate use of antibiotics. The search for novel antimicrobial compound is still a priority goal in drug discovery. Thus, actinomycetes from lake sediments are being explored. This study was conducted to determine if the isolated actinomycetes could exhibit antifungal activity against two test microorganisms namely Candida albicans and Aspergillus niger. A total of 34 actinomycetes was isolated from the western part of Lake Lanao specifically in the municipalities of Wato-Balindong, Tugaya and Bacolod-Kalawi, Lanao del Sur. Antifungal screening using Filter Paper-Disc Diffusion Method revealed that out of the 34 actinomycete isolates, only eight (23.53%) have inhibitory effect against Candida albicans with the mean zone of inhibition greater than the positive control. These actinomycetes, with their corresponding mean values, were A3 (26.39 mm), A9 (21.83 mm), A11 (22.66 mm), A18 (26.63 mm), A21 (24.74 mm), A25 (22.76 mm), A31 (14.76 mm) and A32 (16.88 mm). Whereas, only two (5.88%) of the actinomycete isolates inhibited the growth of Aspergillus niger with mean zone of inhibition greater than the positive control. These potential actinomycetes, with their corresponding mean values, were A11 (23.83 mm) and A31 (30.13 mm). Generally, isolates were found to be more effective against Candida albicans. Thus, this study concludes that Lake Lanao harbors potential actinomycetes that could be a source for the search of new and effective drugs against pathogenic fungi. 1. INTRODUCTION
Some bacteria, fungi, virus and other pathogenic microorganisms are resistant to their own antibiotics nowadays. As stated by Prabakarana et al., (2011), bacteria lived on earth for several billions of years. During this long period of time, they encountered range of naturally occurring antibiotics to which by now, they combated these and became resistant by the drugs synthesized today. Supported by the study of Spadari et al., (2013), Candida albicans, a pathogenic fungus which causes candidiasis is found to be resistant to its antibiotic (Fluconazole) by Disc-Diffusion method. Antimicrobial resistance is not just a national issue but a global problem and so, finding new and effective drugs is major challenge to the field of medicine. One possible candidate in the search of new and effective drugs is from the actinomycetes. Some actinomycetes form branching filaments that look like the branching hyphae formed by
fungi and so, it was erroneously classified as fungi before. Actinomycetes are actually bacteria under the phylum, Actinobacteria. Under this phylum, actinomycetes tend to produce secondary metabolites; many of which have been successfully isolated and turned into useful drugs. It was in the fifties and sixties that the antibiotics discovered were mainly isolated from Streptomyces. Primarily, Streptomyces were active against bacteria and fungi (Prabakarana and Raja, 2011). The purpose of this study is to screen the 34 actinomycetes isolated from the surface sediments of Lake Lanao specifically from Wato Balindong, Tugaya and Bacolod- Kalawi for its antifungal activity against Candida albicans and Aspergillus niger.
2. METHOD Thirty-four actinomycete isolates obtained from Lake Lanao were cultured in nutrient broth for 48 hours
17th World Lake Conference, Lake Kasumigaura, Ibaraki, Japan, 2018
910
P1-8

1
Antifungal Activity of Actinomycetes Isolated from Surface Sediments of Lake Lanao against Candida
albicans and Aspergillus niger Naima Sirad1, Soofiah-Ayesha Maongco1 and Beverly Amparado1
Mindanao State University, Marawi City, Philippines
Keywords: Actinomycetes, Antifungal activity, Lake Lanao
ABSTRACT
Antibiotic resistance is not only a national problem but a global dilemma. There are many reasons why this type of resistance exists including inappropriate use of antibiotics. The search for novel antimicrobial compound is still a priority goal in drug discovery. Thus, actinomycetes from lake sediments are being explored. This study was conducted to determine if the isolated actinomycetes could exhibit antifungal activity against two test microorganisms namely Candida albicans and Aspergillus niger. A total of 34 actinomycetes was isolated from the western part of Lake Lanao specifically in the municipalities of Wato-Balindong, Tugaya and Bacolod-Kalawi, Lanao del Sur. Antifungal screening using Filter Paper-Disc Diffusion Method revealed that out of the 34 actinomycete isolates, only eight (23.53%) have inhibitory effect against Candida albicans with the mean zone of inhibition greater than the positive control. These actinomycetes, with their corresponding mean values, were A3 (26.39 mm), A9 (21.83 mm), A11 (22.66 mm), A18 (26.63 mm), A21 (24.74 mm), A25 (22.76 mm), A31 (14.76 mm) and A32 (16.88 mm). Whereas, only two (5.88%) of the actinomycete isolates inhibited the growth of Aspergillus niger with mean zone of inhibition greater than the positive control. These potential actinomycetes, with their corresponding mean values, were A11 (23.83 mm) and A31 (30.13 mm). Generally, isolates were found to be more effective against Candida albicans. Thus, this study concludes that Lake Lanao harbors potential actinomycetes that could be a source for the search of new and effective drugs against pathogenic fungi. 1. INTRODUCTION
Some bacteria, fungi, virus and other pathogenic microorganisms are resistant to their own antibiotics nowadays. As stated by Prabakarana et al., (2011), bacteria lived on earth for several billions of years. During this long period of time, they encountered range of naturally occurring antibiotics to which by now, they combated these and became resistant by the drugs synthesized today. Supported by the study of Spadari et al., (2013), Candida albicans, a pathogenic fungus which causes candidiasis is found to be resistant to its antibiotic (Fluconazole) by Disc-Diffusion method. Antimicrobial resistance is not just a national issue but a global problem and so, finding new and effective drugs is major challenge to the field of medicine. One possible candidate in the search of new and effective drugs is from the actinomycetes. Some actinomycetes form branching filaments that look like the branching hyphae formed by
fungi and so, it was erroneously classified as fungi before. Actinomycetes are actually bacteria under the phylum, Actinobacteria. Under this phylum, actinomycetes tend to produce secondary metabolites; many of which have been successfully isolated and turned into useful drugs. It was in the fifties and sixties that the antibiotics discovered were mainly isolated from Streptomyces. Primarily, Streptomyces were active against bacteria and fungi (Prabakarana and Raja, 2011). The purpose of this study is to screen the 34 actinomycetes isolated from the surface sediments of Lake Lanao specifically from Wato Balindong, Tugaya and Bacolod- Kalawi for its antifungal activity against Candida albicans and Aspergillus niger.
2. METHOD Thirty-four actinomycete isolates obtained from Lake Lanao were cultured in nutrient broth for 48 hours
2
and tested against the two test fungi, Candida albicans and Aspergillus niger. Inoculation of test fungi were done following the agar over-lay technique. The antifungal assay was done using filter paper disc diffusion method. Filter paper discs were impregnated with the 48 hour-old broth culture of the actinomycete isolates were then placed each on the surface of the pre-labeled plates. Petri plates were then incubated at 28oC for 7 days. The mean for every seven-day observation was calculated in three replicates of each isolate. Distilled water and nystatin were used as negative and positive control, respectively. One-way ANOVA and DMRT were used to analyze the zone of inhibition effect of the isolates against the two test-fungi. 3. RESULTS Candida albicans
Out of the 34 actinomycete isolates that were tested for antagonistic screening, only eight isolates (23.53%) were found to inhibit the growth of Candida albicans. Among the actinomycete isolates, A18 has the highest mean zone of inhibition of 26.63mm other isolates ranges from 14.76 to 26.39 mm (Figure 1). There is a statistically significant difference in the mean zones of inhibition among the actinomycete isolates (p value of <0.001). Duncan’s Multiple Range Test results showed that the inhibitory effect of A3 and A 18 are comparable and were significantly different from the other bioactive isolates (Fig. 1). The mean values of the zone of inhibition of the positive control were less than of the bioactive isolates. The mean value of the actinomycete isolate, A3 (26.39mm) was greater than the positive control (13.89mm) and so with the other bioactive isolates, A9 (21.83mm>13.57mm), A11 (22.66mm>13.14mm), A18 (26.63mm>14.40mm), A21 (24.74mm>14.12mm), A25 (22.76mm>12.52mm), A31 (14.76mm>14.29mm) and A32 (16.88mm>13.63mm) .
Figure 1. Antifungal activity of the bioactive actinomycete isolates vs. positive control (Nystatin) against Candida albicans.
Aspergillus niger Out of the 34 isolates, there were only two (5.88%) bioactive isolates that shows inhibitory effect against A. niger. These bioactive actinomycete isolates were A11 and A31 only. Results showed that the zone of inhibition between the bioactive isolates, A31 has the highest mean value of zone of inhibition of 30.13mm followed by A11, with a mean value of 23.83mm (Figure 2). Results also shows that there is a statistically significant difference in the mean zone of inhibition between the actinomycete isolates (p<0.001). Moreover, from the raw data, the mean values of the zone of inhibition of the positive control were less than of the bioactive isolates. The mean value of the actinomycete isolate, A11 (23.83mm) was greater than the positive control (10.14mm). Likewise, A31, with a mean value of 30.13mm was greater than the mean value of the positive control (8.86mm). Figure 2. Antifungal activity of the bioactive
actinomycete isolates vs. positive control (Nystatin)
against Aspergillus niger.
4. DISCUSSION Results showed that Lake Lanao has bioactive
actinomycetes with antifungal activity. Unlike Candida
albicans, the growth of Aspergillus niger is more difficult
to inhibit (Das et al., 2014). Thus, it correlates with the
results that only two actinomycetes isolates (A11 and
A31) inhibited the growth of A. niger. This is similar to
the findings of Jiang and Xu (1996), in which only 118
(6.78%) out of 1741 actinomycete isolates inhibited the
growth of A. niger. These 118 bioactive actinomycetes
were isolated from Yunnan Middle Plateau lakes that are
said to be clear and not as densely polluted by human
activities. Supporting this study, the active actinomycetes
17th World Lake Conference, Lake Kasumigaura, Ibaraki, Japan, 2018
911

3
that inhibited the growth of A. niger with a percentage
value of 5.88% were isolated from the lake sediments that
are not densely polluted by the local residences of
Wato-Balindong.
Antifungal activity of the bioactive
actinomycetes may be described either having a
fungistatic effect or fungicidal effect. Fungistatic effect
explains the effect of inhibiting the growth of the fungi
that may result to thinning of growth of the certain fungi.
Fungicidal effect on the other hand, totally eliminates or
kills the fungi. In the study of Bonjar et al., 2005, it was
determined that clear zones were indicative of fungicidal
effect and the zones bearing only mycelial growth had
fungistatic effect. Bacteria are known to produce
substances with fungistatic and fungicidal effects
(Barbosa et al., 2017) just as actinomycetes produced in
various studies. All of the bioactive actinomycetes that
inhibited the growth of C. albicans have fungistatic
effects as shown in Figure 3. We observed thinning of the
growth of the test fungi as seen in the surroundings of the
growth of the actinomycete isolate. Though fungistatic
effects do not totally inhibit the growth of the test fungi,
fungistatic effects still weakened the growth of the said
fungi. Welsch (1942), showed that the independence of
bacteriolytic and bacteriostatic properties is highly
improbable or unlikely. As for inhibiting the growth of A.
niger, the two bioactive actinomycete isolates clearly
showed fungicidal effects as shown in Figure 4.
Figure 3. Zones of inhibition of the bioactive
actinomycete isolates A3 and A32 with its – (negative
control) and + (positive control) against Candida albicans
at 28°C after 7 days.
Figure 3. Zones of inhibition of the bioactive
actinomycete isolates A11 and A31 with its – (negative
control) and + (positive control) against Aspergillus niger
at 28°C after 7 days
5. CONCLUSION
Findings on this research conclude that the western part of Lake Lanao has bioactive actinomycete isolates. Thus, the lake is a potential ecosystem for antagonistic actinomycetes which deserves bioprospecting or to search for substances that are produced by these bacteria that may be of helpful to medicinal research in the future. Considering the above-mentioned results, eight isolates, A3, A9, A11, A8, A21, A25, A31 and A32 exhibited antifungal activity against Candida albicans and only two isolates, A11 and A31 exhibited antifungal activity against Aspergillus niger. These bioactive actinomycete isolates have the potential to contribute in the search for new and effective drugs. REFERENCES [1] Abbas, A.K.: Antifungal Activities of Actinomycetes Isolated
from a Sample of Iraqi Soil. Iraqi Journal Comm. Med., Vol. 3, pp.179-183, 2009.
[2] Barbosa, J.C., Mochi, D. A., Monteiro, A. and Soares, F: Population Density of Beauveria bassiana in soil under the action of fungicides and native microbial populations. Acta Scientiarum. Vol. 4, pp. 465- 474, 2017.
[3] Bonjar G., Farrokhi, P., Aghigi, S. Bonjar, L., & Aghelizadeh, A. J.C: Antifungal Characterization of Actinomycetes Isolated from Kerman, Iran and Their Future Prospects in Biologucal Control Strategiesin Greenhouse and Field Conditions. Plant Pathology Jourbal. Vol, 4 (1), pp. 78-84, 2005.
[4] Jiang, C. L. and Xu, L. H.: Diversity of Aquatic Actinomycetes in Lakes of Middle, Applied and Environmental Microbiology, Vol. 1, pp. 249-253, 1996.
[5] Prabakarana, P. and Raja, A.: Actinomycetes and Drug- An Overview, American Journal of Drug Discovery and Development, Vol. 1, pp. 75-84, 2011.
17th World Lake Conference, Lake Kasumigaura, Ibaraki, Japan, 2018
912

1
Environmental Impact Risk Assessment of Alien Species using Microcosm System
Kazuhito Murakami1, Tatsuya Shimizu1, Machiko Hata1, Tomomi Tsuchiya1 and Hideaki Hayashi1,2 1Dept. of Life and Environmental Sciences, Chiba Institute of Technology, 2Swing Corporation
Keywords: alien species, environmental impact risk assessment, microcosm, prey-predator interaction, food chain
ABSTRACT From the biota (structural parameter) and the P/R ratio (functional parameter), utilizing the microcosm, which is a microbial ecosystem capable of constructing the basic ecological structure of general lakes, Daphnia (Moina macrocopa,the top-level predator species in the food chain) and bacteria (Escherichia coli, the lowest-level prey species in the food chain) as foreign species invading from outside the lake ecosystem and conducted ecological risk assessment. When introducing the top-level predator species in the food chain into the microcosm, there would be a risk that existing top-level predators would increase due to invasion of foreign organisms that would become higher predator. When introducing the lowest-level prey species in the food chain, it was evaluated that there would be no major impact on existing ecosystems. The influence of alien species on existing ecosystem depends on which trophic stage the alien species are located, and the influence on existing ecosystem is shown to be stronger in high-level predator species in food chain more than low-level prey species in food chain.
1. INTRODUCTION One of the factors that have a serious effect on ecosystems and biodiversity is invasion of alien species into existing ecosystems such as microbial pesticides, ballast water, abandonment of pets, etc. Some these alien species which cause damage and destruction of existing wildlife due to genetic disturbance and disruption of balance of food chain, which causes damage to primary industry, it has become a problem in recent years. In this study, we used the microbial ecosystem (microcosm) that can construct the fundamental ecological structure of general lakes, and from the biota (structural parameters) and P/R ratio (functional parameters), Moina macrocopa (the top-level predator species in the food chain) and bacteria (Excherichia coli, the lowest-level prey species in the food chain) were evaluated as foreign species invading from outside the lake ecosystem, and the purpose was to evaluate the ecological risk impact. 2. EXPERIMENTAL PROCEDURE 2.1 microcosm Microcosm is a simulated ecosystem that cut out a part of natural ecosystem, and it consists of basic components of ecosystem such as decomposer, producer, predator and their biological interaction, material circulation, energy flow. It is a microbial ecosystem that contains elements and is capable of constructing a stable ecosystem. In the Gnotobiotic type microcosm used in this study, the constitutive species is completely known, two producers of green algae Chlorella sp., Scenedesmus sp., one blue-green algae Tolypothrix sp., one protozoan ciliate Cyclidium glaucoma (primary consumer), two metazoan rotiferas Lecane sp., Philodina erythrophthalma, one metazoan oligochaetes Aeolosoma hemprichi (top consumer), four kinds of bacteria (Bacillus cereus, Pseudomonas putida, Acinetobacter sp., coryneform bacteria) as decomposer, consisting of eleven species in total. It has been shown that this microcosm system (N-type) has a high correlation with the natural ecosystem.
2.2 Culture method 200ml of TP (Taub’s basal medium + polypeptone) medium was poured into a 300ml Erlenmeyer flask, and 10ml of subcultured microcosm seed was added, and cultivation was carried out for 30 days under a static condition of a temperature of 25℃ and an illuminance of 2,400 lux (light/dark cycle 12hr./12hr.). 2.3 Introduced organisms As a transferred organism (alien species), Moina macrocopa (the top-level predator in the food chain) and Escherichia coli HB101/pBR325 (the lowest-level prey in the food chain) which were not constructed in microcosm were supplied. Moina macrocopa is filtration feeding minute crustaceans belonging to Daphnia with a physical condition of 0.6-1.2 mm and is usually parthenogenetic only in female, but males appear due to deterioration of the environment due to water pollution and the like to form resisting egg. Also useful as organisms are living baits for ornamental fishes, usefulness of toxicity testing of chemicals, attention as a biomanipulation introduced species, and so on. In this study, focusing on the competitive relationship with Aeolosoma hemprichi which is the top predator in the microcosm, Moina macrocopa is added at 1, 5 and 10 times the introduction amount of Aeolosoma hemprichi individuals, and the structure of the ecosystem and its effect on function. Escherichia coli is gram-negative bacteria and belongs to facultative anaerobic bacteria and is one of the major species of bacteria present in the environment. This bacteria is also an intestinal bacterium and inhabits the large intestine in the digestive tract of warm-blooded animals (birds, mammals), especially humans. Its size is usually 0.4-0.7 μm on the short axis and 2.0-4.0 μm on the long axis, but the long axis is shortened, and some are nearly spherical. It is one of the model organisms as a representative of bacteria, and it is used as a material in various research such as genetic engineering, and it is also used for the production of chemical substances by
17th World Lake Conference, Lake Kasumigaura, Ibaraki, Japan, 2018
913
P1-9

2
incorporating genes. In this study, we focused on the competitive relationship with the four species of bacteria which are the lowest species in the microcosmic food chain. Escherichia coli HB101/pBR325 was added at 1, 10 and 100 times the number of indigenous bacteria in the microcosm, and the influence on the structure and function of the ecosystem was examined. 2.4 Evaluation method Evaluation items were two, number of individuals (structural parameter) and DO (functional parameter). The number of individuals was observed on days 0, 2, 4, 7, 14, 16, 18, 20, 23 and 30 from the start of cultivation using an optical microscope, and the ratio of the number of organisms on the 30th day to the control system evaluated from N30. DO was continuously measured from the 16th day, and the P/R ratio was calculated from the production amount (P) and the respiration amount (R) and evaluated. 3. RESULTS AND DISCUSSION 3.1 Impact of top-level predator introduction 3.1.1 Evaluation by individual number (structural
parameter) In any of the addition systems, the producers Chlorella sp. and Tolypothrix sp. were decreased from immediately after introduction of Moina macrocopa. The cause was thought to be because the predation pressure increased by Moina macrocopa invasion and the latter could not grow sufficiently due to the swimming behavior of Moina macrocopa. In predators, Lecane sp. and Cyclidium glaucoma showed a decreasing tendency, and in the 10 times addition system, extinction was confirmed on the 18th day immediately after addition. This is thought because the competitive relationship of consumers in the microcosm became severe due to the predation pressure of Moina macrocopa and the difference in superiority or inferiority of predation ability occurred. In addition, Moina macrocopa added as a foreign organism in all additive systems converged on the 30th day by the time of measurement. In the 10 times addition system assuming the invasion of a larger amount of alien species, the number of individuals of Aeolosoma hemprichi, which is the top indigenous predator in the microcosm system, increased dramatically on the 30th day. This is because the existence of metabolites generated by the remains of Moina macrocopa and molting is a physical obstacle to filtering feeding zooplankton in predation behavior and only Aeolosoma hemprichi which is opening feeding intake advantageously can prey green algae Chlorella sp.. 3.1.2 Evaluation by DO (functional parameter) From the P/R ratio, which is the ratio of the production and consumption of dissolved oxygen, the consumption activity of dissolved oxygen (DO) increases as the addition amount of Moina macrocopa increases, and immediately after the start of continuous measurement in the 10 times addition system After the DO value attenuated for about 70 hours, it stabilized. For this reason, introduction of ten times amount determined that the ecosystem was affected by the variation of the structural type of the structural parameter and the attenuation of the DO value of the functional parameter, and the top category of the food chain (higher predator) invaded in the microcosm the
Fig.1 Microcosm (microbial ecosystem model)
Fig.2 Population succession in microcosm (control
system)
Fig.3 Moina macrocopa (the top-level predator species in
the food chain) addition system
Fig.4 Escherichia coli (the lowest-level prey species in
the food chain) addition system.
maximum no effect concentration (NOEC) was estimated to bebetween 5 and 10 times the existing top-level predator. Furthermore, since the Lecane sp. is drastically decreased in the 5 times addition system from the structural parameter, the m-NOEC (microcosm maximum effect free
17th World Lake Conference, Lake Kasumigaura, Ibaraki, Japan, 2018
914

3
concentration) is considered to be at a relatively low concentration among 5 to 10 times. 3.2 Impact of lowest-level prey introduction 3.2.1 Evaluation by individual number (structural
parameters) Escherichia coli rapidly decreased at 1, 10, or 100 times inoculation concentrations in viable counts by the selective media method after microcosm inoculation, and the number of small animal groups (in particular, it is a primary consumer, protozoan ciliate Cyclidium glaucoma) in the microcosm increased. Escherichia coli has been shown to be a suitable food source for microcosm-constituting micro animal group such as protozoan ciliates including Cyclidium glaucoma and Philodina erythrophthalma and Aeolosoma hemprichi in prey-predator interaction test, it was considered to be dominated by these predatory actions. In N30 comparison, no significant difference was observed between Escherichia coli-added system and non-added system (control system). 3.2.2 Evaluation by DO (functional parameter) In the P/R ratio, which is the ratio of the production and consumption of dissolved oxygen, the consumption activity of dissolved oxygen (DO) increased as the amount of Escherichia coli added increased, but eventually the non-additive system (control system) converge same level, And the P/R ratio was also stabilized at about 1. For this reason, the introduction of Escherichia coli judged that there is no influence on the ecosystem from the variation of the structural type of the structural parameter and the decline of the DO value of the functional parameter, and even if the lowest species of the food chain invades microcosm, it was evaluated that there was no major impact on the ecosystem. 4. CONCLUSIONS 1) In the case of the top-level predator species in the food
chain (Moina macrocopa) was introduced into the microcosm, two predators were confirmed to extinct in the 10 times addition system. There was a risk that existing top level predators would increase due to invasion of alien species that would become higher predator. The possibility of collapse of the system was indicated. 2) In the case of introducing the lowest-level prey species in the food chain (Escherichia coli) was introduced into the microcosm, both the structure and function parameters converged to the same extent as the control system (non-additive system) and the system recovered, and it was evaluated that there would be no big impact on existing ecosystems. 3) The influence of alien species on existing ecosystem depended on which trophic stage the alien species are located, and the influence on the existing ecosystem was shown to be stronger in high-level predator species more than low-level prey species in its food chain. REFERENCES [1] U.Nishikawa, T.Miyashita Alien Species Biodiversity and
Impact on Human Society, 297pp., Syoukabou, 2011. [2] R.J.Beyers, H.T.Odum Ecological Microcosmos, 557pp.,
Spriger-Verlag, 1993. [3] Y.Kurihara Finite Ecology, 187pp., Iwanamishinsho, 1975. [4] K.Murakami, K.Kakazu, K.Shibata, R.Inamori, K.Sugiura,
Y.Inamori Development of Ecosystem Risk Impact Assessment System Methods for Chemicals using Microcosm Systems, Proceedings of IWA 10th World Water Congress & Exhibition(WWC2016), Website, 2016.
[5] T.Mizuno, E.Takahashi Japanese Freshwater Zooplankton Search Illustration, 551pp., Toukaidaigakusyuppankai, 2000.
[6] J.G.Holt Bergey’s Manual of Determinative Bacteriology, 9th Ed., 816pp., Lippincott Williams & Wilkins, 1994.
[7] R.Sudo, Y.Inamori, K.Murakami, M.Okada, H.Ohtake Effect of Micro Animals on Prosperity and Decay of Plasmid DNA Transconjugant, Preprint of Poster Papers on Water Pollution Research and Control, Kyoto, pp.331-334, 1990.
Fig.5 Impact risk of alien species on different trophic level on existing ecosystem
2
incorporating genes. In this study, we focused on the competitive relationship with the four species of bacteria which are the lowest species in the microcosmic food chain. Escherichia coli HB101/pBR325 was added at 1, 10 and 100 times the number of indigenous bacteria in the microcosm, and the influence on the structure and function of the ecosystem was examined. 2.4 Evaluation method Evaluation items were two, number of individuals (structural parameter) and DO (functional parameter). The number of individuals was observed on days 0, 2, 4, 7, 14, 16, 18, 20, 23 and 30 from the start of cultivation using an optical microscope, and the ratio of the number of organisms on the 30th day to the control system evaluated from N30. DO was continuously measured from the 16th day, and the P/R ratio was calculated from the production amount (P) and the respiration amount (R) and evaluated. 3. RESULTS AND DISCUSSION 3.1 Impact of top-level predator introduction 3.1.1 Evaluation by individual number (structural
parameter) In any of the addition systems, the producers Chlorella sp. and Tolypothrix sp. were decreased from immediately after introduction of Moina macrocopa. The cause was thought to be because the predation pressure increased by Moina macrocopa invasion and the latter could not grow sufficiently due to the swimming behavior of Moina macrocopa. In predators, Lecane sp. and Cyclidium glaucoma showed a decreasing tendency, and in the 10 times addition system, extinction was confirmed on the 18th day immediately after addition. This is thought because the competitive relationship of consumers in the microcosm became severe due to the predation pressure of Moina macrocopa and the difference in superiority or inferiority of predation ability occurred. In addition, Moina macrocopa added as a foreign organism in all additive systems converged on the 30th day by the time of measurement. In the 10 times addition system assuming the invasion of a larger amount of alien species, the number of individuals of Aeolosoma hemprichi, which is the top indigenous predator in the microcosm system, increased dramatically on the 30th day. This is because the existence of metabolites generated by the remains of Moina macrocopa and molting is a physical obstacle to filtering feeding zooplankton in predation behavior and only Aeolosoma hemprichi which is opening feeding intake advantageously can prey green algae Chlorella sp.. 3.1.2 Evaluation by DO (functional parameter) From the P/R ratio, which is the ratio of the production and consumption of dissolved oxygen, the consumption activity of dissolved oxygen (DO) increases as the addition amount of Moina macrocopa increases, and immediately after the start of continuous measurement in the 10 times addition system After the DO value attenuated for about 70 hours, it stabilized. For this reason, introduction of ten times amount determined that the ecosystem was affected by the variation of the structural type of the structural parameter and the attenuation of the DO value of the functional parameter, and the top category of the food chain (higher predator) invaded in the microcosm the
Fig.1 Microcosm (microbial ecosystem model)
Fig.2 Population succession in microcosm (control
system)
Fig.3 Moina macrocopa (the top-level predator species in
the food chain) addition system
Fig.4 Escherichia coli (the lowest-level prey species in
the food chain) addition system.
maximum no effect concentration (NOEC) was estimated to bebetween 5 and 10 times the existing top-level predator. Furthermore, since the Lecane sp. is drastically decreased in the 5 times addition system from the structural parameter, the m-NOEC (microcosm maximum effect free
17th World Lake Conference, Lake Kasumigaura, Ibaraki, Japan, 2018
915

1
17th World Lake Conference, Lake Kasumigaura, Ibaraki, Japan, 2018
916
P1-10

1
2
17:300
30:600
31: :400
34: :200
23:200
27: :400
20k
0 5
15 10
24:350
32:300
25:300
21:150
7: :25m
38:600
37:400
12:200
10:50m
1: :2m
18:200
29:600
13:111m
19:300
11: :100
35: :200
33:200
~
~
28:530m
:115m 14:134m
15:140m
:144m
36:200
6: :19m
4:7m
22:155 16:300
20:200 26:600
2:7m N
S
5:12m
W E
8:36m
9:45m
3:4m
17th World Lake Conference, Lake Kasumigaura, Ibaraki, Japan, 2018
917

3
mm
A 10mm
C 10mm
B 10mm
17th World Lake Conference, Lake Kasumigaura, Ibaraki, Japan, 2018
918

1
Distribution of Phytoplankton and Water Quality in Chiang Mai Moat, Thailand
Metee Khonfu*1, Morrakot Wijitrangsan1, Achara Punsueb1,
Tatporn Kunpradid1,2 and Pongpan Leelahakriengkrai1,2 1 Department of Biology, Chiang Mai Rajabhat University, Thailand
2 Centre of Excellence of Biodiversity Research and Implementation for Community,
Faculty of Science and Technology, Chiang Mai Rajabhat University, Thailand
*Corresponding author E-mail: [email protected]
Keywords: Biodiversity, Chiang Mai Moat, Phytoplankton, Water Quality
ABSTRACT
The distribution of phytoplankton and the water quality of the Chiang Mai Moat, Thailand were investigated over a period of 4 months (September-December 2017). Samples were collected from 4 sites within the Chiang Mai Moat. The distribution of phytoplankton was found to be of the highest abundance at the Chang Phueak Gate site with thirty-nine species found, while the most abundant species were Chlamydomonas sp., Trachelomonas sp. and Microcystis sp. Thirty-four species were identified at the Suan Dok Gate site and the most abundant species were Lepocinclis sp. and Trachelomonas sp. Thirty-two species were identified at the Tha Phae Gate site and the most abundant species were Aulacoseira granalata, Pediastrum biradiatum and Merismopedia sp. Twenty-five species were identified at the Chiang Mai Gate site and the most abundant species were Pseudanabaena sp., and Peridinium sp., respectively. In addition, the trophic status of the Chiang Mai Moat was classified as meso-eutrophic status. 1. INTRODUCTION
The Chiang Mai Moat was built in 1839. It has a square shape and surrounds the old city of Chiang Mai, which is located in Chiang Mai Province. It was originally built to protect the city from the Burmese army. At present, the Chiang Mai Moat is considered a famous tourist attraction of the city and is associated with both the Loy Kratong and Songkran Festivals. It is particularly important in the Songkran Festival (Thai New Year's festival) when people pour or splash moat water to one another as part of the cleansing ritual to welcome the New Year. However, around the moat there are many markets and a thriving community, which have affected the water quality in the moat. Moreover, phytoplankton is one of organisms that are sensitive to water quality because each species can grow in different types of water quality. For this reason, phytoplankton can be used to monitor water quality [1]. Our present investigation focuses on the distribution of phytoplankton and water quality in the Chiang Mai Moat by examining samples collected from four sampling sites.
2. METHOD The samples were collected from 4 sites,
namely Tha Phae Gate, Chiang Mai Gate, Suan Dok Gate and Chang Phueak Gate, within the Chiang Mai Moat (Figure 1). The collection period involved the months of September, October, November and December in 2017. The physical and chemical factors of the water including pH, conductivity, DO, BOD5, nitrate nitrogen, ammonium nitrogen and Orthophosphates values were measured according to the methods described by APHA, AWWA and WEF [2]. The trophic status of the water was classified using the Applied Algal Research Laboratory-Physical and Chemical Score (AARL-PC Score) [3].
Fig. 1 Aerial photograph of the Chiang Mai Moat and 4 sampling sites (O).
17th World Lake Conference, Lake Kasumigaura, Ibaraki, Japan, 2018
919
P1-11

2
Table 1 Minimum and maximum values of the physico-chemical factors, trophic level, Total number of species, Diversity index, Evenness and Richness in Chiang Mai Moat between September to December 2017.
Physico-chemical factors Tha Phae Gate Chiang Mai Gate Suan Dok Gate Chang Phueak Gate
pH 7.01-7.52 6.93-8.15 7.05-7.41 6.87-7.59
Conductivity (µs/cm-1) 212.5-299.1 194.3-234.3 203.5-228.9 198.9-241.3
DO (mg/L) 5.4-7.0 4.4-7.4 5.6-6.8 4.4-6.4
BOD5 (mg/L) 5.2-7.6 5.4-7.8 4.8-10.8 3.2-6.8
Nitrate nitrogen (mg/L) 0.6-1.7 0.2-1.9 0.4-4.7 0.7-4.0
Ammonium nitrogen 0.07-0.50 0.13-0.42 0.82-1.93 0.73-1.52
Orthophosphates (mg/L) 0.07-0.58 0.05-0.31 0.07-0.23 0.21-0.57
Trophic level* Meso-eutrophic Meso-eutrophic Meso-eutrophic Meso-eutrophic
Total number of species 32 25 34 39
Diversity index 0.58 - 1.97 0.73 - 2.37 2.16 - 2.87 2.13 - 2.80
Evenness 0.16-0.71 0.42-0.76 0.68-0.87 0.36-0.68
Richness 10-19 4-18 10-22 13-24
Note: * Trophic level was calculated by conductivity, DO, BOD5, nitrate nitrogen, ammonium nitrogen and Orthophosphates
Phytoplankton samples were collected by filtering 10 liters of water with a 10 µm mesh size plankton net in the field. The samples were then preserved by Lugol's solution. The samples were identified and counted according to relevant resource references [4-6]. The abundance of the phytoplankton species found was also determined for calculation of the diversity index using the Shannon method [7]
3. RESULTS A total of sixty-eight species of phytoplankton were found in the Chiang Mai Moat. Thirty-two species were identified at the Tha Phae Gate site and the most abundant species (more than 10% of relative abundance) were Aulacoseira granalata, Pediastrum biradiatum and Merismopedia sp. Twenty-five species were identified at the Chiang Mai Gate site and the most abundant species were Pseudanabaena sp., and Peridinium sp. Thirty-four species were identified at the Suan Dok Gate site and the most abundant species were Lepocinclis sp. and Trachelomonas sp. Thirty-nine species were identified at the Chang Phueak Gate site and the most abundant species were Chlamydomonas sp., Trachelomonas sp. and Microcystis sp.
The diversity index ranged from 0.58-2.87 and the evenness ranged from 0.16-0.87. At the Suan Dok Gate site during the month of October, a total of 22
species were present. This was where the highest diversity index of 2.87 (evenness 0.80) was recorded. The trophic status of the Chiang Mai Moat was classified as meso-eutrophic status. The maximum and minimum values of the physico-chemical factors, trophic level, Total number of species, Diversity index, Eveness and Richness of each sampling site are shown in Table 1.
4. DISCUSSION The distribution of phytoplankton and water quality revealed differences at each sampling site due to the different activities taking place around the moat. The most dominant species of each sampling site was similar to what was reported by Bicudo et al. [8], Solórzano et al. [9], Wołowski and Grabowska [10] and Komárek and Jankovská [11]. The species that are typically found in water bodies that are rich in organic matter and nutrients could be used to indicate the meso-eutrophic species. This was relevant to determining the trophic level of the Chiang Mai Moat according to the AARL PC score. In addition, Microcystis sp. were found to be in high abundance at the Chang Phueak Gate site and this species could produce Microcystins, which are a group of hepatotoxins that can actively affect fish, birds and mammals [12]. Therefore, water bodies should be considered in the investigation of water quality.
17th World Lake Conference, Lake Kasumigaura, Ibaraki, Japan, 2018
920

3
5. CONCLUSION Sixty-eight species of phytoplankton were collected from the Chiang Mai Moat. The distribution of phytoplankton revealed differences at each sampling site. The dominant species are commonly found in the meso-eutrophic level of lentic ecosystems and could be used to indicator species. In addition, the water quality of the Chiang Mai Moat was classified as meso-eutrophic status.
REFERENCES [1] Heinonen, P., ZiglioAndré, G. and Beken, V.D.: Water Quality
Measurements Series: Hydrological and Limnological Aspects of Lake Monitoring, John Wiley & Sons, Ltd, Chichester, 2000.
[2] APHA, AWWA and WEF: Standard Methods for the Examination of Water and Wastewater, 21st edition, American Public Health Association (APHA), Washington DC, 2002 .
[3] Peerapornpisal, Y., Chaubol, C., Pekkoh, J., Kraibut, H., Chorum, M., Wannathong, P., Ngearnpat, N., Jusakul, K., Thammathiwat, A., Chuanunta, J. and Inthasotti, T.: Monitoring of Water Quality in Ang Kaew Reservoir of Chiang Mai University Using Phytoplankton as Bioindicater from 1995-2002, Chiang Mai Journal of Science, Vol. 31, No. 1, pp 85-94, 2004.
[4] Peerapornpisal, Y.: Phycology ,Chotana Print ,Chiang Mai, 2006.
[5] Peerapornpisal, Y .: Freshwater Algae in Thailand ,Chotana Print, Chiang Mai, 2013.
[6] John, D.M., Whitton, B.A. and Brook, A.J.: The Freshwater Algae Flora of the British Isles, 2nd edtion, Cambridge Press, Cambridge, 2011.
[7] Bicudo D.C., Tremarin, P.I., Almeida, P.D., Almeida, S.Z., Wengrat, S., Faustino, S.B., Costa, L.F., Bartozek, E.C.R., Rocha, A.C.R., Bicudo, C.E.M. and Morales, E.A.: Ecology and distribution of Aulacoseira species (Bacillariophyta) in tropical reservoirs from Brazil, Diatom Research, Vol. 31, pp. 199-215, 2016.
[8] Solórzano, G.G., Martinez, M.G.O., Vazquez, A. L., Garfias, M.B.M., Zuniga, R.E.Q. and Conforti, V.: Trachelomonas (Euglenophyta) from a eutrophic reservoir in Central Mexico, Journal of Environmental Biology, Vol. 32, pp. 363- 371 ,2011.
[9] Wołowski, K. and Grabowska, M.: Trachelomonas species as the main component of the euglenophyte community in the Siemianówka Reservoir (Narew River, Poland), International Journal of Limnology: Annales de Limnologie, Vol. 43 (3), pp. 207-218, 2007.
[10] Komárek, J. and Jankovská, V.: Review of the green algal genus Pediastrum: implication for pollen–analytical research, Bibliotheca Phycologica, Vol. 108, pp. 1–127, 2001.
[11] Chen, X., Xiang, H., Hu, Y., Zhang, Y., Ouyang, L., Gao, M.: Fates of Microcystis aeruginosa Cells and Associated Microcystins in Sediment and the Effect of Coagulation Process on Them, Toxins, Vol. 6, pp. 152-167, 2014.
2
Table 1 Minimum and maximum values of the physico-chemical factors, trophic level, Total number of species, Diversity index, Evenness and Richness in Chiang Mai Moat between September to December 2017.
Physico-chemical factors Tha Phae Gate Chiang Mai Gate Suan Dok Gate Chang Phueak Gate
pH 7.01-7.52 6.93-8.15 7.05-7.41 6.87-7.59
Conductivity (µs/cm-1) 212.5-299.1 194.3-234.3 203.5-228.9 198.9-241.3
DO (mg/L) 5.4-7.0 4.4-7.4 5.6-6.8 4.4-6.4
BOD5 (mg/L) 5.2-7.6 5.4-7.8 4.8-10.8 3.2-6.8
Nitrate nitrogen (mg/L) 0.6-1.7 0.2-1.9 0.4-4.7 0.7-4.0
Ammonium nitrogen 0.07-0.50 0.13-0.42 0.82-1.93 0.73-1.52
Orthophosphates (mg/L) 0.07-0.58 0.05-0.31 0.07-0.23 0.21-0.57
Trophic level* Meso-eutrophic Meso-eutrophic Meso-eutrophic Meso-eutrophic
Total number of species 32 25 34 39
Diversity index 0.58 - 1.97 0.73 - 2.37 2.16 - 2.87 2.13 - 2.80
Evenness 0.16-0.71 0.42-0.76 0.68-0.87 0.36-0.68
Richness 10-19 4-18 10-22 13-24
Note: * Trophic level was calculated by conductivity, DO, BOD5, nitrate nitrogen, ammonium nitrogen and Orthophosphates
Phytoplankton samples were collected by filtering 10 liters of water with a 10 µm mesh size plankton net in the field. The samples were then preserved by Lugol's solution. The samples were identified and counted according to relevant resource references [4-6]. The abundance of the phytoplankton species found was also determined for calculation of the diversity index using the Shannon method [7]
3. RESULTS A total of sixty-eight species of phytoplankton were found in the Chiang Mai Moat. Thirty-two species were identified at the Tha Phae Gate site and the most abundant species (more than 10% of relative abundance) were Aulacoseira granalata, Pediastrum biradiatum and Merismopedia sp. Twenty-five species were identified at the Chiang Mai Gate site and the most abundant species were Pseudanabaena sp., and Peridinium sp. Thirty-four species were identified at the Suan Dok Gate site and the most abundant species were Lepocinclis sp. and Trachelomonas sp. Thirty-nine species were identified at the Chang Phueak Gate site and the most abundant species were Chlamydomonas sp., Trachelomonas sp. and Microcystis sp.
The diversity index ranged from 0.58-2.87 and the evenness ranged from 0.16-0.87. At the Suan Dok Gate site during the month of October, a total of 22
species were present. This was where the highest diversity index of 2.87 (evenness 0.80) was recorded. The trophic status of the Chiang Mai Moat was classified as meso-eutrophic status. The maximum and minimum values of the physico-chemical factors, trophic level, Total number of species, Diversity index, Eveness and Richness of each sampling site are shown in Table 1.
4. DISCUSSION The distribution of phytoplankton and water quality revealed differences at each sampling site due to the different activities taking place around the moat. The most dominant species of each sampling site was similar to what was reported by Bicudo et al. [8], Solórzano et al. [9], Wołowski and Grabowska [10] and Komárek and Jankovská [11]. The species that are typically found in water bodies that are rich in organic matter and nutrients could be used to indicate the meso-eutrophic species. This was relevant to determining the trophic level of the Chiang Mai Moat according to the AARL PC score. In addition, Microcystis sp. were found to be in high abundance at the Chang Phueak Gate site and this species could produce Microcystins, which are a group of hepatotoxins that can actively affect fish, birds and mammals [12]. Therefore, water bodies should be considered in the investigation of water quality.
17th World Lake Conference, Lake Kasumigaura, Ibaraki, Japan, 2018
921

17th World Lake Conference, Lake Kasumigaura, Ibaraki, Japan, 2018
922
P1-12

17th World Lake Conference, Lake Kasumigaura, Ibaraki, Japan, 2018
923
17th World Lake Conference, Lake Kasumigaura, Ibaraki, Japan, 2018
924

Diversity of Fishes in Laguna de Cagayan Lake, Philippines: Status and Conservation Needs
Wilma S. Urmeneta1
1 College of Fisheries and Marine Science, Cagayan State University
Keywords: species composition, abundance, IUCN, Red List status, diversity indices
ABSTRACT
Assessment of ichthyofauna and habitat stability of Laguna de Cagayan Lake is a pioneer study to document diversity and conservation towards sustainable ecosystem services. The study was conducted to characterize species composition, abundance, IUCN Red List status, and diversity of fishes caught in the lake from September, 2017 to March, 2018. Species composition revealed 1,714 individuals belonging to 14 species from 9 families. The dominant species Trichopodus pectoralis consisted 41.94% and the least 0.06% of the population is Leiopotherapon plumbeus, Family Osphronemidae dominated the catch followed by Cichlidae and Anguillidae .Cyprinus carpio VU is the only Red List species. But Anguilla celebesensis, A. bicolor pacifica and Clarias macrocephalus are NT fishes. Diversity T-test showed significant differences (P<0.05) on fish abundance between two sites and species richness of Luga, Margalef Index d= 1.77 is higher than Bangalao d= 1.34. Shannon-Weiner index H=1.59 revealed that the lake is fairly stable. Simpson’s Reciprocal Index showed 1/D= 3.34- 4.29 means there are 3-4 commonly caught species and suggest good result of the study. Pielou’s Evenness (J=0.69) observed more equal distribution of individual. Furthermore, Sorensen’s Index Cs=2.67 showed more than half of the fishes identified in both sites are of the same species. Results of this study could serve as a baseline data in coordination with concerned line agencies to formulate sound-community based management strategy. 1. INTRODUCTION
The Philippine archipelago belongs to the world’s richest mega diverse countries and one of the biodiversity hotspots worldwide with high diversity of endemic species significantly altered by human activities. The province of Cagayan (capital: Tuguegarao City, 170 37’N 121043’E) lies in the northern part of Region II. Cagayan is endowed with rich biodiversity. In the recently conducted Philippine Biodiversity Conservation Setting, the region has been one of the priority conservation sites and identified as Key Biodiversity Areas.
Species richness and relative species abundance describe key elements of biodiversity. Diversity is maximum when all species that make up the community are equally abundant or have similar population sizes [1]. Diversity indices are commonly related to studies on species composition and distribution to evaluate stability of aquatic ecosystems.
Documentation of species composition and abundance of fishes at Laguna de Cagayan (LDC) Lake is important because this freshwater ecosystem has never been scientifically assessed. There is no detailed investigation on species diversity to date thus, this study was conducted. Proper documentation of the area is needed for policy formulation and proper management of the ecosystem.
This study generally aimed to assess the diversity and abundance of fishes along Laguna de Cagayan Lake. Specifically aimed to determine the species composition and evenness, Red List conservation status, and diversity indices of fishes caught.
2. METHODS 2.1 Study Area
Laguna de Cagayan Lake is bounded in the north by Bangalao Elementary School, in the south by Namunit hills and caves, in the west by a wide landmass uninhabited and the east by rice fields towards the Sierra Madre Mountains. LDC Lake has rich ecosystem diversity and natural scenic attractions promote the famous annual “National Eco-tourism Festival”. Laguna De Cagayan (LDC), the town’s premiere lake also known as Bangalao Lake is one of the most productive inland waters having diverse aquatic flora and fauna. Various aquatic vegetation’s like the emergent native bakong grass, Hanguana malayana surrounds the lake abundantly, which is widely used in making expensive barongs, bags, and wall decors. The lake has an estimated area of 200 ha. located at Brgy. Luga, Sta. Teresita, Cagayan North. Three sampling points each were used in site 1-Sitio Bangalao and site 2- Barangay Luga. 2.2 Data Gathering and Analysis
Fishing practices used passive gears like fish corral in shallow portion. Gill net and hook and line were used at depths of 5-10 m. Specimen were collected at random from the catch of three fishermen/ cooperators each from the different fishing gears. Only two fishermen have skiff boat. Sampling was done thrice a month in the landing sites between 6:00 – 8:00 am from September 2017-March 2018. Fishes were counted and weighed fresh and classified to the lowest possible taxon. Some were preserved in ice packed cooler and brought to COFMS-Aparri laboratory for further identification.
17th World Lake Conference, Lake Kasumigaura, Ibaraki, Japan, 2018
925
P1-13
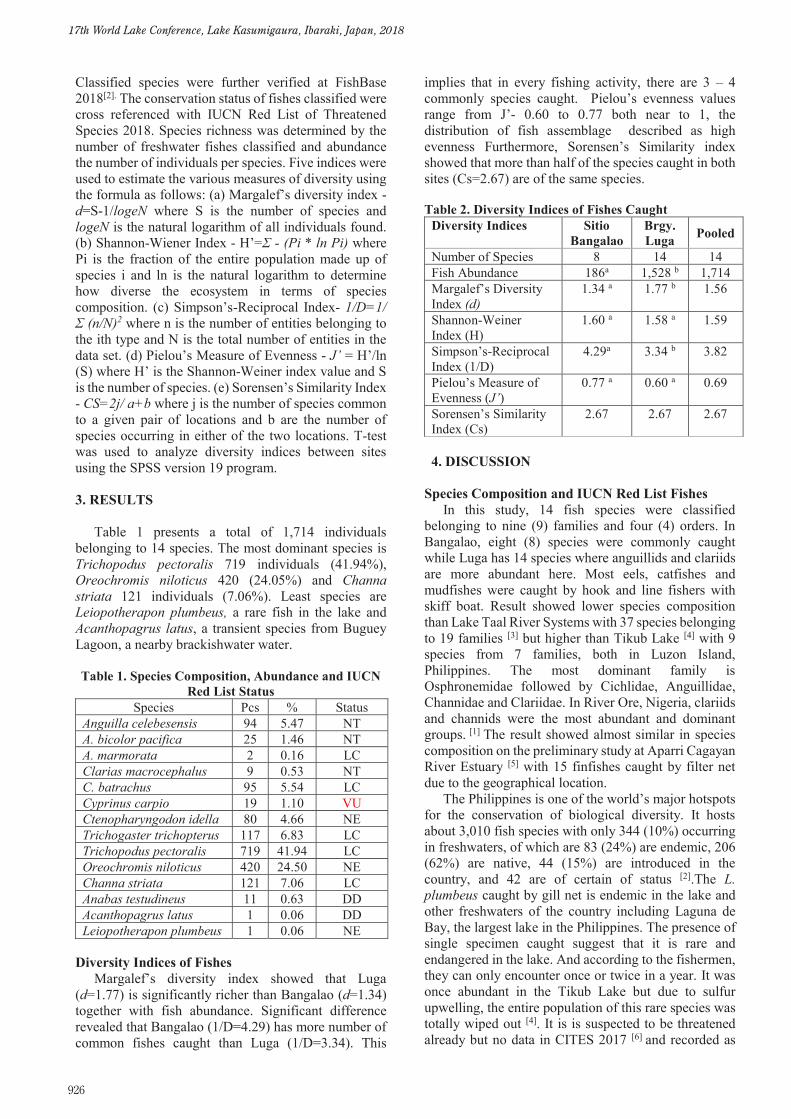
Classified species were further verified at FishBase 2018[2]. The conservation status of fishes classified were cross referenced with IUCN Red List of Threatened Species 2018. Species richness was determined by the number of freshwater fishes classified and abundance the number of individuals per species. Five indices were used to estimate the various measures of diversity using the formula as follows: (a) Margalef’s diversity index - d=S-1/logeN where S is the number of species and logeN is the natural logarithm of all individuals found. (b) Shannon-Wiener Index - H’=Σ - (Pi * ln Pi) where Pi is the fraction of the entire population made up of species i and ln is the natural logarithm to determine how diverse the ecosystem in terms of species composition. (c) Simpson’s-Reciprocal Index- 1/D=1/ Σ (n/N)2 where n is the number of entities belonging to the ith type and N is the total number of entities in the data set. (d) Pielou’s Measure of Evenness - J’ = H’/ln (S) where H’ is the Shannon-Weiner index value and S is the number of species. (e) Sorensen’s Similarity Index - CS=2j/ a+b where j is the number of species common to a given pair of locations and b are the number of species occurring in either of the two locations. T-test was used to analyze diversity indices between sites using the SPSS version 19 program.
3. RESULTS
Table 1 presents a total of 1,714 individuals belonging to 14 species. The most dominant species is Trichopodus pectoralis 719 individuals (41.94%), Oreochromis niloticus 420 (24.05%) and Channa striata 121 individuals (7.06%). Least species are Leiopotherapon plumbeus, a rare fish in the lake and Acanthopagrus latus, a transient species from Buguey Lagoon, a nearby brackishwater water. Table 1. Species Composition, Abundance and IUCN
Red List Status Species Pcs % Status
Anguilla celebesensis 94 5.47 NT A. bicolor pacifica 25 1.46 NT A. marmorata 2 0.16 LC Clarias macrocephalus 9 0.53 NT C. batrachus 95 5.54 LC Cyprinus carpio 19 1.10 VU Ctenopharyngodon idella 80 4.66 NE Trichogaster trichopterus 117 6.83 LC Trichopodus pectoralis 719 41.94 LC Oreochromis niloticus 420 24.50 NE Channa striata 121 7.06 LC Anabas testudineus 11 0.63 DD Acanthopagrus latus 1 0.06 DD Leiopotherapon plumbeus 1 0.06 NE
Diversity Indices of Fishes
Margalef’s diversity index showed that Luga (d=1.77) is significantly richer than Bangalao (d=1.34) together with fish abundance. Significant difference revealed that Bangalao (1/D=4.29) has more number of common fishes caught than Luga (1/D=3.34). This
implies that in every fishing activity, there are 3 – 4 commonly species caught. Pielou’s evenness values range from J’- 0.60 to 0.77 both near to 1, the distribution of fish assemblage described as high evenness Furthermore, Sorensen’s Similarity index showed that more than half of the species caught in both sites (Cs=2.67) are of the same species.
Table 2. Diversity Indices of Fishes Caught
Diversity Indices Sitio Bangalao
Brgy. Luga Pooled
Number of Species 8 14 14 Fish Abundance 186a 1,528 b 1,714 Margalef’s Diversity Index (d)
1.34 a 1.77 b 1.56
Shannon-Weiner Index (H)
1.60 a 1.58 a 1.59
Simpson’s-Reciprocal Index (1/D)
4.29a 3.34 b 3.82
Pielou’s Measure of Evenness (J’)
0.77 a 0.60 a 0.69
Sorensen’s Similarity Index (Cs)
2.67 2.67 2.67
4. DISCUSSION Species Composition and IUCN Red List Fishes
In this study, 14 fish species were classified belonging to nine (9) families and four (4) orders. In Bangalao, eight (8) species were commonly caught while Luga has 14 species where anguillids and clariids are more abundant here. Most eels, catfishes and mudfishes were caught by hook and line fishers with skiff boat. Result showed lower species composition than Lake Taal River Systems with 37 species belonging to 19 families [3] but higher than Tikub Lake [4] with 9 species from 7 families, both in Luzon Island, Philippines. The most dominant family is Osphronemidae followed by Cichlidae, Anguillidae, Channidae and Clariidae. In River Ore, Nigeria, clariids and channids were the most abundant and dominant groups. [1] The result showed almost similar in species composition on the preliminary study at Aparri Cagayan River Estuary [5] with 15 finfishes caught by filter net due to the geographical location.
The Philippines is one of the world’s major hotspots for the conservation of biological diversity. It hosts about 3,010 fish species with only 344 (10%) occurring in freshwaters, of which are 83 (24%) are endemic, 206 (62%) are native, 44 (15%) are introduced in the country, and 42 are of certain of status [2].The L. plumbeus caught by gill net is endemic in the lake and other freshwaters of the country including Laguna de Bay, the largest lake in the Philippines. The presence of single specimen caught suggest that it is rare and endangered in the lake. And according to the fishermen, they can only encounter once or twice in a year. It was once abundant in the Tikub Lake but due to sulfur upwelling, the entire population of this rare species was totally wiped out [4]. It is is suspected to be threatened already but no data in CITES 2017 [6] and recorded as
17th World Lake Conference, Lake Kasumigaura, Ibaraki, Japan, 2018
926
Not Evaluated (NE) by IUCN Red List of Threatened Species.
Some 20 years ago, according to fishermen of LDC Lake, Clarias macrocephalus was once abundant but due to the introduction of Thailand hito, C. batracus an invasive alien species (IAS) is now more dominant species therefore, reduced the population of the native catfish. Further research across the species range is needed into the impacts of hybrids on the wild. Thus, the conservation efforts should ensure minimization of anthropogenic impacts, like the introduction of IAS.
Cagayan River, the longest river in the Philippines, is also habitat of the above two Near Threatened (NT) eel species including vulnerable (VU) species Cyprinus carpio. Although no population data exists, it is suspected that in the past 60 to 75 years within the native range, major threats are river channelization which impacts the species. Common carp needs flooded areas at very specific times to successfully spawn, and hybridization with introduced stock, has caused a population decline of over 30% [2]. Due to rising concerns over the increased exploitation of elvers, the Philippines issued a ban in 2012 on the trade of juvenile eels. Aside from this ban, which was largely driven by fisheries concerns, there are other conservation measures being taken for Anguilla spp.
LDC Lake has recently joined select areas in the country in the implementation of the Restoration and Enhancement of Fisheries in Lakes and Reservoirs, to capacitate the residents surrounding the lake on fisheries management, protection and conservation.
Diversity Indices
Results showed that Margalef’s diversity index in Laguna de Cagayan varies from d=1.34 to 1.77. Diversity T-test results showed that Luga is significantly higher in species richness and abundance than Bangalao. Shannon—Weiner index H=1.59 means that the habitat structure is fairly stable and quite balanced. Comparing the diversity to Buguey Lagoon of a nearby town has higher species composition (n=43) with a stable ecosystem H=2.0 (author’s unpublished paper presented WLC 2016, Bali, Indonesia). Lake Geriyo, Nigeria [8] with H=2.48 indicated a fair fish diversity and
Lake Taal River Systems [3] with a range of H=2.32-3.05 as high diversity. The fair diversity estimate of this 200ha. lake could be explained by the very few fishermen with lesser fishing effort because they are busy with other livelihood like farming. They are not interested even in buying a motorized banca nor constructing one, again only two used a skiff boat. Most of the fishermen are about two km. away from the isolated deeper portion of the lake. However, because of the scenic beauty of this biodiverse lake including nearby verdant hills and numerous caves, it is where the said municipality celebrates the opening program and other fisheries activities of the national annual festival. Its theme emphasizes the management and conservation of terrestrial and aquatic ecosystems biodiversity.
High evenness values J’=0.69 was observed. The distribution of fish assemblage can be therefore
described as high evenness, reflecting fish assemblage co-existing within the lake. Result is quiet lower than Lake Taal River Systems [3] of which values ranged from J’= 0.7 - 0.85.
5. CONCLUSION Fourteen (14) species of freshwater fishes with a
total of 1,714 individuals were classified at LDC Lake with good species richness and abundance Trichopodus spp. dominated the catch followed by cichlid, anguillids, channids and clariids. Cyprinus carpio (VU) is the only Red List species. More ever, native Anguilla celebesensis, A. bicolor pacifica and Clarias macrocephalus are Near Threatened (NT) fishes already. Shannon-Wiener index estimate of fair habitat stability is for further study. Simpson’s Reciprocal Index significantly showed 3-4 common fishes caught every fishing in Laguna de Cagayan Lake and suggest good result of the study. Consequently, Pielou’s Evenness revealed more equal distribution of individuals or high evenness. Furthermore, Sorensen’s Similarity Index showed that more than half of the fishes identified between sites are of the same species. Further study should be conducted and coordinated to government line agencies like DA- BFAR and DENR for funding and better documentation. The generated data base will be presented to the Local Government Unit (LGU) of Sta. Teresita for information dissemination to increase awareness among fisher folks on the importance of conserving threatened, native and endemic fishes in maintaining ecosystem integrity and promote sustainable fishing. This study could serve as a baseline data in formulating management plan and conservation of fisheries resources of this water body. REFERENCES [1] Emmanuel, L.O. and Modupe, O. O., Fish Diversity in Three
Tributaries of River Ore, South West, Nigeria World Journal of Fish and Marine Sciences Vol. 2(6) pp. 524-531. 2010.
[2] Froese, R. and D. Pauly, Editors .FishBase, Concepts, Design and Data Sources., Laguna, Philippines.334pp. 2018.
[3] Corpuz, M.C., Paller, V.V., and Ocampo, P.P., Diversity and Distribution of Freshwater Fish Assemblages in Lake Taal River Systems in Batangas, Philippines, Journal of Environment Science and Management 19(1): 85-95. ISSN 0119-1144. June, 2016.
[4] Bonifacio V. Labatos Jr. and Nicomedes D. Briones Freshwater Fishes of Tikub Lake, Tiaong, Quezon, Philippines, Vol. 5 pp.41-53. 2014.
[5] Molina L.P., Urmeneta W.S.,Rabanal S.R., Amaba S.T., Catch, Effort and Socio-Economic Dynamics of Filter Net Fishery In Aparri Cagayan River Estuary-A Preliminary Study, IAMURE International Journal of Ecology and Conservation Vol.7 pp. 166-185. 2014.
[6] CITES, UNEP- WCMC. The Checklist of CITES Species Website< Appendix I, II and III valid from April 4, 2017. Geneva, Switzerland, Compiled by UNEP UK 2017.
[7] Bolarinwa, J.B. Fasakin, E.A., Fagbenro, A. O. Species Composition and Diversity of the Coastal Waters of Ondo State, Nigeria. International Journal of Research in Agriculture and Forestry. Vol. II, pp 51-58 2015.
[8] Adedeji, Adebowale H, Adeniyi TI, Olubunmi AJ, Amos SO. Some Ichthyofauna Status of Lake Geriyo, Adamawa State. J Fisheries Livest Prod 5: 244. 2017.
Classified species were further verified at FishBase 2018[2]. The conservation status of fishes classified were cross referenced with IUCN Red List of Threatened Species 2018. Species richness was determined by the number of freshwater fishes classified and abundance the number of individuals per species. Five indices were used to estimate the various measures of diversity using the formula as follows: (a) Margalef’s diversity index - d=S-1/logeN where S is the number of species and logeN is the natural logarithm of all individuals found. (b) Shannon-Wiener Index - H’=Σ - (Pi * ln Pi) where Pi is the fraction of the entire population made up of species i and ln is the natural logarithm to determine how diverse the ecosystem in terms of species composition. (c) Simpson’s-Reciprocal Index- 1/D=1/ Σ (n/N)2 where n is the number of entities belonging to the ith type and N is the total number of entities in the data set. (d) Pielou’s Measure of Evenness - J’ = H’/ln (S) where H’ is the Shannon-Weiner index value and S is the number of species. (e) Sorensen’s Similarity Index - CS=2j/ a+b where j is the number of species common to a given pair of locations and b are the number of species occurring in either of the two locations. T-test was used to analyze diversity indices between sites using the SPSS version 19 program.
3. RESULTS
Table 1 presents a total of 1,714 individuals belonging to 14 species. The most dominant species is Trichopodus pectoralis 719 individuals (41.94%), Oreochromis niloticus 420 (24.05%) and Channa striata 121 individuals (7.06%). Least species are Leiopotherapon plumbeus, a rare fish in the lake and Acanthopagrus latus, a transient species from Buguey Lagoon, a nearby brackishwater water. Table 1. Species Composition, Abundance and IUCN
Red List Status Species Pcs % Status
Anguilla celebesensis 94 5.47 NT A. bicolor pacifica 25 1.46 NT A. marmorata 2 0.16 LC Clarias macrocephalus 9 0.53 NT C. batrachus 95 5.54 LC Cyprinus carpio 19 1.10 VU Ctenopharyngodon idella 80 4.66 NE Trichogaster trichopterus 117 6.83 LC Trichopodus pectoralis 719 41.94 LC Oreochromis niloticus 420 24.50 NE Channa striata 121 7.06 LC Anabas testudineus 11 0.63 DD Acanthopagrus latus 1 0.06 DD Leiopotherapon plumbeus 1 0.06 NE
Diversity Indices of Fishes
Margalef’s diversity index showed that Luga (d=1.77) is significantly richer than Bangalao (d=1.34) together with fish abundance. Significant difference revealed that Bangalao (1/D=4.29) has more number of common fishes caught than Luga (1/D=3.34). This
implies that in every fishing activity, there are 3 – 4 commonly species caught. Pielou’s evenness values range from J’- 0.60 to 0.77 both near to 1, the distribution of fish assemblage described as high evenness Furthermore, Sorensen’s Similarity index showed that more than half of the species caught in both sites (Cs=2.67) are of the same species.
Table 2. Diversity Indices of Fishes Caught
Diversity Indices Sitio Bangalao
Brgy. Luga Pooled
Number of Species 8 14 14 Fish Abundance 186a 1,528 b 1,714 Margalef’s Diversity Index (d)
1.34 a 1.77 b 1.56
Shannon-Weiner Index (H)
1.60 a 1.58 a 1.59
Simpson’s-Reciprocal Index (1/D)
4.29a 3.34 b 3.82
Pielou’s Measure of Evenness (J’)
0.77 a 0.60 a 0.69
Sorensen’s Similarity Index (Cs)
2.67 2.67 2.67
4. DISCUSSION Species Composition and IUCN Red List Fishes
In this study, 14 fish species were classified belonging to nine (9) families and four (4) orders. In Bangalao, eight (8) species were commonly caught while Luga has 14 species where anguillids and clariids are more abundant here. Most eels, catfishes and mudfishes were caught by hook and line fishers with skiff boat. Result showed lower species composition than Lake Taal River Systems with 37 species belonging to 19 families [3] but higher than Tikub Lake [4] with 9 species from 7 families, both in Luzon Island, Philippines. The most dominant family is Osphronemidae followed by Cichlidae, Anguillidae, Channidae and Clariidae. In River Ore, Nigeria, clariids and channids were the most abundant and dominant groups. [1] The result showed almost similar in species composition on the preliminary study at Aparri Cagayan River Estuary [5] with 15 finfishes caught by filter net due to the geographical location.
The Philippines is one of the world’s major hotspots for the conservation of biological diversity. It hosts about 3,010 fish species with only 344 (10%) occurring in freshwaters, of which are 83 (24%) are endemic, 206 (62%) are native, 44 (15%) are introduced in the country, and 42 are of certain of status [2].The L. plumbeus caught by gill net is endemic in the lake and other freshwaters of the country including Laguna de Bay, the largest lake in the Philippines. The presence of single specimen caught suggest that it is rare and endangered in the lake. And according to the fishermen, they can only encounter once or twice in a year. It was once abundant in the Tikub Lake but due to sulfur upwelling, the entire population of this rare species was totally wiped out [4]. It is is suspected to be threatened already but no data in CITES 2017 [6] and recorded as
17th World Lake Conference, Lake Kasumigaura, Ibaraki, Japan, 2018
927
1
Bird abundance in the rice fields of Chor-Lae community,
Mae Rim District, Chiang Mai Province in Thailand Nattida Supahan1,2,* and Angkana Chaiwong1
1Department of Biology, Faculty of Science and Technology, Chiang Mai Rajabhat University, Chiang Mai, Thailand 2Centre of Excellence of Biodiversity Research and Implementation for Community, Faculty of Science and Technology,
Chiang Mai Rajabhat University, Chiang Mai, Thailand
*Corresponding author: email address: [email protected]
Keywords: Bird abundance, Biodiversity evaluation, Wetlands, Rice fields
ABSTRACT
The objective of this study was to investigate the abundance of birds in the rice fields and its surroundings during
farming season. The survey was conducted from September to December 2016, by using the line transect technique along
the rice fields. Data were collected from 0600 h to 0900 h and/or 1500 h to 1800 h, 16 times in total. Overall, seven orders
consisting of 45 species within 24 families of birds were found. Thirty-two species were resident birds and 13 species were
migratory birds. Passeriformes was the most common order of birds found in the area. Twelve bird species were categorized
as abundant, for instance, Common Myna (Acridotheres tristis), White-vented Myna (Acridotheres grandis), Spotted Dove
(Streptopelia chinensis), Rock Pigeon (Columba livia) and Eurasian Tree Sparrow (Passer montanus). Seven species were
common; for example, White-breasted Waterhen (Amaurornis phoenicurus) and White Wagtail (Motacilla alba). Thirteen
species were moderately common, such as Bronzed Drongo (Dicrurus aeneus). Other 13 species were uncommon, such
as White-throated Kingfisher (Halcyon smyrnensis) and Intermediate Egret (Mesophoyx intermedia). The Shannon
diversity index was 3.16 and the evenness index was 0.88. The data from this research will be useful for those interested
in studying birds in the rice fields, wetlands or fresh water sources, and it would build good source of knowledge for
community for planning conservation of natural resources in the future.
1. INTRODUCTION
Chor-Lae community is located in the basin of the
Mae Ping and Mae Ngad River. It is an agricultural area
with extensive vegetable gardens, fruit orchards and rice
fields which are the good sources of food and habitat for
birds. Many birds help to eliminate insects, worms and
pests or help to spread pollination. During rainy and winter
seasons, between August to December of every year, the
large part of Chor-Lae community will become rice fields. When rice is planted, various living species, such as
insects, mollusks, mice, etc., will come into the area due to
the abundance of food and water. These organisms are
abundant sources of food for many species of birds.
Therefore, the objective of this study were to explore the
diversity and abundance of birds in the rice fields and its
surroundings, to gain knowledge for the use of community
and those who are interested later on.
2. METHOD
Bird surveys were conducted along the rice fields in
Chor-Lae community ( 19°08'30.5"N 99°00'48.2"E) by
using the line transect technique. This technique is suitable
for a complex environment or large areas with open spaces
such as rice fields, wetlands, lowlands, etc., where birds
are easily visible. The total distance observed was
approximately 850 meters. The data were collected 16
times across the period of four months (four times every
month) during September to December 2016, from 0600 h
17th World Lake Conference, Lake Kasumigaura, Ibaraki, Japan, 2018
928
P1-14

1
Bird abundance in the rice fields of Chor-Lae community,
Mae Rim District, Chiang Mai Province in Thailand Nattida Supahan1,2,* and Angkana Chaiwong1
1Department of Biology, Faculty of Science and Technology, Chiang Mai Rajabhat University, Chiang Mai, Thailand 2Centre of Excellence of Biodiversity Research and Implementation for Community, Faculty of Science and Technology,
Chiang Mai Rajabhat University, Chiang Mai, Thailand
*Corresponding author: email address: [email protected]
Keywords: Bird abundance, Biodiversity evaluation, Wetlands, Rice fields
ABSTRACT
The objective of this study was to investigate the abundance of birds in the rice fields and its surroundings during
farming season. The survey was conducted from September to December 2016, by using the line transect technique along
the rice fields. Data were collected from 0600 h to 0900 h and/or 1500 h to 1800 h, 16 times in total. Overall, seven orders
consisting of 45 species within 24 families of birds were found. Thirty-two species were resident birds and 13 species were
migratory birds. Passeriformes was the most common order of birds found in the area. Twelve bird species were categorized
as abundant, for instance, Common Myna (Acridotheres tristis), White-vented Myna (Acridotheres grandis), Spotted Dove
(Streptopelia chinensis), Rock Pigeon (Columba livia) and Eurasian Tree Sparrow (Passer montanus). Seven species were
common; for example, White-breasted Waterhen (Amaurornis phoenicurus) and White Wagtail (Motacilla alba). Thirteen
species were moderately common, such as Bronzed Drongo (Dicrurus aeneus). Other 13 species were uncommon, such
as White-throated Kingfisher (Halcyon smyrnensis) and Intermediate Egret (Mesophoyx intermedia). The Shannon
diversity index was 3.16 and the evenness index was 0.88. The data from this research will be useful for those interested
in studying birds in the rice fields, wetlands or fresh water sources, and it would build good source of knowledge for
community for planning conservation of natural resources in the future.
1. INTRODUCTION
Chor-Lae community is located in the basin of the
Mae Ping and Mae Ngad River. It is an agricultural area
with extensive vegetable gardens, fruit orchards and rice
fields which are the good sources of food and habitat for
birds. Many birds help to eliminate insects, worms and
pests or help to spread pollination. During rainy and winter
seasons, between August to December of every year, the
large part of Chor-Lae community will become rice fields. When rice is planted, various living species, such as
insects, mollusks, mice, etc., will come into the area due to
the abundance of food and water. These organisms are
abundant sources of food for many species of birds.
Therefore, the objective of this study were to explore the
diversity and abundance of birds in the rice fields and its
surroundings, to gain knowledge for the use of community
and those who are interested later on.
2. METHOD
Bird surveys were conducted along the rice fields in
Chor-Lae community ( 19°08'30.5"N 99°00'48.2"E) by
using the line transect technique. This technique is suitable
for a complex environment or large areas with open spaces
such as rice fields, wetlands, lowlands, etc., where birds
are easily visible. The total distance observed was
approximately 850 meters. The data were collected 16
times across the period of four months (four times every
month) during September to December 2016, from 0600 h
2
to 0900 h and/or 1500 h to 1800 h. The surveys were
designed to explore both left and right sides vertically to the
path not over 30 m. Binoculars and a digital camera were
used to search for the location of birds from the ground
level, in grass, bushes and up to the tall trees[1]. Species,
numbers and behaviour found were recorded. Bird species
were identified by using the bird guide. The relative
abundance[2], Shannon diversity index (H´) and Pielou’s
evenness index (J´) were then calculated.
3. RESULTS
From the survey of birds found in the area from
September to December 2016, there were seven orders
consisting of 45 species from 24 families. Thirty-two of
them were residents, such as Red Collared Dove
(Streptopelia tranquebarica), White-throated Kingfisher
(Halcyon smyrnensis), Green Bee-eater (Merops
orientalis), White-breasted Waterhen (Amaurornis
phoenicurus), Bronzed Drongo (Dicrurus aeneus), Scaly-
breasted Munia (Lonchura punctulata), Little
Spiderhunter (Arachnothera longirostra), Olive-backed
Sunbird (Nectarinia jugularis), Eurasian Tree Sparrow
(Passer montanus), Baya Weaver (Ploceus philippinus),
Streak-eared Bulbul (Pycnonotus blanfordi), Red-
whiskered Bulbul (Pycnonotus jocosus), Sooty-headed
Bulbul (Pycnonotus aurigaster), Black-collared Starling
(Sturnus nigricollis) and Common Myna (Acridotheres
tristis). The other 13 species were migratory birds or
winter visitors, such as Chinese Pond Heron (Ardeola
bacchus), Asian Openbill (Anastomus oscitans), Common
Kingfisher (Alcedo atthis), Sand Martin (Riparia riparia),
White Wagtail (Motacilla alba), Red-throated Flycatcher
(Ficedula parva) and Japanese White-eye (Zosterops
japonicas) (Fig.1). When considering the abundance of
individual birds, across five categories of the abundance,
12 species were categorized as abundant, seven species
were common, 13 species were moderately common and
13 species were uncommon (Fig.2). When analyzing the
data drawn out from the recorded information, the
diversity index was 3.16 and the evenness index was 0.88.
Fig.1 Orders and status of birds found in the rice fields
of Chor-Lae community during the farming season.
Fig.2 Relative abundance of birds found in the rice fields
of Chor-Lae community during the farming season.
4. DISCUSSION
The most common bird species recorded are in order
Passeriformes. They live in this area all year long and do
not move or migrate to other areas. Thailand is in the
tropical zone where warm weather is stable throughout the
year. More than half of the birds found in Thailand are
endemic. Each species adapted themselves to suit different
habitats and adaptable birds are found in almost every
season and habitat. However, the results shown that
several species are abundant than others. They are
Common Myna, White-vented Myna, Spotted Dove, Rock
Pigeon and Eurasian Tree Sparrow. These birds are able to
adapt to the changing environment, communities’
livelihoods and the development of the country. By living
in the suburbs where food and water sources are plentiful,
the species can spread more widely[3]. These birds also eat
0
10
20
30
40
No.
of s
peci
es
Residents Winter visitors
0
5
10
15
No.
of s
peci
es
17th World Lake Conference, Lake Kasumigaura, Ibaraki, Japan, 2018
929

3
a variety of food and that makes more chance of survival
than other species that eat specific kinds of food. Also,
close to the rice fields, there are vegetable gardens,
orchards and several ponds where food, fruits, seeds,
grains, insects and small mollusks are abundant for them
to eat. However, around the beginning of December, rice
was harvested. There were more kinds of grains, insects
and reptiles under the ground which brought more birds
coming into the area, especially migratory birds such as
White Wagtail, Common Kingfisher, Red-rumped
Swallow, Sand Martin, Barn Swallow, Intermediate Egret
and Little Egret.
Birds of interest in the area are Asian Pied Starling and
Asian Openbill. Asian Pied Starling can be found in all
parts of Thailand except the south and northeast. In the
past, this species were rarely found in the north. However,
this bird has successfully spread due to the breeding
programme. Besides, this may be due to the abundance of
resources in the northern part of Thailand, the species can
find food more easily. The study area is also near the water
sources and rice fields which are suitable for them to find
food. We found the migration of Asian Openbill in the
early period of the study. They will travel to Thailand
around September or October and continue to live
throughout the winter (November-February). This bird
usually live by the rice fields, swamps, marshes, wetlands
or fresh water sources where they feed on fish, mollusks,
etc[4].
Seasons in the year usually affect the number and
density of birds. Overall, the Shannon diversity index of
this study was 3.16. First couple of months of the study
were the beginning of the rainy season and the area was
generally watered. As a result, the abundance of bird
habitats and food sources had increased. It caused more
birds to spread out of the area and to other wetlands. By
the end of the study, it was the beginning of the winter
season and rice was harvested. The diversity of birds had
increased because of the reproductive season of the
resident birds and there were groups of migrant birds
joined. Birds that eat grains and insects would be easily
found such as Green Bee-eater, Sand Martin, Barn
Swallow, Ashy Woodswallow, Red-throated Flycatcher
and Common Tailorbird. For the species evenness, it was
generally 0.88. Birds, that are living on top of tree canopy,
by the roof of the house or walking along the ground and
farmland, usually live together as a group. Most of them
are found throughout the season, such as Eurasian Tree
Sparrow, Scaly-breasted Munia, Black-collared Starling
and Spotted Dove, resulting in high consistency. In open
spaces and meadows, there were many small birds that
were found in both grouped species and isolated species,
such as Green Bee-eater, Common Tailorbird, Barn
Swallow and Ashy Woodswallow. This makes them a little
less consistency.
5. CONCLUSION
There are 45 species found in Chor-Lae community
consisting of both resident and migratory birds. Most of
them are in order Passeriformes. Each species has a
different abundance caused by types of food, water
sources, habitats, seasons and migration.
REFERENCES
[1] Supahan, N., Kunpradid, T., Joradol, A. and
Leelahakriengkrai, P. Diversity of some organisms in Chiang
Mai Rajabhat University, Mae Rim Campus, Chiang Mai
Province. Science and Technology RMUTT Journal, Vol. 7,
pp. 1-15, 2017.
[2] Pettingill, O.S. A laboratory and field manual of ornithology.
United States: Burguss. 1950.
[3] Pagani-Núñez, E., He, C., Wu, Y.W., Peabotuwage, I. and
Goodale, E. Foraging in the tropics: relationships among
species’ abundances, niche asymmetries and body condition
in an urban avian assemblage. Urban Ecosystems, Vol. 20, pp.
1301-1310, 2017.
[4] Zainul-Abidin, M.K., Mohd-Taib, F.S. and Md-Nor, S.
Distribution and habitat selection of the Asian Openbill
(Anastomus oscitans) in Peninsular Malaysia. Malayan Nature
Journal, Vol. 69, pp. 169-181, 2017.
17th World Lake Conference, Lake Kasumigaura, Ibaraki, Japan, 2018
930

青森県姉沼におけるイシガイ科二枚貝の脱落後の生態に関する研究
染谷 聖 1,柿野 亘 1,筏井宏実 1,岩坪遼平 1,島田 海 1,眞家永光 1,丹治 肇 1
1北里大学
キーワード:生物多様性評価,生態系機能,絶滅危惧種
抄録
イシガイ科二枚貝は,世界各地に広く分布し,国内では 15 種 1 亜種が確認されているが,近年,湖沼流域環境の劣
化の影響で 15 種中 11 種が絶滅を危惧される状態にある。そこでイシガイ科の保全を考慮し,本研究では,脱落後の
稚貝の生息適地に必要な餌料の解明を目指すことを目的とした。宿主魚類から稚貝を採取し,この稚貝を餌料が異な
る底質で飼育することによって,その成長可否について調べた。解析の結果,底質にバイオフィルムが存在すると成長
量が大きくなる傾向がうかがえた。また,乾燥させたバイオフィルムも餌料として機能することが示唆された。足と消化管
内に繊毛を確認し,それらを用いて足弁摂餌およびそれらで水流を起こして周囲の餌料を摂食している様子が確認さ
れた。これらのことから,イシガイ科稚貝は,バイオフィルムを餌料とし,足弁摂餌により摂食していると考えられる。
1.はじめに
軟体動物門に属するイシガイ科二枚貝(イシガイ科:
Unionidae)は,世界各地に広く分布し,日本国内では
15種 1亜種が確認されている[1]。近年,湖沼流域では,
開発や人工の増加等の社会・経済的な構造の変化によ
って汚濁負荷が増加し,それと密接に関連した湖沼の
水域環境が損なわれてきており[2],これらの水域環境の
劣化によって 15 種中 11 種が絶滅を危惧される状態に
ある[3]。本科二枚貝は,特定の宿主に対して寄生や産
卵場の提供を通じた共生関係[4]や大量の有機物を短期
的な物質循環のサイクルから取り除いて底土に集積する
など生態的機能を有しているとともに,浮遊物・金属イオ
ンを取り除く[5]ことで水質浄化を行っているため,その保
全は必須である。本科二枚貝の保全を考慮した場合,
脱落後の稚貝の好適な環境を確保することで稚貝の生
残率を向上させることが重要な課題だが,稚貝の生態に
関する知見は,成貝の生態に関する知見に比べて極め
て少ない。中でも脱落後の稚貝の生息適地に必要な餌
料については,具体的にどの成分を吸収し,栄養分とし
ているかは未だに不明な点が多い[4]。そこで本研究で
は,脱落後の稚貝を蓄養し,成長量を把握することで,
底質に含まれる自然環境下の餌料の解明および形態観
察により摂餌方法の解明を目指した。
2.方法
対象地は,青森県東部に位置する姉沼とし,2017 年
6月 27日,11月 7日に宿主魚類の採捕を行った。宿主
魚類は定置網(周囲長 30 m,目合い 5 mm)を用いて採
捕した。採捕する宿主魚種は,水質変化に比較的に強
く,長期的な飼育が容易なハゼ科(ウキゴリ,ジュズカケ
ハゼ,ヌマチチブ)の魚種に限った。持ち帰った宿主魚
類は標準体長に合わせて 10~15 個体ずつ虫籠(190
mm×95 mm×90 mm間隙寸法 2 mm)に入れ,それをエ
アーポンプ(Suisaku 水心 SSPP-2S)で曝気を行っている
円筒形容器(直径 20 cm,高さ 205 mm)に収容した。円
筒形容器は水温(20~23℃)を一定に保ったトロ箱(700
mm×410 mm×200 mm)に収容した。採捕日の翌日から
毎日,円筒形容器内の稚貝を含む沈殿物をプランクトン
ネット(目合い 112μm)で濾し取った。濾し取った沈殿物
は,プラスチック製のシャーレー(直径 60 mm)に移した
後,実体顕微鏡(SHIMIZU)で沈殿物から稚貝を探し出
し,パスツールピペット(先端直径 1 mm,長さ 143 mm)を
用いて採取した。採取した稚貝は,採取時期により異な
る方法で飼育を行った。稚貝の餌料には,姉沼の沿岸
域の底質に堆積し,シルトが含まれるバイオフィルム
(biofilm)を利用した。2017 年 6 月 28 日,6 月 30 日,7
月 6 日に宿主魚類から採取した稚貝(イケチョウガイ:
Hyriopsis scblegeli)は,採取日ごとに地下水のみの飼育
ケース(以下,底質無し),姉沼で採取した砂礫・少量の
採取した状態の生のバイオフィルムから成る土を入れた
飼育ケース(以下,姉沼の土),採取した状態の生のバ
イオフィルムを入れた飼育ケース(以下,生バイオフィル
ム)の 3 種類に等分し,計 9 個の飼育ケースで飼育を行
17th World Lake Conference, Lake Kasumigaura, Ibaraki, Japan, 2018
931
P1-15
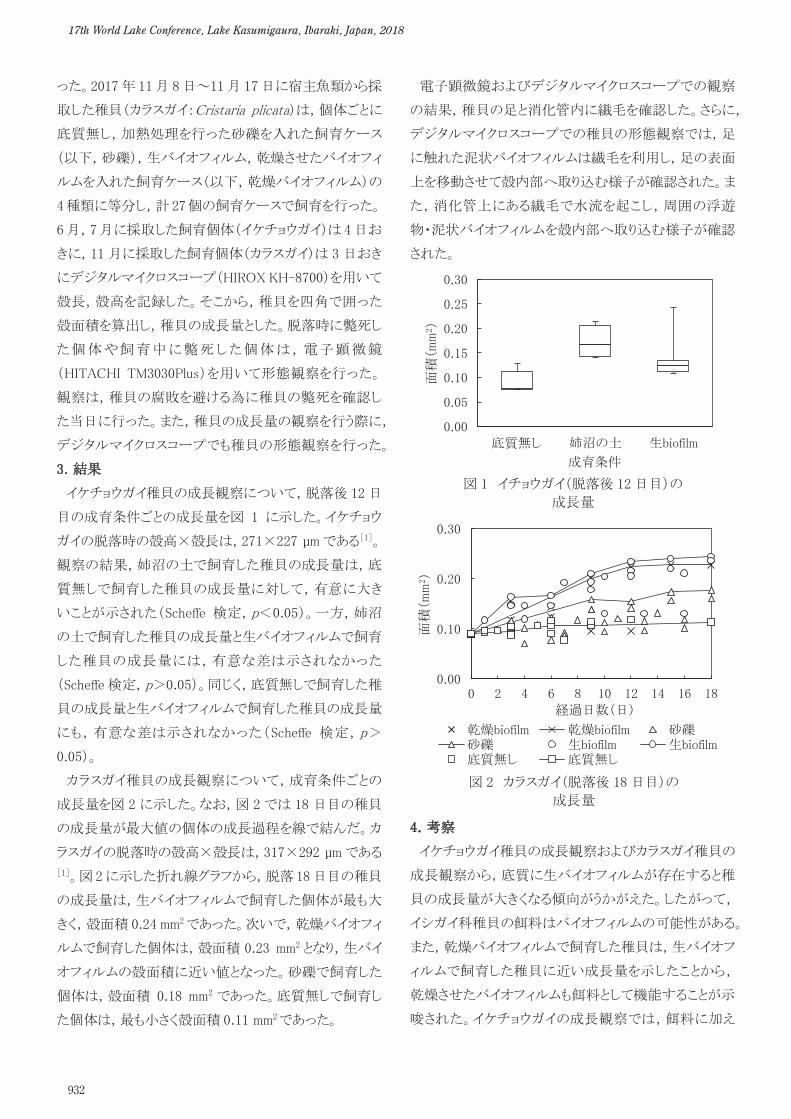
った。2017年 11月 8日~11月 17日に宿主魚類から採
取した稚貝(カラスガイ:Cristaria plicata)は,個体ごとに
底質無し,加熱処理を行った砂礫を入れた飼育ケース
(以下,砂礫),生バイオフィルム,乾燥させたバイオフィ
ルムを入れた飼育ケース(以下,乾燥バイオフィルム)の
4種類に等分し,計 27個の飼育ケースで飼育を行った。
6月,7月に採取した飼育個体(イケチョウガイ)は 4日お
きに,11月に採取した飼育個体(カラスガイ)は 3日おき
にデジタルマイクロスコープ(HIROX KH-8700)を用いて
殻長,殻高を記録した。そこから,稚貝を四角で囲った
殻面積を算出し,稚貝の成長量とした。脱落時に斃死し
た個体や飼育中に斃死した個体は,電子顕微鏡
(HITACHI TM3030Plus)を用いて形態観察を行った。
観察は,稚貝の腐敗を避ける為に稚貝の斃死を確認し
た当日に行った。また,稚貝の成長量の観察を行う際に,
デジタルマイクロスコープでも稚貝の形態観察を行った。
3.結果
イケチョウガイ稚貝の成長観察について,脱落後 12日
目の成育条件ごとの成長量を図 1 に示した。イケチョウ
ガイの脱落時の殻高×殻長は,271×227 µmである[1]。
観察の結果,姉沼の土で飼育した稚貝の成長量は,底
質無しで飼育した稚貝の成長量に対して,有意に大き
いことが示された(Scheffe 検定,p<0.05)。一方,姉沼
の土で飼育した稚貝の成長量と生バイオフィルムで飼育
した稚貝の成長量には,有意な差は示されなかった
(Scheffe検定,p>0.05)。同じく,底質無しで飼育した稚
貝の成長量と生バイオフィルムで飼育した稚貝の成長量
にも,有意な差は示されなかった(Scheffe 検定,p>
0.05)。
カラスガイ稚貝の成長観察について,成育条件ごとの
成長量を図 2 に示した。なお,図 2では 18 日目の稚貝
の成長量が最大値の個体の成長過程を線で結んだ。カ
ラスガイの脱落時の殻高×殻長は,317×292 µmである
[1]。図 2に示した折れ線グラフから,脱落 18日目の稚貝
の成長量は,生バイオフィルムで飼育した個体が最も大
きく,殻面積 0.24 mm2であった。次いで,乾燥バイオフィ
ルムで飼育した個体は,殻面積 0.23 mm2 となり,生バイ
オフィルムの殻面積に近い値となった。砂礫で飼育した
個体は,殻面積 0.18 mm2 であった。底質無しで飼育し
た個体は,最も小さく殻面積 0.11 mm2であった。
電子顕微鏡およびデジタルマイクロスコープでの観察
の結果,稚貝の足と消化管内に繊毛を確認した。さらに,
デジタルマイクロスコープでの稚貝の形態観察では,足
に触れた泥状バイオフィルムは繊毛を利用し,足の表面
上を移動させて殻内部へ取り込む様子が確認された。ま
た,消化管上にある繊毛で水流を起こし,周囲の浮遊
物・泥状バイオフィルムを殻内部へ取り込む様子が確認
された。
4.考察
イケチョウガイ稚貝の成長観察およびカラスガイ稚貝の
成長観察から,底質に生バイオフィルムが存在すると稚
貝の成長量が大きくなる傾向がうかがえた。したがって,
イシガイ科稚貝の餌料はバイオフィルムの可能性がある。
また,乾燥バイオフィルムで飼育した稚貝は,生バイオフ
ィルムで飼育した稚貝に近い成長量を示したことから,
乾燥させたバイオフィルムも餌料として機能することが示
唆された。イケチョウガイの成長観察では,餌料に加え
0.00
0.10
0.20
0.30
0 2 4 6 8 10 12 14 16 18
面積(m
m2)
経過日数(日)
乾燥biofilm 乾燥biofilm 砂礫砂礫 生biofilm 生biofilm底質無し 底質無し
0.00
0.05
0.10
0.15
0.20
0.25
0.30
水 姉沼の土 生biofilm面積(m
m2)
成育条件
図 1 イチョウガイ(脱落後 12日目)の
成長量
図 2 カラスガイ(脱落後 18日目)の 成長量
底質無し
17th World Lake Conference, Lake Kasumigaura, Ibaraki, Japan, 2018
932
て砂礫があると成長量が大きくなる傾向が示された。ま
た,カラスガイにおいても砂礫で飼育した稚貝は,餌料
が存在しない環境であるものの,脱落直後の 2倍近い成
長量を示した。底質(細砂)がある条件下で Epiobasma
copsaeformis と Villosa irisの稚貝を飼育した場合,底質
が存在しない場合に比べて成長率と生残率が高いとさ
れ,これは底質(細砂)がバクテリアなどの餌料の供給源
となっている可能性があることが報告されている[6]。この
ことから,砂礫が稚貝の餌料となる生物・物質の発生・付
着する基質となり,それを稚貝が摂食したことで成長した
と考えられる。イシガイ科稚貝の摂餌方法として,Yeager
et al.[7]によると Villosa irisは足で餌料を集めていること
が示唆されており,Akiyama[8]では,脱落直後のタガイ
は粘性の強い粘液を吐き出し,周囲のデトリタスを軟体
部の周辺に吸着させる行動を行うとしている。また,鰓の
発達が十分でないアサリは足弁摂餌[9]を行うことが報告
されている。電子顕微鏡の形態観察およびデジタルマイ
クロスコープでの観察の結果を踏まえると,イシガイ科成
貝に対し消化管が未発達なイシガイ科稚貝は,足と消
化管内にある繊毛を利用し,足弁摂餌により餌料を摂食
していると推察される。
5.結論
脱落後のイシガイ科稚貝の餌料は,バイオフィルムの
可能性が示唆され,底質に付着・堆積しているバイオフ
ィルムを少なくとも足弁摂餌によって摂食していると考え
られる。
引用文献
[1] Takaki, K.: Monograph of Unionoida in Japan (Mollusca:
Bivalia), Special Publication of Malacological Society of Japan
3, 1‐69, 2008.
[2] 環境省: 湖沼環境保全制度の在り方について, 2005.
www.env.go.jp/council/toshin/t090-h1607/mat01.pdf
[3] 環境省: 貝類のレッドリスト, 2007.
www.env.go.jp/press/files/jp/9946.pdf
[4] 根岸淳二朗, 萱場祐一, 塚原幸治, 三輪芳明: イシガイ目
二枚貝の生態学的研究 現状と今後の課題, 日本生態学会
58, 37‐50, 2008.
[5] 近藤高貴: 用水路と二枚貝の生活, (森誠一編著)淡水生物
の保全生態学-復元生態学に向けて-, 信山社サイテック,
東京, 56‐62, 1999.
[6] Jones, J.W., Mair, R.A., Neves, R.J.: Factors affecting
survival and growth of juvenile freshwater mussels cultured in
recirculating aquaculture systems, North American Journal of
Aquaculture 67, 210‐220, 2005.
[7] Yeager, M.M., Cherry, D.S., Neves, R.J.: Feeding and
burrowing behaviors of juvenile rainbow mussels, Villosa iris
(Bivalvia:Unionidae), Journal of the North American
Benthological Society 13, 217‐222, 1994.
[8] Akiyama, Y.B.: Host Fish Species for the Glochidia of
Anodonta japonica inhabiting drainage for rice cultivation in
Hikone City, Venus 69, 206‐209, 2011.
[9] 鳥羽光晴: 特集知りたい貝類養殖の新潮流アサリ, 養殖
446, 70‐73, 1999.
った。2017年 11月 8日~11月 17日に宿主魚類から採
取した稚貝(カラスガイ:Cristaria plicata)は,個体ごとに
底質無し,加熱処理を行った砂礫を入れた飼育ケース
(以下,砂礫),生バイオフィルム,乾燥させたバイオフィ
ルムを入れた飼育ケース(以下,乾燥バイオフィルム)の
4種類に等分し,計 27個の飼育ケースで飼育を行った。
6月,7月に採取した飼育個体(イケチョウガイ)は 4日お
きに,11月に採取した飼育個体(カラスガイ)は 3日おき
にデジタルマイクロスコープ(HIROX KH-8700)を用いて
殻長,殻高を記録した。そこから,稚貝を四角で囲った
殻面積を算出し,稚貝の成長量とした。脱落時に斃死し
た個体や飼育中に斃死した個体は,電子顕微鏡
(HITACHI TM3030Plus)を用いて形態観察を行った。
観察は,稚貝の腐敗を避ける為に稚貝の斃死を確認し
た当日に行った。また,稚貝の成長量の観察を行う際に,
デジタルマイクロスコープでも稚貝の形態観察を行った。
3.結果
イケチョウガイ稚貝の成長観察について,脱落後 12日
目の成育条件ごとの成長量を図 1 に示した。イケチョウ
ガイの脱落時の殻高×殻長は,271×227 µmである[1]。
観察の結果,姉沼の土で飼育した稚貝の成長量は,底
質無しで飼育した稚貝の成長量に対して,有意に大き
いことが示された(Scheffe 検定,p<0.05)。一方,姉沼
の土で飼育した稚貝の成長量と生バイオフィルムで飼育
した稚貝の成長量には,有意な差は示されなかった
(Scheffe検定,p>0.05)。同じく,底質無しで飼育した稚
貝の成長量と生バイオフィルムで飼育した稚貝の成長量
にも,有意な差は示されなかった(Scheffe 検定,p>
0.05)。
カラスガイ稚貝の成長観察について,成育条件ごとの
成長量を図 2 に示した。なお,図 2では 18 日目の稚貝
の成長量が最大値の個体の成長過程を線で結んだ。カ
ラスガイの脱落時の殻高×殻長は,317×292 µmである
[1]。図 2に示した折れ線グラフから,脱落 18日目の稚貝
の成長量は,生バイオフィルムで飼育した個体が最も大
きく,殻面積 0.24 mm2であった。次いで,乾燥バイオフィ
ルムで飼育した個体は,殻面積 0.23 mm2 となり,生バイ
オフィルムの殻面積に近い値となった。砂礫で飼育した
個体は,殻面積 0.18 mm2 であった。底質無しで飼育し
た個体は,最も小さく殻面積 0.11 mm2であった。
電子顕微鏡およびデジタルマイクロスコープでの観察
の結果,稚貝の足と消化管内に繊毛を確認した。さらに,
デジタルマイクロスコープでの稚貝の形態観察では,足
に触れた泥状バイオフィルムは繊毛を利用し,足の表面
上を移動させて殻内部へ取り込む様子が確認された。ま
た,消化管上にある繊毛で水流を起こし,周囲の浮遊
物・泥状バイオフィルムを殻内部へ取り込む様子が確認
された。
4.考察
イケチョウガイ稚貝の成長観察およびカラスガイ稚貝の
成長観察から,底質に生バイオフィルムが存在すると稚
貝の成長量が大きくなる傾向がうかがえた。したがって,
イシガイ科稚貝の餌料はバイオフィルムの可能性がある。
また,乾燥バイオフィルムで飼育した稚貝は,生バイオフ
ィルムで飼育した稚貝に近い成長量を示したことから,
乾燥させたバイオフィルムも餌料として機能することが示
唆された。イケチョウガイの成長観察では,餌料に加え
0.00
0.10
0.20
0.30
0 2 4 6 8 10 12 14 16 18
面積(m
m2)
経過日数(日)
乾燥biofilm 乾燥biofilm 砂礫砂礫 生biofilm 生biofilm底質無し 底質無し
0.00
0.05
0.10
0.15
0.20
0.25
0.30
水 姉沼の土 生biofilm
面積(m
m2)
成育条件
図 1 イチョウガイ(脱落後 12日目)の
成長量
図 2 カラスガイ(脱落後 18日目)の 成長量
底質無し
17th World Lake Conference, Lake Kasumigaura, Ibaraki, Japan, 2018
933

Biodiversity evaluation using Nature Index tool in
Chilika Lake, Odisha, India – A case study C. Thomson Jacob
Centre for Biodiversity Policy and Law, National Biodiversity Authority, India
Keywords: Biodiversity evaluation and ecosystem services
ABSTRACT
Biodiversity is crucial for human well-being; it provides food, nutrition and livelihood security. In 2010, parties to
the Convention on Biological Diversity (CBD) adopted the Strategic Plan for Biodiversity 2011-2020, a ten year
framework for action by all the countries to safeguard biodiversity and halt biodiversity loss. A pilot study was
carried out in Chilika Lake for evaluating the status of biodiversity using the Nature Index (NI) tool developed
by the Norwegian Institute for Nature Research (NINA). Chilika is one of the largest lagoons in Asia and this is
the first Ramsar site of India and boasts of rich floral and faunal diversity. For evaluating the biodiversity status
in Chilika Lake, 25 indicator species were selected (15 species of fish & 10 species of birds) and the time series
data of these indicator species were fed into the NI database. The NI values were calculated using the R-
package and the status of biodiversity was visualized though a colour coded map (e.g. red-very poor; orange,
yellow and green-gradual improvement; and blue-good). NI is a well-designed policy tool that synthesizes
biodiversity data and helps in monitoring the status of biodiversity. This monitoring tool can be used for
identifying the threat status of species/ecosystem and guides the policy makers to take important policy
decisions towards conserving the biodiversity. NI tool can be used for assessing the biodiversity status of the
an ecosystem, protected areas, lakes, rivers, hotspots etc.
1. INTRODUCTION
India is a mega diverse country harbouring 7-8% of all
recorded species of the world, which includes 48,000
species of plants [1] and more than 97, 708 species of
animals [2] India has 10 bio-geographic zones and is home
for 8.6% of mammalian species, 13.7% avian species,
7.9% reptiles, 4.7% amphibians, 11.7% fishes and 11.8%
plants in the world. India has more than 15,042 species of
marine diversity [3]. Biodiversity plays a crucial role in the
functioning of the ecosystems on which human beings
depend for food, water, health, recreation and protection
from the natural disasters. The loss of biodiversity affects
cultural and spiritual values that are integral to human
well-being. The global mission of the Strategic Plan for
biodiversity 2011-2020[4] is advocating countries to halt the
loss of biodiversity and ensure that ecosystems are resilient
and continue to provide essential services, thereby
securing the planet’s variety of life.
The objective of the present study is to test the Norwegian
Nature Index (NI) tool in Chilika Lake for evaluating the
biodiversity status in collaboration with the Norwegian
Institute for Nature Research and Chilika Development
Authority. The NI is a policy tool provides an overview of
the state and trend of biodiversity and it can be used for
taking important policy decisions for conserving and
managing the biodiversity in an ecosystem[5]. The status of
an indicator is calculated through a scaled value (ranging
from 0 to 1) where the value zero means that the species is
extinct and the value 1 means that the status of the
indicator is very good. The NI is then calculated as the
average over many such indicators. This tool can be
applied in both data-rich and data-deficient areas and helps
Usefulness of NI
Strengthen and support Science policy Interface in India
Support national decision making
Help in policy formulation in various sectors
For national reporting to various International conventions
Display and disseminate the impact of decisions and policies on trends in
biodiversity status in different natural ecosystems
Provide information about human impact on biodiversity conservation.
Snapshot of the status of protected areas and wildlife biodiversity.
17th World Lake Conference, Lake Kasumigaura, Ibaraki, Japan, 2018
934
P1-16

Biodiversity evaluation using Nature Index tool in
Chilika Lake, Odisha, India – A case study C. Thomson Jacob
Centre for Biodiversity Policy and Law, National Biodiversity Authority, India
Keywords: Biodiversity evaluation and ecosystem services
ABSTRACT
Biodiversity is crucial for human well-being; it provides food, nutrition and livelihood security. In 2010, parties to
the Convention on Biological Diversity (CBD) adopted the Strategic Plan for Biodiversity 2011-2020, a ten year
framework for action by all the countries to safeguard biodiversity and halt biodiversity loss. A pilot study was
carried out in Chilika Lake for evaluating the status of biodiversity using the Nature Index (NI) tool developed
by the Norwegian Institute for Nature Research (NINA). Chilika is one of the largest lagoons in Asia and this is
the first Ramsar site of India and boasts of rich floral and faunal diversity. For evaluating the biodiversity status
in Chilika Lake, 25 indicator species were selected (15 species of fish & 10 species of birds) and the time series
data of these indicator species were fed into the NI database. The NI values were calculated using the R-
package and the status of biodiversity was visualized though a colour coded map (e.g. red-very poor; orange,
yellow and green-gradual improvement; and blue-good). NI is a well-designed policy tool that synthesizes
biodiversity data and helps in monitoring the status of biodiversity. This monitoring tool can be used for
identifying the threat status of species/ecosystem and guides the policy makers to take important policy
decisions towards conserving the biodiversity. NI tool can be used for assessing the biodiversity status of the
an ecosystem, protected areas, lakes, rivers, hotspots etc.
1. INTRODUCTION
India is a mega diverse country harbouring 7-8% of all
recorded species of the world, which includes 48,000
species of plants [1] and more than 97, 708 species of
animals [2] India has 10 bio-geographic zones and is home
for 8.6% of mammalian species, 13.7% avian species,
7.9% reptiles, 4.7% amphibians, 11.7% fishes and 11.8%
plants in the world. India has more than 15,042 species of
marine diversity [3]. Biodiversity plays a crucial role in the
functioning of the ecosystems on which human beings
depend for food, water, health, recreation and protection
from the natural disasters. The loss of biodiversity affects
cultural and spiritual values that are integral to human
well-being. The global mission of the Strategic Plan for
biodiversity 2011-2020[4] is advocating countries to halt the
loss of biodiversity and ensure that ecosystems are resilient
and continue to provide essential services, thereby
securing the planet’s variety of life.
The objective of the present study is to test the Norwegian
Nature Index (NI) tool in Chilika Lake for evaluating the
biodiversity status in collaboration with the Norwegian
Institute for Nature Research and Chilika Development
Authority. The NI is a policy tool provides an overview of
the state and trend of biodiversity and it can be used for
taking important policy decisions for conserving and
managing the biodiversity in an ecosystem[5]. The status of
an indicator is calculated through a scaled value (ranging
from 0 to 1) where the value zero means that the species is
extinct and the value 1 means that the status of the
indicator is very good. The NI is then calculated as the
average over many such indicators. This tool can be
applied in both data-rich and data-deficient areas and helps
Usefulness of NI
Strengthen and support Science policy Interface in India
Support national decision making
Help in policy formulation in various sectors
For national reporting to various International conventions
Display and disseminate the impact of decisions and policies on trends in
biodiversity status in different natural ecosystems
Provide information about human impact on biodiversity conservation.
Snapshot of the status of protected areas and wildlife biodiversity.
the policy makers and administrators to monitor the
biodiversity status in an ecosystem.
2. METHOD
The NINA has developed a web-based information system
for recording, storing and presenting NI data. The system
consists of SQL relational database connected to a web
server and the database has various modules such as (i)
indicator type; (ii) type of organisms
(mammals/reptiles/birds); (iii) red list status (critically
endangered/vulnerable/ near threatened/least concern);
(iv) reference value; (v) pressure factors (e.g.
eutrophication, pollution, climate change, habitat
destruction, human pressure and hydrological changes);
(vi) ecosystem affinity [5]. The time series data collected
from various secondary sources were fed into these
modules. The Reference value for the indicators species
were determined with the help of experts (expert
judgement/opinion) and the catch data were collected
during 2003 was used as a reference year. The NI values
were analysed by NINA using R-scripts and the status of
biodiversity is visualised using colour coded map. For
example, red shows a very poor state and the blue a very
good state. Orange, yellow and green signify gradual
improvements towards blue [6](Fig.1).
Figure 1 - Scaled value expressed on a 0-1 scale
For monitoring the status of biodiversity in Chilika, 25
indicator species were selected which includes 15 fish
species (Flat head mullet, Large scale mullet, Sea bass,
Bengal corvine, Four finger threadfin, Pearl spot, Hilsa
shad, Grey eel-catfish, Spot tail needle fish, Bloch's
gizzard shad, Small Bengal silver-biddy, Long whiskers
catfish, Gold lined sea bream, Soldier catfish and Striped
snakehead and 10 bird species (Northern pintail, Eurasian
wigeon, Gadwall, Black-tailed godwit, Brown-headed gull,
Asian open-bill stork, Purple swamp hen, Common coot
and Lesser whistling-duck). The polygon map of Chilika
was divided into 5 regions viz (i) Southern Sector (SC); (ii)
Central Sector (CS); (iii) Northern Sector (NS); (iv) Outer
Channel Sector (OSC) and (v) Island based on salinity
variation.
3. RESULT
In the Chilika lake the maximum NI value of (>0.8) of bird population was recorded in OSC, CS and Nalabana Island and the moderate values of >0.7 (SS) and >0.6 (NS) was recorded in other sectors. In the case of fish diversity, the OSC has recorded the maximum value of >0.8 and in other sectors the NI values have declined {SS (from >0.9 to <0.7); NS (from >0.7 to <0.6); CS (from >0.7 to <0.6)} between 2005 to 2015. The status of the biodiversity can be visualised through the colour coded maps depicted in Fig.2.
Figure 2 -Thematic value for the five areas of Chilika and the map showing the colour rang
4. DISCUSSION
The biodiversity wealth of Chilika Lake has tremendously
increased after the ecological restoration of the Lake (by
opening a new mouth to the Bay of Bengal) during the year
17th World Lake Conference, Lake Kasumigaura, Ibaraki, Japan, 2018
935
2000. This has resulted in rejuvenation of lost species (6
species of fish, 4 species of prawn, 7 species of crab and 2
species of Indian spiny lobster have reappeared) and the
Irrawaddy dolphin population was increased from 89 to
160 individual.
The present study has reported that in Chilika the bird
population was showing an increasing trend in OSC, CS
and Nalabana Island regions. Birds such as the Brown
headed gull, Asian open bill stock, Purple swamp hen,
Common coot, Lesser whistling duck and Little cormorant
is showing a good population trend in all the sectors
studied.
In the cases of fishes, the Pearl spot and Grey eel showed
a maximum aggregation in all the sectors and it was
noticed that, the Spot tail needle fish was maximum in the
OSC and the Hilsa population was high the NS. The
figure indicates that there is a declined in the biodiversity
in the NS (fresh water zone) and this be due to various
anthropogenic pressure and over harvesting of fish
resources by the local fishers. In the other sectors the good
biodiversity trend was maintained due to the some
biodiversity friendly initiatives by the CDA which
includes: (a) protection of migratory waterfowl from
poaching; (b) eviction of the Illegal prawn gherries from
Chilika;(c) maintenance and dredging of the feeder
channel and creeks, which facilitates for migration of
fish juveniles; (d) catchment area treatment; (e) weed
control; (f) restoration of feeding and roasting habitat of
water fowl; (g) pollution control and (h) encourage
community participation.
5. CONCLUSION
The pilot study carried out in Chilika Lake helped us in
monitoring the status of birds and fishes (Sector wise in
Chilika Lake) from the year 2000 to 2015. The NI tool
provides an overall picture of the changes in biodiversity
over a period of time and provides details about the
causative factors for taking corrective measures. This
scientific tool can be used for evaluating the impact of
climate change; monitoring the implementation of
National Biodiversity Targets (NBTs) and Sustainable
Development Goals (SDGs) etc.
This NI tool can be extensively used for assessing the
biodiversity wealth of the Protected Areas (PAs) in the
forestry sector. Similarly, NI can be used for evaluating the
wealth of marine/inland and agriculture ecosystems. This
scientific tool provide visual clarity (maps and graphs) to
the policy makers for taking important policy decisions on
species and ecosystem conservation related issues.
Currently there is no other scientific tool is available to
store, synthesis the time series biodiversity data showing
the trends over time for assessing the biodiversity.
Hence, the Nature Index tool can be extensively used in
evaluating biodiversity in national parks, sanctuaries,
biodiversity hotspots, etc. The PA area managers can use
this tool to monitoring the status of wildlife biodiversity
inside the PAs. The NI methodology and database is very
well suited to assess the state of biodiversity. The data
generated under this study can also be used for the
preparation of national reports, and Climate Change action
plans and for undertaking studies for the Inter-
governmental science-policy platform on biodiversity and
ecosystem services, etc. As India pledged under several
International agreements, the NI study can be used for
monitoring the progress of the various global and national
biodiversity targets (e.g., Aichi, National Biodiversity
Action Plan and Sustainable Development Goals) towards
addressing the biodiversity loss.
REFERENCES [1] Botanical Survey of India, 2017 web resource.
(https://en.wikipedia.org/wiki/). [2] Zoological Survey of India, 2017 web
(resourcehttp://zsi.gov.in/App/index.aspx). [3] Hem K. Pande and Sujata Arora, India’s Fifth National Report
to the CBD, Published by the Ministry of Environment and Forests, Government of India, 2014.
[4] Convention on Biological Diversity Web Resources (www.cbd.int).
[5] Signe Nybø, Erik Framstad, Bård Pedersen, Olav Skarpaas, The Norwegian Nature Index - A Communication tool on Biodiversity. Norwegian Institute for Nature Research, Norway. Published during the 3rd Science for the Environment Conference Aarhus Denmark 1-2 October 2015. (see also http://www.naturindeks.no/).
[6] Nybo, s., Certain, G. & Skarpaas, O. 2011. The Norwegian Nature Index 2010. DN-report, 2011-1.
17th World Lake Conference, Lake Kasumigaura, Ibaraki, Japan, 2018
936

1
Terrestrial and Freshwater Mollusks on the University of Tsukuba Campus
Ikuyo Saeki1, Noriaki Namba1, and Wataru Mukaimine1 1University of Tsukuba
Keywords: biodiversity evaluation, introduced species, nature conservation, education
ABSTRACT
Terrestrial and freshwater mollusks comprise one of the most diverse groups of animals. The mollusks are generally known as good ecological indicators and, because they are slow-moving and easy to observe, they have great potential for use in education. To describe the species composition and diversity, we surveyed terrestrial and freshwater mollusks on the University of Tsukuba campus in Ibaraki Prefecture, Japan. Between May 2017 and April 2018, we recorded 22 terrestrial and five freshwater molluscan species in 15 surveys at 28 sites. Commonly observed species were Euhadra brandtii brandtii (local name, Hitachimaimai), Zonitoides arboreus (Kohakugai), and Acusta despecta sieboldiana (Usukawamaimai) in terrestrial ecosystems and Pseudosuccinea columella (Habutaemonoaragai) and Physa acuta (Sakamakigai) in freshwater ones. Introduced species were also observed: six were terrestrial and two were freshwater species, accounting for about 30% of the total recorded species. The molluscan species are threatened globally by anthropogenic disturbances. Our results will be used for science and environmental education, management of introduced species and identification of important areas for biodiversity conservation.
1. INTRODUCTION
Although terrestrial and freshwater mollusks (i.e., nonmarine mollusks) are one of the most diverse groups of animals, they are threatened by anthropogenic disturbances worldwide [1]. The main causes of their decline are habitat loss, predation by introduced species, and overuse by humans [2]. Yet terrestrial and freshwater mollusks are generally known as good ecological indicators. In addition, because they are slow-moving and easily observed, they are good study organisms for education.
Here we describe our field surveys of terrestrial and freshwater mollusks at the University of Tsukuba in central Japan. Our aims were to describe their species composition and diversity on the campus and use the data for student education and conservation planning. This project is still ongoing, and we report the preliminary results here.
2. METHODS Between May 2017 and April 2018, we conducted field surveys of terrestrial and freshwater mollusks on the University of Tsukuba campus in Tsukuba city, Ibaraki Prefecture, Japan. The campus is approximately 257 ha and contains various types of ecosystem, such as forests
and grasslands, as well as street trees, gardens, ponds, artificial drainages, and land/water ecotones. We explored 28 sites during 15 field surveys and recorded the molluscan species observed by at least one of the authors. 3. RESULTS Twenty-two species of terrestrial mollusk from nine families were recorded in total. Commonly observed species were Euhadra brandtii brandtii (local name, Hitachimaimai), Zonitoides arboreus (Kohakugai), and Acusta despecta sieboldiana (Usukawamaimai). We found relatively high species diversity in forest and grassland ecosystems, despite them being fragmented into small pieces by road and building construction. On the other hand, five species of freshwater mollusk were observed at three aquatic sites: Sinotaia quadrata historica (Himetanishi), Pseudosuccinea columella (Habutaemonoaragai), Physa acuta (Sakamakigai), Corbicula sp. (Mashijimi or Taiwanshijimi), and Laevapex nipponica (Kawakozaragai). Individuals of Corbicula sp. could not be distinguished between C. leana (native) and C. fluminea (introduced) because they are morphologically similar and we found only shells of dead individuals. With regard to introduced species, we recorded six terrestrial and two freshwater species, accounting for approximately 30% of the total recorded
17th World Lake Conference, Lake Kasumigaura, Ibaraki, Japan, 2018
937
P1-17

2
species. 4. DISCUSSION The University of Tsukuba campus was constructed approximately 45 years ago. Today many areas have been developed with roads and buildings, and more than 10,000 students attend the campus. The observed mollusks consist largely of native species, some of which (e.g., E. brandtii brandtii) are characteristic to the Kanto plain. We also recorded introduced species that are common in urbanized areas. These findings can be used for science and environmental education, management of introduced species, and identification of important areas for biodiversity conservation. 5. REFERENCES [1] Lydeard, C., Cowie, R. H., Ponder, W. F., Bogan, A.
E., Bouchet, P., Clark, S. A., Cummings, K. S., Frest, T. J., Gargominy, O., Herbert, D. G., Hershler, R., Perez, K. E., Roth, B., Seddon, M., Strong, E. E. & Thompson, F. G.: The global decline of nonmarine mollusks, BioScience, Vol. 415, pp. 321–330, 2004.
[2] Coote, T. & Loeve, E.: From 61 species to five: endemic tree snails of the Society Islands fall prey to an ill-judged biological control programme, Oryx, Vol. 37, pp. 91–96, 2003.
17th World Lake Conference, Lake Kasumigaura, Ibaraki, Japan, 2018
938
1
Isolation, screening, and identification of potential antibiotic-producing fungi
from surface sediments of Lake Lanao in Lanao del Sur, Philippines 1Chua, Catherine Grace M. and .2Amparado, Beverly B.
1 College of Medicine, Mindanao State University, Iligan City 2Biology Department, College of Natural Sciences and Mathematics, M.S.U., Marawi City
Keywords: biodiversity evaluation, lake ecosystem functions, biological resource use, sediment release
ABSTRACT
To keep abreast with the need to discover new antibiotics and help address problem on antibiotic-resistance,
this study was conducted to isolate, screen, and identify potential antibiotic-producing fungi from Lake Lanao along
Ditsaan Ramain, Taraka, and Marawi City, Lanao del Sur, Philippines. Isolation of fungi from sediment samples
followed Serial Dilution Pour Plate Method resulting to the isolation of 126 kinds of fungi based on colony, hyphae and
reproductive spores in slide cultures. Antibiotic screening was done using Cotton Swabbing Technique which showed 10
(7.94%) isolates with antibiosis activity based on the zone of inhibition (ZOI) around each fungal isolate against
Escherichia coli and Staphylococcus aureus. Acremonium sp., Pestalotia sp. 1, Sporotrichum sp., and Cladosporium sp.
inhibited both test bacteria with average ZOI of inhibition of 2-17.5 mm. Pestalotia sp. 2, Scopulariopsis sp., and
Aspergillus sp. 2 inhibited S. aureus only whereas Curvularia sp., Aspergillus sp. 1, and Penicillium sp. inhibited E. coli
only with 7-9.5 mm and 2.75-6.25 mm average zone of inhibition, respectively. The fungal isolates will be further tested
against other pathogens and their antibiotics produced will be later purified and utilized for drug development, thus,
could be of economic and medical importance.
1. INTRODUCTION
Antibiotic resistance has increasingly become a problem in recent years because the pace at which we are discovering novel antibiotics has slowed drastically, while antibiotic use is rising. Therefore, we will always need new antibiotics to keep up with resistant bacteria. And the most common source of antimicrobial compounds was isolated from soil but in the last two decades, however, the rate of discovery of novel compounds from this source has significantly declined, as demonstrated by the fact that extracts from soil-derived microorganisms have yielded high numbers of clinically unacceptable metabolites. The aquatic environment is now becoming increasingly
recognized as a rich and untapped reservoir of useful novel natural products. Fungal habitats in lake ecosystems are numerous, diverse, and often hidden and due to the specific habitat of freshwater fungi, they might have biosynthetic capabilities different from those of terrestrial fungi. Hence, there is a high possibility of obtaining new antibiotic metabolites of medical importance from freshwater fungi. Thus, this study was conducted to isolate, characterize, screen for antibiosis activity, and identify up to the genus level the untapped pool of microbial sources from Lake Lanao, the second largest lake in the Philippines.
Fungi that displayed antibiosis can be potential sources of new antibiotics that can be
17th World Lake Conference, Lake Kasumigaura, Ibaraki, Japan, 2018
939
P1-18
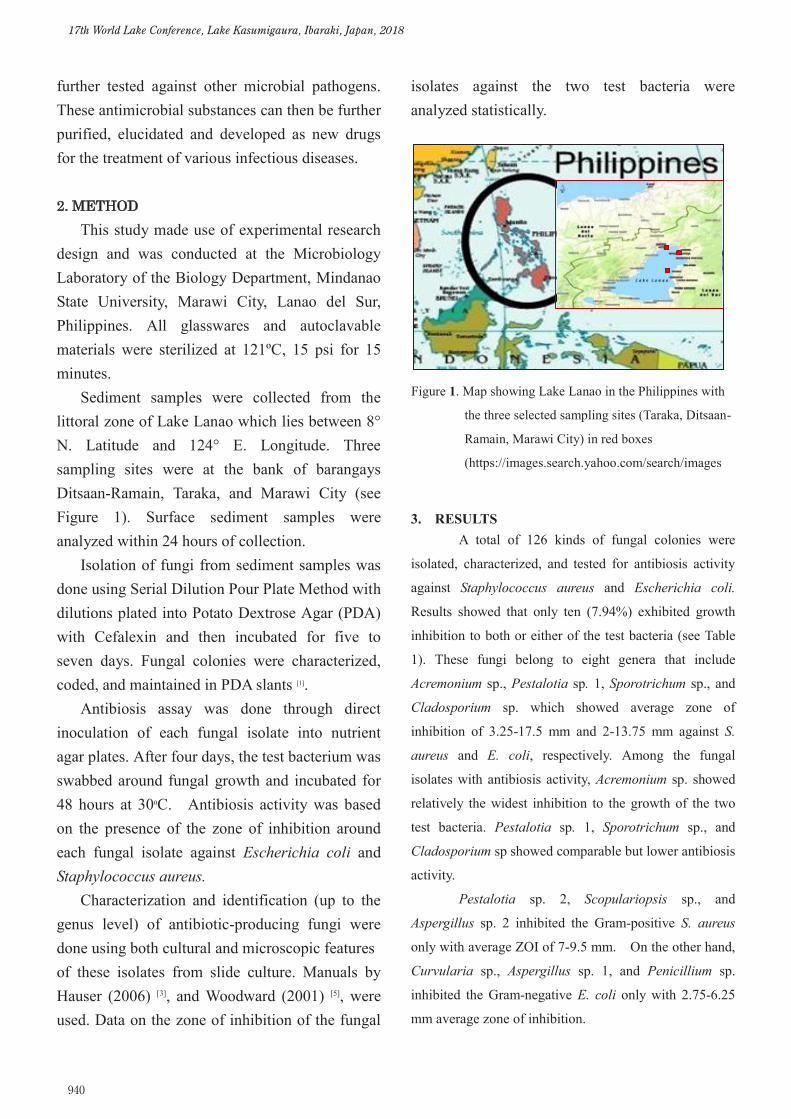
2
further tested against other microbial pathogens. These antimicrobial substances can then be further purified, elucidated and developed as new drugs for the treatment of various infectious diseases.
2. METHOD This study made use of experimental research
design and was conducted at the Microbiology Laboratory of the Biology Department, Mindanao State University, Marawi City, Lanao del Sur, Philippines. All glasswares and autoclavable materials were sterilized at 121ºC, 15 psi for 15 minutes.
Sediment samples were collected from the littoral zone of Lake Lanao which lies between 8° N. Latitude and 124° E. Longitude. Three sampling sites were at the bank of barangays Ditsaan-Ramain, Taraka, and Marawi City (see Figure 1). Surface sediment samples were analyzed within 24 hours of collection.
Isolation of fungi from sediment samples was done using Serial Dilution Pour Plate Method with dilutions plated into Potato Dextrose Agar (PDA) with Cefalexin and then incubated for five to seven days. Fungal colonies were characterized, coded, and maintained in PDA slants [1].
Antibiosis assay was done through direct inoculation of each fungal isolate into nutrient agar plates. After four days, the test bacterium was swabbed around fungal growth and incubated for 48 hours at 300C. Antibiosis activity was based on the presence of the zone of inhibition around each fungal isolate against Escherichia coli and Staphylococcus aureus.
Characterization and identification (up to the genus level) of antibiotic-producing fungi were done using both cultural and microscopic features of these isolates from slide culture. Manuals by Hauser (2006) [3], and Woodward (2001) [5], were used. Data on the zone of inhibition of the fungal
isolates against the two test bacteria were analyzed statistically.
3. RESULTS A total of 126 kinds of fungal colonies were
isolated, characterized, and tested for antibiosis activity
against Staphylococcus aureus and Escherichia coli.
Results showed that only ten (7.94%) exhibited growth
inhibition to both or either of the test bacteria (see Table
1). These fungi belong to eight genera that include
Acremonium sp., Pestalotia sp. 1, Sporotrichum sp., and
Cladosporium sp. which showed average zone of
inhibition of 3.25-17.5 mm and 2-13.75 mm against S.
aureus and E. coli, respectively. Among the fungal
isolates with antibiosis activity, Acremonium sp. showed
relatively the widest inhibition to the growth of the two
test bacteria. Pestalotia sp. 1, Sporotrichum sp., and
Cladosporium sp showed comparable but lower antibiosis
activity.
Pestalotia sp. 2, Scopulariopsis sp., and
Aspergillus sp. 2 inhibited the Gram-positive S. aureus
only with average ZOI of 7-9.5 mm. On the other hand,
Curvularia sp., Aspergillus sp. 1, and Penicillium sp.
inhibited the Gram-negative E. coli only with 2.75-6.25
mm average zone of inhibition.
Figure 1. Map showing Lake Lanao in the Philippines with
the three selected sampling sites (Taraka, Ditsaan-
Ramain, Marawi City) in red boxes
(https://images.search.yahoo.com/search/images
17th World Lake Conference, Lake Kasumigaura, Ibaraki, Japan, 2018
940

3
The 10 fungal isolates which showed antibiosis
are maintained as pure cultures in PDA slants. Slide
culture and microscopic examination showed their colony,
hyphae, and spore features (Figure 2).
4. DISCUSSION The 10 fungal isolates inhibited growth of S. aureus and/or E. coli through a mechanism called antibiosis.
Antibiotics act by either inhibiting synthesis of peptidoglycan in the cell wall and/or proteins and phospholipids in the cell membrane resulting to cell lysis; or may also inhibit enzyme activity, thus, causing cessation in metabolism resulting to cell death [4].
Four genera (Acremonium, Pestalotia, Cladosporium, Sporotrichum) that inhibited both S. aureus and E. coli are potential sources of broad-spectrum antibiotics effective against both Gram-positive and Gram-negative bacteria being comparable with streptomycin (ZOI:15 mm) and cephalosporin (ZOI:18 mm)[2]. Pestalotia sp. 2, Scopulariopsis sp., and Aspergillus sp. 2 that inhibited S. aureus as well as Curvularia sp., Aspergillus sp. 1, and Penicillium sp. that inhibited E. coli could be possible sources of narrow-spectrum antibiotics. 5. CONCLUSION With the main purpose to find sources of new antibiotics, this study was able to isolate Acremonium sp. with antimicrobial activity comparable to commercially sold antibiotics followed by Pestalotia sp. 1, Cladosporium sp., and Sporotrichum sp.; all these four fungal isolates are potential sources of broad-spectrum antibiotics. Six other isolates that include two species of Aspergillus, Curvularia sp., Penicillium sp., Pestalotia sp.2, and Scopulariopsis sp. could be sources of narrow-spectrum antibiotics. Further tests, however, should be done to establish safety in the use of these antimicrobials for future drug development. Also, more studies must be done on Lake Lanao particularly of its microbial community to assess its ecological status and safety for human uses. REFERENCES [1] Atlas, R. & R. Bartha. (1993). Microbial Ecology.
Benjamin-Cummings Publ. Co., USA.
[2] Haafidh, R. et al. Inhibition of Growth of Highly Resistant
Bacterial and Fungal Pathogens by a Natural Product. Open
Microbiology Journal. 2011; 5: 96–106.
[3] Hauser, Alan R. (2006). Microbiology. Illinois.
www.feinberg.northwestern.edu
[4] Tortora, Gerard J.; B.R. Funke; and C.L. Case. 2013.
Microbiology: An Introduction. Pearson Education, Inc., USA.
[5] Woodward, J. W. (2001). Simplified Fungi Identification key.
Cooperative Extension Service. Collage of Agricultural and
Environmental Sciences University of Georgia, 1-12.
FUNGAL
ISOLATES
TEST BACTERIA MEAN
Staphylococcus
aureus
Escherichia
coli
Acremonium sp. 17.5 13.75 15.62
Pestalotia sp. 1 7.25 3.5 5.38
Sporotrichum sp. 3.25 2 2.63
Cladosporium sp. 3.25 2 2.63
Pestalotia sp. 2 9.5 0 9.25
Scopulariopsis sp. 9 0 9
Aspergillus sp. 2 7 0 7
Curvularia sp. 0 6.25 6.25
Aspergillus sp. 1 0 4.25 4.25
Penicillium sp. 0 2.75 2.75
Grand Mean 8.107 4.929 6.50
Table 1. Zone of inhibition (in mm) of the ten fungal isolates
against the two test bacteria after 48 hours of incubation.
Figure 2. Colonies and spores (1,000x) of the 10 kinds of fungi
which showed antibiosis (Acremonium sp.(a), Pestalotia sp. 1
(b), Sporotrichum sp. (c), Cladosporium sp. (d), Pestalotia sp.
2 (e), Scopulariopsis sp. (f), Aspergillus sp. 2 (g), Curvularia
sp. (h), Aspergillus sp. 1 (i), and Penicillium sp. (j).
2
further tested against other microbial pathogens. These antimicrobial substances can then be further purified, elucidated and developed as new drugs for the treatment of various infectious diseases.
2. METHOD This study made use of experimental research
design and was conducted at the Microbiology Laboratory of the Biology Department, Mindanao State University, Marawi City, Lanao del Sur, Philippines. All glasswares and autoclavable materials were sterilized at 121ºC, 15 psi for 15 minutes.
Sediment samples were collected from the littoral zone of Lake Lanao which lies between 8° N. Latitude and 124° E. Longitude. Three sampling sites were at the bank of barangays Ditsaan-Ramain, Taraka, and Marawi City (see Figure 1). Surface sediment samples were analyzed within 24 hours of collection.
Isolation of fungi from sediment samples was done using Serial Dilution Pour Plate Method with dilutions plated into Potato Dextrose Agar (PDA) with Cefalexin and then incubated for five to seven days. Fungal colonies were characterized, coded, and maintained in PDA slants [1].
Antibiosis assay was done through direct inoculation of each fungal isolate into nutrient agar plates. After four days, the test bacterium was swabbed around fungal growth and incubated for 48 hours at 300C. Antibiosis activity was based on the presence of the zone of inhibition around each fungal isolate against Escherichia coli and Staphylococcus aureus.
Characterization and identification (up to the genus level) of antibiotic-producing fungi were done using both cultural and microscopic features of these isolates from slide culture. Manuals by Hauser (2006) [3], and Woodward (2001) [5], were used. Data on the zone of inhibition of the fungal
isolates against the two test bacteria were analyzed statistically.
3. RESULTS A total of 126 kinds of fungal colonies were
isolated, characterized, and tested for antibiosis activity
against Staphylococcus aureus and Escherichia coli.
Results showed that only ten (7.94%) exhibited growth
inhibition to both or either of the test bacteria (see Table
1). These fungi belong to eight genera that include
Acremonium sp., Pestalotia sp. 1, Sporotrichum sp., and
Cladosporium sp. which showed average zone of
inhibition of 3.25-17.5 mm and 2-13.75 mm against S.
aureus and E. coli, respectively. Among the fungal
isolates with antibiosis activity, Acremonium sp. showed
relatively the widest inhibition to the growth of the two
test bacteria. Pestalotia sp. 1, Sporotrichum sp., and
Cladosporium sp showed comparable but lower antibiosis
activity.
Pestalotia sp. 2, Scopulariopsis sp., and
Aspergillus sp. 2 inhibited the Gram-positive S. aureus
only with average ZOI of 7-9.5 mm. On the other hand,
Curvularia sp., Aspergillus sp. 1, and Penicillium sp.
inhibited the Gram-negative E. coli only with 2.75-6.25
mm average zone of inhibition.
Figure 1. Map showing Lake Lanao in the Philippines with
the three selected sampling sites (Taraka, Ditsaan-
Ramain, Marawi City) in red boxes
(https://images.search.yahoo.com/search/images
17th World Lake Conference, Lake Kasumigaura, Ibaraki, Japan, 2018
941

1
Evaluation of River Environment by Biological Indicators in Boso Peninsula
Kazuhito Murakami, Tsuyoshi Doyama, Haruna Niida, Kenji Watanabe
Dept. of Life and Environmental Science , Chiba Institute of Technology
Keywords : river environment, biological index, attached diatom, benthos, water quality, Boso peninsula
Abstract In this study, rivers that flow down the Boso peninsula using biological indicators for river environmental assessment was conducted, and river environment map in the Boso peninsula drew up at the same time, aimed at the construction of biological environment information in Chiba Prefecture. The Boso peninsula is shown to be divided into three areas in the Northwestern (urban area), Northeastern (plains) and Southern parts (hilly area). The Northwest (urban area) and the Northeast (plains) were estimated as "dirty" and the South (hilly area) was estimated as "clean". In addition, there is the great gap on biotic assessment between benthos and attached diatom. In the future, traditionally from individuals, populations and water quality assessment and environmental assessment environmental DNA analysis be conducted from biological habitat quality and quantity and ecosystem composition, structure and functions point of view. Furthermore, development of the database is expected to the characteristics of environment information for ecosystem restoration and conservation by linking with evaluation based on sensibility such as Water Environmental Soundness Index. 1. INTRODUCTION
Utilization of biological indicators for water environmental evaluation is different from water quality indicator by chemical analysis. It has the advantage of reflection a relatively long-term environmental change and easy to convert as a influence to human. On one hand, there is a big problem that they require skill in the classification, identification and counting, and susceptible to the influence of analysis of individual differences and method of investigation. In Japan, when evaluating rivers, chemical water quality survey is main investigation but biological water quality survey is not, as well as in Chiba prefecture. Then, it is thought that comprehensive biological water quality survey in Chiba prefecture will be possible by using attached diatom as a producer and benthos as higher-level consumers. In this study, rivers that flow down the Boso peninsula using biological indicators for river environmental assessment was conducted, and river environment map in the Boso peninsula drew up at the same time, aimed at the construction of biological environment information in Chiba prefecture.
2. RESEARCH METHODS 2.1 Rivers to survey
Kikuta River (2005), Koito River (2009), Obitsu River (2010), Yoro River (2011), Inba marsh inflow and outflow Rivers(Shinkawa River, Hanami River, Kashima River) (2012, 2016), Tega marsh inflow and outflow rivers(Ohori River, Ohtsu River, Someiiriotoshi, Tega River) (2013), Yatsu tidal flats inflow in and out Rivers(Yatsu River, Takase River) (2013), Kuriyama River (2014), Ebi River (2014), Isumi River (2015), Sakuta River (2016), Ichinomiya River (2017), Minato River (2018), and
their watershed were surveyed. It was carried out four times a year at each of three to seven points of each river by season. The parentheses are the years studied.
2.2 Attached diatom investigation as a producer
Attached diatom was collected using a quadrate frame of 5 cm × 5 cm from the bottom of the river, and It was classified, identified and counted using a biological microscope (Nikon Ecripse E 800).
DAIpo (Diatom Assemblage Index to organic water pollution) and RPId (River Pollution Index based on DCI) were calculated, and the river environment was evaluated by these indicators. 1 DAIpo
DAIpo is an organic pollution index based on attached diatom community, and is used as a biological index for organic contamination, common to still water areas (lakes) and running water areas (rivers).
Attached diatom is decided to investigate belong to what a biotic community (good clear water species, wide adaptability species, good pollution species), and calculated from equation (1).
DAIpo=50 ((A B)/2) (1) Here,
A: The sum of the relative frequency (%) of all saproxenous taxa at the survey site
B: The sum of the relative frequency (%) of all saprophilous taxa at the survey site
Table 1 shows the relationship between DAIpo, BOD, and pollution class. 2 RPId
RPId is a total evaluation value of river based on DAIpo, and by calculating the RPId, it is possible to compare the pollution of rivers different flow
17th World Lake Conference, Lake Kasumigaura, Ibaraki, Japan, 2018
942
P1-19
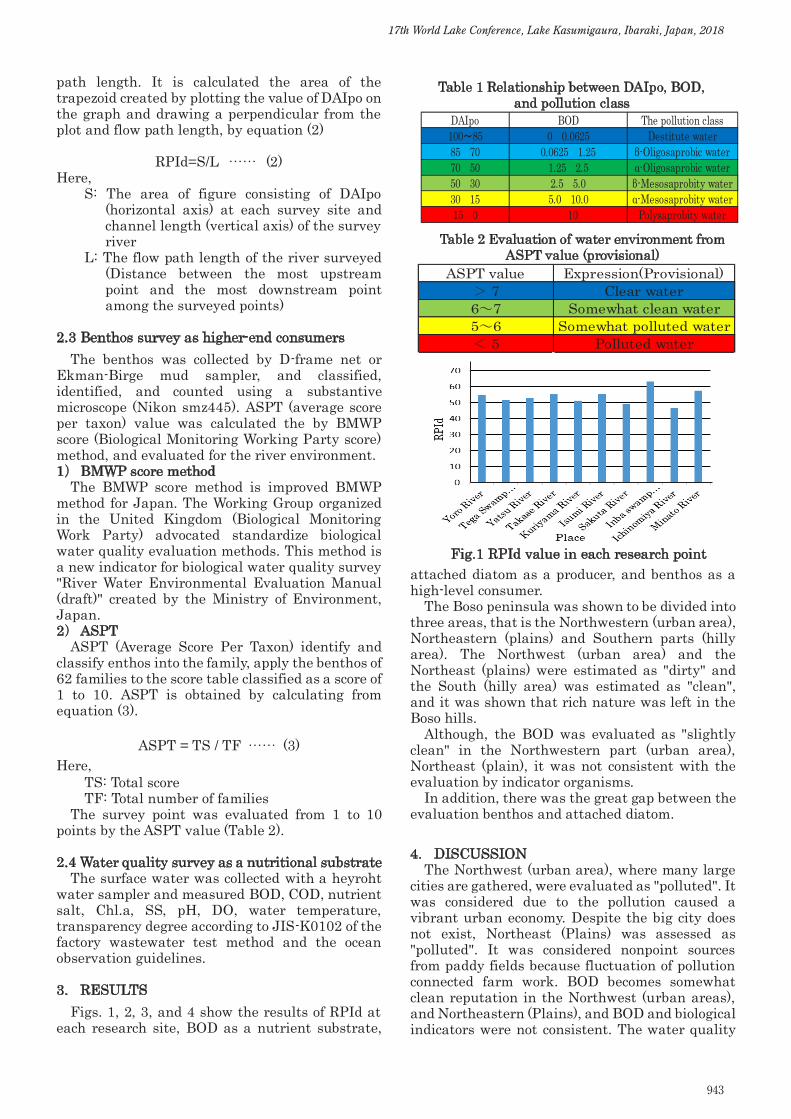
2
path length. It is calculated the area of the trapezoid created by plotting the value of DAIpo on the graph and drawing a perpendicular from the plot and flow path length, by equation (2)
RPId=S/L (2)
Here, S: The area of figure consisting of DAIpo
(horizontal axis) at each survey site and channel length (vertical axis) of the survey river
L: The flow path length of the river surveyed (Distance between the most upstream point and the most downstream point among the surveyed points)
2.3 Benthos survey as higher-end consumers
The benthos was collected by D-frame net orEkman-Birge mud sampler, and classified, identified, and counted using a substantive microscope (Nikon smz445). ASPT (average score per taxon) value was calculated the by BMWP score (Biological Monitoring Working Party score) method, and evaluated for the river environment. 1 BMWP score method
The BMWP score method is improved BMWP method for Japan. The Working Group organized in the United Kingdom (Biological Monitoring Work Party) advocated standardize biological water quality evaluation methods. This method is a new indicator for biological water quality survey "River Water Environmental Evaluation Manual (draft)" created by the Ministry of Environment, Japan. 2 ASPT
ASPT (Average Score Per Taxon) identify and classify enthos into the family, apply the benthos of 62 families to the score table classified as a score of 1 to 10. ASPT is obtained by calculating from equation (3).
ASPT = TS / TF (3) Here,
TS: Total score TF: Total number of families
The survey point was evaluated from 1 to 10 points by the ASPT value (Table 2). 2.4 Water quality survey as a nutritional substrate
The surface water was collected with a heyroht water sampler and measured BOD, COD, nutrient salt, Chl.a, SS, pH, DO, water temperature, transparency degree according to JIS-K0102 of the factory wastewater test method and the ocean observation guidelines. 3. RESULTS
Figs. 1, 2, 3, and 4 show the results of RPId at each research site, BOD as a nutrient substrate,
attached diatom as a producer, and benthos as a high-level consumer.
The Boso peninsula was shown to be divided into three areas, that is the Northwestern (urban area), Northeastern (plains) and Southern parts (hilly area). The Northwest (urban area) and the Northeast (plains) were estimated as "dirty" and the South (hilly area) was estimated as "clean", and it was shown that rich nature was left in the Boso hills.
Although, the BOD was evaluated as "slightly clean" in the Northwestern part (urban area), Northeast (plain), it was not consistent with the evaluation by indicator organisms.
In addition, there was the great gap between the evaluation benthos and attached diatom. 4. DISCUSSION
The Northwest (urban area), where many large cities are gathered, were evaluated as "polluted". It was considered due to the pollution caused a vibrant urban economy. Despite the big city does not exist, Northeast (Plains) was assessed as "polluted". It was considered nonpoint sources from paddy fields because fluctuation of pollution connected farm work. BOD becomes somewhat clean reputation in the Northwest (urban areas), and Northeastern (Plains), and BOD and biological indicators were not consistent. The water quality
DAIpo BOD The pollution class100 85 0 0.0625 Destitute water85 70 0.0625 1.25 β-Oligosaprobic water70 50 1.25 2.5 α-Oligosaprobic water50 30 2.5 5.0 β-Mesosaprobity water30 15 5.0 10.0 α-Mesosaprobity water15 0 10 Polysaprobity water
Table 1 Relationship between DAIpo, BOD, and pollution class
Fig.1 RPId value in each research point
ASPT value Expression(Provisional) 7 Clear water
6 7 Somewhat clean water5 6 Somewhat polluted water
5 Polluted water
Table 2 Evaluation of water environment from ASPT value (provisional)
17th World Lake Conference, Lake Kasumigaura, Ibaraki, Japan, 2018
943

3
is evaluated from instantaneous sampling, however, biological indicators are for the evaluation of long-lasting water quality of river. The difference between benthos and attached diatom assessment are time lag before change of water quality was reflected by bottom material, because water quality of rivers had a big-time change but bottom material had an influence for a long term. Therefore, it may show improvement from pollution state.
5. CONCLUSIONS 1) The Boso peninsula was shown to be divided into
three areas of the Northwestern (urban area), Northeastern (plains) and Southern parts (hilly area).
2) The Northwestern part (urban area) and the Northeastren part (plains) were estimated as "dirty" and the Southern part (hilly area) was estimated as "clean", respectively.
3) There was the great gap between the evaluation by benthos and attached diatom as biological indicators, and from this reason, it is necessary to evaluate both indicators comprehensively.
6. FUTURE PROSPECT In the future, using assessment by existing
individuals, population and water quality and analysis by DNA (eDNA), more detailed environmental assessment will be conducted considering quality/quantity of existing creature and construction/structure/function of ecosystem. Furthermore, conducting assessment by sensitivity like Water Environmental Soundness Index at the same time, it is anticipated that construction of database relating to acquisition environmental information to ecosystem restoration and characteristic of location become possible.
PEFERENCES [1] Watanabe,T:(2005) Freshwater Diatom Ecology
Encyclopedia, Uchidaroukakuho [2] Tanida,K:(2010) Indicators of River Environment
Biology, Hokuryukan [3] Fukuhara,H:(1993) Factory Wastewater Test Method
JIS-K0102, Japan Standards Association [4] JMA:(1999) Manual on Oceanogaphic Observation,
Meteorological Business Support Center
Fig.2 Environmental condition map of Boso peninsula by BOD
Fig.3 Environmental condition map of Boso peninsula by diatom
Fig.4 Environmental condition map of Boso peninsula by benthos
17th World Lake Conference, Lake Kasumigaura, Ibaraki, Japan, 2018
944
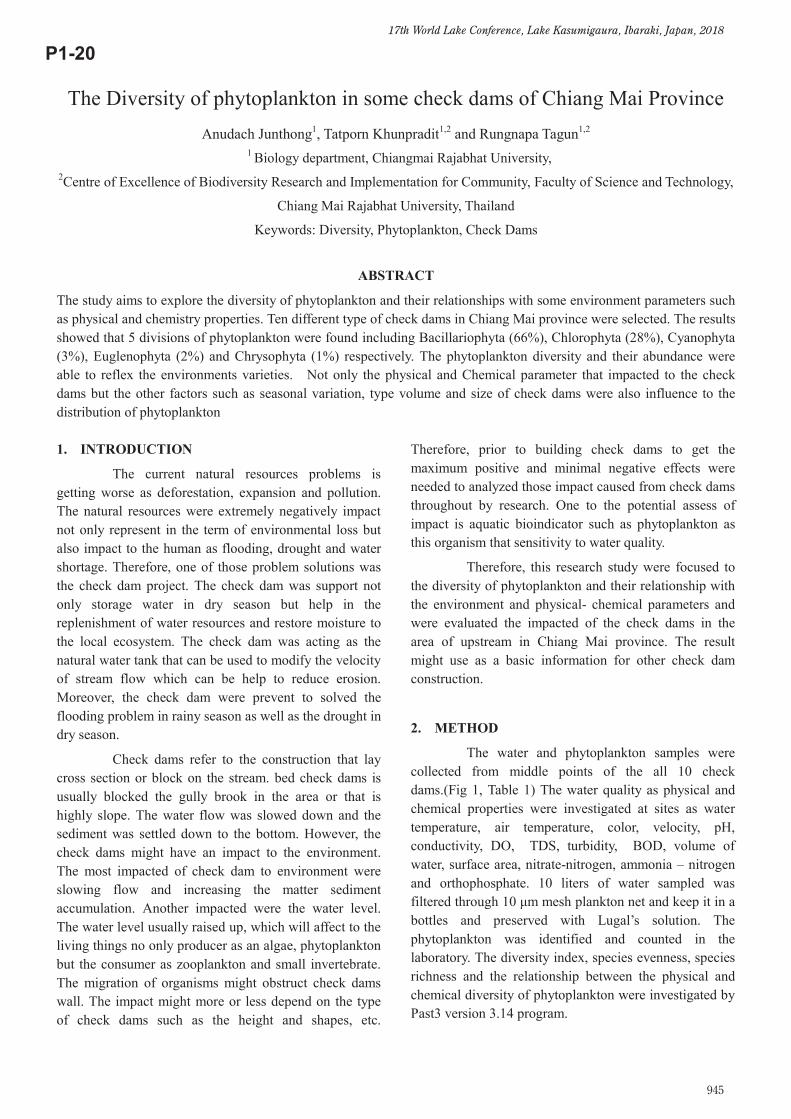
1
The Diversity of phytoplankton in some check dams of Chiang Mai Province Anudach Junthong1, Tatporn Khunpradit1,2 and Rungnapa Tagun1,2
1 Biology department, Chiangmai Rajabhat University, 2Centre of Excellence of Biodiversity Research and Implementation for Community, Faculty of Science and Technology,
Chiang Mai Rajabhat University, Thailand
Keywords: Diversity, Phytoplankton, Check Dams
ABSTRACT
The study aims to explore the diversity of phytoplankton and their relationships with some environment parameters such as physical and chemistry properties. Ten different type of check dams in Chiang Mai province were selected. The results showed that 5 divisions of phytoplankton were found including Bacillariophyta (66%), Chlorophyta (28%), Cyanophyta (3%), Euglenophyta (2%) and Chrysophyta (1%) respectively. The phytoplankton diversity and their abundance were able to reflex the environments varieties. Not only the physical and Chemical parameter that impacted to the check dams but the other factors such as seasonal variation, type volume and size of check dams were also influence to the distribution of phytoplankton 1. INTRODUCTION
The current natural resources problems is getting worse as deforestation, expansion and pollution. The natural resources were extremely negatively impact not only represent in the term of environmental loss but also impact to the human as flooding, drought and water shortage. Therefore, one of those problem solutions was the check dam project. The check dam was support not only storage water in dry season but help in the replenishment of water resources and restore moisture to the local ecosystem. The check dam was acting as the natural water tank that can be used to modify the velocity of stream flow which can be help to reduce erosion. Moreover, the check dam were prevent to solved the flooding problem in rainy season as well as the drought in dry season.
Check dams refer to the construction that lay cross section or block on the stream. bed check dams is usually blocked the gully brook in the area or that is highly slope. The water flow was slowed down and the sediment was settled down to the bottom. However, the check dams might have an impact to the environment. The most impacted of check dam to environment were slowing flow and increasing the matter sediment accumulation. Another impacted were the water level. The water level usually raised up, which will affect to the living things no only producer as an algae, phytoplankton but the consumer as zooplankton and small invertebrate. The migration of organisms might obstruct check dams wall. The impact might more or less depend on the type of check dams such as the height and shapes, etc.
Therefore, prior to building check dams to get the maximum positive and minimal negative effects were needed to analyzed those impact caused from check dams throughout by research. One to the potential assess of impact is aquatic bioindicator such as phytoplankton as this organism that sensitivity to water quality.
Therefore, this research study were focused to the diversity of phytoplankton and their relationship with the environment and physical- chemical parameters and were evaluated the impacted of the check dams in the area of upstream in Chiang Mai province. The result might use as a basic information for other check dam construction.
2. METHOD
The water and phytoplankton samples were collected from middle points of the all 10 check dams.(Fig 1, Table 1) The water quality as physical and chemical properties were investigated at sites as water temperature, air temperature, color, velocity, pH, conductivity, DO, TDS, turbidity, BOD, volume of water, surface area, nitrate-nitrogen, ammonia – nitrogen and orthophosphate. 10 liters of water sampled was filtered through 10 μm mesh plankton net and keep it in a bottles and preserved with Lugal’s solution. The phytoplankton was identified and counted in the laboratory. The diversity index, species evenness, species richness and the relationship between the physical and chemical diversity of phytoplankton were investigated by Past3 version 3.14 program.
17th World Lake Conference, Lake Kasumigaura, Ibaraki, Japan, 2018
945
P1-20
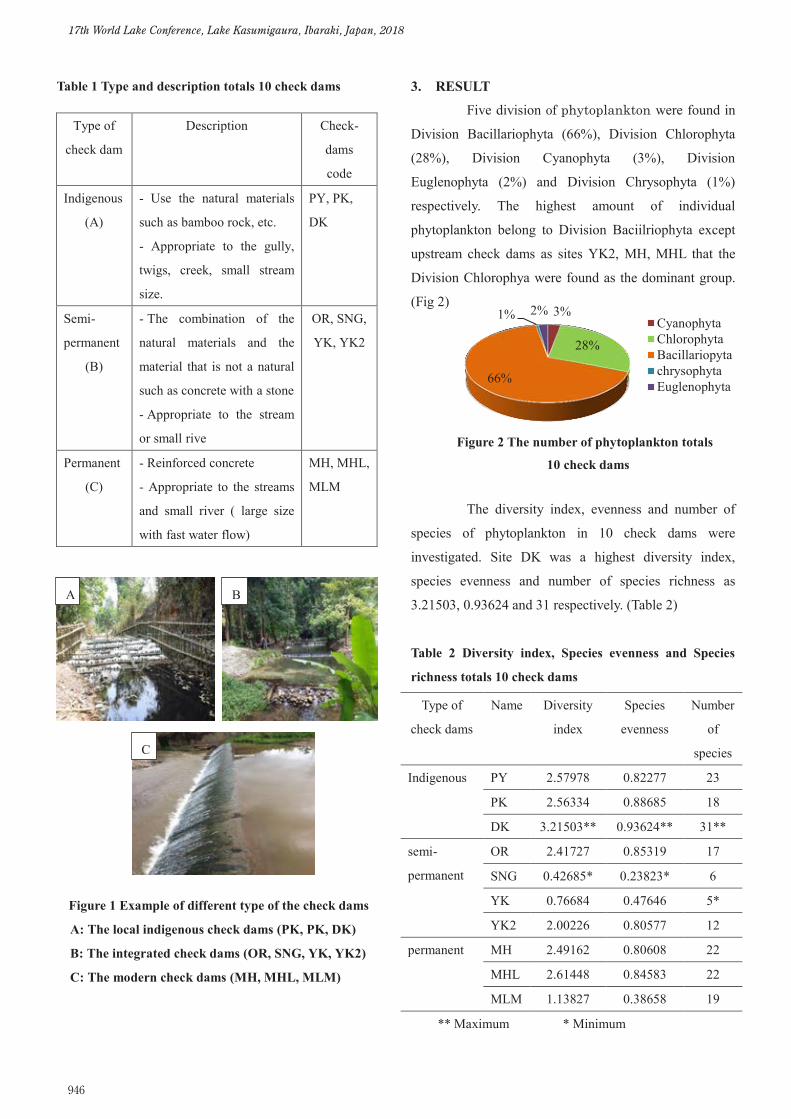
2
3%
28%
66%
1% 2% CyanophytaChlorophytaBacillariopytachrysophytaEuglenophyta
Table 1 Type and description totals 10 check dams
Figure 1 Example of different type of the check dams
A: The local indigenous check dams (PK, PK, DK)
B: The integrated check dams (OR, SNG, YK, YK2)
C: The modern check dams (MH, MHL, MLM)
3. RESULT
Five division of phytoplankton were found in
Division Bacillariophyta (66%), Division Chlorophyta
(28%), Division Cyanophyta (3%), Division
Euglenophyta (2%) and Division Chrysophyta (1%)
respectively. The highest amount of individual
phytoplankton belong to Division Baciilriophyta except
upstream check dams as sites YK2, MH, MHL that the
Division Chlorophya were found as the dominant group.
(Fig 2)
Figure 2 The number of phytoplankton totals
10 check dams
The diversity index, evenness and number of
species of phytoplankton in 10 check dams were
investigated. Site DK was a highest diversity index,
species evenness and number of species richness as
3.21503, 0.93624 and 31 respectively. (Table 2)
Table 2 Diversity index, Species evenness and Species
richness totals 10 check dams
** Maximum * Minimum
Type of
check dam
Description Check-
dams
code
Indigenous
(A)
- Use the natural materials
such as bamboo rock, etc.
- Appropriate to the gully,
twigs, creek, small stream
size.
PY, PK,
DK
Semi-
permanent
(B)
- The combination of the
natural materials and the
material that is not a natural
such as concrete with a stone
- Appropriate to the stream
or small rive
OR, SNG,
YK, YK2
Permanent
(C)
- Reinforced concrete
- Appropriate to the streams
and small river ( large size
with fast water flow)
MH, MHL,
MLM
Type of
check dams
Name Diversity
index
Species
evenness
Number
of
species
Indigenous PY 2.57978 0.82277 23
PK 2.56334 0.88685 18
DK 3.21503** 0.93624** 31**
semi-
permanent
OR 2.41727 0.85319 17
SNG 0.42685* 0.23823* 6
YK 0.76684 0.47646 5*
YK2 2.00226 0.80577 12
permanent MH 2.49162 0.80608 22
MHL 2.61448 0.84583 22
MLM 1.13827 0.38658 19
A B
C
17th World Lake Conference, Lake Kasumigaura, Ibaraki, Japan, 2018
946

3
The relationship of the physical and chemical
and diversity of phytoplankton in 10 sampling sites were
investigated. The relationship between the water quality
physical and chemical properties could be grouped by the
cluster distance 1.0 as divided to two. Firstly turbidity
had a positive relationships with site MH and MHL. Thus
the conductivity and TDS has a positive relationships
with sites SNG and OR in second group. (Fig. 3) On the
other hand, the diversity of phytoplankton to check dams
could be grouped by the cluster distance 7.5 as 8 groups.
Each group has a difference dominant phytoplankton
such as site MH, MHL were staurastrum tetracerum,
MLM was Navicula sp., PY, YK2 weas Coelastrum
reticulatrum (dangeard) Senn, DK was Pandorina sp. and
PK was Cyclotella sp. (Fig. 4)
Figure 3 The cluster plot show the relationship between
water quality Physical and Chemical of
10 check dams.
76
Figure 4 The cluster plot show the relationship diversity index of phytoplankton in 10 check dams.
4. DISCUSSION
The diversity and distribution of phytoplankton
in sampling sites were different as well as the water
condition.[1] The water composition from each sampling
point were unique characteristics and influence to the
phytoplankton communities.[2] The other factor as a
seasonal condition might impact to check dams especially,
small size and low volume capacity. Moreover, the
seasonal influenced to the distribution of phytoplankton
as higher abundant in rainy season as well as the richness
more than the dry season. [3]
In this research the relationship between the
physical and chemical and some algae were investigated.
The sites MH MLM that had a high turbidity would
found staurastrum tetracerum as the dominant species.
(Fig. 3, 4)
5. CONCLUSION
The physical and chemical properties of all 10
sampling check dams sites that had and unique and
different characteristics. The other factors such as the
season, the volume and size of check dams were also
impact to the diversity of phytoplankton were also
different depended on the characteristic of the check
dams. Thus, the construction of the check dams should be
aware about the impacted to ecosystem and environment.
REFERANCES [1] Sammanee, P. Effects of Check Dam on Water Quality and
Diversity of Macroalgae, Phytoplankton, Zooplankton and
Benthic Diatoms. Master’ s thesis of Science. Chiangmai
uuuuRajabhat University. 2010.
[2] Santiwat, S., Soontornprasit, K.and Valunpian, S. Water
eeeequality and phytoplankton diversity in the Ing river.
Khon Kaen AGR. J. 42 SUPPL. 1, pp.778-784, 2014.
[3] Sithik, A. M. A., G. Thirrumaran, R. Arumugam, R. R. R.
Kanamand, and P. Anantharaman.Studies ofphytoplankton
wwwdiversity from Agnitheertham andKothandaramar Koil coastal
wwwwaters,Southeast coastof India. Global Journal of
wwwEnvironmental Research, pp. 118 – 125, 2009
1 2
1 2 3 4 5 6 7 8
2
3%
28%
66%
1% 2% CyanophytaChlorophytaBacillariopytachrysophytaEuglenophyta
Table 1 Type and description totals 10 check dams
Figure 1 Example of different type of the check dams
A: The local indigenous check dams (PK, PK, DK)
B: The integrated check dams (OR, SNG, YK, YK2)
C: The modern check dams (MH, MHL, MLM)
3. RESULT
Five division of phytoplankton were found in
Division Bacillariophyta (66%), Division Chlorophyta
(28%), Division Cyanophyta (3%), Division
Euglenophyta (2%) and Division Chrysophyta (1%)
respectively. The highest amount of individual
phytoplankton belong to Division Baciilriophyta except
upstream check dams as sites YK2, MH, MHL that the
Division Chlorophya were found as the dominant group.
(Fig 2)
Figure 2 The number of phytoplankton totals
10 check dams
The diversity index, evenness and number of
species of phytoplankton in 10 check dams were
investigated. Site DK was a highest diversity index,
species evenness and number of species richness as
3.21503, 0.93624 and 31 respectively. (Table 2)
Table 2 Diversity index, Species evenness and Species
richness totals 10 check dams
** Maximum * Minimum
Type of
check dam
Description Check-
dams
code
Indigenous
(A)
- Use the natural materials
such as bamboo rock, etc.
- Appropriate to the gully,
twigs, creek, small stream
size.
PY, PK,
DK
Semi-
permanent
(B)
- The combination of the
natural materials and the
material that is not a natural
such as concrete with a stone
- Appropriate to the stream
or small rive
OR, SNG,
YK, YK2
Permanent
(C)
- Reinforced concrete
- Appropriate to the streams
and small river ( large size
with fast water flow)
MH, MHL,
MLM
Type of
check dams
Name Diversity
index
Species
evenness
Number
of
species
Indigenous PY 2.57978 0.82277 23
PK 2.56334 0.88685 18
DK 3.21503** 0.93624** 31**
semi-
permanent
OR 2.41727 0.85319 17
SNG 0.42685* 0.23823* 6
YK 0.76684 0.47646 5*
YK2 2.00226 0.80577 12
permanent MH 2.49162 0.80608 22
MHL 2.61448 0.84583 22
MLM 1.13827 0.38658 19
A B
C
17th World Lake Conference, Lake Kasumigaura, Ibaraki, Japan, 2018
947

1
A brief introduction of biodiversity in Dongting Lake Nan Yang1, Youzhi Li2, Feng Li3
1ASEM Water Resources Research and Development Center 2Hunan Agriculture University 3Institute of Subtropical
Agriculture, Chinese Academy of Sciences Keywords: Dongting Lake; Biodiversity; Invasive plants; Poplar plantation
ABSTRACT
Dongting Lake, the second largest freshwater lake in China, locates in the northern Hunan Province and connectes to the Yangtze River. The lake has three Ramsar wetlands of international importance and shows rich biodiversity.
The vegetation in Dongting Lake composes by 229 seed plants belong to 58 families and 150 genera. Among these plants, 97% of species belongs to herbs. However, the number of the invasive plants reaches 43 species, belong to 34 genera and 19 families. The most typical invasive plant in the Dongting Lake is poplar plantations and their effects on the native plant diversity were investigated. On the whole, large-area of poplar plantations increased species richness and diversity index. However, they changed the species composition and decrease the number of aquatic species and native species. Therefore, biodiversity protection must be enhanced in the Dongting Lake wetlands.
1. INTRODUCTION
Dongting Lake (28°30´–30°20´N, 111°40´–113°10´E),
the second largest freshwater lake in China (2,691 km2), is
located in northern Hunan Province in a basin south of the
Yangtze River and is connected to the Yangtze by
distributary channels. Three major sections of the lake
(eastern, southern, and western) have been designated as
Wetlands of International Importance by the Ramsar
Convention. The mean water depth is 6.7m and with
deepest 30.8m, the mean annual runoff is 312.6 billion m3.
The lake has seven water inlets, including three channels
of the Yangtze River (Songzi, Taiping and Ouchi) and four
rivers (Rivers Xiang, Zi, Yuan and Li). The lake has only
one outlet, which discharges into the Yangtze River at
Chenglingji. Annual fluctuation in water level is
approximately 12–14 m, with the maxima in August and
minima typically in January or February, which provides
the basic hydrological regime for maintaining large areas
of beach wetlands, the most dynamic landscape within the
Dongting Lake area. The mean annual temperature in the
area is 16.4–17℃, with the coldest temperatures in
January (3.9–4.5℃) and the hottest in July (28.6–29.1℃).
Annual precipitation is 1,382 mm, with more than 60 %
falling during the period from April to August. Alluvial
soil is the primary soil type in the Dongting Lake wetlands.
The region has also been recognized as one of the 200
global conservation priority eco-regions proposed by the
World Wide Fund for Nature, due to its valuable and
exclusive biodiversity. The catchment has 1428
herbaceous species, 114 fish species, and 217 bird species.
2. METHOD The nested quadrats sampling design suggested by Avery
and Burkhart33 was used to form sampling units to
determine plant diversity. In each vegetated area, three
plots (20 m 330 m) with equal spacing were established
as replicates. In each plot, five quadrats (2 m 2 m) with
equal spacing (5 6 m) were chosen for investigation.
3. RESULTS With the field investigation, totally 235 species were
found in the Dongting Lake wetland. Among these species,
97.9% were herbaceous plants. The number of seed plants
was 229 species, belonging to 58 families and 150 genera.
17th World Lake Conference, Lake Kasumigaura, Ibaraki, Japan, 2018
948
P1-21

1
A brief introduction of biodiversity in Dongting Lake Nan Yang1, Youzhi Li2, Feng Li3
1ASEM Water Resources Research and Development Center 2Hunan Agriculture University 3Institute of Subtropical
Agriculture, Chinese Academy of Sciences Keywords: Dongting Lake; Biodiversity; Invasive plants; Poplar plantation
ABSTRACT
Dongting Lake, the second largest freshwater lake in China, locates in the northern Hunan Province and connectes to the Yangtze River. The lake has three Ramsar wetlands of international importance and shows rich biodiversity.
The vegetation in Dongting Lake composes by 229 seed plants belong to 58 families and 150 genera. Among these plants, 97% of species belongs to herbs. However, the number of the invasive plants reaches 43 species, belong to 34 genera and 19 families. The most typical invasive plant in the Dongting Lake is poplar plantations and their effects on the native plant diversity were investigated. On the whole, large-area of poplar plantations increased species richness and diversity index. However, they changed the species composition and decrease the number of aquatic species and native species. Therefore, biodiversity protection must be enhanced in the Dongting Lake wetlands.
1. INTRODUCTION
Dongting Lake (28°30´–30°20´N, 111°40´–113°10´E),
the second largest freshwater lake in China (2,691 km2), is
located in northern Hunan Province in a basin south of the
Yangtze River and is connected to the Yangtze by
distributary channels. Three major sections of the lake
(eastern, southern, and western) have been designated as
Wetlands of International Importance by the Ramsar
Convention. The mean water depth is 6.7m and with
deepest 30.8m, the mean annual runoff is 312.6 billion m3.
The lake has seven water inlets, including three channels
of the Yangtze River (Songzi, Taiping and Ouchi) and four
rivers (Rivers Xiang, Zi, Yuan and Li). The lake has only
one outlet, which discharges into the Yangtze River at
Chenglingji. Annual fluctuation in water level is
approximately 12–14 m, with the maxima in August and
minima typically in January or February, which provides
the basic hydrological regime for maintaining large areas
of beach wetlands, the most dynamic landscape within the
Dongting Lake area. The mean annual temperature in the
area is 16.4–17℃, with the coldest temperatures in
January (3.9–4.5℃) and the hottest in July (28.6–29.1℃).
Annual precipitation is 1,382 mm, with more than 60 %
falling during the period from April to August. Alluvial
soil is the primary soil type in the Dongting Lake wetlands.
The region has also been recognized as one of the 200
global conservation priority eco-regions proposed by the
World Wide Fund for Nature, due to its valuable and
exclusive biodiversity. The catchment has 1428
herbaceous species, 114 fish species, and 217 bird species.
2. METHOD The nested quadrats sampling design suggested by Avery
and Burkhart33 was used to form sampling units to
determine plant diversity. In each vegetated area, three
plots (20 m 330 m) with equal spacing were established
as replicates. In each plot, five quadrats (2 m 2 m) with
equal spacing (5 6 m) were chosen for investigation.
3. RESULTS With the field investigation, totally 235 species were
found in the Dongting Lake wetland. Among these species,
97.9% were herbaceous plants. The number of seed plants
was 229 species, belonging to 58 families and 150 genera.
2
Additionally, we analyzed the floristic type according to
the floristic areal-type method. In family level, the plants
contents 38 families belonging to cosmopolitan type.
Poaceae is the biggest family, followed by Asteraceae. In
genus level, the plants contents 52 genera belonging to
cosmopolitan type and Polygonum is the biggest type.
From the observation results, most plants in Dongting
Lake belong to the cosmopolitan type and temperate flora.
Then, we would introduce the invasive plants in
Dongting Lake and take poplar as an example. Totally, we
found 43 invasive plant species from 19 families and 34
genera. The biggest invasive family is Compositae and
contents 7 species, which accounts to 16.2% of the total
species. Among these invasive species, 24 species are
originated from America. The 17 species, including
Erigeron annuus, Alternanthera philoxeroides, and
Populus euramevicana are most common invasive plants
in Dongting Lake. 27 species distribute along the flood
control levee and road edge. 37 species belong to
herbaceous type, in which, 29 species are annuals or
biennials. The invasive species are adaptable and short in
growth cycle and easy to be spread by water flow in
Dongting Lake. On the whole, 48.8% plant species were
introduced by intentional human activities and or 37.2%
by unconscious human activities.
Now, we take Poplar (Populus deltoides) as an example.
In 1970s, P. deltoides was introduced into the Dongting
Lake area for making paper. In 2007, the area increased
from 87 km2 in 1983 to 640 km2 (accounting for 26% of
the total lake area). The study shows that although species
number and Shannon’s diversity were higher in young
poplar versus reedy areas, poplar plantations had different
effects on relative proportions of species composition: a
higher ratio of mesophytes but a lower ratio of
hygrophytes, and a higher ratio of heliophytes but a lower
ratio of neutrophilous or shade plants. Changes in relative
proportions of species also reflect the changes in
understory environmental conditions. Therefore, species
richness alone is incomplete and species composition of
different ecotypes or life forms cannot be neglected when
evaluating the extent to which understory plant diversity is
affected by fast-growing tree plantations. Additionally,
poplar plantations might also have far-reaching effects on
the diversity of animal species. In the South Dongting
Lake wetlands, poplar plantations have led to a
significantly lower diversity of migratory birds
4. CONCLUSION
Considering the wetland of international importance,
the biodiversity in Dongting Lake region should be
protected or strengthen by taking artificial and natural
measures to restore the degraded habitat
17th World Lake Conference, Lake Kasumigaura, Ibaraki, Japan, 2018
949

1
Paper title Do winter-flooded paddies serve as overwintering sites for aquatic animal communities?
Tawa Kota1 and Sagawa Shiro2 1 River Restoration Team, Water Environment Research Group, Public Works Research Institute
2 Graduate School of Regional Resource Management, University of Hyogo / Hyogo Park of the Oriental White Stork
Keywords: eco-friendly rice paddy, biodiversity, winter-flooded rice cultivation, aquatic animal community
ABSTRACT
For successful reintroduction of storks, winter-flooded rice cultivation has been introduced widely in paddy fields in the Toyooka Basin of the Hyogo prefecture, Japan. We studied the overwintering status of aquatic animal communities in winter-flooded paddies (WFP). The number of taxa of aquatic animals in winter-flooded paddies did not differ from that of conventional water management paddies (CWMP), fallow-field biotopes (FFB), and canal-type biotopes (CTB). Aquatic animals were more abundant in CWMP than in WEP. In addition, community structures of Odonata, Hemiptera, and Coleoptera were roughly divided into CWMP and WFP, and FFB and CTB, respectively. Our results show that winter-flooded rice cultivation is not very effective for the overwintering of aquatic animals, compared with conventional paddies and fallow-field biotopes. Therefore, it may be necessary to develop various types of overwintering environments at the regional scale in paddy fields for conservation of the aquatic animal communities.
1. INTRODUCTION
The Oriental white stork (Ciconia boyciana) inhabits open freshwater wetlands, such as paddy fields and floodplains, and preys on various animal species (e.g., fish, insects, frogs, tadpoles, snakes, crayfishes, and small mammals) there [1]. The Japanese wild population of the Oriental white stork became extinct in 1971. One major reason for this extinction was the sharp decrease in the number of aquatic animal species in paddy fields due to the spread of agrochemicals and agricultural field improvements in the 1960s [2]. Since 2005, Oriental white storks have been continuously reintroduced in the Toyooka Basin, the final habitat of wild storks in Japan. Reintroduced storks have bred every year since 2007. For successful reintroduction of storks, various eco-friendly rice farming, i.e., “White Stork-friendly Farming Method”, have been introduced in paddy fields of the Toyooka Basin. Among them, winter-flooded rice cultivation is especially believed to contribute to the conservation of paddy biodiversity and restoration of feeding habitats of storks in winter; however, to our knowledge, no study has quantitatively analyzed its effects. Therefore, we examined the impact of winter-flooded rice cultivation on overwintering in aquatic animal communities.
2. METHOD We studied one paddy field area (35°55 N, 134°86 E) in the Toyooka Basin, of the Hyogo prefecture, Japan. This
area is one of the main habitats of reintroduced storks and has approximately 50 modernized structural paddy fields. Small streams are utilized for irrigation, and water is supplied to each paddy through concrete creeks spread throughout the district. Winter-flooded rice cultivation is carried out in half of all paddies in this area. Conventional water management paddies (CWMP) are flooded only during the cropping period (from late April to late August), but some puddles remain in each paddy because of poor drainage and heavy precipitation during the non-cropping period (Fig. 1a). On the other hand, winter-flooded paddies (WFP) are flooded not only during the cropping period but also during the non-cropping period (from early December to late March, Fig. 1b). Besides WFP, 20 fallow-field biotopes (FFB) and eight canal-type biotopes (CTB) adjacent to paddies have been developed for conservation of aquatic animal habitats and as foraging sites of storks. FFB are flooded during all seasons and CTB are flooded during the same season as WFP. Four types of study sites were selected: (1) WFP, (2) CWMP, (3) CTB, and (4) FFB. We set three control sections for each site type to have 12 study sites in total. To capturing aquatic animals, we conducted sweeping survey with a D-frame hand net (35-cm frame diameter, 1-mm mesh size). At each study site, we set eight sampling points and swept approximately 30 cm toward the shoreline. Aquatic animals were counted for each taxon and were discharged into the sampling point. All surveys were conducted from January 19 to January 30, 2015.
17th World Lake Conference, Lake Kasumigaura, Ibaraki, Japan, 2018
950
P1-22

1
Paper title Do winter-flooded paddies serve as overwintering sites for aquatic animal communities?
Tawa Kota1 and Sagawa Shiro2 1 River Restoration Team, Water Environment Research Group, Public Works Research Institute
2 Graduate School of Regional Resource Management, University of Hyogo / Hyogo Park of the Oriental White Stork
Keywords: eco-friendly rice paddy, biodiversity, winter-flooded rice cultivation, aquatic animal community
ABSTRACT
For successful reintroduction of storks, winter-flooded rice cultivation has been introduced widely in paddy fields in the Toyooka Basin of the Hyogo prefecture, Japan. We studied the overwintering status of aquatic animal communities in winter-flooded paddies (WFP). The number of taxa of aquatic animals in winter-flooded paddies did not differ from that of conventional water management paddies (CWMP), fallow-field biotopes (FFB), and canal-type biotopes (CTB). Aquatic animals were more abundant in CWMP than in WEP. In addition, community structures of Odonata, Hemiptera, and Coleoptera were roughly divided into CWMP and WFP, and FFB and CTB, respectively. Our results show that winter-flooded rice cultivation is not very effective for the overwintering of aquatic animals, compared with conventional paddies and fallow-field biotopes. Therefore, it may be necessary to develop various types of overwintering environments at the regional scale in paddy fields for conservation of the aquatic animal communities.
1. INTRODUCTION
The Oriental white stork (Ciconia boyciana) inhabits open freshwater wetlands, such as paddy fields and floodplains, and preys on various animal species (e.g., fish, insects, frogs, tadpoles, snakes, crayfishes, and small mammals) there [1]. The Japanese wild population of the Oriental white stork became extinct in 1971. One major reason for this extinction was the sharp decrease in the number of aquatic animal species in paddy fields due to the spread of agrochemicals and agricultural field improvements in the 1960s [2]. Since 2005, Oriental white storks have been continuously reintroduced in the Toyooka Basin, the final habitat of wild storks in Japan. Reintroduced storks have bred every year since 2007. For successful reintroduction of storks, various eco-friendly rice farming, i.e., “White Stork-friendly Farming Method”, have been introduced in paddy fields of the Toyooka Basin. Among them, winter-flooded rice cultivation is especially believed to contribute to the conservation of paddy biodiversity and restoration of feeding habitats of storks in winter; however, to our knowledge, no study has quantitatively analyzed its effects. Therefore, we examined the impact of winter-flooded rice cultivation on overwintering in aquatic animal communities.
2. METHOD We studied one paddy field area (35°55 N, 134°86 E) in the Toyooka Basin, of the Hyogo prefecture, Japan. This
area is one of the main habitats of reintroduced storks and has approximately 50 modernized structural paddy fields. Small streams are utilized for irrigation, and water is supplied to each paddy through concrete creeks spread throughout the district. Winter-flooded rice cultivation is carried out in half of all paddies in this area. Conventional water management paddies (CWMP) are flooded only during the cropping period (from late April to late August), but some puddles remain in each paddy because of poor drainage and heavy precipitation during the non-cropping period (Fig. 1a). On the other hand, winter-flooded paddies (WFP) are flooded not only during the cropping period but also during the non-cropping period (from early December to late March, Fig. 1b). Besides WFP, 20 fallow-field biotopes (FFB) and eight canal-type biotopes (CTB) adjacent to paddies have been developed for conservation of aquatic animal habitats and as foraging sites of storks. FFB are flooded during all seasons and CTB are flooded during the same season as WFP. Four types of study sites were selected: (1) WFP, (2) CWMP, (3) CTB, and (4) FFB. We set three control sections for each site type to have 12 study sites in total. To capturing aquatic animals, we conducted sweeping survey with a D-frame hand net (35-cm frame diameter, 1-mm mesh size). At each study site, we set eight sampling points and swept approximately 30 cm toward the shoreline. Aquatic animals were counted for each taxon and were discharged into the sampling point. All surveys were conducted from January 19 to January 30, 2015.
2
Fig. 1 Pictures of study paddies during the non-cropping
season (January 30, 2015) in the Toyooka Basin, (a) the
CWMP and (b) the WFP. 3. RESULTS A total of 2,915 aquatic animals belonging to 38 taxa were collected at the 12 study sites. The number of Oligochaeta and Chironomidae larvae were 1349 and 754, respectively, which accounted for 72% of captured aquatic animals. In terms of taxa, aquatic insects were dominant (24 taxa, 63%). The number of taxa of aquatic animals in WFP did not differ from that in other study sites. Community structures of Odonata, Hemiptera, and Coleoptera, which are the indicator fauna in paddy fields (Nakanishi et al., 2009[3]), were roughly divided into CWMP and WFP, and FFB and CTB, respectively (Fig. 2). Oligochaeta, Chironomidae larvae, and Hirudinea were more abundant in CWMP than in other study sites. Aquatic Hemiptera Sigara spp. showed a similar abundance in CWMP and WFP, they did not appear in FFB and CTB. Viviparidae were more abundant in CWMP, WFP, and CTB than in FFB, while Veneroida showed the opposite trend. 4. DISCUSSION Aquatic animals in WFP were not more diverse than those in other study sites. Tawa et al. (2013) [4] reported that ill-drained paddy fields where water puddles of various depths remain during the non-agricultural period can serve as wintering habitats for aquatic animal communities. In the WFP, the whole surface was filled with water after
flatting the field, so a water environment of constant depth was formed there. Hence, the WFP plays a role as an overwintering habitat for the aquatic animals, but it is considered to be less likely to function as an effective overwintering site than the CWMP. Fig. 2 Nonmetric multidimensional scaling (NMDS) plot
of aquatic insect communities in study sites. Different
types of study sites are denoted by different symbol
shapes. 5. CONCLUSION
For conservation of aquatic animal communities in paddy fields at the regional scale, it is necessary to create various types of overwintering environments rather than introducing specific environmentally friendly farming methods (e.g., WFP). Even in modernized structural paddy fields, water puddles that serve as overwintering habitats for aquatic animals may be formed depending on topography. Therefore, it is also important to not only implement new eco-friendly rice farming but also make use of existing paddy fields as overwintering sites for aquatic animals. REFERENCES [1] Naito K & Ikeda H: Habitat restoration for the reintroduction
of oriental white storks, Global Environmental Research-English edition-, Vol. 11, pp. 217-221, 2007.
[2] Naito K & Ikeda H: Re-creation of the Homeland for Oriental White Storks-Habitat Restoration for Reintroduction-, Landscape Research Japan, Vol. 64, pp. 318-321, 2000. (in Japanese)
[3] Nakanishi K, Tawa K, Kanbara B, Noma N & Sawada H: Comparisons of macro-aquatic animal communities among paddy fields under different cultivation management systems, Japanese Journal of Environmental Entomology and Zoology, Vol. 20, pp. 103-114, 2009.
[4] Tawa K, Nakanishi K, Murakami D, Nishida N & Sawada H: The habitat status of large-sized aquatic animals in an ill-drained paddy field and an adjacent side ditch, Japanese Journal of Conservation Ecology, Vol. 18, pp. 77-89, 2013.
(b)
(a)
17th World Lake Conference, Lake Kasumigaura, Ibaraki, Japan, 2018
951
1
Paper Title: Estimation of ecological carrying capacity of tilapia (Oreochromis
niloticus) cage culture in Lake Volta using phosphorus mass balance.
Karikari, A.Y.1, Asmah, R.1, Amisah, S.2, Agbo, N. 2, Telfer, T.C.,3 and Ross. L.G.3 1CSIR Water Research Institute, Accra, Ghana, 2Kwame Nkrumah University of Science & Technology, Kumasi, Ghana,
3Institute of Aquaculture, University of Stirling, United Kingdoms
Keywords: Ecological carrying capacity, phosphorus mass balance model, cage fish farm, Lake Volta, Tilapia.
ABSTRACT
Development of intensive fish cage farming in reservoirs and lakes could pose threats to the environment. Ecological carrying capacity assessment is useful for sustainable aquaculture production and rational use of water bodies. The current study estimated the ecological carrying capacity for a tilapia cage culture on Lake Volta. The ecological carrying capacity was predicted using Dillon and Rigler mass balance model, taking into account water quality data and average production data of feed and fish compositions and feed conversion ratio (FCR). The phosphorus load to the environment estimated per tonne of fish produced was 22.77 kg P t-1 for the farm. The calculated capacity was 6,363 ty-1 for the farm area. The estimated capacity was about 14 times higher than the present production (450 ty-1) in the zone. This suggests that further cage culture of tilapia could be established in the lake without compromising the water quality and the ecosystem. However, monitoring of water quality should be undertaken periodically to accurately determine the state of the lake in order to both confirm and refine predictions.
1. INTRODUCTION
Lake Volta, a multipurpose water body supports a range of
interests including wild capture fisheries, hydropower,
irrigation and water supply. Currently, cage fish farming of
tilapia is fast expanding on the lake. Large quantities of
waste (uneaten food and fish faeces) are produced as a
result of intensive cage fish culture[1] . Excess phosphorus
loading from fish feed can cause eutrophication in lakes.
Thus, mismanagement of intensive cage farming can
negatively impact the lake water.
The estimation of ecological carrying capacity of a specific
site is essential to sustain culture, protect the environment
and reduce risks of eutrophication that may occur[2]. A
phosphorus mass balance model for freshwater lakes by
Dillon and Rigler is widely used for estimating phosphorus
levels in lakes and reservoirs in different areas, as well as
other waters with cage fish culture. The carrying capacity
of Lake Volta is unknown. There is a need to have
estimates for the lake’s carrying capacity for aquaculture
development.
The study is aimed at estimating the ecological carrying
capacity of important areas for aquaculture development
in Lake Volta. This is done as a basis for planning, decision
making and integrated management of sustainable
aquaculture in the lake.
2. METHOD The Lake Volta is a tropical man-made lake that was
created by damming River Volta in 1964 to provide
hydroelectric power. Geographically, it lies between
longitude 1° 30° W and 0° 20° E and Latitude 6° 15´ N and
9° 10´ N (Figure 1). At a maximum level, the lake has a
volume of 149 km3, a surface area of about 8,500 km2 and
its length is 400 km.
For the purposes of estimating the ecological carrying
capacity, a medium-scale farm with 80 cages of 5m x 5m
x5 m was chosen. The farm is located close to the dead end
of a side channel of Lake Volta, near to Akosombo, an
17th World Lake Conference, Lake Kasumigaura, Ibaraki, Japan, 2018
952
P1-23
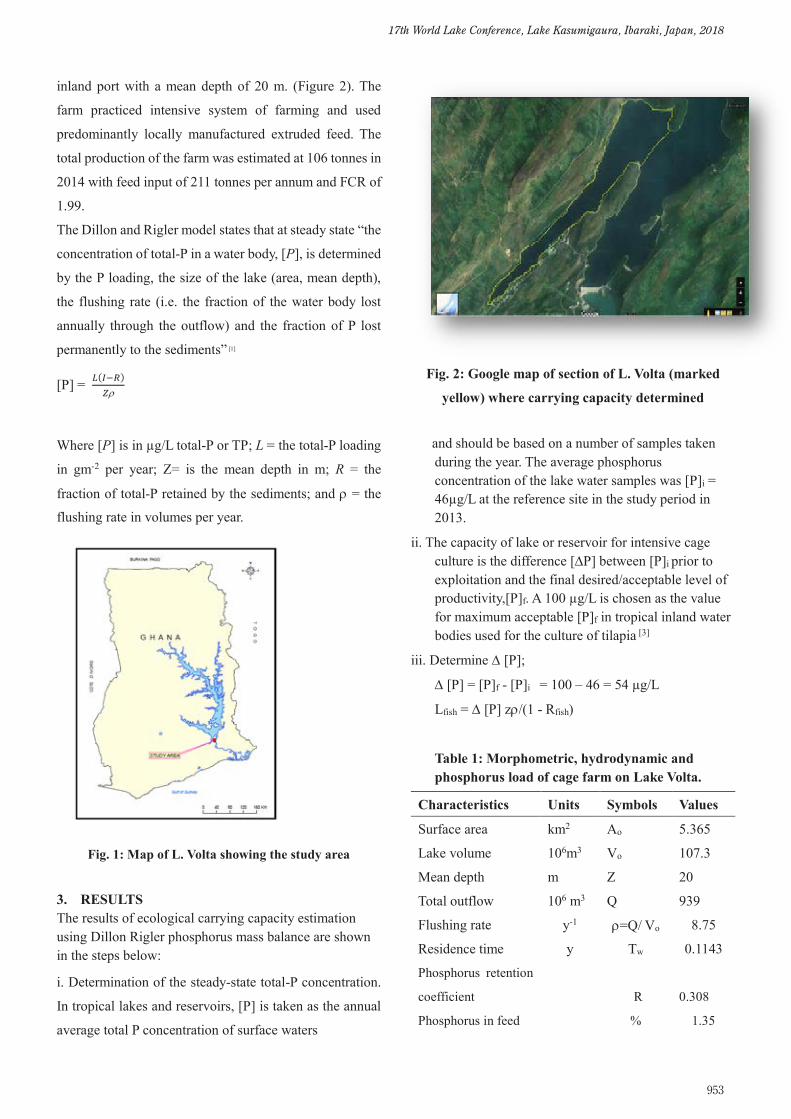
1
Paper Title: Estimation of ecological carrying capacity of tilapia (Oreochromis
niloticus) cage culture in Lake Volta using phosphorus mass balance.
Karikari, A.Y.1, Asmah, R.1, Amisah, S.2, Agbo, N. 2, Telfer, T.C.,3 and Ross. L.G.3 1CSIR Water Research Institute, Accra, Ghana, 2Kwame Nkrumah University of Science & Technology, Kumasi, Ghana,
3Institute of Aquaculture, University of Stirling, United Kingdoms
Keywords: Ecological carrying capacity, phosphorus mass balance model, cage fish farm, Lake Volta, Tilapia.
ABSTRACT
Development of intensive fish cage farming in reservoirs and lakes could pose threats to the environment. Ecological carrying capacity assessment is useful for sustainable aquaculture production and rational use of water bodies. The current study estimated the ecological carrying capacity for a tilapia cage culture on Lake Volta. The ecological carrying capacity was predicted using Dillon and Rigler mass balance model, taking into account water quality data and average production data of feed and fish compositions and feed conversion ratio (FCR). The phosphorus load to the environment estimated per tonne of fish produced was 22.77 kg P t-1 for the farm. The calculated capacity was 6,363 ty-1 for the farm area. The estimated capacity was about 14 times higher than the present production (450 ty-1) in the zone. This suggests that further cage culture of tilapia could be established in the lake without compromising the water quality and the ecosystem. However, monitoring of water quality should be undertaken periodically to accurately determine the state of the lake in order to both confirm and refine predictions.
1. INTRODUCTION
Lake Volta, a multipurpose water body supports a range of
interests including wild capture fisheries, hydropower,
irrigation and water supply. Currently, cage fish farming of
tilapia is fast expanding on the lake. Large quantities of
waste (uneaten food and fish faeces) are produced as a
result of intensive cage fish culture[1] . Excess phosphorus
loading from fish feed can cause eutrophication in lakes.
Thus, mismanagement of intensive cage farming can
negatively impact the lake water.
The estimation of ecological carrying capacity of a specific
site is essential to sustain culture, protect the environment
and reduce risks of eutrophication that may occur[2]. A
phosphorus mass balance model for freshwater lakes by
Dillon and Rigler is widely used for estimating phosphorus
levels in lakes and reservoirs in different areas, as well as
other waters with cage fish culture. The carrying capacity
of Lake Volta is unknown. There is a need to have
estimates for the lake’s carrying capacity for aquaculture
development.
The study is aimed at estimating the ecological carrying
capacity of important areas for aquaculture development
in Lake Volta. This is done as a basis for planning, decision
making and integrated management of sustainable
aquaculture in the lake.
2. METHOD The Lake Volta is a tropical man-made lake that was
created by damming River Volta in 1964 to provide
hydroelectric power. Geographically, it lies between
longitude 1° 30° W and 0° 20° E and Latitude 6° 15´ N and
9° 10´ N (Figure 1). At a maximum level, the lake has a
volume of 149 km3, a surface area of about 8,500 km2 and
its length is 400 km.
For the purposes of estimating the ecological carrying
capacity, a medium-scale farm with 80 cages of 5m x 5m
x5 m was chosen. The farm is located close to the dead end
of a side channel of Lake Volta, near to Akosombo, an
2
inland port with a mean depth of 20 m. (Figure 2). The
farm practiced intensive system of farming and used
predominantly locally manufactured extruded feed. The
total production of the farm was estimated at 106 tonnes in
2014 with feed input of 211 tonnes per annum and FCR of
1.99.
The Dillon and Rigler model states that at steady state “the
concentration of total-P in a water body, [P], is determined
by the P loading, the size of the lake (area, mean depth),
the flushing rate (i.e. the fraction of the water body lost
annually through the outflow) and the fraction of P lost
permanently to the sediments” [1]
[P] = 𝐿𝐿(𝐼𝐼−𝑅𝑅)𝑍𝑍
Where [P] is in µg/L total-P or TP; L = the total-P loading
in gm-2 per year; Z= is the mean depth in m; R = the
fraction of total-P retained by the sediments; and = the flushing rate in volumes per year.
Fig. 1: Map of L. Volta showing the study area
3. RESULTS The results of ecological carrying capacity estimation using Dillon Rigler phosphorus mass balance are shown in the steps below:
i. Determination of the steady-state total-P concentration.
In tropical lakes and reservoirs, [P] is taken as the annual
average total P concentration of surface waters
Fig. 2: Google map of section of L. Volta (marked
yellow) where carrying capacity determined
and should be based on a number of samples taken
during the year. The average phosphorus concentration of the lake water samples was [P]i = 46µg/L at the reference site in the study period in 2013.
ii. The capacity of lake or reservoir for intensive cage culture is the difference [P] between [P]i prior to exploitation and the final desired/acceptable level of productivity,[P]f. A 100 µg/L is chosen as the value for maximum acceptable [P]f in tropical inland water bodies used for the culture of tilapia [3]
iii. Determine [P];
[P] = [P]f - [P]i = 100 – 46 = 54 µg/L
Lfish = [P] z/(1 - Rfish)
Table 1: Morphometric, hydrodynamic and phosphorus load of cage farm on Lake Volta.
Characteristics Units Symbols Values
Surface area km2 Ao 5.365
Lake volume 106m3 Vo 107.3
Mean depth m Z 20
Total outflow 106 m3 Q 939
Flushing rate y-1 =Q/ Vo 8.75
Residence time y Tw 0.1143
Phosphorus retention
coefficient
R
0.308
Phosphorus in feed % 1.35
17th World Lake Conference, Lake Kasumigaura, Ibaraki, Japan, 2018
953
3
Feed conversion ratio
(FCR)
1.99
Phosphorus content
in fish
% 0.41
Phosphorus load to
environment
kgt-1 22.77
Tot. Phosphorus load
to environment
kgy-1 2,416
Rfish is the most difficult parameter to estimate. At least 45-55% of the total-P wastes from cage rainbow trout are likely to be permanently lost to sediments as a result of solids deposition. In the absence of any other data, these values are also used for cage tilapia and carp, and calculated as Rfish = x + [(1 - x) R]
Where x is the net proportion of total-P lost permanently to the sediments as a result of solids deposition (0.45-0.55) and R is proportion of dissolved total-P lost to the sediments i.e. phosphorus retention coefficient.
X was calculated to be 0.50
Thus, R is calculated from equation R = 1/1 + 0.747
0.507
R= 0.308
Thus, using above equation, Rfish is calculated as 0.65.
z = 20 m (Table 1)
= 8.75 y-1 (Table 1)
Lfish = (54 x 20 x 8.75) / (1 - 0.65)
= 27,000 mg m-2 y-1
Equivalent to 27.0 g m-2 y-1
iv. Since the area under operation (Farm area) of the lake has a surface area of 5.365 x 10⁶ m2, the total loading, La, is
La = 27.0g m-2 y-1x 5.365 x 106 m2
La = 27.0g y-1x 5.365 x 106
La = 144.86 x 10⁶ g y-1
v. Having calculated the total acceptable P loading Lfish, this value is divided by the average total P waste to the environment per tonne fish production as a result of the cage culture to obtain the carrying capacity of the area.
The tonnage of fish of P loading from Farm was calculated as 22.765 kg t-1 (Table 1). Therefore,
Carrying capacity of Farm area of lake = 144.86 x 10⁶ g y-1/ 22765 g t-1
= 6,363 t y-1
4. DISCUSSION The present production levels of tilapia of 450 t for the farm is over 14 times higher than the predicted ecological carrying capacity. Despite the rapid expansion of cage culture, the present biomass and impact to the lake’s ecosystem is still acceptable. Cage aquaculture has the potential to continue on its current trend and increase without substantially altering the lakes ecosystem. With the government’s proposal to increase aquaculture production from 10, 200 tonnes to 100,000 tonnes, and from the results of this study, this may be still within acceptable ecological limits, since there are other zones in the lake to accommodate the required expansion. . 5. CONCLUSION
The results of this work indicated that the carrying capacity of the zone studied on the lake has not yet been reached. Further cage culture of tilapia could be established in the lake without compromising the water quality and the ecosystem. This calculated value can be taken as an indicator of a possible ecologically sustainable aquaculture production level for Lake Volta area. However, monitoring of water quality should be undertaken periodically to accurately determine the current state of the lake in order to both confirm and refine predictions.
REFERENCES [1] Beveridge M.C.M. Cage Aquaculture, (3rd edn). Blackwell
Science, Oxford, UK, pp. 368, 2004
[2] Ross, L.G., Telfer, L. Falconer, D. Soto & J. Aguilar-Manjarrez, (eds). Site selection and carrying capacities for inland and coastal aquaculture, pp. 231–251. FAO/Institute of Aquaculture, University of Stirling, Expert Workshop, 6–8 December 2010. Stirling, the United Kingdom of Great Britain and Northern Ireland. FAO Fisheries and Aquaculture Proceedings No. 21. Rome, FAO. pp.282, 2013
[3] OECD (Organisation for Economic Co-operation and Development). Assessment of trophic status of standing waters are based on methods described in the Eutrophication of waters: monitoring assessment and control. In: Vollenwieder (Ed.). Organisation for Economic Co-operation and Development, Paris, 1982.
17th World Lake Conference, Lake Kasumigaura, Ibaraki, Japan, 2018
954

1
Hyroipsis schlegeli Inversiunio jokohamensis Sinanodonta spp.
1.
Acheilognathinae
15 11[1][2][3][4]
Hyroipsis schlegeli Inversiunio jokohamensis Cristaria
plicata Anemina arcaeformis Sinanodonta japonica Sinanodonta lauta
Sinanodonta spp
[6][7][8]
Habitat Evaluation Procedure HEP
2. 40 42 N
141 20 E 1.56 7.64.3m 1.3m [9]
Phragmites austrailisTypha latifolia
Trapa japonica
HEP HEPSuitability Index SI
17th World Lake Conference, Lake Kasumigaura, Ibaraki, Japan, 2018
955
P1-24

2
Habitat Suitability Index HSI
0 1
HEP 3
[1][10][11][12][13][14][15][16][17] SISI DO
a
36
a
SI2016 7 12 9 27
SonTek/YSI Hydro Surveyor M9DO a 2016 9
16 Hydrolab/DS5X2016 9 16
15 15 15110 24
19mm 4.7mm2mm 0.85mm 0.25mm
0.075
SISI SI
HSI HSI6 1 125 125m
3
HSI
3. SI 0m SI 0 40
SI 1 DO 0mg/ⅼ SI 0
5mg/ⅼ DOSI 1 a
5μg/ⅼa 5μg SI 10μg/ⅼ
1
770m SI 00m SI 1
, SI0.2
SI 1SI 0.3
SI 36 HSIHSI 0 0.77
0.29 0 0.910.30 HSI
1 2HSI 3
HSI 0.77 0.91
3HSI
SI
3 HSI
SIHSI
4.
17th World Lake Conference, Lake Kasumigaura, Ibaraki, Japan, 2018
956

3
[1] Kondo, T. Monograph of Unionoida in Japan Mollusca
Bivalvia Special Pubulication of the Malacological Society Japan. 3 1-69 2008.
[2] Itoh, T. Kitano, T. Toma, M. Fujimoto, H. Sakihara, K. & Kohno, H. Host species for glochidia of the freshwater unionid mussel Cristaria tenuis in Ishigakijima Island Japan, Venus 72 1-4 77-87 2014.
[3] . , 39 1 25-29 2008.
[4] Geist, J. Strategies for the conservation of endangered freshwater pearl mussels Margaritifera margaritifera L. , A synthesis of conservarion genetics and ecology, Hydrobiologia 644 69-88 2010.
[5] 4 , http://www.biodic.go.jp/rdb/rdb_f.html.,2015.
[6] , Venus 53 2156-159 1994.
[7] ,
1, 97-127, 1996. [8] , 13
11-19 2003. [9] Schwalb, A.N. Morris, T.J. Mandark, N.E. & Cottenie, K.
Distribution of unionid freshwater mussels depends on the distribution of host fishes on a regional scale, Diversity and Distributions 19 446-454, 2013.
[10] Neves, R.J. Widlak, J.C. Occurrence of glochidia in stream drift and on fishes of the Upper North Fork Holston RiverVirginia, American Midland Naturalist 119 1 111-1201988.
[11] 54 85-94 2003.
[12]
79-91 2003.
[13] 94-95 2001. [14]
2 Venus 65 3 241-2452006.
[15] 80 5
741-752 2014. [16]
82 1 2-112016.
[17] 54 85-94 2004.
2.HSI1.HSI
2
Habitat Suitability Index HSI
0 1
HEP 3
[1][10][11][12][13][14][15][16][17] SISI DO
a
36
a
SI2016 7 12 9 27
SonTek/YSI Hydro Surveyor M9DO a 2016 9
16 Hydrolab/DS5X2016 9 16
15 15 15110 24
19mm 4.7mm2mm 0.85mm 0.25mm
0.075
SISI SI
HSI HSI6 1 125 125m
3
HSI
3. SI 0m SI 0 40
SI 1 DO 0mg/ⅼ SI 0
5mg/ⅼ DOSI 1 a
5μg/ⅼa 5μg SI 10μg/ⅼ
1
770m SI 00m SI 1
, SI0.2
SI 1SI 0.3
SI 36 HSIHSI 0 0.77
0.29 0 0.910.30 HSI
1 2HSI 3
HSI 0.77 0.91
3HSI
SI
3 HSI
SIHSI
4.
17th World Lake Conference, Lake Kasumigaura, Ibaraki, Japan, 2018
957