Embed Size (px)
Citation preview
Third Workshop on Case Histories inDam Safety Risk-Informed Decision Making
2018 Annual Conference Workshop
PRELIMINARY RISK ASSESSMENTFOR A DAM WITH A VEGETATION-LINED SPILLWAY AND FERC PILOT
RIDM PROJECT
MAY 3, 2018
DAVID S. BOWLES AND LOREN R. ANDERSONRAC ENGINEERS AND ECONOMISTS, LLC AND UTAH STATE UNIVERSITY
ADAM J. MONROE AND MICHAEL J. THELENCONSUMERS ENERGY COMPANY

Alcona Hydroelectric Project
Emergency Spillway
Embankment Dam
Powerhouse& Service Spillway Emergency Spillway

Preliminary Risk Assessment (PRA)
FERC regulations provide a choice for informing risk reduction decisions between: 1. Engineering standards/guidelines approach, OR 2. Risk-informed Decision Making (RIDM) approach
• Incorporates reference to Engineering standards/guidelines.
Purpose of the PRA: To inform the owner’s decision about requesting permission to be included as a
pilot project in the FERC Risk-Informed Decision Making (RIDM) program. Focused on following potential failure modes (PFMs) related to flood capacity
• Excluded other less significant PFMs related to embankment core wall, or the absence of a core wall.

Alcona Hydroelectric Project
Emergency Spillway
Embankment Dam
Powerhouse& Service Spillway Emergency Spil
1) Emergency Spillway Erosion
2) Toe Erosion3) Embankment
Overtopping4) Service Spillway Apron Breakup
Potential Failure Modes Included in Preliminary
Risk Assessment
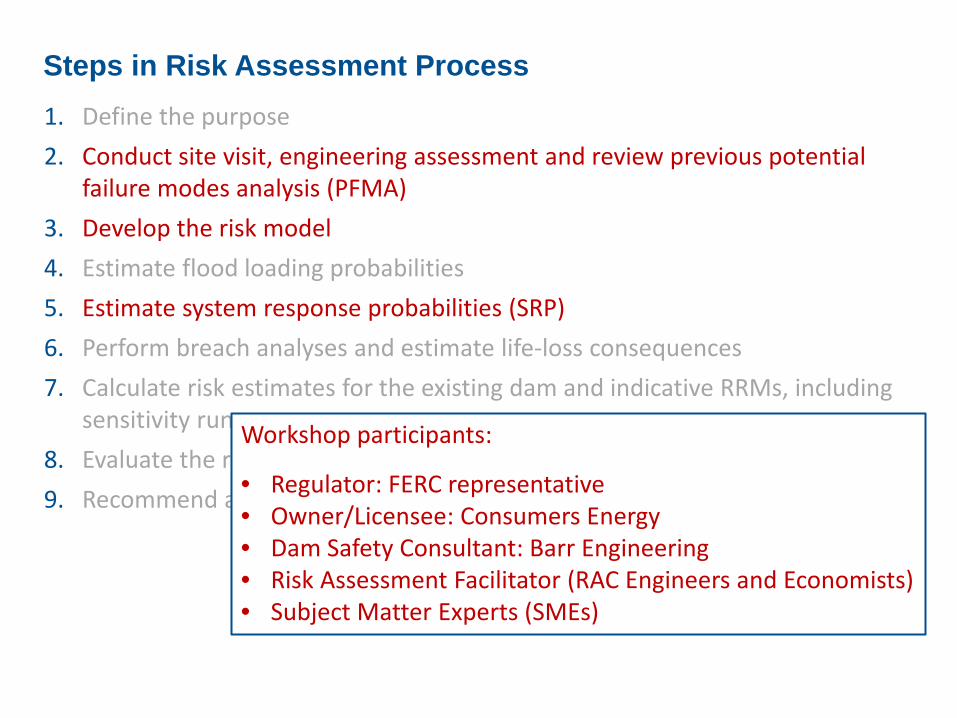
Steps in Risk Assessment Process1. Define the purpose2. Conduct site visit, engineering assessment and review previous potential
failure modes analysis (PFMA)3. Develop the risk model4. Estimate flood loading probabilities5. Estimate system response probabilities (SRP)6. Perform breach analyses and estimate life-loss consequences7. Calculate risk estimates for the existing dam and indicative RRMs, including
sensitivity runs8. Evaluate the risk - what risk is tolerable?9. Recommend and make the case for the RIDM decision
Workshop participants:
• Regulator: FERC representative• Owner/Licensee: Consumers Energy• Dam Safety Consultant: Barr Engineering• Risk Assessment Facilitator (RAC Engineers and Economists)• Subject Matter Experts (SMEs)
3.1 3.2 3.32.1
2.2 2.32.4
2.5 2.62.7
2.8 2.9
0
2
4
6
8
10
12
14
16
0 2,000 4,000 6,000 8,000 10,000 12,000
Dept
h of
Ero
sion
in E
mer
genc
y Sp
illw
ay (f
eet)
Emergency Spillway Peak Flow (cfs)
No Erosion
Maximum 4 ft Erosion
Maximum 8 ft Erosion
Maximum 16 ft Erosion
Figure 4.5. Sensitivity cases for emergency spillway maximum erosion depth (measured from the emergency spillway sill at Elevation of 832
feet NGVD29) conditioned on emergency spillway peak flow1.
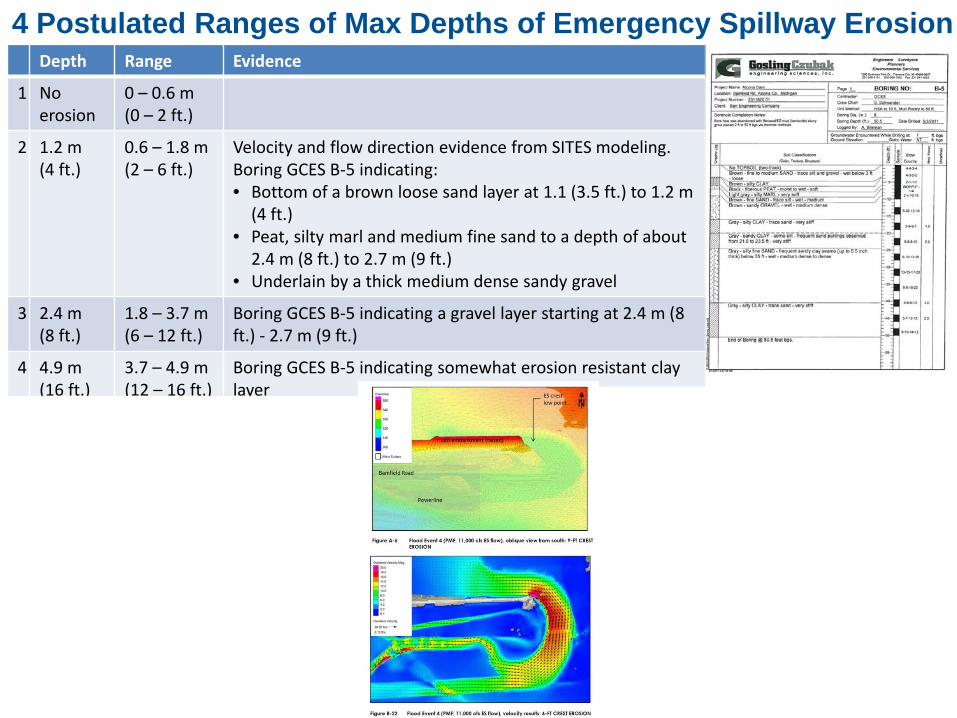
4 Postulated Ranges of Max Depths of Emergency Spillway ErosionDepth Range Evidence
1 No erosion
0 – 0.6 m(0 – 2 ft.)
2 1.2 m(4 ft.)
0.6 – 1.8 m(2 – 6 ft.)
Velocity and flow direction evidence from SITES modeling.Boring GCES B-5 indicating:• Bottom of a brown loose sand layer at 1.1 (3.5 ft.) to 1.2 m
(4 ft.)• Peat, silty marl and medium fine sand to a depth of about
2.4 m (8 ft.) to 2.7 m (9 ft.)• Underlain by a thick medium dense sandy gravel
3 2.4 m(8 ft.)
1.8 – 3.7 m(6 – 12 ft.)
Boring GCES B-5 indicating a gravel layer starting at 2.4 m (8 ft.) - 2.7 m (9 ft.)
4 4.9 m(16 ft.)
3.7 – 4.9 m(12 – 16 ft.)
Boring GCES B-5 indicating somewhat erosion resistant clay layer
0
0.1
0.2
0.3
0.4
0.5
0.6
0.7
0.8
0.9
1
- 2,000 4,000 6,000 8,000 10,000 12,000
Cond
ition
al P
roba
bilit
y of
Max
imum
Ero
sion
Emergency Spillway Peak Flow (cfs
0 - 2 feet Maximum Erosion 2 - 6 feet Maximum Erosion
6 - 12 feet Maximum Erosion 12 - 16 feet Maximum Erosion
Figure 4.19. Team likelihoods for four maximum erosion depth intervals for various emergency spillway peak flow rates.
0 ft.
4 ft.
8 ft.
16 ft.
Emerg Spillway Discharge
Likelihood of Max Erosion Depth
Scenario 0-2 6-12
12-162-6
Emerg Spillway Discharge

No Erosion
Maximum 4 ft Erosion
Maximum 8 ft Erosion
Maximum 16 ft Erosion
Event Tree Risk Model for the 4 postulated range of Emergency Spillway maximum erosion depths
0
0.1
0.2
0.3
0.4
0.5
0.6
0.7
0.8
0.9
1
- 2,000 4,000 6,000 8,000 10,000 12,000
Cond
ition
al P
roba
bilit
y of
Max
imum
Ero
sion
Emergency Spillway Peak Flow (cfs
0 - 2 feet Maximum Erosion 2 - 6 feet Maximum Erosion
6 - 12 feet Maximum Erosion 12 - 16 feet Maximum Erosion
Figure 4.19. Team likelihoods for four maximum erosion depth intervals for various emergency spillway peak flow rates.

Event tree showing dependencies between branches
1,000
10,000
100,000
0.00000010.0000010.000010.00010.0010.010.11
Peak
Inflo
w (c
fs)
Annual Exceedance Probability
Level 1 Inflow Flood Frequency
Level 11 Failure Modes
Event Tree Risk Model
Level 12 Day-Night Exposure Factors
Level 13 Life-Loss 750 intervals of
flood loading
No Erosion

Event tree showing dependencies between branches
1,000
10,000
100,000
0.00000010.0000010.000010.00010.0010.010.11
Peak
Inflo
w (c
fs)
Annual Exceedance Probability
Level 1 Inflow Flood Frequency
Level 11 Failure Modes
Event Tree Risk Model
Level 12 Day-Night Exposure Factors
Level 13 Life-Loss
Failure Mode Conditioned on Emergency Spillway maximum erosion depth (Level 4) AND:
1 Emergency spillway erosion
Emergency spillway peak flow rate (Level 6)
2 Embankment toe erosion
Emergency spillway peak flow rate (Level 6)
3 Service spillway apron breakup
1. High flow causes a breakup of the tailrace slab as a function of service spillway peak flow rate (Level 9)2. Initiates erosion which works its way under the training wall3. Loss of confinement activates uplift forces4. Collapse of the training wall as a function of duration of spill tube flow exceeding 5,000 cfs (Level 7)5. Continued erosion undercuts the toe of the embankment adjacent to the power house as a function of duration of spill tube flow exceeding 5,000 cfs (Level 7)6. A breach (uncontrolled release) of the embankment dam occurs as a function of peak reservoir stage (Level 5)
4 Embankment overtopping
Peak embankment overtopping depth (Level 10)

829
831
833
835
837
839
841
843
0 5,000 10,000 15,000 20,000 25,000 30,000
Peak
Res
ervo
ir St
age
(feet
NG
VD29
)
Peak Inflow (cfs)
No Erosion 4-feet Maximum Erosion 8-feet Maximum Erosion 16-feet Maximum Erosion
Emergency Spillway Sill
Emergency Spillway Threshold for Erosion
2015 Crest Survey Lowest ElevationCurrent PMF Peak Reservoir Stage - PMF Report
Revised PMF Peak Reservoir Stage - 2D Modeling
Figure 4.11. Peak reservoir stage – peak inflow for
emergency spillway erosion sensitivity cases.
0
5,000
10,000
15,000
20,000
25,000
30,000
832 833 834 835 836 837 838 839 840 841 842
Emer
genc
y Sp
illw
ay D
isch
arge
(cfs
)
Reservoir Stage (feet NGVD29)
No Erosion 4-feet Maximum Erosion
8-feet Maximum Erosion 16-feet Maximum Erosion
Figure 4.14. Emergency spillway peak discharge - peak stage for emergency spillway erosion sensitivity cases.
0
10,000
20,000
30,000
40,000
50,000
60,000
70,000
80,000
0 5,000 10,000 15,000 20,000 25,000 30,000
Peak
Tot
al O
utflo
w (c
fs)
Peak Inflow (cfs)
No Erosion 4-feet Maximum Erosion
8-feet Maximum Erosion 16-feet Maximum Erosion
Service spillway apron breaks up Toe erosion
Overtopping breach
Figure 4.17. Peak total outflow vs. peak inflow for emergency spillway erosion sensitivity cases for breach and non-breach cases.
0
5
10
15
20
25
30
0 5,000 10,000 15,000 20,000 25,000 30,000
Dura
tion
of S
pillt
ube
Flow
Exc
eedi
ng 5
,000
cfs
(day
s)
Peak Inflow (cfs)
No Erosion 4-feet Maximum Erosion 8-feet Maximum Erosion 16-feet Maximum Erosion
Figure 4.16. Duration of spill tube flow exceeding 5,000 cfs - peak inflow for emergency spillway erosion cases.
Emergency Spillway Max Depth of Erosion – PFM Interdependencies
0 ft.
16 ft.
16 ft.
0 ft.
16 ft.
0 ft.
0 ft.
16 ft.
Peak Inflow Rate
Peak Reservoir Stage
Peak Reservoir Stage
Emerg. Spillway Peak Discharge
Peak Total Discharge
Peak Inflow Rate
Duration of Service
Spillway Flow >5,000 cfs
Emerg. Spillway Peak Discharge

CONSEQUENCES Inundation modelling:
Non-breach/no erosion for range of flow rates
Range of erosion depths and flow rates
Other PFMs
Life Loss estimated by Graham Method Warning Time = Travel Time +
Notification Time - Agency Response Time
Conservatively applied for PRA
Estimated incremental life loss is very small for all PFMs except for embankment overtopping for which it is still small relative to many dams. Small because of slow rate of emergency
spillway erosion & very long travel time Expected that a more detailed evaluation of
life-loss will support even lower life-loss estimates.
3.1 3.2 3.32.1
2.2 2.32.4
2.5 2.62.7
2.8 2.9
0
2
4
6
8
10
12
14
16
0 2,000 4,000 6,000 8,000 10,000 12,000
Dept
h of
Ero
sion
in E
mer
genc
y Sp
illw
ay (f
eet)
Emergency Spillway Peak Flow (cfs)
No Erosion
Maximum 4 ft Erosion
Maximum 8 ft Erosion
Maximum 16 ft Erosion

Tolerability of Risk – Existing Dam & RRMs
1)
2)
3)4)
1)
2)3)4)
1.E-8
1.E-7
1.E-6
1.E-5
1.E-4
1.E-3
1.E-2
1.E-1
0.1 1.0 10.0 100.0 1,000.0 10,000.0
Annu
al F
ailu
re P
roba
bilit
y, f
(/yea
r)
Weighted Average Life Loss Estimate, Nbar
f-Nbar Plot with USACE APF and AALL Guidelines
1 in 10,000/year
Total Risk with emergency spillway erosion failure mode
Total Risk without emergency spillway erosion failure mode
Societal Risk (SR) for Existing Dam

1E-7
1E-6
1E-5
1E-4
1E-3
1E-2
1) Existing Dam 2) Service SW & ToeEros Fix
3) 2) + 1 in 10,000 ESStabilization
4) 2) + PMF ESStabilization
Annu
al P
roba
bilit
y of F
ailu
re
Estimated Annual Probabilities of Failure
TotalService SW Apron
Breakup
Emergency SW Erosion
Emb Toe Erosion
EmbankmentOvertopping
1 in 10,000 per year
1E-7
1E-6
1E-5
1E-4
1E-3
1E-2
1) Existing Dam 2) Service SW & ToeEros Fix
3) 2) + 1 in 10,000 ESStabilization
4) 2) + PMF ESStabilization
Annu
al P
roba
bilit
y of F
ailu
re
Estimated Average Annual Life Loss
Total
Service SW Apron Breakup
Emergency SW Erosion
Emb Toe Erosion
Emb Overtopping
0.001 lives per year
Existing DamRRM 1) Service SW & Toe Eros FixRRM 2) + 1 in 10,000 ES StabilizationRRM 3) + PMF ES Stabilization
Increase in APF & AALL of embankment overtopping due to:• Survival effect of addressing other failure
modes• Higher reservoir levels if emergency spillway
erosion is addressed• Higher life loss for Embankment Overtopping
Is < PMF RRM acceptable given that life safety is paramount? Likely would meet IR & SR but not APF is
ES erosion considered a PFM Both Emergency Spillway Stabilization
alternatives are extremely disproportionate
More detailed RA needed to evaluate this option
Interdependencies between PFMs
Eng Stds: PMFRIDM?
APF
AALL

PRA Recommendation
Recommended Owner to propose the Alcona Project to the FERC to be included in the FERC pilot RIDM program
PRA provides a robust case for this recommendation: PRA indicates that RIDM might justify smaller or no emergency spillway
remediation except for protecting the toe of the dam. Avoids increase in APF & AALL for overtopping failure with higher life loss. Avoids/greatly reduces environmental concerns regarding elimination of existing
wetlands emergency spillway stabilization. Potential reduced cost.
Additional expected benefits of RIDM include: A strong assurance that all significant dam safety issues identified and understood A strong assurance that all options for addressing dam safety issues are identified An improved risk-informed basis for communicating with the FERC and other
stakeholders; A more robust risk-informed basis for the FERC's regulatory decisions and for
Owner’s corporate governance of dam safety at the Alcona Project; and A sound basis for allocating resources for future investigations and to reduce the
risk of dam failure.

Current Status
FERC has accepted the Alcona Project into the FERC RIDM pilot program Kickoff meeting scheduled for next week
Overall objective for the pilot risk assessment:To make a defensible risk-informed case for a decision on risk reduction measures for Alcona Dam.
“Level 3” Semi-Quantitative” Risk Assessment (SQRA): Screen potential failure modes (PFMs) Formulate and justify supporting studies
A “Level 4” Quantitative Risk Assessment (QRA): All credible and significant PFMs (including associated with the core wall) In-depth emergency spillway erosion studies Expert elicitation using subject matter experts covering all PFMs Life-loss estimation using simulation Uncertainty analysis A sensitivity analysis for uncertainty in the flood hazard relationship Evaluate Risk Reduction Alternatives Participative Risk Review Board

Third Workshop on Case Histories inDam Safety Risk-Informed Decision Making
2018 Annual Conference Workshop
QUESTIONS?
E-MAIL:[email protected]
HOME PAGE (INCLUDING LINKS TO SELECTED PAPERS):WWW.RACENGECON.COM/DAVIDBOWLES