Embed Size (px)
Citation preview

P R E L I M I N A R Y R E S U L T S
March 2005

£ million 2004 2003 % inc.
Group sales 149.0 146.1 2.0%
Operating profit 21.4 21.1 1.4%
Operating margin 14.3% 14.4%
Net interest (2.7) (3.0)
Profit before tax 18.6 18.0 3.2%
Earnings per share 8.3p 7.9p 5.1%
Dividend per share 4.0p 3.5p 14.3%
Financial highlights 2004

Key features
Strong volume growth
Strong Cutisin performance
Adverse external factors
Further reduction in net debt
Investment in capacity
Sales analysis 2004
Sales change vs 2003
2004
Volume 7.2%
Price / Mix(2.0)%
Operations 5.2%
Foreign Exchange(3.2)%
Total 2.0%
Regional sales by destination 2004
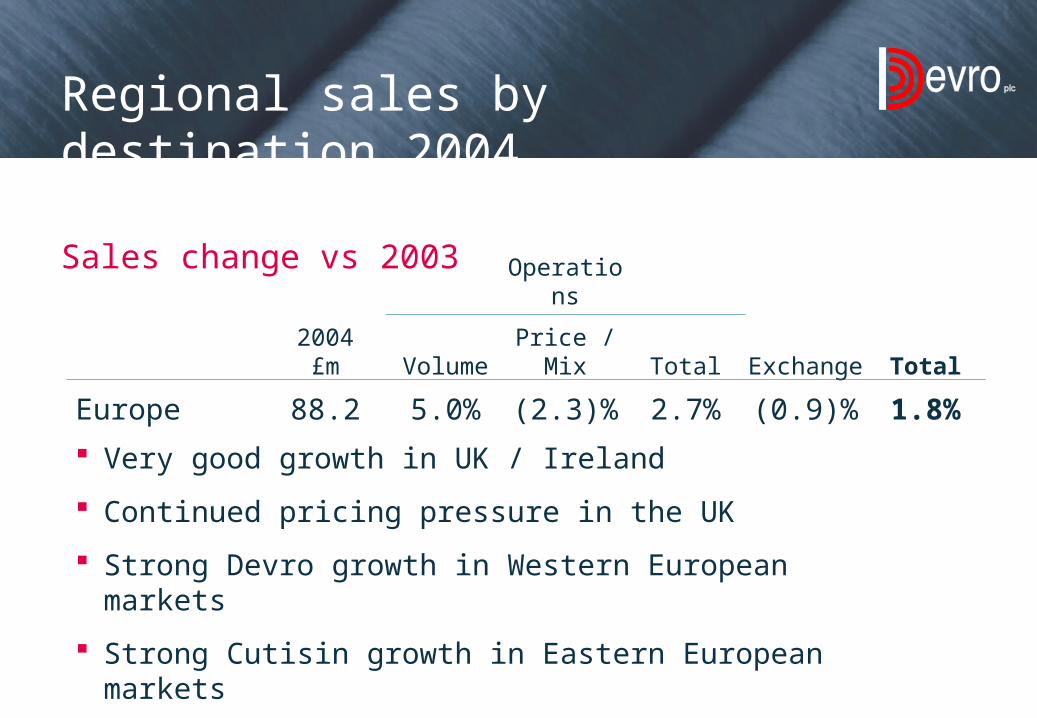
Sales change vs 2003
Very good growth in UK / Ireland
Continued pricing pressure in the UK
Strong Devro growth in Western European markets
Strong Cutisin growth in Eastern European markets
Operations
2004£m Volume Price / Mix Total Exchange Total
Europe 88.2 5.0% (2.3)% 2.7% (0.9)% 1.8%
Regional sales by destination 2004
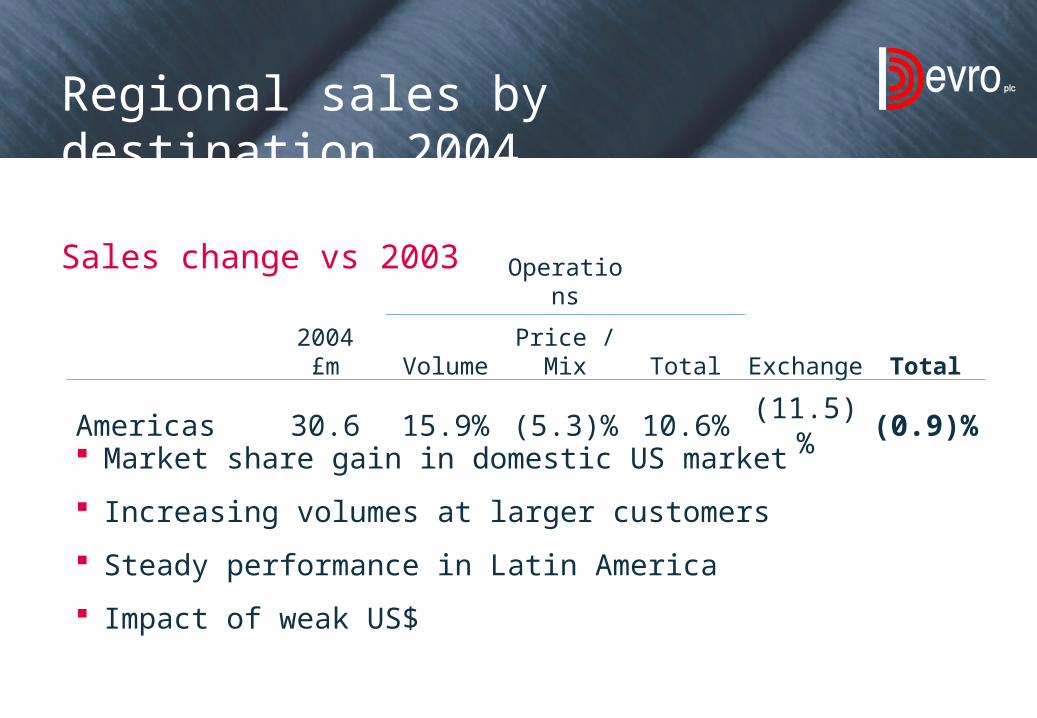
Sales change vs 2003
Market share gain in domestic US market
Increasing volumes at larger customers
Steady performance in Latin America
Impact of weak US$
Operations
2004£m Volume Price / Mix Total Exchange Total
Americas 30.6 15.9% (5.3)% 10.6% (11.5)% (0.9)%
Regional sales by destination 2004
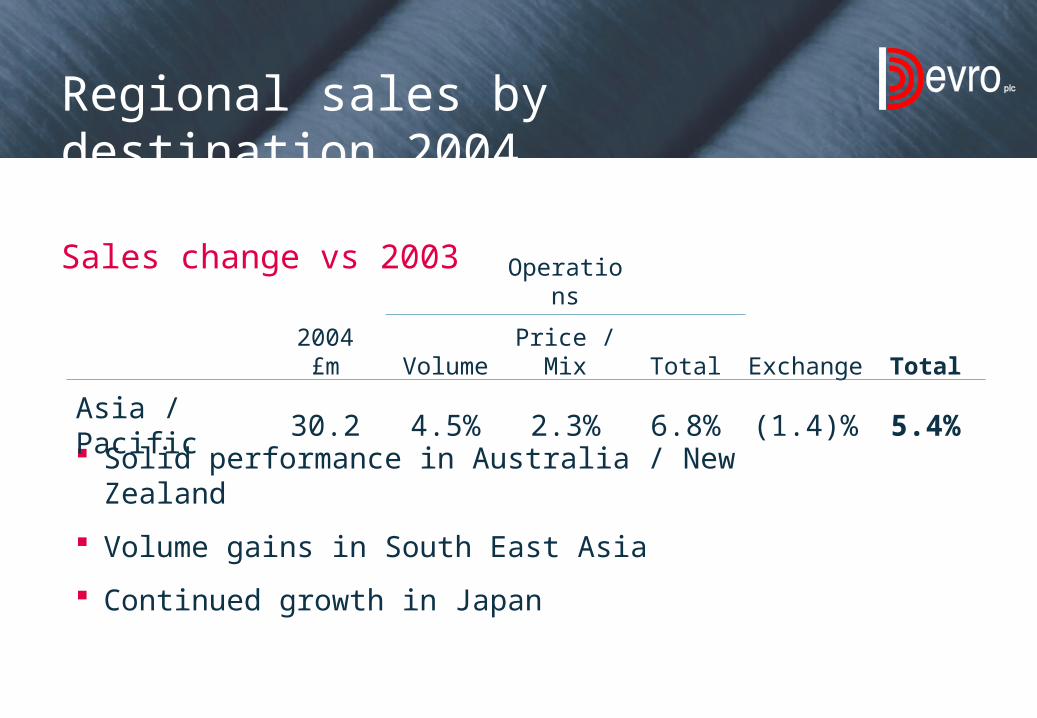
Sales change vs 2003
Solid performance in Australia / New Zealand
Volume gains in South East Asia
Continued growth in Japan
Operations
2004£m Volume Price / Mix Total Exchange Total
Asia / Pacific 30.2 4.5% 2.3% 6.8% (1.4)% 5.4%
Regional sales by destination 2004
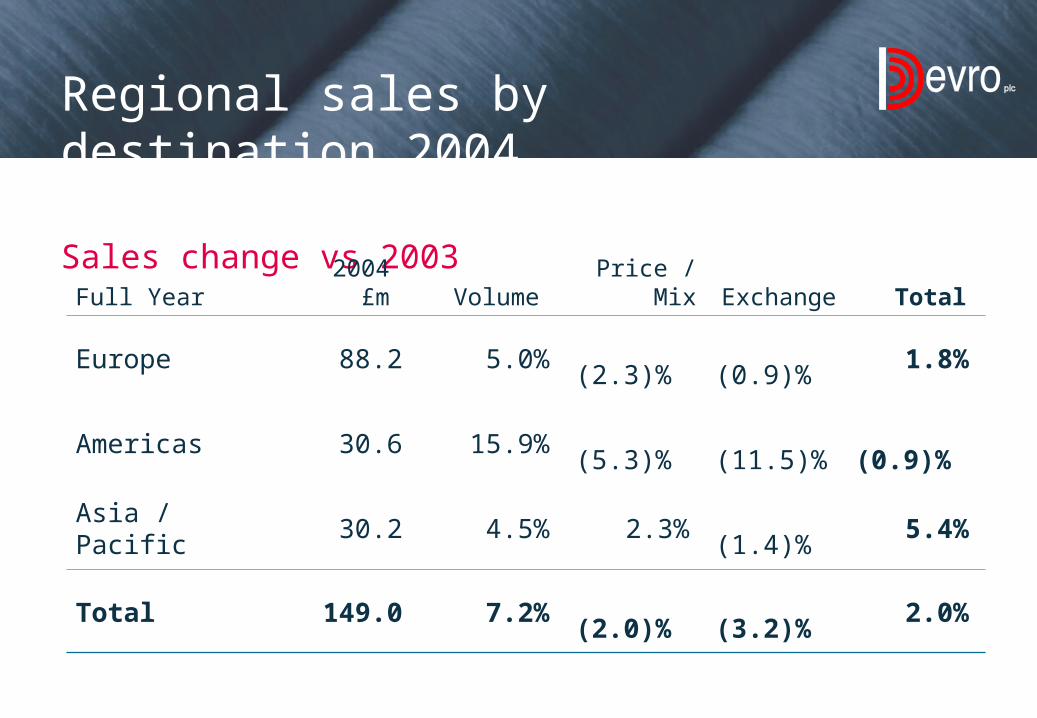
Sales change vs 2003
Full Year2004
£m VolumePrice /
Mix Exchange Total
Europe 88.2 5.0% (2.3)%(0.9)%
1.8%
Americas 30.6 15.9% (5.3)%(11.5)%
(0.9)%
Asia / Pacific 30.2 4.5% 2.3%(1.4)%
5.4%
Total 149.0 7.2% (2.0)%(3.2)%
2.0%
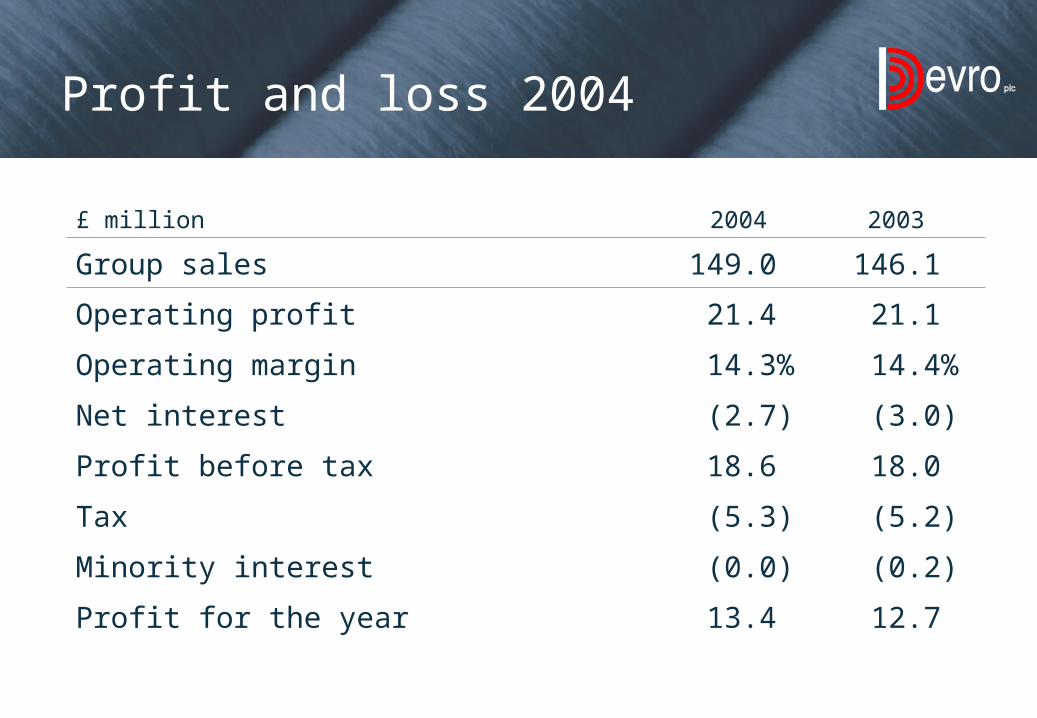
Profit and loss 2004
£ million 2004 2003
Group sales 149.0 146.1
Operating profit 21.4 21.1
Operating margin 14.3% 14.4%
Net interest (2.7) (3.0)
Profit before tax 18.6 18.0
Tax (5.3) (5.2)
Minority interest (0.0) (0.2)
Profit for the year 13.4 12.7
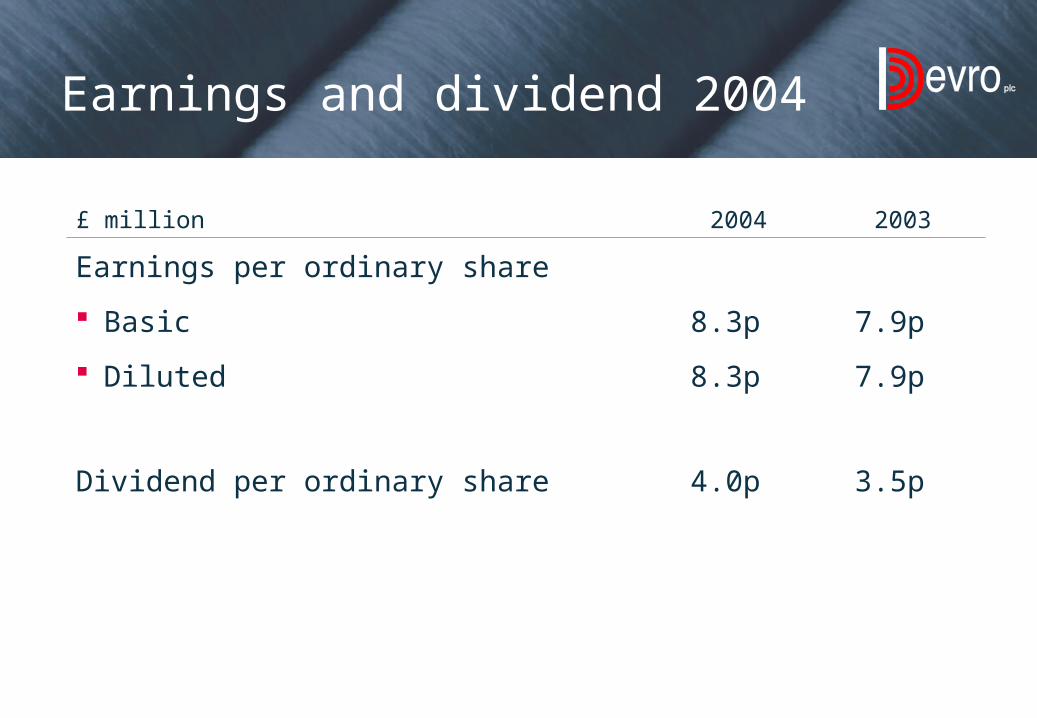
Earnings and dividend 2004
£ million 2004 2003
Earnings per ordinary share
Basic 8.3p 7.9p
Diluted 8.3p 7.9p
Dividend per ordinary share 4.0p 3.5p
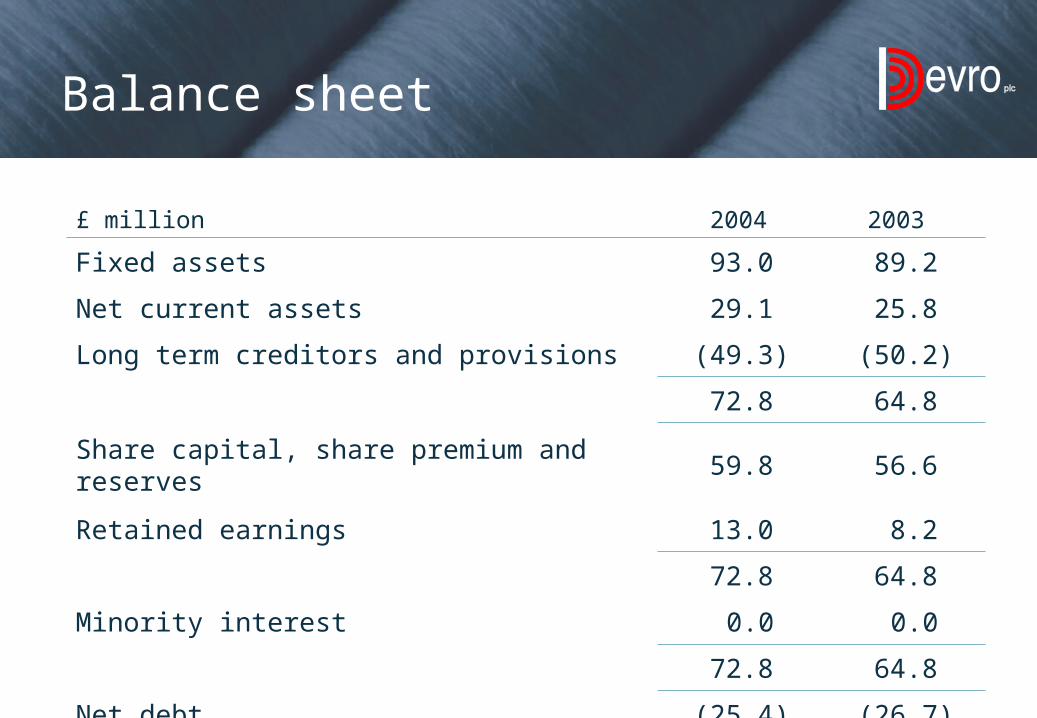
Balance sheet
£ million 2004 2003
Fixed assets 93.0 89.2
Net current assets 29.1 25.8
Long term creditors and provisions (49.3) (50.2)
72.8 64.8
Share capital, share premium and reserves 59.8 56.6
Retained earnings 13.0 8.2
72.8 64.8
Minority interest 0.0 0.0
72.8 64.8
Net debt (25.4) (26.7)
Net gearing 34.9% 41.2%
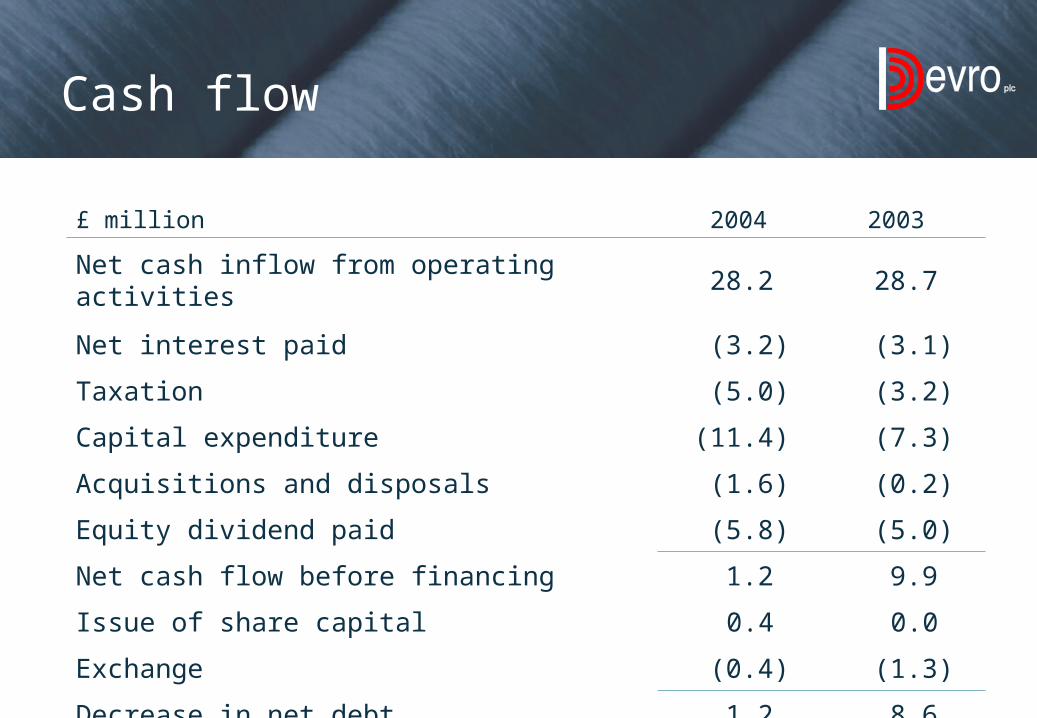
Cash flow
£ million 2004 2003
Net cash inflow from operating activities 28.2 28.7
Net interest paid (3.2) (3.1)
Taxation (5.0) (3.2)
Capital expenditure (11.4) (7.3)
Acquisitions and disposals (1.6) (0.2)
Equity dividend paid (5.8) (5.0)
Net cash flow before financing 1.2 9.9
Issue of share capital 0.4 0.0
Exchange (0.4) (1.3)
Decrease in net debt 1.2 8.6
Interest cover 7.8 7.0

Outlook
New products
2005 trends
Positive outlook