Embed Size (px)
Citation preview
Post-war growth, productivity convergence
and reconstruction
A theoretical and empirical investigation
Werner Smolny
University of Konstanz, Germany
Revision June 1999
Abstract:
In this paper, it is shown that aggregate cross-country analyses of the growth
process of the industrial countries should take reconstruction e�ects into ac-
count. The enormous growth rates in many European countries and in Japan
in the �fties which often appear as outliers in aggregate analyses of productiv-
ity convergence can be understood as a catching-up with respect to the past.
Neoclassical capital deepening combined with arguments from growth models
relying on the stock of knowledge, knowledge spillovers and technological di�u-
sion as the source of economic growth can explain the fast reconstruction after
the war, without referring to country-speci�c growth factors.
Keywords: Endogenous growth, convergence, reconstruction.
JEL No.: N10, O47, O57
Address: University of Konstanz, D 139, D-78457 Konstanz
Tel.: (49) 7531 88 4326, Fax: (49) 7531 88 3120
e-mail: [email protected]
I would like to thank the Editorial Board and a referee of the Bulletin for helpful
comments on an earlier version of this paper.
Contents
1 Introduction 1
2 Economic growth: A long-run perspective 2
3 The early post-war period: Reconstruction 6
4 Productivity convergence 1950-1988 12
5 Economic growth in the �fties 14
6 Conclusions 20
References 21
List of Figures
1 Economic growth in Germany and the United States . . . . . . . 4
2 Catching-up with respect to the United States . . . . . . . . . . 5
3 Reconstruction growth 1947-1950 . . . . . . . . . . . . . . . . . . 8
4 Annual reconstruction growth . . . . . . . . . . . . . . . . . . . . 9
5 Labour productivity growth in the �fties . . . . . . . . . . . . . . 15
List of Tables
1 Reconstruction growth 1947-1950 . . . . . . . . . . . . . . . . . . 10
2 Labour productivity convergence 1950-1988 . . . . . . . . . . . . 14
3 Labour productivity growth in the �fties . . . . . . . . . . . . . . 17
4 Labour productivity growth since the sixties . . . . . . . . . . . . 19
1 Introduction
The recent development of endogenous growth theory has renewed the inter-
est into the determinants of productivity growth in the industrialized countries
after World War II. The most outstanding stylized facts of the economic de-
velopment in the post-war period are the extraordinary high growth rates of
output and labour productivity during the �rst quarter-century after the war.
This paper contributes to this discussion with a reassessment of the successful
growth performance of many European countries and Japan during post-war re-
construction. It is argued that most of the \growth miracles" of those countries
after the war can be explained consistently with neoclassical capital deepening,
augmented with arguments from endogenous growth models which place their
emphasis on the stock of knowledge as the primary source of economic growth.
The destruction of productive capacities by the war implied a temporary devi-
ation from the steady state, and a part of the high growth after the war can
be understood as the return to the steady state.1 It is shown that the growth
di�erences in the early post-war period 1947-1950 correspond closely to the
gap between actual production and the technological potential of those coun-
tries, i.e. those countries which were mostly damaged by the war grew fastest
afterwards.
Most of the di�erences of productivity growth in the industrial countries
since the �fties can be explained consistently with growth models relying on
knowledge spillovers, technological di�usion and convergence towards \best
practice" technology.2 However, the empirical analysis in this paper also re-
veals that aggregate cross-country analyses of the growth process should take
reconstruction e�ects into account. It is shown that those countries which grew
fastest during the period 1950-1988 are again those which were mostly dam-
aged during the war and which grew fastests during the early reconstruction
phase 1947-1950. Especially in the �fties, the high growth rates of Japan, Ger-
many, Austria and Italy are outstanding as compared with the other industrial
countries. Of course, \pure" reconstruction was probably responsible only for a
small part of the economic success of those countries, since pre-war productivity
levels were achieved already at the beginning of the �fties. However, the techno-
logical development had not stopped during the war, and the enormous growth
in the early reconstruction phase had created an economic atmosphere with de-
mand increases and high physical and R&D investment which was favourable
to economic growth afterwards.
The empirical results in the paper reveal that the standard arguments for
productivity convergence since the �fties, i.e. neoclassical capital deepening and
technological di�usion, should be augmented with speci�c arguments which
1For overviews of this discussion, see Dumke (1990), Eichengreen (1995a) and Lindlar
(1997).2See e.g. Abramovitz (1986,1990), Dowrick and Nguyen (1989) and Nelson and Wright
(1992).
1
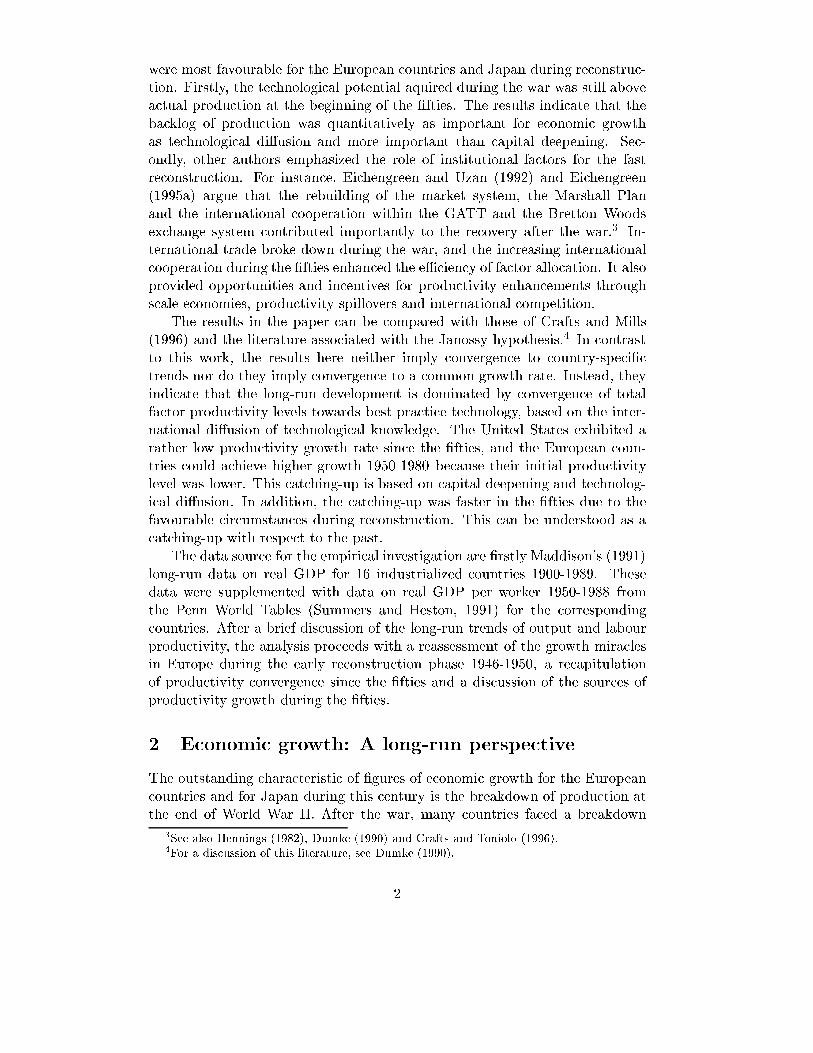
were most favourable for the European countries and Japan during reconstruc-
tion. Firstly, the technological potential aquired during the war was still above
actual production at the beginning of the �fties. The results indicate that the
backlog of production was quantitatively as important for economic growth
as technological di�usion and more important than capital deepening. Sec-
ondly, other authors emphasized the role of institutional factors for the fast
reconstruction. For instance, Eichengreen and Uzan (1992) and Eichengreen
(1995a) argue that the rebuilding of the market system, the Marshall Plan
and the international cooperation within the GATT and the Bretton Woods
exchange system contributed importantly to the recovery after the war.3 In-
ternational trade broke down during the war, and the increasing international
cooperation during the �fties enhanced the eÆciency of factor allocation. It also
provided opportunities and incentives for productivity enhancements through
scale economies, productivity spillovers and international competition.
The results in the paper can be compared with those of Crafts and Mills
(1996) and the literature associated with the Janossy hypothesis.4 In contrast
to this work, the results here neither imply convergence to country-speci�c
trends nor do they imply convergence to a common growth rate. Instead, they
indicate that the long-run development is dominated by convergence of total
factor productivity levels towards best practice technology, based on the inter-
national di�usion of technological knowledge. The United States exhibited a
rather low productivity growth rate since the �fties, and the European coun-
tries could achieve higher growth 1950-1980 because their initial productivity
level was lower. This catching-up is based on capital deepening and technolog-
ical di�usion. In addition, the catching-up was faster in the �fties due to the
favourable circumstances during reconstruction. This can be understood as a
catching-up with respect to the past.
The data source for the empirical investigation are �rstly Maddison's (1991)
long-run data on real GDP for 16 industrialized countries 1900-1989. These
data were supplemented with data on real GDP per worker 1950-1988 from
the Penn World Tables (Summers and Heston, 1991) for the corresponding
countries. After a brief discussion of the long-run trends of output and labour
productivity, the analysis proceeds with a reassessment of the growth miracles
in Europe during the early reconstruction phase 1946-1950, a recapitulation
of productivity convergence since the �fties and a discussion of the sources of
productivity growth during the �fties.
2 Economic growth: A long-run perspective
The outstanding characteristic of �gures of economic growth for the European
countries and for Japan during this century is the breakdown of production at
the end of World War II. After the war, many countries faced a breakdown
3See also Hennings (1982), Dumke (1990) and Crafts and Toniolo (1996).4For a discussion of this literature, see Dumke (1990).
2
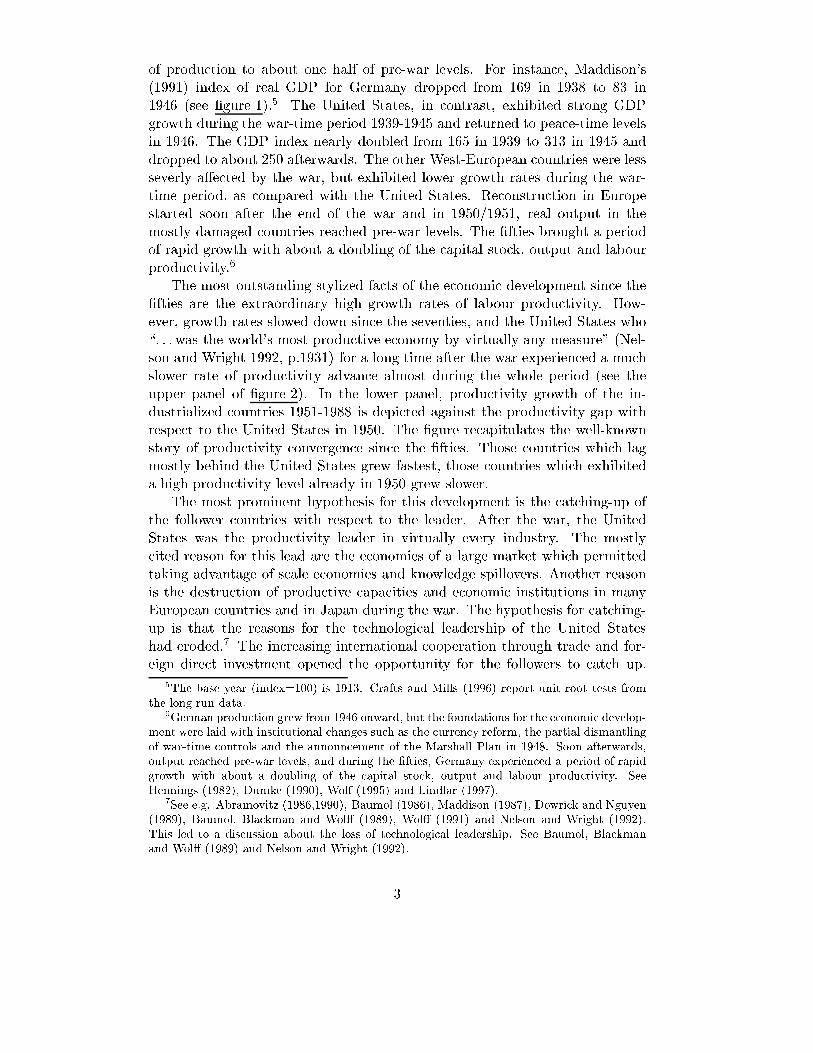
of production to about one half of pre-war levels. For instance, Maddison's
(1991) index of real GDP for Germany dropped from 169 in 1938 to 83 in
1946 (see �gure 1).5 The United States, in contrast, exhibited strong GDP
growth during the war-time period 1939-1945 and returned to peace-time levels
in 1946. The GDP index nearly doubled from 165 in 1939 to 313 in 1945 and
dropped to about 250 afterwards. The other West-European countries were less
severly a�ected by the war, but exhibited lower growth rates during the war-
time period, as compared with the United States. Reconstruction in Europe
started soon after the end of the war and in 1950/1951, real output in the
mostly damaged countries reached pre-war levels. The �fties brought a period
of rapid growth with about a doubling of the capital stock, output and labour
productivity.6
The most outstanding stylized facts of the economic development since the
�fties are the extraordinary high growth rates of labour productivity. How-
ever, growth rates slowed down since the seventies, and the United States who
\. . . was the world's most productive economy by virtually any measure" (Nel-
son and Wright 1992, p.1931) for a long time after the war experienced a much
slower rate of productivity advance almost during the whole period (see the
upper panel of �gure 2). In the lower panel, productivity growth of the in-
dustrialized countries 1951-1988 is depicted against the productivity gap with
respect to the United States in 1950. The �gure recapitulates the well-known
story of productivity convergence since the �fties. Those countries which lag
mostly behind the United States grew fastest, those countries which exhibited
a high productivity level already in 1950 grew slower.
The most prominent hypothesis for this development is the catching-up of
the follower countries with respect to the leader. After the war, the United
States was the productivity leader in virtually every industry. The mostly
cited reason for this lead are the economies of a large market which permitted
taking advantage of scale economies and knowledge spillovers. Another reason
is the destruction of productive capacities and economic institutions in many
European countries and in Japan during the war. The hypothesis for catching-
up is that the reasons for the technological leadership of the United States
had eroded.7 The increasing international cooperation through trade and for-
eign direct investment opened the opportunity for the followers to catch up.
5The base year (index=100) is 1913. Crafts and Mills (1996) report unit root tests from
the long-run data.6German production grew from 1946 onward, but the foundations for the economic develop-
ment were laid with institutional changes such as the currency reform, the partial dismantling
of war-time controls and the announcement of the Marshall Plan in 1948. Soon afterwards,
output reached pre-war levels, and during the �fties, Germany experienced a period of rapid
growth with about a doubling of the capital stock, output and labour productivity. See
Hennings (1982), Dumke (1990), Wolf (1995) and Lindlar (1997).7See e.g. Abramovitz (1986,1990), Baumol (1986), Maddison (1987), Dowrick and Nguyen
(1989), Baumol, Blackman and Wol� (1989), Wol� (1991) and Nelson and Wright (1992).
This led to a discussion about the loss of technological leadership. See Baumol, Blackman
and Wol� (1989) and Nelson and Wright (1992).
3
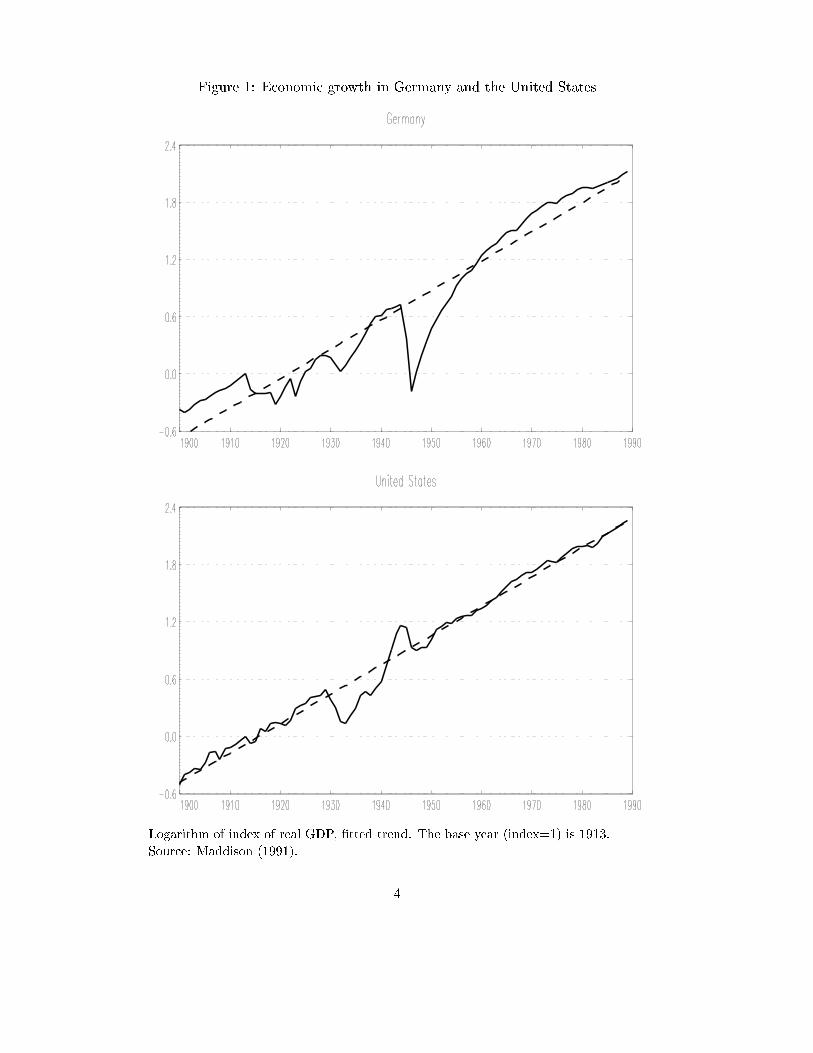
Figure 1: Economic growth in Germany and the United States
Logarithm of index of real GDP, �tted trend. The base year (index=1) is 1913.
Source: Maddison (1991).
4
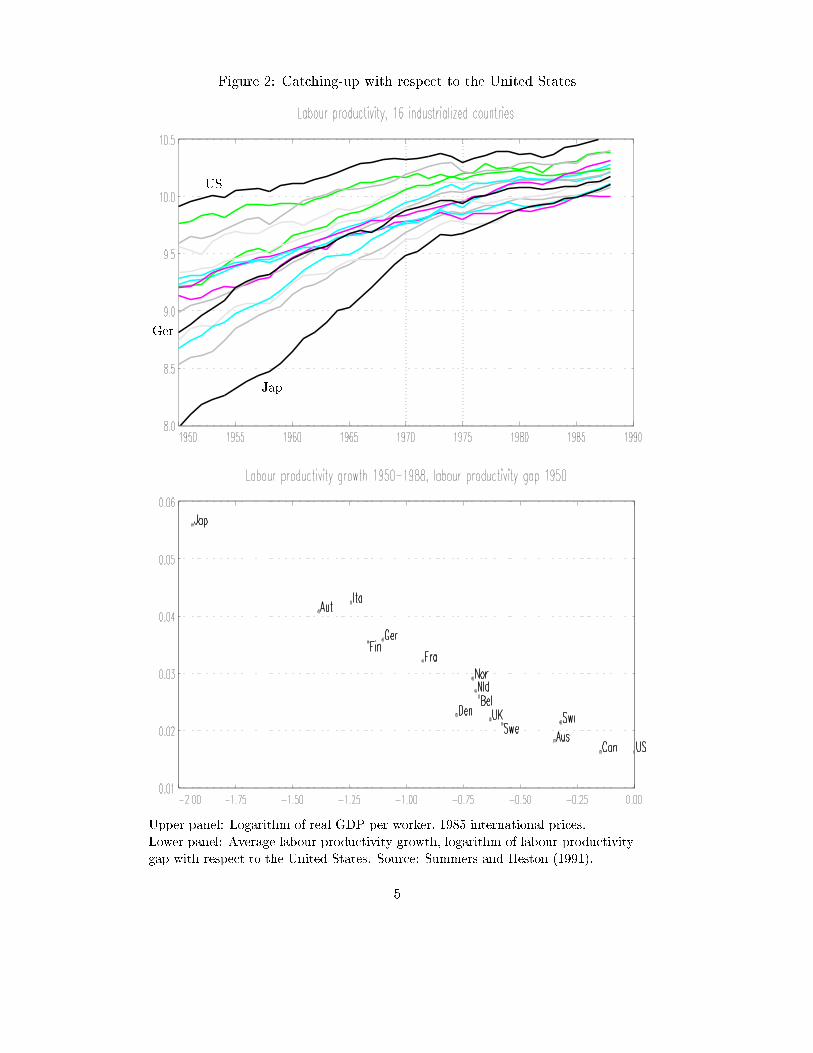
Figure 2: Catching-up with respect to the United States
Upper panel: Logarithm of real GDP per worker, 1985 international prices.
Lower panel: Average labour productivity growth, logarithm of labour productivity
gap with respect to the United States. Source: Summers and Heston (1991).
US
Ger
Jap
5
The waning of opportunities then o�ers a partial explanation for the observed
slowdown of productivity growth since the seventies in the follower countries.
A theoretical background for the catching-up hypothesis is found both in
the neoclassical growth model and in endogenous growth models. In neoclas-
sical models, a country's labour productivity growth rate tends to be inversely
related to its starting level due to diminishing returns of reproducible capital.8
Many endogenous growth models, in contrast, focus on di�usion of technol-
ogy through knowledge spillovers and vanishing di�erences of total factor pro-
ductivity levels.9 A related argument relevant to the convergence debate is
reconstruction growth.10
After the war, a large gap existed between actual output and the techno-
logical potential of many European countries and in Japan. Part of the high
growth of those countries in the early post-war period can be attributed to the
closing of this gap. In the following analysis, it is shown that cross-country
analyses of productivity growth and convergence in the post-war period should
take these reconstruction e�ects into account. Reconstruction e�ects are �rstly
explained within the neoclassical growth framework. The destruction of pro-
ductive capacities by the war implied a temporary deviation from the steady
state, and a part of the growth miracles of the European countries and Japan
after the war was simply return to the steady state. This kind of reconstruction
was probably responsible only for a small part of the economic success of those
countries, since pre-war output levels were achieved already in 1950/1951. How-
ever, the technological development had not stopped during the war. In this
paper, it is argued that the enormous growth in the early reconstruction phase
was favourable to economic growth afterwards. These reconstruction e�ects
can explain the sucessful growth performance of e.g. Germany and Japan in
the �fties which often appear as outliers in cross-county analyses of the growth
process for the post-war period.11
3 The early post-war period: Reconstruction
During the war and immediately afterwards, many countries (Germany, Japan,
Italy, Austria, France and the Netherlands) faced a breakdown of production to
about one half of pre-war levels. The bulk of war-time destruction took place
in di�erent years for those countries. France and the Netherlands experienced
output reductions since 1940, Japan and Italy exhibited output growth until
1942/1943 and in Germany and Austria, output growth lasted until 1944. The
8See Solow (1956), Denison (1967), Maddison (1987) and Barro (1991).9See e.g. Dowrick and Nguyen (1989), Grossman and Helpman (1991) and Coe and Help-
man (1995).10Overviews of the literature are given by the collections of Boltho (1982), Eichengreen
(1995), van Ark and Crafts (1996) and Crafts and Toniolo (1996).11See Denison (1967), Maddison (1987) and Dowrick and Nguyen (1989). Note that the
survey of Fagerberg (1994) hardly mentions reconstruction growth as a source of catching-up.
6
United States, in contrast, exhibited strong GDP growth during the war-time
period 1939-1945. Australia and Canada were hardly a�ected by the war, and
the other West-European countries in the sample (Belgium, Denmark, Finland,
Norway, Sweden, Switzerland and the United Kingdom) were less severly af-
fected by the war, but exhibited lower growth rates during the war-time period
as compared with the United States and Canada.
Reconstruction started soon after the end of the war 1945/1946, but in
those years, the di�erences between the countries were still large. Especially in
the Netherlands, in France and in Italy, strong reconstruction growth occurred
already in 1946. Germany, in contrast, experienced the strongest breakdown
of production in this year, and the United States exhibited a strong output
reduction due to the return to peace-time levels. In the upper panel of �gure 3,
average reconstruction growth during the years 1947-1950 is depicted against
the war-time gap 1946 as compared with 1938.12 The remarkable feature of
this �gure is the strong correlation of reconstruction growth with the extent of
war-time destruction, i.e. those countries which were mostly damaged by the
war exhibited the strongest growth afterwards:
{ Germany and Austria who started with output levels of about one half of
pre-war levels in 1946 exhibited the strongest output growth of above 15
percent during the early reconstruction phase.
{ Italy, France and the Netherlands who experienced strong reconstruction
growth already in 1946 grew at a rate of 9 percent 1947-1950.
{ The other European countries in the sample which were less severely
damaged during the war and had achieved pre-war output levels already
in 1946 exhibited an output growth of 4-6 percent.
{ The United States and Canada who experienced the strongest increase of
production during the war exhibited low growth rates of only 3 percent.
In the lower panel of �gure 3, the annual growth rates 1947-1950 are depicted
against the war-time gap in t-1 vs. 1938. The �gure reveals that especially in
Germany (marked in the �gure) growth rates slowed down as the war-time gap
reduced. A corresponding result is revealed for most of the other countries (see
�gure 4). The di�erences of the growth rates became smaller as the war-time
gap closed.
In table 1, some estimation results on reconstruction growth are reported.
They �rstly con�rm the strong correlation of reconstruction growth and the
extent of war-time damage. The war-time gap explains more that 80 percent
of the variance of reconstruction growth rates of those countries (version 1).
12Reconstruction growth is de�ned as the average growth rate of real GDP 1947-1950, and
the war-time gap is de�ned as the logarithm of real GDP 1946 as compared with the pre-war
GDP level 1938. The country codes correspond to those of Maddison (1989). Figure 1.1 in
Eichengreen (1995a) depicts a similar result for a slightly di�erent time period.
7
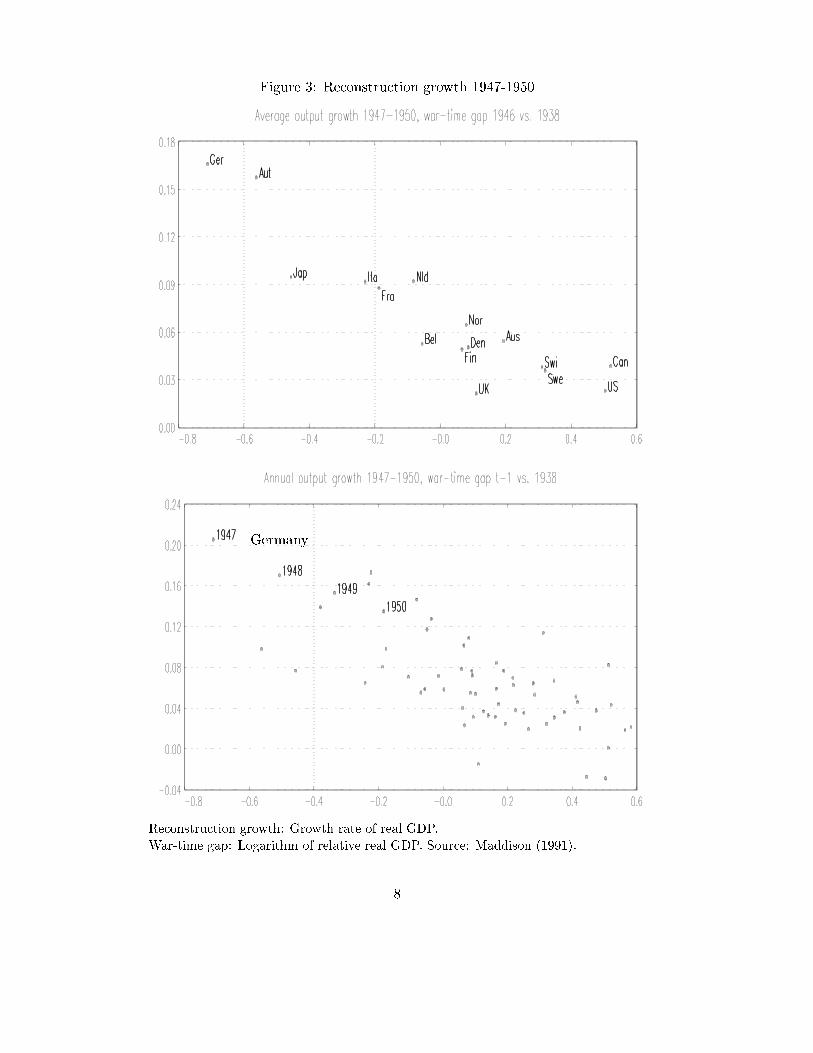
Figure 3: Reconstruction growth 1947-1950
Reconstruction growth: Growth rate of real GDP.
War-time gap: Logarithm of relative real GDP. Source: Maddison (1991).
Germany
8
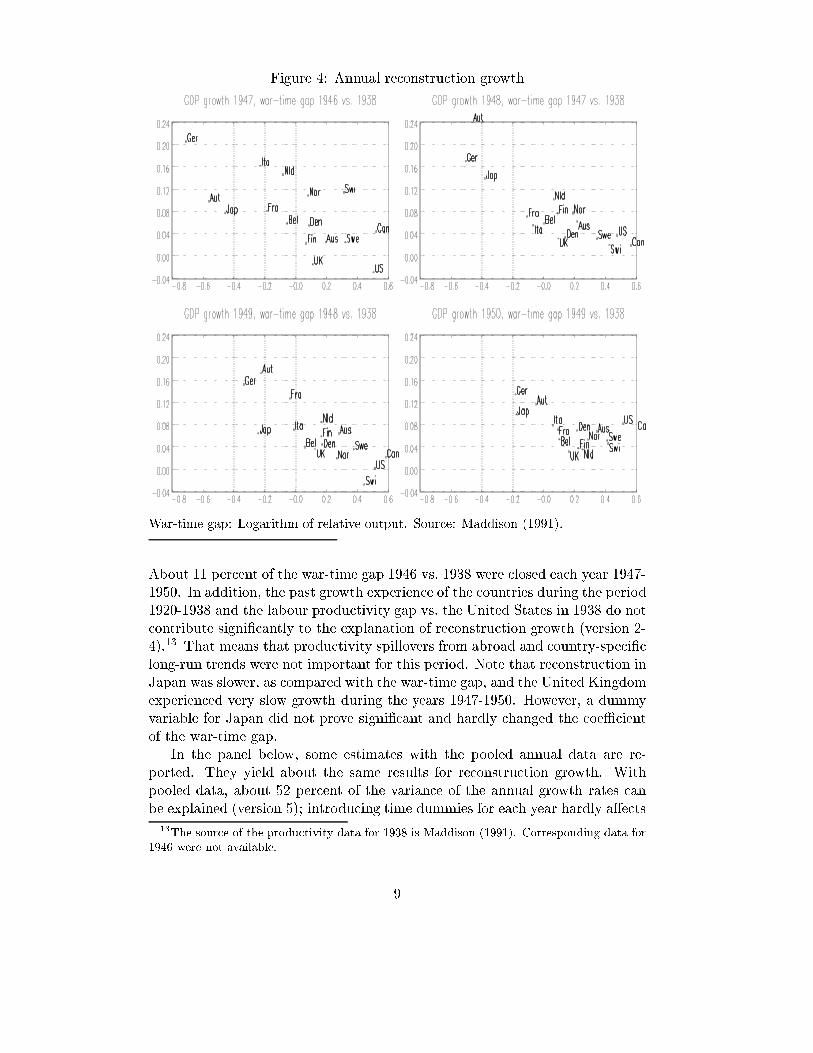
Figure 4: Annual reconstruction growth
War-time gap: Logarithm of relative output. Source: Maddison (1991).
About 11 percent of the war-time gap 1946 vs. 1938 were closed each year 1947-
1950. In addition, the past growth experience of the countries during the period
1920-1938 and the labour productivity gap vs. the United States in 1938 do not
contribute signi�cantly to the explanation of reconstruction growth (version 2-
4).13 That means that productivity spillovers from abroad and country-speci�c
long-run trends were not important for this period. Note that reconstruction in
Japan was slower, as compared with the war-time gap, and the United Kingdom
experienced very slow growth during the years 1947-1950. However, a dummy
variable for Japan did not prove signi�cant and hardly changed the coeÆcient
of the war-time gap.
In the panel below, some estimates with the pooled annual data are re-
ported. They yield about the same results for reconstruction growth. With
pooled data, about 52 percent of the variance of the annual growth rates can
be explained (version 5); introducing time dummies for each year hardly a�ects
13The source of the productivity data for 1938 is Maddison (1991). Corresponding data for
1946 were not available.
9
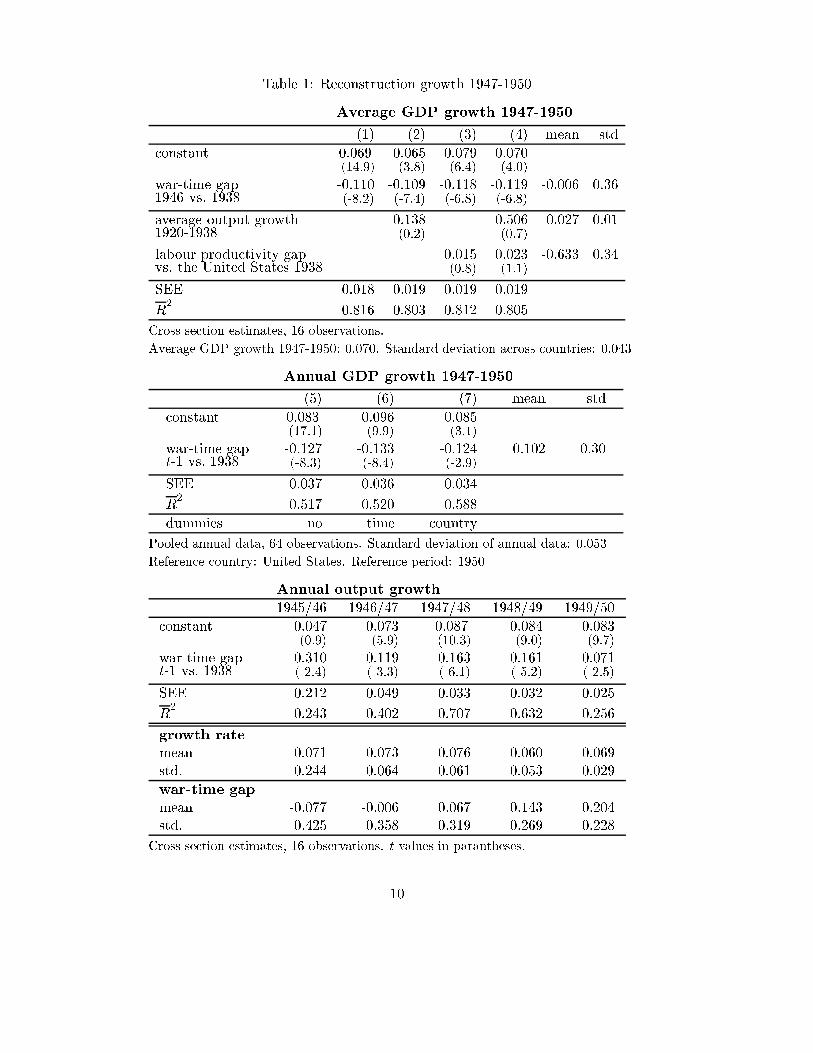
Table 1: Reconstruction growth 1947-1950
Average GDP growth 1947-1950
(1) (2) (3) (4) mean std
constant 0.069(14.9)
0.065(3.8)
0.079(6.4)
0.070(4.0)
war-time gap -0.110(-8.2)
-0.109(-7.4)
-0.118(-6.8)
-0.119(-6.8)
-0.006 0.361946 vs. 1938
average output growth 0.138(0.2)
0.506(0.7)
0.027 0.011920-1938
labour productivity gap 0.015(0.8)
0.023(1.1)
-0.633 0.34vs. the United States 1938
SEE 0.018 0.019 0.019 0.019
R2
0.816 0.803 0.812 0.805
Cross section estimates, 16 observations.
Average GDP growth 1947-1950: 0.070. Standard deviation across countries: 0.043
Annual GDP growth 1947-1950
(5) (6) (7) mean std
constant 0.083(17.1)
0.096(9.9)
0.085(3.1)
war-time gap -0.127(-8.3)
-0.133(-8.4)
-0.124(-2.9)
0.102 0.30t-1 vs. 1938
SEE 0.037 0.036 0.034
R2
0.517 0.520 0.588
dummies no time country
Pooled annual data, 64 observations. Standard deviation of annual data: 0.053
Reference country: United States. Reference period: 1950
Annual output growth
1945/46 1946/47 1947/48 1948/49 1949/50
constant 0.047(0.9)
0.073(5.9)
0.087(10.3)
0.084(9.0)
0.083(9.7)
war-time gap -0.310(-2.4)
-0.119(-3.3)
-0.163(-6.1)
-0.161(-5.2)
-0.071(-2.5)t-1 vs. 1938
SEE 0.212 0.049 0.033 0.032 0.025
R2
0.243 0.402 0.707 0.632 0.256
growth rate
mean 0.071 0.073 0.076 0.060 0.069
std. 0.244 0.064 0.061 0.053 0.029
war-time gap
mean -0.077 -0.006 0.067 0.143 0.204
std. 0.425 0.358 0.319 0.269 0.228
Cross section estimates, 16 observations. t-values in parantheses.
10
the estimates (version 6); introducing country dummies for each country does
not change the adjustment coeÆcient and increases the R2only slighly to about
59 percent (version 7). Finally, in the bottom panel estimates for each year are
reported. They reveal that the average adjustment with respect to the pre-war
level was mostly signi�cant in 1948 and 1949. In 1946, the di�erences between
the countries were large, and for 1950, the coeÆcient of the war-time gap is
much smaller. In addition, the standard deviation of the gap became smaller
(from 0.43 in 1945 to 0.21 in 1950) and the standard deviation of the growth
rates became smaller (from 0.24 in 1946 to 0.03 in 1950) as the output gap
closed (see also �gure 4).
These empirical results reveal the fast recovery of output to pre-war levels
in the mostly damaged European countries and in Japan. At the beginning of
the �fties, those countries had achieved at least the pre-war level of production.
The estimation results also show that the growth miracles of those countries in
the early post-war period need not be explained with country-speci�c growth
factors, but rather can be seen as the general development after the breakdown
during the war.14 Most of the di�erences of reconstruction growth correspond
closely to the extent of war-time damage. Even the timing of reconstruction
growth rates can to a large extent be explained within the neoclassical growth
framework as the return to the steady state level of production and within
growth models relying on the stock of knowledge as the recovery of the tech-
nological potential of those countries, i.e. as a \catching-up with respect to the
past":
{ First, physical capital was not destroyed to the extent expected by ob-
servers in the early post-war period. For instance, Krengel's (1958) esti-
mates for Germany imply that war-time investments exceeded the extent
of war-time damage.
{ Second, the help from the Marshall Plan contributed to the fast rebuilding
of the capital stock. This argument was emphasized by Eichengreen and
Uzan (1992).
{ Third, the technological potential which was achieved during the war in
Europe and Japan was not destroyed by the war. Note that the level
of production and investment during the war exceeded pre-war levels
in many countries. In Germany, for instance, annual war-time invest-
ments in the investment goods industry were more than twice the value
of 1936/37.15
{ Fourth, the breakdown of international trade during the war enhanced
the eÆciency gains from rising import and export shares after the war.
14For instance, Hennings (1982) discusses the importance of the in ow of quali�ed workers
from the eastern area and institutional changes such as the monetary reform for reconstruction
in Germany. See also Wolf (1995).15See Krengel (1958).
11
{ Finally, those countries were endowed with a well educated work force
and quickly rebuild (restored) the neccessary institutions for economic and
technological advancement. This argument is emphasized by Abramowitz
(1986,1990), who coined the term of the \social capability" for catching-
up.
4 Productivity convergence 1950-1988
In the early post-war period, the United States was the productivity leader in
virtually every industry. In 1950, the level of GDP per worker in the United
States was about twice as high as the productivity level of the major European
countries, three times as high as in Germany, Austria and Italy, and seven times
as high as in Japan (see �gure 2 above). The following reasons are cited for
this lead (Nelson and Wright, 1992):
{ The availability and the techniques of exploiting natural resources in the
United States.
{ The destruction of a large part of productive capacities and economic
institutions in many European countries and in Japan during the war.
{ The economies of a large market which permitted taking advantage of
scale economies and knowledge spillovers.
The most prominent hypothesis for the catching-up of the follower countries
after the war is that the reasons for the technological leadership of the United
States had eroded. Trade in natural resources expanded and countries became
less dependent on local materials, war-time deconstruction ceased to be impor-
tant, and a large market for industrial products also emerged in Europe.
Productivity convergence can �rstly be explained within the neoclassical
growth framework.16 In neoclassical models, labour productivity growth tends
to be inversely related to the level of productivity due to diminishing returns
to reproducible capital. Catching-up is simply convergence of capital-labour
ratios. In addition, the destruction of productive capacities by the war implied
a temporary deviation from the steady state, and a part of the high growth
after the war can be explained as the return to the steady state. However, pre-
war output levels were achieved already in 1950/1951, and standard growth
accounting exercises within the neoclassical model leave a large residual not
accounted for by the growth of inputs.17
Models of technological di�usion, in contrast, focus on knowledge spillovers
between �rms and scale economies at the aggregate level to explain productiv-
16See e.g. Denison (1967), Maddison (1987), Barro (1991), Barro and Sala-i-Martin
(1992,1995) and Mankiw, Romer and Weil (1992).17See e.g. Solow (1957), Denison (1967), Maddison (1987) and Dowrick and Nguyen (1989).
12
ity convergence.18 Those models �t almost perfectly into the picture of loosing
leadership of the United States' economy since the �fties. During that period,
markets and business had become more global, and national technology due to
geographical proximity ceased to be important. Mass production techniques
became widespread, a large market of industrial products also emerged in Eu-
rope, and the increasing international trade implied that \. . . eÆcient companies
producing attractive products increasingly faced a world market rather than a
national market" (Nelson and Wright 1992, p. 1957). This development was
accompanied by a large increase of foreign direct investment as for instance Eu-
ropean branches of United States' �rms. Protectionism became less practicable
than before, and \best practice" technology became available for everybody.
In table 2, some estimation results on productivity convergence are re-
ported. They �rstly con�rm the importance of catching-up for productivity
growth. The productivity gap with respect to the United States in 1950 ex-
plains more than 90 percent of the variance of productivity growth rates 1951-
1988 (version 1) and 1951-1973 (version 4). The estimated coeÆcient in version
(1) corresponds to an annual rate of unconditional convergence obtained within
the neoclassical growth framework of about 4 percent.19 Notice the rather slow
adjustment of productivity levels with respect to the United States, as com-
pared with the very fast adjustment of output to pre-war levels during the
early reconstruction phase.20
These results con�rm that productivity catching-up with respect to the
United States should be an important ingredient of the explanation of produc-
tivity growth in the post-war period. However, the productivity data also reveal
that those countries which grew fastest during the period 1951-1988 (Japan,
Italy, Austria and Germany) are also those which were mostly damaged dur-
ing the war and which grew fastest during the early reconstruction phase. In
contrast, the lowest growth rates occurred in the United States, Canada and
Australia, i.e. those countries which were not or hardly damaged during the
war. In addition, the productivity gap with respect to the United States was to
a large extent caused by war-time destruction.21 Finally, Germany and Japan
18See Grossman and Helpman (1991), Fagerberg (1994), Coe and Helpman (1995) and Barro
and Sala-i-Martin (1995). The work on endogenous growth through knowledge spillovers was
inspired by the articles of Romer (1986) and Lucas (1988).19The implied annual rate of convergence � can be calculated from �c � t = 1� e
���t, where
c is the estimated coeÆcient and t is the number of time periods. See Mankiw, Romer and
Weil (1992), pp. 423-25.20Results for sub-periods revealed that most of the catching-up occurred until 1980. For the
eighties, the productivity gap hardly contributed to the explanation of productivity growth.
This corresponds to the about constant productivity gap in this period. In 1980, the other
industrial countries had achieved about 75 percent of the productivity level of the United
States. See also Smolny (1999).21For instance, Germany and Japan exhibited a lower productivity level 1950 as compared
with 1938 and exhibited large output growth until 1943/1944. The highest war level of output
in Germany, Austria and Japan was about 20 percent above the pre-war level 1938. See
Maddison (1991).
13
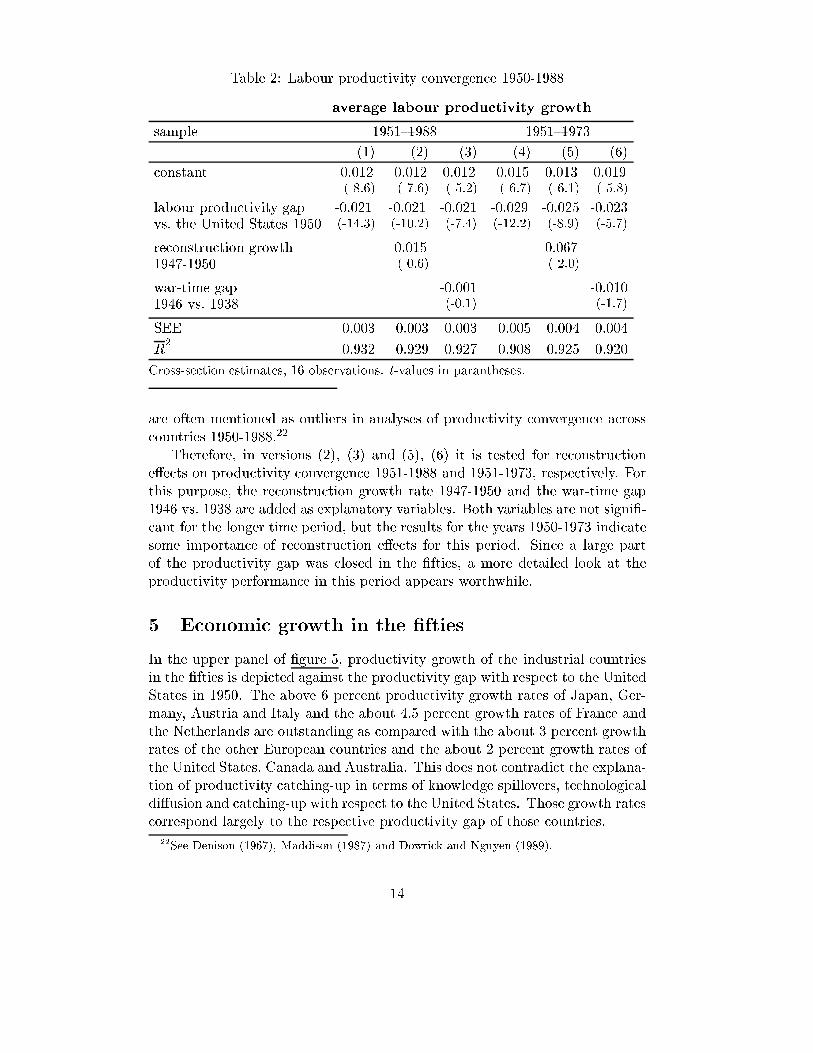
Table 2: Labour productivity convergence 1950-1988
average labour productivity growth
sample 1951{1988 1951{1973
(1) (2) (3) (4) (5) (6)
constant 0.012( 8.6)
0.012( 7.6)
0.012( 5.2)
0.015( 6.7)
0.013( 6.1)
0.019( 5.8)
labour productivity gap -0.021(-14.3)
-0.021(-10.2)
-0.021(-7.4)
-0.029(-12.2)
-0.025(-8.9)
-0.023(-5.7)vs. the United States 1950
reconstruction growth 0.015( 0.6)
0.067( 2.0)1947-1950
war-time gap -0.001(-0.1)
-0.010(-1.7)1946 vs. 1938
SEE 0.003 0.003 0.003 0.005 0.004 0.004
R2
0.932 0.929 0.927 0.908 0.925 0.920
Cross-section estimates, 16 observations. t-values in parantheses.
are often mentioned as outliers in analyses of productivity convergence across
countries 1950-1988.22
Therefore, in versions (2), (3) and (5), (6) it is tested for reconstruction
e�ects on productivity convergence 1951-1988 and 1951-1973, respectively. For
this purpose, the reconstruction growth rate 1947-1950 and the war-time gap
1946 vs. 1938 are added as explanatory variables. Both variables are not signi�-
cant for the longer time period, but the results for the years 1950-1973 indicate
some importance of reconstruction e�ects for this period. Since a large part
of the productivity gap was closed in the �fties, a more detailed look at the
productivity performance in this period appears worthwhile.
5 Economic growth in the �fties
In the upper panel of �gure 5, productivity growth of the industrial countries
in the �fties is depicted against the productivity gap with respect to the United
States in 1950. The above 6 percent productivity growth rates of Japan, Ger-
many, Austria and Italy and the about 4.5 percent growth rates of France and
the Netherlands are outstanding as compared with the about 3 percent growth
rates of the other European countries and the about 2 percent growth rates of
the United States, Canada and Australia. This does not contradict the explana-
tion of productivity catching-up in terms of knowledge spillovers, technological
di�usion and catching-up with respect to the United States. Those growth rates
correspond largely to the respective productivity gap of those countries.
22See Denison (1967), Maddison (1987) and Dowrick and Nguyen (1989).
14
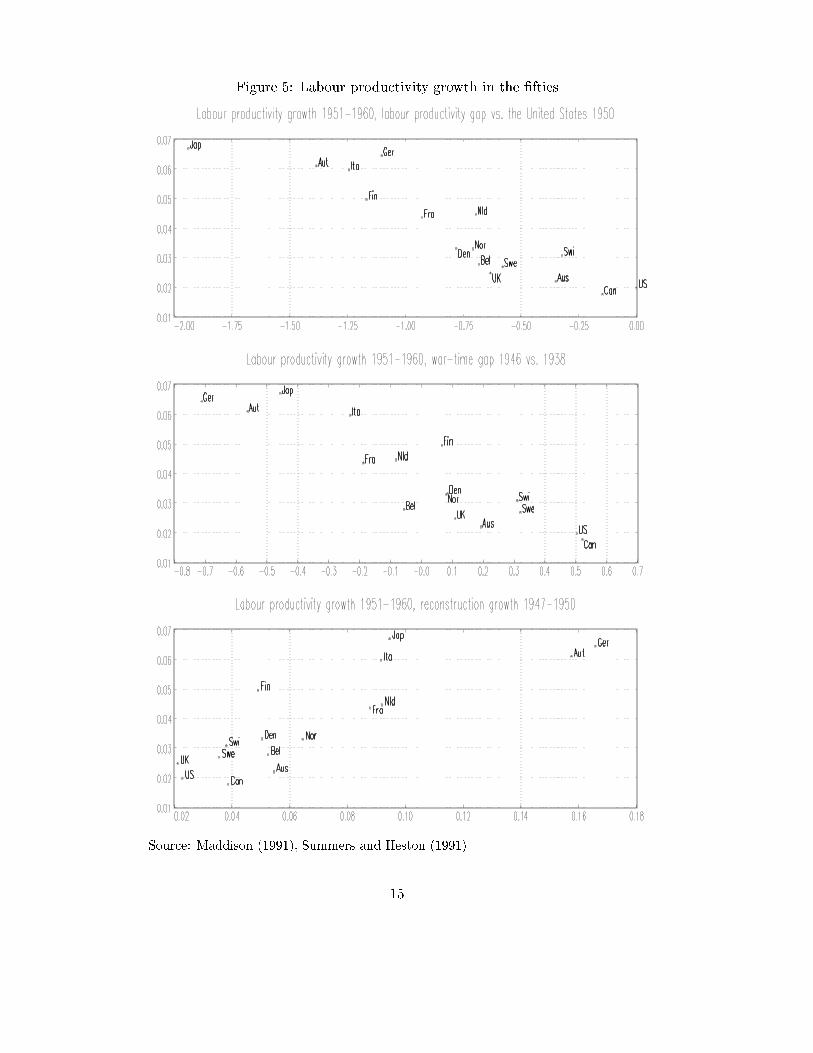
Figure 5: Labour productivity growth in the �fties
Source: Maddison (1991), Summers and Heston (1991)
15
However, the high growth rates in the �fties also correspond to the extent of
war-time destruction and the high growth rates during the early reconstruction
phase (see the lower panels of �gure 5). In Germany, Austria and Japan, the
level of GDP 1946 was about one half of the pre-war level 1938. Correspond-
ingly, output growth 1947-1950 in Germany and Austria exceeded 15 percent
and was about 9 percent in Japan, Italy, France and the Netherlands. The other
European countries grew with rates of about 4 to 6 percent, and the United
States exhibited a low growth rate of about 2 percent.
In table 3, some estimates for the sources of productivity growth in the
�fties are reported. In version (1), the productivity gap with respect to the
United States is the only explanatory variable. The implied annual rate of
convergence in the �fties is about 3.5 percent. In version (2) and (3), only the
war-time gap of relative output 1946 vs. 1938 or the average growth rate during
the early reconstruction phase 1947-1950 are included. The results reveal that
the catching-up with respect to the past exhibits about the same explanatory
power for productivity growth as the productivity catching-up with respect to
the United States. In both cases, about 80 percent of the cross-country variance
of growth rates are explained. Productivity growth in the �fties was the higher,
the lower the productivity level as compared with the United States, the lower
the output level 1946 as compared with 1938, and the higher the growth rate
in the early reconstruction phase.
In versions (4) and (5), the results of the combined model are reported.23
They reveal that reconstruction e�ects remain signi�cant even after controlling
for the productivity gap with respect to the United States. The productivity
gap, the war-time output gap and the growth rate in the early post-war period
exhibit a signi�cant and quantitatively large e�ect on productivity growth in
the �fties. The estimates imply that
{ the catching-up with respect to the United States explains about 4 per-
centage points of the seven percent growth rate of Japan24 and about 2.5
percentage points of the 6 percent growth rates of Germany, Austria and
Italy,
{ the catching-up with respect to the past explains about 2 percentage
points of the about 6 percent growth rates of Germany, Austria and Japan,
{ productivity convergence and reconstruction e�ects together explain about
90 percent of the variance of productivity growth rates in the �fties,
{ the estimated annual rate of convergence is reduced by about 1 percentage
point by the inclusion of reconstruction e�ects.
23Due to multicollinearity, it was not possible to include both, the war-time gap and the
reconstruction growth rate. See �gure 3 and table 1 above.24That means, the outlier is not the high growth of Japan since the �fties, but rather the
slow start of reconstruction after the war. See �gures 3 and 4.
16
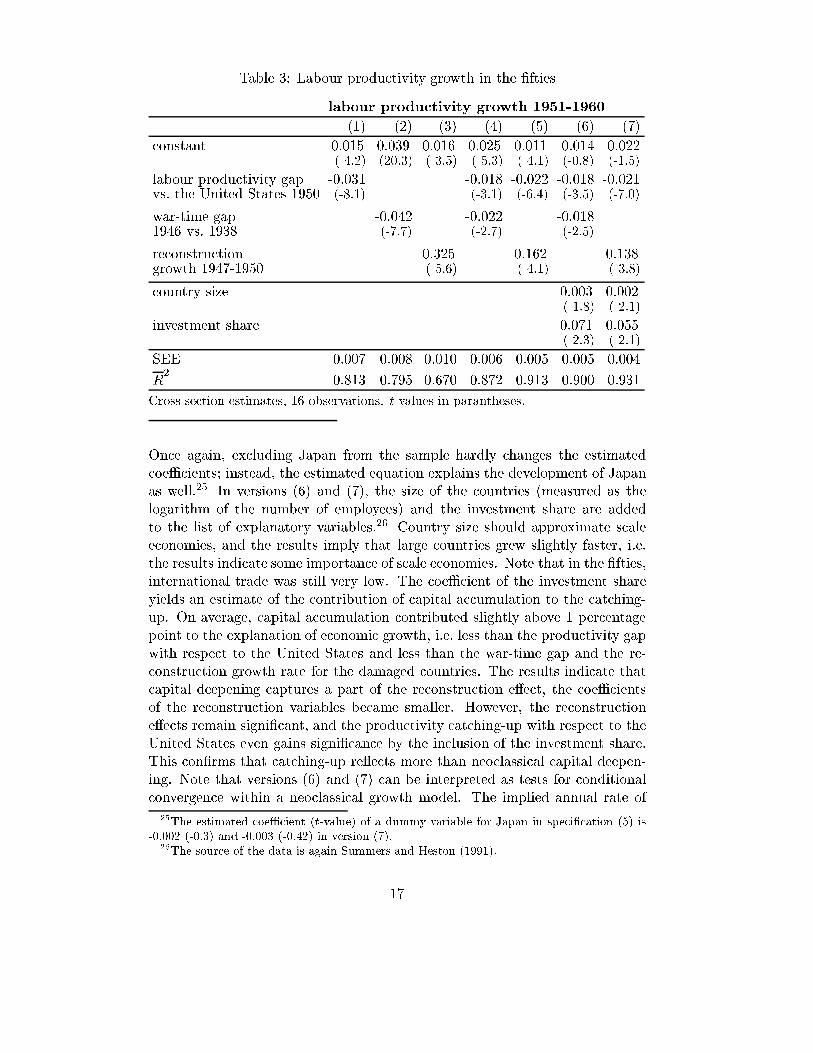
Table 3: Labour productivity growth in the �fties
labour productivity growth 1951-1960
(1) (2) (3) (4) (5) (6) (7)
constant 0.015( 4.2)
0.039(20.3)
0.016( 3.5)
0.025( 5.3)
0.011( 4.1)
-0.014(-0.8)
-0.022(-1.5)
labour productivity gap -0.031(-8.1)
-0.018(-3.1)
-0.022(-6.4)
-0.018(-3.5)
-0.021(-7.0)vs. the United States 1950
war-time gap -0.042(-7.7)
-0.022(-2.7)
-0.018(-2.5)1946 vs. 1938
reconstruction 0.325( 5.6)
0.162( 4.1)
0.138( 3.8)growth 1947-1950
country size 0.003( 1.8)
0.002( 2.1)
investment share 0.071( 2.3)
0.055( 2.1)
SEE 0.007 0.008 0.010 0.006 0.005 0.005 0.004
R2
0.813 0.795 0.670 0.872 0.913 0.900 0.931
Cross section estimates, 16 observations. t-values in parantheses.
Once again, excluding Japan from the sample hardly changes the estimated
coeÆcients; instead, the estimated equation explains the development of Japan
as well.25 In versions (6) and (7), the size of the countries (measured as the
logarithm of the number of employees) and the investment share are added
to the list of explanatory variables.26 Country size should approximate scale
economies, and the results imply that large countries grew slightly faster, i.e.
the results indicate some importance of scale economies. Note that in the �fties,
international trade was still very low. The coeÆcient of the investment share
yields an estimate of the contribution of capital accumulation to the catching-
up. On average, capital accumulation contributed slightly above 1 percentage
point to the explanation of economic growth, i.e. less than the productivity gap
with respect to the United States and less than the war-time gap and the re-
construction growth rate for the damaged countries. The results indicate that
capital deepening captures a part of the reconstruction e�ect, the coeÆcients
of the reconstruction variables became smaller. However, the reconstruction
e�ects remain signi�cant, and the productivity catching-up with respect to the
United States even gains signi�cance by the inclusion of the investment share.
This con�rms that catching-up re ects more than neoclassical capital deepen-
ing. Note that versions (6) and (7) can be interpreted as tests for conditional
convergence within a neoclassical growth model. The implied annual rate of
25The estimated coeÆcient (t-value) of a dummy variable for Japan in speci�cation (5) is
-0.002 (-0.3) and -0.003 (-0.42) in version (7).26The source of the data is again Summers and Heston (1991).
17
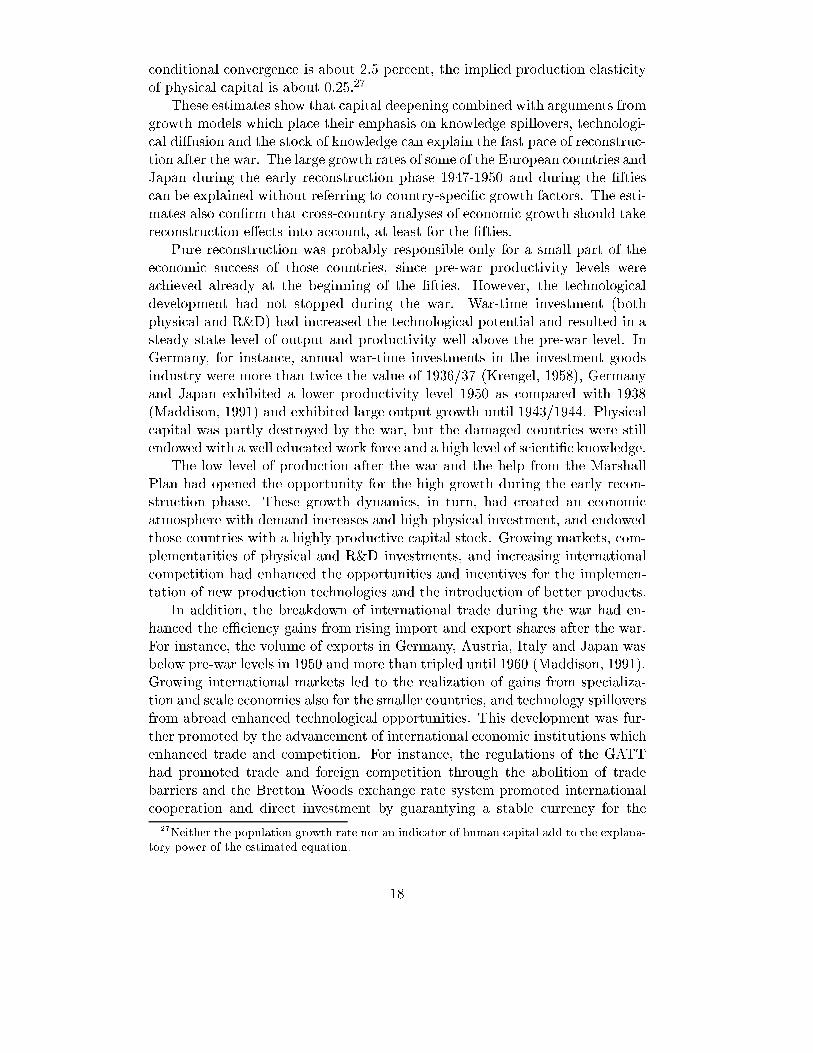
conditional convergence is about 2.5 percent, the implied production elasticity
of physical capital is about 0.25.27
These estimates show that capital deepening combined with arguments from
growth models which place their emphasis on knowledge spillovers, technologi-
cal di�usion and the stock of knowledge can explain the fast pace of reconstruc-
tion after the war. The large growth rates of some of the European countries and
Japan during the early reconstruction phase 1947-1950 and during the �fties
can be explained without referring to country-speci�c growth factors. The esti-
mates also con�rm that cross-country analyses of economic growth should take
reconstruction e�ects into account, at least for the �fties.
Pure reconstruction was probably responsible only for a small part of the
economic success of those countries, since pre-war productivity levels were
achieved already at the beginning of the �fties. However, the technological
development had not stopped during the war. War-time investment (both
physical and R&D) had increased the technological potential and resulted in a
steady state level of output and productivity well above the pre-war level. In
Germany, for instance, annual war-time investments in the investment goods
industry were more than twice the value of 1936/37 (Krengel, 1958), Germany
and Japan exhibited a lower productivity level 1950 as compared with 1938
(Maddison, 1991) and exhibited large output growth until 1943/1944. Physical
capital was partly destroyed by the war, but the damaged countries were still
endowed with a well educated work force and a high level of scienti�c knowledge.
The low level of production after the war and the help from the Marshall
Plan had opened the opportunity for the high growth during the early recon-
struction phase. These growth dynamics, in turn, had created an economic
atmosphere with demand increases and high physical investment, and endowed
those countries with a highly productive capital stock. Growing markets, com-
plementarities of physical and R&D investments, and increasing international
competition had enhanced the opportunities and incentives for the implemen-
tation of new production technologies and the introduction of better products.
In addition, the breakdown of international trade during the war had en-
hanced the eÆciency gains from rising import and export shares after the war.
For instance, the volume of exports in Germany, Austria, Italy and Japan was
below pre-war levels in 1950 and more than tripled until 1960 (Maddison, 1991).
Growing international markets led to the realization of gains from specializa-
tion and scale economies also for the smaller countries, and technology spillovers
from abroad enhanced technological opportunities. This development was fur-
ther promoted by the advancement of international economic institutions which
enhanced trade and competition. For instance, the regulations of the GATT
had promoted trade and foreign competition through the abolition of trade
barriers and the Bretton Woods exchange rate system promoted international
cooperation and direct investment by guarantying a stable currency for the
27Neither the population growth rate nor an indicator of human capital add to the explana-
tory power of the estimated equation.
18
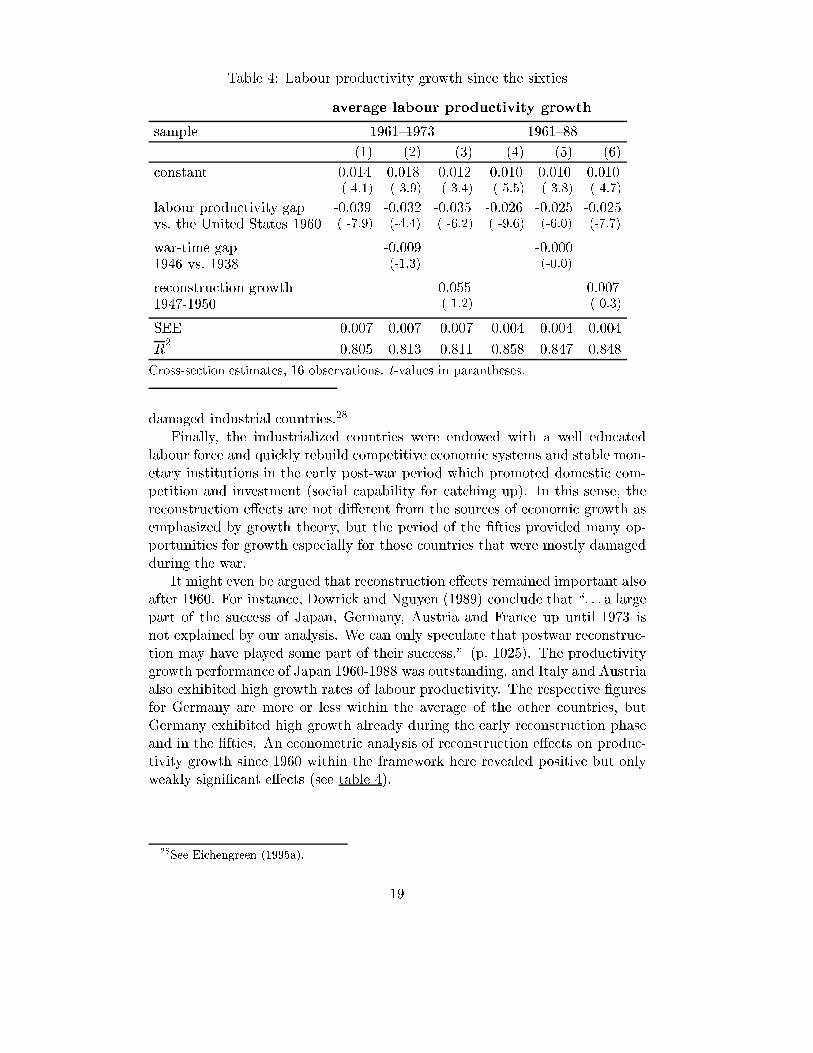
Table 4: Labour productivity growth since the sixties
average labour productivity growth
sample 1961{1973 1961{88
(1) (2) (3) (4) (5) (6)
constant 0.014( 4.1)
0.018( 3.9)
0.012( 3.4)
0.010( 5.5)
0.010( 3.8)
0.010( 4.7)
labour productivity gap -0.039( -7.9)
-0.032(-4.4)
-0.035( -6.2)
-0.026( -9.6)
-0.025(-6.0)
-0.025(-7.7)vs. the United States 1960
war-time gap -0.009(-1.3)
-0.000(-0.0)1946 vs. 1938
reconstruction growth 0.055( 1.2)
0.007( 0.3)1947-1950
SEE 0.007 0.007 0.007 0.004 0.004 0.004
R2
0.805 0.813 0.811 0.858 0.847 0.848
Cross-section estimates, 16 observations. t-values in parantheses.
damaged industrial countries.28
Finally, the industrialized countries were endowed with a well educated
labour force and quickly rebuild competitive economic systems and stable mon-
etary institutions in the early post-war period which promoted domestic com-
petition and investment (social capability for catching up). In this sense, the
reconstruction e�ects are not di�erent from the sources of economic growth as
emphasized by growth theory, but the period of the �fties provided many op-
portunities for growth especially for those countries that were mostly damaged
during the war.
It might even be argued that reconstruction e�ects remained important also
after 1960. For instance, Dowrick and Nguyen (1989) conclude that \. . . a large
part of the success of Japan, Germany, Austria and France up until 1973 is
not explained by our analysis. We can only speculate that postwar reconstruc-
tion may have played some part of their success." (p. 1025). The productivity
growth performance of Japan 1960-1988 was outstanding, and Italy and Austria
also exhibited high growth rates of labour productivity. The respective �gures
for Germany are more or less within the average of the other countries, but
Germany exhibited high growth already during the early reconstruction phase
and in the �fties. An econometric analysis of reconstruction e�ects on produc-
tivity growth since 1960 within the framework here revealed positive but only
weakly signi�cant e�ects (see table 4).
28See Eichengreen (1995a).
19
6 Conclusions
In this paper, it is shown that the high growth rates of output and labour
productivity in many European countries and in Japan after the war are no
miracle but can be consistently explained with neoclassical capital deepening
combined with growth models which place their emphasis on the stock of knowl-
edge, knowledge spillovers and technological di�usion as the source of economic
growth. The extent of war-time destruction can explain more than 80 percent of
the di�erences of reconstruction growth in the early reconstruction phase. The
productivity gap with respect to the United States together with the extent
of war-time destruction and the growth dynamics in the early reconstruction
phase can explain about 90 percent of the di�erences of productivity growth
rates in the �fties. Reconstruction e�ects remained important after the pre-
war level of output was achieved. Catching-up re ects more than neoclassical
capital deepening.
It is also shown that cross-country analyses of productivity convergence
and the growth process in the post-war period should take reconstruction ef-
fects into account. Reconstruction e�ects are as important for the explanation
of productivity catching-up as the productivity distance with respect to the
United States and more important than capital deepening for the �fties. These
reconstruction e�ects increased the speed of convergence. Probably, those re-
construction e�ects lasted even longer into the sixties for some of the countries,
especially Japan. They can explain the successful growth performance in many
European countries and in Japan in the �fties which often appear as outliers in
aggregate analyses of productivity convergence. Reconstruction growth can be
understood as a catching-up with respect to the past.
The results �nally indicate that corresponding growth miracles in the East
Euopean countries after the opening of the Iron Curtain should not be expected.
The East European countries do not exhibit a comparable history of high out-
put and productivity levels, but rather inherited the burden of mis-allocation
and dis-incentives from the past.29 In addition, the process of catching-up
with respect to best practice technology takes place at a much slower pace as
compared with the fast catching-up with respect to the past during post-war
reconstruction. It took 5 years to achieve a doubling of output in the early
reconstruction phase until 1950. It took 10 year to achieve a doubling of labour
productivity in the �fties, as both reconstruction e�ects and catching-up with
respect to best practice technology contributed to the high growth. It took
20 years to increase the relative productivity of the industrialized countries as
compared with the United States from 55 percent in 1960 to 75 percent in 1980.
29For a more detailed discussion, see Eichengreen and Uzan (1992).
20
References
[1] Abramovitz, M., (1986). Catching-up, forging ahead, and falling behind.
Journal of Economic History, 36:385{406.
[2] Abramovitz, M., (1990). The catch-up factor in postwar economic
growth. Economic Inquiry, 38:1{18.
[3] van Ark, B. and N.F.R. Crafts, (1996). Quantitative aspects of post-
war European economic growth. Cambridge University Press, Cambridge.
[4] Barro, R.J., (1991). Economic growth in a cross section of countries.
Quarterly Journal of Economics, 106/2:407{443.
[5] Barro, R.J. and X. Sala-i-Martin, (1992). Convergence. Journal of
Political Economy, 100/4:223{251.
[6] Barro, R.J. and X. Sala-i Martin, (1995). Economic Growth. McGraw-
Hill, New York.
[7] Baumol, W.J., (1986). Productivity growth, convergence, and welfare:
What the long{run data show. American Economic Review, 76/5:1072{
1084.
[8] Baumol, W.J., S.A.B. Blackman, and E.N. Wol�, (1989). Pro-
ductivity and American Leadership { The Long View. The MIT Press,
Cambridge, Mass.
[9] Boltho, A., (1982). The European Economy. Oxford University Press,
Oxford.
[10] Coe, D.T. and E. Helpman, (1995). International R&D Spillovers.
European Economic Review, 39:859{87.
[11] Crafts, N.F.R. and G. Toniolo, (1996). Economic Growth in Europe
since 1945. Cambridge University Press, Cambridge.
[12] Crafts, N.F.R. and T.C. Mills, (1996). Europe's Golden Age: An
econometric investigation of changing trend rates of growth. In B. van
Ark and N.F.R. Crafts, editors, Quantitative aspects of post-war European
economic growth, pages 415{31. Cambridge University Press, Cambridge.
[13] Denison, E.F., (1967). Why Growth Rates Di�er{Postwar Experience in
Nine Western Counties. The Brookings Institution, Washington.
[14] Dowrick, S. and D.T. Nguyen, (1989). OECD comparative economic
growth 1950-85: Catch{up and convergence. American Economic Review,
79/5:1010{1030.
21
[15] Dumke, N.W., (1990). Reassessing the Wirtschaftswunder: Reconstruc-
tion and postwar growth in West Germany in an international context.
Oxford Bulletin of Economics and Statistics, 52:451{90.
[16] Eichengreen, B., (1995). Europe's Post-War Recovery. Cambridge Uni-
versity Press, Cambridge.
[17] Eichengreen, B. , (1995a). Mainsprings of economic recovery in post-
war Europe. In B. Eichengreen, editor, Europe's Post-War Recovery, pages
3{35. Cambridge University Press, Cambridge.
[18] Eichengreen, B. and M. Uzan, (1992). The Marshall Plan. Economic
Policy, 14:14{75.
[19] Fagerberg, J., (1994). Technology and international di�erences in growth
rates. Journal of Economic Literature, 32:1147{75.
[20] Grossman, G.M. and E. Helpman, (1991). Trade, knowledge
spillovers, and growth. European Economic Review, 35:517{26.
[21] Hennings, K.-H., (1982). Country experience: Germany. In A. Boltho,
editor, The European Economy, pages 472{501. Oxford University Press,
Oxford.
[22] Krengel, R., (1958). Anlageverm�ogen, Produktion und Besch�aftigung der
Industrie im Gebiet der Bundesrepublik von 1924 bis 1956. Dunker und
Humblodt, Berlin.
[23] Lindlar, L., (1997). Das mi�verstandene Wirtschaftswunder. Mohr
Siebeck, T�ubingen.
[24] Lucas Jr., R.E., (1988). On the mechanics of economic development.
Journal of Monetary Economics, 22:3{42.
[25] Maddison, A., (1987). Growth and slowdown in advanced capitalist
economies: Techniques of quantitative assessment. Journal of Economic
Literature, 25:649{98.
[26] Maddison, A., (1991). Dynamic Forces in Capitalist Development. Ox-
ford University Press, Oxford.
[27] Mankiw, N.G., D. Romer, and D.N. Weil, (1992). A contribution to
the empirics of economic growth. Quarterly Journal of Economics, 2:407{
437.
[28] Nelson, R.R. and G. Wright, (1992). The rise and fall of American
technological leadership. Journal of Economic Literature, 30:1931{64.
[29] Romer, P.M., (1986). Increasing returns and long{run growth. Journal
of Political Economy, 94:1002{1037.
22
[30] Smolny, W., (1999). International sectoral spillovers { An empirical anal-
ysis for German and U.S. industries. Journal of Macroeconomics, 21/1:135{
54.
[31] Solow, R.M., (1956). A contribution to the theory of economic growth.
Quarterly Journal of Economics, 70:65{94.
[32] Solow, R.M., (1957). Technical change and the aggregate production
function. Review of Economics and Statistics, 39:312{320.
[33] Summers, R. and A. Heston, (1991). The Penn world table (Mark
5): An expanded set of international comparisons, 1950-1988. Quarterly
Journal of Economics, pages 327{68.
[34] Wolf, H.C., (1995). Post-war Germany in the European context: Do-
mestic and external determinants of growth. In B. Eichengreen, editor,
Europe's Post-War Recovery, pages 323{352. Cambridge University Press,
Cambridge.
[35] Wol�, E.N., (1991). Capital formation and productivity convergence over
the long term. American Economic Review, 81/3:565{79.
23