Embed Size (px)
Citation preview
Edited by
P. Lava Kumar, A. T. Jones and F. Waliyar
MMeetthhooddss MMaannuuaall
Virology and Mycotoxin Diagnostics LaboratoryInternational Crops Research Institute for the Semi-Arid Tropics
© International Crops Research Institute for the Semi-Arid Tropics, 2004 AUTHORS P. LAVA KUMAR Special Project Scientist – Virology
Virology and Mycotoxin Diagnostics ICRISAT, Patancheru 502 324, India e-mail: [email protected]
A. T. JONES Senior Principal Virologist Scottish Crop Research Institute (SCRI) Invergowrie Dundee DD2 5DA Scotland, United Kingdom e-mail: [email protected]
FARID WALIYAR Principal Scientist and Global Theme Leader – Biotechnology ICRISAT, Patancheru 502 324, India e-mail: [email protected]
Material from this manual may be reproduced for the research use providing the source is acknowledged as: KUMAR, P.L., JONES, A. T. and WALIYAR, F. (Eds) (2004). Serological and nucleic acid based methods for the detection of plant viruses. International Crops Research Institute for the Semi-Arid Tropics, Patancheru 502 324, India. FOR FURTHER INFORMATION: International Crops Research Institute for the Semi-Arid Tropics (ICRISAT) Patancheru - 502 324, Andhra Pradesh, India Telephone: +91 (0) 40 23296161 Fax: +91 (0) 40 23241239 +91 (0) 40 23296182 Web site: http://www.icrisat.org Cover photo: Purified particles of PoLV-PP (©Kumar et al., 2001)
This publication is an output from the United Kingdom Department for International Development (DFID) Crop Protection Programme for the benefit of developing countries. Views
expressed are not necessarily those of DFID.
Manual designed by P Lava Kumar

SSeerroollooggiiccaall aanndd NNuucclleeiicc AAcciidd BBaasseedd MMeetthhooddss ffoorr tthhee DDeetteeccttiioonn ooff PPllaanntt VViirruusseess
Edited by P. Lava Kumar, A. T. Jones and Farid Waliyar
For the training course on Serological and Nucleic Acid Based Methods for the Detection of Plant Viruses
Virology Unit, ICRISAT, Patancheru 502 324, AP, India 12 – 20 April 2004
Crop Protection Programme Department for International Development
Natural Resources International Ltd Park House, Bradbourne Lane, Aylesford, Kent ME20 6SN
United Kingdom
Sponsored by
International Crops Research Institute for the Semi-Arid Tropics Patancheru 502 324, Andhra Pradesh, India
Scottish Crop Research Institute Dundee DD2 5DA, Scotland, UK
IINNDDEEXX
CCoonntteennttss PPaaggee nnoo.. Preface
2
Abbreviations 3 Training course objective 5
Section – I Virus diseases of current importance in Asia
1 Virus diseases of ICRISAT mandate crops P Lava Kumar and F Waliyar
8
2 Pigeonpea sterility mosaic disease P Lava Kumar, AT Jones, F Waliyar, P Sreenivasulu, V Muniyappa, TKS Latha and K B Saxena
12
3 Groundnut bud necrosis and spotted wilt P Sreenivasulu and P Lava Kumar
20
4
Peanut stem necrosis RDVJ Prasad Rao, AS Reddy, F Waliyar, P Sreenivasulu and P Lava Kumar
26
5 Chickpea stunt disease SV Reddy, P Lava Kumar and F Waliyar
30
6 Plant virus diseases of quarantine importance RDVJ Prasad Rao and KS Varaprasad
34
Section – II Virus disease diagnosis and screening for resistance
7 Diagnosis of virus diseases P Lava Kumar, P Sreenivasulu and F Waliyar
42
8 Plant virus isolation and purification P Lava Kumar and P Sreenivasulu
52
9 ELISA and RT-PCR methods for the detection of plant viruses P Lava Kumar and P Sreenivasulu
56
10 Screening genotypes for virus resistance P Lava Kumar, AT Jones, F Waliyar and KB Saxena
66
Section – III Protocols for virus detection
11 Mechanical Sap Inoculation for Virus Detection and Assay P Lava Kumar, SV Reddy and AS Reddy
72
12 Enzyme-linked immunosorbent assay (ELISA) P Lava Kumar, AS Reddy and SV Reddy
75-91
Extraction IgGs and preparation of enzyme conjugate 78 Double antibody sandwich (DAS)-ELISA 80 Direct antigen coating (DAC)-ELISA 81 Virus testing in seed 82 Western immuno-blotting 86 13 Nucleic acid-based methods
P Lava Kumar 92-107
PCR and RT-PCR 92 Isolation of total RNA from leaf tissue 92 RT-PCR 95 Gel Electrophoresis of PCR and RT-PCR products 100
Agarose Gel Electrophoresis 100 Polyacrylamide Gel Electrophoresis (PAGE) for separation of DNA
and Proteins 102
14 Screening for virus resistance
P Lava Kumar, SV Reddy and AS Reddy 108-113
Vector-mediated resistance screening for identifying sources of resistance to sterility mosaic disease
108
Screening for stem necrosis disease resistance by mechanical inoculation
111
Section – IV Appendices
1 Certain economically important virus diseases of crops in India 2 List of commonly used methods for the detection of plant viruses 3 Common conversions 4 ICTV classification of plant viruses 5 Further reading 6 Glossary 7 List of contributors
Preface
CCrroopp losses as a result of plant disease caused by viruses come second only to fungal
diseases, but plant viruses are much more difficult to control. Of the various virus disease control strategies, cultivating the disease resistant varieties are by far the most effective and economical choice. Any efforts to control virus disease in the field should proceed first by accurately identifying the causal virus involved in the disease etiology. Virus identification based on symptoms is unreliable, as different viruses can cause similar symptoms on different host species or strains of same virus can cause different symptoms on a same host.
Methods for the detection and identification of plant viruses are described in this manual with particular emphasis on detection of important virus diseases of ICRISAT mandate crops. These include protein-based (ELISA and Western immunoblotting) and nucleic acid-based (PCR, RT-PCR and dot-blot hybridization) techniques. Though the technology may appear complicated to beginners, every effort has been made to simplify the procedures by providing technical details in a step-wise manner, with description of underlying principles. The techniques described are applicable for the detection of any plant virus in general, albeit suitable modifications made to optimise the performance as per the needs.
This manual is a sequel to the previous manuals ‘Methods for the Detection of Pigeonpea Sterility Mosaic Disease - Version 2’ developed in 2002 and ‘Laboratory Exercises for a Training Course on the Detection and Identification of Viruses’ developed in 1995. This manual is based on our experience and expertise built over the years with the help of past and present research staff. Some basic procedures have been adapted from other people’s work and credit given where applicable.
I sincerely thank all authors for their contribution to this manual. I gratefully acknowledge the financial support from the Crop Protection Program (CPP) of the United Kingdom Department for International Development (DFID) (Project No. R8205). This is the 4th virology training programme funded by the CPP for the benefit of researchers in the developing countries.
Dr CLL Gowda
Global Theme Leader Crop Improvement

Abbreviations ALP Alkaline phosphatase BND Bud necrosis disease BTB Bromothymol blue cv Cultivar DAC-ELISA Direct antigen coating-enzyme-linked immunosorbent assay DAS-ELISA Double antibody sandwich-enzyme-linked immunosorbent assay DNA Deoxyribonucleic acid dH2O Distilled water dNTPs Deoxynucleotide phosphates ELISA Enzyme-linked immunosorbent assay EM Electron micrograph Ig Immunoglobulin IgG Immuno-γ-globulin mol. wt. Molecular weight kb Kilo base kbp Kilo base pair kDa Kilo Dalton PAGE Polyacrylamide gel electrophoresis PBS Phosphate buffer saline PCR Polymerase chain reaction pi Post-inoculation PNC Penicillinase PSND Peanut stem necrosis disease RNA Ribonucleic acid RT-PCR Reverse transcription-polymerase chain reaction SEM Scanning electron microscope SMD Sterility mosaic disease TAS-ELISA Triple antibody sandwich-ELISA TEM Transmission electron microscope VLP Virus-like particles WIB Western immuno blotting Symbols/Units A Absorbance cm Centimeter 0C Degree centigrade g grams h hours l Liter lb/sq.in Pounds per square inch M Moles mM Millimoles min minutes
ml Milliliter mg Milligram µl Microliter µg Microgram ng Nanogram nm Nanometer OD Optical density pH Hydrogen ion concentration % Percent rpm Revolutions per minute sec Seconds v Volume w Weight Virus Acronyms CCDV Chickpea chlorotic dwarf virus CMMV Cowpea mild mottle virus CpSDaV Chickpea stunt disease associated virus GRAV Groundnut rosette assistor virus IPCV Indian peanut clump virus MYMV Mungbean Yellow mosaic virus PBNV Peanut bud necrosis virus PCLSV Peanut chlorotic streak virus PCV Peanut clump virus PPSMV Pigeonpea sterility mosaic virus PSV Peanut stunt virus PStV Peanut stripe virus PYSV Peanut yellow spot virus MStV Maize stripe virus TSV Tobacco streak virus TSWV Tomato spotted wilt virus
Course objective This course on “Serological and Nucleic Acid Based Methods for the Detection of Plant Viruses” will take the participants through techniques, in particular ELISA and PCR/RT-PCR, for detecting plant viruses in general, with particular reference to Pigeonpea sterility mosaic virus, Peanut bud necrosis virus, Tobacco streak virus and other important virus diseases of ICRISAT mandate crops. Emphasis will be placed on practical applications. Who we are
Name E-mail Address Dr Farid Waliyar Principal Scientist Global Theme Leader - Biotechnology
Dr CLL Gowda Principal Scientist Global Theme Leader – Crop Improvement
Dr P Lava Kumar Special Project Scientist – Virology
Mr A Sudarshan Reddy Scientific Officer
Mr S Veera Reddy Scientific Officer
ICRISAT Patancheru 502 324, AP, India
Dr P Sreenivasulu Professor in Virology
[email protected] Department of Virology Sri Venkateswara University, Tirupati 517 502, AP, India
Dr RDVJ Prasad Rao Principal Scientist
[email protected] NBPGR (Regional Station) Rajendra Nagar, Hyderabad
Dr A Teifion Jones Senior Principal Virologist
[email protected] Scottish Crop Research Institute Invergowrie DD 2 5DA, Scotland, United Kingdom
About this course There will be mixture of talks and practical sessions, during which we will move amongst you helping when your get stuck. Please ask questions. There will inevitably be a mixture of abilities in this course. If you find that we are going too fast or not making ourselves clear: PLEAS ASK QUESTIONS and FEEL FREE TO INTERRUPT US. The only way that we can improve this course is for you to tell us that we are not being clear. SHOUT OUT if you need help during the practicals. This manual is based on our experience and expertise built over the years with the help of past and present research staff. Some basic procedures have been adapted from other people’s work and credit given where applicable. Credits This course is sponsored by the Crop Protection Programme (CPP) of the United Kingdom Department for International Development (DFID; Project No R8205)
SSeeccttiioonn -- II VViirruuss DDiisseeaasseess ooff CCuurrrreenntt IImmppoorrttaannccee iinn AAssiiaa
1. Virus Diseases of ICRISAT Mandate Crops
P Lava Kumar and F Waliyar
ICRISAT, Patancheru 502 324, AP, India
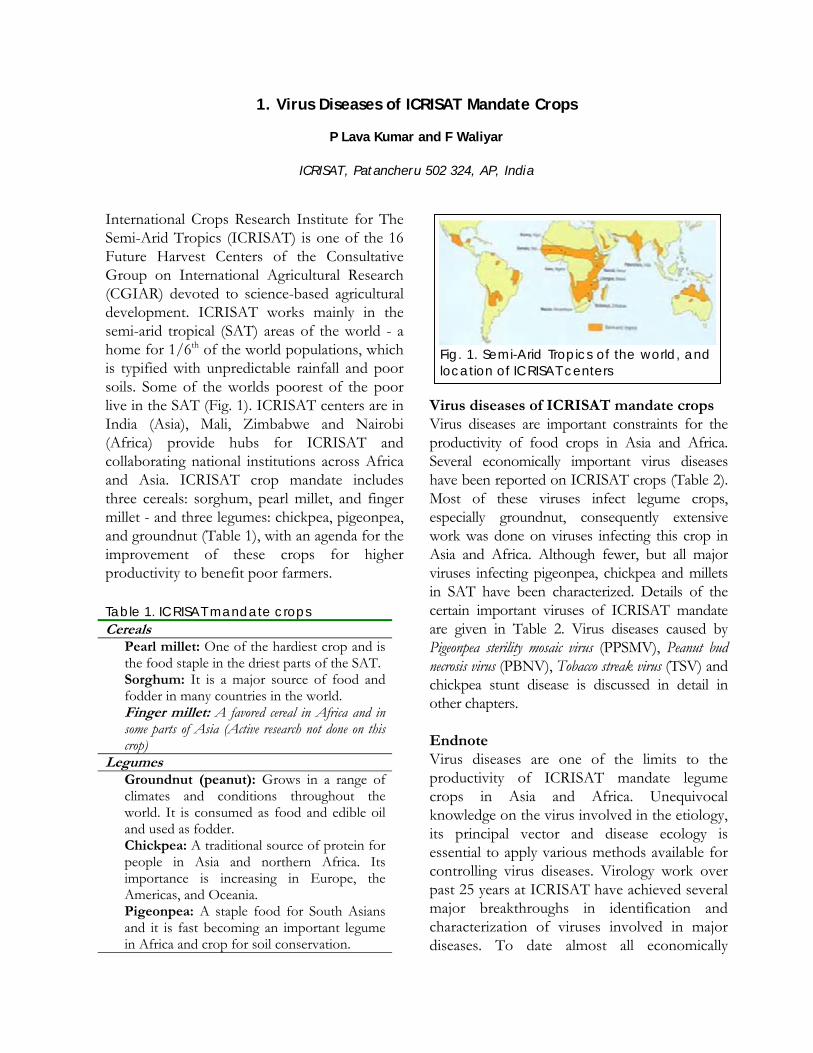
International Crops Research Institute for The Semi-Arid Tropics (ICRISAT) is one of the 16 Future Harvest Centers of the Consultative Group on International Agricultural Research (CGIAR) devoted to science-based agricultural development. ICRISAT works mainly in the semi-arid tropical (SAT) areas of the world - a home for 1/6th of the world populations, which is typified with unpredictable rainfall and poor soils. Some of the worlds poorest of the poor live in the SAT (Fig. 1). ICRISAT centers are in India (Asia), Mali, Zimbabwe and Nairobi (Africa) provide hubs for ICRISAT and collaborating national institutions across Africa and Asia. ICRISAT crop mandate includes three cereals: sorghum, pearl millet, and finger millet - and three legumes: chickpea, pigeonpea, and groundnut (Table 1), with an agenda for the improvement of these crops for higher productivity to benefit poor farmers. Table 1. ICRISAT mandate crops Cereals Pearl millet: One of the hardiest crop and is
the food staple in the driest parts of the SAT. Sorghum: It is a major source of food and
fodder in many countries in the world. Finger millet: A favored cereal in Africa and in
some parts of Asia (Active research not done on this crop)
Legumes Groundnut (peanut): Grows in a range of
climates and conditions throughout the world. It is consumed as food and edible oil and used as fodder.
Chickpea: A traditional source of protein for people in Asia and northern Africa. Its importance is increasing in Europe, the Americas, and Oceania.
Pigeonpea: A staple food for South Asians and it is fast becoming an important legume in Africa and crop for soil conservation.
Virus diseases of ICRISAT mandate crops Virus diseases are important constraints for the productivity of food crops in Asia and Africa. Several economically important virus diseases have been reported on ICRISAT crops (Table 2). Most of these viruses infect legume crops, especially groundnut, consequently extensive work was done on viruses infecting this crop in Asia and Africa. Although fewer, but all major viruses infecting pigeonpea, chickpea and millets in SAT have been characterized. Details of the certain important viruses of ICRISAT mandate are given in Table 2. Virus diseases caused by Pigeonpea sterility mosaic virus (PPSMV), Peanut bud necrosis virus (PBNV), Tobacco streak virus (TSV) and chickpea stunt disease is discussed in detail in other chapters. Endnote Virus diseases are one of the limits to the productivity of ICRISAT mandate legume crops in Asia and Africa. Unequivocal knowledge on the virus involved in the etiology, its principal vector and disease ecology is essential to apply various methods available for controlling virus diseases. Virology work over past 25 years at ICRISAT have achieved several major breakthroughs in identification and characterization of viruses involved in major diseases. To date almost all economically
Fig. 1. Semi-Arid Tropics of the world, andlocation of ICRISAT centers

Table 2. Certain economically important virus diseases of ICRISAT mandate crops in Asia and Africa Disease Distribution Causal virus Vector Seed
transmissionGroundnut Bud necrosis South and South-
East Asia Peanut bud necrosis virus (PBNV) (Tospovirus)
Thrips (Thrips palimi)
None
Stem necrosis India Tobacco streak virus (TSV) Pollen (passively by Thrips palimi)
None (?)
Spotted wilt Africa Tomato spotted wilt virus (TSWV) (Tospovirus)
Thrips (Frankliniella schultzei)
None
Peanut yellow spot
Thailand and India Peanut yellow spot virus (PYSV) (Tospovirus)
Thrips (Scirtothrips dorsalis)
None
Peanut mottle South and South-East Asia, Africa
Peanut mottle virus (PMoV) (Potyvirus)
Aphids (Aphis gossypii, A. glycines, A. craccivora, Myzus persicae)
Yes (0.1 – 4%)
Peanut stripe South and South-East Asia
Peanut stripe virus (PStV) (Potyvirus)
Aphids (A. craccivora, M. persicae)
Yes (4-38%)
Peanut stunt East and South-East Asia, Africa
Peanut stunt virus (PSV) (Cucumovirus)
Aphids (A. craccivora, A. spiraecola, M. persicae)
Yes (0-0.1%)
Peanut clump India Indian peanut clump virus (IPCV) (Pecluvirus)
Fungus (Polymyxa graminis)
Yes (0-10%)
Africa Peanut clump virus (PCV) (Pecluvirus)
Fungus (Polymyxa graminis)
Yes (0-10%)
Peanut leaf-roll and Mottle
Philippines, Thailand, India and Malaysia,
Cowpea mild mottle virus (Carlavirus) (mild and severe strains)
Whitefly (Bemisia tabaci)
Severe strain is seed-born
Rosette Africa Groundnut rosette virus (GRV) (Umbravirus) Groundnut rosette assistor virus (GRAV) (Luteovirus) Satellite RNA
Aphids (Aphis craccivora)
None
Pigeonpea Sterility mosaic South Asia,
Thailand and China
Pigeonpea sterility mosaic virus (PPSMV) (Unassigned virus)
Eriophyid mites (Aceria cajani)
None
Yellow mosaic India Mungbean yellow mosaic virus (MYSV) (Begamovirus)
Whitefly (Bemisia tabaci)
None
Chickpea Chickpea stunt Asia, Africa 4 different viruses involved
in etiology Chickpea stunt disease associated virus (CpSDaV), Beat western yellows virus
Luteoviruses by aphids (several species). CCDV by
None
(BWYV) Bean leaf roll virus (BLRV) (Luteovirus) Chickpea chlorotoic dwarf virus (CCDV) (Masterivirus)
leafhoppers (Orosius orientalis)
Sorghum Stripe India, Africa Maize stripe virus (sorghum
strain) (MStpV) (Tenuivirus)
Planthoppers (Peregrinus maidis)
None
Stripe Africa Maize streak virus (MSV) (Mastrevirus)
Leafhoppers (Cicadulina mbila)
None
Mosaic India, Africa Maize mosaic virus (MMV) (Rhabdovirus)
Planthoppers None
Dwarf mosaic Africa Suspected as due to Sugarcane mosaic virus (ScMV) (Potyvirus)
Aphids (Aphis craccivora)
Seed transmission
suspected Pearl millet Clump India and Africa PCV and IPCV Fungus Yes
(0-0.9%) important virus diseases of mandate crops have been recognized and characterized, and management options established. Simple tools for the detection of these viruses have been developed, which are aiding in disease monitoring and screening for disease resistant varieties. Several promising resistant sources to most of these viruses have been identified in cultivated and wild germplasm and also in breeding populations. Additionally, methods were established to control virus diseases through altered crop practices to control the virus spread into uninfected fields, from field to field, and within the fields.
In addition to research, ICRISAT has provided training to several scientists from Asian and African countries, in characterization and detection of viruses, and in methods for screening for the identification of virus disease resistant sources in germplasm. Antisera and necessary reagents for performing highly sensitive serological tests and nucleic acid-based detection systems are made available to national
scientists. Additionally, seed of promising disease resistant sources of mandate crops supplied to national scientists on request for utilization in disease resistant breeding programmes.
Current virology research at ICRISAT is focused on epidemiology and management of PPSMV, TSV and PBNV in Asia; groundnut rosette and peanut clump in Africa. Efforts are also being made to develop transgenic resistance utilizing the viral genes through tissue culture and recombinant DNA technology. ICRISAT recently opened doors to extend unique virology facilities and expertise, for tackling virus diseases of other crops grown in SAT, through Agri-Biotech Park established at ICRISAT, Patancheru, India.
ICRISAT continues to collaborate with international and national institutions to obtain data on distribution of virus diseases and emergence of new viruses, which is essential to develop (or to modify existing methods) effective virus disease management strategies.

References and Further Reading Buddenhagen, I.W., Gibbs, A.J. Persley, G.J.,
Reddy, D.V.R. and Wongkaew. S. 1987. Improvement and change of food legume agriculture in Asian in relation to disease. In Food Legume Improvement for Asian Farming Systems (Eds Wallis, E.S. and Byeth D.E). ACIAR, Canberra, Australia. Pp 138-155.
Huges, J.ď.A. and Shoyinka, S.A. 2002. Overview of viruses of legumes other than groundnut in Africa. In Plant Virology in Sub-Saharan Africa. IITA, Nigeria. pp 553-568.
Fajemisinm J.M. 2002. Overview of maize viruses. In Plant Virology in Sub-Saharan Africa. IITA, Nigeria. pp 158-171
Jones, A.T., Kumar, P.L., Saxena, K.B., Kulkarni, N.K., Muniyappa, V. and Waliyar, F. 2004. Sterility mosaic disease - the “green plague” of pigeonpea: advances in understanding the etiology, Transmission and control of a major virus disease. Plant Disease 88: (in press).
Reddy, D.V.R., McDonald, D. and Moss, J.P. (Eds). 1994. Working together on groundnut viruses. Summary and recommendations of a meeting of international working groups on groundnut virus diseases. ICRISAT, Patancheru India.
Reddy, D.V.R. and Gowda, C.L.L. (Eds). 1996.
Groundnut virus diseases in the Asia-Pacific region. Summary and the recommendations of the 4th meeting of the international working group. ICRISAT, Patancheru, India.
Reddy, D.V.R., Delfosse, P., Lennè, J.M . and Subrahmanyam, P (Eds). 1997. Groundnut virus diseases in Africa. Summary of Recommendations of the 6th meeting of the International Working group. ICRISAT, Patancheru, India.
Reddy, D.V.R., Nene, Y.L. and McDonald, D. 1986. Virus disease problems of groundnut, chickpea and pigeonpea in Asia. Tropical Agriculture Series No. 9. Tropical Agriculture Research Center, Japan. pp67-75
Sreenivasulu, P., Kuhn, C.W., Naidu, R.A., Demski, J.W., Reddy, D.V.R. and Naidu, M.V. 1991. Viruses infecting peanuts (Arachis hypogaea): taxonomy, identification and disease management. Research Bulletin 406. The University of Georgia, Athens, Georgia, USA.
2. Pigeonpea Sterility Mosaic Disease
P Lava Kumar1, AT Jones2, F Waliyar1, P Sreenivasulu3, V Muniyappa4, TKS Latha1,5 and KB Saxena1
1ICRISAT, Patancheru 502 324, AP, India
2Scottish Crop Research Institute, Invergowrie DD2 5DA, Scotland, UK 3Sri Venkateswara University, Tirupati 517 501, AP, India
4University of Agriculture Sciences, Bangalore 560 065, Karnataka, India 5Tamil Nadu Agriculture University, Coimbatore, India
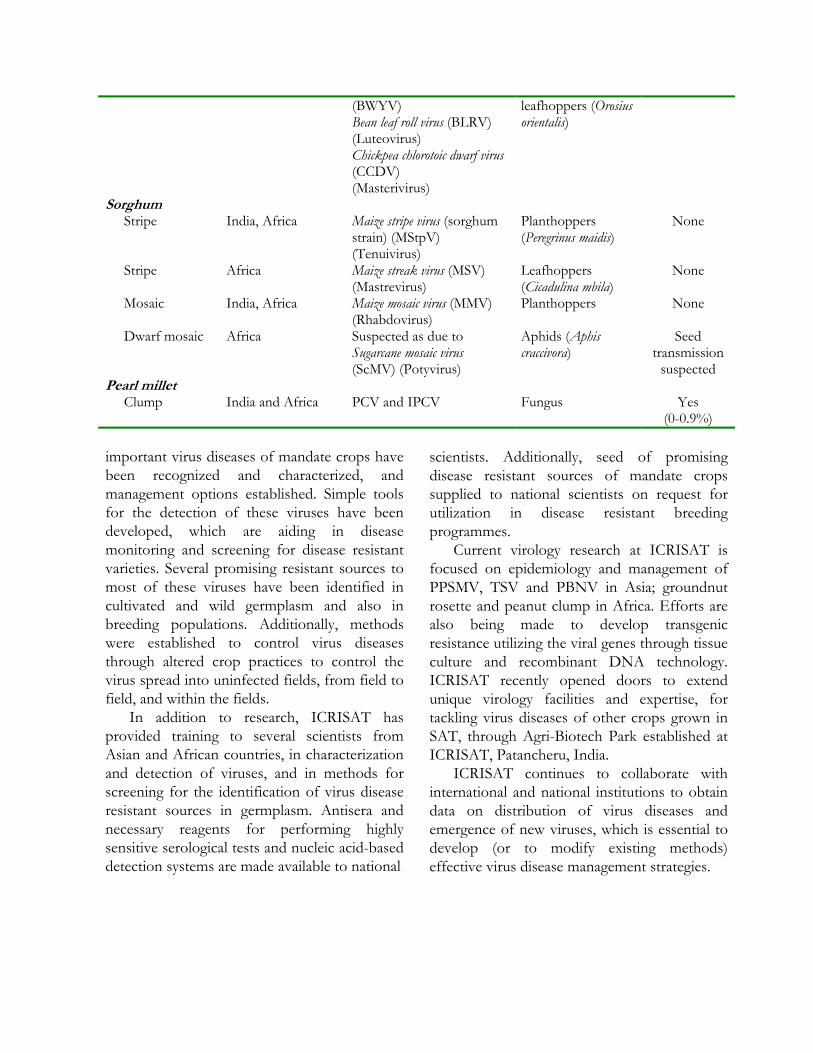
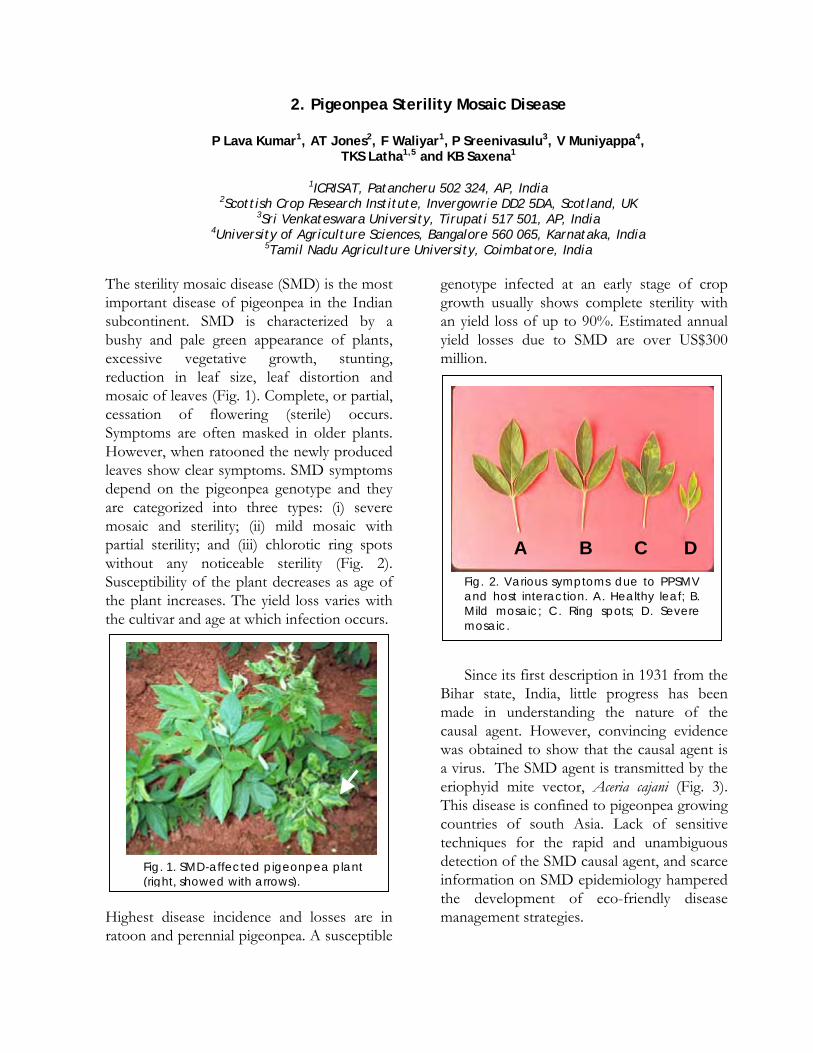
The sterility mosaic disease (SMD) is the most important disease of pigeonpea in the Indian subcontinent. SMD is characterized by a bushy and pale green appearance of plants, excessive vegetative growth, stunting, reduction in leaf size, leaf distortion and mosaic of leaves (Fig. 1). Complete, or partial, cessation of flowering (sterile) occurs. Symptoms are often masked in older plants. However, when ratooned the newly produced leaves show clear symptoms. SMD symptoms depend on the pigeonpea genotype and they are categorized into three types: (i) severe mosaic and sterility; (ii) mild mosaic with partial sterility; and (iii) chlorotic ring spots without any noticeable sterility (Fig. 2). Susceptibility of the plant decreases as age of the plant increases. The yield loss varies with the cultivar and age at which infection occurs. Highest disease incidence and losses are in ratoon and perennial pigeonpea. A susceptible
genotype infected at an early stage of crop growth usually shows complete sterility with an yield loss of up to 90%. Estimated annual yield losses due to SMD are over US$300 million.
Since its first description in 1931 from the
Bihar state, India, little progress has been made in understanding the nature of the causal agent. However, convincing evidence was obtained to show that the causal agent is a virus. The SMD agent is transmitted by the eriophyid mite vector, Aceria cajani (Fig. 3). This disease is confined to pigeonpea growing countries of south Asia. Lack of sensitive techniques for the rapid and unambiguous detection of the SMD causal agent, and scarce information on SMD epidemiology hampered the development of eco-friendly disease management strategies.
Fig. 2. Various symptoms due to PPSMVand host interaction. A. Healthy leaf; B.Mild mosaic; C. Ring spots; D. Severemosaic.
A B C D
Fig. 1. SMD-affected pigeonpea plant (right, showed with arrows).

SMD etiology Recently, using a new purification method, the SMD causal agent was isolated and confirmed as a virus, provisionally named as Pigeonpea sterility mosaic virus (PPSMV). The purified PPSMV preparations consist of slender highly flexuous filamentous virus-like particles (VLPs) of c. 8-11 nm in diameter (Fig. 4), a major virus-specific protein of c. 32 kDa and 5-7 major RNA species of c. 0.8 – 6.8 kb. Polyclonal antiserum to PPSMV virus- VLPs preparations was produced in a rabbit. The partial nucleotide sequence of some cDNA clones made to PPSMV RNA revealed no significant sequence matches to any of the known viral sequences in the database. Oligonucleotide primers were developed for the detection of PPSMV by reverse transcription-polymerase chain reaction (RT-PCR).
PPSMV polyclonal antibodies in all SMD-affected plants detected the virus using ELISA, and the virus-specific 32 kDa protein in Western immunoblotting (WIB). In such assays, the virus was detected consistently in all SMD-affected pigeonpea plant samples from several different locations in India, but not in samples from symptom-free pigeonpea plants from the same locations.
In experimental studies, all pigeonpea plants inoculated with viruliferous A. cajani and those plants graft-inoculated with SMD-affected tissue, were infected with the virus as assessed by ELISA and WIB, but not any uninfected pigeonpea plants. Mechanical transmission Purified PPSMV preparations were not infective to plants. However, PPSMV was transmitted to Nicotiana benthamiana by mechanical sap inoculation using freshly extracted SMD-affected pigeonpea leaf sap (Fig. 5), but not to pigeonpea or several other herbaceous hosts tested. The transmission efficiency by mechanical inoculation to N. benthamiana was low (10-30% infection), and visible symptoms and detection of virus in these plants occurred only after more than 40 days post-inoculation (pi). Inoculum prepared from fresh sap extracts of PPSMV infected N. benthamiana
Fig. 3. Electron micrograph of A. cajani
Fig. 5. Leaf symptoms of PPSMV-infected N. benthamiana
100 nm Fig. 4. PPSMV VLPs

was transmitted to N. benthamiana and N. clevelandii, but not pigeonpea or other herbaceous hosts. Cytopathology Ultrastructural studies of leaves from SMD-affected pigeonpea cultivars, ICP8863 showing sever mosaic symptoms and ICP2376 showing chlorotic ringspots, and PPSMV-infected N. benthamiana, revealed quasi-spherical, membrane bound bodies (MBBs) (Fig. 6) of c. 100-150 nm and amorphous electron-dense material (EDM). These structures were distributed singly or in groups, in the cytoplasm of all cells, but not in conductive tissues. Fibrous inclusions (FIs), composed of randomly dispersed fibrils with electron lucent areas, were present in the cytoplasm of palisade cells and rarely in mesophyll cells of the two-pigeonpea cultivars. Immuno-gold labelling using antiserum to PPSMV, specifically labelled the MBBs and associated EDM, but not the FIs, indicating MBBs and EDMs contain the 32 kDa nucleoprotein and that FIs could probably the non-structural protein component of the virus. The MBBs and associated inclusions are similar in appearance to those reported for plants infected with the eriophyid mite-transmitted High Plains virus and the agents of unidentified etiology associated with rose rosette, fig mosaic, thistle mosaic, wheat spot chlorosis and yellow ringspot of budwood.
Transmission characteristics The transmission characteristics of PPSMV to pigeonpea by its vector A. cajani were studied. Non-viruliferous A. cajani colonies were generated by ‘float-leaf technique’. The transmission efficiency of single A. cajani was up to 53% but was 100% when >5 mites per plant were used. A. cajani acquired PPSMV after a minimum acquisition access period (AAP) of 15 min and inoculated virus after a minimum inoculation access period (IAP) of 90 min. No latent period was observed. Starvation of A. cajani prior to, or following, PPSMV acquisition reduced the minimum AAP and IAP periods to 10 min and 60 min, respectively, and mites retained virus for up to 13 h. None of the mites that developed from eggs taken from PPSMV-infected leaves transmitted the virus indicating that it is not transmitted transovarially. Taken together, these data suggest a semi-persistent mode of transmission of PPSMV by A. cajani. Taxonomy PPSMV has some properties similar to virus species in the genera Tospovirus and Tenuivirus and with the eriophyid mite-transmitted High plains virus (HPV) but is distinct from these and from all other characterized viruses. The combination of novel properties shown by PPSMV and HPV suggest that they may constitute species in a new genus of plant viruses. Host range Twenty-nine commonly occurring weed species in the families Amaranthaceae, Asteraceae, Solanaceae, Boraginaceae, Convolulaceae, Tiliaceae, Euphorbiaceae, Laminaceae, Sapindaceae and Leguminaceae occurring naturally in pigeonpea fields of ICRISAT, Patancheru were analyzed for PPSMV and A. cajani. Of the plants observed only 2 of 12 plants of Chrozophora rottleri (Euphorbiaceae) tested positive for PPSMV in DAS-ELISA. No overt symptoms or mites
Fig. 6. MBBS in PPSMV infected pigeonpea immuno labeled with PPSMV antiserum.
were noticed on these two PPSMV-infected plants. Observations revealed that C. rottleri was susceptible to PPSMV, but it did not supported A. cajani multiplication and therefore may not act as an inoculum source for PPSMV and mites in the fields. A. cajani were found on all the 11 Hibiscus panduriformis (Malvaceae) observed (5 to 9 mites/leaf). When mites from H. panduriformis were transferred onto indicator plants (pigeonpea cv. ICP8863), they developed typical SMD symptoms and were positive for PPSMV in DAS-ELISA. Hibiscus panduriformis plants observed in the fields were present close to pigeonpea plants. It is likely that mites carried by wind currents from pigeonpea might have entangled in the highly pubescent H. panduriformis leaves.
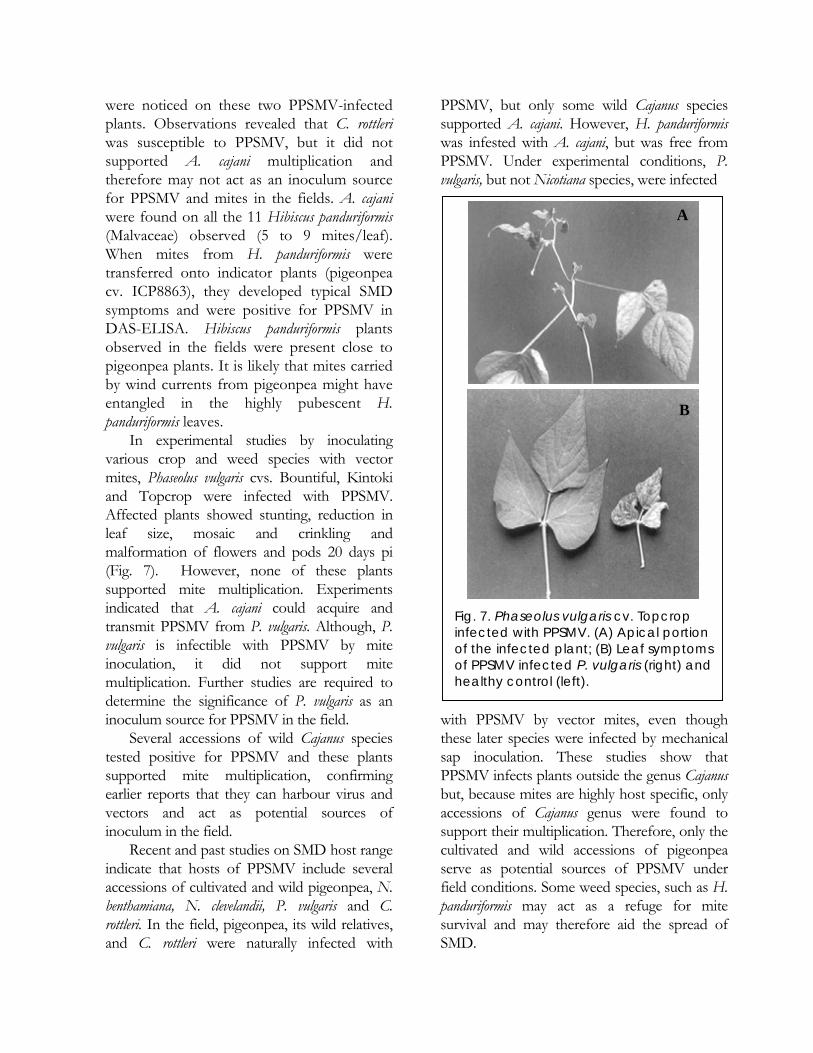
In experimental studies by inoculating various crop and weed species with vector mites, Phaseolus vulgaris cvs. Bountiful, Kintoki and Topcrop were infected with PPSMV. Affected plants showed stunting, reduction in leaf size, mosaic and crinkling and malformation of flowers and pods 20 days pi (Fig. 7). However, none of these plants supported mite multiplication. Experiments indicated that A. cajani could acquire and transmit PPSMV from P. vulgaris. Although, P. vulgaris is infectible with PPSMV by mite inoculation, it did not support mite multiplication. Further studies are required to determine the significance of P. vulgaris as an inoculum source for PPSMV in the field.
Several accessions of wild Cajanus species tested positive for PPSMV and these plants supported mite multiplication, confirming earlier reports that they can harbour virus and vectors and act as potential sources of inoculum in the field.
Recent and past studies on SMD host range indicate that hosts of PPSMV include several accessions of cultivated and wild pigeonpea, N. benthamiana, N. clevelandii, P. vulgaris and C. rottleri. In the field, pigeonpea, its wild relatives, and C. rottleri were naturally infected with
PPSMV, but only some wild Cajanus species supported A. cajani. However, H. panduriformis was infested with A. cajani, but was free from PPSMV. Under experimental conditions, P. vulgaris, but not Nicotiana species, were infected with PPSMV by vector mites, even though these later species were infected by mechanical sap inoculation. These studies show that PPSMV infects plants outside the genus Cajanus but, because mites are highly host specific, only accessions of Cajanus genus were found to support their multiplication. Therefore, only the cultivated and wild accessions of pigeonpea serve as potential sources of PPSMV under field conditions. Some weed species, such as H. panduriformis may act as a refuge for mite survival and may therefore aid the spread of SMD.
Fig. 7. Phaseolus vulgaris cv. Topcrop infected with PPSMV. (A) Apical portion of the infected plant; (B) Leaf symptoms of PPSMV infected P. vulgaris (right) and healthy control (left).
A
B
Variability in host plant resistance Screening trials for sources of SMD resistance initiated under a collaborative project between ICRISAT and the Indian Council of Agricultural Research (ICAR) have identified pigeonpea varieties with field resistance to SMD infection. By screening nearly 15,000 germplasm accessions about 400 lines resistant (no overt symptoms) or tolerant (no sterility or ring spots symptoms) to the SMD were identified. Most of these genotypes were shown to possess location-specific resistance. The resistance mechanism is not known, but is presumed to be resistant to either the pathogen, the vector, or to both agents. Three factors were attributed to the location-specific variation observed in SMD resistance: (i) variability in the pathogen, (ii) variability in the mite vector, (iii) the plant genotype and environment interaction.
The role of mite vector and its influence on host-plant resistance was studied using DNA-based markers to (i) determine whether different species of Aceria mites are involved as vectors; (ii) assess the diversity amongst A. cajani populations and (iii) understand the variation in SMD resistance shown by different pigeonpea genotypes with respect to the mite vector. This study suggested that A. cajani on pigeonpea across the Indian subcontinent constitutes one population and that no other Aceria species or A. cajani biotypes that differ in virus transmission ability are involved in PPSMV transmission. This indicates that host plant resistance across the Indian subcontinent is influenced by biotypes (strains) of PPSMV.
Previous studies using a set of 7 differential pigeonpea genotypes, indicated existence of at least 5 variants of SMD. Our recent studies using the differential cultivars indicated that PPSMV at Patancheru is a mild strain compared to that of the strain endemic in Bangalore and Coimbatore regions. Further wider studies to determine the PPSMV strains are underway.
SMD diagnosis Until now, SMD recognition and selection of resistant lines is based solely on symptom expression. Disease confirmation based on symptoms alone is complicated by the fact that symptoms are governed by many biotic and abiotic factors. Pigeonpea is a cross-pollinated crop and in addition to environmental factors, genotypic variability induced as a result of cross-pollination, is also likely to play an important role in symptomatology.
Polyclonal antiserum was produced to PPSMV in a rabbit. These have been shown to be very effective in detecting PPSMV in plant tissues, utilizing double antibody sandwich (DAS)-ELISA. This assay is simple, sensitive, and cost effective, and can easily be adaptable to conditions in developing countries. For sensitive detection of PPSMV, RT-PCR-based method has been developed. These tests are now being used routinely for PPSMV detection in plants and in mites. Screening for SMD-resistance A system for screening of pigeonpea genotypes under laboratory conditions has been standardized. Plants raised in growth chambers are inoculated at the 2-leaf stage with vector-mites by the leaf-stapling technique. Plants are monitored for disease symptoms and also tested for PPSMV in DAS-ELISA. Resistant genotypes (asymptomatic and ELISA negative) are tested again by graft inoculation. Since PPSMV is not mechanically transmissible to pigeonpea, graft transmission tests are performed to confirm its resistance to virus. This method of screening pigeonpea genotypes confirmed for the first time that, there are genotypes that are (i) resistant to PPSMV and mites, (ii) resistant to mites, but not to PPSMV (iii) resistant to PPSMV, but not to mites and (iv) susceptible to PPSMV and mites. Using a combination of ELISA, mite transmission by leaf stapling and transmission by grafting, it is now possible to

determine in 4 to 5 weeks, the precise nature of mechanism of resistance to SMD. Selection of broad-based durable SMD resistant pigeonpea genotypes A global pigeonpea germplasm collection is held in trust by ICRISAT following on international agreement with Food and Agriculture Organization (FAO). Many cultivated genotypes in this collection have been found to show location-specific resistance to SMD and a large number of genotypes are yet to be evaluated for SMD resistance. New technologies developed for SMD monitoring are being used for screening genotypes. These include cultivated and wild Cajanus species and also breeding lines from crosses between wild and cultivated short duration pigeonpea genotypes. Accessions (115) from six wild Cajanus species have been screened for resistance against three isolates (P, B and C) and 7 accessions possessing broad-based resistance to all the three isolates have been identified. High yielding and SMD-resistant genotypes will be selected and evaluated further for resistance to more than one PPSMV-biotype using new screening techniques. Genotypes that show resistance to more than one virus biotype will be selected. Promising genotypes will be identified and utilized in breeding programs. These efforts will lead to an understanding of the inheritance of SMD resistance and the development of pigeonpea cultivars with broad-based resistance. Endnote Sterility mosaic, Fusarium wilt and pod borer are serious threats to pigeonpea production in the Indian subcontinent. Although in annual incidence SMD is next to that of wilt, but SMD has been shown to cause significantly more crop losses than wilt. An integrated approach to tackle these three problems is vital to increase the pigeonpea production in south Asia. Significant progress has been
made to enable in devising strategies for the management of wilt and pod borer. However, the previous lack of information on the causal agent and the absence of diagnostic tools have hindered progress to develop management strategies for SMD.
After seven decades of SMD description, ICRISAT, in collaboration with the Scottish Crop Research Institute, Scotland has made a breakthrough in the identification of the causal agent of SMD. Information generated has lead to the development of efficient monitoring and screening technologies leading to identification of broad-based durable SMD-resistant pigeonpea genotypes and to understand the epidemiology of the SMD. Recently studies two PPSMV isolates from Bangalore (B) and Coimbatore (C) locations were characterized. These two isolates have several properties similar to Patancheru (P) isolate. However some differences were found between these two isolates. For instance arrays of longitudinal crystalline aggregates were detected in pigeonpea plants infected with B isolate, whereas C isolate lack the 32 kDa protein, but has a protein of higher molecular weight of c 35 kDa. Both B and C isolates are physiologically aggressive, i.e., they overcome resistance to P isolates found in several pigeonpea genotypes. Details of studies on P and B isolates will be presented elsewhere. Identification of SMD resistance in wild Cajanus species, some of which are also resistant to wilt and pod borer, is a major step towards an integrated approach to reduce losses substantially to biotic constraints. These efforts will contribute to sustainable pigeonpea production in the Indian subcontinent. References and Further reading Nene, Y.L. 1995. Sterility mosaic of pigeonpea:
the challenge continues. Indian Journal of Mycology and Plant Pathology 25:1-11.
Jones, A.T., Kumar, P.L., Saxena, K.B., Kulkarni, N.K., Muniyappa, V. and Waliyar, F. 2004. Sterility mosaic disease - the “green plague” of pigeonpea: advances in understanding the

etiology, Transmission and control of a major virus disease. Plant Disease 88: (in press).
Kumar, P.L., Fenton, B., Duncan, G., Jones, A.T., Sreenivasulu, P. and Reddy, D.V.R. 2001. Assessment of variation in Aceria cajani (Acari: Eriophyidae) using analysis of nuclear rDNA ITS regions and scanning electron microscopy: implications for the variability observed in host plant resistance to pigeonpea sterility mosaic disease. Annals of Applied Biology 139:61-73.
Kumar, P.L., Jones, A.T., Sreenivasulu, P. and Reddy, D.V.R. 1998. Isolation of a virus associated with sterility mosaic disease of pigeonpea (Cajanus cajan (L) Millsp). Indian Journal of Plant Protection 26:164-166.
Kumar, P.L., Jones, A.T., Sreenivasulu, P. and Reddy, D.V.R. 2000. Breakthrough in the Identification of the causal virus of pigeonpea sterility mosaic disease. Journal of Mycology and Plant Pathology 30, 249.
Kumar, P.L., Duncan, G., Roberts, I.M., Jones, A.T., and Reddy, D.V R. 2002. Cytopathology of Pigeonpea sterility mosaic virus in pigeonpea and Nicotiana benthamiana: similarities with those of eriophyid mite-borne agents of undefined aetiology. Annals of Applied Biology 140:87-96.
Kumar, P.L., Jones, A.T. and Reddy, D.V.R. 2003. A novel mite-transmitted virus with a divided RNA genome closely associated with
pigeonpea sterility mosaic disease. Phytopathology 93:81-91
Kumar, P.L. Jones, A.T. and Reddy, D.V.R. 2002. Methods for the detection of Pigeonpea sterility mosaic virus and screening for SMD resistance – training course manual. ICRISAT Publication, Patancheru 502 324, India, 47pp.
Kulkarni, N.K., Kumar, P.L., Jones, A.T., Muniyappa, V. and Reddy, D.V.R. 2002. Transmission of pigeonpea sterility mosaic virus by the eriophyid mite, Aceria cajani. Plant Disease 86:1297-1302
Kulkarni, N.K., Kumar, P.L., Muniyappa, V., Jones, A.T. and Reddy, D.V.R. 2003. Studies on host range of Pigeonpea sterility mosaic virus. Journal of Mycology and Plant Pathology 33:141-145.
Kulkarni, N.K., Reddy, A.S., Kumar, P.L., Vijaynarasimha, J., Rangaswamy, K.T., Reddy, L.J., Saxena, K.B., Jones, A.T. and Reddy, D.V.R. 2003. Broad-based resistance to Pigeonpea sterility mosaic disease in the accessions of Cajanus scarabaeoides. Indian Journal of Plant Protection 31:6-11.
Reddy, A.S., Kulkarni, N.K., Kumar, P.L., Jones, A.T., Muniyappa, V. and Reddy, D.V.R. 2002. A new graft inoculation method for screening resistance to Pigeonpea sterility mosaic virus. International Chickpea and Pigeonpea Newsletter 9: 44-46.

33.. GGrroouunnddnnuutt Bud Necrosis and Spotted Wilt
P Sreenivasulu and *P Lava Kumar
Sri Venkateswara University, Tirupati-517 502, AP, India *ICRISAT, Patancheru 502 324, AP, India
Groundnut/peanut (Arachis hypogaea L.) is an important grain legume crop grown in the tropical and subtropical regions of the world mainly for its seed, which is rich in oils and proteins. The crop is grown under varied crop production systems. Corp growth and yield are affected by several pests and pathogens (Reddy and Demski, 1996). Several viruses representing different plant virus taxa are reported to naturally infect groundnut and have varied impacts on its yield. Groundnut/peanut bud necrosis disease (PBND) and spotted wilt diseases caused by two distinct tospoviruses are considered to be most important in the groundnut growing regions. The causal viruses of PBND and spotted wilt are Tomato spotted wilt virus (TSWV) and Peanut bud necrosis virus (PBNV), respectively. TSWV is widely distributed in the Americas, Australasian, Africa and Europe. PBNV seems to be restricted to South, East and South-east Asia. In addition, Groundnut ring spot virus (GRSV) in Africa and Southern America, and Peanut yellow spot virus (PYSV) in South-East Asia are the other to important diseases caused by tospoviruses. The TSWV and PBND are difficult to distinguish by symptoms alone on groundnut or other hosts that they infect. Yield losses due to TSWV and PBND can be reach up to 80% in the early infected crop. The PBNV and TSWV incidence is highly variable from field to field in a season and year to year, ranging from <1% to > 50% (Camann et al., 1995). TSWV is listed among the top ten of the most devastating plant viruses in the world (Peters and Goldbach, 1995). PBNV naturally infects several other crop species such as chillies green gram, black gram, cowpea, soybean, tomato, chilies and potato (Bhat et al., 2002, Huan Thien et al., 2003)
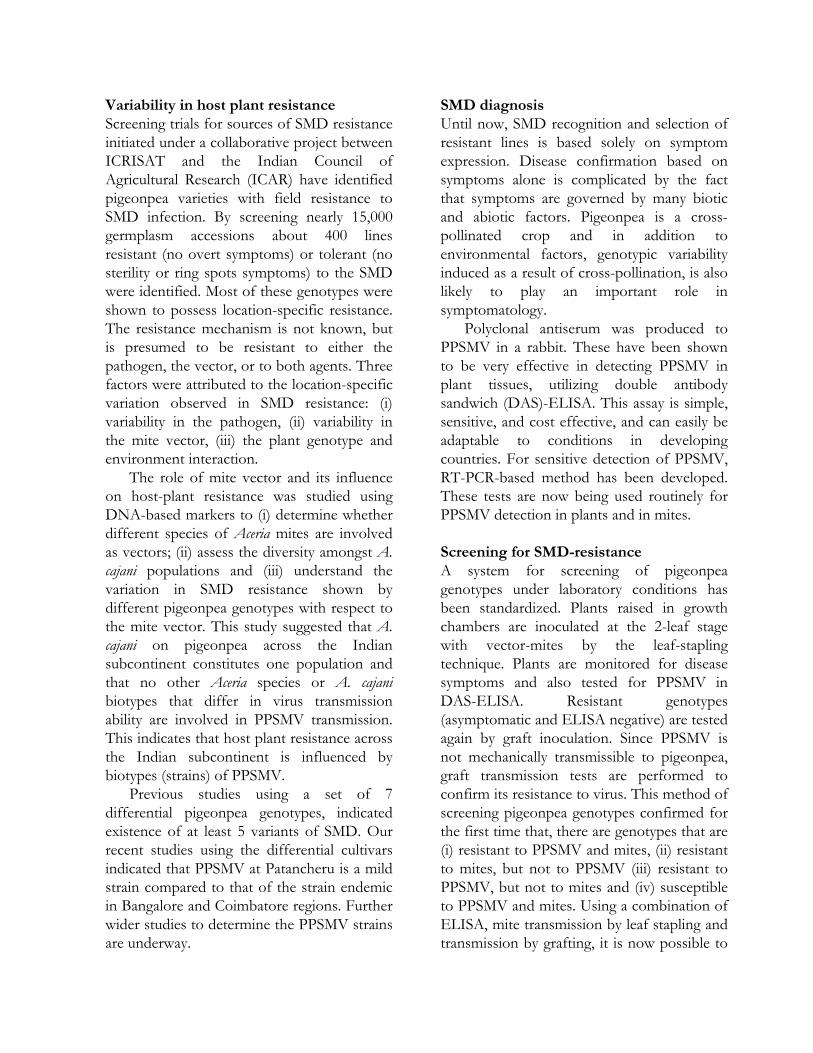
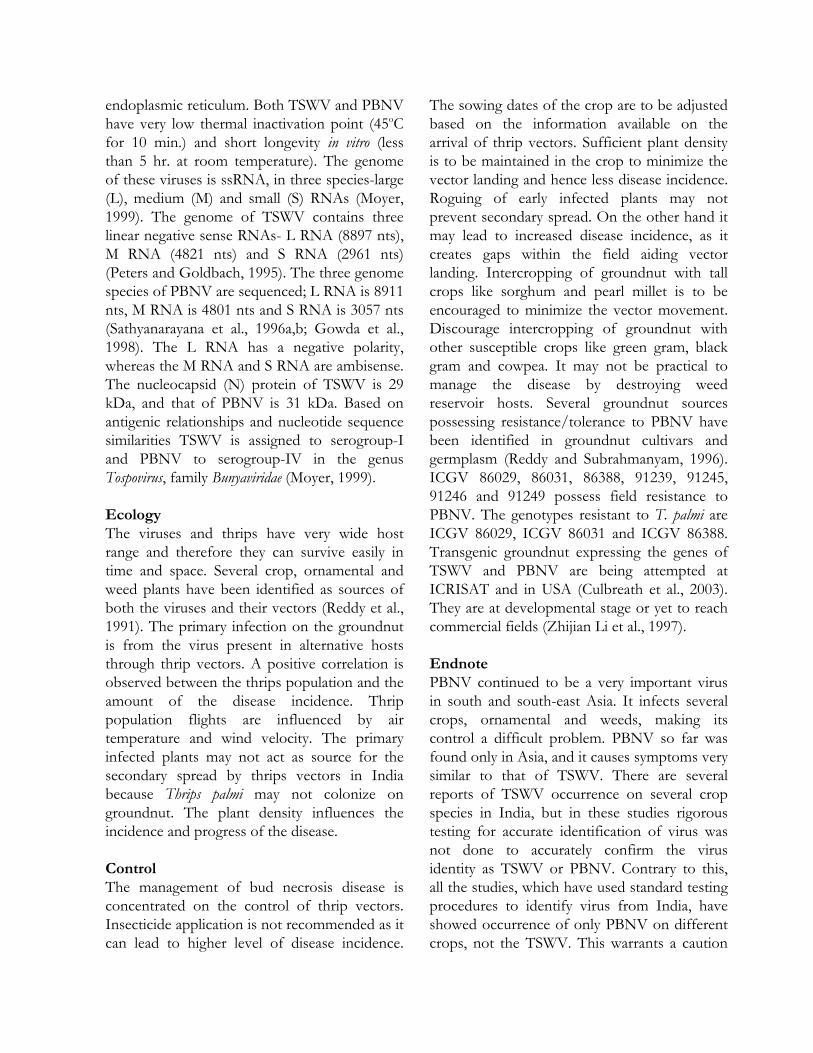
Symptoms The PBNV and TSWV induce almost similar symptoms. Symptoms first appear in the young leaflets in the form of chlorotic spots and mild mottle, which later develop into chlorotic and necrotic rings and streaks (Fig. 1,2). The necrosis from the leaf extends to petiole and to the growing terminal bud, especially when the temperature is above 30oC during the day. The leaves above symptomatic leaflets become flaccid and droop. Infection at young age results in death of the plant due to severe necrosis. As a result of necrosis of terminal bud, various secondary symptoms like stunting and proliferation of axillary shoots occur (Fig. 2). The leaflets on proliferated shoots are reduced in size and exhibit puckering, mosaic, mottling, oak-leaf line pattern and some times chlorosis. The secondary symptoms are most common in early infected plants, giving them a stunted and bushy appearance. Infection at later stage of the growth results in symptoms on a few branches or in apical parts of the plants. In early infected plants the number of pegs and properly filled pods are found to be much less. The seeds of the infected plants are small, shriveled with discolored testa. Late infected plants may produce some seed of normal size.
BB CCFig. 1. PBNV primary symptoms ongroundnut leaflets, (A) chlorotic spots onleaflets and (C) necrotic symptoms withchlorotic borders.
Etiology and transmission The etiology of peanut bud necrosis in Asia was uncertain till 1976. Ghanekar et al., (1979) have reported TSWV as the causative virus of the disease based upon its host range, transmission, virion morphology and antigenic relationships. Reddy et al. (1992) reinvestigated the serological relationships of the virus causing bud necrosis disease in India and reported that causal virus is distinct from TSWV occurring in other countries and named the virus as peanut bud necrosis virus. Both TSWV and PBNV are sap transmissible to groundnut and other herbaceous hosts, but it is difficult, and transmission results from inoculum prepared from the young leaves showing primary symptoms in presence of antioxidants. Natural transmission is by Arthropod vector, thrips (Thysanoptera: Thripidae) in a propagative manner, i.e. virus multiplies in the vector and pass through molting (Reddy and Wightman, 1988). Once vector acquires the virus, they remain viruliferous throughout their life cycle. However, only thrips larvae are able to acquire the virus, and then they transmit virus during larval stage and as adults also. Virus is not transmitted through the eggs. PBNV or TSWV are not transmitted through seed, but virus antigen can be detected in tests by ELISA assay. PBNV is transmitted by Thrips palmi only. Whereas TSWV is transmitted by Frankliniella occidentalis, F. schultzei, F. fusca, Thrips tabaci and T. setosus. This difference in vector transmission
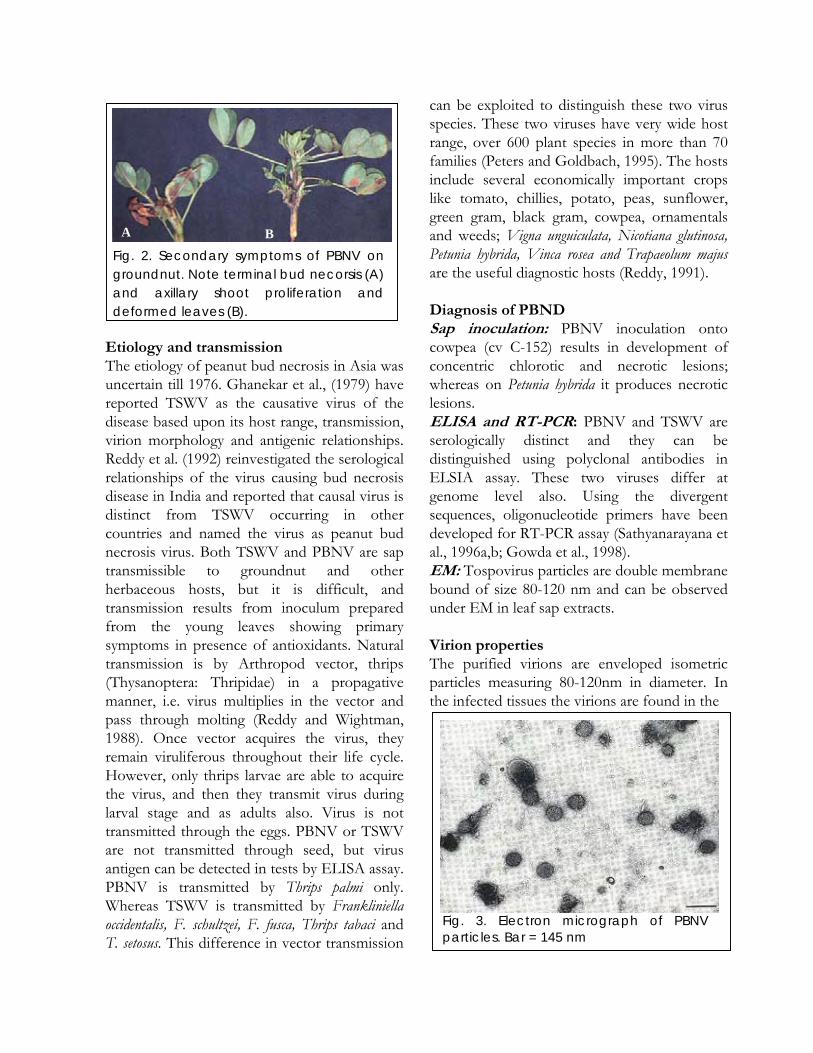
can be exploited to distinguish these two virus species. These two viruses have very wide host range, over 600 plant species in more than 70 families (Peters and Goldbach, 1995). The hosts include several economically important crops like tomato, chillies, potato, peas, sunflower, green gram, black gram, cowpea, ornamentals and weeds; Vigna unguiculata, Nicotiana glutinosa, Petunia hybrida, Vinca rosea and Trapaeolum majus are the useful diagnostic hosts (Reddy, 1991). Diagnosis of PBND Sap inoculation: PBNV inoculation onto cowpea (cv C-152) results in development of concentric chlorotic and necrotic lesions; whereas on Petunia hybrida it produces necrotic lesions. ELISA and RT-PCR: PBNV and TSWV are serologically distinct and they can be distinguished using polyclonal antibodies in ELSIA assay. These two viruses differ at genome level also. Using the divergent sequences, oligonucleotide primers have been developed for RT-PCR assay (Sathyanarayana et al., 1996a,b; Gowda et al., 1998). EM: Tospovirus particles are double membrane bound of size 80-120 nm and can be observed under EM in leaf sap extracts. Virion properties The purified virions are enveloped isometric particles measuring 80-120nm in diameter. In the infected tissues the virions are found in the
Fig. 2. Secondary symptoms of PBNV ongroundnut. Note terminal bud necorsis (A)and axillary shoot proliferation anddeformed leaves (B).
A B
Fig. 3. Electron micrograph of PBNVparticles. Bar = 145 nm
endoplasmic reticulum. Both TSWV and PBNV have very low thermal inactivation point (45oC for 10 min.) and short longevity in vitro (less than 5 hr. at room temperature). The genome of these viruses is ssRNA, in three species-large (L), medium (M) and small (S) RNAs (Moyer, 1999). The genome of TSWV contains three linear negative sense RNAs- L RNA (8897 nts), M RNA (4821 nts) and S RNA (2961 nts) (Peters and Goldbach, 1995). The three genome species of PBNV are sequenced; L RNA is 8911 nts, M RNA is 4801 nts and S RNA is 3057 nts (Sathyanarayana et al., 1996a,b; Gowda et al., 1998). The L RNA has a negative polarity, whereas the M RNA and S RNA are ambisense. The nucleocapsid (N) protein of TSWV is 29 kDa, and that of PBNV is 31 kDa. Based on antigenic relationships and nucleotide sequence similarities TSWV is assigned to serogroup-I and PBNV to serogroup-IV in the genus Tospovirus, family Bunyaviridae (Moyer, 1999). Ecology The viruses and thrips have very wide host range and therefore they can survive easily in time and space. Several crop, ornamental and weed plants have been identified as sources of both the viruses and their vectors (Reddy et al., 1991). The primary infection on the groundnut is from the virus present in alternative hosts through thrip vectors. A positive correlation is observed between the thrips population and the amount of the disease incidence. Thrip population flights are influenced by air temperature and wind velocity. The primary infected plants may not act as source for the secondary spread by thrips vectors in India because Thrips palmi may not colonize on groundnut. The plant density influences the incidence and progress of the disease. Control The management of bud necrosis disease is concentrated on the control of thrip vectors. Insecticide application is not recommended as it can lead to higher level of disease incidence.
The sowing dates of the crop are to be adjusted based on the information available on the arrival of thrip vectors. Sufficient plant density is to be maintained in the crop to minimize the vector landing and hence less disease incidence. Roguing of early infected plants may not prevent secondary spread. On the other hand it may lead to increased disease incidence, as it creates gaps within the field aiding vector landing. Intercropping of groundnut with tall crops like sorghum and pearl millet is to be encouraged to minimize the vector movement. Discourage intercropping of groundnut with other susceptible crops like green gram, black gram and cowpea. It may not be practical to manage the disease by destroying weed reservoir hosts. Several groundnut sources possessing resistance/tolerance to PBNV have been identified in groundnut cultivars and germplasm (Reddy and Subrahmanyam, 1996). ICGV 86029, 86031, 86388, 91239, 91245, 91246 and 91249 possess field resistance to PBNV. The genotypes resistant to T. palmi are ICGV 86029, ICGV 86031 and ICGV 86388. Transgenic groundnut expressing the genes of TSWV and PBNV are being attempted at ICRISAT and in USA (Culbreath et al., 2003). They are at developmental stage or yet to reach commercial fields (Zhijian Li et al., 1997). Endnote PBNV continued to be a very important virus in south and south-east Asia. It infects several crops, ornamental and weeds, making its control a difficult problem. PBNV so far was found only in Asia, and it causes symptoms very similar to that of TSWV. There are several reports of TSWV occurrence on several crop species in India, but in these studies rigorous testing for accurate identification of virus was not done to accurately confirm the virus identity as TSWV or PBNV. Contrary to this, all the studies, which have used standard testing procedures to identify virus from India, have showed occurrence of only PBNV on different crops, not the TSWV. This warrants a caution
in claiming TSWV as etiological agent in this region. Resistance to PBNV is scarce in the germplasm. Field resistance to PBND in groundnut varieties is due to the vector resistance. At ICRISAT efforts are being made to develop transgenic groundnut using PBNV N gene. References and Further reading Bhat, A.I., Jain, R.K., Varma, A. and Lal, S.K. 2002.
Nucleocapsid protein gene sequence studies suggest that soybean bud blight is caused by a strain of Groundnut bud necrosis virus. Current Science 82:1389-1392.
Buiel, A.A., Parlevliet, J.E. and Lennè, J.M. 1995. Recent studies on peanut bud necorsis disease. Proceedings of a meeting, 20 March 1995, ICRISAT, Patancheru India.
Camann, M.A., Culbreath, A.K., Pickering, J., Todd, J.W. and Demski, J.W. 1995. Spatial and temporal Patterns of spotted wilt epidemics in peanut. Phytopathology 85:879-85.
Culbreath, A.K., Todd, J.W. and Brown, S.L. 2003. Epidemiology and management of tomato spotted wilt in peanut. Annual Reviews of Phytopathology 41:53-75.
Ghanekar, A.M., Reddy, D.V.R., Iizuka, A., Amin, P.W. and Gibbons, R.W. 1979. Bud necrosis of groundnut (Arachis hypogae) in India caused by tomato spotted wilt virus. Annals of Applied Biology 93:173-179.
Gowda, S., Satyanarayana, T., Naidu, R.A., Mushegiana, A., Dawson, W.O., and Reddy, D.V.R. 1998. Characterization of the large (L) RNA of peanut bud necrosis tospovirus. Archves of Virology 143:2381-2390.
Huan Thien, Bhat, A.T. and Jain, R.K. 2003. Mungbean necrosis disease caused by a strain of groundnut bud necrosis virus. Indian Phytopathology 56: 54-60.
Moyer, J.W. 1999. Tospoviruses (Bunyaviridae). In: Encyclopedia of Virology (Eds. Webster and Granoff), pp.1803-1807. Academic Press, New York.
Peters, D. and Goldbach, R. 1995. The biology of Tospoviruses In: Singh, R.P., Singh, U.S and
Host Specificity in Plant Diseases. Vol III. Viruses and Viroids, Oxford, UK: Pergamon Press, pp. 199-210.
Reddy, D.V.R. 1991. Groundnut viruses and virus diseases: distribution, identification and control. Review of Plant Pathology 70, 665-678.
Reddy, D.V.R., Wightman, J.A., Beshear, R.J., Highland, B., Black, M., Sreenivasulu. P., Dwivedi, S.L., Demski, J.W., McDonald, D., Smith, J.W. and Smith, D.H. 1991. Bud Necrosis: A Disease of Groundnut caused by Tomato spotted wilt virus. ICRISAT Information Bulletin No.31, 20pp.
Reddy, D.V.R., Ratna, A.S., Sudarshana, M.R., Poul, F. and Kiran Kumar, I. 1992. Serological relationship and purification of bud necrosis virus, a tospovirus occurring peanut. Annals of Applied Biology 120:279-286.
Reddy, D.V.R. and Demski, J.W. 1996. Virus disease. In: Kokalis Burelle, N.,Porter, D.M., Rodriguez-Kabanta, R., Smith, D.H. and Subrahmanyam, P.(eds) Compendium of peanut Diseases, 2nd edn. American Phytopathological Society, St Paul, Minnesota, USA, pp.53-59.
Reddy, D.V.R. and Wightman, J.A. 1988. Tomato spotted wilt virus: trips transmission and control. In: Harries, K.F.(ed.) Advances in Disease Vector Research, Springer-Verlag, London.pp.202-220.
Reddy, L.J. and Subrahmanyam, P. 1996. Breeding for rosette resistant groundnut varieties, In:Reddy, D.C.R., Lenne, J.M., Delfosse, P. and Subrahmanyam,P.(eds) Groundnut Virus Diseases in Africa. Summary Proceedings of a Working Group Meeting 18-19 March 1996. Plant Protection Research Institute, Pretoria, South Africa. ICRISAT, Patancheru, India, pp.15-19.
Satyanarayana, T., Mitchell, S.E., Reddy, D.V.R., Kresovich, S., Jarret, R., Naidu, R.A. Gowda, S and Demski, J.W. 1996a. The complete nucleotide sequence and genome organization of the M RNA segment of peanut bud necrosis tospovirus and comparison with other tospoviruses. Journal of General Virology 77:2347-2352.

Satyanarayana, T., Mitchell, S.E., Reddy, D.V.R., Brown, S., Kresovich, S., Jarrer, R., Naidu, R.A. and Demski, J.W. 1996b. Peanut bud necrosis tospovirus S RNA: complete nucleotide sequence, genome organization and homology
to other tospoviruses. Archives of Virology 141: 85-98.
Zhijian Li, Rober, L., Jarret and Demski, J.W. 1997. Engineered resistance to tomato spotted wilt virus in transgenic peanut expressing the viral nucleocapsid gene. Transgenic Research 6: 297-305.
44.. PPeeaannuutt Stem Necrosis
RDVJ Prasad Rao1, AS Reddy2, F Waliyar2, P Sreenivasulu3 and P. Lava Kumar2
1NBPGR, Regional Station, Rajendranagar, Hyderabad 500 030, AP, India 2ICRISAT, Patancheru 502 324, AP, India
3Sri Venkateswara University, Tirupati 517502, AP, India
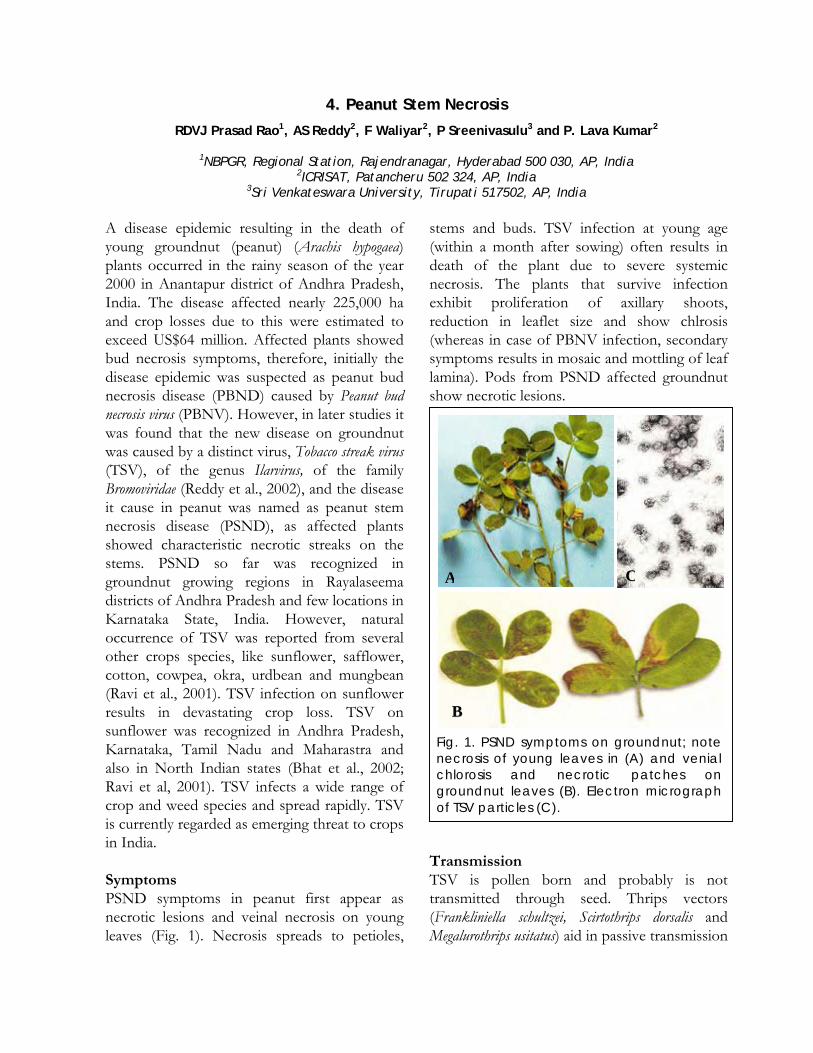
A disease epidemic resulting in the death of young groundnut (peanut) (Arachis hypogaea) plants occurred in the rainy season of the year 2000 in Anantapur district of Andhra Pradesh, India. The disease affected nearly 225,000 ha and crop losses due to this were estimated to exceed US$64 million. Affected plants showed bud necrosis symptoms, therefore, initially the disease epidemic was suspected as peanut bud necrosis disease (PBND) caused by Peanut bud necrosis virus (PBNV). However, in later studies it was found that the new disease on groundnut was caused by a distinct virus, Tobacco streak virus (TSV), of the genus Ilarvirus, of the family Bromoviridae (Reddy et al., 2002), and the disease it cause in peanut was named as peanut stem necrosis disease (PSND), as affected plants showed characteristic necrotic streaks on the stems. PSND so far was recognized in groundnut growing regions in Rayalaseema districts of Andhra Pradesh and few locations in Karnataka State, India. However, natural occurrence of TSV was reported from several other crops species, like sunflower, safflower, cotton, cowpea, okra, urdbean and mungbean (Ravi et al., 2001). TSV infection on sunflower results in devastating crop loss. TSV on sunflower was recognized in Andhra Pradesh, Karnataka, Tamil Nadu and Maharastra and also in North Indian states (Bhat et al., 2002; Ravi et al, 2001). TSV infects a wide range of crop and weed species and spread rapidly. TSV is currently regarded as emerging threat to crops in India. Symptoms PSND symptoms in peanut first appear as necrotic lesions and veinal necrosis on young leaves (Fig. 1). Necrosis spreads to petioles,
stems and buds. TSV infection at young age (within a month after sowing) often results in death of the plant due to severe systemic necrosis. The plants that survive infection exhibit proliferation of axillary shoots, reduction in leaflet size and show chlrosis (whereas in case of PBNV infection, secondary symptoms results in mosaic and mottling of leaf lamina). Pods from PSND affected groundnut show necrotic lesions. Transmission TSV is pollen born and probably is not transmitted through seed. Thrips vectors (Frankliniella schultzei, Scirtothrips dorsalis and Megalurothrips usitatus) aid in passive transmission
AA
BB
CC
Fig. 1. PSND symptoms on groundnut; notenecrosis of young leaves in (A) and venialchlorosis and necrotic patches ongroundnut leaves (B). Electron micrographof TSV particles (C).
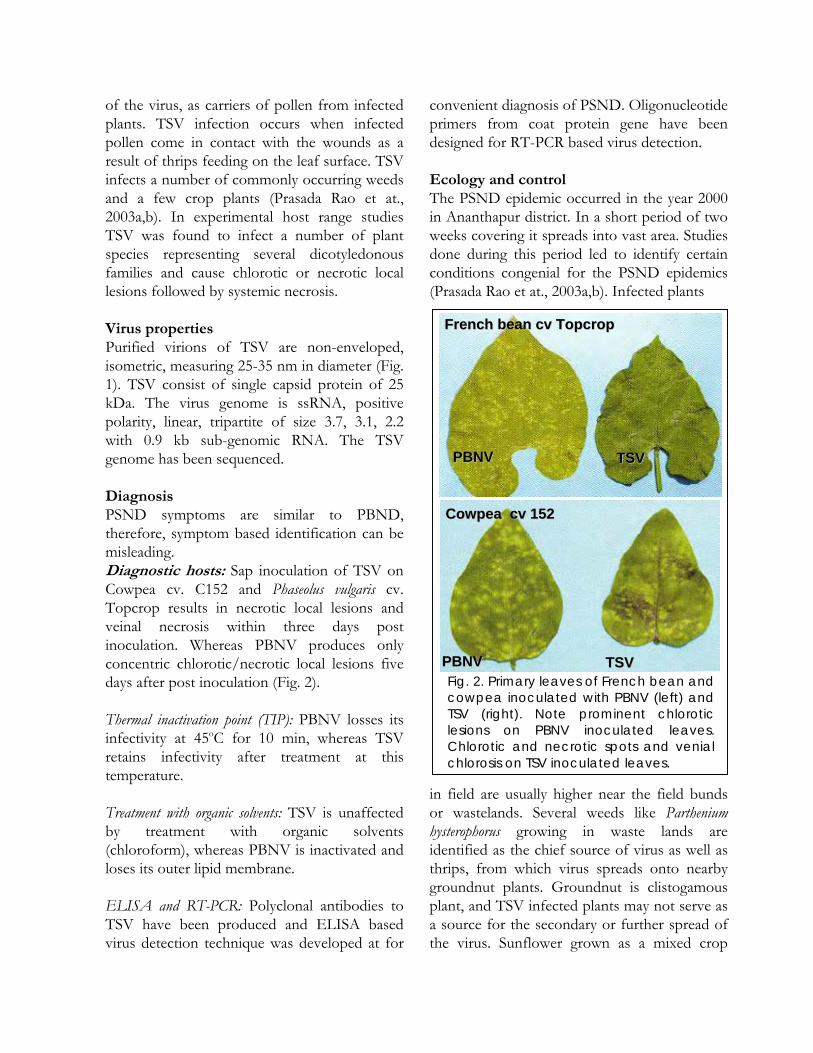
of the virus, as carriers of pollen from infected plants. TSV infection occurs when infected pollen come in contact with the wounds as a result of thrips feeding on the leaf surface. TSV infects a number of commonly occurring weeds and a few crop plants (Prasada Rao et at., 2003a,b). In experimental host range studies TSV was found to infect a number of plant species representing several dicotyledonous families and cause chlorotic or necrotic local lesions followed by systemic necrosis. Virus properties Purified virions of TSV are non-enveloped, isometric, measuring 25-35 nm in diameter (Fig. 1). TSV consist of single capsid protein of 25 kDa. The virus genome is ssRNA, positive polarity, linear, tripartite of size 3.7, 3.1, 2.2 with 0.9 kb sub-genomic RNA. The TSV genome has been sequenced. Diagnosis PSND symptoms are similar to PBND, therefore, symptom based identification can be misleading. Diagnostic hosts: Sap inoculation of TSV on Cowpea cv. C152 and Phaseolus vulgaris cv. Topcrop results in necrotic local lesions and veinal necrosis within three days post inoculation. Whereas PBNV produces only concentric chlorotic/necrotic local lesions five days after post inoculation (Fig. 2). Thermal inactivation point (TIP): PBNV losses its infectivity at 45oC for 10 min, whereas TSV retains infectivity after treatment at this temperature. Treatment with organic solvents: TSV is unaffected by treatment with organic solvents (chloroform), whereas PBNV is inactivated and loses its outer lipid membrane. ELISA and RT-PCR: Polyclonal antibodies to TSV have been produced and ELISA based virus detection technique was developed at for
convenient diagnosis of PSND. Oligonucleotide primers from coat protein gene have been designed for RT-PCR based virus detection. Ecology and control The PSND epidemic occurred in the year 2000 in Ananthapur district. In a short period of two weeks covering it spreads into vast area. Studies done during this period led to identify certain conditions congenial for the PSND epidemics (Prasada Rao et at., 2003a,b). Infected plants in field are usually higher near the field bunds or wastelands. Several weeds like Parthenium hysterophorus growing in waste lands are identified as the chief source of virus as well as thrips, from which virus spreads onto nearby groundnut plants. Groundnut is clistogamous plant, and TSV infected plants may not serve as a source for the secondary or further spread of the virus. Sunflower grown as a mixed crop
CCoowwppeeaa ccvv 115522
FFrreenncchh bbeeaann ccvv TTooppccrroopp
PPBBNNVV TTSSVV
PPBBNNVV TTSSVV Fig. 2. Primary leaves of French bean andcowpea inoculated with PBNV (left) andTSV (right). Note prominent chloroticlesions on PBNV inoculated leaves.Chlorotic and necrotic spots and venialchlorosis on TSV inoculated leaves.

along with peanut or as a pure crop adjacent to peanut can act as a source of virus and thrips.
Removal of weed hosts growing around the peanut fields is helpful to reduce disease incidence, roguing of early infected groundnut plants many not limit further spread of the disease in the fields. Border cropping with pearl millet, maize or sorghum around the peanut fields may decrease the disease incidence by obstructing the movement of thrips flying into the fields. Maintenance of optimum plant density is important to discourage landing of thrips. Seed treatment with systemic insecticides may prevent vector infestation at early stage of the crop growth. Limited germplasm screening trials have indicated that A. chacoense (ICG 4983) is infected with TSV but showed no symptoms. Improved groundnut varieties ICGV 92267, 99029 and 01276 have shown consistently low disease incidence during field evaluations (Prasada Rao et al., 2003a,b). Efforts are being made to develop transgenic resistance using TSV coat protein gene.
References and Further reading Bhat, A.I., Jain, R.K., Kumar. A., Ramiah, M. and
Varma, A. 2002. Serological and coat protein sequence studies suggest that necrosis disease on sunflower in India is caused by a strain of
Tobacco streak virus. Archives of Virology 147:651-658.
Reddy, A.S., Prasad Rao, R.D.V.J., Thirumal-Devi, K., Reddy, S.V., Mayo, M, Roberts I,M., Satryanrayana, T., Subramaniam, K. and Reddy, D.V.R. 2002. Occurrence of tobacco streak virus on peanut (Arachis hypogaea L.) in India. Plant Disease 86:173-178.
Prasada Rao, R.D.V.J., Reddy, D.V.R., Nigam, S.N., Reddy, A.S., Waliyar, F., Yellamanda Reddy, T., Subramanyam, K., John Sudheer, M., Naik, K.S.S. Bandyopadhyay, A., Desai, S., Ghewande, M.P., Basu, M.S. and Somasekhar. 2003a. Peanut Stem Necrosis: A New Disease of Groundnut in India. Information Bulletin No. 67. Patancheru 502 324, Andhra Pradesh, India: International Crops Research Institute for the Semi-Arid Tropics. 12pp.
Prasada Rao, R.D.V.J., Reddy, A.S., Reddy, S.V., Thirumala Devi, K., Chandar Rao, S., Manoj Kumar V., Subramniam, K., Yellamanda Reddy, T., Nigam, S.N. and Reddy, D.V.R 2003b. The host range of Tobacco streak virus in India and transmission by thrips. Annals of Applied Biology 142:365-368.
Ravi, K.S., Buttgereitt, A., Kitkaru, A.S., Deshmukh, S., Lesemann, D.E. and Winder. S. 2001. Sunflower necrosis disease from India is caused by an Ilarvirus related to Tobacco streak virus. Plant Pathology 5:800.
55.. CChhiicckkppeeaa SSttuunntt DDiisseeaassee
SV Reddy, P Lava Kumar and Farid Waliyar
ICRISAT, Patancheru 502 324, AP, India India is the largest producer of chickpea (Cicer arietinum) with nearly 75% of global production concentrated in this region. Several fungal, viral and insects attack chickpea crop at all stages of the growth and cause severe crop losses. Stunt disease of chickpea (CpSD: chickpea stunt disease) is the most important virus disease caused by luteoviruses, is endemic in India and other chickpea growing countries in the world. More than one luteovirus is involved in the CpSD etiology in various countries. Mixed infections due to involvement of more than one luteovirus or a luteovirus / geminivirus / potyvirus is not uncommon. In India a luteovirus (Chickepa stunt disease associated virus – CpSDaV) and geminivirus (Chickpea chlorotic dwarf virus – CCDV) are predominantly associated with CpSD-affected plants. Both these viruses cause symptoms similar to CpSD, and are difficult to distinguish by symptoms alone. Causal viruses Several luteoviruses were reported to cause symptoms similar to stunt disease in different countries: Pea leaf roll virus [synonymous with Bean leaf roll virus (BLRV)] in Iran; Subterranean clover red leaf virus [a strain of Soybean dwarf virus (SDV)] and Beet western yellows virus (BWYV) in California, USA; and BLRV and BWYV in Spain. In India, two different luteoviruses, BWYV and CpSDaV of genus Polerovirus, family Luteoviridae; and the leafhopper transmitted Chickpea chlorotic dwarf virus (CCDV), genus Cutovirus, family Geminiviridae are predominantly associated with CpSD. The BWYV found in only a small proportion of CpSD plants at certain locations, whereas CpSDaV and CCDV are widely distributed.
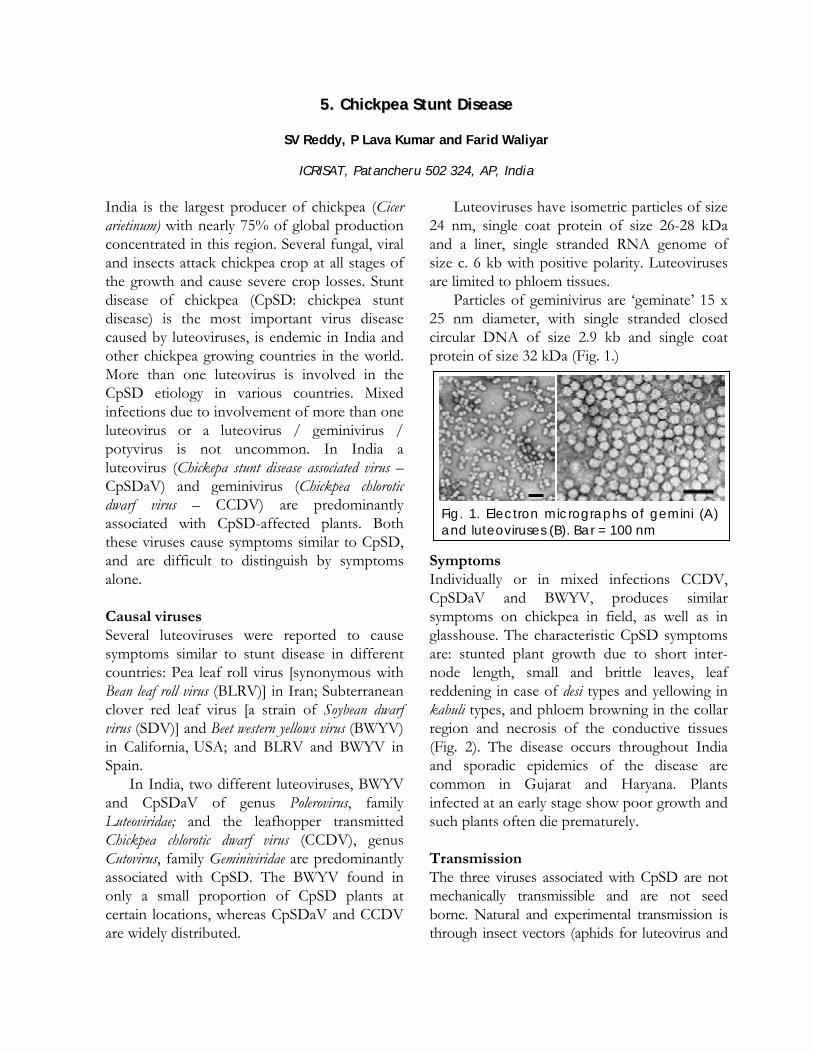
Luteoviruses have isometric particles of size 24 nm, single coat protein of size 26-28 kDa and a liner, single stranded RNA genome of size c. 6 kb with positive polarity. Luteoviruses are limited to phloem tissues. Particles of geminivirus are ‘geminate’ 15 x 25 nm diameter, with single stranded closed circular DNA of size 2.9 kb and single coat protein of size 32 kDa (Fig. 1.) Symptoms Individually or in mixed infections CCDV, CpSDaV and BWYV, produces similar symptoms on chickpea in field, as well as in glasshouse. The characteristic CpSD symptoms are: stunted plant growth due to short inter-node length, small and brittle leaves, leaf reddening in case of desi types and yellowing in kabuli types, and phloem browning in the collar region and necrosis of the conductive tissues (Fig. 2). The disease occurs throughout India and sporadic epidemics of the disease are common in Gujarat and Haryana. Plants infected at an early stage show poor growth and such plants often die prematurely. Transmission The three viruses associated with CpSD are not mechanically transmissible and are not seed borne. Natural and experimental transmission is through insect vectors (aphids for luteovirus and
AA BB
Fig. 1. Electron micrographs of gemini (A)and luteoviruses (B). Bar = 100 nm
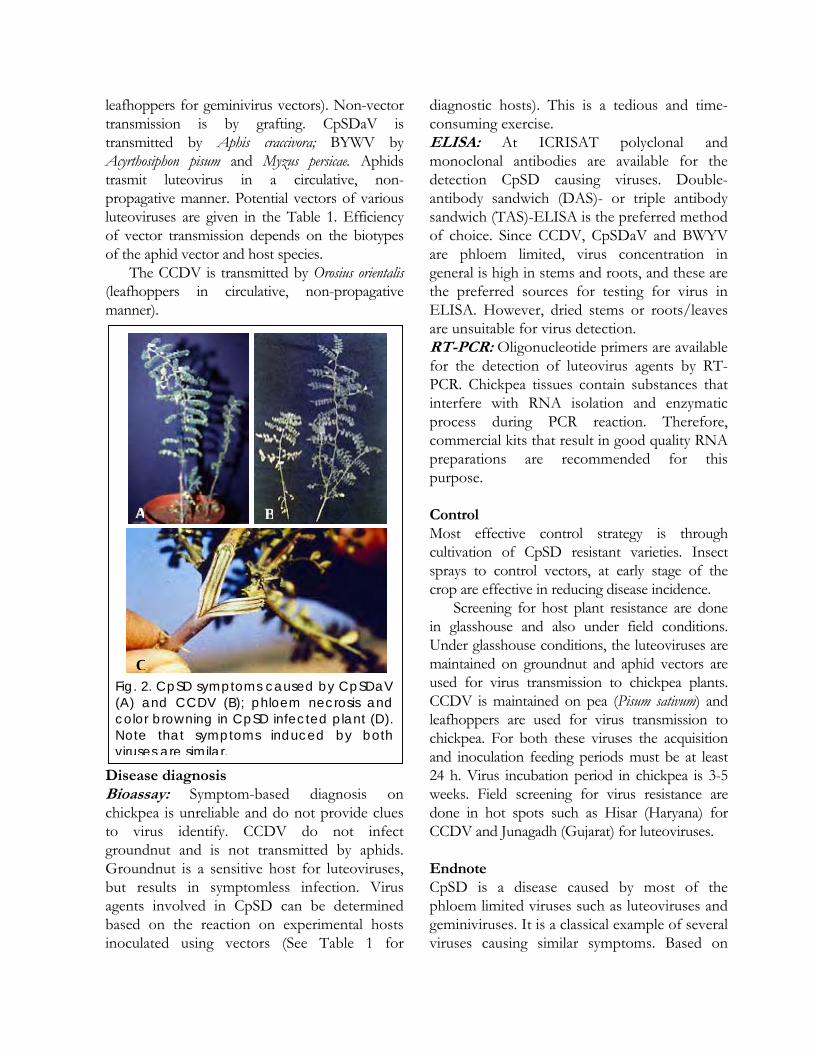
leafhoppers for geminivirus vectors). Non-vector transmission is by grafting. CpSDaV is transmitted by Aphis craccivora; BYWV by Acyrthosiphon pisum and Myzus persicae. Aphids trasmit luteovirus in a circulative, non-propagative manner. Potential vectors of various luteoviruses are given in the Table 1. Efficiency of vector transmission depends on the biotypes of the aphid vector and host species.
The CCDV is transmitted by Orosius orientalis (leafhoppers in circulative, non-propagative manner). Disease diagnosis Bioassay: Symptom-based diagnosis on chickpea is unreliable and do not provide clues to virus identify. CCDV do not infect groundnut and is not transmitted by aphids. Groundnut is a sensitive host for luteoviruses, but results in symptomless infection. Virus agents involved in CpSD can be determined based on the reaction on experimental hosts inoculated using vectors (See Table 1 for
diagnostic hosts). This is a tedious and time-consuming exercise. ELISA: At ICRISAT polyclonal and monoclonal antibodies are available for the detection CpSD causing viruses. Double-antibody sandwich (DAS)- or triple antibody sandwich (TAS)-ELISA is the preferred method of choice. Since CCDV, CpSDaV and BWYV are phloem limited, virus concentration in general is high in stems and roots, and these are the preferred sources for testing for virus in ELISA. However, dried stems or roots/leaves are unsuitable for virus detection. RT-PCR: Oligonucleotide primers are available for the detection of luteovirus agents by RT-PCR. Chickpea tissues contain substances that interfere with RNA isolation and enzymatic process during PCR reaction. Therefore, commercial kits that result in good quality RNA preparations are recommended for this purpose. Control Most effective control strategy is through cultivation of CpSD resistant varieties. Insect sprays to control vectors, at early stage of the crop are effective in reducing disease incidence.
Screening for host plant resistance are done in glasshouse and also under field conditions. Under glasshouse conditions, the luteoviruses are maintained on groundnut and aphid vectors are used for virus transmission to chickpea plants. CCDV is maintained on pea (Pisum sativum) and leafhoppers are used for virus transmission to chickpea. For both these viruses the acquisition and inoculation feeding periods must be at least 24 h. Virus incubation period in chickpea is 3-5 weeks. Field screening for virus resistance are done in hot spots such as Hisar (Haryana) for CCDV and Junagadh (Gujarat) for luteoviruses. Endnote CpSD is a disease caused by most of the phloem limited viruses such as luteoviruses and geminiviruses. It is a classical example of several viruses causing similar symptoms. Based on
C
AA B
Fig. 2. CpSD symptoms caused by CpSDaV(A) and CCDV (B); phloem necrosis andcolor browning in CpSD infected plant (D).Note that symptoms induced by bothviruses are similar.
symptoms CpSD can be diagnosed in the field, however, rigorous assays are required to identify the causal virus associated with the disease in that particular region to formulate a specific control strategy. The abundance of different luteoviruses surviving in reservoir hosts and prevalence of different aphid vector species and biotypes, and leafhoppers occurring in the proximity of chickpea crops presumably determine which virus or what proportion of different viruses occur in each year. Mixed infections are common in CpSD plants. However, the effect of synergistic interaction in the case of mixed infections between luteoviruses, and luteoviruses and CCDV on symptom severity and host-plant resistance is not known. Disease control strategy should be aimed at all the major viruses involved in CpSD for efficient management of the disease. References and Further reading Allen, D.J. and Lennè, J.M. 1998. The pathology of
food and pasture legumes. CAB International, Wallingford, UK.
Horn, N.M., Reddy, S.V., Roberts, I.M. and Reddy, D.V.R. 1993. Chickpea chlorotic dwarf virus, a new leafhopper-transmitted geminivirus of chickpea in India. Annals of Applied Biology 122:467-479.
Horn, N.M., Reddy, S.V. and Reddy, D.V.R. 1994. Virus-vector relationships of chickpea chlorotic dwarf geminivirus and the leafhopper Orosius orientalis (Hemiptera: Cicadellidae). Annals of Applied Biology 124:441-450.
Horn, N.M., Reddy, S.V., Reddy, D.V.R. 1995. Assessment of yield loss caused by chickpea chlorotic dwarf geminivirus in chickpea. European journal of plant pathology101: 221-224.
Horn, N.M., Reddy. S.V., van den Heuvel, J.F.J.M. and Reddy, D.V.R. 1996. Survey of chickpea (Cicer arietinum L.) for chickpea stunt disease and associated viruses in India and Pakistan. Plant Disease 80:286-290.
Reddy, S.V. and Kumar, P.L. 2004. Transmission and properties of a new luteovirus associated with chickpea stunt disease in India. Current Science 86 (8): (In press)
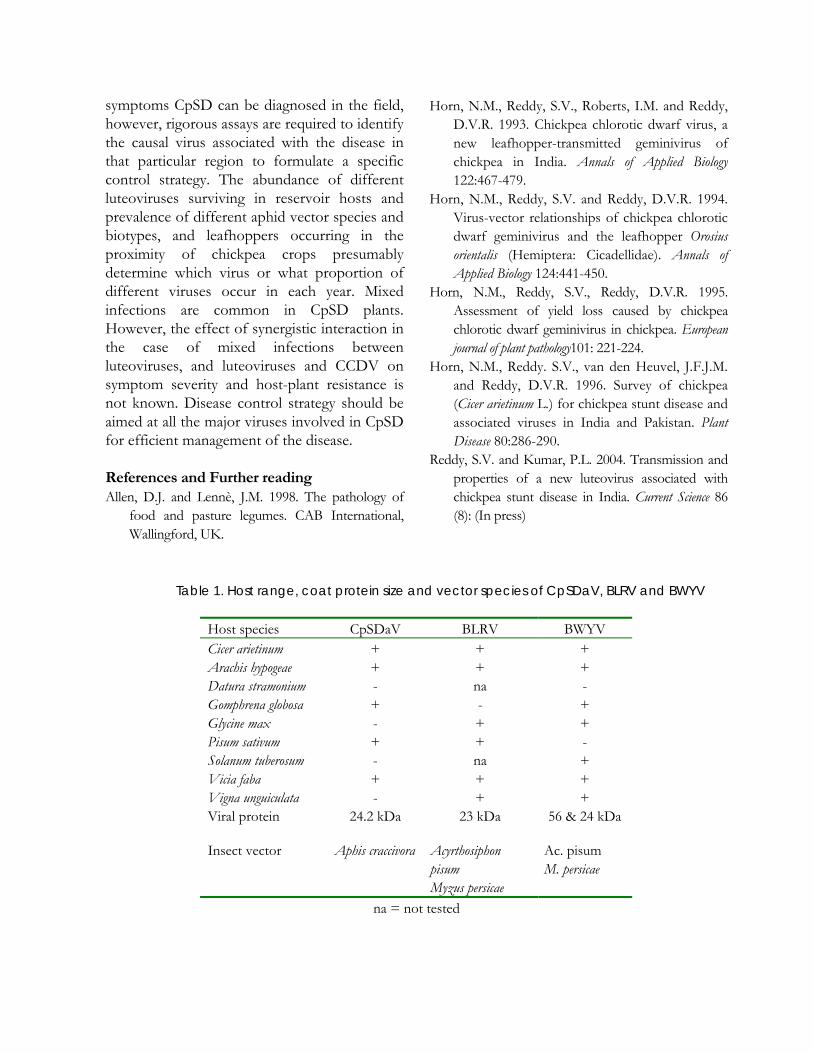
Table 1. Host range, coat protein size and vector species of CpSDaV, BLRV and BWYV
Host species CpSDaV BLRV BWYV Cicer arietinum + + + Arachis hypogeae + + + Datura stramonium - na - Gomphrena globosa + - + Glycine max - + + Pisum sativum + + - Solanum tuberosum - na + Vicia faba + + + Vigna unguiculata - + + Viral protein 24.2 kDa 23 kDa 56 & 24 kDa
Insect vector Aphis craccivora
Acyrthosiphon pisum Myzus persicae
Ac. pisum M. persicae
na = not tested
6. Plant Virus Diseases of Quarantine Importance
R D V J Prasada Rao and K S Varaprasad
National Bureau of Plant Genetic Resources (NBPGR) Regional Station, Rajendra Nagar, Hyderabad-500 030
Introductions of useful planting material (seed and vegetative propagules) from one region to another region have played a significant role in diversifying Indian agriculture. However, such introductions have the inherent risk of introducing exotic pathogens, particularly viruses, into the country.
For over a century, plant viruses have been known to reduce the yield and quality of horticultural, ornamental, field and vegetable crops. At present, about one thousand plant virus diseases have been recognized worldwide. Unlike fungal and bacterial diseases virus disease cannot be controlled by chemical treatments. Control is primarily through exclusion or minimizing the virus entry into fields or into new geographical regions. To make this processes more effective, certification and/or quarantine systems are established by state agencies to prevent the spread of viruses into new geographic areas A) Plant Quarantine Plant Quarantine is a legal enforcement of measures aimed to prevent pests and pathogens from spreading into new regions or to prevent further perpetuation of escaped exotic pathogen, in case they have already found entry and established in a new area.
Plant quarantine is a national service provided by the central and state governments for the benefit of the national agriculture system. The guidelines for promulgating quarantine regulations are generally based on the suggestions made by international organization or intergovernmental agreements or conventions, which are organized within the framework of the Food and Agricultural Organization (FAO).
The Government of India enacted the Destructive Insects and Pests (DIP) Act in 1914 in order to regulate the imports to restrict the entry of exotic pests, pathogens and weeds. This act, which was amended from time to time, forms the basis of functioning of the Directorate of Plant Protection, Quarantine and Storage (DPPQ&S) of Ministry of Agriculture. This organization have national network of plant quarantine and fumigation stations at different airports, seaports and land frontiers. The notifications issued under the act as plant, fruits and seeds (PFS) order 1985, which was Revised in 1989, and which is under further revision because of the new policy announcement on seed development by Government of India, lead to liberalizing the import of seeds and planting materials for the benefit of Indian farmers.
The authority for enforcing plant quarantine in India basically rests with the DPPQ&S at Faridabad, India. In addition to this, the Government of India has authorized three other national institutions to handle quarantine clearance of seed and plant material imported for research purpose. These are,
− National Bureau of Plant Genetic Resources (NBPGR), New Delhi and its regional stations, for clearance of germplasm material of agri-horticultural and agri-silvicultural crops
− Forest Research Institute, Dehradun, for forestry crops
− Botanical Survey of India, Calcutta for plants of botanical interest
. The Plant Quarantine and Fumigation
Stations under the DPPQ&S undertake quarantine processing and clearance of bulk

consignments meant for sowing, planting and consumption. The NBPGR is authorized to handle quarantine processing of germplasm and transgenic planting material under exchange. In 1986, the NBPGR regional station at Hyderabad was established for quarantine processing of International Crops Research Institute for the Semi-Arid Tropics (ICRISAT) crop material, and rice material for Directorate of Rice Research (DRR) in Hyderabad. As on today NBPGR regional station has processed about 650,000 germplasm accessions of ICRISAT. B) Domestic (Internal) Quarantine The Central and State Governments are jointly responsible for regulating the movement of plants and plant materials within the country. Central governments look after the inter-state movement, while the State Government manages intra-state movement. To check further spread of pests and diseases, which are restricted to certain regions in the country, the Central Government issue notifications under the DIP Act, which are enforced in collaboration with State Governments. Under the DIP Act, State Governments are also empowered to issue notifications or to make acts to prevent further spread of pests and diseases within the state.
The Government of India has so far issued notifications against 8 pests/pathogens, 3 of which are virus diseases:
1) The spread of banana bunchy top disease from Assam, Kerala, Orissa, Tamil Nadu and West Bengal to other parts of India
2) The spread of banana mosaic from Gujarat and Maharastra to other States of the country
3) The spread of Peanut stripe virus (PStV) from Gujarat to other states of the country
In addition to above, the Central Government notifications to Tamil Nadu Government has prohibited the movement of
any potato germplasm from Nilgiri and Kodaikanal areas to any other part within the state or outside the state to prevent spread of the golden nematode (Globodera rostochiensis and G. pallida). (More details about DIP notifications are available on DPPQ&S website). C) Monitoring for Virus Movement Across Borders Most of the plant germplasm is moved in country or outside the country in the form of seed. In some cases it is through vegetative plant material [unrooted cutting (sugarcane, cassava) suckers (banana) budwood (citrus)]. Movement of plant material as whole plant or rooted cuttings is rare, but not uncommon. (i) Movement through vegetatively propagated seed stocks Most plant viruses infect many of their plant hosts systemically (whole plant infection) and such plants remain infected all through its life. Many economically important fruit, ornamental and certain food crops are vegetatively propagated. If such plants are infected systemically, vegetative parts (tubers, corms, bulbs, suckers, bud grafts, stem cuttings) taken from infected plants serve as source for virus spread. When such cuttings are planted in new regions, along with the plant, virus also establishes. Any plant virus and viroids, are capable of transmission through vegetative stocks. Therefore, importation of vegetative plant parts poses greater risk of virus spread into new regions. (ii) Movement through seed Most common means of germplasm movement is through seed. Few viruses (108 of about 1000 viruses reported) are capable of transmission through seed, because of this shipment of seeds poses less risk. Virus transmission through seed depends on the interaction between virus and host, and this relation is specific. For example Tobacco mosaic virus is transmitted through seed
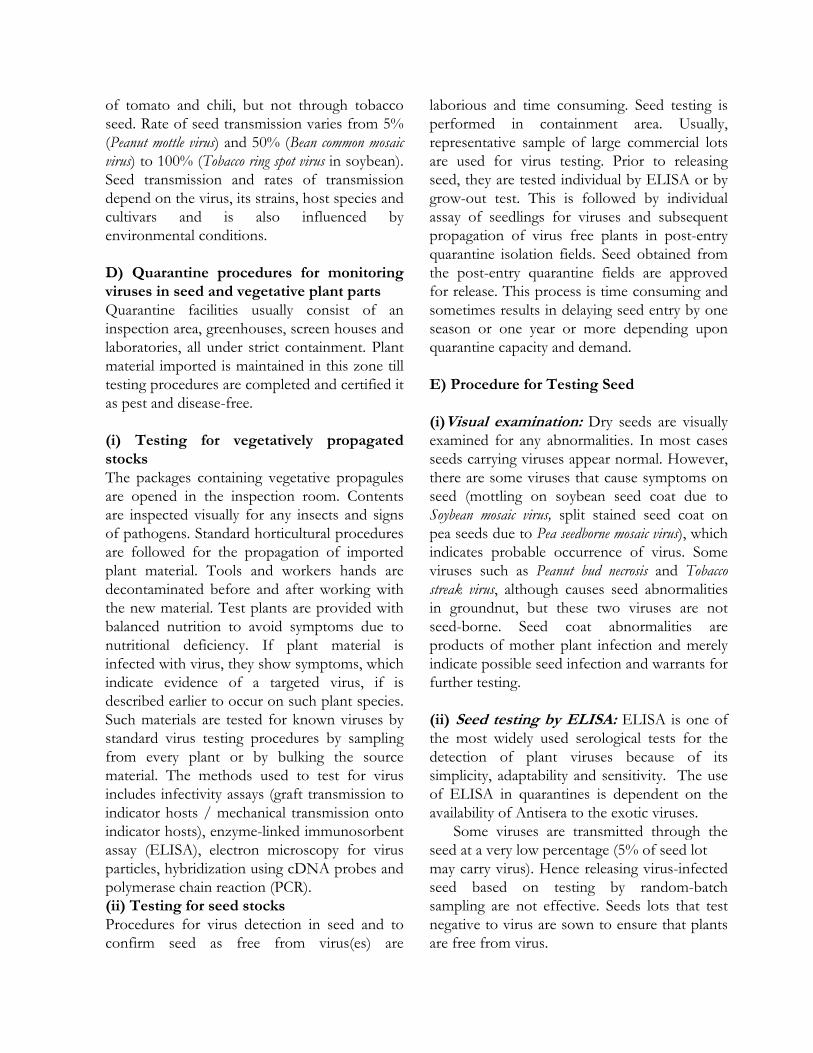
of tomato and chili, but not through tobacco seed. Rate of seed transmission varies from 5% (Peanut mottle virus) and 50% (Bean common mosaic virus) to 100% (Tobacco ring spot virus in soybean). Seed transmission and rates of transmission depend on the virus, its strains, host species and cultivars and is also influenced by environmental conditions.
D) Quarantine procedures for monitoring viruses in seed and vegetative plant parts Quarantine facilities usually consist of an inspection area, greenhouses, screen houses and laboratories, all under strict containment. Plant material imported is maintained in this zone till testing procedures are completed and certified it as pest and disease-free. (i) Testing for vegetatively propagated stocks The packages containing vegetative propagules are opened in the inspection room. Contents are inspected visually for any insects and signs of pathogens. Standard horticultural procedures are followed for the propagation of imported plant material. Tools and workers hands are decontaminated before and after working with the new material. Test plants are provided with balanced nutrition to avoid symptoms due to nutritional deficiency. If plant material is infected with virus, they show symptoms, which indicate evidence of a targeted virus, if is described earlier to occur on such plant species. Such materials are tested for known viruses by standard virus testing procedures by sampling from every plant or by bulking the source material. The methods used to test for virus includes infectivity assays (graft transmission to indicator hosts / mechanical transmission onto indicator hosts), enzyme-linked immunosorbent assay (ELISA), electron microscopy for virus particles, hybridization using cDNA probes and polymerase chain reaction (PCR). (ii) Testing for seed stocks Procedures for virus detection in seed and to confirm seed as free from virus(es) are
laborious and time consuming. Seed testing is performed in containment area. Usually, representative sample of large commercial lots are used for virus testing. Prior to releasing seed, they are tested individual by ELISA or by grow-out test. This is followed by individual assay of seedlings for viruses and subsequent propagation of virus free plants in post-entry quarantine isolation fields. Seed obtained from the post-entry quarantine fields are approved for release. This process is time consuming and sometimes results in delaying seed entry by one season or one year or more depending upon quarantine capacity and demand. E) Procedure for Testing Seed (i)Visual examination: Dry seeds are visually examined for any abnormalities. In most cases seeds carrying viruses appear normal. However, there are some viruses that cause symptoms on seed (mottling on soybean seed coat due to Soybean mosaic virus, split stained seed coat on pea seeds due to Pea seedborne mosaic virus), which indicates probable occurrence of virus. Some viruses such as Peanut bud necrosis and Tobacco streak virus, although causes seed abnormalities in groundnut, but these two viruses are not seed-borne. Seed coat abnormalities are products of mother plant infection and merely indicate possible seed infection and warrants for further testing. (ii) Seed testing by ELISA: ELISA is one of the most widely used serological tests for the detection of plant viruses because of its simplicity, adaptability and sensitivity. The use of ELISA in quarantines is dependent on the availability of Antisera to the exotic viruses.
Some viruses are transmitted through the seed at a very low percentage (5% of seed lot may carry virus). Hence releasing virus-infected seed based on testing by random-batch sampling are not effective. Seeds lots that test negative to virus are sown to ensure that plants are free from virus.
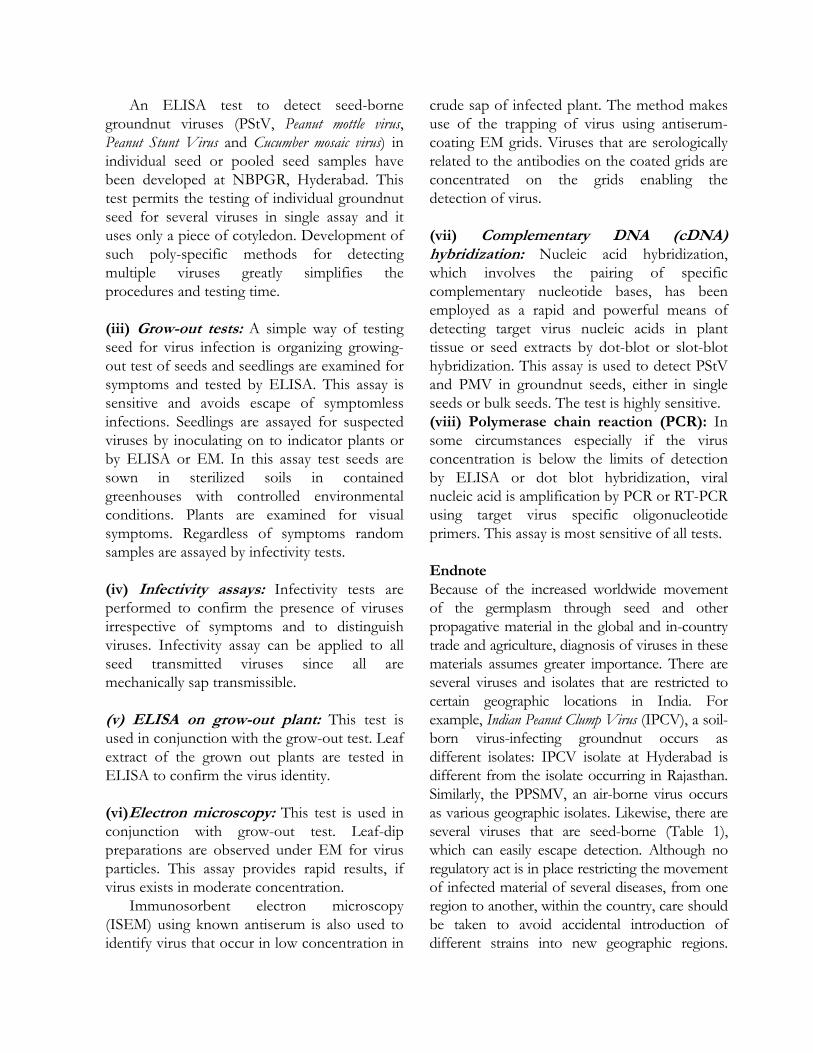
An ELISA test to detect seed-borne groundnut viruses (PStV, Peanut mottle virus, Peanut Stunt Virus and Cucumber mosaic virus) in individual seed or pooled seed samples have been developed at NBPGR, Hyderabad. This test permits the testing of individual groundnut seed for several viruses in single assay and it uses only a piece of cotyledon. Development of such poly-specific methods for detecting multiple viruses greatly simplifies the procedures and testing time. (iii) Grow-out tests: A simple way of testing seed for virus infection is organizing growing-out test of seeds and seedlings are examined for symptoms and tested by ELISA. This assay is sensitive and avoids escape of symptomless infections. Seedlings are assayed for suspected viruses by inoculating on to indicator plants or by ELISA or EM. In this assay test seeds are sown in sterilized soils in contained greenhouses with controlled environmental conditions. Plants are examined for visual symptoms. Regardless of symptoms random samples are assayed by infectivity tests. (iv) Infectivity assays: Infectivity tests are performed to confirm the presence of viruses irrespective of symptoms and to distinguish viruses. Infectivity assay can be applied to all seed transmitted viruses since all are mechanically sap transmissible. (v) ELISA on grow-out plant: This test is used in conjunction with the grow-out test. Leaf extract of the grown out plants are tested in ELISA to confirm the virus identity. (vi)Electron microscopy: This test is used in conjunction with grow-out test. Leaf-dip preparations are observed under EM for virus particles. This assay provides rapid results, if virus exists in moderate concentration.
Immunosorbent electron microscopy (ISEM) using known antiserum is also used to identify virus that occur in low concentration in
crude sap of infected plant. The method makes use of the trapping of virus using antiserum-coating EM grids. Viruses that are serologically related to the antibodies on the coated grids are concentrated on the grids enabling the detection of virus. (vii) Complementary DNA (cDNA) hybridization: Nucleic acid hybridization, which involves the pairing of specific complementary nucleotide bases, has been employed as a rapid and powerful means of detecting target virus nucleic acids in plant tissue or seed extracts by dot-blot or slot-blot hybridization. This assay is used to detect PStV and PMV in groundnut seeds, either in single seeds or bulk seeds. The test is highly sensitive. (viii) Polymerase chain reaction (PCR): In some circumstances especially if the virus concentration is below the limits of detection by ELISA or dot blot hybridization, viral nucleic acid is amplification by PCR or RT-PCR using target virus specific oligonucleotide primers. This assay is most sensitive of all tests.
Endnote Because of the increased worldwide movement of the germplasm through seed and other propagative material in the global and in-country trade and agriculture, diagnosis of viruses in these materials assumes greater importance. There are several viruses and isolates that are restricted to certain geographic locations in India. For example, Indian Peanut Clump Virus (IPCV), a soil-born virus-infecting groundnut occurs as different isolates: IPCV isolate at Hyderabad is different from the isolate occurring in Rajasthan. Similarly, the PPSMV, an air-borne virus occurs as various geographic isolates. Likewise, there are several viruses that are seed-borne (Table 1), which can easily escape detection. Although no regulatory act is in place restricting the movement of infected material of several diseases, from one region to another, within the country, care should be taken to avoid accidental introduction of different strains into new geographic regions.
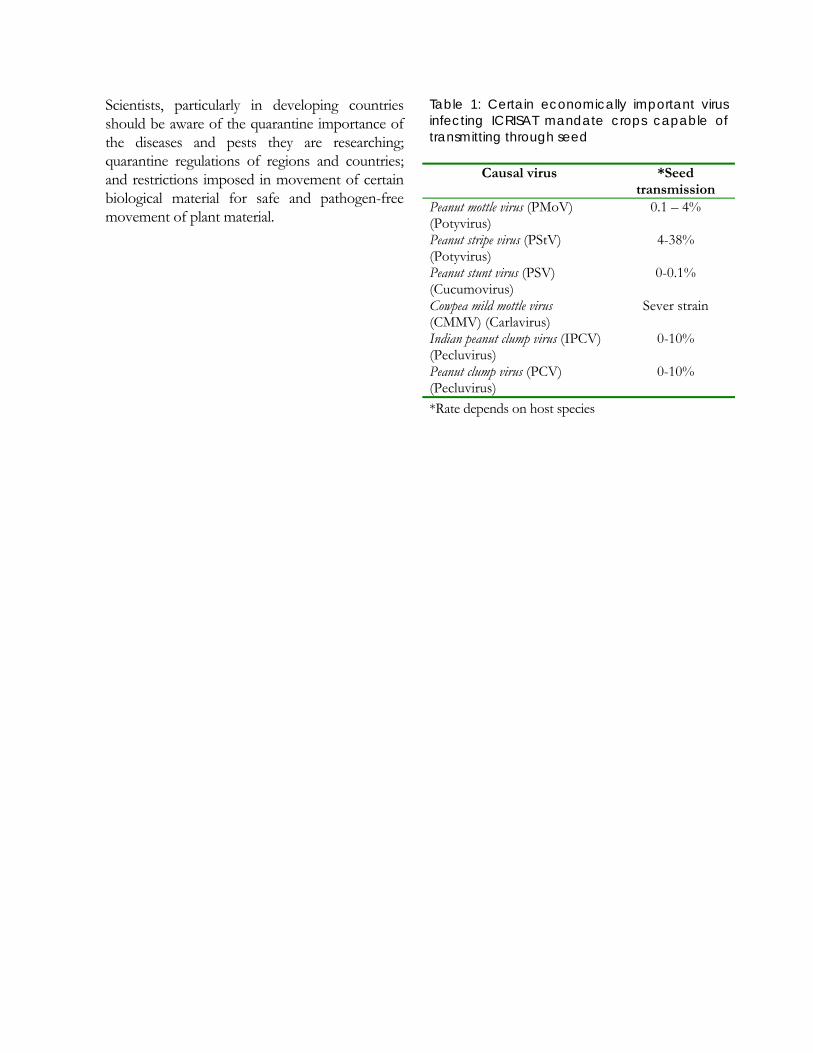
Scientists, particularly in developing countries should be aware of the quarantine importance of the diseases and pests they are researching; quarantine regulations of regions and countries; and restrictions imposed in movement of certain biological material for safe and pathogen-free movement of plant material.
Table 1: Certain economically important virus infecting ICRISAT mandate crops capable of transmitting through seed
Causal virus *Seed transmission
Peanut mottle virus (PMoV) (Potyvirus)
0.1 – 4%
Peanut stripe virus (PStV) (Potyvirus)
4-38%
Peanut stunt virus (PSV) (Cucumovirus)
0-0.1%
Cowpea mild mottle virus (CMMV) (Carlavirus)
Sever strain
Indian peanut clump virus (IPCV) (Pecluvirus)
0-10%
Peanut clump virus (PCV) (Pecluvirus)
0-10%
*Rate depends on host species
SSeeccttiioonn -- IIII VViirruuss ddiisseeaassee ddiiaaggnnoossiiss aanndd ssccrreeeenniinngg ffoorr rreessiissttaannccee
7. Diagnosis of Virus Diseases
P Lava Kumar, *P Sreenivasulu and F Waliyar
ICRISAT, Patancheru 502 324, AP, India *Sri Venkateswara University, Tirupati 517 502, AP, India
Plant viruses cause major losses to agricultural crops around the world. Chemical agents similar to fungicides and bactericides are not effective to control virus diseases. Strategies for virus management are mostly aimed at eradicating the source of infection to prevent it from reaching the crop and interfering with the movement of vectors to prevent the spread of the disease. However, the most effective means of controlling virus diseases is through cultivating the virus-resistant varieties. Precise identification of the causal agent is the first step in management of virus diseases. Although accurate description of symptoms is necessary to describe the disease, virus diagnosis should not be based on symptoms alone, because several unrelated viruses cause similar symptoms and same virus or its strains can result in different symptoms on the same host or on different host species. Several diagnostic methods are available for the identification of causal viruses. The choice of test depends on the facilities, availability of reagents, expertise and the amount of known information about the virus or disease. A) Disease Diagnosis The terms diagnosis and detection are often used interchangeably. Diagnosis step involve careful examination to determine underlying cause of the disease. Whereas detection is to find out the virus For example, stem necrosis in groundnut is diagnosed as due to Tobacco streak virus (TSV). Methods such as ELISA are employed to detect TSV in diseased plants. Detection of a virus in a diseased plant not necessarily is a proof that it causes the disease. Further careful testing is essential prior to naming a particular virus as cause of the disease.
The following steps modified from L Bos (1976) are useful for diagnosing a disease.
1) Observe disease in the field, determine affected plant species and cultivars, disease incidence and distribution within field (random-, clustering-, peripheral-, uniform-distribution of infected plants)
2) Record the symptoms and compare in literature for any similar descriptions on the same host in-country or elsewhere.
3) Study infectivity and transmission tests by grafting; mechanical sap inoculation; transmission through vectors (insects, mites, nematodes or fungi)
4) Inoculate (using plant sap, by grafting or vector) to a range of test plants and back inoculate to a parallel range of test plants to check possible multiple infections and to determine host range and symptoms. Compare symptoms observed on experimental host range in literature for clues to identify the probable virus. Select systemically infected host for virus propagation for purification purpose; local lesion host for virus assays; and diagnostic species, which react uniquely to that particular causal virus.
5) Determine the persistence of infectivity in sap extracts (dilution end point, thermal inactivation point, stability and retention of infectivity upon storage at various temperatures and length of time) and effects of additives on virus infectivity and stability (treatment with organic solvents; stability at various pH, molarity and buffer type; addition of reducing agents).
6) Examine leaf dip preparations under electron microscope to detect any virus particles.
7) Isolate the virus and purify thereafter to determine the physicochemical properties (particle morphology, sedimentation coefficient, buoyant density, number of particle components, number of structural proteins, genome type, number, its polarity and strandedness, sequence information)
8) Study the cytopathology for virus inclusions and cytological changes in affected cells.
9) Produce polyclonal antibodies and develop a serological diagnostic test for virus detection.
10) Assess virus serological relationships using antiserum and inter relationships from nucleotide sequence information to determine virus taxonomic status.
11) Fulfill Kochs’ postulates, especially using purified virus or isolated virus cultures if purified virus preparation looses infectivity.
Depending on the virus kind, previous knowledge on virus or knowledge gained from during experimentation, laboratory facilities and expertise, the order of steps described can be changed or few steps can be ignored.
Majority of the plant diseases are caused by
specific viruses, often singly. Few diseases are caused by mixed infections of unrelated viruses. For example groundnut rosette, which is caused by three unrelated agents: a luteovirus (Groundnut rosette assistor virus – GRAV), an umbravirus (Groundnut rosette virus – GRV) and a satellite-RNA, which depends on GRV for its replication. Although ‘rosette’ symptoms are mainly due to sat-RNA, all the three agents are essential for successful transmission and establishment of the disease under natural conditions. Thus it is imperative after purification of virus(es) to show that they can induce characteristic symptoms on natural host
and induces the disease, i.e. fulfilling Koch’s postulates, they are A virus isolated:
1) Must be found in all cases of the disease 2) Must be isolated and grown in pure
culture 3) Must reproduce the original symptoms
when back-inoculated into a susceptible host
4) Must be found in the experimental host, so infected.
When a new disease appear on a host, suspected as due to virus based on symptoms of type never have been described on that particular host in that country, the disease can be considered as new and it can be named. However, conclusion on virus identity should not be drawn without properly diagnosing the disease to identify the actual causal agent. For example, stem necrosis, is a characteristic symptom in groundnut caused by TSV. This disease in groundnut can be named as ‘stem necrosis disease’, but not as ‘stem necrosis virus’. B) Virus characterization (description) The properties elucidated during the course of isolation, purification and diagnosis of the virus disease determines the virus relationships with previously characterized viruses and forms a basis to identify it as a new species / an isolate of a virus species / a new strain of a virus species, and to place it into an appropriate taxonomic group in present plant virus classification (see Table 3). The characters commonly used for virus identification are: (i) Biological characters Transmission characters − Mechanical transmission − Transmission by biotic vectors (insects,
fungi, mites, nematodes etc.) − Transmission by seed or pollen − Transmission by soil (direct root ingress)
− Transmission by direct contact, plant debris and dodder
Host range − Symptoms on diagnostic host species (local
and systemic infections) − Reaction on wide range of host plants
In vitro properties − Thermal inactivation point − Longevity in vitro (at various temperatures
and time periods in sap extracts and intact plant parts)
− Dilution end point Symptomatology − Macroscopic symptoms (on natural hosts
and diagnostic hosts) − Microscopic symptoms (inclusion bodies,
cytopathological changes within in the cell) − Pathogenicity associated with disease − Tissue tropism
Cross-protection − Against related strains or non-related
viruses (ii) Physico-chemical properties − Number of virus components (mono-, di,
tri- or multipartite) − Number and molecular weight of the
structural proteins (coat and nucleoproteins) − Type of nucleic acid (DNA / RNA; single
or double; linear or circular; positive or negative polarity; genome linked structures)
− Number and molecular weight of the virus genome
− Sedimentation coefficient − Particle buoyant density
Morphological − Size and shape − Special features such as lipid membranes
(iv) Inter-relationships Serology-based − Serological relationships utilizing polyclonal
antibodies or monoclonal antibodies or epitope specific antibodies.
− Relationships by western immuno-blotting − Mapping epitopes
Nucleic acid-based − Percent nucleic acid homology by nucleic
acid hybridization or direct comparison of nucleotide sequences
− Genome organization and expression − Amino acid composition
C) Virus detection Methods Detection of plant viruses included serological laboratory tests since the 1960. The choice of detection method is influenced by facilities and expertise, information on virus suspected to be present, host plant and time for completing the experiment. In general, any detection method should be rapid and highly specific for the target virus, and should detect virus present in low amounts in the plant tissue and detection at an early stage of disease development.
Various methods have been in use for virus detection in plants. They can be broadly categorized as techniques used prior to the development of ELISA (prior to 1976), modern serological assays and nucleic acid-based tools (Table 1).
Some of the techniques have been used for decades without any major changes or improvement, while some are recently introduced. Commonly used diagnostic tools are constantly modified for improvement and optimize the performance. Of various detection methods, ELISA and PCR/RT-PCR are based methods are most widely used, at present. An overview of some of the commonly used detection methods is described here. More details about ELISA and PCR methods are discussed in next chapter 9. Other routinely used assays are briefed below.

Table 1: The commonly used diagnostic tests Conventional techniques prior to 1976 Bioassay with indicator hosts Detection for inclusion bodies Conventional serological assays Chloroplast agglutination Ring precipitation interference test Agar gel single and double diffusion Immuno-electrophoresis Hemagglutination Bentonite flocculation Latex agglutination Serologically specific electron microscopy Fluorescent antibody-based assay EM-based Leaf dips for virus particles Modern assays Serological assays Multiwell plate ELISA (also with
fluorescent, gold and radio labelled antibodies)
Dot-blot assay on membranes Tissue print immuno-blotting Rapid immuno-filter paper assay Nucleic-acid based assays dsRNA analysis Nucleic acid hybridization PCR and RT-PCR Real-time PCR
(i) Biological assays: Symptoms on plants are commonly used if they are characteristic of a specific disease. Symptoms are influenced by several biotic and abiotic factors, nutritional deficiencies and some genetic abnormalities can also result in symptoms similar to viruses. Usually symptom based virus diagnosis is done in conjugation with other confirmatory tests. Diagnostic hosts: Mechanical transmission to indicator plants can be done with minimum facilities and characteristic symptoms produced by these plants allow detection and identification of known viruses. Although this may not provide precise virus identification, it is still used as an important assay in virus
diagnosis. Viruses that are not transmitted mechanically can be inoculated on to indicator plants by grafting or using vectors. This is relatively complex, as it requires continuous maintenance of vector and virus cultures. It is still being routinely used to assay non-mechanically transmissible viruses. (ii) Microscopy Electron microscope (EM) provides useful information on particle morphology in leaf dip preparations. For stable viruses, EM can give rapid results using negative staining technique. When viruses occurring in low concentration are not easily seen. In such case sap from test material needs to be concentrated prior to observation or particles from sap can be trapped using antibody-coated grids (immunosorbent EM) to improve the detection efficiency. However, EM is an expensive to acquire and maintain.
EM is commonly used to study ultracytopathology of virus infected cells also. Although this is not commonly used for diagnostic purpose, unknown viruses can be readily identified based on unique inclusions they produce (e.g potyviruses). (iii) Serological methods Polyclonal antibodies raised against structural proteins (coat protein, ribonucleoroteins) in mammalian systems (rabbit, goat, chicken) can be used to develop variety of serological tests. Serological assays are two types, solid phase assays (ELSIA, Western immuno-blotting) and liquid phase assays (agar gel single and double diffusion, ring precipitation or agglutination). (ELISA test is discussed in chapter 9. For more information on some on liquid phase assay refer Hamptom et al., 1990) Precipitin tests: This assay relies on the formation of a visible precipitate at the point of virus and antibody interaction. In agar gel double diffusion (Ouchterlony) test, antigen (in leaf sap or purified virus preparations) and antibody diffuse through gel matrix and a
visible precipitin line appears at the point of interaction. This method is most commonly used to study serological relationships. Although this assay lacks sensitivity, it is most useful to identify viruses that occur in moderate concentration in sap. This assay can be conducted with minimum facilities and expertise, therefore is suitable for diagnosing virus in feebly equipped labs. Immunoblotting: Dot immunoblotting assay (DIA) can be used to detect virus in plants as well as in vectors. Sap or insect extracts are spotted onto the membrane for detecting virus using homologous antibodies. The principle of DIA is similar to ELISA, except that it is performed on nitrocellulose membranes and precipitable substrates are used for development of positive reaction at the site of reaction. Chemiluminescent or radioactive substrates are also used, but in this case, energy (light or radiation) emitted is captured by exposing it to x-ray film. DIA is as sensitive as ELISA, but it requires optimization and it is not suitable for testing plant tissues, which contain high amount polyphenols that gives of background reaction.
Tissue printing or tissue print immuno-blotting is similar to DIA, but instead of sap extracts, whole tissue is blotted on to the nitrocellulose membrane. Subsequent detection is similar to that of DIA. Tissue print blotting aids in determining virus in the tissues.
Western immuno-blotting (WIB) is another variation of DIA. In this case, proteins separated in polyacrylamide gels are transferred onto nitrocellulose membrane by electrophoresis (Western transfer or Western blotting). Proteins transferred on to the membrane are detected using antibodies (immuno detection). This assay is commonly used to differentiate virus strains, epitope mapping and also for accurate detection of virus from total protein extracts.
There are several variations of immunoblotting techniques. The most
commonly used ones are DIA, WIB and tissue printing.
(iv) Nucleic acid (NA) based methods (Details of NA-based methods are discussed in chapter 9). Nucleic acid hybridization: The affinity between the complementary strands of DNA/ RNA is very strong and specific. This specificity has been exploited in developing nucleic acid hybridization assays, which are based on the homology between two strands of nucleic acids (DNA:DNA / RNA:RNA / RNA:DNA). A single-stranded complementary NA, either DNA or RNA is labeled with reporter molecule [radioactive (32P) or non-radioactive (digoxygenin)] is used as probe to hybridize with target molecule, and this reaction is detected by various means depending on the reporter molecule.
Dot or slot blot hybridization is most commonly used technique for virus detection. In this target molecule, in total nucleic acid extracts or total RNA or DNA extracts are blotted onto the nitrocellulose or nylon membranes (nylon membranes are durable). Hybridization is allowed to take place at high temperatures (usually 57-65oC) between bound NA and the probe in, hybridization chamber. Target sequences are assayed by detecting the reporter molecule.
NA hybridization take 24-48 h to complete, and requires expertise and well-equipped laboratories.
Detection range of various diagnostic methods is given in Table 2. Endnote Virus detection tools are essential to assay infections in seed, testing of stock plants in certification programmes, indexing of commercial crops derived from certification programmes, screening for sources of virus resistance, surveys of virus incidence in crops, weeds, vectors and forecasting of epidemics by direct testing of insect vectors.
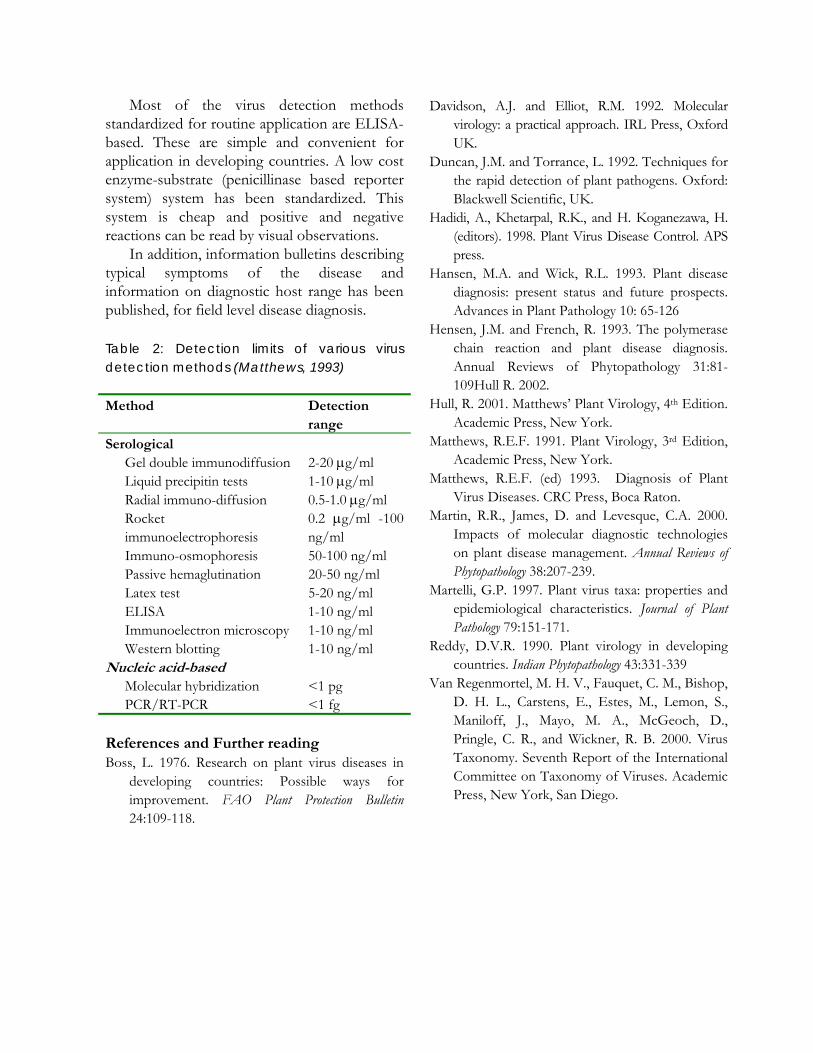
Most of the virus detection methods standardized for routine application are ELISA-based. These are simple and convenient for application in developing countries. A low cost enzyme-substrate (penicillinase based reporter system) system has been standardized. This system is cheap and positive and negative reactions can be read by visual observations.
In addition, information bulletins describing typical symptoms of the disease and information on diagnostic host range has been published, for field level disease diagnosis. Table 2: Detection limits of various virus detection methods (Matthews, 1993) Method Detection
range Serological Gel double immunodiffusion 2-20 µg/ml Liquid precipitin tests 1-10 µg/ml Radial immuno-diffusion 0.5-1.0 µg/ml Rocket
immunoelectrophoresis 0.2 µg/ml -100 ng/ml
Immuno-osmophoresis 50-100 ng/ml Passive hemaglutination 20-50 ng/ml Latex test 5-20 ng/ml ELISA 1-10 ng/ml Immunoelectron microscopy 1-10 ng/ml Western blotting 1-10 ng/ml Nucleic acid-based Molecular hybridization <1 pg PCR/RT-PCR <1 fg References and Further reading Boss, L. 1976. Research on plant virus diseases in
developing countries: Possible ways for improvement. FAO Plant Protection Bulletin 24:109-118.
Davidson, A.J. and Elliot, R.M. 1992. Molecular virology: a practical approach. IRL Press, Oxford UK.
Duncan, J.M. and Torrance, L. 1992. Techniques for the rapid detection of plant pathogens. Oxford: Blackwell Scientific, UK.
Hadidi, A., Khetarpal, R.K., and H. Koganezawa, H. (editors). 1998. Plant Virus Disease Control. APS press.
Hansen, M.A. and Wick, R.L. 1993. Plant disease diagnosis: present status and future prospects. Advances in Plant Pathology 10: 65-126
Hensen, J.M. and French, R. 1993. The polymerase chain reaction and plant disease diagnosis. Annual Reviews of Phytopathology 31:81-109Hull R. 2002.
Hull, R. 2001. Matthews’ Plant Virology, 4th Edition. Academic Press, New York.
Matthews, R.E.F. 1991. Plant Virology, 3rd Edition, Academic Press, New York.
Matthews, R.E.F. (ed) 1993. Diagnosis of Plant Virus Diseases. CRC Press, Boca Raton.
Martin, R.R., James, D. and Levesque, C.A. 2000. Impacts of molecular diagnostic technologies on plant disease management. Annual Reviews of Phytopathology 38:207-239.
Martelli, G.P. 1997. Plant virus taxa: properties and epidemiological characteristics. Journal of Plant Pathology 79:151-171.
Reddy, D.V.R. 1990. Plant virology in developing countries. Indian Phytopathology 43:331-339
Van Regenmortel, M. H. V., Fauquet, C. M., Bishop, D. H. L., Carstens, E., Estes, M., Lemon, S., Maniloff, J., Mayo, M. A., McGeoch, D., Pringle, C. R., and Wickner, R. B. 2000. Virus Taxonomy. Seventh Report of the International Committee on Taxonomy of Viruses. Academic Press, New York, San Diego.
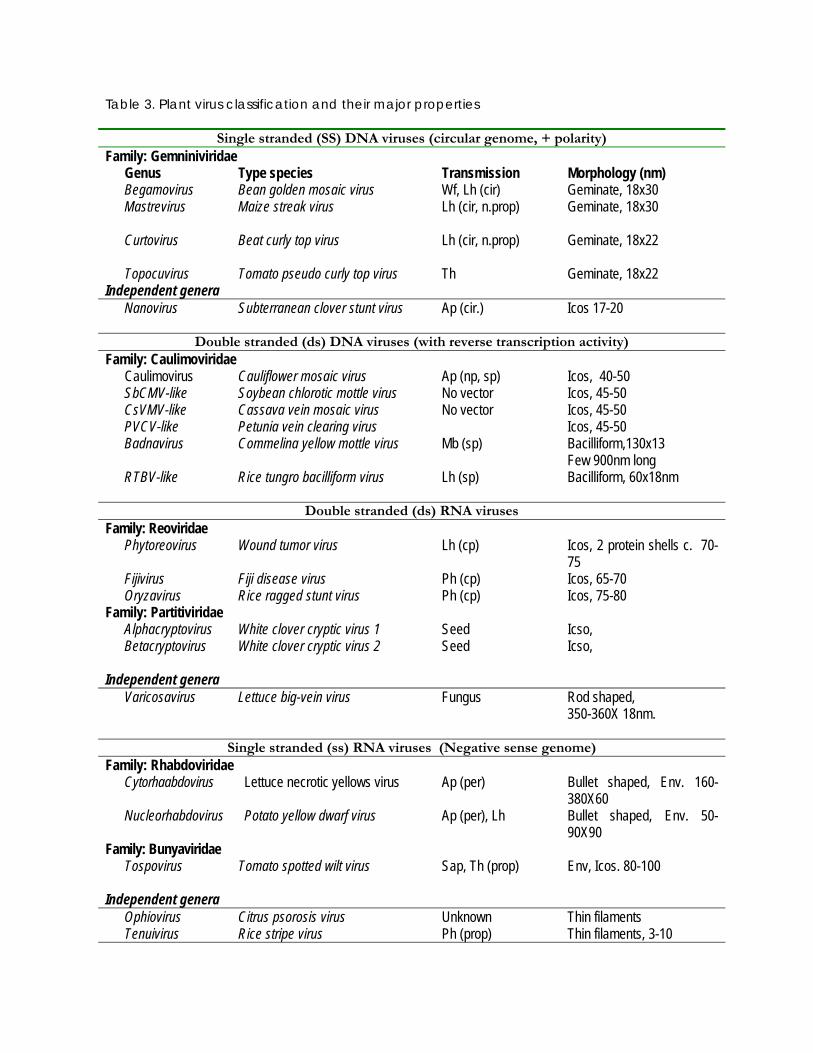
Table 3. Plant virus classification and their major properties
Single stranded (SS) DNA viruses (circular genome, + polarity) Family: Gemniniviridae Genus Type species Transmission Morphology (nm) Begamovirus Bean golden mosaic virus Wf, Lh (cir) Geminate, 18x30 Mastrevirus Maize streak virus Lh (cir, n.prop) Geminate, 18x30
Curtovirus Beat curly top virus Lh (cir, n.prop) Geminate, 18x22
Topocuvirus Tomato pseudo curly top virus Th Geminate, 18x22 Independent genera Nanovirus Subterranean clover stunt virus Ap (cir.) Icos 17-20
Double stranded (ds) DNA viruses (with reverse transcription activity)
Family: Caulimoviridae Caulimovirus Cauliflower mosaic virus Ap (np, sp) Icos, 40-50 SbCMV-like Soybean chlorotic mottle virus No vector Icos, 45-50 CsVMV-like Cassava vein mosaic virus No vector Icos, 45-50 PVCV-like Petunia vein clearing virus Icos, 45-50 Badnavirus Commelina yellow mottle virus Mb (sp) Bacilliform,130x13
Few 900nm long RTBV-like Rice tungro bacilliform virus Lh (sp) Bacilliform, 60x18nm
Double stranded (ds) RNA viruses
Family: Reoviridae Phytoreovirus Wound tumor virus Lh (cp) Icos, 2 protein shells c. 70-
75 Fijivirus Fiji disease virus Ph (cp) Icos, 65-70 Oryzavirus Rice ragged stunt virus Ph (cp) Icos, 75-80 Family: Partitiviridae Alphacryptovirus White clover cryptic virus 1 Seed Icso, Betacryptovirus White clover cryptic virus 2 Seed Icso, Independent genera
Varicosavirus Lettuce big-vein virus Fungus Rod shaped, 350-360X 18nm.
Single stranded (ss) RNA viruses (Negative sense genome) Family: Rhabdoviridae Cytorhaabdovirus Lettuce necrotic yellows virus Ap (per) Bullet shaped, Env. 160-
380X60 Nucleorhabdovirus Potato yellow dwarf virus Ap (per), Lh Bullet shaped, Env. 50-
90X90 Family: Bunyaviridae Tospovirus Tomato spotted wilt virus Sap, Th (prop) Env, Icos. 80-100 Independent genera
Ophiovirus Citrus psorosis virus Unknown Thin filaments Tenuivirus Rice stripe virus Ph (prop) Thin filaments, 3-10

Single stranded RNA viruses (Positive polarity) Family: Bromoviridae Bromovirus Brome mosaic virus Sap, beetles Icos, 28-30 Cucumovirus Cucumber mosaic virus Sap, Ap (np) Icos, 28-30 Alfamovirus Alfalfa mosaic virus Ap (np), seed, Bacilliform, 4 particles, 30-
57X18 Ilarvirus Tobacco streak virus pollen Icos, 3 particles, Oleavirus Olive latent virus 2 Unknown Bacilliform, multipartite Family: Comoviridae Comovirus Cowpea mosaic virus Sap, Bt, Icos, 28-30 Nepovirus Tobacco ringspot virus Nematodes, pollen,
seed Icos
Fabavirus Broad bean wilt virus 1 Ap (np) Icos Family: Closteroviridae Closterovirus Beet yellows virus Ap (sp), Mb, Wf flexuous filaments, 1250-
2000,monopartite Crinivirus Lettuce infectious yellows virus Ap (sp), Mb, Wf (sp) flexuous filaments, bipartite,
700-900 & 650-850, Family: Luteoviridae Luteovirus Barley yellow dwarf virus-PAV Ap (cir, np) Icos, 25-28 Polerovirus Potato leafroll virus Ap (cir, np), Icos, 24, Enamovirus Pea enation mosaic virus-1 Ap Icos, 25-28 (Umbravirus) Carrot mottle virus No vectors
Helper virus dependent
No specific particles
Family: Sequiviridae Sequivirus Parsnip yellow fleck virus Aphids (sp, np, cir.)
depending on helper virus)
Icos, 30
Waikavirus Rice tungro spherical virus Lh (sp) Icos, 30 Family: Tombusviridae Tombusvirus Tomato bushy stunt virus few by seed, pollen,
few by fungi. Icos, 32-35
Carmovirus Carnation mottle virus Fungi Icos, 32-35 Necrovirus Tobacco necrosis virus A Fung. Icos, 28 Machlomovirus Maize chlorotic mottle virus Seed Icsos, 30 Dianthovirus Carnation ringspot virus Soil, no vectors,
some times nematode
Icos, 30
Avenavirus Oat chlorotic stunt virus Soilborne, zoosporic, fungi,
Isom, Icos, 35
Aureusvirus Pothos latent virus Soilborne, no vector Isom, Icos, 30 Panicovirus Panicum mosaic virus Isom, Icos, 30 Family: Potyviridae Potyvirus Potato virus Y Ap (np), some by
seed also flexuous filaments 680-900X11-13
Rymovirus Ryegrass mosaic virus Mt (per) Filamentous 690-720X11-15
Bymovirus Barley yellow mosaic virus Fungi flexuous filaments 250-300

& 500-600 both are 15 width.
Macluravirus Maclura mosaic virus Ap (np) flexuous filaments 650-675X13-16
Ipomovirus Sweet potato mild mottle virus Wf (np), flexuous filamentous, 800-950
Tritimovirus Wheat streak mosaic virus Mt (per) flexuous filamentous, 690-700
Viruses of Independent genera (single stranded (ss) RNA genomes with positive polarity) Tobravirus Tobacco rattle virus Nematodes Rigid rods, bipartite, L-180-
215 & 48-115 Tobamovirus Tobacco mosaic virus contact, no vectors rigid rods, mono partite,
300-350X18 Hordeivirus Barley strip mosaic virus Sap, contact NE, rigid rods, tri partite,
110-150X20 Furovirus Soil-borne wheat mosaic virus Fungus (Polymyxa
graminis) Rod shaped, bipartite, 260-300X20 140-160X20
Pomovirus Potato mo-top virus Fungus Rod shaped, tripartite 1) 290-310 2) 150-160 3) 65-80
Pecluvirus Peanut clump virus Fungus Rod shaped, 2 predominant length, 245 & 190 with dia-21
Benyvirus Beet necrotic yellow vein virus Sap, fungus Filamentous, 4-5 particles-390,265,100,85X20
Sobemovirus Southern bean mosaic virus Bt Icos, 30 Marafivirus Maize rayadofino virus Lh Isom, 28-32 Tymovirus Turnip yellow mosaic virus Bt, Icosahed, 30 Idaeovirus Raspberry bushy dwarf virus Pollen , seed Isome, 33 Ourmiavirus Ourmia melon virus Unknown vector,
seed transmission bacilliform, multipartite, 28 in dia, length of 55, 43, 43, 37
Potexvirus Potato virus X Contact Slight flexuous rods, 470-500X13
Carlavirus Carnation latent virus Ap (np) slightly flexuous filaments, 600-700nmX12-15
Foveavirus Apple stem pitting virus flexuous filaments, 800X12 Allexivirus Shallot virus X Mt flexuous filaments, 800X12 Capillovirus Apple stem grooving virus No vector flexuous filaments, 640-
700X12 Trichovirus Apple chlorotic leaf spot virus Vitivirus Grapevine virus A Ap = Aphid; Th = Thrip; Lh = Leaf hopper; Mb = Mealy bug; Wf = Whitefly; Bt = Beetle; Mt = eriophyid mites; s.per: Semi persistent; np = Non persistent; n.prop = non-propagative; per = persistent; cir = circulative; prop = propagative; Isom = Icosahedron; Icos = Isometric particles; Env = Enveloped (unless stated, rest are non-enveloped); Genus unassigned to any family is in parenthesis Important note: Classification as per the ICTV – 2000.
8. Plant Virus Isolation and Purification
P Lava Kumar and *P Sreenivasulu ICRISAT, Patancheru 502 324, AP, India
*Sri Venkateswara University, Tirupati-517502, Andhra Pradesh, India
Isolation of a virus in its purest form from a diseased plant newly recognized in the field is called isolation. Obtaining virus in most pure form from the host plant is called purification. These two steps are prerequisite for characterization and identification of disease causative agent. A) Isolation In order to isolate a virus, certain aspects, such as means of its transmission, knowledge on vector, its spread in the field is advantageous. The virus from the diseased plant is isolated by sap inoculation to the healthy homologous and selected diagnostic/indicator host plants, using infected tissue sap extracted in water or buffer. If virus is not sap transmissible, virus culture is established by grafting or using vector, onto the homologous and other test plants. Inoculated plants are maintained in isolation to prevent contamination with other pathogens. The development of the disease in the laboratory inoculated plants indicates successful isolation of virus(es) from the field infected plants.
The second step is to check for the homogeneity of the isolated virus(es). Diseased plants in the field may contain more than one virus or strains of the same virus, and they need to be separated by inoculating the sample to a range of differential host plants and back inoculation to the original host to check for conformation of isolation of disease causing virus. Appearance of the disease with original symptoms indicates isolation of the virus involved in the disease etiology. The ‘isolated’ virus is purified by established cultures with sap prepared from single lesion (or individual vector) by transferring serially for 4 to 5 times on a suitable local lesion host or by exploiting
different virus-vector transmission mechanisms. Such pure isolate can then be propagated on a suitable host for bulking the material for further investigations and purification.
Certain properties of the virus can be studied without purifying the virus. These include biological characters of the virus, such as longevity in vitro [in detached leaf, sap extract, lyophilized tissues]; virus stability and infectivity [sensitivity to organic solvents, thermal inactivation point]; host range [local lesion hosts, diagnostic hosts, propagative hosts, non-hosts]; modes of transmission [vector (arthropod, nematode, fungi) and non-vector (mechanical sap inoculation, grafting, contact, soil]; symptomatology [macroscopic symptoms (visual changes on the plants) and cytological (virus inclusions and cytological changes)] and observation of sap extracts for virus particles under electron microscope. These properties would aid in developing a method for virus purification and also provide clues to the virus identity. B) Purification Purified virus preparations are essential to study virus properties at biochemical level. Virus purification aims at the separation of virus from host constituents without affecting its structure and infectivity. Choice of purification method depends on the virus as well as host plant. The number of purification methods in use exceeds total number of virus species. Because different procedures are required to purify same virus from different host plants or for the strains of the same virus. Some knowledge on the virus being purified would aid in devising a suitable purification protocol and also provide indicators to monitor the quality and quantity of
virus at various stages. Lack of any information, would sometimes result in unusually longtime to devise a suitable purification method.
The most common steps in the purification of the plant viruses are:
1) Establishment of biologically pure virus culture in a suitable propagation host.
2) Extraction of the cultured virus into a selected buffer medium that can protect virus from the deleterious effects of host components and retain virus infectivity.
3) Clarification of the extracted sap to remove as much of the host material with minimum loss of virus.
4) Concentration of the virus from the clarified extract by chemical precipitation or by differential centrifugation or by gel permeation/ affinity chromatography (for labile viruses) or combination of one or more of these methods.
5) Further purification of the virus by rate zonal or equilibrium density gradient centrifugation.
6) Final pellets of the virus obtained by high speed centrifugation are used to determine physico-chemical properties of the virus and its infectivity.
Virus purification is performed at low temperatures (usually 40C) to minimize the deleterious effects on virus particles.
(i) Extraction The composition of the virus extraction medium (buffer molarity and pH, additives) should be compatible to the host and also to virus and yield infective virus in high quantities. Buffers at high concentration (0.2-0.5 M) and pH of 7.0-9.0 are usually used for the initial extraction of the virus from the plant tissues. Additives that are generally incorporated into the extraction buffer are: β-mercaptoethanol, monothioglycerol, sodium sulphite, ascorbic acid, glutathione, EDTA and DIECA at different concentrations. Some times detergents
like Triton X-100 and Tween-80 are used. On occasions protein denaturing agents such as urea or polyvinyl pyrilodine are included into the extraction or resuspension buffers to minimize the aggregation of virus particles. To release some viruses from host components it may be necessary to treat extracts with enzymes such as drysilase. Plant material is extracted in electric blenders in presence of the selected buffer. (ii) Clarification Following extraction, coarse host components are removed by different clarification methods. This include low speed centrifugation, filtration through a filter paper supporting a pad of celite, emulsification with organic solvents like chloroform, n-butanol or carbon tetrachloride, followed by centrifugation. Organic solvents are not used for the purification of enveloped viruses (if the aim is to isolate particles with intact membranes; otherwise only nucleoprotein particles of virus would result).
The virus present in the clarified aqueous extract can be concentrated either by precipitation of the virus with chemicals like ammonium sulphate or polyethylene glycol (PEG) or by differential high speed pelleting of the virus. In some cases, especially if virus is highly unstable clarification can be achieved by gel permeation/affinity chromatography. The concentrated virus is resuspended in a suitable buffer and subject to further purification.
The impurities present in the clarified extracts can be minimized by pelleting the virus through sucrose cushion. The virus obtained in this step may still contain pigments and plant molecules. Therefore, further purification of the virus is generally achieved by rate-zonal sucrose density gradient (usually 10-40% w/v) centrifugation (@26,000 rpm, 2hr.) or by equilibrium density gradient centrifugation in heavy salt gradients of cesium chloride or cesium sulphate at 25,000-30,000 rpm, over night. Depending upon the nature of the virus (mono-, bi-, multi-partite components) and
associated impurities, clarified virus resolves as different light scattering zones. This separation is based on the sedimentation coefficient or particle buoyant densities. Virus from the light scattering zones are collected separately, and concentrated by centrifugation. Various tests are used to determine the infectious nature of the virus and its purity (iii) Virus purity The purity and virus yield vary with virus-host combinations. The virus purity usually examined by UV spectrophotometry, serology, electron microscopy, analytical ultracentrifugation and gel electrophoresis. If the purified virus contains impurities, preparations are subjected to second cycle of either rate-zonal or equilibrium density gradient centrifugation, followed by final high speed pelleting of the virus.
Infectivity of the purified virus can be assessed by inoculation on the host plants and also on diagnostic host. It is vital to inoculate the purified virus onto host plant and reproduce the disease to fulfill the Koch’s postulates. Certain viruses, though intact loose infectivity during purification.
Purified virus can be stored for long term as aliquots at -200C or in lyophilized form. Some viruses are highly sensitive to freezing and thawing process. Such viruses are processed, immediately after purification, as per the need (denatured proteins or as nucleic acids) and virus components can be preserved for downstream applications.
Endnote Virus isolation and purification is a complex process. Depending on the virus and host, it can be achieved in short period or sometimes it would take extremely long periods. Several factors can influence the ease with which virus isolation and purification can be achieved. Stable viruses that reach high concentration in host plants are easy to purify. Whereas some viruses are very difficult to purify, owning to their labile nature and occurrence in low concentration. Virus purification from herbaceous hosts (such as tobacco plants) is relatively simple due to low percent of host interfering material, whereas purification from woody plants are difficult due to hardy nature of the tissue, and to the deleterious host interfering material, such as polyphenols and tannins. There is no universal purification procedure that suits all viruses. Each and every virus and host system needs unique procedure to achieve optimum results. References and Further reading Francki R.I.B. 1972, Purification of viruses. In
Principles and Techniques in Plant Virology, ed. Kado, C.I. and Agarwal, H.O., pp.293-335. Van Nostrand Reinhold, Princeton.
Hull. R.2002. Matthews’ Plant Virology, Academic Press, London. 4th ed.pp. 75-109.
Stace-Smith, R and R.Martin. 1993. Virus purification in relation to diagnosis in: Diagnosis of Plant Virus Diseases Ed. R.E.F.Matthews pp.129-158. CRC press, Bocaraton.
9. ELISA and RT-PCR Methods for the Detection of Plant Viruses
P Lava Kumar and P Sreenivasulu*
ICRISAT, Patancheru 502 324, AP, India *Sri Venkateswara University, Tirupati 517 502
Diagnosis is as much an art as it is science. The ‘scientific’ part is the technology used to detect pathogens. The art lies in the synthesis of information obtained from the case history, symptoms and results of laboratory tests to determine the virus(es) involved in inducing disease. Detection of a virus in a plant does not necessarily prove that the virus causes the disease. To establish that the virus detected causes the disease, Koch’s postulates should be proved. Nevertheless constant association of a virus with a set of symptoms is often used as the ‘proof’ that the virus detected causes the disease. Disease diagnosis based on symptoms is unreliable for the reason that different viruses may cause similar symptoms and that different symptoms may be induced by one virus. Many abiotic stresses and other pathogens such as phytoplasma may cause symptoms characteristic of virus infection. Even after one become familiar with the symptoms typically caused by a virus in a particular plant, it is essential to confirm the diagnosis with reliable methods.
Several factors influence the method to be used for virus detection. These include;
• Facilities and expertise available • Type of virus suspected to be present • Host plant • Time available Any detection method should be rapid and
highly specific for the target virus, and should detect virus present in low amounts in the plant tissue and detection at an early stage of disease development.
Enzyme-linked immunosorbent assay (ELISA) and polymerase chain reaction (PCR) are the most widely used virus detection methods because of their rapidness and
sensitivity. However, PCR-based methods require expensive laboratory equipment, whereas ELISA requires little or no special equipment and is particularly suitable for use in developing countries. A) ELISA: A serology-based method Principles of antibody production An antigen is a molecule that can elicit production of antibodies when introduced into warm-blooded animals. Proteins, peptides, carbohydrates, nucleic acids, lipids, and many other naturally occurring or synthetic compounds can act as antigens, especially those having a molecular weight of 10,000 Daltons or higher with a definite molecular structure and which are not normal constituents of the animal being immunized. Antibodies are glycoproteins, which are produced as a result of immune response following introduction of antigens. Blood serum containing antibodies is referred to as antiserum.
When antigens are introduced, into an animal, a series of interactions between macrophages, T lymphocytes, and B-lymphocytes lead to antibody production. The first exposure of animals to antigens leads to a relatively weak reaction, referred to as the primary response. A series of specialized events occur during the primary response. These events prepare the animal to respond with quick and intense production of antibodies (secondary response) when the antigen is reintroduced. Both the primary and secondary responses occur in plasma cells. When antigens are first introduced, antigen presenting cells (APCs), (Langerhans cells in the skin, dendritic cells in the spleen and lymph nodes and monocytes in
the blood), T cells and B cells act in concert to stimulate the production of antibodies. Many techniques for the preparation and introduction of antigens, such as selection of appropriate injection site (intramuscular, subcutaneous, intravenous, intraperitoneal etc.), mixing of antigen with adjuvants etc. influence the uptake of antigen by the APCs. Adjuvants act by protecting the antigen from being rapidly degraded in the blood stream, and they also contain substances that stimulate the secretion of host factors that facilitate the macrophage movement to the site of antigen deposition and increase the local rate of phagocytosis.
After an antigen is engulfed by APCs, it is partially degraded, appears on the cell surface of APC and binds to it with a cell-surface class II glycoprotein. In the next step, antigen-glycoprotein complex on the APC binds to T-cell receptors. This leads to T-cell proliferation and differentiation. While T-cells are proliferating, antigens are also processed by virgin B-cell lymphocytes in a similar manner as by APC’s. However, the uptake of antigen by B-cells is specific, unlike that by APC'S. As in the case of APC'S, the antigen forms a complex with a surface antibody (Class II protein) on the B-cell surface. This complex also stimulates the same helper T-cells, which now bind to B- cells. This leads to division of B-cells and the production of the antibodies. Therefore the contact between B cells and helper T-cells is a major event in the regulation of production of antibodies.
In order for a compound to be good antigen, it should possess one or more epitopes (an antigenic determinant of defined structure), which can bind to the surface antibody on virgin B cells. After the antigen is dissociated, each epitope should be able to bind simultaneously to both the Class II protein and T- cell receptor. Any epitope that is exposed is expected to stimulate strong response to antibody production.
Structure of immuno-gammaglobulins and function Antibodies are glycoproteins present in the serum and tissue fluids of mammals. They are referred to as immunoglobulins (Igs) because of their role in adaptive immunity. Although all antibodies are immunoglobulins, it is important to realize that not all the immunoglobulins produced by a mammal have antibody activity. There are five classes of antibodies, IgG, IgM, IgA, IgE, and IgD, separated on the basis of the number of Y-like units and the type of heavy-chain polypeptide they contain. There are also significant differences within each class of gammaglobulins.
The basic polypeptide structure of the immunoglobulin molecule is shown in the Fig 1. It contains a unit of two identical light polypeptide chains and two identical heavy polypeptide chains linked together by disulfide linkage. The class and subclass of an immunoglobulin molecule are determined by the type of heavy chain. The most common immunoglobulin is IgG and therefore the description given is for IgG.
IgG molecule contains one structural "Y" unit (Fig. 1). The two arms of Y are made of two identical light chains of molecular weight 23,000 daltons and two identical heavy chains of molecular weight 53,000 daltons. Each light chain is linked to the heavy chain by non-covalent bonds and by one covalent disulfide bridge. Each light-heavy chain pair is linked to another IgG by disulfide bridges between the heavy chains. Carboxytermini of the two heavy chains fold together and form the "FC" domain. The region between the Fab and Fc fragments is called the "hinge". Digestion of IgG with pepsin yields two Fab fragments attached to each other by disulfide bonds and an Fc fragment.
In both heavy and light chains, at the N-terminal portion, the amino acid sequences vary greatly from IgG to IgG. In contrast, in the Fc portion (C-terminal portion of both heavy and light chains) the sequences are identical. Hence the Fab domain contains "Complementary
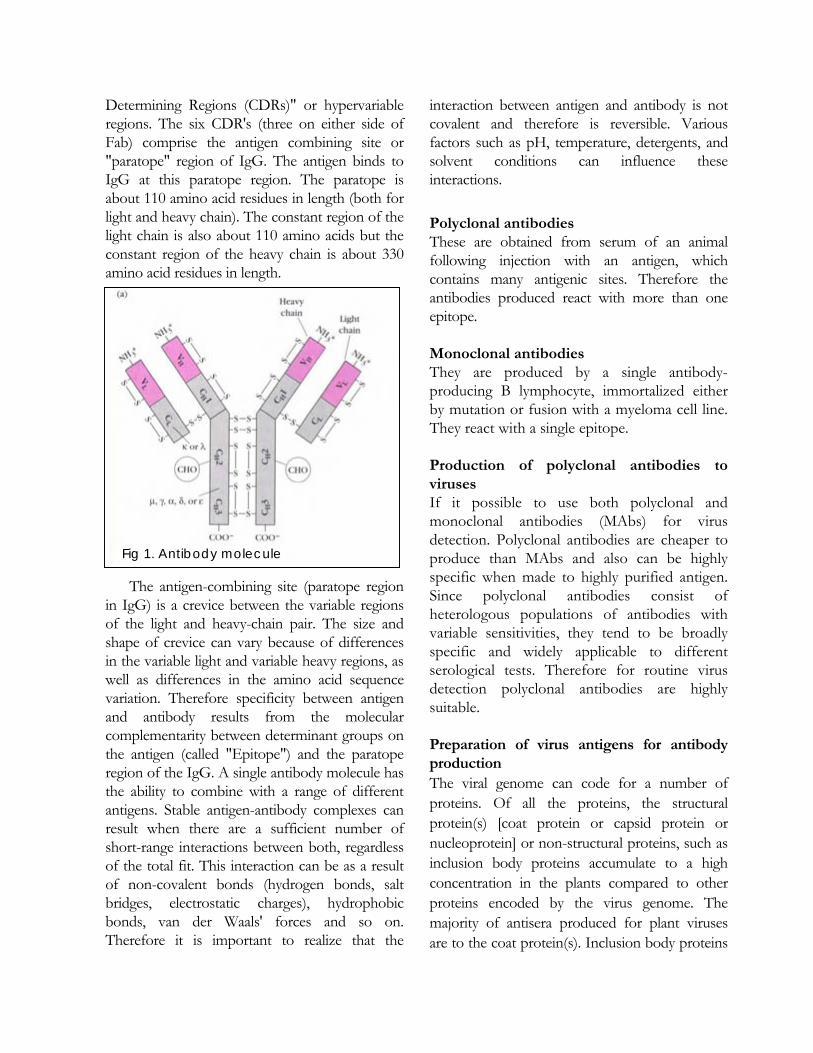
Fig 1. Antibody molecule
Determining Regions (CDRs)" or hypervariable regions. The six CDR's (three on either side of Fab) comprise the antigen combining site or "paratope" region of IgG. The antigen binds to IgG at this paratope region. The paratope is about 110 amino acid residues in length (both for light and heavy chain). The constant region of the light chain is also about 110 amino acids but the constant region of the heavy chain is about 330 amino acid residues in length.
The antigen-combining site (paratope region
in IgG) is a crevice between the variable regions of the light and heavy-chain pair. The size and shape of crevice can vary because of differences in the variable light and variable heavy regions, as well as differences in the amino acid sequence variation. Therefore specificity between antigen and antibody results from the molecular complementarity between determinant groups on the antigen (called "Epitope") and the paratope region of the IgG. A single antibody molecule has the ability to combine with a range of different antigens. Stable antigen-antibody complexes can result when there are a sufficient number of short-range interactions between both, regardless of the total fit. This interaction can be as a result of non-covalent bonds (hydrogen bonds, salt bridges, electrostatic charges), hydrophobic bonds, van der Waals' forces and so on. Therefore it is important to realize that the
interaction between antigen and antibody is not covalent and therefore is reversible. Various factors such as pH, temperature, detergents, and solvent conditions can influence these interactions. Polyclonal antibodies These are obtained from serum of an animal following injection with an antigen, which contains many antigenic sites. Therefore the antibodies produced react with more than one epitope. Monoclonal antibodies They are produced by a single antibody-producing B lymphocyte, immortalized either by mutation or fusion with a myeloma cell line. They react with a single epitope. Production of polyclonal antibodies to viruses If it possible to use both polyclonal and monoclonal antibodies (MAbs) for virus detection. Polyclonal antibodies are cheaper to produce than MAbs and also can be highly specific when made to highly purified antigen. Since polyclonal antibodies consist of heterologous populations of antibodies with variable sensitivities, they tend to be broadly specific and widely applicable to different serological tests. Therefore for routine virus detection polyclonal antibodies are highly suitable. Preparation of virus antigens for antibody production The viral genome can code for a number of proteins. Of all the proteins, the structural protein(s) [coat protein or capsid protein or nucleoprotein] or non-structural proteins, such as inclusion body proteins accumulate to a high concentration in the plants compared to other proteins encoded by the virus genome. The majority of antisera produced for plant viruses are to the coat protein(s). Inclusion body proteins
can also be used for antibody production (eg. potyviruses).
The best source from which to obtain large quantity of coat protein is the purified virus, largely devoid of host plant components. Purification of viruses is accomplished by various physcio-chemical techniques. There are several important points to consider prior to purifying viruses from plants. They include selection of suitable host plant for virus maintenance, procedures for purification and methods for monitoring purity. The quality of the antiserum produced will depend largely on the purity of the virus preparation used for immunization. Recombinant antigens Recombinant DNA technology allows cloning of plant viral nucleic acids and express their genes in prokaryotic and eukaryotic systems. This facilitates large-scale expression of proteins in vitro. For this it is essential to know the sequence of protein encoding gene (for example, coat protein sequence, if the antibodies are to be produced to the coat protein). The gene of interest is inserted at a suitable site in an expression vector (eg. pET) to express in Escherichia coli. This leads to production of virtually unlimited quantities of gene product of interest. Expressed protein can be purified and utilized in the production of antiserum. Choice of animals Any warm blooded animal can be used for antibody production e.g., Rabbits, chickens, guinea pigs, rats, sheep, goats and horses. When small animals such as rats and mice are used, only small quantity of serum can be obtained. Although large animals such as goats and horses can provide large volumes of serum, large amounts of antigen are required for immunizing these animals. The rabbit is the most commonly used animal for antibody production.
Immunization Injection of an antigen into an animal is accomplished either by intramuscular or subcutaneous injections or intravenous.
For injection the antigen preparation should be emulsified with an adjuvant (1:1 proportion). The most commonly used adjuvant is Freund's adjuvant, which consists of paraffin oil and an emulsifier, mannide monooleate (incomplete). Complete adjuvants, in addition to these two components, contain heat-killed Mycobacterium tuberculosis, or M. butyricurn or a similar acid-fast bacterium. Emulsification with adjuvants results in very slow release of antigen, thereby stimulating excellent immune response. Antigen concentration required may vary from 100 µg/ml to 500 µg/ml. A normal immunization schedule followed for rabbits is given below. • Four subcutaneous injections (multiple
sites) at weekly intervals (for first injection use Freund's complete adjuvant and for the 2nd, 3rd and 4th use incomplete adjuvant). Five injections are usually adequate to obtain good immune response.
• If the titer of the antibody is low, either an intravenous (for intravenous injection adjuvants should not be used) or an intramuscular injection should be given as a booster.
Blood collection and serum preparation Blood is collected from rabbits by making an incision in the marginal vein of the ear. It is preferable to collect the blood in sterile containers. The blood is allowed to clot at room temperature for 2 - 3 h (this can also be done by exposure at 37oC for 30 min). After overnight refrigeration, the serum is collected with a Pasteur pipette and then centrifuged at 5,000 rpm for 10 min. Note: It is important to starve rabbits for at least 24 h before blood collection to minimize concentration of lipids

Storage of antisera • For long-term storage of antisera at 4oC it is
essential to add either glycerol (1:1) or. sodium azide to a concentration of 0.02%.
• In lyophilized form antisera can be stored at –20°C indefinitely for many years without losing potency.
• Antisera can be stored at –70oC. • It is advisable to store serum in small
aliquots of 1.0 ml or less. • Antisera should not be frozen and thawed
repeatedly. This leads to aggregation of antibodies thereby affecting antibody activity by steric interference of the antigen-combining site or by generating insoluble material, which may sediment during centrifugation.
Enzyme-linked immunosorbent assay Enzyme-linked immunosorbent assays are solid-phase assays in which each successive reactant is immobilized on a plastic surface and the reaction is detected by means of enzyme-labelled antibodies. The principle of amplification of the reaction between viral antigens and their antibodies by utilizing an enzyme and its substrate, was described by Avrameas (1969). The microplate method currently being used widely for virus detection and the term ELISA was introduced by Voller et al. (1976).
ELISA is one of the most widely used serological tests for the detection of plant viruses because of its simplicity, adaptability and sensitivity. In this immunospecificity is recognized through the action of the associated enzyme label on a suitable substrate. ELISA detects only viral antigens and it does not give a measure of infective virus concentration.
The basic principle of the ELISA lies in immobilizing the antigen onto a solid surface, or capturing antigen by specific antibodies, and probing with specific immunoglobulins carrying an enzyme label. The enzyme retained in the case of positive reaction is detected by adding
the suitable substrate. The enzyme converts substrate to product, which can be easily recognized by its colour. There are two types of ELISA procedures; ‘direct’ and ‘indirect’ ELISA. In the ‘direct’ procedure, IgG’s extracted from virus-specific antiserum or in some cases polyclonal antiserum, are used for coating the solid surface to trap the antigen, and the same IgG’s labelled with an enzyme are employed for detection. In this case the antigen gets sandwiched between IgG’s and thus is referred to as the double-antibody sandwich (DAS) form of ELISA. The DAS-ELISA has limitations in that test is not suitable for (a) virus detection in disease surveys unless it is targeted to a specific virus, (b) when adequate antisera are not available for IgG extraction and conjugation and (c) for probing a single antigen with several different antisera.
In the simplest ‘indirect’ ELISA procedure, antigen is bound to the solid surface of ELISA plate. In the second step unconjugated antigen-specific detecting antibodies (primary antibody) is added. Primary antibody is detected by the enzyme-labelled second antibody (anti Fc or anti IgG). The second antibody is produced in a different animal than that used for producing primary antibody. The main advantage of the indirect ELISA procedure is that one enzyme conjugate (of antiglobulin antibody or protein A) can be utilized with all the systems. This assay is particularly suitable for (a) virus detection in disease surveys, (b) testing the presence of virus in seed and (c) for determining serological relationships, particularly when specific conjugates cannot be prepared. It is also more economical to perform than the DAS form. Choice of antibodies Antibodies produced in any experimental animal are suitable for ELISA. In some test procedures crude antisera can be used. For DAS-ELISA only purified IgGs can be used for conjugation with an enzyme. IgG’s produced in a heterologous animal or second antibody (eg.,
anti-rabbit IgGs produced in goat) used in the ‘indirect ELISA’ procedure are commercially obtained. Choice of antigens One of the major advantages of ELISA is that it can be used on crude plant/insect extracts, and on partially purified and purified virus preparations. Choice of enzyme labels The two-enzyme labels that are widely used are alkaline phosphatase (ALP) and horseradish peroxidase (HRP). Urease and penicillinase (β-lactamase) have subsequently been introduced. Reaction kinetics of HRP is not linear and some of its substrates are hazardous to the operator. Urease and isozymes of peroxidase are known to be present in seeds and plant extracts, thus limiting their application in plant virus detection. ALP and its substrate, p-nitrophenyl phosphate, are very expensive and are not readily available in developing countries. ALP has certain limitations for use in the detection of viruses in insects. Penicillinase has several advantages over the ALP system;
• It is less expensive than ALP and HRP • Enzyme and substrate are available in
some developing countries • Penicilloic acid produced as a result of
penicillinase activity on penicillin substrate is less toxic
• The substrate has longer shelf-life than the other enzyme substrates
• Visual reading of results is easier than for the ALP system
• Penicillinase is not known to occur in higher plants.
Penicillinase breaks down penicillin into penicilloic acid, and this is detected either by the rapid decolorization of a starch-iodine reagent or by utilizing acid-sensitive pH indicators.
B) PCR: A nucleic acid-based virus detection method Nucleic acid-based methods Serological methods have major disadvantage that they are based on the antigenic properties of the virus structural proteins. Thus immunological approaches ignore the rest of the virus genome. It is possible that viruses that are distantly related or not related, as determined by serological methods, may have highly conserved sequences in the genes other than the coat protein gene or that serologically related viruses may have very little sequence homology. In addition, there are instances where immunological procedures have limited application such as the detection of viroids, satellite RNAs, viruses that lack particles (eg. Groundnut rosette virus), viruses which occur as extremely diverse serotypes (eg. Indian peanut clump virus) and viruses that are poor immunogens or are difficult to purify. For these agents, detection is often possible only by using nucleic acid-based methods such as nucleic acid hybridization assays and PCR.
In instances where nucleic acid-based methods and serological methods provide similar information, detection sensitivity, and specificity, and are equally convenient, serological methods like ELISA be the preferred method. This is particularly so in developing countries because serological methods are easier to perform, cost effective and the required reagents are readily available. The composition of nucleic acids Nucleic acids are polynucleotides, i.e. they consist of nucleotides joined together in a long chain. Each nucleotide is made up of a base, a sugar and a phosphate group. The differences between DNA and RNA (i) the sugar is ribose in RNA but deoxyribose in DNA, (ii) the bases in DNA are adenine (A), cytosine (C), guanine (G) and thymine (T) but in RNA the bases are A, C, G and Uracil (U) in place of T. In polynucleotide the bases are side branches on a
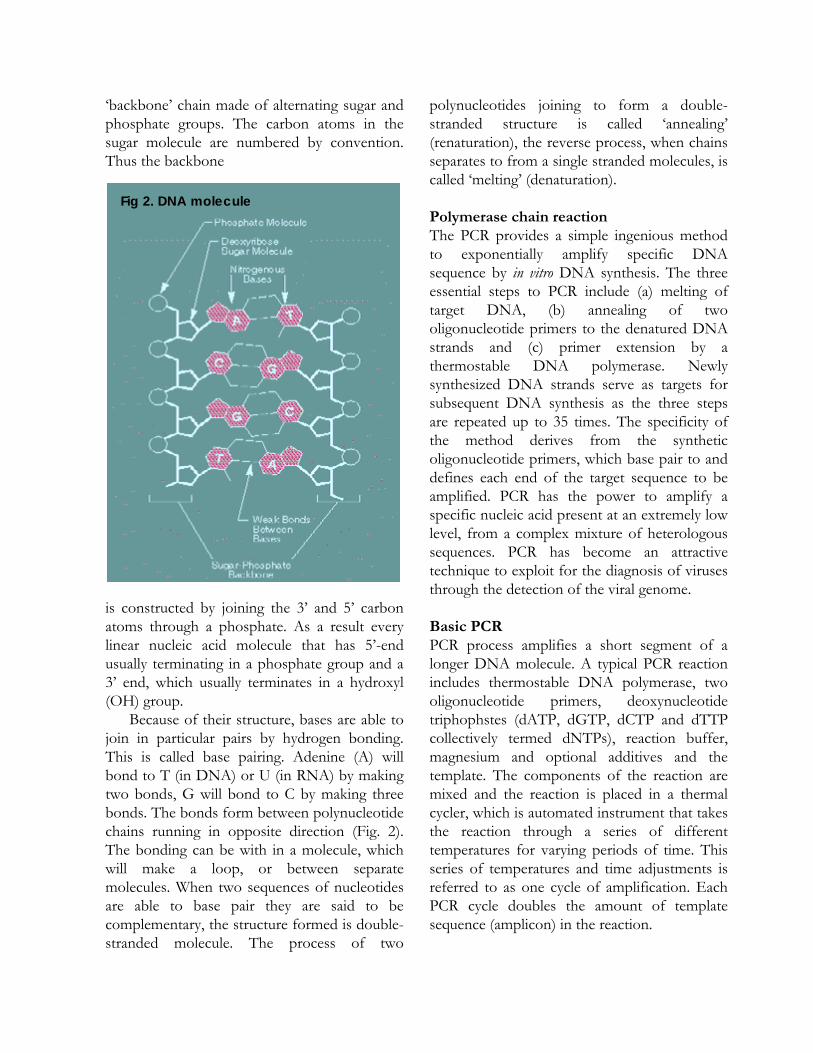
‘backbone’ chain made of alternating sugar and phosphate groups. The carbon atoms in the sugar molecule are numbered by convention. Thus the backbone is constructed by joining the 3’ and 5’ carbon atoms through a phosphate. As a result every linear nucleic acid molecule that has 5’-end usually terminating in a phosphate group and a 3’ end, which usually terminates in a hydroxyl (OH) group.
Because of their structure, bases are able to join in particular pairs by hydrogen bonding. This is called base pairing. Adenine (A) will bond to T (in DNA) or U (in RNA) by making two bonds, G will bond to C by making three bonds. The bonds form between polynucleotide chains running in opposite direction (Fig. 2). The bonding can be with in a molecule, which will make a loop, or between separate molecules. When two sequences of nucleotides are able to base pair they are said to be complementary, the structure formed is double- stranded molecule. The process of two
polynucleotides joining to form a double-stranded structure is called ‘annealing’ (renaturation), the reverse process, when chains separates to from a single stranded molecules, is called ‘melting’ (denaturation). Polymerase chain reaction The PCR provides a simple ingenious method to exponentially amplify specific DNA sequence by in vitro DNA synthesis. The three essential steps to PCR include (a) melting of target DNA, (b) annealing of two oligonucleotide primers to the denatured DNA strands and (c) primer extension by a thermostable DNA polymerase. Newly synthesized DNA strands serve as targets for subsequent DNA synthesis as the three steps are repeated up to 35 times. The specificity of the method derives from the synthetic oligonucleotide primers, which base pair to and defines each end of the target sequence to be amplified. PCR has the power to amplify a specific nucleic acid present at an extremely low level, from a complex mixture of heterologous sequences. PCR has become an attractive technique to exploit for the diagnosis of viruses through the detection of the viral genome. Basic PCR PCR process amplifies a short segment of a longer DNA molecule. A typical PCR reaction includes thermostable DNA polymerase, two oligonucleotide primers, deoxynucleotide triphophstes (dATP, dGTP, dCTP and dTTP collectively termed dNTPs), reaction buffer, magnesium and optional additives and the template. The components of the reaction are mixed and the reaction is placed in a thermal cycler, which is automated instrument that takes the reaction through a series of different temperatures for varying periods of time. This series of temperatures and time adjustments is referred to as one cycle of amplification. Each PCR cycle doubles the amount of template sequence (amplicon) in the reaction.
Fig 2. DNA molecule
Each cycle of PCR consists of initial denaturation of the target DNA by heating to >90oC for 15 seconds to 2 min. In this step, the two intertwined strands of DNA separate from one another. In the second step, the temperature is reduced to approximately 45-60oC. At this step oligonucleotide primers can form stable associations (anneal) with the separated target strands and serve as primers for DNA synthesis. This step lasts approximately 30-60 seconds. Finally, the synthesis of new (primer extension) DNA begins when the reaction temperature is raised to the optimum for the thermostable DNA polymerase, which is around 70-74oC. This step lasts for 30-120 seconds depending on the amplicon size. This step completes one cycle. After 20-35 cycles, the amplified nucleic acid can be analyzed for size, quantity, sequence or can be used for further experimental procedures such as cloning. PCR optimization The following factors influence the amplification of products during PCR;
• Magnesium ion concentration • Reaction buffer • Enzyme choice and concentration • Primer design • Template • Cycle parameters • Nucleic acid cross-contamination
Magnesium ion concentration: It is the critical factor affecting the performance of Taq DNA polymerase. Reaction components, including template, chelating agents present in the sample (eg., EDTA), dNTPs and proteins, can affect the amount of free magnesium. In the absence of adequate free magnesium, Taq DNA polymerase is inactive. Excess free magnesium reduces enzyme fidelity and may increase the non-specific amplification. For this reason it is important to determine empirically, the optimal concentration of MgCl2 for each
reaction. This can be done by preparing a reaction series in 0.5 mM increments by adding 2, 3, 4, 5 or 6 µl of a 25 mM MgCl2 stock to a 50 µl reaction. Reaction buffer: The basic ingredients of a PCR reaction buffer are; NaCl, KCl, EDTA, DTT, Triton X-100, Nonidet-P 40, Tween-20, glycerol and tris-HCl, pH 8. The composition of these components varies depending on the type of thermostable polymerase in consideration. The manufacturer supplies reaction buffer in 10x concentration along with the thermostable DNA polymerase. For most of the PCRs, use of this buffer at recommended concentration yields good amplification. Enzyme: The choice of the enzyme to use depends on the several factors. Taq DNA polymerase is the most popular thermostable DNA polymerase. This enzyme possesses relatively high processivity and is the least expensive enzyme. However, this enzyme lacks 3’-5’ exonuclease (proof reading) activity and it has high error incorporation rate compared to other enzymes. For accurate amplification of the PCR product thermostable enzymes with proof reading activity are recommended (eg: Pfu. Tli).
Generally, 1 U of Taq DNA polymerase in a 50 µl reaction is sufficient for good yield of product. Inclusion of more enzyme does not significantly increase product yield. Further, this lead to likelihood of generating artifacts associated with 5’-3’ exonuclease activity associated with Taq DNA polymerase resulting in smearing in agarose gels. Pipetting errors are the most frequent cause of excessive enzyme levels. Accurate dispensing of submicroliter volumes of enzyme solutions is difficult. We strongly recommend the use of reaction master mixes, sufficient for the number of reactions being performed to overcome this problem. The master mixes will increase the initial pipetting volumes of reactants and reduce pipetting errors.
Primer design: PCR primers (oligomers or oligonucleotides) generally range in length from 15-30 bases and are designed to flank the region of interest. Primers should contain 40-60% G+C and care should be taken to avoid sequences that would produce internal secondary structure. The 3’-end of the primers should not be complementary to avoid the production of primer-dimers in the PCR reaction. Ideally both primers should anneal at the same temperature. The annealing temperature is dependent upon the primer with the lowest melting temperature. Regardless of primer choice, the final concentration of the primer in the reaction must be optimized. We recommend adding 50 pmol of primer (1 µM final concentration in a 50 µl reaction) as a starting point for the optimization. Template: successful PCR amplification depends on the amount and quality of the template. Reagents commonly used to purify nucleic acids (salts, guanidine, proteases, organic solvents and SDS) are potent inhibitors of DNA polymerases. The amount of template required for successful amplification is dependent upon the complexity of the DNA sample and depends on percent target DNA of interest. Too much of target DNA or too little, results in poor or no amplification. Cycle parameters: The sequence of the primers is major consideration in determining the temperature of the PCR amplification cycles. For primers with a high melting temperature it may be advantageous to use high annealing temperatures. The higher temperature minimizes nonspecific primer annealing, increasing the amour of specific product and reduce primer-dimer formation. Allow a minimum extension time of 1 min for a cycle and increase it by a min for every 1 kb of amplicon (2 min extension for 2 kb target).
Certain unwanted reactions can occur in PCR, and these usually begin at room temperature once all components are mixed. These unwanted reactions can be avoided by incorporating ‘hot start’ method. In this
thermostable enzyme is added into the reaction mixtures after heating the reaction minus enzyme to 90oC. However, this method is tedious and can increase the chances of contamination. Nucleic acid cross-contamination: It is important to take great care to minimize the potential for cross-contamination between samples and to prevent carryover of RNA and DNA from one experiment to another. Use positive displacement pipettes or aerosol resistant tips to reduce contamination during pippetting. Wear gloves and change them often. Wherever possible prepare master mixes by mixing all reagents and at the end, add template into the reaction tube. RT-PCR Most of the viral and sub-viral pathogens have RNA genome. In this case RNA is first reverse transcribed in order to produce a complementary (c)DNA copy using the enzyme reverse transcriptase and a primer. In the first cycle of PCR thermostable DNA polymerase synthesis complementary strand to the first strand cDNA. The resultant double stranded cDNA is amplified exponentially by PCR process.
RT-PCR uses Moloney murine leukemia virus (MoMLV) or Avian myeloblastosis virus (AMV) reverse transcriptase (RT). Taq DNA polymerase performs second strand cDNA and subsequent amplification during PCR. The viral RT enzymes are inactivated at elevated temperatures. Therefore first strand reaction must be performed at 37-48oC. The maximum recommended temperature for optimum RT enzyme activity is 42oC. Efficient first cDNA can be completed in 20-60 min. RNA exhibiting significant secondary structure must be denatured for efficient reverse transcription. Generally, incubation at 42oC for 45 min yields good yield of first strand cDNA. For RNA templates with high secondary structures, a denaturation step can be incorporated by incubating primers and RNA in a separate tube
at 70oC for 10 min, then quench on ice and proceed to RT step.
The purity and integrity of the total RNA extracted from the leaf tissue of interest is critical for successful and consistent results in RT-PCR. The extraction procedure for RNA isolation consists of (a) effective disruption of tissue, (b) inactivation of ribonuclease (RNase) activity and (c) separation of RNA from protein, carbohydrates, polysaccharides etc. It is very difficult to inactivate RNase and hence several precautions have to be followed to prevent RNA degradation due to RNase activity, during or after extraction. Use autoclaved solutions and baked glassware (bake in an overnight 200oC overnight). Always use disposable gloves as a precaution against RNase in the fingertips. Include potent RNase inhibitors (SDS, guanidine thiocyanate, β-mercapthoethanol) in the extraction buffer to inactivate the enzyme and carry all steps at 4oC to minimize RNase activity. References and Further reading Ausubel, F.M., Brent, R., Kingston, R.E.,
Moore, D.D., Seidman, J.G., Smith, J.A., and Struhl, K. 1994. Current Protocols in Molecular Biology.
Crowther, J.R. (editor). 1995. ELISA. Methods in Molecular Biology 42.Humana Press, New Jersey.
Harlow, A., and Lane, D. 1998. Antibodies. A Laboratory Manual. Cold Spring Harbor Laboratory, New York.
Hampton, R., Ball, E., and De Boer, S. 1990. Srological Methods for Detection and Identification of Viral and Bacterial Plant Pathogens. APS Press.
Harwood, A.J. (editor). 1996. Basic DNA and RNA Protocols. Methods in Molecular Biology 58.Humana Press, New Jersey.
Sambrook, J., and Russell, D .W. 2000. Molecular cloning - a laboratory manual, 3rd ed. Cold Spring Harbor Laboratory. Cold Spring Harbor, New York.
Sambrook J, Fritsch, E F, Maniatis T. 1989. Molecular Cloning: A Laboratory Manual 2nd ed. Cold Spring Harbor Laboratory. Cold Spring Harbor, New York.
White, B.A. (editor). 1993. PCR Protocols. Current Methods and Applications. Methods in Molecular Biology 15.Humana Press, New Jersey.
10. Screening Genotypes for Virus Resistance
P Lava Kumar, AT Jones*, F Waliyar and KB Saxena
ICRISAT, Patancheru 502 324, AP, India *Scottish Crop Research Institute, SCRI DD2 4A, Dundee
Crop losses caused by plant virus diseases can be prevented in various ways. Over the years three main categories of control measures have been adopted for minimizing virus-induced crop losses. They are (i) removing virus sources, for example by removing volunteer plants or plant remains left from the previous crops; (ii) preventing virus spread usually by killing vectors or interfering with their activity; and (iii) growing the virus-resistant/tolerant varieties of crops. The third option is the most economical for farmers and easily adaptable. Because of this, host resistance has become one of the primary control methods for reducing losses from virus diseases. This form of control is relatively inexpensive for plant producers to implement and is ‘eco-friendly’.
The attempts to breed improved crop plants relay on selection, more often intentional, to eliminate the most readily infectible and sensitive types and to select genotypes with superior performance in the field. When the range of genetic variation found in a crop species does not meet the required degree of virus resistance, then related crop species can be screened for the identification of resistance. If the useful source of resistance is identified in cultivated species or closely related and sexually compatible species, it can be used for crossing with a cultivar having desirable agronomic traits. The strategy for breeding depends on the crop species, nature of the reproductive-biology (self-pollinated or self-incompatible), type of cultivar (F1 hybrid, homozygous line or vegetative clone) and inheritance of the resistance (monogenic, oligogenic or polygenic; dominant or recessive). In case of resistant sources available only in related wild species that are difficult or impossible to use in
crossing, techniques of interspecific crosses such as in vitro culture of immature embryo can be used to introduce resistance.
The basic requirement for successful breeding programs for virus resistance involves, selection and crossing appropriate parents, and then making selections from among their progeny, backed, where possible, by knowledge about the genetic control of resistance. This is also possible without detailed knowledge of the genetic mechanism for resistance. The final objective is to combine the resistance with good agronomic traits. Screening for virus resistance For any strategy of breeding for virus resistance, good knowledge of the virus and its different strains, and diagnostic tools for their unambiguous detection are essential. The plants to be tested should generally be young and uniform in stage of development. It is essential to use susceptible control plants to ensure that the inoculum used on test plant produces typical symptoms.
Virus transmission onto test plants can be achieved by various means. Mechanically transmissible virus can be inoculated by sap inoculation. The inoculation can be done manually or using inoculation gun. If the virus is not readily sap transmissible (eg: luteoviruses; PPSMV), virus vectors (fungi, nematodes, insects, mites) can be used for inoculation purpose. In this case viruliferous vectors need to be reared on infected plants. In case of vegetatively propagated crops such as raspberry, graft inoculation can be used. After inoculation the plants should be protected from other viruses to avoid confusions as result other virus infection.
Appearance of symptoms often forms the basis of screening. It is advisable to monitor presence of virus in symptomless plants with sensitive serological or nucleic acid-based detection tools. In case where inoculation response is highly variable in the plant population, from complete resistance to partial resistance with different grades of symptom intensities in between, scoring system often denoted by a ‘scale’ can be used.
Large-scale evaluation of genotypes is often carried out under field conditions. This is possible only if the disease recurs at the same area on particular crop every year owing to the presence of vectors and of virus reservoir hosts nearby and there is no risk of mixed infections. Alternatively, growing host plants of the vectors and the virus, inter-spreading the test plants to increase the vector population, allows more consistent disease spread onto test plants evaluated in the field. In any case test plants should be evaluated for presence or absence of virus by diagnostic tools. The screening done under field conditions for 2-3 years takes into account the field resistance. This does not ensure test plants performance against different strains of the virus. The multilocational screening for resistance helps in exposing the genotype to diverse geographic isolates of the virus.
In case of seed transmitted viruses, initial screening of seed material for virus by ELISA is essential. Seed tested positive should be eliminated from the screening trial. Host response to virus inoculation Based on the response of the plant to virus inoculation, they can be classified broadly as immune host, infectible (susceptible and resistant) host and tolerant host (see Fig. 1). Immune host: A host in which virus cannot be detected despite repeated inoculations. This is because cells of immune host lacks surface receptors to facilitate virus particle adsorption and entry, or virus particles may enter into cells, but cell machinery does not support the
replication of virus nucleic acid or due to both factors. This reaction typically determines the host range of the virus. Field immune: A host in which virus cannot be detected under natural virus transmission conditions and under conditions typical to the crop environment. Immunity of such hosts can be overcome by introducing virus through non-convention methods, such as agro-infection. Infectible: A host which supports virus multiplication. Infectible hosts are two kinds (i) susceptible host, which readily supports rapid virus infection, multiplication and invasion; and (ii) resistant host, which do not readily support virus infection and multiplication. Passive resistance: Hosts with resistance to virus entry. If virus enters into the cells, it can multiply and invade as in susceptible host. This kind of response is mainly due to plant resistance to vector (vector resistance); due to lack of surface receptors permitting virus entry or interference with virus adsorption to cells. Active resistance: This host resistance is against virus replication. Cells do not support virus replication or translation of its products. This response sometimes is influenced by abiotic factors (such as temperature) which can influence cell functions, thus can result in varied host response to virus infection. Hypersensitive reaction: Severe response of the host plant to minimize the rate and extent of virus invasion. This mainly results in localized necrosis (death of virus infected cells). Field resistance: The presence of various forms of resistance separately or in combination minimizing incidence of infection in an infectible plant is termed field resistance. Tolerant host: Plant is infectible with virus, but it shows only mild symptoms without marked affect on plant growth and vigor or yield. This kind of host response may or may not correlate with virus concentration in the cells. Host may support normal rate of virus multiplication, but show only mild symptoms, such host is susceptible to virus infection, but resistant to disease. If host restricts virus
multiplication leading to decrease in virus concentration and show mild symptoms, this host is resistant to virus and also to disease. Latent host: Virus can infect this host, multiply and invade without causing any effect on the growth, and such plants do not show any symptoms. Sensitive host: Virus infection leading to conspicuous symptoms markedly affecting the growth pattern and often leading to the plant death. In some cases sensitive reaction depends on the stage at which virus infection occurs. Case study: selection for SMD resistance Several different methods have been used to identify pigeonpea accessions with useful levels of resistance to sterility mosaic disease (SMD). The PPSMV is not transmissible to pigeonpea by mechanical sap inoculation. Therefore viruliferous mite vectors have been used for PPSMV transmission. ‘Leaf-stapling’ or ‘infector row’ methods wherein an infected leaflet or infected plant, carrying mites aid in virus transmission onto the healthy plants, are the popular screening methods used for resistance screening. Selection of resistant genotypes is based on visual symptoms. In one method pigeonpea genotypes were categorized based on disease incidence (scoring by symptoms) as (1) resistant (0-10% incidence); (2) moderately resistant (11-30% SMD incidence) and (3) susceptible (>30% SMD incidence). However, this categorization is disadvantaged with the fact that various pigeonpea genotypes show different symptoms and different effects on yield. Screening pigeonpea germplasm at ICRISAT resulted in identification of four types of host response to PPSMV infection, genotypes that show (i) severe mosaic and sterility (eg. ICP8863), (ii) mild mosaic with partial sterility (eg. ICP8862), (iii) chlorotic ringspots without any noticeable sterility (eg. ICP2376 reaction to PPSMV Patancheru isolate) and (iv) no visible symptoms (eg. ICP7035). Genotypes showing mild mosaic and chlorotic ring spot symptoms
can be classified as tolerant to SMD, genotypes with severe mosaic symptoms as susceptible type and the genotypes showing no visible symptoms as resistant. Additionally, if the resistance selection is based on symptoms, it is essential to record observations at least twice, once during early stage of the plant growth (20-30 days following germination) and again before maturity. In this case new growth, especially at the base of the stem should be observed for symptoms. Early observation is important to monitor chlorotic ringspots or mild mosaic symptoms, which get masked with the plant growth. In case of late infection symptoms may not appear even if the genotype is susceptible to PPSMV. However, when plants are ratooned symptoms appear prominently on the new growth.
Screening genotypes using vectors (leaf-stapling method) and assessment based on symptoms does not provide information on type of resistance offered by the host plant. Furthermore, screening of wild Cajanus accessions, which have been suggested to contain useful resistance genes for diseases and pests, was difficult because susceptible wild accessions seldom showed visible symptoms. Moreover, several factors influence the expression of symptoms; (i) genotype x pathogen interaction (ii) environment (iii) PPSMV strains, (iv) mite numbers and (v) age of the plant at which infection occurs. Thus symptoms based methods are unreliable.
Previously progress in developing broad-based SMD resistant material has been hindered by the lack of information on the SMD causal agent and the absence of diagnostic tools. Now the SMD causal agent has been identified and diagnostic tools are available for its detection. This led to the development of a new scheme for rapid screening of genotypes for SMD resistance.
Either for selection of resistance or for critical studies such as inheritance of resistance, it is necessary to inoculate test plants at seedling stage with leaflets containing 5-10 viruliferious
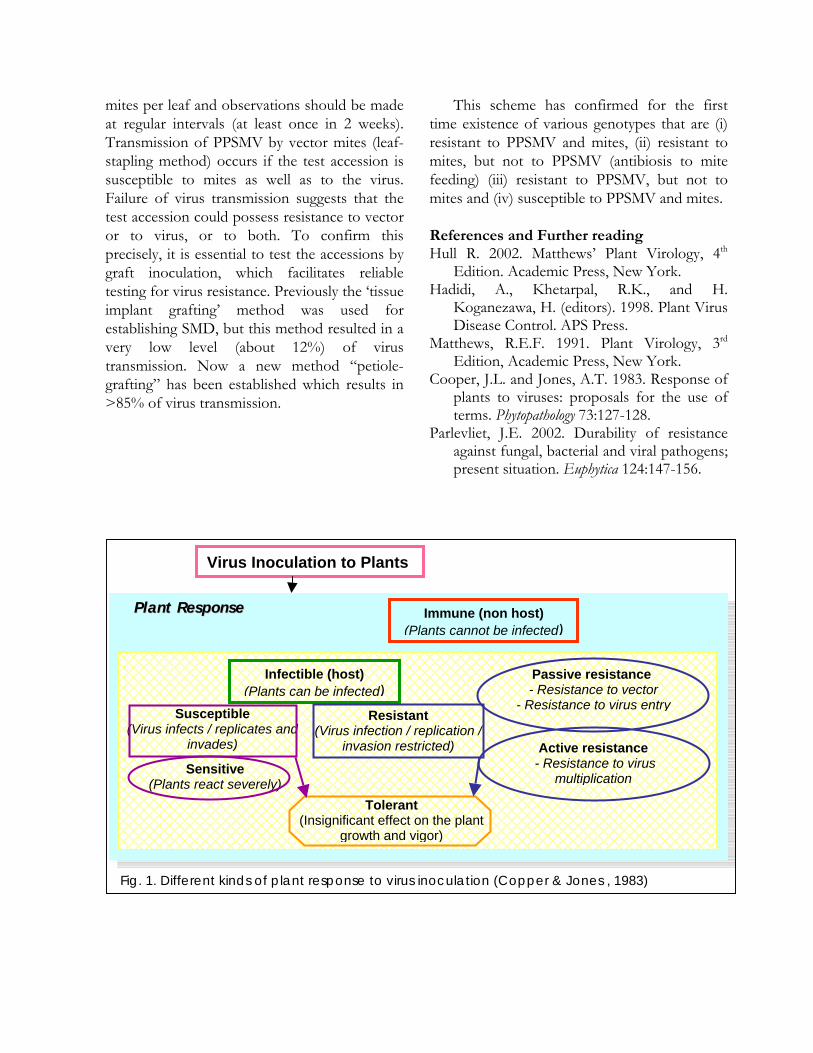
mites per leaf and observations should be made at regular intervals (at least once in 2 weeks). Transmission of PPSMV by vector mites (leaf-stapling method) occurs if the test accession is susceptible to mites as well as to the virus. Failure of virus transmission suggests that the test accession could possess resistance to vector or to virus, or to both. To confirm this precisely, it is essential to test the accessions by graft inoculation, which facilitates reliable testing for virus resistance. Previously the ‘tissue implant grafting’ method was used for establishing SMD, but this method resulted in a very low level (about 12%) of virus transmission. Now a new method “petiole-grafting” has been established which results in >85% of virus transmission.
This scheme has confirmed for the first time existence of various genotypes that are (i) resistant to PPSMV and mites, (ii) resistant to mites, but not to PPSMV (antibiosis to mite feeding) (iii) resistant to PPSMV, but not to mites and (iv) susceptible to PPSMV and mites. References and Further reading Hull R. 2002. Matthews’ Plant Virology, 4th
Edition. Academic Press, New York. Hadidi, A., Khetarpal, R.K., and H.
Koganezawa, H. (editors). 1998. Plant Virus Disease Control. APS Press.
Matthews, R.E.F. 1991. Plant Virology, 3rd Edition, Academic Press, New York.
Cooper, J.L. and Jones, A.T. 1983. Response of plants to viruses: proposals for the use of terms. Phytopathology 73:127-128.
Parlevliet, J.E. 2002. Durability of resistance against fungal, bacterial and viral pathogens; present situation. Euphytica 124:147-156.
Virus Inoculation to Plants
PPllaanntt RReessppoonnssee
Infectible (host) (Plants can be infected)
Immune (non host) (Plants cannot be infected)
Susceptible (Virus infects / replicates and
invades)
Resistant (Virus infection / replication /
invasion restricted)
Sensitive (Plants react severely)
Tolerant (Insignificant effect on the plant
growth and vigor)
Passive resistance - Resistance to vector
- Resistance to virus entry
Active resistance - Resistance to virus
multiplication
Fig. 1. Different kinds of plant response to virus inoculation (Copper & Jones , 1983)
SSeeccttiioonn –– IIIIII
PPrroottooccoollss ffoorr VViirruuss DDeetteeccttiioonn
11. Mechanical Sap Inoculation for Virus Detection and Assay
P Lava Kumar, SV Reddy and AS Reddy
ICRISAT, Patancheru 502324, AP, India
Mechanical inoculation to a range of experimental hosts is the most widely used methods for the detection and identification of viruses. It can be used as qualitative test to know whether virus is present or not and also to assess the infectivity of the virus and nucleic acids. It can also be used to measure the infectivity of the virus, called as ‘bioassay’. This method can be used to test and/or assay the virus or genome from variety of sources (leaf sap / plant tissue extract / purified virus preparations / nucleic acids purified from the virus preparations / total nucleic acids extracted from the infected leaves / extracts of vectors). Bioassays are performed on host plants that produce local lesions. The number of lesions produced is governed by the infective virus concentration in plant extracts prepared in the appropriate buffer. Test plants are dusted with abrasives [carborundum (silicon carbide), corundum (aluminium oxide), celite (diatomaceous earth)] to induce micro wounds to facilitate virus entry. Extracts are applied to test plants with fingers or using pads made with muslin cloth or cotton swab.
Viruses that can multiply in epidermal and mesophyll cells, those viruses transmitted in non-persistent manner by insect vectors and those that reach to moderate concentration can be transmitted by mechanically sap inoculation. Viruses that are restricted to conductive tissues, that exists in low concentration and those transmitted in persistent manner cannot be transmitted by mechanical inoculations. Generally, sap transmissible viruses produce, mosaic, mottling, ringspots, necrotic spots and general necrosis and chlorosis on the infected leaves. Non-mechanically transmissible viruses are restricted to xylem and they cause yellowing symptoms, vein clearing. Mechanically transmissible viruses would have positive polarity genome. Viruses with negative polarity genomes are difficult to transmit by mechanically sap inoculation. Virus stability in vitro, and host components also influence the rate of mechanical transmission. 11.1. Materials
• Pestles and mortars • Muslin cloth • Carborundum or corundum • Chemicals for appropriate buffers
11.2. Inoculation buffer Choice of inoculation buffer depends on the virus and host system. Most commonly used inoculation buffer composition is given here. 11.2.1 Phosphate buffer (0.05 M) KH2PO4 2.4g K2HPO4 5.4 g Thioglycerol 0.75 ml [or 1.56 ml β-mercaptoethanol] dH2O 1L Note: Not necessary to adjust pH (if compounds are accurately measured)
11.3. Selection of experimental hosts Always select healthy looking plants, raised in well-fertilized soils. Choice of plants depends on the virus in question. Commonly French bean (Phaseolus vulgaris), Cowpea (Vigna unguiculata), Chenopodium spp, Nicotiana species is used. For list of host plants to select against each group of viruses refer Matthews (1993) 11.4. Choice of infected tissue and inoculum preparation Always select young infected tissues showing primary symptoms. Young leaves contain high virus concentration and less inhibitory substances. Ensure that source is not contaminated with other pathogens or viruses.
Using a mortar and pestle macerate leaf tissue to fine homogenate under chilled conditions, using cold inoculation buffer. Usually for every 100 mg leaf tissue 1 ml buffer is used (1:10 w/v). Apply this inoculum immediately onto the test plants. 11.5. Procedure
1. Dust abrasive (corundum or carborundum or celite) sparingly on leaves of the test plants to be inoculated.
2. Use disposable gloves to inoculate plants. If not, wash hands thoroughly with soap and then rinse with water.
3. Support the leaf to be inoculated with one hand and apply inoculum on the leaf with fingers of other hand or muslin cloth or thick end of a pestle or with cotton swab.
4. Inoculate at least 5 plants per each treatment. Labelle the pots containing the test plants or plants individually with date and inoculum details (virus inoculated, dilution of the buffer and other details if necessary for the experiment).
5. Rinse the inoculated leaves with tap water and cover the plants with sheets of paper (old news papers) overnight.
6. Wash hands thoroughly with soap (or with trisodium phosphate when highly infectious are handled) and then with water.
11.6. Observations
• Monitor test plants regularly and record time and appearance of first symptoms and the symptom type (mosaic, ringspots, necrosis, chlorosis etc).
• Observe for symptoms on inoculated leaves and newly produced leaves on the plants • When local lesion are produced record their diameter and colour, concentric rings or
haloes • Observe for systemic symptoms such as vein clearing, mosaic, line patterns chlorosis, leaf
deformation, puckering, enations, etc. • Check both inoculated leaves and newly produced leaves on the plants by ELISA or by
back inoculating on to the local lesion assay plant as described above.
Classification of hosts: • Symptoms only on the inoculated leaves: Local lesion hosts • Symptoms on inoculated leaves as well as newly developed leaves: Systemic host • No symptoms on inoculated leaves, but symptoms on newly developed leaves: Systemic
host • No symptoms on inoculated leaves or on newly developed leaves. Assay both leaves by
ELISA. − Both samples are ELISA-negative: Non-host (or immune host) − Only inoculated leaves are positive: Asymptomatic local host − Both inoculated and newly developed leaves test positive: Asymptomatic systemic
host Note: Asymptomatic infections should be confirmed by back inoculation with the sap extracted from such hosts, onto symptom producing hosts.
Note 1: Symptom development depends on the virus incubation period in each host. Usually it would be 4-20 days depending on virus and host. Some viruses would take long time (>40 days) to produce symptoms. At that stage of the crop growth, symptoms may not appear clearly, and/or are difficult to notice due to growth related changes. Note 2: Some viruses are erratically distributed in plants; leaves on one or few branches may produce symptoms. Careful monitoring is essential in such cases. Note 3: Symptoms can be enhanced by pruning the plants. New growth of pruned plants generally shows good symptoms. Note 4: Record symptoms on each host by taking colour and black white photographs with contrasting and neat background.
11.7. Precautions
• Good greenhouse facilities are required to maintain test plants rose for the biological assays. At least, test plants should be kept in cages protected with wire-mesh to control insets.
• Only seeds obtained from genetically pure-lines should be sued for this assay to avoid confusion due to symptom variation as result of genetic impurity.
• When highly infectious viruses such as Tobacco mosaic virus, tested, all the equipment should be soaked in sodium hypochlorate overnight, they should be washed and autoclaved prior to next use. Inoculated plants should be kept well away from other plants to avoid contact transmission.
• Care should be taken to avoid contact transmission by handling such plants with gloves.
12. Enzyme-linked Immunosorbent Assay (ELISA)
The basic principle of ELISA technique involves immobilizing the antigen onto a solid surface or captured by specific antibodies bound to the solid surface, and probing with specific immunoglobulins carrying an enzyme label. The enzyme retained in the case of positive reaction is detected by adding a suitable substrate. The enzyme converts the substrate to a product, which can be recognized by its colour. Direct antigen coating (DAC)-ELISA (TSV as example): This is the simplest of ELISA. Antigen is bound to the plate surface. In the second step, polyclonal antiserum (primary antibody usually produced in a rabbit or mice) or IgGs are used to detect the trapped homologous antigen (Fig. 1). Primary antibody is detected by the enzyme-labeled secondary antibody produced in a different animal (goat). Then enzyme substrate is added to detect the positive reactions. The main advantage with DAC-ELISA is one secondary antibody (anti-rabbit or anti-mice) can be utilized with several systems. This is the most widely used assay. However, certain virus cannot be detected by DAC-ELISA (such as luteoviruses). Polyclonal antibodies to TSV have been produced in a rabbit. In the first step, virus antigen in leaf sap extract bind to the plate. In the second step, primary antibody (anti-TSV (rabbit) antibodies) is used to detect the plate-bound TSV antigen. In the third step, secondary antibody, the alkaline phosphates (ALP)-labelled anti-rabbit (goat) antibodies, are used to detect the positive reactions. Enzyme substrate, p-nitro phenyl phosphate (PNPP) is added into the ELISA wells to develop positive reactions. Substrate turns to deep yellow in case of strong positive reactions, and it remains colorless to light yellow in negative and weak reactions, respectively. In ALP system colour difference between positive reaction and negative reaction is difficult to read visually. Plates must be read in an ELISA plate reader fitted with a 405 nm filter for accurate assessment of the results. Double antibody sandwich (DAS)-ELISA (PPSMV as example): In DAS-ELISA polyclonal antibodies or IgGs extracted from the polyclonal serum are coated onto the ELISA plate followed by the addition of antigen. The trapped antigen is detected by the addition of enzyme labeled antibodies. In this assay virus antigen is sandwiched between two antibodies. This assay is specific for only one virus, and requires good amount of antiserum to prepare enzyme conjugate. Polyclonal antibodies to Pigeonpea sterility mosaic virus (PPSMV) were produced in a rabbit. These were used to detect the virus in plant tissues by double antibody sandwich (DAS)-ELISA (Fig. 2) using penicillinase (PNC)-labeled PPSMV-specific immuno-γ-globulins (IgGs) as reporter. The positive reaction is detected by adding sodium-penicillin-G (substrate). Penicillinase converts sodium penicillin-G into penicilloic acid, and this is detected by utilizing an acid-sensitive pH indicator, bromothymol blue (BTB). In the case of positive reaction the bluish-green colour of the PNC substrate turn apple green to orange-yellow. No colour change will occur in the case of negative reaction. PNC reaction can also be quantified by taking readings in ELISA plate reader fitted with 620nm filter. PNC-based system is cost-effective and applicable in laboratory with minimum facilities.
12.1.1 Materials • ELISA plates: Several brands are available. For high binding ‘Nunc-Maxisorp’ plates are
recommended. • Micropipettes: 1-40 µl, 40-200 µl and 200-1000 µl single channel pipettes. 40-200 µl
multichannel pipette. Several brands are available (eg: Eppendorf, Finpipette, Gilson). Those with adjustable volumes are preferable.
• ELISA plate reader: Manual or automatic provided with 620 nm filter and 405 nm filter. • PPSMV polyclonal antibodies. • ALP-labelled anti-rabbit (goat) antibodies. Whole molecule (available from several
commercial companies) • Penicillinase enzyme (Sigma) • Mortars and pestles • Muslin cloth • pH meter • p-nitrophenyl phosphate (PNPP) • Light box • Incubator • Refrigerator
12.1.2. Solutions 12.1.2.1. Carbonate buffer or coating buffer, pH 9.6
Na2CO3 1.59 g NaHCO3 2.93 g
Distilled water to 1 l [No need to adjust pH] Note: Add Diethyldithiocarbamate (DIECA) at 1.71 M concentration (1.71 gm for 1 L) when this buffer is used for extracting antigen. DIECA is not necessary for coating antibodies.
12.1.2.2. Phosphate buffer saline (PBS), pH 7.4 Na2HPO4 2.38 g KH2 PO4 0.4 g KCl 0.4 g NaCl 16.0 g Distilled water to 2 l No need to adjust the pH
12.1.2.3. Phosphate buffered saline Tween (PBS-T) PBS 1 l Tween-20 0.5 ml
12.1.2.4. Antibody buffer (PBS-TPO) PBS-T 100 ml Polyvinyl Pyrrolidone (PVP) 40,000 MW 2.0 gm Bovine serum albumin (Sigma Cat. No. A6793) 0.2 gm

12.1.2.5. Distilled water - Tween (dH2O-T) Distilled water 2 l Tween 20 (0.05% v/v) 1 ml 12.1.2.6. Substrate buffer (BTB buffer) for PNC system 1. Dissolve 15 mg bromothymol blue (BTB) in 50 ml of 0.01 M NaOH. Neutralise the alkali by
adding 0.1 N HCl, until the pH of the solution is 7.4 (or to the appearance of bluish-green colour). Make up the volume to 100 ml with distilled water. [Note: the final concentration of NaOH in 100 ml solution is 0.005 M and that of BTB is 0.015% w/v].
2. Add sodium penicillin-G (potassium penicillin-G or procaine penicillin also suitable) at 0.5 mg/ml (w/v) concentration and adjust the pH to 7.2 using either HCl or NaOH. Store the mixture at room temperature.
Note:- It is absolutely essential to adjust the substrate buffer pH to 7.2 before use. BTB solution alone is stable for several months at room temperature, but with substrate (penicillin) it is stable only for few days. 12.1.2.7. Substrate buffer (diethanolamine buffer) for ALP system Prepare 10% diethanolamine in distilled water and store at 4 0C. Adjust pH to 9.8 with con.HCl. Prepare 0.5 mg/ml p-nitro phenyl phosphate (PNPP) in 10% diethanolamine, pH 9.8 (for each 15 mg table 30 ml substrate buffer is required). This solution should be prepared fresh. Don’t store left over buffer. Note: Diethanolamine is toxic and harmful to eyes. Take necessary care to avoid contact with skin. PNPP convert to p-nitrophenol after reacting with APL. Plates after adding substrate must be handled extremely carefully. Precautions for DAC and DAS-ELISA
• Perform all incubation steps in a humid chamber to provide uniform temperature [a small plastic box suitable to fit ELISA plate, with moist paper towels covering the bottom of the box].
• Rinse the glassware intended for storing penicillin-BTB solution with water thoroughly. Presence of even traces of detergent or soaps will buffer the reaction.
• Use new ELISA plates as supplied by the manufacturer. Do not wash or rinse them prior to use.
• In each plate always include positive (PPSMV infected sample), negative (healthy) and buffer controls.
• Unless antiserum used is very high quality, cross adsorption of crude antisera with healthy plant extract is recommended for primary antibodies used for DAC-ELISA. This is done by grinding healthy leaves in 1:50 dilution (W/V) buffer, then filter it by passing through muscling cloth. Use this for diluting the antiserum appropriately and incubate by shaking at room temperature or at 37 0C for 1h and use it for coating into wells of ELISA plates.

12.1.3. Extraction of PPSMV IgG by sodium sulphate method 12.1.3.1. Materials • 36% Na2SO4: Dissolve 36 g Na2SO4 in 80 ml distilled water. Make up the volume to 100 ml. • 18% Na2SO4: Mix 36% Na2SO4 with equal volumes of distilled water. • PBS: See section 12.1.2.2. • Sodium azide • UV-Spectrophotometer • Magnetic stirrer • Dialysis tube • Low speed centrifuge (table top or floor models) 12.1.3.2. Procedure 1. Dilute 1 ml of crude antiserum with 1 ml of distilled water. 2. Add 2 ml of 36% Na2SO4, drop by drop. 3. Immediately collect the precipitate by centrifugation at 6,000 rpm/10 min at room
temperature. 4. Suspend the precipitate in 18% Na2SO4 and centrifuge at 6,000 rpm/10 min at room
temperature. Repeat this again. 5. Dissolve the precipitate in 2 ml half strength PBS containing 0.02% sodium azide (1x PBS
diluted 1:1 with distilled water). 6. Dialyze against 500 ml half-strength PBS containing 0.02% sodium azide. Change the buffer at
least three times. 7. Remove IgGs from the dialysis bag, measure the concentration by reading the absorbance
(230-300 nm) in a spectrophotometer. Normally, the preparation should be diluted 1:8 for measurement. At 280 nm, 1.4 optical density (OD) is considered to be equal to 1 mg/ml, when measure in 1 cm cuvettes.
8. Store IgGs at 4 0C in aliquots. Note: Do not freeze IgG preparations. 12.1.4. Conjugation of PPSMV IgGs with Penicillinase by glutaraldehyde method 12.1.4.1. Materials
• PPSMV IgG fraction (see 12.1.3) • PBS (see 12.1.2.2) • Glutaraldehyde (generally supplied as 25% v/v solution) (Sigma, Cat. No. G5882) • Sodium azide • Dialysis bag (0.6 cm dia) • Bovine serum albumin (BSA) (Sigma, Cat. No. A7638) • Penicillinase (PNC) (Sigma, Cat. No. P0389). Generally supplied as lyophilized powder.
Store this at 4 0C. Working solution: Prepare PNC solutions of 1 mg/ml concentration in sterile distilled water and store in a refrigerator (4 0C).
12.1.4.2. Procedure 1. Place 500 µg/ml, PPSMV IgGs diluted in PBS, in a dialysis bag and add 250 µg of
penicillinase. Dialyse against PBS in a beaker for 1 h at room temperature. 2. Transfer the dialysis bag into a beaker containing 0.06% glutaraldehyde in PBS (Add 1 ml
of 25% glutaraldehyde in 400 ml of PBS to get 0.06% v/v final concentration) and dialyse for 3-4 h at room temperature.
3. Replace glutaraldehyde with 500 ml of PBS containing 0.02% sodium azide and dialyse for 18 h at 4 0C with at least three changes of buffer. For each change replace with 500 ml PBS containing sodium azide.
4. Transfer the conjugate into a new glass or plastic vial and add BSA at 5 mg/ml concentration. Store in small aliquots at 4 0C. If stored properly shelf life of enzyme IgG conjugate should exceed 12 months. Note: Do not freeze the conjugate.
5. Estimate the optimum working concentration of the enzyme conjugate by performing ELISA using various dilutions.
12.1.5. Double antibody sandwich (DAS)-ELISA 12.1.6. Cross-adsorption of PPSMV-antiserum To minimize the non-specific reaction as a result of presence of antibodies to host plant antigen, cross-adsorption of PNC-conjugated PPSMV IgGs with healthy leaf extracts is recommended. For this grind healthy leaves in antibody buffer to give 1:10 w/v dilution (10 mg/ml), then filter through a double layer of muslin cloth. Use this extract for preparing the required dilution of PPSMV-IgG-PNC conjugate. This step reduces the non-specific reaction due to neutralization of antibodies to host antigen. Note: Cross-adsorbed enzyme conjugates can be stored for a maximum period of 3 weeks at 4 0C.
• Preparation for 15 ml PPSMV-IgG-PNC conjugate (sufficient for one ELISA plate using 100 µl reaction volume) 1. Grind 150 mg of healthy pigeonpea leaf (ICP 7035 or ICP8863) in 4 ml of PBS-TP0. 2. Filter the extract through double layer muslin cloth and make up the volume to 15 ml
using PBS-TPO. 3. Dilute PNC-conjugated PPSMV IgGs in healthy pigeonpea leaf extract, to 1:1,500
dilution and incubate at 37 0C or room temperature for 45-60 min with gentle shaking. 12.1.7. Steps in DAS-ELISA 1. Coating ELISA plates with antibodies: Dilute PPSMV polyclonal antiserum to 1;10,000 in
carbonate coating buffer and dispense 100 µl into each well of the ELISA plate. Cover the plate, place it in a humid chamber and incubate at 37 0C for 1 h or in a refrigerator (4 0C) overnight.
2. Wash the plate with three changes of PBS-T, allowing 3 min at each wash. 3. Note: Antibody coated plates can be stored for up to 4-6 weeks in a refrigerator. In this case
coat the well of the ELISA plate with antibodies, incubate and wash the plate as above. After final wash, fill the wells of the ELISA plate with PBS-T, cover with a lid and store in a refrigerator (4 0C).
4. Preparation of leaf extract: Grind test samples in PBS-TPO at a rate of 100 mg/ml buffer and dispense 100 µl into each well of the antibody coated ELISA plates, incubate in a humid chamber for 1 h at 37 0C or in a refrigerator (4 oC) overnight.
5. Wash the plate with three changes of PBS-T, allowing 3 min for each wash. 6. Cross-adsorb the PNC conjugated PPSMV IgGs as described in section 12.1.6. dispense 100 µl
of this into each well of the ELISA plate. Keep the plates in a humid chamber and incubate at 37 0C for 1 h.
7. Wash the plates with three changes of distilled water-Tween, allowing 3 min for each wash. Note: Traces of PBS-T left in wells is adequate to buffer the reaction between penicillin and penicillinase and therefore preventing the color change.
8. Add 100 µl of PNC substrate and incubate for 1 h at room temperature or for the intervals depending on the development of orange-yellow colour in the case of positive reaction.
Observe plate on X-ray film light box for recording color changes. Results recorded after long intervals (>2 hrs) may not be accurate. Measure absorbance at 620 nm in an ELISA plate reader. Note: Absorbance value of the positive reaction will be lesser than negative.
9. In the case of positive reaction the bluish-green colour of BTB will turns to apple-green, and then to orange-yellow color. Apple-green color indicates week positive and orange yellow indicates a strong positive. Normally 0.2 mg/ml BTB gives an optical density of >2 units and positive reaction gives less than 0.1 optical density (O.D) units.
12.1.8. Direct antigen coating (DAC)-ELISA
1. Coating ELISA plates with antigen: Grind test leaves (French bean, cowpea, groundnut, sunflower) in carbonate coating buffer at a rate of 100 mg/ml buffer (1:10 w/v) and dispense 100 µl into each well of the new ELISA plate. Incubate the plate in a humid chamber for 1 h at 37 0C or in a refrigerator (4 oC) overnight.
2. Wash the plate with three changes of PBS-T, allowing 3 min for each wash. 3. Dilute TSV polyclonal antiserum to 1:20,000 in PBS-TPO and dispense 100 µl into each well of
the ELISA plate. Cover the plate, place it in a humid chamber and incubate at 37 0C for 1 h or in a refrigerator (4 0C) overnight.
4. Wash the plate with three changes of PBS-T, allowing 3 min for each wash. 5. Dilute anti-rabbit ALP-conjugate to 1:5000 in PBS-TPO and dispense 100 µl of this into each
well of the ELISA plate. Keep the plates in a humid chamber and incubate at 37 0C for 1 h or in a refrigerator (4 0C) overnight (note: conjugate after incubation can be collected for reuse at least 3-4 times, if stored properly at 4 0C, within a period of 2 weeks from the date of first use)
6. Wash the plate with three changes of PBS-T, allowing 3 min for each wash. 7. Add 100 µl of PNPP substrate (see 12.1.2.7) into each well and cover the plates and incubate
in dark, at room temperature. (Note: Substrate solution turns yellow when exposed to light for long time)
8. Observe plate on X-ray film light box for recording color changes. Results recorded after long intervals may not be accurate. Unlike PNC system, overnight incubation at 4 0C can also be allowed for ALP system. Measure absorbance at 405 nm in an ELISA plate reader. Note: Absorbance value of the positive reaction will be higher than negative reactions.
9. In the case of positive reaction the colourless-substrate will turns to light yellow, and then to deep-yellow colour. Light yellow colour indicates week positive and deep- yellow indicates a strong positive. The reaction can be stopped by adding 50 µl of 3 M NaOH per well.
12.1.9 Virus Testing in Seed Samples RDVJ Prasad Rao
NBPGR, Hyderabad, India 12.1.9.1. Non-destructive ELISA for the detection of viruses in groundnut seeds A simple method was devised for large scale screening of seed samples for the detection of seed-transmitted viruses (Peanut stripe virus, Peanut mottle virus, Peanut stunt virus, Cucumber mosaic virus). This is done in two steps. During step-1, ten randomly collected seed samples are pooled and tested in DAC-ELISA using antisera cocktail (prepared by mixing antiserum of PStV, PMV, PSV and CMV). The samples that test positive are analyzed by ELISA (step – 2). In step –2, samples are tested separately with antiserum of each virus for specific identification of the virus. This assay is simple, cost-effective and time saving.
Note 1: The procedure and buffers used for this assay are similar to that of DAC-ELISA (Section 12.1.8). Note 2: Irrespective of the number of seeds received for each germplasm accession, testing is done on 10 randomly selected seeds. Note 3: The level of seed transmission of each virus varies (it ranges from 0.1 – 50% depending on the virus and host). This factor influences the final outcome.
Step 1: Identification of seed lot infected with PStV, PMV, PSV or CMV (pool assay) Procedure:
1. With a sterile scalpel-blade excise a piece (about 50 mg) of cotyledon tissue opposite to embryo. Likewise collect samples from 10 seeds and pool them together. Note: Ensure not to damage embryo; carefully label the remaining part of the seed (embryo and part of the cotyledon) and retain it till ELISA testing is completed.
2. In a mortar grind excised cotyledon samples (pooled from 10 seeds) using carbonate coating buffer with DIECA (100 mg sample in 1 ml buffer; 1:10 w/v).
3. Coat 100 µl of the extracted samples into the wells of the ELISA plate and incubate in a humid chamber at 37 0C for 1 h or 4 0C overnight.
4. Wash the plate thrice with PBS-T, 3 min interval between each wash. 5. Add 100 µl of cross-adsorbed antisera (cocktail) and incubate for 1 hr at 37 0C in humid
chamber. [Note: For cross-adsorption, 1 gm of healthy ground seed is extracted in 20 ml of PBS-TPO, filter through single layer muslin cloth and use for diluting the antisera)
6. Wash the plate thrice with PBS-T, 3 min interval between each wash. 7. Add 100 µl of anti-rabbit (goat) ALP-conjugate diluted to 1:5000 in PBS-TPO, into wells of
the ELISA plate and incubate at 37 0C.
8. Wash the plate thrice with PBS-T, 3 min interval between each wash. 9. Add ALP substrate (p-nitrophenyl phosphate) and incubate for 1 hr at room
temperature. Read the plate in an ELISA plate reader fitted with 405 nm filter. 10. Mark the wells that test positive in this assay.
Note: Positive reaction indicate that seeds from that lot may be infected with either PStV, PMV, PSV or CMV; or two or more of these viruses. Confirm specific virus identity by ELISA in step-2
Step 2: Specific identification of virus present in the see lot
1. Prepare antigen extract from the individual seeds from the seed-lot that tested ‘positive’ in pooled assay. Perform ELISA test as above, but this time using antiserum of each virus (PMV, PStV, PSV and CMV) separately.
2. This results in specific identification of the virus present in the seeds. Note: Procedure is similar to DAC-ELISA described above
Grow-out test for ELISA negative seed. 1. Sow the seed that are negative to any of the 4 viruses in quarantine greenhouse. 2. Observe germinated plants for up to 4 – 5 weeks, for expression of any symptoms of
exotic viruses. Note: If the plants are free from virus – seed lot will be approved for release or they will be permitted for seed production in quarantine zone. Seed thus produced will be approved for release.
Caution: Seeds that test positive in ELISA assay indicates that they contain viral antigen, but not necessarily the presence of infectious virus. This is true even in case of seed transmitted viruses. Only few of those ELISA positive seeds contain infectious virus. This can be confirmed by bioassay. Antigens of few viruses can be detected in seed (Peanut bud necrosis virus), but they are not infectious, and such viruses are classified as non-seed-borne.
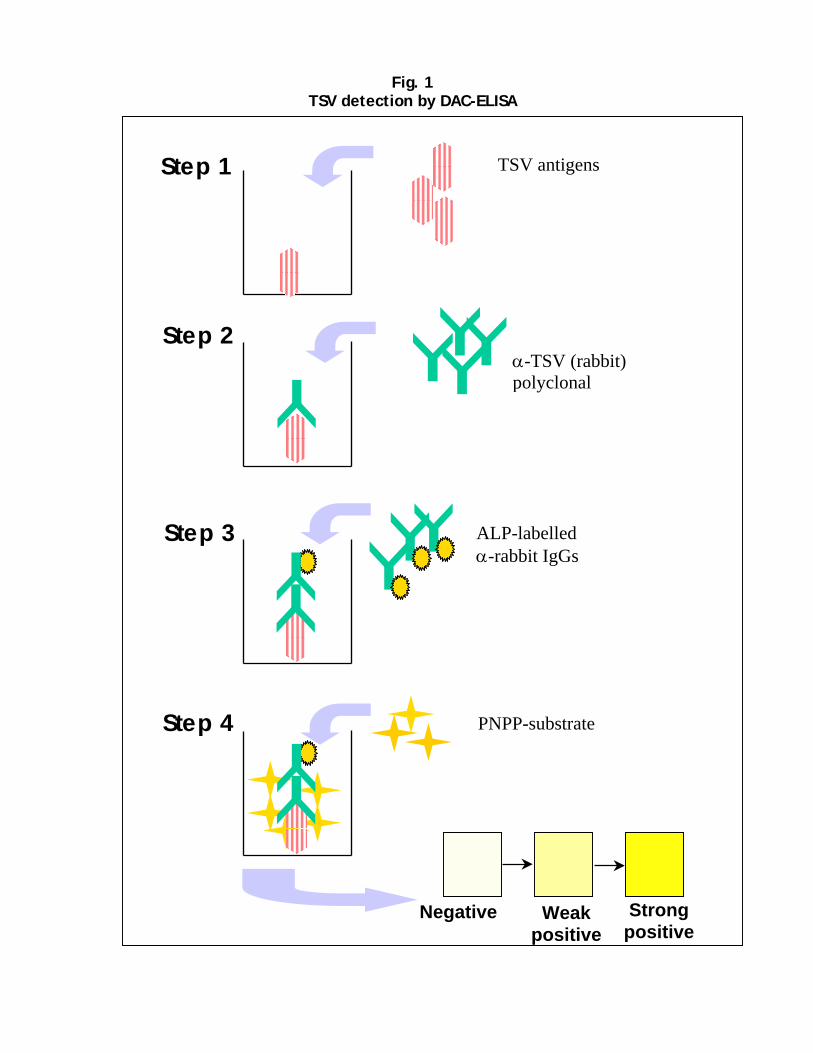
Step 1
Step 4
Step 3
Step 2
TSV antigens
α-TSV (rabbit) polyclonal
ALP-labelled α-rabbit IgGs
PNPP-substrate
Fig. 1 TSV detection by DAC-ELISA
Negative Weak positive
Strong positive
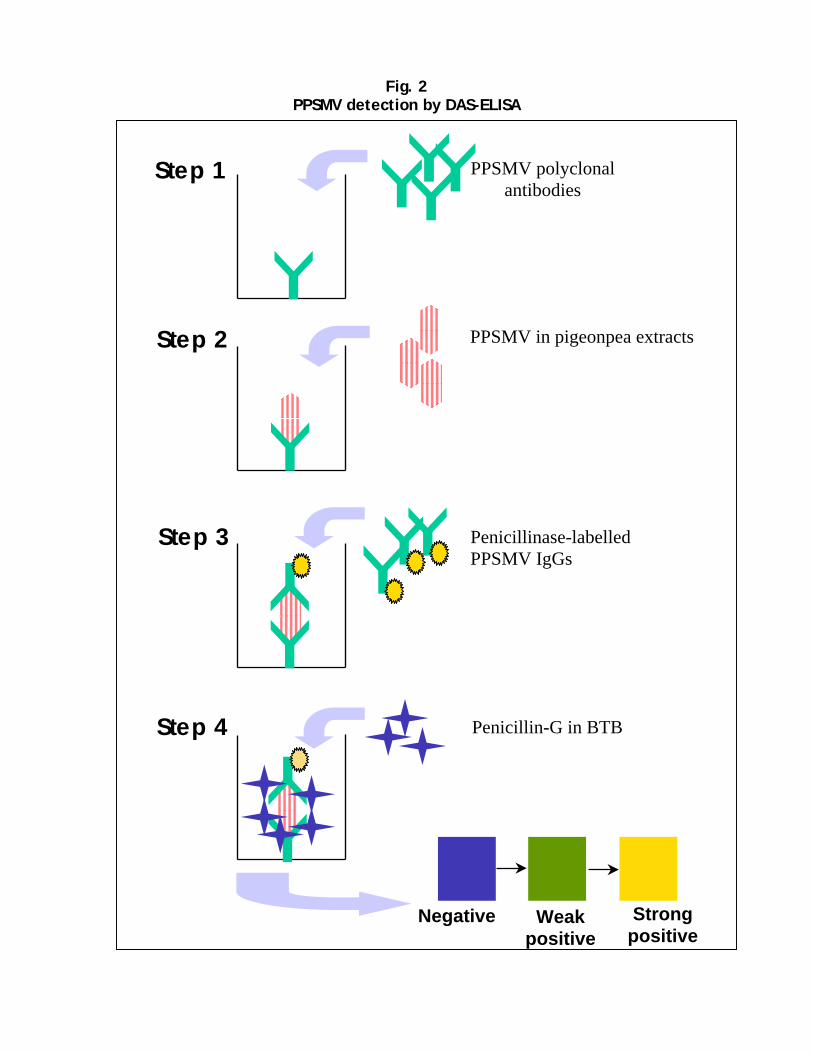
Step 1
Step 4
Step 3
Step 2
PPSMV polyclonal antibodies
PPSMV in pigeonpea extracts
Penicillinase-labelled PPSMV IgGs
Penicillin-G in BTB
Fig. 2 PPSMV detection by DAS-ELISA
Negative Weak positive
Strong positive
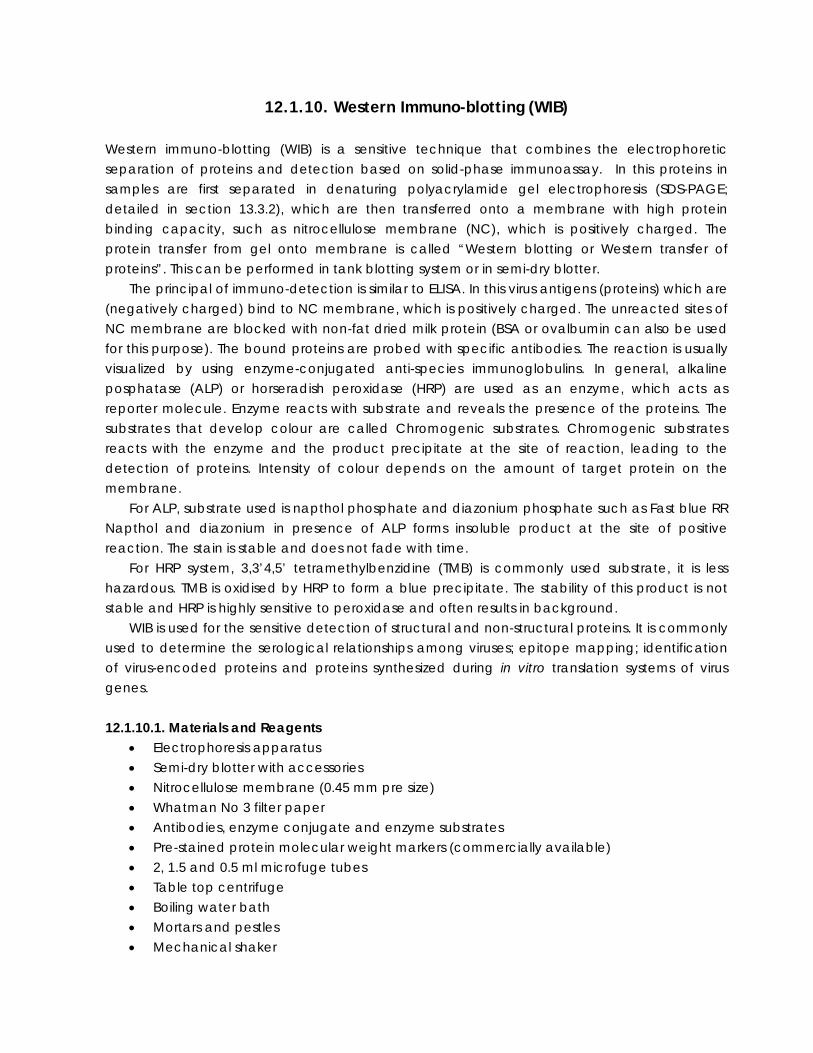
12.1.10. Western Immuno-blotting (WIB)
Western immuno-blotting (WIB) is a sensitive technique that combines the electrophoretic separation of proteins and detection based on solid-phase immunoassay. In this proteins in samples are first separated in denaturing polyacrylamide gel electrophoresis (SDS-PAGE; detailed in section 13.3.2), which are then transferred onto a membrane with high protein binding capacity, such as nitrocellulose membrane (NC), which is positively charged. The protein transfer from gel onto membrane is called “Western blotting or Western transfer of proteins”. This can be performed in tank blotting system or in semi-dry blotter.
The principal of immuno-detection is similar to ELISA. In this virus antigens (proteins) which are (negatively charged) bind to NC membrane, which is positively charged. The unreacted sites of NC membrane are blocked with non-fat dried milk protein (BSA or ovalbumin can also be used for this purpose). The bound proteins are probed with specific antibodies. The reaction is usually visualized by using enzyme-conjugated anti-species immunoglobulins. In general, alkaline posphatase (ALP) or horseradish peroxidase (HRP) are used as an enzyme, which acts as reporter molecule. Enzyme reacts with substrate and reveals the presence of the proteins. The substrates that develop colour are called Chromogenic substrates. Chromogenic substrates reacts with the enzyme and the product precipitate at the site of reaction, leading to the detection of proteins. Intensity of colour depends on the amount of target protein on the membrane.
For ALP, substrate used is napthol phosphate and diazonium phosphate such as Fast blue RR Napthol and diazonium in presence of ALP forms insoluble product at the site of positive reaction. The stain is stable and does not fade with time.
For HRP system, 3,3’4,5’ tetramethylbenzidine (TMB) is commonly used substrate, it is less hazardous. TMB is oxidised by HRP to form a blue precipitate. The stability of this product is not stable and HRP is highly sensitive to peroxidase and often results in background.
WIB is used for the sensitive detection of structural and non-structural proteins. It is commonly used to determine the serological relationships among viruses; epitope mapping; identification of virus-encoded proteins and proteins synthesized during in vitro translation systems of virus genes.
12.1.10.1. Materials and Reagents
• Electrophoresis apparatus • Semi-dry blotter with accessories • Nitrocellulose membrane (0.45 mm pre size) • Whatman No 3 filter paper • Antibodies, enzyme conjugate and enzyme substrates • Pre-stained protein molecular weight markers (commercially available) • 2, 1.5 and 0.5 ml microfuge tubes • Table top centrifuge • Boiling water bath • Mortars and pestles • Mechanical shaker
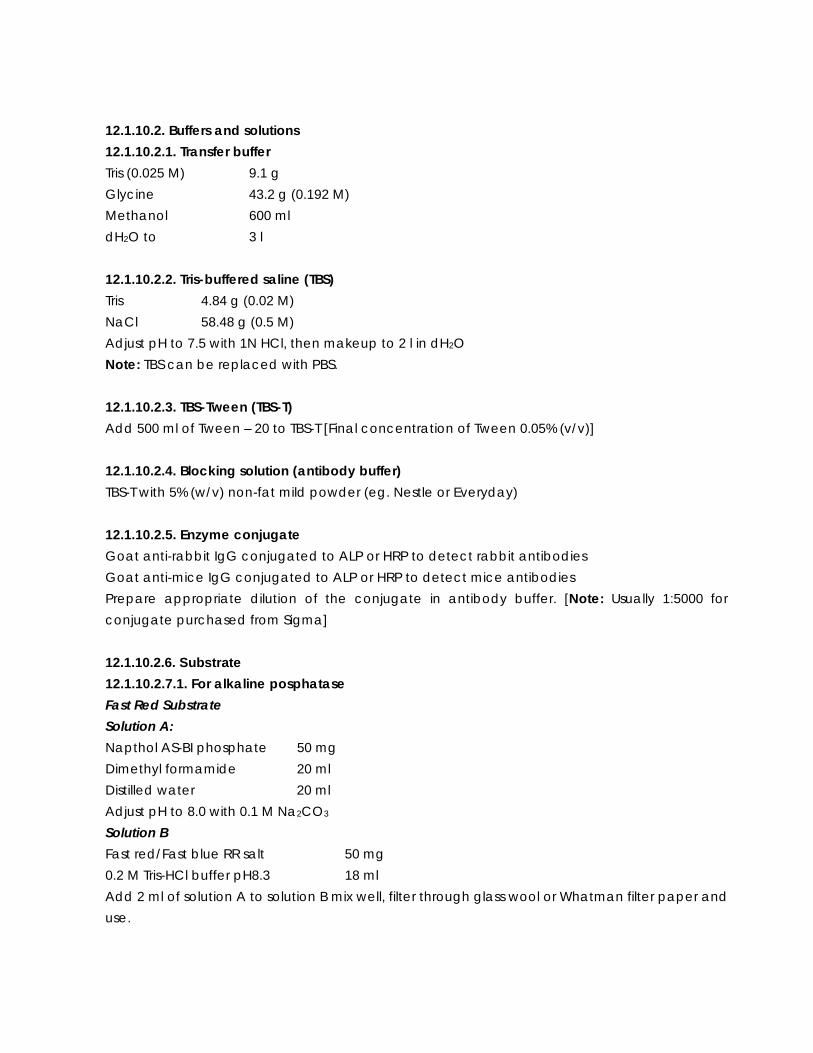
12.1.10.2. Buffers and solutions 12.1.10.2.1. Transfer buffer Tris (0.025 M) 9.1 g Glycine 43.2 g (0.192 M) Methanol 600 ml dH2O to 3 l 12.1.10.2.2. Tris-buffered saline (TBS) Tris 4.84 g (0.02 M) NaCl 58.48 g (0.5 M) Adjust pH to 7.5 with 1N HCl, then makeup to 2 l in dH2O Note: TBS can be replaced with PBS. 12.1.10.2.3. TBS-Tween (TBS-T) Add 500 ml of Tween – 20 to TBS-T [Final concentration of Tween 0.05% (v/v)] 12.1.10.2.4. Blocking solution (antibody buffer) TBS-T with 5% (w/v) non-fat mild powder (eg. Nestle or Everyday) 12.1.10.2.5. Enzyme conjugate Goat anti-rabbit IgG conjugated to ALP or HRP to detect rabbit antibodies Goat anti-mice IgG conjugated to ALP or HRP to detect mice antibodies Prepare appropriate dilution of the conjugate in antibody buffer. [Note: Usually 1:5000 for conjugate purchased from Sigma] 12.1.10.2.6. Substrate 12.1.10.2.7.1. For alkaline posphatase Fast Red Substrate Solution A: Napthol AS-BI phosphate 50 mg Dimethyl formamide 20 ml Distilled water 20 ml Adjust pH to 8.0 with 0.1 M Na2CO3 Solution B Fast red/Fast blue RR salt 50 mg 0.2 M Tris-HCl buffer pH8.3 18 ml Add 2 ml of solution A to solution B mix well, filter through glass wool or Whatman filter paper and use.
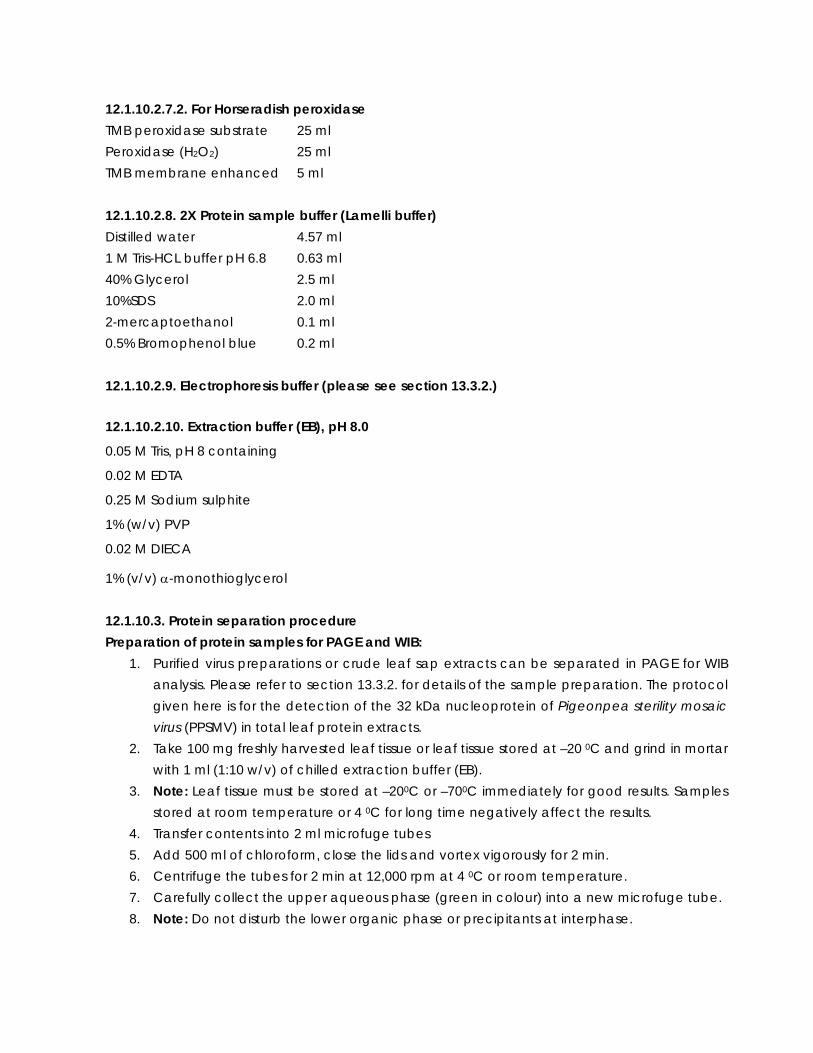
12.1.10.2.7.2. For Horseradish peroxidase TMB peroxidase substrate 25 ml Peroxidase (H2O2) 25 ml TMB membrane enhanced 5 ml 12.1.10.2.8. 2X Protein sample buffer (Lamelli buffer) Distilled water 4.57 ml 1 M Tris-HCL buffer pH 6.8 0.63 ml 40% Glycerol 2.5 ml 10%SDS 2.0 ml 2-mercaptoethanol 0.1 ml 0.5% Bromophenol blue 0.2 ml 12.1.10.2.9. Electrophoresis buffer (please see section 13.3.2.)
12.1.10.2.10. Extraction buffer (EB), pH 8.0
0.05 M Tris, pH 8 containing
0.02 M EDTA
0.25 M Sodium sulphite
1% (w/v) PVP
0.02 M DIECA
1% (v/v) α-monothioglycerol 12.1.10.3. Protein separation procedure Preparation of protein samples for PAGE and WIB:
1. Purified virus preparations or crude leaf sap extracts can be separated in PAGE for WIB analysis. Please refer to section 13.3.2. for details of the sample preparation. The protocol given here is for the detection of the 32 kDa nucleoprotein of Pigeonpea sterility mosaic virus (PPSMV) in total leaf protein extracts.
2. Take 100 mg freshly harvested leaf tissue or leaf tissue stored at –20 0C and grind in mortar with 1 ml (1:10 w/v) of chilled extraction buffer (EB).
3. Note: Leaf tissue must be stored at –200C or –700C immediately for good results. Samples stored at room temperature or 4 0C for long time negatively affect the results.
4. Transfer contents into 2 ml microfuge tubes 5. Add 500 ml of chloroform, close the lids and vortex vigorously for 2 min. 6. Centrifuge the tubes for 2 min at 12,000 rpm at 4 0C or room temperature. 7. Carefully collect the upper aqueous phase (green in colour) into a new microfuge tube. 8. Note: Do not disturb the lower organic phase or precipitants at interphase.

9. To the aqueous phase add equal volumes of 2X sample buffer (Lamelli buffer), vortex for 15 seconds.
10. Place tubes on sample holder and heat treat for exactly 3 min in a boiling water bath. 11. Takeout the tubes and place on ice, till samples are used for separation in gel.
Note: For storing and reusing the samples, dispense the samples into 100 ml aliquots and store at –20oC. Avoid repeated freezing and thawing.
12. Load 50 –100 ml of the sample into PAGE gel. In one well, load pre-stained protein molecular weight marker
Separation of protein samples in PAGE gels
13. Please see section 13.3.2. for preparation of PAGE gels and electrophoresis. 14. After electrophoresis, carefully takeout the gel and soak in transfer buffer
12.1.10.4. Western blotting (protein transfer) procedure (Tank electroblotting)
1. Perform all steps with gloved hands 2. Soak the PAGE gel, Whatman filter papers, NC membrane and sponge pads in transfer
buffer for 5 to15 min. Note: Do not allow NC membrane to dry till the procedure is completed. Always handle NC membrane with blunt ended forceps.
3. Prepare the Western-blotting sandwich as follows (see Fig. 3) 1. Place the sponge pad on the cathode (Black) plate 2. Place the Whatman filter papers over the sponge pads. With a pipette gently role
over the surface to remove any air bubbles trapped between the filter papers and sponge pads.
3. Note: Air bubbles act as insulators by obstructing the flow of ions (current) and prevent transfer of proteins. Care should be taken to remove the trapped air bubbles.
4. Place the gel on top of the Whatman filter paper. 5. Place the NC membrance on top of the PAGE gel. With a pipette gently role over
the surface to remove any air bubbles trapped between the filter papers and sponge pads. Note: Don’t drag NC membrane on the gel surface, it can result in background reaction. NC membrane should be handled with forceps.
6. Place the Whatman filter papers over the NC membrane. With a pipette gently role over the surface to remove any air bubbles trapped between the filter papers and sponge pads.
7. Place the sponge pad on the Whatman filter paper and then place the anode (Red) plate
8. Clamp this sandwich and place it in the Western blotting tank, filled with transfer buffer.
9. Connect unit to the power supply. Set current to 200 mA (constant current setting) and perform blotting for 2-3 hrs, at low temperature.
10. Note: Blotting can also be done for longer hours to increase transfer efficiency; in this case, experiment should be performed at 4-10 0C to counter the heat generated due to high current.
12.1.10.5. Immuno detection of immobilized proteins Note: Perform all steps on mechanical shaker with gentle shaking setup.
1. After the western transfer, takeout the NC membrane carefully and immerse it in the blocking solution for 1 h at room temperature with gentle shaking. Membrane can be left overnight in blocking solution at 4 0C.
2. Incubate the membrane at room temperature in antibody buffer containing PPSMV polyclonal antibodies at 1:10,000 (v/v) dilution. Note: Cross-adsorption of PPSMV antiserum: Dilute PPSMV antiserum to 1:10,000 in antibody buffer containing pigeonpea healthy leaf sap (1:10 w/v)(100 mg in 10 ml antibody buffer). Incubate for 1 hr at room temperature with gentle shaking and use.
3. Wash the membrane with TBS-T, thrice for 5 min each. 4. Incubate the membrane in anti-rabbit ALP labeled antibodies, for 1 hr at room
temperature. Note: Anti-rabbit enzyme-conjugate can be collected for reuse, at least 4-5 times, within in a period of 10 days after first use.
5. Wash the membrane with TBS-T, three times for 5 min each. 6. Add the substrate ALP substrate solution. Record the colour development visually. Stop
the reaction by washing the membrane in TBS-T for 5 min and then place it in distilled water. Dry the membrane and photograph the blot or digitize the membrane using a scanner.
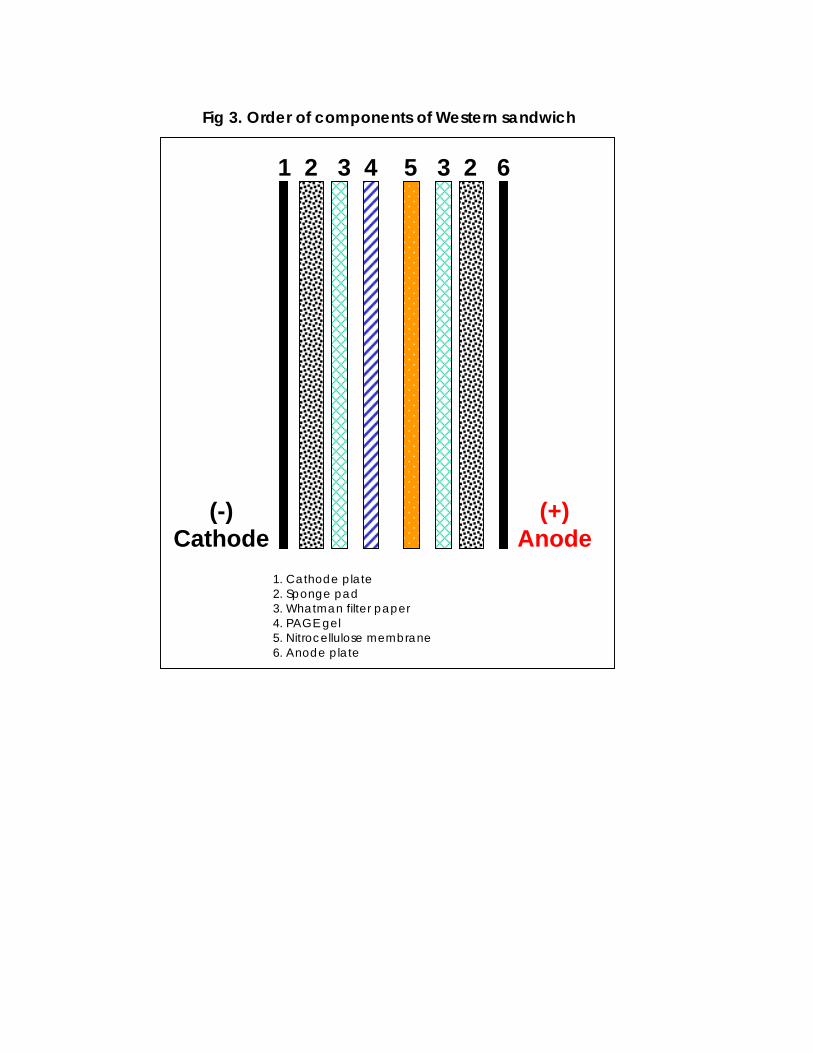
(+) Anode
(-) Cathode
1 2 3 4 5 3 2 6
1. Cathode plate 2. Sponge pad 3. Whatman filter paper 4. PAGE gel 5. Nitrocellulose membrane 6. Anode plate
Fig 3. Order of components of Western sandwich
13. Nucleic acid-based methods
P Lava Kumar ICRISAT, Patancheru 502 324, AP, India
13.1. PCR and RT-PCR The polymerase chain reaction (PCR) is a technique for the in vitro amplification of specific DNA sequences by the simultaneous primer extension of complementary strands of DNA. This involves repeated cycles of heat denaturation of the DNA, annealing of primers to the complementary sequences and extension of the annealed primers with thermostable DNA polymerase (Taq polymerase) in the presence of four deoxyribonucleotides (dNTPs). Since the extension products are complementary to and capable of binding primers, subsequent cycles of amplification double the amount of target DNA synthesized in the previous cycle (Fig. 1). The result is exponential accumulation of the specific target DNA. In virology PCR is used for amplification of genome of DNA containing viruses.
RT-PCR is used for the amplification of viruses containing RNA as their genome. During RT-PCR, the target RNA is first reverse-transcribed to a complementary DNA (cDNA) copy using the enzyme, reverse transcriptase (RT). During the first cycle of PCR, a second strand of the DNA is synthesized from the first-strand cDNA. The resultant dsDNA copy is then amplified in vitro by PCR by the simultaneous primer extension of complementary strands of DNA, as in PCR. Since the extension products are complementary to and capable of binding primers, subsequent cycles of amplification double the amount of target DNA synthesized in the previous cycle (Fig. 1). The result is exponential accumulation of the specific target DNA of interest, which in essence has originated from RNA.
In this course, PPSMV detection is used as example for RT-PCR assay, using oligonucleotide primers, SM-1 and SM-2, designed to amplify a 321 bp product corresponding to the RNA-5 segment of PPSMV genome.
13.2.1. Isolation of total RNA from leaf tissue Obtaining high quality intact RNA is the first and the critical step in performing RT-PCR. Many procedures are currently available for the isolation of total RNA from prokaryotes and eukaryotes. The essential feature of any protocol is to obtain large amount of intact RNA by effectively lysing the cells, avoiding the action of contaminating nucleases, in particular RNase. RNA isolation is difficult when processing certain tissues like pigeonpea, which is rich in polyphenols, tannins, polysaccharides and nucleases making it difficult to get clean RNA preparations. The protocols described here for RNA isolation from pigeonpea are being used successfully at ICRISAT for RT-PCR experiments. Precautions
• Use autoclaved solutions, glass- and plastic ware. • Always wear disposable gloves as a precaution to avoid RNase contamination. • Where possible use DEPC-treated water (see section 13.2.2.2.1)
13.2.1.1. Isolation of total RNA using Qiagen plant RNeasy RNA isolation kit
This kit is designed to isolate high quality total RNA from small amounts of starting material. The procedure is simple and fast (<30 min). In this procedure, leaf material is first lysed and homogenized in the presence of a denaturing buffer, which rapidly inactivates the RNase to ensure isolation of intact RNA. Ethanol is added to the lysate to provide appropriate binding conditions and the sample is then applied to an RNeasy minicolum built with a silica-gel-based membrane. Total RNA binds to the membrane and contaminants are efficiently removed. High-quality RNA is then eluted in distilled water. 13.2.1.1.1. Materials
• QIAGEN Plant RNeasy mini kit (Genetix, New Delhi, India) • Variable speed microcentrifuge (table top model) • Sterile 1.5 ml and 2 ml eppendorf tubes • Sterile mortars and pestles • Liquid nitrogen • Absolute ethanol (molecular biology grade)
13.2.1.1.2. Procedure 1. Grind 100 mg of leaf material under liquid nitrogen to a fine powder using a mortar and
pestle. 2. Transfer the tissue powder to a 2 ml eppendorf tube. 3. Add 450 µl of RLT buffer (supplied with the kit) and 5 µl of α-monothioglycerol (or β-
mercaptoethanol) and mix vigorously (in a vortex shaker). 4. Transfer the lysate into the QIAshreder spin column (supplied with the kit) and centrifuge for 2
min at maximum speed (14,000 rpm) in a microcentrifuge. 5. Transfer flow-throw fraction (lysate) from QIAshreder to a new 2 ml tube without disturbing
the cell-debris pellet. 6. Add 0.5 volumes (usually 250 µl) of absolute ethanol to the lysate and mix well by pipetting. 7. Apply the sample into an RNeasy mini spin column (supplied with the kit) and centrifuge for
15 sec at 10,000 rpm. 8. Discard the flow-throw. 9. Add 700 µl of RW1 buffer (supplied with the kit) into mini column and centrifuge for 15 sec at
10,000 rpm. 10. Discard the flow-throw 11. Add 500 µl of RPE buffer (supplied with the kit) into mini column and centrifuge for 15 sec at
10,000 rpm. 12. Discard the flow-throw. 13. Repeat the steps 11 and 12. 14. Transfer the RNeasy column into a new 1.5 ml collection tube and centrifuge for 1 min at
10,000 rpm to dry the RNeasy membrane.
15. Transfer RNeasy column into a new 1.5 ml tube and add 30-50 µl of RNase-free water directly onto the RNeasy membrane. Centrifuge at 10,000 rpm for 1 min to elute RNA.
16. Store RNA at –20 0C. 13.2.1.2. Isolation of total RNA by phenol-chloroform method This is a relatively inexpensive procedure to separate RNA from proteins and other contaminants. In this RNA from leaf extract is selectively partitioned into the aqueous phase after extracting in the presence of phenol-chloroform. RNA from aqueous phase is precipitated in the presence of salt by adding 2.5 volumes of ethanol. 13.2.1.2.1. Materials • Sterile mortars and pestles • Sterile eppendorf tubes 0.5 ml, 1.5 ml and 2 ml • 1 M Tris-HCl, pH 8.0 : Dissolve 121.1 g of Tris base in 800 ml of distilled water. Adjust the pH to
8.0 with conc. HCl. Adjust volume to 1 l with distilled water. Sterilize by autoclaving. • 0.1 M Trish-HCl, pH 7.6: Dissolve 12.11 g of Tris base in 800 ml of distilled water. Adjust the pH
to 7.6 with conc. HCl. Adjust volume to 1 l with distilled water. Sterilize by autoclaving. • 10% SDS: Dissolve 10 g of sodium dodecyl sulfate (SDS) in 1 l of autoclaved distilled water.
Warm to assist dissolution of SDS. No need to sterilize by autoclaving. • 0.5 M EDTA: Add 186.1 g of EDTA to 800 ml water. Stir vigorously on a magnetic stirrer. Adjust
the pH to 8 with 1 M NaOH (EDTA dissolves in solutions above pH 8). Make up to 1 l with distilled water. Sterilize by autoclaving.
• 3 M sodium acetate: Dissolve 24.612 g of sodium acetate in 80 ml distilled water. Adjust the pH to 5.2 with glacial acetic acid. Adjust volume to 100 ml. Sterilize by autoclaving
• Phenol:chloroform: Mix equal amounts of redistilled phenol and chloroform. Equilibrate the mixture by extracting several times with 0.1 M Tris-HCl, pH 7.6. Store the mixture under 0.01 M Tris-HCl pH 7.6 at 4 0C in a dark bottle.
Caution: Phenol is highly corrosive, can cause severe burns and is carcinogenic. Wear gloves and protective clothing when handling phenol. Any areas of skin that comes in contact with phenol should be rinsed with a large volume of water. DO NOT USE ETHANOL. Carry all steps involving phenol-chloroform in a fume hood. Care must be taken in disposing phenol-chloroform solutions.
• DEPC-treated water (see section 13.2.2.2.1) • Chloroform: Isoamyl alcohol (IAA) (24:1 v/v) mixture: To 96 ml of chloroform add 4 ml of IAA.
Store the bottle at 4 oC. 13.2.1.2.2. Procedure 1. Grind 150 mg leaf material in liquid nitrogen to a fine powder. 2. Add 1 ml of extraction buffer (0.1 M Tris-HCl, pH 8.0 containing 2% SDS and 2 mM EDTA) and 1
ml of phenol-chloroform mixture (1:1 v/v).
3. Transfer the contents into a 2 ml eppendorf tube, vortex vigorously and then heat the samples at 70 0C for 5 min.
4. Centrifuge at 12,000 rpm for 10 min in a microcentrifuge. 5. Collect the upper aqueous phase carefully and add equal volumes of phenol-chloroform
mixture and vortex vigorously. 6. Centrifuge at 12,000 rpm for 5 min. 7. Take the upper aqueous phase carefully and add equal volumes of chloroform and vortex
vigorously. 8. Centrifuge at 12,000 rpm for 5 min. 9. Carefully collect the upper aqueous phase and to this add 1/10 (v/v) 3 m sodium acetate,
pH 5.2 and 2.5 volumes of cold absolute ethanol. Store at –20 0C overnight. 10. Centrifuge at 12,000 rpm for 10 min. Carefully discard the supernatant. Rinse the pellet with
70% ethanol. Carefully discard the supernatant. 11. Dry the pellet at room temperature and resuspend the pellet in 100 µl of RNase-free water
and store at –20 0C.
13.2.2. RT-PCR Precautions PCR and RT-PCR is a highly sensitive techniques. Care must be taken to avoid cross-contamination and carryover of template, to prevent false amplifications. The following tips may help in getting good results with RT-PCR.
• Autoclave all solutions used in PCR. This degrades any extraneous DNA/RNA and nucleases.
• Divide reagents into aliquots to minimize the number of repeated samplings necessary. • Avoid splashes by using tubes, which do not require much effort to open and collect the
contents to the bottom by brief spinning before opening the tubes. • Ensure that all the reaction components are added as per the required concentration.
Failure would result in blank PCR gel. • Use positive displacement pipettes with disposable tips. • Wherever possible, prepare master reaction mixture by premixing all reagents except
template. Distribute into individual reactions then add the template directly into each tube.
• Always use a positive control (known positive) and a negative control (no ‘template’ control) to ensure the specificity of the RT-PCR reaction. A successful RT-PCR should give amplification in positive control and there should not be any bands in negative control.
13.2.2.1. Materials • Thermal cycler • Sterile 0.2 ml, 0.5 ml and 1.5 ml Eppendorf tubes • Oligonucleotide primers
SM-1:- 5'ACA TAG TTC AAT CCT TGA GTG CG3' SM-2:- 5'ATA TTT TAA TAC ACT GAT AGG A3’
• Template RNA • Moloney murine leukemia virus-RT (MoMLV-RT. Cat.# M1701, Promega) • RNase inhibitor (Rnasin Cat.# N251A, Promega) • Dithiothreitol (DTT) (Sigma grade) • Taq Polymerase (Cat.# M668, Promega) • Four deoxynucleotide triphosphates, 100 mM stock (Promega, Cat.# U1330)
(dATP, dGTP, dCTP, dGTP) • RNase free water • Mineral oil (optional) • Crushed ice • Micropipettes (1-10 µl, 1-40 µl, 40-200 µl and 200-1000 µl single channel pipettes). • Microfuge
13.2.2.2. Solutions 13.2.2.2.1. RNase free water Treat distilled water with 0.1% diethylpyrocarbonate (DEPC; Sigma) for 12 h at 37 0C. Then autoclave for 15 min at 15 lb/sq.in to destroy DEPC. Caution: DEPC is a suspected carcinogen and should be handled with care. Note: DEPC reacts rapidly with amines and cannot be used to treat solutions containing buffers such as Tris. Autoclaving degrades DEPC and therefore is safe to use DEPC-treated autoclaved water for preparation of Tris buffers. 13.2.2.2.2. 10 mM dNTP mixture Mix 10 µl of each dATP, dCTP, dGTP and dTTP from a 100 mM stock and makeup to 100 µl with RNase free water. The final concentration of each dNTP in this mixture is 10 mM. 13.2.2.2.3. 25 mM MgCl2 Usually supplied with Taq enzyme by the manufacturer. If necessary, prepare by dissolving 0.508 g of MgCl2.6H20 in 100 ml RNase-free water. Sterilise by autoclaving, aliquot and store at -20 0C.
Note: Magnesium chloride solution can form a gradient of different concentrations when frozen. Therefore vortex well prior to using it.
13.2.2.2.4. 0.1 M DTT Dissolve 154 mg of DTT in 10 ml of RNase-free water, aliquot and store at -20 0C
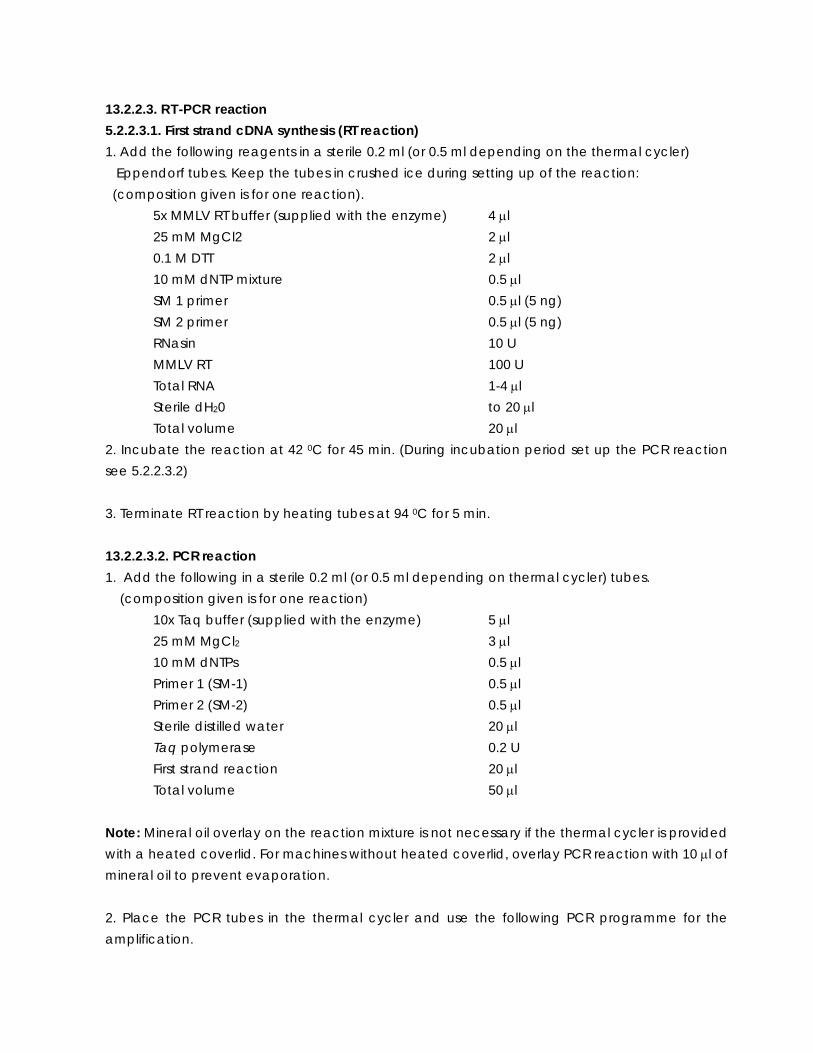
13.2.2.3. RT-PCR reaction 5.2.2.3.1. First strand cDNA synthesis (RT reaction) 1. Add the following reagents in a sterile 0.2 ml (or 0.5 ml depending on the thermal cycler) Eppendorf tubes. Keep the tubes in crushed ice during setting up of the reaction: (composition given is for one reaction). 5x MMLV RT buffer (supplied with the enzyme) 4 µl
25 mM MgCl2 2 µl 0.1 M DTT 2 µl 10 mM dNTP mixture 0.5 µl
SM 1 primer 0.5 µl (5 ng) SM 2 primer 0.5 µl (5 ng)
RNasin 10 U MMLV RT 100 U Total RNA 1-4 µl Sterile dH20 to 20 µl Total volume 20 µl
2. Incubate the reaction at 42 0C for 45 min. (During incubation period set up the PCR reaction see 5.2.2.3.2) 3. Terminate RT reaction by heating tubes at 94 0C for 5 min. 13.2.2.3.2. PCR reaction 1. Add the following in a sterile 0.2 ml (or 0.5 ml depending on thermal cycler) tubes. (composition given is for one reaction) 10x Taq buffer (supplied with the enzyme) 5 µl
25 mM MgCl2 3 µl 10 mM dNTPs 0.5 µl
Primer 1 (SM-1) 0.5 µl Primer 2 (SM-2) 0.5 µl
Sterile distilled water 20 µl Taq polymerase 0.2 U First strand reaction 20 µl Total volume 50 µl
Note: Mineral oil overlay on the reaction mixture is not necessary if the thermal cycler is provided with a heated coverlid. For machines without heated coverlid, overlay PCR reaction with 10 µl of mineral oil to prevent evaporation. 2. Place the PCR tubes in the thermal cycler and use the following PCR programme for the amplification.

13. RT-PCR programme:
Perform PCR amplification in a thermal cycler using the following parameters: one cycle of denaturation for 5 min at 94 0C, followed by 35 cycles of amplification by denaturation at 92 0C for 45 sec, primer annealing at 55 0C for 45 sec and primer extension at 72 0C for 90 sec and finally incubate at 72 0C for 5 min for extension.
13.2.2.4. Analysis of RT-PCR products Analyse 30-40 µl of PCR products in a 1% agarose gel as described in section 13.3.1
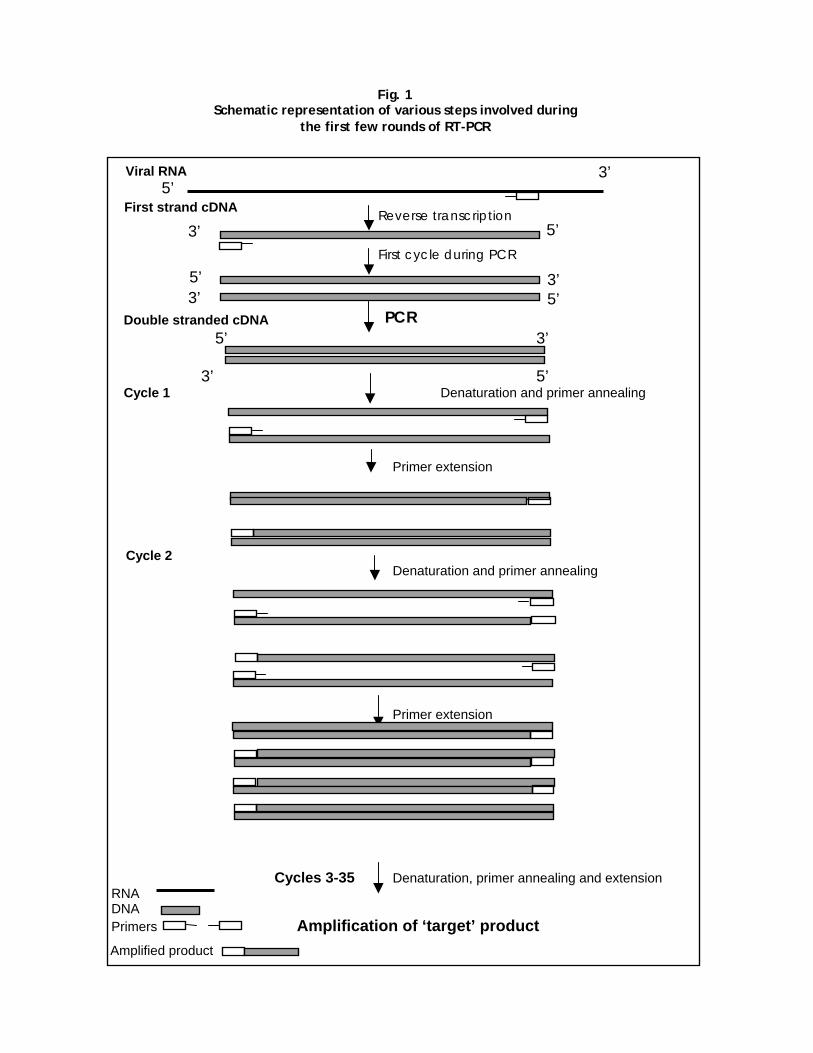
Double stranded cDNA 5’ 3’
3’ 5’ Cycle 1 Denaturation and primer annealing
Primer extension
Cycle 2 Denaturation and primer annealing
Primer extension
Cycles 3-35 Denaturation, primer annealing and extension RNA DNA Primers Amplification of ‘target’ product
5’ 3’
Reverse transcription
Viral RNA
First strand cDNA
First cycle during PCR
5’ 3’
PCR
5’ 3’ 5’ 3’
Fig. 1 Schematic representation of various steps involved during
the first few rounds of RT-PCR
Amplified product
13. 3. Gel Electrophoresis of PCR and RT-PCR Products
Electrophoresis through agarose or polyacrylamide gels is the standard method used to analyse PCR amplified products. The phosphate groups in the DNA backbone carry uniform net negative charge at neutral or alkaline pH. During electrophoresis regardless of base composition, the DNA molecules move towards anode under a constant driving force provided by the net negative charge. Consequently, the rate of migration of a DNA molecules depends on its size than on the molecular weight, the smallest moving fastest. However, the migration rate is affected by such factors as, DNA conformation, buffer composition and presence of intercalating dyes. These techniques are simple, rapid to perform and DNA in the gel can be identified by staining with low concentrations of intercalating fluorescent dyes, such as ethidium bromide. As little as 1 ng of DNA can be detected in the gels by direct observation under ultraviolet light. The choice of gels to be used depends on the size of the fragments being separated. Polyacrylamide gels have high resolving power and are most effective for separating DNA fragments differed by 1-500 bp. These are run in a vertical configuration in a constant electric field. Agarose gels have low resolving capacity than polyacrylamide gels but are easy to prepare and has greater separation range. These are run in a horizontal configuration. For routine separation of RT-PCR products agarose gels are preferred.
13.3.1. Agarose Gel Electrophoresis Agarose gels are prepared by melting agarose in the desired buffer until a clear transparent solution is obtained. The molten agarose solution is poured into a mould (boat) and allowed to harden. Upon hardening the agarose forms a matrix, the density of which depends on the concentration of the agarose. 13.3.1.1. Materials • Horizontal electrophoresis unit • Power supply • Agarose (electrophoresis grade; BioRad, Cat.# 162-0125) • UV Transilluminator (302 nm wave length) 13.3.1.2. Solutions 13.3.1.2.1. 10x Electrophoresis buffer (TBE buffer, pH 8.3) Tris base (0.45 M) 54 g Boric acid (0.45 M) 27.5 g 0.5 M EDTA, pH 8 (0.01 M) 20 ml Distilled water to 1 liter It is not necessary to adjust pH. Sterilize by autoclaving and store at room temperature.
13.3.1.2.2. Working solution ( 0.5x ) To 5 ml of 10x TBE buffer add 95 ml of sterile distilled water. The final concentration of Tris-base, boric acid and EDTA in working solution is 0.045 M, 0.045 M and 0.001 M, respectively. 13.3.1.2.3. 5x Sample buffer (Gel loading buffer) Bromophenol blue (0.25%) 5 mg Xylene cyanol FF (0.25%) 5 mg Glycerol (30%) 3 ml Sterile distilled water to 10 ml 13.3.1.2.4. 1% Ethidium bromide solution Ethidium bromide 100 mg Distilled water 10 ml Store in a dark coloured bottle at 4 0C. Working solution (0.5 µg/ml): To 100 ml water or molten agarose, add 5 µl of 1% ethidium bromide. Caution: Ethidium bromide is a carcinogen. Gloves should be worn when handling and care must be taken to dispose materials containing this substance. 13.3.1.3. Procedure 1. Prepare agarose at the desired concentration (w/v) in 1x TBE buffer (for 1% gel, dissolve1 g
agarose in 100 ml buffer) and boil in a microwave oven or on a hot water bath, with intermittent shaking until all the agarose is completely dissolved. Replace evaporation loss with distilled water. Note: Ethidium bromide can be directly added into molten agarose [8 µl (0.05µg/ml) /100ml]. This is kind of staining is used for routine analysis. However, if the gel is for estimating molecular size of DNA fragments, do not add ethidium bromide into the gel. It affects DNA migration in gel.
2. Seal the edges of the gel tray with a tape and place the comb at one end of the tray surface.
3. Cool the agarose solution to about 50 0C and pour into the gel tray to a thickness of 4-5 mm and allow the gel to set. Note: It will take about 20 min for agarose to harden.
4. Remove the tape and place the gel tray in the electrophoresis unit and fill the unit with 0.5x TBE buffer so that there is 2-3 mm of buffer over the gel surface. Then remove the comb carefully. Note: Wells should be towards cathode end (black colour leads). The migration of DNA will be towards anode (red colour leads)
5. Mix 6 µl of loading buffer to 30 µl of PCR product and load slowly into the wells. Avoid overloading of the wells.
6. Load DNA molecular weight marker.
7. Connect electrophoresis unit to the power pack and turn on power supply until the bromophenol blue dye reaches the bottom of the gel. (Approximately 60 min at 100 V, for DNA to migrate 7 cm from the wells in a 1% gel)
8. Remove the gel from the tray and stain in ethidium bromide solution (0.5 µg/ml) in water for 15 min with gentle agitation. Then destain by soaking the gel in water for 5 min.
9. Observe the gel under UV Transilluminator using UV protective goggles or a full safety mask that efficiently blocks UV light. Photograph the gel using an orange filter fitted camera. Caution: UV radiation is very dangerous to the skin and particularly to the eyes. It is absolutely essential to use UV-protective goggles.
13.3.2. Polyacrylamide Gel Electrophoresis (PAGE) for separation of DNA and Proteins Two PAGE systems are commonly used. 1. Continuous system (Weber and Osborn system) and 2. Discontinuous system (Laemmli system), which is most widely used system. In discontinuous system the gel consists of two parts, resolving gel located at the bottom, which has pore size that permits the sieving of the macromolecule to be analyzed. On top of this is a stacking gel, which has large pore size to exert no sieving effect. During electrophoresis, the DNA/protein (peptides) molecules are concentrated as a sharp band by isotachophoresis (steady state sieving) in the stack gel. They then separated according to their size in a resolving gel.
Non-denaturing gels (gel composition without SDS or Urea) are used for commonly separating dsDNA in PAGE gels, and they are stained with ethidium bromide to visualize DNA under UV-light. Due to uniform net negative charge of the DNA, the molecular separation is based on size.
Proteins are usually separated in denaturing gels (gel composition with SDS). In these conditions, proteins separate based on their size, as SDS in the gel imparts uniform net negative charge. Proteins can also be separated under native conditions (gel composition and sample preparation similar to that of dsDNA gels), however, peptides separation in this condition are based on charge, not on size. Due to overall net negative charge molecules migrate towards anode. 13.3.2.1. Materials • Vertical slab gel electrophoresis unit [Refer to the equipment user manual] • Power supply • Acrylamide • Bisacrylamide • Ammonium per sulphate • TEMED • 10% SDS (dissolve 10 gms of SDS in 100 ml of water and store at room temperature)
13.3.2.2. Solutions 13.3.2.2.1. Stack gel buffer (1 M Tris-HCl, pH 6.8)
Tris base 12.1 g Dissolve in 70 ml distilled water, adjust pH to 6.8 with 1 N HCl and make up to 100 ml with distilled water. 13.3.2.2.2. Resolving gel buffer (1 M Tris-HCl, pH 8.8)
Tris base 12.1 g Dissolve in 70 ml distilled water, adjust pH to 8.8 with 1 N HCl and make up to 100 ml with distilled water. 13.3.2.2.3. Acrylamide/Bis (30:0.8 w/w) mixture
Acrylamide 30 g Bis acrylamide 0.8 g Distilled water to 100 ml
Store this solution at 4 0C in amber coloured bottle or wrap the bottle with aluminum foil to avoid exposure to light. Caution: Acrylamide is a neurotoxin. Direct contact with skin or inhalation of acrylamide should be avoided. Prepare this solution in fume hood and always wear gloves. 13.3.2.2.5. 10% ammonium persulphate (APS)
APS 100 mg Distilled water 1 ml Note: Always prepare fresh solution before use.
13.3.2.2.6. TEMED (Sigma, Cat.# T9281) Store at 4 0C. 13.3.2.2.7. Electrode (running or tank) buffer, pH 8.3
Tris base (25mM) 3 g Glycine (250 mM) 14.4 g SDS (1%) 1 g (add this into buffer, for separating proteins)
Distilled water to 1 litre. No need to adjust pH. Store at room temperature. 13.3.2.2.8. Plug gel composition (optional) Note: Plug gel is used to seal the bottom of the gel mould. Use of this depends on the type of electrophoresis unit.
Acrylamide: Bis mixture 1.75 ml Resolving gel buffer 1 ml Distilled water 1 ml TEMED 20 µl 10% APS 40 µl
13.3.2.2.9. Resolving gel composition Note: The concentration of the gel depends on the size of the products being separated. Usually 10% is the preferred concentration for separation of PCR products of size between 10-1000 bp _____________________________________________________________
Gel concentration 10% 12% 14% 16% _____________________________________________________________ Acrylamide: Bis mixture 10 ml 12 ml 14 ml 16 ml Resolving gel buffer 11.25 ml 11.25 ml 11.25 ml 11.25 ml Distilled water 9 ml 7 ml 5 ml 3 ml *10% SDS 300 µl 300 µl 300 µl 300 µl TEMED 20 µl 20 µl 20 µl 20 µl 10% APS 100 µl 100 µl 100 µl 100 µl ______________________________________________________________ *Note: Add SDS for only protein gels 13.3.2.2.10. Stacking gel composition (4%) Acrylamide: Bis mixture 1.5 ml Stacking gel buffer 1.25 ml Distilled water 7 ml *10% SDS 100 µl (only for protein gels) TEMED 15 µl 10% APS 200 µl Note: Mix acrylamide:bis solution, gel buffer, distilled water and TEMED mix well, then add APS, swirl the flask and immediately pour into the gel mould. Caution: Unpolymerized acrylamide is a neurotoxin. Gloves should be worn when preparing this solution. 13.3.2.3. Procedure 1. Assemble the vertical slab gel apparatus in casting mode as per the manufacturer
instructions. 2. Pipette 1 ml of the plug gel solution into the gel mould from a corner and allow it to set. Note:
Some units may not require sealing the bottom with a plug gel. 3. Pour resolving gel solution into the gel mould leaving about 3 cm space for stacking gel.
Gently overlay with water. A sharp water-gel interface will be visible with the polymerisation of the gel. Note: Add 10% SDS as shown in table, if gel is meant for separating proteins.
4. Decant the water overlay by gently tilting the gel mould. 5. Pour stacking gel solution into the gel mould and insert a comb and allow the gel to set.
Care must be taken not to trap air bubbles below the comb’s teeth. Note: Add 10% SDS as shown in table if gel is meant for separating proteins.
6. Carefully lift the comb straight-up, without disturbing the wells. Wash the wells with water to remove unpolymerised acrylamide.
7. Fill the lower tank of the electrophoresis unit with electrode buffer. Note: Add SDS into electrode buffer, if gel is meant for separating proteins.
8. Insert the gel mould into the electrophoresis unit making sure not to trap air bubbles under the gel.
9. Fill the upper tank with electrode buffer. Avoid direct pouring of buffer into the wells. 10. Load the samples (DNA or proteins) for separating in the gels.
13.3.3. DNA / protein sample preparation for separation in PAGE gels 13.3.3.1. Preparation of DNA for electrophoresis in PAGE gels 1. Take aliquot (5-20 ml or more depending on the purpose) of DNA sample to be separated
and mix with loading dye (as give in section 13.3.1.2.3) and load into the wells. 2. Connect electrophoresis unit to the power supply. Connect the cathode lead to upper
chamber and anode lead to the lower chamber. Turn power and set the appropriate voltage.
3. Turn off the power supply when tracking dye (bromopheonl blue or xylene cyanol) reaches nearly to bottom of the gels. Note: Under constant applied voltage and buffer temperature, migration of the tracking dye depends on the percentage of the resolving gel (see Table 1).
4. Remove the gel and stain in ethidium bromide solution for 15 min. Destain the gel for 5 min in distilled water and observe the gel under UV transilluminator. Note: PAGE gels are very fragile; care must be taken while handling to avoid breaking the gel.
Table 1. Dye migration in polyacrylamide non-denaturing gels of different strengths
% Acrylamide Xylene cyanol Bromophenol blue 3.5 460 100 5 260 65 8 160 45
12 70 20 15 60 15 20 45 12
*Separation equivalent to base pairs 13.3.3.2. Preparation of protein sample for electrophoresis in PAGE gels 13.3.3.2.1. 2X Protein sample buffer (Lamelli buffer) Distilled water 4.57 ml 1 M Tris-HCL buffer pH 6.8 0.63 ml 40% Glycerol 2.5 ml 10%SDS 2.0 ml 2-mercaptoethanol 0.1 ml 0.5% Bromophenol blue 0.2 ml

13.3.3.2.2. Preparation of protein samples for loading into PAGE gel 1. Suspend the sample in equal volumes of Lamelli buffer 2. Heat in boiling water bath for 3 min (longer incubations lead to peptide degradation) 3. Remove the sample and place it on ice till ready to load. Note: Denatured samples can be stored at –20 OC for long-term storage. In this case, aliquot the sample as per the loading volume and store (repeated freezing and thawing results in peptide degradation). 4. Load samples into the wells of PAGE gel.
13.3.3.2.3. PAGE gel staining with Coomassie brilliant blue R250 for protein staining Stain: Commsassie brilliant blue R250 200 mg Methanol 100 ml Acetic acid 14 ml Distilled water 200 ml Note: This can be reused 3-5 times Distaining solution: Methanol 15 ml Acetic acid 7 ml Water 100 ml Procedure
1. Place the gel into a tray containing the staining solution 2. Gently shake for 60 min (increase incubation time to 2-4 hrs (or overnight if stain has been
used previously many times or to visualize proteins occurring in low concentration) Note: overnight incubation will lead to high background, and it would take long time to destain 3. Replace the stain with destaining solution and gently shake. Replace destainig solution
periodically. Destain till bands are clearly visible. Gels can be stored in destaining solution. • Note 1: Gels stained with CBB, can be restained again with CBB, if first staining is not
to the satisfaction. • Note 2: By continuously destaining, gel can be destained totally, and the gel can be
used for silver staining. 13.3.3.2.4. Silver staining of proteins Fixing solution (Prepare freshly before use) Glacial acetic acid 3 ml Methanol 50 ml dH2O 147 ml
DTT wash solution (0.05% Dithiothreitol (DTT) DTT 5 mg dH2O 10 ml This can be stored as aliquots at –200C. Note: Dilute this to 1:100 freshly before use. Silver nitrate solution (Prepare freshly before use) Silver nitrate 400 mg dH2O 200 ml Developer solution (Prepare freshly before use) Na2CO3 6 g Formaldehyde 100 µl dH2O 200 ml Stop solution Glacial acetic acid 1 ml dH2O 99 ml Silver staining procedure
1. Place the gel in a clear glass tray containing fixing solution. Shake gently for 30 min at room temperature. (Gel can be left overnight in fixative at 4 0C, this does not adversely affect the results)
2. Rinse the gel in dH2O for 3 times, 10 min each time. (Gel can be left in water overnight at 4 0C and this does not adversely affect the results)
3. Then add 200 ml of diluted DTT solution and gently shake for 30 min at room temperature (time can be increased up to 10 h; longer washes in DTT result in much less background)
4. Discard the DTT 5. Rinse the gel with dH2O, and place it in silver solution and gently shake for 30 min at room
temperature (normally 30 min is enough. Longer incubations in silver results in high background; generally incubation up to 90 min does not seems to have adverse effect on the results)
6. Discard the silver solution 7. Then rinse the gel in dH2O for 60 to 90 seconds. 8. Place the gel in developer solution and gently shake for 10 min at room temperature or
till bands appear to the satisfaction). Longer incubations in silver leads to dark yellow background, which masks the protein bands. Note: It is advised to monitor the gel reaction is stopped.
9. Discard the silver solution 10. Add stopper solution and shake gently for 15 min. 11. Discard the stopper solution and replace it with distilled water. Gel can be stored in
distilled water for long time. 12. Photograph the gel on a light box for permanent record or it can be scanned for
digitized image.
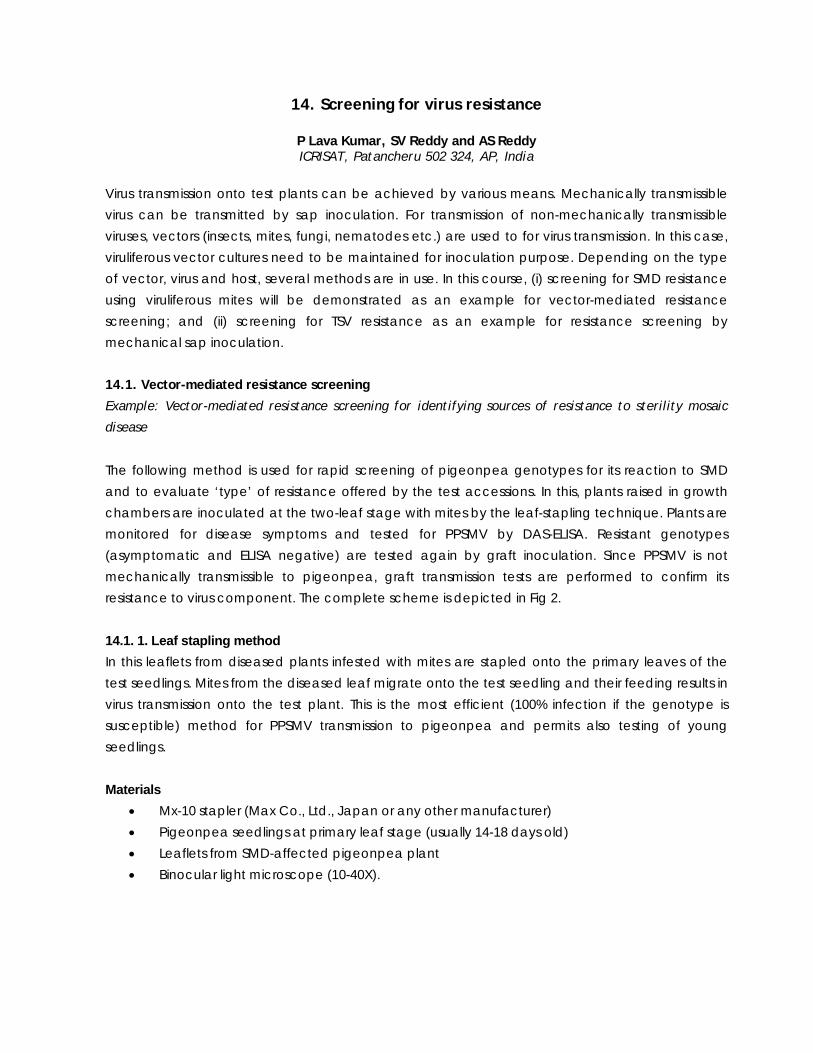
14. Screening for virus resistance
P Lava Kumar, SV Reddy and AS Reddy ICRISAT, Patancheru 502 324, AP, India
Virus transmission onto test plants can be achieved by various means. Mechanically transmissible virus can be transmitted by sap inoculation. For transmission of non-mechanically transmissible viruses, vectors (insects, mites, fungi, nematodes etc.) are used to for virus transmission. In this case, viruliferous vector cultures need to be maintained for inoculation purpose. Depending on the type of vector, virus and host, several methods are in use. In this course, (i) screening for SMD resistance using viruliferous mites will be demonstrated as an example for vector-mediated resistance screening; and (ii) screening for TSV resistance as an example for resistance screening by mechanical sap inoculation. 14.1. Vector-mediated resistance screening
Example: Vector-mediated resistance screening for identifying sources of resistance to sterility mosaic
disease The following method is used for rapid screening of pigeonpea genotypes for its reaction to SMD and to evaluate ‘type’ of resistance offered by the test accessions. In this, plants raised in growth chambers are inoculated at the two-leaf stage with mites by the leaf-stapling technique. Plants are monitored for disease symptoms and tested for PPSMV by DAS-ELISA. Resistant genotypes (asymptomatic and ELISA negative) are tested again by graft inoculation. Since PPSMV is not mechanically transmissible to pigeonpea, graft transmission tests are performed to confirm its resistance to virus component. The complete scheme is depicted in Fig 2. 14.1. 1. Leaf stapling method In this leaflets from diseased plants infested with mites are stapled onto the primary leaves of the test seedlings. Mites from the diseased leaf migrate onto the test seedling and their feeding results in virus transmission onto the test plant. This is the most efficient (100% infection if the genotype is susceptible) method for PPSMV transmission to pigeonpea and permits also testing of young seedlings. Materials
• Mx-10 stapler (Max Co., Ltd., Japan or any other manufacturer) • Pigeonpea seedlings at primary leaf stage (usually 14-18 days old) • Leaflets from SMD-affected pigeonpea plant • Binocular light microscope (10-40X).

Viruliferous mite cultures Viruliferous mite cultures are maintained on SMD affected pigeonpea cv. ICP8863 (or on any SMD susceptible cultivar). Old plants (>130 days) are periodically replaced with fresh plants for continued culture maintenance. Procedure 1. Collect leaflets from SMD affected pigeonpea plants. 2. Observe leaflets under a binocular microscope for mite infestation.
Note: >10 mites per leaf are required for efficient virus transmission. It is most essential to ensure that source leaves contain mites.
3. Fold diseased leaflet (if larger in size) in a way that the under surface of the disease leaflet comes in contact with both surfaces of the test plant. Staple these leaves together using a stapler. Alternatively, if the disease leaflet is smaller, staple these two leaves in a way that under surface of test leaf and mite-infested leaf are in contact.
4. Inoculate SMD-susceptible pigeonpea genotypes as control (eg: ICP8863; TTB7). These plants show symptoms 12-14 days following staple inoculation.
5. Observe inoculated plants for visible symptoms. Record type of symptoms and time of its first appearance on the plants. Assay test plants by DAS-ELISA to confirm virus presence.
6. Positive result indicates that test plants are susceptible to virus. A negative result indicates that the test plants possess inherent resistance to virus or to mites or to both.
14.1.2. Grafting method In graft transmission freshly cut surfaces of infected and healthy plant tissues are brought together to allow virus movement from infected plant to healthy plant. There are several forms of graft-inoculation methods. ‘Petiole grafting’ developed for PPSMV transmission from pigeonpea to pigeonpea, including to its wild relatives, is simple to perform and results in high virus transmission rate (80-90% if the genotype is susceptible). In this method SMD-affected leaflet (scion) is used to graft to stems of the test plant (stock plant) (Fig. 1). Materials • Surgical blade • Scissors • Cellophane tape • Polythene bags • SMD-affected plants • Plant material
o Test plant or stock plant: A healthy rooted plant (about 25 days old). Use at least 5 plants per accession for graft inoculation studies.

o Scion (detached tissue): Leaflet from SMD-affected plant. Note: Render virus source plants free from mites by repeatedly spraying with acaricides. For routine use, establish SMD cultures by graft-inoculation and maintain in a mite-free area.
Procedure 1. Cut the primary branch at the terminal end of a test plant. 2. Make an incision of about 1 cm down the centre of the stem. 3. Take a leaflet from the donor plant and trim its petiole into a wedge shape and insert into the
stem slit of the test plant. Note: Ensure that donor plants are free from mites. Also treat donor plant tissue in acaricide to eliminate any mites.
4. Bind the grafted portion tightly with a cellophane tape. Note: Ensure that contact surfaces between grafted parts fit neatly and closely, prior to binding.
5. Cover the grafted plants with plastic bags for maintaining high humidity for up to 7 days. Note: To avoid cross-contamination by mites maintain graft-inoculated plants in a mite-proof growth cabinets or at least well away from the known sources of SMD-affected plants and spray with acaricides.
6. Observe plants for symptoms. A susceptible genotype takes about 20-25 days to show the symptoms. Assay all grafted plants for virus by DAS-ELISA. Negative result indicates that the test plants possess inherent resistance to virus infection.
14.1.3. Interpretation of results Note: Susceptible controls tested simultaneously should show 80-100% infection to consider inoculation procedures as effective
Scion
Stock
Fig 1. Petiole grafting for PPSMV transmission
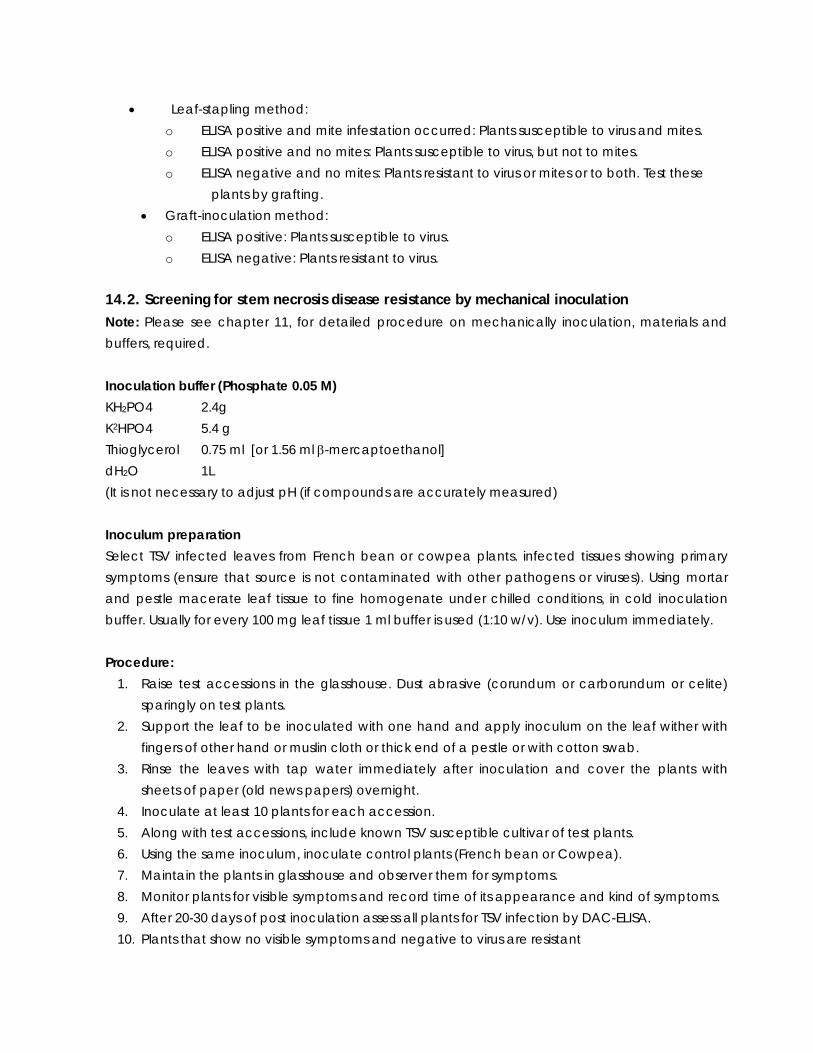
• Leaf-stapling method: o ELISA positive and mite infestation occurred: Plants susceptible to virus and mites. o ELISA positive and no mites: Plants susceptible to virus, but not to mites. o ELISA negative and no mites: Plants resistant to virus or mites or to both. Test these
plants by grafting. • Graft-inoculation method:
o ELISA positive: Plants susceptible to virus. o ELISA negative: Plants resistant to virus.
14.2. Screening for stem necrosis disease resistance by mechanical inoculation Note: Please see chapter 11, for detailed procedure on mechanically inoculation, materials and buffers, required. Inoculation buffer (Phosphate 0.05 M) KH2PO4 2.4g K2HPO4 5.4 g Thioglycerol 0.75 ml [or 1.56 ml β-mercaptoethanol] dH2O 1L (It is not necessary to adjust pH (if compounds are accurately measured) Inoculum preparation Select TSV infected leaves from French bean or cowpea plants. infected tissues showing primary symptoms (ensure that source is not contaminated with other pathogens or viruses). Using mortar and pestle macerate leaf tissue to fine homogenate under chilled conditions, in cold inoculation buffer. Usually for every 100 mg leaf tissue 1 ml buffer is used (1:10 w/v). Use inoculum immediately. Procedure:
1. Raise test accessions in the glasshouse. Dust abrasive (corundum or carborundum or celite) sparingly on test plants.
2. Support the leaf to be inoculated with one hand and apply inoculum on the leaf wither with fingers of other hand or muslin cloth or thick end of a pestle or with cotton swab.
3. Rinse the leaves with tap water immediately after inoculation and cover the plants with sheets of paper (old news papers) overnight.
4. Inoculate at least 10 plants for each accession. 5. Along with test accessions, include known TSV susceptible cultivar of test plants. 6. Using the same inoculum, inoculate control plants (French bean or Cowpea). 7. Maintain the plants in glasshouse and observer them for symptoms. 8. Monitor plants for visible symptoms and record time of its appearance and kind of symptoms. 9. After 20-30 days of post inoculation assess all plants for TSV infection by DAC-ELISA. 10. Plants that show no visible symptoms and negative to virus are resistant

Interpretation of results: • Plants show severe symptoms: Susceptible cultivar • Plants show no visible symptoms, test leaf samples by ELISA for TSV presence:
- Virus negative: Plants resistant to virus - Virus positive: Tolerant cultivar, but it can sever as potential source of inoculum in the fields
• Plants show mild symptoms and show recovery (symptoms get masked with growth of the plant: Tolerant cultivar (The tolerant reaction to virus is variable; it depends on the environmental conditions and general health of the plant).
• Plants show delayed symptoms: Tolerant cultivar (this can be useful as “field resistant” source. Due to delayed expression of disease – plants become resilient and therefore less impact on plant yield).
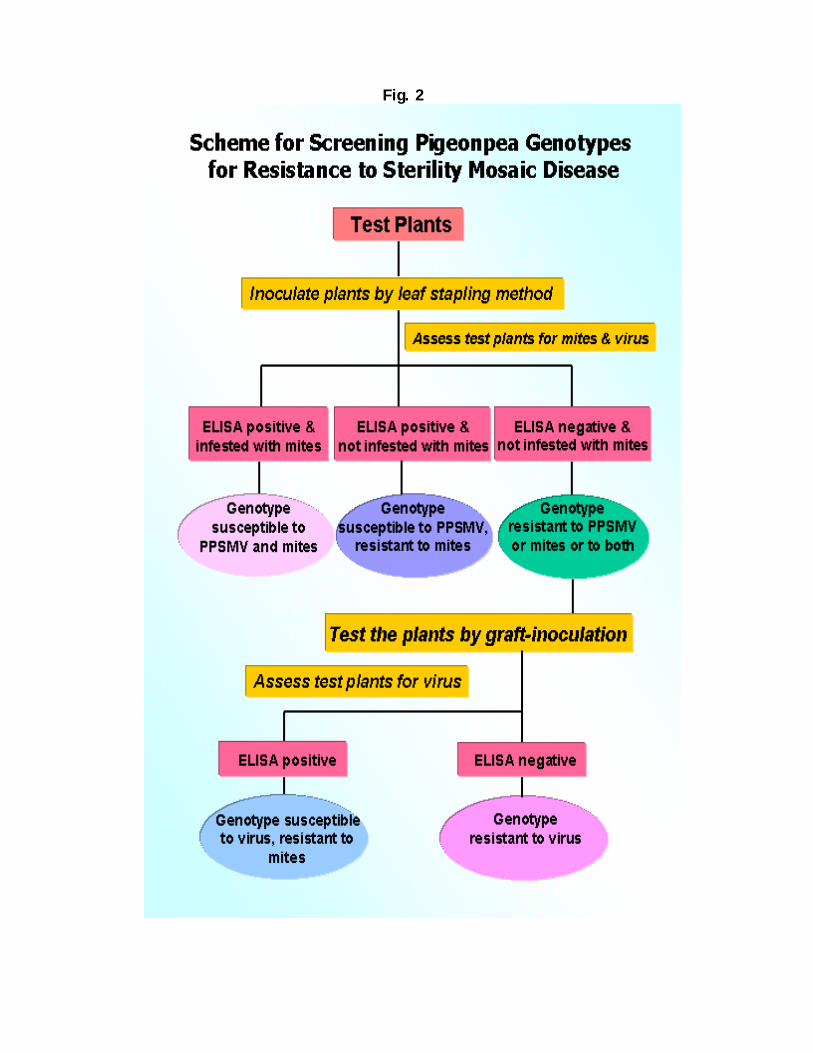
Fig. 2
DDeeppaarrttmmeenntt ffoorr IInntteerrnnaattiioonnaall DDeevveellooppmmeenntt ((DDFFIIDD)) The Department for International Development (DFID) is the UK government department responsible for promoting development and the reduction of poverty. Its central focus is a commitment to an internationally agreed target to halve the proportion of people living in extreme poverty by 2015. In addition, associated targets include ensuring basic health care provision and universal access to primary education by the same date. DFID work in partnership with other governments committed to these targets, and with business and the private sector, civil society and the research community, supporting progress to reduce world poverty. It also works with multilateral institutions, including the World Bank, UN agencies and the European Commission. The bulk of DFID's assistance is concentrated on the poorest countries in Asia and Sub-Saharan Africa. For more information visit: http://www.dfid.gov.uk/
CCrroopp PPrrootteeccttiioonn PPrrooggrraammmmee ((CCPPPP)) The Crop Protection Programme (CPP) is committed to the development and promotion of socially and environmentally acceptable technologies to reduce crop losses from pests in developing countries. It is one of the ten programmes under DFID strategy for Renewable Natural Resources Research for the period (1995 – 2005) aimed to contribute to poverty elimination by enhancing productive capacity in the renewable natural resources sector in an economically and environmentally sustainable way. The Crop CPP is one of the research programmes within the agriculture sector taking forward research funded by DFID and other agencies over the preceding years. The Natural Resource International limited (NR International) manages the CPP. For more information visit: http://www.cpp.uk.com/
IInntteerrnnaattiioonnaall CCrrooppss RReesseeaarrcchh IInnssttiittuuttee ffoorr tthhee SSeemmii--AArriidd TTrrooppiiccss ((IICCRRIISSAATT)) International Crops Research Institute for the Semi-Arid Tropics (ICRISAT) was established in 1972 with a mission to conduct research which can lead to enhanced sustainable crop production and to improved management of the limited natural resources of the semi-arid tropics (SAT). The SAT encompasses parts of 48 developing countries including most of India, parts of Southeast Asia, a swathe across sub-Saharan Africa, much of southern and eastern Africa, and parts of Latin America. Many of these countries are among the poorest in the world. Approximately one-sixth of the world's population lives in the SAT, which is typified by unpredictable weather, limited and erratic rainfall, and nutrient-poor soils. ICRISAT's mandate crops are sorghum, pearl millet, pigeonpea, chickpea and groundnut; these five crops are vital to life for the ever-increasing populations of the semi-arid tropics. ICRISAT is one of 16 non-profit, research and training centers funded through the Consultative Group on International Agricultural Research (CGIAR). The CGIAR is an informal association of approximately 50 public and private sector donors; it is co-sponsored by the Food and Agriculture Organization of the United Nations (FAO), the United Nations Development Programme (UNDP), the United Nations Environment Programme (UNEP), and the World Bank. For more information visit: http://www.icrisat.org/
SSccoottttiisshh CCrroopp RReesseeaarrcchh IInnssttiittuuttee ((SSCCRRII)) The Scottish Crop Research Institute (SCRI) is a major international centre for research on agricultural, horticultural and industrial crops, and on the underlying processes common to all plants. A broad, multidisciplinary approach to research is a special strength of the Institute and the range of skills available from fundamental studies on genetics and physiology, through agronomy and pathology, to glasshouse and field trials is unique within the United Kingdom research service. SCRI is a lead centre in the UK for research on potatoes, barley, brassicas, beans, soft fruit crops (blackberry, blackcurrant, raspberry and strawberry) and forestry. In addition, research is carried out on a wide range of temperate, sub-tropical and tropical crops and tree species including cassava, groundnut, mahogany, coffee and maize. SCRI collaborates with many research centres in Europe and throughout the rest of the world on a wide range of scientific disciplines and crops. SCRI is a Non-Departmental Public Body, with a Governing Body. It is grant-aided by the SOAEFD and has charitable status. For more information visit: http://www.scri.sari.ac.uk/
ICRISAT International Crops Research Institute for the Semi-Arid TropicsPatancheru 502 324, Andhra Pradesh, India http://www.icrisat.org/
SCRI Scottish Crop Research InstituteInvergowrie DD2 5DA, Dundee Scotland, United Kingdom http://www.scri.sari.ac.uk/
Crop Protection Programme NR International Park House, Bradbourne lane Aylesford, Kent ME20 6SN, UKhttp://www.cpp.uk.com/
DFID Department for International Development1 Palace Street, London SW1E 5HE http://www.dfid.gov.uk/