Embed Size (px)
Citation preview
Topographic and stochastic influences on pāhoehoe lava lobe emplacement 1
2
Christopher W. Hamilton1,2, Lori S. Glaze1, Mike R. James3, and Stephen M. Baloga4 3
1 Planetary Geodynamics Laboratory, NASA Goddard Space Flight Center, Greenbelt, 4
MD, 20771, USA, [email protected]. 5
2 Department of Astronomy, University of Maryland, College Park, MD, USA. 6
3 Lancaster Environment Centre, Lancaster University, Lancaster, UK. 7
4 Proxemy Research, Laytonsville, MD, USA 8
9
Abstract 10
A detailed understanding of pāhoehoe emplacement is necessary for developing 11
accurate models of flow field development, assessing hazards, and interpreting the 12
significance of lava morphology on Earth and other planetary surfaces. Active pāhoehoe 13
lobes on Kīlauea Volcano, Hawaiʻi, were examined on 21–26 February 2006 using 14
oblique time-series stereo-photogrammetry and differential global positioning system 15
(DGPS) measurements. During this time, the local discharge rate for peripheral lava lobes 16
was generally constant at 0.0061 ± 0.0019 m3/s, but the areal coverage rate of the lobes 17
exhibited a periodic increase every 4.13 ± 0.64 minutes. This periodicity is attributed to 18
the time required for the pressure within the liquid lava core to exceed the cooling-19
induced strength of its margins. The pāhoehoe flow advanced through a series of down-20
slope and cross-slope breakouts, which began as ~0.2 m-thick units (i.e., toes) that 21
coalesced and inflated to become approximately meter-thick lobes. The lobes were 22
thickest above the lowest points of the initial topography and above shallow to reverse-23
https://ntrs.nasa.gov/search.jsp?R=20160000385 2018-07-08T22:10:22+00:00Z
2
facing slopes, defined relative to the local flow direction. The flow path was typically 24
controlled by high-standing topography, with the zone directly adjacent to the final lobe 25
margin having an average relief that was a few centimeters higher than the lava-26
inundated region. This suggests that toe-scale topography can, at least temporarily, exert 27
strong controls on pāhoehoe flow paths by impeding the lateral spreading of the lobe. 28
Observed cycles of enhanced areal spreading and inflated lobe morphology are also 29
explored using a model that considers the statistical likelihood of sequential breakouts 30
from active flow margins and the effects of topographic barriers. 31
32
1. Introduction 33
Basalt is the most common rock type on the surface of terrestrial bodies 34
throughout the solar system and—by total volume and areal coverage—pāhoehoe flows 35
are the most abundant form of basaltic lava in subaerial and submarine environments on 36
Earth (Self et al., 1994, 1998). Pāhoehoe flow fields are composed of flows, lobes, and 37
toes, which represent a continuum of lava emplacement scales, with toes being the 38
smallest elements. Pāhoehoe flows commonly advance as toes break out along lobe 39
margins (Hon et al., 1994; Crown and Baloga, 1999; Hoblitt et al., 2012). These new toes 40
quickly cool and develop a rheological gradient that includes an inferred three-part 41
structure composed of a brittle outer crust, underlying viscoelastic layer, and inner molten 42
core (Hon et al., 1994). As toes develop sufficient strength to retain incoming lava, they 43
can pressurize, coalesce, and inflate to form lobes that are interconnected with other 44
portions of the flow through internal fluid pathways (Walker, 1991, 2009). The evolution 45
of these pathways can vary considerably (Kauahikaua et al., 1998), but the initial 46
3
emplacement of pāhoehoe flow fronts can influence the subsequent development of the 47
flow. Consequently, a detailed understanding of processes operating on the scale of toes 48
and lobes can provide important information for modeling aspects of flow field 49
development, assessing hazards, and interpreting the significance of lava flow 50
morphology on Earth and other planetary bodies (Peitersen and Crown, 2000; Byrnes and 51
Crown, 2001). 52
Hon et al. (1994) suggest that “microtopography” (i.e., tens of centimeters relief), 53
herein termed “toe-scale topography”, can strongly affect the emplacement of pāhoehoe 54
lava flows that reach a final inflated thickness of several meters. Previous studies have 55
attempted to determine the relationship between topography and pāhoehoe emplacement 56
(Crown and Balgoa, 1999; Peitersen and Crown, 2000; Byrnes and Crown, 2001), but 57
these studies have been unable to quantify the effects of toe-scale topography at the flow 58
front due to data resolution limitations. Here, oblique digital photogrammetry and 59
Differential Global Positioning System (DGPS) measurements are combined to quantify 60
key physical parameters involved in pāhoehoe flow advance through development of toes 61
and lobes, which constitute the fundamental building blocks of all pāhoehoe flows 62
(Walker, 1991; Self et al., 1996, 1998; Thordarson and Self, 1998). These field 63
observations are also used to inform and constrain a new stochastic model that describes 64
pāhoehoe lobe emplacement in terms of a balance between random and non-random 65
processes. 66
67
2. Background 68
4
Pāhoehoe flow fields exhibit a multitude of branching events at several scales 69
(Crown and Baloga, 1999) and include self-similar morphologies (Bruno et al., 1994) that 70
enable local observations to be used to understand larger aspects of flow fields and their 71
emplacement. However, these patterns are complicated and irregular because of the 72
influence of stochastic processes operating on multiple scales (Kilburn, 1996). This 73
makes it important to identify the scales over which recurring processes and structures 74
combine to form the overall pattern of a pāhoehoe flow field. Understanding how 75
eruption parameters, deterministic factors, and random influences affect the emplacement 76
and modification of pāhoehoe flows, also makes it possible to develop improved 77
probabilistic models to describe likely patterns of flow growth (Glaze and Baloga, 2013). 78
This study examines active pāhoehoe lava lobes on Kīlauea Volcano, Hawaiʻi, to 79
characterize the effects of toe-scale topography on flow emplacement and identify key 80
parameters needed to model statistical aspects of the process. 81
Pāhoehoe flows grow through a combination of areal spreading and inflation, with 82
new toes breaking out along lobe margins and quickly cooling by radiation (Hon et al., 83
1994; Keszthelyi and Denlinger, 1996; Harris et al., 2007a, 2013). Once a thin skin 84
develops on the surface of the new toes, cooling becomes increasingly dominated by 85
conduction (Castruccio et al., 2013). The crust also helps to retain incoming lava, which 86
slows the advance of the new toes as their internal pressure decreases relative to the 87
increasing confining strength of the growing crust (Hon et al., 1994). Given a constant 88
influx of lava, this leads to a reduction in the areal coverage rate of the toes and an 89
increase in the rate of inflation. Inflation will then continue to dominate the emplacement 90
process until the internal pressurization of the lobe reaches a threshold required to rupture 91
5
the flow margins and initiate a new cycle of enhanced areal spreading (Hoblitt et al., 92
2012). 93
Within an active pāhoehoe flow, internal connections between numerous lobes 94
can form extensive lava pathways (Kauahikaua et al., 1998). Preferred pathways within 95
these lava networks tend to concentrate in existing topographic lows and may develop 96
into a tube-system as the surrounding flow cools and stagnates. This allows pāhoehoe 97
flows to advance great distances by transporting lava to the flow front through thermally 98
insulated pathways that can reduce cooling rates to only 0.5–1.0°C/km (Helz at al., 99
1991). As lava is distributed from a master pathway into peripheral lobes and toes, the 100
local discharge rates will progressively decrease with each branch in the system. Local 101
discharge rates may therefore be constant over short periods of time (Hon et al., 1994), 102
but are expected to evolve as the lobes at the former flow front are incorporated into the 103
growing body of the lava transport system. In this study, lobes along the periphery of a 104
low discharge pāhoehoe flow are examined to explore flow front emplacement processes 105
and inflation. 106
107
3. Study Area 108
The Prince Kūhiō Kalanianaʻole (PKK) flow was erupted from Puʻu ʻŌʻō on 109
Kīlauea Volcano, Hawaiʻi, from March 2004 to June 2007 (Fig. 1). Active margins along 110
the flow were examined in the field between 21–26 February 2006. During this time, lava 111
from Puʻu ʻŌʻō was primarily transferred though an established tube system that reached 112
the ocean (Koeppen et al., 2013). However, during February 2006, the master tube-113
system also fed a series of small surface flows located ~7 km south of Puʻu ʻŌʻō. Harris 114
6
et al. (2007a) referred to this portion of the PKK flow as the “Hook flow”. Field 115
observations and thermal imagery were used to establish that this flow exhibited 116
breakouts of S-type pāhoehoe (Wilmoth and Walker, 1993) from three small flows on 21 117
February. However, by 23 February, the activity had dwindled to the distal margin of just 118
one flow. Waning activity was also evidenced by a decrease in maximum core 119
temperature from 1141°C on 21 February, to 1131°C on 23 February, and a decrease in 120
areal coverage rate from ~0.22 m2/s on February 22 to ~0.03 m2/s on 23 February (Harris 121
et al., 2007a). Additionally, there was a corresponding decrease in discharge rate feeding 122
small surface flows, from ~0.14 m3/s on February 22 to ~0.03 m3/s on 23 February 123
(Harris et al., 2007a). These surface flows stagnated on February 24. Measurements 124
reported in this study were made contemporaneously with the observations of Harris et al. 125
(2007a), who used thermal-image chronometry to establish broad relations among 126
cooling, discharge rate, and areal coverage rates for the whole flow. 127
To place the local discharge rates discussed within this study into a broader 128
context, the Puʻu ʻŌʻō-Kupaianaha eruption began erupting in Kīlauea Volcano’s East 129
Rift Zone (ERZ) in January 3, 1983, and between 1983 and 2002 its time-averaged 130
discharge rate (Harris et al., 2007b) was ~3.81 m3/s dense-rock-equivalent lava (Heliker 131
and Mattox, 2003). However, the Puʻu ʻŌʻō-Kupaianaha eruption has undergone 132
numerous changes throughout its history (Heliker and Mattox, 2003) and in 2003‒2007 133
the magma supply rate to the ERZ increased significantly during a mantle-derived surge 134
to Kīlauea Volcano (Poland et al., 2012). During this time, the magma supply to Kīlauea 135
Volcano increased by a factor of two (Poland et al., 2012). By 2005 the supply rate to the 136
ERZ increased to ~5.11 m3/s (Poland et al., 2012) and so at the time of the field campaign 137
7
in February 2006, effusion rates from Puʻu ʻŌʻō were probably higher than the long-term 138
average. Tilt meter records from the Hawaiian Volcano Observatory’s Puʻu ʻŌʻō cone 139
station also show that there was an oscillatory pattern of inflation and deflation between 140
21‒26 February 2006 (Orr, 2011). This pattern began with an inflation event on 21 141
February, which was followed by gradual deflation over the next five days through a 142
series of smaller tilt cycles (Tim Orr, personal communication, 2013). Orr (2011) showed 143
that these tilt cycles were associated with fluctuations in lava discharge through the tube 144
system and may have contributed to the observed breakouts from the master tube. 145
Discharge rates associated with the small surface flows examined within this study were 146
therefore much lower than for the concurrently active PKK tube and the eruption as a 147
whole. 148
149
4. Methods of Digital Terrain Modeling 150
To quantify aspects of the pāhoehoe emplacement processes, two complementary 151
methods were employed. First, time-series oblique stereo-imaging and photogrammetry 152
(Robson and James, 2007) were used to determine the changing geometric properties of 153
an active lava lobe, herein referred to as Lobe A. Second, Differential Global Positioning 154
System (DGPS) measurements of topography before and after the emplacement of a 155
second pāhoehoe lobe (Lobe B) were used to assess the relationship between initial 156
topography and final lobe morphology. Lobes A and B were located along the same lava 157
pathway system, with Lobe B located ~10 m directly down-flow of Lobe A. 158
Time series stereo-image pairs of Lobe A were acquired on 23 February using 159
two synchronized tripod-mounted digital Single Lens Reflex cameras (6 mega-pixel 160

8
Canon EOS 300D), which collected image pairs every minute over a duration of 35 161
minutes (Robson and James, 2007). The cameras were mounted approximately one meter 162
apart and had pre-calibrated, fixed-focus 28 mm lenses. Photogrammetric control was 163
provided using spherical targets (0.25 mm in diameter) with positions determined by 164
DGPS measurements. The analysis was carried out using Vision Measurement System 165
(Robson and Shortis, http://www.geomsoft.com) with image matching by the GOTCHA 166
dense matching algorithm (Gruen, 1985; Day and Muller, 1989; Otto and Chau, 1989). A 167
typical stereopair provided topographic point cloud data with positional precisions of 25, 168
65 and 20 mm in easting (x), northing (y), and elevation (z), respectively. To quantify 169
surface changes, these point cloud data were gridded in Surfer using a Kriging algorithm 170
over a 0.1 m/pixel x-y grid. The data were then imported into ArcGIS. 171
For Lobe B, x, y, and z coordinates for topographic surfaces were acquired before 172
(23 February) and after lava emplacement. Post-emplacement surveys were performed on 173
24–26 February; however, no changes were observed after 24 February and so data from 174
these three surveys were combined together. Data were collected at a sampling rate of 0.5 175
seconds using two Ashtech Z-Xtreme DGPS receivers—one operating in kinematic mode 176
and the other as a static base-station. These data were post-processed using Ashtech 177
Solutions 2.60 with differential, L1/L2 (1575.42 MHz/1227.60 MHz) frequency 178
correction for ionospheric delay error, and International Global Navigation Satellite 179
System Service Standard Product 3 precise orbit file corrections. Resulting data points 180
were filtered to remove measurements with more than 0.05 m residual accuracy error. On 181
volcanic terrains, Hamilton et al. (2010) estimate the vertical precision of single traverse 182
kinematic DGPS surveys to be ±0.08 m, and double traverses being ±0.06 m, with 183
9
horizontal precision being better than the vertical measurements. Most gridded cells in 184
this dataset contain multiple DGPS observations and should have a vertical precision of 185
±0.06 m. The resulting datasets for the initial and final topography include 14,618 and 186
20,585 records, respectively. To avoid spatial aliasing and to eliminate redundant data, 187
the BLOCKMODE function in Generic Mapping Tools (GMT; Wessel and Smith, 1991) 188
was used to average z within each pixel. Filtered x, y, and z, data were then interpolated 189
using NEARNEIGHBOR in GMT to form a 0.1 m/pixel x-y grid. 190
191
5. Time Series Observations of Pāhoehoe Lobe Emplacement 192
Stereogrammetric point clouds and interpolated Digital Terrain Models (DTMs) 193
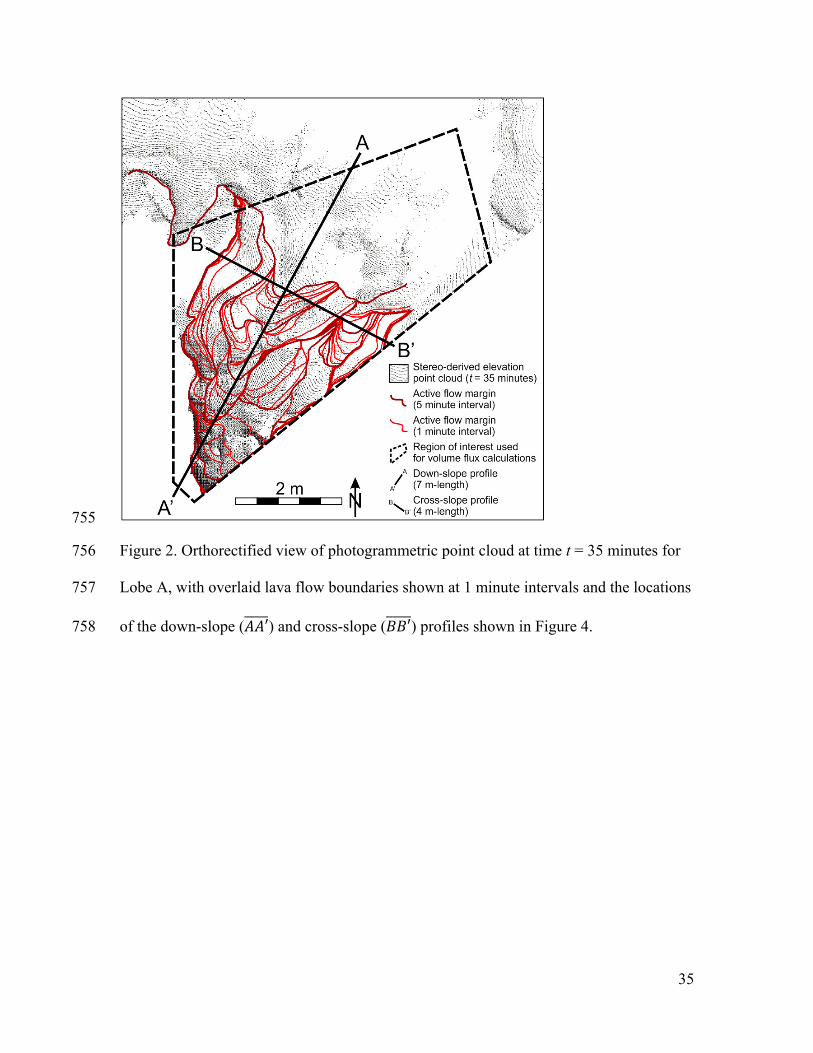
were used to identify and digitize the active margins of Lobe A at 1-minute intervals (Fig. 194
2). These areal spreading maps show that the lava lobe grew by a series of breakouts that 195
broadly fit into two categories: narrow (0.2–0.6 m-wide) toes that grew preferentially 196
down-slope and broad (1.4–3.5 m-wide) breakouts that formed along the sides of the 197
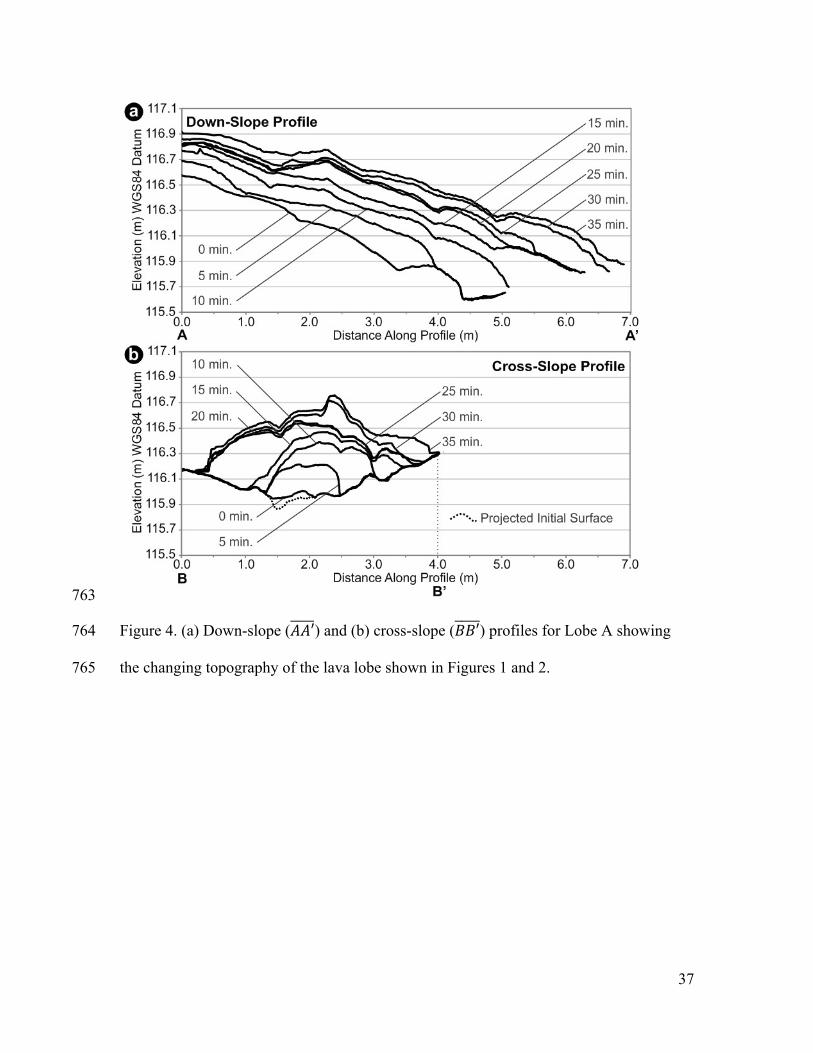
lobe, nearly perpendicular to the down flow axis (Figs. 3 and 4). Initial toe thicknesses 198
were typically ~0.2 m and, during the 35 minute period of observation, they inflated to a 199
maximum thickness of ~1.1 m, with most toes inflating to half their final thickness within 200
10 minutes. Within the first minute of emplacement toes generally extended ~0.2 m, with 201
a range of 0.05 to 0.55 m. After 28 minutes, the active flow margin began to exit the field 202
of view of the stereo cameras and toe lengths could not be accurately constrained. 203
The mean local discharge rate measured at Lobe A over the first 19 minutes was 204
0.0061 ± 0.0019 m3/s (N = 19, Fig. 5a). Note that all uncertainties in this study are 205
reported at 1 standard deviation, σ, unless otherwise noted. Standard deviation describes 206
10
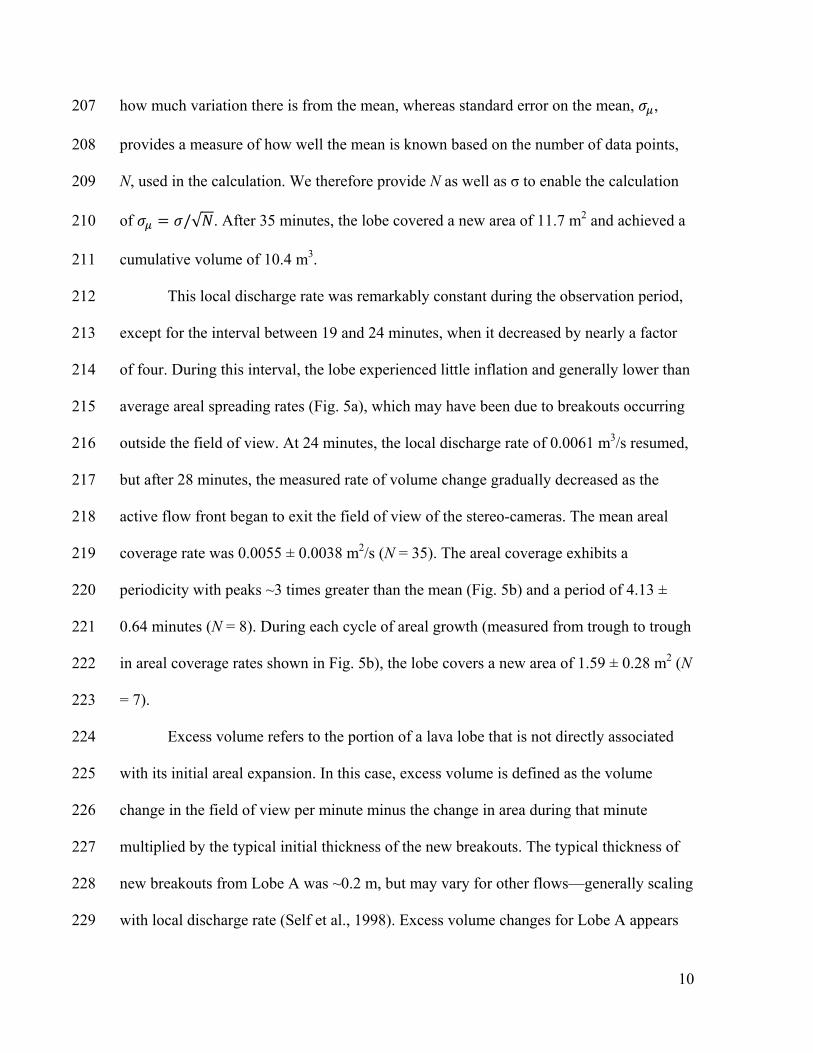
how much variation there is from the mean, whereas standard error on the mean, , 207
provides a measure of how well the mean is known based on the number of data points, 208
N, used in the calculation. We therefore provide N as well as σ to enable the calculation 209
of /√ . After 35 minutes, the lobe covered a new area of 11.7 m2 and achieved a 210
cumulative volume of 10.4 m3. 211
This local discharge rate was remarkably constant during the observation period, 212
except for the interval between 19 and 24 minutes, when it decreased by nearly a factor 213
of four. During this interval, the lobe experienced little inflation and generally lower than 214
average areal spreading rates (Fig. 5a), which may have been due to breakouts occurring 215
outside the field of view. At 24 minutes, the local discharge rate of 0.0061 m3/s resumed, 216
but after 28 minutes, the measured rate of volume change gradually decreased as the 217
active flow front began to exit the field of view of the stereo-cameras. The mean areal 218
coverage rate was 0.0055 ± 0.0038 m2/s (N = 35). The areal coverage exhibits a 219
periodicity with peaks ~3 times greater than the mean (Fig. 5b) and a period of 4.13 ± 220
0.64 minutes (N = 8). During each cycle of areal growth (measured from trough to trough 221
in areal coverage rates shown in Fig. 5b), the lobe covers a new area of 1.59 ± 0.28 m2 (N 222
= 7). 223
Excess volume refers to the portion of a lava lobe that is not directly associated 224
with its initial areal expansion. In this case, excess volume is defined as the volume 225
change in the field of view per minute minus the change in area during that minute 226
multiplied by the typical initial thickness of the new breakouts. The typical thickness of 227
new breakouts from Lobe A was ~0.2 m, but may vary for other flows—generally scaling 228
with local discharge rate (Self et al., 1998). Excess volume changes for Lobe A appears 229
11
to be weakly anti-correlated with its areal spreading rate. However, to quantify the degree 230
of anti-correlation, the cross-correlation coefficient was calculated between the areal 231
growth and excess volume. The correlation analysis was restricted to the first 19 minutes 232
of observation when the volume flow rate feeding the lobe was relatively constant. The 233
areal growth rate during this 19 minute period exhibits a slight overall increase over time 234
(slope = 0.013 m2/minute and intercept = 0.206 m2/minute), and therefore the trend was 235
removed prior to analysis. After trend removal, the cross correlation coefficient, at lag = 236
0 (the measure of direct anti-correlation) is -0.22. The negative sign of this statistic 237
indicates anti-correlation; however, the magnitude is well within the 90% confidence 238
interval (±0.34) indicating that the anti-correlation is very weak and not statistically 239
significant at this level. This suggests that there may be a trade-off between areal 240
spreading and inflation given an approximately constant lava supply, but that the 241
relationship may be complicated by other factors. See Section 7.2 for further discussion. 242
243
6. Lava Thickness, Inflation, and the Effects of Topographic Relief on Pāhoehoe 244
Lobe Emplacement 245
Topographic maps of the terrain before and after the emplacement of Lobe B are 246
shown in Figure 6. Lava covered 111.83 m2 within the DGPS survey region, with a total 247
lobe volume of 59.45 m3. Forward Looking Infrared Radiometer (FLIR) measurements of 248
the flow at 06:00 on 24 February 2006, revealed no anomalously hot pixels within the 249
study region, which indicates that the flow terminated at least 5 hours before (Harris et 250
al., 2007). Based on the time of the last field observations on 23 February, this constrains 251
the emplacement duration to <8 hours. If the mean areal coverage and discharge rates 252
12
were similar for Lobes A and B, then the emplacement duration of Lobe B was likely 253
between 2.6 and 5.2 hours. 254
Using the before and after DTMs (Figs. 6a and b), topographic profiles have been 255
extracted down-slope (Fig. 7a) and cross-slope (Fig. 7b). The lava entered the study 256
region from the north and the lobe grew to a length of ~18 m and a maximum width of 257
9.1 m. However, the distal part of the flow focused into a 4.3 m-wide topographic 258
constriction before being bifurcated by a 1.0 m-high topographic obstacle into two 259
smaller lobes that were 2.4 m and 4.0 m-wide. The profiles show that inflation of the lava 260
tended to topographically invert the landscape, with the thickest portions of the lobe 261
developing above topographic depressions and shallow to reverse-facing slopes, defined 262
relative to the local flow direction. Thus, apparent barriers to the spreading of the flow 263
are typically much smaller than the maximum height of the lobe and the thicker portions 264
of the lobe appear confined by the thinner peripheral parts of the flow. 265
The thickness distribution of Lobe B (Fig. 6c) above the existing surface was 266
calculated by taking the simple difference between the final and initial topography. This 267
yields a mean lobe thickness of 0.57 ± 0.24 m, with a maximum of 1.21 m. However, 268
simple topographic difference overestimates inflation because lobes are initially 269
emplaced as toes with an initial thickness. Additionally, lava had to fill small closed 270
depressions before thickening above the surrounding topography. 271
To account for the infilling of small topographic depressions, a new initial surface 272
was created by smoothing the initial topography in a process that is analogous to tightly 273
stretching a rubber sheet through the data. The smoothed surface was created using the 274
GMT function SURFACE, which interpolates a grid using continuous curvature splines 275
13
in tension (Smith and Wessel, 1990). Specifically, SURFACE applies the Laplace 276
transform (L) to the initial topography (z): 277
(1–T) L × (L (z)) + T × L(z) = 0. [1] 278
Varying the tension factor T between 1 (i.e., the harmonic surface solution) and 0 279
(i.e., the minimum curvature solution) enables this data interpolation method to smooth 280
the initial surface to different degrees. For instance, a grid produced with high tension (T 281
→ 1) will suppress local maxima and minima by fitting an increasingly taut surface 282
between the data constraints, whereas applying a looser tension factor (T → 0) will 283
produce a smooth polynomial function analogous to a flexed elastic plate that is anchored 284
by the data (Smith and Wessel, 1990). 285
To constrain the inflated thickness of Lobe B, a smoothed local datum was fit to 286
the initial topography using a T-value of 1. This removes high frequency oscillations in 287
the topography, while preserving the overall shape of the terrain. Subtracting this surface 288
from the final topography isolates the thickness of lava above the local datum and 289
provides a better proxy for inflation than the simple difference map because it reduces the 290
thickness contributions due to small basin infilling. Using this method, the mean 291
thickness due to inflation was 0.34 ± 0.21 m (N = 9614), with a maximum of 1.00 m (Fig. 292
6d). 293
To isolate local relief within the initial topography, a second interpolated surface 294
was created using Eq. (1) with T = 0.25. A loose tension factor of T = 0.25 is 295
recommended for low-tension interpolations to suppress extraneous oscillations (i.e., 296
minima and maxima) that can otherwise be generated within the T = 0 (i.e., end-member 297
minimum curvature) solution (Wessel and Smith, http://gmt.soest.hawaii.edu/). The new 298
14
surface preserves more variations in the initial topography than the harmonic surface 299
solution (T = 1) and was subtracted from the original initial topography to isolate high 300
frequency changes in elevation (i.e., relief) above and below a new local datum centered 301
on 0 m. 302
In the lava inundated region, the distribution of initial relief is unimodal with a 303
mean of -0.02 ± 0.07 m (N = 9614 pixels; Fig. 8). For comparison, a 1-pixel buffer region 304
was also defined around the outer extent of the lobe and, in this buffer region, the 305
frequency distribution of relief had a mean of 0.00 ± 0.07 m (N = 499 pixels). However, 306
relative to the lava inundated region, there are more pixels with a relief of 0.03 to 0.09 m 307
and fewer pixels with a relief of -0.09 to -0.03 m (Fig. 8). This implies that there are 308
systematically more high relief pixels bounding the pāhoehoe lava lobe than in the region 309
that was inundated. Consequently, positive relief on the order of only a few centimeters 310
may exert an important influence on bounding the extent of low-effusion-rate pāhoehoe 311
flows. 312
Toe-scale topography (i.e., on the order of centimeters in this case) appears to 313
influence the areal spreading of pāhoehoe lobes by blocking peripheral toes, which may 314
then stagnate and help confine the interior portions of the flow. If the interior of the flow 315
continues to be supplied by lava it may then inflate above the height of the surrounding 316
barriers, thereby topographically inverting the landscape. Barriers to flow may therefore 317
be much less than the final inflated thickness of a lobe. Based on observations of Lobe B, 318
relief that is at least 15% of a toe’s initial thickness may be significant in terms of 319
affecting the path of low-discharge pāhoehoe lava lobes, but given sample-size-320
dependent restrictions on the optimum bin-size for the data (Stuges, 1926; Doane, 1976), 321
15
influences of even smaller variations in topography cannot be precluded. Obstacle 322
heights affecting the path of higher local discharge rate flows may similarly scale with 323
initial toe height. 324
325
7. Stochastic Modeling of Pāhoehoe Lobe Emplacement 326
7.1. Overview of the Model 327
Random effects strongly influence processes of pāhoehoe flow growth and pose a 328
fundamental difficulty in developing models for their emplacement (Hon et al. 1994; 329
Thordarson and Self, 1998; Keszthelyi et al., 1999; Crown and Baloga, 1999). Glaze and 330
Baloga (2013) have recently developed a new simulation approach for modeling 331
pāhoehoe emplacement that builds on the ideas presented in Baloga and Glaze (2003). 332
This model is based on (1) conservation of lava volume and (2) prescribed stochastic 333
rules for lava movements within a pāhoehoe lobe. This approach differs significantly 334
from other models that treat lava emplacement as a gravity-driven viscous fluid flow on 335
an inclined plane (e.g., Danes, 1972; Hulme, 1974; Baloga and Pieri, 1986; Baloga, 1987; 336
Crisp and Baloga, 1990; Harris and Rowland, 2001; Rowland et al., 2004; Baloga and 337
Glaze, 2008). The Glaze and Baloga (2013) model simulates the 3-Dimensional shape for 338
pāhoehoe lobes as they evolve in time, subject to a wide variety of ambient and internal 339
conditions and processes. Here, the new model is used to explore the effects of inflation 340
on pāhoehoe lobes analogous to Lobes A and B. 341
The fundamental building block of the Glaze and Baloga (2013) model is the lava 342
“parcel”. A “parcel” of lava is defined here as a volumetric unit sampled from a 343
probability distribution of lava volumes that typically construct a pāhoehoe lobe. Thus 344
16
the smallest toe observed on the surface or along the margins of a pāhoehoe lobe 345
represents a lava parcel volume from the small end of the distribution. However, larger 346
toes may either represent a larger parcel volume, or may be comprised of multiple 347
parcels. 348
A parcel is observable as a “toe” when it is permanently affixed at the surface or 349
margin of a lobe. In the Glaze and Baloga (2013) model, lava parcels originate from a 350
source region and are transported through fluid internal pathways. For the purposes of 351
discussion here, the model assumes a constant parcel size for all parcels. Crown and 352
Baloga (1999) measured dimensions of hundreds of toes and their mean thickness is very 353
well constrained at ~0.20 cm, (0.19 ± 0.08 m, N = 448). Based on the geometric mean toe 354
sizes measured by Crown and Baloga (1999), the parcel volume is assumed to be 0.09 m3 355
(Glaze and Baloga, 2013). Assuming a square x-y grid and a typical parcel thickness of 356
0.2 m—comparable to the observed initial thickness of toes in our study area—the 357
corresponding cell spacing is 0.67 m, with a parcel area of 0.45 m2. 358
The Glaze and Baloga (2013) random simulation model begins with an initial 359
source region (a single point, linear source, etc.), a constant supply of lava (i.e., one 360
parcel per time step), and probabilistic rules governing where each parcel will be 361
transferred and allocated. For example, in the most basic scenario of complete 362
randomness, two random choices are made for each breakout. First, a parcel is randomly 363
selected to be the source for the next parcel transfer. Second, a random selection is made 364
to determine the orientation of the new parcel transfer relative to its source (i.e., North, 365
South, East, or West). In the purely random case, every face of every parcel has an equal 366
probability of being the source for the next parcel transfer. As various factors that 367
17
influence emplacement are examined (e.g., barriers, slope, etc.), different probabilistic 368
rules are applied that determine where and when each parcel will be transferred. 369
370
7.2. Model Simulations of Areal Growth 371
Figure 9a shows a typical example of a completely random simulation involving 372
500 parcels. In this simulation, each transfer location and direction is chosen at random. 373
Figure 10a (solid line) shows the corresponding cumulative area as a function of time 374
step. However, Glaze and Baloga (2013) showed that topographic profiles of pahoehoe 375
lobes are more consistent with simulations that include sequential breakouts at the 376
margin. In this case, the momentum of new parcels breaking out from a lobe margin 377
results in an increased probability that the next parcel will be transferred from the most 378
recent parcel in the same direction. Figure 9b shows the influence of allowing sequential 379
breakouts at the lobe margin on lobe morphology. Specifically, every time a new parcel is 380
transferred to the margin (increasing the lobe area) probabilistic rules are used to 381
determine whether 0, 1, or 2 extra parcels will be added at that location. For the 382
simulation shown in Figure 9b, the probability of 0 additional parcels is P(0) = 0.25, of 1 383
additional parcel being added is P(1) = 0.25, and of 2 additional parcels is P(2) = 0.5. As 384
expected, the cumulative area of the simulation that includes sequential breakouts at the 385
margin rapidly diverges from the purely random simulation (Fig. 10a), exhibiting a 386
steeper gradient and overall greater cumulative area. Although a general trend in the areal 387
growth (m2 per time step) is evident in both simulations shown in Figure 10a, the curves 388
are irregular with periods where the area increases rapidly and periods where the area 389
does not change at all. Also as expected, the rate of overall areal growth tapers off over 390

18
time as the number of available lava transfer locations along the margins decreases 391
relative to the total area of the lobe. 392
The Glaze and Baloga (2013) simulation approach explicitly requires that lava 393
parcels will either expand the area of the flow or contribute to inflation if they are 394
allocated to the flow interior. This naturally results in a trade-off between areal growth 395
and interior lobe inflation similar to the pattern observed during the emplacement of Lobe 396
A. The natural periodicity of the areal growth rate in the simulated lobes is illustrated by 397
the solid line in Figure 10b. Also shown in Figure 10b is the excess volume, which was 398
defined in Section 5 as the volume in addition to what is directly associated with the 399
change in lobe area because all breakouts will be emplaced with some initial thickness. 400
For the simulated data, the definition of excess volume results in a periodic behavior that 401
exactly mirrors the areal growth (i.e., perfect anti-correlation). This suggests that the 402
weak anti-correlation shown in Figure 5b may be relevant, but also indicates that other 403
processes are present in the field that have not yet been accounted for by the model. Also 404
in the field example, there was a period of anomalously low average lava flux between 405
20–23 minutes, which coincided with a period of negative excess volume change. This 406
indicates that areal spreading can also be accommodated by the depletion of lava stored 407
within the parent lobe, rather than always being related to a simple balance between 408
pressurization and confining strength under conditions of constant lava supply. Future 409
studies would therefore benefit from longer time-series observations of multiple active 410
lava lobes to further explore the statistical significance of the relationship between areal 411
spreading and inflation. 412
413
19
7.3. Comparisons Between Model Simulations and Observations 414
Given the measured volume of Lobe A and typical parcel volume of 0.09 m3, 415
Lobe A would include ~117 parcels. The simulation of a lobe composed of 117 parcels 416
begins with a 1 × 7 cell linear source region trending East-West (depicted as the gray 417
shaded region in Figure 11a crossing through the mid-point of the array). This source 418
region, with one parcel in each of the seven cells, is approximately equivalent to the 419
initial length of Lobe A (i.e., ~4.69 m; see Fig. 4a). The model also includes two parallel 420
barriers located at ±3 cells along the North-South axis. The barriers are considered 421
transitional zones in which the advancing lava enters, but becomes blocked, thereby 422
reflecting the lava parcel back toward the interior of the flow. The distance between these 423
barriers is 4.69 m (including the barrier cells as well), which corresponds to the 424
topographically-bounded maximum width of Lobe A. The probabilities of sequentially 425
adding 0, 1, or 2 extra parcels from an existing flow margin are P(0) = P(1) = 0.25, and 426
P(2) = 0.5. 427
One cannot expect any specific realization of the stochastic model to exactly 428
reproduce the morphology of an observed lava lobe, but characteristics of the simulated 429
lobes are broadly consistent with the morphology of Lobe A. Figure 11b shows examples 430
of topographic profiles taken perpendicular to the flow direction through the simulated 431
lobes averaged over 10, 20, 30, and 60 realizations. These examples demonstrate that 432
there are stochastic variations between simulations, but also persistent morphological 433
characteristics. For example, the simulated lobes are thickest in the middle (i.e., along the 434
axis of the linear source region) with maximum heights that are consistent with those 435
observed for Lobe A. The models also exhibit the effects of lava confinement along lobe 436
20
margins due to lava parcels being reflected back toward the interior of the flow. Plan 437
views of the simulated lobes (e.g., Figs. 9a and 9b) also show irregular margins and 438
thickness variations that are typical of inflated pāhoehoe lobes. 439
440
8. Discussion 441
8.1. Relationships between Pāhoehoe Breakouts and Inflation 442
Pāhoehoe breakouts will be emplaced with some initial thickness and then grow 443
through a process of inflation. This inflation process includes two dominant components: 444
thickening of the molten core and thickening of the crust (Hon et al., 1994), with the crust 445
consisting of both a brittle outer layer and underlying viscoelastic layer. After an initial 446
chilled margin forms around a new toe, it will retain incoming lava and inflate as its 447
molten core thickens to equalize the pressure with other connected portions of the fluid 448
lava pathway. During the early stages of emplacement, the rate of core thickening will 449
greatly exceed the rate of crustal thickening (Hon et al., 1994), but as the fluid interior 450
achieves its equilibrium thickness, inflation will be increasingly dominated by the process 451
of crustal growth (Cashman and Kauahikaua, 1997). 452
Two conditions must be met for the upper crust to continue to accrete new 453
material and contribute to inflation. First, there must be a continuous influx of new lava 454
through the molten core and, second, there must be physical coupling of the molten core 455
to the upper crust (Kauahikaua et al., 1998). If the flow of lava through the core stagnates 456
then the lava will cool in situ and will not increase the flow’s total thickness. 457
Additionally, if the molten core partially drains and decouples from the upper crust then 458
new material will not be added to the base of the surface layer and the crust may even 459
21
subside and “deflate” (Kauahikaua et al., 1998). Cooling histories inferred from the 460
thicknesses of the upper brittle and viscoelastic layers (Hon et al., 1994) therefore 461
provide an estimate of the time that a lava pathway flowed at full capacity, but not 462
necessarily the total duration of emplacement if the core of the flow and the upper crust 463
were decoupled. In some cases, the molten core of a flow can also undergo cycles of 464
pressurization related to changes in the local discharge rate (Orr, 2011). This can lead to 465
variations in molten core pressure that induce cycles of surface disruption and 466
subsidence, thereby producing a range of surface textures that include slabbly pāhoehoe, 467
rubbly pāhoehoe, and shatter rings. 468
Initial cooling can strengthen the margins of a lava flow (Castruccio et al., 2013), 469
but the process is complicated by the development of numerous cooling fractures. These 470
fractures will mechanically weaken the outer brittle crust and make the underlying 471
viscoelastic layer more important in terms of governing the overall confining strength of 472
the flow. The frequency of breakouts will therefore depend on the balance between the 473
combined strength of the brittle and viscoelastic layers relative to the pressure within the 474
molten core (Hoblitt et al., 2012). If the internal pressure exceeds the confining strength 475
of the flow’s outer layers, then the periphery of the flow will rupture and generate new 476
breakouts that promote increased areal growth. In contrast, if the exterior of the flow does 477
not rupture, it will pressurize and inflate through gradual deformation of the viscoelastic 478
layer and opening of fractures in the overlying brittle crust. 479
In this study, peripheral lobes along the margins of the PKK flow on the flanks of 480
Kīleaua Volcano, exhibited a generally constant local discharge rate (0.0061 ± 0.0019 481
m2/s). However, approximately every four minutes there was a significant increase in the 482
22
areal spreading rate. The observed periodicity in areal coverage may relate to the 483
changing balance between the confining strength of the lava as it cools and strengthens, 484
and the internal pressure within the core of the flow. This balance would give rise to an 485
increased frequency of new breakouts when the core pressure exceeds the confining 486
strength of the exterior. Enhanced areal spreading rates would then persist until the core 487
pressure decreases below a critical threshold required to continuously rupture the active 488
flow margin. As the rate of areal spreading deceases, continued influx of lava into the 489
lobe would begin to re-pressurize its fluid core and perpetuate a new cycle. This process, 490
operating on the scale of an individual lobe, is similar to what Hoblitt et al. (2012) have 491
observed on the scale of an entire pāhoehoe flow, which demonstrates the self-similarity 492
of the inflation mechanism over a range of scales. 493
494
8.2. Static and Dynamic Pressure Considerations 495
During early stages of pāhoehoe emplacement, the inflation process will be 496
dominated by molten core thickening as the liquid interior of the flow moves toward an 497
equilibrium thickness. However, there are multiple factors that can contribute to this 498
equilibrium. Calculations generally assume a Bingham liquid rheology, with lava 499
descending a slope as an unconfined laminar flow under the influence of gravity (Hulme, 500
1974; Dragoni et al., 1986; Castruccio et al., 2013). Within this scenario, the critical 501
depth hs required to induce down-slope flow will be 502
hs = σ0/ρgsin(β), [2] 503
where σ0 is the flow’s yield stress, ρ the flow’s density, g is gravitational acceleration, 504
and β is the underlying slope (see Eq. [14] in Hulme, 1974). However, such calculations 505
23
of a lava flow’s equilibrium thickness will be complicated by cooling-induced changes in 506
rheology and other factors that influence its internal pressure once the molten core is 507
confined by a coherent crust. Several studies (e.g., Rossi and Gudmundsson, 1996; 508
Anderson et al., 1999, 2012) have considered the “magmastatic” pressure (herein referred 509
to as “hydrostatic” pressure) generated by fluid elevation changes along a hydrostatically 510
connected pathway, as well as the pressure required to drive lava through pipe-like 511
pathways and lift the crust. These models generally assume that the pathways (i.e., lava 512
tubes) are cylindrical pipes with constant cross-sectional area, but the geometry of lava 513
pathways can vary widely within a pāhoehoe flow (e.g., Guest et al., 1984; Kauahikaua et 514
al., 1998; Self et al., 1998; Calvari and Pinkerton, 1999). This raises the possibility that 515
changes in pathway geometry can introduce additional changes in lava core pressure due 516
to dynamic processes. 517
These dynamic effects may be understood within the context of Bernoulli’s 518
principle, which describes the inverse relationship between fluid flow velocity and fluid 519
pressure within incompressible laminar flows through a pipe (Resnick and Halliday, 520
1977; Batchelor, 1998). For lava moving within a system of combined pathways, changes 521
in fluid core pressure could affect inflation rates by changing the magnitude of the 522
stresses applied to the overlying crust. This may lead to increased inflation rates where 523
the flow velocity decreases and the core pressure increases. Conversely, inflation rates 524
would be lower where the flow velocity increases and the core pressure decreases. For 525
otherwise equivalent lava flows through a pipe-like pathway, the most important controls 526
on fluid velocity will be the pipe’s cross-sectional area and underlying slope. In general, 527
lava velocities will be relatively low where the flow pathway is broad and its cross-528
24
sectional area is large and/or where it descends a shallow slope or encounters a reverse-529
facing slope. Alternatively, flow velocities will be higher when lava enters a narrow 530
topographic constriction and/or descends a steeper slope. These scenarios are broadly 531
consistent with the observed relationship between the initial topography and final 532
morphology for Lobe B. In this case, maximum inflation was observed where the flow 533
was the broadest and above shallow to reverse-facing slopes, whereas the least inflation 534
was observed where the flow passed through narrow constrictions and descended steep 535
slopes (Figs. 6 and 7). These observations support the viability of a conservation of 536
energy approach to modeling the spatial variability of inflation and its relationship to 537
emplacement processes. They also highlight the importance of including both fluid static 538
and dynamic components in understanding core pressure and thickening during the early 539
stages of pāhoehoe inflation. Early stage inflation processes related to core pressurization 540
and thickening may also help to establish preferred pathways through the thickest parts of 541
the flow, which would continue to preferentially inflate through crustal accretion if the 542
pathways remain full. Continued crustal accretion and uplift must also be coupled with 543
overpressurization of the molten core, which Cashman and Kauahikaua (1997) inferred 544
from their observations of pāhoehoe crustal vesicularity profiles that exhibit decreased 545
vesicle number density with depth. 546
547
9. Conclusions 548
The confining strength of a lava lobe depends strongly on the age distribution of 549
its surfaces, with the youngest surfaces (i.e., sites of the most recent breakouts) being the 550
weakest. Therefore, when new breakouts occur, growth tends to concentrate at these 551
25
localities. Otherwise, the next most likely location for a breakout to occur is from an 552
older fractured surface overlying a still molten core. This process is treated with a 553
stochastic model by introducing correlation with a probability distribution describing the 554
preferential growth of the flow in the direction of new breakouts through sequential 555
emplacement of lava parcels (i.e., toes) from that locality. Including correlated growth 556
into the model also recreates observed periods of enhanced areal spreading and lobe 557
morphologies. 558
Time-series data for Lobe A shows that periods of enhanced areal spreading 559
roughly alternate with periods of increased excess volume change. For an approximately 560
constant local discharge rate, this suggests that the volume of lava not utilized during the 561
process of areal spreading can contribute to thickening through inflation. Trade-offs 562
between areal spreading and inflation should be detectable in thermal infrared (e.g., 563
FLIR) imagery, provided that a single lobe is isolated in the field of view. For instance, 564
when the flow enters a period of above average areal spreading, newly exposed lava 565
surfaces will radiate more thermal energy and will contribute to an increased frequency 566
distribution of high temperature pixels within the field of view. As the flow shifts toward 567
an inflation-dominated mode, older lava surfaces will cool dominantly by conduction 568
rather than radiation (Hon et al., 1994), and this would shift the frequency distribution of 569
temperatures toward lower values. Temperature distributions in FLIR data may therefore 570
be used to identify patterns of pāhoehoe flow emplacement, such as periodicities in areal 571
spreading rate and the trade-off with inflation. Statistical models of flow emplacement 572
may be improved by coupling them with a cooling model to estimate the temperature 573
distribution of the lava based on its emplacement age. 574
26
New toes are highly sensitive to subtle topographic irregularities and for low 575
discharge rate flows may be deflected or stopped by obstacles measuring only a few 576
centimeters in height. This process was observed during the emplacement of Lobe B and 577
demonstrates that the final morphology of a lobe may inherit boundaries influenced by 578
variations in the initial toe-scale topography that are orders of magnitude smaller than the 579
flow’s final thickness. Even though toes may be locally deflected or impeded by toe-scale 580
topography, inflating pāhoehoe lobes may overcome local barriers through a combination 581
of stochastic breakouts in down-flow and cross-flow directions that allow them to find 582
and follow the maximum regional slope. These behaviors are described in the model by 583
considering the sequential emplacement of new lava parcels (i.e., toes) from existing flow 584
margins, with boundaries that reflect parcels back towards the interior of the flow. 585
Combining measurements of initial topography with time-series observations of 586
active pāhoehoe lobes provides new insights into the growth of pāhoehoe flows. These 587
observational constraints also help to improve statistical models of lava emplacement 588
processes and better understand the relationship between areal expansion and inflation. 589
This information is important for understanding how subtle topographic influences can be 590
inherited by inflated lobes to develop preferred lava pathways that influence the overall 591
development of a flow and for interpreting the emplacement history of pāhoehoe lava 592
flows on Earth and other planetary surfaces. 593
594
Acknowledgments: 595
We thank Benjamin Brooks and the Pacific GPS facility for providing access to 596
DGPS survey equipment and post-processing resources, Samuel Hulme for his assistance 597
27
with GMT, Richard Herd for kindly providing DGPS data for photogrammetry control, 598
Andy Harris for his assistance in the field making contemporaneous FLIR observations, 599
Tim Orr for providing historical lava flow data shown in Figure 1, as well as Sarah 600
Fagents, Thorvaldur Thordarson, and Jacob Bleacher for many insightful discussions 601
relating to lava flow emplacement. Prof. S. Robson and Prof. J. P. Muller are thanked for 602
their ongoing support through provision of VMS and GOTCHA, respectively. Christopher 603
Kilburn and Jim Kauahikaua are sincerely thanked for their thorough and constructive 604
reviews. Field work was conducted in Hawaii Volcanoes National Park under Scientific 605
Research and Collecting Permit # HAVO-2006-SCI-0003. CWH was supported by an 606
appointment to the NASA Postdoctoral Program at the Goddard Space Flight Center, 607
administered by Oak Ridge Associated Universities through a contract with NASA. LSG 608
and SMB research was supported by the NASA Planetary Geology and Geophysics, and 609
Mars Data Analysis programs (LSG: 811073.02.01.04.44 and 203959.02.03.17.56; SMB: 610
NNX08AF16G and NNX10AP63G). 611
28
References 612
Anderson SW, Stofan ER, Smrekar SE, Guest JE, Wood B (1999) Pulsed inflation of 613
pahoehoe lava flows: implications for flood basalt emplacement. Earth Planet Sci 614
Lett 168:7–18 615
Anderson SW, Smrekar SE, Stofan ER (2012) Tumulus development on lava flows: 616
insights from observations of active tumuli and analysis of formation models. Bull 617
Volcanol 74:931–946. doi:10.1007/s00445-012-0576-2 618
Baloga S (1987) Lava flows as kinematic waves. J Geophys Res 92 (B9):9271–9279 619
Baloga S, Pieri DC (1986) Time-dependent profiles of lava flows. J Geophys Res 620
91:9543–9552 621
Baloga S, Glaze LS (2003) Pahoehoe transport as a correlated random walk. J Geophys 622
Res 108:2031. doi:10.1029/2001JB001739 623
Baloga S, Glaze LS (2008) Self-replication model for long channelized lava flows on the 624
Mars plains. J Geophys Res 113:E05003. doi:10.1029/2007JE002954 625
Batchelor GK (1980) An introduction to fluid dynamics. Cambridge Univ Press, New 626
York, 615 p 627
Bruno BC, Taylor GJ, Rowland SW, Baloga SM (1994) Quantifying the effect of 628
rheology of lava-flow margins using fractal geometry. Bull Volcanol 56:193–206 629
Byrnes JM, Crown DA (2001) Relationships between pahoehoe surface units, 630
topography, and lava tubes at Mauna Ulu, Kilauea Volcano, Hawaii. J Geophys 631
Res 106(B2):2139–2151 632
29
Byrnes JM, Ramsey MS, Crown DA (2004) Surface unit characterization of the Mauna 633
Ulu flow field Kilauea Volcano, Hawai‘i, using integrated field and remote 634
sensing analyses. J Volcano Geothem Res 135:169–193 635
Calvari S, Pinkerton H (1999) Lava tube morphology on Etna and evidence for lava flow 636
emplacement mechanisms. J Volcanol Geotherm Res 90:263–280 637
Cashman KV, Kauahikaua JP (1997) Reevaluation of vesicle distributions in basaltic lava 638
flows. Geology 25:419–422. doi:10.1130/0091-7613 639
Castruccio A, Rust AC, Sparks RJS (2013) Evolution of crust- and core-dominated lava 640
flows using scaling analysis. Bull Volcanol 75:681. doi:10.1007/s004455-012-641
0681-2 642
Crisp JA, Baloga SM (1990) A model for lava flows with two thermal components. J 643
Geophys Res 95:1255–1270 644
Crown DA, Baloga SM (1999) Pahoehoe toe dimensions morphology, and branching 645
relationships at Mauna Ulu, Kilauea Volcano, Hawai‘i. Bull Volcanol 61:288–305 646
Danes ZF (1972) Dynamics of lava flows J Geophys Res 77:1430–1432 647
Doane DP (1976) Aesthetic frequency classifications. American Statistician 30:181–1905 648
Dragoni M, Bonafede M, Boschi E (1986) Downslope models of a Bingham liquid: 649
implications for lava flow. J Volcanol and Geotherm Res 30:305–325 650
Day T, Muller JP (1989) Digital elevation model production by stereo-matching SPOT 651
image-pairs: A comparison of algorithms. Image Vision Comp 7:95–101 652
Gruen AW (1985) Adaptive least squares correlation: A powerful image matching 653
technique. S Afr J Photogramm Remote Sens Cartogr 14:175–187 654
Glaze LS, Baloga SM (2013) Simulation of inflated pahoehoe lava flows. J 655
30
Volcanol Geotherm Res, 255:108–123. doi:10.1016/j.jvolgeores.2013.01.018 656
Guest JE, Wood C, Greeley R (1984) Lava tubes, terraces and megatumuli on the 1614–657
24 pahoehoe lava flow field, Mount Etna, Sicily. Bull Volcanol 47(3):635–648 658
Hamilton CW, Thordarson T, Fagents SA (2010) Explosive lava–water interactions I: 659
architecture and emplacement chronology of volcanic rootless cone groups in the 660
1783–1784 Laki lava flow, Iceland. Bull Volcanol 72(4):449–467. 661
doi:10.1007/s00445-009-0330-6. 662
Harris AJL, Rowland SK (2001) FLOWGO: A kinematic thermo-rheological model for 663
lava flowing in a channel. Bull Volcanol 63:20–44 664
Harris AL, Dehn J, James MR, Hamilton C, Herd R, Lodato L, Steffke A(2007a) 665
Pahoehoe flow cooling, discharge, and coverage rates from thermal image 666
chronometry. Geophys Res Lett 34:L19303. doi:10.1029/2007GL030791 667
Harris AJL, Dehn J, Calvari S(2007b) Lava effusion rate definition and measurement: a 668
review. Bull Volcanol 70:1–22 669
Harris AJL (2013) Lava flows. In: Modeling volcanic processes: the physics and 670
mathematics of volcanism (eds. S.A. Fagents, T.K.P. Gregg, and R.M.C. Lopes). 671
Cambridge Univ. Press, New York, pp 85–106 672
Hon K, Kauahikaua J, Denlinger R, MacKay R (1994) Emplacement and inflation of 673
pahehoe sheet flows: Observations and measurements of active lava flows on 674
Kilauea Volcano, Hawaii. Geol Soc Am Bull 106:351–370 675
Hoblitt RP, Orr TR, Heliker C, Denlinger RP, Hon K, Cervelli PF (2012) Inflation rates, 676
rifts, and bands in a pāhoehoe sheet flow. Geosphere 8(5):179–195. 677
doi:10.1130/GES00656.1 678
31
Hulme G (1974) The interpretation of lava flow morphology, Geophys J R astr Soc 679
39:361–383 680
Kauahikaua J, Cashman KV, Mattox TN, Heliker CC, Hon LA, Mangan MT, Thornber 681
CR (1998) Observations on basaltic lava streams in tubes from Kilauea Volcano, 682
island of Hawai'i. J Geophys Res 103(B11):27,303–27,323 683
Keszthelyi L, Denlinger R (1996) The initial cooling of pahoehoe flow lobes. Bull 684
Volcanol 58:5–18 685
Keszthelyi L, Self S, Thordarson T (1999) Application of recent studies on the 686
emplacement of basaltic lava flows to the Deccan Traps, Memoirs – Geolog Soc 687
India 43:485–520 688
Keszthelyi L, Self S, Thordarson T (2006) Flood lavas on Earth, Io and Mars. J Geol Soc 689
163(2):253–264 690
Keszthelyi L, McEwen AS, Thordarson T (2000) Terrestrial analogs and thermal models 691
for Martian flood lavas. J Geophys Res 105(E6):15,027–15,049 692
Kilburn CRJ (1996) Patterns and predictability in the emplacement of subaerial lava 693
flows and flow fields. In: Scarpa R., R.I. Tilling (eds.) Monitoring and mitigation 694
of volcanic hazards. Springer, New York: pp 491–537 695
Koeppen WC, Patrick M, Orr T, Sutton AJ, Dow D, Wright R (2013) Constraints on the 696
portioning of Kīlauea’s lavas between surface and tube flows, estimated from 697
infrared satellite data, sulfur dioxide emission rates, and field observations. Bull 698
Volcanol 75:716. doi:10.1007/s00445-013-0716-3 699
32
Orr TR (2011) Lava tube shatter rings and their correlation with lava flux increases at 700
Kīlauea Volcano, Hawai‘i. Bull Volcanol 73:355–346. doi:10.1007/s00445-010-701
0414-3 702
Otto GP, Chau TKW (1989) Region-growing algorithm for matching of terrain images, 703
Image Vision Comp 7:83–94 704
Peitersen MN, Crown DA (2000) Correlations between topography and intraflow width 705
behavior in Martian and terrestrial lava flows. J Geophys Res 105(E2):4123–4123 706
Poland MP, Miklius A, Jeff Sutton A, Thornber CR (2012) A mantle-driven surge in 707
magma supply to Kilauea Volcano during 2003–2007. Nature Geosci 5(4):295–708
300 709
Ramsey MS, Harris AJL (2012) Volcanology 2010: How will thermal remote sensing of 710
volcanic surface activity evolve over the next decade? J Volcanol Geotherm Res. 711
249:217–233 712
Resnick R, Halliday D (1977) Physics: Part One (3rd ed.). John Wiley & Sons, New York, 713
608 p 714
Robson S, James MR (2007) Photogrammetric image sequence processing to determine 715
change in active lava flows. Proc Remote Sensing and Photogrammetry Society 716
Ann Conf, 2007 (RSPSoc 2007), 11–14th September, Newcastle upon Tyne, U.K. 717
Rossi MJ, Gudmundsson A (1996) The morphology and formation of flow-lobe tumuli 718
and Icelandic shield volcanoes. J Volc Geotherm Res 72:291–308 719
Rowland SK, Harris AJL, Garbeil H (2004) Effects of martian conditions on numerically 720
modeled, cooling-limited channelized lava flows. J Geophys Res 109(E10010). 721
doi:10.1029/2004JE002288 722
33
Self S, Thordarson T, Keszthelyi L, Walker GPL, Hon K, Murphy MT, Long P, 723
Finnemore D (1996) A new model for the emplacement of Columbia River 724
basalts as large, inflated pahoehoe lava flow fields. Geophys Res Lett 23:2689–725
2692 726
Self S, Keszthelyi L, Thordarson T (1998) The importance of pāhoehoe. Ann Rev Earth 727
Planet Sci 26(1):81–110 728
Smith WHF, Wessel P (1990) Gridding with continuous curvature splines in tension. 729
Geophysics 55(3):293–305 730
Sturges H (1926) The choice of a class-interval. J Amer Statist Assoc 21:65–66 731
Thordarson T, Self S (1998) The Roza Member, Columbia River Basalt Group: A 732
gigantic pahoehoe lava flow field formed by endogenous processes? J Geophys 733
Res 103(B11):27411–27445 734
Walker GPL (1991) Structure, and origin by injection of lava under surface crust, of 735
tumuli, `lava rises´, `lava-rise pits´, and `lava-inflation clefts´ in Hawaii. Bull 736
Volcanol 53:546–558 737
Walker GPL (2009) The endogenous growth of pahoehoe lava lobes and morphology of 738
lava-rise edges. In: Thordarson T, Self S, Larsen G, Rowland SK, Hoskuldsson A 739
(eds) Studies in volcanology—the legacy of George Walker (Special Publications 740
of IAVCEI No. 2). The Geol Soc: pp 17–32 741
Wilmoth RA, Walker GPL (1993) P-type and S-type pahoehoe: a study of vesicle 742
distribution and patterns in Hawaiian lava flows. J Volcanol Geotherm Res 743
55:129–142 744
34
Figures 745
746
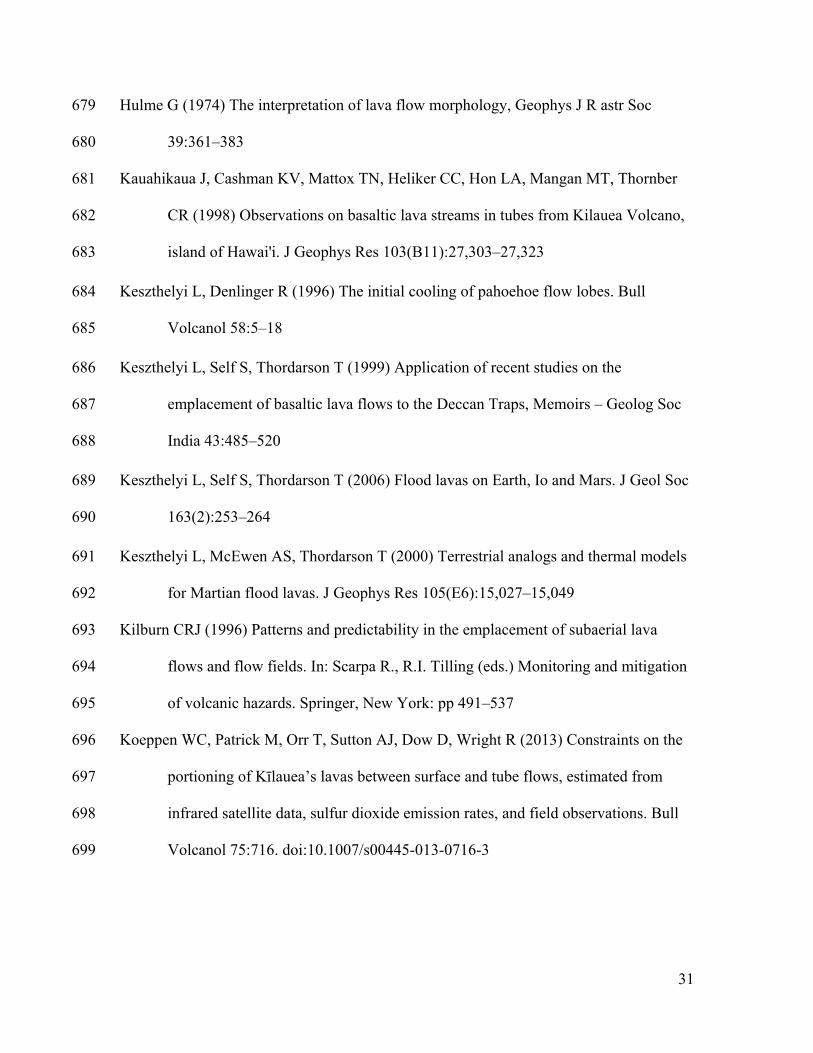
Figure 1. Lava flow map showing the study area location (19.336430°N, -747
155.055235°W) within the Prince Kūhiō Kalanianaʻole (PKK) flow (shown in yellow) on 748
Kīlauea Volcano, Hawaiʻi. Pāhoehoe lava lobes at this locality were fed lava from Puʻu 749
ʻŌʻō. Field measurements were acquired on 21–26 February 2006 for two lobes (A and 750
B) located along the same lava pathway system. Lobe B was located directly down-slope 751
of Lobe A, with a separation distance of ~10 m. The dashed lines approximately bound 752
the edifices of Puʻu ʻŌʻō and Kupaianaha. Lava flow data provided by Tim Orr, United 753
States Geologic Survey (USGS). 754
35
755
Figure 2. Orthorectified view of photogrammetric point cloud at time t = 35 minutes for 756
Lobe A, with overlaid lava flow boundaries shown at 1 minute intervals and the locations 757
of the down-slope ( ′) and cross-slope ( ′) profiles shown in Figure 4. 758
36
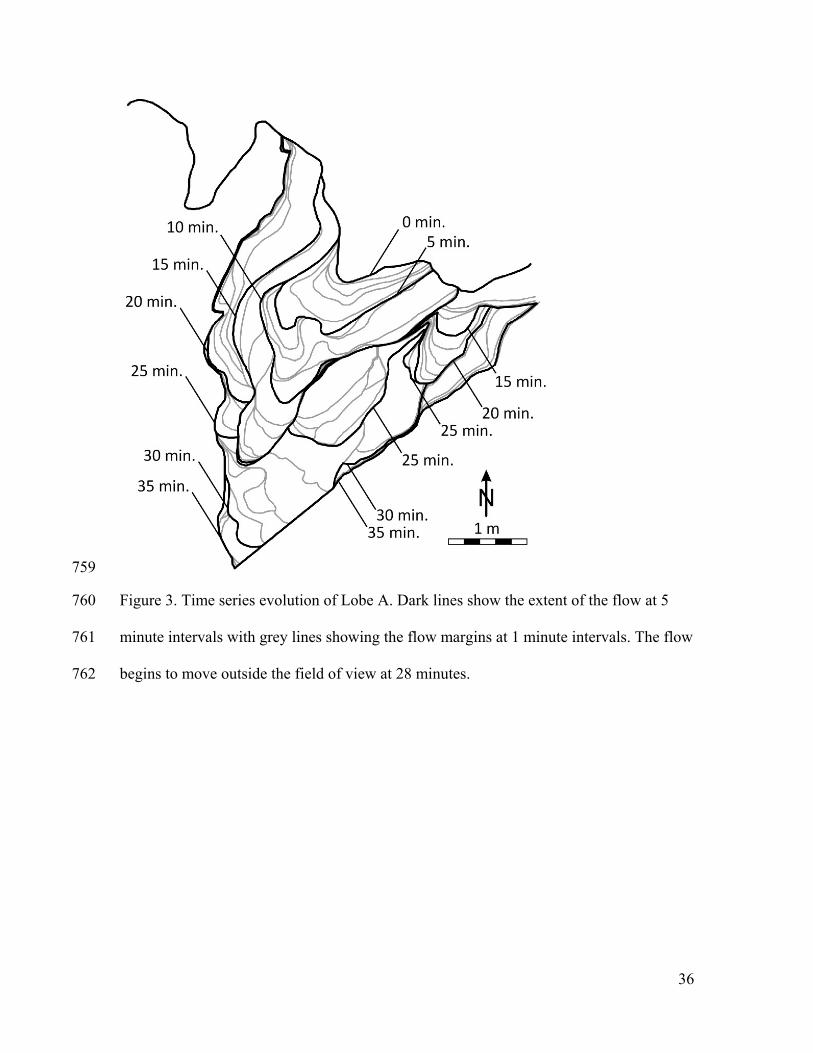
759
Figure 3. Time series evolution of Lobe A. Dark lines show the extent of the flow at 5 760
minute intervals with grey lines showing the flow margins at 1 minute intervals. The flow 761
begins to move outside the field of view at 28 minutes. 762
37
763
Figure 4. (a) Down-slope ( ′) and (b) cross-slope ( ′) profiles for Lobe A showing 764
the changing topography of the lava lobe shown in Figures 1 and 2. 765
38
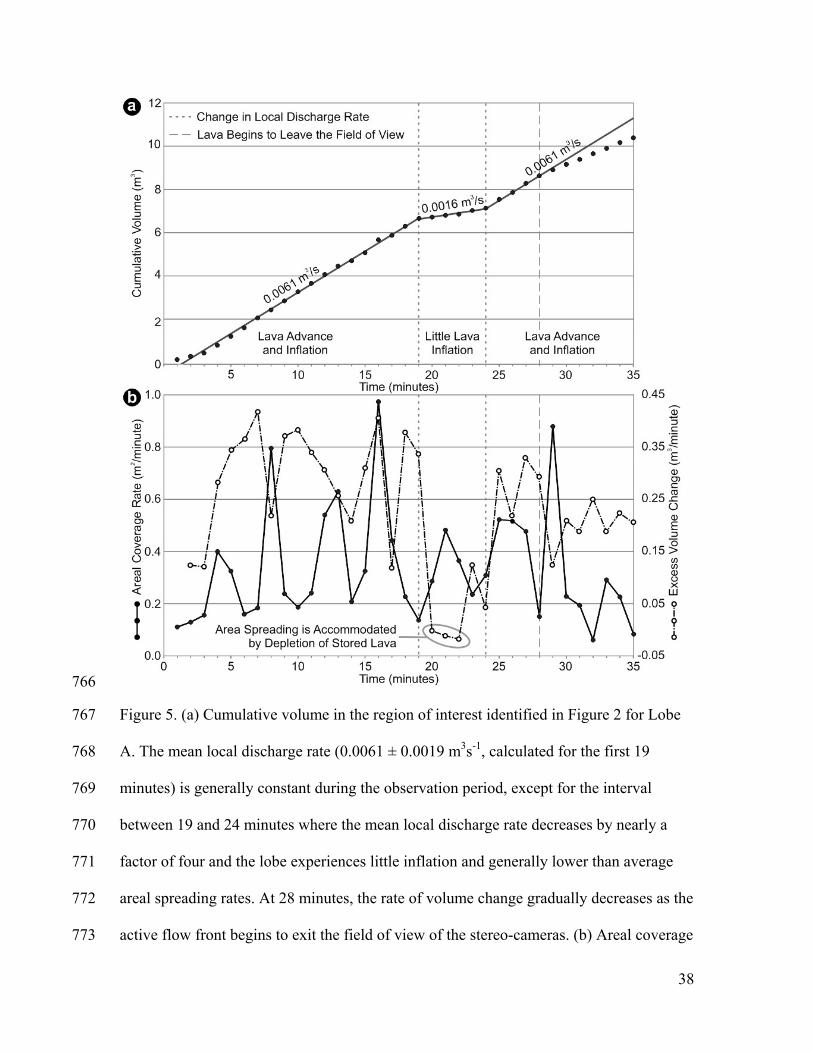
766
Figure 5. (a) Cumulative volume in the region of interest identified in Figure 2 for Lobe 767
A. The mean local discharge rate (0.0061 ± 0.0019 m3s-1, calculated for the first 19 768
minutes) is generally constant during the observation period, except for the interval 769
between 19 and 24 minutes where the mean local discharge rate decreases by nearly a 770
factor of four and the lobe experiences little inflation and generally lower than average 771
areal spreading rates. At 28 minutes, the rate of volume change gradually decreases as the 772
active flow front begins to exit the field of view of the stereo-cameras. (b) Areal coverage 773

39
rate (mean 0.33 ± 0.23 m2/minute, filled black circles with solid black line) and mean 774
excess volume change (0.23 ± 0.12 m3/minute, open circles with broken line), where 775
excess volume change is defined in the text. Excess volume changes less than zero, 776
between 20–23 minutes, implies that areal growth was accommodated by depletion of 777
stored lava during this time interval. The areal coverage rate shows a periodicity with 778
peaks at intervals of 4.13 ± 0.64 minutes. All uncertainties are reported at 1 σ. 779
40
780
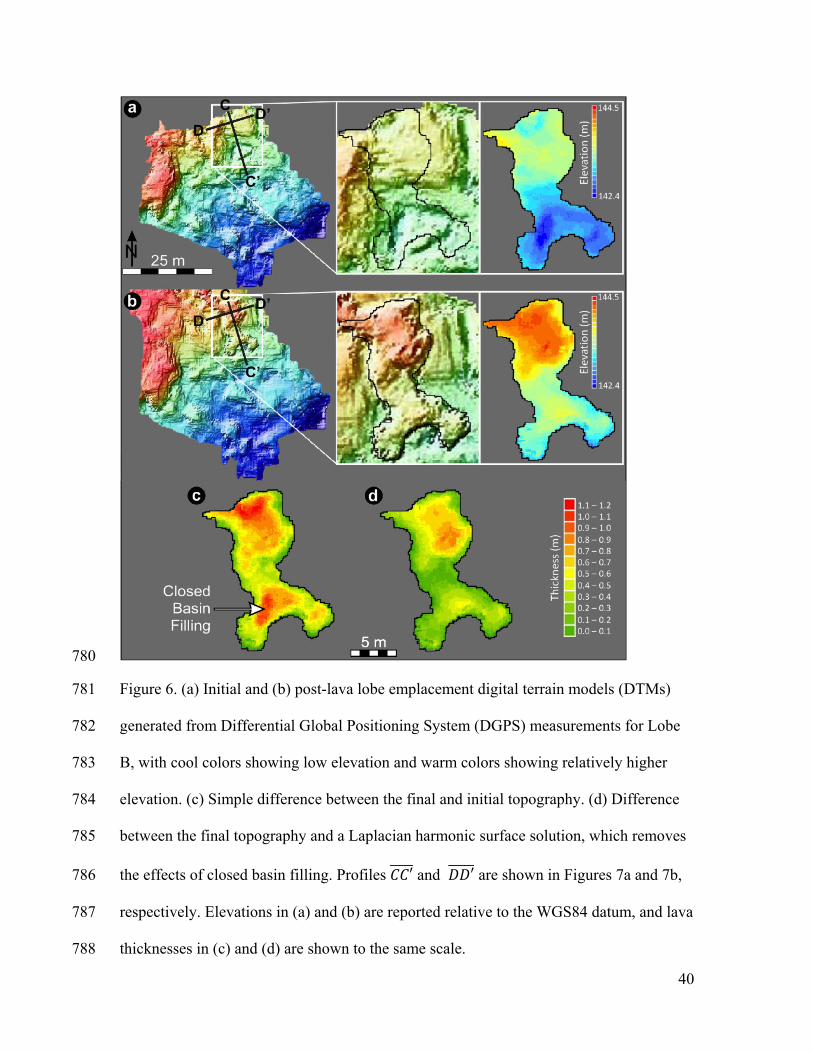
Figure 6. (a) Initial and (b) post-lava lobe emplacement digital terrain models (DTMs) 781
generated from Differential Global Positioning System (DGPS) measurements for Lobe 782
B, with cool colors showing low elevation and warm colors showing relatively higher 783
elevation. (c) Simple difference between the final and initial topography. (d) Difference 784
between the final topography and a Laplacian harmonic surface solution, which removes 785
the effects of closed basin filling. Profiles ′ and ′ are shown in Figures 7a and 7b, 786
respectively. Elevations in (a) and (b) are reported relative to the WGS84 datum, and lava 787
thicknesses in (c) and (d) are shown to the same scale. 788
41
789
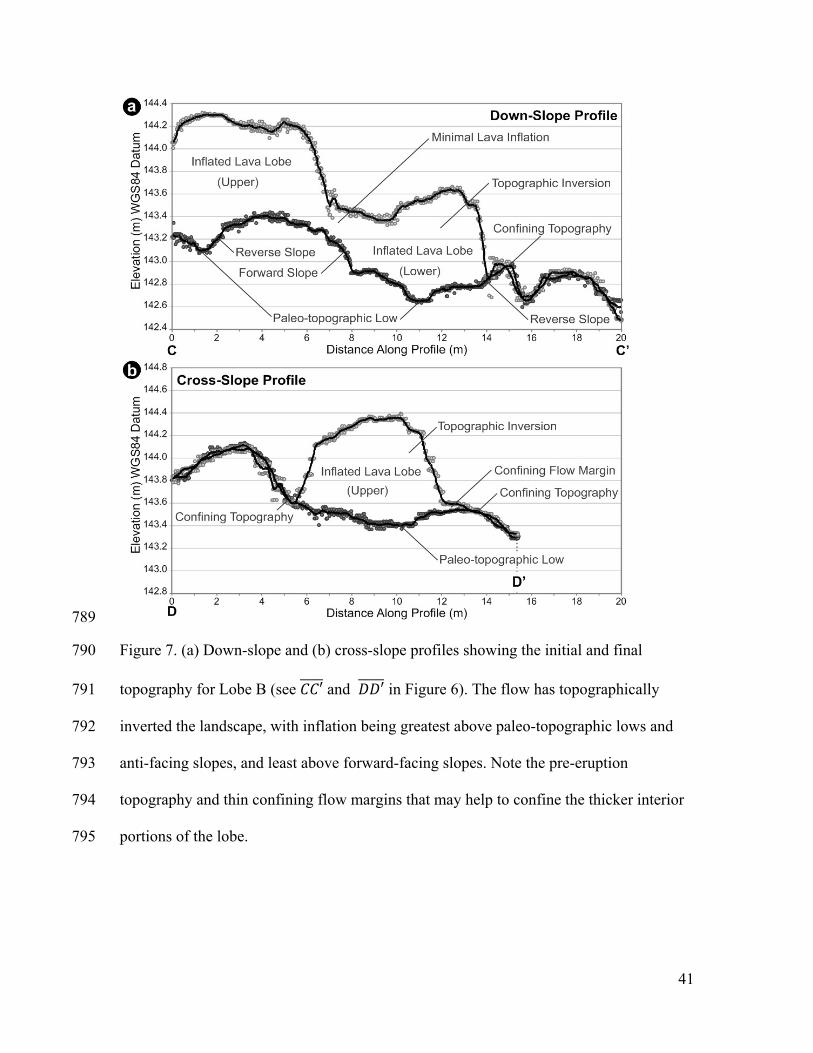
Figure 7. (a) Down-slope and (b) cross-slope profiles showing the initial and final 790
topography for Lobe B (see ′ and ′ in Figure 6). The flow has topographically 791
inverted the landscape, with inflation being greatest above paleo-topographic lows and 792
anti-facing slopes, and least above forward-facing slopes. Note the pre-eruption 793
topography and thin confining flow margins that may help to confine the thicker interior 794
portions of the lobe. 795
42
796
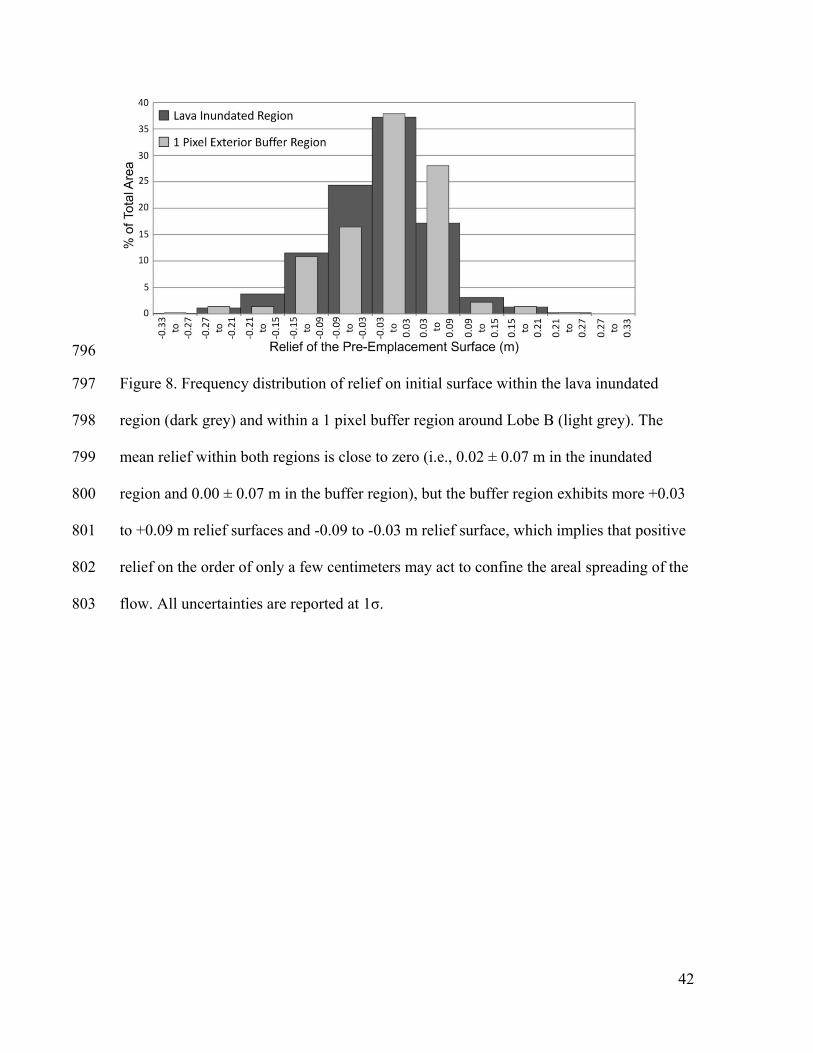
Figure 8. Frequency distribution of relief on initial surface within the lava inundated 797
region (dark grey) and within a 1 pixel buffer region around Lobe B (light grey). The 798
mean relief within both regions is close to zero (i.e., 0.02 ± 0.07 m in the inundated 799
region and 0.00 ± 0.07 m in the buffer region), but the buffer region exhibits more +0.03 800
to +0.09 m relief surfaces and -0.09 to -0.03 m relief surface, which implies that positive 801
relief on the order of only a few centimeters may act to confine the areal spreading of the 802
flow. All uncertainties are reported at 1σ. 803
43
804
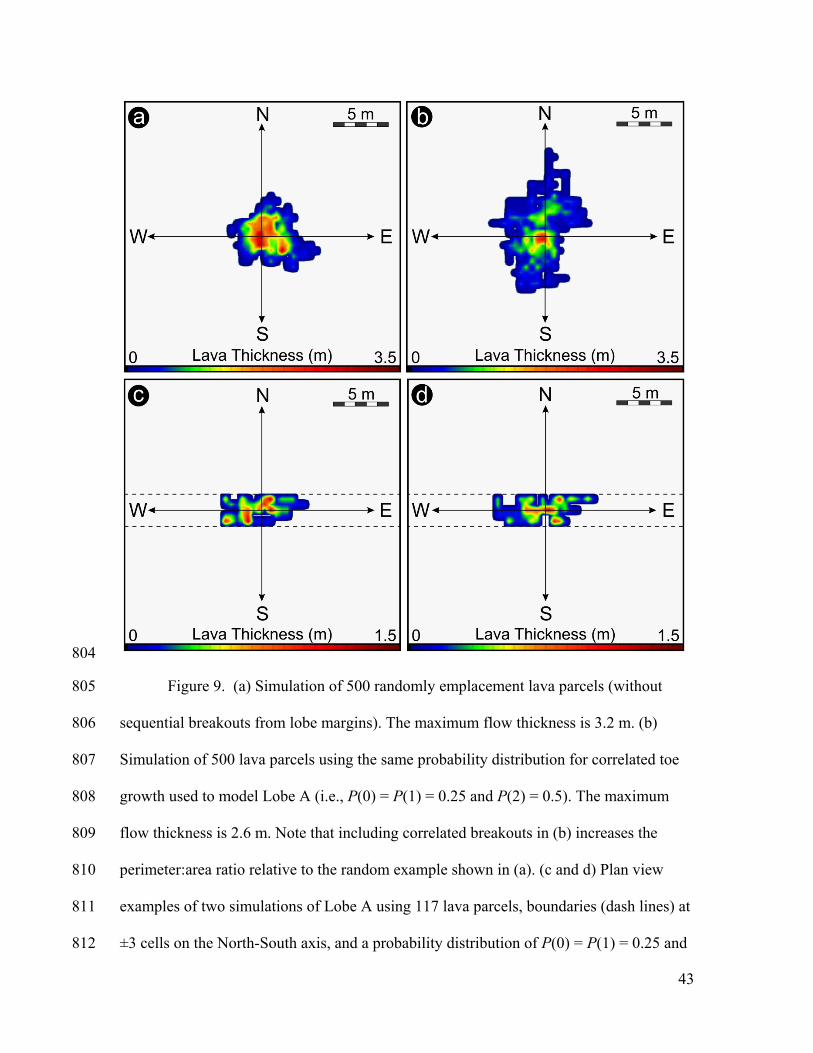
Figure 9. (a) Simulation of 500 randomly emplacement lava parcels (without 805
sequential breakouts from lobe margins). The maximum flow thickness is 3.2 m. (b) 806
Simulation of 500 lava parcels using the same probability distribution for correlated toe 807
growth used to model Lobe A (i.e., P(0) = P(1) = 0.25 and P(2) = 0.5). The maximum 808
flow thickness is 2.6 m. Note that including correlated breakouts in (b) increases the 809
perimeter:area ratio relative to the random example shown in (a). (c and d) Plan view 810
examples of two simulations of Lobe A using 117 lava parcels, boundaries (dash lines) at 811
±3 cells on the North-South axis, and a probability distribution of P(0) = P(1) = 0.25 and 812

44
P(2) = 0.5 for adding 0, 1, and 2 extra parcels in the same direction when a parcel breaks 813
out from the flow margin. The maximum height of the flows shown in (c) and (d) are 1.2 814
m. For visualization purposes, the REBIN function in Interactive Data Language (IDL) 815
was used to magnify the cells by a factor of 10 and perform a default bilinear 816
interpolation. This process smoothes the model output and provides the exterior toes with 817
a rounded appearance. This process does not alter the raw model output shown in Figures 818
10 or 11b. 819
45
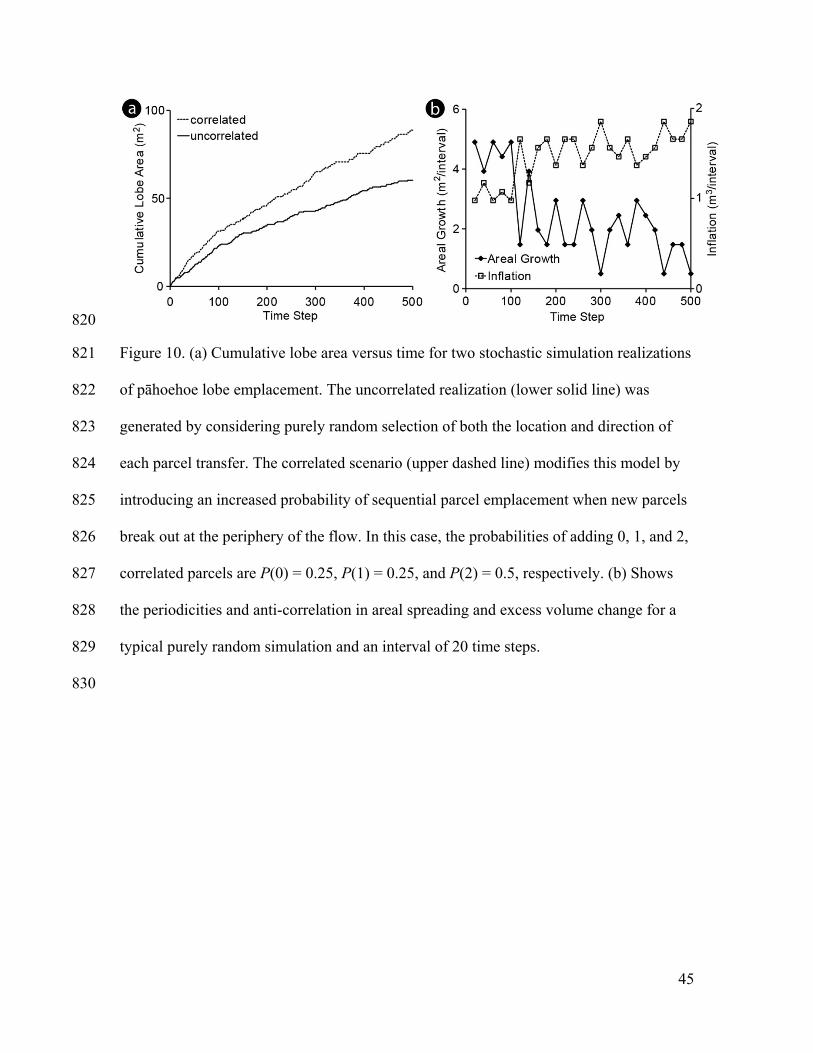
820
Figure 10. (a) Cumulative lobe area versus time for two stochastic simulation realizations 821
of pāhoehoe lobe emplacement. The uncorrelated realization (lower solid line) was 822
generated by considering purely random selection of both the location and direction of 823
each parcel transfer. The correlated scenario (upper dashed line) modifies this model by 824
introducing an increased probability of sequential parcel emplacement when new parcels 825
break out at the periphery of the flow. In this case, the probabilities of adding 0, 1, and 2, 826
correlated parcels are P(0) = 0.25, P(1) = 0.25, and P(2) = 0.5, respectively. (b) Shows 827
the periodicities and anti-correlation in areal spreading and excess volume change for a 828
typical purely random simulation and an interval of 20 time steps. 829
830
46
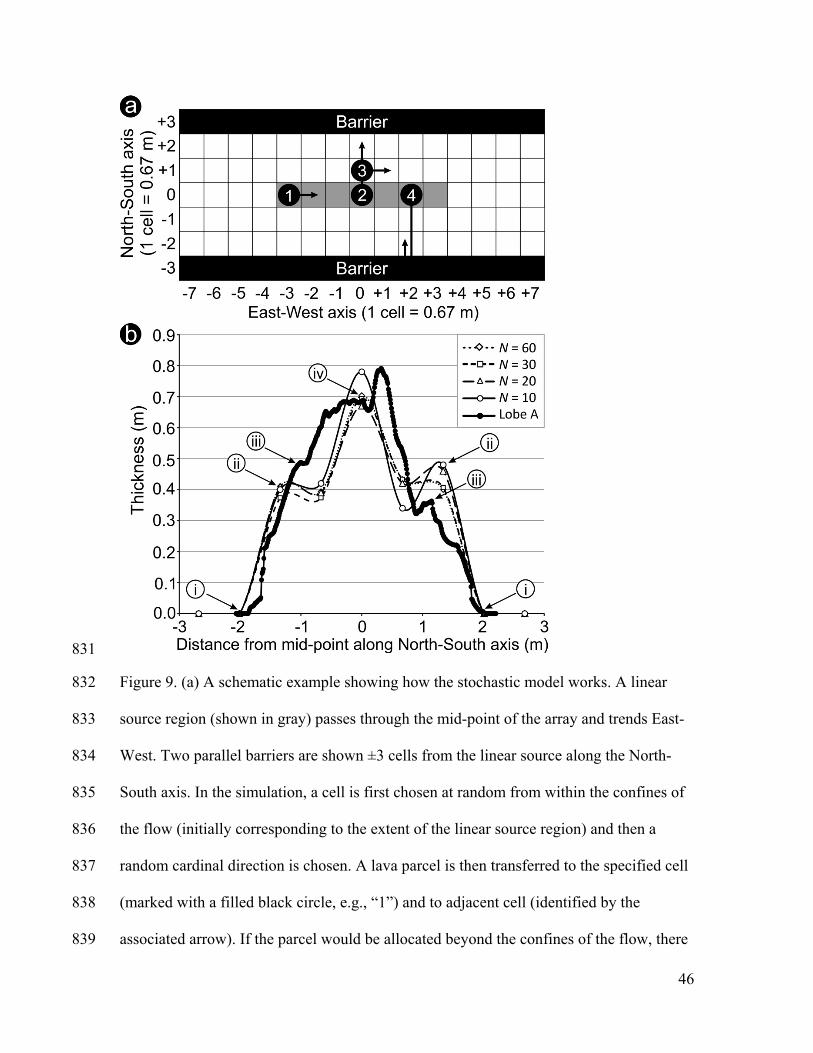
831
Figure 9. (a) A schematic example showing how the stochastic model works. A linear 832
source region (shown in gray) passes through the mid-point of the array and trends East-833
West. Two parallel barriers are shown ±3 cells from the linear source along the North-834
South axis. In the simulation, a cell is first chosen at random from within the confines of 835
the flow (initially corresponding to the extent of the linear source region) and then a 836
random cardinal direction is chosen. A lava parcel is then transferred to the specified cell 837
(marked with a filled black circle, e.g., “1”) and to adjacent cell (identified by the 838
associated arrow). If the parcel would be allocated beyond the confines of the flow, there 839

47
is a 0.25, 0.25, and 0.50 probability that 0, 1, or 2 extra parcels, respectively, will be 840
allocated to sequential cells in the same direction (e.g., “2” shows 1 extra, 2 total, cells 841
being added). As the areal extent of the flow increases, new parcel transfer locations 842
become available (e.g., “3”). If a cell allocation would result in a parcel being extended 843
beyond the barrier, then the parcel is reflected back towards the cell interior (e.g., “4”). 844
Each parcel allocated to a given cell increases its thickness by 0.2 m. This process is 845
repeated until all lava parcels are allocated, which in the case of Lobe A, includes a total 846
of 117 parcels. (b) Simulated North-South profiles for Lobe A, averaged over 10, 20, 30, 847
and 40 realizations of the model. The results show that despite the stochastic nature of the 848
model, the average simulations converge to a stable equilibrium shape over a few tens of 849
realizations. Also shown is the flow-perpendicular cross-section though Lobe A (Fig. 4b) 850
with the underlying topographic trend removed. “i”: The maximum width simulated lobes 851
and Lobe A are determined by the influences of topographic barriers. “ii”: Reflecting of 852
lava parcels by the barriers produces an excess thickening in the adjacent interior cells. 853
“iii”: High-standing topography and stagnated peripheral toes helps to confine the interior 854
of the lobe and promote inflation. “iv”: The thickest portion of the simulated lobe is 855
located along the medial axis and is generally consistent with the thickness of Lobe A 856
along the flow axis. 857