Embed Size (px)
Citation preview
\OZONE TREATMENT OF A SELECTED
TEXTILE DYEING AND FINISHING WASTEWATER;
by
Daniel Bruce ,,Horne
Thesis submitted to the Graduate Faculty of the
Virginia Polytechnic Institute and State University
in partial fulfillment of the requirements for the degree of
MASTER OF SCIENCE
in
Sanitary Engineering
APPROVED:
Dr. Paul H. King, Chairman
Dr. Robert C. Hoehn Df': 'Clifford W. Randall
December, 1974
Blacksburg, Virginia
To the honor and glory of God:
And whatever you do in word or deed, do all in the Name of the Lord Jesus, giving thanks through Him to God the Father. Whatever you do, do your work heartily, as for the Lord rather than for men;
(Colossians 3:17, 23)
ii
ACKNOWLEDGEMENTS
The author wishes to express his deepest gratitude and appreciation
to his parents for their continued support and encouragement throughout
the period of his education.
In addition, he wishes to thank , major thesis
advisor, for his guidance, patience, and constructive criticism during
the performance of the research described herein and the preparation
of this text. He also expresses appreciation to
and , members of the author's graduate conunittee,
for their help and advice during the carrying out of research.
This study would have been impossible without the assistance of
and , of the Corning Glass Works plant
in Blacksburg, Virginia, who arranged for the manufacturing of the
reaction chamber.
The author also gives thanks to for his
assistance in the laboratory and to his fellow graduate students for
their help and friendship.
He also appreciates the efforts of , who typed this
thesis, and who offered invaluable aid at a critical
moment in the research.
The author was supported in part by the U.S. Environmental
Protection Agency during the time of his graduate study, in the form
of a Training Grant, T-900333-06.
Lastly, and possibly most importantly, the author is indebted to
his Christian brothers and sisters in Blacksburg, Radford, and elsewhere,
iii
iv
who supported him faithfully with prayer and encouragement during times
of both exultation and discouragement.
TABLE OF CONTENTS
ACKNOWLEDGEMENTS . . . . . . . . . . . . . LIST OF TABLES • . . . . . . . . . . . . . . . . . . . . LIST OF FIGURES . . . . . . . . . . . . . . . . . . . .
I. INTRODUCTION • . • . . . . . . . . . . . . . . II. LITERATURE REVIEW . . . . . . . . .
General Properties of Ozone . Ozone Kinetics • • • • . Applications of Ozone • • • • Decolorization of Effluents •
III. MATERIALS AND METHODS . . . . . . . . . . . . . .
IV.
Analytical Procedures • Experimental Procedures •
EXPERIMENTAL RESULTS . .. . . . . . . . . Batch Condition • . • • • • • • . Continuous Flow Conditions
. . . . . . . .
V. DISCUSSION •••• . . . . . . . . . . . . . . . . . Ozone Determination • Solids and Turbidity pH . . • • • Dissolved Oxygen BOD5 . . • • • • • • • • COD and TOC Removal • • • • • • • Color Removal • • • • •
VI. CONCLUSIONS AND RECOMMENDATIONS
BIBLIOGRAPHY
VITA .• . . . . . . . . . . . . . . . . . . . . . . . . ABSTRACT
v
page
iii
vi
vii
1
4
4 6 9
16
23
23 25
30
30 37
47
47 48 48 49 50 50 51
53
56
59
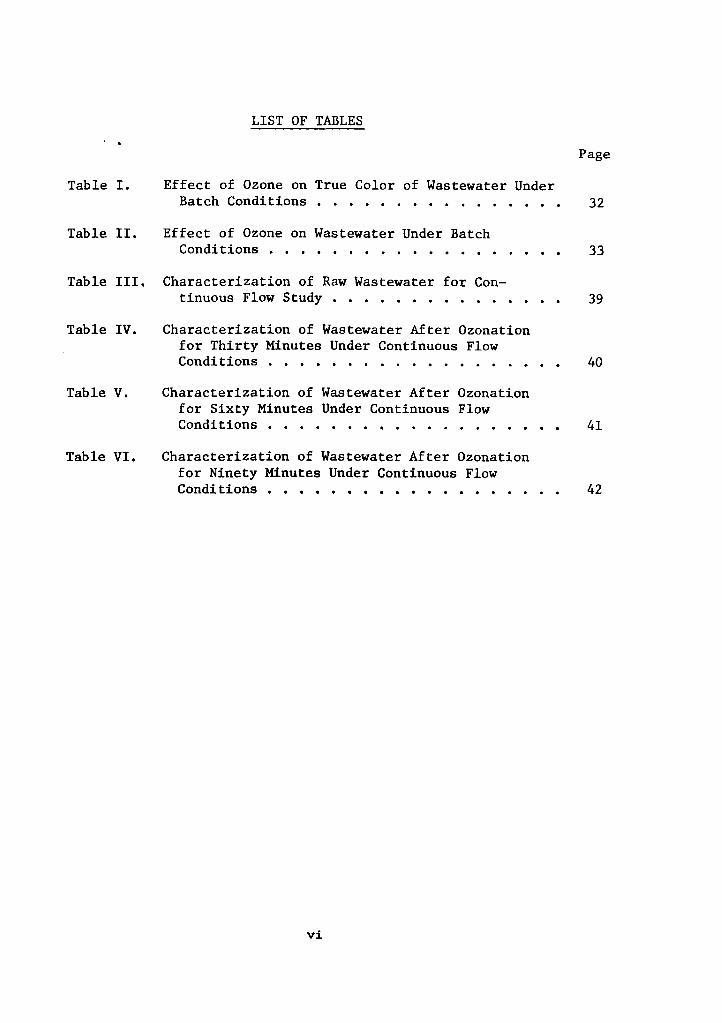
Table I.
Table II.
LIST OF TABLES
Effect of Ozone on True Color of Wastewater Under Batch Conditions • • • • • • • • • . • • • • • •
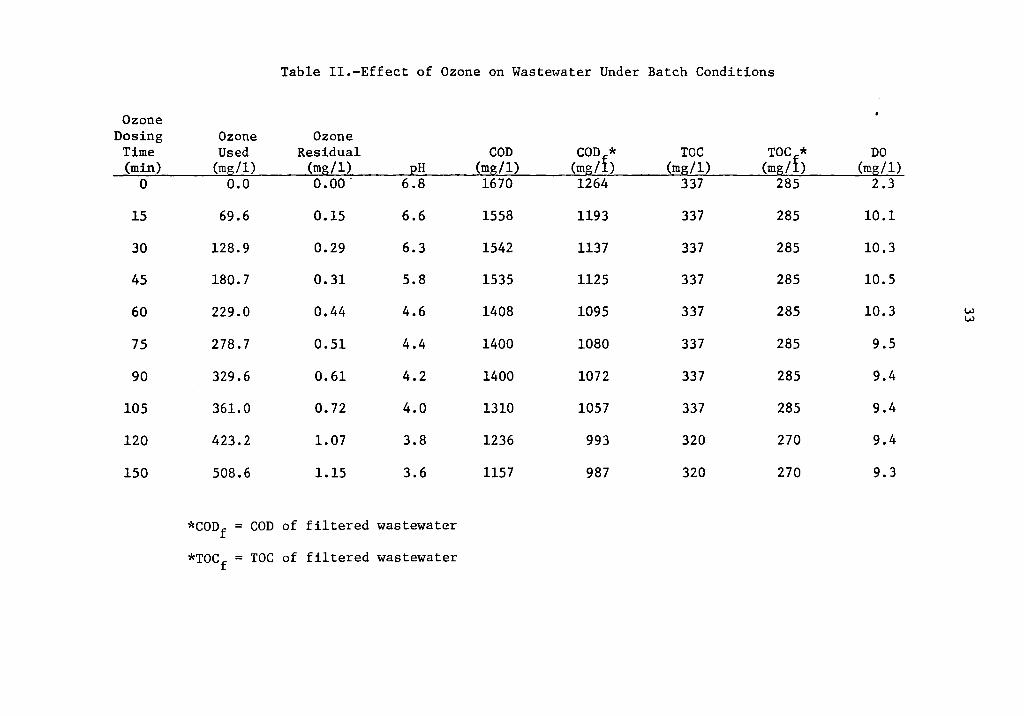
Effect of Ozone on Wastewater Under Batch Conditions • •
Page
32
33
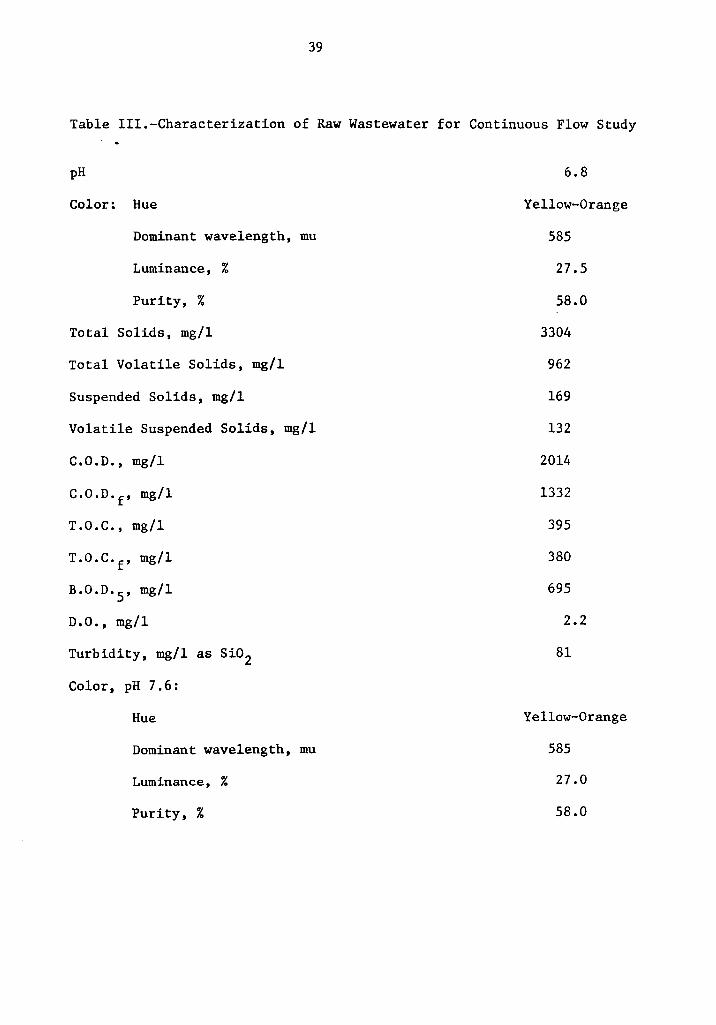
Table III. Characterization of Raw Wastewater for Con-tinuous Flow Study • . • • • 39
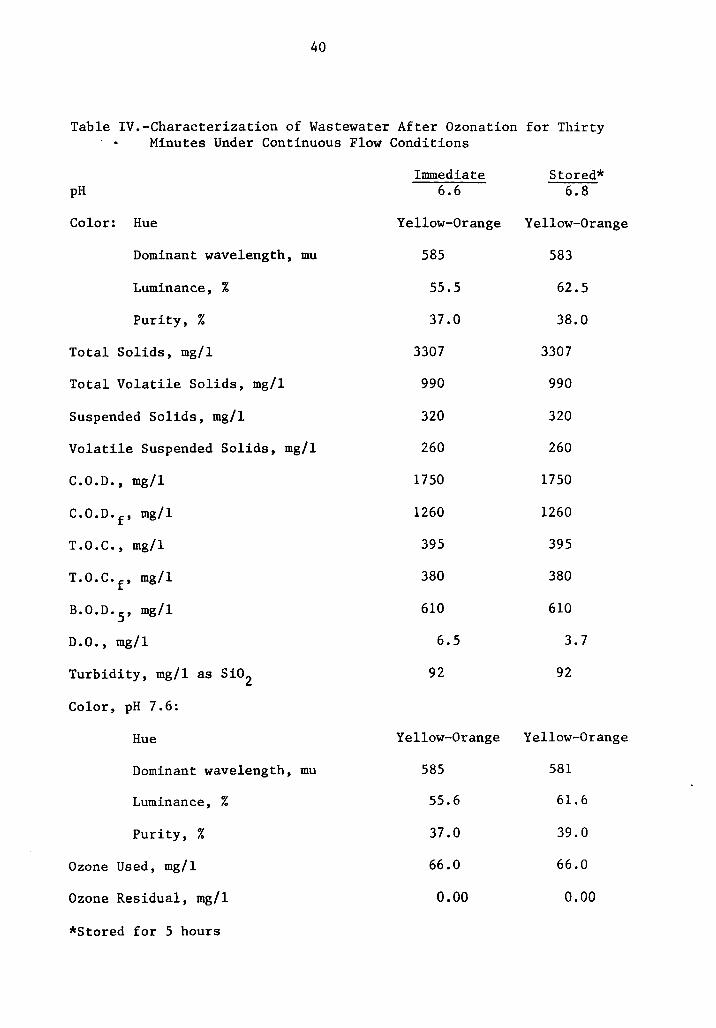
Table IV. Characterization of Wastewater After Ozonation for Thirty Minutes Under Continuous Flow Conditions • • • • • • . . . • • • . • 40
Table V. Characterization of Wastewater After Ozonation
Table VI.
for Sixty Minutes Under Continuous Flow Conditions • • • • • • • • • • . • • • 41
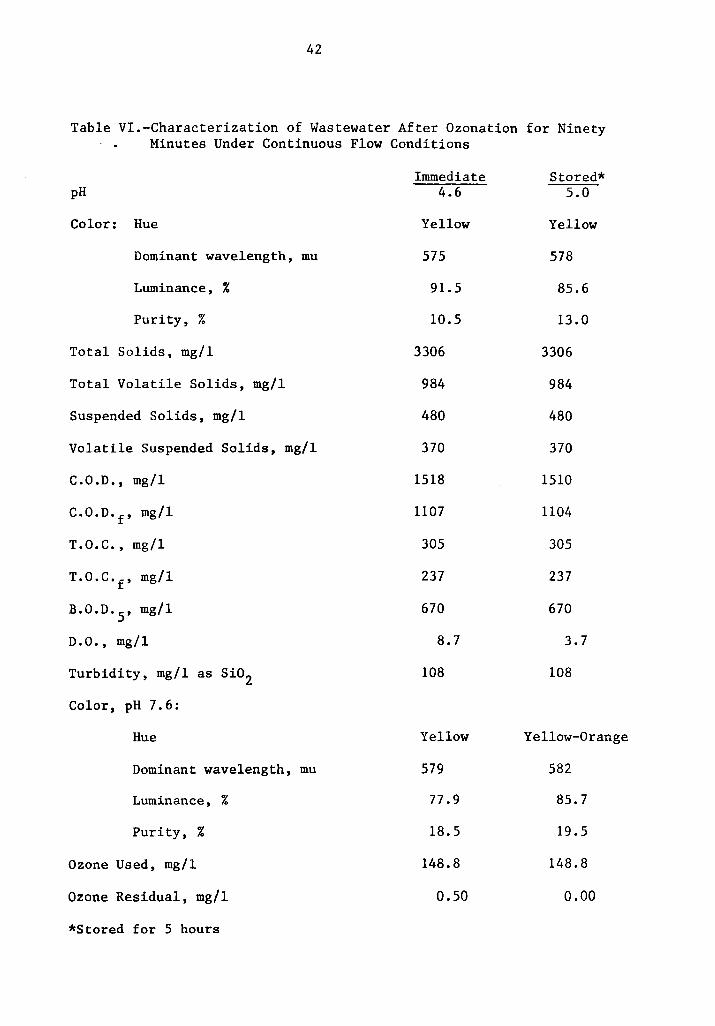
Characterization of Wastewater After Ozonation for Ninety Minutes Under Continuous Flow Conditions • • • • • • • • • • • • • • • • • 42
vi
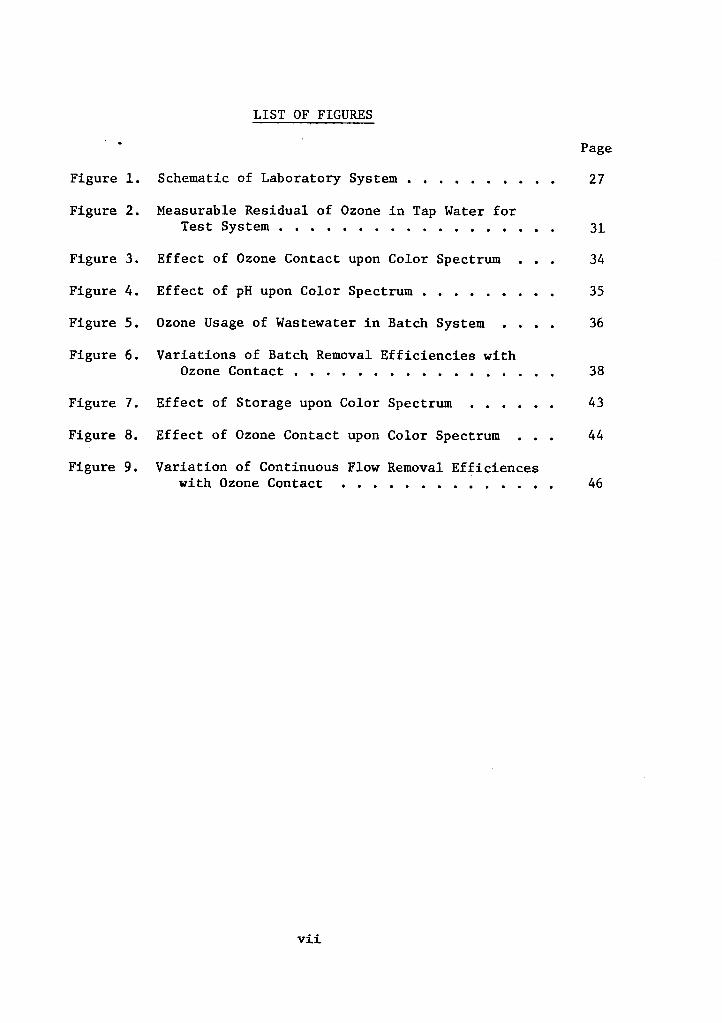
LIST OF FIGURES
Page
Figure 1. Schematic of Laboratory System • . . . . . . . 27
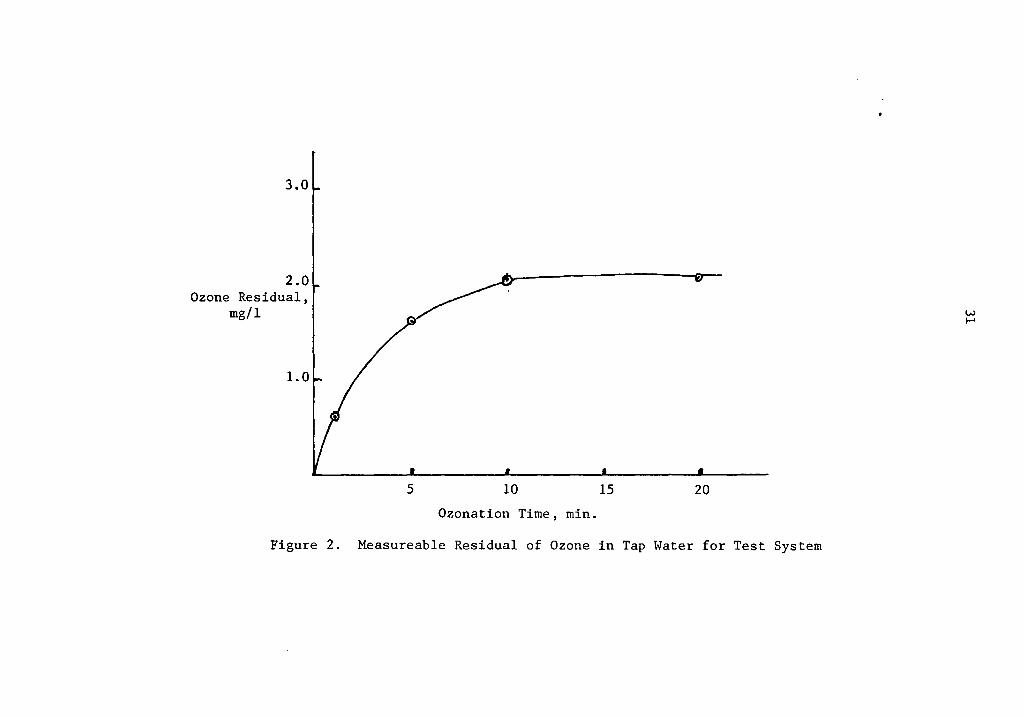
Figure 2. Measurable Residual of Ozone in Tap Water for Test System . . . . . . . . . 31
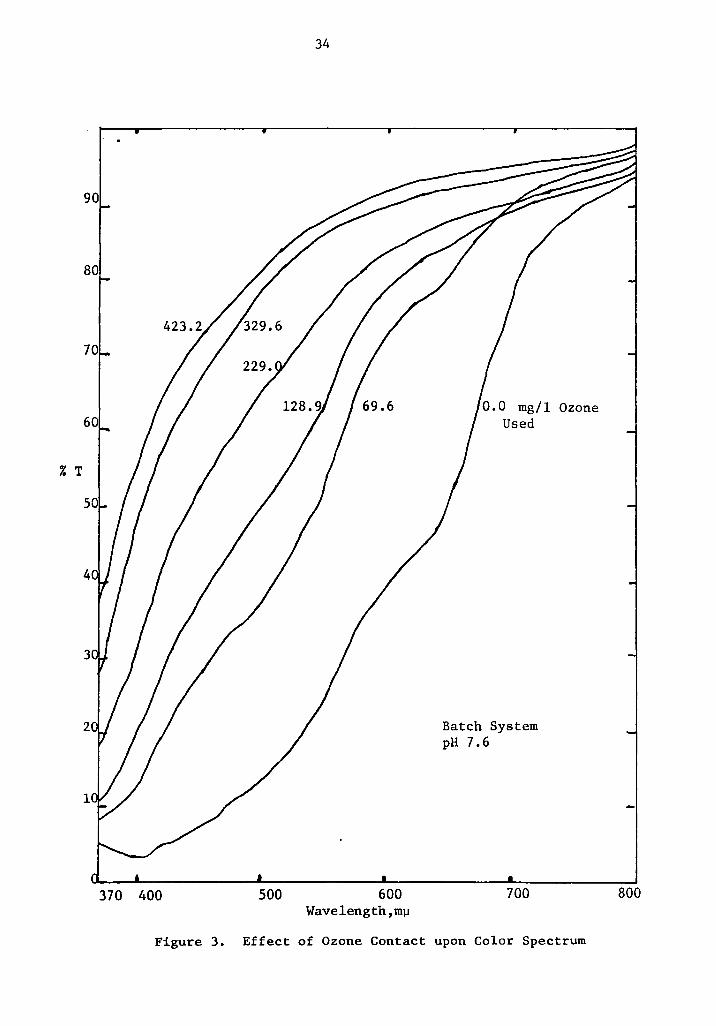
Figure 3. Effect of Ozone Contact upon Color Spectrum 34
Figure 4. Effect of pH upon Color Spectrum • . . . . . 35
Figure 5. Ozone Usage of Wastewater in Batch System . . . . 36
Figure 6. Variations of Batch Removal Efficiencies with Ozone Contact . . . . . . . . . 38
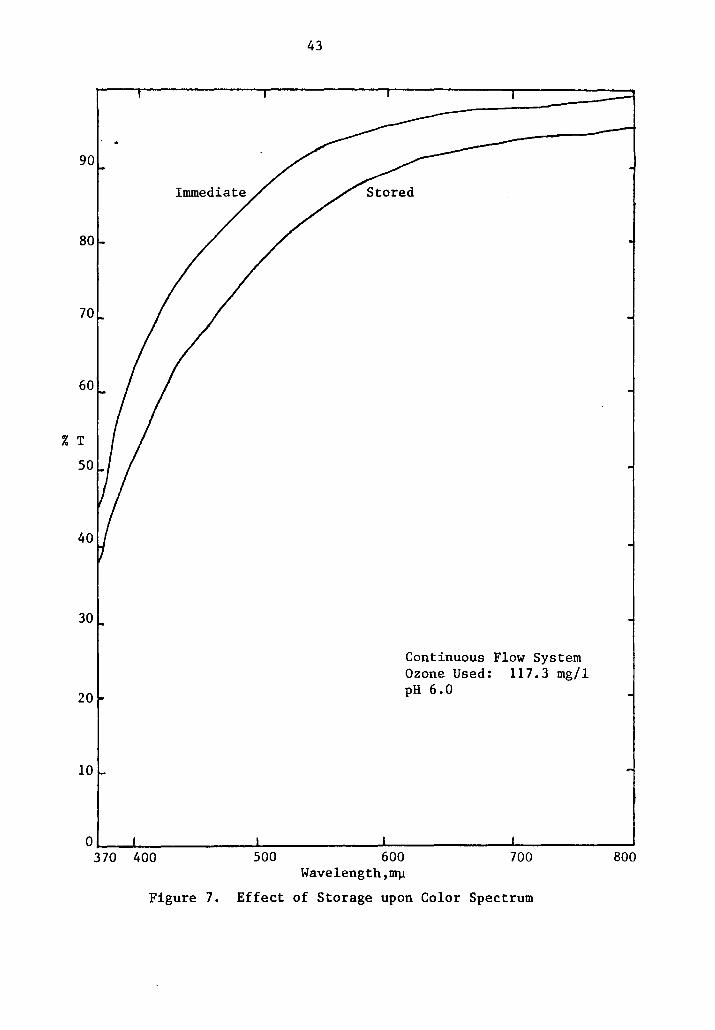
Figure 7. Effect of Storage upon Color Spectrum . . . . 43
Figure 8. Effect of Ozone Contact upon Color Spectrum 44
Figure 9. Variation of Continuous Flow Removal Efficiences with Ozone Contact . . . . . . . . . . . 46
vii
I. INTRODUCTION
Water is considered today to be one of man's most precious
resources, used in nearly every process known to civilization. The
quality of the available water greatly affects its suitability for
intended purposes. Water quality is degraded easily largely due
to its strong solvent properties. As a result of these properties,
many contaminants enter into solution in the water with each use
and re-use. Industrial processes in general are known for their
additions of contaminants to water. The textile dyeing industry,
in particular, adds large quantities of solids, BOD, COD, phosphates,
and heavy metals to the water used in its processes. In addition,
the dyes and coloring agents used in the dyeing processes pass
through the process equipment and cause color in the wastewater
effluents. Even at high dilutions, these solutions are highly
colored, and textile dyeing plants whose effluents flow into
streams of low flow are finding that color itself is a pollution
problem.
In the earlier days of untreated effluents, color was used
as an indicator of the potential of a wastewater for killing fish.
Water research showed that the effects of a waste on aquatic fauna
were primarily due to oxygen depletion, rather than to chemical
toxicity, and waste treatment systems were developed to alleviate
the problem of deoxygenation. Conventional treatment systems
included primary treatment for the removal of settleable solids
1
2
and secondary treatment for biological oxidation of organic matter
in the effluent. These conventional systems have had conspicuous
success in removing the materials in an effluent which are responsible
for oxygen depletion, as witnessed by the growing infrequency of
fish kills.
A major remaining problem with dyeing operation effluents
involves the removal of the waste fraction of the effluents which
is responsible for color. Biological oxidation has had virtually
no effect on the color of these effluents, as the color-producing
components are largely biologically refractive. The compounds have
not generally been found to be toxic to fish species, at least in
normal effluent concentrations. However, high color in effluents
is meeting increased criticism on several grounds: 1) by reducing
sunlight penetration, color might inhibit the growth of desirable
aquatic plant life; 2) while not toxic to fish, colored components
might be toxic to some of the lower organisms in the aquatic
ecosphere; 3) at some point downstream, colored wastewater may
become part of a municipal supply.system, where color removal may
become troublesome; 4) regulatory bodies at all levels are becoming
less tolerant of any organic materials in an effluent; and 5) estheti-
cally, strong color in a water is inconsistent with present public
attitudes. Since pressure on dyers to remove color from their
effluents is increasing, effective methods of doing so must be found.
The research described in this thesis consisted of an investi-
gation of the suitability of a system which used ozone as a chemical

3
oxidant for removing color from a textile dye waste. The purpose of
this investigation was to evaluate the feasibility of using ozone to
achieve a high degree of color removal. In addition, the effect of
ozone on several waste constituent parameters was studied. The waste
chosen for this study was the dyehouse effluent of the Martin Process-
ing Company plant located in Rocky Mount, Virginia.
II • LITERATURE REVIEW
Ozone was first noticed by Van Marum in 1785 as a result of
a pungent odor in the vicinity of an electrical machine (9).
Cruickshank noted the occurrence of the same smell during the
electrolysis of water in 1801. Schonbein attributed the odor to a
new chemical substance in 1840, and proposed the name ozone, deriving
it from the Greek word "ozein," which means "to smell" (21). The
tri-atomic oxygen formula was established in 1867.
General Properties of Ozone
Physical properties. Ozone is the tri-atomic form (03 , molecular
weight 48) of oxygen. Unlike normal molecular oxygen, ozone has a
characteristic pungent odor, detectable in concentrations as low
as 1 part per million (16). It is colorless at room temperatures,
and condenses to a dark blue liquid at -112°c. Liquid ozone is
easily exploded, as are concentrations of ozone in air-oxygen
mixtures greater than 30 percent.
Ozone strongly absorbs light in the infrared, visible, and
ultraviolet spectrums at several specific wavelengths, with an
absorption maximum measured at 2537 angstroms (16). This character-
istic makes the use of spectrophotometric methods of measuring ozone
concentrations in the atmosphere and the laboratory very convenient.
The ozone molecule, after studying its microwave spectrum, is
found to be diamagnetic, with an obtuse angle of 116°49', and with
oxygen-oxygen bonds of equal length of 1.278 angstroms, possessing
a dipole moment of 0.49-0.58 debye (2). The molecular configuration
4
5
can best be described as a resonance hybrid, with four forms possible.
As a result, an ozone molecule does not behave as a radical, but
as a 1,3-dipole (2).
Ozone is much more soluble in water than is oxygen, but due to
its much lower available partial pressure, it is very difficult to
obtain a concentration much higher than a few parts per million
under normal atmospheric and operating conditions of temperature
and pressure (16). Regular di-atomic oxygen is soluble in distilled 0 water up to 8.92 ppm at 25 C, while ozone is theoretically soluble
up to 500-600 ppm at the same temperature. This theoretical con-
centration is rarely, if ever, reached. Determination of actual
concentrations from theoretical concentrations involves many
complicated calculations (24). The need for and use of these
calculations has been eliminated by the development of a physical
relationship between concentrations of ozone in air and water, as
expressed by the distribution co-efficient,
A s:: -B
where A is the concentration of ozone in water at a given temperature
and pressure, and B is the concentration of ozone in air under the
same conditions. In many cases, however, it is the amount of
organics present in water that will determine the quantity of ozone
dissolved in the water, rather than the distribution co-efficient.
Chemical properties. Ozone gas is a powerful oxidizing agent,
possessing an electronegative oxidation potential of -2.07 mv at
25°C (16). This value is exceeded only by fluorine, nascent oxygen,
6
and F2o, and is approximately double that of the OCl ion. Such a
high electronegativity makes ozone a very versatile, highly reactive
oxidant. This activity is even more valuable, as ozone retains this
oxidative power in aqueous solution, attacking nearly all organics and
most metals, except gold and platinum. This strong oxidative power
could possibly be a drawback, were it not for another of ozone's
properties, that of its relatively rapid breakdown, with a half-life
of approximately 15 minutes in dry air. The decomposition of ozone
is even more rapid in the presence of water, and the half-life may
be as low as 9 minutes in an aqueous solution. Several substances
may act as a catalyst to further increase the decomposition rate,
including sodium hydroxide, soda ash, lime, halogens and halides,
silver, platinum, manganese dioxide, and nitrogen pentoxide (16).
The decomposition of ozone, and the effects of its breakdown products
on both organics and inorganics in water, is extremely important in
understanding the usefulness of ozonation as a water and wastewater
treatment process.
Ozone Kinetics
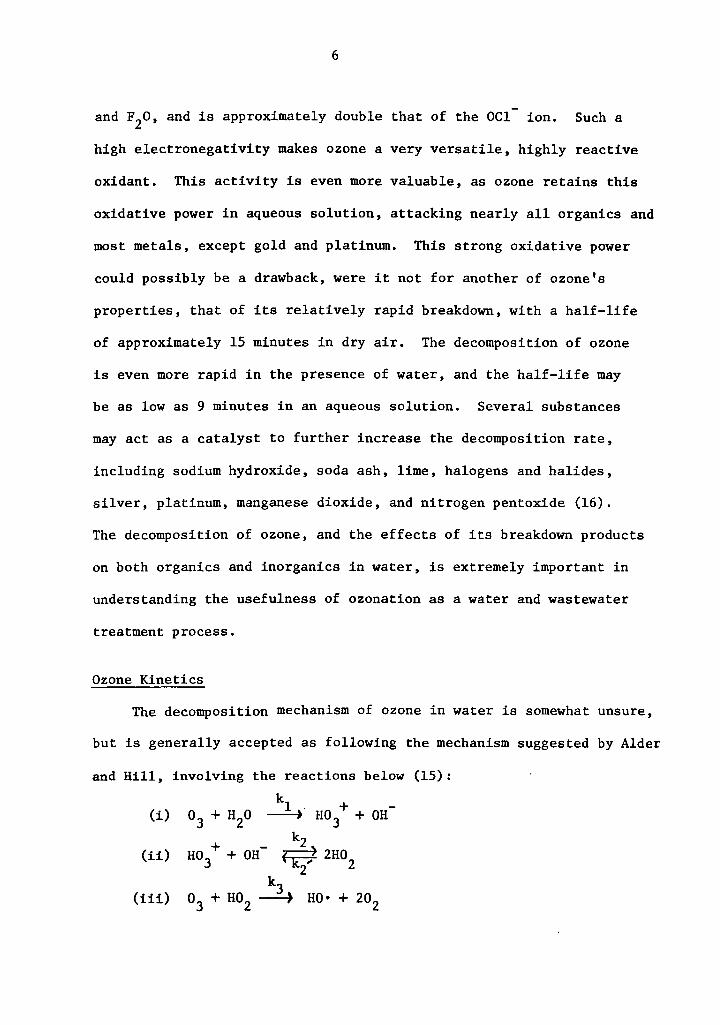
The decomposition mechanism of ozone in water is somewhat unsure,
but is generally accepted as following the mechanism suggested by Alder
and Hill, involving the reactions below (15): k
(i) o3 + H20 ~·HO+ -3 + OH
HO++ - kz (ii) OH ( k} 2HO 3 2 2
(iii) o3 + H02 k3 ~ HO• + 202
7
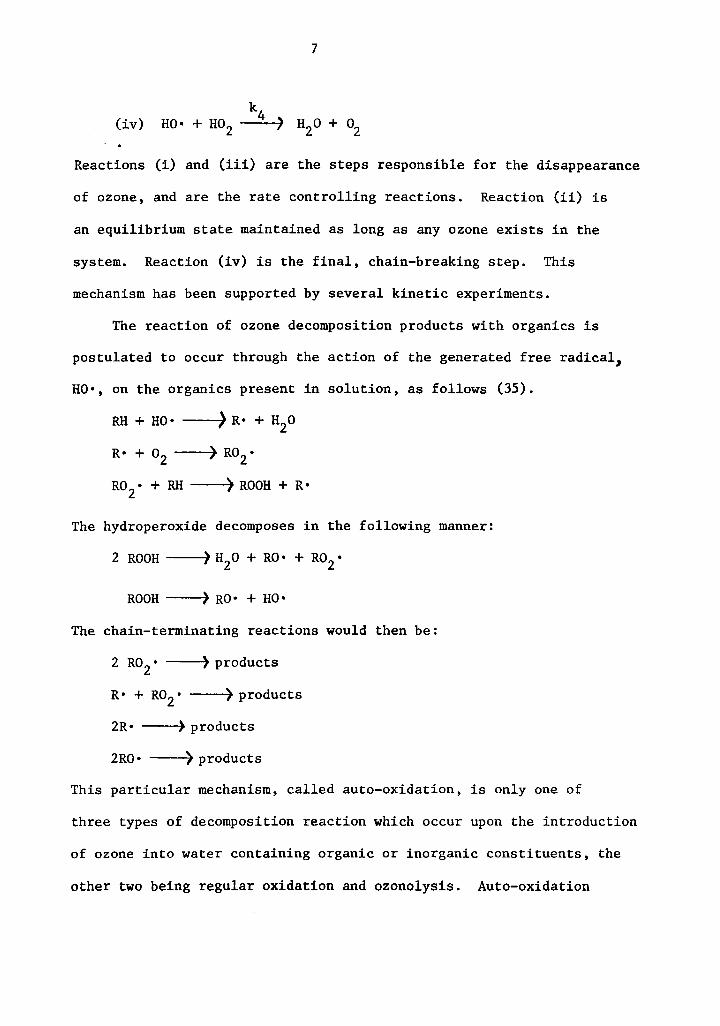
(iv)
Reactions (i) and (iii) are the steps responsible for the disappearance
of ozone, and are the rate controlling reactions. Reaction (ii) is
an equilibrium state maintained as long as any ozone exists in the
system. Reaction (iv) is the final, chain-breaking step. This
mechanism has been supported by several kinetic experiments.
The reaction of ozone decomposition products with organics is
postulated to occur through the action of the generated free radical,
HO•, on the organics present in solution, as follows (35).
RH + HO• -~) R• + H20
R• + o2 ) R02 •
R02 • + RH ----.) ROOH + R•
The hydroperoxide decomposes in the following manner:
ROOH --...) RO• + HO•
The chain-terminating reactions would then be:
2 R02 • ) products
R• + R02 • ) products
2R • ) products
2RO • ) products
This particular mechanism, called auto-oxidation, is only one of
three types of decomposition reaction which occur upon the introduction
of ozone into water containing organic or inorganic constituents, the
other two being regular oxidation and ozonolysis. Auto-oxidation
8
is an enhancing action by ozone on the oxidizing capacity of ozygen.
The. products of this type of action may be greatly different than
those of a pure ozone reaction.
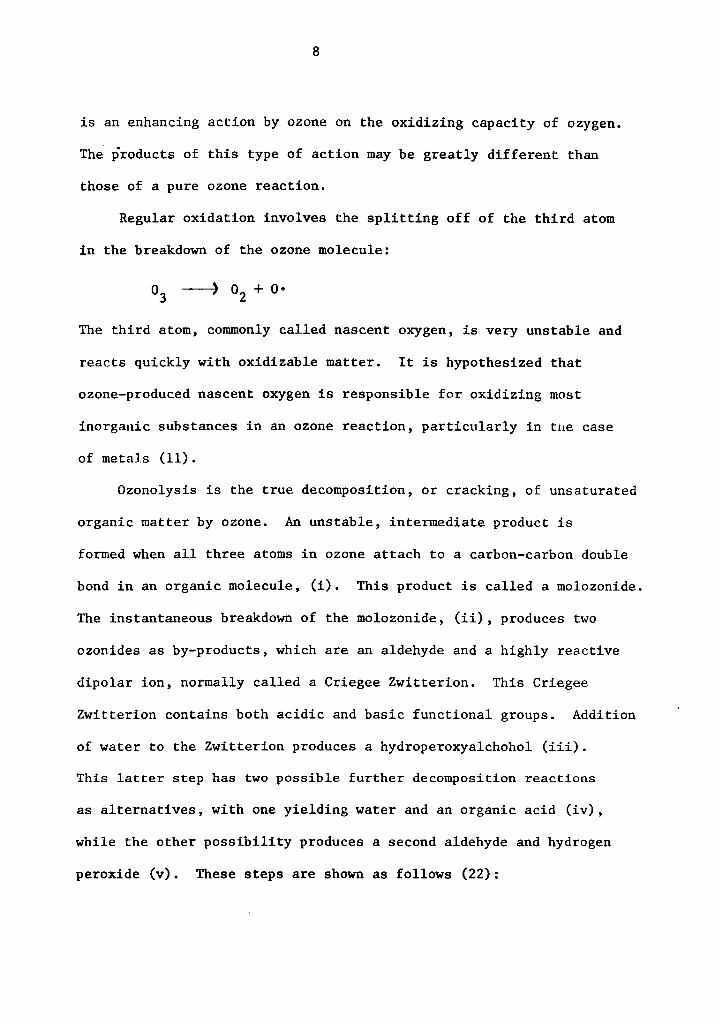
Regular oxidation involves the splitting off of the third atom
in the breakdown of the ozone molecule:
The third atom, commonly called nascent oxygen, is very unstable and
reacts quickly with oxidizable matter. It is hypothesized that
ozone-produced nascent oxygen is responsible for oxidizing most
inorganic substances in an ozone reaction, particularly in tue case
of metals (11).
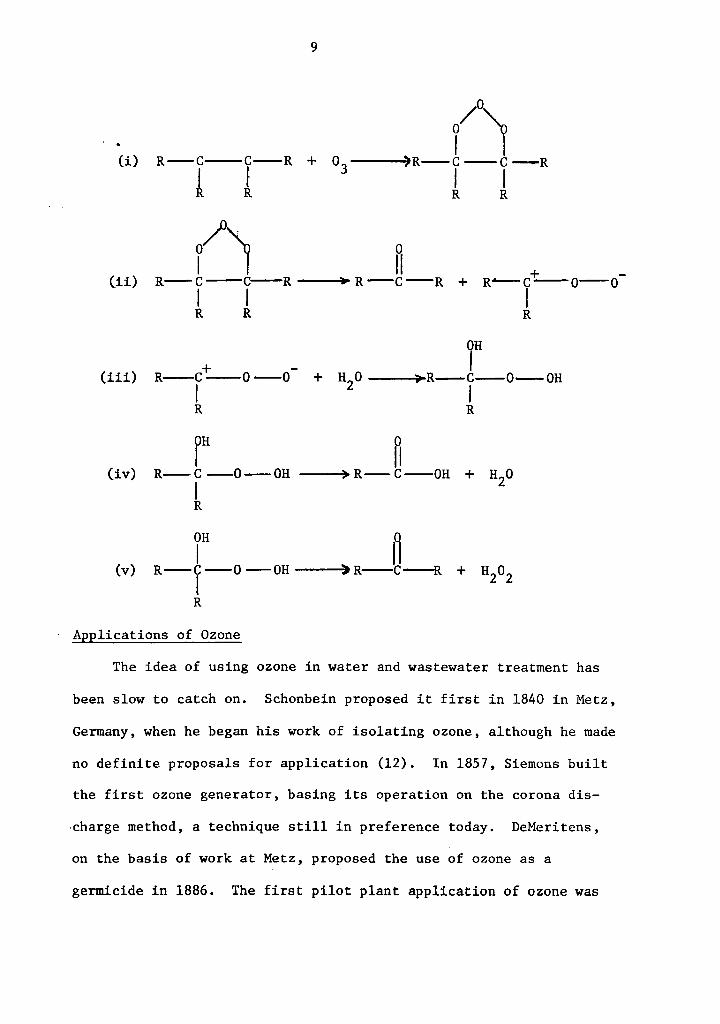
Ozonolysis is the true decomposition, or cracking, of unsaturated
organic matter by ozone. An unstable, intermediate product is
formed when all three atoms in ozone attach to a carbon-carbon double
bond in an organic molecule, (i). This product is called a molozonide.
The instantaneous breakdown of the molozonide, (ii), produces two
ozonides as by-products, which are an aldehyde and a highly reactive
dipolar ion, normally called a Criegee Zwitterion. This Criegee
Zwitterion contains both acidic and basic functional groups. Addition
of water to the Zwitterion produces a hydroperoxyalchohol (iii).
This latter step has two possible further decomposition reactions
as alternatives, with one yielding water and an organic acid (iv),
while the other possibility produces a second aldehyde and hydrogen
peroxide (v). These steps are shown as follows (22):
9
1'1 (i) R-C--C--R + 03 )R-c-c-R
I f I I R R R R
n Ii + -(ii) R--C--C--R R-C--R + R.....__c-o--o
I I I R R R
+ -IH
(iii) R--c--o-o + H20 >R-C--0-0H I I R R
IH
(iv) R-C -0-0H I R
(v)
Applications of Ozone
The idea of using ozone in water and wastewater treatment has
been slow to catch on. Schonbein proposed it first in 1840 in Metz,
Germany, when he began his work of isolating ozone, although he made
no definite proposals for application (12). In 1857, Siemons built
the first ozone generator, basing its operation on the corona dis-
·charge method, a technique still in preference today. DeMeritens,
on the basis of work at Metz, proposed the use of ozone as a
germicide in 1886. The first pilot plant application of ozone was
10
in Paderborn, Germany, in 1891, utilizing a system designed by
Frolich (12). Schneller, Van der Sleen, and Tindal constructed
the first industrial apparatus for ozone sterilization of water in
Oudshoorn, Holland in 1893 (9). The plant followed up sedimentation
and filtration with ozonation, and treated raw water from the Rhine
River. Weisbaden, Germany, put the first full-scale municipal
ozonation plant into operation in 1896 (12). Otto-ozone equipment
was used at Nice, France, in the first major ozone disinfection
plant which involved treatment of more than one million gallons
per day (9). The degree of success at Nice led quickly to the
construction of similar installations throughout Europe. The growth
of ozone use stopped abruptly with the advent of World War I, but
increased rapidly again after the war ended. Today, there are more
than 1000 ozone disinfection installations in 50 countries around
the world. Ozone is the method of choice for disinfection of water
in continental Europe.
In this country, however, the use of chlorine in water treatment
became prevalent after World War I, as cheap chlorine gas was a by-
product of the war's research into poison gases. Only two major
municipal installations in the United States have used ozone as part
of their treatment schemes (9). Whiting, Indiana, opened a plant
in 1940 which used ozone as a pretreatment process for the removal
of taste and odor from Lake Michigan water. Philadelphia, Pennsylvania,
in 1949, put into operation the worlds' largest ozonation installation.
Ozone was used to remove taste, odor, and manganese from water drawn
11
from the Schuylkill River. This plant was closed in 1959 due
to increased operational costs when the main treatment plant was
expanded.
As can be seen, the principle use of ozone in the United States
has been as an oxidant for taste and odor removal, while in Europe
ozone is primarily used as a disinfectant. The use of ozone as a
disinfectant is perhaps the most wide-spread application. Ozone
exhibits an effect commonly called the "all-or-nothing" mechanism
upon bacteria and virus (26). By this it is meant that little
effect is noted on the microbial population until a critical dosage
is reached, whereupon the population is almost completely eliminated.
It has been found that when this critical dosage is reached, an
ozone residual appears in the water. Nice, France, reaches a
coliform count of zero with an ozone dosage of two grams per cubic
meter for 5 minutes, obtaining an ozone residual of 0.1 ppm at one
minute after ozonation ends (11). Paris, France, has reported
similar results for the same dosage, with reduction off_. perfringens
cells to zero, and spores to near zero. Hoather found that a
coliform MPN of 50 per 100 ml was reduced to zero by a dose of
2 ppm (23). In a test performed by Houston, Bacterium coli were
present in 1 ml. of filtered Thames River water in more than 70%
of untreated water samples (37). After treatment with 1.5 ppm of
ozone, .!!_. coli were absent in 100% of samples of 100 ml.
Ozone has also been shown to be a powerful viricidal agent.
K~ssel found that poliomyelitis virus was completely inactivated by
two minutes of contact with 0.05-0.45 ppm of ozone (37). The same
12
virus required contact of 1.5 to 3 hours at 0.5-110 ppm of chlorine
to achieve the same level of inactivation. The normal applied dosage
of ozone for disinfection purposes is 0.5-1.5 ppm for up to five
minutes. The residual is then measured five minutes after ozone
injection has stopped to determine the degree of disinfection, with
a residual of 0.1-0.2 ppm considered sufficient for complete bacterial
kill and 0.4 ppm adequate for virus deactivation (20).
Ozone is also used as a method of controlling taste and odor
in water (9). At Whiting, Indiana, the introduction of ozone reduced
threshold odor numbers by 58 to 83 percent. At Philadelphia, an
ozone dose of 1.27 ppm reduced threshold odor numbers from 43 to 19.
Valin has reported, from results at the Dusseldorf, Germany, plant
that thresholds for tastes up to 18 and those for odors up to 10
were completely eliminated at a dose of 0.7-1.0 ppm for 10 minutes (13).
The oxidative power of ozone in water has been applied to
industrial wastes as well as to municipal waters and wastewaters. An
oil refinery near Lake Ontario in Canada currently uses ozone to
destroy phenols and cyanides in the plant effluent. Ozone dosage is
maintained at 20 to 50 mg/l, yielding a phenol level in the effluent
of less than 3 ppb (8).
A plant in Kansas includes ozonation as part of a waste treat-
ment scheme to remove chrominum, phenols, sulfides and sulfites,
cyanides, and miscellaneous oils (21). Treatment occurs in two
packed towers, with the second tower acting as an air scrubber to
remove ozone from the exhaust gases. The ozone is applied at a
13
dosage level of 20 ppm. After filtration, the effluent is discharged
to a lagoon where live fish thrive in the non-toxic water.
Many industrial uses of ozone involve a frothing action, where
materials are concentrated in an ozone-induced froth and removed
for disposal or re-use, or where the froth is being broken down by
the treatment. Foulds found that in an ozone frothing pond, there
was an 83% removal of ABS (10). The surfactants which remained in
the water after treatment were biodegradable, while those before
ozonation were not. He also showed that nitrates, phosphates, and
suspended solids were concentrated in the froth and could be
easily removed by a skinmrlng operation.
Buescher studied the destruction of lindane, aldrin, dieldrin,
and other pesticides by various oxidants (9). He reported destruction
of lindane and aldrin and decreased concentrations of dieldrin by
ozonation, while other oxidants, such as calcium hypochlorite, KMn0 4 ,
Na2o2 , (each at up to 40 mg/l dose), showed either no measurable
effect or only partial removal, and in some cases, increased toxicity.
Gardiner and Montgomery observed substantial reductions of hydrocarbon
pesticides upon ozonation (9). Dieldrin and y-BHC were removed at
the same rate, with approximately 50% of each disappearing with the
absorption of 20 ppm of ozone. A more rapid removal was observed
with both DDT and TDE.
Ozone has also been applied in both primary and tertiary treat-
ment schemes to reduce the carbonaceous content of waters and waste-
waters, as measured by BOD, COD, and TOC (6,7,34). Ozone can
14
theoretically oxidize organic materials completely to carbon dioxide
and.water. This result would be reflected by a decrease in the TOC
level of the effluent. If the oxidation is not complete, the TOC
level will not change. COD reduction is a result of incorporation of
oxygen into the molecular structures of the ozonated organic materials.
The organics in a waste in such a case will also show a reduction
in BOD, as the initial oxygen demand will be satisfied by the ozone.
After this initial oxygen demand has been met, ozone will begin to
attack refractory materials, making them biodegradable. This
increased biodegradability is caused by the action of ozone intro-
ducing oxygen functional groups into the refractory materials. These
new oxygen-containing groups afford bacteria a site where metabolism
can occur, possibly yielding an increase in the BOD. Continued
ozonation of the refractory materials further oxidizes them and the
BOD once again decreases.
Evans and Ryckman have reported an 80% reduction of the COD in
the effluent of a secondary treatment plant after ozonation (9).
The Air Reduction Company studied the effect of ozonation on a
trickling filter effluent (9). The results showed a reduction in
the COD from 32 to 13 mg/l and a TOC reduction of 12 to 9 mg/l, at
a contact time of one hour. At Hanover Park in Chicago, Illinois,
results of an ozone dose of 6 mg/l showed an ave~age BOD reduction,
after refractory materials were oxidized, of 30% (9).
Even though ozone has been shown to be effective in many
instances, occasions have occurred where the results did not meet
15
expectations. These "failures" have generally been related to the
normal occurrence in the waters of colloidal and suspended solids.
Colloidal and suspended solids exert a masking effect on the intended
target of ozonation, driving up the required dosages, and reducing
the effectiveness of the ozonation process (24).
In order to combat this masking effect, two ozonation and micro-
straining processes for water treatment have been developed. They
are called the Microzon process and the M.D. (Micellization/Demicelli-
zation) process (3). Micellization refers to an increase of turbidity
due to ozonation from the formation of negatively charged micelles.
Demicellization refers to the neutralization of these charged
particles by the addition of a small dose of polyelectrolyte, and
their subsequent removal by sand filtration. This effect comes
about as a result of ozone's attack on both the hydrophilic groupings
and the hydrophobic groupings-peptizing agent complexes which cause
colloidal stability, with the final result being precipitation of the
dispersed particles.
Both processes provide microstraining immediately before ozonation
to remove solids that would mask the action of ozone on the water.
If turbidity is not produced by ozonation, the water is discharged
as finished: clarified, sterilized, and containing the appropriate
ozone residual. This is the complete Microzon process. The Micelli-
zation/Demicellization process is used if ozonation has generated
turbidity in the water.
Reasons for using ozone in the water and wastewater treatment
processes are varied, but may be placed into two main categories (19,32).
16
The first category is the effect of ozone on the receiving stream.
Here, the advantages of using ozone include an increase in dissolved
oxygen, the disinfective action of ozone, decrease in organic
pollutants, the unincreased salt content, hardness, and aggressive-
ness of the water, and the fact that the oxidized products are non-
toxic or less toxic than the unoxidized materials. The second group
of reasons for using ozone involve physical design concepts. Ozone
is easily applied to a water or wastewater, yielding lower appli-
cation costs. The high reactivity of ozone, combined with its
ability to react with some materials without actually being in
solution, leads to more rapid reaction rates, which may lead to
shorter detention times.
Decolorization of Effluents
The causes of color. Color in waters and wastewaters is caused
by both organic and inorganic compounds. Inorganic color-forming
materials most commonly are complexes of metals called pigments (22).
Pigments generally are readily removed during sedimentation processes,
although some inorganic color is removed by flotation and frothing.
Most generally, color in waters and wastewaters is caused by
materials of organic origin. This feature is particularly true in
the textile dyeing industry. Almost all organic compounds are
colored, but most do not absorb light in the visible spectrum (22).
Color problems in dyehouse effluents are caused by organic compounds
which do sorb light in the visible spectrum. The mechanism of light
sorption is accomplished by organic functional groups, linked in
17
long chains, which have excesses of electrons (2). These groups are
called chromophores, and include such functional groups as carbon-
carbon double and triple bonds, nitro groups, benzene rings, and
heterocyclic compounds which have sulfur, oxygen, or nitrogen in
the ring (14). The shade of the color displayed will depend on the
length of the molecular chain and the nature of the chromophoric
groups involved.
Effluents from dyeing operations include both naturally
occurring color and color imparted from the dyes added to the water.
There are many types of dyes used in the textile industry, but they
may be put into four main categories: vat dyes, disperse dyes,
reactive dyes, and the most common type, soluble dyes (28). Soluble
dyes include basic, acidic, and direct dyes, and may or may not be
complexed with metals to increase dye fastness. Basic dyes are large
cationic organic molecules and are the brightest class of soluble
dyes, thereby causing the greatest color problem. Acidic dyes,
either of the azo or anthraquinone variety, are small molecules
complexed with sulfonic acid, and have poor light fastness. Direct
dyes are medium length molecules complexed with inorganic salts, and
are the most resistent to light degradation.
Methods of color removal. There are five major methods of waste
treatment for color removal: oxidation, filtration, co-precipitation,
ion exchange, and centrifugation. Each treatment type has its
advantages and disadvantages. No single commercial treatment process,
with the exception of reverse osmosis, a filtration process, has been
found to be effective in removing color in all cases.
18
Co-precipitation is perhaps the most widely used type of color
removal process in the textile dyeing industry (14,27,28,29,30,38).
This method physically removes the color bodies from the effluent by
adding coagulating aids to the waste and then settl.ing the solids
out of solution. Packham has found that most color bodies are not
colloids, but are in true solution (14). However, the bodies are of
sufficient size to exhibit colloidal properties, and thus are easily
coagulated and flocculated out of solution. The most popular
chemicals for use in a co-precipitation system are alum, alum-
cationic polymer mixtures, massive lime dosages, lime-anionic
polymer mixtures, and ferric salts. Results have shown up to 95%
color removal, combined with up to 35% BOD removal (28,24,30,38).
This type of system works best with a raw waste, rather than with
a secondary effluent, as the sludge produced will cause problems
in biological treatment when recycled. The quantity of sludge
produced by a co-precipitation process is the major drawback to
its use.
Centrifugation is another method for color removal, although
it is not widely used (36). In fact, it is probably the least
employed of all color removal methods. It has been used mostly
for the recovery and re-use of soluble materials from dilute solutions
of azo dyes. The method involves the addition of a specific liquid
ion exchange solvent to strip the color from the stream, centri-
fugation, the addition of another specific solvent to act as a
carrier, and more centrifugation (36). This process will concentrate
a dye about 700 times and is not prohibitively expensive.
19
Filtration, a general process classification, could be said to
be the most widely used for color removal, but the various individual
types of filtration are different and must be categorized separately.
These individual methods include reverse osmosis, ultra- and hyper-
filtration, sand filtration, and carbon adsorption filtration.
Reverse osmosis and hyper-filtration, in addition to merely removing
color, have been used to recover color bodies for re-use in the
dyeing process (1,18). However, fines and colloids tend to clog
membranes and can not normally be backwashed out, unless very small
pore sizes are used. If the waste has been previously treated
biologically, pore size may be increased up to 10-20 microns. Sand
filtration generally requires the addition of chemicals to aid in
color removal to get more than a 5% removal of color (1). Carbon
adsorption has been found to remove color quite efficiently from
most dye wastes, with the exception of disperse dyes (30). Depending
upon the particular plant set-up, pretreatment may be required to
prevent clogging, and carbon regeneration may be carried out either
by thermal or biological methods. One plant in Georgia has achieved
99% color removal and an excess of 64% removal of TOC by using a
carbon adsorption system involving a 10-hour carbon adsorption run,
followed by 14 hours of biological regeneration under aerobic
condition (31,33).
Ion exchange has not been widely used as a color removal process,
as it has been relatively difficult to remove the color bodies from
the resins once they are sorbed onto the solid phase. However, the
20
introduction of some new styrene-sulfonic acid resins has begun to
eliminate this problem, especially when the backwash liquid used is
a caustic soda solution (1). Color removals of up to 95% have been
noted. The resin influent must be free of suspended and colloidal
materials, and the resins have not been effective in removing disperse
dyes.
Oxidation, the last of the categories of color removal processes,
is a process in which decolorization occurs by alteration of the
chemical structure of the color bodies, resulting in a change in the
light absorption spectrum away from the visible spectrum, and yielding
products easily assimulated into the environment. The color causing
materials are not removed, but are only changed in form. In the past,
oxidation has meant the addition of chlorine or hydrogen peroxide to
the waste (22). Hydrogen peroxide has such a low oxidation potential
that its application is limited to those materials which are easily
oxidized. Even then, long detention times and high dosages are
required. Chlorine, in both its gaseous and hypochlorite salt forms,
is effective in removing color, although it has been recently shown
that the products generated have detrimental effects upon the
receiving stream. As a result, dechlorination has begun to be
required in several areas before discharge is allowed.
Recently, experimentation has begun involving oxidation of
color-causing compounds by gamma-irradiation, using cobalt-60 as
the source of the gamma rays (5). In the initial experiments, the
process has been shown to be effective in removing color, yielding
21
co2 and H20 as the ultimate products, in the presence of sufficient
oxygen in the water. Gamma irradiation works especially well in
conjunction with the carbon adsorption and reverse osmosis processes.
The carbon is reactivated under radiation, and the concentrated color
from the R.O. membrane is destroyed easily. However, the process is
very expensive, both in capital and operating costs and has not been
fully examined by the Atomic Energy Commission for safety consider-
ations and environmental aspects.
Ozone and color removal. Ozone, as noted before, has a very
high oxidation potential. The advantages of using such a high
potential for color removal were noted in the past, but only recently
has the application of ozone for color removal become popular. As
a result of its reactivity, ozone is theoretically more suited to
an oxidation process than the oxidants commonly in use.
The first applications of ozone for color removal were in the
water treatment field, as a method for removing color caused by
natural organics (24). This type of color is a result of soluble
vegetable dyes leached into the water from decaying vegetable matter,
possibly complexed with iron or manganese. This type of color is
not generally a problem in the United States, but occurs frequently
in Europe. The best known applications of ozone in this area are
the plants at Baerum and Skedsmo, Norway, and Loch Turret, Scotland.
The Loch Turret plant uses raw surface water as its influent,
utilizing the Microzon and M/D processes (4). The ozone dose is
1.4 grams per cubic meter. 0 With waters of 30 Hazen or less, all
22
color is removed, before an ozone residual of 0.1 ppm appears.
How~ver, with waters of high color, the ozone residual appears
before complete color removal occurs. In some cases, a color
residual remains which is not removable.
When oxidation is incomplete, some return of color is possible
when the water is stored for a sufficient period of time. At the
Redbridge plant in London, England, an ozone dose of 20-25 ppm was 0 0 sufficent to reduce an influent color of 38-41 Hazen to 2-5 Hazen,
at a flow rate of 2000 gallons/hour (25).
Relatively few applications have been made of the oxidative
power of ozone in decolorizing industrial effluents. The major
applications so far have been in the textile and in the pulp and
paper industries. The pulp and paper industry has a large problem
with color in the effluent, expecially in those plants which use the
draft pulping process. Nebel, studying kraft process plants, found
that ozone dosage levels from 70 to 143 ppm yielded color removals
of 78-88%, involving reductions of color from 520 to 1600 APHA units
down to 100 to 200 units (22). These color removals were complimented
by turbidity removals of up to 67% and COD removals of 21 to 37%.
Snider and Porter used ozone to treat several typical dyes and dye-
wastes, and found that good color removal was achieved (35). How-
ever, they noted low COD reductions and even a few COD increases.
Color removal occurred at varying times, depending upon dye type,
with 15 to 30 minutes of ozonation suitable for soluble dyes, and
up to 150 minutes required for comparable results with disperse dyes.
III. MATERIALS AND METHODS
All wastes used in this study were obtained from the wastewater
recycle station of the Martin Processing Company plant located in
Rocky Mount, Virginia. The wastewater treatment plant is designed
to treat the spent textile process waters. The samples were drawn
from the influent to the treatment plant and were stored in five-
gallon nalgene bottles in a refrigerator at approximately 35°F.
Due to the varied nature of the analyses performed on the samples,
no preservatives were added to the samples.
Analytical Procedures
Determinations performed included color, chemical and five-
day biochemical oxygen demand, total organic carbon, dissolved oxygen,
ozone residual, pH, total and suspended solids, and turbidity. The
following methods of analysis were used:
1. Color analyses were performed according to the Spectrophoto-
metric Method described in the 13th edition of Standard
Methods for the Examination of Water and Wastewater,
utilizing the ten ordinate technique, with one exception
(39). The waste was filtered through Reeve Angel grade
934AH filter paper, rather than through the standard filter
aid. A Perkin-Elmer Model 124 Double-Beam Spectrophotometer
was the instrument used for the analyses, with a spectral
band width of one mµ.
23
24
2. Chemical oxygen demand was determined using the dichromate
method described in Standard Methods (39).
3. Biochemical oxygen demand (five-day) was determined using
the procedure outlined in Standard Methods (39), utilizing
a seed acclimated to the waste. The solids used for the
seed were drawn from the aeration basin of an activated
sludge unit which treats only domestic waste. Four liters
of the mixed liquor were placed in a aeration chamber, and
mixed there with a four liter volume of the waste diluted
in a 1:4 ratio. This mixture was aerated and the microbes
fed new waste daily on a batch draw-and-fill basis. The
mixture was settled for one hour, and one liter of the
supernatent removed. One liter of diluted waste was then
added, and aeration resumed. This procedure occurred
for one week, with the strength of the waste added increased
daily. After this, the waste was fed to the mixture at
full strength for another week.
4. Total organic carbon was measured through the use of a
Beckman Model 915 Total Organic Carbon Analyzer. Due to
a malfunction in the inorganic carbon channel, TOC was
measured on the total carbon channel by the following
process: a 100 ml aliquot was stripped of co2 by acidi-
fication with concentrated HCl and sparging with nitrogen
gas, as is suggested in Standard Methods (39). The sample
was then ready for injection.
25
5. Dissolved oxygen was measured using a YSI Model 54 Oxygen
Meter, immediately before and after treatment.
6. The ozone residual of the treated waste was determined
by the Iodometric Method discussed in Standard Methods (39).
The measurements were carried out in such a way as to find
the ozone residual at five minutes after the end of ozone
contact with the water.
7. The measurement of pH was performed on a Fisher Accumet
Model 120 pH Meter, standardized against pH buffer solutions
of pH 7.0 and pH 10.0.
8. Total solids and total volatile solids analyses were performed
according to the method given in Standard Methods (39).
Total and volatile dissolved solids were determined using
the Gooch crucible method found in Standard Methods (39).
9. Turbidity was measured using a Hellige Model 8000-TS
Turbidimeter, with a 10 cm. light path length and no filter.
Experimental Procedures
Laboratory system. The ozone generator used throughout the
study was an Airox ozonator, model C2P-3C-2, a product of Pollution
Control Industries, Incorporated, having a capacity of 2.8 grams of
ozone per hour. Bottled dry air, grade II with zero hydrocarbons 0
with a dewpoint of -60 C was used as the air source for the ozonator.
Tygon tubing with an inside diameter of 3/8 inches was used to
deliver the ozone to the reaction chamber. The tubing coming from
the ozone generator was branched so that one branch ran to the
26
reaction chamber and the other was vented directly to be exhausted.
The branching of the tubing permitted the wasting of gases produced
during the generator's warmup period.
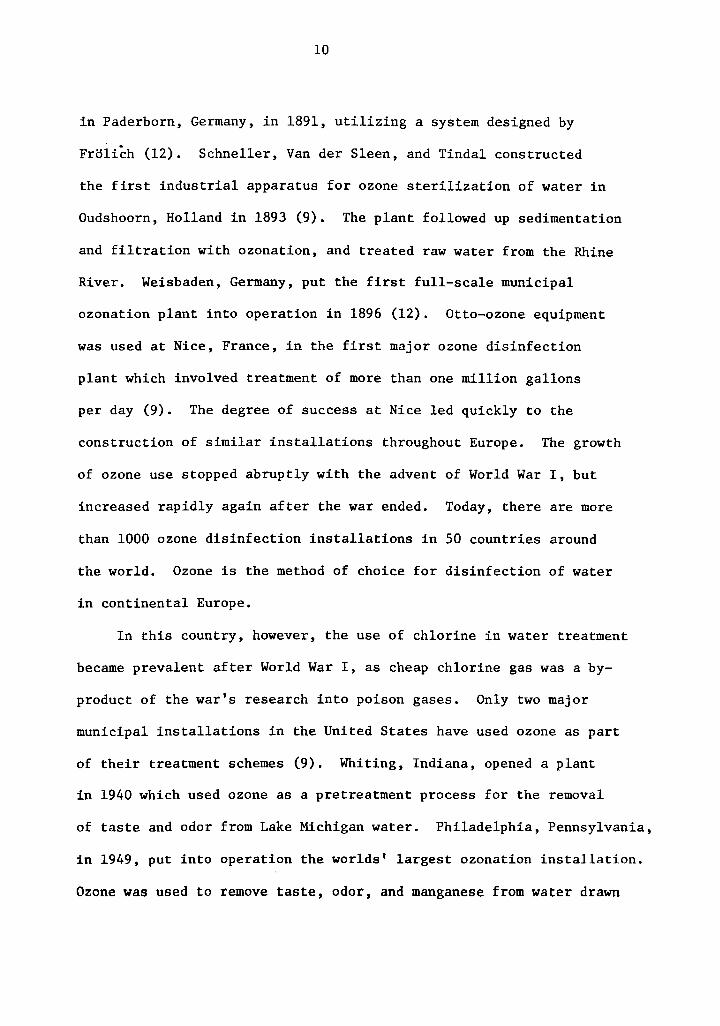
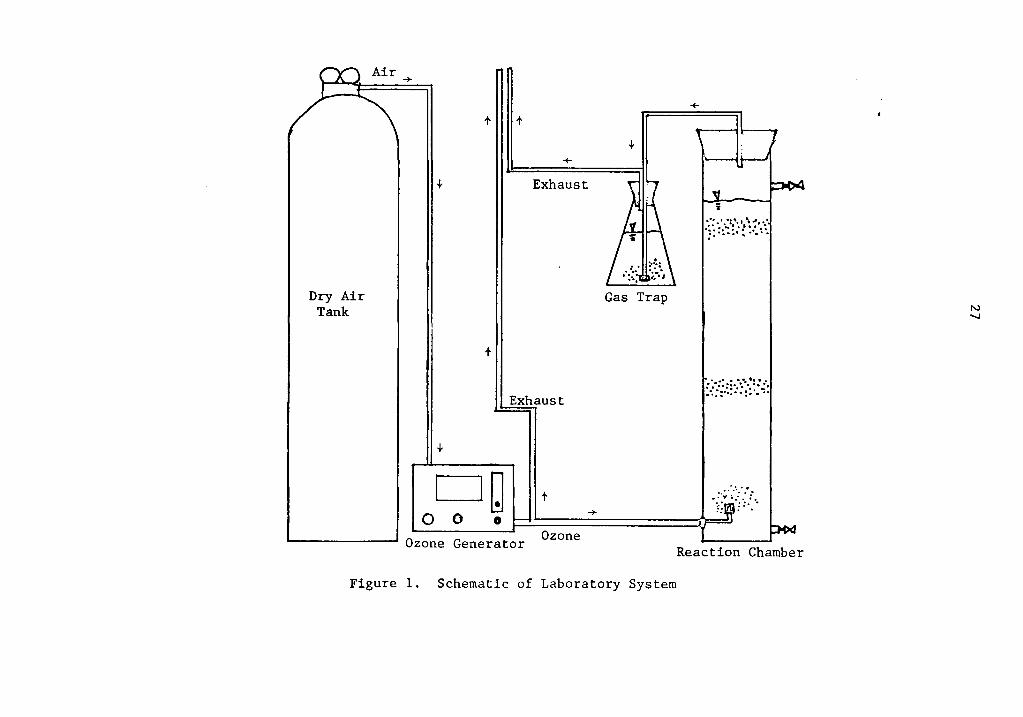
The reaction chamber consisted of a glass column, four feet
long and three inches internal diameter, equipped with a sintered
glass porous diffuser. The chamber was mounted with two taps, one
for influent wastewater and the other for the treated wastewater
effluent. These taps were closed off during batch studies. The
chamber was loaded with 4.5 liter samples, both in batch and con-
tinuous flow studies. The reaction chamber was vented to a
fume hood to allow any ozone not dissolved to escape. A schematic
of the system is shown in Figure 1.
Determination of ozone. Determinations of ozone were performed
throughout the duration of the study. The first determination was
to find the ozone production capacity of the generator. This value
was noted in milligrams/liter/minute. The second was a study of the
solubility of ozone in water for this particular system. Due to the
lack of appropriate wet-test meters, the ozone concentration in the
exhaust gases from the reaction chamber had to be monitored by gas
traps. These traps consisted of 400 ml of a 2% potassium iodine
solution in an Erlenmeyer flask. By subtracting the amount of
ozone in the exhaust gases from the amount produced, the amount of
ozone actually used in the wastewater treatment system could be
determined.
Dry Air Tank
+
tllllt
+
+ Exhaust
t
Exhaust
+
D~ 0 0 •
t +
Ozone Generator Ozone
+
+
::
·~~ ·=·~:=:':· ·~ ~~·:·~:
Gas Trap
:.: :.=;.:~::::;·~: :· ~·:
Reaction Chamber
Figure 1. Schematic of Laboratory System
N -..J
28
Experiment One: Batch Study
"rn this experiment, several 4.5 liter samples were ozonated
for varying lengths of time. Ozone production was held at 14 mg/l/
min., and contact times were 15, 30, 45, 60, 75, 90, 105, 120, and
150 minutes. The entire wastewater sample was characterized before
any ozonation occurred. Each 4.5 liter sample was tested for pH
and dissolved oxygen immediately before ozonation. After ozonation
ended, 500 ml were withdrawn, and the dissolved oxygen content was
measured. After five minutes had elapsed, the ozone residual was
determined. The entire 4 liters of ozonated sample remaining were
scrubbed to find this ozone residual. Two aliquots were drawn to
perform the rest of the analyses and the remainder of the waste
discarded. One aliquot was adjusted to pH 7.6, while the other
remained at the pH attained during ozonation. Half of each aliquot
was filtered, yielding 4 test samples: filtered and unfiltered
ozonated wastewater, and filtered and unfiltered ozonated wastewater
with pH adjusted. Each test sample was analysed for COD and TOC,
and the filtered samples were analysed for true color.
Experiment Two: Continuous Flow Study
This experiment was carried out in a manner similar to the
batch study except that there was a continuous flow of waste
through the reaction chamber which occurred in such a way that
counter-current conditions were achieved. Ozone production was
held at 14 mg/l/min, and the hydraulic retention time was 30 minutes.
In order to ozonate for longer periods of time, ozonated waste was
29
recycled back through the reaction chamber. This simulated a multi-
stage injection system, chosen on the basis of Campbell's recommend-
ations for a highly colored water, stemming from work at Loch
Turret (4). Since there was often a time lapse between the waste-
water draw-off from the chamber and it's re-introduction, tests were
run on the waste immediately after exit and before re-ozonation to
note any changes that occurred in the waste during storage. In
this study, ozone residuals were measured in the reaction chamber
effluent, in 400 ml sample sizes, rather than in the chamber itself.
In addition, a study of the BOD characteristics of the wastewater was
carried out to note changes associated with the treatment process.
IV. EXPERIMENTAL RESULTS
The results of the color removal experiments and of the associated
ozone determinations are presented in this section. The chapter is
divided into two parts, with the first section describing the batch con-
dition experiments and the second describing the continuous flow experi-
ments. In each section, the experimental results are briefly discussed.
The results of the preliminary study to determine the solubility of
ozone in tap water for the particular system described in the previous
chapter and used in this research are shown in Figure 2. As can be seen,
ozone has a maximum measurable residual in this system of approximately
2.1 mg/l.
Batch Conditions
The variations of the measured parameters due to ozone contact are
shown in Tables I and II. Table I shows the change in the true color of
the waste due to the action of ozone upon the waste. Table II tabulates
the effect of ozone upon the other measured parameters. Figure 3 shows
the effect of varying the ozone contact time on the color absorption
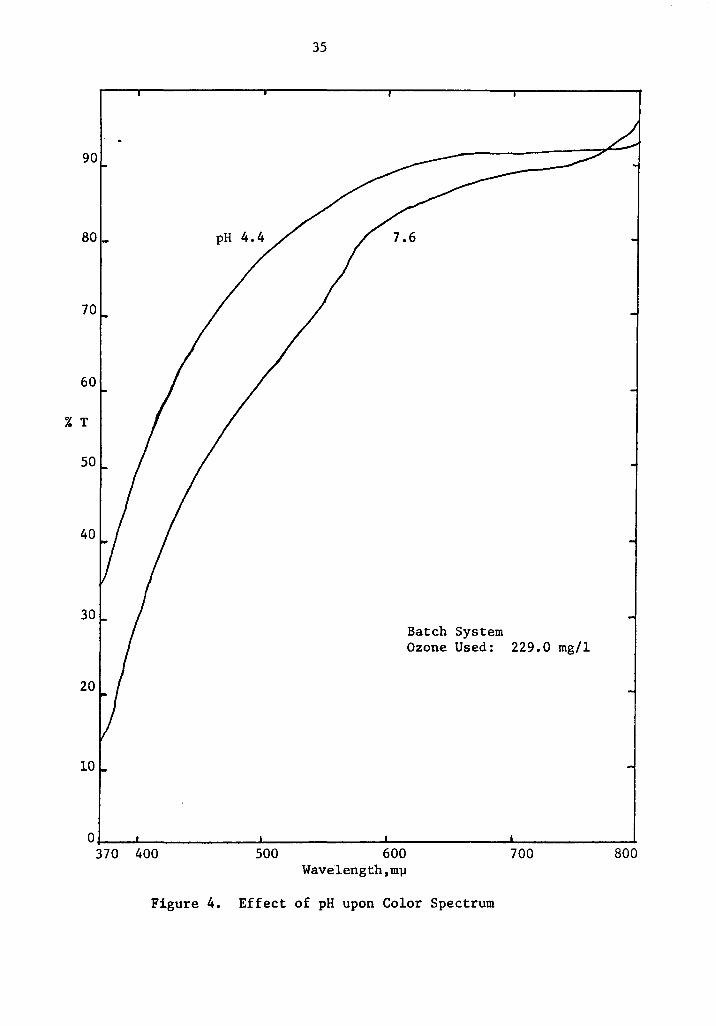
spectrum of the waste, while Figure 4 pictures a typical variation of
the spectrum with pH, at one contact time. In this case, the contact
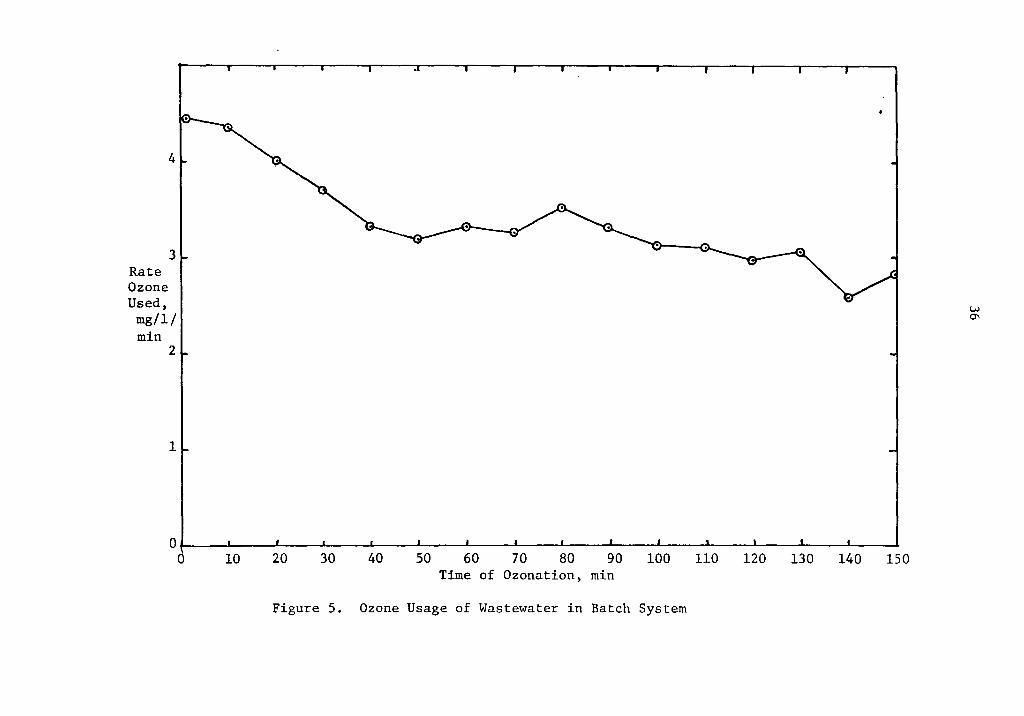
time shown is one hour, and the ozone usage is 229.0 mg/l. The ozone
determinations were made at ten minute intervals, and the resulting
amounts of ozone used are shown in Figure 5.
As seen in Table I and Figure 4, the pH of a liquid greatly
affects its color characteristics. It was for this reason that one
30
3.0
2.0 Ozone Residual,
mg/l
1.0
5 10 15 20 Ozonation Time, min.
Figure 2. Measureable Residual of Ozone in Tap Water for Test System
w I-'
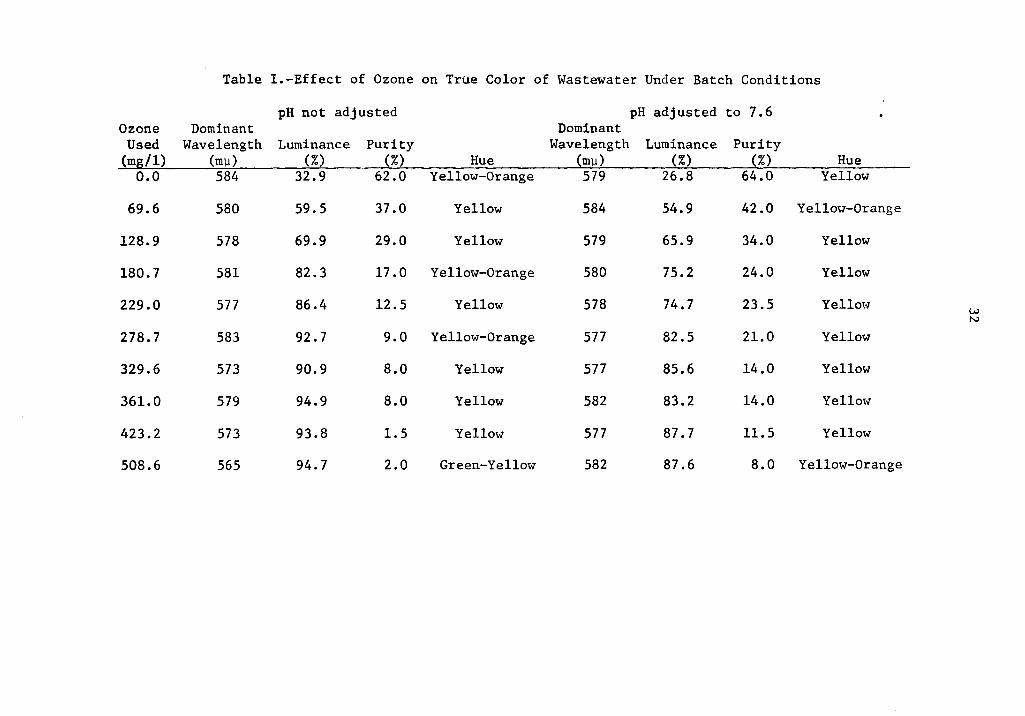
Table I.-Effect of Ozone on True Color of Wastewater Under Batch Conditions
pH not adjusted pH adjusted to 7.6 Ozone Dominant Dominant
Used Wavelength Luminance Purity Wavelength Luminance Purity (mg/l) (mµ) (%) (%) Hue ~mµ) (%) (%) Hue
o.o 584 32.9 62.0 Yellow-Orange 579 26.8 64.0 Yellow
69.6 580 59.5 37.0 Yellow 584 54.9 42.0 YelloY-Orange
128.9 578 69.9 29.0 Yellow 579 65.9 34.0 Yellow
180.7 581 82.3 17.0 Yellow-Orange 580 75.2 24.0 Yellow
229.0 577 86.4 12.5 Yellow 578 74.7 23.5 Yellow w N
278.7 583 92.7 9.0 Yellow-Orange 577 82.5 21.0 Yellow
329.6 573 90.9 8.0 Yellow 577 85.6 14.0 Yellow
361.0 579 94.9 8.0 Yellow 582 83.2 14.0 Yellow
423.2 573 93.8 1.5 Yellow 577 87.7 11.5 Yellow
508.6 565 94.7 2.0 Green-Yellow 582 87.6 8.0 Yellow-Orange
Ozone Dosing
Time (min)
0
15
30
45
60
75
90
105
120
150
Table II.-Effect of Ozone on Wastewater Under Batch Conditions
Ozone Ozone Used Residual
(mg/l) (mg/l) EH o.o 0.00 - 6.8
69.6 0.15 6.6
128.9 0.29 6.3
180. 7 0.31 5.8
229.0 0.44 4.6
278.7 0.51 4.4
329.6 0.61 4.2
361.0 o. 72 4.0
423.2 1.07 3.8
508.6 1.15 3.6
*CODf = COD of filtered wastewater
*TOCf = TOC of filtered wastewater
COD COD * rec roe * (mg/1) (mg/!} (mg/l) (mg/!} 1670 1264 337 285
1558 1193 337 285
1542 1137 337 285
1535 1125 337 285
1408 1095 337 285
1400 1080 337 285
1400 1072 337 285
1310 1057 337 285
1236 993 320 270
1157 987 320 270
DO (mg/l)
2.3
10.1
10.3
10.5
10.3 w w
9.5
9.4
9.4
9.4
9.3
90
80
70
60
% T
50
3
2
1
370 400 500
34
600 Wavelength,mµ
O. 0 mg/l Ozone Used
Batch System pH 7.6
700
Figure 3. Effect of Ozone Contact upon Color Spectrum
800
35
90
80
70
60
% T
so
40
30 Batch System Ozone Used: 229.0 mg/l
20
10
o+-~......_~~~~~~--~~~~~~--~~~~~~--~~~~~---310 400 500 600
Wavelength,mµ
Figure 4. Effect of pH upon Color Spectrum
700 800
Rate Ozone Used,
4
3
mg/!/ min
2
1
0,__~_._~___.~~_.._~_._~~---~_._~__,.__~_._~_._~~----~_._~~.__~_._~__._~~
10 20 30 40 50 60 70 80 90 100 110 120 130 140 150 Time of Ozonation, min
Figure 5. Ozone Usage of Wastewater in Batch System
w O'I
37
aliquot of each sample was adjusted to pH 7.6. This allowed direct
comparison of color data. The percent purity of the waste was
chosen to be the parameter for comparison of color and color
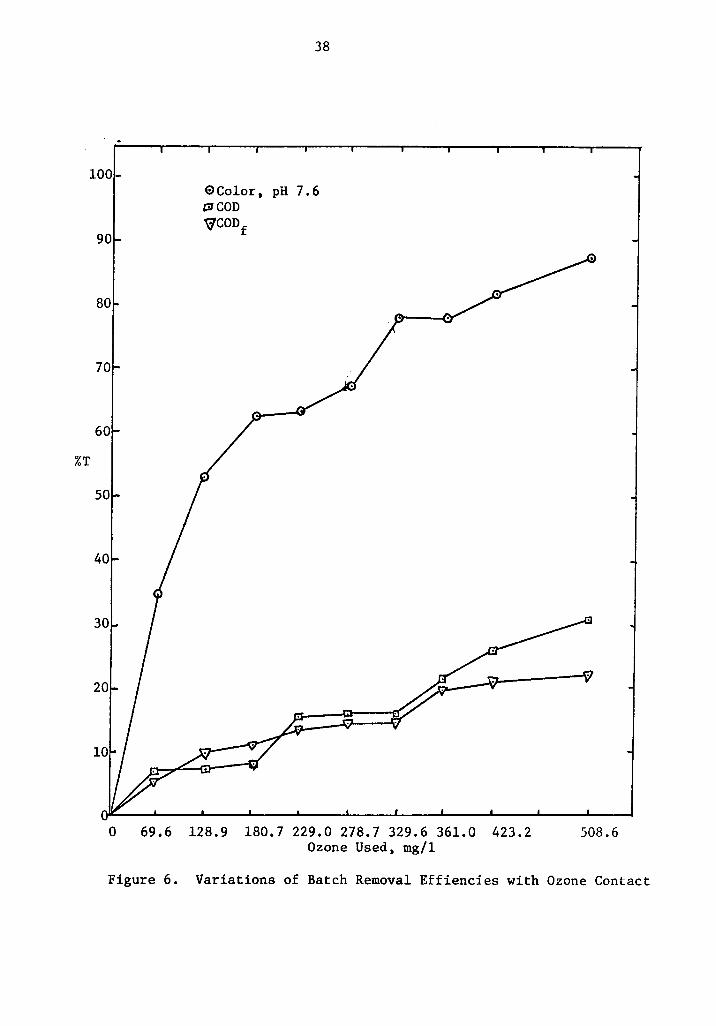
removal. Figure 6 shows the action of ozone in removing color and
COD from the waste. As can be seen, the earlier stages of ozonation
removed larger amounts of color than the later stages. However,
the same result is not true with COD removal. Here, the amount
of COD removed remained fairly constant with the ozone used.
Continuous Flow Conditions
The characteristics of the raw and ozonated wastewater used
in the continuous flow experiments are listed in Tables III through
VI. In these tables, color is reported at both the pH of the
effluent and pH 7.6. Samples of the waste:were analyzed immediately
after ozonation and after storage. Figure 7 shows a typical change
in the color spectrum of the waste after storage. This figure
reveals an increase in the color of the waste after storage,
indicating that color can return to the waste if not filtered
immediately. Color reappearance was not noted when the waste was
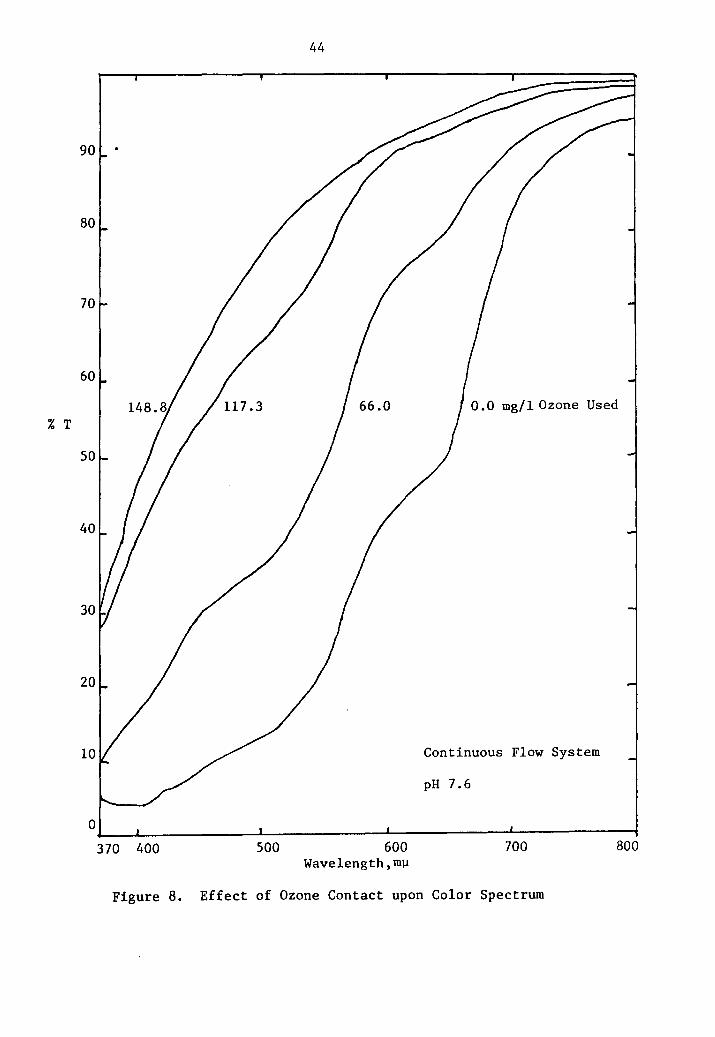
filtered before storage. Figure 8 shows the change in the spectrum
of the waste due to varying the ozone contact time, not considering
any changes resulting from storage.
As Tables III through VI show, the suspended solids concentration
and turbidity increased with ozonation. This effect has been previ-
ously noted with textile wastes, and is the major reason for measurjng
true color rather than apparent color (25).
100-
90
%T
38
0 Color, pH 7 • 6 CilCOD ~CODf
0 69.6 128.9 180.7 229.0 278.7 329.6 361.0 423.2 Ozone Used, mg/l
508.6
Figure 6. Variations of Batch Removal Effiencies with Ozone Contact
39
Table III.-Characterization of Raw Wastewater for Continuous Flow Study
pH
Color~ Hue
Dominant wavelength, mu
Luminance, %
Purity, %
Total Solids, mg/l
Total Volatile Solids, mg/l
Suspended Solids, mg/l
Volatile Suspended Solids, mg/l
C.O.D., mg/l
C.O.D.f' mg/l
T.O.C., mg/l
T.O.C.f' mg/l
B.O.D. 5 , mg/l
D.O., mg/l
Turbidity, mg/l as Sio2 Color, pH 7.6:
Hue
Dominant wavelength, mu
Luminance, %
Purity, %
6.8
Yellow-Orange
585
27.5
58.0
3304
962
169
132
2014
1332
395
380
695
2.2
81
Yellow-Orange
585
27.0
58.0
40
Table IV.-Characterization of Wastewater After Ozonation for Thirty Minutes Under Continuous Flow Conditions
pH
Color: Hue
Dominant wavelength, mu
Luminance, %
Purity, %
Total Solids, mg/l
Total Volatile Solids, mg/l
Suspended Solids, mg/l
Volatile Suspended Solids, mg/l
C.O.D., mg/l
C.O.D.f' mg/l
T.O.C., mg/l
T.O.C.f, mg/l
B.O.D. 5 , mg/l
D.O., mg/l
Turbidity, mg/l as Si02
Color, pH 7.6:
Hue
Dominant wavelength, mu
Luminance, %
Purity, %
Ozone Used, mg/l
Ozone Residual, mg/l
*Stored for 5 hours
Immediate Stored* 6.6 6.8
Yellow-Orange Yellow-Orange
585 583
55.5 62.5
37.0 38.0
3307 3307
990 990
320 320
260 260
1750 1750
1260 1260
395 395
380 380
610 610
6.5 3.7
92 92
Yellow-Orange Yellow-Orange
585 581
55.6 61.6
37.0 39.0
66.0 66.0
0.00 0.00

41
Table V.-Characterization of Wastewater After Ozonation for Sixty Minutes Under Continuous Flow Conditions
pH
Color: Hue
Dominant wavelength, mu
Luminance, %
Purity, %
Total Solids, mg/l
Total Volatile Solids, mg/l
Suspended Solids, mg/l
Volatile Suspended Solids, mg/l
C.O.D., mg/l
C.O.D.f, mg/l
T.O.C., mg/l
T.O.C.f' mg/l
B.O.D. 5 , mg/l
D.O., mg/l
Turbidity, mg/l as Sio2 Color, pH 7.6
Hue
Dominant wavelength, mu
Luminance, %
Purity, %
Ozone Used, mg/l
Ozone Residual, mg/l
*Stored for 8 hours
Inunediate Stored* 6.0 6.0
Yellow-Orange Yellow-Orange
580 580
80.6 77 .4
20.0 21.0
3308 3308
997 997
400 400
320 320
1636 1631
1187 1182
325 325
255 255
550 550
7.3 3.7
105 105
Yellow-Orange Yellow-Orange
581 582
78.5 78.2
21.0 22.0
117. 3 117. 3
0.30 0.00
42
Table VI.-Characterization of Wastewater After Ozonation for Ninety Minutes Under Continuous Flow Conditions
pH
Color: Hue
Dominant wavelength, mu
Luminance, %
Purity, %
Total Solids, mg/l
Total Volatile Solids, mg/l
Suspended Solids, mg/l
Volatile Suspended Solids, mg/l
C.O.D., mg/l
C.O.D.f' mg/l
T.O.C., mg/l
T .0. C. £' mg/l
B.O.D. 5 , mg/l
D.O., mg/l
Turbidity, mg/l as Si02 Color, pH 7.6:
Hue
Dominant wavelength, mu
Luminance, %
Purity, %
Ozone Used, mg/l
Ozone Residual, mg/l
*Stored for 5 hours
Immediate 4.6
Yellow
575
91.5
10.5
3306
984
480
370
1518
1107
305
237
670
8.7
108
Yellow
579
77.9
18.5
148.8
0.50
Stored* 5.0
Yellow
578
85.6
13.0
3306
984
480
370
1510
1104
305
237
670
3.7
108
Yellow-Orange
582
85.7
19.5
148.8
0.00
90
80
70
60
% T
50
40
30
20
10
43
Continuous Flow System Ozone Used: 117.3 mg/l pH 6.0
01--~..1.-~~~~~~-'-~~~~~~_._~~~~~~~.._~~~~~--' 370 400 500 600
Wavelength,m-µ 700
Figure 7. Effect of Storage upon Color Spectrum
800
% T
90 .•
80
70
60
50
40
30
20
10
370 400 500
44
600 Wavelength,mµ
0 .O mg/l Ozone Used
Continuous Flow System
pH 7.6
700 800
Figure 8. Effect of Ozone Contact upon Color Spectrum
45
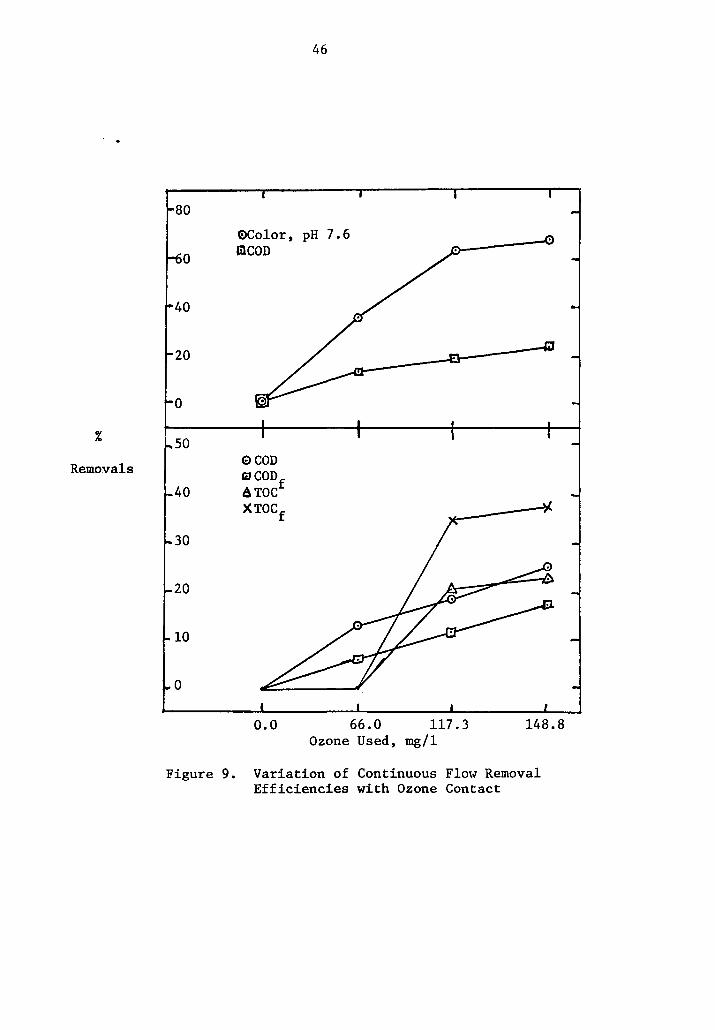
Figure 9 shows the removal of filtered and unfiltered COD and
TOC. as a function of the ozone used, and the removal of COD in
comparison with the removal of color. The COD removals remained
fairly constant with the amounts of ozone used. Filtered and
unfiltered TOC were not removed until large amounts of ozone were
used.
46
80 OColor, pH 7.6
0 aeon
40
20
0
% 50
Removals SCOD IC1 CODf
40 6TOC XTOCf
30
20
10
0
0.0 66.0 117.3 148.8 Ozone Used, mg/l
Figure 9. Variation of Continuous Flow Removal Efficiencies with Ozone Contact
V. DISCUSSION
Ozone Determination
The results of the treatment studies clearly show that the
important factor in determining the effect of ozone on a waste is
not the applied ozone dosage, but how much ozone is actually dis-
solved into the wastewater and used by the waste. The dosage
required to create a particular residual is a function of the system
used to apply ozone to the waste. The efficiency of the system will
also affect the required dosing levels. The system used in this
study had a very low efficiency of ozone use, as can be seen by
comparing the amounts of ozone used with the amount applied.
The maximum measurable ozone residual for this system was
found to be approximately 2.1 mg/l. This value corresponds closely
with the value postulated by O'Donovan. For an ozone concentration
in air of 14 mg/l, he found a normal residual ozone level in water
of 2.7 mg/l (24). The difference here is due to several factors,
including temperature and pressure. However, the most important
probable cause for the discrepancy is the difference in the S
co-efficient as previously discussed in Chapter II. O'Donovan
assumed a value of 0.2 for S, which most probably is incorrect for
this system. Also, the large air flow of 20 standard cubic feet
per hour through the small-sized reaction chamber resulted in a
self-scrubbing action, stripping the water of ozone.
The ozone residuals found in both the batch and continuous
flow experiments were much lower than the amount found in tap
47
48
water. These residuals appeared before all the color in the wastewater
was· removed, as has been noted by Campbell (4).
Solids and Turbidity
Solids and turbidity determinations were made only on the waste-
water treated under continuous flow conditions. The total solids
seemed to vary slightly, but only in such a magnitude that experi-
mental error could explain the variation. The same result is not
true in the variations seen with suspended solids and turbidity. Both
of these parameters increased with increasing ozone use of the waste-
water. This result means the effect of ozone on the waste consti-
tuents is to make them less soluble, driving them out of solution,
and into a filterable state. It is possible that the action of
ozone here is largely on the positively charged portions of the
constituents, with the end effect of causing colloidal particles
to be restabilized. The mechanism causing this action is not yet
understood. However, it has been found that ozonation of raw water
containing natural organics caused the formation of negatively
charged micelles, with an accompanying increase of both turbidity
and suspended solids (3). This effect of ozonation would necessitate
the filtration of an ozonated wastewater before discharge could be
allowed.
In previous studies involving ozonation of wastewaters, it has
been reported that the pH of the wastewaters was driven towards
49
neutral (17). These changes toward neutrality occurred with original
pH belng both acidic and basic. However, in this study, the pH was
driven further and further towards an acidic condition with continued
ozonation. The batch system drove the pH down further over the
comparable ozonation time, with the greatest drop in pH coming in
the middle range of ozonation time employed. The continuous flow
system had a continually increasing rate of pH drop. No reasons
have been advanced for the effect of ozone on pH, either towards or
away from neutrality.
Dissolved Oxygen
The effect of ozonation was to increase the dissolved ozygen
content of the wastewater. In batch condition treatment, the
dissolved oxygen was always raised above saturation. This result
was not evident in continuous flow treatment, where the dissolved
oxygen content was increased, but not above saturation, until after
90 minutes of ozonation. Also, the dissolved oxygen fell far below
saturation after storage but always to the same level, regardless
of the oxygen content at the time ozonation was completed. The
super-saturation of the wastewater with oxygen after ozonation
could be expected, but the drop of dissolved ozone to far below
saturation could not. One possible reason for this drop would be
biological action in the wastewater during storage. This effect
would be highly improbable, due to the disinfectant action of
ozone, but the suspended solids and turbidity of the wastewater
so
could yield a masking effect and thereby preserve some of the microbes
which" could use oxygen in their metabolism.
The measured BODS of the wastewater followed a pattern which has
been previously reported by Nebel (22). The ozone caused a decrease
in BODS by satisfying a portion of the oxygen demand, and then an
increase by attacking refractory materials, making them biodegradable.
This decrease and subsequent increase in BODS occurred, but ozonation
was not continued to the point where the measured BODS began to
decrease again.
COD and TOC Removal
The COD and CODf of the waste was diminished slightly by the
application of ozone. This result is to be expected, as the ozone
demand of organic materials is extremely high. In both the batch
and continuous flow treatment schemes, the removal of COD was
greatly below that of color, indicating a change in chemical
structure that did not materially affect the ultimate oxygen demand
of the waste. Continued ozonation of the waste would most likely
yield higher COD reductions. Also, in both treatment systems, CODf
removal was lower than that of total COD removal. When compared
with the solids and turbidity data, this result is the opposite
of what might be expected and leads to the conclusion that the
action of ozone on COD is mainly on the filterable matter, not on
the dissolved material.
51
When TOC and TOCf are examined, there are immediate differences
noted.in the results of the two different systems. Under batch
conditions no TOC or TOCf removal occurred until after two hours of
ozonation. However, TOC and TOCf were removed to a very limited
extent after one hour under continuous flow conditions. Also, the
amount of TOC removed under continuous flow was greater than that
removed in batch. This result would mean that the continuous flow
system was more effective in completely oxidizing the wastewater.
However, when compared with the COD data, it becomes apparent that
this result is not likely. Instead, the most probable explanation
is that the wastewater constituents are slightly different, and
that those in the wastewater sample treated in continuous flow are
more easily oxidized to completion.
Color Removal
The color of the wastewater was removed rapidly by the action
of ozone. In each treatment system, the ozone attacked the color
readily, removing large amounts of color in the early part of
ozonation. However, the amount of color removed decreased as
ozonation continued, with larger amounts of ozone becoming necessary
to remove smaller amounts of color. This result would indicate that
the color removed in the early stages of treatment was due to the
breakdown of chromophores which are easily oxidized, while those
remaining are more resistant to oxidation. This resistance may be
seen by the color removal curves in Figures 6 and 9 approaching a
maxim~, and also in the decreasing shifts of spectrums in Figures 3
and 8.
52
The color was removed more easily in the continuous flow treat-
ment system than in the batch treatment system. Approximately one-
half the amount of ozone used in the batch system was required
to achieve the same results under continuous flow conditions. This
result could mean that the chromophores of the batch treated waste-
water were more resistant to oxidation, requiring more ozone to be
broken down. However, the ozone residual was greater with the batch
flow conditions. This result could be related to the fact that tur-
bulence was greater in the continuous flow system, allowing a much
quicker pass-through of ozone, thus allowing less time for the ozone
to dissolve into solution.
Looking at the action of ozone on the spectrum of the waste-
water, the effect of ozone is greatest between the wavelengths of
400 and 650 mµ. There is almost no effect on the red end of the
spectrum, at the higher wavelengths. The batch treatment system
created wide variations in the dominant wavelength of the waste-
water throughout treatment, while in the continuous flow treatment,
the dominant wavelength remained fairly constant, although it did
finally decrease. In all cases, the hue was in the yellow range,
although it varied from yellow-orange to green-yellow.
The luminance of the wastewater also varied greatly. There
seemed to be no direct relationship between the purity and the
luminance, as the purity generally decreased while the luminance
either decreased or increased.
VI. CONCLUSIONS AND RECOMMENDATIONS
There are several conclusions that can be drawn from the
results of the research performed and described in this thesis.
Among them are:
1. Ozone is effective in removing color from the selected
textile dye waste.
2. Filtration is necessary after ozonation, due to the tendency
of ozonation to increase turbidity and suspended solids in
wastewater.
3. Ozone is effective in removing COD from a wastewater, and,
depending upon the constituent form, may also be effective
in removing TOC.
4. BODS is removed from a textile wastewater, depending on
the length of ozonation. It is possible to increase the
BODS of a wastewater by ozonation. This result could
cause further treatment to be required in order to reduce
the treated effluent BODS.
S. Color is removed much more readily from a wastewater than
is COD, due to the fact that only slight changes in
molecular structure are needed to change color character-
istics, while much larger structural changes are required
to decrease COD.
The research raised several questions which were not answered,
either due to a lack of data or because the study was not designed
53
S4
to search answers in these areas. As a result, several reconnnendations
for·further research are listed as follows.
1. Further study could be performed to ascertain the mechanism
by which ozone causes an increase of the turbidity and the
suspended solids in a wastewater.
2. Studies could be performed to compare the treatment of
raw wastewater with the treatment of filtered raw waste-
water and wastewater which has been through secondary
treatment to see the action of ozone on the color of the
wastewater.
3. The effect of ozone on the pH of the wastewater is
currently unexplained, and further research could explain
how ozone causes pH changes.
4. It has been suggested that ozonation and carbon adsorption
be used in conjunction with each other as wastewater
treatment processes. Studies could be done to see if
ozone causes materials to be more or less readily adsorbed
on the carbon. However, caution would have to be exercised
in a study of this sort, as mixed ozone and activated carbon
sometimes has explosive tendencies.
S. As mentioned before, ozone does have a tendency to reduce
and then increase BODS. Further research could determine
when the minimum BODS is reached, in relationship to color
removal, as well as when ozone begins to reduce BODS again.
6. A study could be performed to find the result of ozonating
55
a textile dyewaste secondary effluent, to see if the amount
of ozone needed to remove color would be less.
BIBLIOGRAPHY
1. Alspaugh, T. A., "Treating Dye Wastewater." Textile Chemist & Colorist, 5(11), 255 (1973).
2. Railey, P. S., "Organic Groupings 1--!echani sms in Aqueous Media.'' Treatment, Evans, F. L., ed., Inc., Ann Arbor, ~Uch., 1972.
~eactive Toward Ozone: 07.one in Water and Wastewater
Ann Arbor Science Publishers,
3. Boucher, P. L., et al., "Use of Ozone in Reclamation of T·Tater From Sewage Effluent." Journal of the Institute of Public Health Engineers, 67(2), 75 (1968).
4. Campbell, R. M., "The Use of Ozone in the Treatment of Loch Turret Water." Journal of the Institution of Water F.ngineers, 17(4), 333 (1963).
5. Case, F. N., Ketchen, E. E. , and Alspaup,h, T. A. , "Gamma-Induced, Low Temperature Oxidation of Textile Effluents." Textile Chemist & Colorist, 5(4), 23 (1973).
6. Diaper, E.W. J., ''A New Method of Treatment for Surface Water Supplies." Water & Sewage Works, 117(11), 373 (1970).
7. Diaper, E.W. J., "Practical Aspects of Water and Wastewater Treatment by Ozone." Ozone in Water and Wastewater. Treat-ment, Evans, F. L. , ed. , Ann Arbor Science Publishers, Inc. , Ann Arhor, Mich., 1972.
8. Eisenhauer, H. R., "The Ozonation of PhenoU.c Wastes." Journal of the Water Pollution Control Federation, 40(11), 1887 (1968).
9. Evans, F. L., "Ozone Technology - Current Status." Ozone in Water and Wastewater Treatment, F.vans, F. L., ed., Ann Arbor Science Publishers, Inc., Ann Arbor, Mich., 1972.
10. Foulds, J. T., Wilson, D. B. , and Clark, J. W. , "Ozone Generated Froth for Sewage Treatment." Water and SewaP,e Tforks, 118(3), 80 (1971).
11. Gomella, C., "Ozone Practices in France." Journal of the American Water Works Association, 64(1), 39 (1972).
12. Hann, V. A., "Ozone Treatment of Water." Journal of the American Water Works Association, 35(5), 585 (1943).
56
57
13. Hann, V. A., "Disinfection of Drinking Water with Ozone." Journal of the American Water Works Association, 48(10), 1316 (1956).
14. Hall, E. S. and Packham, R. F., "Coagulation of Organic Color With Hydrolyzing Coagulants." Journal of the American Water Works Association, 57(9), 1149 (1965).
15. Hewes, C. G., and Davison, R. R., "Kinetics of Ozone Decom-position and Reaction with Organics in Water." A. I. Ch. E. Journal, 17(1), 141 (1971).
16. Kinman, R. N., "Ozone in Water Disinfection." Ozone in Water and Wastewater Treatment, Evans, F. L., ed., Ann Arbor Science Publishers, Inc., Ann Arbor, Mich., 1972.
17. Kirk, B. S., McNabney, R., and Wynn, c. S., "Pilot Plant Studies of Tertiery Wastewater Treatment with Ozone," Ozone in Water and Wastewater Treatment, Evans, F. L., ed., Ann Arbor Science Publishers, Inc., Ann Arbor, Mich., 1972.
18. Lindbert, S., "Decolorization of Rleach Plant Effluent and Chloride Hand.ling." Paper Trade Journal, 157(51), 36 (1973).
19. Lowndes, M. R., "Ozone for Water and Effluent Treatment." Chemistry and Industry, 34, 951 (1971).
20. Majumdar, S. B., Ceckler, W. H., and Sproul, O. J., "Inactivation of Polio~irus in Water by Ozonation." Journal - Water Pollution Control ~ederation, 45(12), 2433 (1973).
21. Nebel, C., and Unangst, P. C., "Ozone for Pollution Control." International Pollution Control Magazine, Pilot Issue, 29.
22. Nebel, C. , Gottschling;, R. D. , and 0 'Neill, H. J. , "Ozone Decolorization of Pulp and Paper Mill Secondary Effluents." Unpublished paper circulated by the Welshach Ozone Systems Corporation, Philadelphia, Pa.
23. ~ebel, C., et al., "Ozone Disinfection of Industrial - Municipal Secondary Effluents." Journal Water Pollution Control Federation, 45(12), 2493 (1973).
24. O'Donovan, D. C., "Treatment with Ozone." Journal of the American Water Tforks Association, 57(9), 1167 (1965).
25. Palin, A. J., "The Ozonization of Water with Special Reference to Colour Removal." Water and Water Engineering, 5 7 (7) 271 (1953).
58
26. Pavoni, J. L., et al., "Virus Removal from Wastewater Using Ozone." Water & Sewage Works, ll9(12), 59 (1972).
27. Pollock, M. J., "Neutralizing Dyehouse Wastes with Flue Gases and Decolorizing with Fly Ash." American Dyestuff Reporter, 62(8), 21 (1973).
28. Porter, J. J., "Stability and Removal of Commercial Dyes from Process Wastewater." Pollution Engineering, 5(10), 27 (1973).
29. Randall, C. W., and King, P.H., "Treating Finishing Wastes Chemically and l3iologically." American Dyestuff Reporter, 62(6), 63 (1973).
30. Rodman, C. A., "Removal of Color from Textile Dye Wastes." Textile Chemist & Colorist, 3(11), 239 (1971).
31. Rodman, C. A., and Shunney, E. L., "Treating Textile Wastes with Activated Carbon." Textile Chemist & Colorist, 2(16), 286 (1970).
32. Rosen, H. M., "Use of Ozone and Oxygen in Advanced Wastewater Treatment." Journal Water Pollution Control Federation, 45(12), 2521 (1973).
33. Shunny, E. L., Perrotti, A. E., and Rodman, C. A., "Decolorization of Carpet Yarn Dye Wastewater." American Dyestuff Reporter, 60(6), 32 (1971).
34. Sommerville, R. C., and Rempel, G., "Ozone for Supplementary Water Treatment." Paper presented at American Water Works Association meeting, Denver, Col., (June 1971).
35. Sni<ler, E. H. and Porter, J. J., "Ozone Treatment of Dye Waste." Journal Tfater Pollution Control Federation, 46 (5), 886 (1974).
36. Todd, D. B., and Hopper, C. A., "Centrifugal Extraction of Waste Dyes." Chemical Engineering Process, 67(9), 60 (1970).
37. Venosa, A. D., "Ozone as a Water and Wastewater Disinfectant: A Literature Review." Ozone in Water and Wastewater Treat-ment, Evans, E. L., ed., Ann Arbor Science Publisher, Inc., Ann Arbor, Mich., 1972.
38. "Extensive Effluent Treatment at Hodge Includes Color Removal." Paper Trade Journal, 157(18), 39 (1973).
39. Standard Methods for the Examination of Water and Wastewater. 13th Edition, American Public Health Association, New York, New York, (1971).

The vita has been removed from the scanned document
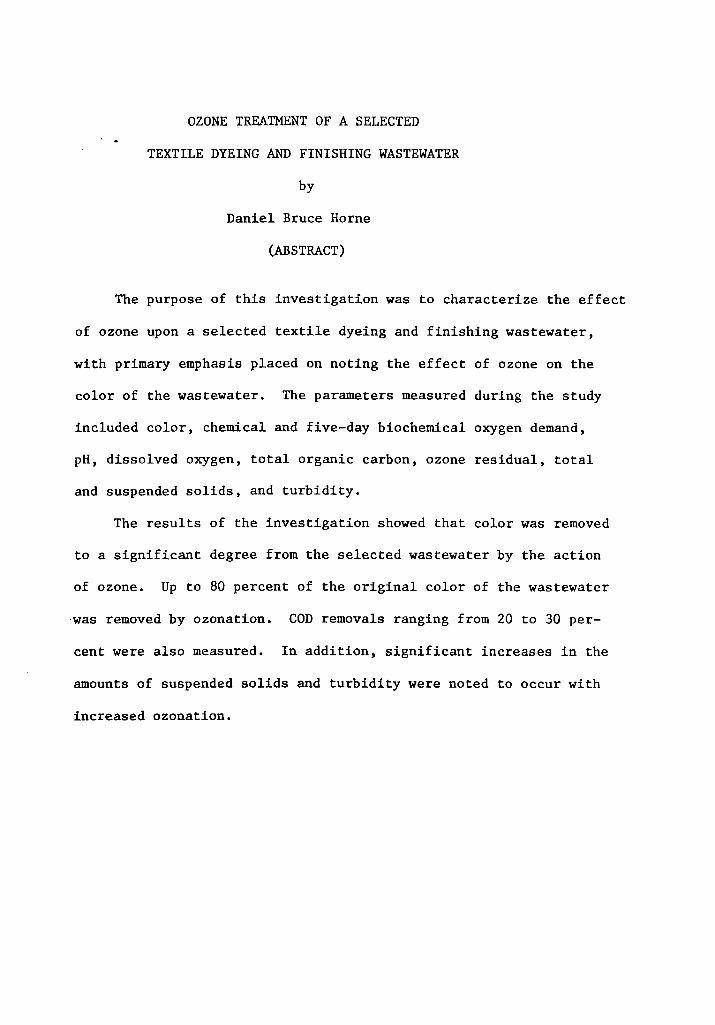
OZONE TREATMENT OF A SELECTED
TEXTILE DYEING AND FINISHING WASTEWATER
by
Daniel Bruce Horne
(ABSTRACT)
The purpose of this investigation was to characterize the effect
of ozone upon a selected textile dyeing and finishing wastewater,
with primary emphasis placed on noting the effect of ozone on the
color of the wastewater. The parameters measured during the study
included color, chemical and five-day biochemical oxygen demand,
pH, dissolved oxygen, total organic carbon, ozone residual, total
and suspended solids, and turbidity.
The results of the investigation showed that color was removed
to a significant degree from the selected wastewater by the action
of ozone. Up to 80 percent of the original color of the wastewater
was removed by ozonation. COD removals ranging from 20 to 30 per-
cent were also measured. In addition, significant increases in the
amounts of suspended solids and turbidity were noted to occur with
increased ozonation.


![Regional Report on Ozone Observation Ozone Observation [ RA-II: Asia ] Regional Report on Ozone Observation Ozone Observation [ RA-II: Asia ] Hidehiko](https://img.pdfslide.us/doc/110x75/56649f115503460f94c23df0/regional-report-on-ozone-observation-ozone-observation-ra-ii-asia-regional.jpg)