Embed Size (px)
Citation preview

1 Oxygen Depletion in Enclosed Spaces
Oxygen Depletion in Enclosed SpacesMr. Daniel Burke& Dr. Manhal AlnasserFaculty of Nautical & STEM
2 Oxygen Depletion in Enclosed Spaces
Oxygen Depletion in Enclosed SpacesDaniel Burke, Manhal AlnasserEdited by Linus Reichenbach and Douglas MorrisonDesigned by City of Glasgow College Design Studio
Special thanks to Paul Little, Principal and CEO of City of Glasgow College, for acting as patron of this research. Without the support of Principal Little and his team at City of Glasgow College this would not have been possible.
City of Glasgow CollegeRiverside Campus, 21 Thistle St, Glasgow G5 9XB
ISBN Number: 978-1-9164866-1-4First Edition201950 copies
Funded by The Maritime Educational Foundation

3 Oxygen Depletion in Enclosed Spaces
Foreword 4
Abstract 8
Aim 9
Introduction 10
Dalton’s law of partial pressure 12
Equipment used in the experiments 15
Oxygen depletion in a sealed container 16
Oxygen depletion in adjacent spaces 22
Oxygen depletion in an open vented container 26
Oxygen depletion in a chain locker 30
Summary 34
Recommendations 36
References 38
Contents
4 Oxygen Depletion in Enclosed Spaces
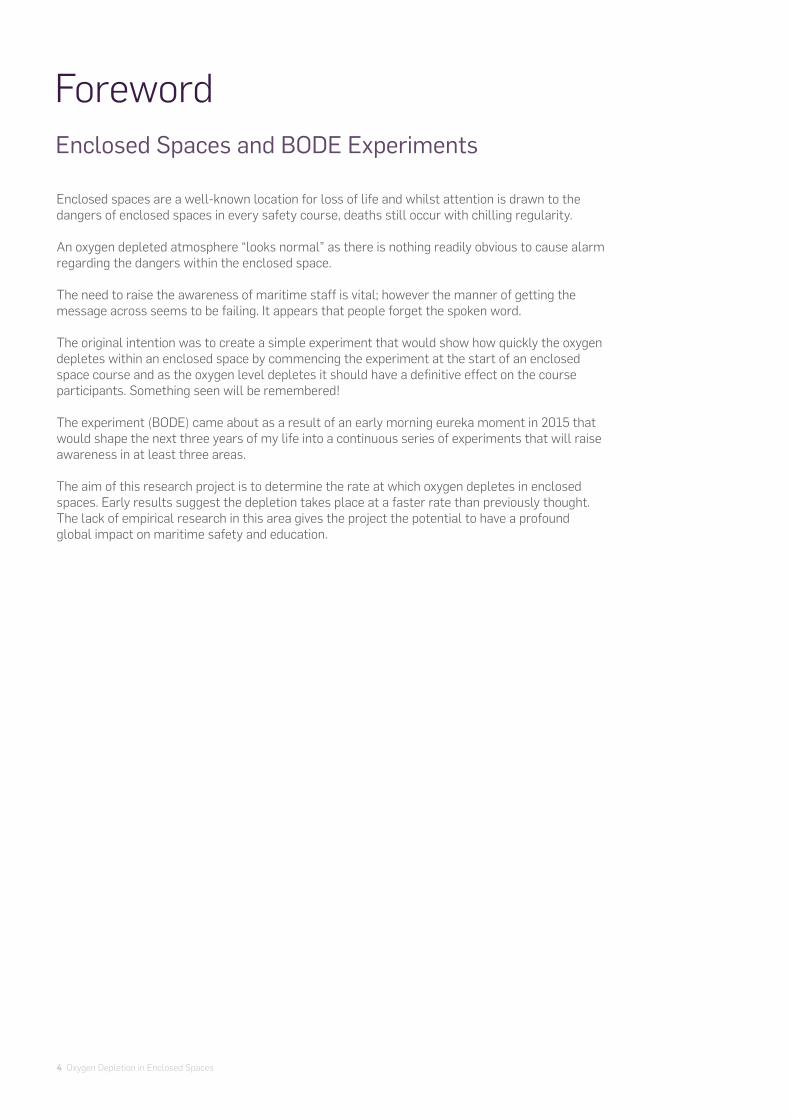
Enclosed Spaces and BODE Experiments
Enclosed spaces are a well-known location for loss of life and whilst attention is drawn to the dangers of enclosed spaces in every safety course, deaths still occur with chilling regularity. An oxygen depleted atmosphere “looks normal” as there is nothing readily obvious to cause alarm regarding the dangers within the enclosed space.
The need to raise the awareness of maritime staff is vital; however the manner of getting the message across seems to be failing. It appears that people forget the spoken word. The original intention was to create a simple experiment that would show how quickly the oxygen depletes within an enclosed space by commencing the experiment at the start of an enclosed space course and as the oxygen level depletes it should have a definitive effect on the course participants. Something seen will be remembered!
The experiment (BODE) came about as a result of an early morning eureka moment in 2015 that would shape the next three years of my life into a continuous series of experiments that will raise awareness in at least three areas. The aim of this research project is to determine the rate at which oxygen depletes in enclosed spaces. Early results suggest the depletion takes place at a faster rate than previously thought. The lack of empirical research in this area gives the project the potential to have a profound global impact on maritime safety and education.
Foreword

5 Oxygen Depletion in Enclosed Spaces
Comparison of oxygen depletion rate in experiments at 10°C and 23°C
Comparison of oxygen depletion rate in experiments at 10°C and 23°C
Experiment Type:Closed Containment T (°C) Time (Hours)
to 19.5% 02
Time (Hours)to 10% 02
Time (Hours)to 6% 02
Closed Containment Experiment 10°C 1.7 15.9 25.3
Closed Containment Experiment 23°C 0.38 2.63 4.37
Experiment Type:Open Containment T (°C) Time (Hours)
to 19.5% 02
Time (Hours)to 10% 02
Time (Hours)to 6% 02
Open Vented Experiment 10°C 2.03 30.05 48.76
Open Vented Experiment 23°C 0.93 5.65 8.05
Closed Containment Experiment212019181716151413121110987654321
50 10 15 20 25 30 35 40 45 50 55 600
Oxy
gen
%
Time (Hours)
Open Vented Containment212019181716151413121110987654321
50 10 15 20 25 30 35 40 45 50 55 600
Oxy
gen
%
Time (Hours)
Depletion rate at 10°C
Depletion rate at 10°C
Depletion rate at 23°C
Depletion rate at 23°C

6 Oxygen Depletion in Enclosed Spaces
Chain Locker Experiment212019181716151413121110987654321
50 10 15 20 25 30 35 40 45 50 55 60 65 70 75 80 85 900
Oxy
gen
%
Time (Hours)
Comparison of oxygen depletion rate in experiments at 10°C and 23°C
Experiment Type T (°C) Time (Hours)to 19.5% 02
Time (Hours)to 10% 02
Time (Hours)to 6% 02
Chain Locker (40kg steel) 10°C 4.53 38.48 58.17
Chain Locker (Scale model experiment) 23°C 2.05 17.25 27.17
Depletion rate at 10°C
Depletion rate at 23°C
It is clear from the experiment results that once the hatch covers or tank lids are closed, the oxygen contained within the space is immediately being absorbed by the cargo or due to rusting within a space, and that enclosed spaces must at all times be treated as unsafe. In 2017 at the invitation of Mr Paul Little I decided to get involved with the City of Glasgow College to ensure that the findings would be promulgated to a wide audience and an agreement was concluded in late 2017 with a verifying number of experiments being carried out in COGC at 23°C with alarming results at the increased speed of oxygen depletion due to the increased temperature.
With the COGC involvement there are greater possibilities for experiments on a wider range of cargoes and double bottom tanks that will further raise awareness.
The hope is that not only will these experiment results make a difference and particularly when delivered in conjunction with the experiment, but additionally that the IMO will take on board the findings and hopefully will influence the need for a specific enclosed space course becoming mandatory.
Daniel C Burke, CEng, CMarEng, FIMarEST.Ballea Road, Carrigaline, Co.Cork.
1st May 2018.Email: [email protected]

7 Oxygen Depletion in Enclosed Spaces7 Oxygen Depletion in Enclosed Spaces

8 Oxygen Depletion in Enclosed Spaces
The aim of this research project was to determine the rate at which oxygen depletes in enclosed spaces.
The project was conducted using the Burke Oxygen Depletion Experiment (BODE) inside sealed containers built specifically for this project in conjunction with purpose-built manometers as well as the Burke Adjacent Space Experiment (BASE).
Results show that the average times in the BODE sealed containers at 10˚C for the oxygen level to drop to 19.5%, 10%, and 6% were 1.70, 15.90, and 25.30 hours respectively whilst the results at 23˚C were 0.38 (23 mins), 2.63, and 4.37 hours respectively.
In BODE open vented containers at 10˚C the average times for the oxygen level to drop to 19.5%, 10% and 6% were 2.03, 30.05, and 48.76 hours respectively whilst the results at 23˚C were 0.93, 5.65 and 8.05 hours respectively.
On the other hand the study shows that within replicated a chain locker at 10˚C the average times for the oxygen level to drop to 19.5%, 10% and 6% were 4.53, 38.48,58.17 hours respectively whilst the results at 23˚C were 2.08, 17.25 and 25.83 hours respectively.
The project also demonstrates that the hazards of oxygen depletion do not stop at the immediate enclosed cargo spaces but similar risks can exist when entering adjacent spaces. To illustrate this in a specific BODE experiment it took 7 hours for the oxygen level to drop to 4.35% inside the sealed container; this was indicated on the manometer as 1720 mm of water vacuum which is equivalent to an air pressure of 84.675 kPa.
To illustrate how air can be depleted in an adjacent space through a tiny orifice the BASE rig was then connected to the BODE rig through a valve controlled pipeline and it took just 35 minutes for the manometer levels/pressures to equalise in the BODE and BASE rigs as illustrated by the manometers when connected.
Bearing in mind that an oxygen depleted atmosphere “looks normal” as there is nothing readily obvious to cause alarm regarding the dangers within the enclosed space, the results of the experiments must be seen as a significant step in raising awareness of the dangers within an enclosed space. This condition can be observed clearly in the Chain Locker experiment through the transparent polycarbonate lid whilst being aware of the depleted oxygen readings.
Abstract

9 Oxygen Depletion in Enclosed Spaces
The aim of this research project is to determine the rate at which oxygen depletes in enclosed spaces. Early results suggest the depletion takes place at a faster rate than previously thought.
The lack of empirical research in this area gives the project the potential to have a profound global impact on maritime safety and education.
This research has three key outputs:
• Improve health and safety standards and save lives at sea by promulgating the results of this research. • Develop educational programmes to raise awareness of the dangers associated with oxygen depletion and to promote best practice at sea. • Potentially lead to the development of low cost sensor technology to continuously monitor oxygen levels and clearly identify when an enclosed space is unsafe to enter.
The project was conducted using the Burke Oxygen Depletion Experiment (BODE) utilising sealed containers built specifically for this project in conjunction with purpose-built manometers, along with the Burke Adjacent Space Experiment (BASE) and Chain Locker Experiment.
The project also demonstrates that the hazards of oxygen depletion do not stop at the immediate enclosed cargo spaces but similar risks can exist when entering adjacent spaces. To illustrate this in a specific BODE experiment it took 7 hours for the oxygen level to drop to 4.35% inside the sealed container; this was indicated on the manometer as 1720 mm of water vacuum which is equivalent to an air pressure of 84.675 kPa abs.
To illustrate how air can be depleted in an adjacent space through a tiny orifice the BASE rig was then connected to the BODE rig through a valve controlled pipeline and it took just 35 minutes for the manometer levels/pressures to equalise in the BODE and BASE rigs as illustrated by the manometers when connected.
Aim
9 Oxygen Depletion in Enclosed Spaces

10 Oxygen Depletion in Enclosed Spaces
It is a well-established fact that once a space is closed, air becomes stale. Even in everyday life whether at a workplace or in our own homes we tend to open windows to get fresh air even in cold weather. What makes air stale is the lack of oxygen. Many training courses and health and safety regulations on this subject emphasise the risks and hazards of entering enclosed spaces due to a lack of oxygen. However, there are no studies, research or other information available to indicate how rapidly oxygen is depleted in enclosed spaces. The aim of this project is to urgently raise awareness of the risks and hazards of entering enclosed spaces by highlighting how fast the oxygen level can drop to a dangerous level in an enclosed environment.
Dry bulk cargoes, sometimes food products are in everyday use and there seems to be a general assumption that those cargoes are of a benign nature. Within fresh water tanks and ballast tanks where the water is used for everyday purposes, there is also a false sense of security because of this everyday usage and the allegedly benign nature of the cargo and tank contents. It is essential to acutely emphasize that once the hatch covers or tank lids are closed, the oxygen contained in the space immediately begins being consumed either by the cargo or by rusting within the space itself. The International Maritime Organization states that “appropriate attention shall be paid to the fact that cargo spaces and adjacent spaces may be depleted in oxygen or may contain toxic or asphyxiating gases, and that an empty cargo space or tank which has remained closed for some time may have insufficient oxygen to support life. Many solid bulk cargoes are liable to cause oxygen depletion in a cargo space or tank. These include, but are not limited to, most vegetable products and forest products, ferrous metals, metal sulphide concentrates and coal cargoes” (IMO, 2005).
It is very necessary to raise awareness about the speed of oxygen depletion that takes place in enclosed spaces as this occupational hazard is not properly studied in published literature (Urban Svedberg, 2009).
Oxygen level in air is 21% and according to Health & Safety Executives when the level drops to 19.5% there is a threat to safety from the atmosphere. Although evacuating the space at this stage is not necessary, however, action should be taken to eliminate the cause of the threat and put safety measures in place. Nonetheless, as soon as the level drops below 19.5% the atmosphere is becoming dangerous and the space must be evacuated in accordance with the emergency plan. Self-rescuers equipment should be worn immediately. (HSE, 2013).
Detection equipment is readily available to ascertain the oxygen level within an enclosed space at any specific time; however it is rare to have continuous monitoring of these spaces.
This research project was carried out to determine the rate of oxygen depletion and is based upon Dalton’s Law of Partial Pressures and the details are set out hereafter.
Air contains 16 different gases with four main components: nitrogen, oxygen, argon, and carbon dioxide along with seven additional gases of very low content and five other gases with trace elements. Each of these gases has its own partial pressure which is addressed in Dalton’s law of partial pressure in the next section.
Introduction

11 Oxygen Depletion in Enclosed Spaces
12 Oxygen Depletion in Enclosed Spaces12 Oxygen Depletion in Enclosed Spaces
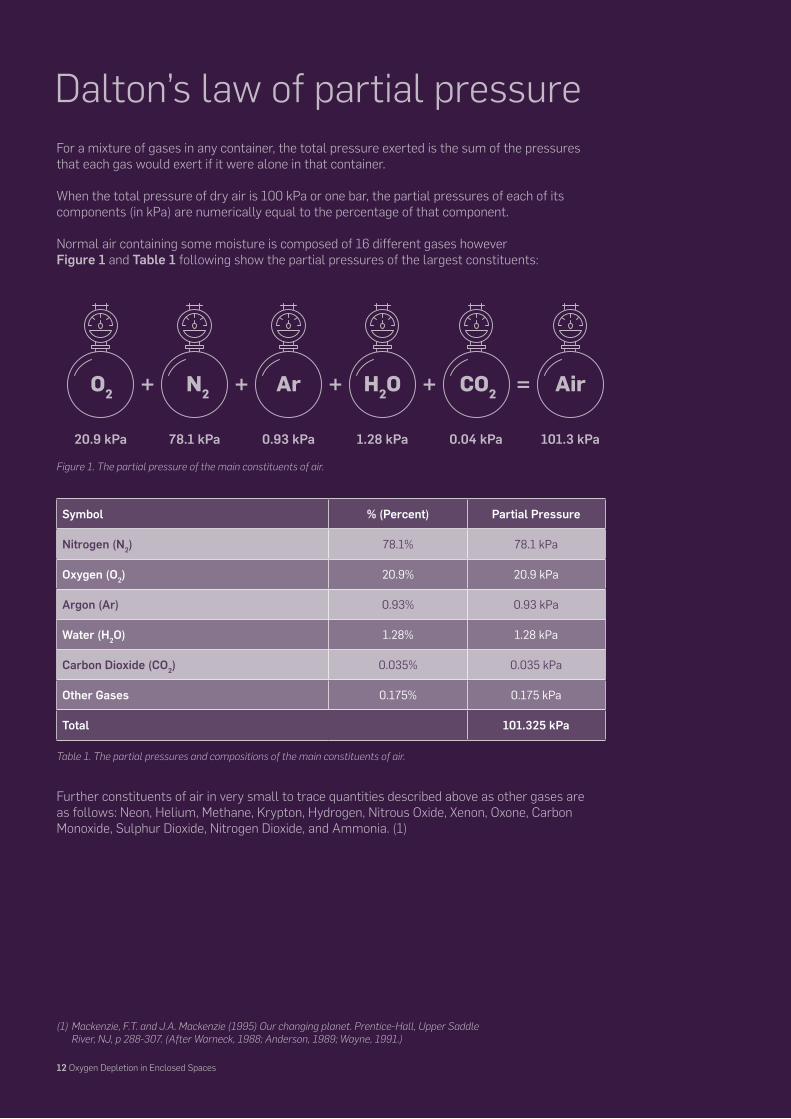
For a mixture of gases in any container, the total pressure exerted is the sum of the pressures that each gas would exert if it were alone in that container.
When the total pressure of dry air is 100 kPa or one bar, the partial pressures of each of its components (in kPa) are numerically equal to the percentage of that component.
Normal air containing some moisture is composed of 16 different gases however Figure 1 and Table 1 following show the partial pressures of the largest constituents:
Further constituents of air in very small to trace quantities described above as other gases are as follows: Neon, Helium, Methane, Krypton, Hydrogen, Nitrous Oxide, Xenon, Oxone, Carbon Monoxide, Sulphur Dioxide, Nitrogen Dioxide, and Ammonia. (1)
(1) Mackenzie, F.T. and J.A. Mackenzie (1995) Our changing planet. Prentice-Hall, Upper Saddle River, NJ, p 288-307. (After Warneck, 1988; Anderson, 1989; Wayne, 1991.)
Figure 1. The partial pressure of the main constituents of air.
Table 1. The partial pressures and compositions of the main constituents of air.
Dalton’s law of partial pressure
O2
20.9 kPa 78.1 kPa 0.93 kPa 1.28 kPa 0.04 kPa 101.3 kPa
N2+ + + + =H2O CO2Ar Air
Symbol % (Percent) Partial Pressure
Nitrogen (N2) 78.1% 78.1 kPa
Oxygen (O2) 20.9% 20.9 kPa
Argon (Ar) 0.93% 0.93 kPa
Water (H2O) 1.28% 1.28 kPa
Carbon Dioxide (CO2) 0.035% 0.035 kPa
Other Gases 0.175% 0.175 kPa
Total 101.325 kPa
13 Oxygen Depletion in Enclosed Spaces
(2) Mackenzie, F.T. and J.A. Mackenzie (1995) Our changing planet. Prentice-Hall, Upper Saddle River, NJ, p 288-307. (After Warneck, 1988; Anderson, 1989; Wayne, 1991.)
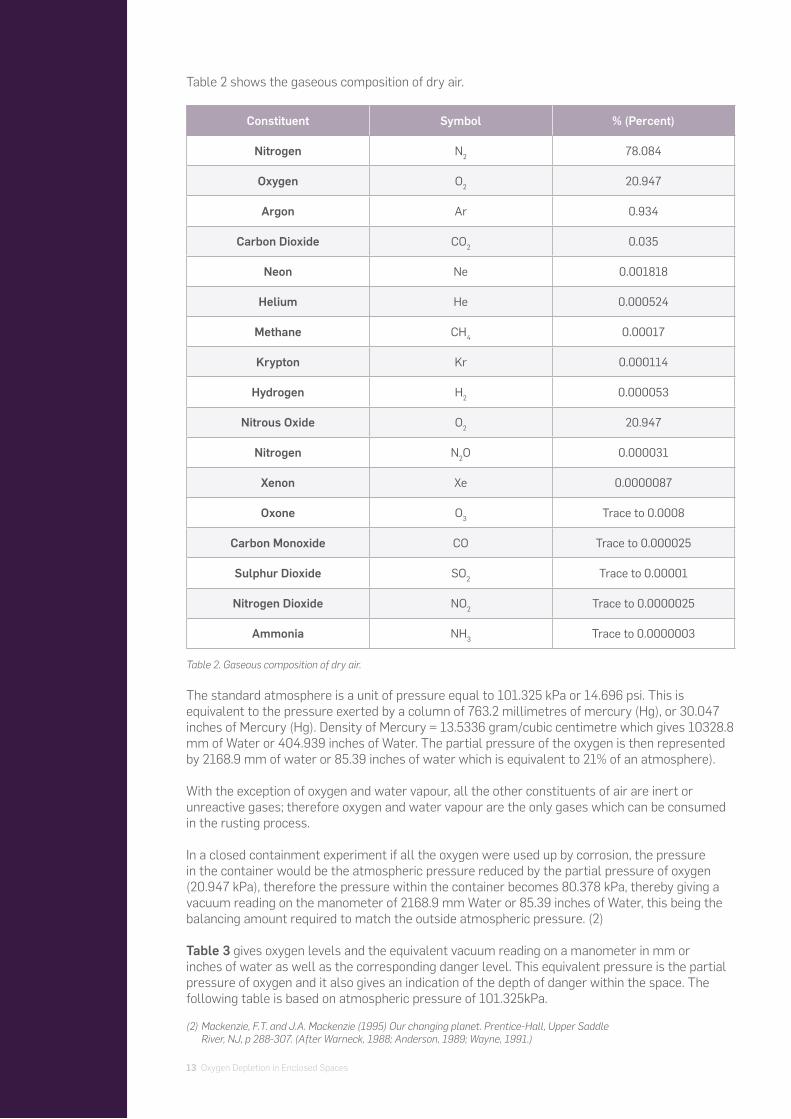
Table 2. Gaseous composition of dry air.
Table 2 shows the gaseous composition of dry air.
The standard atmosphere is a unit of pressure equal to 101.325 kPa or 14.696 psi. This is equivalent to the pressure exerted by a column of 763.2 millimetres of mercury (Hg), or 30.047 inches of Mercury (Hg). Density of Mercury = 13.5336 gram/cubic centimetre which gives 10328.8 mm of Water or 404.939 inches of Water. The partial pressure of the oxygen is then represented by 2168.9 mm of water or 85.39 inches of water which is equivalent to 21% of an atmosphere).
With the exception of oxygen and water vapour, all the other constituents of air are inert or unreactive gases; therefore oxygen and water vapour are the only gases which can be consumed in the rusting process.
In a closed containment experiment if all the oxygen were used up by corrosion, the pressure in the container would be the atmospheric pressure reduced by the partial pressure of oxygen (20.947 kPa), therefore the pressure within the container becomes 80.378 kPa, thereby giving a vacuum reading on the manometer of 2168.9 mm Water or 85.39 inches of Water, this being the balancing amount required to match the outside atmospheric pressure. (2)
Table 3 gives oxygen levels and the equivalent vacuum reading on a manometer in mm or inches of water as well as the corresponding danger level. This equivalent pressure is the partial pressure of oxygen and it also gives an indication of the depth of danger within the space. The following table is based on atmospheric pressure of 101.325kPa.
Constituent Symbol % (Percent)
Nitrogen N2 78.084
Oxygen O2 20.947
Argon Ar 0.934
Carbon Dioxide CO2 0.035
Neon Ne 0.001818
Helium He 0.000524
Methane CH4 0.00017
Krypton Kr 0.000114
Hydrogen H2 0.000053
Nitrous Oxide O2 20.947
Nitrogen N2O 0.000031
Xenon Xe 0.0000087
Oxone O3 Trace to 0.0008
Carbon Monoxide CO Trace to 0.000025
Sulphur Dioxide SO2 Trace to 0.00001
Nitrogen Dioxide NO2 Trace to 0.0000025
Ammonia NH3 Trace to 0.0000003

14 Oxygen Depletion in Enclosed Spaces
Similarly for Oxygen that is partially used up in the rusting process the following table will give the equivalent vacuum reading on the manometer in mm water or inches water, this being the balancing amount required to match the outside atmospheric pressure. This equivalent pressure will be the partial pressure or oxygen reading within the space and will give an indication of the depth of danger within the space. The following table is based on atmospheric pressure of 101.325kPa. (3)
Partial Pressure in kPa and Oxygen %
Manometer Reading
Manometer Reading % (Percent)
mm Water In Water Dangers at various O2 levels
21 0.00 0.00 Oxygen centration in normal air
20 103.28 4.07
19.5 154.92 6.10 Minimum permissible oxygen level
19 206.56 8.13
Decreasing ability to work. Problems for persons with coronary, pulmonary or
circulatory problems
18 309.84 12.20
17 413.12 16.26
16 516.40 20.33
15 619.68 24.40
14 722.96 28.46
Respiration further increases in rate and depth. Poor judgement, blue lips
13 826.24 32.53
12 929.52 36.60
11 1032.80 40.66
10 1136.08 44.73 Mental failure, fainting, unconsciousness
9 1239.36 48.79 Ashen face, nausea, and vomiting
8 1342.64 52.86 Recovery still possible after 4 or 5 mins
7 1445.92 56.93 50% fatal after 6 mins
6 1549.20 60.99 Fatal after 8 mins
5 1652.48 65.06
4 1755.76 69.12
3 1859.04 73.19
2 1962.32 77.26
1 2065.60 81.32
0 2168.88 85.39
Table 3. Oxygen levels and an approximation of the reading on a manometer in mm/inches of water as well as the corresponding danger level.
(3) Occupational Safety & Health Administration, US Dept. of Labor).

15 Oxygen Depletion in Enclosed Spaces
Equipment used in the experiments
The containment systems used in the experiments are:
1. Keg type containment systems complete with sealable lids. The lids are drilled to take tank connections that will connect with purpose made manometers of suitable height to illustrate the pressure head range required.2. Pipe type of containment systems with sealable and adjustable plugs with connections that permit connection to the manometer.3. A steel chamber to simulate a chain locker with suitable connection and drain points for measuring and drainage. This containment was provided by Messrs. Seftec, Carrigaline, Co. Cork.4. 3 Manometers made to suit specific conditions which are used to measure the anticipated partial vacuum generated by the rusting within the experimental containment and thus enable the monitoring of the oxygen level.5. Systech Transducer for measuring oxygen content complete with read out meter and data logging device. This Transducer was provided by KPS Maritime Services Ltd.6. Concrete mixer used for occasional cleaning of steel contents of the experiments.7. Grit for use with concrete mixer for cleaning steel contents. Similar to that used in grit blasting of ships hulls.8. Power washer for initial cleaning of steel contents and containers to remove sludge etc.9. Adjacent Space Experiment test rig.

16 Oxygen Depletion in Enclosed Spaces
The only constituent of air that is absorbed through the rusting process is oxygen1 and therefore with the other constituents of air being of an inert nature any reduction in pressure internally in the container will be as a direct result of oxygen depletion due to rusting and will be as reliable as any other type of monitoring from an experimental point of view.
The experiments have to be carried out using an air tight container to prevent any air from outside leaking in and distorting the vacuum readings. The container should be of adequate strength so as to prevent distortion due to the partial vacuum created by the oxygen depletion.
To illustrate the absorption of oxygen in the rusting process, the contents were lightly sprayed with water. As the oxygen within the sealed container is consumed by the contents, the vacuum created will be illustrated by the manometer measurement and this will represent the oxygen level within the container. When all the oxygen within the container has been consumed the manometer will read 2168.88 mm of water vacuum.
The oxygen level at any instant will be ascertained by measuring the manometer water level and translating this through a formula which will then indicate the oxygen content. The partial pressure of oxygen is represented by a column of water as set out in Table 3.
It is important to note that the experiments were carried out under ideal conditions, and will differ from the actual rate of depletion in cargo holds and tanks due to probable air ingress. This is discussed later in the open vented experiments.
1 Water vapour is also consumed in oxidation, however, in this project, the metal was sprayed with water, thus no water vapour from air is used.
The purpose of the experiment is to illustrate the oxygen depletion by rusting or oxidation in scrap metal cargoes and also to illustrate the speed at which the oxygen depletion takes place. Oxygen depletion will create a vacuum within a closed container containing steel off-cuts and nails, and this vacuum is measured by a manometer connected to the top of the container. The parameters which affect oxidation or in other words oxygen depletion by a cargo such as scrap metal are surface area of material available for rusting, oxygen level, moisture and temperature.
Oxygen Depletion in a sealed container
Fig. 2. Scrap metal cargoes

17 Oxygen Depletion in Enclosed Spaces
However atmospheric pressure changes will affect the height of water in the manometer. The effect of high pressure is to increase the height of the water in the column giving an illusion of greater oxygen depletion than has actually taken place. Atmospheric pressure readings were taken from available data at Cork and Glasgow Airports and mathematical calculations were carried out to ascertain the correct oxygen level within the container.
Constant temperature is required as wide temperature swings will cause the air in the container to expand or contract, thereby slightly raising or lowering the internal pressure, as well as changing the rate of oxidation. It is important to ensure that all components have stabilized at room temperature prior to commencing the experiment.
Readings should be taken at regular intervals preferably on an hourly basis from an accuracy point of view.
Particular emphasis is to be placed on the first few hours of the experiment from an impact point of view and particularly during the time frame within the safe oxygen levels.
All experiments were carried out on the basis that the enclosed containment space was well ventilated so that the contents were immersed in fresh air containing 20.9% Oxygen. To achieve this, the contents were well ventilated using a blower. There was sufficient space or permeability for air to be distributed throughout the simulated cargo of 20kg of cleaned nails which was sprayed with a small amount of water to replicate rain conditions.
Fig. 3 Burke Oxygen depletion experiment set up (BODE)
The first set of experiments was conducted in Cork using the Burke Oxygen Depletion Experiment (BODE) set up. Controlling the temperature was challenging and a total of 40 experiments ran over 30 months to be able to get comparable results at the same temperature. Only 5 experiments are presented in the following graph where the temperature was constant at 10˚C. The permeability or free air space within the container was calculated to be 80%. The contents were lightly sprayed with water the same procedure was followed in all experiments.
Following the experiments in Cork, a second set was conducted in Glasgow to study the effect of higher temperature and where the permeability was the same. The temperature in the second set was 23˚C. The contents were lightly sprayed with water. Figure 3 shows Burke Oxygen Depletion Experiments (BODEs) set up.
17 Oxygen Depletion in Enclosed Spaces
18 Oxygen Depletion in Enclosed Spaces
212019181716151413121110987654321
0.50.0 1.0 1.5 2.0 2.5 3.0 3.5 4.0 4.5 5.0 5.5 6.00
1 2 3 4 5
Oxy
gen
%
Time (Hours)
212019181716151413121110987654321
0.0 1 2 3 4 5 6 7 8 9 10 11 12 13 14 15 16 17 18 200
19
Oxy
gen
%
Time (Hours)
1 2 3 4 5 6 7 8 9
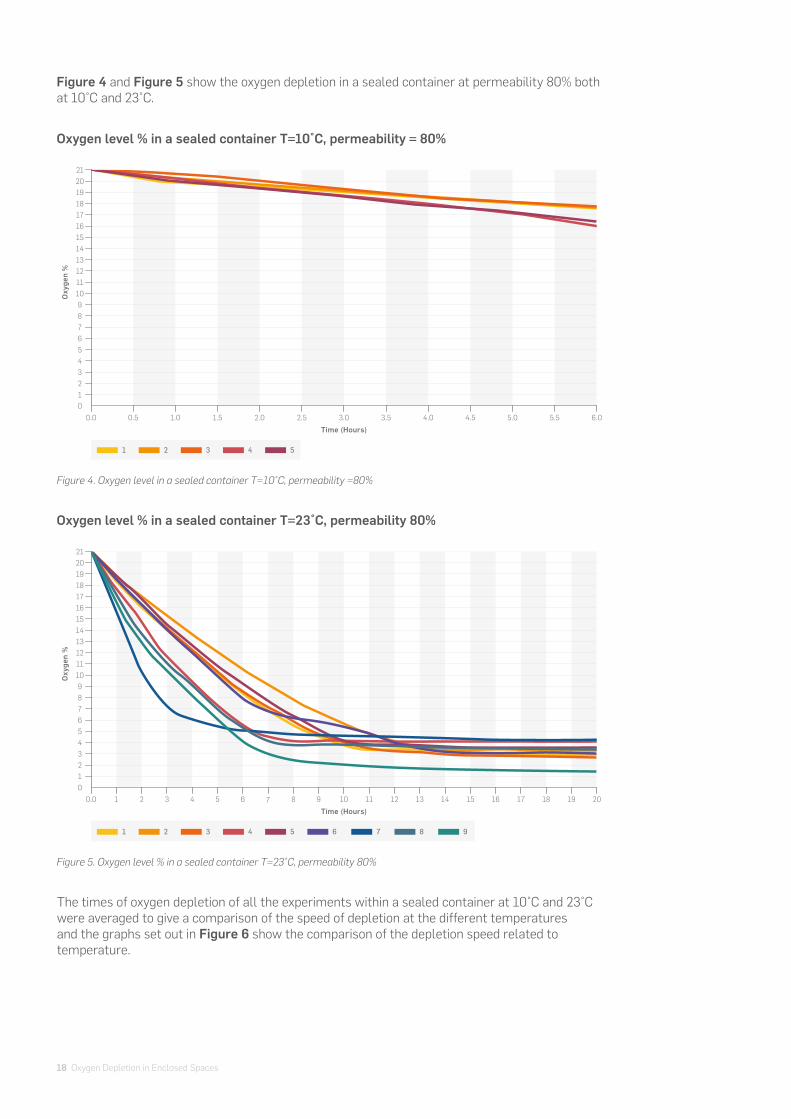
Figure 4 and Figure 5 show the oxygen depletion in a sealed container at permeability 80% both at 10˚C and 23˚C.
Oxygen level % in a sealed container T=10˚C, permeability = 80%
Oxygen level % in a sealed container T=23˚C, permeability 80%
Figure 4. Oxygen level in a sealed container T=10˚C, permeability =80%
Figure 5. Oxygen level % in a sealed container T=23˚C, permeability 80%
The times of oxygen depletion of all the experiments within a sealed container at 10˚C and 23˚C were averaged to give a comparison of the speed of depletion at the different temperatures and the graphs set out in Figure 6 show the comparison of the depletion speed related to temperature.

19 Oxygen Depletion in Enclosed Spaces
212019181716151413121110987654321
0.0 1 2 3 4 5 6 7 8 9 10 11 12 13 14 15 16 17 18 20 21 22 23 24 25 26 27 28 29 300
19
Oxy
gen
%
Time (Hours)
Closed Containment Experiment
Comparison of Oxygen depletion rate in experiments at 10°C and 23°C
Figure 6 Oxygen level % in a sealed container at 10˚C and 23˚C
Table 4 The average times of oxygen depletion at 10˚C and 23˚C for a sealed container
The difference in the rate of oxygen depletions between the two set of experiments can be explained be the facts that oxidation or in other words rusting takes place much faster at higher temperatures, hence more oxygen is being consumed which corresponds to the faster rate of oxygen depletion. The results also show that after 4.37 hours on average the oxygen level drops below 6% at 23˚C. Nonetheless, even in the first set of experiments at 10˚C where it took 1.70 hours for the oxygen level to drop 19.5%, it is still indeed very alarming considering the fact that entering into enclosed spaces is one of the highest cause of death at sea, even though the dangers of enclosed spaces are covered in general courses in health and safety for personnel working in board ships. However, entry into enclosed spaces courses are neither mandatory nor is there any awareness how fast oxygen is depleted once a space is enclosed.
Both graphs show the alarming rate at which oxygen was depleted as soon as the containers were sealed. In the first set of experiments where the temperature was 10˚C, it only took 1.70 hours on average for oxygen to drop to 19.5% which is the minimum safe level as discussed earlier. On the other hand the second set of experiments where the temperature was 23˚C and loading in-rain conditions, the results were even more alarming. It only took 23 minutes for the oxygen level to drop below the minimum safe level. The averages of the complete set of results of time of oxygen level to drop to 19.5%, 10%, and 6% at 10˚C and 23˚C are set out in Table 4.
The times of oxygen depletion of all the experiments within a sealed container at 10˚C and 23˚C were averaged to give a comparison of the speed of depletion at the different temperatures and the graphs set out in Figure 6 show the comparison of the depletion speed related to temperature.
Depletion rate at 10°C
Depletion rate at 23°C
Experiment Type:Sealed Containment T (°C) Time (Hours)
to 19.5% 02
Time (Hours)to 10% 02
Time (Hours)to 6% 02
Sealed Containment 10°C 1.7 15.9 25.3
Sealed Containment 23°C 0.38 2.63 4.37

20 Oxygen Depletion in Enclosed Spaces
212019181716151413121110987654321
0.0 1 2 3 4 5 6 7 8 9 10 11 12 13 14 15 16 17 18 200
19
Manometer Transducer
Oxy
gen
%
Time (Hours)
Oxygen level % in a sealed container , T= 10˚C, Permeability = 80% , moist conditions*
Figure 7 Oxygen level % measured by the manometers and the transducer (Combined Experiment)
To validate the readings of the manometers manufactured specifically for the purpose of this project, another set of experiments were conducted using an oxygen transducer and the manometers at the same time. The oxygen transducer gives the concentration of oxygen directly. The readings were taken at the same time at certain intervals. The other parameters were constant the temperature 10˚C, the permeability 80%. Figure 7 shows the graphs of the combined experiments where both the manometer and the transducer were used at the same time.
The graph clearly shows that the readings of the oxygen concentration in air measured by the manometer or the transducer were the same and there was no significant difference between both results which proves that using the manometers manufactured for the project were as valid and accurate as a means of measurement as the transducer.

21 Oxygen Depletion in Enclosed Spaces

22 Oxygen Depletion in Enclosed Spaces
In order to prove that this occurs, an experimental test rig was manufactured to simulate the possibility. The experiment or test rig is titled “Burke Adjacent Spaces Experiment (BASE)”. A steel pipe of approximately: 200mm length x 77mm internal diameter, with a square steel plate sealing each end is used. These end plates have holes drilled that will accommodate the following:
1. One end was drilled and tapped in order to accommodate a short length of 12mm stud bar and lock nut on the outside. This nut was tightened by means of a socket after a 1¼” F.I. pipe coupling was welded onto the end. This will illustrate how air will penetrate through the end plate arrangements. Thereafter a fitting was used to reduce from the 1¼” pipe coupling to ½” copper to enable the new test rig to be connected to the oxygen depletion experiment rig.
2. The other end was drilled to allow access to a manometer for measurement purposes. A ¾” F.I. pipe coupling was welded to the outside of this end plate with a reducer to accommodate a ½” copper connection. This is to permit attachment to a secondary manometer.
The purpose is to illustrate that whilst it appears that the end piece representing a bulkhead is sealed, air can still penetrate through this end piece or bulkhead between the threads of the stud bar & nut and the end plate, or indeed any other very small opening. In this case the leakage space is the cross sectional area between the threads is calculated at 0.426mm².
A connection pipe arrangement will attach between the BODE pipe container and the main manometer with a valve controlled connection to the new test rig. This will enable the test rig to illustrate leakage when a partial vacuum has occurred within the main containment system. This is best simulated for effect when a sufficient vacuum has built up and the point proved of the oxygen depletion experiment. Figure 8 shows Burke Adjacent Space Experiment (BASE) rig and Figure 9 shows the experimental set up.
Spaces adjacent to chain lockers or cargo spaces with an access door or hatch to the adjacent space (e.g. the forecastle or similar spaces) are also susceptible to oxygen depletion. Even a very small opening will permit air to be drawn into the cargo hold or chain locker from this adjacent space, which subsequent reduction in oxygen content. Air may ingress through the access hatch or door; however most should be water tight. Chain lockers may well have the vents closed and the spurling pipe sealed to prevent water ingress in bad weather thereby increasing the risk of air being drawn into the depleted space from adjacent spaces.
Oxygen Depletion in adjacent spaces
22 Oxygen Depletion in Enclosed Spaces
Figure 8. Burke Adjacent Space Experiment (BASE) rig.

23 Oxygen Depletion in Enclosed Spaces
Figure 9. BASE set up.
If all of the oxygen in the BODE container is depleted including the oxygen in the air drawn in from the BASE rig. Leakage between the two spaces will occur until the pressures in both spaces have equalised. The air pressure in the BASE rig will then be 80.425kPa which means that the oxygen level within the BASE Rig will be reduced pro-rata by 20.9/101.325 of the original amount of 20.9% oxygen content, this reduction amounts to 4.31%.
The secondary indicating manometer reading of the BASE Rig will be similar to the BODE manometer reading; however this indicates the reduction of pressure in the air in this case.
The assumption is that no other factor is involved within the adjacent space that will add to a further reduction through corrosion or oxygen absorption within the adjacent space.
This oxygen level will be the equivalent of working at an altitude of 6000 feet or 1890 metres.
Adjacent spaces if unvented will generally contain a limited amount of air whereas the hold will be much larger and therefore the cargo within the hold can absorb a substantial amount of oxygen.
This air reduction and equivalent oxygen level reduction will result in danger levels associated with this oxygen content to be of “decreasing ability to work, and dangers for persons with coronary, pulmonary or circulatory problems” as shown earlier in Table 3.
Original oxygen concentration in BASE rig is: 20.9%
Estimated oxygen reduction within adjacent space will now be: 4.31%
New oxygen level within adjacent space will now be: 16.59%

24 Oxygen Depletion in Enclosed Spaces
Figure 10. The manometers readings of BASE and BODE rigs.
Two separate trials using the BASE rig were conducted::
1. In the first trial the BODE and BASE experiments ran simultaneously. It took 7 hours for the oxygen level to drop to 4.35% in the BODE rig which corresponds to 84.675 kPaabs inside the container. At the same time the manometer connected to the BASE rig indicated 1720 mm of water vacuum which is equivalent to 84.675 kPaabs. This confirms that as soon as oxygen was consumed in the BODE rig; air was simultaneously drawn through the stud and nut assembly in the BASE end plate.
2. At the end of the first trial, the BASE manometer was isolated and opened to the atmosphere to allow the water level to equalise. After that, it was reconnected to the BODE rig and the connecting valve was opened which allowed the air to be drawn through the nut and stud assembly in the BASE end plate into the BODE container which gave a visual illustration of the accelerated speed of air leakage between adjacent spaces. Allowing air from the BASE rig into the BODE containment will reduce the vacuum therein, which will increase the absolute pressure. The time taken for the pressures to equalise to 88.105 kPaabs both in the BODE and BASE manometers was 35 minutes. This is quite fast and gives an indication of how quickly depletion of the adjacent space can occur especially considering the size of the opening for this leakage which was 0.426 mm2. This depletion of the adjacent space atmosphere also highlights what happens if the access way to the cargo space from the adjacent space is inadvertently opened for whatever reason thereby causing the adjacent space to deplete to a level of oxygen that is unsafe. Figure 10 shows the manometers after pressure equalizations after 35 minutes.

25 Oxygen Depletion in Enclosed Spaces

26 Oxygen Depletion in Enclosed Spaces
Figure 11 shows the open vented experiment set up and Figure 12 shows oxygen depletion in an open vented pipe.
Figure 12 and Figure 13 show the oxygen depletion in an open vented container at permeability 80% both at 10˚C and 23˚C.
In comparing the experiment to an actual cargo hold where air enters from outside (or from adjacent linked areas into the cargo space) open vented experiments utilising a Systech Transducer and data logging device. The temperature and permeability were 10˚C and 80% respectively. The contents were lightly sprayed with water; the same procedure was followed in all experiments.
Oxygen depletion in an open vented container
212019181716151413121110987654321
10 2 3 4 5 6 7 8 109 11 12 13 14 15 16 17 18 19 20 21 22 23 240
1 2 3 4
Oxy
gen
%
Time (Hours)
Oxygen level % in an open vented pipe at 10˚C , dry conditions*
Figure 12. Oxygen level % in an open vented pipe at 10˚C in dry conditions.
Figure 12. Open vented containment set up.

27 Oxygen Depletion in Enclosed Spaces
The times of oxygen depletion of all the experiments within an open vented containment at 10˚C and 23˚C were averaged to give a comparison of the speed of depletion at the different temperatures and graph Figure 14 show the comparison of the depletion speed related to temperature.
212019181716151413121110987654321
10 2 3 4 5 6 7 8 109 11 12 13 14 15 16 17 18 19 20 21 22 23 240
1 2 3
Oxy
gen
%
Time (Hours)
Oxygen level % in an open vented pipe T = 23˚C
Figure 13 Oxygen level % in an open vented pipe at 23˚C
27 Oxygen Depletion in Enclosed Spaces
212019181716151413121110987654321
0.0 2 4 6 8 10 12 14 16 18 20 22 24 26 28 30 32 34 36 40 42 44 46 48 50 52 54 56 58 600
38
Oxy
gen
%
Time (Hours)
Open Containment Experiment
Comparison of Oxygen depletion rate in experiments at 10˚C and 23˚C
Figure 14 Oxygen level % in an open vented containment at 10˚C and 23˚C
Depletion rate at 10°C
Depletion rate at 23°C

28 Oxygen Depletion in Enclosed Spaces
Both graphs show the alarming rate at which oxygen was depleted as soon as the containers were sealed. In the first set of experiments where the temperature was 10˚C, it only took 2.03 hours on average for oxygen to drop to 19.5% which is the minimum safe level as discussed earlier. On the other hand the second set of experiments where the temperature was 23˚C and loading in-rain conditions, the results were even more alarming. It only took 0.93 hours for the oxygen level to drop below the minimum safe level.
The averages of the complete set of results of time of oxygen level to drop to 19.5%, 10%, and 6% at 10˚C and 23˚C are set out in Table 5.
The difference in the rate of oxygen depletions between the two set of experiments can be explained be the facts that oxidation or in other words rusting takes place much faster at higher temperatures and in wet conditions, hence more oxygen is being consumed which corresponds to the faster rate of oxygen depletion. The results also show that after 8.05 hours on average the oxygen level drops below 6% at 23˚C.
Nonetheless, even in the first set of experiments at 10˚C where it took 2.03 hours for the oxygen level to drop 19.5%, it is still indeed very alarming considering the fact that entering into enclosed spaces is one of the highest cause of death at sea, even though the dangers of enclosed spaces are covered in general courses in health and safety for personnel working in board ships. However, entry into enclosed spaces courses are neither mandatory nor is there any awareness how fast oxygen is depleted once a space is enclosed.
Table 5 The average times of oxygen depletion at 10˚C and 23˚C for an open vented container
Experiment Type:Open Vented Containment T (°C) Time (Hours)
to 19.5% 02
Time (Hours)to 10% 02
Time (Hours)to 6% 02
Open Vented Containment 10°C 2.03 30.05 48.76
Open Vented Containment 23°C 0.93 5.65 8.05

29 Oxygen Depletion in Enclosed Spaces
30 Oxygen Depletion in Enclosed Spaces
The scale model chain locker size has been calculated on a scale comparable with an actual chain locker therefore it reasonably accurately replicates a chain locker without forced ventilation. The permeability of the space is as high as 94%. This has been ascertained prior to the experiment when the volume of the steel was measured.
A connection point has been drilled and tapped into the side of the chain locker at an approximate level where a person might stand if they entered the space, and this will be used as the test. This will be an open vented experiment with a vent pipe as a chain locker is. The tank lid is transparent polycarbonate material allowing visual inspection to show how clear the contents are and also enable one to observe the rust crystals forming on the material within. The data gathered will show up in both graphic and data format utilising the Systech Transducer and a Data Logging device EL-USB-4.
The calculations are based on an actual vessel: the MV Cill Airne having 1.25” diameter chain and 11 Lengths of chain. The air to steel ratio of the Cill Airne Chain Locker is approx. 20.35:1 by volume. A more relevant ratio for rusting purposes is the surface areas of the chain to the experiment steel which is calculated at 21.36:1.
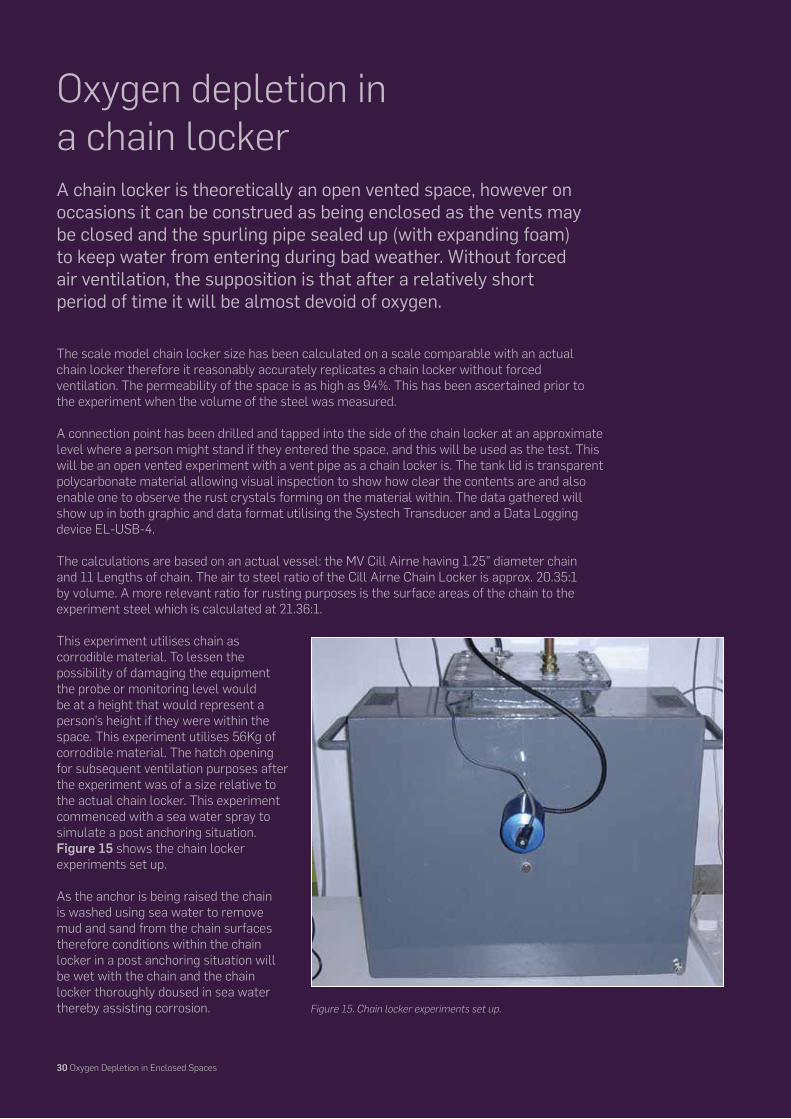
This experiment utilises chain as corrodible material. To lessen the possibility of damaging the equipment the probe or monitoring level would be at a height that would represent a person’s height if they were within the space. This experiment utilises 56Kg of corrodible material. The hatch opening for subsequent ventilation purposes after the experiment was of a size relative to the actual chain locker. This experiment commenced with a sea water spray to simulate a post anchoring situation. Figure 15 shows the chain locker experiments set up.
As the anchor is being raised the chain is washed using sea water to remove mud and sand from the chain surfaces therefore conditions within the chain locker in a post anchoring situation will be wet with the chain and the chain locker thoroughly doused in sea water thereby assisting corrosion.
A chain locker is theoretically an open vented space, however on occasions it can be construed as being enclosed as the vents may be closed and the spurling pipe sealed up (with expanding foam) to keep water from entering during bad weather. Without forced air ventilation, the supposition is that after a relatively short period of time it will be almost devoid of oxygen.
Oxygen depletion in a chain locker
Figure 15. Chain locker experiments set up.
30 Oxygen Depletion in Enclosed Spaces

31 Oxygen Depletion in Enclosed Spaces
Figure 16 shows the oxygen depletion in a chain locker at 10˚C, permeability 94% conditions and Figure 17 shows the oxygen depletion in a chain locker at 23˚C, permeability 94%.
One set of three experiments were conducted at 10°C and a further set of three experiments at 23˚C, with a permeability 94% inside the chain locker utilising a Systech Transducer and data logging device. Figure 17 shows oxygen depletion in a chain locker at 23˚C.
Oxy
gen
%
Time (Hours)
212019181716151413121110987654321
10 2 3 4 5 6 7 8 109 11 12 13 14 15 16 17 18 19 20 21 22 23 240
1 2 3 4
Oxy
gen
%
Time (Hours)
212019181716151413121110987654321
10 2 3 4 5 6 7 8 109 11 12 13 14 15 16 17 18 19 20 21 22 23 240
1 2 3
Oxygen level % in a chain locker, permeability= 96%, T=10˚C, sea water
Oxygen level % in a chain locker, permeability= 96%, T=23˚C, sea water
Figure 16. Oxygen level in a chain locker, permeability 96%, T=10˚C, sea water
Figure 17. Oxygen level in a chain locker, permeability 96%, T=23˚C, sea water

32 Oxygen Depletion in Enclosed Spaces
Figure 12 shows the average times taken for the oxygen level inside a replicated chain locker at 10˚C to drop to 19.5%, 10% and 6% were 4.53,38.48,58.17 hours respectively. Figure 17 shows the average times taken for the oxygen level inside a replicated chain locker at 23˚C to drop to 19.5%, 10% and 6% were 2.05,17.25,27.17 hours respectively.
The rate of oxygen depletion inside the chain locker is very alarming and it clearly contradicts the commonly held view that oxygen depletion is slow and progressive over time.
The times of oxygen depletion of all the experiments within a replicated chain locker at 10˚C and 23˚C were averaged to give a comparison of the speed of depletion at the different temperatures. Figure 18 and Table 6 show the comparison of the depletion speed related to temperature.
As previously ascertained rusting takes place much faster at higher temperatures and in wet conditions, hence more oxygen is being consumed which corresponds to the faster rate of oxygen depletion. The results also show that after 27.17 hours on average the oxygen level drops below 6% at 23˚C. Nonetheless, even in the first set of experiments at 10˚C where it took 4.53 hours for the oxygen level to drop 19.5%.
An oxygen depleted atmosphere “looks normal” as there is nothing readily obvious to cause alarm regarding the dangers within the enclosed space. This condition can be observed clearly in the Chain Locker experiment through the transparent polycarbonate lid whilst being aware of the depleted oxygen readings.
Table 6 The average times of oxygen depletion at 10˚C and 23˚C for a chain locker
Experiment Type:Chain Locker (Open Vented) T (°C) Time (Hours)
to 19.5% 02
Time (Hours)to 10% 02
Time (Hours)to 6% 02
Chain Locker (Open Vented) 10°C 1.7 15.9 25.3
Chain Locker (Open Vented) 23°C 0.38 2.63 4.37
212019181716151413121110987654321
0.0 2 4 6 8 10 12 14 16 18 20 22 24 26 28 30 32 34 36 40 42 44 46 48 50 52 54 56 58 600
38
Oxy
gen
%
Time (Hours)
Chain Locker Experiment
Comparison of Oxygen depletion rate in experiments at 10˚C and 23˚C
Figure 18. Oxygen level % in an open vented containment at 10°C and 23°C
Depletion rate at 10°C
Depletion rate at 23°C

33 Oxygen Depletion in Enclosed Spaces

34 Oxygen Depletion in Enclosed Spaces
This rapid reduction of oxygen level is a significant factor that administrations, companies, crew members, teaching and training establishments should highlight in trying to prevent deaths in cases of entry into enclosed spaces. It is clear from the experiments that once the hatch covers or tank lids are closed, the oxygen contained within the space is immediately being absorbed by the cargo or due to rusting within a space, and that enclosed spaces must at all times be treated as unsafe. Any access way to the cargo hold such as in the forecastle area must also be suspected as being devoid of oxygen as even a very small leakage will deplete the air content of the adjacent space. Ballast Tanks, Fresh Water Tanks, Cofferdam’s etc. will react slower but will deplete over time and thereafter will be completely devoid of oxygen.
Chain lockers will probably behave in a similar manner to the experiment due to the large amount of chain surface, however the speed of depletion will be slower due to the air / steel ratio, but once depleted the space will be completely devoid of oxygen. The spurling pipe may well be sealed with expanding foam and the vents also closed to prevent ingress of water whilst at sea, thereby rendering it a sealed space.
The project shows that the time for the oxygen level inside a sealed container to drop to 19.5%, 10%, and 6% at 10°C and 23°C are set out in the following table.
When similar experiments were carried out using an open vented containment system at 10˚C at 23˚C the average times for the oxygen level to drop to 19.5%, 10% and 6% were as follows:
Summary
Experiment Type:Open Vented Containment T (°C) Time (Hours)
to 19.5% 02
Time (Hours)to 10% 02
Time (Hours)to 6% 02
Open Vented Containment 10°C 2.03 30.05 48.76
Open Vented Containment 23°C 0.93 5.65 8.05
Experiment Type:Sealed Containment T (°C) Time (Hours)
to 19.5% 02
Time (Hours)to 10% 02
Time (Hours)to 6% 02
Sealed Containment 10°C 1.7 15.9 25.3
Sealed Containment 23°C 0.38 2.63 4.37

35 Oxygen Depletion in Enclosed Spaces
In a combined BODE and BASE rig experiments where both rigs were interconnected it took 7 hours for the oxygen level to drop to 4.35% in the BODE rig which corresponds to 84.675 kPaabs inside the sealed container. At the same time the manometer connected to the BASE rig indicated 1720 mm of water vacuum which is equivalent to 84.675 kPaabs. This confirms that as soon as oxygen was consumed in the BODE rig; air was simultaneously drawn through the stud and nut assembly in the BASE end plate.
This depletion of the adjacent space atmosphere highlights what happens if the cargo space is inadvertently opened for whatever reason causing the adjacent space to deplete to a level of oxygen that is unsafe.
The study shows that within a replicated chain locker at 10˚C and 23˚C the average times for the oxygen level to drop to 19.5%, 10% and 6% were as follows:
Indeed the results are extremely alarming. The Maritime and Coastguard Agency published that “101 Enclosed Space Accidents reported between March 1998 and May 2009 including 93 fatalities and 96 injuries, Since May 2009, a further 14 accidents resulting in 14 deaths and 9 injuries on the MAIB database alone” (Clinch, 2016). They describe this information as “the tip of the iceberg”.
Experiment Type:Chain Locker (Open Vented) T (°C) Time (Hours)
to 19.5% 02
Time (Hours)to 10% 02
Time (Hours)to 6% 02
Chain Locker (Open Vented) 10°C 1.7 15.9 25.3
Chain Locker (Open Vented) 23°C 0.38 2.63 4.37
36 Oxygen Depletion in Enclosed Spaces
The recommendations of this project are:
1. The widespread promulgation of the results of this research to raise awareness to the Industry and regulatory Authorities of the rapid depletion of Oxygen in enclosed spaces – over hours, not days.2. To highlight that an oxygen depleted atmosphere “looks normal” as there is nothing readily obvious to cause alarm regarding the dangers within the enclosed space.3. The development of educational programmes to raise awareness of the dangers associated with oxygen depletion and to promote best practice at sea. The work done in this project can be duplicated in these educational programmes. Ideally the experiment should be commenced at the beginning of an enclosed spaces course. During the course, the progress of the vacuum can be observed and act as an added heightening of awareness of the dangers involved. This will be extremely relevant when the minimum permissible oxygen level is reached and the related time involved.4. Training of entry into enclosed spaces should become mandatory.5. The urgent development of low cost sensor technology to continuously monitor oxygen levels and clearly identify when an enclosed space is safe to enter.
Many lives have been lost as a result of the lack of awareness of the rate of oxygen depletion in enclosed space. It is time to act now before more incidents happen and more lives are lost.
Recommendations

37 Oxygen Depletion in Enclosed Spaces37 Oxygen Depletion in Enclosed Spaces

38 Oxygen Depletion in Enclosed Spaces
(IMO), I. M. O., 2005. Code of Safe Practice for Solid Bulk Cargo. [Online] Available at: https://www.imo.org [Accessed Aug 2017].
Clinch, S., 2016. Maritime and Coastguard Agency. [Online] Available at: https://www.gov.uk/government/publications/enclosed-spaces-on-sea-going-vessels [Accessed 04 October 2017].
HSE, 2013. Review of alarm setting for toxic gas and oxygen detectors. [Online] Available at: http://www.hse.gov.uk/ [Accessed 15 Aug 2017].
IMO, I. M. O., 2005. Code of Safe Practice for Solid Bulk Cargo. [Online] Available at: https://www.imo.org [Accessed Aug 2017].
MAIB, 2008. Entering Dangerous Enclosed/Confined Spaces. [Online] Available at: http://www.fisg.org.uk/fisg/MAIB/Flyers/2008 [Accessed 10 Sep 2017].
MAIB, 2008. www.maib.gov.uk. [Online] Available at: http://www.fisg.org.uk/fisg/MAIB/Flyers/2008 [Accessed 10 Sep 2017].
Urban Svedberg, C. P. a. G. J., 2009. Oxygen Depletion and Formation of Toxic Gases following Sea Transportaion of Logs and Wood Chips. Oxford University Press, 53(8), pp. 779-787.
References

39 Oxygen Depletion in Enclosed Spaces

40 Oxygen Depletion in Enclosed Spaces
Delivered by Funded byIn Association with


![Inhomogeneous depletion of oxygen ions in metal oxide ...seavernews.lmu.edu/wp-content/uploads/2015/11/...incidence x-ray diffraction [17], dynamic scanning force microscopy [18],](https://img.pdfslide.us/doc/110x75/60de22f0930dc448bd219302/inhomogeneous-depletion-of-oxygen-ions-in-metal-oxide-incidence-x-ray-diffraction.jpg)