Embed Size (px)
Citation preview
OXYCHLORINATION FLUID BED
REACTOR MODELLING AND
SIMULATION
w w w . c f d o i l . c o m . b rw w w. c f d o i l . c o m . b r
Jeã Carlos Santos Moreira (RLAM/OT)
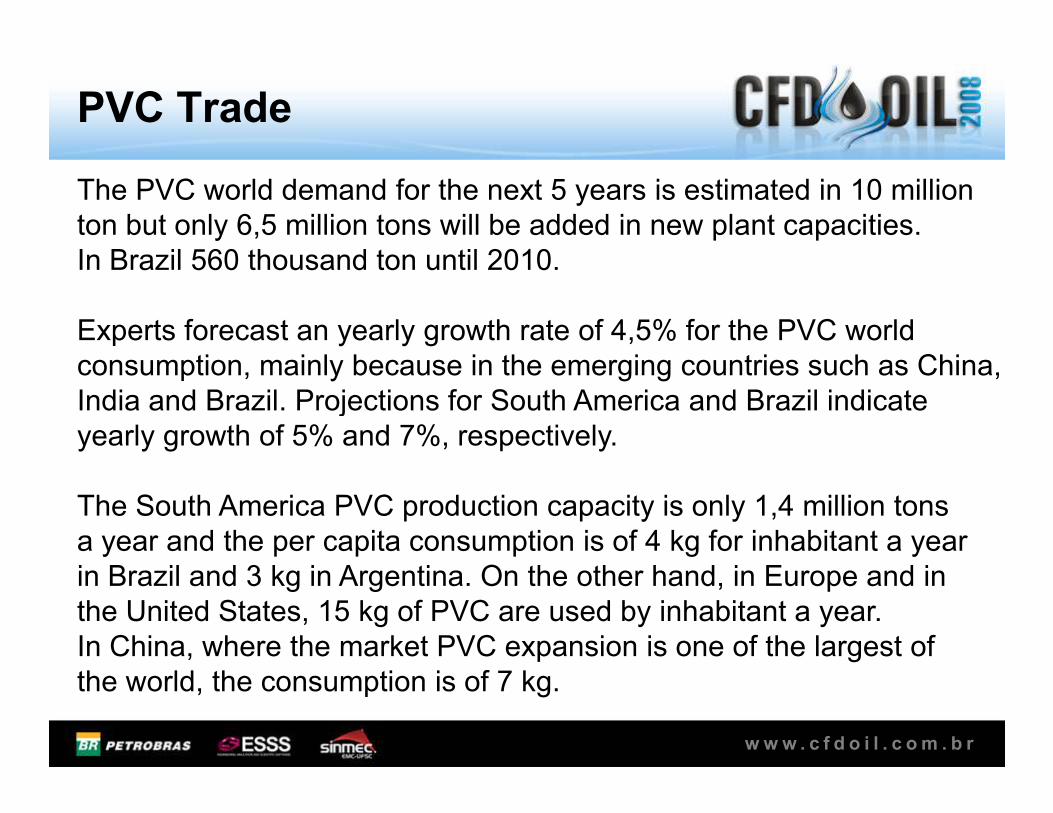
PVC Trade
The PVC world demand for the next 5 years is estimated in 10 million
ton but only 6,5 million tons will be added in new plant capacities.
In Brazil 560 thousand ton until 2010.
Experts forecast an yearly growth rate of 4,5% for the PVC world
consumption, mainly because in the emerging countries such as China,
India and Brazil. Projections for South America and Brazil indicate
w w w . c f d o i l . c o m . b r
India and Brazil. Projections for South America and Brazil indicate
yearly growth of 5% and 7%, respectively.
The South America PVC production capacity is only 1,4 million tons
a year and the per capita consumption is of 4 kg for inhabitant a year
in Brazil and 3 kg in Argentina. On the other hand, in Europe and in
the United States, 15 kg of PVC are used by inhabitant a year.
In China, where the market PVC expansion is one of the largest of
the world, the consumption is of 7 kg.
The goal was develop a model for the
simulation a fluidized bed oxychlorination
reactor in order to investigated through
the sensitivity analysis the effect of
different parameters which influence the
reactor performance and then apply
Problem characterization
w w w . c f d o i l . c o m . b r
reactor performance and then apply
optimization using a commercial software.
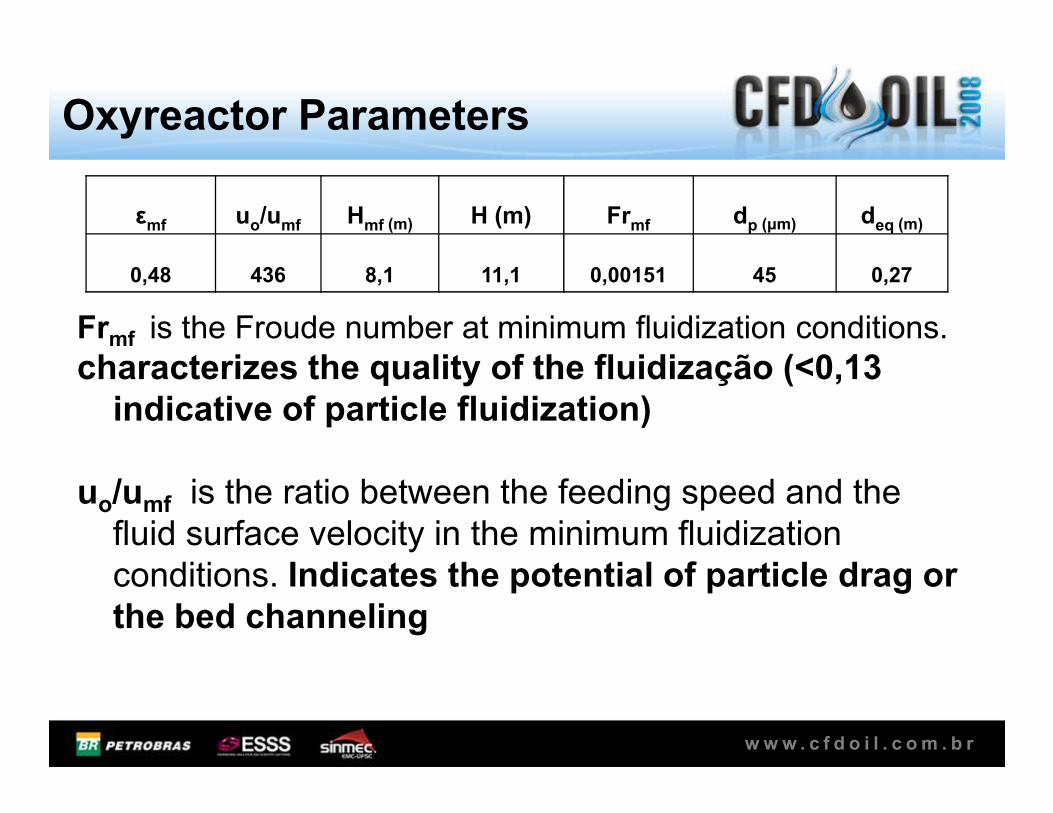
Oxyreactor Parameters
Frmf is the Froude number at minimum fluidization conditions.
characterizes the quality of the fluidização (<0,13 indicative of particle fluidization)
εmf uo/umf Hmf (m) H (m) Frmf dp (µm) deq (m)
0,48 436 8,1 11,1 0,00151 45 0,27
w w w . c f d o i l . c o m . b r
indicative of particle fluidization)
uo/umf is the ratio between the feeding speed and the
fluid surface velocity in the minimum fluidization
conditions. Indicates the potential of particle drag or the bed channeling
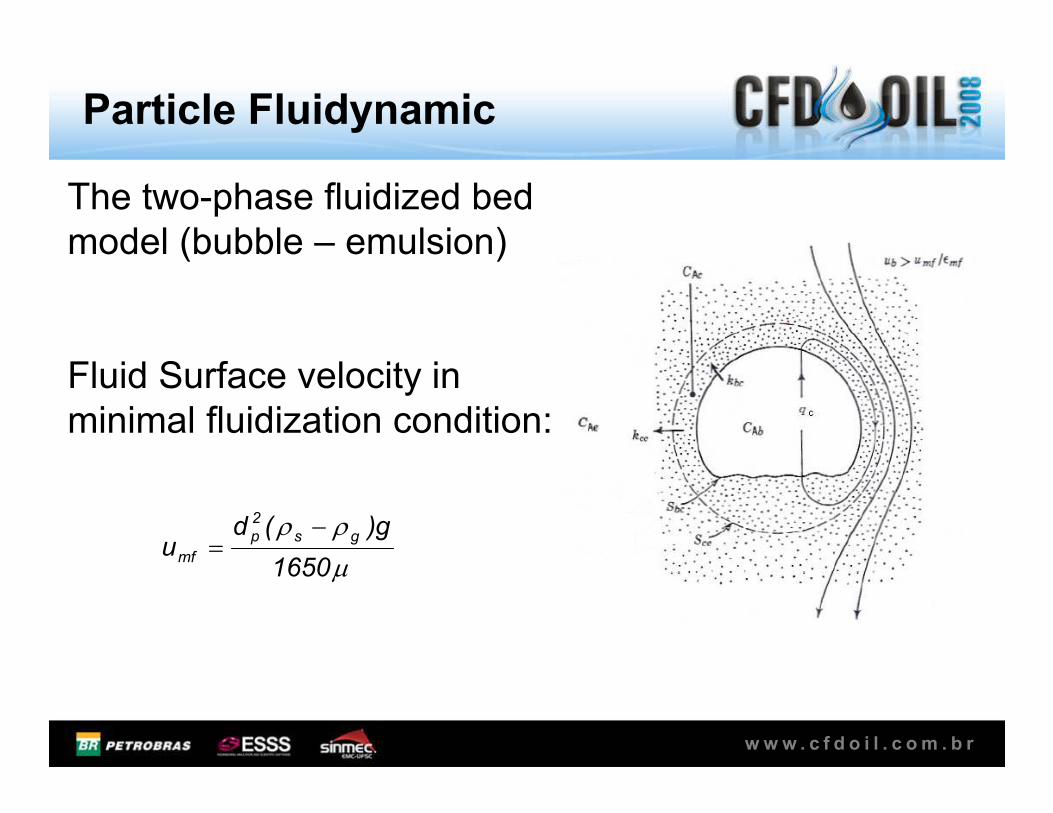
The two-phase fluidized bed
model (bubble – emulsion)
Fluid Surface velocity in
minimal fluidization condition:
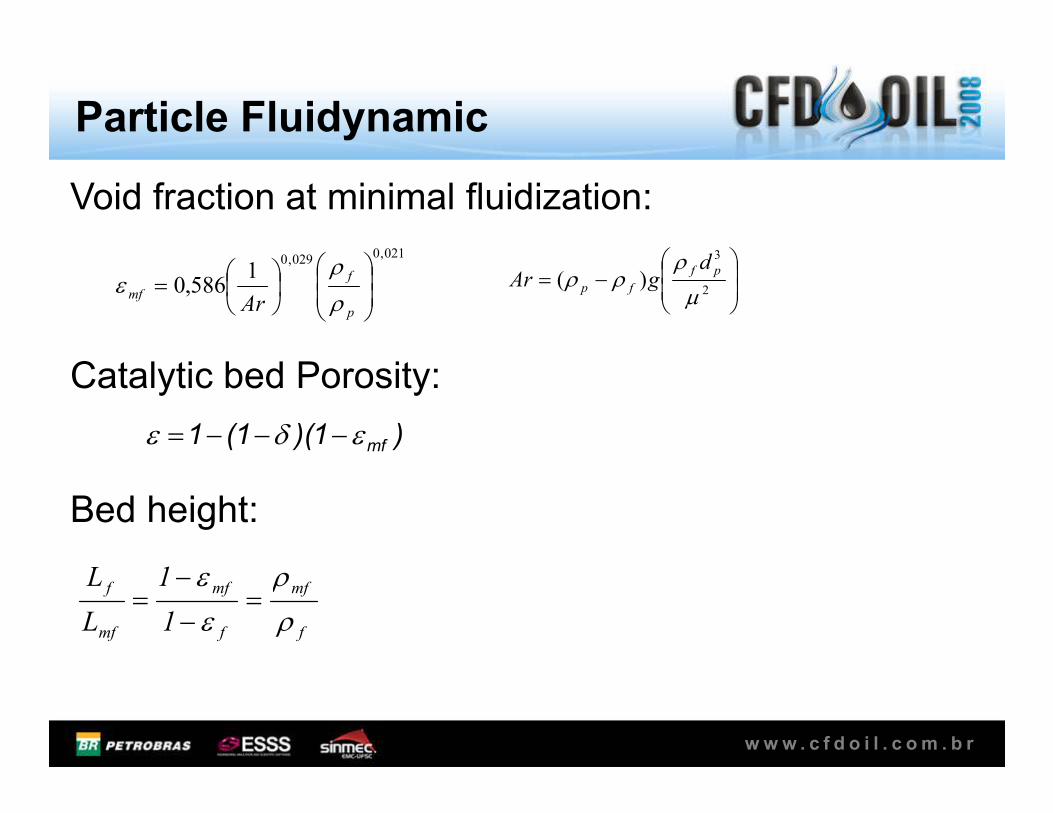
Particle Fluidynamic
w w w . c f d o i l . c o m . b r
minimal fluidization condition:
µ
ρρ
1650
g)(du
gs
2
p
mf
−=
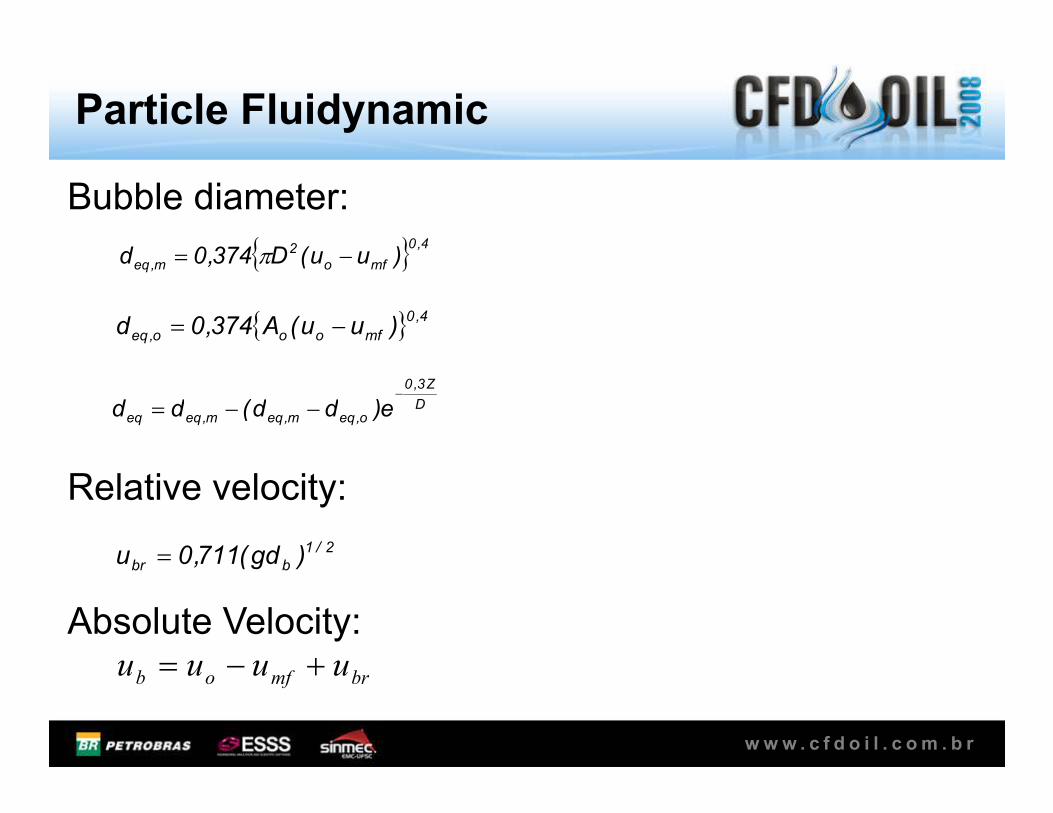
Particle Fluidynamic
Bubble diameter:
4,0
mfo
2
m,eq )uu(D374,0d −= π
D
Z3,0
e)dd(dd−
−−=
4,0
mfooo,eq )uu(A374,0d −=
w w w . c f d o i l . c o m . b r
Relative velocity:
Absolute Velocity:
brmfob uuuu +−=
2/1
bbr )gd(711,0u =
Do,eqm,eqm,eqeq e)dd(dd −−=
Particle Fluidynamic
Void fraction at minimal fluidization:
Catalytic bed Porosity:
021,0029,0
1586,0
=p
f
mfAr ρ
ρε
−=
2
3
)(µ
ρρρ pf
fp
dgAr
w w w . c f d o i l . c o m . b r
Bed height:
)1)(1(1 mfεδε −−−=
f
mf
f
mf
mf
f
1
1
L
L
ρ
ρ
ε
ε=
−
−=
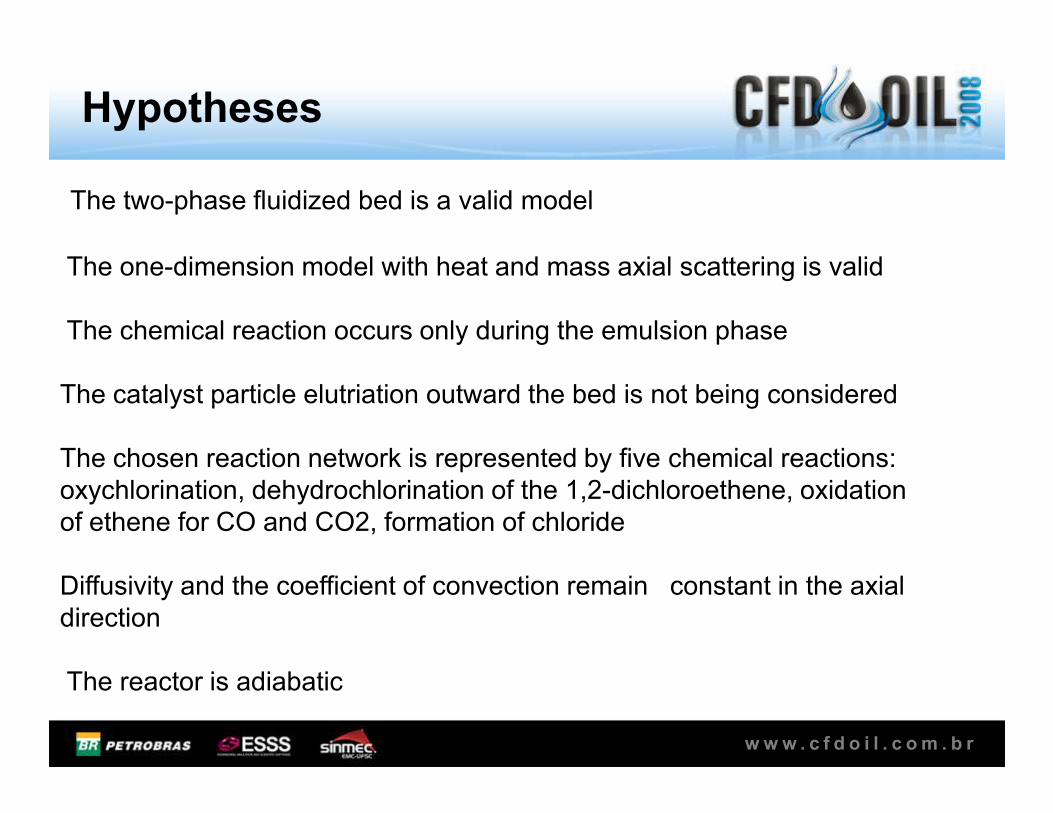
Hypotheses
The two-phase fluidized bed is a valid model
The one-dimension model with heat and mass axial scattering is valid
The chemical reaction occurs only during the emulsion phase
The catalyst particle elutriation outward the bed is not being considered
w w w . c f d o i l . c o m . b r
The catalyst particle elutriation outward the bed is not being considered
The chosen reaction network is represented by five chemical reactions:
oxychlorination, dehydrochlorination of the 1,2-dichloroethene, oxidation
of ethene for CO and CO2, formation of chloride
Diffusivity and the coefficient of convection remain constant in the axial
direction
The reactor is adiabatic
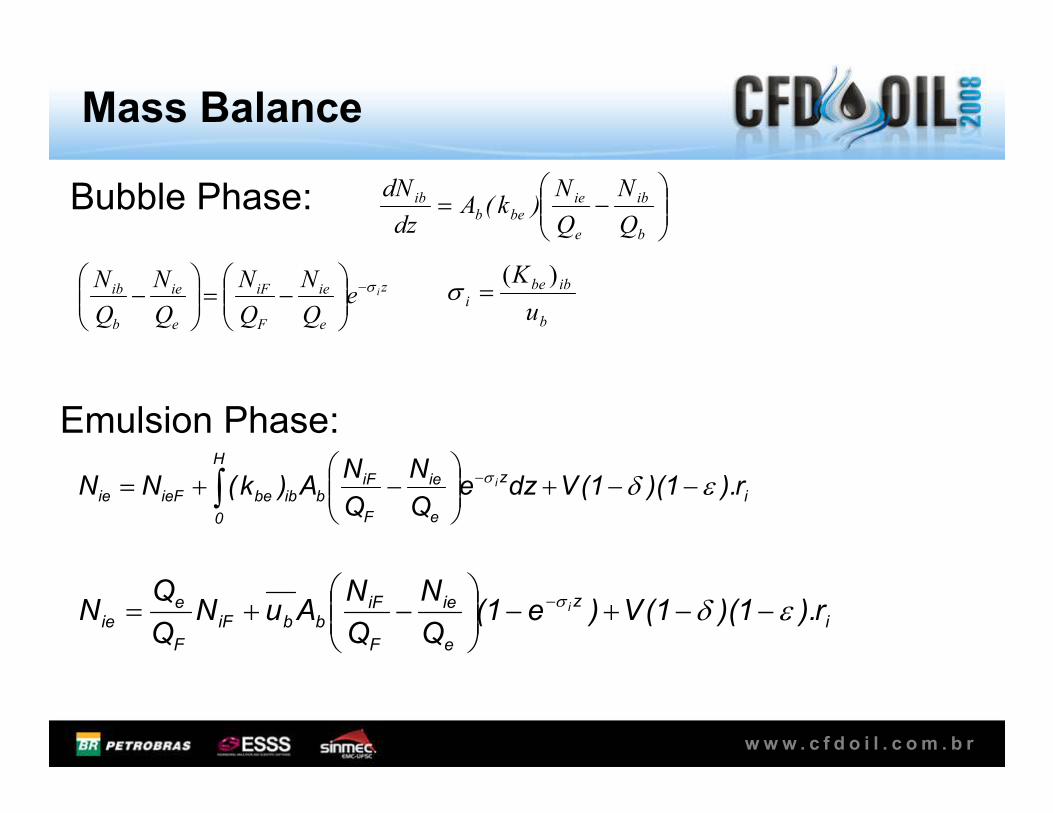
Mass Balance
Bubble Phase:
Emulsion Phase:
−=
b
ib
e
ie
beb
ib
Q
Q
)k(A
dz
d
z
e
ie
F
iF
e
ie
b
ib ieQ
Q
Q
Q
σ−
−=
−
b
ibbe
iu
K )(=σ
w w w . c f d o i l . c o m . b r
Emulsion Phase:
i
z
e
ie
F
iFb
H
0
ibbeieFie r).1)(1(VdzeQ
N
Q
NA)k(NN i εδσ −−+
−+= −∫
i
z
e
ie
F
iFbbiF
F
eie r).1)(1(V)e1(
Q
N
Q
NAuN
Q
QN i εδσ −−+−
−+= −
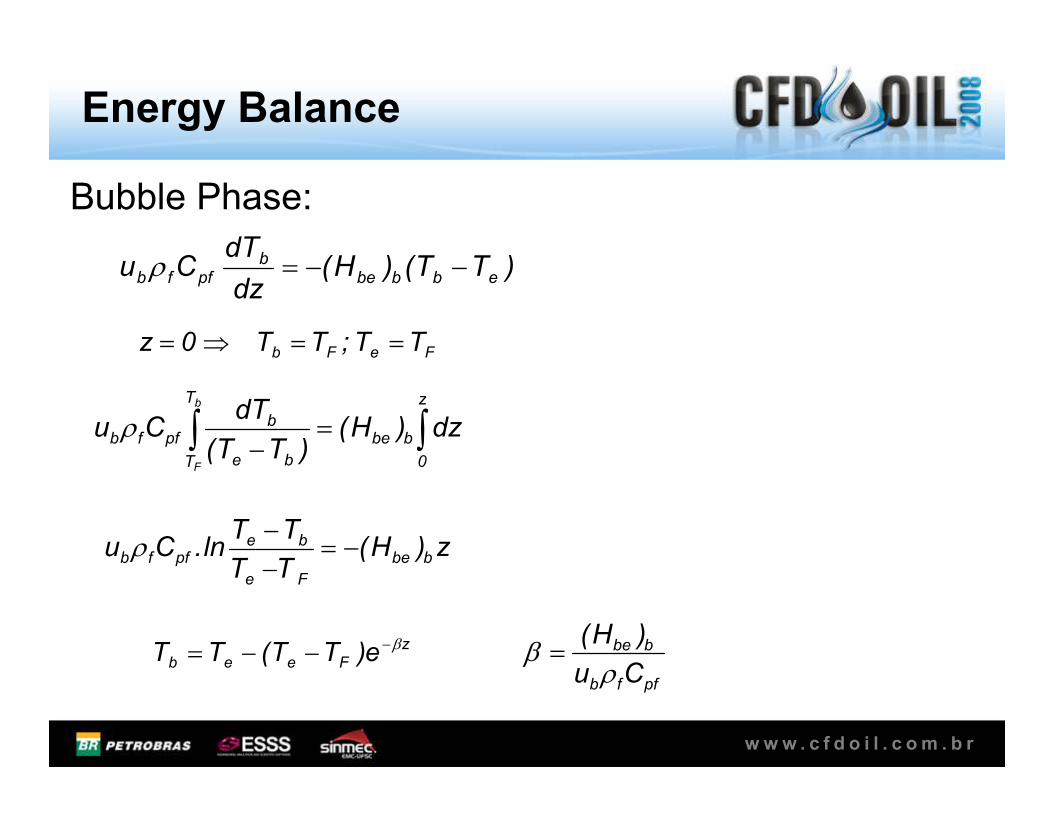
Energy Balance
Bubble Phase:
)TT()H(dz
dTCu ebbbe
bpffb −−=ρ
FeFb TT;TT0z ==⇒=
∫∫zT
dTb
w w w . c f d o i l . c o m . b r
∫∫ =−
z
0
bbe
T be
bpffb dz)H(
)TT(
dTCu
b
F
ρ
z)H(TT
TTln.Cu bbe
Fe
bepffb −=
−−
ρ
z
Feeb e)TT(TT β−−−=pffb
bbe
Cu
)H(
ρβ =
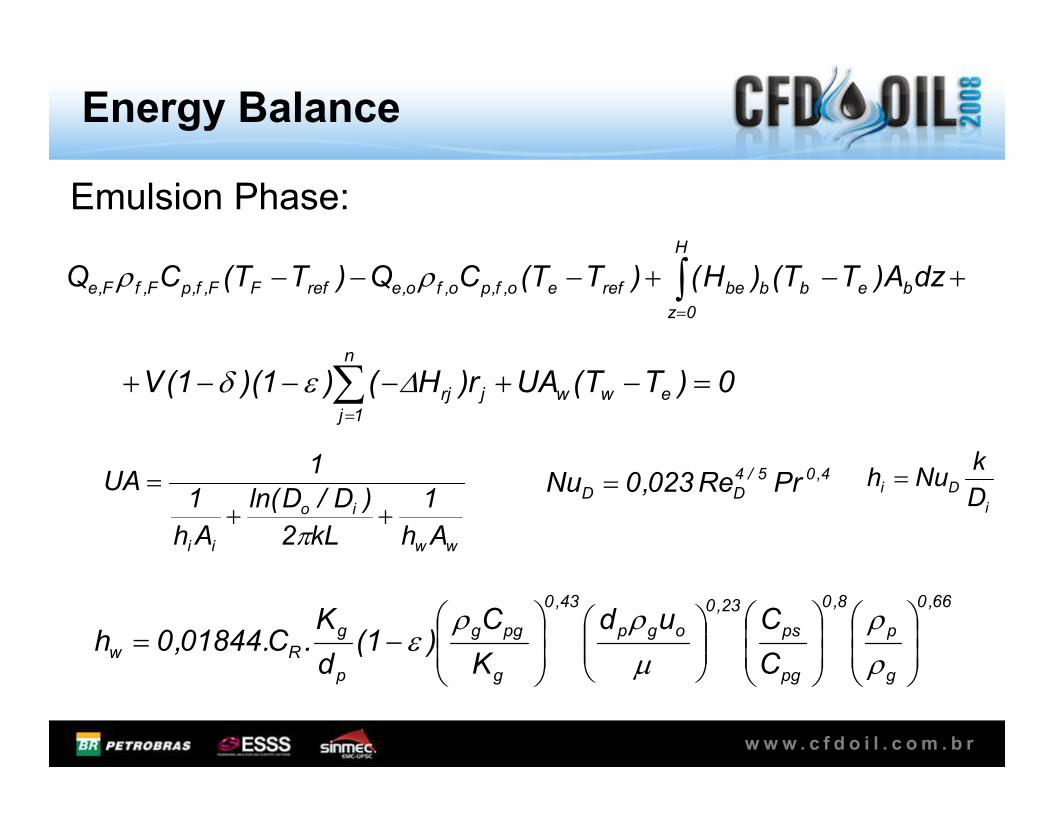
Energy Balance
Emulsion Phase:
+−+−−− ∫=
dzA)TT()H()TT(CQ)TT(CQ beb
H
0z
bberefeo,f,po,fo,erefFF,f,pF,fF,e ρρ
0)TT(UAr)H()1)(1(V eww
n
1j
jrj =−+−−−+ ∑=
∆εδ
w w w . c f d o i l . c o m . b r
1j
∑=
ww
io
ii Ah
1
kL2
)D/Dln(
Ah
1
1UA
++=
πi
DiD
kNuh =4,05/4
DD PrRe023,0Nu =
66,0
g
p
8,0
pg
ps
23,0
ogp
43,0
g
pgg
p
g
RwC
Cud
K
C)1(
d
K.C.01844,0h
−=
ρ
ρ
µ
ρρε
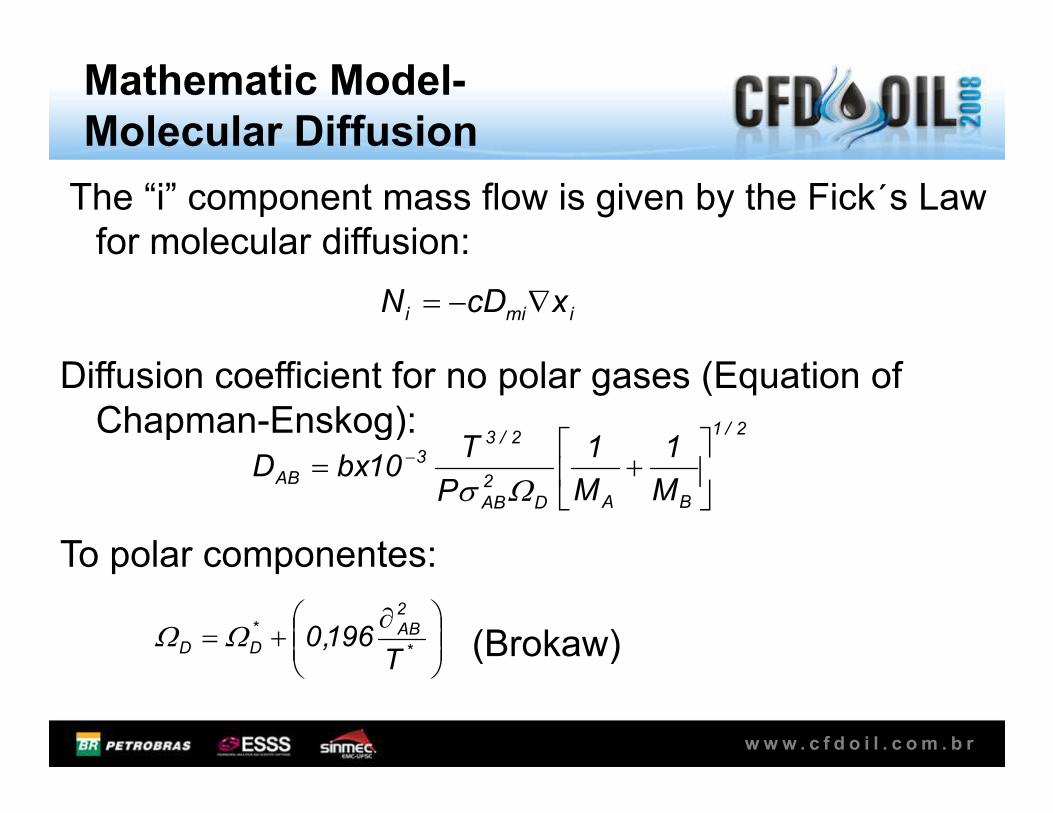
Mathematic Model-Molecular Diffusion
The “i” component mass flow is given by the Fick´s Law
for molecular diffusion:
Diffusion coefficient for no polar gases (Equation of
Chapman-Enskog):
imii xcDN ∇−=
w w w . c f d o i l . c o m . b r
Chapman-Enskog):
To polar componentes:
(Brokaw)
2/1
BAD
2
AB
2/33
ABM
1
M
1
P
T10bxD
+= −
Ωσ
∂+=
*
2
AB*
DDT
196,0ΩΩ
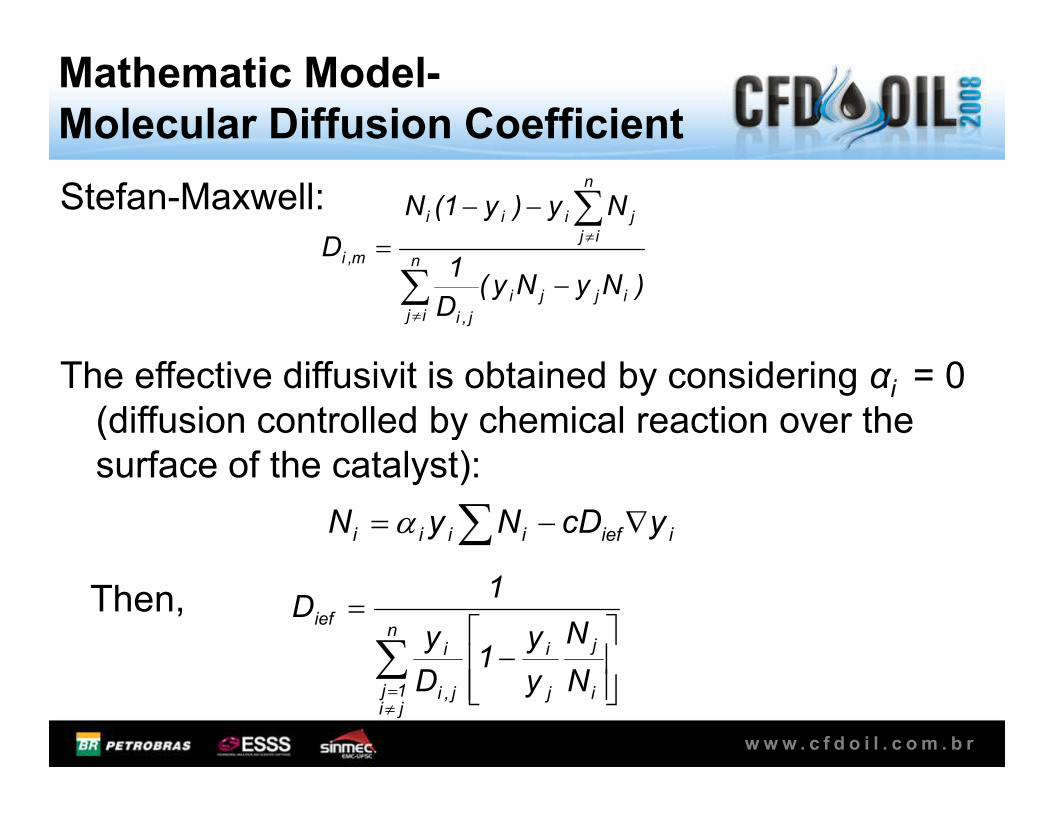
Mathematic Model-Molecular Diffusion Coefficient
Stefan-Maxwell:
The effective diffusivit is obtained by considering αi = 0
(diffusion controlled by chemical reaction over the
)NyNy(D
1
Ny)y1(N
D
ijji
n
ij j,i
n
ij
jiii
m,i
−
−−
=
∑
∑
≠
≠
w w w . c f d o i l . c o m . b r
(diffusion controlled by chemical reaction over the
surface of the catalyst):
Then,
∑ ∇−= iiefiiii ycDNyN α
∑≠=
−
=n
ji1j i
j
j
i
j,i
i
ief
N
N
y
y1
D
y
1D
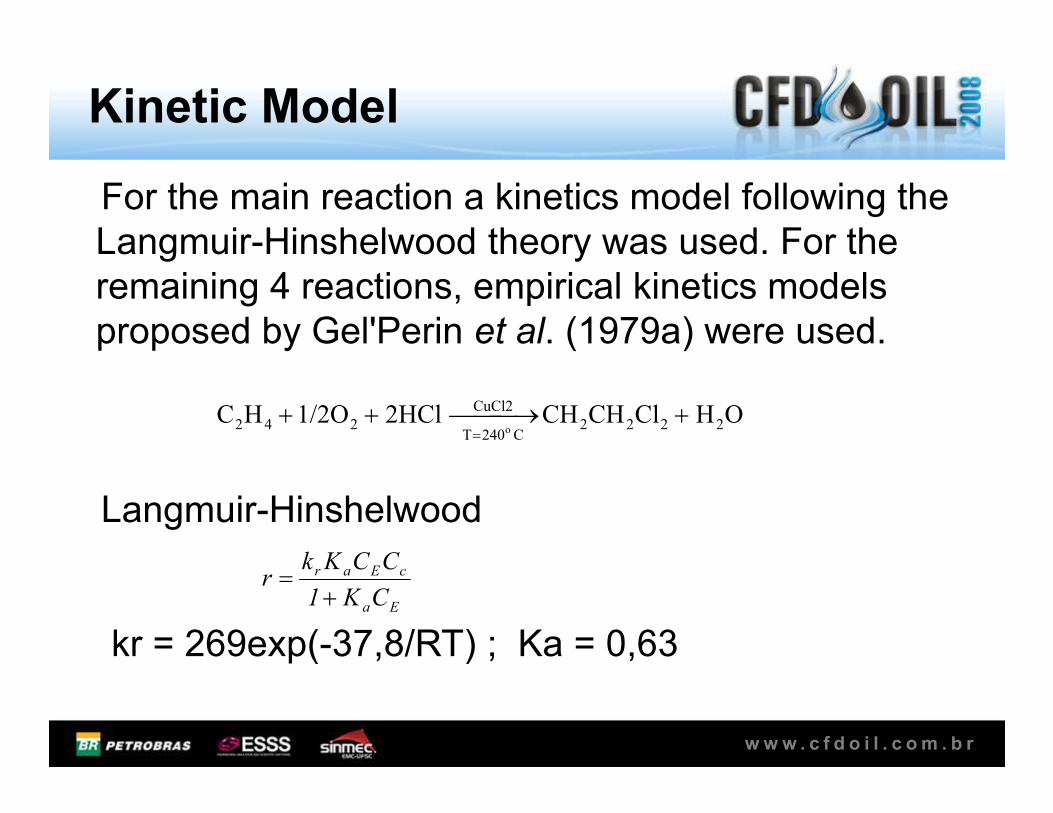
Kinetic Model
For the main reaction a kinetics model following the
Langmuir-Hinshelwood theory was used. For the
remaining 4 reactions, empirical kinetics models
proposed by Gel'Perin et al. (1979a) were used.
OHClCHCH2HCl1/2OHCCuCl2 + →++
w w w . c f d o i l . c o m . b r
Langmuir-Hinshelwood
kr = 269exp(-37,8/RT) ; Ka = 0,63
OHClCHCH2HCl1/2OHC 2222C240T
CuCl2
242 o+ →++
=
Ea
cEar
CK1
CCKkr
+=
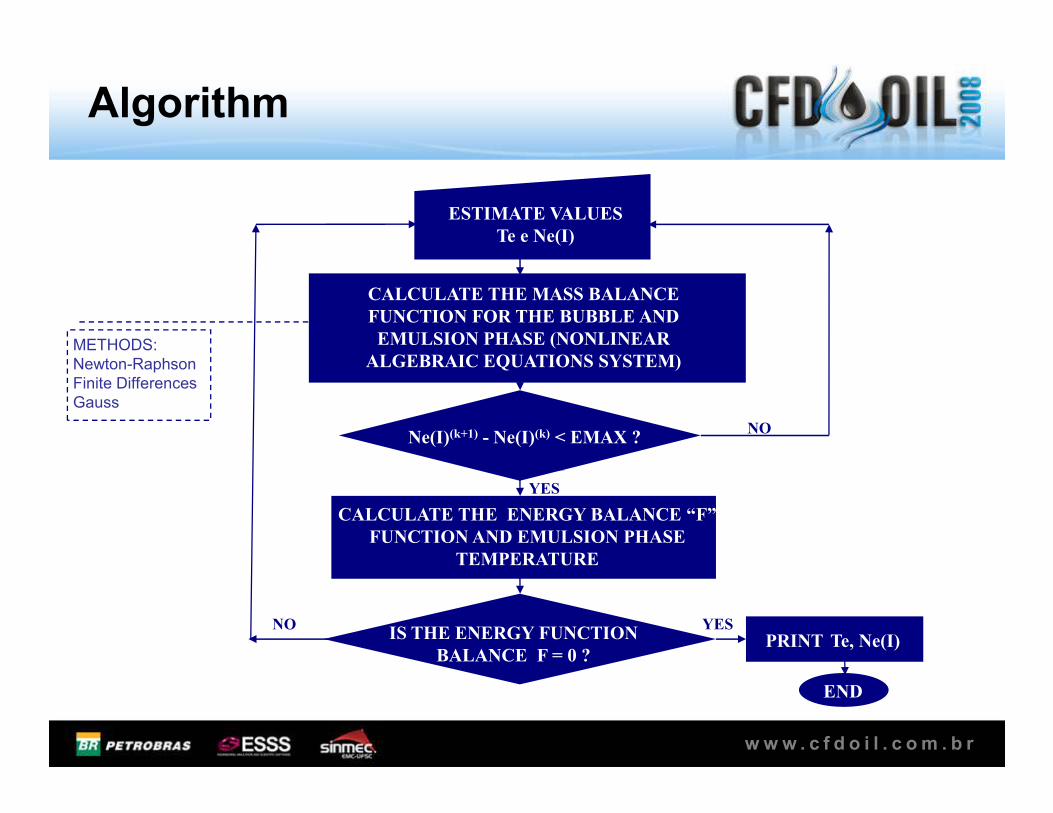
Algorithm
METHODS:
Newton-Raphson
Finite Differences
Gauss
ESTIMATE VALUES
Te e e(I)
CALCULATE THE MASS BALACE
FUCTIO FOR THE BUBBLE AD
EMULSIO PHASE (OLIEAR
ALGEBRAIC EQUATIOS SYSTEM)
w w w . c f d o i l . c o m . b r
SIM
Gauss
O
O
e(I)(k+1) - e(I)(k) < EMAX ?
PRIT Te, e(I)
ED
YES
YES
CALCULATE THE EERGY BALACE “F”
FUCTIO AD EMULSIO PHASE
TEMPERATURE
IS THE EERGY FUCTIO
BALACE F = 0 ?
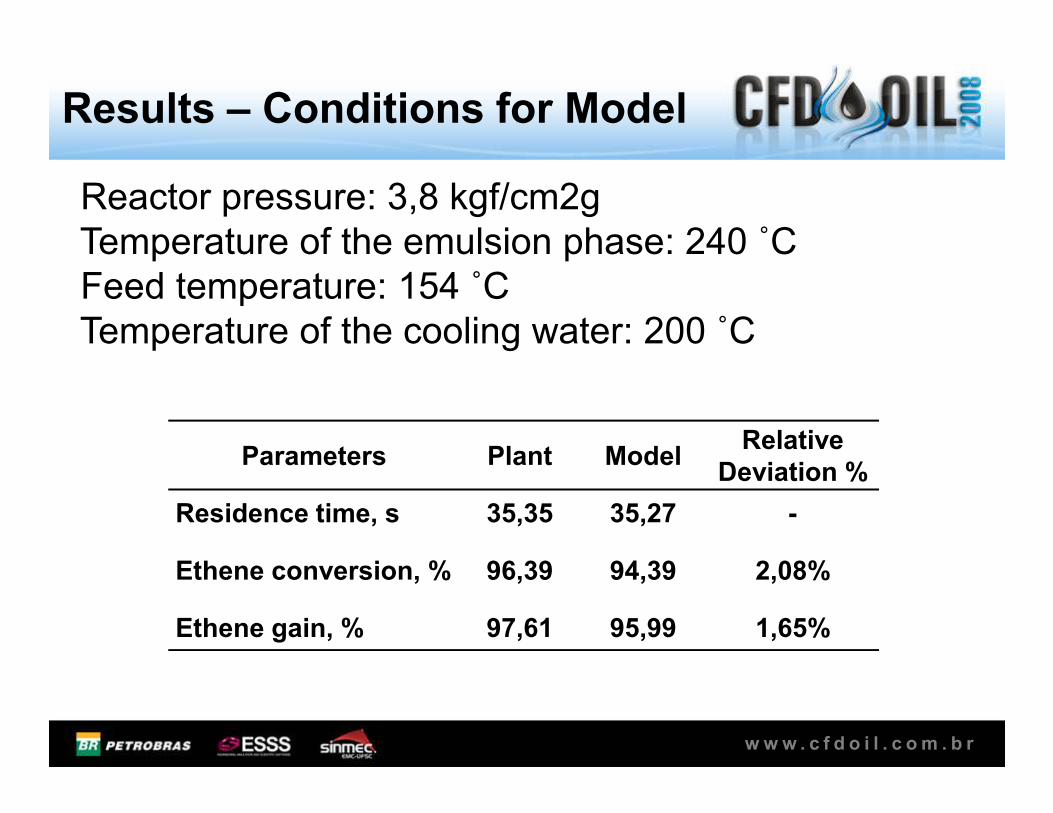
Results – Conditions for Model
Reactor pressure: 3,8 kgf/cm2g
Temperature of the emulsion phase: 240 ˚C
Feed temperature: 154 ˚C
Temperature of the cooling water: 200 ˚C
w w w . c f d o i l . c o m . b r
Parameters Plant ModelRelative
Deviation %
Residence time, s 35,35 35,27 -
Ethene conversion, % 96,39 94,39 2,08%
Ethene gain, % 97,61 95,99 1,65%
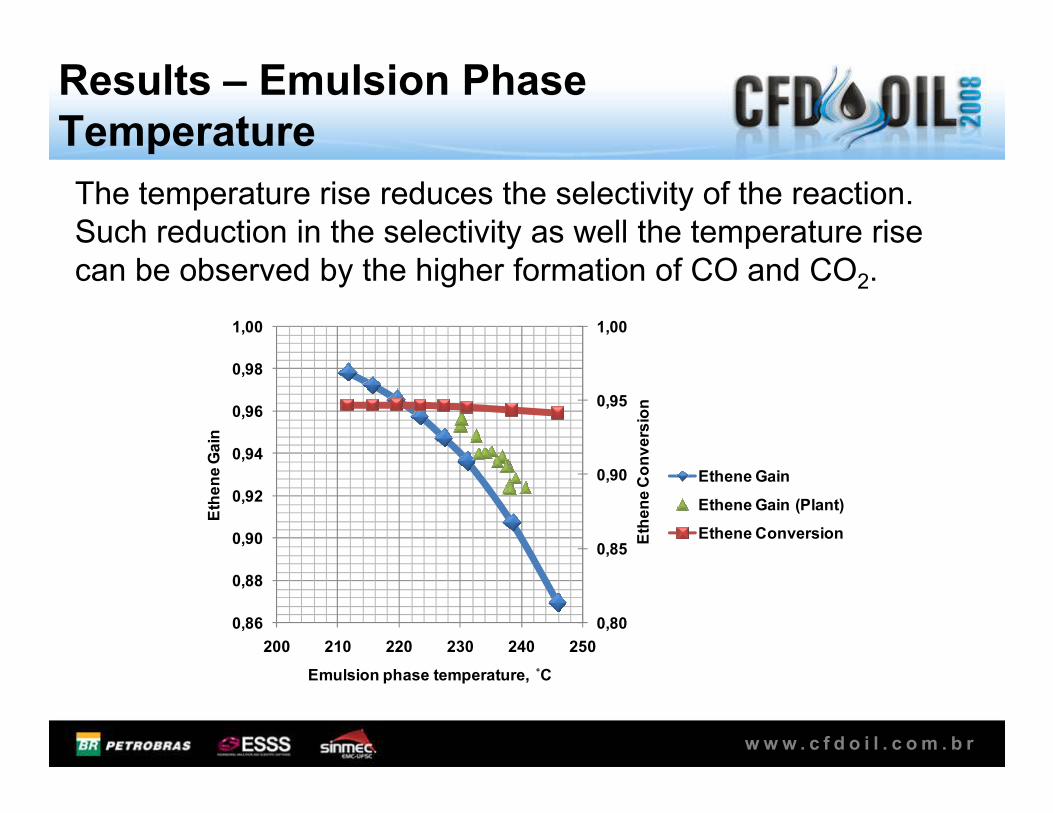
Results – Emulsion PhaseTemperature
The temperature rise reduces the selectivity of the reaction.
Such reduction in the selectivity as well the temperature rise
can be observed by the higher formation of CO and CO2.
0,95
1,00
0,96
0,98
1,00
Eth
en
e C
on
ve
rsio
n
w w w . c f d o i l . c o m . b r
0,80
0,85
0,90
0,95
0,86
0,88
0,90
0,92
0,94
0,96
200 210 220 230 240 250E
the
ne
Co
nv
ers
ion
Eth
en
e G
ain
Emulsion phase temperature, ˚C
Ethene Gain
Ethene Gain (Plant)
Ethene Conversion
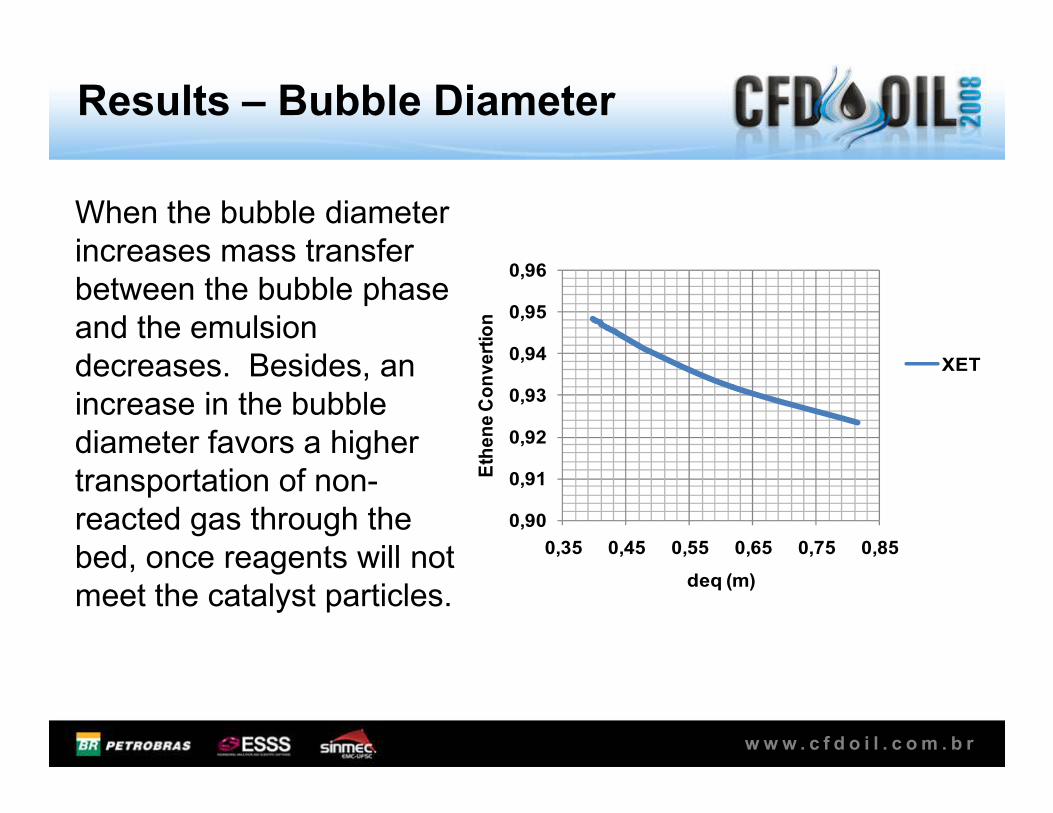
Results – Bubble Diameter
When the bubble diameter
increases mass transfer
between the bubble phase
and the emulsion
decreases. Besides, an
increase in the bubble 0,93
0,94
0,95
0,96
Eth
en
e C
on
ve
rtio
n
XET
w w w . c f d o i l . c o m . b r
increase in the bubble
diameter favors a higher
transportation of non-
reacted gas through the
bed, once reagents will not
meet the catalyst particles.
0,90
0,91
0,92
0,35 0,45 0,55 0,65 0,75 0,85
Eth
en
e C
on
ve
rtio
n
deq (m)
Results – Bed Height
0,93
0,94
0,95
0,96
Eth
en
e C
on
ve
rsio
n
zmin
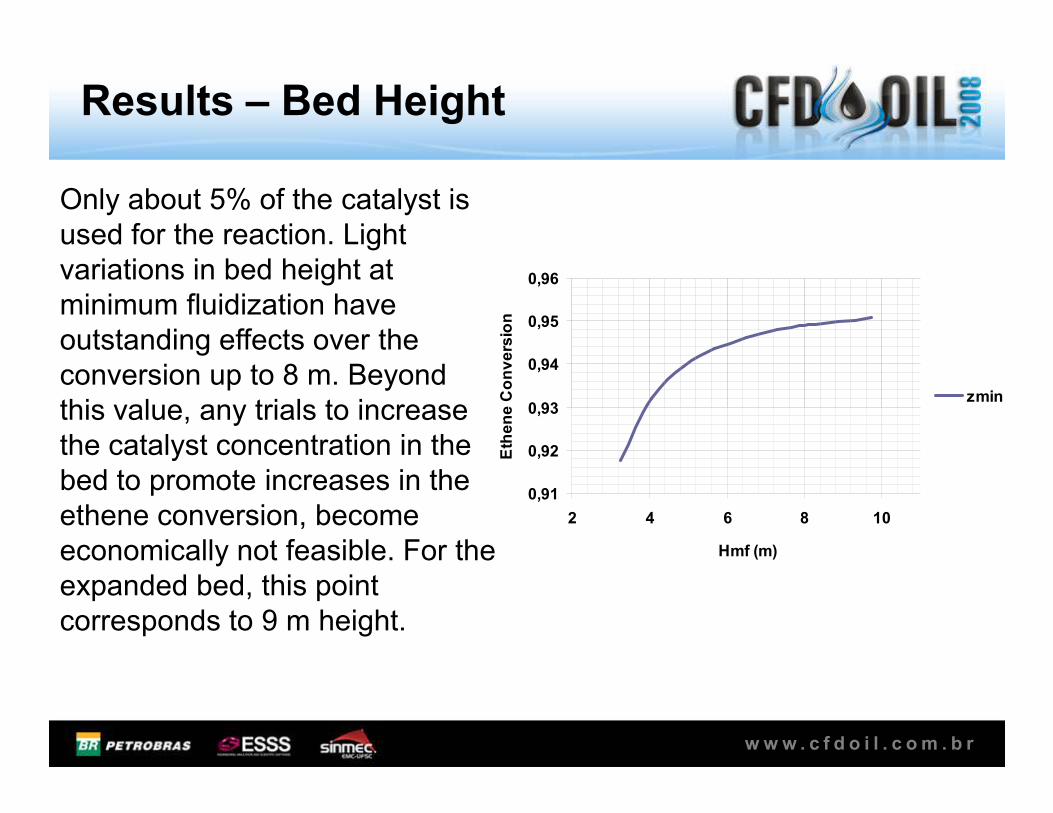
Only about 5% of the catalyst is
used for the reaction. Light
variations in bed height at
minimum fluidization have
outstanding effects over the
conversion up to 8 m. Beyond
this value, any trials to increase
w w w . c f d o i l . c o m . b r
0,91
0,92
0,93
2 4 6 8 10
Hmf (m)
Eth
en
e C
on
ve
rsio
n
this value, any trials to increase
the catalyst concentration in the
bed to promote increases in the
ethene conversion, become
economically not feasible. For the
expanded bed, this point
corresponds to 9 m height.
Results – Residence Time
0,98
0,95
0,96
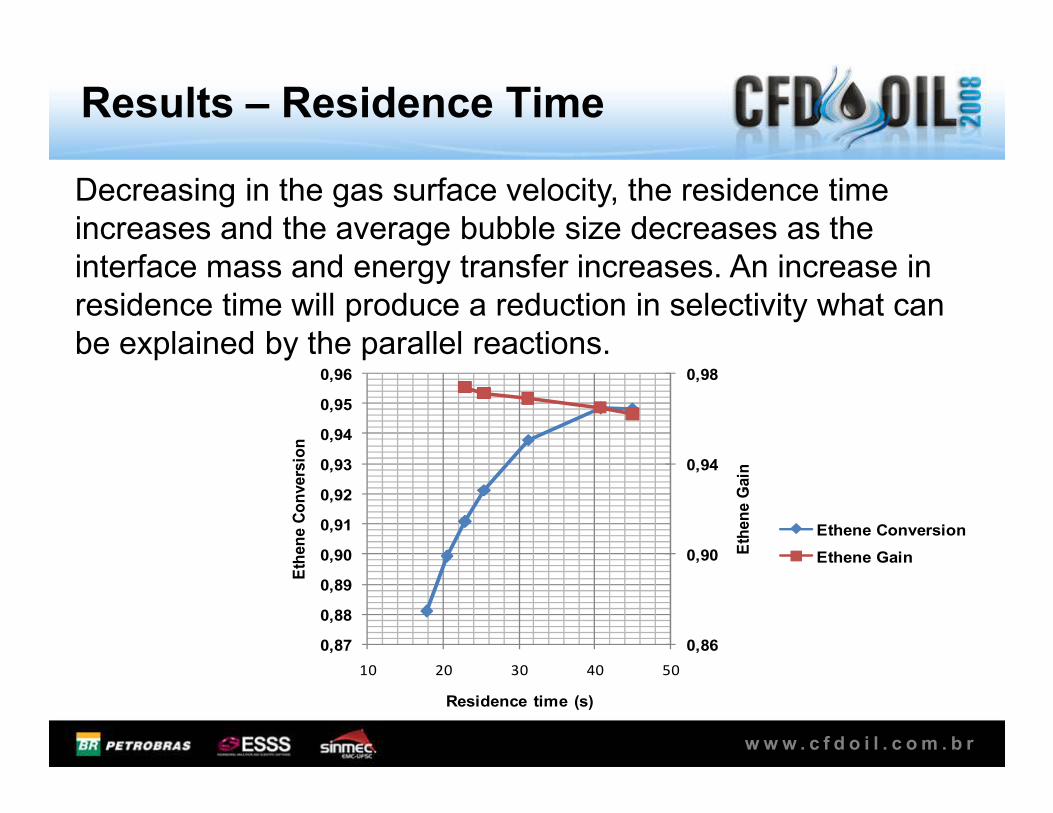
Decreasing in the gas surface velocity, the residence time
increases and the average bubble size decreases as the
interface mass and energy transfer increases. An increase in
residence time will produce a reduction in selectivity what can
be explained by the parallel reactions.
w w w . c f d o i l . c o m . b r
0,86
0,90
0,94
0,87
0,88
0,89
0,90
0,91
0,92
0,93
0,94
0,95
10 20 30 40 50
Eth
en
e G
ain
Eth
en
e C
on
vers
ion
Residence time (s)
Ethene Conversion
Ethene Gain
Final Comments
The pseudo-homogeneous model hypothesis is valid and it was possible to
conclude that the diffusion process does not pose as a limiting phase for this
system.
The optimized values for the residence time tend to be closed to 24 s for systems
with recycle. Non-converted ethene may be reprocessed.
Variations in bed heights have effect on reaction gains up to 9 m; above this
value, investments in catalyst quantity increase become economically
w w w . c f d o i l . c o m . b r
value, investments in catalyst quantity increase become economically
impracticable as a way to increase ethene conversion.
Develop a simulation applying multi-dimension model (CFX, Fluent, H):
Varying the distributor design to control bubbles diameters by limiting their size
and thus, enlarging the feasible area for mass and energy transfer between
phases. Besides, the larger reagents volume, confined inside the bubbles, favors
the passage of gas through the bed without its contact with the catalyst particles.
Some accessories such as baffles can be used for reduction of bubbles diameter.
Analyzer effect of PSD (multi-phase).
.