Embed Size (px)
Citation preview
Oxides of Nitrogen and ParticulateMonitoring at Wagerup Refinery
An Analysis of Influences Detectablein Yarloop
Mervyn Thomas
Emphron Informatics Pty Ltd
Report Number 2005.14
www.emphron.com
April 4, 2005
Contents
List of Figures 3
List of Tables 5
Glossary 6
Executive Summary 8
1 Background 10
2 Oxides of Nitrogen and Airborne Particulate Data 12
2.1 Background . . . . . . . . . . . . . . . . . . . . . . . . . . . . .12
2.2 Descriptive Statistics . . . . . . . . . . . . . . . . . . . . . . . .13
2.3 Monthly Variation in Wind Direction, Oxides of Nitrogen and Air-borne Particulates . . . . . . . . . . . . . . . . . . . . . . . . . .17
2.4 Joint Analysis of Meteorological Conditions . . . . . . . . . . . .17
2.4.1 Analysis of Oxides of Nitrogen . . . . . . . . . . . . . .21
2.4.2 Analysis of Particulate Concentrations . . . . . . . . . . .26
2.5 Conclusions . . . . . . . . . . . . . . . . . . . . . . . . . . . . .26
2.6 Technical Appendix . . . . . . . . . . . . . . . . . . . . . . . . .27
3 Alkalinity of Airborne Particles 31
1
3.1 Background . . . . . . . . . . . . . . . . . . . . . . . . . . . . .31
3.2 Estimation of Peak Concentrations . . . . . . . . . . . . . . . . .31
3.3 Conclusions . . . . . . . . . . . . . . . . . . . . . . . . . . . . .32
4 Environmental Measurements and Community Complaints 34
4.1 Objectives and Background . . . . . . . . . . . . . . . . . . . . .34
4.2 Descriptive Statistics for Complaints Data . . . . . . . . . . . . .35
4.3 Overview of Analysis . . . . . . . . . . . . . . . . . . . . . . . .37
4.4 Results . . . . . . . . . . . . . . . . . . . . . . . . . . . . . . . .39
4.5 Conclusions . . . . . . . . . . . . . . . . . . . . . . . . . . . . .39
4.6 Technical Appendix . . . . . . . . . . . . . . . . . . . . . . . . .44
5 Conclusions 47
2
List of Figures
2.1 NOx Distribution at Boundary Road . . . . . . . . . . . . . . . .16
2.2 Proportion of Day with Wind from North by Month, at BoundaryRoad . . . . . . . . . . . . . . . . . . . . . . . . . . . . . . . . .18
2.3 log Nitric Oxide Concentrations (ppb) by Month, at Boundary Road.18
2.4 log Nitrogen Dioxide Concentrations (ppb) by Month, at Bound-ary Road. . . . . . . . . . . . . . . . . . . . . . . . . . . . . . .19
2.5 log Total Oxides of Nitrogen Concentrations (ppb) by Month, atBoundary Road. . . . . . . . . . . . . . . . . . . . . . . . . . . .19
2.6 logPM10 (µgm−3) by Month, at Boundary Road . . . . . . . . .20
2.7 PM2.5 (µgm−3) by Month, at Boundary Road. . . . . . . . . . . .20
2.8 Effect of Wind Direction on Probability of Peak Nitric Oxide -Boundary Rd . . . . . . . . . . . . . . . . . . . . . . . . . . . .23
2.9 Effect of Wind Direction on Probability of Peak Nitrogen Dioxide- Boundary Rd . . . . . . . . . . . . . . . . . . . . . . . . . . . .23
2.10 Effect of Wind Direction on Probability of Peak Nitrogen Oxides- Boundary Rd . . . . . . . . . . . . . . . . . . . . . . . . . . . .24
2.11 Effect of Wind Direction on Probability of Peak Nitric Oxide -Upper Dam . . . . . . . . . . . . . . . . . . . . . . . . . . . . .24
2.12 Effect of Wind Direction on Probability of Peak Nitrogen Dioxide- Upper Dam . . . . . . . . . . . . . . . . . . . . . . . . . . . .25
2.13 Effect of Wind Direction on Probability of Peak Nitrogen Oxides- Upper Dam . . . . . . . . . . . . . . . . . . . . . . . . . . . .25
3
2.14 Effect of Wind Direction on Probability of PeakPM10 at Bound-ary Rd . . . . . . . . . . . . . . . . . . . . . . . . . . . . . . . .27
2.15 Effect of Wind Direction on Probability of PeakPM2.5 at Bound-ary Rd . . . . . . . . . . . . . . . . . . . . . . . . . . . . . . . .28
2.16 Effect of Wind Direction on Probability of Peak TSP at the SouthRDA . . . . . . . . . . . . . . . . . . . . . . . . . . . . . . . . .28
2.17 Effect of Wind Direction on Probability of Peak TSP at the SouthWest RDA . . . . . . . . . . . . . . . . . . . . . . . . . . . . . .29
3.1 Peak Daily Estimated NaOH Equivalents by Month Boundary Rd33
4.1 Distribution of Number of Complaints made by Each Complainant36
4.2 Incidence of Complaints by Issue Type and Month. . . . . . . . .40
4.3 Incidence of All Complaints by Oxides of Nitrogen, Airborne Par-ticulates and Meteorological Variables . . . . . . . . . . . . . . .41
4.4 Incidence of Odour Complaints by Oxides of Nitrogen, AirborneParticulates and Meteorological Variables . . . . . . . . . . . . .42
4.5 Incidence of Health Related Complaints by Oxides of Nitrogen,Airborne Particulates and Meteorological Variables . . . . . . . .43
4
List of Tables
2.1 Distribution ofNO (ppb) Boundary Rd by Month . . . . . . . . .14
2.2 Distribution ofNO2 (ppb) Boundary Rd by Month . . . . . . . .14
2.3 Distribution ofNOx (ppb) Boundary Rd by Month . . . . . . . .15
2.4 Distribution ofPM10 (µgm−3) Boundary Rd by Month . . . . . . 15
2.5 Distribution ofPM2.5 (µgm−3) Boundary Rd by Month . . . . . . 16
4.1 Number of Complaints by Issue and by Complainant Frequency .37
4.2 Bootstrap Confidence Intervals for Effect of Oxides of Nitrogen,Airborne Particulates and Meteorological Variables on Complaints46
5
Glossary
NO Nitrogen Oxide Concentration (ppb)
NO2 Nitrogen Dioxide Concentration (ppb)
NOx Total Nitrogen Oxides Concentration (ppb): equalsNO + NO2
PM10 Airborne particulate matter less than 10 microns in diameterµgm−3
PM2.5 Airborne particulate matter less than 2.5 microns in diameterµgm−3
Blocked Bootstrap A version of the bootstrap re-sampling procedure which ame-liorates the effects of serial correlation in the samples.
Bootstrap A non-parametric procedure for estimating confidence intervals orperforming significance tests, used when the theoretical distribution of anestimator is uncertain or intractable. The bootstrap procedure is computa-tionally intensive, and is based on re-sampling from the data.
Box and Whisker Plot A box and whisker plot provides summary informationabout the distribution of measurements. The central box represents the25th and75th quantiles. The middle line is the mean of the observations.The whiskers represent the largest and smallest observations within a cutoff distance of the top and the bottom of the box. The cut off distance isset as 1.5 times the width of the box. Observations outside the range of thewhiskers are considered outlying observations, and are displayed as points.
Generalised Linear Model A very versatile approach to statistical analysis, whichallows data with non-normal error distributions to be analysed. The ap-proach encompasses many of the common distributional forms of data,including Poisson models for count data, and Binomial models for success/ failure data.
6
Kernel Density Estimate A non-parametric smooth estimate of the statisticaldistribution of some quantity. A kernel density estimate provides infor-mation about the shape of a distribution.
logit A transformation applied to a probability to map the (0,1) range onto theinterval(−∞,∞) The logit function is defined aslogit(p) = log( p
1−p).
lowess An algorithm for fitting a smooth curve to data. It uses a local regression,in which the line is fitted to points within a moving window about eachdata point. The local fit is based on a robust weighted regression.
RDA Residue Drying Area
TSP Total Suspended Particulatesµgm−3
7
Executive Summary
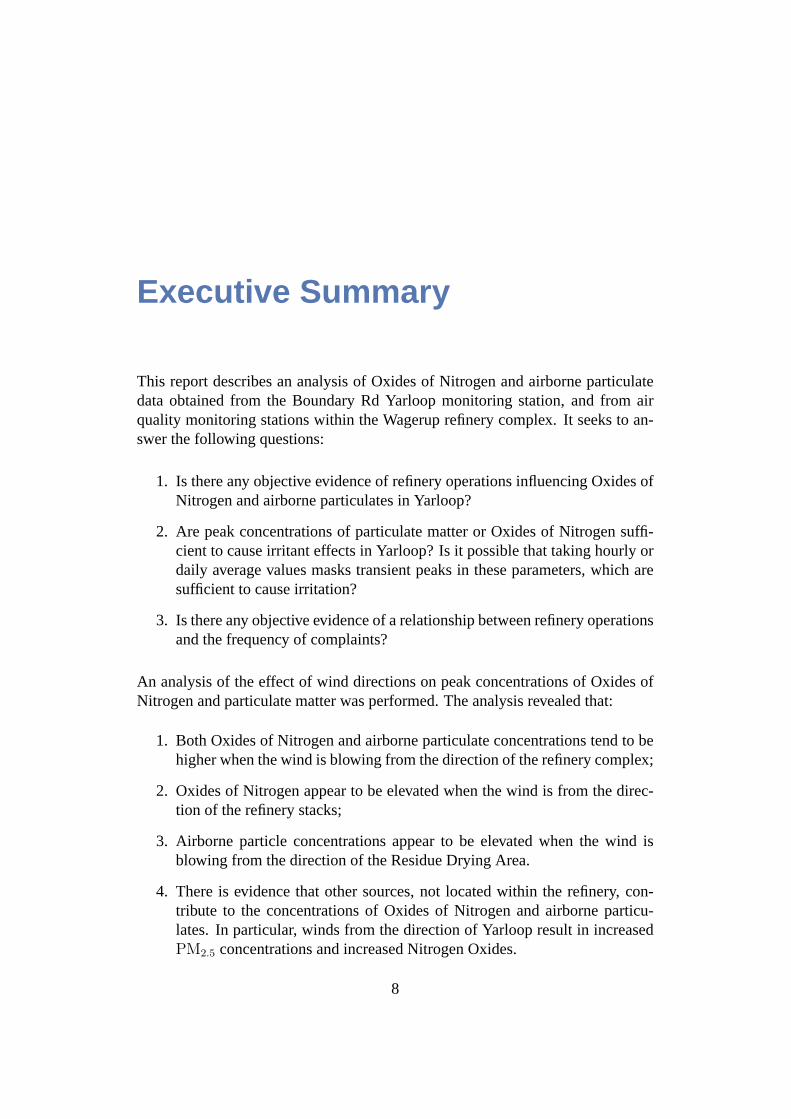
This report describes an analysis of Oxides of Nitrogen and airborne particulatedata obtained from the Boundary Rd Yarloop monitoring station, and from airquality monitoring stations within the Wagerup refinery complex. It seeks to an-swer the following questions:
1. Is there any objective evidence of refinery operations influencing Oxides ofNitrogen and airborne particulates in Yarloop?
2. Are peak concentrations of particulate matter or Oxides of Nitrogen suffi-cient to cause irritant effects in Yarloop? Is it possible that taking hourly ordaily average values masks transient peaks in these parameters, which aresufficient to cause irritation?
3. Is there any objective evidence of a relationship between refinery operationsand the frequency of complaints?
An analysis of the effect of wind directions on peak concentrations of Oxides ofNitrogen and particulate matter was performed. The analysis revealed that:
1. Both Oxides of Nitrogen and airborne particulate concentrations tend to behigher when the wind is blowing from the direction of the refinery complex;
2. Oxides of Nitrogen appear to be elevated when the wind is from the direc-tion of the refinery stacks;
3. Airborne particle concentrations appear to be elevated when the wind isblowing from the direction of the Residue Drying Area.
4. There is evidence that other sources, not located within the refinery, con-tribute to the concentrations of Oxides of Nitrogen and airborne particu-lates. In particular, winds from the direction of Yarloop result in increasedPM2.5 concentrations and increased Nitrogen Oxides.
8
The distribution ofPM10 during periods in which the wind blew from the North-ern sector was used to estimate the total alkalinity of airborne particles. Even aftermaking pessimistic (ie upwards) adjustments to the estimated NaOH concentra-tions there was no evidence of alkalinity sufficient to cause an irritant response.
The incidence of complaints is related to the proportion of each day with a northerlywind. Complaint incidence also increases withNOx concentrations. ElevatedNOx concentrations probably serve as a marker for instances in which the refin-ery stack plumes reach ground level. This provides some objective evidence thatcomplaints are related to refinery operations, and the most likely cause of com-plaints is odour associated with the plume.
9
Chapter 1
Background
Alcoa operate an Alumina refinery at Wagerup. The refinery is situated about 5km north of the town of Yarloop. The local community has often complained ofnuisance associated with the site. Reports include unpleasant smells, transitoryirritant effects, and more controversially, the development of “multiple chemicalsensitivity”. Complaints are more common during the winter months.
The Wagerup refinery has an extensive environmental monitoring programmewhich includes the following data sources:
• Particulate concentrations of air sampled at various locations within the re-finery, and at Boundary Rd, Yarloop;
• Oxides of Nitrogen sampled within the refinery, and at Boundary Rd Yarloop;
• Measurements of total suspended particulate alkalinity at Boundary Rd Yarloop;
• Records of complaints by issue, date and by complainant.
Despite community concerns, there has been little objective evidence to date ofany influence of refinery operations on Oxides of Nitrogen or airborne particulatesin Yarloop. In particular the concentrations of particulates and Oxides of Nitrogenare well below relevant health standards for hourly averages, daily averages orannual averages [3, 2]
This report seeks to address several questions:
1. Is there any objective evidence of refinery operations influencing Oxides ofNitrogen or airborne particulates in Yarloop?
10
2. Are peak concentrations of particulate matter or Oxides of Nitrogen suffi-cient to cause irritant effects in Yarloop? Is it possible that taking hourly ordaily average values masks transient peaks in these parameters, which aresufficient to cause irritation?
3. Is there any objective evidence of a relationship between refinery operationsand the frequency of complaints?
The relationship between refinery operations and Oxides of Nitrogen and airborneparticulates was investigated by an analysis of meteorological records from Ban-cell Rd and Oxides of Nitrogen and airborne particulates records from BoundaryRd Yarloop, and from sites within the refinery. This analysis is described in Chap-ter Two.
The potential irritant effect of peak concentrations was evaluated by consideringthe distribution of peak particulate concentrations, and the alkalinity of total sus-pended particulates. This analysis is described in Chapter Three.
The relationship between refinery operations and complaints data was investigatedby a joint analysis of:
1. the history of complaints;
2. meteorological records from Bancell Rd and
3. Oxides of Nitrogen and airborne particulates records from Boundary RdYarloop.
This analysis is described in Chapter Four.
Chapters Two, Three and Four each provide a non–technical overview of the re-sults and the conclusions of the analyses. Chapters Two and Four also have tech-nical appendices, which detail the analyses performed.
Chapter Five provides a summary of the results, and conclusions of the analyses.
Throughout this report, reference to the ‘refinery’ should be understood to meanthe refinery plant, the Residue Drying Areas and the stockpiles. It includes all thearea within the refinery complex.
11
Chapter 2
Oxides of Nitrogen and AirborneParticulate Data
2.1 Background
There is an automated meteorological station at Bancell Rd, and automated atmo-spheric measurement stations are located at: Boundary Rd, Yarloop; The UpperDam, The South Residue Drying Area (RDA) and the South West RDA. The fol-lowing measurements are available at the measuring stations:
Bancell Rd Wind Direction (degrees), Wind Speed at 10m and at 3m (km/h),Temperature (◦C), Solar Radiation, Barometric Pressure (mBar), Rainfalland Relative Humidity;
Boundary Rd Yarloop Nitric Oxide concentration (NO), Nitrogen Dioxide con-centration (NO2), Total Oxides of Nitrogen (NOx), PM10 andPM2.5;
Upper Dam Nitric Oxide concentration (NO), Nitrogen Dioxide concentrationand Total Oxides of Nitrogen (NOx);
South West RDA Total Suspended particulates (TSP);
South RDA Total Suspended particulates (TSP);
All of these variables are available as 6 minute averages. Unless otherwise qual-ified, any further reference to these variables should be understood to refer to 6minute average values.
12
Any influence of plant operations on Oxides of Nitrogen or airborne particulatesin Yarloop must involve wind transport. If the plant is a major source of Oxidesof Nitrogen and particulate matter, we might expect to see higher values ofNO,NO2, NOx, PM10 andPM2.5 during those months in which the wind is often fromthe North (since the monitoring station at Boundary Rd is South of the refinery).
2.2 Descriptive Statistics
Analysis of wind direction was restricted to those records containing a full set ofmonitoring data - ie the period March 2002 to January 2004 inclusive.
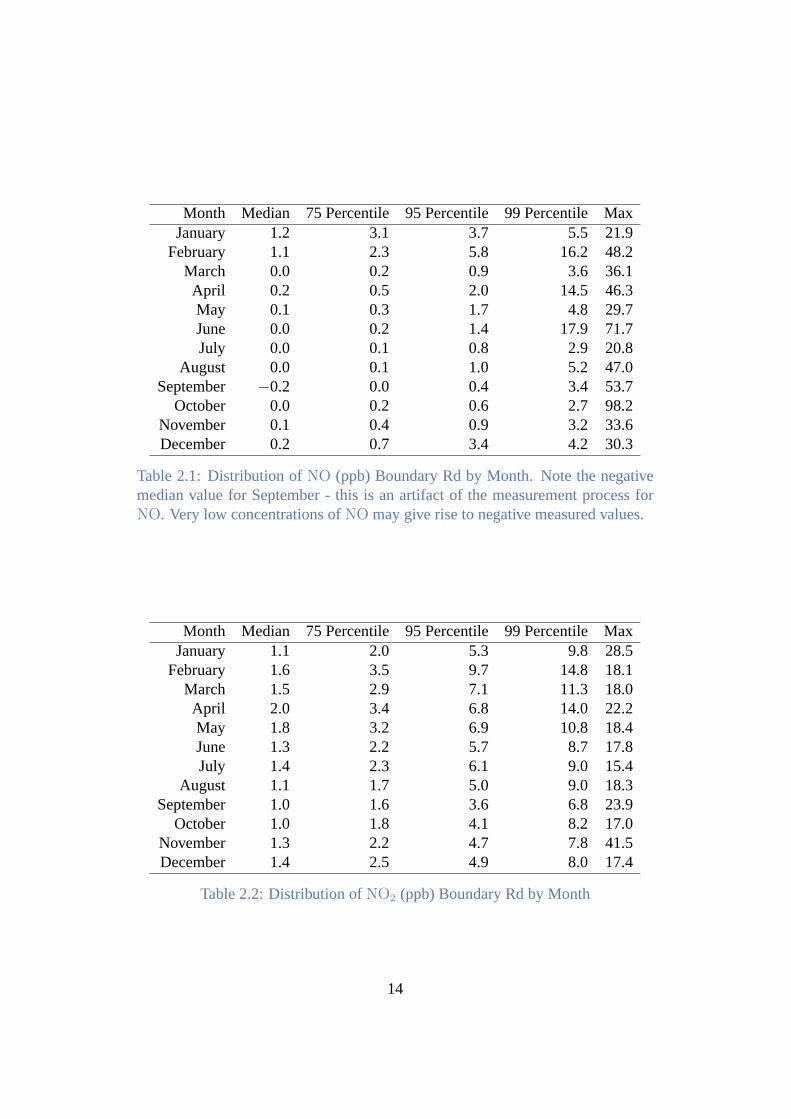
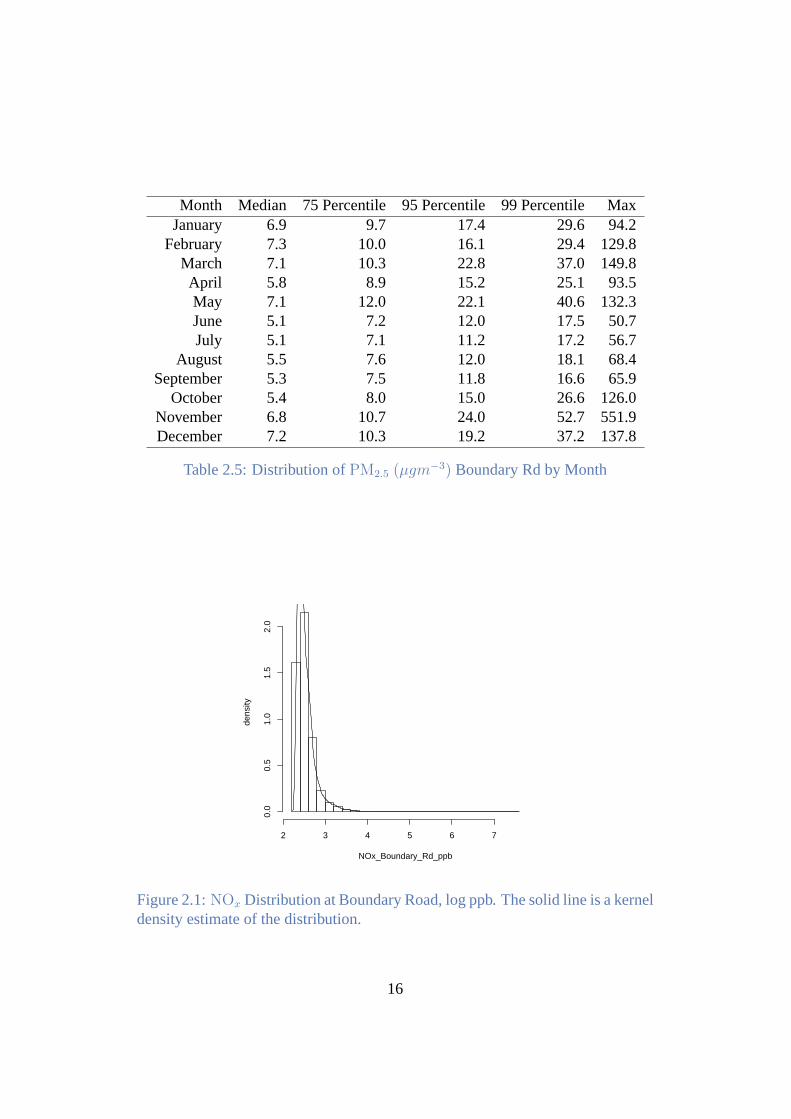
All of the Oxides of Nitrogen and airborne particulates parameters follow a long-tailed distribution. That is, most measurements are relatively low, but there are afew measurements which are many times the average value. These larger mea-surements are generated by transient peaks in the measured concentration. Forillustrative purposes only, Figure 2.1 shows a histogram of the distribution of nat-ural logNOx concentrations at Boundary Rd. The very long tail of the distributionis apparent (even after taking logarithms).
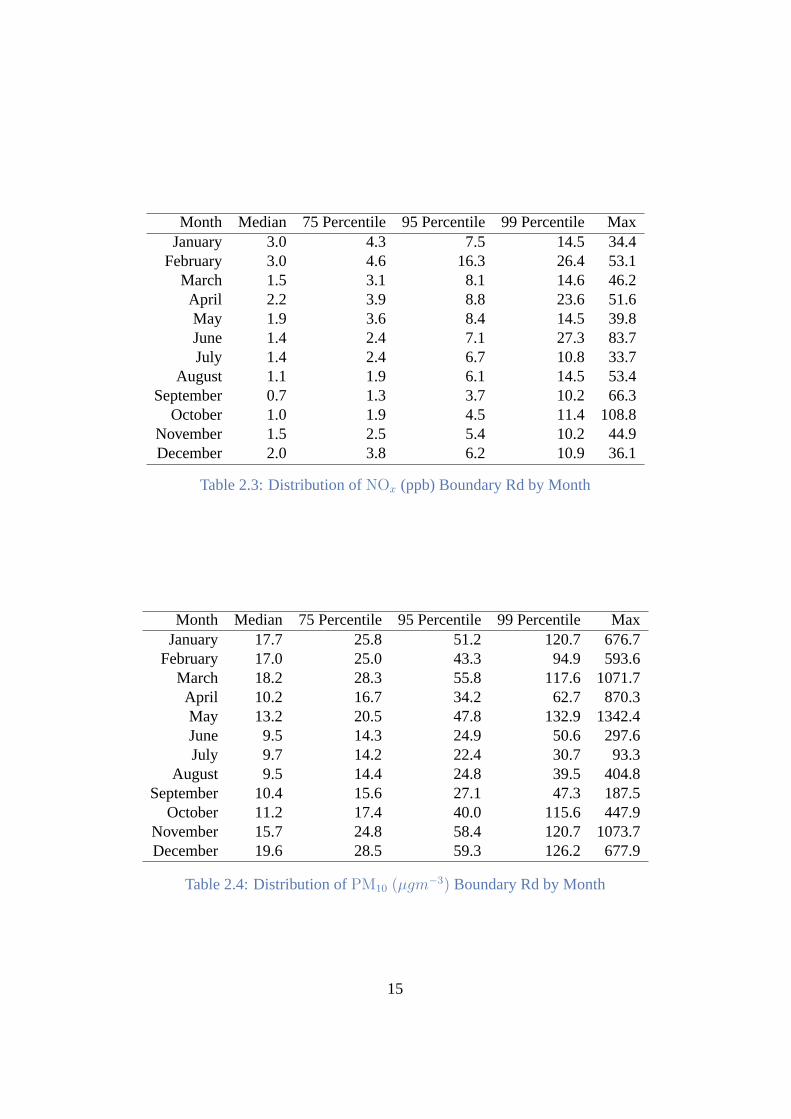
Summary statistics (Median,75th, 95th and99th percentiles and maximum) of theconcentrations ofNO, NO2, NOx, PM10 andPM2.5 at Boundary Rd are shownin Tables 2.1, 2.2, 2.3, 2.4 and 2.5 respectively. Each table displays the summarystatistics by month.
13
Month Median 75 Percentile 95 Percentile 99 Percentile MaxJanuary 1.2 3.1 3.7 5.5 21.9
February 1.1 2.3 5.8 16.2 48.2March 0.0 0.2 0.9 3.6 36.1April 0.2 0.5 2.0 14.5 46.3May 0.1 0.3 1.7 4.8 29.7June 0.0 0.2 1.4 17.9 71.7July 0.0 0.1 0.8 2.9 20.8
August 0.0 0.1 1.0 5.2 47.0September −0.2 0.0 0.4 3.4 53.7
October 0.0 0.2 0.6 2.7 98.2November 0.1 0.4 0.9 3.2 33.6December 0.2 0.7 3.4 4.2 30.3
Table 2.1: Distribution ofNO (ppb) Boundary Rd by Month. Note the negativemedian value for September - this is an artifact of the measurement process forNO. Very low concentrations ofNO may give rise to negative measured values.
Month Median 75 Percentile 95 Percentile 99 Percentile MaxJanuary 1.1 2.0 5.3 9.8 28.5
February 1.6 3.5 9.7 14.8 18.1March 1.5 2.9 7.1 11.3 18.0April 2.0 3.4 6.8 14.0 22.2May 1.8 3.2 6.9 10.8 18.4June 1.3 2.2 5.7 8.7 17.8July 1.4 2.3 6.1 9.0 15.4
August 1.1 1.7 5.0 9.0 18.3September 1.0 1.6 3.6 6.8 23.9
October 1.0 1.8 4.1 8.2 17.0November 1.3 2.2 4.7 7.8 41.5December 1.4 2.5 4.9 8.0 17.4
Table 2.2: Distribution ofNO2 (ppb) Boundary Rd by Month
14
Month Median 75 Percentile 95 Percentile 99 Percentile MaxJanuary 3.0 4.3 7.5 14.5 34.4
February 3.0 4.6 16.3 26.4 53.1March 1.5 3.1 8.1 14.6 46.2April 2.2 3.9 8.8 23.6 51.6May 1.9 3.6 8.4 14.5 39.8June 1.4 2.4 7.1 27.3 83.7July 1.4 2.4 6.7 10.8 33.7
August 1.1 1.9 6.1 14.5 53.4September 0.7 1.3 3.7 10.2 66.3
October 1.0 1.9 4.5 11.4 108.8November 1.5 2.5 5.4 10.2 44.9December 2.0 3.8 6.2 10.9 36.1
Table 2.3: Distribution ofNOx (ppb) Boundary Rd by Month
Month Median 75 Percentile 95 Percentile 99 Percentile MaxJanuary 17.7 25.8 51.2 120.7 676.7
February 17.0 25.0 43.3 94.9 593.6March 18.2 28.3 55.8 117.6 1071.7April 10.2 16.7 34.2 62.7 870.3May 13.2 20.5 47.8 132.9 1342.4June 9.5 14.3 24.9 50.6 297.6July 9.7 14.2 22.4 30.7 93.3
August 9.5 14.4 24.8 39.5 404.8September 10.4 15.6 27.1 47.3 187.5
October 11.2 17.4 40.0 115.6 447.9November 15.7 24.8 58.4 120.7 1073.7December 19.6 28.5 59.3 126.2 677.9
Table 2.4: Distribution ofPM10 (µgm−3) Boundary Rd by Month
15
Month Median 75 Percentile 95 Percentile 99 Percentile MaxJanuary 6.9 9.7 17.4 29.6 94.2
February 7.3 10.0 16.1 29.4 129.8March 7.1 10.3 22.8 37.0 149.8April 5.8 8.9 15.2 25.1 93.5May 7.1 12.0 22.1 40.6 132.3June 5.1 7.2 12.0 17.5 50.7July 5.1 7.1 11.2 17.2 56.7
August 5.5 7.6 12.0 18.1 68.4September 5.3 7.5 11.8 16.6 65.9
October 5.4 8.0 15.0 26.6 126.0November 6.8 10.7 24.0 52.7 551.9December 7.2 10.3 19.2 37.2 137.8
Table 2.5: Distribution ofPM2.5 (µgm−3) Boundary Rd by Month
NOx_Boundary_Rd_ppb
dens
ity
2 3 4 5 6 7
0.0
0.5
1.0
1.5
2.0
Figure 2.1:NOx Distribution at Boundary Road, log ppb. The solid line is a kerneldensity estimate of the distribution.
16
2.3 Monthly Variation in Wind Direction, Oxides ofNitrogen and Airborne Particulates
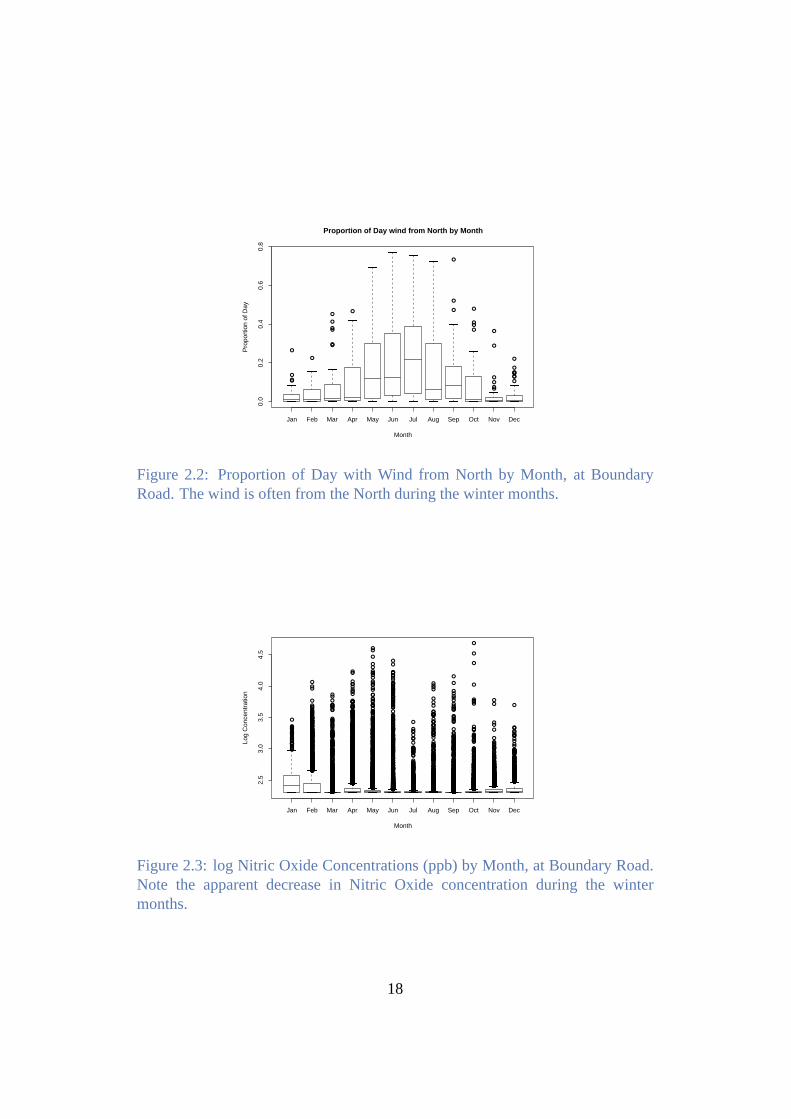
Figure 2.2 shows box and whisker plots for the proportion of each day in whichthe wind is from the North (350◦ to 25◦) by month. It is clear that there aresubstantial differences between months in wind direction. Throughout the wintermonths (May to August) the wind is often from the North; throughout the summermonths the wind is rarely from the North.
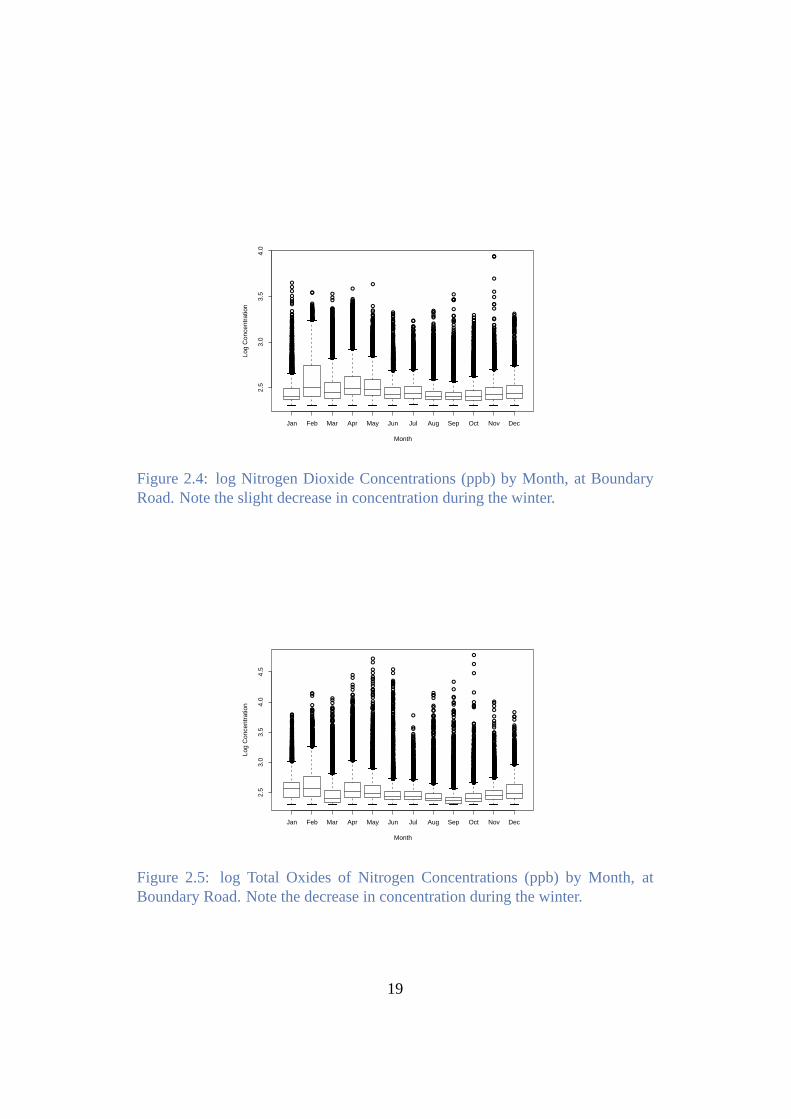
Figures 2.3, 2.4 and 2.5 show the mean natural log concentration ofNO, NO2 andNOx by month, respectively. All three measurements show a pronouncedreduc-tion during the winter months. That is, considered on a monthly basis, Oxides ofNitrogen (NO, NO2 andNOx) are lowest during those seasons when the wind isblowing from the direction of the plant.
Figures 2.6 and 2.7 show similar plots for the log mean values ofPM10 andPM2.5
respectively. AgainPM10 andPM2.5 values tend to belower during the wintermonths, when the wind is blowing from the direction of the plant. It is, however,likely that drier conditions during the summer increase the lift off of dust.
If the effects of wind direction are considered in isolation from the effects of othermeteorological conditions, it appears unlikely that the plant is a major source ofthe Oxides of Nitrogen or particulate matter detected at the Boundary Rd Yarloopmonitoring station. These measurements arelowestwhen the wind is blowingfrom the refinery towards the monitoring station.
Wind transport, however, is a complex multi-factorial process; and most of thedetermining factors (eg temperature, wind direction, wind speed, humidity) showmarked seasonal trends. It is possible that the effect of wind direction on Oxidesof Nitrogen and airborne particulates is masked by relationships with other sea-sonally varying parameters. This issue can be resolved only by a joint analysis,which investigates the simultaneous effects of several meteorological variables.
2.4 Joint Analysis of Meteorological Conditions
Details of this analysis are provided in the technical appendix to this chapter. Thissection provides only an informal overview of the approach.
17
●●
●
●
●
●
●
●
●
●
●
●
●
●
●
●
●●
●
●
●
●●●
●
●●●●●
●
●●
Jan Feb Mar Apr May Jun Jul Aug Sep Oct Nov Dec
0.0
0.2
0.4
0.6
0.8
Proportion of Day wind from North by Month
Month
Pro
port
ion
of D
ay
Figure 2.2: Proportion of Day with Wind from North by Month, at BoundaryRoad. The wind is often from the North during the winter months.
●
●
●
●
●●
●
●
●●●●●●●
●●●●●
●
●
●
●
●●●●●
●
●●
●
●
●●
●●
●●●●
●●●●●
●
●●●●●●●
●●
●
●●●●●●●
●
●●
●
●
●●
●
●●
●
●●
●●●
●●●●●
●●
●●●●●
●
●
●●●●
●●
●
●
●●●●●●●●●●●●●●●●●●●●
●●
●
●●●
●
●●
●●
●●
●
●
●
●●●
●●●
●
●
●●●
●
●
●
●●●●
●●
●
●
●
●
●
●
●
●
●
●
●
●●●
●●●●
●
●●●●●●
●●●
●
●●●
●
●
●●●●
●●●
●●●●●
●●
●
●
●●
●●●●●
●●●●●
●●
●●●
●
●●
●●●
●●●●
●
●●
●●
●
●
●●
●●
●●●
●●●
●
●●●●●
●●
●●
●●●●●●●●●
●
●●●●●●●●●●
●
●●
●
●●
●
●●
●
●
●
●●
●
●
●●
●●●●
●
●
●
●●
●●●
●
●●●
●●●●●●●●●●●●
●
●●●
●●●●
●
●
●●●●●●●
●
●●●●
●
●
●
●
●
●●●●
●
●●●●●●●●●●●
●●●●
●●●●●●●
●●●●●●●●●●●
●●
●●●●●●
●
●●●
●
●
●●●●●●●
●●●
●●●●●
●●
●●●●●
●●
●
●
●●●●●
●
●●
●
●
●
●●●●●●●●●●
●●●●
●●
●
●●●
●●●
●●
●●
●●
●
●
●●
●●●●●
●
●●●
●
●
●●
●●●●●●●
●●●●
●
●
●●●●●●●●●●●●
●●●●●●●●●●●●●●●●
●●
●
●●●●●●●
●●●●●●●●●●●
●●●●●●●●●●●●●●●●●●●●●●●●●●●●●●●●●●●●●●●●●●●●●●●●●●●●●●●●●●●●●●●●●●●●●●●●●●●●●●●●●●●●●●●●●●●●●●●●●●●●●●●●●●●●●●●●●●●●●●●●●●●●●
●●●●●●●●●●●●●●●●●●●●●●●●●●●●●●●●●●●●●●●●●●●●●●●●●●●●●●●●●●●●●●●●●●●●●●●●●●●●●●●●●●●●●●●●●●●●●●●●●●
●●●●●●●●●●●●●●●●●●●●●●●●●●●●●●●●●●●●●●●●●●●●●●●●●●●●●●●●●●●●●●●●●●●●●●●●●●●●●●●●●●●●●●●●●●●●●●●●●●●●●●●●●●●●●●●●●●●●●●●●●●●●●●●●●●●●●●●●●●●●●●●●●●●●●●●●●●●●●●●●●●●●●●●●●●●●●●●●●●●●●●●●●●●●●●●●●●●●●●●●●●●●●●●●●●●●●●●●●●●●●●●●●●●●●●●●●●●●●●●●●●●●●●●●●●●●●●●●●●●●●●●●●●●●●●●●●●●●●●●●●●●●●●●●●●●●●●●●●●●●●●●●●●●●●●●●●●●●●●●●●●●●●●●●●●●●●●●●●●●●●●●●●●●●●●●●●●●●●●●●●●●●●●●●●●●●●●●●●●●●●●●●●●●●●●●●●●●●●●●●
●●●●●●●●●●●●●●●●●●●●●●●●●●●●●●●●●●●●●●●●●●●●●●●●●●●●●●●●●●●●●●●●●●●●●●●●●●●●●●●●●●●●●●●●●●●●●●●●●●●●●●●●●●●●●
●
●
●●●●●●●●●●●●●●●●●●●●●●●●●●●●●●●●●●●●●●●●●●●●●●●●●●●●●●●●●●●●●●●●●●●●●●●●●●●●●●●●●●●●●●●●●●●●●●●●●●●●●●●●●●●●●●●●●●●●●●●●●●●●●●●●●●●●●●●●●●●●
●
●●●●●●●
●●●●●●●●●●●●●●●●●●●●●●●●●●●●●●●●●●●●●●●●●●●●●●●●●●●●●●●●●●●●●●●●●●●●●●●●●●●●●●●●●●●●●●●●●●●●●●●●●●●●●●●●●●●●●●●●●●●●●●●●●●●●●●●●●●●●●●●●●●●●●●●●●●●●●●●●●●●●●●●●●●●●●●●●●●●●●●●●●●●●●●●●●●●●●●●●●●●●●●●●●●●●●●●●●●●●●●●●●●●●●●●●●●●●●●●●●●●●●●●●●●●●●●●●●●●●●●●●●●●●●●●●●●●●●●●●●●●●●●●●●●●●●●●●●●●●●●●●●●●●●●●●●●●●●●●●●●●●●●●●●●●●●●●●●●●●●●●●●●●●●●●●●●●●●●●●●●●●●●●●●●●●●●●●●●●●●●●●●●●●●●●●●●●●●●●●●●●●●●●●●●●●●●●●●●●●●●●●●●●●●●●●●●●●●●●●●●●●●●●●●●●●●●●●●●●●●●●●●●●●●●●●●●●●●●●●●●●●●●●●●●●●●●●●●●●●●●●●●●●●●●●●●●●●●●●●●●●●●●●●●●●●●●●●●●●●●●●●●●●●●●●●●●●●●●●●●●●●●●●●●●●●●●●●●●●●●●●●●●●●●●●●●●●●●●●●●●●●●●●●●●●●●●●●●●●●●●●●●●●●●●●●●●●●●●●●●●●●●●●●●●●●●●●●●●●●●●●●●●●●●●●●●●●●●●●●●●●●●●●●●●●●●●●●●●●●●●●●●●●●●●●●●●●●●●●●●●●●●●●●●●●●●●●●●●●●●●●●●●●●●●●●●●●●●●●●●●●●●●●●●●●●●●●●●●●●●●●●●●●●●●●●●●●●●●●●●●●●●●●●●●●●●●●●●●●●●●●●●●●●●●●●●●●●●●●●●●●●●●●●●●●●●●●●●●●●●●●●●●●●●●●●●●●●●●●●●●●●●●●●●●●●●●●●●●●●●●●●●●●●●●●●●●●●●●●●●●●●●●●●●●●●●●●●●●●●●●●●●●●●●●●●●●●●●●●
●●●●●●●●●●●●●●●●●●●●●●●●●●●●●●●●●●●●●●●●●●●●●●●●●●●●●●●●●●●●●●●●●●●●●●●●●●●●●●●●●●●●●●●●●●●●●●●●●●●●●●●●●●●●●●●●●●●●●●●●●●●●●●●●●●●●●●●●●●●●●●●●●●●●●●●●●●●●●●●●●●●●●●●●●●●●●●●●●●●●●●●●●●●●●●●●●●●●●●●●●●●●●●●●●●●●●●●●●●●●●●●●●●●●●●●●●●●●●●●●●●●●●●●●●●●●●●●●●●●●●●●●●●●●●●●●●●●●●●●●●●●●●●●●●●●●●●●●●●●●●●●●●●●●●●●●●●●●●●●●●●●●●●●●●●●●●●●●●●●●●●●●●●●●●●●●●●●●●●●●●●●●●●●●●●●●●●●●●●●●●●●●●●●●●●●●●●●●●●●●●●●●●●●●●●●●●●●●●●●●●●
●
●●●●●●●●●●●●●●●●●●●●●●●●●●●●●●●●●●●●●●●●●●●●●●●●●●●●●●●●●●●●●●●●●●●●●●●●●●●●●●●●●●●●●●●●●●●●●●●●●●●●●●
●●●●●●●●●●●●●●●●●●●●●●●●●●●●●●●●●●●●●●●●●●●●●●●●●●●●●●●●●●●●●●●●●●●●●●●●●●●●●●●●●●●●●●●●●●●●●●●●●●●●●●●●●●●●●●●●●●●●●●●●●●●●●●●●●●●●●●●●●●●●●●●●●●●●●●●●●●●●●●●●●●●●●●●●●●●●●●●●●●
●●
●●●
●●●
●●●●●●●●●●●●●●●●●●●●●●●●●●●●
●
●●
●
●●
●
●●
●
●●●●●●
●
●
●
●●
●
●
●●●
●
●
●
●
●●●●●●●●●●●●●●●●●●●●●●●●●●●●●●●●●●●●●●●●●●●●●●●●●●●●●●●●●●●●●●●●●●●●●●●●●●●●●●●●●●●●●●●●●●●●●●●●●●●●●●●●●●●●●●●●●●●●●●●●●●●●●●●●●●●●●
●●
●
●●●●
●
●●
●●●●●
●
●
●
●●●
●
●
●
●●●●
●
●
●●●●●●●●●
●●●●●
●
●
●
●
●
●
●●●
●●●●●●●●●●●●●●●●●●●●●●●●●●●●●●●
●●●
●●
●●●
●
●●●●●●●●
●●●
●
●
●●
●
●
●
●●
●
●
●
●
●
●
●●
●●
●
●
●
●●
●●●
●●
●
●●●●
●●●●●●●●●●●●
●●●
●
●●●
●●
●
●●
●
●●
●●●●●●●
●
●
●
●●●
●
●
●
●
●●●
●●●
●●●●
●
●●
●●●●●
●
●●●●●●●●●●●●●●●●
●
●
●
●
●
●
●
●
●●●●●
●●
●
●
●●●●
●●●●
●●●
●
●
●●
●●●●●●
●●●●●
●●●
●
●●●
●●●
●
●
●
●
●●●●
●●
●●●
●
●●●
●●●
●
●●●●●●●●●●●●●●●●●●●●●●●●●●●●●●●●●●●●●
●
●
●
●
●●●●
●
●●●●●●●●●●
●●●●●
●●●●●●●●●●●●●●●●●●●●●●●●●●●●●●●●●●●●●●●●●●●●●●●●●●●●●●●●●●●●●●●●●●●●●●●●●●●●●●●●●●●●●●●●●●●●●●●●●●●●●●●●●●●
●
●
●●
●
●●●
●
●●●●●●●●●●●●●●●●●●●●●●●●●●●●●●●●●●●●
●
●●
●
●
●
●
●●●●
●●●●
●
●●●
●
●
●●
●●
●●
●●
●●●
●●
●
●●●
●●●●●●●
●
●●
●●
●
●
●●●
●
●
●
●
●
●●●●
●●●●●
●
●●●●●●
●
●
●●●●
●●
●
●●
●
●●●
●
●●
●●●●●●
●
●
●●●●●●●●●●●●●●●
●
●
●●●●●●●●●●
●●●●●●●●●●●●●●●●●●●●●●●●●●●●●●●●●●●●●●●●●●●●●●●●●●●●●●●●●●●●●●●●●●●●●●●●●●●●●●●●●●●●●●●●●●●●●●●●●●●●●●●●●●●●●●●●●●●●●●●
●
●●●●●●
●
●●●●
●●●●●
●
●●
●
●●●●●●
●
●
●
●
●●●●●●●●●●●●●●●●●●●●●●●●●●●●●●●
●
●●
●
●
●●●●●●●●●●●●●●●●●●●●●●●●●●●●●●●●●●●●●●●●●●●●●●
●
●●●●●
●●
●●●●●●●●
●
●
●
●●●
●●
●
●●●●●●●●●●●●●●●●●●●●●●●●●●●●●●●●●●●●●●●●●
●●●●●●
●
●●
●
●●●●●●●
●
●●
●
●
●●●●●●●●●●●●●●
●
●
●●●●
●●
●●●●
●●●●●
●
●
●
●
●●
●●●
●
●●●●●●
●
●●
●
●
●
●
●
●
●
●●●●●●●●●●●●●
●
●
●
●
●
●
●
●
●
●
●
●
●●●●●●●●●●
●●
●
●●●●●●●●●
●●●●●●●●●●●
●●●●●●●●●
●●●●●●●●●
●●●●●●●
●●●●●●●●
●
●●●
●
●●●●●●●●●●●●
●
●●●●●
●
●●
●
●
●
●
●●●●●●●●
●●●●●●●●●●●●●●●●●●●●●●●●●●●
●
●
●●
●●
●●
●●
●●
●●●●●●●●●●●●●●●
●
●●●●●●
●●●
●
●
●
●
●●●●●●
●
●●●
●
●●●●●●●●●●●●●●●●●●●●●●●●●●●●●●●●●●●●●●●●●●●●●●●●●●●●●●●
●
●●●●●
●●●
●
●●●
●●●●●●●●●●●●●●●●●●●
●
●●●
●
●
●
●●●●
●●
●
●
●
●
●
●
●●●
●
●●
●●●●●●●●●●●●●●●●●●●●●●●●●●●●
●●●●●●●●●●●●●●●
●
●●●●●●●●●●●●●●●
●●●●●●●●
●
●●●●●
●●●
●
●
●
●●
●
●●●
●
●●
●●
●
●
●●●●●
●
●
●
●
●
●
●●●
●●●●●●●●
●●●●
●●●●
●
●
●●●
●
●
●●
●
●
●●
●●●●●
●●
●●●●●●●●●●●●
●●
●●●●●●●●●●●●
●
●
●●●●
●●●●
●●
●●●
●
●●●●●
●
●
●●●●
●●
●
●
●
●
●●●●●●●●
●●●●●●
●●●●●
●
●
●
●
●●
●●●●●●
●●●●
●●●
●●●
●●●●●●●●●●●●●●●●
●●
●
●●●●●●
●●●●●●●●●●●●
●●●●●
●●
●
●●●●●●●●●
●●●●●
●●●
●●●●●●●
●
●
●
●
●●●
●
●
●
●
●●●●●●●●●●●●●●
●
●
●
●
●
●
●
●●●●
●
●
●●
●
●●
●●
●
●
●
●
●●
●●
●
●●
●●
●
●
●●●●●●
●
●●●●●●●●●
●
●
●
●
●●
●
●●
●
●
●
●
●
●
●●●●●●●●●
●●●●●●●●●●
●●●●●●●●●●●●●●●●●●●●●●
●●●●●●●
●
●
●
●●●
●●
●
●●●
●
●
●●●●●●●●●●●●●●●●●●●●●●●●●●●●●●●●●●●●●●
●●●●●●●
●
●●●
●
●
●
●●●●
●●●●●●●●●●●●●●●●●●●●●●●
●●●●●●●●●●●●●●●●●●●●●●●●●●●●●●●●●●●●●●●●●●●●●●●●●●●●●●●●●●●●●●●●●●●●●●●●●●●●●●●●●●●●●●●●●●●●●●●●●
●
●
●
●●●●●
●●●●●●●●●●●●●●●●●●●●●●●
●
●●●●●●●●●●●●●●●●●●●●●●●●●●●●●●●●
●
●
●
●●
●
●
●
●
●●
●
●
●
●●●●●●●●●●●●●●●●●●●●●●●●●●●●●
●●
●●●●●●●●●●●●●●●●●●●●●●●●●●●●
●
●●
●
●●
●
●●●
●●
●●●●
●●●●●●●●●●●●●●●●●●●●●●
●●●●●●●●●●●●●●●●●●●●●●●●●●●●●
●●●●●●●●
●
●
●
●
●
●
●
●
●
●
●●
●●●●●●●●●●●●●●●●●●●●●●●●●
●
●●●●●
●
●●●●●●●●●●●●●●●●●●●●●●●●●●●●●●●●●●●●●●●●●●●●●●●●●●●●●●●●●●●●●●●●●
●
●
●
●●●●●●●●●●●●●●●●●●●●●●●●●●●●●●●●●●●●●●●●●●●●●●●●●●●●●●●●●●●●●●●●●●
●
●
●●
●●●
●
●
●
●●●●●●●●●●●●●●●●●●●●●●●●
●
●●●
●
●●●●●
●
●●●●●●●●
●
●
●
●●
●
●
●
●●●●●●●●●●●●●●●●●●●●●●●●●●●●●●●●●●●●●●●●●●●●●●●●●●●●●●●●●●●●●●●●●●●●●●●●●●●●●●●●
●
●●●●●
●●●●●●●●
●●●●●●●●●●●●●●●●●●●●●●●●●●●●●●●●●●●●●●●●●●●●●●●●●●●●●●●●●●●●●●●●●●●●●●●●●●●●●●●●●●●●●●
●
●
●
●
●●
●
●
●
●●
●
●
●●●●●●●●●●●●●●●
●●●●●●●●●●●●●●●●●●●●●●●●●●●●●●●
●●●●●●●●●●●●●●●●●●●
●
●●●●●●●●●●●●●●●●●●●●●●●●●
●
●
●●
●
●●●●
●●●●●●●●●●●●●●●●●●●●●●●●●●●●●●●●●●●●●●●
●●●●●●●●●●●●●●●●●●●●●●●●●●●●●●●●●●●●●●●●●●●●●●●●●●●●●●●●●●●●●●●●●●●●●●●●●●●●●●●●●●●●
●●●
●●●●●●●●●●●●●●
●●
●●●●●●●●●●●●
●
●
●
●
●
●
●
●
●●
●
●●
●
●●●●●●●●●●●
●
●
●
●
●
●●●
●
●
●●●
●
●
●
●
●●
●
●
●
●●
●●●●●●●●●●●●●●●
●●
●●●●●●●●●●●●●●●●●●●●●●●●●●●●●●●●
●●●●
●
●●
●
●
●
●
●●
●●●●
●
●●●●●●●●●●
●●
●
●●●●●●●●●●●●●●●●●●●●●●●●●●●●●●●●●●●
●
●
●
●●●●●●●●●●●●●●●●●●●
●
●●●●●●●●●●●●●●●●
●●●●●●●
●
●●●●●●●●●●●●●●●●●●●●●●●●●●●●●●●●
●
●●
●●●
●
●●●●●●
●●●●●●●●●●●●●●●●●●●●●●●●●●●●●●●●●●●●●●●
●
●●●●●●●●●●●●●●●●●●●●●●●●●●●●●●●●●●●●●
●
●●●●●●●●●●●●●●●●●●●●●●
●●
●
●●
●
●●●●●●●●●●●●●●●●●●●●
●
●
●
●
●
●
●●●
●●
●
●
●
●
●●●●
●●
●
●●●
●●
●
●
●●●●
●
●
●
●
●●●●
●
●
●
●●●●
●
●
●
●
●
●
●●
●●●
●
●●●
●
●●●●●●●●●●
●
●●●●●●●●●●●●●●●●●●●●●●●●●●●●●●●
●
●●●
●●●●●●●●●
●●
●●●●●●●●●
●
●
●
●
●●●●
●
●
●
●
●●●
●●●●●●●●●●●●●●●●●●●●●●●●●●●●●●●●●●●●●●●●●●●●●●●●●●●●●●●●●●●●●●●●●●●●●●●●●●
●●●●●●●●●●●●●●●●●●●●●●●
●
●● ●●●
●●●●●●●●●●●●●●●●●●●●●●●●●●●●●●●●●●●●●●●●●●●●●●●●●●●●●●●●
●●●●●●●●●●●
●●●●●●●●●●●●●●●
●
●
●
●
●
●
●
●
●
●
●
●
●●●●
●●
●
●●
●
●
●●●●●●●●
●
●
●
●
●●●●●●●●●●●●●●●●●●●●●●●
●
●
●
●
●
●
●●
●
●●●
●
●●●●
●●
●
●
●
●
●
●
●
●●
●
●
●●●
●
●●●
●
●●●●
●●●●
●
●
●●
●
●
●
●
●●
●
●
●●●●●●●●●●●●●●●●●●●●●●●●●●●●●●●●●●●●●●●●●●●●●●●●●●●●●●●●●●●●●
●
●
●●
●
●
●●●●●●
●●●
●●●●
●
●
●●●●●●●●●●●●●●●●●●●●●
●
●●●●
●
●
●
●
●
●●
●
●●
●●
●●●
●●●●●
●●●
●●
●
●
●●
●
●●
●
●
●●●
●
●
●●●●●●●●
●
●
●
●
●
●●●●●●
●
●
●
●
●●
●
●
●●
●
●
●
●
●●●●●●●●●●●●●●●●
●
●●●●●●●●●●●
●
●●●●●●
●
●●●
●
●●●●
●
●
●●
●
●●
●
●
●●
●
●
●
●
●
●
●
●●●●●
●
●
●●●●●●●●●●●●●●●●●●●●●●●●●●●●●●●●●●●●●●●●●●●●●●●●●●●●●●●●●
●●●
●●●
●
●
●
●
●●●●●●●●●●●●●●●●●●●●●●●●●●●●●●●●●●●●●●●●●●●●●●●●●●●●●●●●●●●●●●●●●●●●●●●●●●●●●●●●●●●●●●●●●●●●●●●●●
●
●
●●●●●●●●●●●●●●●●●●●●●●●●●●●●●●●●●●●●●●●●●●●●●●●●●●●●●●●●●●●●●
●
●
●
●
●
●●
●
●●●●●●●●●●
●
●●
●
●●●
●
●
●
●●●●●
●
●●●●●●●●●●●
●●●●●●●●●●● ●
●
●
●●
●
●●●●●●●●●●●●●●●●●●●●●●●●●●●●●●●●●●●●●●●●●●●●●●●●●●●●●●●●●●
●
●●●●●●●●●●●●●●●
●●●●●●●●●●●●●●●●●●●●●●●●●●●●●●●●●●●●●●●●●●●●●●●●●●●●●●●●●●●●●●●●●●●●●●●●●●●●●●●●●●●●●●●●●●●●●●●●●●
●
●
●
●●
●
●●●●●●●●●●●●●●●●●●●●●●●●●●●●
●●
●
●
●●●●●●●●●●●●●●●●●●●●●●●●●●●●●●●●●●●●●●●●●●●●●●●●●●●●●●●●●●●●●●●●●●●●●●●●●●●●●●●●●●●●●●●●●●●●●●●●●●●●●●●●●●●●●●●●●●●●●●●●●●●●●●●●●●●●●●●●●●●●●●●●●●●●
●
●●●●●●●●●●●●●●●●●
●●
●●●●●●●●●●●●●●●●●●●●●●●●●●●●●●●●●●●●●●●●●●●●●●●●●●●●●●●●●●●●●●●●●●●●●●●●●●●●●●●●●●●●●●●●●●●●●●●●●●●●●●●●●●●●●●●●●●●●●●●●●●●●●●●●●●●●●●●●●●●●●●●●●●●●●●●●●●●●●●●●●●
●
●
●
●●
●
●
●●●●●●●●●●●●●
●●●●●●●●●●●●●●●●●●●●●●●●●●●●●●●●●●●●●●●●●●●●●●●●●●●●●●●
●
●●●●●●●●●●●●●●●●●●●●●●●●●●●●●●●●●●
●
●●●●●●●●●●●●●●●●●●●●●●●●●●●●●●●●●●●●●●●●●●●●●●●●
●
●
●●
●●●●●
●
●●●●●●●●●●●●●●●●●●●●●●●●●●●●●●●●●
●●●●●●●●●●●●●●●●●●●●●●●●●●●●●●●●●●●●●●●●●●
●
●
●
●●●●●●●●●●●●●●●●●●●●●●●●●●●●●●●●●●●●●●
●
●
●
●
●●●●●●
●
●●
●
●●●●●● ●●●
●
●●●●●●●●●●●●●●●●●●●●●●●●●●●●●●●●●●●●●●●●●●●●●●●●●●●●●●●●●●●●●●●●●●●●●●●●●●●●●●●●●●●●●●●●●●●●●●●●●●●●●●●●●●●●●●●●●●●●●●●●●●●●●●●●●●●●●●●●●●●●●
●
●
●●
●●●●●●
●●
●
●
●
●
●●
●
●
●●
●●
●●●●●●●●●●
●●●●●●●●●●●●●●●●●●●●●●●●●●●●●●●●●●●●●●●●●●●●
●
●
●
●
●
●
●●●●●
●
●●●●
●
●●
●●
●
●
●
●●●●●●●●●●●●●●
●●●●●●●●●●●●
●
●
●
●●
●●●●●●●●●●●●●●●●●●●●●●●●●●●●●●●●●●●●●●●●●●●●
●●●●●●●●
●●●●●●●●●●●●●●●●●●●●●●●●●●●●●●●●●●●●●●●●●●●●●●●●●●●●●●●●●●●●●●●●●●●●●●●●●
●
●
●
●●●
●●●●
●●●●●●
●
●●
●
●
●
●
●
●
●
●●●●●●●●●●●●●●●●●●●●●●●●●●●●●●●●●●●●●●●●●●●●●
●
●
●
●
●
●
●●●●
●●●●●
●
●●●●●●●●●●●●●●●●●●●●●●●●●●●
●
●●●●●●●●●●●●●●●●●●
●
●
●●
●
●●●
●
●
●
●●
●
●
●●●●●●●●●●●●●●●●
●●●●●●●●
●
●●●●●●●●●●●●●●●●●●●●●●●●●●
●●●●●●●●●●●●●●●●●●●●●●●●●●●●●●●●●●●●●●●●●●●●●●●●●●●●●●●●●●●●●●●●●●●●●●●●●●●●●●●●●●●●●●●●●●●●●●●●●●●●●●●●●●●●●●●●●●●●●●●●●●●●●●●●●●●●●●
●
●
●
●●●
●
●
●
●●
●●
●
●
●
●●●●●●●●●●●●●●●●●●●●●●●●●●●●●●●●●●●●●●●●●●●●●●●●●●●
●
●●●●●●●●●●●●●●●●●●●●●●●●●●●●●●●●●●●●●●●●●●●●●●●●●●●●●●●●●●●●●●●●●●●●●●●●●●●●●●●●●●●●●●●●●●●●●●●●●●●●●●●●●●●●●●●●●●●●●●●●●●●●●●●●●●●●●●●●●●●●●●●●●●●●●●●●●●●●●●●●●●●●●●●●●●●●●●●●●●●●●●●
●
●
●
●●●●●●●●●●●●●●●●●●●●●●●●●●●●●●●●●
●
●
●
●
●●
●●
●
●●●●●●●●●●●●●●●●●●●●●●●●●●●●●●●●●●●●●●●●●●●●●
●●●●●●●●●●●●●●●●●●●●●●●●●●●●●●●●●●●●●●●●●●●●●●●●●●●●●●●●●●●●●●●●●●●
●
●●●●●●●●●●●●●●●●●●●●●●●●●●●●●●●●●●●●●●●●●●●●●●●●●●●●●●●
●
●
●
●●●●●●●●●●●●●●●●●●●●●●●●●●●●●●●●●●●● ●
●●●●●●●●●●
●●●●●●●●●●●●●
●●
●●
●
●
●
●●
●●●●●●●●●●●●
●●
●●●●●●●●●●●●●●●●●●●●●●●●●
●●●●●●●●●●●●●●●●●
●
●●●●●●●●●●●●●●●●●●●●●●●●●●●
●●●●●
●●●●●●
●●●●●
●●
●
●●●●●●●●●●●●
●
●●
●●●●●●●●
●
●
●●●●●●●●
●
●
●
●
●
●
●
●●●●●●●●●●●●●●●●●●●●●●●●
●
●
●
●
●
●
●
●●●●●●●●●●●●●●●
●●
●●●●
●
●
●
●●●●●●●●●●●●●●
●
●
●
●●●●●●●●
●
●●
●
●
●
●
●●●
●
●
●●
●
●●
●
●
●
●
●
●
●●
●●
●●●●●●●●●●●●●●●●●●●●●●●●●●●●●●●●●●●●●●●●●●●●●●●●●●
●
●●●●●●●●●●●●●●●●●●●●●●●●●●●●●●●●●●●●●●●●●●●●●●●●●●●●●●●●●●●●●●●●●●●●●●●●●●●●●●●●●●●●●●●●●●●●●●●●●●●●●●●●●●●●●
●●
●
●●●●●●●●●●●●●●●●●●●●●●●●●●●●●●●●●●●●●●●●●●
●●
●
●●●●●●●●●●●●●●●●●●●●●●●●●●●●●●●●●●●●●●●●●●●●●●●●●●●●●●●●●●●●●●●●●●●●●●●●●●●●●●●●●●●●●●●●●●●●●●●●●●●●●●●●●●●
●
●●●●●●●●●●●●●●●●●●●●●●●●●●●●●●●●●●●●●●●●●●●●●●●●●●●●●●●●●●●●●●●●●●●●●●●●●●●●●●●●●●●●●●●●●●●
●
●●
●●●●●●●●●●●●●●
●
●●
●●●●●●
●●●●●●●●●●●●●●●●●●●●●●●●●●●●●●●●●●●●●●●●●●●●●●●●●●●●●●●●●●●●●●●●●●●●●●●●●●●●●●●●●●●●●●●●●●●●●●●●●●●●●●●●●●●
●
●
●
●
●
●●●●●●●●●●●●●●●●●●●●●●●●●●●●●●●●●●●●●●●●●●●●●●●●●●●●●●●●●●●●●●●●●●●●●●●●●●●●●●●●●●●●●●●●●●●●●●●●●●●●●●●●●●●●●●●●●●●●●●●●●●●●●●●●●●●●●●●●●●●●●●●●●●●●●●●●●●●●●●●●●●●●●●●●●●●●●●●●●●●●●●●●●●●●●●●●●●●●●●●●●●●●●●●●●●●●●●●●●●●●●●●●●●●●●●●●●●●●●●●●●●●●●●●●●●●●●●●●●●●●●●●●●●●●●●●●●●●●●●●●●●●●●●●●●●●●●●●●●●●●●●●●●●●●●●●●●●●●●●●●●●●●●●●●●●●●●●●●●●●●●●●●●●●●●●●●●●●●●●●●●●●●●●●●●●●●●
●●●●●●●●●●●●●●●●●●●●●
●
●
●●●●●●●●●●●●●●●●●●●●●●●●●●●●●●●●●●●●●●●●●●●●●●●●●●●●●●●●●●●●●●●●●●●●●●●●●●●●●●●●●●●●●●●●●●●●●●●●●●●●●●●●●●●●●●●●●●●●●●●●●●●●●●●●●●●●●●●●●●●●●●●●●●●●●●●●●●●●●●●●●●●●●●●●●●●●●●●●●●●●●●●●●●●●●●●●●●●●●●●●●●
●
●●●●●●●●●●●●●●●●●●●●●●●●●●●●●●●●●●●●●●●●●●●●●●●●●●●●●●●●●●●●●●●●●●●●●●●●●●●●●●●●●●●●●●●●●●●●●●●●●●●●●●●●●●●●●●●●●●●●●●●●●●●●●●●●●
●●●●●●●●●●●●●●●●●●●●●●●●●●●●●●●●●●●●●●●●●●●●●●●●●●●●●●●●
●●●●●●●●●●●●●●●●
●●●●●●●●●●●●●●●●●●●●●●●●●●●●●●●●●●●●●●●●●●●●●●●●●●●●●●●●●●●●●●●●●●●●●●●●●●●●●●●●
●●●●●●●●●●●●
●
●
●
●●
●
●
●●●
●●●●
●●
●
●
●●●●●
●
●●
●●●
●●●
●
●
●●
●●●
●
●●●●●●●●●●●●●●●●●●●●●●●●●●●●●●●●●●●●●●●●●●●●●●●●●●●●●●●●●●●●●●●●●●●●●
●
●
●
●●●●●●●●●●●●●●●●●●●●●●●●●●●●●●●
●●
●●●●●●●●●●●●●●●●●●●●●●●●●●●●●●●●●●●●●●●●●●●●●●●●●●●●●●●●●●●●●●●●●●●●●●●●●●●●●●●●●●●●●●●●●●●●●●●●●●●●●●●●●●●●●●●●●●●●●●●●●●●●●●●
●
●
●●●●●●●●●●●●●●●●●●●●●●●●●●●●●●●●●●●●●●●●●●●●●●●●●●●●●●●●●●●●●●●●●●●●●●●●●●●●●●●●●●●●●●●●●●●●●●●●●●●●●●●●●●●●●●●●●●●●●●●●●●●●●●●●●●●●●●●●●●●●
●●●●●●●●●●●●●●●●●●●●●●●●●●●●●●●●●●●●●●●●●●●●●●●●●●●●●●●●●●●●●●●●●●●●●●●●●●●●●●●●●●●●●●●●●●●●●●●●●●●●●●●●●●●●●●●●●●●●●●●●●●●●●●●●●●●●●●●●●●●●●●●●●●●●●●●●●●●●●●●●●●●●●●●●●●●●●●●●●●●●●●●●●●●●●●●●●●●●●●●●●●●●●●●●●●●●●●●●●●●●●●●●●●●●●●●●●●●●●●●●●●●●●●●●●●●●●●●●●●●●●●●●●●●●●●●●●●●●●●●●●●●●●●●●●●●●●●●●●●●●●●●●●●●●●●●●●●●●●●●●●●●●●●●●●●●●●●●●●●●●●●●●●●●●●●●●●●●●●●●●●●●●●●●●●●●●●●●●●●●●●●●●●●●●●●●●●●●●●●●●●●●●●●●●●●●●●●●●●●●●●●●●●●●●●●●●●●●●●●●●●●●●●●●●●●●●●●●●●●●●●●●●●●●●●●●●●●●●●●●●●●●●●●●●●●●●●●●●●●●●●●●●●●●●●●●●●●●●●●●●●●●●●●●●●●●●●●●●●●●●●●●●●●●●●●●●●●●●●●●●●●●●●●●●●●●●●●●●●●●●●●●●●●●●●●●●●●●●●●●●●●●●●●●●●●●●●●●●●●●●●●●●●●●●●●●●●●●●●●●●●●●●●●●●●●●●●●●●●●●●●●●●●●●●●●●●●●●●●●●●●●●●●●●●●●●●●●●●●●●●●●●●●●●●●●●●●●●●●●●●●●●●●●●●●●●●●●●●●●●●●●●●●●●●●●●●●●●●●●●●●●●●●●●●●●●●●●●●●●●●●●●●●●●●
●
●●●
●
●●●●●●●●●●●●●●●●●●●●●●●●●●●●●●●●●●●●●●●●●●●●●●●●●●●●●●●●●●●●●●●●●●●●●●●●●●●●●●●●●●●●●●●●●●●●●●●●●●●●●●●●●●●●●●●●●●●●●●●●●●●●●●●●●●●●●●●●●●●●●●●●●●●●●●●●●●●●●●●●●●●●●●●●●●●●●●●●●●●●●●●●●●●●●●●●●●●●●●●●●●●●●●●●●●●●●●●●●●●●●●●●●●●●●●●●●●●●●●●●●●●●●●●●●●●●●●●●●●●●●●●●●●●●●●●●●●●●●●●●●●●●●●●●●●●●●●●●●●●●●●●●●●●●●●●●●●●●●●●●●●●●●●●●●●●●●●●●●●●●●●●●●●●●●●●●●●●●●●●●●●●●●●●●●●●●●●●●●●●●●●●●●●●●●●●●●●●●●●●●●●●●●●●●●●●●●●●●●●●●●●●●●●●
●●
●●●●●●
●
●●●●●●●●●●●●●●
●
●
●
●
●
●●●
●
●●●●
●
●●●●●●●●●●●●●●●●●●●●●●●●
●●
●
●
●
●
●
●
●
●
●
●●
●●●●●●
●
●
●●●●●●●●●●●
●●
●●
●
●
●●●●●●●●●●●●●●●●●●●●●●●●●●●
●
●●●●●●●●●●●●●●●●●●●●●●●
●
●●●
●
●●●●●●●●●●●●
●●●
●●●●●●●●
●●
●●
●
●
●
●●●●●●●●●●●●●●●●●●●●●●●●●●●●●●●●●●●●●●●●●●●●●●●●●●●●●●●●●●●●●●●●●●●●●●●●●●
●●●●●●●●●●●●●●●●●●●●●●●●●●●●●●●●●●●●●●●●●●●●●●●●●●●●●●●●●●●●●●●●●
●●●●●●●●●●●
●●
●
●●●●●●●●
●●
●
●
●●●●●●●●●●●●●●●●●
●
●
●
●●
●
●●
●●
●
●
●●●
●
●
●
●●●●●●●●●●
●
●●●●
●●
●
●●
●●●●
●●●●●●●●●●●●●●●●●●●●●●●●●●●●●●●●●●●●●●●●
●
●
●
●●●●●●●
●●●●●●
●
●●●●●
●
●●●●●●●●●●●●●●●●●●●●●●●●●●●●
●●●●●●●●●●●●●●●●●●●●●●●●●●●●●●●●●●●●●●●●●●●●●●●●●●●●
●●●●●●●●●●●●●●●●●●●●●●●●●●●●●●●●●●●●●●●●●●●●●●●●●●●●●●●●●●●●●●●●●●●●●●●●●●●●●●●●●●●●●●●●●●●●●●●●●●●●●●●●●●●●●●●●●●●●●●●●●●●●●●●●●●●●●●●●●●●●●●●
●
●●●
●
●●●●
●
●●●●●●●
●●●●●●●●●●●●●●
●●●●●●●●●●●●●●●●●●●●●●●●●●●●●●●●●●●●●●●●●●●●●●●●●●●●●●●●●●●●●●●●●●●●●●●●●●●●●●●●●●●●●●●●●●●●●●●●●●●●●●●●●●●●●●●●●●●●●●●●●●●●●●●●●●●●●●●●●●●●●●●●
●
●●●
●
●
●●●●
● ●●●●●
●
●●●
●●
●
●
●●●●●●●●●
●
●●
●
●●●●
●●
●
●●
●
●
●
●●●●●●●●●●●●●●●●●●●●●●●●●●●●●●●●●●●●
●
●
●●●●●●●
●
●●
●
●●●●●●●●●●●●●●●●●●●●●●
●
●
●
●
●●●●●●●●●●●
●
●
●
●
●
●
●●●●
●
●
●
●
●
●
●
●●
●
●
●
●
●●●●●●●●●●●●●●●●●●
●
●
●
●●
●●●●●●●●
●●●●●●●●●●●●●●●●●●●●●●●●●●●●●●●●●●●
●●
●●●●●●●●●●●●●●●●●●●●●
●
●
●●
●
●
●●●
●
●●●●●●●●●●●●
●
●●●●●●●●●●●●●●●●●●●●●
●●●●●●●●●●●●●●●●●●●●●●●●●●●●●●●
●●
●●
●
●
●●●●●●●●●●
●
●
●
●●●●●●●●
●●
●
●●●●●●●●●●●●●●●●
●●●●●●●●●●●●●●●
●●●●●●
●●●●●●●●●●●●●●●●●●●●●●●●●
●
●●
●
●
●●
●●●●●●●●●●●
●●●●●●●●●●●●●●
●●●●●●●●●●●●●●●●●●●●●●●●●●●●●●●●●●●●●●●●●
●●●●●●●●●●
●●●●●
●●●●●
●●●●●●●●●●●●●●●●●●●●●●●
●●●●●●●●●●●●●●●
●
●●●●●
●
●●●●●
●
●
●●●
●
●●
●
●
●
●●●●●●●●●
●●●
●●●
●●●
●●
●
●●●●●●●●●●●●●●●●●
●●●●●●●●●●●●●●●●●●●●●●●●●●●●●●●●●●●●●●●●●●●●●●●●●●●●●●●●●●●●●●●●●●●●●●●●●●●●●●●●●●●●●●●●●●●●●●●●●●●●●●●●●●●●●●●●●●●●●●●●●●●●●●●●●●●●●●●●●●●●●●●●●●●●●●●●●●●●●●●●●●●●●●●●●●●●●●●●●●●●●●●●●●●●●●●●●●●●●●●●●●●●●●●●●●●●●●●●●●●●●●●●●●●●●●●●●●●●●●●●●●●●●●●●●●●●●●●●●●●●●●●●●●●●●●●●●●●●●●●●●●●●●●●●●●●●●●●●●●●●●●●●●●●●●●●●●●●●●●●●●●●●●●●●●●●●●●●●●●●●●●●●●●●●●●●●●●●●●●●●●●●●●●●●●●●●●●●●●●●●●●●●●●●●●●●●●●●●●●●●●●●●●●●●●●●●●●●●●●●●●●●●●●●●●●●●●●●●●●●●●●●●●●●●●●●●●●●●●●●●●●●●●●●●●●●●●●●●●●●●●●●●●●●●●●●●●●●●●●●●●●●●●●●●●●●●●●●●●●●●●●●●●●●●●●●●●●●●●●●●●●●●●●●●●●●●●●●●●●●●●●●●●●●●●●●●●●●●●●●●●●●●●●●●●●●●●●●●●●●●●●●●●●●●●●●●●●●●●●●●●●●●●●●●●●●●●●●●●●●●●●●●●●●●●●●●●●●●●●●●●●●●●●●●●●●●●●●●●●●●●●●●●●●●●●●●
●
●
●●●●●
●●●●●●●●●
●
●●●●●●●●●●●●●●●●●●●●●●●●●●●●●●●●●●●●●●●●●●●●●●●●●●●●●●●●●●●●●●●●●●●●●●●●●●●●●●●●●●●●●●●●●●●●●●●●●●●●●●●●●●●●●●●●●●●●●●●●●●●●●●●●●●●●●●●●●●●●●●●●●●●●●●●●●●●●●●●●●●●●●●●●●●●●●●●●●●●●●●●●●●●●●●●●●●●●●●●●●●●●●●●●●●●●●●●●●●●●●●●●●●●●●●●●●●●●●●●●●●●●●●●●●●●●●●●●●●●●●●●●●●●●●●●●●●●●●●●●●●●●●●●●●●●●●●●●●●●●●●●●●●●●●●●●●●●●●●●●●●●●●●●●●●●●●●●●●●●●●●●●●●●●●●●●●●●●●●●●●●●●●●●●●●●●●●●●●●●●●●●●●●●●●●●●●●●●●●●●●●●●●●●●●●●●●●●●●●●●●●●●●●●●●●●●●●●●●●●●●●●●●●●●●●●●●●●●●●●●●●●●●●●●●●●●●●●●●●●●●●●●●●●●●●●●●●●●●●●●●●●●●●●●●●●●●●●●●●●●●●●●●●●●●●●●●●●●●●●●●●●●●●●●●●●●●●●●●●●●●●●●●●●●●●●●●●●●●●●●●●●●●●●●●●●●●●●●●●●●●●●●●●●●●●●●●●●●●●●●●●●●●●●●●●●●●●●●●●●●●●●●●●●●●
●
●●●
●
●●●●●●●●●●●●●●●●●●●●●●●●●●●●●●●●●●●●●●●●●●●●●●●●●●●●●●●●●●●●●●●●●●●●●●●●●●●●●●●●●●●●●●●●●●●●●●●●●●●●●●●●●●●●●●●●●●●●●●●●●●●●●●●●●●●●●●●●●●●●●●●●●●●●●●●●●●●●●●●●●●●●●●●●●●●●●●●●●●●●●●●●●●●●●●●●●●●●●●●●●●●●●●●●●●●●●●●●●●●●●●●●●●●●●●●●●●●●●●●●●●●●●●●●●●●●●●●●●●●●●●●●●●●●●●●●●●●●●●●●●●●●●●●●●●●●●●●●●●●●●●●●●●●●●●●●●●●●●●●●●●●●●●●●●●●●●●●●●●●●●●●●●●●●●●●●●●●●●●●●●●●●●●●●●●●●●●●●●●●●●●●●●●●●●●●●●●●●●●●●●●●●●●●●●●●●●●●●●●●●●●●●●●●●●●●●●●●●●●●
●
●●
●
●
●
●●
●●●
●
●
●
●●●●●●
●●
●●●●●●●●●●●●●●
●
●●●
●
●●●●●●
●●●●●●●●●
●●●●
●
●
●●●●●
●
●●●●●●●●●●●●●●
●●●●●●●●
●●
●●●●●●●●
●
Jan Feb Mar Apr May Jun Jul Aug Sep Oct Nov Dec
2.5
3.0
3.5
4.0
4.5
Month
Log
Con
cent
ratio
n
Figure 2.3: log Nitric Oxide Concentrations (ppb) by Month, at Boundary Road.Note the apparent decrease in Nitric Oxide concentration during the wintermonths.
18
●●●●●●
●●●●●
●
●
●●●●●
●
●●●●●●●
●
●●●●●●●●●●
●●
●●●●●
●
●
●●
●●
●
●
●●
●●●●●
●
●●●
●●●●
●
●●●●
●
●●●●●
●●●●●●●●●
●
●
●●
●●●●●●●
●
●
●
●●●●●●●●●●●●●●●●●●●●●●●
●
●●●●●●
●●●●●
●
●●●●●●●●●●●●●●
●●●●●
●
●
●●●
●●●●●●
●●●●●
●●
●
●
●
●●●●
●
●●●●●●
●
●
●
●
●●●●●●●
●●●●●●●●●●●●●
●
●
●●
●
●
●
●
●●
●
●
●
●
●
●
●
●●●●●●●●●●●●●●●●●●●●●●●
●
●●●●●●●●●●●●●●●●●●●●●●●●●●●●●
●●●●●
●
●
●●●●
●
●●●●
●
●●
●●●●
●
●
●●●●●●●●●●●●●●●●●●●●●●●●●●●●●●●●●●●●●●●●●●●●●●●●●●●●●●●●●
●
●●●●●●●●●●●
●
●●●●●●●●●●
●
●●●
●●●●●●●●●●●●●●●●●●●●●●●●●●
●
●
●●●●●●●●●●●
●
●
●●●●●
●●
●
●●●●●●●
●
●
●
●
●●
●
●●●●
●●
●
●
●●
●●
●
●
●
●●
●●●●●●
●●●●●●●●●
●
●
●
●●●●●●●●●●●●●●●●●●●●●●●●●●●●●●●●●●●●●●●
●
●●●●●●●●●●●●●
●
●●●●●
●●●●●●●●●●
●●●●●
●●
●●●●●●●●●●●●●●●●●●●●●●●●●●●●●●
●●●●
●
●
●
●●●●●●●●●●●●●●●●●●●●●●●●●●●●●●●●●●●●●●
●●
●
●●
●●●
●●
●
●
●●
●
●
●●●●●●●
●●●●●●●
●
●
●●●●●●●●●●●●●●●●●
●●●●●●●●
●
●●●●●●●●●●●●●●●●●●●●●●●
●●●●●●●●●●●●●●●●●●●●●●●●●●●●●●●●●●●●
●
●●●●●●●●●●●●●●●●●●●●●●●●●●●●
●
●●●●●●●●●●●●●●●●●
●●
●●●●●
●●
●●
●
●
●●
●●
●●●●●●●●●●●●●●●●●●●●
●
●
●●●●●●●
●
●
●●
●●
●
●●●
●
●
●●●
●●
●●●●●●●●●●●●●●●●●●●●●●●●●●●●●●●●●●●●●●●●●●●●●●●●●●●●●●●●●●●●●●●●●●●●●●
●●●●
●●●●●●●●●●●●●●●●●●●●●●●●●●●●●●●●●●●●●●●●●●●●●●●●●●●●●●●●●●●●●●●●●●●●●●●●●●●●●●●●●●●●●●●●●●●●●
●●●●●●●●●●●●
●
●
●
●●●●●●●
●●●●●●●●●●●●●●●●●●●●●
●
●●●●●●●●●●●●●●●●●●●●●●●●●●●●
●
●
●●●●●●
●●●●●●●●●●●
●●
●
●●●●●●●●●●
●●●●●●●●●●●●●●●
●●●●●●●●●●●
●
●●●●
●●●●●●●●●●●●●●●●●●
●●●●●●●●●●●●●●●●●●●●●
●●●●●●●●●●●●
●●●●
●
●
●●
●●●
●●●●
●
●
●
●
●
●
●●
●
●
●●●●
●
●
●
●●●●●●●●●●●●●●●●●●●●●
●●●●●●●●●●●●●●●●●●●●●●●●●●●●●●●●●●●
●
●●●●●●●●●●●●●●●●●●●●●●●●●●●●●●●●●●●●●●●●●●●
●
●●●●●●●●●●●●●
●
●●
●
●●●●
●●●
●●●
●
●●●
●
●
●●●●●●●●●
●●●●
●
●●●●●●
●●●●●●●●●●●●
●●●●●●●●●●●●●●●●●●●●●●●●●●●●●●●●●●●
●●●●●
●
●●●
●
●●●●●●●●
●
●●●●●●●●●●●●●●●●
●●●●●●●●●●●●●●●●●●●●●●●
●
●●●●
●
●
●
●
●●●●●●
●●●●●●●●●●●●●●●
●●●
●
●
●●●●●●●●●●●●●●●
●
●●
●●●●●●●
●●
●●
●●●●●●●●●●●●●●●●●●●●●●●●●●●
●
●●
●●
●
●
●●
●
●●●●●●●●●●●
●●
●●●●●●●●●●●●●●
●●●
●●●●
●
●
●●●●●●●●●
●●
●
●
●
●●●●●●●●●●●●
●
●
●
●●●●●●
●
●
●●●●●●●●●●●●
●
●
●●
●
●
●
●
●●●●
●
●
●●●●●●●
●●●●●●●●
●●●●●●●●●
●●●●
●●
●●●●●
●
●●
●●
●●●●●●●●●●●●●
●●●●
●●●●●●●
●
●●
●●
●●●●●●●●
●●
●●●
●●●●
●
●
●
●●
●
●
●●
●
●●●●●●
●
●
●
●●
●●●●●●●
●●
●
●●●
●
●●●●●●●●●●●●●●●●●●●●
●●●●●●●●●
●●●●
●
●●
●
●●●●●●●●●●●
●●
●●
●
●
●●
●●
●
●●●●●●●●●
●●
●●●●
●
●
●●
●●
●
●
●●●●●●●●●●●●●
●
●●●●●●●●●
●●●
●
●●
●●●
●●
●●●●●●
●●●
●
●●●●●●●
●●
●●●●●●●●●●●●●●●●●●●●●●●●●●
●●●●●●●●●●●●●●
●
●●
●●
●
●●
●
●●
●●
●●
●
●
●●
●●
●●●
●
●
●
●
●●
●
●●●
●
●●●●●●●
●●
●
●
●
●●●●
●●●●●
●●
●●
●●
●●●●●●●●●●●●●
●
●
●
●
●
●
●●●●●
●
●●●●●●●
●●●●●●●
●●●
●
●●●
●
●
●●●●●●●●●●●●●●●●●●●●●●●
●
●
●
●●
●
●●●●
●
●
●
●●
●
●●●●●●●●●
●
●
●●
●●
●
●●
●
●
●
●●●●
●●
●
●
●●●
●
●
●
●
●
●
●
●
●
●
●●●●●●●●●●●
●●●●●●●●●●●●●●●●●●●●●●●
●
●●●●●
●●●●
●●●
●●●●●●●
●
●
●
●
●
●●●●●●●●●●
●
●
●
●●
●●●
●●●●●●●●●●
●●●●●●●●
●●●
●●●●●●●●●●
●
●●●●
●
●
●
●●●●●●
●●
●●●
●●●●●●●●●●●●
●●●
●●●●●●●●●●●●●●●●●●
●
●●
●
●
●
●●●●●●●●●●●●●
●●●●●●●●
●●
●●
●●●
●
●●●
●
●
●●●
●●●●●●●●●●●●●●●●●
●
●●
●●
●
●
●●●●●●
●
●
●●
●●
●
●●
●●●●●●●
●●●●
●
●
●
●
●
●●●
●
●
●
●
●
●●
●
●●●
●●
●●●●●●
●●●
●
●
●●●●●●●●●●●●●●●●●●●●●●
●●
●●●●●●●●●●●●●●●●●●●●●●●●●●●●●●
●●●
●
●●●●●●●●●●●●●●
●
●
●●●●●●●
●●●●
●●●
●●●●●●●
●
●
●●
●●●●●●
●●●
●●
●●
●●●
●
●●
●
●●●●●●●●●
●●
●
●
●
●
●●●
●
●●
●●●
●●●●●●●
●●●●●
●
●
●●
●●
●
●
●
●●
●●●●●
●
●
●
●●
●
●●●●●●●●●
●●
●●
●
●
●●●
●
●●
●
●
●●●●
●●●●●●●
●
●●
●●●
●
●
●
●●●
●
●
●●
●
●●●
●●●
●●●
●●●●●●●●●●
●●
●●●●●●●●
●●
●
●
●
●●
●
●●
●
●
●●
●
●●●●●●●●●●●●●●●●●●●●●
●
●
●
●●●
●
●
●
●●
●
●
●●●●
●
●●●●●●●
●
●●●
●●●●
●
●
●
●●●
●
●
●
●
●●●●
●
●●●
●●●●●●●●●●●●●●●●●●●●
●
●●●●
●●
●
●
●●
●●
●●●
●
●●●●●●●
●●
●●●●●●●●
●
●●●
●
●●
●
●●●
●●●●●●
●●●●●●●●●●●
●●●●
●●●●●●●●●
●
●
●
●●●●●●●●
●
●●
●●●●●
●
●●
●●●●●●
●
●
●
●
●●●●●●●●●●●●●●●
●
●●●
●●●
●●●●●
●
●●●
●
●●●●●●●●●●●●●●●●
●
●
●●●●●●●●●●●●●●●●●●●
●●
●
●●
●●●●●●
●●●
●●
●●●●●●●●●
●●●●●●●●●●●●
●
●●●●●●●●●●
●●●●●●●●●●●
●●●●●●●●●●●●●●●●●●●●●
●
●●●
●●
●
●
●
●
●
●
●
●●●●●●●●●●●●●●●●●●●●●●
●●●●●●●●●●●●●●●●●
●●●●●●●●●●●●●●●●●
●●●●●●●●
●●●●●●
●
●
●
●
●●●●●●
●
●●
●●
●●●●●●●●●●●●
●●●●●●●●●●●●
●
●●●●
●●
●●
●●●●●●
●
●●●●●●●●●●●●●●●●●
●●●●●●●●●●●●●●●●●
●●
●●●●
●●●●●●
●●●●●●●●
●
●
●●
●
●
●●●
●●●●●●●●●●●●●●
●●●●●●●●●
●●●●●●●●●●●●●●●●
●●●
●
●●●●●●
●
●
●
●●●●●●●●●
●●●●
●●●●●●
●
●●
●●●
●
●
●●●●
●●●●
●●
●
●●●
●●●
●
●
●
●●
●●●
●●●
●
●
●
●●●●●●●●●●●●●
●
●
●●●
●●
●
●
●●
●
●●●
●●●●●●●●●●●●●●●●●●●●●●●
●●●
●
●
●
●●●●●
●
●
●
●●
●
●
●●●
●●●●●●
●
●●●
●●
●
●●
●
●
●
●
●●
●
●●●●●●●●●●
●
●●●
●●
●●●●
●●●●●●●●●●●●●●●●●●●
●
●
●
●●●
●
●
●
●
●
●●●
●
●●●●●●●●●●●●●●●●●●●●●●
●
●
●●
●●●
●
●●●
●
●
●
●
●
●
●●●●●
●●
●
●
●●●●●
●●●●●●●●
●
●●
●
●●●●
●
●
●
●●●
●
●●●●●●●●
●●
●
●●
●
●●●●●●
●
●●
●
●●●●●
●●●●●●●●●●●
●●
●●
●
●●●●●
●
●●
●●
●
●●●●●
●●●
●
●
●
●
●●●●●
●●
●●●●●●●
●●●●●●●●
●
●
●●
●●●●●
●●●●●●●●
●●●●●●●●●
●●
●●
●
●●●●●
●●●●●●●●
●●
●
●
●
●●●
●●●
●●
●
●
●●
●
●●
●
●●●●●
●●
●●●
●●
●●●●●●●
●
●
●
●●●●●●●●●
●
●●●●●●
●●
●
●
●
●
●
●
●
●
●●
●
●
●●
●
●
●
●
●
●●●●●
●
●●●
●
●
●●●●●●●●
●
●
●●●●●●
●●●●●●●●●
●●
●
●
●
●●
●●
●●
●
●
●
●
●
●
●●
●●
●●●
●
●
●●●
●●●●●●●
●
●●●●●●●
●●●●●
●●
●
●
●
●●●●●
●
●
●
●
●
●●●
●●●●
●●●●●●
●●
●●●●●●●●●●●●
●●
●●●●●●●●
●●●●●●
●●
●●
●●●●
●●
●●●
●
●
●
●
●
●●
●●●●●●●●●●●●●
●
●●
●●●●●
●
●
●●
●
●
●
●●
●
●●
●●●●●●●
●●●●●●●●
●
●
●●
●●●●●●●●●●●●●●●
●●●●●
●●●●●●
●
●●
●●●●
●
●●
●
●
●
●
●
●●●●●●●●●●●●●●●●●●●●●●●●●●
●
●●●●
●
●●
●●●●●●●●●
●
●
●
●●●●●●●●●●●●●●●●●●●●●
●
●
●●●●
●
●
●●●●●●●●●●●●●●●●●●●●●●●●●●●●●●●●●●●●●●●●●●●●●●●●
●
●●●●●●●●●
●
●
●
●
●●●●●●●●●●●●●●●●●●●●●●●●●●●●
●●●
●
●●●●●●
●
●●●
●●●●●●●●●●●
●
●●●●●●●
●●
●
●●
●
●●●●●●●●●●●●●●●●●●●●●●
●●
●
●●
●●
●
●●
●●
●●●●●●●●●●●●●●
●●
●●●●●●●
●●●
●●●
●
●●●●●●●●●●●●●●●●●●●●
●●
●
●
●
●
●
●
●
●●
●
●
●
●
●●●●●●●●●●●●●●●●
●
●●
●
●
●
●
●●●●●●●
●
●●●●●●●●●●●●●●●●●●●●●
●●●●
●
●●●●●●●●●●●●●●●●
●●●●●●●●●●●●●●●●●●●●●●●●
●
●●●●●●●●●●●●
●●●●
●
●●●
●●●
●
●●●●●●
●
●●●●●●●●●●●●●●●●●●●●●●●●●●●●
●●●●●●●●●●●●●●●●●●●
●●●●
●●●●●
●●●●●
●
●●●●●
●
●
●
●
●●●●●●●●●●●●●●
●
●●●●●●●●●●●●●●
●●
●●
●●
●●●●●●
●●●●●●●●●●●●●●●●●●●●
●
●●●●●●●●●●●●●●●●●●●●●●●●●●●●●●●●●
●●●●●●●●●●●●●●●
●●●●●
●●
●●
●●●●●●
●●●
●
●●●●●●
●
●
●●●●●●
●●
●●
●●●●●●
●
●
●
●●●
●●●●●●
●●●
●
●●●●●
●
●
●●●●●●●●●●
●
●●●●●●●●●●●●●●●●●●●
●●●
●●
●
●●●
●●
●●●
●
●●
●●
●●●
●
●
●
●
●●●●●●
●
●●●●
●●●
●
●
●
●●
●
●●●
●●●●●●●
●
●
●●
●
●
●●●●●●●●●
●
●●
●
●
●
●
●●
●●●
●
●●●
●
●●
●●
●
●
●
●
●
●●●
●
●
●●●
●
●
●
●
●●●
●●●
●●●●
●●●●●●●●●●●●●●●●
●●●●●
●
●
●
●
●●●●●●●●●●
●●●●●●
●●
●●
●
●
●
●
●●●●●
●
●
●
●●
●●●
●
●●●
●●
●
●●●
●
●
●
●
●●●
●●
●●●●
●
●
●●●●●●
●
●●●●●●●●●●●●
●●●●●●●●●●●●
●
●
●●●●●●
●●
●●
●
●●●
●
●●●●●●●
●
●
●
●●●●
●●●●●●●●●●●
●
●●●●●●●
●●●●●
●
●
●
●●
●
●
●
●
●
●●
●
●
●●
●
●
●●●●●●●●●●●●●●●●●●●●●
●
●
●
●●●●●
●
●●●●●●●●
●
●
●●●●●●●●●●●●●●●●
●●●●●●●●●●●
●
●
●
●●
●●●●●●●●●●
●
●●●●
●
●●●●
●
●●●●●●●●●●●●●●
●
●●●●●●●
●●●
●●●
●●●
●●
●●
●
●
●
●
●●●●
●
●
●
●●●
●
●
●
●●
●
●●●●●●
●
●●
●
●●●
●●
●●
●
●
●●●●●●●●●●●●●●●●●●●●●●●●
●
●
●
●●●●●●●●●●
●●●●●●●●●●
●
●●●●●
●
●
●
●●
●
●
●
●●●●●●●●●●●●●●●●●●●●●●●●●●●●●●
●
●
●●●●●●●●
●
●●●●●●●●●●●●●●●●●●●●●●
●●●●●●●●●●●●●
●●
●●●●
●●●●●●●●●●
●
●●●●●●●●
●
●
●
●
●●
●●●
●●●
●
●●●●
●●●
●●
●
●
●
●●●●●
●
●●●●●●●●●●●●●●●●●●●●●●●●●●●●●●●●●●●●●●●●●●●
●
●●●
●
●●
●
●
●
●●●●●
●●
●
●
●
●
●●
●●
●
●
●●
●●
●
●●●●●●●●●●●●●●●●●●●●●●●●●●●
●●
●
●●●
●●●●●●●●●●●●●●●
●●●●●●●●●
●
●
●
●●●●●●
●●
●
●
●
●●●●●●●●●●●●●●●●●●●●
●
●
●
●●●●●●●●
●
●
●
●●
●●●
●●●
●
●●●●●
●
●●●●●●●●●●●●
●●●●
●●
●
●
●
●
●●●
●●●●●●
●●●●●●●
●
●
●
●
●●●
●●●●●●●●●●●●●●●●●
●
●
●●●●●●●
●
●
●
●●
●●
●
●
●●
●●●●●●●●●●
●
●
●
●
●
●●●●●●●●●
●●
●
●●●●●●●●●●●●●●
●●
●●●●●●●●●●●
●●●●●●●●●
●
●
●●
●
●
●
●●●
●
●●
●
●●
●
●
●
●
●●
●●●●●●●●
●
●●
●
●
●
●
●
●
●●●●
●
●●●●
●
●●●●●●●●●●●●
●●
●●●●
●
●●●
●
●
●
●
●●●●●●●●●●●●●●●●●●
●
●●
●
●
●●●●●
●●●●●
●
●●●●●●
●
●●
●
●
●
●
●
●
●
●●
●●
●●
●●●●●●●●
●●●
●●
●
●●
●●●●●
●
●●
●
●
●
●●●●●●●●●●
●
●
●●●●●●
●
●
●
●
●●●●●
●●●●●
●●
●●
●
●●
●
●
●
●
●●●●●●●●●●●●●●
●
●
●●
●
●
●
●
●
●●
●
●
●
●
●
●●●●
●
●
●
●●●
●●●●
●●●
●●
●●
●●●●●●●●●
●
●●●
●
●●
●●●●
●●●
●
●●
●●
●
●●●
●
●
●●●●
●●
●
●
●●●●●●●●●●●
●
●
●●●●●●●●●●●●●●●●●●●●●●●●●●
●●●●●●●
●
●
●
●
●●●●
●
●●●●●●●
●●●
●
●
●
●●●
●
●
●●●●
●●
●
●
●●
●
●
●
●●●
●●●
●●●
●
●
●●●●●●●●●
●
●
●●●●●
●
●●●●
●
●●●●●●●●
●●
●●
●
●●
●
●
●
●
●●
●●
●●
●
●
●●●●
●
●
●
●●●●●●●●●●●●●●●●●●●●●●●
●
●●●●
●●
●●
●
●
●●
●●●●●●
●●
●●
●
●●
●
●
●
●●●●●
●●
●●●●●●●●●●
●
●
●●
●
●
●
●
●●●●
●
●●
●●●●●●●●●
●
●
●●●●●●●
●
●●●●●●
●●●●●●●
●
●
●
●
●
●●
●
●
●●
●
●●●●●●●
●
●
●●●●
●●
●●
●
●●●●
●●
●●●●●●●●●●●●●●●●●
●●
●
●●
●●
●
●
●●●
●
●●
●●●●
●
●
●●●●
●
●
●●
●
●
●
●
●
●●●●●●●●
●●
●
●
●
●●●●
●
●●●●●●●●●●●●●●●●●●●●●●●●●●●●●●●●●●●●●●●●●●●●
●
●
●●
●●●●●●●
●
●
●●●●●●
●●
●●●●●●●●●●
●●●●●●●
●
●
●●●●●●●●●●●●●●●●●●●●●●●●●●●●●
●
●●●●●●
●●●●●●●
●●●●●●●●●●●●●●
●●
●
●
●●●●●●●●●
●●
●
●●●●●●●●●●●●
●
●●●●●●●●●●●●●●●●
●●
●
●
●
●
●
●
●●
●
●●
●
●●●●●●●●●●●●●
●●●●●●●●●●●●●●●
●●
●
●●
●●●
●●●●●●●●●●●
●
●●
●
●
●●●●
●
●
●
●●●●●●●
●
●●●●●
●●●●●●
●●●●●●●●●
●
●
●●●●●●●
●
●●●●●●
●●●●●●
●
●
●
●●●●●●
●
●●●●●●●●●●●●
●●●●
●
●
●●●●●●
●●●
●●
●
●●●●●●●●●●●●●●●
●●
●●●●●●●
●
●●●
●●
●
●
●
●●●●●●●
●
●●●
●●
●
●●●●●●●●●●●●●●●●
●
●
●●●
●
●●●●●
●
●
●
●
●●
●●●●●●
●
●●●●●●
●
●●●
●●●●
●●
●●●●
●●
●●●●●
●
●●●
●
●
●●●
●
●
●
●●●
●●
●●●
●●●
●
●●●●●●●●
●●●●
●●
●
●●●●
●●
●
●●●●●●●●●●●●●●
●●●●●●●●●●●●●●●●●●
●●●●●●●●●●●●●●●●●●●●●●●●●●●●●●●●●●●●●
●●
●●●●●
●●●●●●●●●●●●●●●●●
●●●
●
●
●
●●●●●●●●●●●●●●●●●●●●●●●●●●●●●
●
●●●●
●●●
●
●
●
●
●●●●●●
●●●●●●
●●●
●
●
●
●●●●
●
●
●
●●●●●●
●●
●
●●
●
●●
●
●
●●●●●●
●
●
●●
●●●
●
●●
●●
●
●●●
●
●
●
●
●
●●
●●●●●●●●●●●●●
●
●
●●
●
●
●●●●●●●
●
●
●
●
●
●
●
●
●●●●
●
●●
●
●●●
●
●●
●
●
●●●●●●●●●●●●●●●●●●●●
●●●●
●
●●
●●
●
●
●●
●●●●●
●
●
●
●●
●●●●●●
●●●●
●●●●●●●●●●●●●●●●●
●
●●●●●●●●●●●●●
●●
●●●●
●
●●
●
●●●●●●●●●●●●●
●
●●●●●●●
●●●●●●●●●●●●●●●●●●●●●●●●●●●●●●●
●
●●●●
●
●
●●●
●●●●●●●●
●
●
●●●●●●●●●●●
●
●●●●●●
●
●
●●
●
●
●
●
●
●●●●●●●●●●●●●●●
●●●●●●●●●●●●●●●●
●
●
●
●●●●●●●●●●●●●●●●●●●●●●●●
●
●●
●●●●●●●●●●●●●●●●●●●●●●●●●●●●●●●●
●●●
●
●●●●●●●●●●
●●●●
●●
●●●
●
●●●
●●
●
●
●●●●●●●●●●●●
●
●●●●
●
●●●●●●●●●●●●●●●●●
●●●●●●●●●●●●●●●●●●●●●
●
●●
●●●●●●●●●●●●●●●●●●●●●●●●●●●●●●●●●●●●●●●●●●●●●●●●●●●●●●●●●●●●●●●●●●●●●●●●●●●●●●●●●
●●
●●●●●●●
●
●●●●●
●●●
●
●●●
●●
●●●●●●
●
●
●
●
●
●●●●
●●
●
●
●
●●●●●●●●●●●●●
●
●
●
●
●●●●●●●
●
●●●●●●●●●●●●●●●●●●●●●●●
●●
●●
●●●●●●●●●
●
●
●
●
●
●●●
●●
●●
●●
●●
●●●●●●●●●●●●●●●●●●●●●●●
●●
●●
●
●
●●●●●●●●●●●●●●●●●
●●●●●●●●●●●●●●●●●●●●●●●●●●●●●●●●●
●
●●
●●●●●●●●●●●●●●●●●●●●●●●●●●●●●●
●
●●●●●●●●●●●●●●●●●●●●●●●
●
●●●
●●●●●●
●
●●●●●●●●
●●
●●●●●●●●●●●●●
●
●
●●●●●●
●
●
●●●●●●●●●●●●●●●●●●●●●●●●●●●●●●●●●●●●●●●●●●●●●●●●●●●●●●●●●
●
●
●●
Jan Feb Mar Apr May Jun Jul Aug Sep Oct Nov Dec
2.5
3.0
3.5
4.0
Month
Log
Con
cent
ratio
n
Figure 2.4: log Nitrogen Dioxide Concentrations (ppb) by Month, at BoundaryRoad. Note the slight decrease in concentration during the winter.
●●
●●●●●●●●●
●
●●●●●●●●●●●●●●●●●
●●
●●
●●
●
●
●●
●●●●●
●
●●●
●●●●●
●●●●
●●●●●
●●●●●●●●●
●
●●●●●●●●●
●
●
●●●●●
●
●●●
●
●●●
●●●●●●●●●
●
●
●
●
●
●
●●
●●●●●●●●●●●●●●●●●●●●●●●
●
●●
●
●
●●●●●
●
●●●
●
●●●
●
●●●
●●●●●●
●
●●●●●●●●●●●●●●●●●●●●●●
●
●●●●
●●
●●●
●
●
●
●
●
●●
●●●
●●●●
●
●
●
●●●
●
●
●●
●
●●●●●●●●●●●●●●●●
●
●●
●●
●
●●
●●
●
●●
●
●●●●●●●●●●●●●●●●●●●●●●●●●●
●
●●
●
●
●
●●
●
●●
●
●●●
●●
●
●●●●●●●●●●
●
●●
●
●●●
●
●●●
●●
●●
●●●●
●
●
●●●
●
●●●●●●●●
●●●●●●●●●●●●●●●●
●●
●
●●
●●
●●●
●
●
●●●
●
●●●●
●
●●●●●●●●●●●
●
●
●
●●●●●●
●
●●●●●
●●●
●●●●●
●●
●
●●
●●●●●●
●●
●●●
●●
●●●
●●●
●●●
●●●●
●
●●●●
●●●
●●●●●●●●●●●
●
●●●●●●●●●●
●
●●
●
●●●●
●●●●●●●●●●●●
●
●●●●●●●
●●●●●●●●●●●●
●
●
●●●●●●●●●●●●●●●
●●●●●●●●●●●●●●●●●●●
●●●●●●●
●
●
●
●●●●●●●●●●●●●●●●●●●●●●●
●●●●●●●●●●
●●●●●●●●●●●
●
●●●
●●●
●
●
●
●
●
●●
●●
●●●●●●●●●●●●●●●●●●●●●●●●
●●
●●●●●●●●●●●●●●●●●●
●●●●●●●●●●●●●●●●●●
●
●●
●
●●
●●●●
●
●●●
●●
●●●
●
●●●
●
●●●●●
●
●
●●●●●●●●●●●●●●●●●●●●●●●●●●●●●●●●●●●●●●●●●●●●●●●●●●●●●●●●●
●●●●●●●●●●●●●●●●●●●●●●●●●●●●●●●●●●●●●●●●●●●●
●●●●●●●●●●●●●
●
●●●
●●●●●●●●●●
●
●●●
●
●●●●●●●●●●
●●●●●
●●●●●●
●●●●●●●●●●●●●
●●●●●●●●●●●●●●●●●●●●●●●●●●●●●●●●●●●●●●●●●●
●●●●●
●●●●
●
●●●●●●●●●●●●●
●
●●●●●●●●●●●●●●●
●
●
●●●
●●
●
●●
●●●●●●●●●●●●●●●●●●●●●●
●
●●●●●●
●
●●●●●●●●●●●●●
●●●●●●●●●●●●●●●●
●●●
●●●●
●
●●●●●●●●●●●●●●●●●●●●●●●●●●●●●●●●●●●●●●●●●●●●●●●
●●●●●●●●
●●●
●●●●●●
●●●
●●
●
●●
●●
●
●●●●●●●●●●●●●●●●●●●●●●●●●●●●
●
●●
●
●
●
●
●●
●
●●●●●●●
●●●●
●
●
●●
●
●
●
●●●●●●●●
●●●
●●●●●●●●●●●●●●●●●●●●●●●●●●●●●●
●●●●●●
●
●
●●
●
●
●
●●●●●●●●●●●●
●●
●
●●●●●●
●
●
●●●●●●●●●●●
●
●
●
●
●
●
●
●
●●
●●●●
●
●●●●●●
●●●●●●●●●●●●●●●●●
●●●●
●
●
●●●●
●
●●
●●●●●
●
●
●●
●
●
●
●●●
●●
●
●
●
●●
●●
●●
●
●●
●●●
●●
●
●●●
●
●●●●●
●
●●●
●●●●●●●●●●●●●●●
●
●
●
●
●●●
●
●
●
●
●
●●●
●
●
●●
●
●
●●●●
●
●
●●●
●●●●●●●
●
●●●
●●●●●●●●●●●●●●●
●
●
●
●
●
●
●
●
●
●●●●●●●●
●
●
●
●
●
●●●●●●●●●●●
●
●
●
●
●
●
●●
●●
●
●
●●●●●●
●
●
●
●
●●●●
●●
●●
●
●
●
●
●●●●●●●●●●●●●●●●●●
●●●
●●
●●
●●●
●
●
●●●●●●
●●
●
●●●
●
●●●●●●●
●●●●●●●●●●●●●●●●●●●●●●●●●●●●●●●●●●●●●●●●●●●
●
●●
●●
●
●
●●
●
●●
●●
●
●●●●●●●●●●●●●●
●●●●
●●●●●
●●
●●●●●●●
●
●●●
●●●●●●●
●
●●
●
●
●
●●
●
●
●●
●●●
●●
●
●●●
●
●●●●●●●
●●
●
●
●
●
●●●●●
●●
●●●●●●●●●●●
●●●●●●
●
●
●
●
●●
●
●●●
●●●●●●●
●●●●●●●●●●●
●
●
●●
●●●●●●●●●●●●●●●●●●●●
●●●
●●
●
●
●●●●
●
●●●●●●
●
●●●●●●●●●
●
●●
●
●●●●●●
●
●●
●
●●●●●
●
●●●●●
●●●●●●●
●●
●●●●●●●●●
●●
●
●
●
●●●
●●
●
●●●●
●●●
●
●●●●●●
●
●●●
●
●
●
●
●●
●
●
●
●
●●
●●
●
●
●
●
●
●●
●
●●
●
●
●●●●●●●●●●●●●●●●●●●●●●●●●
●
●
●●●●●●●●●●●
●●●●●●●●
●
●●●●●
●
●●●●●●●
●
●●
●●
●
●
●●
●●●●●●●●●●●●●●●●●●
●●●●●●●●●
●
●
●
●
●●●●●●●
●●●
●
●●●●●●●●
●
●●●●●●●●●●
●●●●●●●●●●●
●
●●●
●●
●
●●●●
●●
●
●
●
●●
●●●●●●
●●
●●●
●●●●●●
●●●●●
●●●●
●●●●●●●
●●●●●●●●
●
●
●
●
●
●
●●●●
●●●●●●●●●●●
●●●●●●●●●●●
●
●
●●
●
●●
●
●●●
●●●●●●●●●●●●●●●●●●
●●●●●●
●
●
●
●
●●
●
●●●●
●●●●
●●●●●●
●●●●
●●
●
●
●●●●
●
●
●
●●
●
●
●●●●
●●●●
●●
●●●●
●
●●
●
●●
●●●●●●
●●●●
●●●●●●●●●●●●●●●●●●●●●●●●●●●●●●●●●●●●●●●●●●●
●●
●●●●●●●
●●●●
●●●
●●●●●
●
●
●●
●●●●●●●●●●●●●
●●●
●
●
●
●
●
●●●●
●●
●
●●●●●●●●●●
●
●●
●
●●●
●
●●●●●●●●●●●●
●
●●
●
●
●
●●●
●●●
●
●
●●
●●●●
●
●●●
●●●●●●●●●
●
●
●●
●
●●
●●
●
●
●●●●●●
●
●●●●
●
●
●
●●●
●
●
●●
●
●●
●
●
●
●
●
●
●
●
●●●
●●
●
●●●●●●●
●●●
●●●●●●●●
●
●●
●
●
●
●
●●
●
●
●●●
●●●●●●●●●●●●●●●●●
●
●●
●
●
●
●●
●
●
●●●●●●●●
●
●
●
●
●●●●●●
●●●●
●
●
●
●●
●
●
●
●
●●●
●
●●●
●●●●●●●●●●●●●●●●●●●●●●
●
●●●●●
●
●
●●
●
●
●●
●
●●●
●●
●
●
●
●●●●●●
●
●●
●
●
●●●●●
●
●●●●●●
●
●
●●
●
●
●
●
●
●
●
●●●●●●●●●●
●
●●●●●●
●●●
●●
●●
●●●●●●●●●●●●●●●●●●●●●●●●●●
●
●
●
●
●
●
●
●●●●
●●●●●
●
●
●
●●
●
●●●●
●●●
●
●
●●●●●
●
●●●
●●●●
●
●●
●
●
●
●
●●●●●●●●●●●●●●
●●●●●●●●●●●
●●
●●
●●●●●●●
●●●●●●
●
●●●
●
●●●●●●●●●●●●●●●●●
●●●●●●●●●●●●●●●●●●
●●
●●
●●●●●●●
●
●
●
●●●
●●
●●●
●
●
●●●●●●●●●●●●●●●
●●●●
●
●
●●●●●●●●●●●
●●●●●●●●●●●●●●●●●●●●●
●●●●
●●
●
●
●
●
●
●
●
●●●●●●●●●●●●●●●●●●●
●●●●●●●●●●●●●●●●●●●●●●●●●●●●●●●●●●●●●●●●●●
●
●●●●●
●
●●
●
●
●
●
●●●●
●●
●
●●●
●●●●●●●●●●●
●
●
●
●
●
●●●●●
●●●
●
●●
●
●●
●
●
●●●
●●
●●●●●●●●●●●●●●●●●●●●●●●●●●●●●●●●●●●●●
●
●●
●
●
●
●
●
●●●●
●
●●●●●●●
●
●
●●
●
●
●●
●
●●●●●●●●●●
●●●●●●●●●
●●●●●●●●●●●●●●●
●●●●●●●
●●●●●●
●●●
●
●●
●●●●●●●●●
●●●●●●●
●●●
●●
●
●
●●●●●●●●●
●
●●●●
●●●●
●●●●●●●●●●
●
●●●●●●●●●●●●●●●●●●●●●
●
●●●●
●●●
●●●●●●●●●●●●●●●●●●●●●●
●●
●●●●●
●●
●
●●●●
●
●
●
●
●●●
●●
●
●
●
●
●
●●●
●●
●
●●●
●
●
●
●
●
●
●●
●
●
●
●
●
●
●●●●●
●
●●●●
●●●●●●●
●●●
●●
●
●
●
●
●●●●●
●
●●
●●●
●●●●●●●●●●●●●●●●●●●●●●●●●●●●●●●●●●●●●●●●
●
●●●
●●●●●
●
●●●
●
●
●
●
●
●●●●●●●●●●●●●●●●●●
●●
●●
●●●●
●●●●
●
●
●●●●
●●●●●●
●
●
●●●●
●
●
●
●●●●●●●
●●
●●●
●
●
●●●●●●
●
●
●
●
●●
●●●●●●
●
●●
●
●
●●●
●●●●●
●●●
●
●
●
●●
●
●●●●
●
●
●●●●
●●●
●
●●●●
●●●●●
●●●
●
●
●
●
●●
●
●
●
●
●●●●
●
●●●
●●●●
●●●●●
●
●
●●
●
●
●●●●●
●
●●●
●●●●
●
●
●●●●●●●●
●
●●
●
●●●●●
●
●
●
●
●●●
●●
●
●
●●●
●●●●●
●●●
●
●
●
●
●●
●
●●
●
●
●●●
●
●
●●
●
●●
●
●
●
●●
●●
●
●
●
●
●
●●
●●
●●●
●
●
●
●●●●
●
●
●
●●●●●●●●
●
●
●
●●●●●
●
●●●●●●
●
●
●
●
●
●
●
●
●●
●
●
●
●
●
●
●
●
●
●
●●
●
●
●
●
●
●
●
●●●●●●●●
●
●
●●●●●●●●●●●●●
●●●●●
●●●
●
●
●
●
●
●
●
●●
●
●
●
●
●●●●●
●●●●●●●●
●●●●
●●●●●●●
●●●●●●●●●●●●
●●
●●●●●●●
●
●
●
●●●
●
●●●●●●●●●●●●●●●●●●●●●●●●●●●●
●●●●●●●●●●●●●●
●●●●
●●●●●●
●●●
●●
●●●●●●●●●●●●●●●
●
●
●
●
●●
●
●●
●
●
●
●
●
●
●
●●
●
●●
●
●
●
●
●●
●
●●
●●●●●●●●●●●●●●●●●
●●
●
●●●●●●●●●●●●●●●●●●●
●●●●●●●●●
●●●●
●
●●
●
●
●
●●
●
●●●●●●●●●●●●●●●●●●●●●●●●●●●●●●●●
●●●●●●●●●
●●
●
●
●●●●●●●●●●
●●●●
●
●
●
●●●●●●●●●●●●●●●●●●●
●
●
●●●●
●
●
●●●●●●●●●●●●●●●●●●●●●●●●●●●●●●●●●●●●●●●●●●●●●
●
●●●●●●●●●
●
●●
●
●●●●●●●●●●●●●●
●●
●●●●●●●●●●●●●●
●●●●
●●●●●●
●
●
●●●
●●●●●●●●●●●●●●●●
●
●●●●●●●
●●●
●●●●
●●●●●●●●●●●●●●●●●●●●●●●●●●●●●
●●
●
●●
●●
●
●
●
●●
●
●
●●●●●●●●●●●●
●
●●●●●
●●●●●●●●●●
●●●●●
●●●●
●●●●●●●●●
●
●●●●
●●●●
●●●●
●
●●●●●●●●●
●
●●
●
●●
●●
●●●
●●●●●●●●●●●●●●
●
●
●
●
●
●
●
●●●●●●●●●●●●●●●●●●●●●●●●●●●●●●●●
●●●●●●●●●●●●●●●●●●●●●●●●●●●●●●●●●
●
●●●●●●●●●●●●
●●●
●●
●
●
●
●
●
●●
●●
●●●●●●
●
●●●●●●●●●●●●●●●●●●●●●●●●●●●●
●●●●●●●●●●●●●●●●●●●●●●●
●●●●●●●●
●
●
●●●
●●●●●●●●
●
●●●●●●●●●●●●●●
●●●●
●●
●●●●●●●●●●●●●●●●●●●●●●
●
●●●●●●●●●●●●●●●●●●●●●●●●●●●●●●●●●●●●●●●●●●●●●●●●●●●●●●●●●●●●●●
●●●●●●●●●●●●
●
●
●
●●●
●●●
●
●
●
●
●●
●
●
●●●●●●●●●●
●
●●●●●●●●●●●
●
●
●
●
●
●
●
●●●
●
●
●
●●●
●
●●●●
●
●●
●
●●●
●
●●●●
●●●
●
●●
●●
●
●
●●●●●●●
●
●●
●
●
●
●●
●
●●
●
●
●
●
●
●●
●●●
●
●●●
●
●●●●
●●
●
●
●
●
●
●●●
●
●●
●
●
●
●
●●●
●●●●
●●●●●●●
●
●●
●
●
●
●
●●
●
●●●●●●●●●●
●●●●
●
●●
●
●
●
●●●●●●
●
●
●
●
●
●●
●●●●●●
●
●
●●
●
●
●
●
●
●●
●
●●●●●
●
●
●●●●●●
●
●●●●●●●●●●●●●●●●●●●●●●●●
●
●
●
●
●●
●●●●●●●
●●●●●●●
●
●●
●●●●●●●●●●●
●
●
●
●●●
●
●
●
●●
●●
●
●
●
●
●●●●
●
●
●●
●●
●●
●
●●●●●●●●●●●●●●●●●●●●●●●●●●●●●●●●
●●
●●●●●●
●
●●●●●●
●●●●●●●●●●●●●●●●●●●●●●
●
●
●
●●
●●●●●●●●
●
●
●
●
●●
●●
●
●●●
●●●●●
●●●●●●
●
●
●●●●●
●
●●●●●
●
●
●
●●
●●●●●
●
●
●●●
●
●●●
●
●●●●●
●
●●
●
●●●●●
●
●●●●●●●●●●●●●●●●●●●●●●●●●
●
●
●
●●●●●●●●●●●●●●●●●
●
●
●
●●
●
●●●●●●●●●●●●●
●
●●
●●●●●●●●●●●●●
●●
●●●●●●●
●
●
●
●●
●
●●●●●●●●●●
●
●●
●●●●●●
●
●●●●●●●●●
●●●●●●●
●
●
●
●
●●
●●●
●●●●●●●●●
●
●
●
●
●●●●●●●●●●●●●●●●●●●●●●●●●●●●●
●●●●●●●●●●●●●●
●●●●●
●
●
●
●
●●●●
●●
●
●
●
●●
●
●
●●
●●
●●●●●●●●●●●●●●●●●●●●●●
●
●●●●●●●●●●●●●●●●●●
●
●●
●●●●●●
●●
●
●●●●●●●●●●●●●●●●●●
●●●
●
●
●
●
●
●
●
●●●
●
●●●●●●●●●●●●●●●●●
●
●
●
●
●
●
●
●
●
●●●●●●●●
●●●●●●
●
●
●
●●●●●●●●●●●●
●
●
●●●●●●
●
●●●
●●●
●●●
●●●
●
●
●
●
●
●
●●●●●●●●●
●●●●●●●●●●●●●●
●
●
●●●●
●●●●●●●●●
●
●●
●
●
●
●●●●
●
●
●●
●
●●
●
●
●
●
●●●●●●
●
●●
●
●
●●●
●●●●●
●●●
●●
●
●●●
●
●
●●●●●●●●●●●●
●
●●
●
●
●●●●
●●●●
●
●●
●
●
●●●
●
●●●●●●●●
●
●
●
●●
●
●
●
●
●●●●●●●●●●●●●●●●
●●
●
●
●●
●●
●
●●
●●●●●
●
●
●
●
●
●●
●●●●●●●●●●●●●●
●
●●●●●●●●
●
●
●●●●●●●
●
●
●
●
●
●
●●●●●●
●●●●
●●
●
●●●●●●●●●●●●●●●
●
●●●●●
●
●
●
●
●
●
●●
●
●●
●
●
●
●●●●●●●
●●●
●
●
●
●
●●
●
●
●●●
●●
●●
●●●
●
●●●●●
●
●●
●●●
●●●
●
●
●●
●●●
●●●●●
●●
●
●
●
●●●●●●●●●●
●
●
●
●●
●●●●●●●●●●●●●●
●●●●●●●●●●●●●●●●●●●●●●●●●●●●●●●●●●●●●●
●●●●●●●
●
●
●
●
●●●●
●
●●●●●●●
●●●●●●●
●
●
●●●●●
●●●●●●●●
●●
●
●●
●
●
●
●
●●●●●●●
●
●●●●●●●●●●
●●●●●●●●●●●●●●●●
●●●●●●●●●●●
●●
●●
●
●
●●
●
●●
●●●●●
●
●
●●●●
●
●
●
●●●●●●●●●●●●●●●●●●●●●●●
●
●●●●●●●●●
●
●
●●●●●
●●
●
●
●●●●●●
●
●●●●●●
●
●●
●
●
●●●●●
●
●
●●●●●●●●●●●●●●
●●●●●●●
●
●
●
●●●
●
●●●
●
●●●●●
●
●
●
●
●
●●●
●
●●
●●
●
●●●●●
●●●●●●●●●●●●
●
●
●
●
●●
●
●
●●
●●
●
●●
●●●●●●
●
●
●●●●●●●●
●
●●
●
●
●●
●
●
●
●
●●●●●●
●●●●●●●●●●●
●
●●●
●
●
●●●●●●●●●●●●●●●●●●●●●●●●●●●●●●●●●●●●●●●●●●
●
●
●●
●
●
●●●●●●
●
●
●
●●●●
●
●●
●●●●●●●●●●●●●●
●
●●●●●●●●●●●●●●●●●●●●●●●●●●●
●
●●●
●●●●●●●●
●●●●●●●●●●●
●●
●
●
●●●●●●●●
●●
●
●●●●●●●●●
●
●
●●●●●●
●●
●
●
●●●
●
●●
●
●●
●
●
●●●●●●●●●●●●●●●●●●●●●●●●●
●
●
●
●
●
●
●
●
●●
●●
●●●●●●●●
●
●●●●●●●
●
●
●●●●
●●
●
●
●
●●●●
●●●●●●
●
●●●●●●●
●
●●
●●●●●●
●
●●●●●●●●●●●●●●
●●
●
●
●●●●●
●
●●●●●●●●●●●
●●●●●●●●●●●
●●●●●●●●●●●●●
●
●●●●●●
●
●●
●
●●●
●●
●
●
●●●●●●●●●
●●●
●●●
●●●●●●●●●●●●●●●●
●
●
●●●●
●●●●●●●●●
●
●
●
●●●●●●
●
●●●●●●●
●●●
●●●●
●●●●●●●●
●●●●●
●
●●●
●
●
●●●●
●
●
●
●●●●●●●●
●●●●
●
●●●●●●●●
●●●●
●
●
●●●
●
●●●●
●●
●
●●●●●●●●●●
●●●●●●●●●●●●●●●●●●●
●●●●●●●●●●●●●●●●●●●●●●●●●●●●●●●●●
●●●●●●●●●●●●●●
●●●●●●●●●●●●●●
●
●●
●●●●●●●●●●●●●●●●●●
●
●●●●
●
●
●●●
●
●
●
●
●
●●●●
●●●
●
●●
●●
●
●
●
●●
●
●●●●●●●●●●●●●●●●●
●
●
●
●●●●●●
●
●●
●
●●●●
●●●●
●●
●
●●
●
●
●
●●●●●●●●●
●
●
●
●
●
●
●
●
●
●
●
●
●
●
●
●
●
●●
●
●
●
●
●
●●●
●●●●
●●●●
●
●●
●
●
●●●●●●●
●
●
●
●
●
●
●
●
●
●●●●●●
●
●●
●●
●
●●●
●
●●
●
●
●●●●●●●●●●●●●●●●●
●●●●
●●●
●●
●
●●
●
●
●●●●●●●●●●●
●
●
●
●●
●●●●●●●●
●
●●
●
●●●●●●●●●●●●●●●●●●
●
●●●
●●●●●●●●●●
●●●●●●●●●
●●
●●
●
●
●
●
●●●●●●●●●●●●●●●●●●●●●●●●●●●●●●●●●●●●●●●●●●●●●●
●●●●●●
●●●
●●●●●●●
●●
●●●●
●●●●●●●●●
●
●●●●●●
●
●
●●
●
●
●
●
●
●●●●●●●●●
●
●
●
●●●●●●●●●●●●●●●●●●●●●●●●●●●●●●●●●●●●●●●●●●●●●●●●●●●●●●●●●
●●●●
●
●●●●●●●●●●
●
●
●
●
●
●
●●
●
●●●●●
●
●●●●●
●●●●●●●
●●●●●●●●●●●●●●●
●●●●●●
●●●
●●●●●●●●●●●●●●●●●●●●●●●●●●●●●●●●●●●●●●●●●●●●●●●●●●●●●●●●●
●●●●●●●●●●●●●●●●
●●●●
●●●●●●●●●●●●●●●●●●●●●●●●
●●●●●●
●
●●●●●
●
●●●
●●
●
●●
●●●●●●●●●●●●
●●
●●●●●●●●
●●●●●●●●●●●●●●●●●●●●●●
●
●
●
●
●
●●●
●
●
●●
●●●●●●●
●●●●
●
●●
●●
●
●●●●●●●●●●
●●●●●●●●●●●●●●●●●●●●●●●●
●●●
●
●●●●●●
●●●●●●●●
●
●
●
●●●●
●●
●●●●●●●●●
●
●●
Jan Feb Mar Apr May Jun Jul Aug Sep Oct Nov Dec
2.5
3.0
3.5
4.0
4.5
Month
Log
Con
cent
ratio
n
Figure 2.5: log Total Oxides of Nitrogen Concentrations (ppb) by Month, atBoundary Road. Note the decrease in concentration during the winter.
19
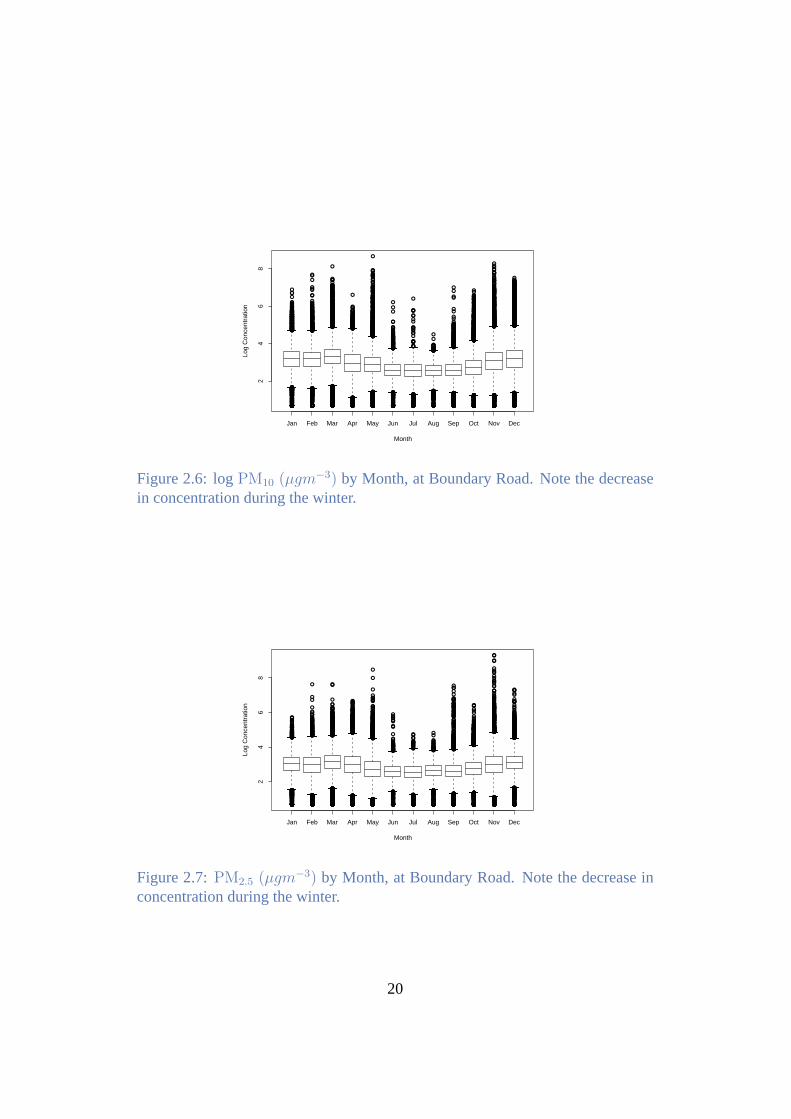
●
●●●●
●
●●●
●
●●
●
●●●●●
●
●●●
●
●●
●
●
●
●●
●
●●
●●
●●●●●●●●
●●●
●●
●●
●●●
●●●
●●●●●●●●●
●
●●●
●
●●
●●●
●●●●●●
●●
●●●●●●●
●●
●●●●
●
●
●
●●●●
●●●●●
●
●
●
●
●
●
●●●●●●●●●●●●●●●
●●●●●
●●●●●
●●●
●●
●●
●
●
●●
●●
●
●
●●●
●
●●●●
●
●●
●
●
●
●●●●●●●●●
●●●
●●●●●●
●●●●●
●●
●
●●●●●●●●
●
●●●
●
●●
●●●●●●●●
●●●
●
●
●
●
●●●●●●
●
●
●
●
●
●
●
●●●
●
●
●●●
●●
●●
●●●●●●●●●●●●●●●●●●
●●●●
●●●
●●●●●●●●●●●●●
●●
●●●●●●
●●
●●
●
●
●●●
●●●●
●●
●
●
●
●●●
●
●●●●●●
●●●●
●●●●
●●●●●●●
●●●●●●
●●●●
●●●●
●
●●●●●●●
●●●●●●●●●●●●●●●●●●●●●●●
●
●●●
●
●●●●
●
●●●●
●
●
●●●●●●●●●●
●
●●●●●
●
●●●●●
●
●●●●●●●●●●●
●
●●●●●
●
●
●
●
●●
●
●●
●●
●
●
●●
●●
●
●
●●
●
●
●
●
●●●●●●●
●●
●
●●
●
●
●
●●●●●●●●●●
●
●●●●
●
●
●
●●
●
●●●
●
●
●
●●●●●
●
●●●●
●●
●●
●
●●●●
●●●●
●
●●●●●●
●●
●●●●●●●
●●
●
●●●●
●●●●
●●●●●●
●
●●●●●●●●●
●
●●●●●
●●●
●●
●●
●●●●
●●
●●
●
●
●●
●
●
●●●●●●●●●●●
●
●●
●
●
●●●●
●●●●●●●●●●
●●●
●●●●●●●●●●●●●●●●●●●
●
●
●
●
●
●
●●
●●
●
●●
●
●
●●●●
●
●●●
●
●
●●●●●●
●
●●●●●
●
●●●●●●●●
●
●●●●●
●●●●●●●●●●●
●●●●●●●
●●●●●●
●●●
●
●●●●●●●
●
●●●●●●●
●●●●●●●●●●●
●●●●
●
●
●
●●●
●
●●●●●
●●
●●●●●
●
●
●
●
●●●
●●●●
●●●●●●●●
●●●
●●●
●
●
●●●●●●
●●●
●
●●
●
●
●●
●
●●●●
●●
●
●
●
●●
●
●●●●●●●●●●
●
●●●●
●
●●●
●●●●●●●●●
●●●●●●●●
●
●●●●
●
●
●●●
●
●
●
●
●
●
●
●
●
●
●
●
●
●
●
●
●
●
●●●●●●●●●●●●●
●●
●●●●●●●●●●●
●
●
●
●●
●●
●●●●
●
●
●●●●
●
●●
●
●
●
●
●
●●●●●●
●
●●
●
●●
●●●●
●
●●●●●●●●
●●
●
●
●
●●
●
●
●●
●
●
●●●●●
●
●●
●
●●
●
●●
●●●●
●
●
●
●●
●
●
●
●●●●●
●
●●●●
●●●●●
●
●●
●●●●●●
●
●
●
●
●●
●
●
●●●
●●
●●
●●
●●
●●●●
●●●
●●
●●●
●
●
●
●●
●
●
●
●●
●
●●
●●●
●●●●●
●
●
●●●
●●●
●
●
●●
●●●
●●●●●●●
●●●
●
●●
●●
●
●●●●●
●●
●●●●
●
●
●●
●●
●●
●
●
●
●
●●●
●●●●
●
●
●●
●
●●●●●
●
●
●
●
●
●●●
●
●●●
●●●
●
●
●●●
●
●
●●●
●●
●
●●●●●
●●●●
●●●●
●
●
●●
●●●●●
●●
●●
●
●●●●●●●●●●●●●●●●●●●
●●●●●●●●●●●●●●●●●●●●●●●●●●●●●
●●●
●●●●●
●●●●●●●●●●●●●●●●●
●●
●●●●●●●●●●●●●●●●●●●●
●●
●
●●●●●●●●●●●●●●●●●●
●●
●●●●
●●
●
●●
●●
●●●●●●●●●●●●●●●
●
●
●
●
●
●
●
●
●●
●
●
●●●
●●●●
●●●
●
●
●
●●
●●
●●●●●●●●●●●●
●●
●●●
●●●●
●●●●●●●●●
●●●
●●●●
●●●●●●
●●●●●
●●●●●
●
●
●●
●
●
●
●●
●
●
●
●●●●●
●●●
●
●●
●
●●●
●
●●●●●●●●
●●●
●●●
●
●
●●●●●●
●
●●●
●
●
●●
●
●
●
●
●
●
●●●
●
●
●●●
●
●
●●
●
●●●●●
●
●
●●
●
●
●
●●
●●●
●
●●●
●
●●●●
●
●
●●
●●
●●
●
●●
●●●●
●
●
●
●●●
●
●
●●
●●
●
●●●●
●
●●●
●●
●
●●●●●
●●●
●●
●●
●
●
●●
●●●●●●●●
●
●●
●
●
●
●
●●
●
●●●●●●●●●●
●●
●●●
●●
●●●●●
●●●●
●
●
●●●
●
●●●
●●
●●●
●●
●
●
●
●●●●●
●
●
●
●●●●●●●●●
●●
●●
●●
●●●●●●●●●
●●
●
●
●●
●●
●●●●
●
●●
●
●
●●●
●●
●
●
●
●
●●●
●
●●●●●●●●●●●●●●●●●
●
●●●
●●●●●●●●
●●
●●●●●●●●●●●●●●●●●●
●●●●●●●
●
●
●
●
●●
●●●●●
●
●
●
●
●
●
●
●
●
●
●●
●
●
●
●
●
●
●
●●
●●●●
●
●●
●
●●
●●●
●●
●●
●
●●
●●●●
●●●
●
●●●●
●●●●●●●
●
●●
●●
●
●●●
●●●●●●●●●●
●●●
●●
●●●
●
●
●
●
●
●●
●
●
●
●
●●
●
●
●
●●●●●
●●
●
●●●
●●●●
● ●
●●●●●
●
●●●●●●●●●●●●
●
●●●●●●●
●
●
●●●●●●●●●●●●●●●
●●
●●●●●●●●●●●●●●●
●
●●●●●●●
●
●
●
●
●
●
●
●
●●●
●
●●●●●●●●●●●●●●●●●●●●●
●
●●●
●●
●
●●●●●●●●●●●●●●●●●●●●●●●●
●
●●●●●●●●●●●
●●
●●
●●●●
●●●
●●●●●●
●●●●
●
●
●●●●●●●●
●●
●●●●●●
●
●
●●●●●●
●
●●
●●●
●
●●●●
●●●●●●●●●●●
●
●●●●●●●●●●●●●
●
●●●●
●
●●●
●●●●●●●
●●
●
●
●●●●●●●●●●
●●●●●●●●●●●●●●●●●●●●●
●
●●●
●●●●●●●
●
●●●●●●●
●
●●●
●
●
●●●●
●
●●●●●●●●●●●●●●●●●●●●●●●●●●●●●●●●●●●●●●●●●●●●●●●●●●●●●●●●●
●
●●●●●●●●●●●●
●
●●●●●●●●●●●●●●●●●●●●●●●●●●●●●●●●●●●●●●●●●●●
●
●●●●●●●●●●●●
●●●●●●●●●●●●●●●●●●●●●●
●
●●●●●●●●●●●●●●●●●●●●
●
●●
●●●●●●●●●●●●●●●●●
●●●
●●●●
●
●●●
●
●
●
●●●●●●●●●●●●●●●●●
●
●
●
●●●●●●●●●●●●●●●●
●
●●●●●●●●●●●●●●●●
●●●●●●●●●
●
●●●●●●●●●●●●●●●
●
●●●●●●●●●●●●●●●●●●●●●●
●●
●
●●●●●●●●●●●●
●
●
●
●●
●●●●●●●●●
●●●●●●
●●
●●
●●●
●●●
●
●●●●●●
●
●
●
●●●●●●●●●●
●●●
●●●●●
●●●
●●●●
●●
●●●●●●●●●●
●●●●
●
●●●●
●
●●●●●●●●
●●●●●●●
●
●
●
●●●
●
●●
●
●●
●●●
●
●●
●●
●
●
●●
●●
●●●
●
●●
●
●●
●
●
●●
●
●
●
●●
●●
●
●●
●
●
●
●
●
●
●
●
●
●
●
●
●●
●●
●
●●●●●●●
●
●●●●●
●
●●●
●●●●
●●
●●●●●
●●
●
●●●●●●●●●●●●●●
●●
●
●●●
●
●
●●●●●
●
●●
●
●●
●●
●●●●●●●●●●●●●
●●
●●●
●
●
●
●●●●●●●●●
●
●●●●●●●●●●●●
●
●●●
●
●●●●
●
●
●
●●
●●●●●
●
●●
●
●
●
●●●
●●
●●●●●
●
●
●
●
●
●●
●●
●●●
●
●
●
●●●●●●
●
●●●●●●●●●●●●
●●●
●●
●
●●
●
●
●●●●
●
●●●●●●●●
●●
●●●●
●●
●●●●
●
●
●
●●●
●
●●
●
●●
●
●
●
●●●
●
●●●
●
●●●
●●
●●●
●
●
●●
●●●●●●●●
●
●●●●●●●●●●●●●●●●
●●
●
●
●●
●●●●
●
●●●●●
●
●●●●●●●
●
●
●●
●
●●●●●
●●
●●
●
●
●
●
●
●
●
●
●●●
●
●●
●
●●
●●
●
●●
●
●
●●●●
●●●●●
●
●●
●●●●
●●
●●
●●●●●●
●
●
●
●●●●●●
●●●●●●●
●●●●●●●●●●●●
●
●●●●●●
●●●
●●
●
●●●●●●
●●●●●
●
●●●
●●●●
●
●●●●●●●●
●●●●
●●●●●●●●●●
●●●●●●●●
●●●●●●●
●●●●●●●●●●●●●●●
●●
●●●●●●●●●●●●●●●●●●●●●●●●●●●●●●●●●●●●
●●●●●
●●●●●●●●
●●
●●●●
●●●●
●●
●●●
●●
●
●●●
●●●
●
●
●●
●
●●
●
●●
●●
●●
●
●●
●
●●●
●●
●●
●●●
●
●
●●●●
●●●
●
●●●
●
●●
●
●●
●
●
●●
●●●
●
●
●●
●●
●●●●●
●●
●
●
●●
●●●●
●●●
●
●●
●
●
●
●●●●●●●●
●●●●
●●
●●
●●
●●●●
●
●●
●
●●
●
●●●●●●
●
●●●
●
●
●
●
●●●
●
●
●
●
●
●●●●
●
●
●
●
●
●
●
●●
●●
●
●
●
●
●●
●
●
●
●●●
●
●●●●
●●●●●
●●●●●
●
●
●
●●●●●
●●●
●●
●
●
●●●
●●
●
●●●
●
●
●
●●●●●●●●●●●●●●
●
●
●●
●
●
●●●●●●●●●
● ●
●
●●●
●●●●●●●
●
●
●
●
●●●●
●
●
●●●●●●
●●●
●●
●
●
●●
●●●
●●●
●●●●
●●
●●
●
●●
●
●
●●
●
●●●
●●●●
●
●●
●
●
●●●●●●●●●●●●
●
●●
●●●
●●●●●
●●●●
●●●●●●●●●●●●●●●●●●●●●
●●
●●●●●●
●
●●●
●
●
●
●
●
●
●
●●●●
●●●●
●
●
●
●
●
●
●●●●
●
●●●
●●
●
●●
●●●
●●●
●●●●
●
●
●●●●
●
●
●●●●●●●
●
●●●●
●
●
●●
●●
●●●
●●
●
●
●
●●●●
●●●
●●
●
●
●●●
●●
●●●
●
●●●●●●●●●●●●●●●
●
●●
●
●●
●
●
●
●●
●
●●●
●●●●●●●●●
●●●
●
●
●
●
●●●●●●●●
●
●
●●
●
●●●●●●
●
●
●●
●
●
●●
●●●
●
●
●
●●
●●●●●●●●●●●●
●●●●●●●●
●
●●●
●
●●●
●●●●●●
●
●●
●
●
●
●
●
●●●●●●●●
●
●●
●
●
●●●
●
●●
●
●
●
●
●●
●
●
●
●
●
●●●
●
●
●
●
●●●●●●●●●●●●●
●
●●
●
●●●●●
●●
●●●
●
●
●
●
●
●●●
●
●●●●●●●
●●●●●●
●●
●
●
●●
●●
●●
●
●●●●●
●
●
●●●●
●●
●
●
●
●
●●●
●
●
●
●
●●
●●
●
●●
●●●
●
●
●●
●●●●●●●●●●●●
●
●
●●●●
●●●
●●
●●●●●●●●●
●
●
●●●●●●●●●
●
●●
●●
●●●●●●●
●
●●●●
●●●●●●●●
●
●●
●●●●●●
●
●●●
●
●●●●●
●
●●
●
●●●●
●●●●●
●●●
●●●●●
●
●
●
●
●
●
●
●
●
●●●●
●●●●●●
●
●
●
●●
●
●●
●
●●●
●
●
●
●
●●●●●
●●●●●
●●
●●●●
●
●
●
●●●●
●●●●●●
●●
●●●
●●
●●
●●
●●
●
●
●●
●
●
●
●
●
●●
●●●
●
●●
●
●●
●
●●
●●
●●●●●●
●
●
●●
●
●
●●●
●
●
●
●
●●●●
●●●
●
●●●●●
●●●●●
●
●
●
●●●●●
●
●●●●
●●
●●
●●●●
●●●●●●●●●●●●●●●●●●●●●●●●
●
●
●●●
●●●
●
●
●●●
●
●
●●
●●
●
●●●
●●
●●
●
●
●
●●●●●●●●
●
●●●
●●
●
●●●●●●●●●
●●●●●●
●
●
●●●
●●●●●
●
●●
●●●●●●
●
●
●●
●
●
●
●
●
●
●
●
●●
●●●●●●●●●●
●●●●●●●●●●●●
●●●●
●
●●●
●●●●
●●
●
●●●●●●
●
●
●
●●
●
●●●●
●●
●
●●
●
●●
●●
●
●
●●●●
●
●●●
●
●
●
●●●●●●●
●●●●
●
●
●●●●●●●
●
●
●●●●●●●●●
●
●●
●●●
●●●●●●●●
●
●●●●
●
●
●●
●●
●
●
●●●
●
●
●●
●●●●
●●
●●●●
●●●
●●
●●●
●
●●
●
●●●
●●●●
●
●●●●●●●●●●●
●●●●●
●●
●
●
●
●
●
●●
●●
●●
●●●●●●●
●
●●●
●●
●
●●●●●
●●
●
●●●
●●
●●●●●
●
●
●●●
●
●●●●
●●●●
●
●●●
●●●●
●
●●●●●●●●
●●
●●●●
●●
●●●
●●●●●●●●●●●●
●●
●●●
●●
●●●●●●●
●
●
●●●●●●
●●
●●
●●●
●●●
●●●
●●
●●●
●●●
●●
●
●●
●
●●●●●●
●●
●●
●●
●
●●
●●●●●●●●●●
●●●●
●●
●
●●●●
●●●
●
●
●●●●●●
●●
●
●
●●●
●●●●●
●
●●●
●
●
●●●●●●●●●●
●●●
●
●●●
●
●●●●●●●●●
●●●●●
●
●●
●●●●●●
●
●●
●●●●●●●
●●●●●●●●●●
●●
●
●●●●●
●
●
●
●●
●●
●●●
●
●●
●●●●●●●●
●●
●
●●●●
●
●
●
●●●●
●●●●
●●●●
●●●
●●●●
●
●
●
●●
●
●●
●●●●
●●●●●
●●●●●●●●
●●●●●●
●●●
●
●●●●●●●●
●●●●
●●●●
●●●●●●●●●●●
●●
●
●●●
●●●●●●
●●●●●●●●●●●●●●●●●●●●●●●●●●●●●
●
●●●●●●●●●
●●
●
●●
●●●●
●●
●●●●●
●
●
●●●●●
●●●●●●●●●
●
●●●●●
●
●●●●●●●
●●●●●
●●
●
●
●
●●
●●●●
●●●●●●●
●●●●●●●
●●●●●
●
●
●
●●
●
●●●●●
●
●●●●●●●●●●●
●●
●●●●●●●●●●●●●●●●●●●●●●●●●●●●●●●●●●●●●●
●
●●●●
●●
●●●
●
●●●●●●●
●●●●●●
●
●●●●●●●
●●●
●●
●
●
●
●●●●●●●●●●●
●●
●●
●●●●●●
●●
●●●
●
●●
●●
●●●●●●●
●
●●●
●●●●●●
●●●
●
●
●●●●●
●●●●●●●●●●●●●●●●●●●
●●●●●●●●●●●●
●●●●●●●●●●●
●●●●
●●●
●
●
●●
●
●●●●●●
●
●●●●●●
●
●●●●●
●
●●
●●
●●●●
●●●●●●●●
●
●
●
●●●●
●
●●
●●●●●●●
●●
●
●●●●
●
●
●●●●
●●●●
●
●●●●●
●●
●●●●●●●●●●●●
●
●●●●●●●●●●●●●
●●●●●●●●●●●●●●●●
●●●●●●●●●●●●●●●●●●●●●●●●●●●●●
●
●
●
●
●
●●●●●●●●●
●●●
●
●●●●●●●●●●●●●●●●●
●
●●
●●
●●●
●●●●●●●●●●●●●●●
●
●●●●●●●●
●
●●●●
●
●●●●●
●
●●●●●●●●●●
●●●
●●●
●
●●●●●
●
●●●●●●●●●
●
●●
●
●●●●●
●
●
●●●●●●●●●●●●●●●●●●●●
●
●●●●
●
●●●●●●●●●
●
●●●●●●
●●
●●●
●
●●●
●●
●●●●●●●●●●●●●●
●
●●
●●●
●●●●
●●
●●●●
●
●●●
●
●●
●
●●●●●●●
●●●●
●●
●●●●●●●●●●●●●
●
●
●
●●●●
●
●
●
●
●
●●●●●●●
●
●●
●
●
●●●●●●●●●●●●●●●●●●●●
●●●●●●●
●●●
●●
●●
●
●
●●●
●●●●●●
●
●●●●●●●●●●●●
●
●●
●
●●
●
●●●●●●
●●
●●●●●●●●
●
●●●●●
●
●●●●●●
●●●●●●
●
●●●
●●
●
●●●●●
●●
●●●●
●●
●●●●
●
●●
●
●●●●●●
●●
●●●●●●●●●
●●●●●●
●
●
●●●●
●●●●●●
●
●
●
●●
●
●●●●●●●●●●●●
●
●
●●●
●
●
●●
●
●
●
●
●●●●
●●●
●
●●
●●
●●●●
●●●
●●
●
●
●●
●
●
●
●
●
●●
●
●
●
●●
●
●
●
●●
●●●●●
●●●
●
●●●●
●
●
●●
●
●
●●●●●●
●
●●●
●●●●
●●●●
●
●
●●●●
●
●●●
●●
●●
●
●
●●●
●●
●●
●●●
●●
●
●●●
●●●●●
●
●
●
●
●●
●
●
●●●●●
●●●
●
●●●●●
●●●●
●●●
●
●●
●●
●●●●●●
●●●
●●●●
●
●●●
●●●●
●●●●
●
●●
●●
●
●
●
●●
●●
●●●●●●●●●●●●●●
●
●●●
●
●
●
●●●●●●●●
●
●●●●
●
●●●●●●
●
●●●●●●●
●●●●●●
●●
●●●●
●●●●●●●●●●●
●●●●●
●●●●●●●●●●●
●●●●●
●
●
●●
●●●●●●●
●
●●
●
●●●
●●
●
●
●●
●●
●●●●
●
●●●
●●
●●
●
●●●
●●
●●●●●●●●●●●●●●●
●
●●
●●●
●
●
●
●●●●
●
●
●●●
●
●
●
●
●●●
●●●
●●●●●●●
●
●●
●
●●●●●●
●
●●
●
●
●
●
●
●●
●●●
●●
●
●●●●
●
●●
●
●●●
●●
●
●●
●
●
●
●●●●●●
●●
●●●●
●●●●●●●●●●●
●
●
●●
●●
●●●
●
●
●
●●●●
●
●
●●●●
●
●●
●●
●●
●
●●●● ●●●●●●●●●●●●
●●
●
●
●●●
●
●●●●●●
●
●●●
●●●
●●●●●●●
●
●●●
●
●
●●●
●
●●
●
●
●●●●●●●●
●
●●●
●
●●●●
●
●●
●
●●
●●●●
●●
●●
●
●●
●●
●
●
●
●
●●
●
●
●●●
●
●●●●●●●●●
●●●●●●●●●●●
●
●●
●
●
●●●●
●
●
●
●
●●
●●●●
●
●
●●●●
●●
●●
●
●●●
●●
●●●
●
●●●
●
●●
●
●●
●●●●
●●●
●●●●●●●●●
●●●●●●●
●●●●●●●●●●●●●●●
●●●●●●●●●●●●●●
●●
●
●●●●●●
●
●●●●●●●●●●●
●●●●●●●●●●●●●●●●●
●●●
●●
●
●
●
●
●●
●
●●
●●
●
●●
●●●
●
●●
●●●●●
●
●●●
●●●
●●
●●●●●●
●●●●●●●●●●
●
●
●●●
●
●
●
●
●●
●
●●●●
●●
●●●●●
●●●●●
●
●●
●
●●●●●
●●●
●
●
●●●
●
●●●
●
●
●
●●●●
●
●
●
●
●
●
●
●
●●
●
●
●●●
●●
●●
●
●●●●
●●●●●
●●●●●●●●●
●
●●●●●●
●●
●●●●
●●●
●
●
●
●●
●●●●
●
●
●●●●●●●
●
●●●●●●
●●
●●●●
●
●●●●●
●●
●●
●●
●●●●●●●●●
●
●●●●●
●
●●●●●
●
●●
●●●●●●●●●●●●●●●●●●
●●
●●●●●●●
●
●●●●●●
●●
●●●
●
●
●
●●●
●
●●●●
●●
●●
●
●●●●●●
●●●●
●●
●●●
●
●●●●
●●●●●
●●
●
●
●●●
●
●●●●
●●●
●●
●
●●
●●●
●●●●
●●●●●●
●●●●
●
●●●●●●●
●●●●●
●
●
●
●●●
●
●
●●
●●
●●●●●
●
●●●●
●
●●
●
●●
●●●●
●
●
●●●●
●
●●●
●●●●●●●●●●●●●●
●●
●
●●●●
●
●
●
●●●●●●●●●
●
●
●
●
●●●●
●
●●●●●●●●
●●
●
●●
●●
●
●
●●●
●●●●●●●●
●●
●●●
●●●
●
●●●
●
●
●
●●●●●
●●●
●
●●●●●
●●●●●●●●●●●●●
●●●●●●
●
●
●
●●●
●
●●●●
●●
●●
●
●●
●●●●●
●●●
●●●●●●●
●
●●●●●●●●●●●●●
●●
●●●●
●
●●●●
●●●
●●●●●●●
●●●●
●●●
●●●
●
●●
●
●●
●
●
●●●●●
●
●●●
●
●●
●
●●
●
●●●●
●
●●
●
●●●●●
●●●●●●●●●●●●●
●●●●
●
●●●●●●●●●●
●●●●●
●●●●
●
●●●●●
●
●●●
●
●●●●●●
●
●
●●●●●
●
●●●●●
●●
●●●
●●●●●●●
●●●●●
●
●●●
●●
●●●●
●●
●●●
●●●
●
●
●●●
●
●
●
●●●●●●●●●●●
●●●●●●●●●
●
●
●
●●
●●●
●●●●
●●
●●
●●●●
●
●
●●●
●
●
●●●●●●●●●●●●●●●●●●●●●●●●●●●●●●●●●●●●●●
●
●●●●●●●●●
●
●●●●●●
●
●●
●
●●●●●●
●
●●●●
●●●
●●
●
●●●●●●●●●●●●●●●●●
Jan Feb Mar Apr May Jun Jul Aug Sep Oct Nov Dec
24
68
Month
Log
Con
cent
ratio
n
Figure 2.6: logPM10 (µgm−3) by Month, at Boundary Road. Note the decreasein concentration during the winter.
●●●●●
●●
●●
●●●●
●●●●
●●
●●
●
●
●●●●●●
●
●●
●
●●
●
●
●●●●
●●●●●●●
●
●
●
●●
●●●●
●
●●●●
●●
●
●●
●●●●●●●●●●●
●
●
●●
●●●●●●●●●●●●●●
●
●●●●●●●●●●●●●●●●●●●●●●●●
●
●●●
●
●
●
●
●●●●
●
●
●
●
●
●
●●●●●●●
●
●
●
●●●
●
●●●●●
●
●●
●●●
●●
●
●
●●●●
●
●●●●●●
●●●
●
●
●●
●●●●
●●
●●●●●●●●●
●
●●●●●●●●●●
●●●
●
●●●
●●●●●●●
●
●●●●●
●●
●
●●●●●●●●●●●●●
●
●●●
●
●●●
●
●●●●●●●
●●
●●●●
●
●
●●●●●●
●
●
●
●
●
●
●
●
●
●●●●
●
●●●●●
●
●●●
●
●
●
●
●
●●●●●●●●●●●●●
●
●●
●
●
●●
●●●●
●●●
●●●●●
●
●●●
●●
●●●
●
●
●●●●●●●●●
●●
●●●●●●●
●
●●●●●
●
●
●●
●
●●●●●
●●●●●●
●
●
●
●
●
●●●
●
●
●●●●●
●●●
●●
●
●
●●
●●●●●●●●●●●●
●
●●●●●●●●
●●●●●
●●●●
●●●
●●●
●
●●●
●●
●●
●
●●●●
●
●●
●
●
●●
●
●●●●●
●
●●●●●●
●●●●
●●
●●
●
●
●●●●
●●
●
●
●
●●
●●●●
●●
●●●●
●
●●●●
●●●
●●●
●
●●●
●●●●●
●●
●
●●
●●
●
●●
●●●●●●
●
●●●●●
●●●●●●●●●●●
●●
●●●●●●
●●
●
●
●●
●●
●●●●
●●
●
●●●●
●●
●●
●●●●●●
●
●●●●
●●
●
●●
●●●
●
●●●●●
●
●
●●●
●
●●●●
●
●
●
●
●
●●
●
●●●
●
●●
●●
●●
●
●
●
●
●
●
●
●
●
●●
●
●●●●●
●
●●●●●●
●
●●●●●●●●●●●●●●●●●●
●
●●●●●●●●●●●●
●●●●●●●
●
●●●●●
●
●●
●
●●
●●●●●●●●
●●
●●●●●●
●●●●
●●●●●●●●●
●
●●●●
●
●●
●●
●
●●●●●●●●●●●
●
●
●●●●●
●●
●●●●●●●●●●●●●●●●●●
●●●●●●●●
●●●●●●●●●●●●
●
●
●●
●●
●●●●●●●
●
●●●●●●●●
●
●
●
●
●
●●●
●
●●●●●●●●●●●●●●
●
●●●●●●●●●●●●●●●●●●●●●●●●
●
●●●
●
●●●●●●●●●●●●●
●●
●●●
●●
●
●●
●●●
●
●●
●
●
●●●●
●●●
●●●●●
●
●
●●
●●●
●
●●●●●●●●●●●●●●●
●
●●
●
●
●
●●
●●●●●●●●●●●●●●●●●●●●●●●●●●●●●●●●●●●●●●●●●●●●●●●●●●●●●●●●●●●●●●●●●●●●●●●
●●●●●●●●●●●●●●●
●
●●●●●●●●●●●●●●●●●●●●●●●●●●●
●
●●●●●●●●●●●●●●
●
●●●
●●●
●
●●
●
●●●●●●●●●●●●●●●●●●●●●●●●●●●●●●●●●●●●●●●●●●●●●
●
●●●●●
●
●
●
●●●●●●●
●
●●●●●●
●●●●
●●
●●●●●●
●
●●●●
●
●
●●●
●●●●●●●●●●●●●
●
●●
●
●
●●●●●●●●●●●●●●●●●●●●●
●●
●●●●●●●
●●●
●
●●●●
●
●
●●
●
●
●
●
●
●●●●●●●
●●●
●●●●●●●●●●●●●●
●
●●●●●●●●●
●
●●●
●
●●●●●●●●●●
●●●●●●●●●●●●●●●●●●●●●●●●
●●
●●●●●●●●●●●●●●
●
●
●●●
●
●●●●●●
●
●●●
●●●●●
●
●●
●
●●●●●●●●
●●
●●●●●●●
●
●●●●●●●●●●
●
●●●●●●●●●●
●
●●●●●●●
●
●
●
●
● ●
●●
●
●●
●●
●●●
●
●●●
●
●●●
●●●
●
●●●●●●●●●●●
●
●●
●
●
●●●●●●●
●
●●
●
●●●●
●
●●●●●●●●●●●●●
●●
●●●●●●●
●●●
●
●
●●
●●
●
●●
●●
●
●●
●
●
●
●
●●●●●●●●●●●●●●
●●●●●●●●●
●●●●●●●●●●●●●●●●
●●
●●●●
●●●●
●
●●●
●
●●
●
●●●
●●
●●
●
●●●
●
●●
●●●
●●
●●●●●
●
●●
●
●
●
●
●●●
●
●●●●
●●●●
●●
●
●
●
●
●
●
●
●●●●●
●
●●●●
●
●●●
●
●●●●●●
●●
●●
●
●●
●●
●
●
●●
●●
●
●
●
●●
●●●
●●
●
●●●
●●
●●
●
●●●●●●●●
●●
●
●●●
●
●●
●●●●
●●●●●●
●●●●●
●
●●
●
●
●
●●●
●
●●
●
●●●●●
●
●
●●
●●
●●
●●●●●●●●
●
●
●
●
●
●●●
●●
●●●
●
●
●●
●●●●
●
●●●●●●●●
●
●●●
●
●●
●
●●
●
●●●
●●
●
●●●
●●●●
●●
●●
●
●
●●●●●
●
●●
●●
●●●●●
●●●●
●●●●●●●●●●
●
●●●
●
●●●●●●●
●
●●●●●●●●●●●●●●
●
●
●●
●
●●●
●
●●
●
●●●●●
●
●●
●●
●●●●
●●
●
●
●
●
●●●
●●
●●
●●●
●●●
●●●
●●●●●●●●
●●●●
●
●
●●●
●
●
●●●●
●●●●
●●●●
●
●●
●●●●●●●
●●●●●●●●
●
●●
●●●
●
●
●
●●●
●●●
●●●●●●
●●●●●●
●●●●●
●●●●●
●●●
●●●
●●
●
●●
●●
●●●
●
●●●
●●
●
●
●
●●●●●●
●●●●●
●●●●
●●●●●
●
●●●●●
●
●
●●
●
●
●●●●●
●
●●●●●●●
●
●
●●●●●●●
●●
●
●●●●
●
●
●●
●
●●
●
●●●●●●
●
●●●●●●●●●●●●●●●
●●●
●●●●●●●●●
●●●●●●●●●●
●●●●
●●●●●●●●
●●●
●●●●●●●●
●●●●●●●●●●
●●●●●
●
●
●●
●●●●●●●●
●
●●●●●●●●●●●●●●●●●●●●
●●●●●●●●●●●●
●
●
●●●
●
●
●●
●
●●●●●
●
●●●●●●●●●●●●●●●●●●●●●●●●
●
●●●●●●●●●●●●●●
●●●
●●●●●●●●●●●●●●●
●
●●●●●●
●
●●●●●●●●●●●●●●●●●●●●●●●●●●●●●●●●●●●●●●
●
●●●●●●●●●●
●
●●●●●
●
●●
●
●●●●
●●●●
●
●●●●●●●●
●●●●●●●●●●●●●●●●●●
●●●●●●●
●
●●●●●●●●
●
●●●●●●●●●
●
●●●●●
●
●●●●●●●●
●●
●
●●●●●●●●●●●●●
●●
●●●●●●
●
●●●
●●
●
●
●●
●
●●●●●
●
●●●●●●●●●●●
●●●●●●●
●
●●●
●
●●●●●●●
●
●●●●●●●
●
●●
●●
●●
●●●
●
●
●
●●
●●●●●
●
●
●●
●
●●●
●
●●
●
●
●
●●●●●
●
●●●●●●●●●●●●●●
●●
●
●
●
●●●●●●●●●●●
●●●
●●●●●
●
●●●●●●●●
●●●●●●●
●●●●●●●●
●
●
●●●●●●●●
●●●●●
●●
●●
●
●●
●●
●●●●
●●
●
●
●
●●
●●
●●
●
●●●●●●●
●
●●●
●
●●●●●
●
●●
●●
●
●●
●●
●●●●●●●●●●●●●●●●
●
●●●●●●●●●●
●
●
●●
●●●●●●●●●●●●
●●
●
●●
●
●●●●●●●●●●●●
●●
●●
●
●●●●●●●●
●
●
●●●
●
●
●●
●●
●●
●●●●
●●
●
●●
●
●
●●
●●●●●●
●
●●
●●
●
●●●
●
●●●●●
●●
●●
●●●●●
●
●
●●●●●●●●
●
●●●●●
●
●
●
●
●
●●
●
●●●●●●
●
●●●●●●●●●●
●●
●●●●●●●●●●●●
●●●●●●●●●
●●
●
●
●●●●●●●●●●●●●●
●●
●●●●
●
●
●●●
●●●
●
●●
●●●●●●●●●●●●●
●●
●
●●●●●●●●●
●●●
●●
●●
●
●●
●
●
●
●
●
●
●●●●●●
●●
●●●
●●●●●●●●●●●●●●●●●●●●●●●●●●●●●●●●●●●●●●●●●●●●●●●●●●●●●●●●●●●●●●●●●●●●●●●●●●●●●●●●
●
●●●●●●●●●●●●●●●●●●●●●●●●●●●●●●●●●●●●●●●●●●●●●●●●●●●●●●●●●●●●●●●●●●●●●●●●●●●●●●●●●●●●●●●●●●●●●●●●●●●●●●●●●
●
●●●●●●●●●●●●●●●●●●●●●●●●●●●●●●●●●●●●●●●●●●●
●●
●●●●●●●●●●●●●●●●●●●●●●●●●●●●●●●●●●●●●●●●●●●●●●●●●●●●●●●●●
●
●●●●●●●●●●●●●●●●●●●●
●●●●●●●●
●●
●
●●
●●
●●
●
●
●
●●●
●●●●
●
●
●
●
●
●
●
●●●●●●
●
●●●●
●●
●●●●●●
●
●●
●
●
●
●●●●
●●
●●
●
●
●●●●●●●●●●●●●●
●
●●●●●●●●●●●●●●●
●●
●●●●●●●
●●●●
●●●
●●
●●
●
●●●
●●●
●●●●
●●●
●
●●
●●
●●
●●
●
●●●●●●●●●●●●●●●●●●●●●●●●●●●●●●●●●
●
●●
●
●●
●
●
●
●
●
●
●●●●●
●●
●
●●●●●●●
●●●
●●●●●●●●●●●●●●●●●●●●●●●●●●●●●●●●
●
●●●●
●
●●●●●●●●●●●●●●●●●●●●●●●●●●●●●●
●●●●●●●●●●●●●
●
●●●●●●
●●
●●●●
●●
●●●●●●●●●●●
●●
●●●
●
●●●●
●
●
●●●
●
●●
●
●
●●
●●●●
●●
●●●●●●
●●
●●
●
●●●●
●●●
●●
●
●●●
●●●●●●●●●●●●●●●●●●●●
●
●
●
●●●●●●
●
●
●
●●●●
●
●
●●●
●
●
●●●
●
●
●●●●●●
●
●●●●
●
●
●●
●●●●●
●●●●
●
●●●●
●●●
●●
●
●
●●●●
●●
●●●●
●●●
●
●
●●
●
●●
●●
●●
●●●●●
●●●●●●
●●●
●●●●
●
●●●●●●●●●
●
●●●●●●●
●
●●●●●●●●●●
●
●●●●
●
●●●●●
●
●●
●●●
●
●
●
●
●●●
●
●●●●●●●●●●●
●
●
●●●
●●
●●●
●●
●●●
●●
●●●●
●●
●●
●●●●
●●●●
●●●●●●●●●●●●●●
●
●●●●●
●
●
●
●●●
●
●●●●●●
●●●●●●●
●
●●●
●
●●●
●
●●
●
●
●●●
●●●●●●●●●●●●
●
●●
●
●
●●●●●●●●●●●●●●●●
●
●●
●
●●
●●
●●
●
●
●●●
●●
●
●●●●●●●
●
●●
●
●●
●
●●●●●
●
●
●
●
●
●●
●
●●
●
●●●●
●●
●●●●●●
●●●●
●●●●●●●●●
●●
●●●●●
●●
●●●●●● ●●
●
●●
●●
●●●●●●
●
●●●●●●●●●●●●●●●●●
●●●●
●●
●
●●●●
●●●●●●
●
●
●●
●
●●●
●●
●●●
●●
●●
●
●●●●●●●●
●●
●●●●●●●
●●
●
●●●●●
●●●
●
●●
●
●●●●
●●●●
●
●●
●●●●
●
●●●●●●
●●●
●
●
●●●●●
●
●●
●●●●●●●●
●●
●●●●●●●
●
●
●
●●●●●●●●●●●●●●
●
●
●●●●●●●●
●
●●●●●●●●
●
●
●
●
●
●●●●
●●●●●●●●
●●
●●●
●
●●
●●●
●
●
●
●
●●
●●
●●
●
●●●
●
●●
●
●
●
●
●
●●●
●
●
●
●●●●
●
●
●●●●
●
●
●●●●
●●
●
●
●●●●●●●●●●●●●●●●●●●●●
●
●
●●●
●●●●
●●●●●●●
●●
●
●
●●●●●●●●●●●
●●
●●●
●●
●●
●●●●
●
●
●●
●●
●
●●●●●
●●
●●
●●●●●●●●●
●
●●●●●●●●●●
●●●●●
●●●
●
●●●●●●●●
●
●●●●●
●
●●●
●●●●
●●
●
●
●●●●●
●●
●●●
●
●●●
●
●●●●●●●●
●
●
●●
●●●
●●●
●●
●
●●●●
●
●●●●●
●●●●
●●●●●
●
●
●●●
●●●●
●
●●●●●●
●
●
●●●●
●●●●●●●●●
●
●●●●●●●●●
●
●●
●●●●
●●●●
●
●
●●●
●●
●●●
●●●
●●●●●●●●●●
●
●
●
●
●●●
●●
●●
●
●
●●●
●●●●
●
●●
●●●●●●●●●●●●●●●●●●●●●●●
●●●●●●●●●●●●●●●●●●●●●●●●●●●●●●
●●●
●●●●●●●●
●●
●●●●●●●●●
●●●●●●
●●●●● ●●
●
●●●●●●●●●●●●●●●●●●●●●●●●●●●
●
●●●●●●●●●●●●●●●●
●●
●●●●
●
●
●●
●●●●●●●●
●
●●●●
●
●●●●
●
●●
●●
●
●
●●●●
●
●
●●●●
●●●●●
●●
●
●
●
●
●●
●
●●●●
●
●
●●
●●●●●
●
●●●●●●●●●
●●●
●●●
●●
●●●●
●
●●
●
●●●●
●●●
●●●●●●●●●●●●●●●●●●●●●●●●●●●●●●●●●●●●●●●●●●●●●●●●
●
●●●●
●
●●
●
●
●●
●●●●●●●●●●●●●●●●●
●
●
●
●●
●●●●●●●●
●●●
●●
●●●●●●●●●●●●●●●●●●●●●●
●●●
●●●●
●●●●●●●●
●
●●●●●●●●●
●
●
●●●●●●
●●
●
●
●●●●●●
●●
●●●
●●
●●
●●●●●
●
●●●
●
●
●
●
●
●●●●●●●●●●
●
●
●●●●●●●●●●●●
●●●●●●●●●●●●●●
●
●
●
●●
●●●●
●
●
●
●
●
●
●●
●●●●●●●●●●●●●●●●●●●●●●●●●●●●
●
●●●●●
●●●●●●●●●●●●●●●●●●●●●●●●●●●●●●●●●●
●●●●●
●●
●●●●●●●●●●●●●●●●
●●●●
●
●●
●
●
●●●
●●
●●
●
●●
●
●●●●●●●●●●●●
●●●●●●●●●●●●●●●●●●●●●●
●
●●
●
●
●●
●●●●●●●●●●
●
●●●●●●●●●●
●
●●
●
●●●●
●
●●●●●●
●
●●●
●
●
●
●●●●●
●●
●●●●●●
●
●●●●●●●●●●●●●●●
●
●●●
●
●
●
●●●
●
●●●●●●
●●●●●
●●
●
●●●●
●●●●●●●●●●
●●
●●●●●●●●●●●●●●●●●●●●
●
●●
●●
●●●●●●●
●
●●●●●
●
●●●
●●●●
●●
●●●●●●●●●●●●●●●●●●●●●●●●●●●●●●●●
●●●●
●
●
●●
●
●
●●●
●●●
●
●●
●
●
●●
●●●●●●●
●
●●●●
●
●●
●
●
●
●
●
●
●
●
●
●●
●●
●●●
●●
●●
●
●
●
●●●●
●●
●●●●●
●
●●●●●●●●●●●●
●●●
●●●●
●
●
●●●●●
●
●●●●●●●●●●●●●
●
●●●●●●●●●●●
●
●●●●●●●●●●●●●●●●●●●●●●●
●
●
●
●
●●●●●●●●
●●●●
●
●●●
●
●
●
●●●
●
●
●
●●
●●●
●
●●●●●●●●
●
●●●●●●●●●●●●
●
●●●●●
●●●●●●●
●
●
●●
●●
●
●
●
●
●●
●
●
●
●
●●
●
●●●●●
●
●
●●●●
●●●●●●●
●
●●●
●
●
●
●●●
●
●●
●●●
●●●
●
●●
●●●
●●
●
●
●
●●●●●●●
●●
●
●
●●
●
●
●●●
●●●
●
●●●●●
●
●●●●●●●●
●
●●●●●●
●●●●●●●●●●●●●●●●●●●●●●●●●●●●●
●
●●●●●●●●
●●●●●●
●
●●●●
●
●●●●●●●●●●●●●
●●
●●●●●●●●●●●●●●●●●●●●●●
●●●●●●●●●●
●●●
●
●●●●●●
●●●●●●
●
●●●
●
●
●
●
●
●●●●●●●
●
●●●●●
●
●●
●
●●
●●●
●
●●●●●●●●
●●●●●●●●●●●●●●●●
●●●●●●●●●●
●●
●
●●●●●●●
●●●●●●●●●●●●
●
●●●●
●●●●●●●●●●●●●●●●
●●●●●●●●●●●●●●●●●●●●●●●●●●●●●●●●●●●●●●●●●●●●●●●●●●●●●●●●●●●●●●●●●●●●●●●●●●●●●●
●
●●●●●●●●●●●●●●●●●●●●●●●●●●●●●●●●●●
●●●●●
●●●
●
●●●●●●●●●●●●●●●●●●●●●●●●●●●●●
●
●●●●
●
●●●●●
●
●●
●
●●●●●●
●●
●●●
●●●●●●●●●●●
●
●●●●
●●
●
●
●●●●●●●●
●●●●●●●●●●●●●●●●●●
●●●●●
●●●●●●●●●●●●●●●●●
●●●
●●●●
●
●●●
●
●●●●●●
●
●●
●
●●●●●●
●
●●●●
●
●●●
●
●●●●●●●●●●●
●●●●●●●●●
●
●●●●●
●
●
●
●●●
●
●●●●●●●●●●
●
●
●
●●●●●
●
●●
●●
●●●●
●●
●●
●
●●●●
●
●●
●
●
●●●●●
●
●
●●●●●
●
●
●●
●
●●●●●●
●●●
●
●●
●
●●●●●●●●●
●
●
●
●
●
●
●
●●●
●●
●
●
●●
●
●●
●●
●●
●●
●●●
●
●●
●
●
●●
●●
●
●●●●
●
●
●
●
●
●
●●●●●●●●●●●●●●●●●●●●●●
●●●●●●●●●●●●●
●●●●●
●●
●●●●
●●
●
●●●●
●
●
●●●●●
●●
●●●●
●
●●●●●●●●
●
●
●
●●●
●
●●●●●
●●●●●●
●
●
●●
●
●●
●●●
●
●●●
●●●●●
●●
●●●●●●●●●●●●
●●●●●
●●●●●●●●●
●●●
●●●●
●●●●●●●●●●
●●
●●●
●
●●●
●●
●●●●●
●
●●●●●
●●●●●
●
●
●
●●●●●●●
●
●●
●
●●●●●●
●●
●
●
●●●
●●
●●
●
●
●
●
●●●●●
●●
●
●●
●
●●
Jan Feb Mar Apr May Jun Jul Aug Sep Oct Nov Dec
24
68
Month
Log
Con
cent
ratio
n
Figure 2.7:PM2.5 (µgm−3) by Month, at Boundary Road. Note the decrease inconcentration during the winter.
20
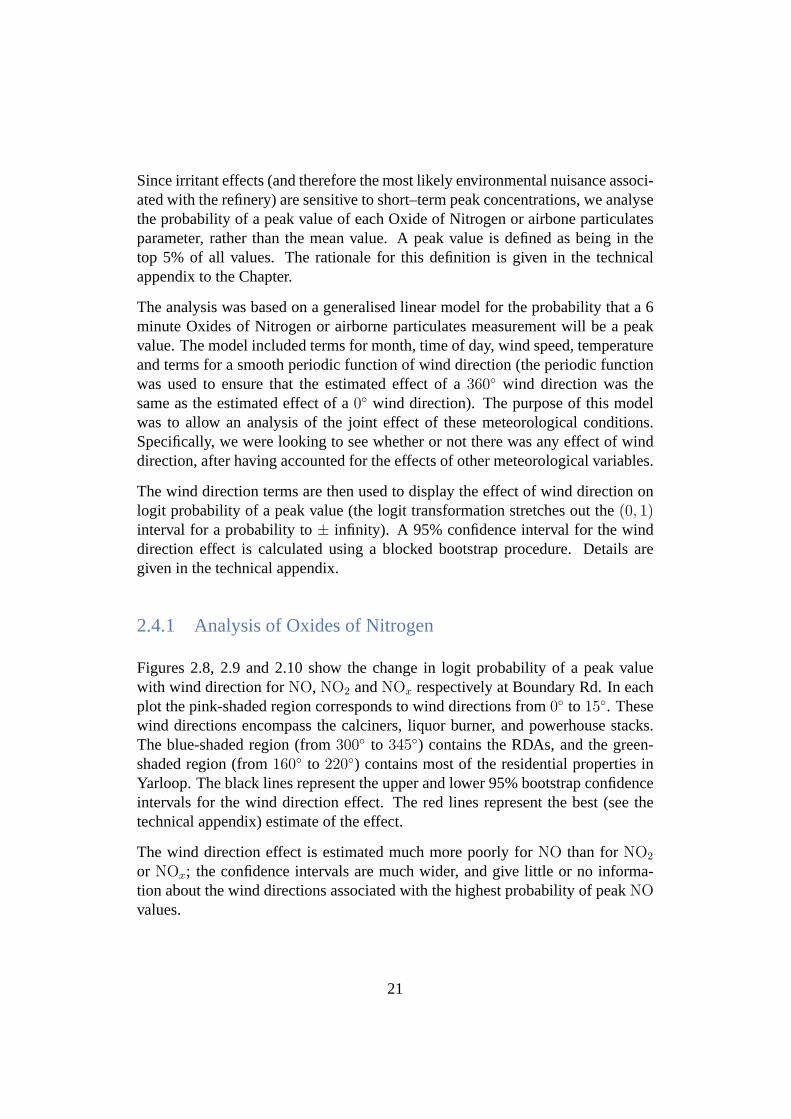
Since irritant effects (and therefore the most likely environmental nuisance associ-ated with the refinery) are sensitive to short–term peak concentrations, we analysethe probability of a peak value of each Oxide of Nitrogen or airbone particulatesparameter, rather than the mean value. A peak value is defined as being in thetop 5% of all values. The rationale for this definition is given in the technicalappendix to the Chapter.
The analysis was based on a generalised linear model for the probability that a 6minute Oxides of Nitrogen or airborne particulates measurement will be a peakvalue. The model included terms for month, time of day, wind speed, temperatureand terms for a smooth periodic function of wind direction (the periodic functionwas used to ensure that the estimated effect of a360◦ wind direction was thesame as the estimated effect of a0◦ wind direction). The purpose of this modelwas to allow an analysis of the joint effect of these meteorological conditions.Specifically, we were looking to see whether or not there was any effect of winddirection, after having accounted for the effects of other meteorological variables.
The wind direction terms are then used to display the effect of wind direction onlogit probability of a peak value (the logit transformation stretches out the(0, 1)interval for a probability to± infinity). A 95% confidence interval for the winddirection effect is calculated using a blocked bootstrap procedure. Details aregiven in the technical appendix.
2.4.1 Analysis of Oxides of Nitrogen
Figures 2.8, 2.9 and 2.10 show the change in logit probability of a peak valuewith wind direction forNO, NO2 andNOx respectively at Boundary Rd. In eachplot the pink-shaded region corresponds to wind directions from0◦ to 15◦. Thesewind directions encompass the calciners, liquor burner, and powerhouse stacks.The blue-shaded region (from300◦ to 345◦) contains the RDAs, and the green-shaded region (from160◦ to 220◦) contains most of the residential properties inYarloop. The black lines represent the upper and lower 95% bootstrap confidenceintervals for the wind direction effect. The red lines represent the best (see thetechnical appendix) estimate of the effect.
The wind direction effect is estimated much more poorly forNO than forNO2
or NOx; the confidence intervals are much wider, and give little or no informa-tion about the wind directions associated with the highest probability of peakNOvalues.
21
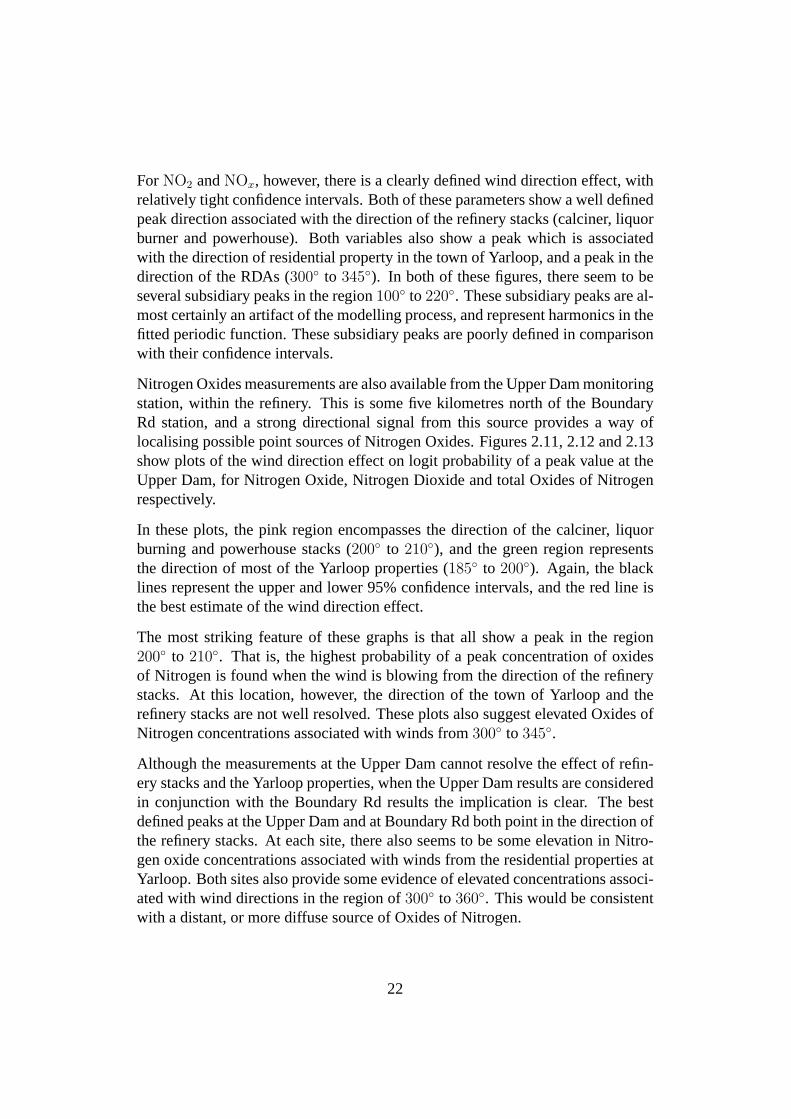
ForNO2 andNOx, however, there is a clearly defined wind direction effect, withrelatively tight confidence intervals. Both of these parameters show a well definedpeak direction associated with the direction of the refinery stacks (calciner, liquorburner and powerhouse). Both variables also show a peak which is associatedwith the direction of residential property in the town of Yarloop, and a peak in thedirection of the RDAs (300◦ to 345◦). In both of these figures, there seem to beseveral subsidiary peaks in the region100◦ to 220◦. These subsidiary peaks are al-most certainly an artifact of the modelling process, and represent harmonics in thefitted periodic function. These subsidiary peaks are poorly defined in comparisonwith their confidence intervals.
Nitrogen Oxides measurements are also available from the Upper Dam monitoringstation, within the refinery. This is some five kilometres north of the BoundaryRd station, and a strong directional signal from this source provides a way oflocalising possible point sources of Nitrogen Oxides. Figures 2.11, 2.12 and 2.13show plots of the wind direction effect on logit probability of a peak value at theUpper Dam, for Nitrogen Oxide, Nitrogen Dioxide and total Oxides of Nitrogenrespectively.
In these plots, the pink region encompasses the direction of the calciner, liquorburning and powerhouse stacks (200◦ to 210◦), and the green region representsthe direction of most of the Yarloop properties (185◦ to 200◦). Again, the blacklines represent the upper and lower 95% confidence intervals, and the red line isthe best estimate of the wind direction effect.
The most striking feature of these graphs is that all show a peak in the region200◦ to 210◦. That is, the highest probability of a peak concentration of oxidesof Nitrogen is found when the wind is blowing from the direction of the refinerystacks. At this location, however, the direction of the town of Yarloop and therefinery stacks are not well resolved. These plots also suggest elevated Oxides ofNitrogen concentrations associated with winds from300◦ to 345◦.
Although the measurements at the Upper Dam cannot resolve the effect of refin-ery stacks and the Yarloop properties, when the Upper Dam results are consideredin conjunction with the Boundary Rd results the implication is clear. The bestdefined peaks at the Upper Dam and at Boundary Rd both point in the direction ofthe refinery stacks. At each site, there also seems to be some elevation in Nitro-gen oxide concentrations associated with winds from the residential properties atYarloop. Both sites also provide some evidence of elevated concentrations associ-ated with wind directions in the region of300◦ to 360◦. This would be consistentwith a distant, or more diffuse source of Oxides of Nitrogen.
22
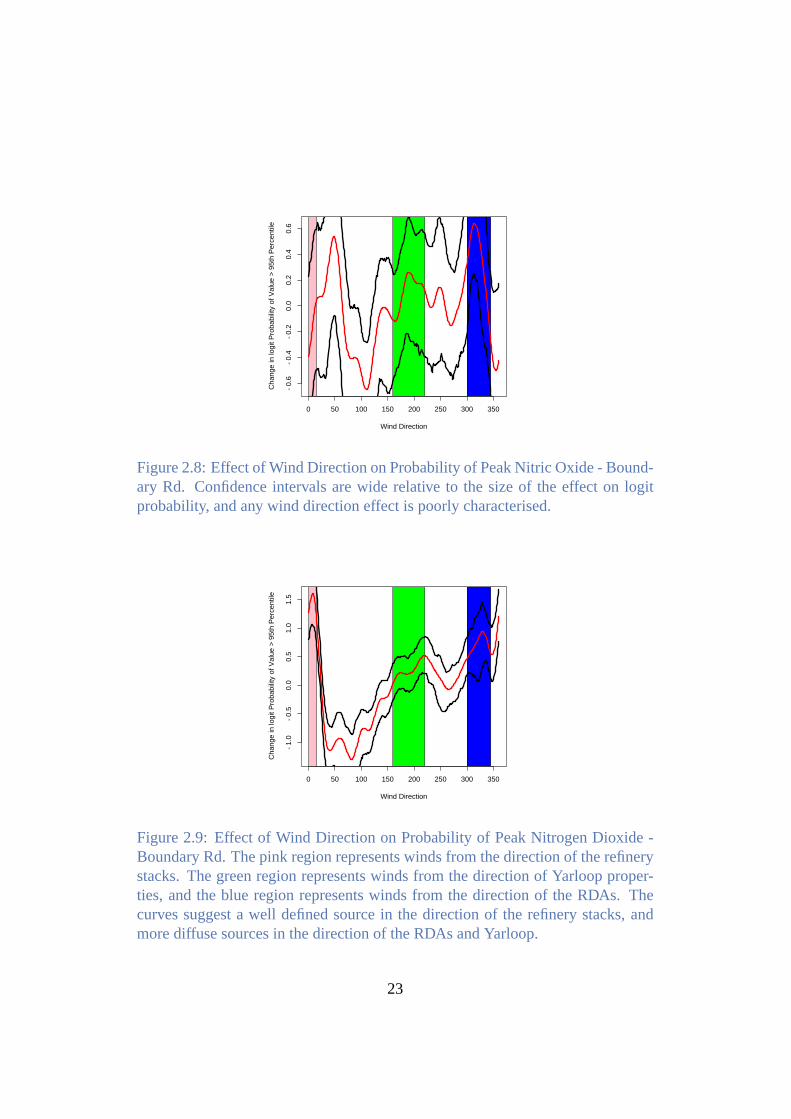
0 50 100 150 200 250 300 350
−0.
6−
0.4
−0.
20.
00.
20.
40.
6
Wind Direction
Cha
nge
in lo
git P
roba
bilit
y of
Val
ue >
95t
h P
erce
ntile
Figure 2.8: Effect of Wind Direction on Probability of Peak Nitric Oxide - Bound-ary Rd. Confidence intervals are wide relative to the size of the effect on logitprobability, and any wind direction effect is poorly characterised.
0 50 100 150 200 250 300 350
−1.
0−
0.5
0.0
0.5
1.0
1.5
Wind Direction
Cha
nge
in lo
git P
roba
bilit
y of
Val
ue >
95t
h P
erce
ntile
Figure 2.9: Effect of Wind Direction on Probability of Peak Nitrogen Dioxide -Boundary Rd. The pink region represents winds from the direction of the refinerystacks. The green region represents winds from the direction of Yarloop proper-ties, and the blue region represents winds from the direction of the RDAs. Thecurves suggest a well defined source in the direction of the refinery stacks, andmore diffuse sources in the direction of the RDAs and Yarloop.
23
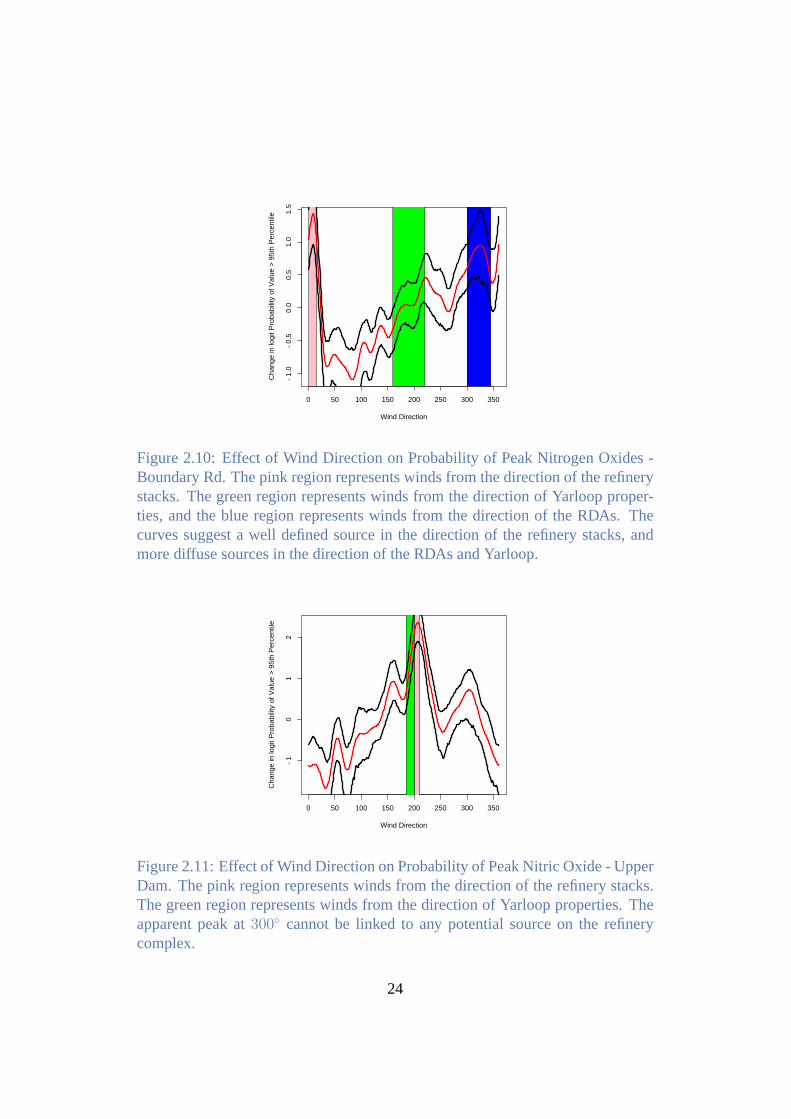
0 50 100 150 200 250 300 350
−1.
0−
0.5
0.0
0.5
1.0
1.5
Wind Direction
Cha
nge
in lo
git P
roba
bilit
y of
Val
ue >
95t
h P
erce
ntile
Figure 2.10: Effect of Wind Direction on Probability of Peak Nitrogen Oxides -Boundary Rd. The pink region represents winds from the direction of the refinerystacks. The green region represents winds from the direction of Yarloop proper-ties, and the blue region represents winds from the direction of the RDAs. Thecurves suggest a well defined source in the direction of the refinery stacks, andmore diffuse sources in the direction of the RDAs and Yarloop.
0 50 100 150 200 250 300 350
−1
01
2
Wind Direction
Cha
nge
in lo
git P
roba
bilit
y of
Val
ue >
95t
h P
erce
ntile
Figure 2.11: Effect of Wind Direction on Probability of Peak Nitric Oxide - UpperDam. The pink region represents winds from the direction of the refinery stacks.The green region represents winds from the direction of Yarloop properties. Theapparent peak at300◦ cannot be linked to any potential source on the refinerycomplex.
24
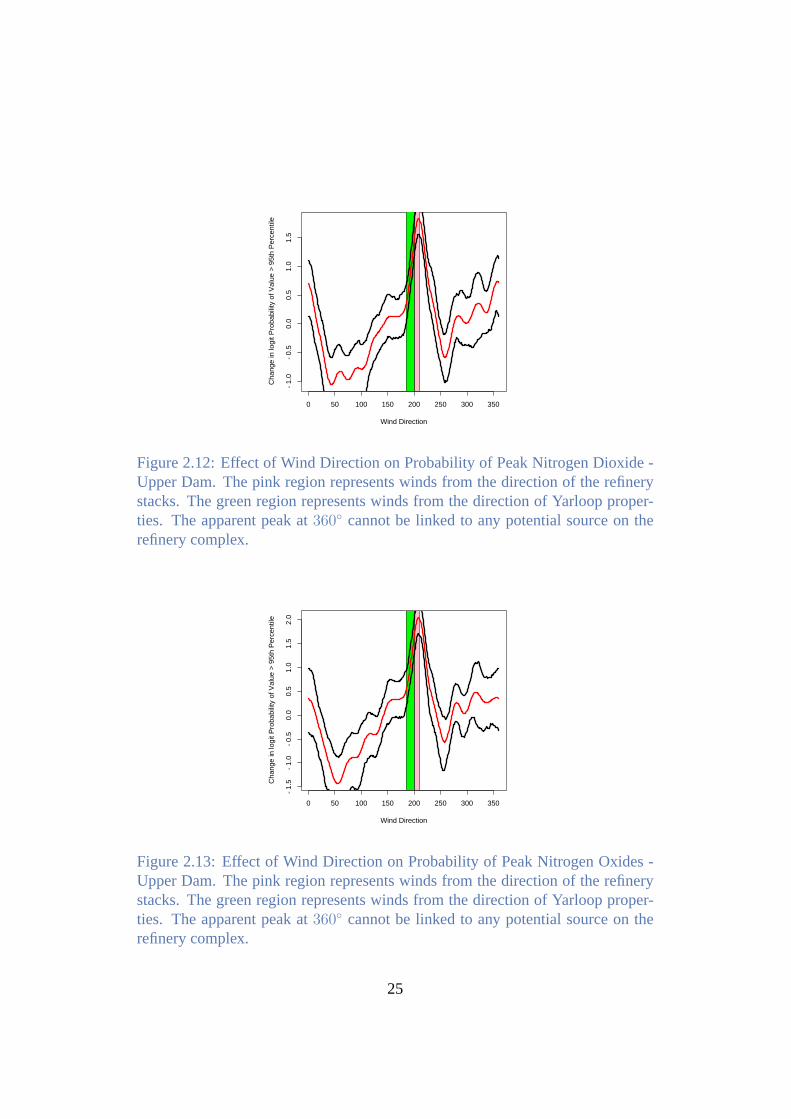
0 50 100 150 200 250 300 350
−1.
0−
0.5
0.0
0.5
1.0
1.5
Wind Direction
Cha
nge
in lo
git P
roba
bilit
y of
Val
ue >
95t
h P
erce
ntile
Figure 2.12: Effect of Wind Direction on Probability of Peak Nitrogen Dioxide -Upper Dam. The pink region represents winds from the direction of the refinerystacks. The green region represents winds from the direction of Yarloop proper-ties. The apparent peak at360◦ cannot be linked to any potential source on therefinery complex.
0 50 100 150 200 250 300 350
−1.
5−
1.0
−0.
50.
00.
51.
01.
52.
0
Wind Direction
Cha
nge
in lo
git P
roba
bilit
y of
Val
ue >
95t
h P
erce
ntile
Figure 2.13: Effect of Wind Direction on Probability of Peak Nitrogen Oxides -Upper Dam. The pink region represents winds from the direction of the refinerystacks. The green region represents winds from the direction of Yarloop proper-ties. The apparent peak at360◦ cannot be linked to any potential source on therefinery complex.
25
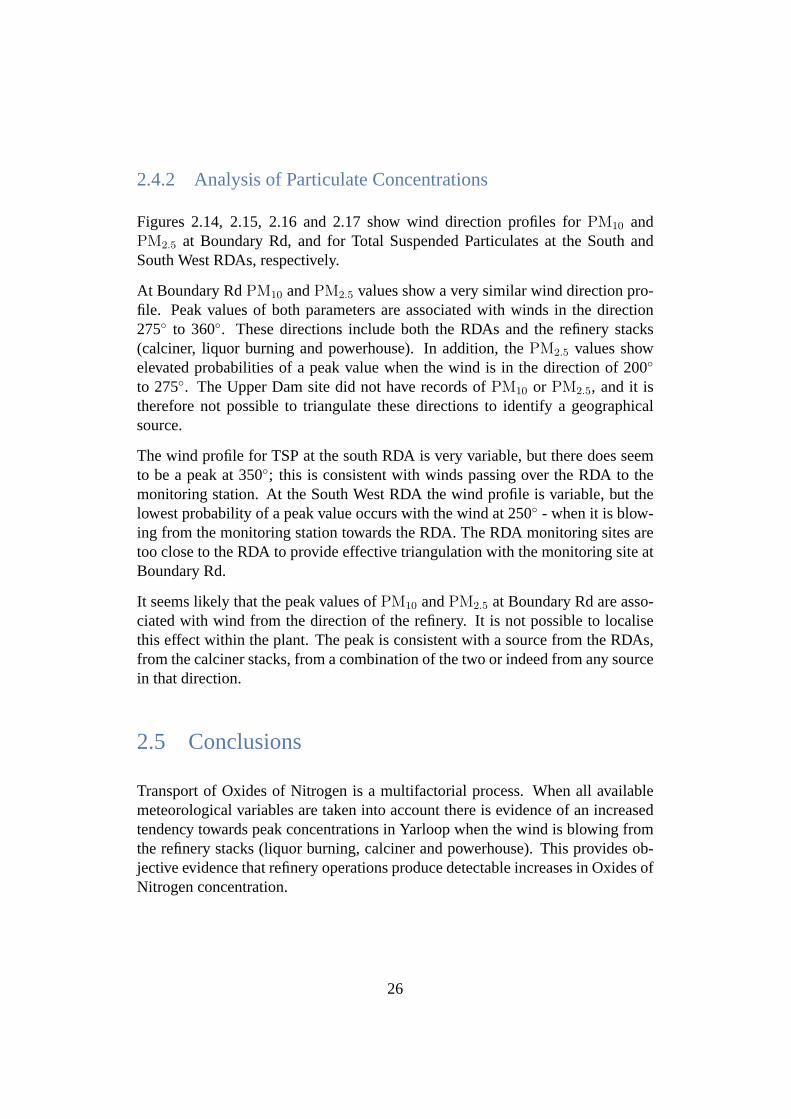
2.4.2 Analysis of Particulate Concentrations
Figures 2.14, 2.15, 2.16 and 2.17 show wind direction profiles forPM10 andPM2.5 at Boundary Rd, and for Total Suspended Particulates at the South andSouth West RDAs, respectively.
At Boundary RdPM10 andPM2.5 values show a very similar wind direction pro-file. Peak values of both parameters are associated with winds in the direction275◦ to 360◦. These directions include both the RDAs and the refinery stacks(calciner, liquor burning and powerhouse). In addition, thePM2.5 values showelevated probabilities of a peak value when the wind is in the direction of 200◦
to 275◦. The Upper Dam site did not have records ofPM10 or PM2.5, and it istherefore not possible to triangulate these directions to identify a geographicalsource.
The wind profile for TSP at the south RDA is very variable, but there does seemto be a peak at 350◦; this is consistent with winds passing over the RDA to themonitoring station. At the South West RDA the wind profile is variable, but thelowest probability of a peak value occurs with the wind at 250◦ - when it is blow-ing from the monitoring station towards the RDA. The RDA monitoring sites aretoo close to the RDA to provide effective triangulation with the monitoring site atBoundary Rd.
It seems likely that the peak values ofPM10 andPM2.5 at Boundary Rd are asso-ciated with wind from the direction of the refinery. It is not possible to localisethis effect within the plant. The peak is consistent with a source from the RDAs,from the calciner stacks, from a combination of the two or indeed from any sourcein that direction.
2.5 Conclusions
Transport of Oxides of Nitrogen is a multifactorial process. When all availablemeteorological variables are taken into account there is evidence of an increasedtendency towards peak concentrations in Yarloop when the wind is blowing fromthe refinery stacks (liquor burning, calciner and powerhouse). This provides ob-jective evidence that refinery operations produce detectable increases in Oxides ofNitrogen concentration.
26
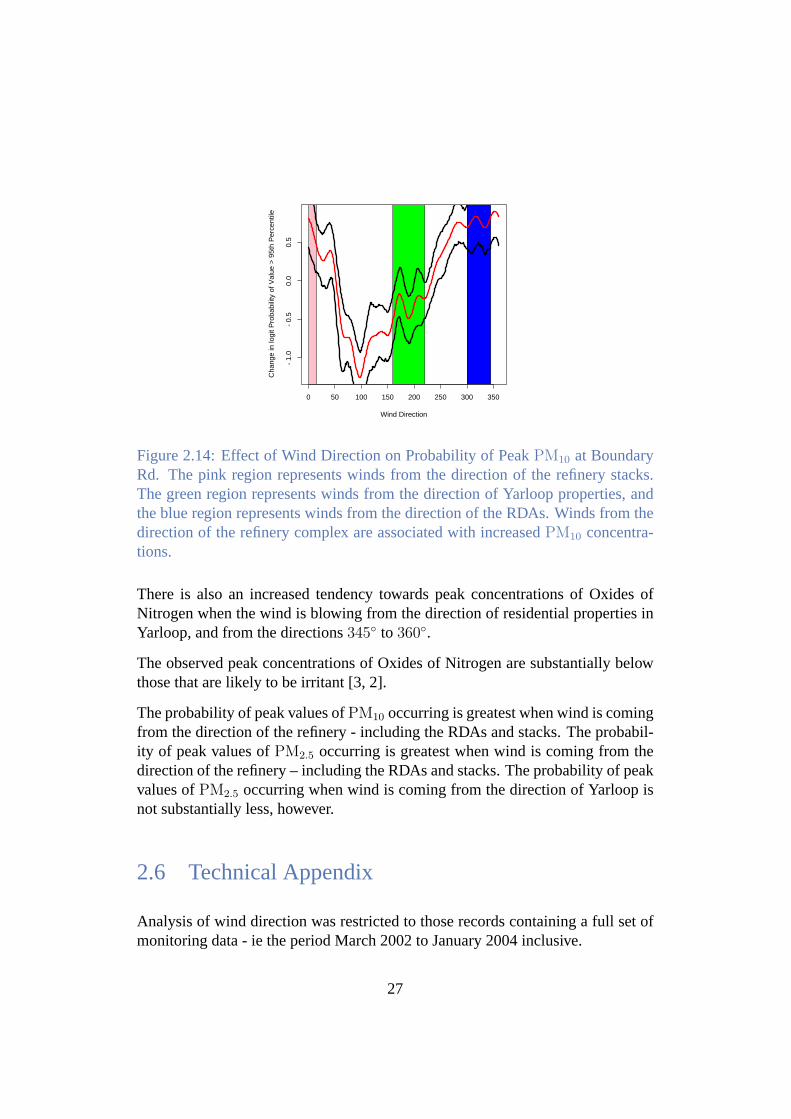
0 50 100 150 200 250 300 350
−1.
0−
0.5
0.0
0.5
Wind Direction
Cha
nge
in lo
git P
roba
bilit
y of
Val
ue >
95t
h P
erce
ntile
Figure 2.14: Effect of Wind Direction on Probability of PeakPM10 at BoundaryRd. The pink region represents winds from the direction of the refinery stacks.The green region represents winds from the direction of Yarloop properties, andthe blue region represents winds from the direction of the RDAs. Winds from thedirection of the refinery complex are associated with increasedPM10 concentra-tions.
There is also an increased tendency towards peak concentrations of Oxides ofNitrogen when the wind is blowing from the direction of residential properties inYarloop, and from the directions345◦ to 360◦.
The observed peak concentrations of Oxides of Nitrogen are substantially belowthose that are likely to be irritant [3, 2].
The probability of peak values ofPM10 occurring is greatest when wind is comingfrom the direction of the refinery - including the RDAs and stacks. The probabil-ity of peak values ofPM2.5 occurring is greatest when wind is coming from thedirection of the refinery – including the RDAs and stacks. The probability of peakvalues ofPM2.5 occurring when wind is coming from the direction of Yarloop isnot substantially less, however.
2.6 Technical Appendix
Analysis of wind direction was restricted to those records containing a full set ofmonitoring data - ie the period March 2002 to January 2004 inclusive.
27
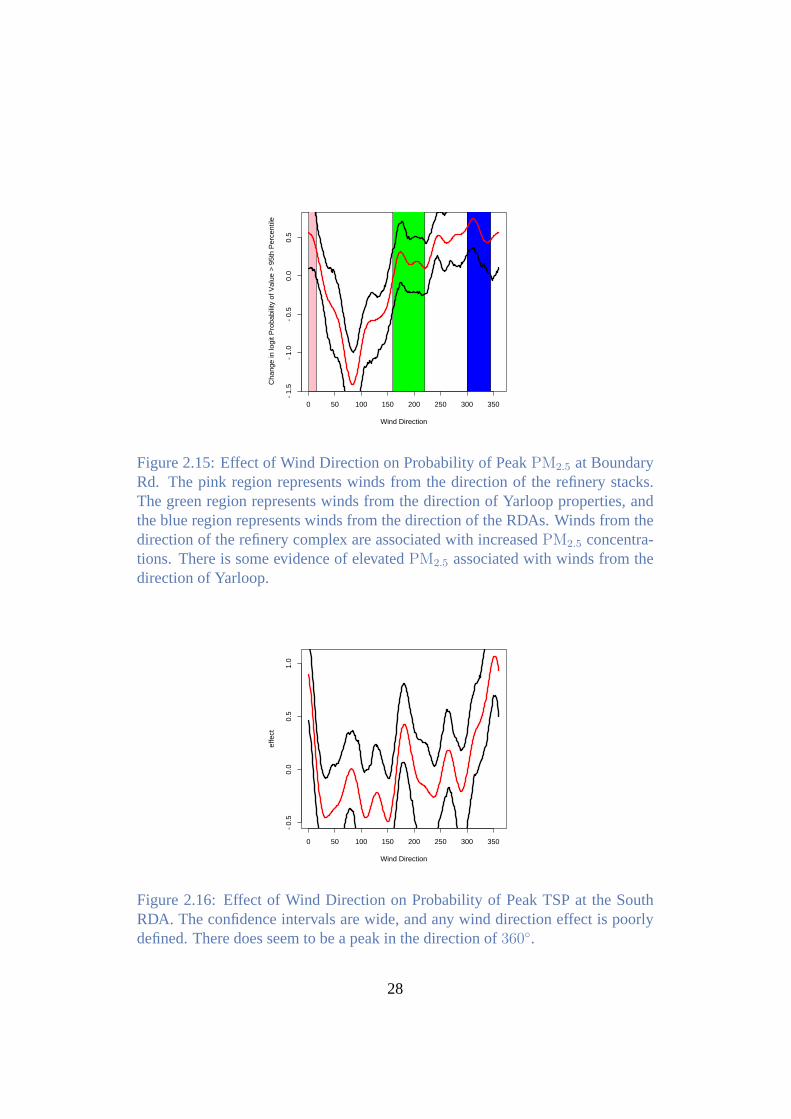
0 50 100 150 200 250 300 350
−1.
5−
1.0
−0.
50.
00.
5
Wind Direction
Cha
nge
in lo
git P
roba
bilit
y of
Val
ue >
95t
h P
erce
ntile
Figure 2.15: Effect of Wind Direction on Probability of PeakPM2.5 at BoundaryRd. The pink region represents winds from the direction of the refinery stacks.The green region represents winds from the direction of Yarloop properties, andthe blue region represents winds from the direction of the RDAs. Winds from thedirection of the refinery complex are associated with increasedPM2.5 concentra-tions. There is some evidence of elevatedPM2.5 associated with winds from thedirection of Yarloop.
0 50 100 150 200 250 300 350
−0.
50.
00.
51.
0
Wind Direction
effe
ct
Figure 2.16: Effect of Wind Direction on Probability of Peak TSP at the SouthRDA. The confidence intervals are wide, and any wind direction effect is poorlydefined. There does seem to be a peak in the direction of360◦.
28
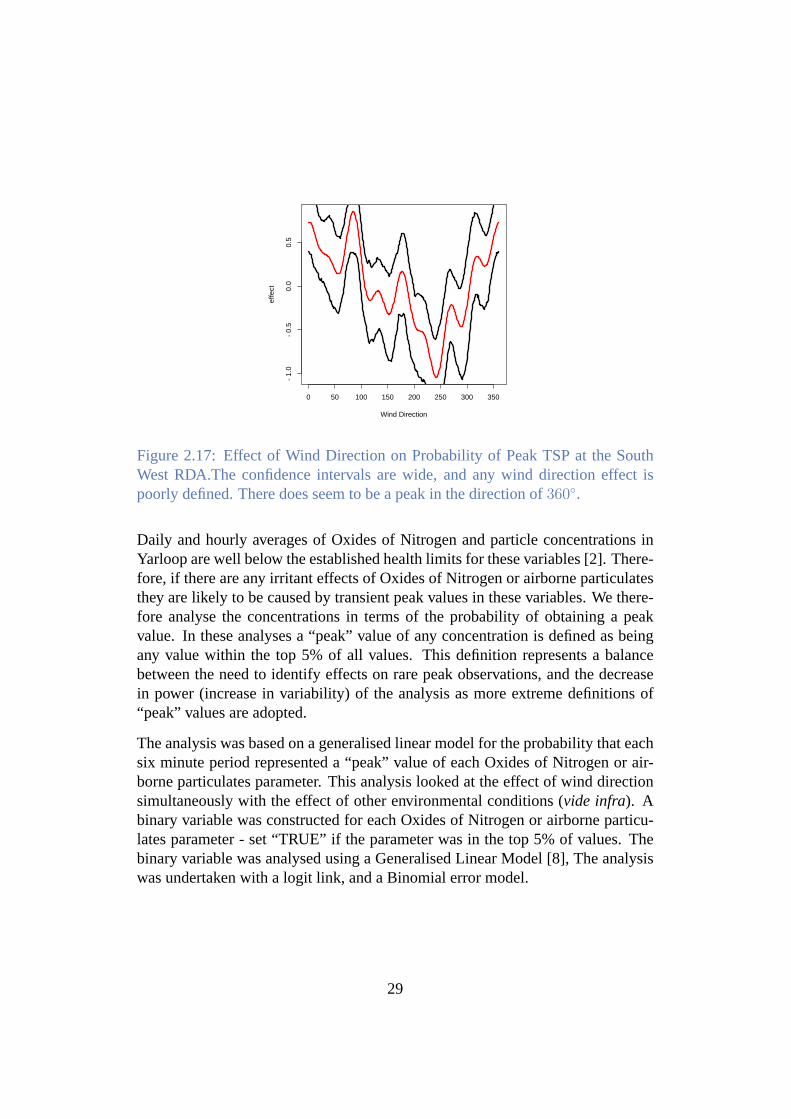
0 50 100 150 200 250 300 350
−1.
0−
0.5
0.0
0.5
Wind Direction
effe
ct
Figure 2.17: Effect of Wind Direction on Probability of Peak TSP at the SouthWest RDA.The confidence intervals are wide, and any wind direction effect ispoorly defined. There does seem to be a peak in the direction of360◦.
Daily and hourly averages of Oxides of Nitrogen and particle concentrations inYarloop are well below the established health limits for these variables [2]. There-fore, if there are any irritant effects of Oxides of Nitrogen or airborne particulatesthey are likely to be caused by transient peak values in these variables. We there-fore analyse the concentrations in terms of the probability of obtaining a peakvalue. In these analyses a “peak” value of any concentration is defined as beingany value within the top 5% of all values. This definition represents a balancebetween the need to identify effects on rare peak observations, and the decreasein power (increase in variability) of the analysis as more extreme definitions of“peak” values are adopted.
The analysis was based on a generalised linear model for the probability that eachsix minute period represented a “peak” value of each Oxides of Nitrogen or air-borne particulates parameter. This analysis looked at the effect of wind directionsimultaneously with the effect of other environmental conditions (vide infra). Abinary variable was constructed for each Oxides of Nitrogen or airborne particu-lates parameter - set “TRUE” if the parameter was in the top 5% of values. Thebinary variable was analysed using a Generalised Linear Model [8], The analysiswas undertaken with a logit link, and a Binomial error model.
29
Wind direction data are circular. A wind direction of 360◦ is very similar to a winddirection of 1◦. The model therefore incorporates wind direction effects using aFourier series model of the form:
W =k∑
i=1
αi sin(2πix
360) + βi cos(
2πix
360)
WhereW is the effect of wind directionx◦, k is the number of Fourier termsin the model, andα1...k andβ1...k are parameters to be estimated from the data.The Fourier model is a periodic function of wind direction, ie, it is constrainedto predict the same wind effect for 360◦ as for 0◦. The number of Fourier termsk was set as 12. A twelfth order series provides a flexible model for the winddirection effect, and is readily estimated given the number of observations. Thevalue was limited to twelve because of the computational cost of the bootstrapanalysis (vide infra).
Other terms in the model for mean pollutant concentration included month of theyear (a factor with 12 levels), hour of the day (a factor with 24 levels), temperatureat 2 metres and at 10 metres, relative humidity, solar radiation, wind velocity,barometric pressure and rainfall.
The coefficientsα1...k andβ1...k of the fitted model were extracted, and used toidentify the contribution of each angle of wind direction to the mean concentrationof the substance concerned.
Given the serial correlation between successive observations, confidence intervalswere calculated using a bootstrap procedure [6]. Serial correlation between ob-servations was accommodated using a blocked bootstrap [5], with blocks set to240 six minute observations (ie one day). Choice of block size is problematic; theanalyses were repeated with varying block sizes, and the results were very similarfor blocksizes of 480. For each analysis, 1,000 bootstrap simulations were per-formed, and used to generate point-wise 95% confidence intervals for the impactof each degree of wind direction on the probability of pollutant levels.
30
Chapter 3
Alkalinity of Airborne Particles
3.1 Background
In a study conducted between26th August and2nd September 2002, Morawskaet al [9] measured the particle concentration at Boundary Rd, when the wind wasblowing from the Northern quadrant (315◦ to 45◦). The accumulatedPM10 par-ticle samples were titrated for alkalinity, and used to estimate an equivalent con-centration of Sodium Hydroxide - which was found to be0.255 ± 0.007µgm−3,for thePM10 fraction. This concentration represents a weekly average - and peakconcentrations could be substantially greater.
3.2 Estimation of Peak Concentrations
During the period concerned, the meanPM10 concentration for wind directionsfrom the Northern Quadrant was11.67µgm−3. If we assume that transient equiv-alent concentrations of NaOH are directly proportional to thePM10 concentrationwhilst the wind is blowing from the Northern quadrant, then we may estimate theNaOH equivalent concentration at any value ofPM10 as follows:
N =NmeanP
Pmean
31
WhereN is the estimated alkalinity (equivalent mols of NaOH),P is the value ofPM10 for which alkalinity is to be estimated,Pmean is the averagePM10 whilstthe wind is from the Northern quadrant during the period26th August 2002, to2nd September 2002 (ie 0.255) andNmean is the average alkalinity during theperiod26th August 2002, to2nd September 2002. This expression, of course, isrelevant only for those values ofPM10 measured whilst the wind is blowing fromthe Northern quadrant.
Using this expression, we may estimate the peak NaOH equivalents each day,from the peak Northern quadrantPM10 values each day. The peak estimate, how-ever, is likely to be too low. This is because:
• The Morawska experiment captured particlate matter when the wind wasfrom the Northern quadrant - but the likely source of alkaline particlesshould be over a angle of less than45◦. This will dilute the alkalinity esti-mate.
• The finest time resolution available is 6 minutes. It is possible that peakvalues within this sampling interval are substantially greater than averagevalues.
If we double the estimated peak values for each of these factors, we have a fourfold increase in estimated NaOH equivalents.
Using this procedure, we calculate the estimated peak NaOH concentration eachday from the peakPM10 when the wind is in the Northern quadrant. The overallmaximum estimated NaOH concentration is93µgm−3. Figure 3.1 shows the dailymaximum estimated NaOH equivalent concentration plotted by month.
3.3 Conclusions
This concentration peak estimated NaOH equivalent concentration of93µgm−3 issubstantially below the Threshold Limit Value (TLV) for NaOH of2000µgm−3
[1]. It is therefore unlikely to produce irritant responses. Furthermore, the dailyestimated peak concentration islowestduring the winter months when there aremost complaints (see below). Daily peak concentrations during the winter monthsare generally below20µgm−3, - around 1% of the TLV.
32
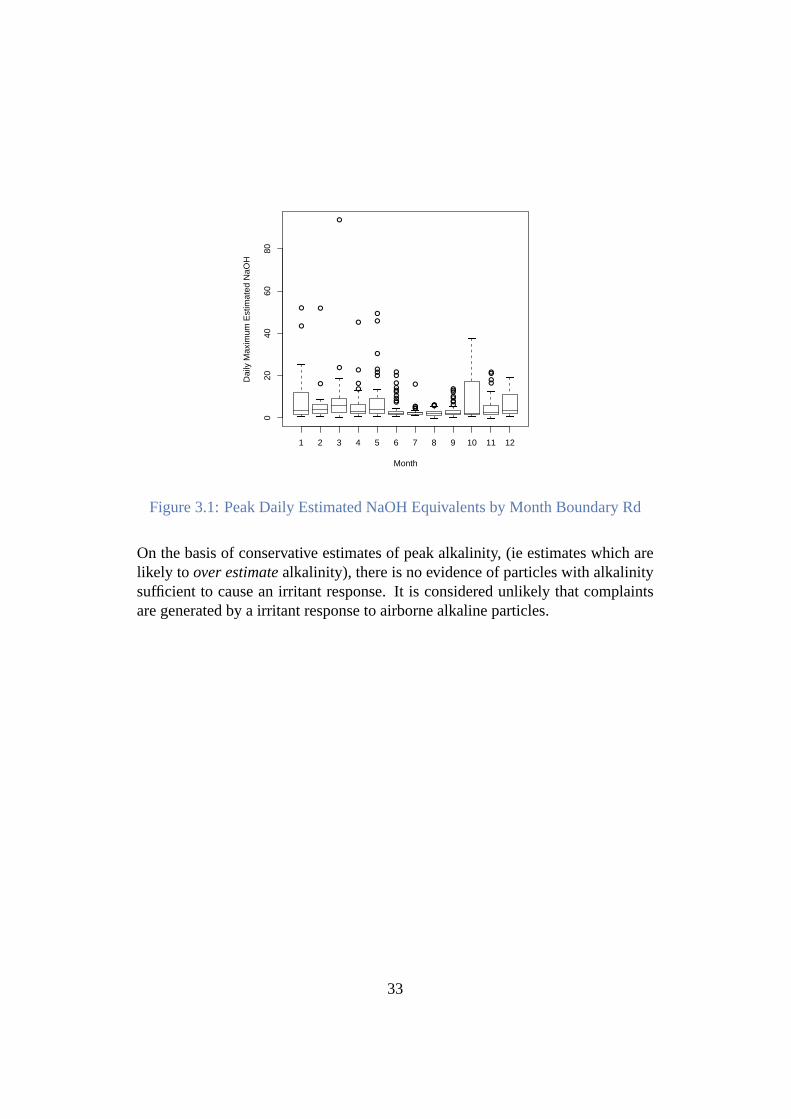
●
●
●
●
●
●
●
●●
●
●
●
●●
●
●●
●
●●
●
●
●
●●●
●●●
●
●●●●
●●
●
●
●●●
●
●
●
●
●
1 2 3 4 5 6 7 8 9 10 11 12
020
4060
80
Month
Dai
ly M
axim
um E
stim
ated
NaO
H
Figure 3.1: Peak Daily Estimated NaOH Equivalents by Month Boundary Rd
On the basis of conservative estimates of peak alkalinity, (ie estimates which arelikely to over estimatealkalinity), there is no evidence of particles with alkalinitysufficient to cause an irritant response. It is considered unlikely that complaintsare generated by a irritant response to airborne alkaline particles.
33
Chapter 4
Environmental Measurementsand Community Complaints
4.1 Objectives and Background
This chapter describes a study undertaken to investigate the relationship betweenmeteorological factors, Oxides of Nitrogen, airborne particulates and the inci-dence of complaints. In particular, the study seeks to establish whether or not thereis any relationship between wind direction, particle concentration, Oxides of Ni-trogen and incidence of complaints. Such a relationship would provide objectiveevidence of an association between refinery outputs and community complaints.The nature of the relationship might also suggest possible mitigation strategies.
Wind direction is of interest because of the observed high frequency of winds fromthe North during the winter months. Winds from this direction cross the refinerybefore reaching the town of Yarloop - and complaints are more frequent in thewinter months (see below).
Particle concentrations are potentially interesting because particles originatingfrom the calciner stacks or the RDAs may be alkaline [9], and particles may makea direct contribution to dust.
Nitrogen Oxide (NOx) concentration is present at concentrations far too low togenerate irritant responses [2]; but it may act as a marker for the refinery plumes.That is, peak measurements ofNOx may indicate that a plume has reached groundlevel near to the measuring station.
34
4.2 Descriptive Statistics for Complaints Data
Complaints records are available from 24th April 2000 to 18th September 2004.Comprehensive Oxides of Nitrogen and airborne particulates data are only avail-able for the period March 2002 to January 2004. Analysis of complaints which donot refer to the relationship with air quality are for the entire period of complaintsdata; but analyses relating complaints to air quality are restricted to the period forwhich Oxides of Nitrogen and airborne particulates data exist.
Complaints are classified by the issue type. Only two issue types are sufficientlycommon to warrant separate analysis: Health issues and Odour issues. Individ-ual complainants have been assigned unique identifiers; this allows an analysisof the distribution of the number of complaints made by each complainant. Noindividual complainants are named in this report.
From the period 24th April 2000 to 18th September 2004 there were 3124 com-plaints, lodged by 250 complainants. The distribution of the number of com-plaints made by each complainant is shown in Figure 4.1. The mean number ofcomplaints per complainer was 12.5, and the variance 895.1. If each complainantwere equally likely to complain, and each complaint was independent, one wouldexpect the distribution of the number of complaints per complainant to follow atruncated Poisson distribution. From elementary probability theory, the varianceto mean ratio for a truncated Poisson distribution is less than 1 for all values ofthe mean. The observed data are therefore strongly inconsistent with a truncatedPoisson distribution. We may conclude that either:
1. All complainants are not equally likely to complain; or
2. Complaints are not independent (ie once a complaint has been made, a com-plainant is more likely to complain again); or
3. both 1. and 2. above.
35
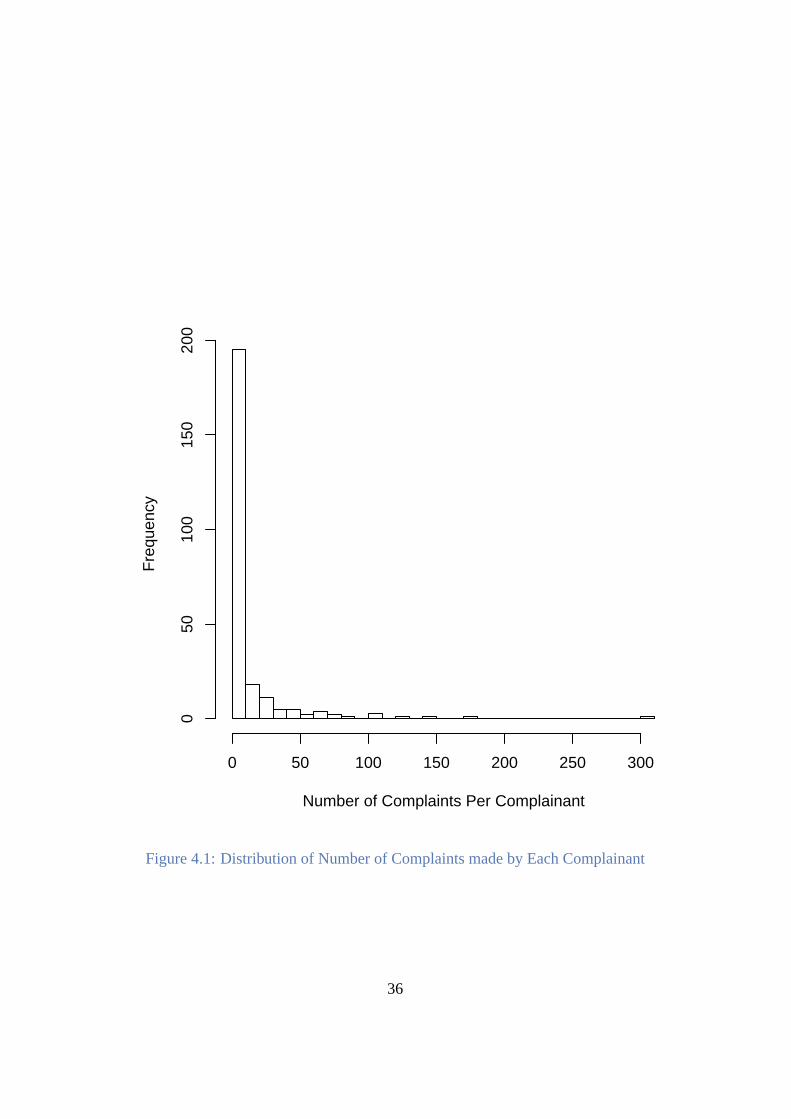
Number of Complaints Per Complainant
Fre
quen
cy
0 50 100 150 200 250 300
050
100
150
200
Figure 4.1: Distribution of Number of Complaints made by Each Complainant
36
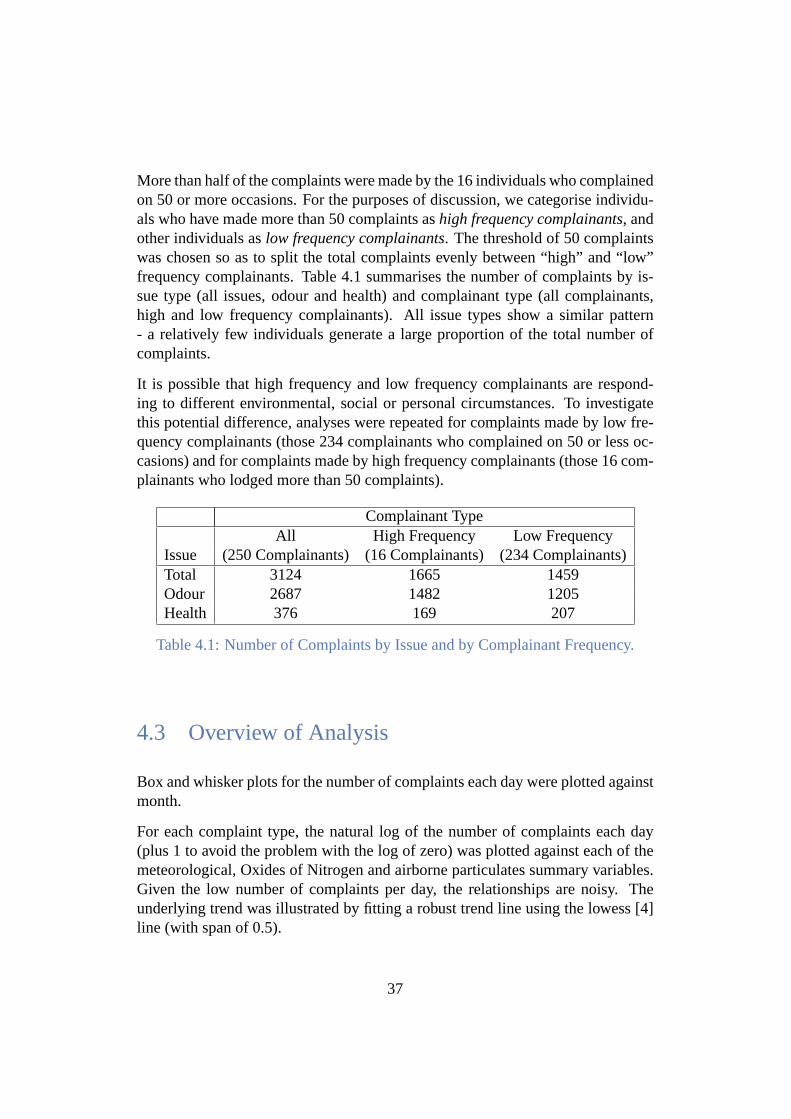
More than half of the complaints were made by the 16 individuals who complainedon 50 or more occasions. For the purposes of discussion, we categorise individu-als who have made more than 50 complaints ashigh frequency complainants, andother individuals aslow frequency complainants. The threshold of 50 complaintswas chosen so as to split the total complaints evenly between “high” and “low”frequency complainants. Table 4.1 summarises the number of complaints by is-sue type (all issues, odour and health) and complainant type (all complainants,high and low frequency complainants). All issue types show a similar pattern- a relatively few individuals generate a large proportion of the total number ofcomplaints.
It is possible that high frequency and low frequency complainants are respond-ing to different environmental, social or personal circumstances. To investigatethis potential difference, analyses were repeated for complaints made by low fre-quency complainants (those 234 complainants who complained on 50 or less oc-casions) and for complaints made by high frequency complainants (those 16 com-plainants who lodged more than 50 complaints).
Complainant TypeAll High Frequency Low Frequency
Issue (250 Complainants) (16 Complainants) (234 Complainants)Total 3124 1665 1459Odour 2687 1482 1205Health 376 169 207
Table 4.1: Number of Complaints by Issue and by Complainant Frequency.
4.3 Overview of Analysis
Box and whisker plots for the number of complaints each day were plotted againstmonth.
For each complaint type, the natural log of the number of complaints each day(plus 1 to avoid the problem with the log of zero) was plotted against each of themeteorological, Oxides of Nitrogen and airborne particulates summary variables.Given the low number of complaints per day, the relationships are noisy. Theunderlying trend was illustrated by fitting a robust trend line using the lowess [4]line (with span of 0.5).
37
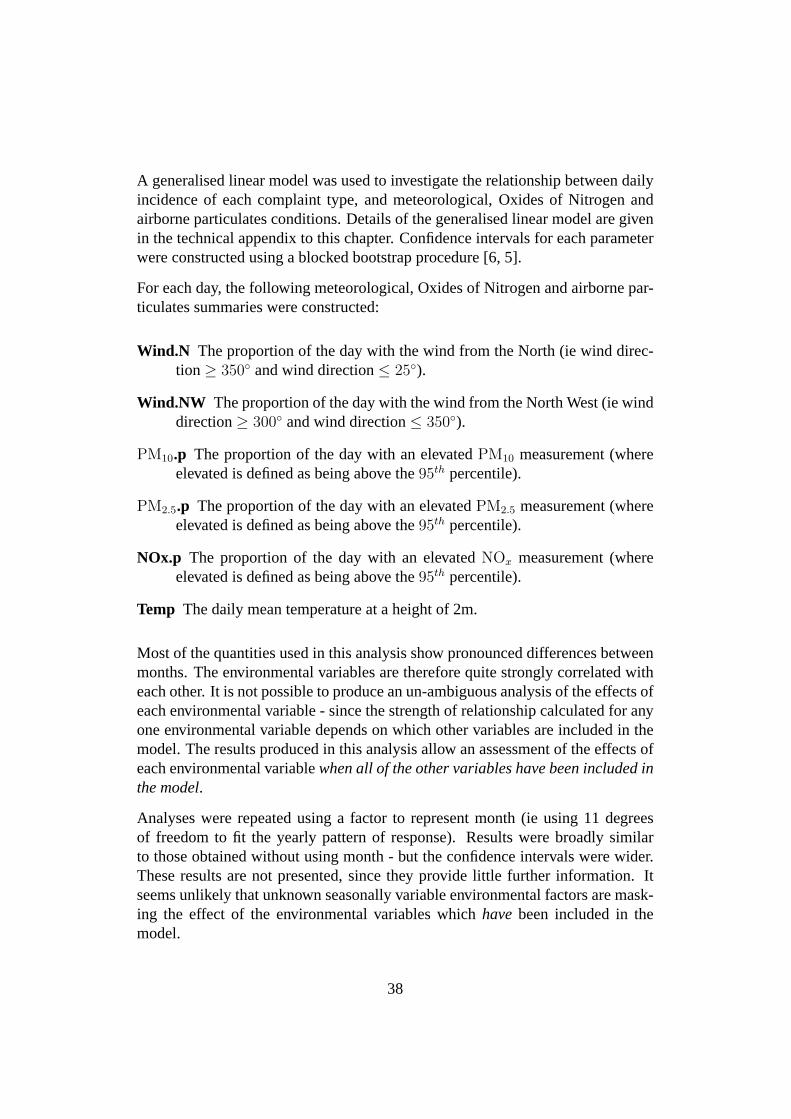
A generalised linear model was used to investigate the relationship between dailyincidence of each complaint type, and meteorological, Oxides of Nitrogen andairborne particulates conditions. Details of the generalised linear model are givenin the technical appendix to this chapter. Confidence intervals for each parameterwere constructed using a blocked bootstrap procedure [6, 5].
For each day, the following meteorological, Oxides of Nitrogen and airborne par-ticulates summaries were constructed:
Wind.N The proportion of the day with the wind from the North (ie wind direc-tion≥ 350◦ and wind direction≤ 25◦).
Wind.NW The proportion of the day with the wind from the North West (ie winddirection≥ 300◦ and wind direction≤ 350◦).
PM10.p The proportion of the day with an elevatedPM10 measurement (whereelevated is defined as being above the95th percentile).
PM2.5.p The proportion of the day with an elevatedPM2.5 measurement (whereelevated is defined as being above the95th percentile).
NOx.p The proportion of the day with an elevatedNOx measurement (whereelevated is defined as being above the95th percentile).
Temp The daily mean temperature at a height of 2m.
Most of the quantities used in this analysis show pronounced differences betweenmonths. The environmental variables are therefore quite strongly correlated witheach other. It is not possible to produce an un-ambiguous analysis of the effects ofeach environmental variable - since the strength of relationship calculated for anyone environmental variable depends on which other variables are included in themodel. The results produced in this analysis allow an assessment of the effects ofeach environmental variablewhen all of the other variables have been included inthe model.
Analyses were repeated using a factor to represent month (ie using 11 degreesof freedom to fit the yearly pattern of response). Results were broadly similarto those obtained without using month - but the confidence intervals were wider.These results are not presented, since they provide little further information. Itseems unlikely that unknown seasonally variable environmental factors are mask-ing the effect of the environmental variables whichhavebeen included in themodel.
38
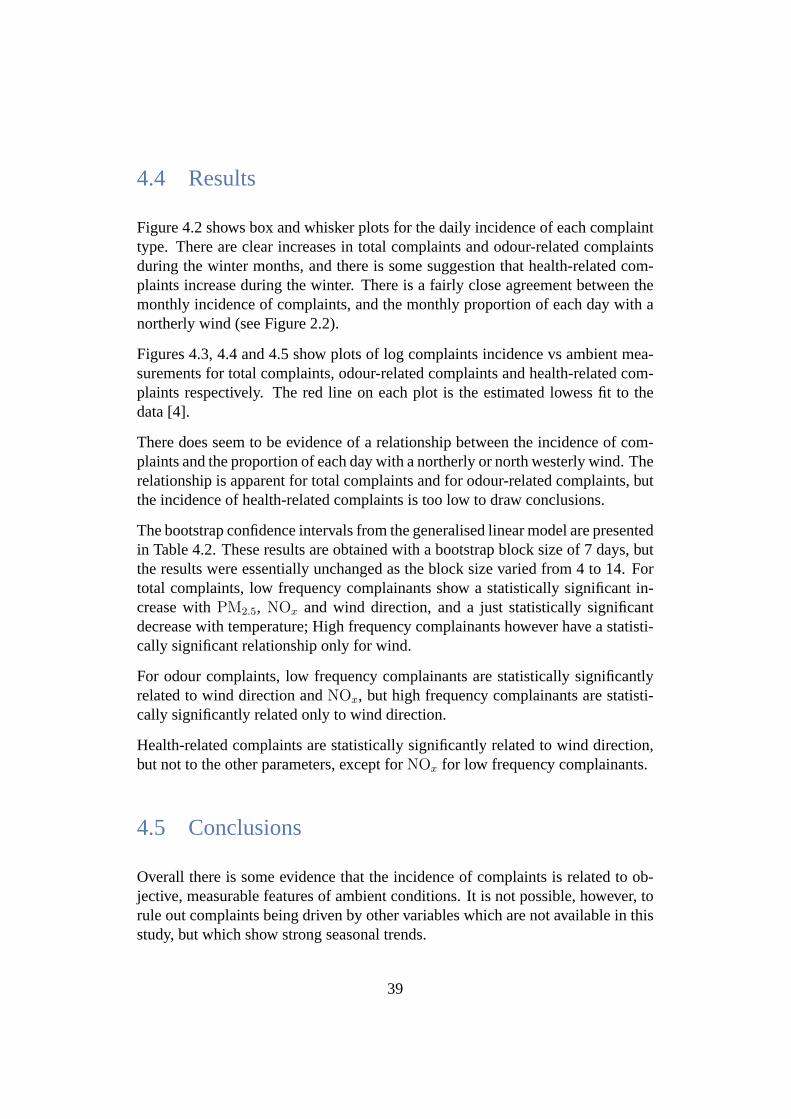
4.4 Results
Figure 4.2 shows box and whisker plots for the daily incidence of each complainttype. There are clear increases in total complaints and odour-related complaintsduring the winter months, and there is some suggestion that health-related com-plaints increase during the winter. There is a fairly close agreement between themonthly incidence of complaints, and the monthly proportion of each day with anortherly wind (see Figure 2.2).
Figures 4.3, 4.4 and 4.5 show plots of log complaints incidence vs ambient mea-surements for total complaints, odour-related complaints and health-related com-plaints respectively. The red line on each plot is the estimated lowess fit to thedata [4].
There does seem to be evidence of a relationship between the incidence of com-plaints and the proportion of each day with a northerly or north westerly wind. Therelationship is apparent for total complaints and for odour-related complaints, butthe incidence of health-related complaints is too low to draw conclusions.
The bootstrap confidence intervals from the generalised linear model are presentedin Table 4.2. These results are obtained with a bootstrap block size of 7 days, butthe results were essentially unchanged as the block size varied from 4 to 14. Fortotal complaints, low frequency complainants show a statistically significant in-crease withPM2.5, NOx and wind direction, and a just statistically significantdecrease with temperature; High frequency complainants however have a statisti-cally significant relationship only for wind.
For odour complaints, low frequency complainants are statistically significantlyrelated to wind direction andNOx, but high frequency complainants are statisti-cally significantly related only to wind direction.
Health-related complaints are statistically significantly related to wind direction,but not to the other parameters, except forNOx for low frequency complainants.
4.5 Conclusions
Overall there is some evidence that the incidence of complaints is related to ob-jective, measurable features of ambient conditions. It is not possible, however, torule out complaints being driven by other variables which are not available in thisstudy, but which show strong seasonal trends.
39
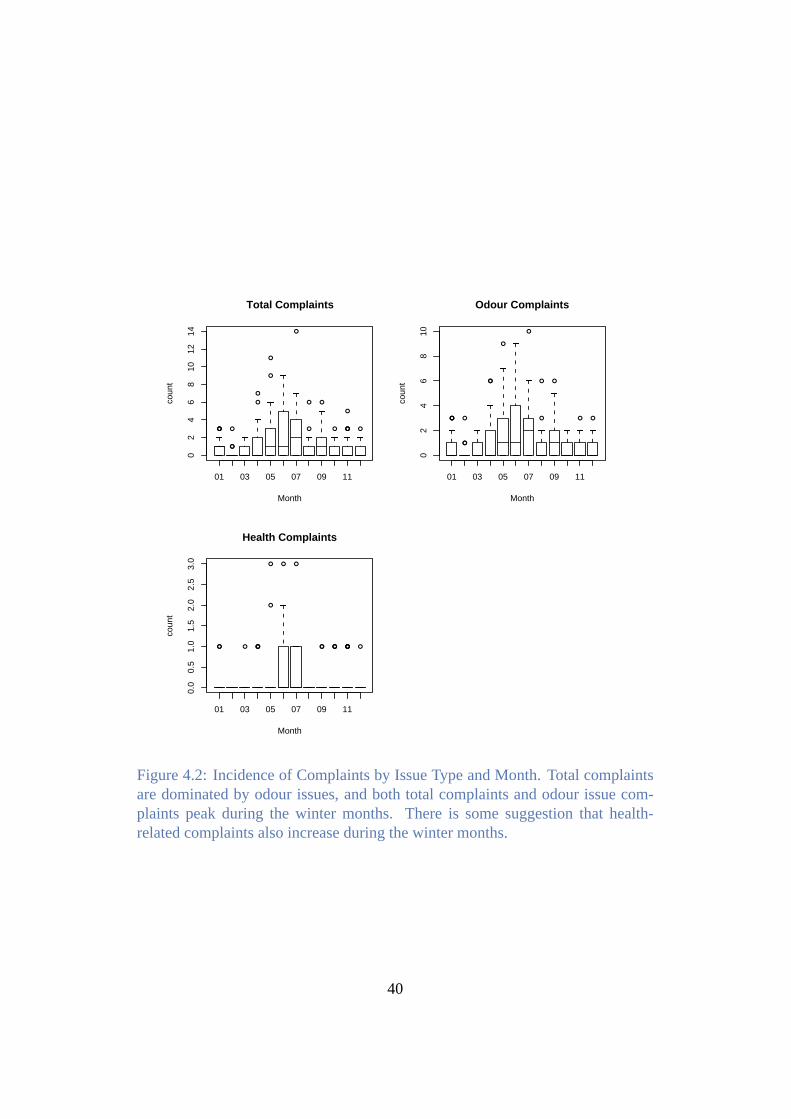
●●●
●●
●
●
●
●
●
●
●
● ●
● ●
●
●● ●
01 03 05 07 09 11
02
46
810
1214
Total Complaints
Month
coun
t
●●●
●●
●
●●
●
●
●
● ●
● ●
01 03 05 07 09 11
02
46
810
Odour Complaints
Month
coun
t
●● ● ●●●
●
● ● ●
●● ●●● ●●●● ●
01 03 05 07 09 11
0.0
0.5
1.0
1.5
2.0
2.5
3.0
Health Complaints
Month
coun
t
Figure 4.2: Incidence of Complaints by Issue Type and Month. Total complaintsare dominated by odour issues, and both total complaints and odour issue com-plaints peak during the winter months. There is some suggestion that health-related complaints also increase during the winter months.
40
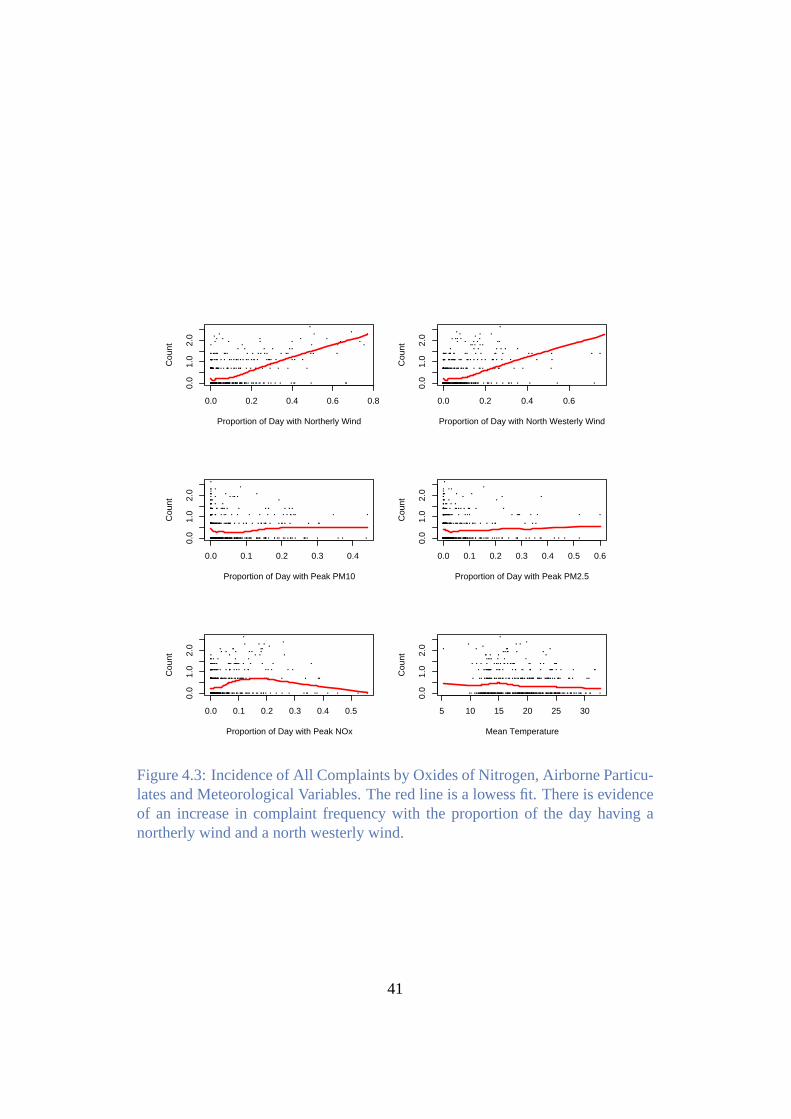
0.0 0.2 0.4 0.6 0.8
0.0
1.0
2.0
Proportion of Day with Northerly Wind
Cou
nt
0.0 0.2 0.4 0.6
0.0
1.0
2.0
Proportion of Day with North Westerly Wind
Cou
nt
0.0 0.1 0.2 0.3 0.4
0.0
1.0
2.0
Proportion of Day with Peak PM10
Cou
nt
0.0 0.1 0.2 0.3 0.4 0.5 0.6
0.0
1.0
2.0
Proportion of Day with Peak PM2.5
Cou
nt
0.0 0.1 0.2 0.3 0.4 0.5
0.0
1.0
2.0
Proportion of Day with Peak NOx
Cou
nt
5 10 15 20 25 30
0.0
1.0
2.0
Mean Temperature
Cou
nt
Figure 4.3: Incidence of All Complaints by Oxides of Nitrogen, Airborne Particu-lates and Meteorological Variables. The red line is a lowess fit. There is evidenceof an increase in complaint frequency with the proportion of the day having anortherly wind and a north westerly wind.
41
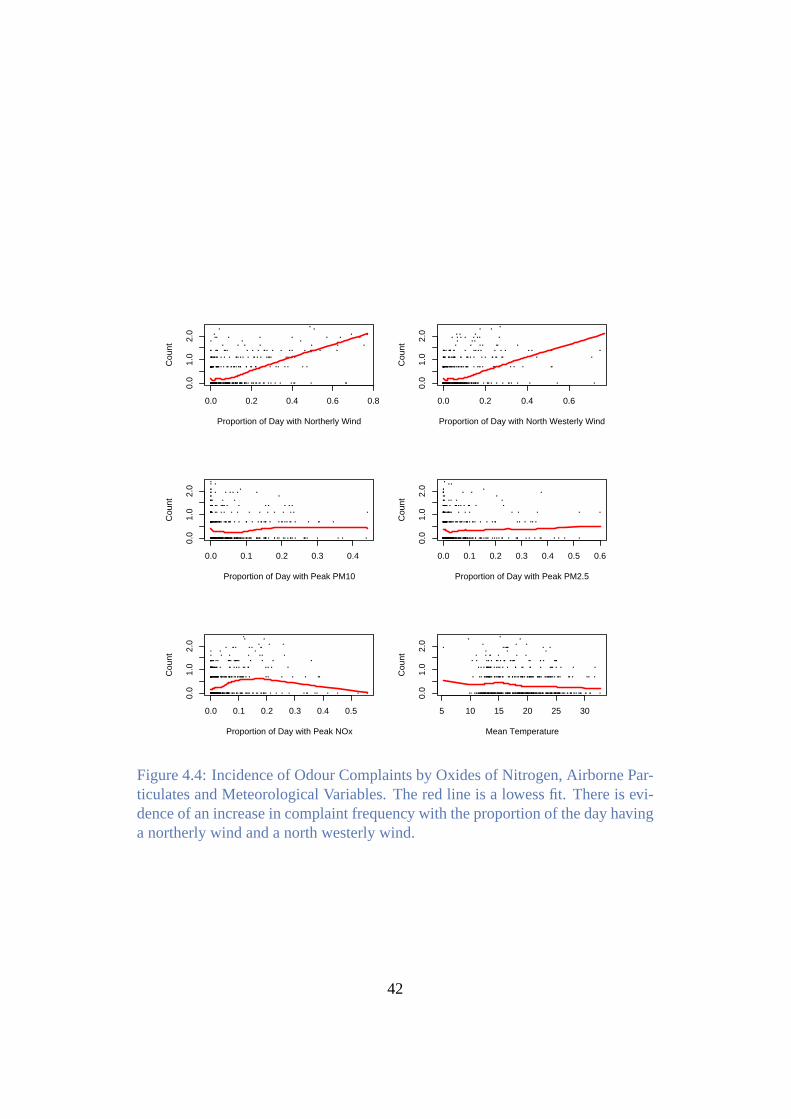
0.0 0.2 0.4 0.6 0.8
0.0
1.0
2.0
Proportion of Day with Northerly Wind
Cou
nt
0.0 0.2 0.4 0.6
0.0
1.0
2.0
Proportion of Day with North Westerly Wind
Cou
nt
0.0 0.1 0.2 0.3 0.4
0.0
1.0
2.0
Proportion of Day with Peak PM10
Cou
nt
0.0 0.1 0.2 0.3 0.4 0.5 0.6
0.0
1.0
2.0
Proportion of Day with Peak PM2.5
Cou
nt
0.0 0.1 0.2 0.3 0.4 0.5
0.0
1.0
2.0
Proportion of Day with Peak NOx
Cou
nt
5 10 15 20 25 30
0.0
1.0
2.0
Mean Temperature
Cou
nt
Figure 4.4: Incidence of Odour Complaints by Oxides of Nitrogen, Airborne Par-ticulates and Meteorological Variables. The red line is a lowess fit. There is evi-dence of an increase in complaint frequency with the proportion of the day havinga northerly wind and a north westerly wind.
42
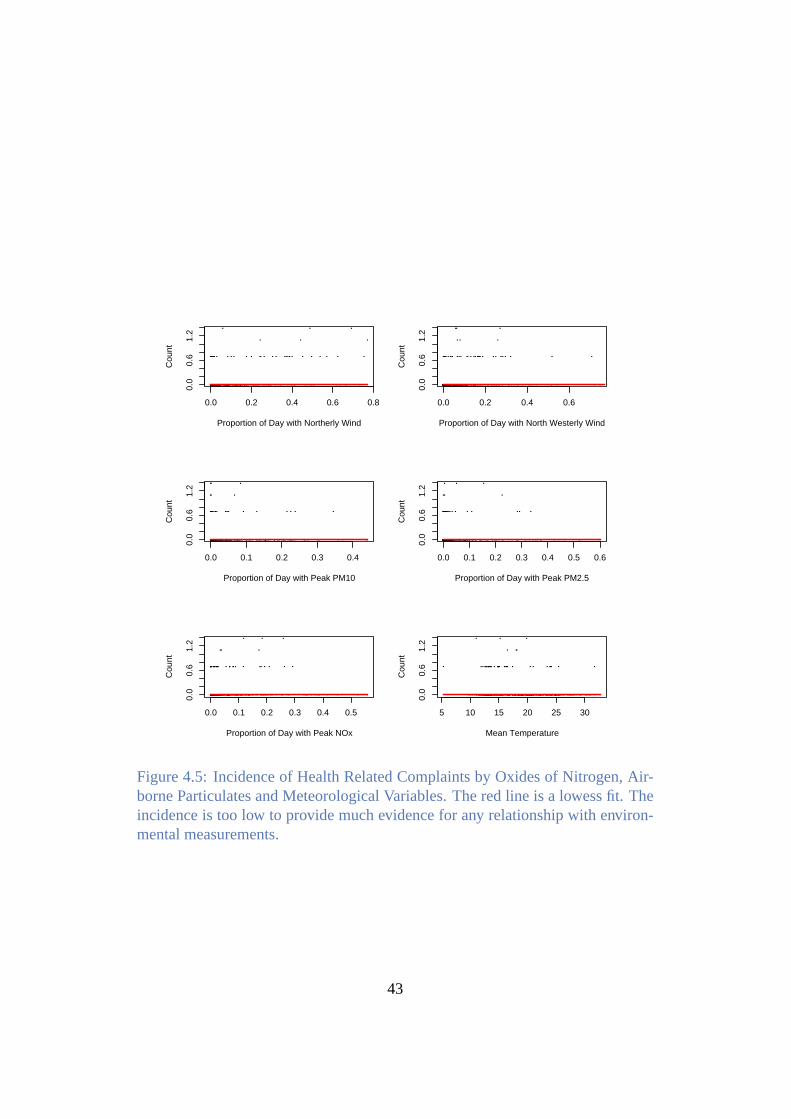
0.0 0.2 0.4 0.6 0.8
0.0
0.6
1.2
Proportion of Day with Northerly Wind
Cou
nt
0.0 0.2 0.4 0.6
0.0
0.6
1.2
Proportion of Day with North Westerly Wind
Cou
nt
0.0 0.1 0.2 0.3 0.4
0.0
0.6
1.2
Proportion of Day with Peak PM10
Cou
nt
0.0 0.1 0.2 0.3 0.4 0.5 0.6
0.0
0.6
1.2
Proportion of Day with Peak PM2.5
Cou
nt
0.0 0.1 0.2 0.3 0.4 0.5
0.0
0.6
1.2
Proportion of Day with Peak NOx
Cou
nt
5 10 15 20 25 30
0.0
0.6
1.2
Mean Temperature
Cou
nt
Figure 4.5: Incidence of Health Related Complaints by Oxides of Nitrogen, Air-borne Particulates and Meteorological Variables. The red line is a lowess fit. Theincidence is too low to provide much evidence for any relationship with environ-mental measurements.
43
Total complaints and odour-related complaints show a near identical pattern ofresponse - since odour complaints make up the majority of complaints. Thereis evidence that complaints are increased when the wind is often from the direc-tion of the refinery (the North and North West). There is also evidence that thecomplaints are increased when much of the day shows elevatedNOx measure-ments and elevatedPM2.5 measurements.NOx is unlikely to be the causativeagent for odour-related complaints; but periods with increased incidence of ele-vatedNOx concentrations are likely to be periods with increased impact from thestack plumes. PeakPM2.5 levels may be associated with airborne material fromthe stacks, from the RDA and possibly from Yarloop.
These results are not definitive, but provide some support for the hypothesis thatfor low frequency complainants, odour-related complaints (and therefore the totalnumber of complaints) are influenced by airborne material from the refinery com-plex – either from the stacks or from the RDAs. For high frequency complainants,the lack of a statistically significant relationship with complaint incidence andOxides of Nitrogen and airborne particulates may suggest that other factors areinvolved.
4.6 Technical Appendix
The incidence of each complaint type was analysed using a generalised linearmodel [7] with a Poisson error distribution and a logistic link. The model in-cluded all the environmental variables described above. Maximum likelihood es-timates of all the linear model coefficients were obtained. There is one importantcaveat with this analysis. The generalised linear model statistics are based on theassumption that counts on successive days are independent - conditional on thevalues of the predictor (meteorological and ambient) variables. This assumptionmay be incorrect for two reasons:-
• The complaints data follow a contagious distribution - once a complaint hasbeen made, there is a transitory lower threshold for further complaints. Inthis way, a single event may trigger not one, but a series of complaints overseveral days.
• There are underlying environmental or social processes not included in theanalysis, but which show strong autocorrelation over time.
44
For this reason, standard errors for linear model parameters were obtained usinga blocked bootstrap procedure [5], to ameliorate the effects of serial correlation.The analysis was repeated with the block size varying from 4 to 14 days. Resultswere stable across the range of block sizes, and results for a block size of 7 arepresented.
Interpretation is complicated by the strong correlations between the various sea-sonally variable quantities. The approach used provides a test of the hypothesisthat each variable has no relationship with complaint incidenceafter having al-lowed for the effect of all other variables.
45
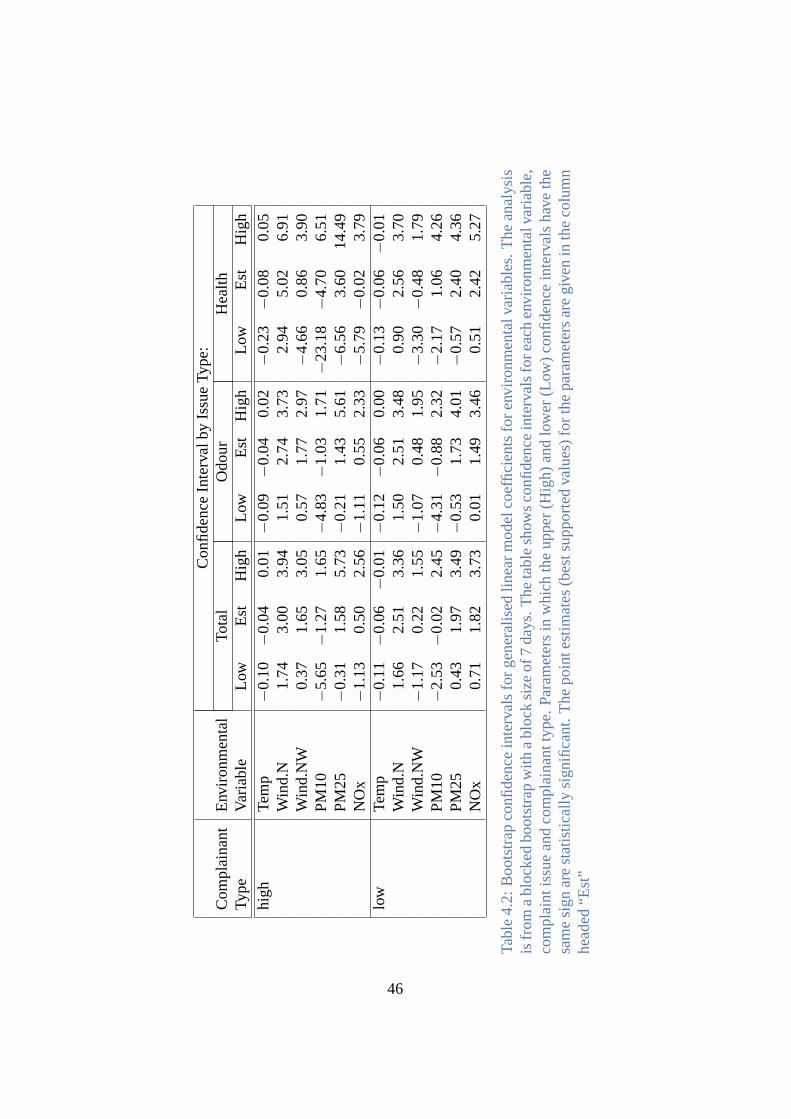
Con
fiden
ceIn
terv
alby
Issu
eTy
pe:
Com
plai
nant
Env
ironm
enta
lTo
tal
Odo
urH
ealth
Type
Varia
ble
Low
Est
Hig
hLo
wE
stH
igh
Low
Est
Hig
h
high
Tem
p−
0.10
−0.
040.
01−
0.09
−0.
040.
02−
0.23
−0.
080.
05W
ind.
N1.
743.
003.
941.
512.
743.
732.
945.
026.
91W
ind.
NW
0.37
1.65
3.05
0.57
1.77
2.97
−4.
660.
863.
90P
M10
−5.
65−
1.27
1.65
−4.
83−
1.03
1.71
−23
.18−
4.70
6.51
PM
25−
0.31
1.58
5.73−
0.21
1.43
5.61
−6.
563.
6014
.49
NO
x−
1.13
0.50
2.56−
1.11
0.55
2.33
−5.
79−
0.02
3.79
low
Tem
p−
0.11
−0.
06−
0.01
−0.
12−
0.06
0.00
−0.
13−
0.06
−0.
01W
ind.
N1.
662.
513.
361.
502.
513.
480.
902.
563.
70W
ind.
NW
−1.
170.
221.
55−
1.07
0.48
1.95
−3.
30−
0.48
1.79
PM
10−
2.53
−0.
022.
45−
4.31
−0.
882.
32−
2.17
1.06
4.26
PM
250.
431.
973.
49−
0.53
1.73
4.01
−0.
572.
404.
36N
Ox
0.71
1.82
3.73
0.01
1.49
3.46
0.51
2.42
5.27
Tabl
e4.
2:B
oots
trap
confi
denc
ein
terv
als
for
gene
ralis
edlin
ear
mod
elco
effic
ient
sfo
ren
viro
nmen
talv
aria
bles
.T
hean
alys
isis
from
abl
ocke
dbo
otst
rap
with
abl
ock
size
of7
days
.T
heta
ble
show
sco
nfide
nce
inte
rval
sfo
reac
hen
viro
nmen
talv
aria
ble,
com
plai
ntis
sue
and
com
plai
nant
type
.P
aram
eter
sin
whi
chth
eup
per
(Hig
h)an
dlo
wer
(Low
)co
nfide
nce
inte
rval
sha
veth
esa
me
sign
are
stat
istic
ally
sign
ifica
nt.
The
poin
test
imat
es(b
ests
uppo
rted
valu
es)
for
the
para
met
ers
are
give
nin
the
colu
mn
head
ed“E
st”
46
Chapter 5
Conclusions
It is clear that ambient Oxides of Nitrogen and airborne particulates parameters arestrongly influenced by wind direction, and that a wind direction from the refineryincreases both particulate and Oxides of Nitrogen concentrations at Boundary RdYarloop. Although this is an observational study, not a designed experiment, itdoes provide some support for the hypothesis that refinery operations generateelevations in oxides of nitrogen and particulate matter. That conclusion cannot bedefinitive without further experimental work.
Any elevations in concentrations of Oxides of Nitrogen seem to be of little healthor amenity significance. The main interest in these data is that they support theapproach used to localise (approximately) the source of emissions. Peak Oxidesof Nitrogen concentration are well below the levels associated with irritant effects[2].
The particulate concentrations might be of greater potential significance. We haveestablished that wind directions from the refinery are associated with higher par-ticulate concentrations (allowing for other variables such as temperature). Thislends some support to the hypothesis that the refinery contributes to ambient par-ticulate matter at Boundary Rd. Furthermore, these wind directions occur muchmore frequently during the winter months, when complaints are more frequent.
When thePM10 data and wind direction are used to estimate likely NaOH concen-trations, however, we see no overall increase in likely NaOH concentrations dur-ing the winter months. Furthermore, even using pessimistic assumptions aboutpeak NaOH equivalent concentrations, particle alkalinity is unlikely to be suffi-cient to cause an irritant response.
47
In summary, it is possible that complaints are increased by airborne material fromthe refinery. The source within the refinery cannot be localised. There is noevidence that complaints are due to an irritant response to alkaline particles.
The analyses do not establish the relative importance of the RDAs or the stacks(liquor burning, calciner and powerhouse) as sources of particulate material.
Complaints do seem to be more common when the wind is blowing from theNorth, and they may be increased when there are elevated Oxides of Nitrogen con-centrations. These elevated Oxides of Nitrogen concentrations are far too smallto be of physiological significance, but they may serve as a marker for the stackplumes. In other words, days experiencing a higher proportion of time with peakNOx levels are likely to be days in which the stack plumes ground in Yarloop.Plume odour is the most probable cause of complaints (and indeed odour is themost common issue for complaints).
48
Bibliography
[1] Documentation of the Threshold Limit Values (TLVs) for Sodium Hydroxide.,Tech. report, American Conference of Governmental Hygienists, 2002.
[2] The National Environmental Protection (Ambient Air Quality) Variation Mea-sure, GazetteS190(2003).
[3] Alcoa Wagerup Environmental Department,Wagerup Ambient Air QualityMonitoring Report, Tech. report, Alcoa Australia, December 2003.
[4] W. S. Cleveland,Robust locally weighted regression and smoothing scatter-plots, J. Amer. Statist. Assoc (1979).
[5] A.C. Davison and D.V. Hinkley,Bootstrap methods and their application,Wiley Series in Probability and Statistics, Cambridge University Press, 1997.
[6] B. Efron,The jackknife, the bootstrap and other resampling plans, Society forIndustrial and Applied Mathematics, 1982.
[7] P. McCullagh and J.A. Nelder,Generalised linear models, Chapman and Hall,London, 1989.
[8] Charles E McCulloch and Shayle R Searle,Generalised, linear, and mixedmodels, Wiley Series in Probability and Statistics, Wiley, 2000.
[9] Morawska,Alkalinity of airborne particulate matter, Tech. report, Queens-land University of Technology, 2002.
49