Embed Size (px)
Citation preview
ww.sciencedirect.com
wat e r r e s e a r c h 4 7 ( 2 0 1 3 ) 2 9 8 3e2 9 9 4
Available online at w
journal homepage: www.elsevier .com/locate/watres
Oxidation ofMicrocystis aeruginosa and Anabaena flos-aquae byozone: Impacts on cell integrity and chlorination by-productformation
Lucila A. Coral a,*, Arash Zamyadi a, Benoit Barbeau a,**, Fatima J. Bassetti c,Flavio R. Lapolli b, Michele Prevost a,***a Ecole Polytechnique de Montreal, Civil, Mineral and Mining Engineering Department, P.O. Box 6079, Station Centre-ville, Montreal,
Quebec, Canada H3C 3A7bUniversidade Federal de Santa Catarina, Sanitary and Environmental Engineering Department, Water Reuse Laboratory,
P.O. Box 476, Florianopolis, Santa Catarina 88040-970, BrazilcChemistry and Biology Department, Universidade Tecnologica Federal do Parana, Sete de Setembro Avenue 3165, Curitiba,
Parana 80230-901, Brazil
a r t i c l e i n f o
Article history:
Received 29 October 2012
Received in revised form
4 March 2013
Accepted 7 March 2013
Available online 18 March 2013
Keywords:
Cyanobacteria
Ozonation
Cell integrity
Dissolved organic carbon
Chlorination by-products
* Corresponding author. Universidade FederLaboratory, P.O. Box 476, Florianopolis, Sant** Corresponding author.*** Corresponding author.
E-mail addresses: [email protected]), [email protected] (F.J. Bassetti0043-1354/$ e see front matter ª 2013 Elsevhttp://dx.doi.org/10.1016/j.watres.2013.03.012
a b s t r a c t
Pre-ozonation of cyanobacterial (CB) cells in raw water and inter-ozonation of settled water
can cause CB cell damage. However, there is limited information about the level of lysis or
changes in cell properties after ozonation, release of intracellular compounds and their
contribution to the formation of disinfection by-products (DBPs). This study aims to: (1)
assess the extent of the pre-ozonation effects on CB cell properties; (2) determine the CT
(ozone concentration � detention time) values required for complete loss of cell viability;
and (3) study the DBPs formation associated with the pre-ozonation of cyanobacterial cells
in laboratorial suspensions. To these ends, both Microcystis aeruginosa and Anabaena flos-
aquae suspensions were prepared at concentrations of 250,000 cells mL�1 and
1,500,000 cells mL�1 and were subjected to ozone dosages of 0.5, 2.0 and 4.0 mg L�1 at pH 6
and pH 8. A quick and complete loss of viability was achieved for both CB species after
exposure (CT) to ozone of <0.2 mg min L�1, although no significant decrease in total cell
numbers was observed. Maximum dissolved organic carbon (DOC) releases of 0.96 mg L�1
and 1.63 mg L�1 were measured after ozonation of 250,000 cells mL�1 of M. aeruginosa and
A. flos-aquae, respectively. DOC release was found to be pH and ozone dose dependent.
Ozonation of CB cells increased formation of trihalomethanes (THM) and haloacetic acids
(HAA), mainly for suspensions of A. flos-aquae at pH 8 (by 174% and 65% for THM and HAA
respectively). Utilities considering using ozone for oxidising CB cells should weigh out the
benefit of CB control with the potential increased formation of chlorinated DBPs.
ª 2013 Elsevier Ltd. All rights reserved.
al de Santa Catarina, Sanitary and Environmental Engineering Department, Water Reusea Catarina 88040-970, Brazil. Tel.: þ55 48 3721 7750.
m.br (L.A. Coral), [email protected] (A. Zamyadi), [email protected] (B.), [email protected] (F.R. Lapolli), [email protected] (M. Prevost).ier Ltd. All rights reserved.
wat e r r e s e a r c h 4 7 ( 2 0 1 3 ) 2 9 8 3e2 9 9 42984
1. Introduction 2012b). Recent studies in the literature demonstrate the
The presence of cyanobacteria is ubiquitous in the environ-
ment. Cyanobacteria has been reported inwater sources, such
as lakes and reservoirs (Oberholster et al., 2006; Carvalho
et al., 2008; Somek et al., 2008; Graham et al., 2010), where
they may cause drastic changes in turbidity, pH, dissolved
oxygen and taste and odour. These variations in water quality
can negatively impact treatment processes used for drinking
water supply. Consequently, cyanobacterial blooms pose a
great challenge for drinking water production (Merel et al.,
2010; Zamyadi et al., 2012a).
Increases in cell concentrations and metabolic substances
produced by cyanobacteria, referred to as algogenic organic
matter (AOM), are responsible for a series of disturbances in
water treatment processes (Henderson et al., 2008b). AOM
includes extracellular organic matter (EOM) and intracellular
organic matter (IOM). EOM results from the metabolic activity
of cells during exponential and stationary growth phases
whereas IOM can be release in the aquatic environment
following cell lysis. The latter can be induced by aging of the
algae population (Pivokonsky et al., 2006; Henderson et al.,
2008a) and by water treatment processes such as oxidation
(Plummer and Edzwald, 2002; Huang et al., 2009).
Although conventional treatment processes (coagulation/
flocculation, sedimentation/flotation and sand filtration) are
effective in removing intact cyanobacteria cells (Chow et al.,
1999; Teixeira and Rosa, 2006), the massive presence of algae
and cyanobacteria may reduce cell-removal efficiency
(Zamyadi et al., 2012b). Pre-oxidation, especially with chlorine,
ozone or potassium permanganate, has often been used as a
pre-treatment ahead of the conventional process. These stra-
tegies may increase the overall removal of cyanobacteria cells
by conventional treatment (Widrig et al., 1996; Plummer and
Edzwald, 2002; Chen et al., 2009; Ma et al., 2012a). However,
the use of oxidants can also cause damage to cyanobacteria
cells and promote the release of IOM, including intracellular
metabolites such as MIB (2-methyl isoborneol), geosmin or
cyanotoxins (Daly et al., 2007; Lin et al., 2009; Miao and Tao,
2009; Zamyadi et al., 2010, 2012a; Ma et al., 2012b). The release
of IOM increases dissolved organic carbon (DOC) which may
negatively impact the coagulationprocess (Maet al., 2012b) and
contribute to DBPs formation (Plummer and Edzwald, 2001;
Nguyen et al., 2005; Hong et al., 2008; Huang et al., 2009; Fang
et al., 2010a,b; Li et al., 2012; Zamyadi et al., 2012a).
Previous studies have shown that pre-ozonation, similarly
to other oxidants, may cause changes in cell surface charac-
teristics, increases in DOC concentrations and the release of
other intracellular metabolites (Plummer and Edzwald, 2001,
2002;Hoegeret al., 2002;Huanget al., 2008;MiaoandTao, 2009).
However, information about the extent of ozone damage to
various cyanobacterial cells under variable oxidation condi-
tions (i.e., contact time, ozone exposure (CT), and pH) remains
limited. Such information is necessary to evaluate whether
pre-ozonation is a viable option for controlling cyanobacterial
blooms. This is especially important given recent evidence
showing that CBs cells can accumulate in various processes
within treatment plants (especially clarifiers) and that CB
species influence the efficacy of coagulation (Zamyadi et al.,
effectiveness of ozone in different applications aiming at the
removal of algae and cyanobacteria (Cheng et al., 2010; Li et al.,
2011; Wu et al., 2012). For this reason, it is interesting to eval-
uate the ozone damages in cellular structure of these micro-
organisms and the cell response to the oxidant application.
The overall objective of this study is to assess the oxidation
kinetics of cyanobacterial cells by ozone and the contribution
of algal organicmatter to DBPs formation under various ozone
operational conditions. More specifically, this research (1) de-
velops a kinetic model to describe the reactivity of Microcystis
aeruginosa andAnabaena flos-aquaewith ozone, (2) assesses the
impact of ozonation on cell characteristics (morphology and
membrane integrity) and the release of IOM for increasing
ozone exposures (CT), and (3) evaluates the release of THMand
HAA precursors after pre-ozonation of cyanobacterial cells.
2. Experimental procedures
2.1. Cell culture and harvesting
A toxic strain ofM. aeruginosa (CPCC 299) and a nontoxic strain
of A. flos-aquae (CPCC 64), which were obtained from the Ca-
nadian Phycological Culture Centre, were cultured in ASM-1
(Gorham et al., 1964) and BG-11 (Rippka et al., 1979) inorganic
growth media, respectively. The cultures were incubated at
26� 1 �Cwith sufficient aerationunder 12h of light-dark cycles
at a light intensity of 70 mmol s�1 m�2. Algae cells in the sta-
tionary phase were separated by filtration (1.2 mm and 10 mm),
re-suspended in borate buffer at pH 7 and enumerated by 400�microscopy, using a Sedgewick-Rafter counting chamber.
2.2. Cell characteristics: lysis, integrity and morphology
To determine cell lysis, cell integrity and cell wall morphology,
three types of microscope techniques were used: (1) cell lysis
wasassessedbyevaluating thedecline in total cell countsusing
optical microscopy in a Sedgewick-Rafter counting chamber
after preservation in a lugol solution (duplicate enumeration/
sample), (2) cell integrity was determined using the BacLight�test (Boulos et al., 1999; Stocks, 2004; Berney et al., 2007), and (3)
cell wall morphology was qualitatively evaluated using a
scanning electronmicroscope (SEM, JSM-7600TFE, JEOL, Japan).
The cell volume for each cyanobacteria was estimated
from cell measures by optical microscopy considering diam-
eter of M. aeruginosa or the width and length of A. flos-aquae.
Measurements revealed an average diameter of 4.5 mm for M.
aeruginosa (approximately 48 mm3 of cell volume) and an
average width and length of 4 and 6.5 mm for A. flos-aquae,
respectively (approximately 75 mm3 of cell volume). Measure-
ments were performed on 30 cells were repeated on several
occasions to yield the average values.
2.3. Ozone experiments
For experiments investigating ozone decay and its impact on
cyanobacterial viability, stockozonesolutions (60e70mgO3 L�1)
were prepared by diffusing gaseous ozone that was produced
wat e r r e s e a r c h 4 7 ( 2 0 1 3 ) 2 9 8 3e2 9 9 4 2985
with a bench-top ozone generator (TG-10, Ozone Solutions, Inc,
USA) through a glass flask containing ultrapure water chilled at
4 �C. The concentration of the ozone stock solution and the
dissolved ozone residual in samplesweredeterminedaccording
to the standard colorimetricmethod 4500-O3 (APHA, 2005) using
indigo trisulfonate ( 3600nm ¼ 20,000 M�1 cm�1). Samples were
analysed at 600 nmwith a Varian spectrophotometer (Cary 100,
Varian) in a 1-cm or 2-cm quartz cell. Ozone performance was
evaluated for both M. aeruginosa and A. flos-aquae using three
different applied doses (0.5, 2.0 or 4.0 mg L�1), two initial cell
densities (250,000 and 1,500,000 cell mL�1) and two pH condi-
tions (6 or 8). This experimental design yielded a total of 24
ozonationassays, towhich6additional assays, in theabsenceof
algae cells, were added as controls. Previous experiments with
CB cells without ozone at two pH conditions (6 and 8) showed
there was no difference on cell viability. All experimental pro-
cedures were performed at room temperature of 20 �C.The pH values were adjusted using a borate buffer (ionic
strength: 0.05 M). An ozone decay curve was monitored in a
true-batch reactor for each of the conditions described above
(ozone dose, cell density and pH). The applied ozone doses
were administered by injecting an aliquot of the ozone stock
solution via a syringe into a continuously stirred 2-L glass
reactor containing the sample (initial sample volume between
500 and 1200 mL) and equipped with a floating Teflon lid to
prevent ozone degassing. Ozone residuals were measured
over a 10 min period by collecting 5 mL samples that were
dispensed into 20 mL of indigo (0.02, 1 or 3%) solution. In
parallel experiments, samples were collected for DOC mea-
surements, cell viability and cell counts at predetermined
contact times (0.5, 1.5, 3, 5 and 10min). The samples (sampling
volume of 150 mL) were immediately quenched with sodium
bisulfite (NaHSO3 e 2.2 mg/mg O3) to stop the ozone reaction.
To quantify �OH radical formation, a parallel reactor was al-
ways spiked with 200 mg L�1 (1.28 mM) of para-chlorobenzoic
acid (pCBA). A sub-sample of 1.5 mL was filtered using
0.45 mm pore filter (Millex-HV) and analysed using HPLC. The
column characteristics, mobile phase and detection were the
same as the column characteristics, mobile phase and
detection described by Vincent et al. (2010).
2.4. DOC quantification
DOC samples were filtered through pre-rinsed 0.45 mm hy-
drophilic polyethersulfone membranes (Supor�-450, PALL,
USA). DOC analysis measurements were conducted on a
5310C laboratory total organic carbon analyser (Sievers In-
struments, Inc., GE, USA). Extracellular DOC samples were
obtained by filtration immediately after ozone exposure. For
the measurements of total DOC values (extracellular and
intracellular DOC), the samples were subjected to three cy-
cles of freezing and thawing to achieve a complete disruption
of cells and the release of intracellular substances (Moreno
et al., 2004; Qian et al., 2010) Preliminary microscopic obser-
vations of disrupted cells confirmed the efficiency of the
freeze-thaw procedure in releasing cell-bound toxins. DOC
release during ozonation results were normalised by dividing
the DOC values by the ultimate filterable DOC released (DOC
extracellular), which was observed at the highest pH and
ozone dosage.
2.5. Formation of DBPs precursors
The potential for pre-ozonation to increase DBPs formation
was evaluated by chlorinating raw and pre-ozonated water
samples. An amount of free chlorine that was sufficient to
achieve a free chlorine residual of 1.0 � 0.2 mg L�1 after a 24-
hr chlorine contact time at 22 �C was added to the samples.
At the end of the incubation period, samples for THM and
HAA were quenched with excess of ammonium sulphate.
Measurements of free chlorine residuals were performed
using the DPD colorimetric method 4500C1-G (APHA, 2005).
Samples were analysed for four THMs (chloroform, bromo-
form, bromodichloromethane, dibromochloromethane)
referred as total THM (TTHM) and six HAA (monochloroacetic
acid, dichloroacetic acid, trichloroacetic acid, monobromo-
acetic acid, dibromoacetic acid and bromochloroacetic acid)
referred as HAA6. THMs were extracted by liquid/liquid
extraction with hexane as described in Standard Methods
6232B (APHA, 1998). HAA compounds were extracted by
liquid/liquid extraction with methyl tert-butyl ether (MtBE)
followed by derivation with acidic methanol in accordance
with USEPA Method 552.2 (USEPA, 1995). All DPBs were ana-
lysed on a gas chromatograph (CP-3800, Varian) equipped
with an electron capture detector (GC/ECD) (Column charac-
teristics: capillary column RTX-5MS with 30 m � 0.25 mm ID
and 0.25 mm film thickness).
2.6. CT calculations: molecular and free radicalexposures
For each specific contact time, the molecular ozone exposure
(CT value e ozone concentration � detention time),
expressed as mg min L�1, was calculated by numerical inte-
gration using the trapezoidal method, which calculates the
area under the decay curve. To validate the estimated nu-
merical CT, they were compared to modelled CT values,
which were obtained by assuming a pseudo-first-order decay
kinetic (k0) in (Eq. (1))
CTO3 ¼ C0
k0 ½1� expð�k0$tÞ� (1)
where C0 ¼ initial ozone residual (mg L�1) determined from
the exponential fit of the relationship between the ozone re-
sidual and time (min); and k0 ¼ the ozone pseudo-first-order
decay constant (min�1).�OH radical exposure (CT�
OH) was estimated using the
reaction-rate constant for �OH radical (kOH,pCBA ¼ 5.2
� 109 M�1s�1) and a second-order kinetic such that
dðpCBAÞdt
¼ �kOH$pCBA$½pCBA�$½$OH� (2)
where kOH.pCBA is the pCBA rate constant; [pCBA] is the pCBA
concentration; and [�OH] is the free hydroxyl radical
concentration.
Subsequently, �OH exposure is defined as:
CTOH ¼Z
$OH$dt ¼Ln
� ½pCBA�½pCBA�o
�kpCBA
(3)
wat e r r e s e a r c h 4 7 ( 2 0 1 3 ) 2 9 8 3e2 9 9 42986
2.7. Kinetic modelling
Ozone decay was modelled as a two-step process: immediate
demand followed by an n-th order kinetic. The immediate
ozone demand characterises the amount of ozone consumed
in the first stage of the oxidation process (measured after a
few seconds) (Park et al., 2001). In this study, the immediate
ozone demand was evaluated as the ozone consumed after
15 s of contact time (our earliest measurement). A step-
forward general regression model was developed to predict
ozone demand as a function of ozone dose, pH, organism type
and DOC. Ozone decay after immediate demand was
modelled using two alternative strategies. Initially, pseudo-
first-order kinetics were fitted successively to each individ-
ual decay curve (Eq. (4)) as
CCo
¼ expð�k$tÞ (4)
where C and C0 are the final and initial concentrations of the
target compound (mg L�1), respectively; k is the pseudo-first-
order reaction rate constant (min�1); and t is the time (min).
As an alternative approach, a generalised empirical kinetic
rate law (Eq. (5)) was developed as followed:
dO3
dt¼ �k$ðO3Þn$
�OH��m$ðDOC TÞp (5)
where O3 is the ozone residual; t is time, OH� is the hydroxide
concentration, DOC_T is the total concentration of organic
carbon; and n, m, p and k are fitting parameters.
Assuming that pH and DOC_T are constant during ozona-
tion, Eq. (5) can be integrated into Eq. (6). Because no mea-
surement is available to represent the reactivity of DOC
according to time, DOC_T is assumed to be constant to
simplify the calculations. In addition, DOC represents a series
of organic compounds rather than a single solute.
O3 ¼"
1
ðO3Þn�10
þ k� t� �OH��m � ðDOC TÞp
#1�n
(6)
Equation (6) was fitted separately for the ozone assays
that were conducted for each of the two organisms as well
as for the entire dataset (i.e., combined data for both
organisms).
3. Results and discussion
3.1. DOC release
Ozonation of CB cell suspensions led to a substantial increase
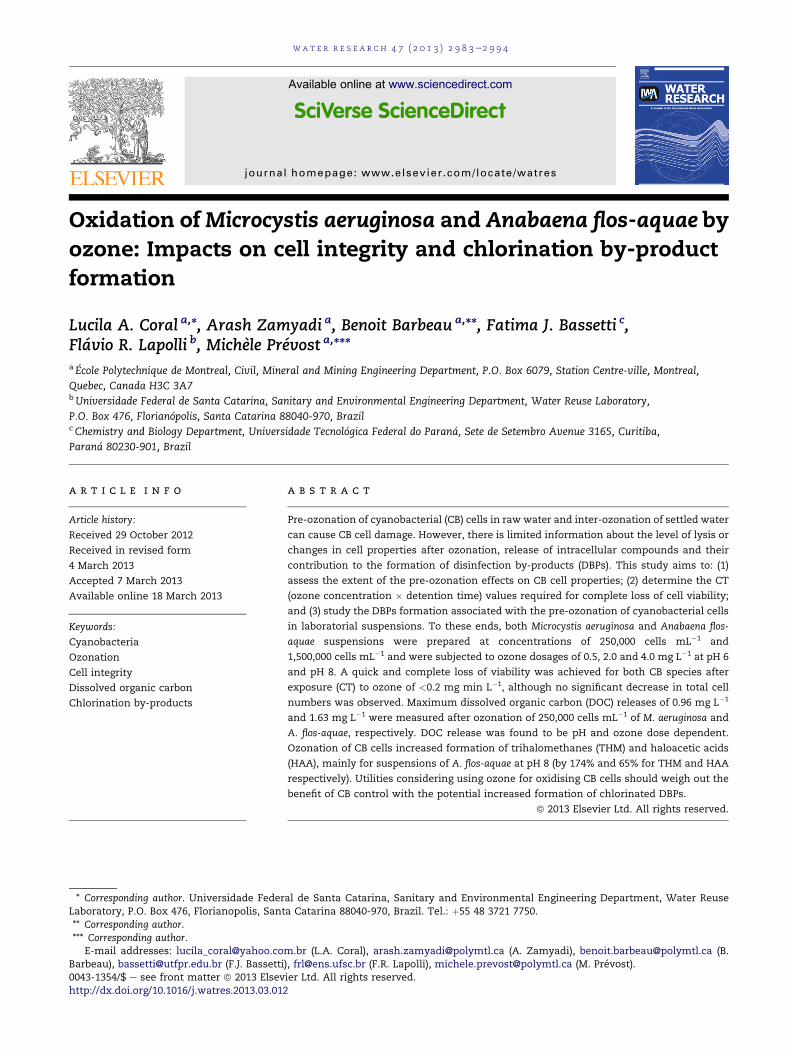
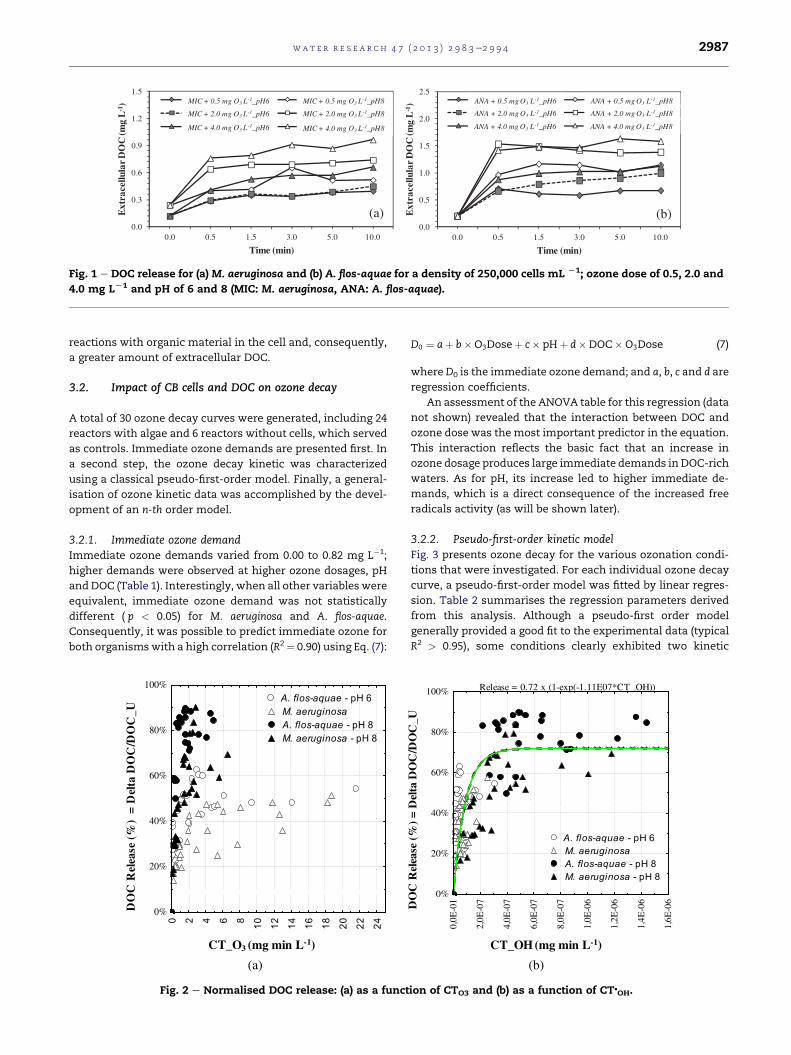
in DOC. For example, Fig. 1 shows increases in DOC
(0.1e1.5 mg C L�1) for M. aeruginosa and A. flos-aquae after
ozonation using 0.5, 2.0 or 4.0mg L�1 of ozone for a cell density
of 250,000 cells mL�1. The large amount of extracellular DOC
immediately after ozone exposure (0.5 min) can be related to
two mechanisms: a rapid reaction between ozone and cell
biomass, with a direct formation of DOC; and/or an indirect
reaction from cell lysis, leading the release of intracellular
compounds (Muller et al., 2003; Hammes et al., 2007; Ramseier
et al., 2011).
As shown in Fig. 1, higher ozone doses increased the pro-
portion of DOC release. After 10 min of contact time, an in-
crease from 0.39 mg L�1 of DOC with 0.5 mg O3 L�1 to
0.96 mg L�1 after 4 mg O3 L�1, and from 0.67 mg L�1 of DOC
with 0.5 mg O3 L�1e1.58 mg L�1 after 4 mg O3 L�1 were
observed forM. aeruginosa andA. flos-aquae, respectively. Miao
and Tao (2009) investigated DOC changes following ozone
oxidation of M. aeruginosa cultures (undisclosed cell concen-
trations). They observed that the release of cell associated
DOC increased from 0.34 to 2.56 mg L�1 with increasing ozone
dosages from 0 to 5 mg O3 L�1.
A greater release of DOC while ozonating A. flos-aquae can
be linked to cell size, which resulted in a greater release of
intracellular substances or a greater quantity of cell biomass
available for oxidation. Also, it can be observed on some oc-
casions (cf.M. aeruginosa at pH 6), that increasing the dosage of
ozone from 0.5 to 2mg L�1 did not result in an increase in DOC
concentration. This may indicate that the internal contents of
cells would have already been completely released at the
lowest ozone dosage. Thus, the greater concentration of DOC
obtained with the higher ozone dosage (4 mg L�1) would be
related to the oxidation of the organic constituents in the cell
structure. Similarly, for A. flos-aquae at pH 8, the increase in
ozone dose from 2 to 4 mg L�1 resulted in no increase in DOC
concentration, suggesting that all the organic material of cell
would have been completely released or oxidized with an
ozone dose of 2 mg O3 L�1.
The increase in extracellular DOC can also be correlated
with the pH values. Our results indicate that the amount of
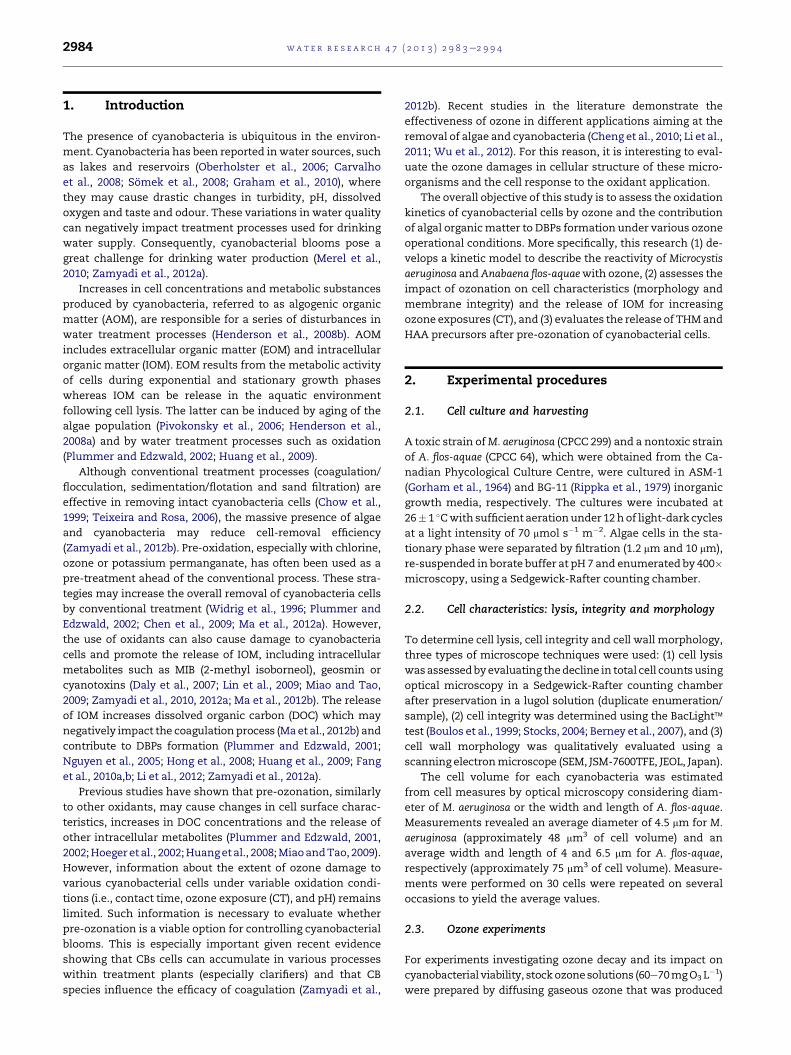
DOC released at pH 8 was greater than at pH 6. Fig. 2 presents
the normalised DOC release (expressed in % of the maximal
DOC released) for both organisms as a function of molecular
ozone exposure (CTO3) and/or hydroxyl radical exposures
(CT�OH). In Fig. 2a, there is no obvious difference in the nor-
malised DOC release between M. aeruginosa and A. flos-aquae.
The higher DOC release, as observed in Fig. 1, was essentially
caused by the higher biomass load of the larger A. flos-aquae.
However, for both organisms, there is an important difference
caused by the pH. DOC release at pH 6 plateaued at 30e50% of
the ultimate DOC release observed at pH 8. Interestingly,
plotting CT release with respect to CT�OH (Fig. 2b) provided a
better description of the entire dataset. We infer that free
radical plays an important role in the oxidation of algae cells.
CT�OH is correlated with CTO3; higher CTO3 also leads to a
higher CT�OH. However, it also accounts for the effect of pH
which explains its superiority over CTO3 in predicting DOC
release. Huang et al. (2008) also observed an increase in DOC
when pHwas increased from 5.5 to 9.0. The authors suggested
that this increase was caused by the increased liberation of
intracellular organic matter and cell-wall polysaccharides
during cell ozonation and that the action of pH on DOC release
was regardless of ozone dosages. At alkaline pH, the higher
concentration of hydroxide ion (OH�) promotes ozone
decomposition and the formation of hydroxyl free radicals
(�OH) (Widrig et al., 1996; Von Gunten, 2003). According to
Widrig et al. (1996), �OH radicals oxidation mechanisms are
more prone to degrade saturated aliphatic molecules, which
are largely present in algal-derived organic substances. Thus,
higher concentrations of �OH radicals due to alkaline pH or
higher O3 doses may lead to increased cell damage or
0.0
0.3
0.6
0.9
1.2
1.5
0.0 0.5 1.5 3.0 5.0 10.0
Ext
race
llula
r D
OC
(mg
L-1
)
Time (min)
(a)0.0
0.5
1.0
1.5
2.0
2.5
0.0 0.5 1.5 3.0 5.0 10.0
Ext
race
llula
r D
OC
(mg
L-1
)
Time (min)
(b)
Fig. 1 e DOC release for (a) M. aeruginosa and (b) A. flos-aquae for a density of 250,000 cells mL L1; ozone dose of 0.5, 2.0 and
4.0 mg LL1 and pH of 6 and 8 (MIC: M. aeruginosa, ANA: A. flos-aquae).
wat e r r e s e a r c h 4 7 ( 2 0 1 3 ) 2 9 8 3e2 9 9 4 2987
reactions with organic material in the cell and, consequently,
a greater amount of extracellular DOC.
3.2. Impact of CB cells and DOC on ozone decay
A total of 30 ozone decay curves were generated, including 24
reactors with algae and 6 reactors without cells, which served
as controls. Immediate ozone demands are presented first. In
a second step, the ozone decay kinetic was characterized
using a classical pseudo-first-order model. Finally, a general-
isation of ozone kinetic data was accomplished by the devel-
opment of an n-th order model.
3.2.1. Immediate ozone demandImmediate ozone demands varied from 0.00 to 0.82 mg L�1;
higher demands were observed at higher ozone dosages, pH
and DOC (Table 1). Interestingly, when all other variables were
equivalent, immediate ozone demand was not statistically
different ( p < 0.05) for M. aeruginosa and A. flos-aquae.
Consequently, it was possible to predict immediate ozone for
both organismswith a high correlation (R2¼ 0.90) using Eq. (7):
DO
C R
elea
se (
%)
= D
elta
DO
C/D
OC
_U
0 2 4 6 8 10 12 14 16 18 20 22 24
0%
20%
40%
60%
80%
100%A. flos-aquae - pH 6M. aeruginosa
A. flos-aquae - pH 8 M. aeruginosa - pH 8
CT_O3 (mg min L-1)
(a)
Fig. 2 e Normalised DOC release: (a) as a funct
D0 ¼ aþ b�O3Doseþ c� pHþ d�DOC�O3Dose (7)
whereD0 is the immediate ozone demand; and a, b, c and d are
regression coefficients.
An assessment of the ANOVA table for this regression (data
not shown) revealed that the interaction between DOC and
ozone dose was the most important predictor in the equation.
This interaction reflects the basic fact that an increase in
ozone dosage produces large immediate demands in DOC-rich
waters. As for pH, its increase led to higher immediate de-
mands, which is a direct consequence of the increased free
radicals activity (as will be shown later).
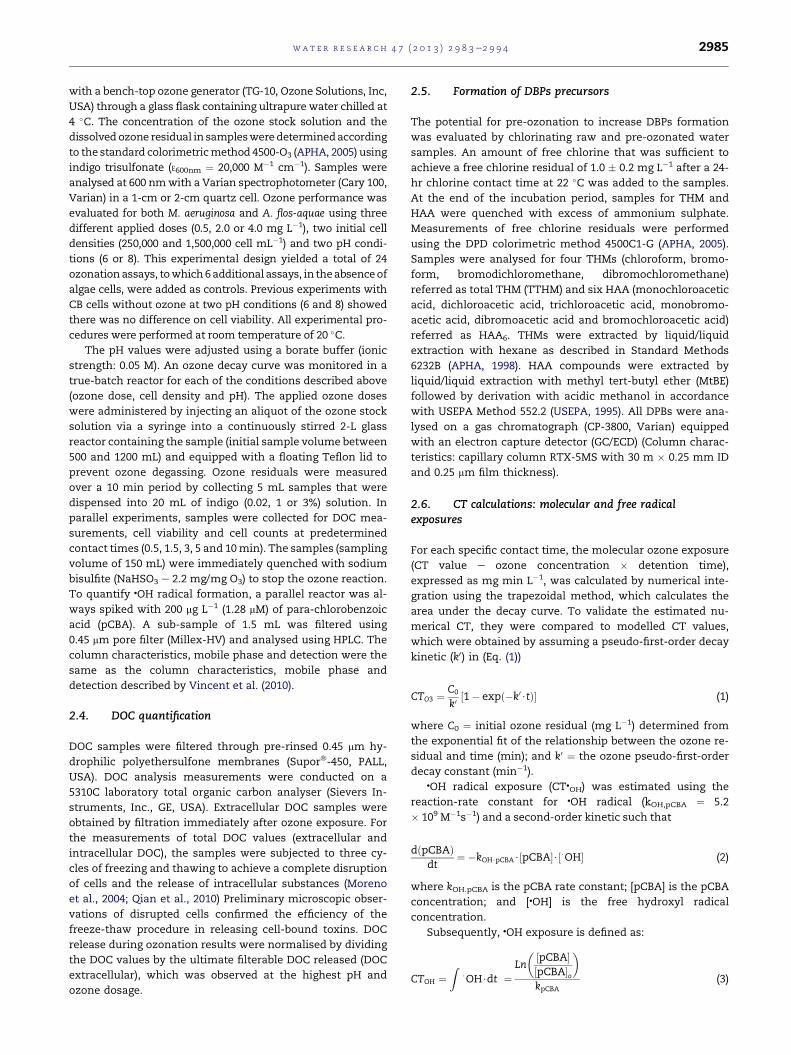
3.2.2. Pseudo-first-order kinetic modelFig. 3 presents ozone decay for the various ozonation condi-
tions that were investigated. For each individual ozone decay
curve, a pseudo-first-order model was fitted by linear regres-
sion. Table 2 summarises the regression parameters derived
from this analysis. Although a pseudo-first order model
generally provided a good fit to the experimental data (typical
R2 > 0.95), some conditions clearly exhibited two kinetic
DO
C R
elea
se (
%)
= D
elta
DO
C/D
OC
_U
0,0E
-01
2,0E
-07
4,0E
-07
6,0E
-07
8,0E
-07
1,0E
-06
1,2E
-06
1,4E
-06
1,6E
-06
0%
20%
40%
60%
80%
100%
A. flos-aquae - pH 6M. aeruginosa
A. flos-aquae - pH 8M. aeruginosa - pH 8
Release = 0.72 x (1-exp(-1.11E07*CT_OH))
CT_OH (mg min L-1)
(b)
ion of CTO3 and (b) as a function of CT�OH.

Table 1 e Immediate ozone demands. R2 [ 0.90.
pH 6 pH 8
Ozonedose(mg L�1)
Immediatedemand(mg L�1)
Ozonedose
(mg L�1)
Immediatedemand(mg L�1)
0.5 0.00 0.5 0.26
2.0 0.22 2.0 0.50
4.0 0.50 4.0 0.82
wat e r r e s e a r c h 4 7 ( 2 0 1 3 ) 2 9 8 3e2 9 9 42988
regimes (e.g., Fig. 3c). Half-life values varied from as low as
0.21 min to as high as 64 min (Table 2). As expected, higher pH
and initial cell densities led to lower half-lifes.
Under identical ozonation conditions, higher ozone decay
were always observed for A. flos-aquae than for M. aeruginosa.
This effect may be due to the fact that the latter algae is larger
(6.5 mm in length � 4 mm in width) than the former algae
(4.5 mm in diameter). Because the initial cell density was
equivalent for both organisms, A. flos-aquae brought a higher
organic load. On average, DOC concentrations were 90%
higher during assays performed with A. flos-aquae. To better
distinguish the impacts of pH, organic carbon concentration
and ozone residual on ozone decay kinetics, a generalised
empirical rate law was fitted to the entire dataset. This will be
the topic of the next section.
3.2.3. N-th order modelEquation (7) was adjusted for the four datasets described in
Table 3: the ultrapure water dataset, M. aeruginosa dataset, A.
0.0
1.5
3.0
4.5
0.0 2.0 4.0 6.0 8.0 10.0
Ozo
ne
Res
idua
l (m
g L
-1)
Time (min)
250,000 cells mL-1
pH 6
0.0
1.5
3.0
4.5
0.0 2.0 4.0 6.0 8.0 10.0
Ozo
ne R
esid
ual (
mg
L-1
)
Time (min)
1,500,000 cells mL-1
pH 6
Fig. 3 e Ozone decay curves in Milli-Q water without CB cells a
(ANA).
flos-aquae dataset and the combination ofM. aeruginosa and A.
flos-aquae into one dataset. The models provided a good fit to
the data (R2 ¼ 0.87e0.92). Ozone decomposition in ultrapure
water proved to be second-order with respect to dissolved
ozone, whereas reaction order for the hydroxide concentra-
tion was 0.53. Mizuno et al. (2007) developed a similar kinetic
model to describe ozone decay in ultrapure water. They also
observed second-order kinetics with respect to dissolved
ozone. However, the order of reaction for hydroxide (0.73) was
slightly higher than that obtained in this study, which is most
likely due to the fact that the Mizumo et al. model was
developed for a wider range of pH (4.0e7.8).
In the presence of algal organic matter (AOM), ozone decay
is always second-order for O3 and almost first-order for DOC.
As for pH, the orders of reaction (0.18e0.34) were lower than in
ultrapure waters, which indicates that the impact of pH on O3
decay was reduced in the presence of AOM. The reactivity of
M. aeruginosa (k ¼ 37.6 M(2.4) (mg C/L)�1.2 min�1) was also
higher than the reactivity forA. flos-aquae (k¼ 2.46M(2.3) (mg C/
L)�1.0 min�1). Such results indicates that the lower half-life
values observed while oxidizing A. flos-aquae were caused by
increased DOC concentrations rather than increased DOC
reactivity. As discussed earlier, higher DOC was promoted by
the larger biovolume of A. flos-aquae as compared with M.
aeruginosa.
To directly compare ozone reactivity of both algae, the
predictive models for immediate ozone demand and ozone
decay were used to predict ozone decay profiles for a common
ozonation condition (DOC_T ¼ 2 mg L�1, dose ¼ 2 mg L�1) and
0.0
1.5
3.0
4.5
0.0 2.0 4.0 6.0 8.0 10.0
Ozo
ne R
esid
ual (
mg
L-1
)
Time (min)
250,000 cells mL-1
pH 8
0.0
1.5
3.0
4.5
0.0 2.0 4.0 6.0 8.0 10.0
Ozo
ne R
esid
ual (
mg
L-1
)
Time (min)
1,500,000 cells mL-1
pH 8
nd in the presence of M. aeruginosa (MIC) and A. flos-aquae
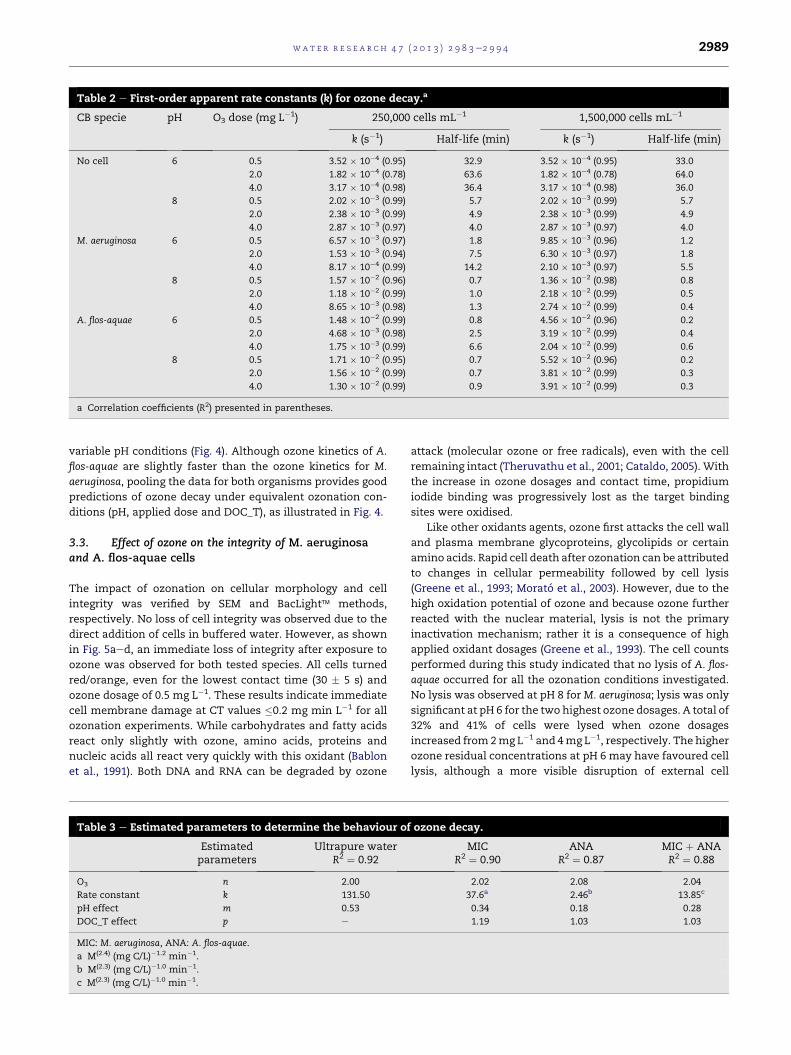
Table 2 e First-order apparent rate constants (k) for ozone decay.a
CB specie pH O3 dose (mg L�1) 250,000 cells mL�1 1,500,000 cells mL�1
k (s�1) Half-life (min) k (s�1) Half-life (min)
No cell 6 0.5 3.52 � 10�4 (0.95) 32.9 3.52 � 10�4 (0.95) 33.0
2.0 1.82 � 10�4 (0.78) 63.6 1.82 � 10�4 (0.78) 64.0
4.0 3.17 � 10�4 (0.98) 36.4 3.17 � 10�4 (0.98) 36.0
8 0.5 2.02 � 10�3 (0.99) 5.7 2.02 � 10�3 (0.99) 5.7
2.0 2.38 � 10�3 (0.99) 4.9 2.38 � 10�3 (0.99) 4.9
4.0 2.87 � 10�3 (0.97) 4.0 2.87 � 10�3 (0.97) 4.0
M. aeruginosa 6 0.5 6.57 � 10�3 (0.97) 1.8 9.85 � 10�3 (0.96) 1.2
2.0 1.53 � 10�3 (0.94) 7.5 6.30 � 10�3 (0.97) 1.8
4.0 8.17 � 10�4 (0.99) 14.2 2.10 � 10�3 (0.97) 5.5
8 0.5 1.57 � 10�2 (0.96) 0.7 1.36 � 10�2 (0.98) 0.8
2.0 1.18 � 10�2 (0.99) 1.0 2.18 � 10�2 (0.99) 0.5
4.0 8.65 � 10�3 (0.98) 1.3 2.74 � 10�2 (0.99) 0.4
A. flos-aquae 6 0.5 1.48 � 10�2 (0.99) 0.8 4.56 � 10�2 (0.96) 0.2
2.0 4.68 � 10�3 (0.98) 2.5 3.19 � 10�2 (0.99) 0.4
4.0 1.75 � 10�3 (0.99) 6.6 2.04 � 10�2 (0.99) 0.6
8 0.5 1.71 � 10�2 (0.95) 0.7 5.52 � 10�2 (0.96) 0.2
2.0 1.56 � 10�2 (0.99) 0.7 3.81 � 10�2 (0.99) 0.3
4.0 1.30 � 10�2 (0.99) 0.9 3.91 � 10�2 (0.99) 0.3
a Correlation coefficients (R2) presented in parentheses.
wat e r r e s e a r c h 4 7 ( 2 0 1 3 ) 2 9 8 3e2 9 9 4 2989
variable pH conditions (Fig. 4). Although ozone kinetics of A.
flos-aquae are slightly faster than the ozone kinetics for M.
aeruginosa, pooling the data for both organisms provides good
predictions of ozone decay under equivalent ozonation con-
ditions (pH, applied dose and DOC_T), as illustrated in Fig. 4.
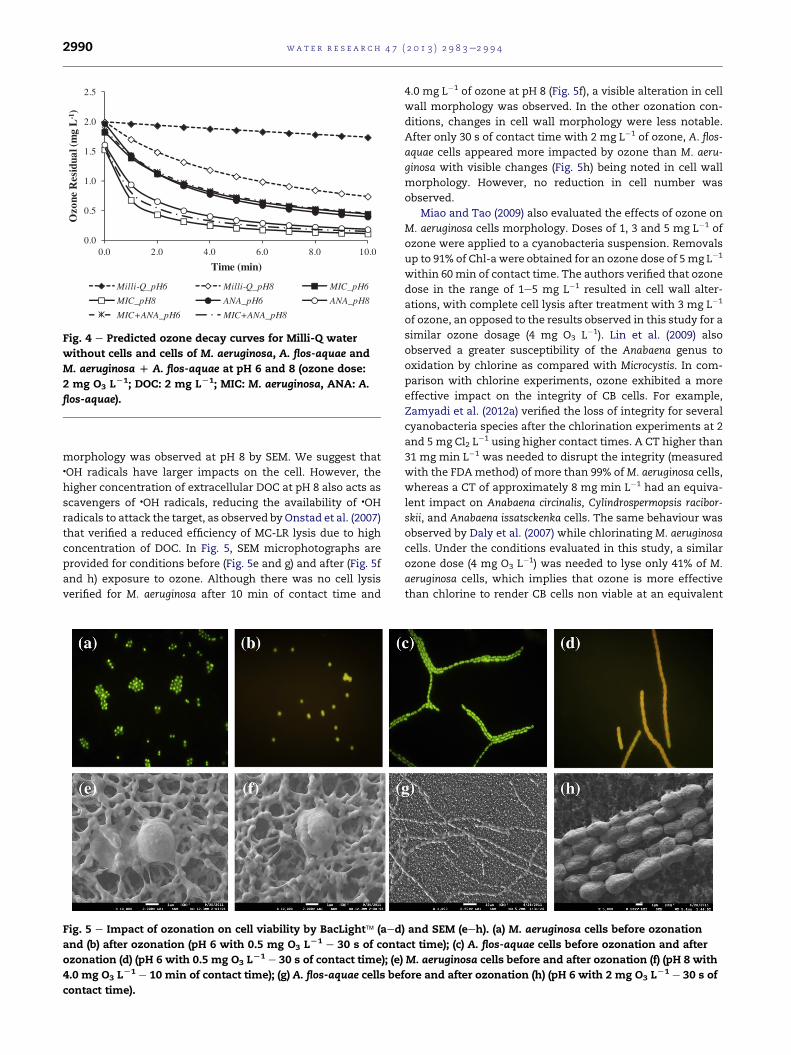
3.3. Effect of ozone on the integrity of M. aeruginosaand A. flos-aquae cells
The impact of ozonation on cellular morphology and cell
integrity was verified by SEM and BacLight� methods,
respectively. No loss of cell integrity was observed due to the
direct addition of cells in buffered water. However, as shown
in Fig. 5aed, an immediate loss of integrity after exposure to
ozone was observed for both tested species. All cells turned
red/orange, even for the lowest contact time (30 � 5 s) and
ozone dosage of 0.5 mg L�1. These results indicate immediate
cell membrane damage at CT values �0.2 mg min L�1 for all
ozonation experiments. While carbohydrates and fatty acids
react only slightly with ozone, amino acids, proteins and
nucleic acids all react very quickly with this oxidant (Bablon
et al., 1991). Both DNA and RNA can be degraded by ozone
Table 3 e Estimated parameters to determine the behaviour of
Estimatedparameters
Ultrapure waterR2 ¼ 0.92
O3 n 2.00
Rate constant k 131.50
pH effect m 0.53
DOC_T effect p e
MIC: M. aeruginosa, ANA: A. flos-aquae.
a M(2.4) (mg C/L)�1.2 min�1.
b M(2.3) (mg C/L)�1.0 min�1.
c M(2.3) (mg C/L)�1.0 min�1.
attack (molecular ozone or free radicals), even with the cell
remaining intact (Theruvathu et al., 2001; Cataldo, 2005). With
the increase in ozone dosages and contact time, propidium
iodide binding was progressively lost as the target binding
sites were oxidised.
Like other oxidants agents, ozone first attacks the cell wall
and plasma membrane glycoproteins, glycolipids or certain
amino acids. Rapid cell death after ozonation can be attributed
to changes in cellular permeability followed by cell lysis
(Greene et al., 1993; Morato et al., 2003). However, due to the
high oxidation potential of ozone and because ozone further
reacted with the nuclear material, lysis is not the primary
inactivation mechanism; rather it is a consequence of high
applied oxidant dosages (Greene et al., 1993). The cell counts
performed during this study indicated that no lysis of A. flos-
aquae occurred for all the ozonation conditions investigated.
No lysis was observed at pH 8 for M. aeruginosa; lysis was only
significant at pH 6 for the two highest ozone dosages. A total of
32% and 41% of cells were lysed when ozone dosages
increased from 2mg L�1 and 4mg L�1, respectively. The higher
ozone residual concentrations at pH 6 may have favoured cell
lysis, although a more visible disruption of external cell
ozone decay.
MICR2 ¼ 0.90
ANAR2 ¼ 0.87
MIC þ ANAR2 ¼ 0.88
2.02 2.08 2.04
37.6a 2.46b 13.85c
0.34 0.18 0.28
1.19 1.03 1.03
0.0
0.5
1.0
1.5
2.0
2.5
0.0 2.0 4.0 6.0 8.0 10.0
Ozo
ne R
esid
ual (
mg
L-1
)
Time (min)
Milli-Q_pH6 Milli-Q_pH8 MIC_pH6
MIC_pH8 ANA_pH6 ANA_pH8
MIC+ANA_pH6 MIC+ANA_pH8
Fig. 4 e Predicted ozone decay curves for Milli-Q water
without cells and cells of M. aeruginosa, A. flos-aquae and
M. aeruginosa D A. flos-aquae at pH 6 and 8 (ozone dose:
2 mg O3 LL1; DOC: 2 mg LL1; MIC: M. aeruginosa, ANA: A.
flos-aquae).
wat e r r e s e a r c h 4 7 ( 2 0 1 3 ) 2 9 8 3e2 9 9 42990
morphology was observed at pH 8 by SEM. We suggest that�OH radicals have larger impacts on the cell. However, the
higher concentration of extracellular DOC at pH 8 also acts as
scavengers of �OH radicals, reducing the availability of �OH
radicals to attack the target, as observed by Onstad et al. (2007)
that verified a reduced efficiency of MC-LR lysis due to high
concentration of DOC. In Fig. 5, SEM microphotographs are
provided for conditions before (Fig. 5e and g) and after (Fig. 5f
and h) exposure to ozone. Although there was no cell lysis
verified for M. aeruginosa after 10 min of contact time and
Fig. 5 e Impact of ozonation on cell viability by BacLight� (aed
and (b) after ozonation (pH 6 with 0.5 mg O3 LL1 e 30 s of conta
ozonation (d) (pH 6 with 0.5 mg O3 LL1 e 30 s of contact time); (e)
4.0 mg O3 LL1 e 10 min of contact time); (g) A. flos-aquae cells be
contact time).
4.0 mg L�1 of ozone at pH 8 (Fig. 5f), a visible alteration in cell
wall morphology was observed. In the other ozonation con-
ditions, changes in cell wall morphology were less notable.
After only 30 s of contact time with 2 mg L�1 of ozone, A. flos-
aquae cells appeared more impacted by ozone than M. aeru-
ginosa with visible changes (Fig. 5h) being noted in cell wall
morphology. However, no reduction in cell number was
observed.
Miao and Tao (2009) also evaluated the effects of ozone on
M. aeruginosa cells morphology. Doses of 1, 3 and 5 mg L�1 of
ozone were applied to a cyanobacteria suspension. Removals
up to 91% of Chl-a were obtained for an ozone dose of 5mg L�1
within 60 min of contact time. The authors verified that ozone
dose in the range of 1e5 mg L�1 resulted in cell wall alter-
ations, with complete cell lysis after treatment with 3 mg L�1
of ozone, an opposed to the results observed in this study for a
similar ozone dosage (4 mg O3 L�1). Lin et al. (2009) also
observed a greater susceptibility of the Anabaena genus to
oxidation by chlorine as compared with Microcystis. In com-
parison with chlorine experiments, ozone exhibited a more
effective impact on the integrity of CB cells. For example,
Zamyadi et al. (2012a) verified the loss of integrity for several
cyanobacteria species after the chlorination experiments at 2
and 5 mg Cl2 L�1 using higher contact times. A CT higher than
31 mg min L�1 was needed to disrupt the integrity (measured
with the FDAmethod) of more than 99% ofM. aeruginosa cells,
whereas a CT of approximately 8 mg min L�1 had an equiva-
lent impact on Anabaena circinalis, Cylindrospermopsis racibor-
skii, and Anabaena issatsckenka cells. The same behaviour was
observed by Daly et al. (2007) while chlorinating M. aeruginosa
cells. Under the conditions evaluated in this study, a similar
ozone dose (4 mg O3 L�1) was needed to lyse only 41% of M.
aeruginosa cells, which implies that ozone is more effective
than chlorine to render CB cells non viable at an equivalent
) and SEM (eeh). (a) M. aeruginosa cells before ozonation
ct time); (c) A. flos-aquae cells before ozonation and after
M. aeruginosa cells before and after ozonation (f) (pH 8 with
fore and after ozonation (h) (pH 6 with 2 mg O3 LL1 e 30 s of
wat e r r e s e a r c h 4 7 ( 2 0 1 3 ) 2 9 8 3e2 9 9 4 2991
oxidant exposure (CT). The results from this study are
consistent with the results in the literature: release of DOC
and internal metabolites precede cell lysis (Plummer and
Edzwald, 2001; Miao and Tao, 2009). Our results indicate that
very low ozone exposure may be sufficient to induce cell
damage and loss of integrity.
3.4. Formation of disinfection by-products from CB cells
Several studies have quantitatively evaluated the reactivity of
algal and cyanobacteria cells and their metabolites as pre-
cursors of chlorinated DBPs (Plummer and Edzwald, 2001;
Hong et al., 2008; El-Aty et al., 2009; Huang et al., 2009;
Zamyadi et al., 2012a). Pre-ozonation of cyanobacteria cells
release intracellular compounds which may contribute to the
pool of chlorinated DBPs precursors (assuming that post-
chlorination is used as a final treatment). To evaluate their
reactivity, ozonated samples spiked with the lower concen-
tration of algae cells (250,000 cell mL�1) were chlorinated and
subjected to a THM and HAA6 analyses.
Our results indicated that the predominant chlorinated
DBPs formed were chloroform (CHCl3) and dichloroacetic acid
(DCAA) forM. aeruginosa, and CHCl3, DCAA and trichloroacetic
acid (TCAA) for A. flos-aquae (Supplementary Data e Table SD-
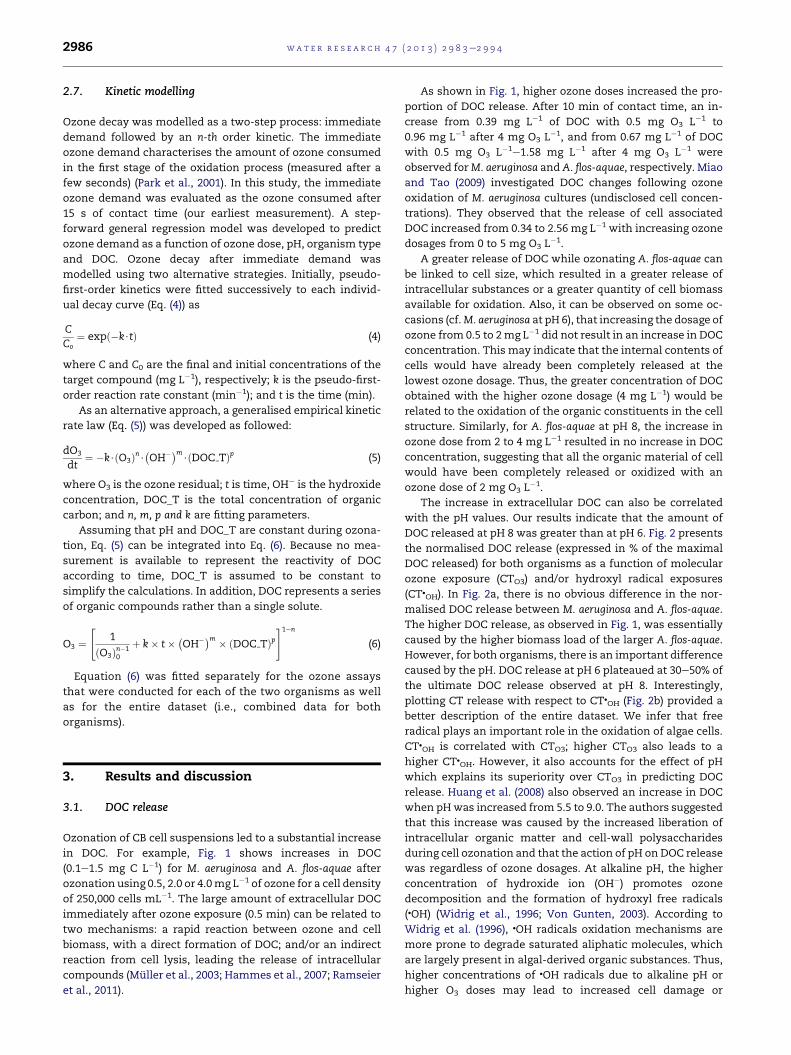
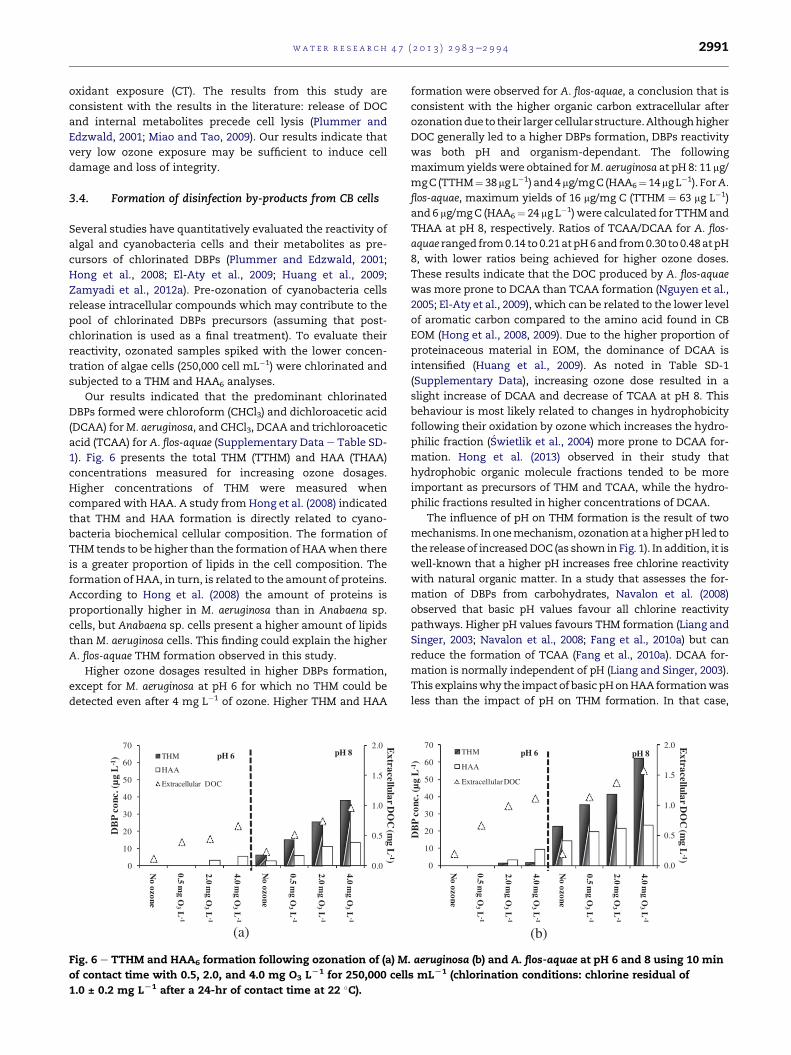
1). Fig. 6 presents the total THM (TTHM) and HAA (THAA)
concentrations measured for increasing ozone dosages.
Higher concentrations of THM were measured when
compared with HAA. A study from Hong et al. (2008) indicated
that THM and HAA formation is directly related to cyano-
bacteria biochemical cellular composition. The formation of
THM tends to be higher than the formation of HAAwhen there
is a greater proportion of lipids in the cell composition. The
formation of HAA, in turn, is related to the amount of proteins.
According to Hong et al. (2008) the amount of proteins is
proportionally higher in M. aeruginosa than in Anabaena sp.
cells, but Anabaena sp. cells present a higher amount of lipids
than M. aeruginosa cells. This finding could explain the higher
A. flos-aquae THM formation observed in this study.
Higher ozone dosages resulted in higher DBPs formation,
except for M. aeruginosa at pH 6 for which no THM could be
detected even after 4 mg L�1 of ozone. Higher THM and HAA
0.0
0.5
1.0
1.5
2.0
0
10
20
30
40
50
60
70
No ozone
0.5 mg/L
O3
2.0 mg/L
O3
4.0 mg/L
O3
No ozone
0.5 mg/L
O3
2.0 mg/L
O3
4.0 mg/L
O3
Extracellular D
OC
(mg L
-1)
DB
P c
onc.
(µg
L-1
) THM
HAA
Extracellular DOC
pH 6 pH 8
No ozone
0.5 mg O
3L
-1
2.0 mg O
3L
-1
4.0 mg O
3L
-1
0.5 mg O
3L
-1
2.0 mg O
3L
-1
4.0 mg O
3L
-1
No ozone
(a)
Fig. 6 e TTHM and HAA6 formation following ozonation of (a) M
of contact time with 0.5, 2.0, and 4.0 mg O3 LL1 for 250,000 cell
1.0 ± 0.2 mg LL1 after a 24-hr of contact time at 22 �C).
formation were observed for A. flos-aquae, a conclusion that is
consistent with the higher organic carbon extracellular after
ozonationdue to their larger cellular structure.Althoughhigher
DOC generally led to a higher DBPs formation, DBPs reactivity
was both pH and organism-dependant. The following
maximumyieldswere obtained forM. aeruginosa at pH 8: 11 mg/
mgC (TTHM¼ 38mg L�1) and4 mg/mgC (HAA6¼ 14mg L�1). ForA.
flos-aquae, maximum yields of 16 mg/mg C (TTHM ¼ 63 mg L�1)
and 6 mg/mgC (HAA6¼ 24 mg L�1) were calculated for TTHMand
THAA at pH 8, respectively. Ratios of TCAA/DCAA for A. flos-
aquae ranged from0.14 to 0.21at pH6and from0.30 to0.48atpH
8, with lower ratios being achieved for higher ozone doses.
These results indicate that the DOC produced by A. flos-aquae
was more prone to DCAA than TCAA formation (Nguyen et al.,
2005; El-Aty et al., 2009), which can be related to the lower level
of aromatic carbon compared to the amino acid found in CB
EOM (Hong et al., 2008, 2009). Due to the higher proportion of
proteinaceous material in EOM, the dominance of DCAA is
intensified (Huang et al., 2009). As noted in Table SD-1
(Supplementary Data), increasing ozone dose resulted in a
slight increase of DCAA and decrease of TCAA at pH 8. This
behaviour is most likely related to changes in hydrophobicity
following their oxidation by ozone which increases the hydro-
philic fraction (�Swietlik et al., 2004) more prone to DCAA for-
mation. Hong et al. (2013) observed in their study that
hydrophobic organic molecule fractions tended to be more
important as precursors of THM and TCAA, while the hydro-
philic fractions resulted in higher concentrations of DCAA.
The influence of pH on THM formation is the result of two
mechanisms. Inonemechanism, ozonationat ahigher pH led to
the release of increasedDOC (as shown in Fig. 1). In addition, it is
well-known that a higher pH increases free chlorine reactivity
with natural organic matter. In a study that assesses the for-
mation of DBPs from carbohydrates, Navalon et al. (2008)
observed that basic pH values favour all chlorine reactivity
pathways. Higher pH values favours THM formation (Liang and
Singer, 2003; Navalon et al., 2008; Fang et al., 2010a) but can
reduce the formation of TCAA (Fang et al., 2010a). DCAA for-
mation is normally independent of pH (Liang and Singer, 2003).
This explainswhy the impact of basicpHonHAAformationwas
less than the impact of pH on THM formation. In that case,
0.0
0.5
1.0
1.5
2.0
0
10
20
30
40
50
60
70
No ozone
0.5 mg/L
O3
2.0 mg/L
O3
4.0 mg/L
O3
No ozone
0.5 mg/L
O3
2.0 mg/L
O3
4.0 mg/L
O3
Extracellular D
OC
(mg L
-1)
DB
P c
onc.
(µg
L-1
)
THM
HAA
ExtracellularDOC
pH 6 pH 8
No ozone
0.5 mg O
3L
-1
2.0 mg O
3L
-1
4.0 mg O
3L
-1
0.5 mg O
3L
-1
2.0 mg O
3L
-1
4.0 mg O
3L
-1
No ozone
(b)
. aeruginosa (b) and A. flos-aquae at pH 6 and 8 using 10 min
s mLL1 (chlorination conditions: chlorine residual of
wat e r r e s e a r c h 4 7 ( 2 0 1 3 ) 2 9 8 3e2 9 9 42992
higherHAAformationatpH8canbeconsideredadirect resultof
the increase in the availability of DBPs (DOC and other intracel-
lular compounds) precursors under this ozonation condition.
A comparative evaluationof thepotential formationofDBPs
from EOM and CB cells was not evaluated in this study. How-
ever, some of the observations on EOM were made on the
accumulated by products during long term cell culture which
raises the representativity of these findings in a real bloom
(2012a).Other results obtainedbyLiuet al. (2011) inchlorination
studies with M. aeruginosa indicate that only 22% of total THM
formedwas derived from EOM in amixture including cells and
EOM. In a study with M. aeruginosa cells, Fang et al. (2010b)
evaluated the contribution of EOM, IOM and cells to the DBPs
formation. They observed that EOM formed lower concentra-
tions of chloroform and DCAA than IOM and CB cells, which
presented a similar contribution to the final total concentration
ofDBPs formed.All thesefindings confirmthat pre-oxidationof
CB cells can impact significantly the formation of chlorination
by-products in certain conditions by increasing the precursor’s
pool, especially when cell concentrations are elevated. How-
ever, in many cases, background DBPs precursors level have
been shown to be the main factor affecting the overall forma-
tionofDBPs innaturalwatersandthekey factor limiting theuse
of pre-chlorination (2012a). In the case of ozonation, treatment
conditions can enhance the reactivity and DBPs yield of cell-
bound and cell-released precursors. When considering pre-
ozonation, the contribution of CB cells to the pool of THM and
HAA precursor should be considered carefully, especially if no
additional treatment is capable of removing the released DBPs
precursors after pre-ozonation.
4. Conclusion
A low-ozone dose (0.5 mg L�1) was sufficient to cause a com-
plete loss of integrity ofM. aeruginosa and A. flos-aquae cells, for
both cell densities and pH values investigated. Although no
significant cell lysis was observed for most ozonation condi-
tions, the damage on cell structure after ozonation resulted in
an increase inDOC.HigherDOCreleasewasobserved forA.flos-
aquae, an observationwhichwas attributed to their differences
in biovolume. DOC release increased with ozone dose and pH.
The greater DOC release at pH 8 suggests that the attack of free
radicals is an important contributor to this process. Kinetic
analysis indicated that presence of CB cells in water can result
in a considerable immediate ozone demand and this behaviour
is dependent on ozone dose, DOC concentration and pH, but
was independent of the type of CB species tested. Ozone decay
was influenced by CB species and pH values, with the fastest
ozone decay observed for A. flos-aquae cells at pH 8.
DOC release from CB cells was confirmed to contribute to
DBPs formation. The ozone dose, pH and CB species were the
most important predictors of DBPs formation. A greater
amount of THMandHAAwasquantified forA. flos-aquae and at
pH 8, which may be related to the greater amount of DOC
release and the cell composition of this algae. When higher
ozone doses were applied, greater concentrations of THM and
HAA were quantified.
Pre-ozonation is an attractive solution for CB impacted
source waters. It can prevent CB cell accumulation within the
plant (clarifiers and filters) thus reducing the risk of toxin
release during treatment and facilitating the disposal of
sludge. However, it is important to take into consideration the
effect of pre-ozonation on DOC andDBPs formationwhich can
be significant under certain ozonation conditions (high pH,
high CB cell concentrations). Thus, the benefits of CBs control
must be weighed against potential significant increases in
DBPs formation considering the water quality at a given site.
Acknowledgements
This study was financially supported by Natural Sciences and
Engineering Research Council of Canada (NSERC) Industrial
Chair on Drinking Water at Ecole Polytechnique de Montreal,
Brazilian Coordination for the Perfection of Higher Level
Personnel (CAPES) and BrazilianNational Council for Scientific
and Technological Development (CNPq). The assistance of
Jacinthe Mailly, Julie Philibert, Marcelin Fosting, Yves Fon-
taine, and Mireille Blais is gratefully acknowledged. The In-
dustrial Chair includes the City of Montreal, John-Meunier Inc.
and the City of Laval.
Appendix A. Supplementary data
Supplementary data related to this article can be found at
http://dx.doi.org/10.1016/j.watres.2013.03.012.
r e f e r e n c e s
American Public Health Association (APHA), 1998. StandardMethods for the Examination of Water and Wastewater,twentieth ed. American PublicHealth Association (AWWA) andthe Water Environment Federation, Washington, DC, USA.
American Public Health Association (APHA), 2005. StandardMethods for the Examination of Water and Wastewater,twentyfirst ed. American Public Health Association (AWWA)and the Water Environment Federation, Washington, DC,USA.
Bablon, G., Bellamy, W.D., Bourbigot, M.-M., Daniel, F.B., Dore, M.,Erb, F., Gordon, G., Langlais, B., Laplanche, A., Legube, B.,Martin, G., Masschelein, W.J., Pacey, G., Reckhow, D.A.,Ventresque, C., 1991. In: Langlais, B., Reckhow, D.A.,Brink, D.R. (Eds.), Ozone in Water Treatment: Application andEngineering. Lewis Publishers, Inc., Chelsea, Michigan,pp. 11e132.
Berney, M., Hammes, F., Bosshard, F., Weilenmann, H.-U., Egli, T.,2007. Assessment and interpretation of bacterial viability byusing the LIVE/DEAD BacLight kit in combination with flowcytometry. Applied and Environmental Microbiology 73 (10),3283e3290.
Boulos, L., Prevost, M., Barbeau, B., Coallier, J., Desjardins, R., 1999.LIVE/DEAD� BacLight�: application of a new rapid stainingmethod for direct enumeration of viable and total bacteria indrinking water. Journal of Microbiological Methods 37, 77e86.
Carvalho, L.R., Pipole, F., Werner, V.R., Laughinghouse IV, H.D.,Camargo, A.C.M., Rangel, M., Konno, K., Sant’Anna, C.L., 2008.A toxic cyanobacterial bloom in an urban coastal lake, RioGrande do Sul state, Southern Brazil. Brazilian Journal ofMicrobiology 39, 761e769.
wat e r r e s e a r c h 4 7 ( 2 0 1 3 ) 2 9 8 3e2 9 9 4 2993
Cataldo, F., 2005. Ozone degradation of ribonucleic acid (RNA).Polymer Degradation and Stability 89, 275e281.
Chen, J.-J., Yeh, H.-H., Tseng, I.-C., 2009. Effect of ozone andpermanganate on algae coagulation removal e pilot andbench scale tests. Chemosphere 74, 840e846.
Cheng, Y.-L., Juang, Y.-C., Liao, G.-Y., Ho, S.-H., Yeh, K.-L.,Chen, C.-Y., Chang, J.-C., Liu, J.-C., Lee, D.-J., 2010. Dispersedozone flotation of Chlorella vulgaris. Bioresource Technology101, 9092e9096.
Chow, C.W.K., Drikas, M., House, J., Burch, M.D.,Velzeboer, R.M.A., 1999. The impact of conventional watertreatment processes on cells of the cyanobacteriumMicrocystisaeruginosa. Water Research 33 (15), 3253e3262.
Daly, R.I., Ho, L., Brookes, J.D., 2007. Effect of chlorination onMicrocystis aeruginosa cell integrity and subsequentmicrocystin release and degradation. Environmental Scienceand Technology 41, 4447e4453.
El-Aty, A.M.A., Ibrahim, M.B.M., El-Dib, M.A., Radwan, E.K., 2009.Influence of chlorine on algae as precursors fortrihalomethane and haloacetic acid production. WorldApplied Sciences Journal 6 (9), 1215e1220.
Fang, J., Ma, J., Yang, X., Shang, C., 2010a. Formation ofcarbonaceous and nitrogenous disinfection by-products fromthe chlorination of Microcystis aeruginosa. Water Research2010, 1934e1940.
Fang, J., Yang, X., Ma, J., Shang, C., Zhao, Q., 2010b.Characterization of algal organic matter and formation ofDBPs chlor(am)ination. Water Research 44, 5897e5906.
Gorham, P.R., Mclachlan, J., Hammer, U.T., Kim, W.K., 1964.Isolation and culture of toxic strains of Anabaena flos-aquae(Lyngb.) de Bred. International Association of Theoretical andApplied Limnology 15, 796e804.
Graham, J.L., Loftin, K.A., Meyer, M.T., Ziegler, A.C., 2010.Cyanotoxin mixtures and taste-and-odor compounds incyanobacterial blooms from the Midwestern United States.Environmental Science and Technology 44 (19), 7361e7368.
Greene, A.K., Few, B.K., Serafini, J.C., 1993. A comparison ofozonation and chlorination for the disinfection of stainlesssteel surfaces. Journal of Dairy Science 76, 3617e3620.
Hammes, F.,Meylan, S., Salhi, E., Koster,O., Egli, T., VonGunten,U.,2007. Formation of assimilable organic carbon (AOC) andspecific natural organic matter (NOM) fraction duringozonation of phytoplankton. Water Research 41, 1447e1454.
Henderson, R., Parsons, S.A., Jefferson, B., 2008a. The impact ofalgal properties and pre-oxidation on solid-liquid separationof algae. Water Research 42, 1827e1845.
Henderson, R.K., Baker, A., Parsons, S.A., Jefferson, B., 2008b.Characterisation of algogenic organic matter extracted fromcyanobacteria, green algae and diatoms. Water Research 42,3435e3445.
Hoeger, S.J., Dietrich, D.R., Hitzfeld, B.C., 2002. Effect of ozonationon the removal of cyanobacterial toxins during drinking watertreatment. Environmental Health Perspectives 110 (11),1127e1132.
Hong, H.C., Mazumder, A., Wong, M.H., Liang, Y., 2008. Yield oftrihalomethanes and haloacetic acids upon chlorinating algalcells, and its prediction via algal cellular. Water Research 42,4941e4948.
Hong, H.C., Wong, M.H., Liang, Y., 2009. Amino acids asprecursors of trihalomethane and haloacetic acid formationduring chlorination. Archives of EnvironmentalContamination and Toxicology 56, 638e645.
Hong, H.C., Huang, F.Q., Wang, F.Y., Ding, L.X., Lin, H.J., Liang, Y.,2013. Properties of sediment NOM collected from a drinkingwater reservoir in South China, and its association with THMsand HAAs formation. Journal of Hydrology 476, 274e279.
Huang, W.-J., Cheng, Y.-L., Cheng, B.-L., 2008. Ozonationbyproducts and determination of extracellular release in
freshwater algae and cyanobacteria. EnvironmentalEngineering Science 25 (2), 139e151.
Huang, J., Graham, N., Templeton, M.R., Zhang, Y., Collins, C.,Nieuwenhuijsen, M., 2009. A comparison of the role of twoblue-green algae in THM and HAA formation. Water Research43, 3009e3018.
Li, H., Yao, C., Dong, X., Dong, W., Fan, Z., 2011. Effect of pH oninactivation of Microcystis aeruginosa by ozonation air insequencing batch reactor. Journal of Chemical TechnologyBiotechnology 86, 468e471.
Li, L., Gao, N., Deng, Y., Yao, J., Zhang, K., 2012. Characterizationof intracellular & extracellular algae organic matters (AOM) ofMicrocystis aeruginosa and formation of AOM-associateddisinfection byproducts and odor & taste compounds. WaterResearch 46, 1233e1240.
Liang, L., Singer, P.C., 2003. Factors influencing the formation andrelative distribution of haloacetic acids and trihalomethanesin drinking water. Environmental Science and Technology 37,2920e2928.
Lin, T.-F., Chang, D.-W., Lien, S.-K., Tseng, Y.-S., Chiu, Y.-T.,Wang, Y.-S., 2009. Effect of chlorination on the cell integrity oftwo noxious cyanobacteria and their releases of odorants.Journal of Water Supply: Research and Technology e AQUA 58(8), 539e551.
Liu, Z., Cui, F., Ma, H., Fan, Z., Zhao, Z., 2011. The role ofnitrobenzene on the yield of trihalomethane formationpotential in aqueous solutions with Microcystis aeruginosa.Water Research 45, 6489e6495.
Ma, M., Liu, R., Liu, H., Qu, J., 2012a. Effect of moderate pre-oxidation on the removal of Microcystis aeruginosa by KMnO4-Fe(II) process: significance of the in-situ formed Fe (III). WaterResearch 46, 73e81.
Ma, M., Liu, R., Liu, H., Qu, J., Jefferson, W., 2012b. Effects andmechanisms of pre-chlorination on Microcystis aeruginosaremoval by alum coagulation: significance of the releaseintracellular organic matter. Separation and PurificationsTechnology 86, 19e25.
Merel, S., Clement, M., Thomas, O., 2010. State of the art oncyanotoxins in water and their behaviour towards chlorine.Toxicon 55, 677e691.
Miao, H., Tao, W., 2009. The mechanisms of ozonation oncyanobacteria and its toxins removal. Separation andPurifications Technology 66, 187e193.
Mizuno, T., Tsuno, H., Yamada, H., 2007. Development of ozoneself-decomposition model for engineering design. Ozone:Science and Engineering 29, 55e63.
Morato, J., Mir, J., Codony, F., Mas, J., Ribas, F., 2003. In: Mara, D.,Horan, N. (Eds.), Water andWastewater Microbiology. Elsevier,Great Britain, pp. 657e693.
Moreno, I.M., Pereira, P., Franca, S., Camean, A., 2004. Toxiccyanobacteria strains isolated from blooms in the GuadianaRiver (southwestern Spain). Biological Research 37, 405e417.
Muller, K.C., Forster, R., Gammeter, S., Hambsch, B., 2003.Influence of ozonated cyanobacteria on bacterial growth inrapid sand filters. Journal of Water Supply: Research andTechnology e AQUA 52 (5), 333e340.
Navalon, S., Alvaro, M., Garcia, H., 2008. Carbohydrates astrihalomethanes precursors. Influence of pH and th resence ofCl� and Br� on trihalomethane formation potential. WaterResearch 42, 3990e4000.
Nguyen, M.-L., Westerhoff, P., Baker, L., Hu, Q., Esparza-Soto, M.,Sommerfeld, M., 2005. Characteristics and reactivity of algae-produced dissolved organic carbon-ASCE. Journal ofEnvironmental Engineering 131, 1574e1582.
Oberholster, P.J., Botha, A.-M., Cloete, T.E., 2006. Toxiccyanobacterial blooms in a shallow, artificially mixed urbanlake in Colorado, USA. Lakes & Reservoirs and Management11, 111e123.
wat e r r e s e a r c h 4 7 ( 2 0 1 3 ) 2 9 8 3e2 9 9 42994
Onstad, G.D., Strauch, S., Meriluoto, J., Codd, G.A., Von Gunten, U.,2007. Selective oxidation of key functional groups incyanotoxins during drinking water ozonation. EnvironmentalScience and Technology 41, 4397e4404.
Park, H.-S., Hwang, T.-M., Kang, J.-W., Choi, H., Oh, H.-J., 2001.Characterization of raw water for the ozone applicationmeasuring ozone consumption rate. Water Research 35 (11),2607e2614.
Pivokonsky, M., Kloucek, O., Pivokonska, L., 2006. Evaluation ofthe production, composition and aluminum and ironcomplexation of algogenic organic matter. Water Research 40,3045e3052.
Plummer, J.D., Edzwald, J.K., 2001. Effect of ozone on algae asprecursors for trihalomethane and haloacetic acid production.Environmental Science and Technology 35, 3661e3668.
Plummer, J.D., Edzwald, J.K., 2002. Effects of chlorine and ozoneon algal cell properties and removal of algae by coagulation.Journal of Water Supply: Research and Technology e AQUA51, 307e318.
Qian, H., Yu, S., Sun, Z., Xie, X., Liu, W., Fu, Z., 2010. Effects ofcopper sulfate, hydrogen peroxide and N-phenyl-2-naphthylamine on oxidative stress and the expression ofgenes involved photosynthesis and microcystin disposition inMicrocystis aeruginosa. Aquatic Toxicology 99, 405e412.
Ramseier, M.K., Peter, A., Traber, J., Von Gunten, U., 2011.Formation of assimilable organic carbon during oxidation ofnatural waters with ozone, chlorine dioxide, chlorine,permanganate, and ferrate. Water Research 45 (5), 2002e2010.
Rippka, R., Deruelles, J., Waterbury, J.B., Herdman, M.,Stanier, R.Y., 1979. Generic assignments, strain histories andproperties of pure cultures of cyanobacteria. Journal ofGeneral Microbiology 111, 1e61.
Somek, H., Ustao�glu, M.R., M., Y., 2008. A case report: algal bloomof Microcystis aeruginosa in a drinking-water body, E�girdir lake,Turkey. Turkish Journal of Fisheries and Aquatic Sciences 8,177e179.
Stocks, S.M., 2004. Mechanism and use of the commerciallyavailable viability stain, BacLight. Cytometry Part A 61, 189e195.
Teixeira, M.R., Rosa, M.J., 2006. Comparing dissolved air flotationand conventional sedimentation to remove cyanobacterialcells of Microcystis aeruginosa part I: the key operating
conditions. Separation and Purifications Technology 52,84e94.
Theruvathu, J.A., Flyunt, R., Aravindakumar, C.T., vonSonntag, C., 2001. Rate constants of ozone reactions with DNA,its constituents and related compounds. Journal of theChemical Society, Perkin Transactions 2, 269e274.
USEPA, 1995. Method 552.2-determination of Haloacetic Acidsand Dalapon in Drinking Water by Liquid-liquid Extraction,Derivatization and Gas Chromatography with ElectronCapture Detection. U.S. Environmental Protection Agency,Cincinnati, Ohio, pp. 1e32.
Vincent, S., Kotbi, A., Barbeau, B., 2010. Predicting hydroxylradical activity and trace contaminants removal in ozonatedwater. Ozone: Science and Engineering 32, 244e251.
Von Gunten, U., 2003. Ozonation of drinking water: part I.Oxidation kinetics and product formation. Water Research 37,1443e1467.
Widrig, D.L., Gray, K.A., McAuliffe, K.S., 1996. Removal of algal-derived organic material by preozonation and coagulation:monitoring changes in organic quality by pyrolysis-GC-MS.Water Research 30 (11), 2621e2632.
Wu, Z., Shen, H., Ondruschka, B., Zhang, Y., Wang, W.,Bremner, D.H., 2012. Removal of blue-green algae using thehybrid method of hydrodynamic cavitation and ozonation.Journal of Hazardous Materials 235-236, 152e158.
Zamyadi, A., Ho, L., Newcombe, G., Daly, R.I., Burch, M., Baker, P.,Prevost, M., 2010. Release and oxidation of cell-boundsaxitoxins during chlorination of Anabaena circinalis cells.Environmental Science and Technology 44, 9055e9061.
Zamyadi, A., Ho, L., Newcombe, G., Bustamante, H., Prevost, M.,2012a. Fate of toxic cyanobacterial cells and disinfection by-products formation after chlorination. Water Research 46,1524e1535.
Zamyadi, A., MacLeod, S.L., Fan, Y., McQuaid, N., Dorner, S.,Sauve, S., Prevost, M., 2012b. Toxic cyanobacterialbreakthrough and accumulation in a drinking water plant: amonitoring and treatment challenge. Water Research 46,1511e1523.
�Swietlik, J., Dabrowska, A., Raczyk-Stanisławiak, U., Nawrocki, J.,2004. Reactivity of natural organic matter fractions withchlorine dioxide and ozone. Water Research 38, 547e558.