Embed Size (px)
Citation preview
*The authors would also like to express their gratitude to the ACCA for funding thisproject. They are particularly grateful for the helpful comments and constructive criticismreceived from the Editor Nickolaos Travlos. The article benefited from discussions that havetaken place with many academics and practitioners. Particular mention should be made toRick Antle, Geoffrey Whittington, Richard Taffler, David Power, and Alasdair Lonie.
(Multinational Finance Journal, 1998, vol. 2, no. 1, pp. ??–??)© Multinational Finance Society, a nonprofit corporation. All rights reserved.
1
Ownership Structure, Managerial Turnoverand Takeovers: Further U.K. Evidence on the
Market for Corporate Control*
Jay DahyaUniversity of Wales College of Cardiff, U.K.
Ronan PowellQueen’s University of Belfast, Northern Ireland
This article investigates the impact that successful hostile and friendlytakeovers have on the rates of top management change for U.K. target firms.The results shows that hostile takeovers are associated with a greater degree ofboth top executive and top team forced departure rates compared to that offriendly takeovers. Furthermore, prior to takeover, hostile targets have lowerabnormal returns, lower profitability, higher debt, lower managerial ownershipand a high ownership stake held by external block holders relative to friendlytargets. The results give further support to the disciplining role of the hostiletakeover (JEL G3).
Key words: managerial control, hostile takeover, top management turnover,friendly takeover, ownership structure
I. Introduction
The threat of takeover, operationalized through the capital markets, isregarded by many as one of the key factors in maintaining goodmanagerial control. Several papers, predominately U.S. in origin, haveshown that takeovers, and hostile takeovers in particular, serve as auseful external control mechanism for removing managers who fail to
Multinational Finance Journal2
maximize firm value, e.g., Morck, Shleifer, and Vishny (1989); Martinand McConnell (1991); and Ikenberry and Lakonishok (1993). Thiscontrol is regarded by many as the single most important external factorin encouraging good managerial performance. Advocates of this viewsuggest that other mechanisms of managerial control, such as internalboard controls, the managerial labor market and product marketcompetition, are ineffective in encouraging the efficient management ofcorporations, e.g., Grossman and Hart (1980); and Rappaport (1990).When other mechanisms fail to influence managerial performance, theexternal market for corporate control comes into play and acts as a‘court of last resort’ (Jensen, 1988, p. 319).
In the U.S. literature, there is strong support for the role of thetakeover as an external check on managerial performance. Hostiletakeovers, in particular, are argued to be disciplinary in nature sincethey tend to be directed at poorly performing firms, where performanceis measured by stock market performance (Martin and McConnell,[1991]). Morck et al. (1989) find similar results on hostile takeoversusing stock market performance and Tobin’s q. Furthermore, theyidentify separate firm-specific and industry-specific effects. In contrast,U.K. research has failed to provide strong support for the discipliningmotive of the hostile takeover. For example, Franks and Mayer (1996)find that hostile bids in the U.K. do not appear to be directed at poorlyperforming firms. On the other hand, Kennedy and Limmack (1996)find poor prior performance to be mainly a characteristic of target firms.
A second approach often adopted in the literature for testing whetherthe market for corporate control provides an external check onmanagerial performance is to examine board turnover following thecompletion of the takeover especially in poorly performing firms. If keyboard members (e.g., CEO, managing director and finance director) areremoved after completion of the transaction, it is likely that the takeoverwas motivated by poor target managerial performance. Such takeoversare likely to be hostile, and hence, disciplinary in nature. Boardturnover research in the U.S. (Walsh [1988]; Martin and McConnell[1991]; Walsh and Ellwood [1991]; and Agrawal and Walkling [1994])find that successful takeovers trigger a forced restructuring of the boardin poorly performing target firms. Furthermore, the rate of managementturnover in successful takeovers is higher for hostile bids compared tofriendly bids, giving further support to the disciplining motive forhostile takeovers. In the U.K., Kennedy and Limmack (1996) find thatpoorly performing targets trigger successful takeovers and a subsequent

3Ownership Structure, Managerial Turnover
restructuring of the board. However, the authors make no distinctionbetween routine and forced top management changes. Franks andMayer (1996) find a forced restructuring of the target board followingsuccessful hostile takeovers. Moreover, unlike the previous authors,they find no evidence of significantly poor performance prior to theacquisition. A careful examination of the above articles reveals thatthey are not entirely comparable with those conducted in the U.S.A.Therefore, the conflicting U.K. results warrant additional research andthis article sheds more light on the subject by focussing on both topexecutive and top team forced departure rates by exploring thedifferences in the rates of top management changes following successfulhostile and friendly takeover bids. This article also tests whether (1)pre-bid market- and accounting-based performance measures (2) pre-bidgrowth in size, and (3) pre-bid changes in ownership characteristics intarget companies, are able to explain more precisely the differences inthe rates of top management change between successful hostile andfriendly takeover bids. A comparison of ownership structures betweenfriendly and hostile target firms is undertaken as an additional test onthe role of the market for corporate control.
The remainder of the article is organised as follows. The nextsection of the paper reviews the relevant corporate control literature.Section III describes the sample and data employed. Section IV reportsthe empirical results and section V concludes with a summary of themain points of the paper and avenues for future research.
II. Literature Review
This section reviews the literature concerning two main issues. First,a brief discussion is provided on the role and effectiveness of bothinternal and external control mechanisms on managerial control.Second, the literature on management turnover is reviewed withparticular reference to studies that have explored the link betweenmanagement turnover and firm performance. The section concludeswith testable propositions on the basis of this literature review.
A. Board of Directors as a Mechanism of Managerial Control
One of the primary responsibilities of the board of directors is tomonitor and assess their firm’s performance. The most striking actions

Multinational Finance Journal4
which can be taken by the board of directors (sometimes with the helpof majority shareholders) and even more vigorously by the boards ofacquiring firms in a takeover situation, is the dismissal of the CEOand/or other members of the top management team.
To perform this function effectively, the board of directors mustassume the task of extracting information about the true managerialperformance of the firm from noisy and sometimes disguised ormisleading financial performance measures. Both accounting andmarket-based measures are likely to be relatively useful indicators,though both of these measures may be determined in part by factorsbeyond the control of the firms managers; e.g., industry and economyeffects. Furthermore, these measures are likely to be prone to theinfluence of managerial inputs and outputs, which themselves mayprovide indicative information on managerial performance (Joskow andRose [1994]). In the U.S. and the U.K., managerial performance ismaintained (and agency problems limited) by the complementaryintervention of both internal and external control mechanisms (Franksand Mayer, [1996]). These mechanisms include: (1) monitoring andexerting an influence on control through the team of executive and non-executive directors on the board (Coughlan and Schmidt [1985];Weisbach [1988]); (2) the managerial labor market (Fama [1980]); (3)product market competition (Hart [1984]); and (4) the market forcorporate control (Jensen [1988]).
B. The Failure of Internal Control Mechanisms
The internal control mechanisms of corporations operate through theboard of directors, who generally maintain the power to hire and fire topmanagement. There is, however, considerable controversy on the roleof the board of directors in this governance process. Fama (1980) andFama and Jensen (1983) view the board as an important internalmechanism for disciplining incumbent management. Mace (1986), onthe other hand, questions the importance of the board and non-executivedirectors as monitors.
The importance of internal control mechanisms has increased in theU.S., due partially to legal and regulatory developments which havecurtailed activity in the market for corporate control (Jensen [1991]).Furthermore, in the U.K., a re-emphasis on the importance of goodinternal management controls followed the publication of the CadburyReport (1992) on corporate governance. There is, however, little
5Ownership Structure, Managerial Turnover
empirical evidence on the effectiveness of internal control mechanismsin generating improvements in firm performance. Denis and Denis(1996) note that, if internal control mechanisms are effective, then thereshould be a greater incidence of top management changes in poorlyperforming companies and improvements in firm performance followingchanges in management. Coughlan and Schmidt (1985) and Warner,Watts and Wruck (1988) document that top management change isinversely related to prior share price performance. Weisbach (1988)documents a stronger relationship between price and top managementchange for firms with a greater percentage of non-executive directors onthe board. These finding are consistent with the board acting as animportant mechanism for disciplining poorly performing managers.
When the internal processes for change in large corporations are tooslow and costly to implement the required management changes, themarket for corporate control quickly responds. Morck et al. (1989)finds that hostile takeovers tend to be directed at poorly performingindustries. In such cases, the hostile takeover seems to provide anefficient alternative to removing unresponsive managers when the boardis reluctant or unable to remove managers. Other constraints onmanagerial activity, such as, competition in the product or manageriallabor markets may encourage managers to behave in firm valuemaximizing ways. However, when these mechanisms fail the market forcorporate control may serve as a “court of last resort.”
C. Takeovers as a Mechanism of Managerial Control
The theory that underlies the functioning of the market for corporatecontrol can be traced back to Manne (1965), who was the first toarticulate the workings of a market for corporate control. Manne viewsthe takeover as a useful mechanism for encouraging mangers to pursueshareholder wealth maximization strategies. According to Mannecorporate control is a valuable asset actively traded on a market. Theoperation of this market depends upon the link between a firm’s shareprice and the performance of its management. Poor performancerelative to some benchmark causes a firm’s share price to fall below itsvalue under efficient management, allowing a transfer of control byencouraging takeover bids from prospective new management teams.
The nature of the bid as to whether it is hostile or friendly, willdepend upon the expected source of gains from the takeover. If thetakeover is primarily motivated to discipline poor managers,
Multinational Finance Journal6
1. Shleifer and Summers (1988) see the hostile takeover as a destructive element whichshould be restricted through tougher anti-trust legislation.
2. Some authors suggest that takeover defences are designed to shield incumbentmanagers from these forces, e.g., Jarrell, Brickley, and Netter (1989) and Sudarsanam (1995).
shareholders will benefit because new managers will invoke shareholderwealth maximizing strategies. A second view advances the notion thatgains are created through the various forms of synergy generatedthrough the combination of target and acquirer firms. Morck et al.(1988) show that friendly takeovers are more likely to be motivated bysynergy, whereas hostile takeovers are more likely to be aimed atdisciplining poorly performing top management.
The effectiveness of the hostile takeover as an external discipliningmechanism has, however, been subject to some dispute. This viewadvocates that takeovers in general only occur to satisfy managers ownself-interests, e.g., Williamson (1964) and Malatesta (1983). Under thisscenario, it is not apparent whether shareholders will benefit.Proponents of this position regard takeovers as a costly and imprecisesolution to managerial control problems.1
D. Top Management Turnover Around Takeovers
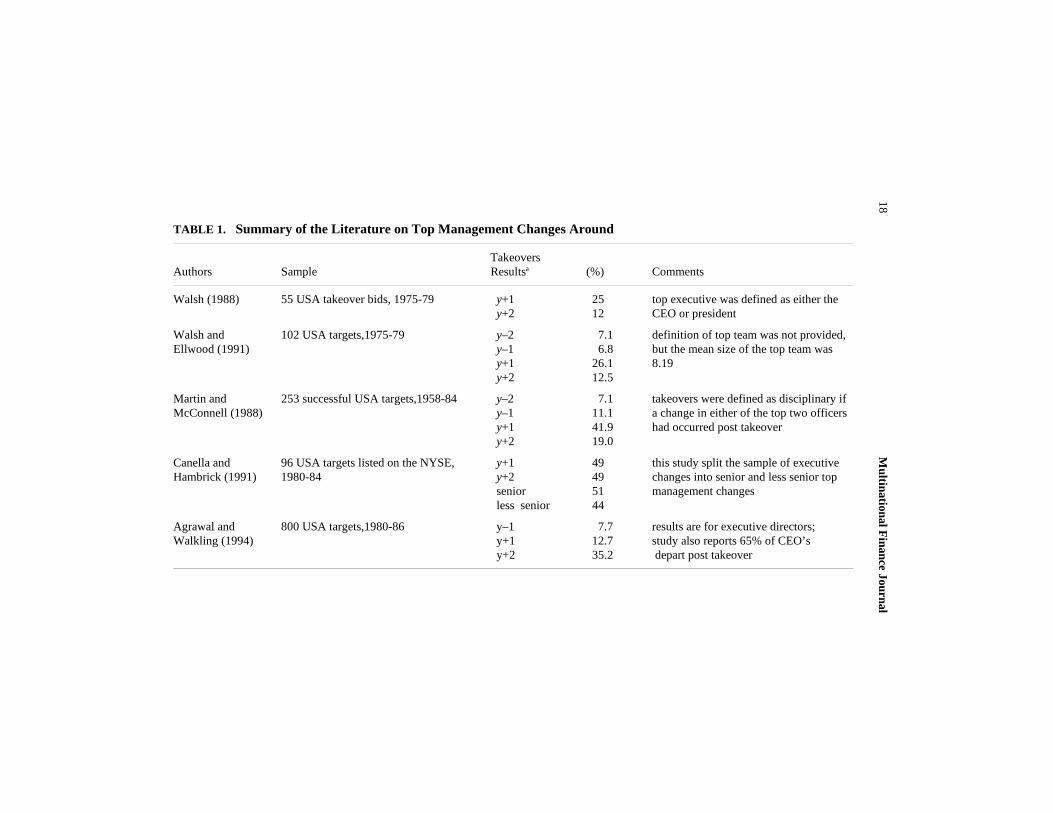
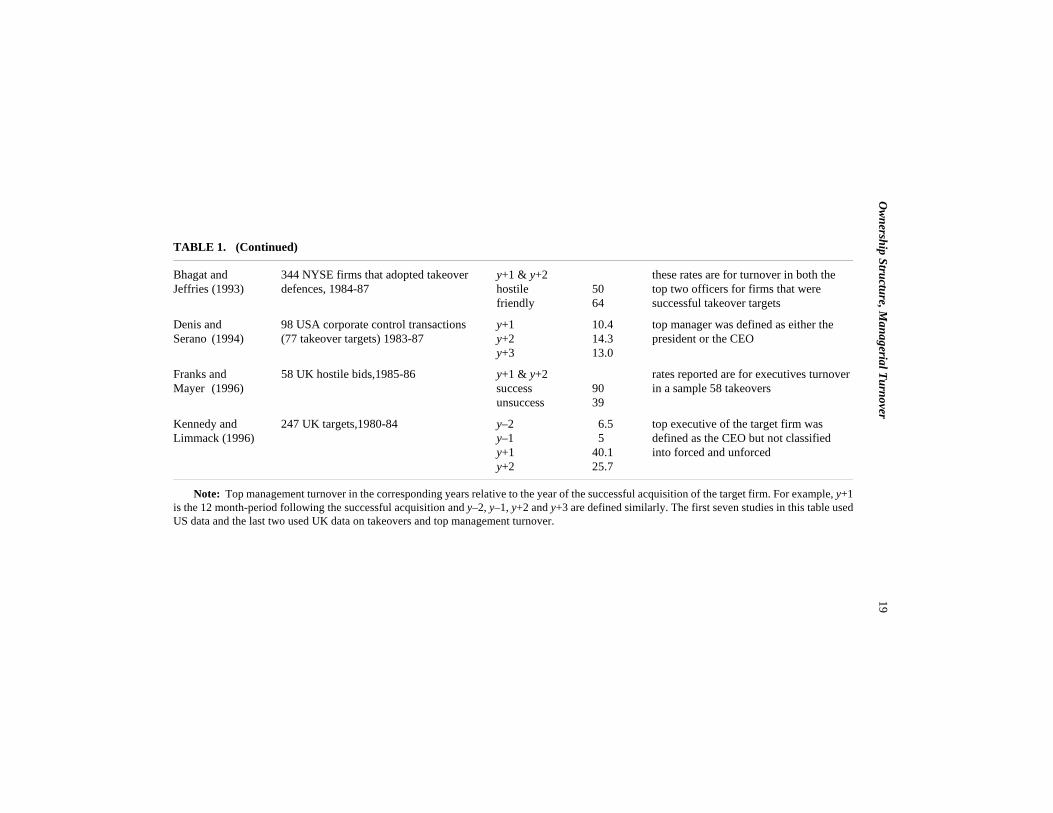
A vast literature suggests that takeovers serve to discipline poorperformers in the managerial ranks.2 Table 1 summarizes the U.S. andU.K. studies which have specifically examined top managementchanges around takeover bids. All these studies report a substantialincrease in the number of executives leaving the firm following asuccessful takeover bid, irrespective of the takeover type (hostile orfriendly) and of the post of the executive within the target firm’smanagement structure. To explore the latter point, the studies areclassified according to the post of the executive leaving the firm.
The first group includes those studies which report only thedeparture rates of top executives of the target firm following a takeoverbid. For the U.S. studies, Walsh (1988) reports a relatively low topexecutive departure rate of 37 percent for a sample of 55 takeover bids.This is not dissimilar to the departure rate of 27.3 percent reported byDenis and Serano (1996), for a sample of 77 takeover bids over a similar24-month period following the first announcement of the takeover bid.In contrast, Martin and McConnell (1991) found a departure rate of60.9% in the 2-year period following the first bid, for a change in either

7Ownership Structure, Managerial Turnover
of the top two officers of 253 firms which were takeover targetsbetween 1958 to 1984. Similar results to those reported by Martin andMcConnell (1991) are confirmed by Canella and Hambrick (1993), fora sample of 96 takeovers and Agrawal and Walkling (1994) for a largersample of 800 takeover bids. Both studies report departure rates of 51percent and 65 percent respectively in the 2-year period after theannouncement of the initial takeover bid. For the U.K., Kennedy andLimmack (1996) report a CEO departure rate of 65.84 percent, for asample of 247 firms subject to takeover.
The second group of studies in table 1 includes those which reportthe departure rates for all executive directors leaving the target firmfollowing the initial takeover bid. In this group, the U.S. studies ofWalsh and Ellwood (1991) report a 38.4 percent executive departurerate for a sample of 102 target firms over the 24 months following thefirst bid. Hambrick and Canella (1993) report a comparable 45 percentdeparture rate in their analysis of non-routine executive changes for 97firms, which had been successfully acquired over the period 1980 to1984. For the U.K., Franks and Mayer (1996) report a higher departurerate than both the U.S. studies with a 90 percent departure rate for allexecutives following only 35 successful takeovers during 1985 to 1986.
E. Performance and Top Management Turnover Around Takeovers
In addition to top management turnover rates following both hostile andfriendly takeovers several studies have examined pre-bid targetperformance. From a detailed examination of these studies, fourimportant results emerge: 1. Takeovers are generally associated with a high level of boardchanges following the first takeover bid. Furthermore, successfultakeovers, irrespective of whether they are hostile or friendly, tend tohave a higher management turnover rate than unsuccessful bids.2. Evidence in the U.S. and the U.K. show post-takeover restructuringof assets, particularly following successful hostile bids and to coincidewith the reshuffling of assets there is also evidence of post-takeoveremployee lay-offs.3. The extant empirical evidence suggests that takeovers in which thetop management of the target firm either departs or is dismissed ispreceded by poorer industry-adjusted share price performance relativeto takeovers in which the top manager does not leave the company.4. Target management response to a bid will depend upon the amount
Multinational Finance Journal8
of compensation they will receive whether they are founding familymembers or executives with large share stakes, furthermore, on thestatus they will be afforded in the merged company.
F. Propositions for Analysis
Based on the literature, several testable proposition are formed.
Proposition 1: Hostile takeovers lead to a greater forced topmanagement departure rate.
Top executive and top management team forced departure rates arereported for both hostile and friendly takeovers for the three years priorto the first bid date to one year following the first bid date. Examiningpre-takeover departure rates provides valuable information on thenormal or average management departure rates. Furthermore, it shouldalso provide some indication of the efficiency of internal managementcontrol mechanisms.
Proposition 2: Hostile takeovers are associated with worse pre-takeover performance compared to friendly takeovers.
Pre-takeover performance is measured by cumulative abnormal returns(CAR’s) and by the change in profitability (return on capital) prior totakeover for both hostile and friendly targets. Additional variables areemployed to capture other relevant attributes, such as resourceproblems, measured as the change in gearing and liquidity, and size,measured as the change in total assets and the change in total sales.Furthermore, the financial profile of the target is not examined inisolation, but is compared to that of it’s industry financial profile. Suchan approach follows closely to that of Morck et al. (1989) where anindustry-adjusted effect is shown to be important in explaining themechanism of corporate control.
Proposition 3: The managers of hostile target firms are associatedwith a lower equity stake in the firm than held by the directors infriendly targets prior to the first bid date.
The effectiveness of the takeover market to replace poorly performingmanagers will depend to a great deal on the ownership structure of the
9Ownership Structure, Managerial Turnover
firm. For example, if an executive director holds a substantial equitystake in the firm then the possibility of a hostile takeover may not be aviable option. Any acquisition attempt to remove poorly performingmanagers may therefore need to either be abandoned or come throughamicable negotiations.
III. Sample and Data
The aforementioned propositions are assessed using a sample of 262successful hostile and friendly takeovers covering the period 1989 to1992. The sample includes 38 hostile takeovers and 224 friendlytakeovers. The identification of the sample was based on theAcquisitions Monthly and the Stock Market Weekly Intelligence,published by the London Stock Exchange. In this article, a hostiletakeover is one in which the target management rejects the initial bid.All other bids are defined as friendly.
To examine the effectiveness of board monitoring mechanisms, wespecifically compare samples of top management changes that areforced with those that are mandatory retirements. However, Warner,Watts and Wruck (1988), Denis and Denis (1995) and Dahya (1997)noted that identification of forced departures can be difficult becausepublications by Stock Exchange news releases in the financial pressoften do not fully disclose the circumstances surrounding these eventsdue to possible litigation. To limit any errors from misclassification, wecross check all announcements. The data relating to managementturnover was initially gathered from Extel and the Corporate Register.Press reports in the Financial Times were also examined for details onany pre-bid management changes. Post-bid changes were not alwaysreadily available, therefore both Extel and reports in the FinancialTimes were used to identify any directors previously in the targetcompany departing from the merged entity. We therefore compareforced top management changes for which the stated reason is dismissal,resignation stepped down, personal reasons or due to poor performance- to those for which the stated reason for the change is mandatoryretirement. This procedure is consistent with two recent studies thatexamined the relation between ownership structure and top managementturnover (Denis and Sarin, 1998; Dahya, Lonie and Power, 1998). Anyoutstanding executives whose fate had not been accounted for werecross-checked with the Personnel Department of the acquiring firm.
Multinational Finance Journal10
3. Top management changes following a successful takeover can occur in variousforms. For example, the top management in the target firm can be (1) promoted to the boardof the acquirer, (2) retained in the same post with the same status, (3) demoted within thetargets board, and (4) fired from the targets board.
Attention now turns to the financial measures employed. Onemarket-based measure of prior share price performance as well as threesets of accounting variables are employed to capture the target firmsperformance, size and resource availability. Accounting-basedprofitability measure, return on capital employed and market-basedmeasure, cumulative abnormal returns, are used as a proxy for firmperformance. Total sales and total assets are employed as proxies forfirm size and resources availability is measured using a gearing (capital)and liquidity (quick assets) ratio. All variables are measured in termsof their change, measured from two year prior to the first bid date. Allvariables were extracted from Datastream.
For the 38 hostile targets, 31 had the necessary data. For the 224friendly targets, data was available for 183 firms. From this sample of183 friendly targets, a random sub-sample of 61 firms were selected forfurther empirical analysis. Data for a control sample of 35 non-targetfirms was also collected and analyzed further.
A. Measuring the Impact of Takeovers on Management Turnover
To measure the impact of takeovers (hostile and friendly) on targetmanagement turnover, attention is drawn to unexpected departures inthe following positions: (1) top executive changes (CEO or chairman);(2) top team changes (comprising, the top executive, the managingdirector or the finance director); and (3) a change in any of theexecutive directors.3
IV. Results
A. Management Turnover Around Takeovers
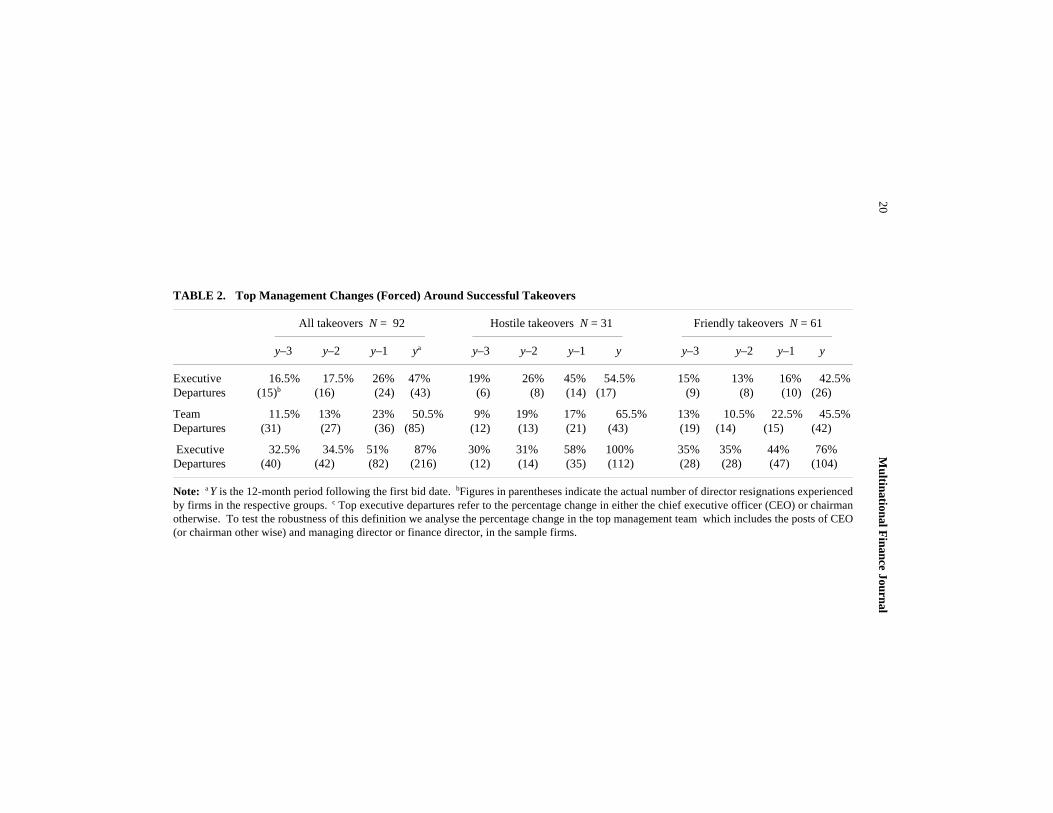
The results of our analysis of top management resignations following asuccessful takeover bid are reported in table 2. The results reported arefor the proportion of companies, which experienced resignations afterhostile and friendly takeovers of top executives, top team, etc.
In general, for the sample of 92 target firms, 47 percent experienced
11Ownership Structure, Managerial Turnover
a change in the top executive category following a successful takeover.In contrast, the rate of top executive change was only 16.5 and 17.5percent for y–3 and y–2. Surprisingly, the rate of 26 percent in y–1, is8 percent greater then that experienced in y–3, suggesting top executivedepartures increase prior to the first bid by the acquirer. This may, inretrospect, be capturing the complementary functioning of the vigilanceof the board of directors and also the first stage in the operation of themarket for corporate control, whereby information about the likelihoodof a bid results in a greater degree of monitoring by the board. Thispattern is also evident in top team and executive director departures.
When our sample of 92 targets is partitioned according to whetherthe initial bid was hostile or friendly, three distinct results emerge.First, both groups report top executive and top team turnover ratesbelow 26 percent in y–3 and y–2, while in y–1, the sample of hostiletargets report a substantially higher rate of departures in two out of thethree groupings. For example, the proportion of companies whichexperienced top executive departures for the hostile group is 45 percent,which is 29 percent higher than the sample of friendly targets. Second,the rate of top executive departures of 54.5 percent in the 12-monthpost-takeover period for hostile targets is 9.5 percent greater than theproportion experienced in the previous twelve months. Furthermore, therate nearly triples for friendly targets. Finally, all hostile targetsexperienced at least one executive change following the first bid, whileonly 76 percent of the friendly targets experienced a directorresignation. The latter set of results seems to suggest that followinghostile takeovers, acquiring companies seem to perform a greater degreeof disciplining at all levels compared to friendly takeovers. Thesefindings are consistent with those reported in the U.S. studies of Walsh(1988), Martin and McConnell (1991), Walsh and Ellwood (1991),Agrawal and Walkling (1994) and they are in line with the U.K.findings of Franks and Mayer (1996). Also, based on the presentfindings, the U.K. results of Kennedy and Limmack (1996) do not seemto be affected by the lack of distinction between forced and unforced topmanagement changes.
B. Pre-bid Financial Characteristics
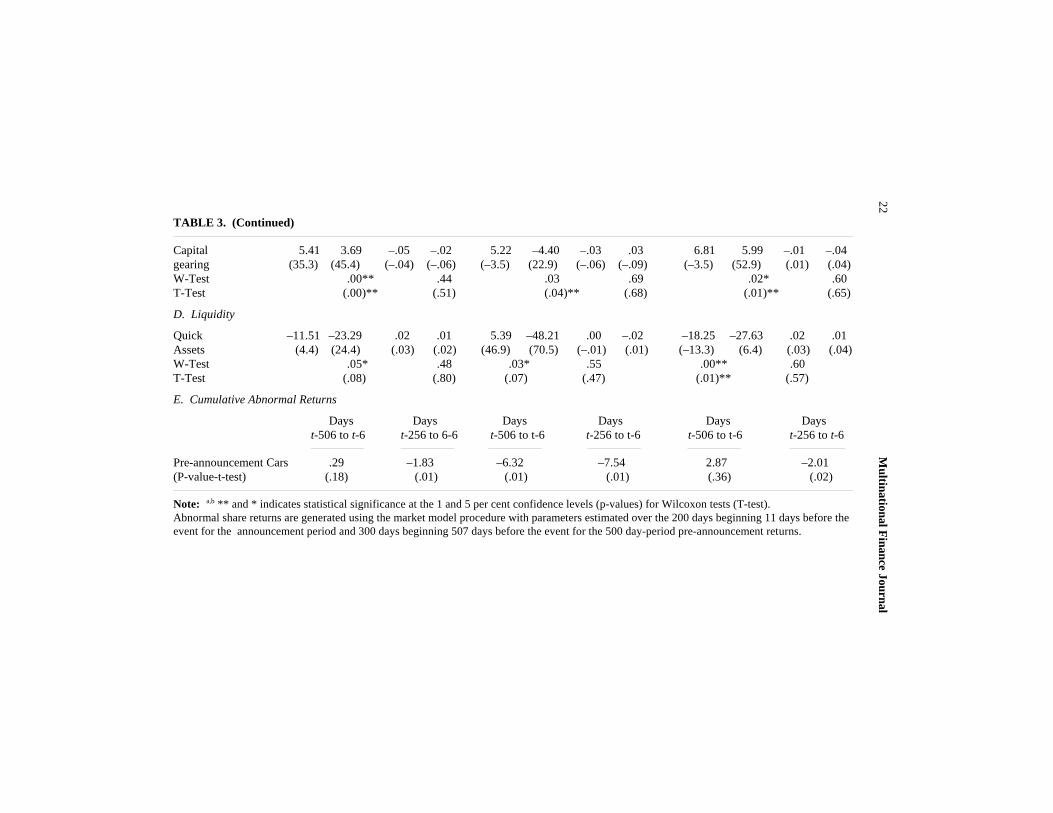
Table 3 reports the pre-bid CAR’s and the growth in the median (mean)over y–2 to y–1 and y –1 to y, in size, profitability, gearing and liquidityfor the sample of 92 successful takeovers and both hostile and friendly
Multinational Finance Journal12
groups. For the total sample, both size measures (total sales and totalassets) and capital gearing show abnormally large levels of growth inboth y –2 to y –1 and y–1 to y, which are statistically significant at the5 percent level using both the Wilcoxon test and the t-test. Target firmsin general, report negative pre-takeover growth in profitability in the 12months preceding the first bid announcement and also exhibit poorgrowth in their liquidity levels. These findings agree with the findingsrecorded by Kennedy and Limmack (1996), but contrast with thosereported by Franks and Mayer (1996). A possible reason for thedifferences in the findings between Franks and Mayer’s results withKennedy and Limmack’s and our findings could be due to the existenceof internal corporate governance structures which may deter hostiletakeovers from taking place even when firms are exhibiting lacklustreperformance.
When the pre-takeover profitability and share price performance ofthe two sub-groups (hostile and friendly) in table 3 is analyzed, severalinteresting results concerning the dissimilarity in performance patternsemerges. Hostile takeovers report the most dramatic decline inprofitability, of almost 22 percent in the 12 months prior to theannouncement of the first bid, while friendly takeovers experience alower decline of only 13 percent over the same period. Both groupsalso report a substantial decline in the availability of liquid funds andCAR’s over the same 12-month period. This result intuitively supportsthe notion postulated by Morck et al. (1989) that hostile takeovers aremore likely to exhibit poorer pre-takeover performance than friendlytakeovers. Even when both the industry-adjusted growth in accountingprofits as well as market-based returns is examined, hostile takeoversseem to report a poorer growth level than friendly takeovers in the 12months preceding the takeover.
Both hostile and friendly takeovers also report a significant growthin their (unadjsuted) size over both pre-takeover periods. Interestingly,pre-takeover growth levels in (unadjsuted) size for both y–2 to y–1 andy–1 to y found in the sample of hostile targets are consistently largerthan for the sample of friendly targets. This provides some support forthe hypothesis that acquiring firm managers select high growth targetsin order to enhance their own companies growth potential.
Finally, friendly takeovers in both pre-takeover periods increasedtheir levels of indebtedness at a statistically significant level, whilehostile targets were surprisingly, found to lower their levels of debt inthe period immediately preceding the takeover. When the industry-
13Ownership Structure, Managerial Turnover
4. A disciplinary motive in friendly takeovers cannot be ruled out since one in four topexecutives of friendly targets depart following the first bid announcement.
5. The data and analyses for the control sample of 35 firms were not disclosed nordiscussed in the main text to restrict the overall length of the paper. Three main results
adjusted growth in capital gearing is examined, it is apparent thatfriendly targets were actually raising their debt levels at a rate whichwas well below the rate at which firms in the whole industry raised theirindebtedness. On the other hand, hostile targets generally display agrowth level in debt in excess of the industry norm in the 12 month pre-takeover period.
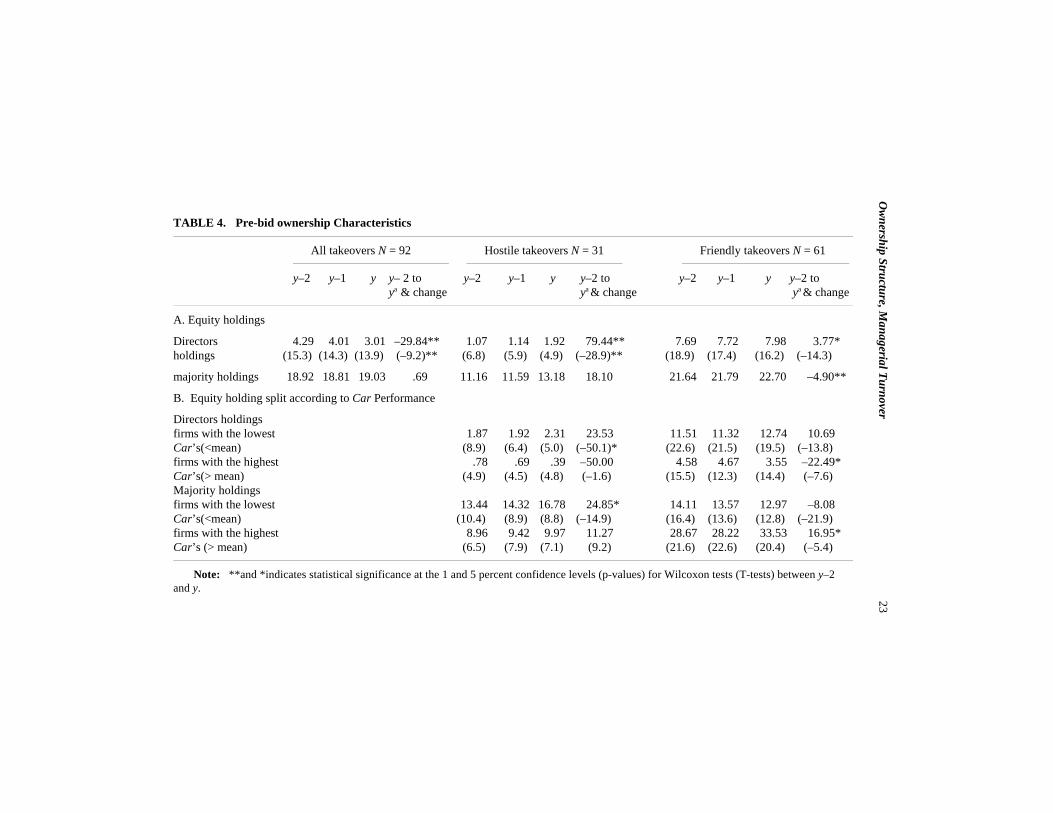
C. Pre-bid Ownership Characteristics
Even though performance may be poor for target firms, hostiletakeovers may not be possible when, for example, top executives areeither entrenched with a substantial equity stake in the firm and or whenthere are no significant external block-holders maintaining a largeequity stake in the firm. This section examines changes in the pre-bidlevels of ownership characteristics. Table 4 presents the pre-takeoverchanges in the levels of directors holding and majority holdings for bothfriwndly and target firms.
Among both hostile and friendly targets, there is a significantdifference in the directors holdings and in the proportion of shares heldby the majority external shareholders. Executives in friendly targets arereported to hold 7.98 percent of the shares in their own firm, whiledirectors of hostile targets only hold a meagre 1.92 percent. As regardsthe largest holding for each takeover group, 22.7 percent of the friendlytargets shares were held by the majority shareholder, who in almost halfof the cases was also a director of the company. On the other hand, themajority external shareholder in the sample of hostile takeovers onlyheld around 11-13 percent of the shares of the target in the pre-takeoverperiod. These results compare favourably to those reported by Morcket al. (1989), who also found friendly takeovers were associated withexecutives with large share stakes in the company.
The combination of results on internal board and external majorityholdings, provide tentative evidence to suggest that friendly takeoverbids are targeted at firms in which management are entrenched with alarge shareholding in the target firm and they are not threatened by theexistence of large external block-holders. Under such circumstances,gaining control via a hostile bid would be difficult.4,5,6

Multinational Finance Journal14
emerge from this data. First, the average top management team turnover rate was only 9%.Second, these firms recorded a steady growth in firm size, profitability and liquidity over thesame period. Finally, the mean change in the ownership of the directors (over the 2 year-period) was only 3.25%.
6. Following the suggestion of an anonymous referee, a multinomial-logit model wasused to predict overall/forced/friendly turnover probabilities by the pre bid characteristics oftargets as explanatory variables; the procedure is similar to the one employed in Huson,Parrino and Starks (1998). Three principle findings emerged from this analysis. First, theprobability of overall management turnover was not significantly related to prior industry-adjusted profitability, share price performance, and managerial equity ownership. Second,once all turnovers were dichotomised into homogenous groups according to the nature of thetop management change (i.e. retirements and forced departures), a different picture emerged.The probability of forced management turnover was inversely related to prior performance,and management equity ownership at the 95 percent confidence interval. Finally, as onemight have anticipated, the probability of routine retirements was not related to priorperformance or managerial equity ownership. The findings of this model are qualitativelysimilar to those reported in tables 3 and 4.
V. Summary And Avenues for Further Research
This paper examined the impact of successful takeover bids, hostile andfriendly, on target management turnover. It extends prior work on thesubject by considering the differences in the turnover rates for differentpositions within the top management structure and by explaining thedifferences in management resignations experienced by hostile andfriendly takeovers in their post-bid period. In addition, this studyemploys both pre-bid market- and accounting-based performancemeasures and corporate governance characteristics to help explain thedifferences in post-takeover top management departure rates. Ourresults provide evidence that hostile takeovers are associated with agreater degree of top management disciplining at all ranks compared tofriendly takeovers. Other findings suggest that (1) Hostile targets havepoorer pre-takeover profitability compared to friendly takeovers (evenwhen CAR’s and industry-adjusted profitability are examined) (2)Hostile targets have rising debt levels prior to takeover, at a rate whichis above the industry norm (while, friendly takeovers raise their gearingin accordance with levels below the industry norm) (3) Hostile targetmanagement tend to hold an unsubstantial proportion of equity in thefirm, while directors in friendly targets tend to be highly entrenchedand/or there are no significant external blockholders maintaining a largestake in the firm, and (4) Takeovers in general, appear to be targeted athigh growth firms, providing some evidence for the growth related
15Ownership Structure, Managerial Turnover
explanations for takeovers.The major implications of this study are (1) hostile takeovers in the
U.K. tend to be disciplinary in nature only when executives hold ameagre equity stake in the firm and are directed at financially fragilefirms who seem to be managed in a lacklustre fashion, as evidenced bypoor pre-bid market- and accounting-based performance, and (2) manytargets of hostile acquisitions are those firms who maintain higher thanaverage growth prospects.
References
Agrawal, A., and Walkling, R. 1994. Executive careers and compensationsurrounding takeover bids. Journal of Finance 49: 985-1014.
Bhagat, S., and Jefferis, R. 1995. Corporate performance, governance anddiscipline: The impact of defensive activity of takeovers and managerialturnover. Working Paper. Graduate School of Business, University ofColorado.
Coughlan, A., and Schmidt, R. 1985. Executive compensation, managerialturnover and firm performance: An empirical investigation. Journal ofAccounting and Economics 7: 43-66.
Datta, D.; Pinches, G.; and Narayan, V. 1992. Factors influencing wealthcreation from mergers and acquisitions: A meta analysis. StrategicManagement Journal 13: 67-84.
Denis, D., and Denis, D. 1995. Performance changes following topmanagement dismissals. Journal of Finance 50: 1029-1057.
Denis, D., and Serano, J. 1996. Active investors and management turnoverfollowing unsuccessful control contests. Journal of Financial Economics40: 239-266.
Fama, E. 1980. Agency problems and the theory of the firm. Journal ofPolitical Economy 88: 288-307.
Fama, E., and Jensen, M. 1983. Separation of ownership and control. Journalof Law and Economics 26: 301-325.
Franks, J., and Mayer, C. 1990. Takeovers, capital markets and corporatecontrol: A study of France, Germany and the U.K. Economic Policy: AEuropean Forum 10: 189-231.
Franks, J., and Mayer, C. 1996. Hostile takeovers and the correction ofmanagerial failure. Journal of Financial Economics 40: 163-181.
Grossman, S., and Hart, O. 1980. Takeover bids, the free rider problem, and thetheory of the corporation. Bell Journal of Economics 11: 42-64.
Hambrick, D., and Canella, A. 1993. Relative standing: A framework forunderstanding departures of acquired executives. Academy of ManagementJournal 36: 733-762.

Multinational Finance Journal16
Herzel, L., and Shepro, R. 1990. Bidders and Targets: Mergers andAcquisitions in the US. Blackwell, Oxford.
Hirshleifer, D., and Thakor, A. 1991. Managerial performance, boards ofdirectors and takeover bidding. Working paper, Anderson Graduate Schoolof Management, UCLA.
Ikenberry, D., and Lakonishok, J. 1993. Corporate governance through theproxy contest: Evidence and implications. Journal of Business 66: 405-436.
Jarrell G.; Brickley, J.; and Netter, J. 1989. The market for corporate control:The empirical evidence from three decades. Journal of Law and Economics23: 371-407.
Jenkinson, M., and Mayer, C. 1992. Hostile Takeovers. Macmillan: London.Jensen, M. 1988. The takeover controversy: Analysis and evidence. In Coffee,
J. Lowenstein, L. and Ackerman, R. (eds.), Knights, Raiders and Targets:The Impact of the Hostile Takeover. Oxford University Press: Oxford.
Jensen, M. 1991. Corporate control and the politics of finance. Journal ofApplied Corporate Finance 4: 13-33.
Jensen, M., and Ruback, R. 1983. The market for corporate control: Thescientific evidence. Journal of Financial Economics 11: 5-50. Kennedy, V., and Limmack, R. 1996. Takeover activity, CEO turnover, andthe market for corporate control. Journal of Business Finance andAccounting 23: 267-293.
Mace, M. 1986. Directors, Myth and Reality. Harvard Business School Press:Boston MA.
Mahate, A., and Sudarsanam, P. 1996. Takeover bids and their impact onanalysts forecasts of target earnings. Working Paper, City UniversityBusiness School, London.
Malatesta, P. 1983. The wealth effect of merger activity and the objectivefunctions of merging firms. Journal of Financial Economics 11: 155-181.
Manne, H. 1965. Mergers and the market for corporate control. Journal ofPolitical Economy 73: 110-120.
Martin, K., and McConnell, J. 1991. Corporate performance, corporatetakeovers and management turnover. Journal of Finance 46: 671-687.
Morck, R.; Shleifer, A.; and Vishny, R. 1988. Characteristics of targets ofhostile and friendly takeovers. In Auerbach, A. (ed.) Corporate Takeovers:Causes and Consequences. University of Chicago Press: Chicago: 101-129.
Morck, R.; Shleifer, A.; and Vishny, R. 1989. Alternative mechanisms forcorporate control. Amercian Economic Review 79: 842-852.
Morck, R.; Shleifer, A.; and Vishny, R. 1990. Do managerial objectives drivebad acquisitions? Journal of Finance 45: 31-48.
Rappaport, A. 1990. The staying power of the public corporation. HarvardBusiness Review 1: 96-104.
Salter, M. and Weinhold, W. (1988), corporate takeovers: financial boom ororganisational bust?. in Coffee, J., Lowenstein, L., and Rose-Ackermann,R. (eds.), Knights, Raiders and Targets. Oxford University Press: New
17Ownership Structure, Managerial Turnover
York, 135-149.Shleifer, A., and Summers, L. 1988. Breach of trust in hostile takeovers. in
Auerbach, A. (ed.), Corporate Takeovers: Causes and Consequences.University of Chicago Press: Chicago.
Sudarsanam, P. 1995. The Essence of Mergers and Acquisitions: Prentice-Hall.Walkling, R., and Long, M. 1991. Agency theory, managerial welfare, and
takeover resistance. Rand Journal of Economics Spring: 54-68.Walsh, J. 1988. Top management turnover following mergers and acquisitions.
Strategic Management Journal 9: 173-183.Walsh, J., and Ellwood, J. 1991. Mergers, acquisitions and the pruning of
managerial deadwood. Strategic Management Journal 12: 201-217.Warner, J.; Watts, R.; and Wruck, K. 1988. Stock prices and top management
changes. Journal of Financial Economics 20: 461-92.Weisbach, M. 1988. Outside directors and CEO turnover. Journal of Financial
Economics 20: 431-460.Williamson, O. 1964. The Economics of Discretionary Behaviour: Managerial
Objectives in a Theory of the Firm. Englewoods Cliffs: Prentice-Hall.
Multinational F
inance Journal18
TABLE 1. Summary of the Literature on Top Management Changes Around
TakeoversAuthors Sample Resultsa (%) Comments
Walsh (1988) 55 USA takeover bids, 1975-79 y+1 25 top executive was defined as either the y+2 12 CEO or president
Walsh and 102 USA targets,1975-79 y–2 7.1 definition of top team was not provided,Ellwood (1991) y–1 6.8 but the mean size of the top team was
y+1 26.1 8.19y+2 12.5
Martin and 253 successful USA targets,1958-84 y–2 7.1 takeovers were defined as disciplinary ifMcConnell (1988) y–1 11.1 a change in either of the top two officers
y+1 41.9 had occurred post takeovery+2 19.0
Canella and 96 USA targets listed on the NYSE, y+1 49 this study split the sample of executiveHambrick (1991) 1980-84 y+2 49 changes into senior and less senior top
senior 51 management changesless senior 44
Agrawal and 800 USA targets,1980-86 y–1 7.7 results are for executive directors;Walkling (1994) y+1 12.7 study also reports 65% of CEO’s
y+2 35.2 depart post takeover
19O
wnership Structure, M
anagerial Turnover
TABLE 1. (Continued)
Bhagat and 344 NYSE firms that adopted takeover y+1 & y+2 these rates are for turnover in both theJeffries (1993) defences, 1984-87 hostile 50 top two officers for firms that were
friendly 64 successful takeover targets
Denis and 98 USA corporate control transactions y+1 10.4 top manager was defined as either the Serano (1994) (77 takeover targets) 1983-87 y+2 14.3 president or the CEO
y+3 13.0
Franks and 58 UK hostile bids,1985-86 y+1 & y+2 rates reported are for executives turnover Mayer (1996) success 90 in a sample 58 takeovers
unsuccess 39
Kennedy and 247 UK targets,1980-84 y–2 6.5 top executive of the target firm wasLimmack (1996) y–1 5 defined as the CEO but not classified
y+1 40.1 into forced and unforcedy+2 25.7
Note: Top management turnover in the corresponding years relative to the year of the successful acquisition of the target firm. For example, y+1is the 12 month-period following the successful acquisition and y–2, y–1, y+2 and y+3 are defined similarly. The first seven studies in this table usedUS data and the last two used UK data on takeovers and top management turnover.
Multinational F
inance Journal20
TABLE 2. Top Management Changes (Forced) Around Successful Takeovers
All takeovers N = 92 Hostile takeovers N = 31 Friendly takeovers N = 61
y–3 y–2 y–1 ya y–3 y–2 y–1 y y–3 y–2 y–1 y
Executive 16.5% 17.5% 26% 47% 19% 26% 45% 54.5% 15% 13% 16% 42.5%Departures (15)b (16) (24) (43) (6) (8) (14) (17) (9) (8) (10) (26)
Team 11.5% 13% 23% 50.5% 9% 19% 17% 65.5% 13% 10.5% 22.5% 45.5%Departures (31) (27) (36) (85) (12) (13) (21) (43) (19) (14) (15) (42)
Executive 32.5% 34.5% 51% 87% 30% 31% 58% 100% 35% 35% 44% 76%Departures (40) (42) (82) (216) (12) (14) (35) (112) (28) (28) (47) (104)
Note: a Y is the 12-month period following the first bid date. bFigures in parentheses indicate the actual number of director resignations experiencedby firms in the respective groups. c Top executive departures refer to the percentage change in either the chief executive officer (CEO) or chairmanotherwise. To test the robustness of this definition we analyse the percentage change in the top management team which includes the posts of CEO(or chairman other wise) and managing director or finance director, in the sample firms.

21O
wnership Structure, M
anagerial Turnover
TABLE 3. Pre-bid Financial Characteristics
All takeovers N = 92 Hostile takeovers N = 31 Friendly takeovers N = 61
Firm Industry-adjusted Firm Industry-adjusted Firm Industry-adjusted
y–2 y–1 y–2 y–1 y–2 y–1 y–2 y–1 y–2 y–1 y–2 y–1to y–1 to ya to y–1 to y to y–1 to y to y–1 to y to y–1 to y to y–1 to y
A. Size
Total Assets 15.21 10.72 18.08 14.21 14.39 9.65(42.4) (29.5) (61.3) (29.5) (18.3) (21.6)
W-Test. .06 .39 .01**T-Test (.03)* (.21) (.02)*Total 5.63 10.65 25.21 19.25 18.39 9.52Sales (57.2) (32.5) (70) (49.3) (46.5) (12.9)
W-Test (.00)** (.00)** (.00)**T-Test (.00)** (.05)** (.01)*
B. Profitability
Return on .14 –19.3 .04 .02 10.08 –21.75 –.01 .03 –9.67 –12.97 .02 .04capital Employed (35.7) (–10.2) (.03) (.04) (90.4) (–50.5) (–.08) (.06) (–4.01) (13.2) (.03) (.02)W-Test .13 .05* .64 .01** .09 .42T-Test (.11) (.35) (.59) .04* .07 .75
C. Gearing
Multinational F
inance Journal22
TABLE 3. (Continued)
Capital 5.41 3.69 –.05 –.02 5.22 –4.40 –.03 .03 6.81 5.99 –.01 –.04gearing (35.3) (45.4) (–.04) (–.06) (–3.5) (22.9) (–.06) (–.09) (–3.5) (52.9) (.01) (.04)W-Test .00** .44 .03 .69 .02* .60T-Test (.00)** (.51) (.04)** (.68) (.01)** (.65)
D. Liquidity
Quick –11.51 –23.29 .02 .01 5.39 –48.21 .00 –.02 –18.25 –27.63 .02 .01Assets (4.4) (24.4) (.03) (.02) (46.9) (70.5) (–.01) (.01) (–13.3) (6.4) (.03) (.04)W-Test .05* .48 .03* .55 .00** .60T-Test (.08) (.80) (.07) (.47) (.01)** (.57)
E. Cumulative Abnormal Returns
Days Days Days Days Days Dayst-506 to t-6 t-256 to 6-6 t-506 to t-6 t-256 to t-6 t-506 to t-6 t-256 to t-6
Pre-announcement Cars .29 –1.83 –6.32 –7.54 2.87 –2.01(P-value-t-test) (.18) (.01) (.01) (.01) (.36) (.02)
Note: a,b ** and * indicates statistical significance at the 1 and 5 per cent confidence levels (p-values) for Wilcoxon tests (T-test).Abnormal share returns are generated using the market model procedure with parameters estimated over the 200 days beginning 11 days before theevent for the announcement period and 300 days beginning 507 days before the event for the 500 day-period pre-announcement returns.
23O
wnership Structure, M
anagerial Turnover
TABLE 4. Pre-bid ownership Characteristics
All takeovers N = 92 Hostile takeovers N = 31 Friendly takeovers N = 61
y–2 y–1 y y– 2 to y–2 y–1 y y–2 to y–2 y–1 y y–2 to ya & change ya & change ya & change
A. Equity holdings
Directors 4.29 4.01 3.01 –29.84** 1.07 1.14 1.92 79.44** 7.69 7.72 7.98 3.77*holdings (15.3) (14.3) (13.9) (–9.2)** (6.8) (5.9) (4.9) (–28.9)** (18.9) (17.4) (16.2) (–14.3)
majority holdings 18.92 18.81 19.03 .69 11.16 11.59 13.18 18.10 21.64 21.79 22.70 –4.90**
B. Equity holding split according to Car Performance
Directors holdingsfirms with the lowest 1.87 1.92 2.31 23.53 11.51 11.32 12.74 10.69Car’s(<mean) (8.9) (6.4) (5.0) (–50.1)* (22.6) (21.5) (19.5) (–13.8)firms with the highest .78 .69 .39 –50.00 4.58 4.67 3.55 –22.49*Car’s(> mean) (4.9) (4.5) (4.8) (–1.6) (15.5) (12.3) (14.4) (–7.6)Majority holdingsfirms with the lowest 13.44 14.32 16.78 24.85* 14.11 13.57 12.97 –8.08Car’s(<mean) (10.4) (8.9) (8.8) (–14.9) (16.4) (13.6) (12.8) (–21.9)firms with the highest 8.96 9.42 9.97 11.27 28.67 28.22 33.53 16.95*Car’s (> mean) (6.5) (7.9) (7.1) (9.2) (21.6) (22.6) (20.4) (–5.4)
Note: **and *indicates statistical significance at the 1 and 5 percent confidence levels (p-values) for Wilcoxon tests (T-tests) between y–2and y.

Multinational Finance Journal24