Embed Size (px)
DESCRIPTION
Managerial Ownership Capital Structure and Firm Value- Evidence
Citation preview
Australasian Accounting,Business and Finance Journal
Volume 5Issue 3 Australasian Accounting Business and FinanceJournal
Article 6
Managerial Ownership, Capital Structure and FirmValue: Evidence from China’s Civilian-run FirmsWenjuan RuanMurdoch University
Gary TianUniversity of Wollongong
Shiguang MaUniversity of Wollongong, [email protected]
Follow this and additional works at: http://ro.uow.edu.au/aabfjCopyright ©2011 Australasian Accounting Business and Finance Journal and Authors.
Research Online is the open access institutional repository for theUniversity of Wollongong. For further information contact the UOWLibrary: [email protected]
Recommended CitationRuan, Wenjuan; Tian, Gary; and Ma, Shiguang, Managerial Ownership, Capital Structure and FirmValue: Evidence from China’s Civilian-run Firms, Australasian Accounting, Business and FinanceJournal, 5(3), 2011, 73-92.Available at:http://ro.uow.edu.au/aabfj/vol5/iss3/6
Managerial Ownership, Capital Structure and Firm Value: Evidence fromChina’s Civilian-run Firms
AbstractThis paper examines the influence of managerial ownership on firm performance through capital-structurechoices, using a sample of China’s civilian-run firms listed on the Chinese stock market between 2002 and2007. The empirical results demonstrate a nonlinear relationship between managerial ownership and firmvalue. Managerial ownership drives the capital structure into a nonlinear shape, but in an opposite direction tothe effect of managerial ownership on firm value. The results of simultaneous regressions suggest thatmanagerial ownership affects capital structure, which in turn affects firm value. Our findings imply that the“interest convergence” and “entrenchment” effects of managers’ behaviour in terms of managerial ownershipcan also explain the agency-relevant situation of China’s civilian-run firms.
Keywordsera2015
This journal article is available in Australasian Accounting, Business and Finance Journal: http://ro.uow.edu.au/aabfj/vol5/iss3/6

73
Managerial Ownership, Capital Structure and Firm Value: Evidence from China’s Civilian-run Firms
Wenjuan Ruan1, Gary Tian2 and Shiguang Ma2,3
Abstract This paper examines the influence of managerial ownership on firm performance through capital-structure choices, using a sample of China’s civilian-run firms listed on the Chinese stock market between 2002 and 2007. The empirical results demonstrate a nonlinear relationship between managerial ownership and firm value. Managerial ownership drives the capital structure into a nonlinear shape, but in an opposite direction to the effect of managerial ownership on firm value. The results of simultaneous regressions suggest that managerial ownership affects capital structure, which in turn affects firm value. Our findings imply that the “interest convergence” and “entrenchment” effects of managers’ behaviour in terms of managerial ownership can also explain the agency-relevant situation of China’s civilian-run firms. Key words: Managerial ownership, Capital structure, Firm value, Civilian-run firms JEL classification: G31; G32, G34
1 Murdoch University, Australia 2 University of Wollongong, Australia 3 [email protected]
AAFBJ | Volume 5, no 3, 2011
74
Introduction The effects of managerial ownership on firm value have been of particular research interest in the corporate finance literature (Denis & McConnell 2003). Most commentators concur that managers’ and shareholders’ interests are not fully aligned. This conflict of interest produces agency problems that reduce firm value. Thus, an increase of managerial ownership helps to connect the interests of insiders and shareholders, and leads to better decision-making and higher firm value. However, when the equity owned by management reaches a certain level, further increase of managerial ownership may provide managers with sufficient shares to pursue their own benefit without concern for decreasing firm value. When managerial ownership approaches a considerably high level, the agency problem can be largely mitigated due to the full alignment between the interests of managers and shareholders. Therefore, it is hypothesised that managerial ownership and firm value have a nonlinear relationship (Cho 1998; McConnell & Servaes 1990; Morck, Shleifer & Vishny 1988).
Most of the cited literature focuses on the relationship between managerial shareholding and firm performance in the developed market. Because of the absence of essential legal protections and appropriate governance mechanisms, agency problems in many emerging markets are relatively more severe than those found in developed markets (La Porta et al. 1998; Wei, Xie & Zhang 2005). Claessens and Djankov (1999) examined the relationship between management equity incentives and firm performance for 706 Czech firms and found that profitability changes in human capital are quite important in bringing about improved corporate performance in transition economies. Bunkanwanicha, Gupta and Rokhim (2008) investigated the relationship between debt, managerial behavior and firm performance in Thai and Indonesian markets. Their results highlight the importance of the country-specific institutional settings in managerial ownership-related agency problems.
The Chinese securities market emerged with the establishment of the Shanghai Stock Exchange in 1990 and the Shenzhen Stock Exchange in 1991. During the first few years after the markets opened, most listed companies came from state-owned enterprises; later, many non-state-owned companies were also listed on the market. Generally, China’s firms are categorised according to the dominant ownership, for example, a “state-owned firm” means that the company is dominantly owned by the state; a “civilian-run firm” is dominantly owned and run by civilians, rather than by the central or local government.
One of the unique characteristics of the present Chinese market is the rapidly growing number of civilian-run firms. The listed companies from non-government enterprises have appeared since 1992 on the Shenzhen Security Exchange (the first being Shen Huayuan A, stockcode 000014). An average of only six civilian-run companies acquired listing qualification each year between 1992 and 1997, but after 1998 the listing of civilian-run companies accelerated. The proportion of civilian-run companies listed through initial public offerings (IPOs) was 6.97 per cent by the end of 2003, and this increased to 15.38 per cent by the end of 2005. By 2007 the total number of civilian-run listed companies was 410, representing 26.53 per cent of a total of 1,545 firms on Shanghai and Shenzhen stock exchanges.4 These data provide evidence that civilian-run firms may represent the trend and shape of public firms in the continuing economic reform of China.
Although managerial ownership is one of the ways that Chinese companies adopt Western corporate governance, the proportion of managerial ownership is quite small among state-owned companies, with a mean value during 2002–2007 of just 0.0929 per cent; in contrast, the mean value of managerial ownership for civilian-run companies was 9.31 per
4 See: http://www.chinareform.org.cn/ (in Chinese).
Ruan, Tian & Ma: Managerial Ownership, Capital Structure & Firm Value
75
cent. Compared to state-owned enterprises, civilian-run firms have much more autonomy and profit retention, and managers are more often appointed on merit and ability, rather than political patronage. Most civilian-run firms adopt a managerial-ownership governance approach, and their managers have more power to choose financial policies compared to those in many developed countries. This situation gives managers of civilian-run firms more discretion over funding, pricing and labor practices (Firth, Fung & Rui 2006). Thus, our study of the Chinese market may shed light on this relevant financial issue within a non-Western environment, thereby providing new, relevant information about how to improve the efficiency of corporate governance in an emerging, transitional economy.
By using Ordinary Least Squares (OLS) regression, this study duplicates the nonlinear relationship between managerial ownership and firm value described in the research by Cho (1998) and Morck et al. (1988). However, we also found that the turning points of managerial ownerships of Chinese civilian-run companies with respect to firm value have moved upward. For example, the turning points of companies in developed countries occurred at 5 per cent and 25 per cent in Morck et al. (1988) and at 7 per cent and 38 per cent in Cho (1998). In contrast, our regression results show that they occur at 18 per cent and 64 per cent of managerial ownership. We therefore argue that in the Chinese corporate-governance context, managers need more ownership to control the firm for their own benefits, and then need much more ownership to be motivated to align their own benefit with shareholders’ interests. Therefore, the two turning points are greater in Chinese civilian-run listed companies compared to those in firms in developed markets.
While managerial ownership drives capital structure as a nonlinear shape, due to managerial entrenchment (Berger, Ofek & Yermack 1997; Friend & Lang 1988), the directions of the nonlinear shapes for managerial ownership and firm value, and for managerial ownership and capital structure, are inversely related. This study also found that the direct influence of managerial ownership on firm value becomes insignificant when capital structure is taken into consideration. The results from simultaneous regressions show that managerial shareholding significantly affects capital structure, which in turn affects firm value. The results of simultaneous equations also show that capital structure is endogenously determined as being in equilibrium in Chinese civilian-run listed companies.
The remaining parts of this paper are organised as follows. Section 2 contains a literature review and hypothesis development about the relationships between managerial ownership, debt policy and firm value. Section 3 explains the sample selection and interprets the summary statistics. Section 4 provides the empirical specifications and results, and also discusses the methodology and robustness tests. Section 5 concludes this research.
Literature Review and Hypothesis Development One of the examples of pioneering research on the relationship between managerial ownership and firm value is Morck et al. (1988). The authors used piecewise linear regressions to estimate the relationship between Tobin’s Q and the shareholdings of the board of directors for 371 Fortune 500 firms in 1980. They found a positive relationship between ownership and Q in the 0 to 5 per cent board-ownership range, and in the range beyond 25 per cent, which is dominated by the convergence-of-interest effect. They also found a negative, though less pronounced, relationship in the 5 to 25 per cent range, in which the entrenchment effect succeeds the convergence-of-interest effect. McConnell and Servaes (1990) used regression on Tobin’s Q with the fraction of shares owned by corporate insiders for firms between 1976 and 1986, and found a curvilinear relationship between managerial ownership and firm value. Miguel, Pindado and Torre (2004) and Short and Keasey (1999) studied the association between management ownership and corporate value using the data of
AAFBJ | Volume 5, no 3, 2011
76
UK and Spanish firms respectively, and came to a similar conclusion. Davies, Hillier and McColgan (2005) echo the above investigations, but that work extended the specification of management holdings from cubic to quintic, and found a similar nonlinear relationship between managerial ownership and firm value.
These examples in the literature constitute the foundation of the research on entrenchment and the convergence-of-interest effect arising from managerial ownership and firm valuation. However, they focus largely on the relationship between managerial shareholding and firm value in developed economies. Debate on whether such a relationship has universal relevance in corporations within emerging markets still requires further evidence. Several recent articles have studied corporate governance in emerging (or transition-economy) markets, focusing on the relationship between ownership structure and firm value (Bunkanwanicha et al. 2008; Claessens & Djankov 1999; Lins 2003; Wei et al. 2005). These studies found a nonlinear relationship between managerial ownership and firm value in many emerging markets, revealing that management and insiders have the ability to engage in the expropriation of other shareholders’ benefits. At low levels of managerial ownership, an increase in management equity holding closely aligns with the interests of managers and shareholders, thereby increasing corporate value. However, at relatively high levels of managerial ownership, an increase in management equity shareholding makes management more entrenched and less subject to market discipline, thereby reducing corporate value (Cho 1998). When managerial ownership reaches a considerably high level, the interest between managers and shareholders are fully aligned. At this level, management pursues best firm performance, and firm value is increased. Thus we submit the first hypothesis in this study:
H1: There is a nonlinear “N” shape relationship between managerial ownership and firm value for Chinese civilian-run firms that represents the change of the alignment between managers’ interests and shareholder’s wealth, in terms of managerial ownership level. The issue of how managerial ownership affects corporate value is also important.
Brailsford, Oliver and Pua (2002) argued that corporate managers and external block owners are two key groups of shareholders with a powerful influence on the decisions in a firm’s resource allocation. Cho (1998) discussed the impact of managerial ownership on firm performance, and thus firm value, as a product of the way shareholding motivates management to make investment decisions for their own or for shareholders’ benefit.
Leverage choice is another important financial decision. It has various effects on firm value, which have been proven in classical corporate financial literature (Jensen 1986: Modigliani & Miller 1963; Myers 1977; Ross 1977). Ruan, Tian and Ma (2009) employed a relatively recent data set that comprised S&P 500 firms. They observed that capital structure can act as an intermediate variable affected by managerial ownership, but eventually influences firm value. Therefore, the following discussion aims to clarify another two points: first, the relationship between managerial ownership and capital structure; and second, the relationship between capital structure and firm value.
The theoretical evidence about how managerial behaviour influences financing choices has emerged only since the middle of the last decade. Zwieble (1996) developed a model in which managers choose debt for their own empire-building. Novaes (2003) set up a managerial model to explore how self-interested managers expropriate firm value via the tool of leverage.
The empirical support for entrenchment that results from managerial ownership affecting leverage decisions is quite limited. Friend and Lang (1988) examined whether managerial entrenchment induced by insiders’ equity holding motivates capital structure decisions, “at least in part”, on a successive-year basis. Berger et al. (1997) used cross-
Ruan, Tian & Ma: Managerial Ownership, Capital Structure & Firm Value
77
sectional analysis to find evidence that firm leverage is affected by the degree of managerial entrenchment and of entrenched managers' debt-avoidance. Brailsford et al. (2002) used evidence from Australia to produce a nonlinear relationship between the level of equity stake owned by insiders and capital structure measured by the debt-to-equity ratio, and supported the effects of convergence-of-interest and management entrenchment.
When the level of managerial ownership is low, an increase in managerial ownership has the effect of aligning management and shareholders’ interests (Brailsford et al. 2002). Managers' main objective is to maximise shareholders’ wealth and achieve higher firm performance by using less debt to avert financial distress. Thus, a negative relationship exists between managerial ownership and capital structure (Berger et al. 1997). However, as managers become entrenched with significant voting power and influence, they can begin to manipulate the debt ratio to achieve self-interests. For example, they may increase debt to obtain more cash to make suboptimum investment decisions, or build a “management empire”. However, when corporate managers hold a considerable proportion of a firm’s shares, managers’ own interests can be aligned with those of shareholders. The entrenchment effect decreases, resulting in reduced debt ratio as managers seek to reduce bankruptcy risks; or alternatively, the agency-related benefits from the use of debt are substituted through managerial ownership.
With the rapid development of civilian-run companies and the implementation of managerial ownership governance in the Chinese market, greater focus is required on the issue of how managerial behaviour in accordance with shareholder ownership influences firms’ financing behaviour. On the basis of theoretical analysis and empirical evidence from the literature, we propose the following hypothesis:
H2: A nonlinear “inversed N” shaped relationship exists between managerial ownership and capital structure in Chinese civilian-run firms, which represents the change of managers’ incentive motivated by their ownership. Much of the relevant research indicates that the relationship between managers and
shareholders has the potential to influence financial decision-making, which in turn affects firm value (McConnell & Servaes 1990; Miguel et al. 2004; Morck et al. 1988; Short & Keasey 1999). Corporate insiders in Chinese listed companies often gain control over a firm by swinging the votes their way, but also through offering non-pecuniary benefits, such as company-paid consumption or building up a “management empire”. Thus, we argue that agency problems in Chinese civilian-run listed companies are more severe due to the emerging market environment. Our third hypothesis is:
H3: Managerial ownership affects capital structure, which in turn affects firm value for Chinese civilian-run firms. Since the seminal research by Jensen and Meckling (1976), the relationship between
capital structure and firm performance has been a prevalent issue in the financial literature. Corporate-governance theory predicts that financial leverage influences agency costs, and thus corporate value. Some commentators suggest that greater financial leverage could help mitigate agency costs via the threat of acquisition and financial distress (Grossman & Hart 1982; Williams 1987). Morck et al. (1988) found that leverage has a negative — but insignificant — impact on corporate value, and attribute this to the possibility that managers in highly leveraged firms might hold a higher than average level of ownership (Davies et al. 2005). Demsetz and Villalonga (2001) interpreted the negative association between leverage and firm value as being due to the relative inflation between now and when companies issued much of their debt. McConnell and Servaes (1995) investigated equity ownership and the effectiveness of leverage choice to find a “two-faced” relationship between firm value and debt. They conjecture that corporate value is positively correlated with the level of debt financing for firms with few growth opportunities, while firm valuation is negatively
AAFBJ | Volume 5, no 3, 2011
78
correlated with the debt level for those with high growth opportunities. However, in reality, firms with good growth opportunities are normal in a fast-growing country such as China (Wu & Yue 2009). Chinese civilian-run listed companies can be considered as having more growth opportunities not only because of their GDP contribution, but also due to their high performance output.5 Therefore, a negative relationship should exist between capital structure and firm value in Chinese civilian-run listed companies, and thus our fourth hypothesis is:
H4: Capital structure negatively affects firm value in Chinese civilian-run listed companies. A large block of literature regarding the determinants of capital structure considers
firm value to be an important factor influencing corporate capital structure (Korajczyk & Levy 2003; Ozkan 2001; Titman & Wessels 1988). These mixed results in prior studies have impelled academics to test whether a reverse causation exists between performance and capital structure that reflects the endogeneity of capital structure. Berger and Patti (2006) employed a simultaneous equation model to research the possibility of reverse causality from firm value to capital structure in the banking industry. They used profit efficiency as an indicator of firm value and acquired satisfactory effect, which was not only economically significant and statistically significant, but also confirmed by a number of robustness checks. This study also examined the endogeneity of capital structure when researching managerial ownership, capital structure and firm valuation.
Data and Statistics This study defines civilian-run listed enterprises as the companies ultimately controlled by an individual or a legal person rather than central or local government, as compared with the state or a government-related legal person or other ownership type. Sample selection starts from all Chinese civilian-run listed firms on the Shanghai Stock Exchange and the Shenzhen Stock Exchange between 2002 and 2007. The sample period starts from 2002, as 2001 was when Chinese companies implemented the New Accounting Standards and Policies. The sample time ends before 2008, which was when the global financial crisis emerged and the Chinese stock market fell sharply. Therefore the sample period was selected to mitigate the influences of shifting accounting standards and financial crises.
In 2005 the China Securities Regulatory Commission launched its reform of non-tradable shares, which influenced the ownership structure of listed firms. This study investigates the mean percentage of tradable shares in listed companies, which increased from 41.53 per cent in 2005 to 47.61 per cent in 2006, 52.88 per cent in 2007 and 59.01 per cent in 2008. At the same time, the mean managerial ownership in civilian-run listed firms were almost the same: at 9.88 per cent in 2005, 10.21 per cent in 2006, 10.07 per cent in 2007 and 10.09 per cent in 2008. Therefore we consider that the reform of non-tradable shares from 2005 cannot alter our evidence from data from 2002 to 2007.
We excluded from our modelling ST and PT6 firms, firms in financial and insurance industry and firms with incomplete datasets. The final sample consists of 197 civilian-run
5 For example, in every year between 2000 and 2008, civilian-run (both publicly and non-publicly traded firms) companies’ gross industrial output was more than 20 per cent of the value of all Chinese companies’ outputs. However, the proportion contributed by state-owned enterprises (both publicly and non-publicly traded firms) made up less than 10 per cent of total output, as computed by the relevant data from http://www.stats.gov.cn/ (in Chinese). The other 70 per cent come from companies dominated by collective ownership, foreign owner, township owner etc. 6 Chinese listed firms with financial distress are classified by the China Securities Regulatory Commission as “special treatment” (ST) or “particular transfer” (PT) firms for the purpose of protecting investors’ benefits. If a listed firm has negative profits for two consecutive years, it is designated as an ST firm. If it continues to
Ruan, Tian & Ma: Managerial Ownership, Capital Structure & Firm Value
79
firms listed between 2002 and 2007; this is an unbalanced panel dataset with 723 firm-year observations. All the data were extracted from the China Centre for Economic Research (CCER) database developed by the Beijing Sinofin Information Service Limited Company. However, we made some necessary enhancements of the data from the annual reports from the Shanghai Stock Exchange and the Shenzhen Stock Exchange websites.
This study uses Holderness's (2003) definition of managerial ownership, in which it means the percentage of equity owned by insiders and block holders, where insiders are defined as the officers and directors of a firm. Cho (1998) defines insider ownership as "the fraction of shares, not including options, held by officers and directors of the board” (p. 106). Davies et al. (2005) consider managerial ownership as having a stake in all board members’ shareholdings. Corporate boards have the power to make, or at least ratify, all important financial policies, and therefore it is plausible that board members with appropriate stock ownership have the incentive to provide effective monitoring and oversight of important corporate decisions (Bhagat & Bolton 2008). Therefore, this study uses the ownership stake of all board members as a proxy of managerial ownership. We also use leverage ratio (total debt divided by total assets) as a measurement of capital structure. Tobin’s Q defines a ratio of the market value of a company’s stock divided by the value of a company’s equity book value, and can help to capture whether the value of a firm as an operational business is greater than the cost of the assets required to generate its cash flow (Hovey et al. 2003). This study uses Tobin’s Q as a proxy of firm value, following the finance and accounting literature (see for example, Davies et al. 2005; Hovey et al. 2003; McConnell & Servaes 1990, 1995; Morck et al. 1988).
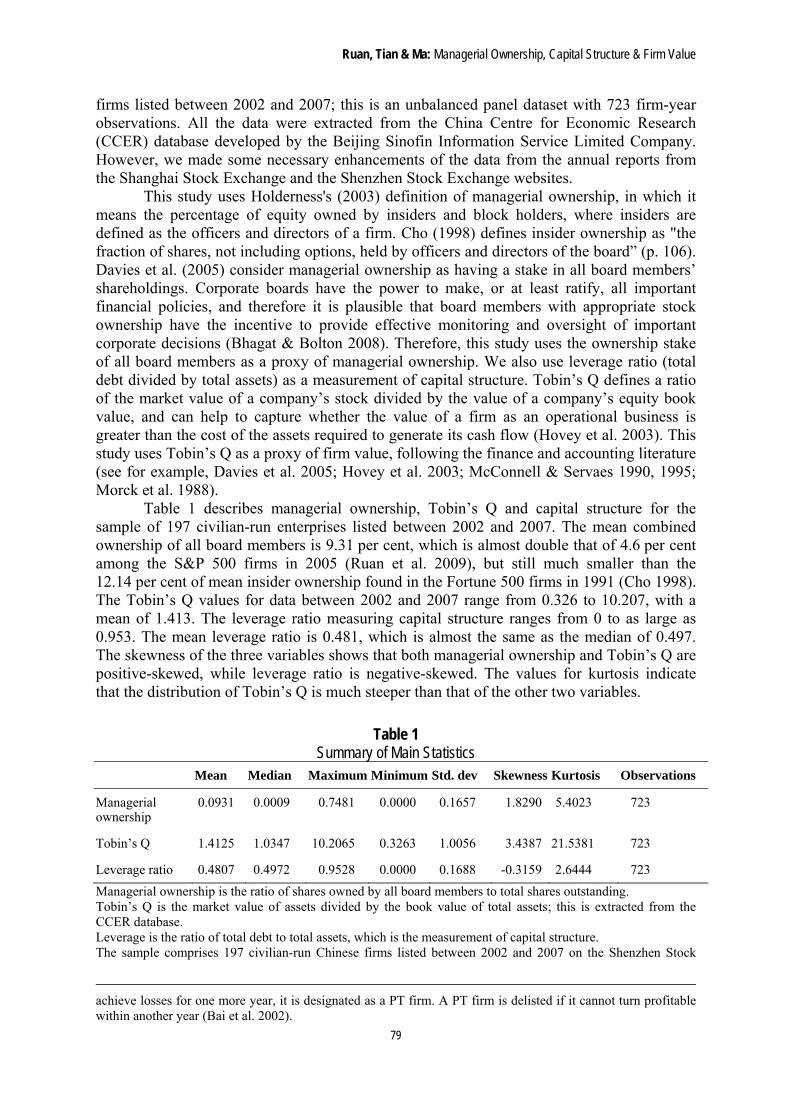
Table 1 describes managerial ownership, Tobin’s Q and capital structure for the sample of 197 civilian-run enterprises listed between 2002 and 2007. The mean combined ownership of all board members is 9.31 per cent, which is almost double that of 4.6 per cent among the S&P 500 firms in 2005 (Ruan et al. 2009), but still much smaller than the 12.14 per cent of mean insider ownership found in the Fortune 500 firms in 1991 (Cho 1998). The Tobin’s Q values for data between 2002 and 2007 range from 0.326 to 10.207, with a mean of 1.413. The leverage ratio measuring capital structure ranges from 0 to as large as 0.953. The mean leverage ratio is 0.481, which is almost the same as the median of 0.497. The skewness of the three variables shows that both managerial ownership and Tobin’s Q are positive-skewed, while leverage ratio is negative-skewed. The values for kurtosis indicate that the distribution of Tobin’s Q is much steeper than that of the other two variables.
Table 1 Summary of Main Statistics
Mean Median Maximum Minimum Std. dev Skewness Kurtosis Observations
Managerial ownership
0.0931 0.0009 0.7481 0.0000 0.1657 1.8290 5.4023 723
Tobin’s Q 1.4125 1.0347 10.2065 0.3263 1.0056 3.4387 21.5381 723
Leverage ratio 0.4807 0.4972 0.9528 0.0000 0.1688 -0.3159 2.6444 723
Managerial ownership is the ratio of shares owned by all board members to total shares outstanding. Tobin’s Q is the market value of assets divided by the book value of total assets; this is extracted from the CCER database. Leverage is the ratio of total debt to total assets, which is the measurement of capital structure. The sample comprises 197 civilian-run Chinese firms listed between 2002 and 2007 on the Shenzhen Stock
achieve losses for one more year, it is designated as a PT firm. A PT firm is delisted if it cannot turn profitable within another year (Bai et al. 2002).
AAFBJ | Volume 5, no 3, 2011
80
Exchange and the Shanghai Stock Exchange. There are 723 firm-year observations in total.
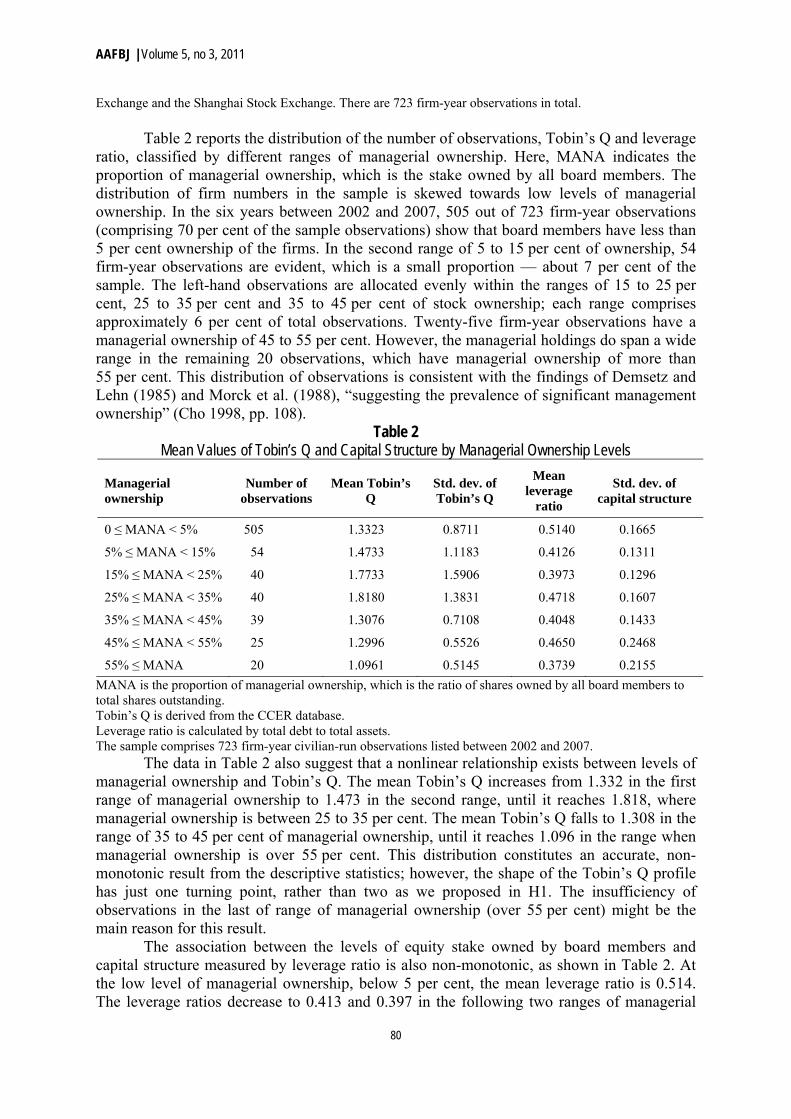
Table 2 reports the distribution of the number of observations, Tobin’s Q and leverage ratio, classified by different ranges of managerial ownership. Here, MANA indicates the proportion of managerial ownership, which is the stake owned by all board members. The distribution of firm numbers in the sample is skewed towards low levels of managerial ownership. In the six years between 2002 and 2007, 505 out of 723 firm-year observations (comprising 70 per cent of the sample observations) show that board members have less than 5 per cent ownership of the firms. In the second range of 5 to 15 per cent of ownership, 54 firm-year observations are evident, which is a small proportion — about 7 per cent of the sample. The left-hand observations are allocated evenly within the ranges of 15 to 25 per cent, 25 to 35 per cent and 35 to 45 per cent of stock ownership; each range comprises approximately 6 per cent of total observations. Twenty-five firm-year observations have a managerial ownership of 45 to 55 per cent. However, the managerial holdings do span a wide range in the remaining 20 observations, which have managerial ownership of more than 55 per cent. This distribution of observations is consistent with the findings of Demsetz and Lehn (1985) and Morck et al. (1988), “suggesting the prevalence of significant management ownership” (Cho 1998, pp. 108).
Table 2 Mean Values of Tobin’s Q and Capital Structure by Managerial Ownership Levels
Managerial ownership
Number of observations
Mean Tobin’s Q
Std. dev. of Tobin’s Q
Mean leverage
ratio
Std. dev. of capital structure
0 ≤ MANA < 5% 505 1.3323 0.8711 0.5140 0.1665
5% ≤ MANA < 15% 54 1.4733 1.1183 0.4126 0.1311
15% ≤ MANA < 25% 40 1.7733 1.5906 0.3973 0.1296
25% ≤ MANA < 35% 40 1.8180 1.3831 0.4718 0.1607
35% ≤ MANA < 45% 39 1.3076 0.7108 0.4048 0.1433
45% ≤ MANA < 55% 25 1.2996 0.5526 0.4650 0.2468
55% ≤ MANA 20 1.0961 0.5145 0.3739 0.2155
MANA is the proportion of managerial ownership, which is the ratio of shares owned by all board members to total shares outstanding. Tobin’s Q is derived from the CCER database. Leverage ratio is calculated by total debt to total assets. The sample comprises 723 firm-year civilian-run observations listed between 2002 and 2007.
The data in Table 2 also suggest that a nonlinear relationship exists between levels of managerial ownership and Tobin’s Q. The mean Tobin’s Q increases from 1.332 in the first range of managerial ownership to 1.473 in the second range, until it reaches 1.818, where managerial ownership is between 25 to 35 per cent. The mean Tobin’s Q falls to 1.308 in the range of 35 to 45 per cent of managerial ownership, until it reaches 1.096 in the range when managerial ownership is over 55 per cent. This distribution constitutes an accurate, non-monotonic result from the descriptive statistics; however, the shape of the Tobin’s Q profile has just one turning point, rather than two as we proposed in H1. The insufficiency of observations in the last of range of managerial ownership (over 55 per cent) might be the main reason for this result.
The association between the levels of equity stake owned by board members and capital structure measured by leverage ratio is also non-monotonic, as shown in Table 2. At the low level of managerial ownership, below 5 per cent, the mean leverage ratio is 0.514. The leverage ratios decrease to 0.413 and 0.397 in the following two ranges of managerial
Ruan, Tian & Ma: Managerial Ownership, Capital Structure & Firm Value
81
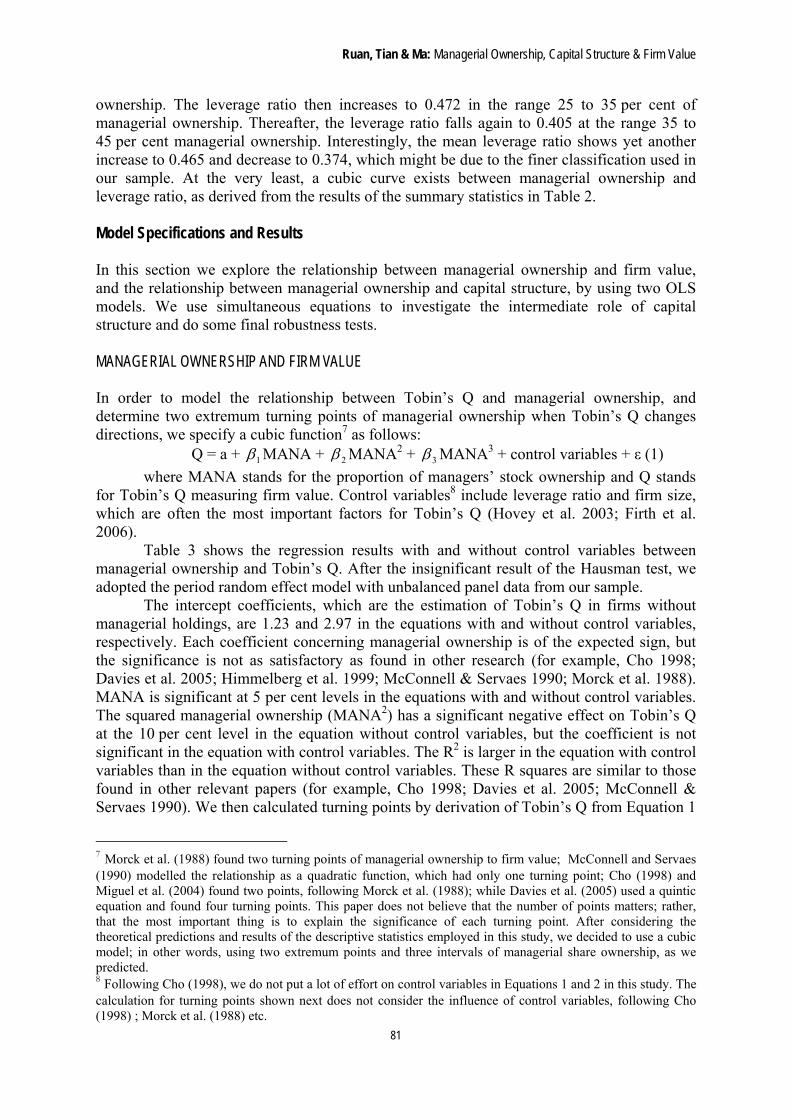
ownership. The leverage ratio then increases to 0.472 in the range 25 to 35 per cent of managerial ownership. Thereafter, the leverage ratio falls again to 0.405 at the range 35 to 45 per cent managerial ownership. Interestingly, the mean leverage ratio shows yet another increase to 0.465 and decrease to 0.374, which might be due to the finer classification used in our sample. At the very least, a cubic curve exists between managerial ownership and leverage ratio, as derived from the results of the summary statistics in Table 2.
Model Specifications and Results In this section we explore the relationship between managerial ownership and firm value, and the relationship between managerial ownership and capital structure, by using two OLS models. We use simultaneous equations to investigate the intermediate role of capital structure and do some final robustness tests. MANAGERIAL OWNERSHIP AND FIRM VALUE In order to model the relationship between Tobin’s Q and managerial ownership, and determine two extremum turning points of managerial ownership when Tobin’s Q changes directions, we specify a cubic function7 as follows:
Q = a + 1 MANA + 2 MANA2 + 3 MANA3 + control variables + ε (1)
where MANA stands for the proportion of managers’ stock ownership and Q stands for Tobin’s Q measuring firm value. Control variables8 include leverage ratio and firm size, which are often the most important factors for Tobin’s Q (Hovey et al. 2003; Firth et al. 2006).
Table 3 shows the regression results with and without control variables between managerial ownership and Tobin’s Q. After the insignificant result of the Hausman test, we adopted the period random effect model with unbalanced panel data from our sample.
The intercept coefficients, which are the estimation of Tobin’s Q in firms without managerial holdings, are 1.23 and 2.97 in the equations with and without control variables, respectively. Each coefficient concerning managerial ownership is of the expected sign, but the significance is not as satisfactory as found in other research (for example, Cho 1998; Davies et al. 2005; Himmelberg et al. 1999; McConnell & Servaes 1990; Morck et al. 1988). MANA is significant at 5 per cent levels in the equations with and without control variables. The squared managerial ownership (MANA2) has a significant negative effect on Tobin’s Q at the 10 per cent level in the equation without control variables, but the coefficient is not significant in the equation with control variables. The R2 is larger in the equation with control variables than in the equation without control variables. These R squares are similar to those found in other relevant papers (for example, Cho 1998; Davies et al. 2005; McConnell & Servaes 1990). We then calculated turning points by derivation of Tobin’s Q from Equation 1
7 Morck et al. (1988) found two turning points of managerial ownership to firm value; McConnell and Servaes (1990) modelled the relationship as a quadratic function, which had only one turning point; Cho (1998) and Miguel et al. (2004) found two points, following Morck et al. (1988); while Davies et al. (2005) used a quintic equation and found four turning points. This paper does not believe that the number of points matters; rather, that the most important thing is to explain the significance of each turning point. After considering the theoretical predictions and results of the descriptive statistics employed in this study, we decided to use a cubic model; in other words, using two extremum points and three intervals of managerial share ownership, as we predicted. 8 Following Cho (1998), we do not put a lot of effort on control variables in Equations 1 and 2 in this study. The calculation for turning points shown next does not consider the influence of control variables, following Cho (1998) ; Morck et al. (1988) etc.
AAFBJ | Volume 5, no 3, 2011
82
with respect to managerial ownership. The two equation turning points without control variables are:
MANA = 17.5 per cent MANA = 64.3 per cent
Table 3 Results of OLS on Tobin’s Q with Managerial Ownership between 2002 and 2007
Constant MANA MANA2 MANA3 Leverage ratio
Size Industrydummy
R2 F-statistic
Panel observations
1.2346
(5.27)***
2.3664
(2.07)**
-8.6090
(-1.77)*
7.0211
(1.38) 0.008 1.982 723
2.9666
(3.84)***
2.7402
(2.35)**
-7.3924
(-1.50)
3.0382
(0.59)
-0.4586
(-2.64)**
-0.1497
(-1.72)* yes 0.032 4.658 723
***, ** and * represent significance at the 1%, 5% and 10% levels, respectively. Panel observations are unbalanced between 2002 and 2007. Tobin’s Q is the dependant variable. MANA stands for managerial ownership. MANA2 and MANA3 are the quadratic and cubic terms of MANA.
As we predicted, Tobin’s Q first increases when managerial ownership is less than 17.5 per cent; it then declines until managerial shareholding reaches 64.3 per cent. Finally, Tobin’s Q rises again slightly as managerial ownership reaches over 64.3 per cent. This result validates Hypothesis 1.
As an N shape, this nonlinear tendency is consistent with the results of Cho (1998) and Morck et al. (1988); however, the turning points are different. Morck et al. (1988) used a piecewise regression on a sample of Fortune 500 firms and found two extremum values of managerial ownership at 5 and 25 per cent. Cho (1998) also used a grid-searching technology with a sample of Fortune 500 firms and found turning points of managerial ownership at 7 and 38 per cent. Miguel et al. (2004) used unbalanced panel data of 135 Spanish companies and found two turning points at 35 and 70 per cent.
The sample differences in firms and study period may explain the variation in the pairs of turning points. However, we suggest that the sample differences in market background are the main explanation. The studies by Cho (1998), Davies et al. (2005) and Morck et al. (1988) presented evidence from the American market. In the Chinese market, in part because of weak legal protection, management must have a larger ownership for there to be a convergence-of-interest effect with other shareholders. Also, the sample time period in this study is closer to the present situation compared to the studies of American companies. Therefore, we argue that, due to the evolution of corporate governances and regulations, both in developed and emerging markets, the thresholds of managerial ownership have moved up for both self-interested decision-making and interest alignment between managers and shareholders. In other words, managers need more ownership to obtain sufficient voting power to make decisions that are in their own interests (Ruan et al., 2009), and therefore, more managerial ownership is required for a full interest alignment between managers and shareholders in Chinese civilian-run listed firms.
MANAGERIAL OWNERSHIP AND CAPITAL STRUCTURE Based on the analysis of the theoretical predictions, we now examine the relationship between managerial ownership and capital structure. For the convenience of a further comparison, and according to the summary description in Table 2, we present Model 2 below, which is a modification of Model 1. According to the insignificant result of Hausman
Ruan, Tian & Ma: Managerial Ownership, Capital Structure & Firm Value
83
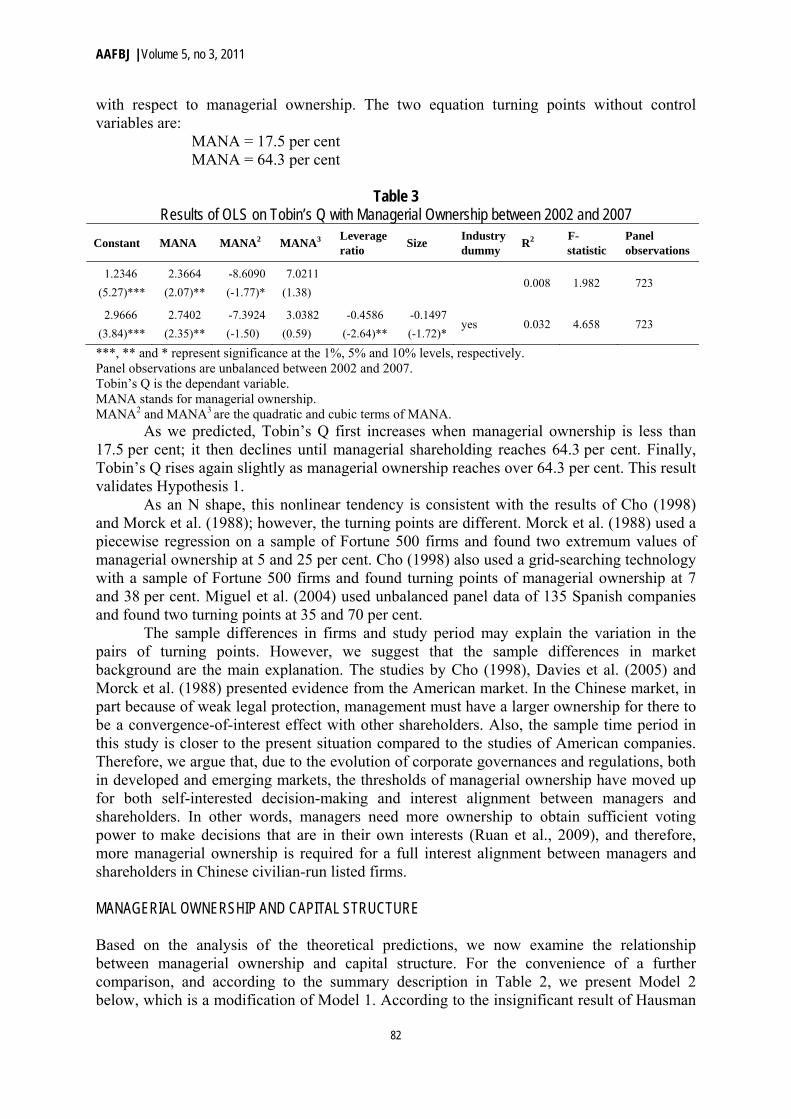
test, we adopt the random-effect model, as we did in Model 1. The regression results are in Table 4.
CS = a + 1 MANA + 2 MANA2 + 3 MANA3 +Control variables +ε (2)
Table 4 Results of OLS on Capital Structure with Managerial Ownership between 2002 and 2007
Constant MANA MANA2 MANA3 CR5 ROA Industry dummy
R2 F-
statistic Panel
observations
0.5117
(69.40)**
-1.5120
(-6.22)**
5.8719
(5.65)**
-6.0928
(-5.61)**
0.086 22.511 723
0.5799
(25.75)**
-1.3733
(-5.67)**
5.4140
(5.24)**
-5.6118
(-5.19)**
-0.1376
(-3.07)**
-0.0608
(-3.18)** yes 0.112 18.153 723
**represents significance at the 1% level. Panel observations are unbalanced between 2002 and 2007. Leverage ratio is the dependant variable. MANA stands for managerial ownership. MANA2 and MANA3 are the quadratic and cubic terms of MANA.
In Model 2 and Table 4, MANA stands for the proportion of managerial ownership,
and CS stands for capital structure, which is defined as total debt divided by total assets. Control variables include ownership concentration (CR5) and return on assets (ROA). The ownership is highly concentrated in Chinese listed companies (Firth et al. 2006; Hovey et al. 2003; Huang & Song 2006). We use the sum of squared ownership held by the largest five shareholders to measure the extent of ownership concentration. Return on asset is often the crucial determinant of capital structure of Chinse listed companies (Chen 2004; Huang & Song 2006) .
Table 4 shows that all the coefficients are of the expected signs and statistically significant at the 1 per cent level. We then calculated points of extremum and intersection via derivation. The two turning points of equations without control variables were:
MANA = 17.8 per cent MANA = 46.4 per cent
The results of Model 2 show negative relationships between managerial ownership and leverage ratios when managerial ownership is in the range from 0 to 17.8 per cent or beyond 46.4 per cent; however, a positive relationship between managerial ownership and leverage ratios exists when managerial ownership is in the range 17.8 to 46.4 per cent. This result validates our predictions and Hypothesis 2, and simultaneously supplements the evidence from Brailsford et al. (2002), in which a nonlinear inverted U-shaped relationship exists between the level of managerial ownership and leverage ratios in top 500 companies listed on the Australian Stock Exchange.
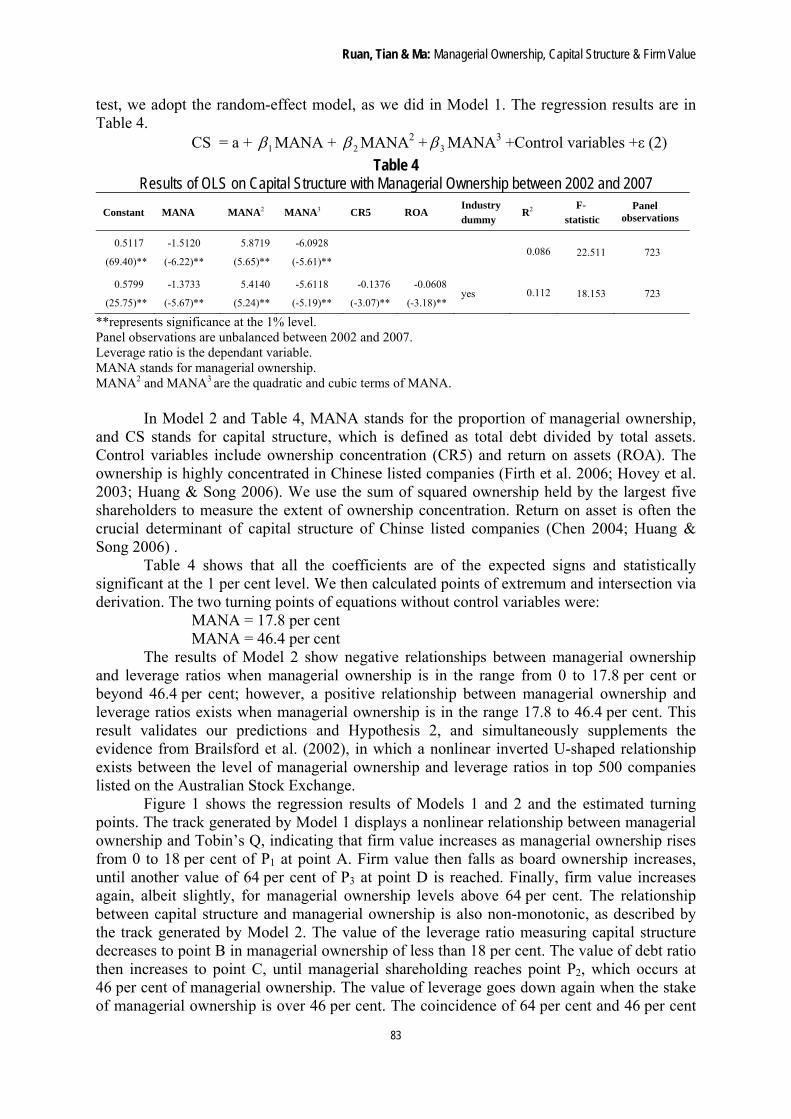
Figure 1 shows the regression results of Models 1 and 2 and the estimated turning points. The track generated by Model 1 displays a nonlinear relationship between managerial ownership and Tobin’s Q, indicating that firm value increases as managerial ownership rises from 0 to 18 per cent of P1 at point A. Firm value then falls as board ownership increases, until another value of 64 per cent of P3 at point D is reached. Finally, firm value increases again, albeit slightly, for managerial ownership levels above 64 per cent. The relationship between capital structure and managerial ownership is also non-monotonic, as described by the track generated by Model 2. The value of the leverage ratio measuring capital structure decreases to point B in managerial ownership of less than 18 per cent. The value of debt ratio then increases to point C, until managerial shareholding reaches point P2, which occurs at 46 per cent of managerial ownership. The value of leverage goes down again when the stake of managerial ownership is over 46 per cent. The coincidence of 64 per cent and 46 per cent
AAFBJ | Volume 5, no 3, 2011
84
of managerial ownership may be due to the limited sample of observations in the ranges over 45 per cent compared to the multitude of sample observations in the ranges with less managerial ownership. Conversely, however, this may reflect the institutional and corporate-governance environment in China, where the relationship between managerial ownership, capital structure and firm value is more complicated than in developed markets.
Figure 1 shows the three levels of managerial ownership. At a low level (less than
18 per cent), external discipline and internal controls or incentives dominate managers’ behaviour (Davies et al. 2005; Fama 1980). Managerial labour markets operate on the principal that poorly performing managers can be removed and appropriately disciplined (Davies et al. 2005). Managers in these markets have sufficient incentive to adopt financial policies, such as debt decisions, that avert financial distress and achieve better firm performance. As the level of managerial equity ownership rises beyond a certain level (approximately 18 per cent), managerial objectives begin to be entrenched. Internal mentoring and external discipline become weak. This lack of disciplinary control over management may strengthen managers’ ability to pursue their own benefits at the cost of decreasing firm value by using suboptimal corporate policies. As the level of managerial ownership reaches a relatively high value (in this study, at 46 and 64 per cent), managers align their interests with those of other owners, which leads to management behaviour aimed at maximising value, as predicted by Jensen and Meckling (1976) – for example, when managers use less debt to avoid being purchased or increasing the firm's financial risk.
The above results of OLS regressions validate Hypotheses 1 and 2. Hypothesis 3 conjectures that managerial ownership affects capital structure, which in turn affects firm value in Chinese civilian-run listed firms. However, we could not confirm this transmitting association without a stricter test, so we estimated a simultaneous equations model to test this relationship.
MANAGERIAL OWNERSHIP, CAPITAL STRUCTURE AND FIRM VALUE To capture potential multiple relationships between managerial ownership, capital structure and firm performance, we applied a set of simultaneous equations using the three-stage least-square method.
Tobin’s Q/capital structure
P1 P2
Capital structure
Tobin’s Q A
B
P1 = 0.18 P2 = 0.46 P3 = 0.64
C
D
P3 Managerial ownership
Figure 1 Relationships Between Firm Value, Capital Structure and Managerial Ownership
Ruan, Tian & Ma: Managerial Ownership, Capital Structure & Firm Value
85
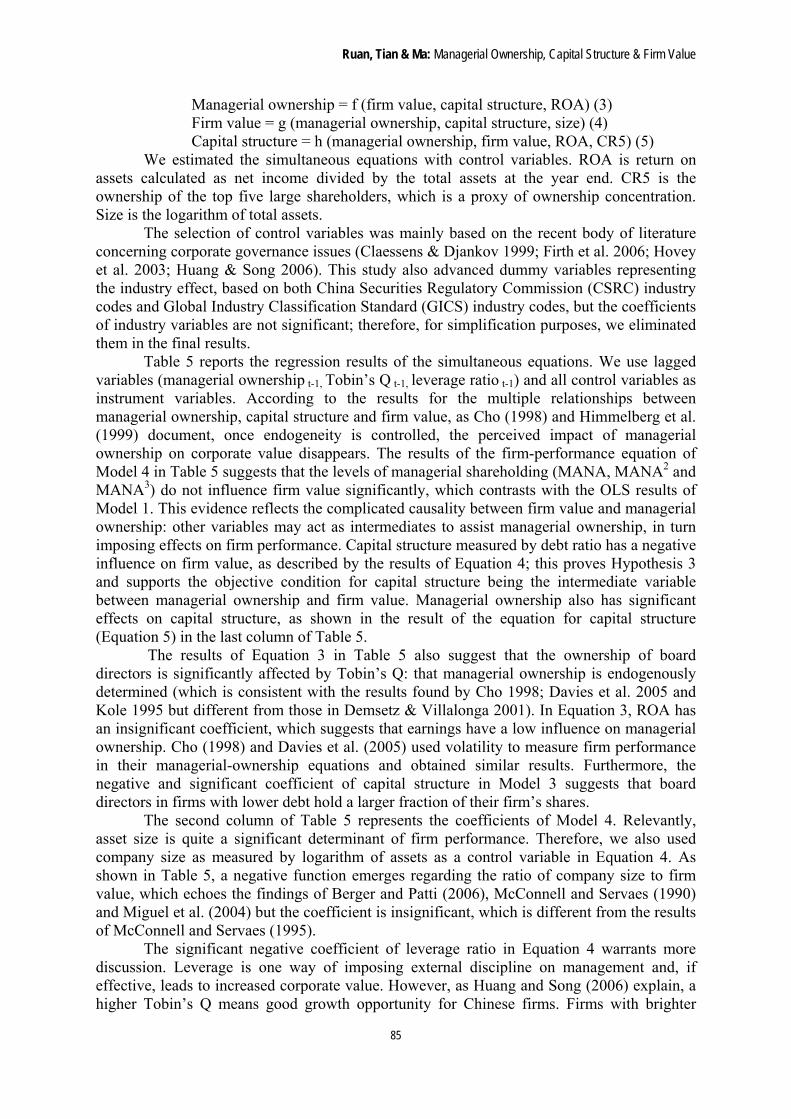
Managerial ownership = f (firm value, capital structure, ROA) (3) Firm value = g (managerial ownership, capital structure, size) (4) Capital structure = h (managerial ownership, firm value, ROA, CR5) (5)
We estimated the simultaneous equations with control variables. ROA is return on assets calculated as net income divided by the total assets at the year end. CR5 is the ownership of the top five large shareholders, which is a proxy of ownership concentration. Size is the logarithm of total assets.
The selection of control variables was mainly based on the recent body of literature concerning corporate governance issues (Claessens & Djankov 1999; Firth et al. 2006; Hovey et al. 2003; Huang & Song 2006). This study also advanced dummy variables representing the industry effect, based on both China Securities Regulatory Commission (CSRC) industry codes and Global Industry Classification Standard (GICS) industry codes, but the coefficients of industry variables are not significant; therefore, for simplification purposes, we eliminated them in the final results.
Table 5 reports the regression results of the simultaneous equations. We use lagged variables (managerial ownership t-1, Tobin’s Q t-1, leverage ratio t-1) and all control variables as instrument variables. According to the results for the multiple relationships between managerial ownership, capital structure and firm value, as Cho (1998) and Himmelberg et al. (1999) document, once endogeneity is controlled, the perceived impact of managerial ownership on corporate value disappears. The results of the firm-performance equation of Model 4 in Table 5 suggests that the levels of managerial shareholding (MANA, MANA2 and MANA3) do not influence firm value significantly, which contrasts with the OLS results of Model 1. This evidence reflects the complicated causality between firm value and managerial ownership: other variables may act as intermediates to assist managerial ownership, in turn imposing effects on firm performance. Capital structure measured by debt ratio has a negative influence on firm value, as described by the results of Equation 4; this proves Hypothesis 3 and supports the objective condition for capital structure being the intermediate variable between managerial ownership and firm value. Managerial ownership also has significant effects on capital structure, as shown in the result of the equation for capital structure (Equation 5) in the last column of Table 5.
The results of Equation 3 in Table 5 also suggest that the ownership of board directors is significantly affected by Tobin’s Q: that managerial ownership is endogenously determined (which is consistent with the results found by Cho 1998; Davies et al. 2005 and Kole 1995 but different from those in Demsetz & Villalonga 2001). In Equation 3, ROA has an insignificant coefficient, which suggests that earnings have a low influence on managerial ownership. Cho (1998) and Davies et al. (2005) used volatility to measure firm performance in their managerial-ownership equations and obtained similar results. Furthermore, the negative and significant coefficient of capital structure in Model 3 suggests that board directors in firms with lower debt hold a larger fraction of their firm’s shares.
The second column of Table 5 represents the coefficients of Model 4. Relevantly, asset size is quite a significant determinant of firm performance. Therefore, we also used company size as measured by logarithm of assets as a control variable in Equation 4. As shown in Table 5, a negative function emerges regarding the ratio of company size to firm value, which echoes the findings of Berger and Patti (2006), McConnell and Servaes (1990) and Miguel et al. (2004) but the coefficient is insignificant, which is different from the results of McConnell and Servaes (1995).
The significant negative coefficient of leverage ratio in Equation 4 warrants more discussion. Leverage is one way of imposing external discipline on management and, if effective, leads to increased corporate value. However, as Huang and Song (2006) explain, a higher Tobin’s Q means good growth opportunity for Chinese firms. Firms with brighter
AAFBJ | Volume 5, no 3, 2011
86
growth opportunities tend to have lower leverage and aim to avert the wealth transfer from shareholders to creditors. In this study, the negative association between leverage ratio and Tobin’s Q also meets the requirement of being an intermediate variable of managerial ownership on firm performance. Thus, we can take this negative relationship as evidence of Hypothesis 4.
Table 5 Simultaneous Regression Analysis Using Three-Stage Least-Squares Method
Variable Managerial ownership (3)
Firm value (4) Capital structure (5)
Constant term 0.1728 (7.85)*** 1.8284 (2.03)** 0.3273 11.47)***
Tobin’s Q -0.0308 (-4.64)*** -0.0593 (-6.41)***
ROA -0.0072 (0.58) -0.0460 (-4.02)***
Managerial ownership t-1 0.7948 (29.60)***
Capital structure -0.1937 (-5.62)*** -1.9818 (-4.01)***
MANA 11.0050 (1.90) -0.1758 (-2.27)***
MANA2 -40.1280 (-1.71) 0.8002 (3.31)***
MANA3 3.0382 (0.44) -1.5000 (-1.58)
SIZE -0.0652 (-0.67)
Tobin’s Q t-1 1.3352 (14.21)***
CR5 -0.0434 (1.48)
Leverage ratio t-1 0.5547 (17.63)***
R2 0.616 0.242 0.453
Number of observations 587 587 587
The dependant variable of Model 3, Managerial ownership, is managerial shareholding in year t. The dependant variable of Model 4, Firm value, is Tobin’s Q in year t. The dependant variable of Model 5, Capital structure, is leverage ratio in year t. Tobin’s Q is market value of assets divided by book value of total assets. ROA is the net income divided by the total assets at the year end. CR5 is the ownership sum of the five largest shareholders. Capital structure is the ratio of total debt to total assets. MANA is the proportion of managerial ownership, which is the ratio of shares owned by all board members to total shares outstanding. The quadratic and cubic terms of MANA are MANA2 and MANA3. Size is the logarithm of total assets. Managerial ownership is the ratio of shares owned by all board members to total shares outstanding. Capital structure is the ratio of total debt to total assets. The sample comprises 197 civilian-run Chinese firms listed between 2002 and 2007. The unbalanced panel data construct 723 observations, but there are only 587 effective observations in simultaneous equations. All independent variables refer to the values in year t, except those with the subscript t-1. *** and ** represent significance at the 1% and 5% levels respectively.
ROA measures a firm’s efficiency in generating profits from every dollar of assets, and shows how well a company uses investment dollars to generate earnings growth. ROA was found to be negatively and significantly related to the level of debt ratio for the results of Model 5. Noticeably, some of the literature uses the accounting profit rate to measure firm performance, such as ROE in Demsetz and Lehn (1985) and profitability in Chaessens and
Ruan, Tian & Ma: Managerial Ownership, Capital Structure & Firm Value
87
Djankov (1999). However, some critics argue that the accounting profit rate is backward-looking and Tobin’s Q is forward-looking (Demsetz & Villalonga 2001). In this study the Tobin’s Q influence on debt ratio is as significant as ROA (-0.059 of Tobin’s Q and -0.046 of ROA on debt ratio). Therefore, both Tobin’s Q and ROA do have a similar relationship with capital structure in Chinese civilian-run firms.
We also viewed another important result from the simultaneous equations as being the endogenous character of capital structure. The significant influence of firm-performance variables on capital structure are consistent with the results of Titman and Wessels (1988), Ozkan (2001) and others. Taken together, the capital structure is an intermediate variable of influence between managerial ownership and firm value, but is also an endogenous variable that should not be neglected in Chinese civilian-run companies.
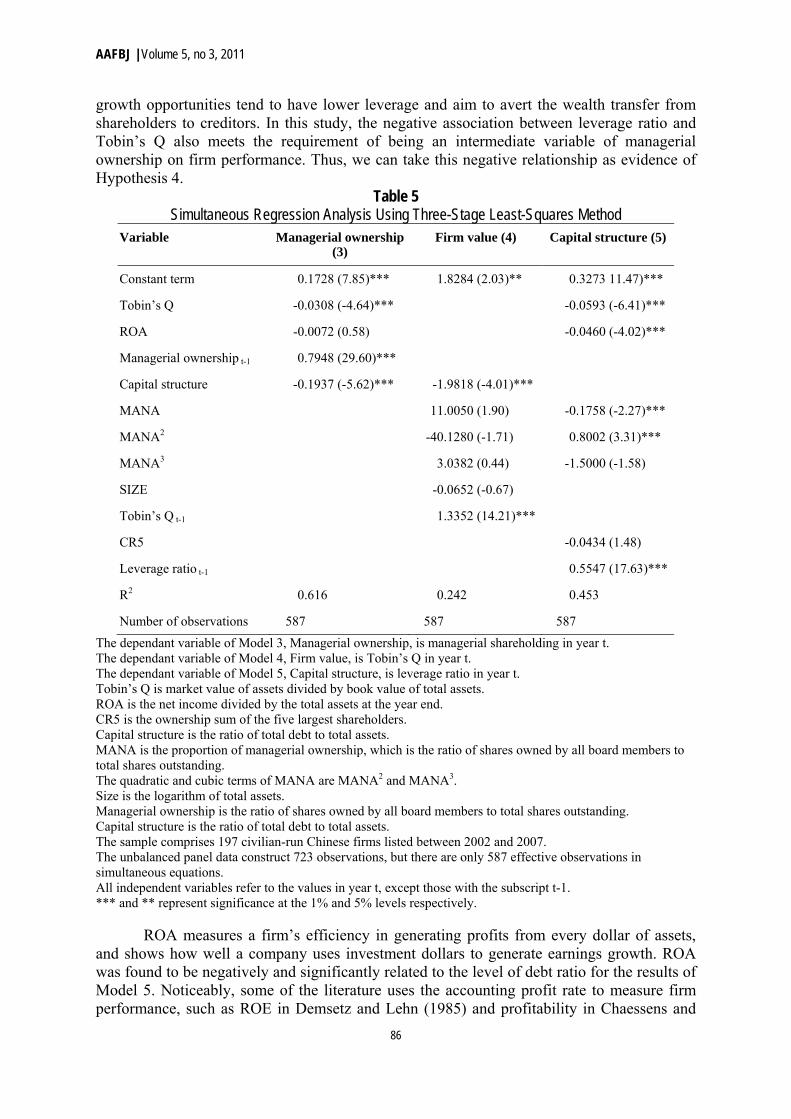
ROBUSTNESS TEST This section uses piecewise regression with simultaneous equations to explore whether considering different ranges of managerial ownership provides results with a significant difference from those estimated using Models 3, 4 and 5. The models are as follows (the estimations are reported in Table 6):
Managerial ownership = f (firm value, capital structure, ROA) (6) Firm value = g (piecewise managerial ownership, capital structure, size) (7) Capital structure = h (piecewise managerial ownership, firm value, ROA, CR5) (8) The piecewise managerial ownership (MANA) in firm value (Model 7) and capital
structure (Model 8) are defined by the results of turning points from Equation 1 (18 per cent, 64 per cent) and Equation 2 (18 per cent, 46 per cent), respectively:
MANA ≤ 18% = managerial ownership if managerial ownership < 0.18, = 0.18 if managerial ownership of firm ≥0.18. MANA 18–64% = 0 if managerial ownership < 0.18, = managerial ownership −0.18 if 0.18 ≤ managerial ownership < 0.64, = 0.64 if managerial ownership ≥ 0.64. MANA > 64% = 0 if managerial ownership of firm < 0.64, = managerial ownership −0.64 if managerial ownership ≥ 0.64. MANA 18–46% = 0 if managerial ownership < 0.18, = managerial ownership −0.18 if 0.18 ≤ managerial ownership < 0.46, = 0.46 if managerial ownership ≥ 0.46. MANA > 46% = 0 if managerial ownership of firm < 0.46, = managerial ownership −0.46 if managerial ownership ≥ 0.46. In Table 6, two piecewise variables of managerial ownership (MANA ≤ 18% and
MANA 18–64%) in Equation 7 remain insignificant influences on firm performance, which are consistent with the nonexistence of direct effects from managerial ownership on firm performance shown in Table 5. Concerning the results of Model 8, managerial ownership up to 18 per cent influences capital structure insignificantly. However, managerial ownership in the 18 to 46 per cent range and over 46 per cent have significant effects on capital structure at the 5 per cent level. Most control variables have similar coefficient signs and significance to the results of Models 3, 4 and 5, including firm size in Model 7. The results of the robustness test echo Hypotheses 3 and 4.
AAFBJ | Volume 5, no 3, 2011
88
Table 6 Robustness Test Using Simultaneous Regression with Three-Stage Least-Squares Method
Variable Managerial ownership t
(6)
Firm value t
(7)
Capital structure t
(8)
Constant term 0.1716 (7.79)*** 1.9165 (2.11)** 0.3201 (9.80)***
Tobin’s Q -0.0305 (-4.60)*** -0.0576 (-5.58)***
ROA 0.0080 (0.64) -0.0459 (-3.54)***
Managerial ownership t-1 0.7944 (29.64)***
Capital structure -0.1922 (-5.58)*** -2.3168 (-5.08)***
MANA ≤ 18% 5.6044 (1.02)
MANA 18–64% -1.7382 (-3.08)***
MANA > 64% -8.5673 (-1.07)
SIZE -0.0525 (-0.53)
Tobin’s Q t-1 1.3511 (14.33)***
MANA ≤18% -0.6663 (-0.892)
MANA 18–46% -0.1667 (-2.03)**
MANA > 46% -0.6966 (-2.31)**
CR5 0.0722 (2.05)**
Leverage ratio t-1 0.5484 (15.98)***
R2 0.617 0.253 0.446
Number of observations 587 587 587
The dependant variable of Model 3, Managerial ownership, is managerial shareholding in year t; the dependant variable of Model 4, Firm value, is Tobin’s Q in year t; the dependant variable of Model 5, Capital structure, is leverage ratio in year t. Tobin’s Q is the market value of assets divided by the book value of total assets. ROA is the net income divided by the total assets at the year end. CR5 is the ownership sum of the five largest shareholders. Capital structure is the ratio of total debt to total assets. MANA is the proportion of managerial ownership, which is the ratio of shares owned by all board members to total shares outstanding. The quadratic and cubic terms of MANA are MANA2 and MANA3. Size is the logarithm of total assets. Managerial ownership is the ratio of shares owned by all board members to total shares outstanding. Capital structure is the ratio of total debt to total assets. The sample comprises 197 civilian-run Chinese firms listed between 2002 and 2007. The unbalanced panel data construct 723 observations, but there are only 587 effective observations in simultaneous equations. All independent variables refer to the values in year t, except those with the subscript t-1. *** and ** represent significance at the 1% and 5% levels respectively.
Ruan, Tian & Ma: Managerial Ownership, Capital Structure & Firm Value
89
Conclusions This paper extends the previous research (Cho 1998; Davies et al. 2005; Morck et al. 1988 and Short & Keasey 1999) in at least two respects. First, we introduced capital structure as an intermediate variable between managerial ownership and corporate value. By using simultaneous equations, we detected the interrelationship between managerial ownership, firm value and capital structure and found the intermediate role of capital structure. Second, we extended the research from developed markets to the emerging Chinese market — a necessary development from previous studies.
Through examination of a sample of 197 civilian-run listed firms between 2002 and 2007, we found a nonlinear relationship between Tobin’s Q and the fraction of shares owned by boards of directors; this is consistent with the results of Cho (1998), Miguel et al. (2004) Morck et al. (1988) and Short and Keasey (1999). Tobin’s Q, which is a proxy of firm performance, increases as managerial ownership grows until it reaches 18 per cent. Thereafter, Tobin’s Q declines with the increase in managerial ownership until it reaches 64 per cent. Tobin’s Q rises again slightly as managerial ownership increases from 64 per cent. These two turning points are higher than those detected by Cho (1998) and Morck et al. (1988), who used Fortune 500 data from an earlier period. We argue that, due to the evolution of corporate governance and changes of regulation in China’s market environment, the managerial control for pursuing self-interest and alignment of interests between managers and other shareholders can only be approached by management holding more ownership than is the case in other developed countries.
The association between managerial ownership and capital structure is also non-monotonic. A negative relationship exists between managerial ownership and leverage ratios when managerial ownership is below 18 per cent or above 46 per cent. Within the managerial ownership range 18to 46 per cent, the leverage ratio increases as managerial ownership increases.
At a low level of managerial ownership (less than 18 per cent for Chinese civilian-run listed companies), managers’ behaviour is dominated by external discipline and internal controls. For example, managers can be removed because of poor performance. Therefore there are sufficient incentive for managers to adopt financial policies, such as debt decisions, that avert financial distress and achieve better firm performance. As the level of managerial equity ownership rises beyond a certain level (approximately 18 per cent), managerial objectives begin to be entrenched. Internal mentoring and external discipline become weak. This lack of disciplinary control over management may strengthen managers’ ability to pursue their own benefits at the cost of decreasing firm value by using suboptimal corporate policies. As the level of managerial ownership reaches a relatively high value (in this study, at 46 and 64 per cent), managers align their interests with those of other shareholders (for example, using less debt to avoid the firm being purchased).
By using a simultaneous equation regression, we found that managerial ownership does not influence firm value significantly when capital structure is added into the equation. Managerial ownership significantly affects capital structure, and capital structure affects corporate performance directly. These results address the influence of managerial shareholding on capital structure, which in turn affects firm value. Furthermore, capital structure is endogenously determined by both firm value and managerial ownership in Chinese civilian-run listed companies between 2002 and 2007, which inspires us to focus on financing issues for China’s civilian-run firms.

AAFBJ | Volume 5, no 3, 2011
90
References
Bai, C E, Liu, Q & Song, F M 2002 'Value of Corporate Control: Evidence from China’s Distressed Firms', Working paper, accessed http://papers.ssrn.com/sol3/papers.cfm?abstract_id= 314802.
Berger, A N & Bonaccorsi di Patti, E 2006 'Capital Structure and Firm Performance: A New Approach to Testing Agency Theory and an Application to the Banking Industry', Journal of Banking & Finance, vol.30, pp1065-1102.
Berger, P G, Ofek, E & Yermack, D L 1997 'Managerial Entrenchment and Capital Structure Decisions', The Journal of Finance, vol.52, pp1411-1438.
Bhagat, S & Bolton, B 2008 'Corporate governance and firm performance', Journal of Corporate Finance, vol.14, pp257-273.
Brailsford, T J, Oliver, B R & Pua, S L H 2002 'On the Relation between Ownership Structure and Capital Structure', Accounting & Finance, vol.42, pp1-26.
Bunkanwanicha, P, Gupta, J & Rokhim, R 2008 'Debt and Entrenchment: Evidence from Thailand and Indonesia', European Journal of Operational Research, vol.185, pp1578-1595.
Chen, J J 2004 'Determinants of capital structure of Chinese-listed companies', Journal of Business Research, vol.57, pp1341-1351.
Cho, M H 1998 'Ownership Structure, Investment, and the Corporate Value: An Empirical Analysis', Journal of Financial Economics, vol.47, pp103-121.
Claessens, S & Djankov, S 1999 'Ownership Concentration and Corporate Performance in the Czech Republic', Journal of Comparative Economics, vol.27, pp498-513.
Davies, J R, Hillier, D & McColgan, P 2005 'Ownership Structure, Managerial Behavior and Corporate Value', Journal of Corporate Finance, vol.11, pp645-660.
Demsetz, H & Lehn, K 1985 'The Structure of Corporate Ownership: Causes and Consequences', Journal of Political Economy, vol.93, pp1155-1177.
Demsetz, H & Villalonga, B 2001 'Ownership Structure and Corporate Performance', Journal of Corporate Finance, vol.7, pp209-233.
Denis, D K & McConnell, J J 2003 'International Corporate Governance', The Journal of Financial and Quantitative Analysis, vol.38, pp1-36.
Fama, E F 1980 'Agency Problems and the Theory of the Firm', Journal of Political Economy, vol.88, pp288-307.
Firth, M, Fung, P M Y & Rui, O M 2006 'Firm Performance, Governance Structure, and Top Management Turnover in a Transitional Economy', Journal of Management Studies, vol.43, pp1289-1330.
Friend, I & Lang, L H P 1988 'An Empirical Test of the Impact of Managerial Self-Interest on Corporate Capital Structure', Journal of Finance, vol.43, pp271-281.
Grossman, S & Hart, O 1982 'Corporate Financial Structure and Managerial Incentives'. in McCall, J J (ed.) The Economics of Information and Uncertainty, University of Chicago Press, Chicago, pp107-140.
Ruan, Tian & Ma: Managerial Ownership, Capital Structure & Firm Value
91
Himmelberg, C P, Hubbard, R G & Palia, D 1999 'Understanding the Determinants of Managerial Ownership and the Link between Ownership and Performance', Journal of Financial Economics, vol.53, pp353-384.
Holderness, C G 2003 A Survey of Blockholders and Corporate Control. Economic Policy Review, Federal Reserve Bank of New York, NY, vol.9, pp51-63.
Hovey, M, Li, L & Naughton, T 2003 'The Relationship Between Valuation and Ownership of Listed Firms in China', Corporate Governance, vol.11, pp112-122.
Huang, G & Song, F M 2006 'The Determinants of Capital Structure: Evidence from China', China Economic Review, 17, vol.pp14-36.
Jensen, M C 1986 'Agency Costs of Free Cash Flow, Corporate Finance, and Takeovers', American Economic Review, vol.76, pp323-329.
Jensen, M C & Meckling, W H 1976 'Theory of the Firm: Managerial Behavior, Agency Costs and Ownership Structure', Journal of Financial Economics, vol.3, pp305-360.
Kole, S R 1995 'Measuring Managerial Equity Ownership: A Comparison of Sources of Ownership Data', Journal of Corporate Finance, vol.1, pp413-435.
Korajczyk, R A & Levy, A 2003 'Capital Structure Choice: Macroeconomic Conditions and Financial Constraints', Journal of Financial Economics, vol.68, pp75-109.
La Porta, R L, Lopez-de-Silanes, F, Shleifer, A & Vishny, R W (1998) 'Law and Finance', The Journal of Political Economy, vol.106, pp1113-1155.
Lins, K V 2003 'Equity Ownership and Firm Value in Emerging Markets', Journal of Financial and Quantitative Analysis, vol.38, pp159-183.
McConnell, J J & Servaes, H 1990 'Additional Evidence on Equity Ownership and Corporate Value', Journal of Financial Economics, vol.27, pp595-612.
McConnell, J J & Servaes, H 1995 'Equity Ownership and the Two Faces of Debt', Journal of Financial Economics, vol.39, pp131-157.
Miguel, A D, Pindado, J & Torre, C D L 2004 'Ownership Structure and Firm Value: New Evidence from Spain', Strategic Management Journal, vol.25, pp1199-1207.
Modigliani, F & Miller, M H 1963 'Corporate Income Taxes and the Cost of Capital: A Correction', The American Economic Review, vol.53, pp433-443.
Morck, R, Shleifer, A & Vishny, R W 1988 'Management Ownership and Market Valuation: An Empirical Analysis', Journal of Financial Economics, vol.20, pp293-315.
Myers, S C 1977 'Determinants of Corporate Borrowing', Journal of Financial Economics, vol.5, pp147-175.
Novaes, W 2003 'Capital Structure Choice When Managers Are in Control: Entrenchment versus Efficiency', The Journal of Business, vol.76, pp49-81.
Ozkan, A 2001 'Determinants of Capital Structure and Adjustment to Long Run Target: Evidence from UK Company Panel Data', Journal of Business Finance & Accounting, vol.28, pp175-198.
Ross, S A 1977 'The Determination of Financial Structure: The Incentive-Signalling Approach', Bell Journal of Economics, vol.8, pp23-40.
Ruan, W, Tian, G & Ma, S 2009 'Managerial Ownership, Capital Structure and Firm Value', Corporate Ownership & Control, vol.7, pp71-82.
Short, H & Keasey, K 1999 'Managerial Ownership and the Performance of Firms: Evidence from the UK', Journal of Corporate Finance, vol.5, pp79-101.
AAFBJ | Volume 5, no 3, 2011
92
Titman, S & Wessels, R 1988 'The Determinants of Capital Structure Choice', Journal of Finance, vol.43, pp1-19.
Wei, Z, Xie, F & Zhang, S 2005 'Ownership Structure and Firm Value in China’s Privatized Firms: 1991–2001', Journal of Financial and Quantitative Analysis, vol.40, pp87-108.
Williams, J 1987 'Perquisites, Risk and Capital Structure', Journal of Finance, 42, pp29-49. Wu, L & Yue, H 2009 'Corporate Tax, Capital Structure, and the Accessibility of Bank
Loans: Evidence from China', Journal of Banking & Finance, vol.33, pp30-38. Zwiebel, J 1996 'Dynamic Capital Structure under Managerial Entrenchment', American
Economic Review, vol.86, pp1197-1215.