Embed Size (px)
Citation preview
1 | Fuel Cell Technologies Office eere.energy.gov
Overview of U.S. Department of Energy Efforts
on Hydrogen Production from Water Electrolysis
ElectroHyPEM Workshop
December 11, 2014
Taormina, Italy
David R. Peterson
Fuel Cell Technologies Office
U.S. Department of Energy
Piotr Zelenay (Presenter)
Los Alamos National Laboratory
2 | Fuel Cell Technologies Office eere.energy.gov
Presentation Outline
• U.S. DOE Hydrogen and Fuel Cell Program
• Hydrogen Production SubProgram
• Electrolysis Workshop
• H2A Production Model
• Electrolysis Accomplishments/Types
• Renewable Electrolysis
12/11/2014

3 | Fuel Cell Technologies Office eere.energy.gov
DOE Program Overview
The DOE Hydrogen and Fuel Cells Program Plan
Released Sept 2011 Update to the Hydrogen
Posture Plan (2006) Includes Four DOE
Offices EERE, FE, NE and Science
More than 200 projects currently funded
at companies, national labs, and
universities/institutes
The Program is an integrated effort, structured to address all the key challenges and obstacles facing widespread commercialization
12/11/2014
4 | Fuel Cell Technologies Office eere.energy.gov
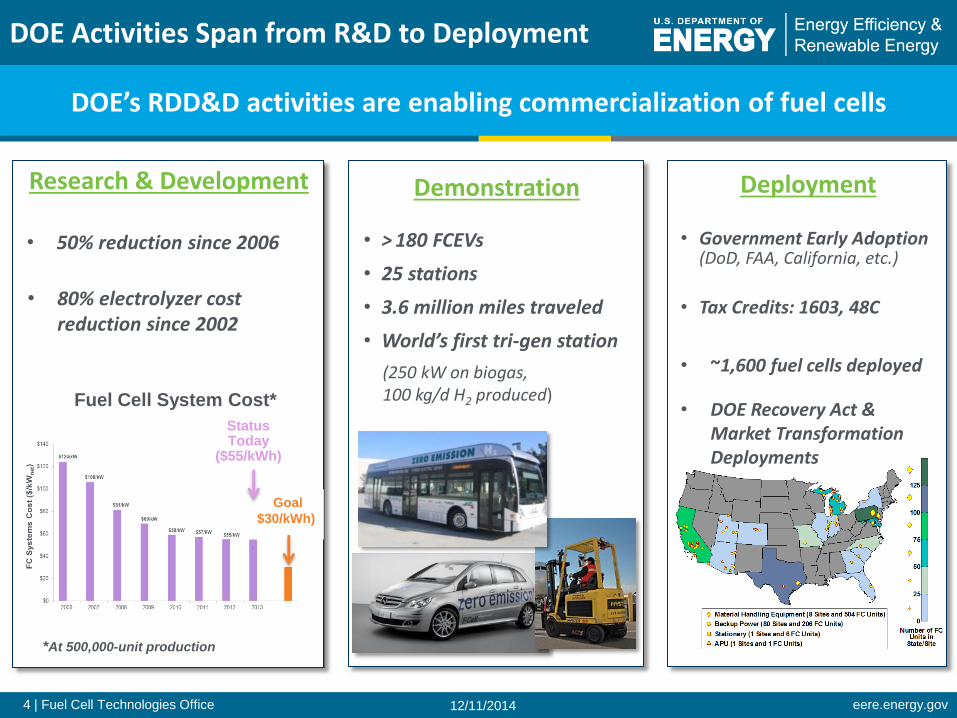
DOE Activities Span from R&D to Deployment
DOE’s RDD&D activities are enabling commercialization of fuel cells
• 50% reduction since 2006 • Government Early Adoption
(DoD, FAA, California, etc.)
• Tax Credits: 1603, 48C
• ~1,600 fuel cells deployed
Goal
$30/kWh)
Status Today
($55/kWh)
Fuel Cell System Cost*
• 80% electrolyzer cost reduction since 2002
• DOE Recovery Act & Market Transformation Deployments
• > 180 FCEVs
• 25 stations
• 3.6 million miles traveled
• World’s first tri-gen station
(250 kW on biogas, 100 kg/d H2 produced)
Research & Development Demonstration Deployment
*At 500,000-unit production
12/11/2014
5 | Fuel Cell Technologies Office eere.energy.gov
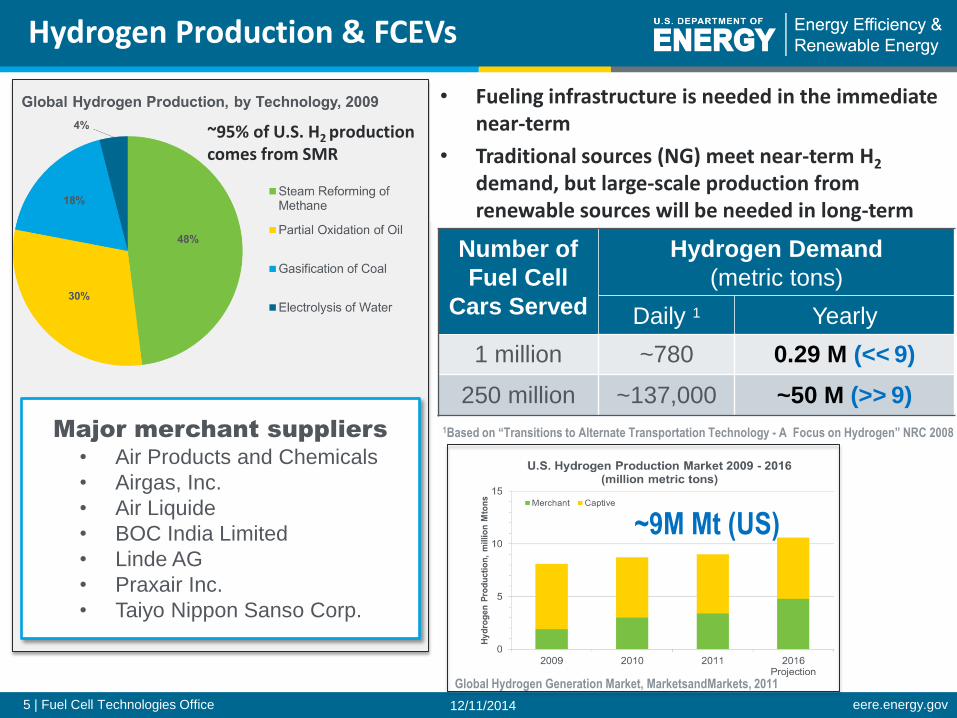
Hydrogen Production & FCEVs
Major merchant suppliers
• Air Products and Chemicals
• Airgas, Inc.
• Air Liquide
• BOC India Limited
• Linde AG
• Praxair Inc.
• Taiyo Nippon Sanso Corp.
~95% of U.S. H2 production comes from SMR
Number of
Fuel Cell
Cars Served
Hydrogen Demand
(metric tons)
Daily 1 Yearly
1 million ~780 0.29 M (<< 9)
250 million ~137,000 ~50 M (>> 9)
1Based on “Transitions to Alternate Transportation Technology - A Focus on Hydrogen” NRC 2008
~9M Mt (US)
Global Hydrogen Generation Market, MarketsandMarkets, 2011
• Fueling infrastructure is needed in the immediate near-term
• Traditional sources (NG) meet near-term H2 demand, but large-scale production from renewable sources will be needed in long-term
12/11/2014
6 | Fuel Cell Technologies Office eere.energy.gov
H2USA Public-Private Partnership to address H2 Infrastructure Challenges
3X increase in partners and growing since 2013
12/11/2014
7 | Fuel Cell Technologies Office eere.energy.gov
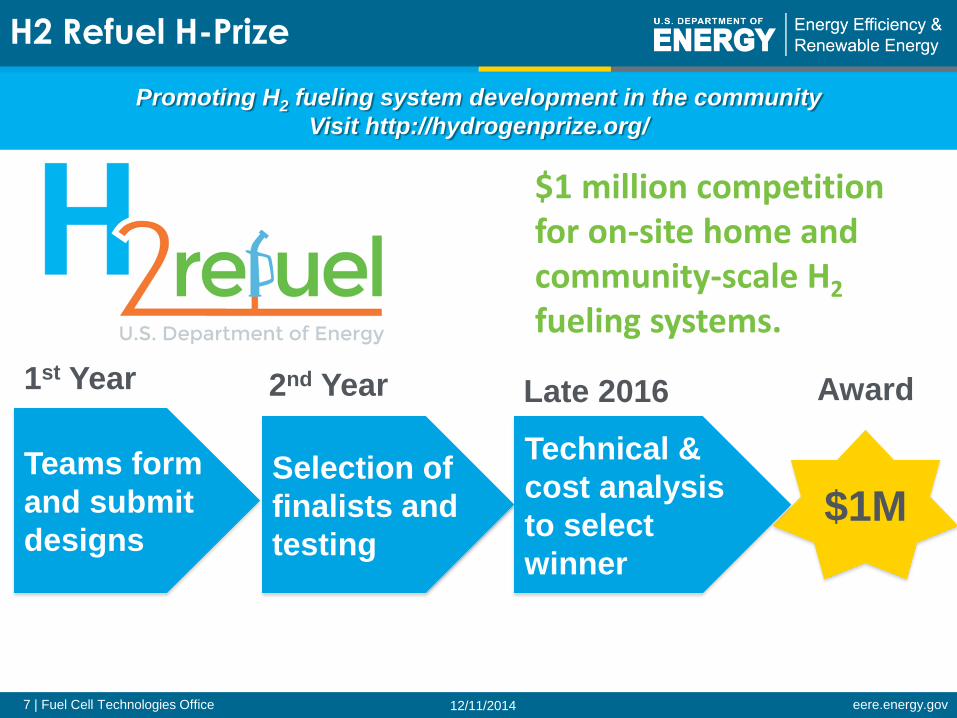
H2 Refuel H-Prize
$1 million competition for on-site home and community-scale H2 fueling systems.
$1M Teams form
and submit
designs
Selection of
finalists and
testing
Technical &
cost analysis
to select
winner
1st Year 2nd Year Late 2016 Award
Promoting H2 fueling system development in the community
Visit http://hydrogenprize.org/
12/11/2014
8 | Fuel Cell Technologies Office eere.energy.gov
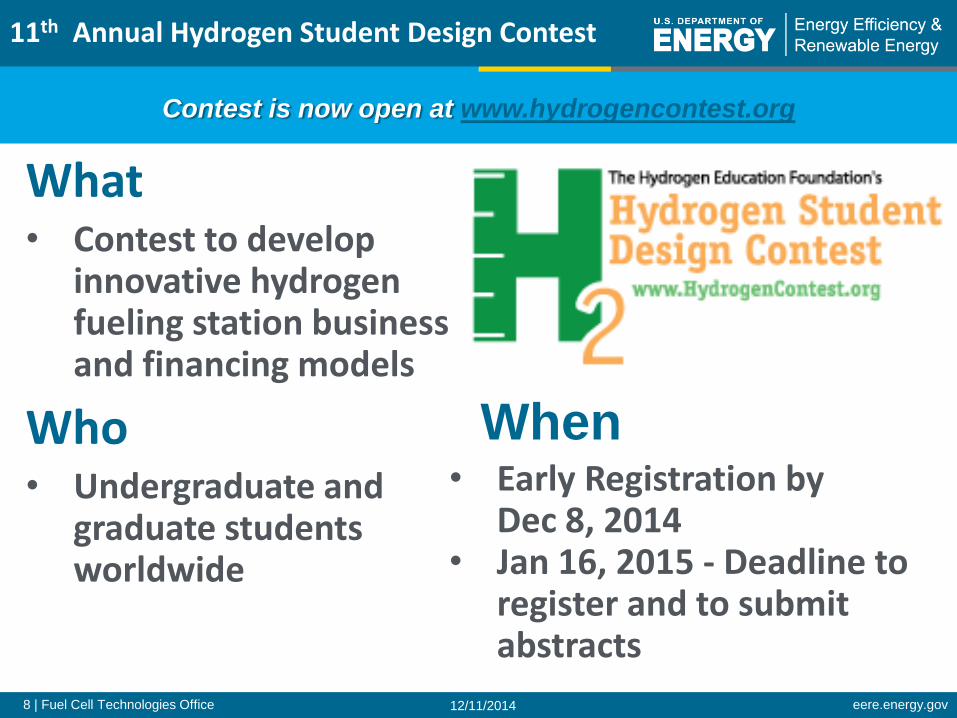
Contest is now open at www.hydrogencontest.org
11th Annual Hydrogen Student Design Contest
What • Contest to develop
innovative hydrogen fueling station business and financing models
Who • Undergraduate and
graduate students worldwide
• Early Registration by Dec 8, 2014
• Jan 16, 2015 - Deadline to register and to submit abstracts
When
12/11/2014
9 | Fuel Cell Technologies Office eere.energy.gov
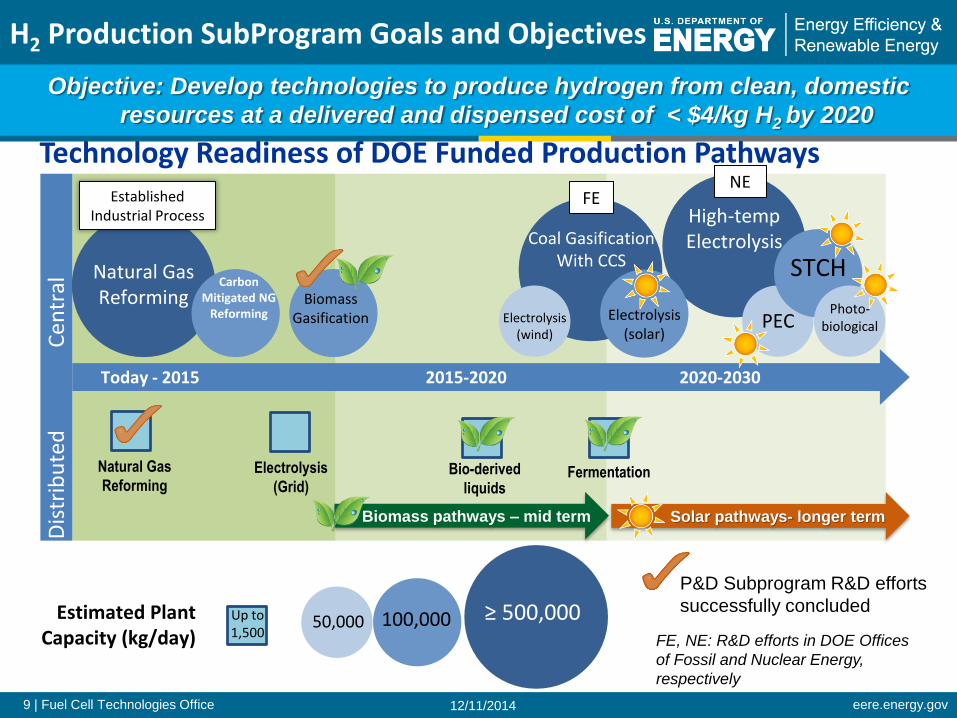
H2 Production SubProgram Goals and Objectives
Objective: Develop technologies to produce hydrogen from clean, domestic
resources at a delivered and dispensed cost of < $4/kg H2 by 2020
P&D Subprogram R&D efforts
successfully concluded
FE, NE: R&D efforts in DOE Offices
of Fossil and Nuclear Energy,
respectively
Today - 2015 2015-2020 2020-2030
Natural Gas
Reforming
Dis
trib
ute
d
Ce
ntr
al Natural Gas
Reforming Biomass Gasification
Bio-derived
liquids
Electrolysis
(Grid)
Coal Gasification With CCS
Electrolysis (wind)
High-temp Electrolysis
PEC
STCH
Photo-biological
FE NE
Electrolysis (solar)
Solar pathways- longer term
Fermentation
Biomass pathways – mid term
Established Industrial Process
Estimated Plant Capacity (kg/day)
100,000 50,000 Up to 1,500
≥ 500,000
Carbon Mitigated NG
Reforming
Technology Readiness of DOE Funded Production Pathways
12/11/2014
10 | Fuel Cell Technologies Office eere.energy.gov
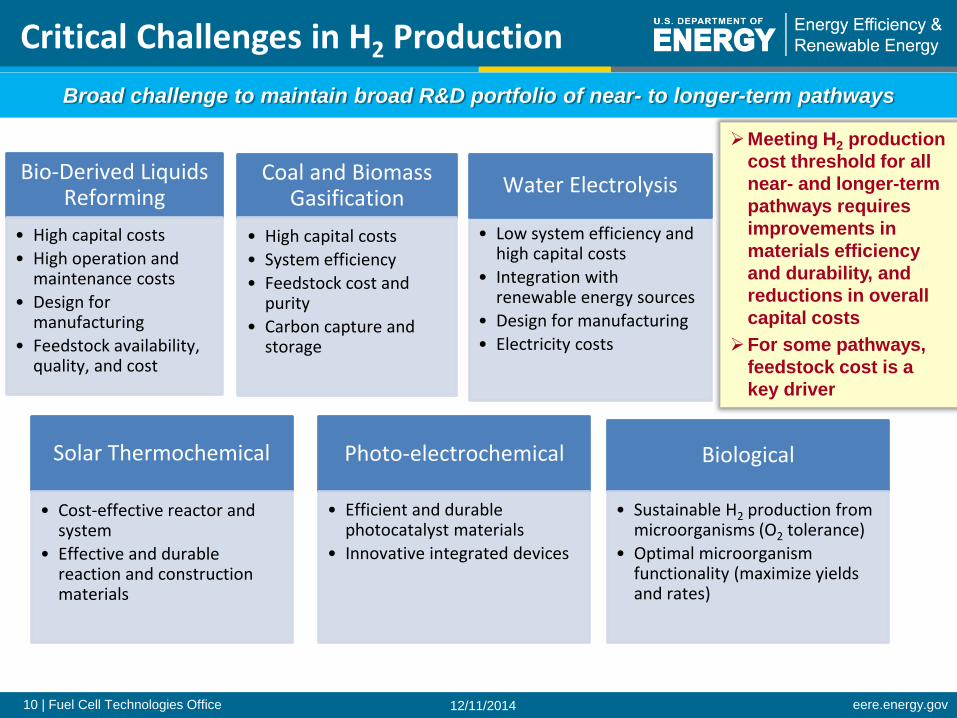
Critical Challenges in H2 Production
Meeting H2 production
cost threshold for all
near- and longer-term
pathways requires
improvements in
materials efficiency
and durability, and
reductions in overall
capital costs
For some pathways,
feedstock cost is a
key driver
• Low system efficiency and high capital costs
• Integration with renewable energy sources
• Design for manufacturing
• Electricity costs
Bio-Derived Liquids Reforming
• High capital costs
• High operation and maintenance costs
• Design for manufacturing
• Feedstock availability, quality, and cost
Coal and Biomass Gasification
• High capital costs
• System efficiency
• Feedstock cost and purity
• Carbon capture and storage
Solar Thermochemical
• Cost-effective reactor and system
• Effective and durable reaction and construction materials
Water Electrolysis
Photo-electrochemical
• Efficient and durable photocatalyst materials
• Innovative integrated devices
Biological
• Sustainable H2 production from microorganisms (O2 tolerance)
• Optimal microorganism functionality (maximize yields and rates)
Broad challenge to maintain broad R&D portfolio of near- to longer-term pathways
12/11/2014
11 | Fuel Cell Technologies Office eere.energy.gov
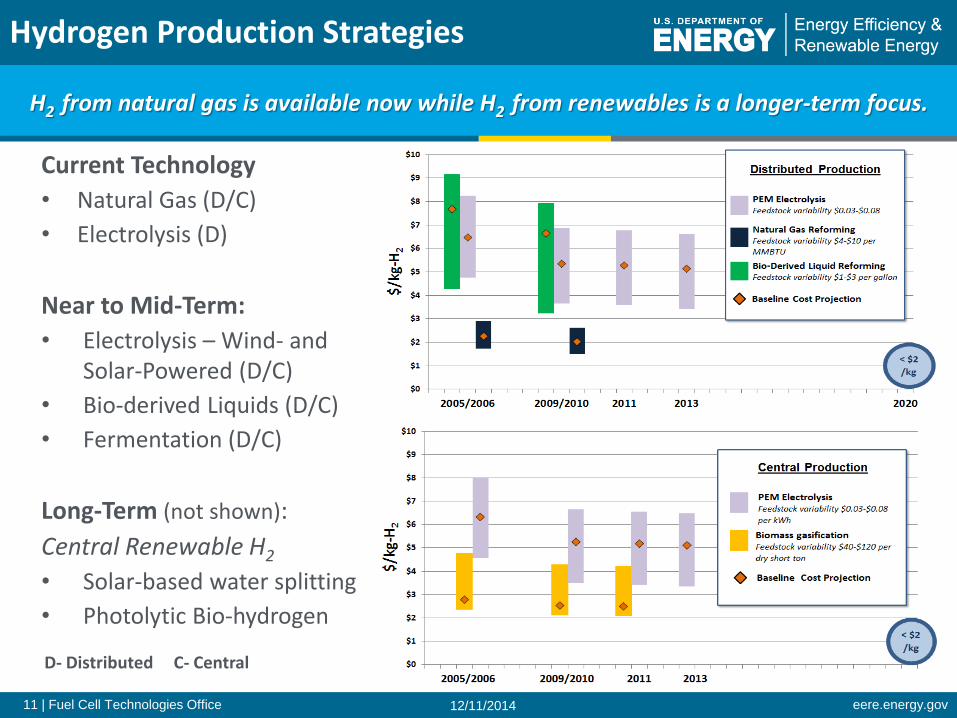
Hydrogen Production Strategies
H2 from natural gas is available now while H2 from renewables is a longer-term focus.
Current Technology
• Natural Gas (D/C)
• Electrolysis (D)
Near to Mid-Term:
• Electrolysis – Wind- and Solar-Powered (D/C)
• Bio-derived Liquids (D/C)
• Fermentation (D/C)
Long-Term (not shown):
Central Renewable H2
• Solar-based water splitting
• Photolytic Bio-hydrogen
D- Distributed C- Central
12/11/2014
12 | Fuel Cell Technologies Office eere.energy.gov
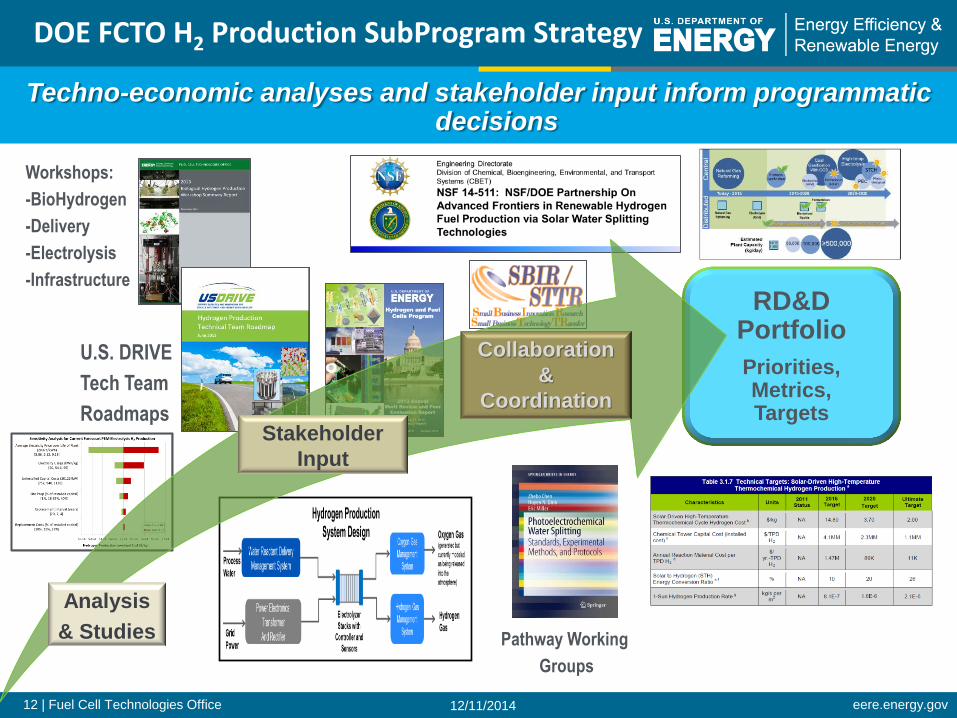
RD&D Portfolio
Priorities, Metrics, Targets
DOE FCTO H2 Production SubProgram Strategy
Techno-economic analyses and stakeholder input inform programmatic decisions
Collaboration
&
Coordination
Stakeholder
Input
Analysis
& Studies
Workshops:
-BioHydrogen
-Delivery
-Electrolysis
-Infrastructure
U.S. DRIVE
Tech Team
Roadmaps
Pathway Working
Groups
12/11/2014
13 | Fuel Cell Technologies Office eere.energy.gov
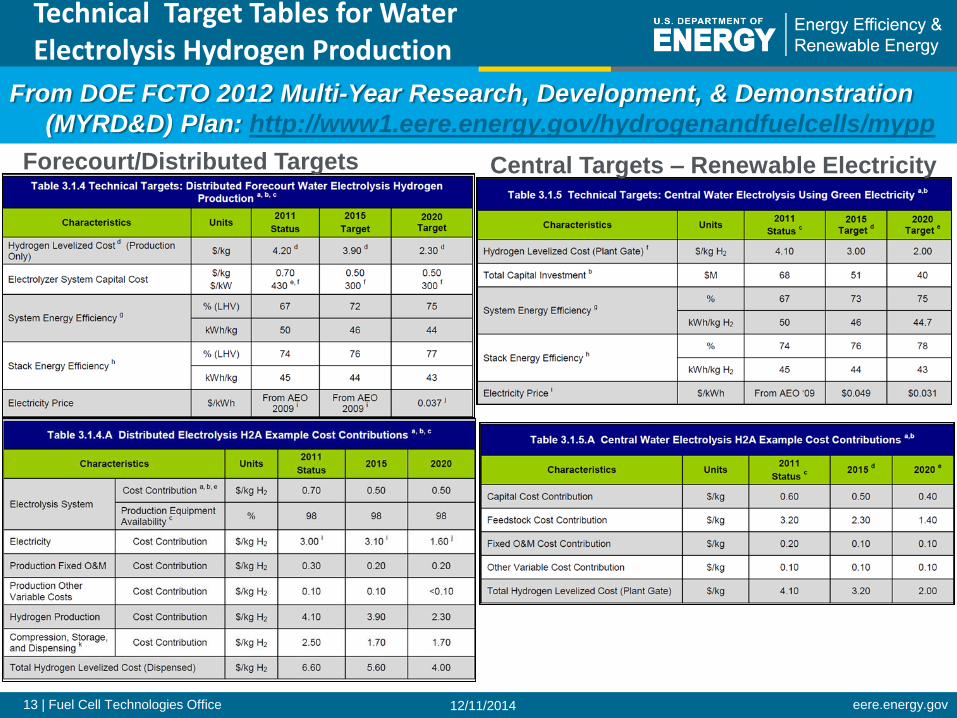
Technical Target Tables for Water Electrolysis Hydrogen Production
From DOE FCTO 2012 Multi-Year Research, Development, & Demonstration
(MYRD&D) Plan: http://www1.eere.energy.gov/hydrogenandfuelcells/mypp
Forecourt/Distributed Targets Central Targets – Renewable Electricity
12/11/2014
14 | Fuel Cell Technologies Office eere.energy.gov
2014 Electrolytic H2 Production Workshop
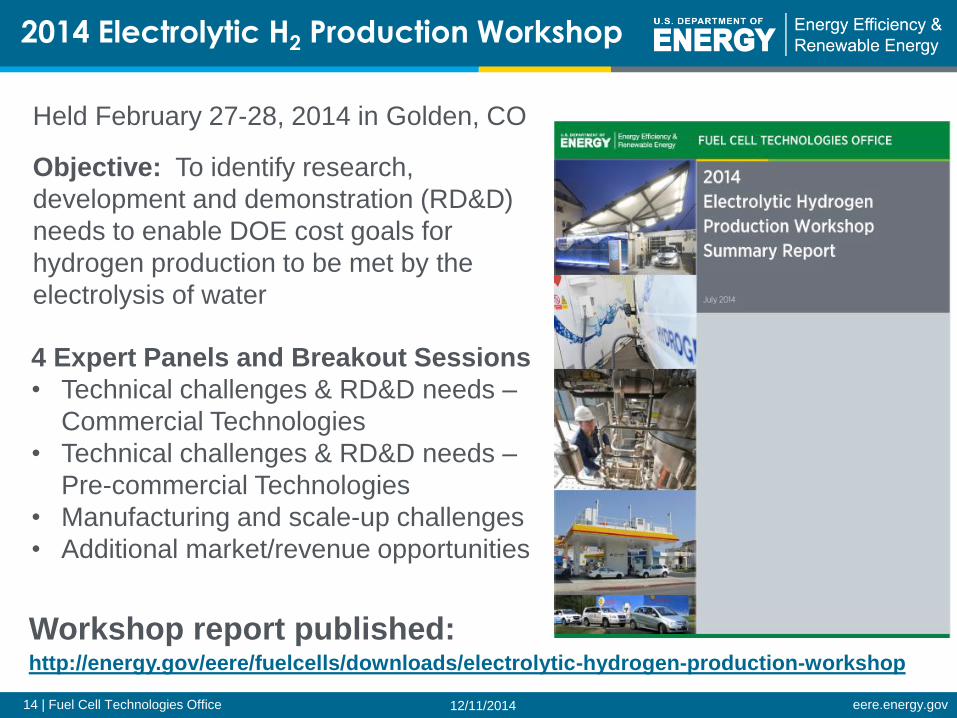
Held February 27-28, 2014 in Golden, CO
Objective: To identify research,
development and demonstration (RD&D)
needs to enable DOE cost goals for
hydrogen production to be met by the
electrolysis of water
4 Expert Panels and Breakout Sessions
• Technical challenges & RD&D needs –
Commercial Technologies
• Technical challenges & RD&D needs –
Pre-commercial Technologies
• Manufacturing and scale-up challenges
• Additional market/revenue opportunities
Workshop report published: http://energy.gov/eere/fuelcells/downloads/electrolytic-hydrogen-production-workshop
12/11/2014
15 | Fuel Cell Technologies Office eere.energy.gov
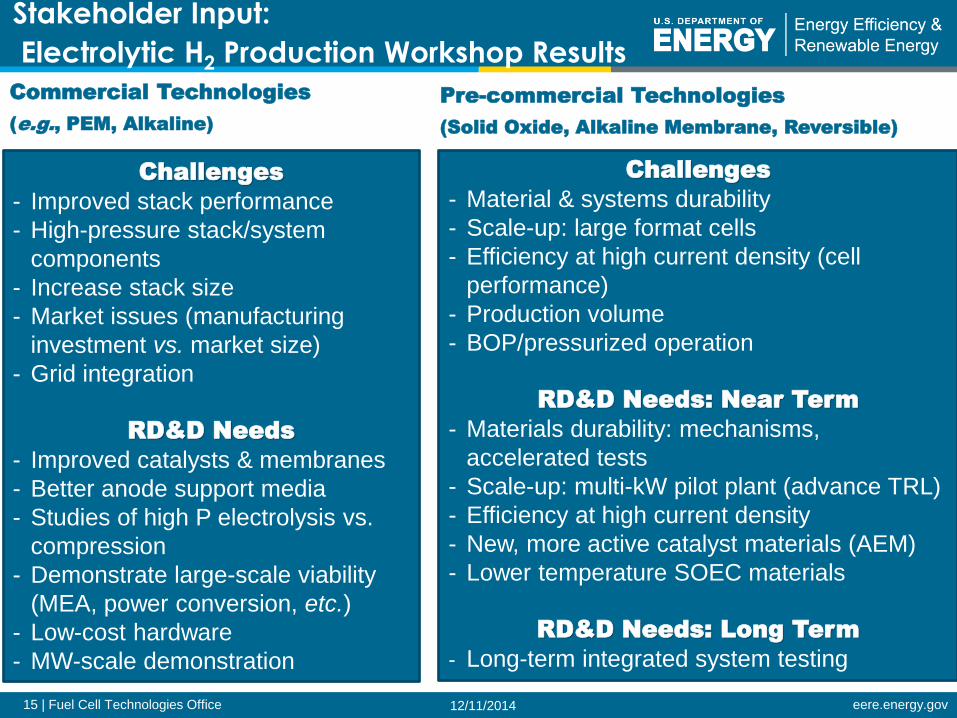
Challenges
- Improved stack performance
- High-pressure stack/system
components
- Increase stack size
- Market issues (manufacturing
investment vs. market size)
- Grid integration
RD&D Needs
- Improved catalysts & membranes
- Better anode support media
- Studies of high P electrolysis vs.
compression
- Demonstrate large-scale viability
(MEA, power conversion, etc.)
- Low-cost hardware
- MW-scale demonstration
Stakeholder Input:
Electrolytic H2 Production Workshop Results
Pre-commercial Technologies
(Solid Oxide, Alkaline Membrane, Reversible)
Challenges
- Material & systems durability
- Scale-up: large format cells
- Efficiency at high current density (cell
performance)
- Production volume
- BOP/pressurized operation
RD&D Needs: Near Term
- Materials durability: mechanisms,
accelerated tests
- Scale-up: multi-kW pilot plant (advance TRL)
- Efficiency at high current density
- New, more active catalyst materials (AEM)
- Lower temperature SOEC materials
RD&D Needs: Long Term
- Long-term integrated system testing
Commercial Technologies
(e.g., PEM, Alkaline)
12/11/2014
16 | Fuel Cell Technologies Office eere.energy.gov
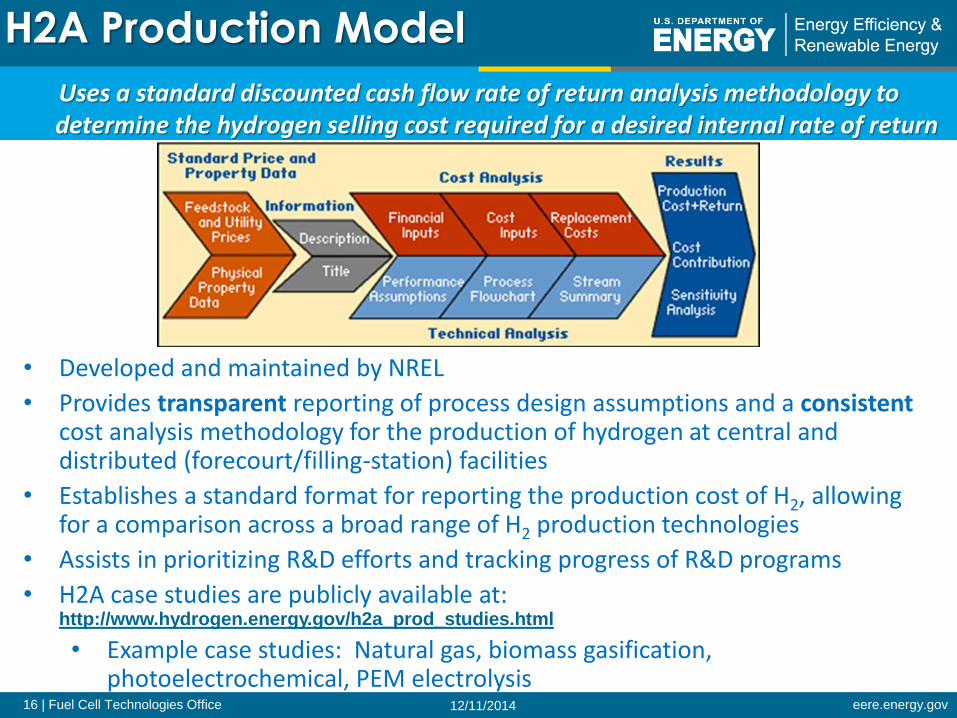
H2A Production Model
Uses a standard discounted cash flow rate of return analysis methodology to determine the hydrogen selling cost required for a desired internal rate of return
• Developed and maintained by NREL
• Provides transparent reporting of process design assumptions and a consistent cost analysis methodology for the production of hydrogen at central and distributed (forecourt/filling-station) facilities
• Establishes a standard format for reporting the production cost of H2, allowing for a comparison across a broad range of H2 production technologies
• Assists in prioritizing R&D efforts and tracking progress of R&D programs
• H2A case studies are publicly available at: http://www.hydrogen.energy.gov/h2a_prod_studies.html
• Example case studies: Natural gas, biomass gasification, photoelectrochemical, PEM electrolysis
12/11/2014
17 | Fuel Cell Technologies Office eere.energy.gov
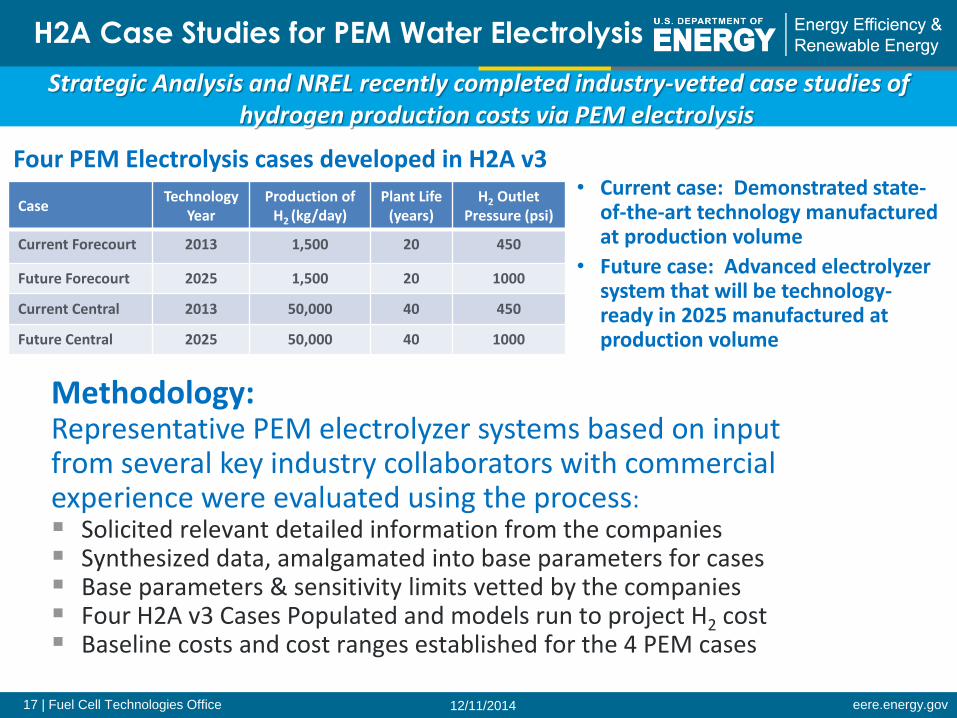
H2A Case Studies for PEM Water Electrolysis
Strategic Analysis and NREL recently completed industry-vetted case studies of hydrogen production costs via PEM electrolysis
Methodology: Representative PEM electrolyzer systems based on input from several key industry collaborators with commercial experience were evaluated using the process: Solicited relevant detailed information from the companies Synthesized data, amalgamated into base parameters for cases Base parameters & sensitivity limits vetted by the companies Four H2A v3 Cases Populated and models run to project H2 cost Baseline costs and cost ranges established for the 4 PEM cases
Case Technology
Year Production of
H2 (kg/day)
Plant Life (years)
H2 Outlet Pressure (psi)
Current Forecourt 2013 1,500 20 450
Future Forecourt 2025 1,500 20 1000
Current Central 2013 50,000 40 450
Future Central 2025 50,000 40 1000
Four PEM Electrolysis cases developed in H2A v3 • Current case: Demonstrated state-
of-the-art technology manufactured at production volume
• Future case: Advanced electrolyzer system that will be technology-ready in 2025 manufactured at production volume
12/11/2014
18 | Fuel Cell Technologies Office eere.energy.gov
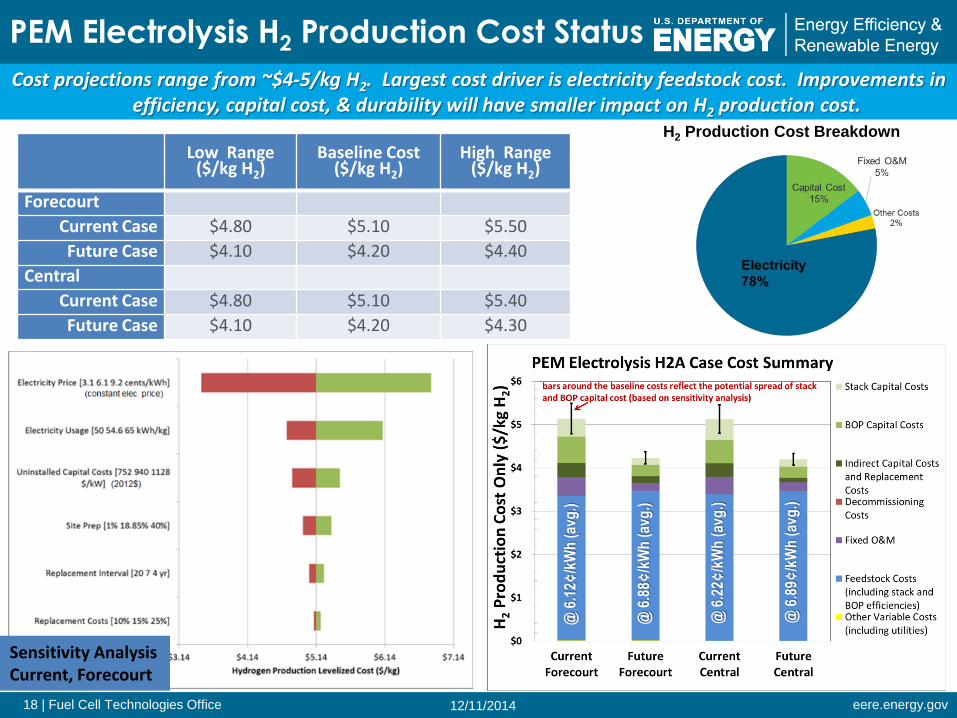
PEM Electrolysis H2 Production Cost Status
Cost projections range from ~$4-5/kg H2. Largest cost driver is electricity feedstock cost. Improvements in efficiency, capital cost, & durability will have smaller impact on H2 production cost.
Low Range ($/kg H2)
Baseline Cost ($/kg H2)
High Range ($/kg H2)
Forecourt
Current Case $4.80 $5.10 $5.50
Future Case $4.10 $4.20 $4.40
Central
Current Case $4.80 $5.10 $5.40
Future Case $4.10 $4.20 $4.30
@ 6
.12¢
/kW
h (
avg
.)
@ 6
.88¢
/kW
h (
avg
.)
@ 6
.22¢
/kW
h (
avg
.)
@ 6
.89¢
/kW
h (
avg
.)
H2 Production Cost Breakdown
Sensitivity Analysis Current, Forecourt
12/11/2014
19 | Fuel Cell Technologies Office eere.energy.gov
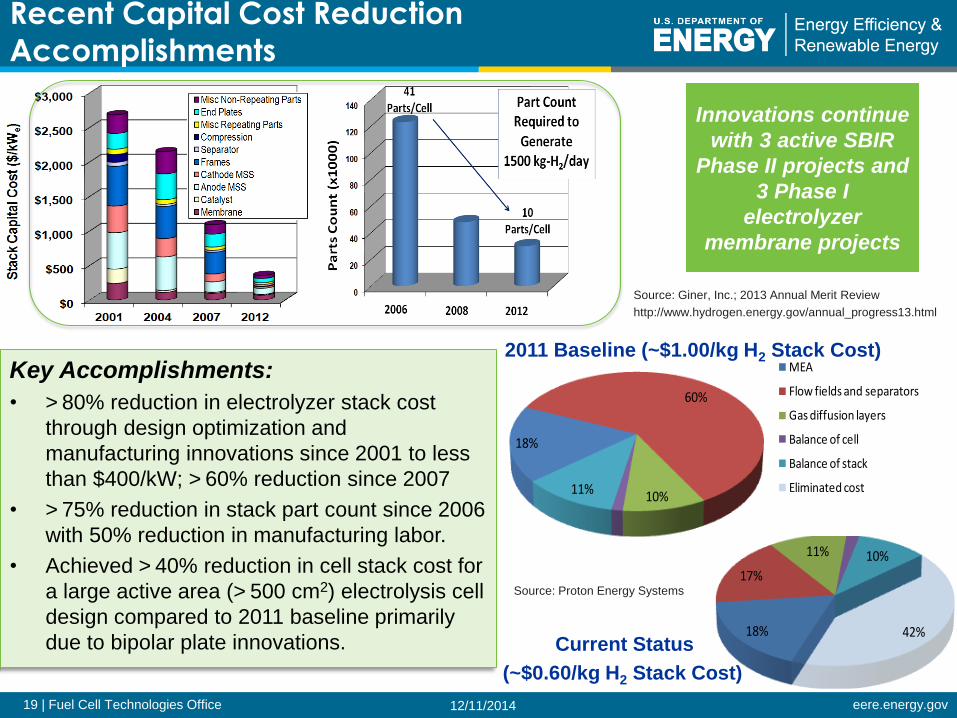
Recent Capital Cost Reduction
Accomplishments
Key Accomplishments:
• > 80% reduction in electrolyzer stack cost
through design optimization and
manufacturing innovations since 2001 to less
than $400/kW; > 60% reduction since 2007
• > 75% reduction in stack part count since 2006
with 50% reduction in manufacturing labor.
• Achieved > 40% reduction in cell stack cost for
a large active area (> 500 cm2) electrolysis cell
design compared to 2011 baseline primarily
due to bipolar plate innovations.
Innovations continue
with 3 active SBIR
Phase II projects and
3 Phase I
electrolyzer
membrane projects
Source: Giner, Inc.; 2013 Annual Merit Review
http://www.hydrogen.energy.gov/annual_progress13.html
18%
60%
10%
1%
11%
MEA
Flow fields and separators
Gas diffusion layers
Balance of cell
Balance of stack
18%
17%
11%
2%
10%
42%
MEA
Flow fields and separators
Gas diffusion layers
Balance of cell
Balance of stack
Eliminated cost
18%
60%
10%
1%
11%
MEA
Flow fields and separators
Gas diffusion layers
Balance of cell
Balance of stack
18%
17%
11%
2%
10%
42%
MEA
Flow fields and separators
Gas diffusion layers
Balance of cell
Balance of stack
Eliminated cost
2011 Baseline (~$1.00/kg H2 Stack Cost)
Current Status
(~$0.60/kg H2 Stack Cost)
Source: Proton Energy Systems
12/11/2014
20 | Fuel Cell Technologies Office eere.energy.gov
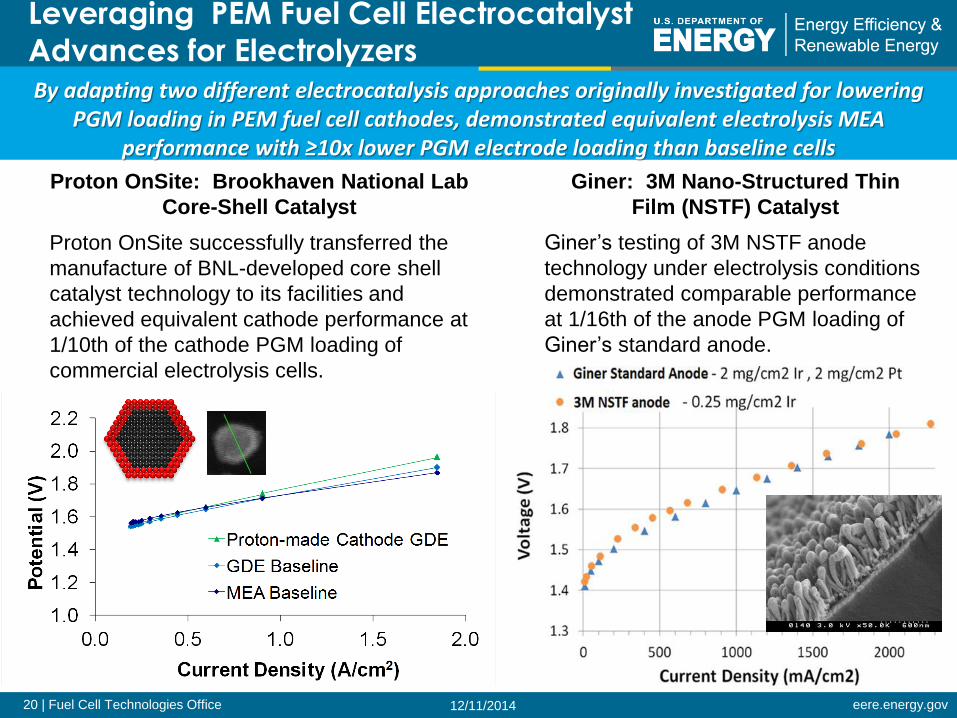
Leveraging PEM Fuel Cell Electrocatalyst
Advances for Electrolyzers
By adapting two different electrocatalysis approaches originally investigated for lowering PGM loading in PEM fuel cell cathodes, demonstrated equivalent electrolysis MEA
performance with ≥10x lower PGM electrode loading than baseline cells
Proton OnSite: Brookhaven National Lab
Core-Shell Catalyst
Giner: 3M Nano-Structured Thin
Film (NSTF) Catalyst
Proton OnSite successfully transferred the
manufacture of BNL-developed core shell
catalyst technology to its facilities and
achieved equivalent cathode performance at
1/10th of the cathode PGM loading of
commercial electrolysis cells.
Giner’s testing of 3M NSTF anode
technology under electrolysis conditions
demonstrated comparable performance
at 1/16th of the anode PGM loading of
Giner’s standard anode.
12/11/2014
21 | Fuel Cell Technologies Office eere.energy.gov
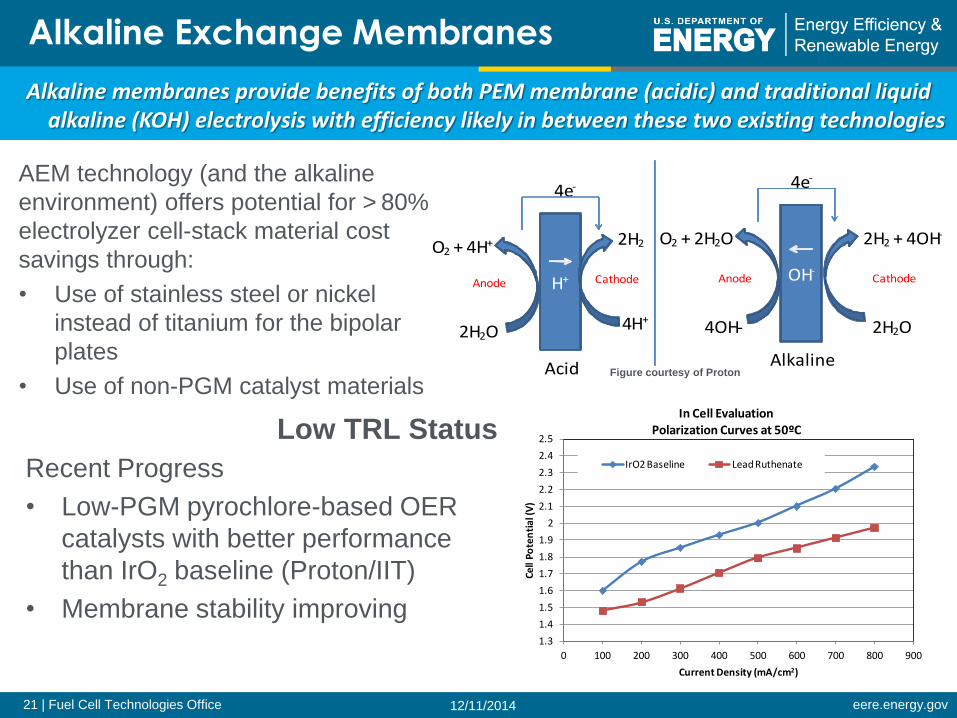
AEM technology (and the alkaline
environment) offers potential for > 80%
electrolyzer cell-stack material cost
savings through:
• Use of stainless steel or nickel
instead of titanium for the bipolar
plates
• Use of non-PGM catalyst materials
Alkaline Exchange Membranes
1.3
1.4
1.5
1.6
1.7
1.8
1.9
2
2.1
2.2
2.3
2.4
2.5
0 100 200 300 400 500 600 700 800 900
Cell
Pote
nti
al (V
)
Current Density (mA/cm2)
In Cell EvaluationPolarization Curves at 50ºC
IrO2 Baseline Lead Ruthenate
OH-
2H2O
2e-
2H2 + 4OH-
4OH-
O2 + 2H2O
4e-
Alkaline
Anode CathodeH+
4H+
2H2
2H2O
O2 + 4H+
4e-
Acid
Anode Cathode
Recent Progress
• Low-PGM pyrochlore-based OER
catalysts with better performance
than IrO2 baseline (Proton/IIT)
• Membrane stability improving
Alkaline membranes provide benefits of both PEM membrane (acidic) and traditional liquid alkaline (KOH) electrolysis with efficiency likely in between these two existing technologies
Low TRL Status
Figure courtesy of Proton
12/11/2014
22 | Fuel Cell Technologies Office eere.energy.gov
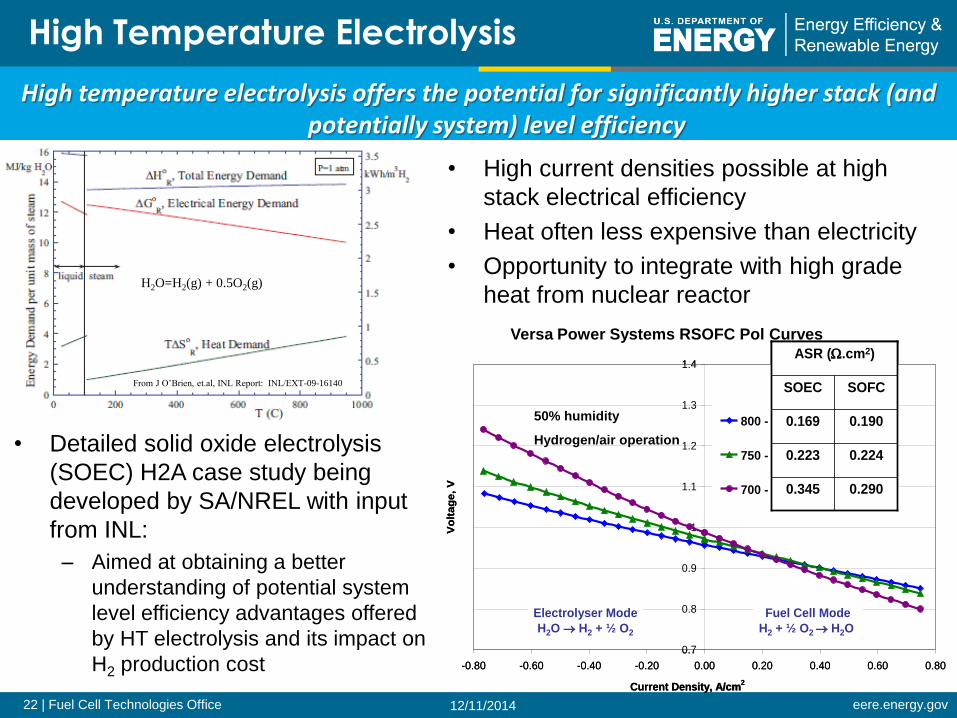
• High current densities possible at high
stack electrical efficiency
• Heat often less expensive than electricity
• Opportunity to integrate with high grade
heat from nuclear reactor
High Temperature Electrolysis
High temperature electrolysis offers the potential for significantly higher stack (and potentially system) level efficiency
Glob 101780; RSOFC-7
0.7
0.8
0.9
1
1.1
1.2
1.3
1.4
-0.80 -0.60 -0.40 -0.20 0.00 0.20 0.40 0.60 0.80
Current Density, A/cm2
Vo
lta
ge
, V
800 - V
750 - V
700 - V
ASR (.cm2)
0.2900.345
0.2240.223
0.1900.169
SOFCSOEC
Electrolyser Mode
H2O H2 + ½ O2
Fuel Cell Mode
H2 + ½ O2 H2O
Glob 101780; RSOFC-7
0.7
0.8
0.9
1
1.1
1.2
1.3
1.4
-0.80 -0.60 -0.40 -0.20 0.00 0.20 0.40 0.60 0.80
Current Density, A/cm2
Vo
lta
ge
, V
800 - V
750 - V
700 - V
ASR (.cm2)
0.2900.345
0.2240.223
0.1900.169
SOFCSOEC
Electrolyser Mode
H2O H2 + ½ O2
Fuel Cell Mode
H2 + ½ O2 H2O
50% humidity
Hydrogen/air operation
Versa Power Systems RSOFC Pol Curves
• Detailed solid oxide electrolysis
(SOEC) H2A case study being
developed by SA/NREL with input
from INL:
– Aimed at obtaining a better
understanding of potential system
level efficiency advantages offered
by HT electrolysis and its impact on
H2 production cost
H2O=H2(g) + 0.5O2(g)
From J O’Brien, et.al, INL Report: INL/EXT-09-16140
12/11/2014
23 | Fuel Cell Technologies Office eere.energy.gov
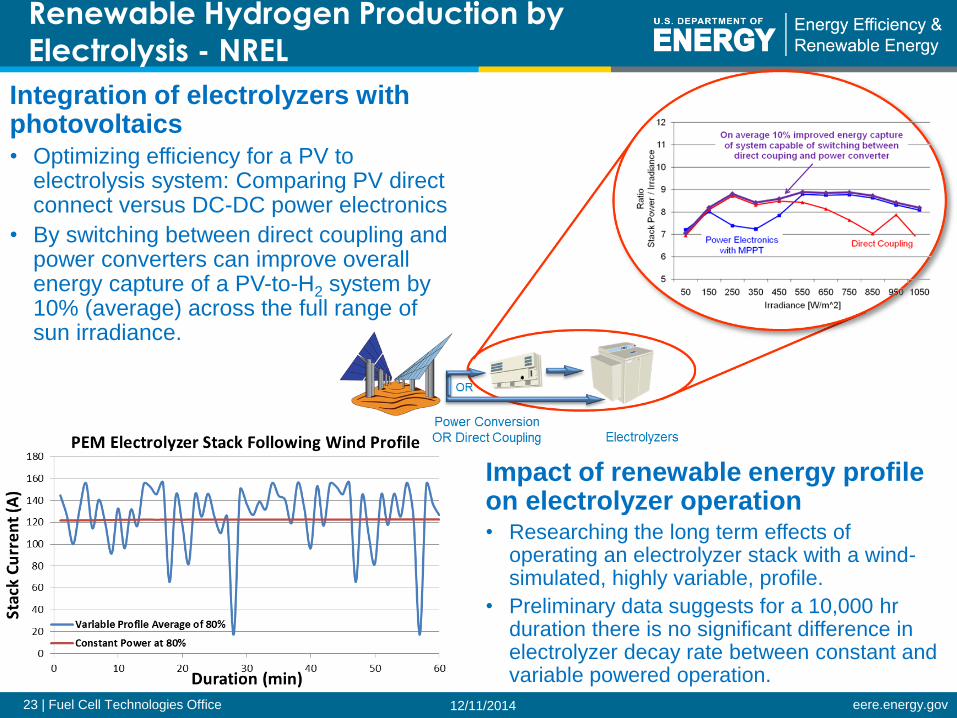
Renewable Hydrogen Production by
Electrolysis - NREL
Integration of electrolyzers with photovoltaics • Optimizing efficiency for a PV to
electrolysis system: Comparing PV direct connect versus DC-DC power electronics
• By switching between direct coupling and power converters can improve overall energy capture of a PV-to-H2 system by 10% (average) across the full range of sun irradiance.
Impact of renewable energy profile on electrolyzer operation • Researching the long term effects of
operating an electrolyzer stack with a wind-simulated, highly variable, profile.
• Preliminary data suggests for a 10,000 hr duration there is no significant difference in electrolyzer decay rate between constant and variable powered operation.
12/11/2014
24 | Fuel Cell Technologies Office eere.energy.gov
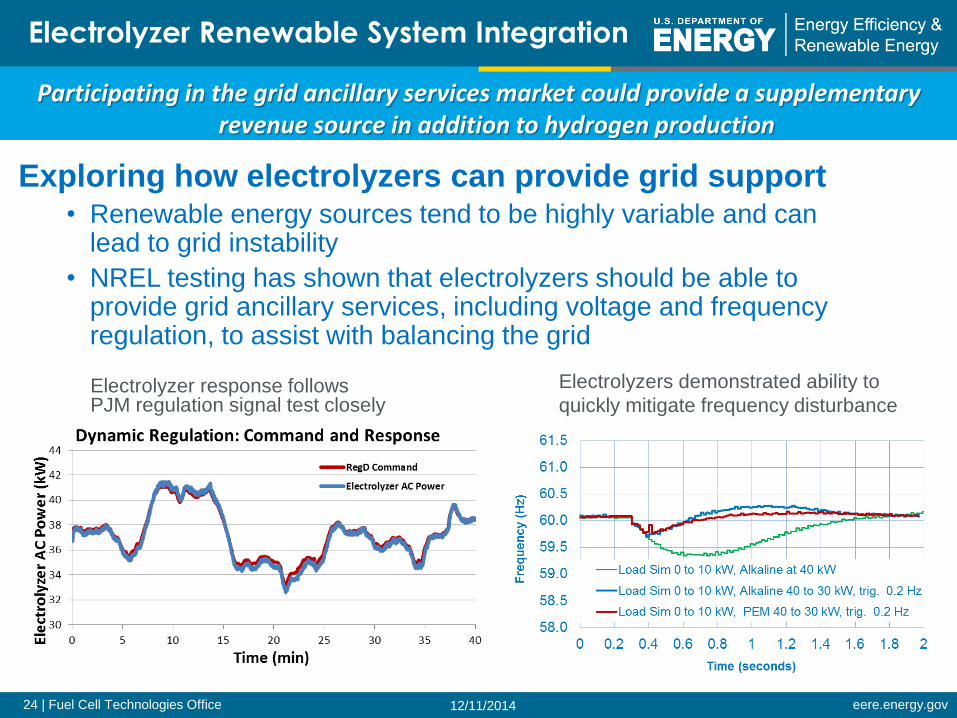
Electrolyzer Renewable System Integration
Participating in the grid ancillary services market could provide a supplementary revenue source in addition to hydrogen production
Exploring how electrolyzers can provide grid support • Renewable energy sources tend to be highly variable and can
lead to grid instability
• NREL testing has shown that electrolyzers should be able to provide grid ancillary services, including voltage and frequency regulation, to assist with balancing the grid
Electrolyzer response follows PJM regulation signal test closely
Electrolyzers demonstrated ability to
quickly mitigate frequency disturbance
12/11/2014
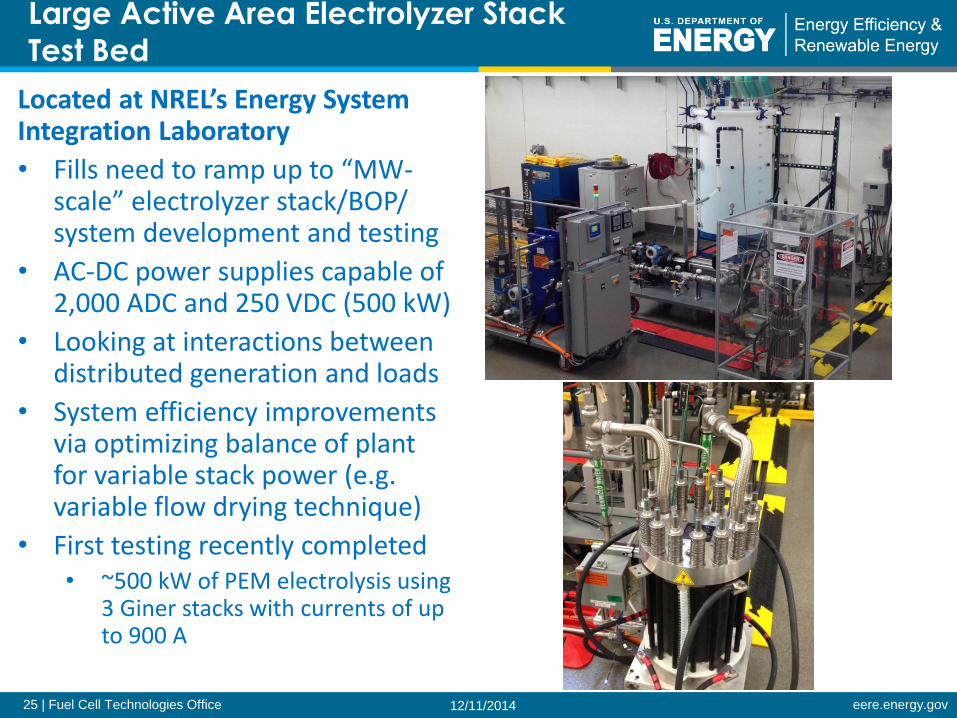
25 | Fuel Cell Technologies Office eere.energy.gov
Large Active Area Electrolyzer Stack
Test Bed
Located at NREL’s Energy System Integration Laboratory
• Fills need to ramp up to “MW-scale” electrolyzer stack/BOP/ system development and testing
• AC-DC power supplies capable of 2,000 ADC and 250 VDC (500 kW)
• Looking at interactions between distributed generation and loads
• System efficiency improvements via optimizing balance of plant for variable stack power (e.g. variable flow drying technique)
• First testing recently completed • ~500 kW of PEM electrolysis using
3 Giner stacks with currents of up to 900 A
12/11/2014
26 | Fuel Cell Technologies Office eere.energy.gov
Thank You For more information on the content of this presentation, please contact:
David Peterson
Technology Manager
Fuel Cell Technologies Office
hydrogenandfuelcells.energy.gov
12/11/2014