Embed Size (px)
Citation preview

“Overview of Transport Scenario in Delhi”
Delhi Vision 2021
Investor Meet
March 26, 2008
@ DIMTS Limited, 2008
2
Population and Vehicles Growth
2.24
6.78
Population Growth Vehicle Growh
Growth – Population Vs. Vehicles, 1981-2001
(Number in X times)
• Delhi’s population is growing at an
average annual growth rate of 4% since
1961. This growth is on account of:
– Its own growth
– Migration from rest of the country
– Growth of border towns of UP and
Haryana
• Between 1981 and 2001, Delhi
population has grown by 2.24 times and
vehicles by 6.78 times.
– Personal vehicles per 1,000
population has grown 3 times
• With rapid growth in urban areas-
infrastructure and services related to
Transport, Energy, Housing etc are
under tremendous strain.

@ DIMTS Limited, 2008
3
Demand for Transport Services in Delhi
Year
Population (million) 14.0 19.0 23.0
Vehicles Trips (million) 16.0 23.0 29.0
Million T trips / Day 10.0 17.0 24.0
14
19
23
16
23
29
10
17
24
2003 2011 2021

@ DIMTS Limited, 2008
4
Population Projection
Population (2020): 22 million
Total Employment (2020): 9 million
Population and Total Employment 2020

@ DIMTS Limited, 2008
5
Demand Forecasting
28 Million Daily Passenger Trips by 2020
Per Capita Trip Rate 1.2
Future Modal Share
60% 62%66% 67%
23% 22% 20% 19%13% 11% 9% 9%
4% 5% 5% 5%
2004 2010 2015 2020
Public Transport Car Two Wheelers Auto

@ DIMTS Limited, 2008
6
Delhi vis-à-vis World Cities
Delhi Seoul SingaporeHong Kong
TokyoKuala Lumpur
Paris
Population Per Sq. Km. 9,340 24,500 8,700 30,100 10,400 5,900 24,448
Road Space as % of Total Area 21% NA NA 12% 13% NA 11%
Public Transport Share of Total Trips
60% 74% 72% 84% 62% 20% 31%
Speed of Vehicles (KMPH)
Public Transport 16 26 26 28 39 16 37
Other Traffic 25 24 33 26 20 29 33
Public Transport’s Speed in Delhi was impacted by growth in personal
transport, which growing at a CAGR of 6.45%.
Total vehicles was 2.24 million in 1993-94 and increased to 4.6million in 2006-07

@ DIMTS Limited, 2008
7
Availability of Road Length in Delhi
1,922 1,922
2,0702,087
2,103 2,103
6.466.98
7.44
7.97.888.45
0
1
2
3
4
5
6
7
8
9
2000-01 2001-02 2002-03 2003-04 2004 - 2005 2005 - 2006
in k
ilom
ete
rs
1800
1850
1900
1950
2000
2050
2100
2150
in k
ilom
ete
rs
Average length of road per 100 square kilometers Road length per thousand vehicles ( in kilometers)
Between 1996 and 2006 total road length in Delhi has increased by about 20%,
but cars increased by 132%.
Delhi has 21% of its area under roads; only quarter of its population own cars;
cars and two-wheelers together drive less than 20% of its people -- and yet roads
are choked

@ DIMTS Limited, 2008
8
Transport Integration Issues
Route Integration
Fare Integration
Institutional Integration
Financial Integration
Informational Integration
Planning Integration
Integration is the key to sustainable and need responsive public transport

@ DIMTS Limited, 2008
9
Traditional problem solving
Most of the developed countries and some of the developing countries are building the car oriented infrastructure.

@ DIMTS Limited, 2008
10
Efficient Use of Urban Space
50 cars or 60 bicycles or 1 bus
To solve the traffic problem in Delhi, the best method is the construction of the public transport oriented infrastructure.

@ DIMTS Limited, 2008
11
Infrastructure for Urban Transport
• Rail transit with existing inter city rail
infrastructure
• Roads suffer from encroachments.
33% approx is lost including that too
by hawkers and road side businesses.
• Efficiency of road can be improved by
removal of encroachment,
construction of missing links and
maintenance of road surface. Grade
separated entries for regional traffic
and be-passes for not destined for
Delhi. Adequate number of river
crossings.
Main Infrastructure
Bridges, Drains, Railway tracks, Road bye-passes, Bus terminals, Facilities for intermodal transfer, Parking of vehicles,
Pedestrians, Bicycles and Bus Lanes.
Roads, Associated facilities, Road network, Quality of
road, Street furniture, Intersections, Signals, Round
about, Grade separators,

@ DIMTS Limited, 2008
12
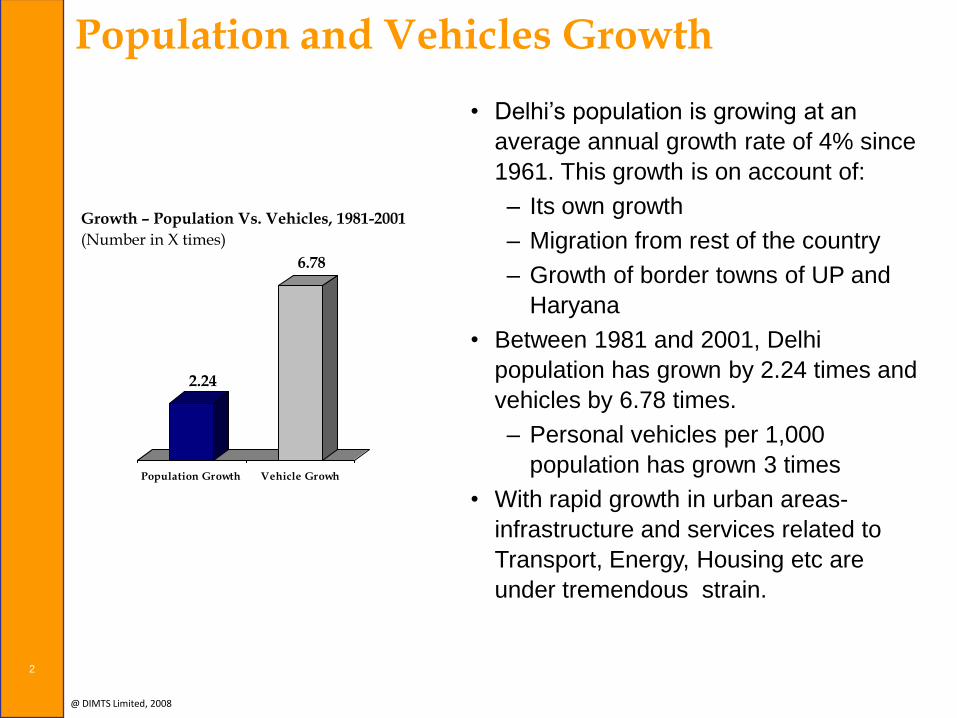
Proposed Projects:
New Modes of Transports
Metro Rail Phase II & Phase III 115 km
Mono Rail 48 km
Light Rail 74 km
Improving the Current Infrastructure
BRT Corridor 294 km
Private Stage Carriage Corporatisation --
Development of ISBTs 4 ISBT
Procurement of New Buses More than 2,500 Buses
13
MUNDKA
NEW ASHOK NGR
SAHIBABAD
GHAZIABAD
METRO PHASE-I
METRO PHASE-III &IV
LRT
MONORAIL
IRBT
BADARPUR
KALINDI KUNJ
MALVIYA
NGR
AMBEDKAR
NGR
SHAHBAD
MOHAMMADPUR
GURGAON RS
KALKAJI
GHEVRA
WAZIRPUR
PUSA
MANDI FATEHPUR
IGIA
AZADPUR
NANDNAGRI
METRO PHASE-II
NARELA
IBRAHIMPUR
KARAWAL NGRJAHANGIRPURI
PUTHKHURD
RITHALA
TILAK NGR
PALAM
KIRTI NGRPULBAN
GASH
ISBT
SHAHDARA
DWARKA
KAPASHEDA
BORDER
VASANT
KUNJ
QUTUB
MINAR
AIIMS
SEELAMPUR
DU
SHAKTI NGRINDERLOK
CP
GOKULPURI
RAJOKRI
BRAR SQUARE
DABRI MOR
Vision 2021SANOTH
BAWANA
BUDH VIHAR
KANJHAWALA
RANHAULA
NAJAFGARH
KAKROLA
HASTSAL
PUNJABI
BAGH
PASCHIM
VIHAR
KHERAKHURD
WAZIRABAD
SHASTRI
PARK
DELHI
GATE
AV ISBT
KONDLIIP
SAGARPUR
DHAULA
KUAN
MOOLCHAND
JAMIA
INDIA
GATE
C.SEC. TILAK
BRIDGE
SCOPE
KARKAR
DUMA
RAJA
GARDEN
MAYAPURI
HYATT
ASHRAM
GAZIPUR
MEERA BAGH
MAJOR INTERCHANGE
HCBS
MINOR INTERCHANGE

@ DIMTS Limited, 2008
14
New Modes of Public Transport
Mono Rail
Light Rail
Metro Rail

@ DIMTS Limited, 2008
Metro Rail• Under Phase I, Delhi Metro in Delhi consisting of 3 lines covering 65 km.
• Phase II of the Delhi Metro will cover 53.02 kms of track, with 45 stations. There would be 6 lines under phase II
– Delhi University to Jehangirpuri (6.36 kms with 7 stations).
– Central Secretariat to Qutub Minar (10.87 km with 9 stations).
– Indraprastha to New Ashok Nagar via Yamuna Depot in East Delhi (18.07 km with 5 stations).
– Yamuna Depot to Anand Vihar ISBT (6.16 km with 5 stations).
– Shahadara to Dilshad Garden (3.09 km with 3 stations).
– Kirti Nagar to Mundka (18.47 km with 16 stations).
15

@ DIMTS Limited, 2008
Mono Rail• The government proposed to construct 3 corridors, covering a length of 47.8
km.
• The feasibility study has been completed and the report has been submitted to cabinet for approval.
16
Corridor Length (km)
Line 1: Rohini Sector 21 to Red Fort 28.5
Line 2: Kalyan Puri – Pul Mithai 15.5
Line 3: Gulabi Bagh – Delhi University 3.8
Proposed Corridors Types of Mono Rail

@ DIMTS Limited, 2008
Light Rail
• The government proposed to construct 3 corridors, covering a length of 45 km.
• The feasibility study has been completed and the report has been submitted to cabinet for approval.
17
Corridor Length (km)
Line 1: Mehrauli – Badarpur 11.5
Line 2: Mehrauli - Dwarka-Sector 22 17.5
Line 3: Mehrauli – Sachivalaya 15.9
Proposed Corridors Types of Light Rail

@ DIMTS Limited, 2008
18
Improving the Current Infrastructure
BRT Corridor
Low Floor AC Buses

@ DIMTS Limited, 2008
BRT Corridor
19
Corridor (Name) Length (km)
Ambedkar Nagar - Delhi Gate 14.5
Moolchand – Jehangirpuri 27.5
Shastri Park - Karawal Nagar 8.8
Kondli – Gokulpuri 15.7
Rajender Nagar - Pragati Maidan 10.80
Nizamuddin – Nandnagri 17.10
Jamia - Tilak Nagar 26.6
• The government has completed ‘Techno Feasibility Studies’ for 6 BRT
corridors in Phase 1.
• First Corridor from Dr. Ambedkar Nagar to Moolchand will be operational in
the early April 2008.
• The complete stretch from Dr. Ambedkar Nagar to Delhi Gate will be
operational by 2008.

@ DIMTS Limited, 2008
20
Present Scenario

@ DIMTS Limited, 2008
21
BRT Corridor Model

@ DIMTS Limited, 2008
Private Stage Carriage Corporatisation
• Bus services are important as they will always form a major component
of city transport
• Quality of service must be upgraded
• Two Features are vital
–Operation to be monitored electronically through vehicle tracking
system to ensure punctual service
–Central parking depots so that every vehicle can be checked for
cleanliness and fitness before it goes out for service
22

@ DIMTS Limited, 2008
Development of ISBT• Upgradation and development of 3 ISBTs
– Kashmere Gate
– Anand Vihar
– Sarai Kale Khan
• Dwarka, a green field projects, is proposed to be done on BOT basis with
DIMTS Ltd as Bid Process Manager
23
ISBT – Kashmere Gate
• Renovation and Upgradation of the
current facilities
• Multi-level parking structure
• Utilizing the large space available
for commercial and recreational
activities
• Real estate development

@ DIMTS Limited, 2008
Procurement of New Buses
• DTC is looking to procure more than 2,500 buses for the Delhi City
operations.
–525 (five hundred and twenty five) new low floor CNG propelled
Buses (500 Non-AC and 25 AC)
–1,000 (one thousand) Standard Floor CNG Propelled City Buses
–1,000 (one thousand) semi-low floor CNG propelled city Buses
24

@ DIMTS Limited, 2008
Thank You
25