Embed Size (px)
Citation preview

WP/04/64
Overview of the Indian Corporate Sector: 1989–2002
Petia Topalova

© 2004 International Monetary Fund WP/04/64
IMF Working Paper
Asia and Pacific Department
Overview of the Indian Corporate Sector: 1989–2002
Prepared by Petia Topalova1
Authorized for distribution by Kalpana Kochhar
April 2004
Abstract
This Working Paper should not be reported as representing the views of the IMF. The views expressed in this Working Paper are those of the author(s) and do not necessarily represent those of the IMF or IMF policy. Working Papers describe research in progress by the author(s) and are published to elicit comments and to further debate.
This paper uses firm-level data to examine the performance of India’s nonfinancial corporate sector since 1989 and evaluate its financial vulnerabilities. While promising trends in liquidity, profitability, and leverage of the sector emerged in the early 1990s, they experienced a reversal after 1996. Nonetheless, most indicators were still at comfortable levels, and there is evidence of improvement in 2002, the last year in our sample. However, a number of firms still face problems servicing their debt obligations, posing a risk to lenders. In particular, the aggregate interest coverage of the corporate sector indicates that potential nonperforming loans of the corporate sector remain high. This underscores the need for close monitoring of the corporate sector in the future. JEL Classification Numbers: G20, G30, O53 Keywords: Indian corporate sector, Indian financial sector Author’s E-Mail Address: [email protected]
1 This paper was prepared while the author was a summer intern in the Asia and Pacific Department in 2003. The author is currently a Ph.D. candidate in economics at the Massachusetts Institute of Technology. I would like to thank David Cowen and Kalpana Kochhar for their guidance and overall support. Special thanks are due to Shawn Cole for his helpful comments.

- 2 -
Contents Page
I. Introduction..............................................................................................................3 II. Overview of the Corporate Sector ...........................................................................4 III. Financial Performance of the Corporate Sector.......................................................6 IV. Corporate Governance in India..............................................................................24 V. Conclusion .............................................................................................................27 Box 1. Legal and Regulatory Framework for the Corporate Sector Prior to the 1991 Reforms....................................................................................5 Figures 1. Share of External Finance of Indian Companies .....................................................7 2. Companies’ Leverage ..............................................................................................8 3. Distribution of Leverage of Companies.................................................................10 4. Companies’ Current Ratio .....................................................................................13 5. Distribution of Current Ratio of Companies..........................................................14 6. Companies’ Interest Coverage...............................................................................15 7. Distribution of Interest Coverage Ratio of Companies..........................................16 8. Measures of Nonperforming Loans .......................................................................18 9. Median Interest Rate by Ownership Category.......................................................18 10. Companies’ Profitability........................................................................................20 11. Distribution of Profitability of Companies ............................................................21 Tables 1. Growth in the Corporate Sector, 1989–2002 .........................................................28 2. Selected Indicators on Registered Companies .......................................................29 3. Pattern of Equity Ownership of Registered Companies in 2002 ...........................30 4. International Comparison of Key Financial Ratios of the Corporate Sector (end-2002).................................................................................................31 5. Debt Structure of Corporate Sector, 1990–2002....................................................32 6. Liquidity Analysis of Corporate Sector, 1989–2002 .............................................33 7. Source of Debt Financing of Corporate Sector, 1989–2002..................................34 Appendix I. Data Sources ..........................................................................................................35 References..........................................................................................................................39

- 3 -
I. INTRODUCTION
India launched a series of economic reforms in 1991 in response to a severe balance of payments crisis, many of which directly or indirectly led to a substantial liberalization of the corporate sector. The reforms aimed at easing restrictions on firms’ activities and enhancing overall competition by putting an end to the ‘license raj,’ liberalizing the foreign trade regime, and opening the financial sector. The freeing of capital markets and entry of foreign investors brought new financing and ownership opportunities and significantly raised the volume of new equity issues. While India withstood the Asian financial crisis of 1997–98 comparatively well, the fallout from the crisis demonstrated that the corporate sector could play an important role in transmitting financial shocks and putting the financial sector at risk. Mismatches in the corporate sector’s balance sheet brought to light both domestic and external vulnerabilities. As evidenced in the Asian crisis, the deterioration in creditworthiness of large segments of the corporate sector sharply increased nonperforming loans (NPLs), curtailed new investment, and contributed to capital flight, all of which adversely affected economic activity as a whole. This paper uses firm-level data to examine the performance of India’s nonfinancial corporate sector since 1989 and evaluate its financial vulnerabilities. The 1990s were a dynamic period for most Indian companies, especially in the first half of the decade, which was characterized by high sales growth, improved profitability, and strengthened finances. The second half of the 1990s witnessed some reversal of these trends, with the variation in the performance of Indian companies increasing and the gap between the best and worst performers growing substantially, as firms were forced to compete in the new economic environment. Yet, despite some signs of weakening in the corporate sector, most indicators are still at comfortable levels, and there is evidence of improvement in almost all indicators during 2002, the last year in our sample. However, an examination of the balance sheets of Indian companies suggests that an increasing number of firms could face problems servicing their debt obligations, which may pose some risk to lenders. In particular, the aggregate interest coverage of the nonfinancial corporate sector indicates a share of potential NPLs in total corporate borrowings of as high as 38 percent in 1999, and down only slightly in recent years.2 This underscores the need for close monitoring of the corporate sector in the future. The remainder of this paper is organized as follows. Section II gives an overview of India’s corporate sector through 2002, including its size and composition, regulatory framework, and recent reforms. Section III analyzes the financial performance of the corporate sector during 1989–2002 using firm-level data, focusing on capital structure, profitability measures, and debt repayment capacity to ascertain financial vulnerability of Indian companies. Section IV concludes with a discussion of the empirical results and their policy implications.
2 Observations made for 2001 and 2002 are subject to the caveat that data for these two years are from a smaller sample of firms than for earlier years.

- 4 -
II. OVERVIEW OF THE CORPORATE SECTOR
The economic reforms since 1991 have brought many changes to the environment in which Indian companies previously operated. The principal aim of these reforms was to strengthen market discipline and promote greater competition by putting an end to the “license raj,” namely through the abolition of the Industries Development and Regulation Act (1951) and amendments to the Companies Act and several other major laws, which had imposed a heavy legal and regulatory burden on the corporate sector (Box 1). In addition, the foreign trade regime was liberalized through cuts in tariff rates, reductions in nontariff barriers, and a streamlining of import licenses; foreign investment opportunities were increased; and shareholders’ rights were improved. Indian companies were allowed to enter into joint ventures with multinational enterprises more freely, import new technologies and capital goods, expand productive capacity, and introduce new products without obtaining industrial licenses.3 More recently, steps have been taken to dereserve a number of small-scale industries, particularly those industries with the greatest export potential. A more modern competition law has also been enacted that focuses more on anti-competitive practices, by giving greater consideration to abuse of market dominance rather than through firm size per se. Further progress is needed in reforming labor laws to allow flexibility in employment decisions in line with market conditions. The financial sector has also experienced a considerable opening. Recognizing the poor health of the financial sector, a host of reforms were implemented (as laid out by the Narasimham Committee on Financial Sector Reforms), including the deregulation of interest rates, easing of restrictions on private and foreign banks, removal of consortium lending requirements, liberalizing of bank branch licensing, and entry of private sector mutual funds and foreign institutional investors. Financial sector reforms, in particular, have acted to induce firms to improve their cash and debt management during the reform period. India’s corporate sector has grown steadily over the past two decades in terms of number of registered companies and amount of paid up capital (Table 1). The corporate sector consists of closely held (private limited) and publicly held (public limited) companies, with approximately 619,000 registered companies as of June 2003, about 40 percent of which are in the manufacturing sector.4 Private limited companies comprise the majority of firms in the corporate sector, but account for less than one–third of total paid up capital (Table 2). Government-owned enterprises (both public and private limited) are comparatively few
3 See Chopra et. al. (1995) for a complete description of the macroeconomic and structural reforms in the aftermath of the 1991 crisis.
4 Among the private limited companies, there is a further subdivision into family-run business group companies and stand-alone companies. Group companies represent 34 percent of the companies in the sample and tend to be more diversified than stand-alone companies.

- 5 -
Box 1. India: Legal and Regulatory Framework for the Corporate Sector Prior to the 1991 Reforms
India is a common law country, with the legal framework for regulating registered companies largely evolving from its colonial past. Nevertheless, these laws were not always properly enforced, and the problems in corporate governance often have been pointed out as impediments to the sound performance of Indian companies. In recent years, an increasing number of firms have realized the necessity for greater transparency, independent management, and the protection of minority shareholders and creditors in order to remain competitive in the expanding capital markets. This section summarizes the institutional framework in which the Indian corporate sector operates, drawing on the excellent surveys on the topic by Goswami (2002), Sarkar and Sarkar (1999), and the World Bank’s Report on Observance of Standards and Codes on Corporate Governance (2000). Prior to the 1991 reform, the main legislative acts governing Indian companies were the following: • The Companies Act of 1956 (largely based on its British counterpart) established the modern legal
and regulatory framework for the corporate sector, giving power to the central government to monitor, regulate, and control the affairs of companies, including establishing the types and structure of companies and registration and reporting requirements.
• The Capital Issues (Control) Act, 1947 required any firm seeking to issue securities to obtain approval from the central government; this was done to ensure that the country’s financial resources were channeled into areas that served the government’s goals and priorities.
• The 1951 Industries Development and Regulation (IDR) Act put in place a system of mandatory licenses, which acted to limit a firm’s ability to expand capacity, change product mix, introduce new processes, and import machinery and equipment without obtaining various licenses from the central government.
• The Industrial Policy Resolution of 1956 reserved certain industries for the public sector, thus creating a large state-owned industrial and services sector.
• Finally, the 1969 Monopolies and Restrictive Trade Practices Act paved the way for widespread nationalization of Indian companies by establishing an asset-based classification of monopoly, but applying only to the private sector.
The government of India also had a number of policies aimed at directing the development of the corporate sector. • Small-scale industries were specifically encouraged since 1967, and many product lines were
reserved for the small-scale sector. This policy was put on a statutory footing by amending the IDR Act in 1984.
• A policy of import substitution was implemented with high tariffs and a requirement of multiple import licenses, shielding domestic firms from foreign competition.
• In order to foster industrialization, the government also set up three development finance institutions: the Industrial Development Bank of India (IDBI), the Industrial Finance Corporation of India (IFCI), and the Industrial Credit and Investment Corporation of India (ICICI), whose mission was to lend to industrial enterprises, often at below-market interest rates.
• With interest rates regulated by the government, competition among financial institutions was very limited. Public financial institutions, which supplied the vast majority of loans to the public sector, had little incentive to monitor the lending activity (Khanna et al., 1999), which led to excess leveraging.
- 6 -
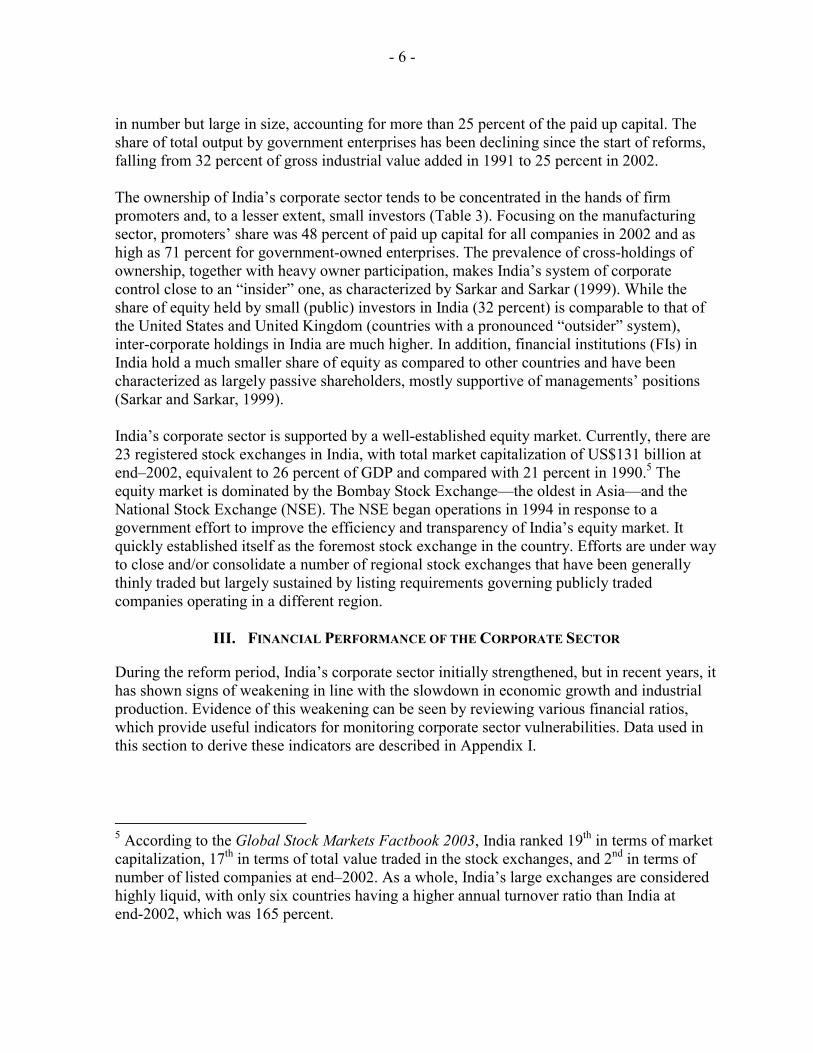
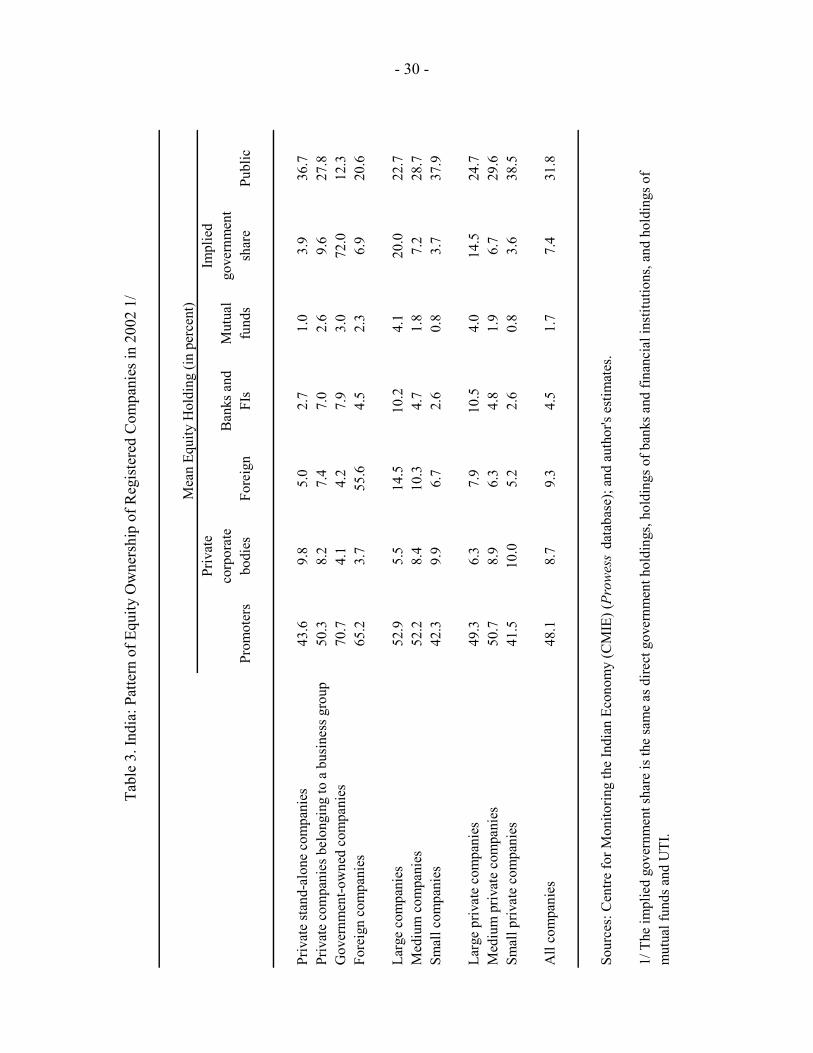
in number but large in size, accounting for more than 25 percent of the paid up capital. The share of total output by government enterprises has been declining since the start of reforms, falling from 32 percent of gross industrial value added in 1991 to 25 percent in 2002. The ownership of India’s corporate sector tends to be concentrated in the hands of firm promoters and, to a lesser extent, small investors (Table 3). Focusing on the manufacturing sector, promoters’ share was 48 percent of paid up capital for all companies in 2002 and as high as 71 percent for government-owned enterprises. The prevalence of cross-holdings of ownership, together with heavy owner participation, makes India’s system of corporate control close to an “insider” one, as characterized by Sarkar and Sarkar (1999). While the share of equity held by small (public) investors in India (32 percent) is comparable to that of the United States and United Kingdom (countries with a pronounced “outsider” system), inter-corporate holdings in India are much higher. In addition, financial institutions (FIs) in India hold a much smaller share of equity as compared to other countries and have been characterized as largely passive shareholders, mostly supportive of managements’ positions (Sarkar and Sarkar, 1999). India’s corporate sector is supported by a well-established equity market. Currently, there are 23 registered stock exchanges in India, with total market capitalization of US$131 billion at end–2002, equivalent to 26 percent of GDP and compared with 21 percent in 1990.5 The equity market is dominated by the Bombay Stock Exchange—the oldest in Asia—and the National Stock Exchange (NSE). The NSE began operations in 1994 in response to a government effort to improve the efficiency and transparency of India’s equity market. It quickly established itself as the foremost stock exchange in the country. Efforts are under way to close and/or consolidate a number of regional stock exchanges that have been generally thinly traded but largely sustained by listing requirements governing publicly traded companies operating in a different region.
III. FINANCIAL PERFORMANCE OF THE CORPORATE SECTOR
During the reform period, India’s corporate sector initially strengthened, but in recent years, it has shown signs of weakening in line with the slowdown in economic growth and industrial production. Evidence of this weakening can be seen by reviewing various financial ratios, which provide useful indicators for monitoring corporate sector vulnerabilities. Data used in this section to derive these indicators are described in Appendix I.
5 According to the Global Stock Markets Factbook 2003, India ranked 19th in terms of market capitalization, 17th in terms of total value traded in the stock exchanges, and 2nd in terms of number of listed companies at end–2002. As a whole, India’s large exchanges are considered highly liquid, with only six countries having a higher annual turnover ratio than India at end-2002, which was 165 percent.

- 7 -
40
50
60
70
80
1990 1991 1992 1993 1994 1995 1996 1997 1998 1999 2000 2001 2002
Figure 1. Share of External Finance of Indian Companies (In percent)
Sources: Centre for Monitoring the Indian Economy (CMIE), Prowess database; and author's estimates.
Sources of Funds Indian companies continue to rely heavily on external sources of finance (i.e., outside the firm), averaging 67 percent during 1990–2002 (Figure 1).6 While the amount of new equity finance raised has been large in recent years, Indian companies are still dependent on debt finance, including bank borrowings. For the year ending March 2002, external financing accounted for 56 percent of total corporate funds raised, with slightly more than two–fifths of this from capital markets (including bonds and debentures). In addition, new financial instruments such as commercial paper (including private placements), certificates of deposit, and inter-corporate deposits have gained popularity as a source of financing. More recently, some firms have also begun to raise funds through external commercial borrowing. The dependence on external sources of finance, especially on debt finance, makes India’s corporate sector relatively vulnerable to domestic financial shocks. At the macro-level, this vulnerability stems from large fiscal deficits (for the general government estimated at 10½ percent of GDP in fiscal year (April–March) 2002/03) and sizable government debt (estimated at 83 percent of GDP, a majority of which is domestic debt and largely held by government-owned banks and FIs), which has the potential to crowd out private investment and slow growth. Indian companies are also more leveraged and have larger short-term borrowing (as a share of total borrowing) than their counterparts in other Asian countries and elsewhere (Table 4). Offsetting these risk factors, Indian companies tend to have comparatively low foreign exposure. Leverage and Debt Structure The average debt-to-equity ratio for Indian companies bottomed out at 1.2 in 1996, but has since risen to 1.4 in 2002, close to the 1990 level (Figure 2). The aggregate picture, however, masks several interesting developments in the corporate sector.
6 In contrast, the share of external finance is less than 40 percent in the United States, the United Kingdom, and Germany. The reliance of Indian corporations on external sources to finance investments is similar to that in Finland, France, and Italy, as pointed out by Cobham et al. (1998).

- 8 -
Figure 2. Companies’ Leverage
Aggregate and Median Debt-Equity Ratio
0.0
0.2
0.4
0.6
0.8
1.0
1.2
1.4
1.6
1.8
2.0
1989 1991 1993 1995 1997 1999 2001
Aggregate Median
Aggregate Debt-Equity Ratio by Trend
0
1
2
3
4
5
6
7
1989 1991 1993 1995 1997 1999 2001
Companies with rising ratio Companies with falling ratioYoung companies
Aggregate Debt-Equity Ratio by Ownership Category
0.0
0.5
1.0
1.5
2.0
2.5
3.0
3.5
1989 1991 1993 1995 1997 1999 2001
Stand Alone Group Government Foreign
Median Debt-Equity Ratio by Ownership Category
0.0
0.5
1.0
1.5
2.0
2.5
3.0
3.5
1989 1991 1993 1995 1997 1999 2001
Stand Alone Group Government Foreign
Aggregate Debt-Equity Ratio by Company Size
0
1
2
3
4
5
6
7
8
9
1989 1991 1993 1995 1997 1999 2001
Large Medium Small
Median Debt-Equity Ratio by Company Size
0.00.20.4
0.60.81.01.21.4
1.61.82.0
1989 1991 1993 1995 1997 1999 2001
Large Medium Small
Sources: CMIE, Prowess database; and author’s estimates.
- 9 -
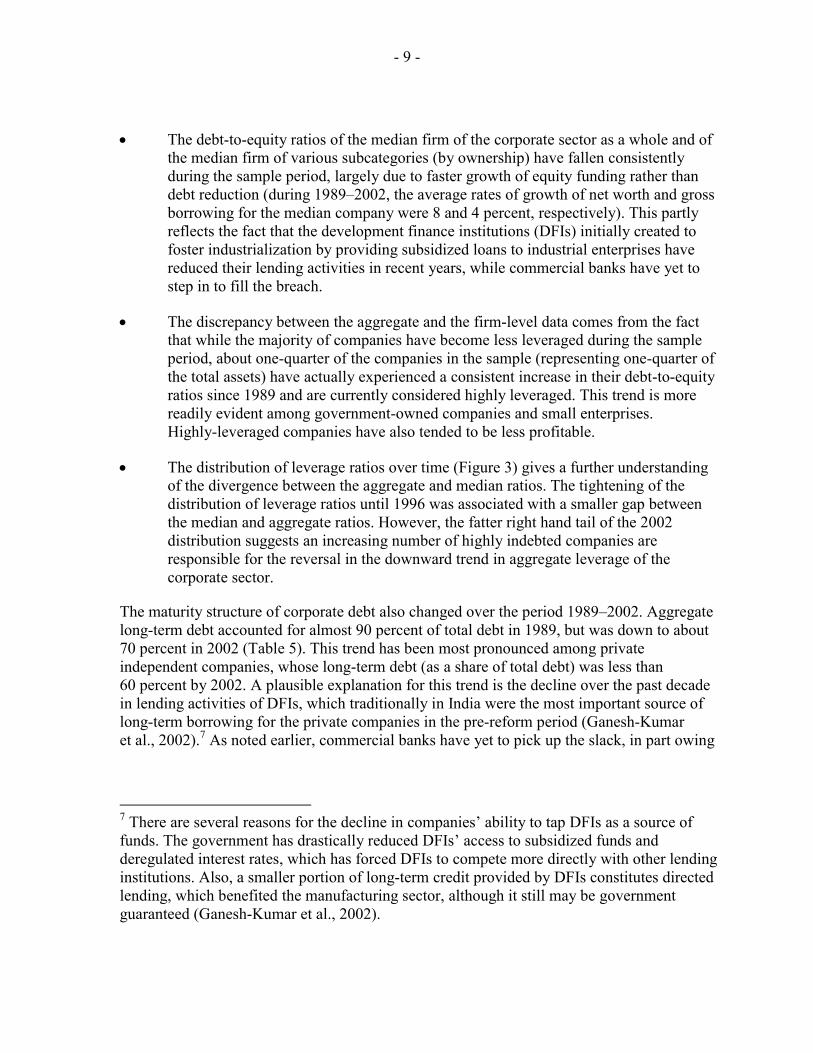
• The debt-to-equity ratios of the median firm of the corporate sector as a whole and of the median firm of various subcategories (by ownership) have fallen consistently during the sample period, largely due to faster growth of equity funding rather than debt reduction (during 1989–2002, the average rates of growth of net worth and gross borrowing for the median company were 8 and 4 percent, respectively). This partly reflects the fact that the development finance institutions (DFIs) initially created to foster industrialization by providing subsidized loans to industrial enterprises have reduced their lending activities in recent years, while commercial banks have yet to step in to fill the breach.
• The discrepancy between the aggregate and the firm-level data comes from the fact that while the majority of companies have become less leveraged during the sample period, about one-quarter of the companies in the sample (representing one-quarter of the total assets) have actually experienced a consistent increase in their debt-to-equity ratios since 1989 and are currently considered highly leveraged. This trend is more readily evident among government-owned companies and small enterprises. Highly-leveraged companies have also tended to be less profitable.
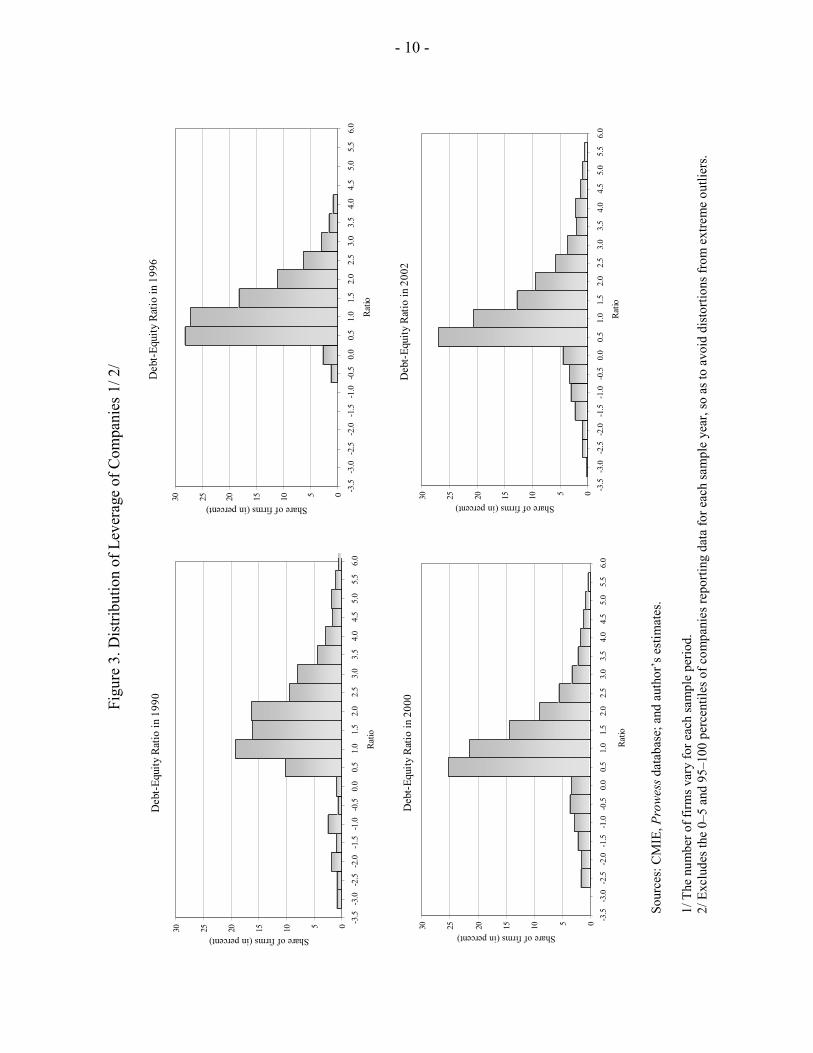
• The distribution of leverage ratios over time (Figure 3) gives a further understanding of the divergence between the aggregate and median ratios. The tightening of the distribution of leverage ratios until 1996 was associated with a smaller gap between the median and aggregate ratios. However, the fatter right hand tail of the 2002 distribution suggests an increasing number of highly indebted companies are responsible for the reversal in the downward trend in aggregate leverage of the corporate sector.
The maturity structure of corporate debt also changed over the period 1989–2002. Aggregate long-term debt accounted for almost 90 percent of total debt in 1989, but was down to about 70 percent in 2002 (Table 5). This trend has been most pronounced among private independent companies, whose long-term debt (as a share of total debt) was less than 60 percent by 2002. A plausible explanation for this trend is the decline over the past decade in lending activities of DFIs, which traditionally in India were the most important source of long-term borrowing for the private companies in the pre-reform period (Ganesh-Kumar et al., 2002).7 As noted earlier, commercial banks have yet to pick up the slack, in part owing
7 There are several reasons for the decline in companies’ ability to tap DFIs as a source of funds. The government has drastically reduced DFIs’ access to subsidized funds and deregulated interest rates, which has forced DFIs to compete more directly with other lending institutions. Also, a smaller portion of long-term credit provided by DFIs constitutes directed lending, which benefited the manufacturing sector, although it still may be government guaranteed (Ganesh-Kumar et al., 2002).
- 10 -
Figu
re 3
. Dis
tribu
tion
of L
ever
age
of C
ompa
nies
1/ 2
/
Deb
t-Equ
ity R
atio
in 1
990
051015202530
-3.5
-3.0
-2.5
-2.0
-1.5
-1.0
-0.5
0.0
0.5
1.0
1.5
2.0
2.5
3.0
3.5
4.0
4.5
5.0
5.5
6.0
Ratio
Share of firms (in percent)
Deb
t-Equ
ity R
atio
in 1
996
051015202530
-3.5
-3.0
-2.5
-2.0
-1.5
-1.0
-0.5
0.0
0.5
1.0
1.5
2.0
2.5
3.0
3.5
4.0
4.5
5.0
5.5
6.0
Ratio
Share of firms (in percent)
Deb
t-Equ
ity R
atio
in 2
000
051015202530
-3.5
-3.0
-2.5
-2.0
-1.5
-1.0
-0.5
0.0
0.5
1.0
1.5
2.0
2.5
3.0
3.5
4.0
4.5
5.0
5.5
6.0
Ratio
Share of firms (in percent)
Deb
t-Equ
ity R
atio
in 2
002
051015202530
-3.5
-3.0
-2.5
-2.0
-1.5
-1.0
-0.5
0.0
0.5
1.0
1.5
2.0
2.5
3.0
3.5
4.0
4.5
5.0
5.5
6.0
Ratio
Share of firms (in percent)
Sour
ces:
CM
IE, P
row
ess d
atab
ase;
and
aut
hor’
s est
imat
es.
1/
The
num
ber o
f firm
s var
y fo
r eac
h sa
mpl
e pe
riod.
2/ E
xclu
des t
he 0
–5 a
nd 9
5–10
0 pe
rcen
tiles
of c
ompa
nies
repo
rting
dat
a fo
r eac
h sa
mpl
e ye
ar, s
o as
to a
void
dis
torti
ons f
rom
ext
rem
e ou
tlier
s.

- 11 -
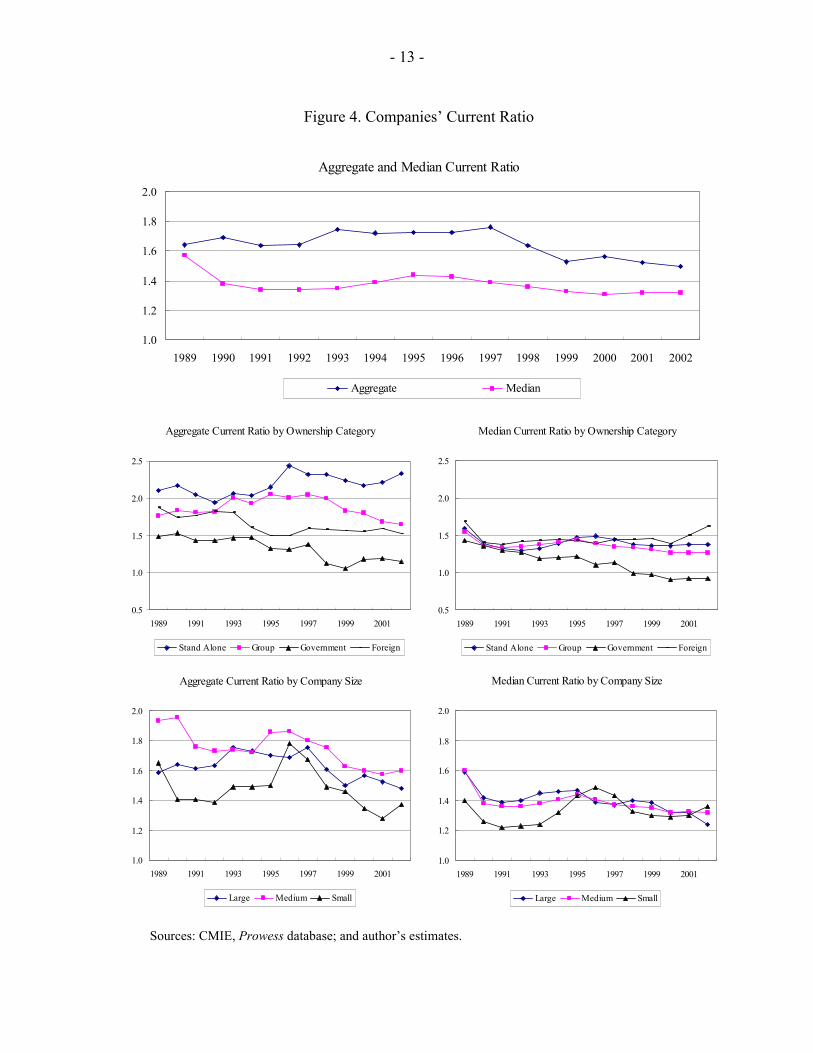
to lack of experience and aversion to risk in the new lending environment. For smaller independent companies, problems related to moral hazard and adverse selection may act to further limit their ability to obtain long-term financing. In addition, the share of foreign currency debt in total debt of the corporate sector also rose considerably in the 1990s, from 8 percent in 1990 to more than 16 percent in 2002. However, this debt remains concentrated in a relatively small number of firms, namely in large government-owned and group companies. A closer look reveals that while the aggregate share of foreign currency debt has been rising since the early 1990s, the median company in India still relies entirely on domestic and rupee-denominated borrowings. In 2002, only 17 percent of the companies had any foreign currency denominated borrowings and less than 5 percent of the companies had any foreign debt. Between 1989 and 2002, 28 percent and 8 percent of all firms reported having foreign currency denominated debt and borrowing abroad, respectively, at some point during the period. This largely reflects limits imposed by the Reserve Bank of India (RBI) on external commercial borrowing, although ceilings on firms have been relaxed in recent years.8 Given the relatively low recourse to foreign borrowing and the comfortable foreign reserves position of India, the external vulnerability of India remains low. The exposure of India’s corporate sector to foreign exchange risk also is very limited in the current environment. There is a highly significant positive correlation between foreign exchange earnings and foreign exchange borrowings after controlling for industry and time fixed effects, company size, and ownership structure, suggesting that corporations with foreign exposure are mostly naturally hedged. Nevertheless, foreign exchange exposure of the corporate sector requires careful monitoring in the future. Firms with the exposure to foreign currency denominated debt accounted for 66 percent of sales, 75 percent of net worth, and 71 percent of total assets in 2002, while those with foreign borrowings accounted for 43 percent of sales, 47 percent of net worth, and 45 percent of total assets. Liquidity By several measures, Indian companies became relatively less liquid during the 1990s. The current ratio (the ratio of current assets to current liabilities), which measures the firm’s ability to meet short-term obligations through the quick sale of liquid assets, has weakened slightly. The aggregate current ratio dropped from 1.64 in 1990 to 1.49 in 2001 (1.57 to 8 Currently, most firms can borrow abroad up to US$50 million through the automatic route. Corporate borrowers may raise long-term financing with maturities of 8 and 16 years up to the equivalent of US$200 million and US$400 million, respectively. Recently, new restrictions have been placed on the use of these funds in addition to limits on investments in the stock market and real estate. Effective November 2003, borrowing in excess of US$50 million is also restricted to financing equipment imports and meeting foreign exchange needs of infrastructure projects.

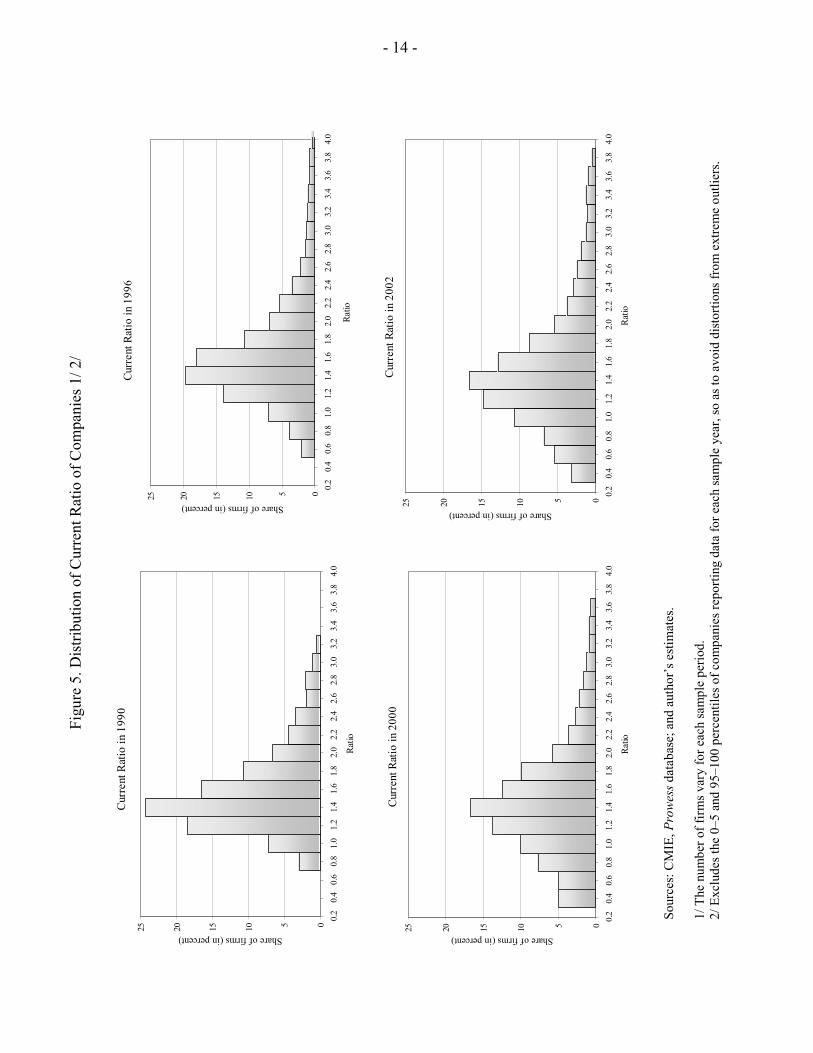
- 12 -
1.32 for the median company) (Figure 4), although it is still at a relatively healthy level when compared to other countries (see Hviding and Papi, 2002 for a recent comparison). The distribution of the current ratio also widened substantially over time, as shown in Figure 5. Moreover, the share of companies with current ratio below 1—companies whose current assets would not be able to meet their current liabilities in the event of a credit cut off—rose from 11 percent of the companies in the sample in 1989 to 27 percent of the companies in 2002 (including 58 percent of government-owned enterprises), representing 40 percent of total assets in 2002 (Table 6). Despite the deleveraging of firms, the interest coverage ratio (ICR) (defined as earnings before interest, taxes, depreciation, and amortization (EBITDA) over interest expenses) has declined in recent years, suggesting that Indian companies might be facing increased strain in meeting their debt service obligations. The ICR, an indicator of both liquidity and profitability, dropped from 2.7 in 1997 to 2.0 in 2001, but improved to 2.3 in 2002 (Figure 6).9 The share of companies that were unable to generate enough cash to meet their interest payments rose from 15 percent of the companies in the sample in 1989 to 31 percent of the companies in 2002, representing 28 percent of total assets, 20 percent of total sales, and 13 percent of net worth. The incidence of a low ICR—less than one (the level at which a firm experience difficulty servicing its debt)—was greatest among government-owned enterprises (55 percent) and small companies (38 percent). Analysis of the inter-industry distribution of companies unable to cover their interest expenses shows that there is no one particular industry that accounted for a large share of companies with an ICR of less than 1. However, among private companies, the incidence of a low ICR in 2002 was greatest among firms in wood products, food and beverages, and textiles, and least in tobacco, refined petroleum products, and precision instrument manufactures. In the second half of the 1990s, the median ICR fell below the aggregate ICR, signaling the growing number of smaller companies facing distress. Within this subsector, the problem was most acute for government-owned enterprises. After 1999, the ICR of the median company of these enterprises dropped below 1.0. Smaller companies also have had a more difficult time generating sufficient cash, although analysis of the firm-level data reveals that the problem is concentrated in a few of the larger companies (within this subsector). Furthermore, the distribution of the ICR also widened substantially over time, as shown in Figure 7. The gap between the best and the worst performers has also increased sharply, with a large number of companies (31 percent) recording a negative ICR.
9 Comparing India to the United States, the average ICRs in 1996 were 2.5 and 8.0, respectively (Kang, 2001). In the United States, the coverage ratio of companies rated AAA by Standard and Poors was 20.3 and B rated was 2.3 in 1996 (Haksar and Kongsamut, 2002).
- 13 -
Figure 4. Companies’ Current Ratio
Aggregate and Median Current Ratio
1.0
1.2
1.4
1.6
1.8
2.0
1989 1990 1991 1992 1993 1994 1995 1996 1997 1998 1999 2000 2001 2002
Aggregate Median
Aggregate Current Ratio by Ownership Category
0.5
1.0
1.5
2.0
2.5
1989 1991 1993 1995 1997 1999 2001
Stand Alone Group Government Foreign
Median Current Ratio by Ownership Category
0.5
1.0
1.5
2.0
2.5
1989 1991 1993 1995 1997 1999 2001
Stand Alone Group Government Foreign
Aggregate Current Ratio by Company Size
1.0
1.2
1.4
1.6
1.8
2.0
1989 1991 1993 1995 1997 1999 2001
Large Medium Small
Median Current Ratio by Company Size
1.0
1.2
1.4
1.6
1.8
2.0
1989 1991 1993 1995 1997 1999 2001
Large Medium Small
`
Sources: CMIE, Prowess database; and author’s estimates.
- 14 -
Figu
re 5
. Dis
tribu
tion
of C
urre
nt R
atio
of C
ompa
nies
1/ 2
/
Cur
rent
Rat
io in
199
0
0510152025
0.2
0.4
0.6
0.8
1.0
1.2
1.4
1.6
1.8
2.0
2.2
2.4
2.6
2.8
3.0
3.2
3.4
3.6
3.8
4.0
Ratio
Share of firms (in percent)
Curr
ent R
atio
in 1
996
0510152025
0.2
0.4
0.6
0.8
1.0
1.2
1.4
1.6
1.8
2.0
2.2
2.4
2.6
2.8
3.0
3.2
3.4
3.6
3.8
4.0
Ratio
Share of firms (in percent)
Cur
rent
Rat
io in
200
0
0510152025
0.2
0.4
0.6
0.8
1.0
1.2
1.4
1.6
1.8
2.0
2.2
2.4
2.6
2.8
3.0
3.2
3.4
3.6
3.8
4.0
Ratio
Share of firms (in percent)
Curr
ent R
atio
in 2
002
0510152025
0.2
0.4
0.6
0.8
1.0
1.2
1.4
1.6
1.8
2.0
2.2
2.4
2.6
2.8
3.0
3.2
3.4
3.6
3.8
4.0
Ratio
Share of firms (in percent)
Sour
ces:
CM
IE, P
row
ess d
atab
ase;
and
aut
hor’
s est
imat
es.
1/
The
num
ber o
f firm
s var
y fo
r eac
h sa
mpl
e pe
riod.
2/ E
xclu
des t
he 0
–5 a
nd 9
5–10
0 pe
rcen
tiles
of c
ompa
nies
repo
rting
dat
a fo
r eac
h sa
mpl
e ye
ar, s
o as
to a
void
dis
torti
ons f
rom
ext
rem
e ou
tlier
s.

- 15 -
Figure 6. Companies’ Interest Coverage
Aggregate and Median Interest Coverage
1.0
1.5
2.0
2.5
3.0
1989 1990 1991 1992 1993 1994 1995 1996 1997 1998 1999 2000 2001 2002
Mean Median
Aggregate Interest Coverage by Ownership Category
0
2
4
6
8
10
12
1989 1991 1993 1995 1997 1999 2001
Stand Alone Group Government Foreign
Median Interest Coverage by Ownership Category
0
2
4
6
8
10
12
1989 1991 1993 1995 1997 1999 2001
Stand Alone Group Government Foreign
Aggregate Interest Coverage by Company Size
0.0
0.5
1.0
1.5
2.0
2.5
3.0
3.5
1989 1991 1993 1995 1997 1999 2001
Large Medium Small
Median Interest Coverage by Company Size
0.0
0.5
1.0
1.5
2.0
2.5
3.0
3.5
1989 1991 1993 1995 1997 1999 2001
Large Medium Small
Sources: CMIE, Prowess database; and author’s estimates.

- 16 -
Figu
re 7
. Dis
tribu
tion
of In
tere
st C
over
age
Rat
io o
f Com
pani
es 1
/
Inte
rest
Cov
erag
e Ra
tio in
199
0
01020304050
-20
24
68
1012
1416
1820
2224
2628
3032
Ratio
Share of firms (in percent)
Inte
rest
Cov
erag
e Ra
tio in
199
6
01020304050
-20
24
68
1012
1416
1820
2224
2628
3032
Ratio
Share of firms (in percent)
Inte
rest
Cov
erag
e Ra
tio in
200
0
05101520253035404550
-20
24
68
1012
1416
1820
2224
2628
3032
Ratio
Share of firms (in percent)
Inte
rest
Cov
erag
e R
atio
in 2
002
05101520253035404550
-20
24
68
1012
1416
1820
2224
2628
3032
Ratio
Share of firms (in percent)
Sour
ces:
CM
IE, P
row
ess d
atab
ase;
and
aut
hor’
s est
imat
es.
1/
The
num
ber o
f firm
s var
y fo
r eac
h sa
mpl
e pe
riod.
2/ E
xclu
des t
he 0
–5 a
nd 9
5–10
0 pe
rcen
tiles
of c
ompa
nies
repo
rting
dat
a fo
r eac
h sa
mpl
e ye
ar, s
o as
to a
void
dis
torti
ons f
rom
ext
rem
e ou
tlier
s.
- 17 -
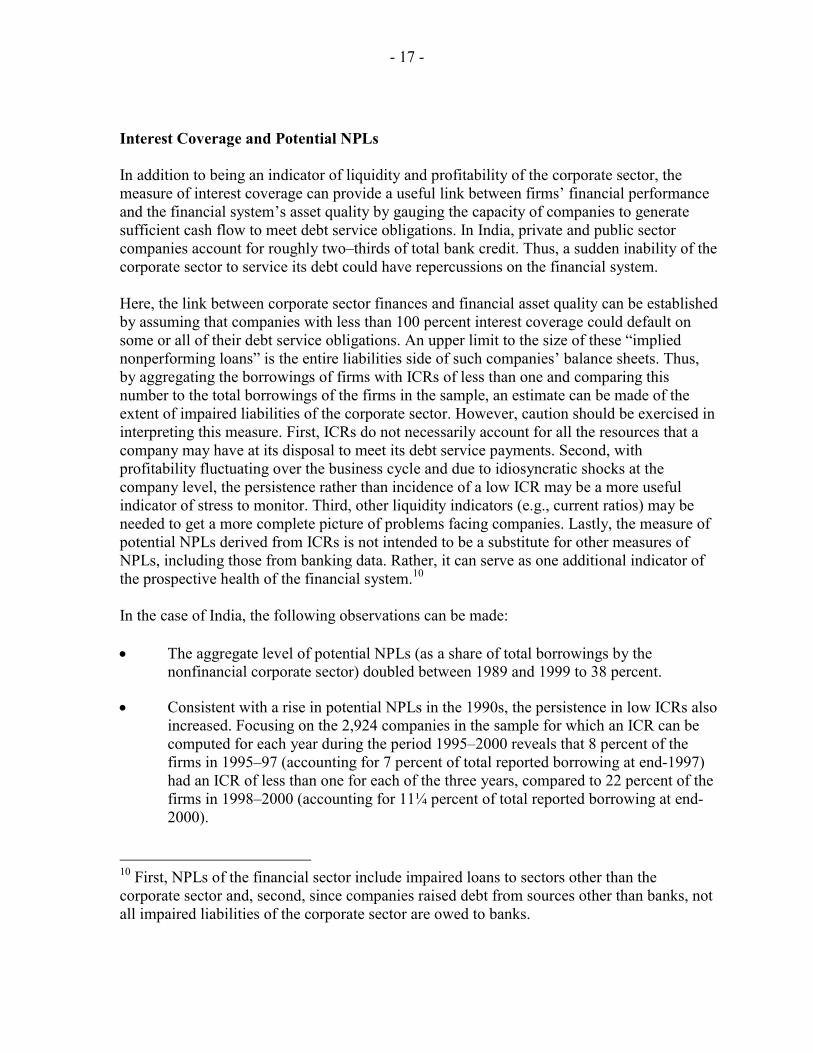
Interest Coverage and Potential NPLs In addition to being an indicator of liquidity and profitability of the corporate sector, the measure of interest coverage can provide a useful link between firms’ financial performance and the financial system’s asset quality by gauging the capacity of companies to generate sufficient cash flow to meet debt service obligations. In India, private and public sector companies account for roughly two–thirds of total bank credit. Thus, a sudden inability of the corporate sector to service its debt could have repercussions on the financial system. Here, the link between corporate sector finances and financial asset quality can be established by assuming that companies with less than 100 percent interest coverage could default on some or all of their debt service obligations. An upper limit to the size of these “implied nonperforming loans” is the entire liabilities side of such companies’ balance sheets. Thus, by aggregating the borrowings of firms with ICRs of less than one and comparing this number to the total borrowings of the firms in the sample, an estimate can be made of the extent of impaired liabilities of the corporate sector. However, caution should be exercised in interpreting this measure. First, ICRs do not necessarily account for all the resources that a company may have at its disposal to meet its debt service payments. Second, with profitability fluctuating over the business cycle and due to idiosyncratic shocks at the company level, the persistence rather than incidence of a low ICR may be a more useful indicator of stress to monitor. Third, other liquidity indicators (e.g., current ratios) may be needed to get a more complete picture of problems facing companies. Lastly, the measure of potential NPLs derived from ICRs is not intended to be a substitute for other measures of NPLs, including those from banking data. Rather, it can serve as one additional indicator of the prospective health of the financial system.10 In the case of India, the following observations can be made: • The aggregate level of potential NPLs (as a share of total borrowings by the
nonfinancial corporate sector) doubled between 1989 and 1999 to 38 percent.
• Consistent with a rise in potential NPLs in the 1990s, the persistence in low ICRs also increased. Focusing on the 2,924 companies in the sample for which an ICR can be computed for each year during the period 1995–2000 reveals that 8 percent of the firms in 1995–97 (accounting for 7 percent of total reported borrowing at end-1997) had an ICR of less than one for each of the three years, compared to 22 percent of the firms in 1998–2000 (accounting for 11¼ percent of total reported borrowing at end-2000).
10 First, NPLs of the financial sector include impaired loans to sectors other than the corporate sector and, second, since companies raised debt from sources other than banks, not all impaired liabilities of the corporate sector are owed to banks.
- 18 -
• Since 2000, the measure of potential NPLs has shown signs of a modest decline consistent with corporate restructuring and improved performance.11 This is broadly in line with other measures of NPLs based on banking system data (Figure 8).12
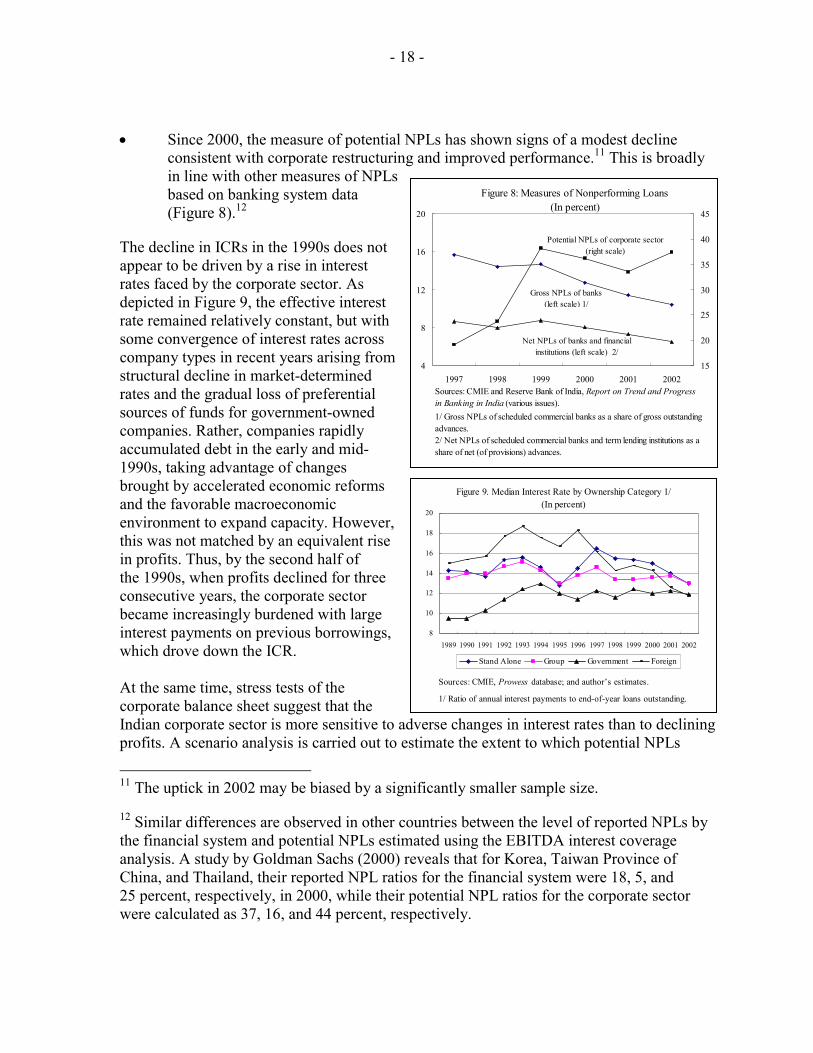
The decline in ICRs in the 1990s does not appear to be driven by a rise in interest rates faced by the corporate sector. As depicted in Figure 9, the effective interest rate remained relatively constant, but with some convergence of interest rates across company types in recent years arising from structural decline in market-determined rates and the gradual loss of preferential sources of funds for government-owned companies. Rather, companies rapidly accumulated debt in the early and mid-1990s, taking advantage of changes brought by accelerated economic reforms and the favorable macroeconomic environment to expand capacity. However, this was not matched by an equivalent rise in profits. Thus, by the second half of the 1990s, when profits declined for three consecutive years, the corporate sector became increasingly burdened with large interest payments on previous borrowings, which drove down the ICR. At the same time, stress tests of the corporate balance sheet suggest that the Indian corporate sector is more sensitive to adverse changes in interest rates than to declining profits. A scenario analysis is carried out to estimate the extent to which potential NPLs
11 The uptick in 2002 may be biased by a significantly smaller sample size.
12 Similar differences are observed in other countries between the level of reported NPLs by the financial system and potential NPLs estimated using the EBITDA interest coverage analysis. A study by Goldman Sachs (2000) reveals that for Korea, Taiwan Province of China, and Thailand, their reported NPL ratios for the financial system were 18, 5, and 25 percent, respectively, in 2000, while their potential NPL ratios for the corporate sector were calculated as 37, 16, and 44 percent, respectively.
Figure 9. Median Interest Rate by Ownership Category 1/(In percent)
8
10
12
14
16
18
20
1989 1990 1991 1992 1993 1994 1995 1996 1997 1998 1999 2000 2001 2002
Stand Alone Group Government Foreign
Sources: CMIE, Prowess database; and author’s estimates.
1/ Ratio of annual interest payments to end-of-year loans outstanding.
Figure 8: Measures of Nonperforming Loans(In percent)
4
8
12
16
20
1997 1998 1999 2000 2001 200215
20
25
30
35
40
45
1/ Gross NPLs of scheduled commercial banks as a share of gross outstanding advances.2/ Net NPLs of scheduled commercial banks and term lending institutions as a share of net (of provisions) advances.
Sources: CMIE and Reserve Bank of India, Report on Trend and Progress in Banking in India (various issues).
Gross NPLs of banks(left scale) 1/
Net NPLs of banks and financial institutions (left scale) 2/
Potential NPLs of corporate sector(right scale)

- 19 -
would rise due to an interest rate shock (see Table 7). A 200 basis points increase in the interest rate would have resulted in approximately 4 percentage points increase in the share of potential NPLs if we average out the effect of the interest rate shock over the period 2000–2002. However, a 3 percent decline in profits would have almost no effect on the potential share of NPLs. Profitability13 Consistent with the ICR, Indian companies experienced major changes in profitability in the period 1989–2002. During 1991–1996, aggregate profitability improved rapidly, spurred by strong economic growth. This holds for various measures of profitability, including operating profits over net sales and profits before interest, depreciation and taxes over sales (Figure 10). In the second half of the 1990s, profitability declined to below pre-reform levels, although there were some signs of recovery in 2002. Government-owned enterprises and smaller companies were the hardest hit. These companies had already tended to generate lower profits. Therefore, the profitability gap between weaker and stronger firms only widened during the decade (Figure 11). The aggregate return on assets (as measured by profit before interest, tax and depreciation over gross fixed assets) generally has followed the trend in profitability. However, the median firm experienced a steady decline in returns over the sample period, given a relatively rapid accumulation of assets and a falling marginal product of capital in the Indian corporate sector in the first half of the 1990s. Corporate-Financial Nexus Assessment of the corporate-financial nexus in the Indian economy should include, in addition to liquidity and debt ratios, an examination of the links between the corporate and financial sectors. There are a variety of ways this plays out, including through bank loans and guarantees, equity holdings, and common directorships (Beaumont et al., 2003). As already discussed in Section II, Table 3 reveals that the involvement of the financial sector through equity ownership varies substantially across type of company. Large companies and companies belonging to business houses have higher equity participation by FIs and foreign investors and greater concentration of equity ownership than small and stand-alone companies. However, according to Sarkar and Sarkar (1999), FIs in India as a whole hold much smaller blocks of equity than FIs in other countries. Nonetheless, they do point out that as the majority of FIs in India are government controlled and fall under the jurisdiction of the Ministry of Finance (e.g., public sector banks held about 75 percent of total commercial bank assets at end-2002). Thus, public FIs are much more likely to act as a single block holder in India than FIs in other countries. 13 Profits before depreciation, interest payments, and taxes (PBDIT) was the preferred measure of profits due to a lack of solid understanding of the accounting standards for recording depreciation in the income statements.

- 20 -
Figure 10. Companies’ Profitability
Aggregate and Median Operating Profit to Net Sales (In percent)
0
2
4
6
8
10
1989 1990 1991 1992 1993 1994 1995 1996 1997 1998 1999 2000 2001 2002
Aggregate Median
Median Operating Profit to Net Sales by Ownership Category(In percent)
-15
-10
-5
0
5
10
1989 1990 1991 1992 1993 1994 1995 1996 1997 1998 1999 2000 2001 2002
Stand Alone Group Government Foreign
Aggregate and Median PBDIT to Sales(In percent)
2
4
6
8
10
12
14
16
1989 1990 1991 1992 1993 1994 1995 1996 1997 1998 1999 2000 2001 2002
Aggregate Median
Median PBDIT to Sales by Ownership Category(In percent)
2
4
6
8
10
12
14
16
1989 1990 1991 1992 1993 1994 1995 1996 1997 1998 1999 2000 2001 2002
Stand Alone Group Government Foreign
Aggregate and Median PBDIT to Gross Fixed Assets (In percent)
0
10
20
30
40
1989 1990 1991 1992 1993 1994 1995 1996 1997 1998 1999 2000 2001 2002
Aggregate Median
Median PBDIT to Gross Fixed Assets by Ownership Category(In percent)
0
10
20
30
40
1989 1990 1991 1992 1993 1994 1995 1996 1997 1998 1999 2000 2001 2002
Stand Alone Group Government Foreign
Sources: CMIE, Prowess database; and author’s estimates.

- 21 -
Figu
re 1
1. D
istri
butio
n of
Pro
fitab
ility
of C
ompa
nies
1/ 2
/
Ope
ratin
g Pr
ofit
Ove
r Net
Sal
es in
199
0
0510152025303540
-.65
-.60
-.55
-.50
-.45
-.40
-.35
-.30
-.25
-.20
-.15
-.10
-.05
.00
.05
.10
.15
.20
.25
>.25
Ratio
Share of firms (in percent)
Ope
ratin
g Pr
ofit
Ove
r Net
Sal
es in
199
6
0510152025303540
-.65
-.60
-.55
-.50
-.45
-.40
-.35
-.30
-.25
-.20
-.15
-.10
-.05
.00
.05
.10
.15
.20
.25
>.25
Ratio
Share of firms (in percent)
O
pera
ting
Prof
it O
ver N
et S
ales
in 2
000
0510152025303540
-.65
-.60
-.55
-.50
-.45
-.40
-.35
-.30
-.25
-.20
-.15
-.10
-.05
.00
.05
.10
.15
.20
.25
>.25
Ratio
Share of firms (in percent)
Ope
ratin
g Pr
ofit
Ove
r Net
Sal
es in
200
2
0510152025303540
-.65
-.60
-.55
-.50
-.45
-.40
-.35
-.30
-.25
-.20
-.15
-.10
-.05
.00
.05
.10
.15
.20
.25
>.25
Ratio
Share of firms (in percent)

- 22 -
Figu
re 1
1. D
istri
butio
n of
Pro
fitab
ility
of C
ompa
nies
(Con
tinue
d)
PBD
IT O
ver S
ales
in 1
990
0510152025303540
-.30
-.25
-.20
-.15
-.10
-.05
.00
.05
.10
.15
.20
.25
.30
.35
>.35
Ratio
Share of firms (in percent)
PBD
IT O
ver S
ales
in 1
996
0510152025303540
-.30
-.25
-.20
-.15
-.10
-.05
.00
.05
.10
.15
.20
.25
.30
.35
>.35
Ratio
Share of firms (in percent)
`
PBD
IT O
ver S
ales
in 2
000
0510152025303540
-.30
-.25
-.20
-.15
-.10
-.05
.00
.05
.10
.15
.20
.25
.30
.35
>.35
Ratio
Share of firms (in percent)
PBD
IT O
ver S
ales
in 2
002
0510152025303540
-.30
-.25
-.20
-.15
-.10
-.05
.00
.05
.10
.15
.20
.25
.30
.35
>.35
Ratio
Share of firms (in percent)

- 23 -
Figu
re 1
1. D
istri
butio
n of
Pro
fitab
ility
of C
ompa
nies
(Con
clud
ed)
PBD
IT O
ver G
ross
Fix
ed A
sset
s in
1990
048121620
-.15
-.10
-.05
.00
.05
.10
.15
.20
.25
.30
.35
.40
.45
.50
.55
.60
.65
.70
.75
.80
>.80
Ratio
Share of firms (in percent)
PBD
IT O
ver G
ross
Fix
ed A
sset
s in
1996
048121620
-.15
-.10
-.05
.00
.05
.10
.15
.20
.25
.30
.35
.40
.45
.50
.55
.60
.65
.70
.75
.80
>.80
Ratio
Share of firms (in percent)
PB
DIT
Ove
r Gro
ss F
ixed
Ass
ets i
n 20
00
048121620
-.15
-.10
-.05
.00
.05
.10
.15
.20
.25
.30
.35
.40
.45
.50
.55
.60
.65
.70
.75
.80
>.80
Ratio
Share of firms (in percent)
PBD
IT O
ver G
ross
Fix
ed A
sset
s in
2002
048121620
-.15
-.10
-.05
.00
.05
.10
.15
.20
.25
.30
.35
.40
.45
.50
.55
.60
.65
.70
.75
.80
>.80
Ratio
Share of firms (in percent)
Sour
ces:
CM
IE, P
row
ess d
atab
ase;
and
aut
hor’
s est
imat
es.
1/
The
num
ber o
f firm
s var
y fo
r eac
h sa
mpl
e pe
riod.
2/ E
xclu
des t
he 0
–5 a
nd 9
5–10
0 pe
rcen
tiles
of c
ompa
nies
repo
rting
dat
a fo
r eac
h sa
mpl
e ye
ar, s
o as
to a
void
dis
torti
ons f
rom
ext
rem
e ou
tlier
s.

- 24 -
The transmission of shocks between the corporate and financial sectors depends on the mutual financial exposure of the two sectors. As pointed by Beaumont et al. (2003), the excessive dependence of the corporate sector on a particular source of financing (such as bank loans) can raise the risk of a financial crisis stemming from corporate sector weaknesses. Table 7 gives a breakdown of the major types of financial liabilities of the Indian corporate sector.14 While the share of bank borrowings is not particularly high, there has been an upward trend in the 1990s, with the combined share of loans from commercial banks and other FIs reaching 57 percent in 2002. The share of short-term bank borrowing also increased from 51 percent in 1989 to 70 percent in 2002, consistent with the decline in the share of long-term debt previously discussed. The increased use of commercial paper and debentures is a positive development and reflects the introduction and growing popularity of new financing options in the Indian capital market. Overall, there is no overwhelming evidence that the corporate sector is entirely dependent on one particular source of debt finance.
IV. CORPORATE GOVERNANCE IN INDIA
Currently, four main laws regulate corporate governance of Indian enterprises: the Companies Act of 1956 (and amendments) aims to ensure adequate protection of the interests of creditors and shareholders and regulates the issue, transfer, and allotment of securities; the Securities Contracts (Regulation) Act of 1956 covers all aspects of securities trading and regulates the operations of the stock market; the Securities and Exchange Board of India (SEBI) Act of 1992 protects the interests of shareholders and promotes and regulates the securities markets; and the Sick Industrial Companies (Special Provision) Act (SICA) deals with financial reorganization (including bankruptcy procedures) of distressed companies. The World Bank’s Report on Observance of Standards and Codes (ROSC) in 2000 found India’s corporate governance practices to generally fall short of OECD standards. Further amendments of the Companies Act were made in late 2000 to fill some of the gap by imposing more stringent corporate disclosures norms (such as quarterly filings of shareholding data, segmented reporting of business activities, disclosure and treatment of related party transactions in directors’ reports, mandatory appointment of an officer for monitoring share transfers, and the establishment of audit committees on the board). Under the currently existing laws: • All shares carry proportional voting rights and are equal within one class.15 Voting
through proxy is also allowed. All shares and all share transfers must be registered.
14 For a detailed study of the pattern of financing of Indian companies, see Shirai (2002).
15 There are two types of shares in India: (i) ordinary shares, which have a variable dividend but give voting rights; and (ii) preference shares, which give the holder the right to a fixed dividend but no right to vote. However, the latter are not widely used in India.

- 25 -
Shareholders can sue a company’s management and controlling parties at various levels of judiciary system, or can apply directly to the SEBI for redress against violation of shareholders’ rights. Still, delays by courts are prevalent and have lasted up to 20 years before a final decision is reached.
• Corporate boards are single tiered and composed of both executive and nonexecutive members. Directors are appointed by the shareholders at the annual general meeting. As of March 2001, a mandatory requirement was introduced requiring a minimum percentage of directors to be independent. A company’s board of directors is required to meet at least once every three months and to disclose board members’ shareholdings and their interests in any company transaction.
• Companies are required to prepare audited annual reports, which must be signed by certified accountants. Audit committees are set up by the company and auditors can be appointed and removed at the annual general meeting. Consolidated statements are not mandatory, but if the ownership interest in another firm is greater than 50 percent, the annual report of a company must contain abridged data of the subsidiary company. Disclosure of price sensitive information to the relevant stock exchanges and to the SEBI is also mandatory. Remuneration to company officers must be disclosed in aggregated form in the annual report, and beginning in 2001, a further breakdown must also be provided. Companies must also be rated by approved credit agencies before issuing any securities.
Despite recent improvements laws governing corporate oversight, the enforcement of the laws needs to be strengthened, standards for disclosure tightened, and penalties for violations raised.16 Other impediments to good corporate governance in India include the lack of independent directors. The current practice sees companies in India often filling boards of directors with representatives of the promoters.17 Accessing information about shareholders also remains difficult. Listing on stock exchanges currently requires a detailed breakdown of
16 For example, the maximum punishment for violating the Companies Act is a fine of no more than Rs. 2,000 (less than US$50) or six months imprisonment or both. If auditors’ signed reports are not in conformity with the law, the maximum penalty is Rs. 1,000. There is anecdotal evidence that “corporates have even offered to make this payment upfront” (Godbole, 2002).
17 A study by Goswami (2002) of the boards of the top 100 listed private companies reveals that most of the boards are numerically dominated by executive directors or, as Godbole (2002) argues, are packed by retired corporate executives, government bureaucrats, family members and well wishers, who have little say over board matters.

- 26 -
equity holdings by shareholder categories,18 but disentangling share control is burdensome owing to the mesh of cross-holdings across companies controlled by a business group. This also makes it harder to track insider trading. A number of actions aimed at strengthening corporate governance are under consideration, in part in response to the Report on the Committee on Corporate Audit and Governance issued in late 2002, which in light of corporate scandals abroad looked closely at audit standards, management controls, and board effectiveness. Further amendments to the Companies Act are expected to be made which tighten companies’ financial reporting requirements with the Registrar of Companies, restrict auditors’ activities for generating income from client companies, and establish stricter protocol for forwarding auditors’ reports (and qualifications) to the SEBI. The Companies Act is also being amended so as to stipulate that at least half of all directors of large companies must be independent and receive training before appointment. The SICA, which governs bankruptcy procedures, contains a number of flaws, which often act to stymie financial restructuring. The definition of financial distress as the erosion of net worth is a generally strict standard of corporate bankruptcy, which affects companies’ ability to undertake meaningful restructuring. Bankruptcy procedures are time consuming and cumbersome, owing to indefinite stays on all claims of creditors and frequent violations of the absolute priority rule, and existing management is often allowed to run and control a bankrupt company during financial reorganization. Liquidation under the Companies Act is even more complicated, and long court delays are commonplace. As a result, these laws afford little effective protection for creditors. The Corporate Insolvency Law, passed in early 2003, sets the ground for the repealing of the SICA and replacing the Board of Industrial and Financial Reconstruction (BIFR) with the National Companies Law Tribunal (NCLT), in an effort to end the open-ended protection debtors have enjoyed from creditors under the BIFR mechanism once a company is recognized as sick or insolvent. The new law tightens the qualifications for being declared a sick company19 and imposes a 24–month time limit (subject to extension by the NCLT) on resolution actions. In keeping with this legislation, the SICA was repealed by the lower house of Parliament in late 2003.
18 Companies are required to disclose information on the equity shareholdings of individual promoters, financial institutions, foreign institutional investors, foreign holdings, other corporate bodies, top 50 shareholders, and other shareholders.
19 A sick industrial company is defined as an industrial firm that either (i) has annual accumulated losses greater than or equal to 50 percent of average net worth during four years immediately preceding the financial year; or (ii) has failed to repay its debts within any three consecutive quarters on demand made in writing for repayment by a creditor or creditors.

- 27 -
V. CONCLUSION
The performance of the India’s corporate sector weakened after 1997, and many of the promising developments during the period of rapid economic growth following the economic reforms of 1991 were partially reversed. Aggregate leverage increased and the maturity structure of debt shifted slightly toward short-term borrowing. Companies also suffered from declining profitability. An analysis of ICRs reveals that more than 30 percent of the companies were unable to generate enough cash to cover their interest payments in 2002, which is a potential risk to lenders. Disaggregated data pointed to significant differences across companies. The distribution of financial ratios widened after the economic reforms as companies faced greater domestic and foreign competition and the need to raise funds on the liberalized capital markets. Despite this weakening of the corporate sector in recent years, most indicators are still at comfortable levels and there were signs of improvement in almost all indicators in 2002, the last year in our sample, and in 2003, with the soft interest rate regime and ongoing economic recovery. Stress tests suggest that the financial health of the corporate sector would be moderately affected by adverse interest rate shocks. Given the comparatively low level of foreign debt as a source of funds for the corporate sector and India’s strong foreign exchange reserve position, the exposure of the Indian corporate sector to foreign exchange risk is generally low at this point of time. Changes in the legal and regulatory framework in the post-1991 period have been key to promoting greater competition, reducing the regulatory burden, and, of late, strengthening corporate governance, which will continue to be of key importance to India’s growth prospects.
- 28 -
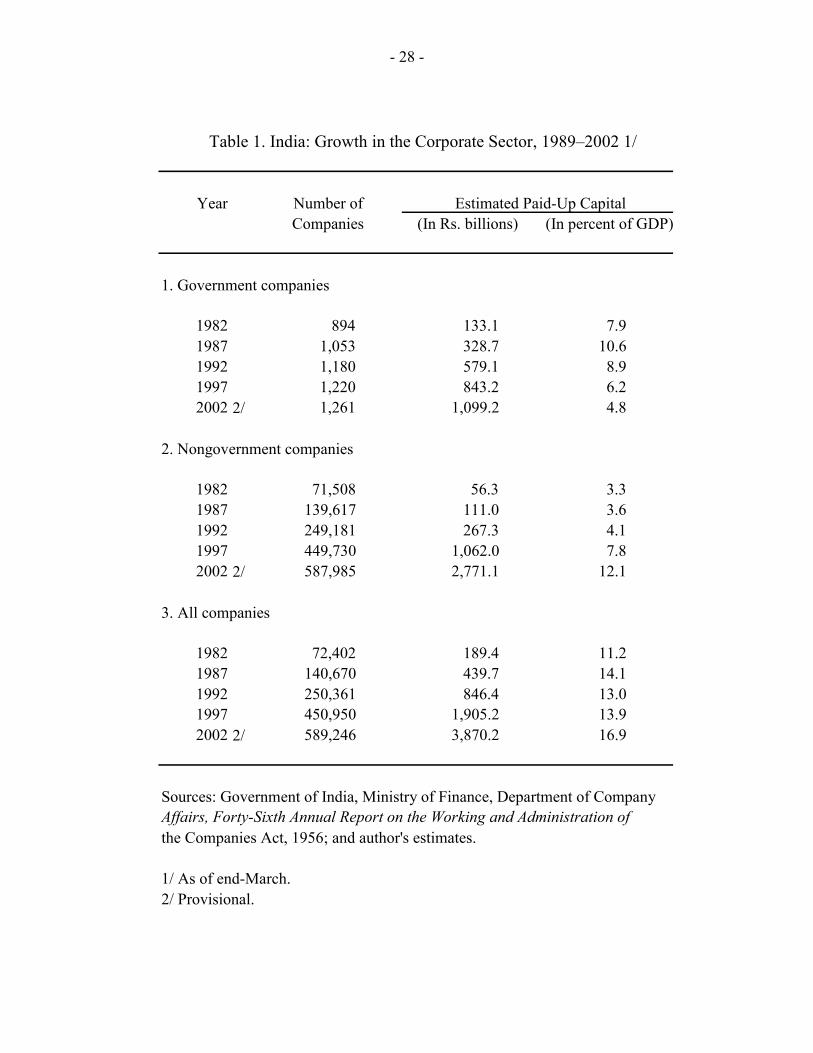
Table 1. India: Growth in the Corporate Sector, 1989–2002 1/
Year Number of Estimated Paid-Up Capital Companies (In Rs. billions) (In percent of GDP)
1. Government companies
1982 894 133.1 7.9 1987 1,053 328.7 10.6 1992 1,180 579.1 8.9 1997 1,220 843.2 6.2 2002 2/ 1,261 1,099.2 4.8
2. Nongovernment companies
1982 71,508 56.3 3.3 1987 139,617 111.0 3.6 1992 249,181 267.3 4.1 1997 449,730 1,062.0 7.8 2002 2/ 587,985 2,771.1 12.1
3. All companies
1982 72,402 189.4 11.2 1987 140,670 439.7 14.1 1992 250,361 846.4 13.0 1997 450,950 1,905.2 13.9 2002 2/ 589,246 3,870.2 16.9
Sources: Government of India, Ministry of Finance, Department of Company Affairs, Forty-Sixth Annual Report on the Working and Administration of the Companies Act, 1956; and author's estimates.
1/ As of end-March. 2/ Provisional.

- 29 -
Num
ber
Estim
ated
Num
ber
Estim
ated
Num
ber
Estim
ated
ofpa
id-u
pof
paid
-up
ofpa
id-u
pfir
ms
capi
tal
firm
sca
pita
lfir
ms
capi
tal
(In R
s. bi
llion
)(In
Rs.
billi
on)
(In R
s. bi
llion
)
Publ
ic li
mite
d co
mpa
nies
65
949
9.8
75,6
191,
843.
076
,278
2,34
2.8
(In p
erce
nt o
f tot
al)
0.1
14.7
12.9
54.2
13.1
68.9
Priv
ate
limite
d co
mpa
nies
60
339
2.8
507,
303
662.
450
7,90
61,
055.
2(In
per
cent
of t
otal
) 0.
111
.686
.819
.586
.931
.1
Sour
ces:
Gov
ernm
ent o
f Ind
ia, M
inis
try o
f Fin
ance
, Dep
artm
ent o
f Com
pany
Aff
airs
, An
nual
Rep
ort 2
001–
2002
.
1/ A
s of e
nd-M
arch
200
2.
Gov
ernm
ent C
ompa
nies
Non
gove
rnm
ent C
ompa
nies
All
Com
pani
es
Tabl
e 2.
Indi
a: S
elec
ted
Indi
cato
rs o
n R
egis
tere
d C
ompa
nies
1/
- 30 -
Priv
ate
Impl
ied
corp
orat
eB
anks
and
Mut
ual
gove
rnm
ent
Prom
oter
sbo
dies
Fore
ign
FIs
fund
ssh
are
Publ
ic
Priv
ate
stan
d-al
one
com
pani
es43
.69.
85.
02.
71.
03.
936
.7Pr
ivat
e co
mpa
nies
bel
ongi
ng to
a b
usin
ess g
roup
50.3
8.2
7.4
7.0
2.6
9.6
27.8
Gov
ernm
ent-o
wne
d co
mpa
nies
70.7
4.1
4.2
7.9
3.0
72.0
12.3
Fore
ign
com
pani
es65
.23.
755
.64.
52.
36.
920
.6
Larg
e co
mpa
nies
52.9
5.5
14.5
10.2
4.1
20.0
22.7
Med
ium
com
pani
es52
.28.
410
.34.
71.
87.
228
.7Sm
all c
ompa
nies
42.3
9.9
6.7
2.6
0.8
3.7
37.9
Larg
e pr
ivat
e co
mpa
nies
49.3
6.3
7.9
10.5
4.0
14.5
24.7
Med
ium
priv
ate
com
pani
es50
.78.
96.
34.
81.
96.
729
.6Sm
all p
rivat
e co
mpa
nies
41.5
10.0
5.2
2.6
0.8
3.6
38.5
All
com
pani
es48
.18.
79.
34.
51.
77.
431
.8
Sour
ces:
Cen
tre fo
r Mon
itorin
g th
e In
dian
Eco
nom
y (C
MIE
) (Pr
owes
s da
taba
se);
and
auth
or's
estim
ates
.
1/ T
he im
plie
d go
vern
men
t sha
re is
the
sam
e as
dire
ct g
over
nmen
t hol
ding
s, ho
ldin
gs o
f ban
ks a
nd fi
nanc
ial i
nstit
utio
ns, a
nd h
oldi
ngs o
f m
utua
l fun
ds a
nd U
TI.
Tabl
e 3.
Indi
a: P
atte
rn o
f Equ
ity O
wne
rshi
p of
Reg
iste
red
Com
pani
es in
200
2 1/
Mea
n Eq
uity
Hol
ding
(in
perc
ent)

- 31 -
Table 4: International Comparison of Key Financial Ratios of the Corporate Sector (end-2002)
RatiosDebt/ Long-term/ Foreign/ Interest
equity total debt total debt coverage 1/
India 2/ 1.27 0.63 0.16 2.00China 0.50 1.00 0.05 2.37Korea 1.31 0.60 0.13 1.05Malaysia 0.47 0.81 0.17 1.41Singapore 0.16 0.79 0.23 2.56Thailand 0.58 0.80 0.31 1.99
France 1.00 0.49 0.33 5.38Germany 1.90 0.48 0.26 3.97Japan 0.99 0.75 0.09 4.58United Kingdom 0.52 0.50 0.36 ...United States 1.12 0.77 0.05 5.64
Sources: CMIE (Prowess database); Bank for International Settlements; Begum and Schumacher, 2001 (based on the Worldscope dataset); Claessens, Djankov, and Lang, 1998; International Finance Corporation; and author's estimates.
1/ For 1998.2/ The estimates for India are not directly comparable to the author's estimates in other sections of the paper because of different data sources used to compute financial ratios.

- 32 -
Tabl
e 5.
Indi
a: D
ebt S
truct
ure
of C
orpo
rate
Sec
tor,
1990
–200
2
1990
1991
1992
1993
1994
1995
19
9619
9719
9819
9920
0020
0120
02
Long
-term
bor
row
ing
Tota
l 73
.766
.466
.666
.166
.365
.6
64.7
64.8
64.4
64.0
62.4
63.0
62.6
(Med
ian
com
pany
in sa
mpl
e)
77.8
74.8
79.1
73.9
76.1
76.1
72
.373
.275
.476
.271
.973
.570
.9Pr
ivat
e st
and-
alon
e co
mpa
nies
65
.359
.960
.559
.759
.761
.7
61.3
60.7
59.1
58.0
57.8
58.1
56.4
Priv
ate
com
pani
es b
elon
ging
to a
bus
ines
s gro
up74
.167
.569
.067
.970
.069
.8
67.7
69.1
68.5
68.5
66.6
66.5
66.6
Gov
ernm
ent-o
wne
d co
mpa
nies
10
0.0
95.4
90.7
87.2
82.6
81.5
83
.983
.883
.883
.382
.180
.280
.3Fo
reig
n co
mpa
nies
66
.762
.261
.866
.367
.363
.7
61.9
65.2
67.7
69.4
67.1
72.6
64.9
Fore
ign
curr
ency
bor
row
ing
Tota
l 8.
49.
413
.712
.512
.212
.5
12.0
14.3
16.1
14.3
15.9
15.0
16.1
(Med
ian
com
pany
in sa
mpl
e)
0.0
0.0
0.0
0.0
0.0
0.0
0.0
0.0
0.0
0.0
0.0
0.0
0.0
Shar
e of
com
pani
es w
ith fo
reig
n cu
rren
cy
borro
win
g (in
per
cent
) 17
.418
.117
.915
.715
.516
.8
17.3
17.9
19.9
18.3
15.3
15.9
17.3
Sour
ces:
CM
IE ( P
row
ess d
atab
ase)
; and
aut
hor's
est
imat
es.
(In
perc
ent o
f tot
al d
ebt)

- 33 -
1989
1990
1991
1992
1993
1994
1995
19
9619
9719
9819
9920
0020
0120
02
Cur
rent
ratio
A
ll co
mpa
nies
10
.613
.515
.815
.619
.317
.516
.5
16.2
18.9
22.8
27.0
28.6
28.4
27.4
Priv
ate
stan
d-al
one
com
pani
es
9.2
13.4
16.7
16.2
21.3
17.7
17.0
15
.017
.921
.826
.227
.325
.723
.4Pr
ivat
e co
mpa
nies
bel
ongi
ng to
a b
usin
ess g
roup
10.6
12.8
14.6
15.2
16.0
15.5
13.7
14
.917
.622
.026
.829
.430
.430
.6G
over
nmen
t-ow
ned
com
pani
es
18.4
23.1
29.8
25.9
37.4
37.0
37.3
41
.443
.350
.850
.052
.653
.157
.7Fo
reig
n co
mpa
nies
7.
110
.18.
97.
816
.015
.515
.4
18.5
19.8
18.0
20.8
21.2
24.2
18.4
Larg
e co
mpa
nies
7.
57.
69.
39.
010
.49.
09.
5 10
.512
.317
.720
.720
.623
.526
.2M
ediu
m c
ompa
nies
10
.312
.813
.513
.615
.514
.512
.3
13.6
15.1
18.1
23.2
25.8
25.4
26.5
Smal
l com
pani
es
18.4
25.5
27.8
24.6
29.9
24.3
22.3
19
.823
.728
.231
.833
.032
.629
.2
Inte
rest
cov
erag
e ra
tio
All
com
pani
es
15.0
12.3
12.3
12.9
15.5
14.1
13.5
17
.524
.329
.633
.732
.832
.531
.0Pr
ivat
e st
and-
alon
e co
mpa
nies
13
.911
.811
.111
.814
.111
.511
.8
17.5
25.3
31.9
34.2
32.3
31.6
29.6
Priv
ate
com
pani
es b
elon
ging
to a
bus
ines
s gro
up12
.09.
110
.010
.813
.213
.311
.3
14.5
21.0
25.9
32.9
32.9
33.2
32.7
Gov
ernm
ent-o
wne
d co
mpa
nies
39
.238
.839
.636
.040
.744
.046
.3
43.3
47.6
53.7
56.3
56.3
55.9
54.9
Fore
ign
com
pani
es
12.0
7.9
7.7
12.2
17.4
16.4
18.0
19
.321
.118
.821
.122
.222
.415
.6La
rge
com
pani
es
8.2
8.0
6.0
9.4
11.1
11.3
7.4
10.1
14.0
15.7
21.0
23.4
25.9
24.5
Med
ium
com
pani
es
16.4
11.2
10.7
11.6
13.4
11.7
10.8
11
.816
.522
.429
.528
.627
.128
.3Sm
all c
ompa
nies
22
.723
.322
.918
.721
.718
.318
.1
24.9
34.1
40.0
40.8
38.9
39.9
37.5
Shar
e of
impl
ied
nonp
erfo
rmin
g lo
ans (
NPL
s)
18.4
16.2
18.0
18.4
18.5
18.0
14.6
15
.919
.223
.738
.236
.233
.537
.4in
tota
l adv
ance
s to
com
pani
es (i
n pe
rcen
t) Sh
are
of N
PLs i
n to
tal l
oans
by
sche
dule
d co
mm
erci
al b
anks
(in
perc
ent)
1/
......
......
23.0
25.0
20.0
18
.015
.714
.414
.712
.711
.410
.4
Sens
itivi
ty a
naly
sis
Shar
e of
impl
ied
NPL
afte
r a 1
per
cent
age
poin
t in
crea
se in
inte
rest
rate
24.6
22.7
22.1
22.7
22.3
22.8
18.1
18
.423
.228
.542
.139
.741
.138
.4Sh
are
of im
plie
d N
PL a
fter a
3 p
erce
nt d
rop
in
PB
DIT
2/
18.9
16.7
18.5
19.3
20.9
20.3
14.9
16
.419
.524
.338
.636
.534
.237
.8
Sour
ces:
CM
IE ( P
row
ess d
atab
ase)
; Res
erve
Ban
k of
Indi
a,
Stat
istic
al T
able
s Rel
atin
g to
Ban
ks o
f Ind
ia
and
Tren
d an
d Pr
ogre
ss o
f Ban
king
in In
dia
(var
ious
issu
es);
and
auth
or's
estim
ates
. 1/
For
199
3–19
97, p
ublic
sect
or b
anks
onl
y.
2/ P
BD
IT is
pro
fits b
efor
e de
prec
iatio
n, in
tere
st p
aym
ents
, and
taxe
s.
Tabl
e 6.
Indi
a: L
iqui
dity
Ana
lysi
s of C
orpo
rate
Sec
tor,
1989
–200
2(I
n pe
rcen
t of s
ampl
e co
mpa
nies
with
a ra
tio <
1.0
0, u
nles
s oth
erw
ise
indi
cate
d) 1
/

- 34 -
1989
1990
1991
1992
1993
1994
1995
19
9619
9719
9819
9920
0020
0120
02
Type
of d
ebt f
inan
cing
B
orro
win
g fro
m b
anks
25
.729
.530
.625
.329
.625
.729
.6
34.6
33.9
33.2
32.5
35.9
33.1
36.8
Of w
hich
: sho
rt-te
rm b
orro
win
g 51
.175
.182
.081
.686
.385
.580
.3
79.8
78.2
72.2
69.1
74.2
74.6
72.5
Bor
row
ing
from
oth
er fi
nanc
ial i
nstit
utio
ns
17.9
18.4
20.5
23.8
25.3
25.5
25.0
24
.423
.824
.424
.723
.722
.519
.9C
omm
erci
al p
aper
and
deb
entu
res
12.3
12.8
13.0
13.4
14.7
18.7
16.0
14
.414
.816
.117
.717
.218
.921
.4B
orro
win
g fro
m g
over
nmen
t 16
.914
.112
.911
.88.
68.
88.
3 7.
06.
45.
96.
66.
06.
94.
9B
orro
win
g fro
m c
orpo
rate
sect
or
1.9
2.6
3.9
2.9
3.8
4.3
4.0
3.9
3.8
3.2
3.5
3.1
3.7
3.0
Mem
oran
dum
item
s To
tal b
orro
win
gs o
f the
cor
pora
te se
ctor
(in
Rs.
billi
on)
506.
165
4.2
803.
196
0.7
1,16
0.4
1,34
2.4
1,58
4.3
1,93
5.4
2,39
2.3
2,81
6.4
3,04
0.9
3,20
7.4
3,27
5.5
2,76
1.5
(in p
erce
nt o
f GD
P)
10.8
11.9
12.7
13.3
14.0
13.8
13.8
14
.616
.216
.716
.215
.514
.611
.5
Sour
ces:
CM
IE ( P
row
ess d
atab
ase)
; and
aut
hor's
est
imat
es.
Tabl
e 7.
Indi
a: S
ourc
e of
Deb
t Fin
anci
ng o
f Cor
pora
te S
ecto
r, 19
89–2
002
(In
perc
ent o
f tot
al d
ebt f
inan
cing
, unl
ess o
ther
wis
e in
dica
ted)

- 35 - APPENDIX I
Data Sources The data used in this analysis are from a firm-level database on India’s corporate sector, compiled by the Centre for Monitoring the Indian Economy, a private company in India. The Prowess database contains information primarily from the income statements and balance sheets of listed companies, which account for more than 70 percent of the economic activity in the organized industrial sector of India. Because the dataset begins in 1989, we have disaggregated data for only two years of the pre-reform period.20 The size of the dataset varies by year, as demonstrated in Table I.1 in this appendix. In some cases, companies exit and reenter the database. However, overall exit rates are very low.21Data have been adjusted to a calendar basis, unless otherwise indicated. In 2001 and 2002, the number of companies is considerably lower than in preceding years because of partially reporting by companies’ accounts for that year at the time of compilation of the database. A total of 4,175 different companies (largely in the manufacturing sector) are included for at least one year in the Prowess database. Firms are categorized by industry according to the National Industrial Classification Code and span the range of industries in the Indian economy. The largest sectors in terms of number of companies are chemicals, basic metals, food and beverages, and textiles. The database contains information on equity ownership, with firms classified to four categories: stand-alone private Indian companies, private Indian companies associated with a business group, government-owned enterprises, and foreign companies. The stand-alone companies represent the largest block of companies (more than half of the total number of companies), but only account for 12 percent of total assets, sales, and net worth of all companies. More than 40 percent of the companies were incorporated in the past 18 years, but the older companies still control a large share of total assets and sales. Additional summary statistics on these companies are provided in Tables I.2 and I.3, including a breakdown by industry classification, ownership, and year of incorporation.
20 The Reserve Bank of India and ICICI Bank each tracked a small set of companies for the period 1980–1990. These data are, however, not available to the public at a disaggregated level.
21 A company is classified as having exited the sample if it does not appear in any subsequent years after the first year it does not appear in the dataset. The drop in the number of companies in the Prowess database in 2001 and especially 2002 is likely due to lags in receiving and processing the necessary information or firms for these two years.

- 36 - APPENDIX I
Companies That Number of Companies Exited Sample
Year in Sample (In percent)
1989 1,073 0.00 1990 1,219 0.00 1991 1,546 0.00 1992 1,757 0.00 1993 2,116 0.00 1994 2,679 0.00 1995 3,184 0.15 1996 3,319 0.41 1997 3,316 1.60 1998 3,322 2.77 1999 3,450 4.49 2000 3,633 3.04
2001 1/ 3,167 ... 2002 1/ 2,093 ...
Sources: CMIE ( Prowess database); and author's estimates.
1/ Provisional data, based on available sample from CMIE as of mid-2003.
Table I.1. Sample Statistics, 1989–2002

- 37 - APPENDIX I
In p
erce
ntIn
per
cent
In
per
cent
In p
erce
ntIn
dust
ry
Num
ber
of to
tal
In R
s. bi
llion
1/of
tota
l In
Rs.
billi
on1/
of to
tal
In R
s. bi
llion
1/of
tota
l
Agr
icul
ture
68
1.6
19.7
0.4
19.2
0.5
7.3
0.6
Oth
er m
inin
g an
d qu
arry
ing
350.
87.
70.
2 2.
50.
13.
10.
2
Man
ufac
turin
g Fo
od p
rodu
cts a
nd b
ever
ages
48
011
.519
9.2
4.4
226.
55.
657
.34.
6To
bacc
o pr
oduc
ts
110.
333
.20.
7 62
.41.
512
.61.
0Te
xtile
s 45
310
.926
8.4
6.0
201.
25.
034
.82.
8W
earin
g ap
pare
l, dr
essi
ng a
nd d
ying
of f
urs
581.
412
.30.
3 9.
20.
24.
20.
3Ta
nnin
g an
d dr
essi
ng o
f lea
ther
44
1.1
14.3
0.3
14.2
0.4
5.0
0.4
Woo
d 19
0.5
8.1
0.2
5.6
0.1
2.0
0.2
Pape
r and
pap
er p
rodu
cts
120
2.9
82.1
1.8
55.9
1.4
22.3
1.8
Publ
ishi
ng, p
rintin
g, a
nd re
prod
uctio
n of
reco
rded
med
ia32
0.8
19.4
0.4
17.7
0.4
9.0
0.7
Cok
e, re
fined
pet
role
um p
rodu
cts,
etc.
370.
948
7.3
10.9
85
0.1
20.9
147.
111
.7C
hem
ical
s 76
518
.375
9.0
16.9
60
9.8
15.0
220.
217
.5R
ubbe
r and
pla
stic
pro
duct
s 26
86.
412
2.3
2.7
115.
62.
833
.12.
6N
onm
etal
lic m
iner
al p
rodu
cts
174
4.2
182.
54.
1 13
4.5
3.3
41.9
3.3
Bas
ic m
etal
s 37
18.
981
3.0
18.1
46
2.6
11.4
231.
218
.4Fa
bric
ated
met
al p
rodu
cts
118
2.8
58.2
1.3
46.1
1.1
13.7
1.1
Mac
hine
ry a
nd e
quip
men
t NEC
27
46.
624
0.2
5.4
209.
35.
253
.24.
2O
ffic
e, a
ccou
ntin
g an
d co
mpu
ting
mac
hine
ry31
0.7
19.7
0.4
23.4
0.6
7.5
0.6
Elec
trica
l mac
hine
ry, e
tc.
165
4.0
112.
42.
5 10
9.8
2.7
32.9
2.6
Rad
io a
nd te
levi
sion
equ
ipm
ent
108
2.6
115.
12.
6 95
.92.
432
.72.
6M
edic
al, p
reci
sion
, and
opt
ical
inst
rum
ents
511.
226
.50.
6 15
.70.
45.
50.
4M
otor
veh
icle
s, tra
ilers
, etc
. 20
24.
823
9.7
5.3
255.
46.
377
.46.
2O
ther
tran
spor
t equ
ipm
ent
421.
012
4.3
2.8
88.5
2.2
17.5
1.4
Furn
iture
and
man
ufac
ture
s not
else
whe
re c
lass
ified
551.
325
.50.
6 29
.40.
711
.00.
9
Com
pute
r and
rela
ted
activ
ities
18
0.4
14.8
0.3
14.2
0.4
8.8
0.7
Mis
cella
neou
s goo
ds a
nd se
rvic
es
50.
10.
20.
0 0.
10.
00.
10.
0
Div
ersi
fied
611.
543
0.1
9.6
342.
78.
415
2.4
12.1
Mis
sing
indu
stria
l cla
ssifi
catio
n 10
82.
649
.71.
1 42
.51.
014
.61.
2
Tota
l 2/
4,17
510
0.0
4,48
5.0
100.
0 4,
060.
210
0.0
1,25
8.2
100.
0
Sour
ces:
CM
IE ( P
row
ess d
atab
ase)
; and
aut
hor's
est
imat
es.
1/ In
con
stan
t 199
3 pr
ices
. 2/
Rep
rese
nts t
he to
tal n
umbe
r of c
ompa
nies
for w
hich
dat
a ar
e re
porte
d in
the
Prow
ess
data
base
dur
ing
the
perio
d 19
89–2
002.
Tabl
e I.2
. Bre
akdo
wn
of C
ompa
nies
by
Indu
stry
Com
pani
esSa
les
Net
Wor
thA
sset
(Ave
rage
dur
ing
1989
–200
2)
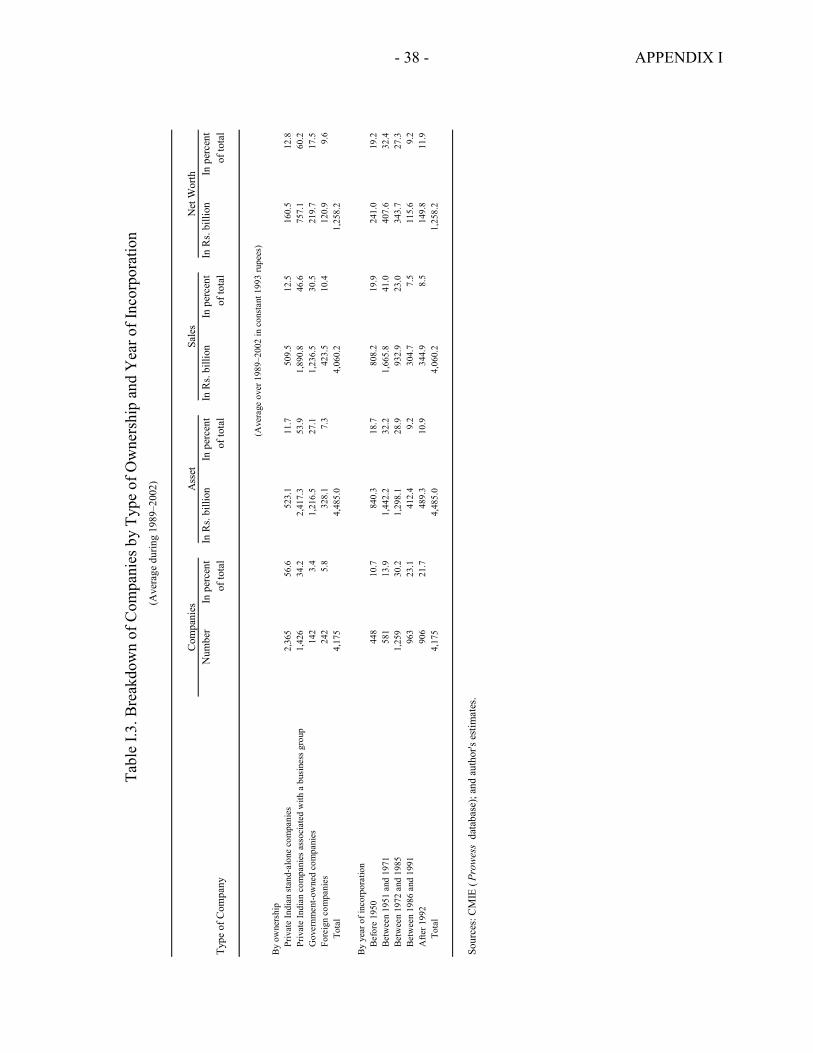
- 38 - APPENDIX I
(Ave
rage
dur
ing
1989
–200
2)
Num
ber
In p
erce
ntIn
Rs.
billi
onIn
per
cent
In
Rs.
billi
onIn
per
cent
In R
s. bi
llion
In p
erce
ntTy
pe o
f Com
pany
of
tota
lof
tota
l of
tota
lof
tota
l
By
owne
rshi
p Pr
ivat
e In
dian
stan
d-al
one
com
pani
es
2,36
556
.652
3.1
11.7
509.
512
.516
0.5
12.8
Priv
ate
Indi
an c
ompa
nies
ass
ocia
ted
with
a b
usin
ess g
roup
1,
426
34.2
2,41
7.3
53.9
1,89
0.8
46.6
757.
160
.2G
over
nmen
t-ow
ned
com
pani
es
142
3.4
1,21
6.5
27.1
1,23
6.5
30.5
219.
717
.5Fo
reig
n co
mpa
nies
242
5.8
328.
17.
3 42
3.5
10.4
120.
99.
6To
tal
4,17
54,
485.
04,
060.
21,
258.
2
By
year
of i
ncor
pora
tion
Befo
re 1
950
448
10.7
840.
318
.7
808.
219
.924
1.0
19.2
Betw
een
1951
and
197
1 58
113
.91,
442.
232
.2
1,66
5.8
41.0
407.
632
.4Be
twee
n 19
72 a
nd 1
985
1,25
930
.21,
298.
128
.9
932.
923
.034
3.7
27.3
Betw
een
1986
and
199
1 96
323
.141
2.4
9.2
304.
77.
511
5.6
9.2
Afte
r 199
2 90
621
.748
9.3
10.9
344.
98.
514
9.8
11.9
Tota
l 4,
175
4,48
5.0
4,06
0.2
1,25
8.2
Sour
ces:
CM
IE ( P
row
ess d
atab
ase)
; and
aut
hor's
est
imat
es.
Net
Wor
th
Tabl
e I.3
. Bre
akdo
wn
of C
ompa
nies
by
Type
of O
wne
rshi
p an
d Y
ear o
f Inc
orpo
ratio
n
(Ave
rage
ove
r 198
9–20
02 in
con
stan
t 199
3 ru
pees
)
Com
pani
esA
sset
Sale
s

- 39 -
References
Beaumont, Craig, Kenneth Kang, Yougesh Khatri, and Helene Poirson, 2003, “A Guidance Note on Surveillance of the Corporate Sector in the Asia Pacific Department” (unpublished; Washington: International Monetary Fund). Begum, Jahanara, and Liliana Schumacher, 2001, “International Comparison of Corporate Leverage,” International Monetary Fund, Monetary and Exchange Affairs Department Technical Note, TN/01/02. Birla, Kumar Mangalam, 1999, “Report of the Committee Appointed by the SEBI on Corporate Governance Under the Chairmanship of Shri Kumar Mangalam Birla.” Claessens, Stijn, Simeon Djankov, and Larry Lang, 1998, “East Asian Corporates: Growth, Financing and Risks over the Last Decade,” Working Paper (unpublished; Washington: World Bank). Chopra, Ajai, et. al., 1995, India: Economic Reform and Growth, IMF Occasional Paper 134 (Washington: International Monetary Fund). Cobham, David, and Ramesh Subramaniam, 1998, “Corporate Finance in Developing
Countries: New Evidence for India,” World Development, Vol. 26, No. 6, pp. 1033–1047.
Ganesh-Kumar, A., Kunal Sen and Rajendra Vaidya, 2002, “Does the Source of Financing Matter? Financial Markets, Financial Intermediaries and Investment in India,” Journal of International Development, Vol. 14, pp. 211–228. Godbole, Madhav, 2002, “Corporate Governance: Myth and Reality,” Economics and Political Weekly, July 27, p. 3099. Goldman Sachs, 2000, “NPLs: How High, How Structural,” (Hong Kong: Goldman Sachs Global Equity Research). Goswami, Omkar, 2002, “Corporate Governance in India,” Taking Action Against Corruption in Asia and the Pacific (Manila: Asian Development Bank), Chapter 9. Government of India, Ministry of Finance, Department of Company Affairs, 2003, Annual Report 2001–02 (New Delhi: Department of Company Affairs). _______, 2002, Forty Sixth Annual Report on the Working and Administration of the Companies Act, 1956 (New Delhi: Department of Company Affairs). Haksar, Vikram, and Piyabha Kongsamut, 2002, “Corporate Performance in Thailand,” Thailand: Selected Issues and Statistical Appendix, IMF Country Report No. 02/195
(Washington: International Monetary Fund).

- 40 -
Heytens, Paul, and Cem Karacadag, 2001, “An Attempt to Profile the Finances of China’s Enterprise Sector,” IMF Working Paper 01/182 (Washington: International Monetary Fund). Hviding, Ketil, and Laura Papi, 2002, “The Mexican Corporate Sector: A Vulnerability Analysis,” Mexico: Selected Issues, IMF Country Report No. 02/238 (Washington:
International Monetary Fund). Kang, Kenneth, 2001, “Health of the Corporate Sector in Korea,” Korea: Selected Issues, IMF Country Report No. 01/101 (Washington: International Monetary Fund). Khanna, Tarun, and Krishna Palepu, 1999, “Emerging Market Business Groups, Foreign
Investors, and Corporate Governance,” NBER Working Paper 6955 (Cambridge: National Bureau of Economic Research).
National Stock Exchange of India Ltd., 2002, “Securities Market in India—An Overview,” www.nseindia.com Report of the Committee on Corporate Audit and Governance, 2002, prepared by the Committee on Corporate Audit and Governance (Chair: Naresh Chandra), Ministry of Finance and Company Affairs, Department of Company Affairs, New Delhi. Sarkar and Sarkar, 1999, “The Governance of Indian Corporates,” Indian Development Report. Shirai, Sayuri, 2002, “Have India’s Financial Market Reforms Changed Firms’ Corporate Financing Patterns?” ADB Institute, Research Paper No. 38
(Manila: Asian Development Bank). Singh, Ajit, and Javed Hamid, 1992, “Corporate Financial Structures in Developing Countries,” IFC Technical Paper No. 1 (Washington: International Finance Corporation). Singh, Ajit, 1995, “Corporate Financial Patterns in Industrializing Economies. A Comparative International Study,” IFC Technical Paper No. 2 (Washington: International Finance Corporation). Standard and Poor’s, 2003, Global Stock Markets Factbook 2002 (New York). World Bank, 2000, India: Report on the Observance of Standards and Codes (ROSC), Corporate Governance Assessment and ROSC Module www.worldbank.org/ifa/rosc_cg_india.html