Embed Size (px)
Citation preview

8/9/2019 SSRN-id878887Overview of the Indian Corporate Sector
http://slidepdf.com/reader/full/ssrn-id878887overview-of-the-indian-corporate-sector 1/41
WP/04/64
M W o r k i n g P a p e r
Overview of the Indian Corporate Sector:
1989-2002
Petia Topalova
I N T E R N T I O N L M O N E T R Y F U N D

8/9/2019 SSRN-id878887Overview of the Indian Corporate Sector
http://slidepdf.com/reader/full/ssrn-id878887overview-of-the-indian-corporate-sector 2/41
© 2004 International Monetary Fund WP/04/64
IMF Working Paper
Asia and Pacific Department
Overview of the Indian Corporate Sector: 1989 2002
Prepared by Petia Topalova
1
Authorized for distribution by Kalpana K ochhar
April 2004
Abstract
This Working Paper should not be reported as representing the views of the IMF.
The views expressed in this W orking Paper are those of the author(s) and do not necessarily represent
those of the IMF or IMF policy. Working Papers describe research in progress by the author(s) and are
published to elicit comments and to further debate.
This paper uses firm-level data to examine the performance of India's nonfinancial corporate
sector since 1989 and evaluate its financial vulnerabilities. While promising trends in
liquidity, profitability, and leverage of the sector emerged in the early 1990s, they
experienced a reversal after 1996. Nonetheless, most indicators were still at comfortable
levels,
and there is evidence of improvement in 2002, the last year in our sample. However, a
number of firms still face problems servicing their debt obligations, posing a risk to lenders.
In particular, the aggregate interest coverage of the corporate sector indicates that potential
nonperforming loans of the corporate sector remain high. This underscores the need for close
monitoring of the corporate sector in the future.
JEL Classification Numbers: G20, G30, 053
Keywords: Indian corporate sector, Indian financial sector
Author's E-Mail Address: [email protected]
1
This paper was prepared while the author was a summer intern in the Asia and Pacific
Department in
2003.
The author is currently a Ph.D. candidate in economics at the
Massachusetts Institute of Technology. I would like to thank David Cowen and Kalpana
Kochhar for their guidance and overall support. Special thanks are due to Shawn Cole for his
helpful comments.

8/9/2019 SSRN-id878887Overview of the Indian Corporate Sector
http://slidepdf.com/reader/full/ssrn-id878887overview-of-the-indian-corporate-sector 3/41
2
Contents Page
I. Introduction 3
II. Overview of the Corpo rate Sector 4
III.
Financial Performance of the Corporate Sector 6
IV. Corporate Gove rnance in India 24
V. Conclusion 27
Box
1. Legal and Regulatory Framework for the Corporate Sector
Prior to the 1991 Reforms 5
Figures
1. Share of External Finance of Indian Comp anies 7
2.
Com panies' Leverage 8
3.
Distribution of Leverage of Com panies 10
4.
Com panies' Current Ratio 13
5.
Distribution of Current Ratio of Com panies 14
6. Com panies' Interest Coverage 15
7.
Distribution of Interest Coverage Ratio of Com panies 16
8. Measures of Nonperforming Loans 18
9. Median Interest Rate by Ownership Category 18
10. Com panies' Profitability 20
11. Distribution of Profitability of Com panies 21
Tables
1.
Growth in the Corporate Sector, 1989-200 2 28
2.
Selected Indicators on Registered Companies 29
3.
Pattern of Equity Ownership of Registered Companies in 2002 30
4.
International Com parison of Key Financial Ratios of the Corporate
Sector (end-2002) 31
5.
Debt Structure of Corpo rate Sector, 1990-2002 32
6. L iquidity Analysis of Corporate Sector, 1989-20 02 33
7. Source of Debt Financing of Corporate Sector, 1989-20 02 34
Appendix
I. Data Sources 35
References 39
8/9/2019 SSRN-id878887Overview of the Indian Corporate Sector
http://slidepdf.com/reader/full/ssrn-id878887overview-of-the-indian-corporate-sector 4/41
3
I . IN TR O D U C TIO N
India launched a series of economic reforms in 1991 in response to a severe balance of
payments crisis, many of which directly or indirectly led to a substantial liberalization of the
corporate sector. The reforms aimed at easing restrictions on firms' activities and enhancing
overall competition by putting an end to the 'license raj,' liberalizing the foreign trade regime,
and opening the financial sector. The freeing of capital markets and entry of foreign investors
brought new financing and ownership opportunities and significantly raised the volume of new
equity issues.
While India withstood the Asian financial crisis of 1997-98 comparatively well, the fallout
from the crisis demonstrated that the corporate sector could play an important role in
transmitting financial shocks and putting the financial sector at risk. Mismatches in the
corporate sector's balance sheet brought to light both domestic and external vulnerabilities. As
evidenced in the Asian crisis, the deterioration in creditworthiness of large segments of the
corporate sector sharply increased nonperforming loans (NPLs), curtailed new investment, and
contributed to capital flight, all of which adversely affected economic activity as a whole.
This paper uses firm-level data to examine the performance of India's nonfinancial corporate
sector since 1989 and evaluate its financial vulnerabilities. The 1990s were a dynamic period
for most Indian companies, especially in the first half of the decade, which was characterized
by high sales growth, improved profitability, and strengthened finances. The second half of
the 1990s witnessed some reversal of these trends, with the variation in the performance of
Indian companies increasing and the gap between the best and worst performers growing
substantially, as firms were forced to compete in the new economic environment. Yet, despite
some signs of weakening in the corporate sector, most indicators are still at comfortable levels,
and there is evidence of improvement in almost all indicators during 2002, the last year in our
sample. However, an examination of the balance sheets of Indian companies suggests that an
increasing number of firms could face problems servicing their debt obligations, which may
pose some risk to lenders. In particular, the aggregate interest coverage of the nonfinancial
corporate sector indicates a share of potential NPLs in total corporate borrowings of as high as
38 percent in 1999, and down only slightly in recent years.
2
This underscores the need for close
monitoring of the corporate sector in the future.
The remainder of this paper is organized as follows. Section II gives an overview of India's
corporate sector through 2002, including its size and composition, regulatory framework, and
recent reforms. Section III analyzes the financial performance of the corporate sector
during 1989-2002 using firm-level data, focusing on capital structure, profitability measures,
and debt repayment capacity to ascertain financial vulnerability of Indian companies.
Section IV concludes with a discussion of the empirical results and their policy implications.
2
Observations made for 2001 and 2002 are subject to the caveat that data for these two years
are from a smaller sample of firms than for earlier years.

8/9/2019 SSRN-id878887Overview of the Indian Corporate Sector
http://slidepdf.com/reader/full/ssrn-id878887overview-of-the-indian-corporate-sector 5/41
4
I I . O V E R V I E W O F T H E C O R P O R A T E S E C T O R
The economic reforms since 1991 have brought many changes to the environment in which
Indian companies previously operated. The principal aim of these reforms was to strengthen
market discipline and promote greater competition by putting an end to the license raj,
namely through the abolition of the Industries Development and Regulation Act (1951) and
amendments to the Co mpanies Act and several other major laws, which had imposed a heavy
legal and regulatory burden on the corporate sector (Box 1). In addition, the foreign trade
regime was liberalized through cuts in tariff
rates,
reductions in nontariff barriers, and a
streamlining of import licenses; foreign investment opportunities were increased; and
shareholders' rights were improved. Indian companies w ere allowed to enter into joint ventures
with multinational enterprises more freely, import new technologies and capital goods, expand
productive capacity, and introduce new products without obtaining industrial licenses.
3
More
recently, steps have been taken to dereserve a number of small-scale industries, particularly
those industries with the greatest export potential. A more modern competition law has also
been enacted that focuses more on anti-competitive practices, by giving greater consideration to
abuse of market dominance rather than through firm size per se. Further progress is needed in
reforming labor laws to allow flexibility in employment decisions in line with market
conditions.
The financial sector has also experienced a considerable opening. Recognizing the poor health
of the financial sector, a host of reforms were implemented (as laid out by the Narasimham
Committee on Financial Sector Reforms), including the deregulation of interest rates, easing of
restrictions on private and foreign banks, removal of consortium lending requirements,
liberalizing of bank branch licensing, and entry of private sector mutual funds and foreign
institutional investors. Financial sector reforms, in particular, have acted to induce firms to
improve their cash and debt manag ement during the reform period.
India's corporate sector has grown steadily over the past two decades in terms of number of
registered companies and amount of paid up capital (Table 1). The corporate sector consists of
closely held (private limited) and publicly held (public limited) companies, with approximately
619,000 registered companies as of June
2003,
about 40 percent of which are in the
manufacturing sector.
4
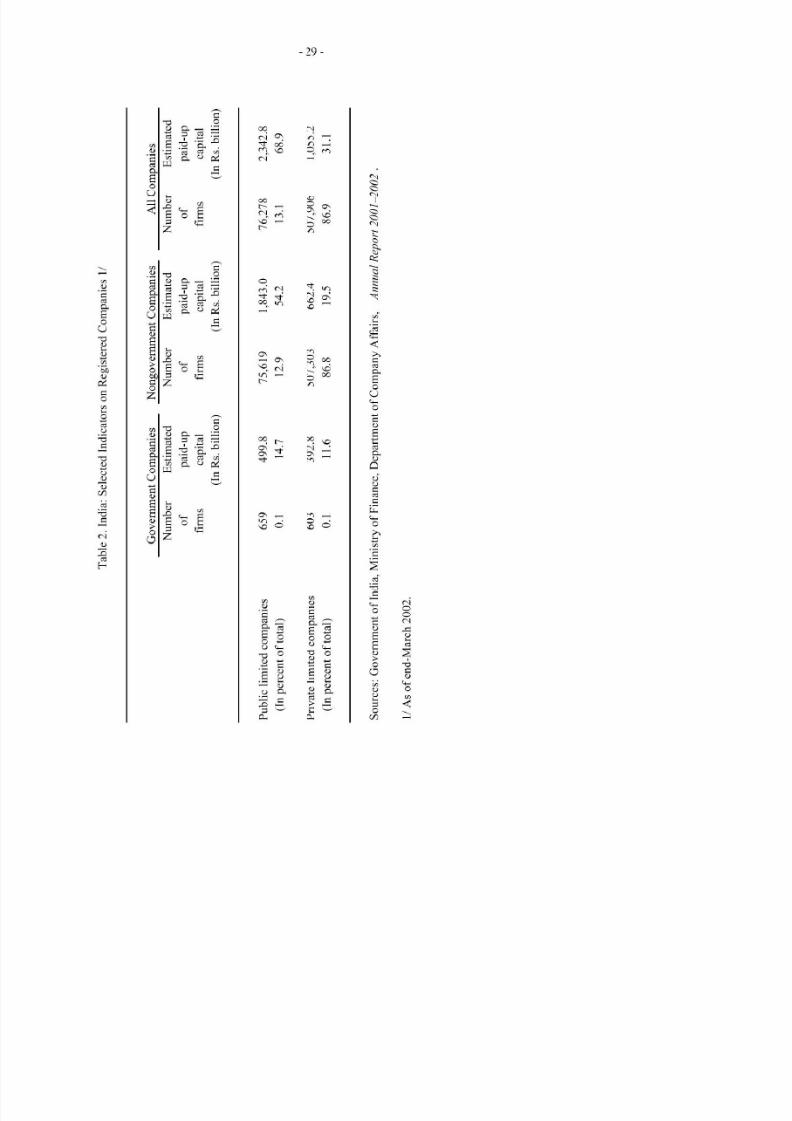
Private limited companies comprise the majority of firms in the
corporate sector, but account for less than one-third of total paid up capital (Table 2).
Government-owned enterprises (both public and private limited) are comparatively few
3
See Chopra et. al. (1995) for a complete description of the macroeconomic and structural
reforms in the aftermath of
the
1991 crisis.
4
Among the private limited companies, there is a further subdivision into family-run business
group companies and stand-alone companies. Group companies represent 34 percent of the
companies in the sample and tend to be more diversified than stand-alone companies.

8/9/2019 SSRN-id878887Overview of the Indian Corporate Sector
http://slidepdf.com/reader/full/ssrn-id878887overview-of-the-indian-corporate-sector 6/41
- 5 -
Box 1. India: Legal and Regulatory Framework for the Corporate Sector Prior to
the 1991 Reforms
India is a common law country, with the legal framework for regulating registered companies largely evolving
from its colonial past. Nevertheless, these laws were not always properly enforced, and the problems in
corporate governance often have been pointed out as impediments to the sound performance of Indian
companies. In recent years, an increasing num ber of firms have realized the necessity for greater transparency,
independent managem ent, and the protection of minority shareholders and creditors in order to remain
competitive in the expanding capital markets. This section sum marizes the institutional framework in which
the Indian corporate sector operates, drawing on the excellent surveys on the topic by Goswam i (2002), Sarkar
and Sarkar (1999), and the World Ba nk's Report on Observance of Standards and Codes on Corporate
Governance (2000).
Prior to the 1991 reform, the main legislative acts governing Indian companies were the following:
• The Companies Act of 1956 (largely based on its British counterpart) established the modern legal
and regulatory framework for the corporate sector, giving power to the central government to
monitor, regulate, and control the affairs of companies, including establishing the types and structure
of companies and registration and reporting requirements.
• The Capital Issues Control) Act, 1947 required any firm seeking to issue securities to obtain
approval from the central government; this was done to ensure that the cou ntry's financial resources
were channeled into areas that served the governm ent's goals and priorities.
• The 1951 Industries Developm ent and Regulation IDR) A ct put in place a system of m andatory
licenses, which acted to limit a firm's ability to expand capacity, change product m ix, introduce new
processes, and import machinery and equipment without obtaining various licenses from the central
government.
• The Industrial Policy Resolution of 195 6 reserved certain industries for the public sector, thus
creating a large state-owned industrial and services sector.
• Finally, the 1969
Mono polies and Restrictive Trade Practices Act
paved the way for widespread
nationalization of Indian com panies by establishing an asset-based classification of monopoly, but
applying only to the private sector.
The government of India also had a number of policies aimed at directing the development of the corporate
sector.
•
Small-scale industries
were specifically encouraged since 1967, and many product lines were
reserved for the small-scale sector. This policy was put on a statutory footing by amending the IDR
Act in 1984.
• A policy of import substitution was implemented with high tariffs and a requirement of multiple
import licenses, shielding domestic firms from foreign competition.
• In order to foster industrialization, the governm ent also set up three
d evelopment finance institutions:
the Industrial De velopment B ank of India (IDBI), the Industrial Finance Corporation of India (IFCI),
and the Industrial C redit and Investment Corporation of India (ICICI), whose mission was to lend to
industrial enterprises, often at below-market interest rates.
• With interest rates regulated by the government, com petition am ong financial institutions was very
limited. Public financial institutions, which supplied the vast majority of loans to the public sector,
had little incentive to monitor the lending activity (Khanna et al., 1999), which led to excess
leveraging.
8/9/2019 SSRN-id878887Overview of the Indian Corporate Sector
http://slidepdf.com/reader/full/ssrn-id878887overview-of-the-indian-corporate-sector 7/41
- 6 -
in number but large in size, accounting for more than 25 percent of the paid up capital. The
share of total output by government enterprises has been declining since the start of reforms,
falling from 32 percent of gross industrial value added in 1991 to 25 percent in 2002.
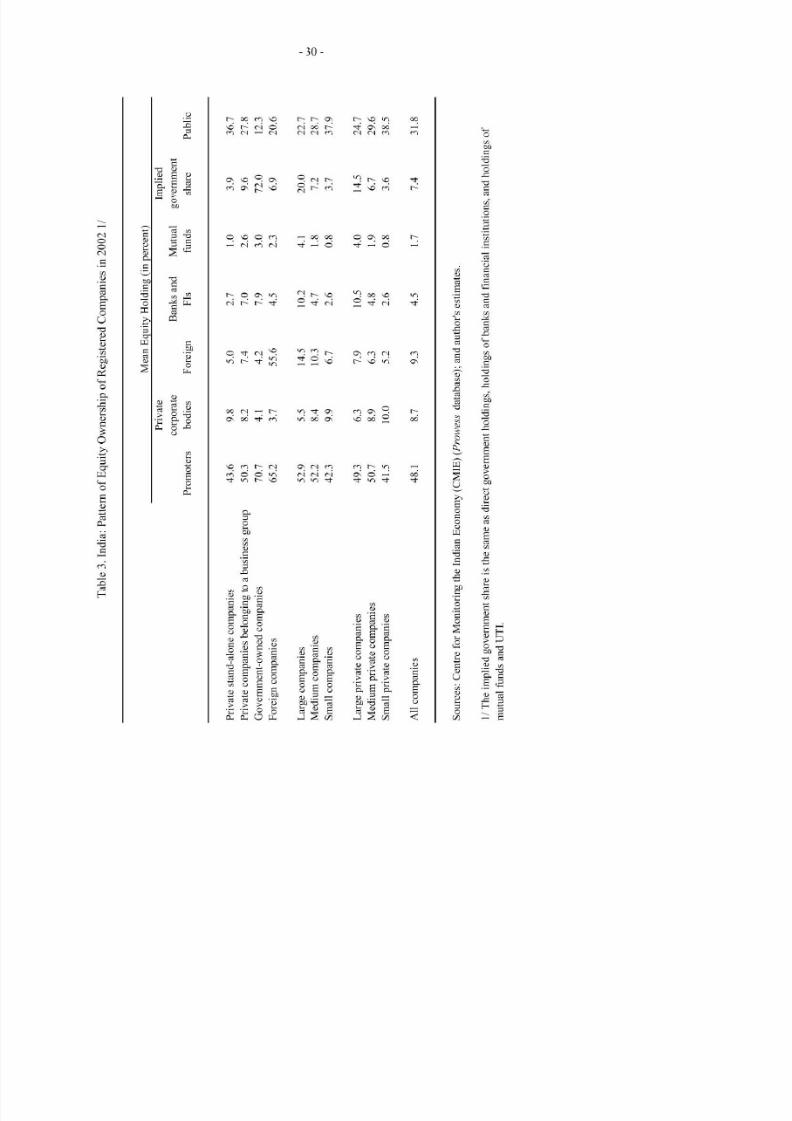
The ownership of India's corporate sector tends to be concentrated in the hands of firm
promoters and, to a lesser extent, small investors (Table 3). Focusing on the manufacturing
sector, promoters' share was 48 percent of paid up capital for all companies in 2002 and as
high as 71 percent for government-owned enterprises. The prevalence of cross-holdings of
ownership, together with heavy owner participation, makes In dia's system of corporate
control close to an insider one, as characterized by Sarkar and Sarkar (1999 ). While the
share of equity held by small (public) investors in India (32 percent) is comparable to that of
the United States and United Kingdom (countries with a pronounced outsider system),
inter-corporate holdings in India are much higher. In addition, financial institutions (FIs) in
India hold a much smaller share of equity as compared to other countries and have been
characterized as largely passive shareholders, mostly supportive of man agem ents' positions
(Sarkar and Sarkar, 1999).
India's corporate sector is supported by a well-established equity market. Currently, there are
23 registered stock exchanges in India, with total market capitalization of US 131 billion at
end-2002, equivalent to 26 percent of GDP and compared w ith 21 percent in 1990.
5
T he
equity market is dominated by the Bombay Stock Exchange—the oldest in Asia—and the
National Stock Exchange (NSE). The NSE began operations in 1994 in response to a
government effort to improve the efficiency and transparency of India's equity market. It
quickly established itself as the foremost stock exchange in the country. Efforts are under way
to close and/or consolidate a number of regional stock exchanges that have been generally
thinly traded but largely sustained by listing requirements governing publicly traded
companies operating in a different region.
I I I. F I N A N C IA L P E R F O R M A N C E O F T H E C O R P O R A T E S E C T O R
During the reform period, India's corporate sector initially strengthened, but in recent years, it
has shown signs of weakening in line with the slowdown in economic growth and industrial
production. Evidence of this weakening can be seen by reviewing various financial ratios,
which provide useful indicators for monitoring corporate sector vulnerabilities. Data used in
this section to derive these indicators are described in Appendix I.
5
According to the Global Stock Markets Factbook 2003, India ranked 19
th
in terms of market
capitalization, 17
th
in terms of total value traded in the stock exchanges, and 2
nd
in terms of
number of listed companies at end-20 02. As a whole, India's large exchanges are considered
highly liquid, with only six countries having a higher annual turnover ratio than India at
end-2002, which was 165 percent.

8/9/2019 SSRN-id878887Overview of the Indian Corporate Sector
http://slidepdf.com/reader/full/ssrn-id878887overview-of-the-indian-corporate-sector 8/41
7
Sources of Funds
Indian companies continue to rely heavily on external sources
of
finance (i.e., outside the
firm), averaging 67 percent during 1990-20 02 (Figure 1).
6
While the amount of new equity
finance raised has been large in recent years, Indian companies are still dependent on debt
finance, including bank
borrowings. For the year ending
March 2002, external financing
accounted
for
56 percent of total
corporate funds raised, with
slightly more than two-fifths
of
this from capital markets
(including bonds and
debentures).
In
addition, new
financial instruments such as
commercial paper (including
private placements), certificates
of deposit, and inter-corporate deposits have gained popularity as
a
source
of
financing. More
recently, some firms have also begun to raise funds through external commercial borrowing.
80
70
60
50
/in
Figure 1. S
-
ha
re of Ext
er
(I
nal
n
p
Fi
er
nance of Indian Companies
cent)
-
-
1990 1991 1992 1993 1994 1995 1996 1997 1998 1999 2000 2001 2002
Sources: Centre for Monitoring the Indian Economy (CMIE),
Prowess
database;
and author's estimates.
The dependence on external sources
of
finance, especially on debt finance, makes India's
corporate sector relatively vulnerable to domestic financial shocks. At the macro-level, this
vulnerability stems from large fiscal deficits (for the general government estimated
at
101/2
percent
of GDP in
fiscal year (April-Ma rch) 2002/03) and sizable government debt
(estimated
at
83 percent
of
GDP,
a
majority of which is domestic debt and largely held by
government-owned banks and FIs), which has the potential to crowd out private investment
and slow growth. Indian companies are also more leveraged and have larger short-term
borrowing (as
a
share of total borrowing) than their counterparts
in
other Asian countries and
elsewhere (Table 4). Offsetting these risk factors, Indian companies tend to have
comparatively low foreign exposure.
Leverage and Debt Structure
The average debt-to-equity ratio
for
Indian companies bottomed out
at 1.2 in
1996, but has
since risen to
1.4 in
2002, close to the 1990 level (Figure 2). The aggregate picture, however,
masks several interesting developments in the corporate sector.
6
In
contrast, the share
of
external finance
is
less than 40 percent in the United States, the
United Kingdom, and Germany. The reliance
of
Indian corporations on external sources
to
finance investments
is
similar to that in Finland, France, and Italy, as pointed out by Cobham
eta l. (1998).

8/9/2019 SSRN-id878887Overview of the Indian Corporate Sector
http://slidepdf.com/reader/full/ssrn-id878887overview-of-the-indian-corporate-sector 9/41
- 8 -
Figure 2. Companies' Leverage
2.0
1.8
1.6
1.4
1.2
1.0
0.8 - -
0.6
0.4
0.2
0.0
Aggregate and Median Debt-Equity Ratio
1989 1991 1993 1995 1997 1999 2001
-Aggregate
Median
Aggregate Debt-Equity Ratio by Trend
A.
1989 1991 1993 1995 1997 1999 2001
- Companies with rising ratio — Companies with falling ratio
-Young companies
Aggregate Debt-Equity Ratio by Ownership Category
Median Debt-Equity Ratio by Ownership Category
1989 1991 1993 1995 1997 1999 2001
3.5
3.0
2.5
2.0
1.5
1.0
0.5
0.0
1989 1991 1993 1995 1997 1999 2001
- Stand Alo ne —• Group
—A—
Government —•— Foreign
- Stand Alo ne —I Group —A— Governm ent —•— Foreign
Aggregate Debt-Equity Ratio by Company Size
Median D ebt-Equity Ratio by Comp any Size
1991 1993 1995 1997 1999 2001
- Large Med ium A Small
2.0
1.8
1.6
1.4
1.2
1.0
0.8
0.6
0.4
0.2
0.0
1989 1991 1993 1995 1997 1999 2001
- Large — Med ium —A— Small
Sources: CMIE, Prowess database; and author's estimates.

8/9/2019 SSRN-id878887Overview of the Indian Corporate Sector
http://slidepdf.com/reader/full/ssrn-id878887overview-of-the-indian-corporate-sector 10/41
- 9 -
• The debt-to-equity ratios of the med ian firm of the corporate sector as a who le and of
the median firm of various subcategories (by ownership) have fallen consistently
during the sample period, largely due to faster growth of equity funding rather than
debt reduction (during 1989 -2002, the average rates of growth of net worth and gross
borrowing for the median company w ere 8 and 4 percent, respectively). This partly
reflects the fact that the development finance institutions (DFIs) initially created to
foster industrialization by providing subsidized loans to industrial enterprises have
reduced their lending activities in recent years, while commercial banks have yet to
step in to fill the breach .
• The discrepancy betwe en the aggregate and the firm-level data comes from the fact
that while the majority of companies have become less leveraged during the sample
period, about one-quarter of the companies in the sample (representing one-quarter of
the total assets) have actually experienced a consistent increase in their debt-to-equity
ratios since 1989 and are currently considered highly leveraged. This trend is more
readily evident among government-owned companies and small enterprises.
Highly-leveraged companies have also tended to be less profitable.
• The distribution of leverage ratios over time (Figure 3) gives a further understanding
of the divergence between the aggregate and median ratios. The tightening of the
distribution of leverage ratios until 1996 was associated with a smaller gap between
the median and aggregate ratios. However, the fatter right hand tail of the 2002
distribution suggests an increasing number of highly indebted companies are
responsible for the reversal in the downward trend in aggregate leverage of the
corporate sector.
The maturity structure of corporate debt also changed over the period 1989 -2002. Aggregate
long-term debt accounted for almost 90 percent of total debt in 1989, but was down to about
70 percent in 2002 (Table 5). This trend has been most pronounced among private
independent companies, whose long-term debt (as a share of total debt) was less than
60 percent by 2002. A plausible explanation for this trend is the decline over the past decade
in lending activities of
DFIs,
which traditionally in India were the most important source of
long-term borrowing for the private companies in the pre-reform period (Ganesh-Kumar
et al., 2002).
7
As noted earlier, commercial banks have yet to pick up the slack, in part owing
7
There are several reasons for the decline in companies' ability to tap DFIs as a source of
funds. The government has drastically reduced DFIs' access to subsidized funds and
deregulated interest rates, which has forced DFIs to compete more directly with other lending
institutions. Also, a smaller portion of long-term credit provided by DFIs constitutes directed
lending, which benefited the manufacturing sector, although it still may be government
guaranteed (Ganesh-Kumar et al., 2002).

8/9/2019 SSRN-id878887Overview of the Indian Corporate Sector
http://slidepdf.com/reader/full/ssrn-id878887overview-of-the-indian-corporate-sector 11/41
F
g
e
3
D
s
b
o
o
L
a
o
C
m
e
1
2
D
E
y
R
o
n
1
D
E
y
R
o
n
1
-
3
5
3
0
-
2
5
2
0
-
1
5
1
0
-
0
5
0
0
0
5
1
0
1
5
2
0
2
5
3
0
3
5
4
0
4
5
5
0
5
5
6
0
R
o
3
-
3
5
3
0
2
5
-
2
0
1
5
1
0
0
5
0
0
0
5
1
0
1
5
2
0
2
5
3
0
3
5
4
0
4
5
5
0
5
5
6
0
R
o
D
E
y
R
o
n
2
2
0
-
3
5
-
3
0
2
5
-
2
0
1
5
-
1
0
0
5
0
0
0
5
1
0
1
5
2
0
2
5
3
0
3
5
4
0
4
5
5
0
5
5
6
0
R
o
D
E
y
R
o
n
2
2
|
2
a
S
1
5
G
-
3
5
3
0
-
2
5
2
0
-
1
5
1
0
-
0
5
0
0
0
5
1
0
1
5
2
0
25
3
0
3
5
4
0
4
5
5
0
5
5
6
0
R
o
S
c
C
M
I
E
P
o
w
e
d
a
a
a
h
s
e
m
e
1
T
n
m
o
m
v
y
o
e
s
m
e
p
o
2
E
u
h
0
5
a
9
1
p
c
e
o
c
m
e
e
n
d
a
o
e
s
m
e
y
s
o
a
o
a
d
d
s
o
o
o
m
e
e
m
o
e

8/9/2019 SSRN-id878887Overview of the Indian Corporate Sector
http://slidepdf.com/reader/full/ssrn-id878887overview-of-the-indian-corporate-sector 12/41
-11 -
to lack of experience and aversion to risk in the new lending environment. For smaller
independent com panies, problems related to m oral hazard and adverse selection may act to
further limit their ability to obtain long-term financing.
In addition, the share of foreign currency debt in total debt of the corporate sector also rose
considerably in the 1990s, from 8 percent in 1990 to more than 16 percent in 2002. However,
this debt remains concentrated in a relatively small number of firms, namely in large
government-owned and group com panies. A closer look reveals that while the aggregate
share of foreign currency debt has been rising since the early 1990s, the median company in
India still relies entirely on domestic and rupee-denominated borrowings. In 2002, only
17 percent of the companies had any foreign currency denominated borrowings and less than
5 percent of the companies had any foreign debt. Between 1989 and 2002, 28 percent and
8 percent of all firms reported having foreign currency denominated debt and borrowing
abroad, respectively, at some point during the period. This largely reflects limits imposed by
the Reserve Bank of India (RBI) on external commercial borrowing, although ceilings on
firms have been relaxed in recent years.
8
Given the relatively low recourse to foreign borrowing and the comfortable foreign reserves
position of India, the external vulnerability of India remains low. The exposure of India's
corporate sector to foreign exchange risk also is very limited in the current environment.
There is a highly significant positive correlation between foreign exchange earnings and
foreign exchange borrowings after controlling for industry and time fixed effects, company
size,
and ownership structure, suggesting that corporations with foreign exposure are mostly
naturally hedged. Nevertheless, foreign exchange exposure of the corporate sector requires
careful monitoring in the future. Firms with the exposure to foreign currency denominated
debt accounted for 66 percent of
sales,
75 percent of net worth, and
71
percent of total assets
in 2002, while those with foreign borrowings accounted for 43 percent of
sales,
47 percent of
net worth, and 45 percent of total assets.
Liquidity
By several measures, Indian companies became relatively less liquid during the 1990s. The
current ratio (the ratio of current assets to current liabilities), which measures the firm's
ability to meet short-term obligations through the quick sale of liquid assets, has weakened
slightly. The aggregate current ratio dropped from 1.64 in 1990 to 1.49 in 2001 (1.57 to
8
C urrently, most firms can borrow abroad up to US$50 million through the automatic route.
Corporate borrowers may raise long-term financing with maturities of
8
and 16 years up to
the equivalent of US$200 million and US$400 million, respectively. R ecently, new
restrictions have been placed on the use of these funds in addition to limits on investments in
the stock market and real estate. Effective November
2003,
borrowing in excess of
US$50 million is also restricted to financing equipment imports and meeting foreign
exchange needs of infrastructure projects.

8/9/2019 SSRN-id878887Overview of the Indian Corporate Sector
http://slidepdf.com/reader/full/ssrn-id878887overview-of-the-indian-corporate-sector 13/41
- 1 2 -
1.32 for the median company) (Figure 4), although it is still at a relatively healthy level when
compared to other countries (see Hviding and Papi, 2002 for a recent comparison). The
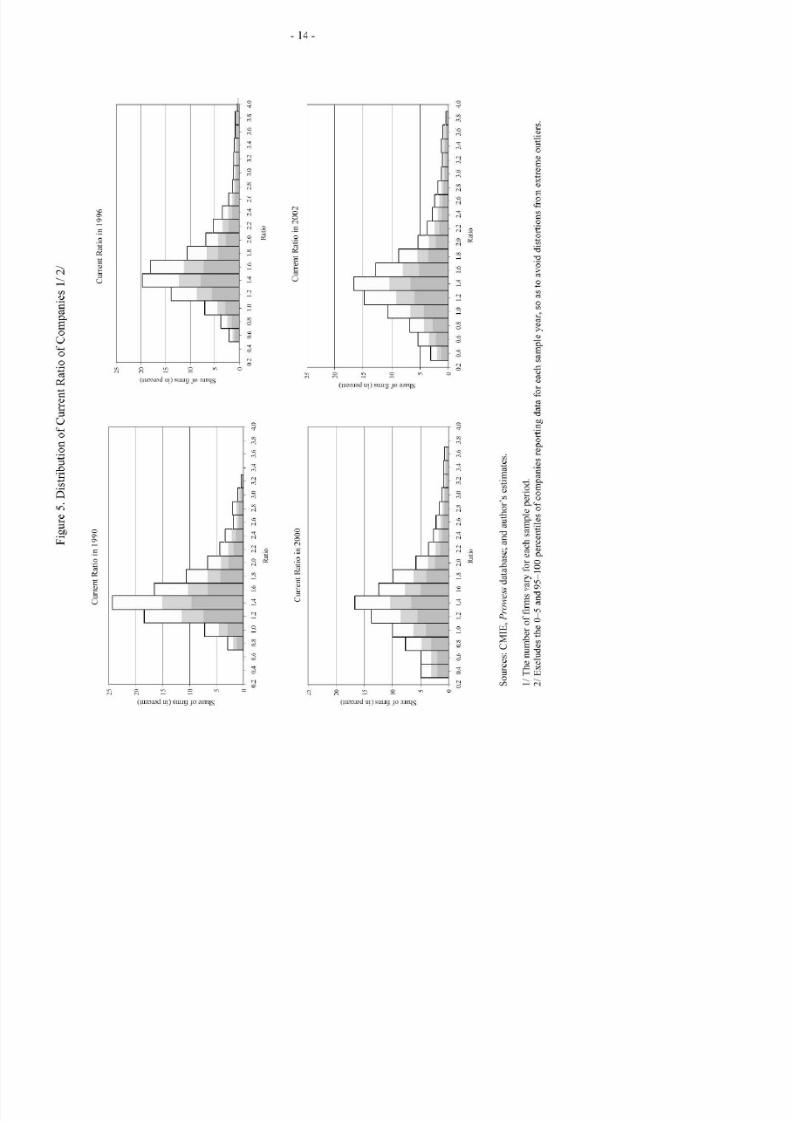
distribution of the current ratio also widened substantially over time, as shown in Figure 5.
Moreover, the share of companies with current ratio below 1—companies whose current
assets would not be able to meet their current liabilities in the event of a credit cut off—rose
from 11 percent of the companies in the sample in 1989 to 27 percent of the companies
in 2002 (including 58 percent of government-owned enterprises), representing 40 percent of
total assets in 2002 (Table 6).
Despite the deleveraging of firms, the interest coverage ratio (ICR) (defined as earnings
before interest, taxes, depreciation, and amortization (EBITDA) over interest expenses) has
declined in recent years, suggesting that Indian companies might be facing increased strain in
meeting their debt service obligations. The ICR, an indicator of both liquidity and
profitability, dropped from 2.7 in 1997 to 2.0 in 2001, but improved to 2.3 in 2002
(Figure 6).
9
The share of companies that were unable to generate enough cash to meet their
interest payments rose from 15 percent of the com panies in the sample in 1989 to 31 percent
of the companies in 2002, representing 28 percent of total assets, 20 percent of total sales,
and 13 percent of net worth. The incidence of a low ICR—less than one (the level at which a
firm experience difficulty servicing its debt)—was greatest among government-owned
enterprises (55 percent) and small companies (38 percent). Analysis of the inter-industry
distribution of companies unable to cover their interest expenses shows that there is no one
particular industry that accounted for a large share of companies with an ICR of less than 1.
However, among private com panies, the incidence of
a
low ICR in 2002 was greatest am ong
firms in wood products, food and beverages, and textiles, and least in tobacco, refined
petroleum products, and precision instrument manufactures.
In the second half of the 1990s, the median ICR fell below the aggregate ICR, signaling the
growing number of smaller companies facing distress. Within this subsector, the problem
was most acute for government-owned enterprises. After 1999, the ICR of the median
company of these enterprises dropped below 1.0. Smaller companies also have had a more
difficult time generating sufficient cash, although analysis of the firm-level data reveals that
the problem is concentrated in a few of the larger companies (within this subsector).
Furthermore, the distribution of the ICR also widened substantially over time, as shown in
Figure 7. The gap between the best and the worst performers has also increased sharply, with
a large number of com panies (31 percent) recording a negative ICR.
9
Comparing India to the United States, the average ICRs in 1996 were 2.5 and 8.0,
respectively (Kang, 2001 ). In the United States, the coverage ratio of companies rated AAA
by Standard and Poors was 20.3 and B rated was 2.3 in 1996 (Haksar and Kongsamut, 2 002).

8/9/2019 SSRN-id878887Overview of the Indian Corporate Sector
http://slidepdf.com/reader/full/ssrn-id878887overview-of-the-indian-corporate-sector 14/41
2.0
1.6
1.4
1.2
1.0
- 1 3 -
Figure 4. Companies' Current Ratio
Aggregate and Median Current Ratio
1989 1990 1991 1992 1993 1994 1995 1996 1997 1998 1999 2000 2001 2002
Median
Aggregate Current Ratio by Ownership C ategory M edian Current Ratio by Ownership Category
2.5
2.0
1.5
1.0
0.5
1989 1991 1993 1995 1997 1999 2001 1989 1991 1993 1995 1997 1999 2001
- S tand A lo ne —I G ro up —A— G ov ern men t — •— F ore ig n - St an d A lo ne —I G roup — A— Government — •— Fo reig n
Aggregate Current Ratio by Company Size
Median Current Ratio by Company Size
2.0
1.8
1.6
1.4
1.2
1.0
1989 1991 1993 1995 1997 1999 2001 1989 1991 1 993 1995 1997 1999 2001
- Large Mediu m —A— Small
- Large Mediu m —A— Small
Sources: CMIE, Prowess database; and author's estimates.
8/9/2019 SSRN-id878887Overview of the Indian Corporate Sector
http://slidepdf.com/reader/full/ssrn-id878887overview-of-the-indian-corporate-sector 15/41
F
g
e
5
D
s
b
o
o
C
e
R
o
o
C
m
e
1
2
C
e
R
o
n
9
2 2
0
2
0
4
0
6
0
8
1
0
1
2
1
4
1
6
1
8
2
0
2
2
2
4
2
6
2
8
3
0
3
2
3
4
3
6
3
8
4
0
R
o
C
e
R
o
n
1
2
2
1
1
—
1
—
I
—
1
—
1
—
•
—
-
0
2
0
4
0
6
0
8
1
0
1
2
1
4
1
6
1
8
2
0
2
2
2
4
2
6
2
8
3
0
3
2
3
4
3
6
3
8
4
0
R
o
C
e
R
o
n
2
2 2
0
2
0
4
0
6
0
8
1
0
1
2
1
4
1
6
1
8
2
0
2
2
2
4
2
6
2
8
3
0
3
2
3
4
3
6
3
8
4
0
R
o
C
e
R
o
n
2
2 2
?
1
0
2
0
4
0
6
0
8
1
0
1
2
1
4
1
6
1
8
2
0
2
2
2
4
2
6
2
8
3
0
3
2
3
4
3
6
3
8
4
0
R
o
S
c
C
M
I
E
P
o
w
e
d
a
a
a
h
s
e
m
e
1
T
n
m
o
m
v
y
o
e
s
m
e
p
o
2
E
u
h
0
5
a
9
1
p
c
e
o
c
m
e
e
n
d
a
o
e
s
m
e
y
s
o
a
o
a
d
d
s
o
o
om
e
e
m
o
e

8/9/2019 SSRN-id878887Overview of the Indian Corporate Sector
http://slidepdf.com/reader/full/ssrn-id878887overview-of-the-indian-corporate-sector 16/41
-
15-
Figure 6. Companies' Interest Coverage
3 0
2 5
2 0
1.5
1.0
Aggregate and Median Interest Coverage
1989 1990 1991 1992 1993 1994 1995 1996 1997 1998 1999 2000 2001 2002
•Me a n
- Median
Aggregate Interest Coverage by Ow nership Category
1989
1991 1993 1995 1997 1999 2001
- S t a n d A l o n e I — G r o u p
—k .
— G o v e r n m e nt — • — F o r e i g n
Aggregate Interest Coverage by Company Size
1989 1991 1993 1995 1997 1999 2001
- Large Me diu m —A— Smal l
Median Interest Coverage
by
Ownership Category
z
1991
1993 1 995 1997 1999 2001
- S t a n d A l o n e
—I
G r oup
—k .
— G o v e r n m en t — - — F o r e i g n
Median Interest Coverage by Company Size
3.5
3.0
2.5
2.0
1.5
1.0
0.5
0.0
1989
1991 1993 1995 1997 1999 2001
- Large Me diu m —A— Smal l
Sources: CMIE, Prowess database; and author's estimates.

8/9/2019 SSRN-id878887Overview of the Indian Corporate Sector
http://slidepdf.com/reader/full/ssrn-id878887overview-of-the-indian-corporate-sector 17/41
F
g
e
7
D
s
b
o
o
I
n
e
e
C
a
R
o
o
C
m
e
1
I
n
e
e
C
a
R
o
n
1
I
n
e
e
C
a
R
o
n
1
5
4
c
3
0
0
2
4
6
8
1
1
1
1
1
2
0
2
2
2
4
2
6
2
8
3
0
3
2
R
I
n
e
e
C
a
R
o
n
2
1
1
1
1
1
2
0
2
2
2
4
2
6
2
8
3
0
3
2
5
<
—
4
0
3 2
-
2
0
4
6
8
1
1
1
1
1
2
0
2
2
2
4
2
6
2
8
3
0
3
2
R
I
n
e
e
C
a
R
o
n
2
3
3
S
c
C
M
I
E
P
o
w
e
d
a
a
a
h
s
e
m
e
1
T
n
m
o
m
v
y
o
e
s
m
e
p
o
2
E
u
h
0
5
a
9
1
p
c
e
o
c
m
e
e
n
d
a
o
e
s
m
e
y
s
o
a
o
a
d
d
s
o
o
o
m
e
e
m
o
e

8/9/2019 SSRN-id878887Overview of the Indian Corporate Sector
http://slidepdf.com/reader/full/ssrn-id878887overview-of-the-indian-corporate-sector 18/41
17
Interest Coverage and Potential NPL s
In addition to being an indicator of liquidity and profitability of the corporate sector, the
measure of interest coverage can provide a useful link between firms' financial performance
and the financial system's asset quality by gauging the capacity of companies to generate
sufficient cash flow to meet debt service obligations. In India, private and public sector
companies account for roughly tw o-thirds of total bank credit. Thus, a sudden inability of the
corporate sector to service its debt could have repercussions on the financial system.
Here, the link between corporate sector finances and financial asset quality can be established
by assuming that companies with less than 100 percent interest coverage could default on
some or all of their debt service obligations. An upper limit to the size of these implied
nonperform ing loan s is the entire liabilities side of such comp anie s' balance sheets. Thus,
by aggregating the borrowings of firms with ICRs of less than one and comparing this
number to the total borrowings of the firms in the sample, an estimate can be made of the
extent of impaired liabilities of the corporate sector. However, caution should be exercised in
interpreting this measure. First, ICRs do not necessarily account for all the resources that a
company may have at its disposal to meet its debt service payments. Second, with
profitability fluctuating over the business cycle and due to idiosyncratic shocks at the
company level, the persistence rather than incidence of
a
low ICR may be a more useful
indicator of stress to monitor. Third, other liquidity indicators (e.g., current ratios) may be
needed to get a more complete picture of problems facing companies. Lastly, the measure of
potential NPLs derived from ICRs is not intended to be a substitute for other measures of
NPLs,
including those from banking data. Rather, it can serve as one additional indicator of
the prospective health of the financial system.
10
In the case of India, the following observations can be made:
• The aggregate level of poten tial NPL s (as a share of total borrow ings by the
nonfinancial corporate sector) doubled between 1989 and 1999 to 38 percent.
• Consistent with a rise in potential NPL s in the 1990s, the persistence in low ICRs also
increased. Focusing on the 2,924 companies in the sample for which an ICR can be
computed for each year during the period 1995-20 00 reveals that 8 percent of the
firms in 1995-97 (accounting for 7 percent of total reported borrowing at end-1997)
had an ICR of less than one for each of the three years, compared to 22 percent of the
firms in 1 998-2000 (accounting for 11% percent of total reported borrowing at end-
2000).
10
First, NPLs of the financial sector include im paired loans to sectors o ther than the
corporate sector and, second, since companies raised debt from sources other than banks, not
all impaired liabilities of the corporate sector are owed to banks.
8/9/2019 SSRN-id878887Overview of the Indian Corporate Sector
http://slidepdf.com/reader/full/ssrn-id878887overview-of-the-indian-corporate-sector 19/41
- 1 8 -
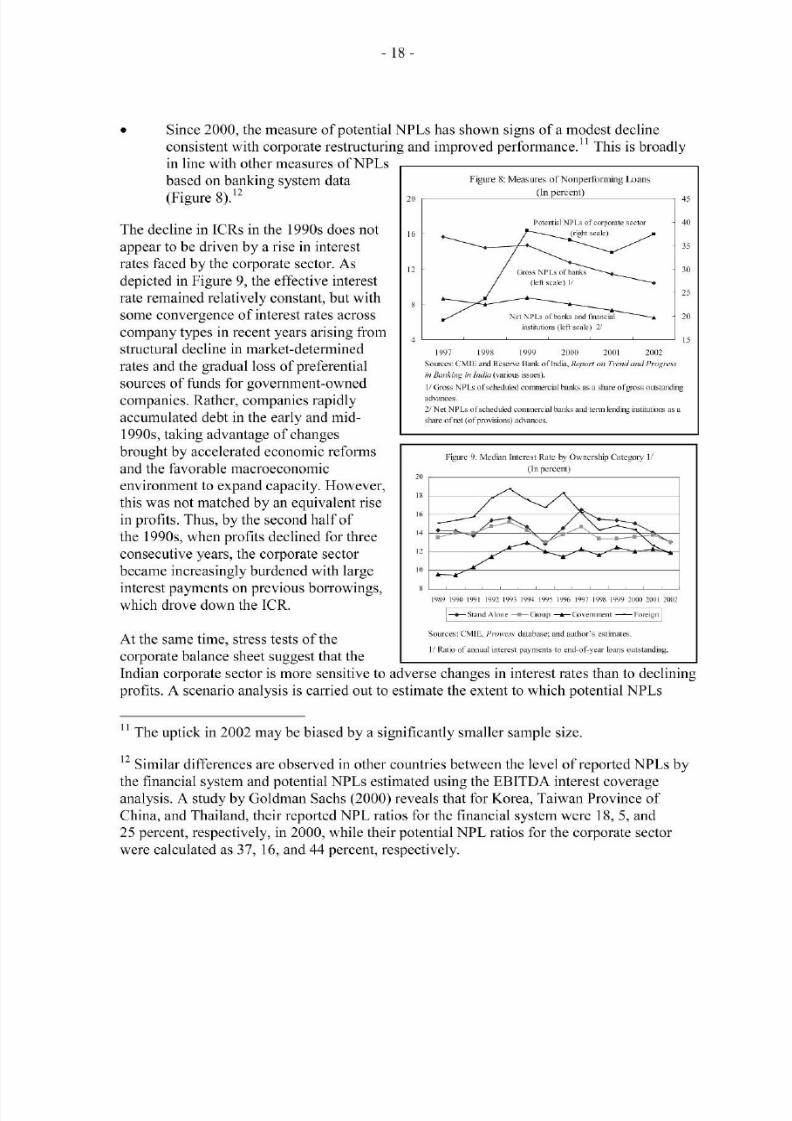
Since 2000, the measure of potential NPLs has shown signs of a modest decline
consistent with corporate restructuring and improved performance.
in line with other measures of NPLs
based on banking system data
(Figure 8).
12
This is broadly
The decline in ICRs in the 1990s does not
appear to be driven by a rise in interest
rates faced by the corporate sector. As
depicted in Figure 9, the effective interest
rate remained relatively constant, but with
some convergence of interest rates across
company types in recent years arising from
structural decline in market-determined
rates and the gradual loss of preferential
sources of funds for government-owned
companies. Rather, companies rapidly
accumulated debt in the early and m id-
1990s, taking advantage of changes
brought by accelerated economic reforms
and the favorable macroeconomic
environment to expand capacity. However,
this was not matched by an equivalent rise
in profits. Thus, by the second half of
the 1990s, when profits declined for three
consecutive years, the corporate sector
became increasingly burdened w ith large
interest payments on previous borrowings,
which drove down the ICR.
At the same time, stress tests of the
corporate balance sheet suggest that the
Indian corporate sector is more sensitive to
profits. A scenario analysis is carried out to
20
16
12
Figure 8: Measures of Nonperforming Loans
(In percent)
Potential NPLs of corporate sector
(right scale)
Net NPLs of banks and financial
institutions (left scale) 2/
1997 1998 1999 2000 2001 2002
Sources : CMIE and Reserve Bank of India , Report on Trend and Progress
in Banking in India
(various issues).
1/ Gross NPLs of scheduled commercial banks as a share of gross outstanding
advances .
2/ Net NPLs of scheduled commercial banks and term lending institutions as a
share of net (of provisions) advances.
Figure 9. Median Interest Rate by Ownership Category 1/
(In percent)
1989 1990 1991 1992 1993 1994 1995 1996 1997 1998 1999 2000 2001 2002
-Stand Alone —•—Group
A
Government Foreign
Sour c e s : C MI E ,
Prowess
database; and author ' s es t imates .
1/ Rat io of annual interes t payments to end-of -year loans outs tanding.
adverse changes in interest rates than to declining
estimate the extent to which potential NPL s
n
12
The uptick in 2002 may be biased by a significantly smaller sample size.
Similar differences are observed in other countries between the level of reported NPLs by
the financial system and potential NPLs estimated using the EBITDA interest coverage
analysis. A study by Goldman Sachs (2000) reveals that for Korea, Taiwan Province of
China, and Thailand, their reported NPL ratios for the financial system were 18, 5, and
25 percent, respectively, in 2000, while their potential NPL ratios for the corporate sector
were calculated as 37, 16, and 44 percent, respectively.

8/9/2019 SSRN-id878887Overview of the Indian Corporate Sector
http://slidepdf.com/reader/full/ssrn-id878887overview-of-the-indian-corporate-sector 20/41
- 1 9 -
wou ld rise due to an interest rate shock see Table 7). A 200 basis points increase in the
interest rate would have resulted in approximately 4 percentage points increase in the share
of potential NPLs if we average out the effect of the interest rate shock over the period 20 00 -
2002. However, a 3 percent decline in profits would have almost no effect on the potential
share of NPLs.
Profitabil ity
13
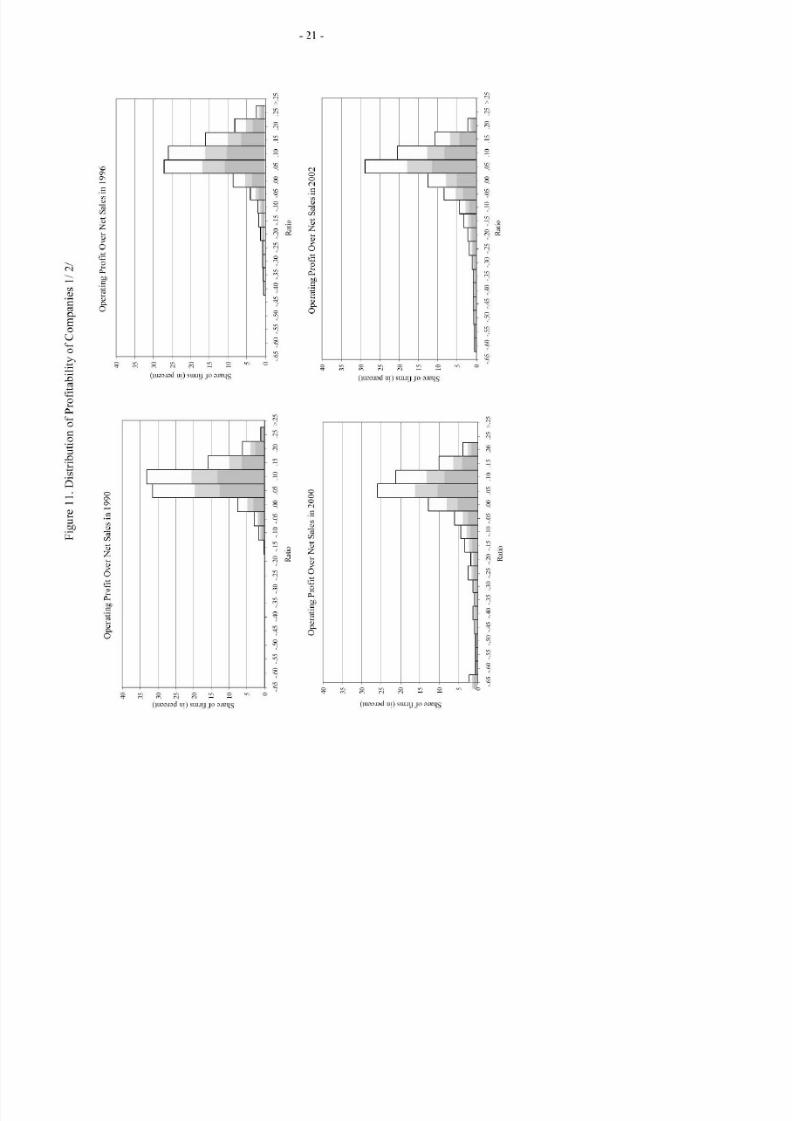
Consistent with the ICR, Indian companies experienced major changes in profitability in the
period 1989-2002. During 1991-1996, aggregate profitability improved rapidly, spurred by
strong economic growth. This holds for various measures of profitability, including operating
profits over net sales and profits before interest, depreciation and taxes over sales
Figure 10). In the second half of the 1990s, profitability declined to below pre-reform levels,
although there were som e signs of recovery in 2002. Governm ent-owned enterprises and
smaller companies were the hardest hit. These companies had already tended to generate
lower profits. Therefore, the profitability gap between weaker and stronger firms only
widened during the decade Figure 11). The aggregate return on assets as measured by profit
before interest, tax and depreciation over gross fixed assets) generally has followed the trend
in profitability. However, the median firm experienced a steady decline in returns over the
sample period, given a relatively rapid accumulation of assets and a falling marginal product
of capital in the Indian corporate sector in the first half of the 1990s.
Corporate Financial Nexus
Assessment of the corporate-financial nexus in the Indian economy should include, in
addition to liquidity and debt ratios, an examination of the links between the corporate and
financial sectors. There are a variety of ways this plays out, including through bank loans and
guarantees, equity holdings, and comm on directorships Beaumont et al., 2003). As already
discussed in Section II, Table 3 reveals that the involvement of the financial sector through
equity ownership varies substantially across type of company. Large companies and
companies belonging to business houses have higher equity participation by FIs and foreign
investors and greater concentration of equity ownership than small and stand-alone
companies. However, according to Sarkar and Sarkar 199 9), FIs in India as a whole hold
much smaller blocks of equity than FIs in other countries. Nonetheless, they do point out that
as the majority of Is in India are government controlled and fall under the jurisdiction of the
Ministry of Finance e.g., public sector banks held about 75 percent of total comm ercial bank
assets at end-2002). Thus, public FIs are much more likely to act as a single block holder in
India than FIs in other countries.
13
Profits before dep reciation, interest paym ents, and taxes PBD IT) was the preferred
measure of profits due to a lack of solid understanding of the accounting standards for
recording depreciation in the income statements.

8/9/2019 SSRN-id878887Overview of the Indian Corporate Sector
http://slidepdf.com/reader/full/ssrn-id878887overview-of-the-indian-corporate-sector 21/41
2
Figure 10. Companies' Profitability
Aggregate and Median Operating Profit to Net Sales
(In percent)
Median Operating Profit to Net Sales by Ownership Category
(In percent)
1989 1990 1991 1992 1993 1994 1995 1996 1997 1998 1999 2000 2001 2002
- A gg r e ga t e —i Me d i a n
Aggregate and Median PBDIT to Sales
(In percent)
1989 1990 1991 1992 1993 1994 1995 1996 1997 1998 1999 2000 2001 20 02
- S t a nd A l one —I I —G roup —*—G ove r nm e n t — — For e i gn
Median PBDIT to Sales by Ownership Category
(In percent)
1989 1990 1991 1992 1993 1994 1995 1996 1997 1998 1999 2000 2001 2002
- A gg r e ga t e —• Me d i a n
A
P
10 -
o
6 -
2
-
.
1989 1990 1991 1992 1993
• Stand Alone
_ •
1994 1995
Group -
\
1996 1997 1998 1999
-A—Government
—
2 0 0 0 2 0 0 1 2 0 0 2
-
F o r e i g n
40
30
20
Aggregate and Median PBDIT to Gross Fixed Assets
(In percent)
1989 1990 1991 1992 1993 1994 1995 1996 1997 1998 1999 2000 2001 2002
- A gg r e ga t e —• Me d i a n
40
30
20
10
Median PB DIT to Gross Fixed Assets by Ownership Category
(In percent)
1989 1990 1991 1992 1993 1994 1995 1996 1997 1998 1999 2000 2001 2002
- S t a nd A l one —ll —G r oup —A —G ove rnm e n t —— For e i gn
Sources: CMIE,
Prowess
database; and author's estimates.
8/9/2019 SSRN-id878887Overview of the Indian Corporate Sector
http://slidepdf.com/reader/full/ssrn-id878887overview-of-the-indian-corporate-sector 22/41
F
g
e
1
D
s
b
o
o
P
o
a
y
o
C
m
e
1
2
O
a
n
P
o
O
N
S
e
n
1
O
a
n
P
o
O
N
S
e
n
1
4
3
o Q
2
2
^
1
5
0
-
6
6
5
5
4
4
3
3
2
2
1
1
0
0
.
0
.
1
.
1
.
2
.
2
>
R
o
O
a
n
P
o
O
N
S
e
n
2
4
3
§
3
o
Q
2
2
°
1
^
1
5
0
~
,
—
—
-
6
6
5
5
4
4
3
3
2
2
1
1
0
0
.
0
1
.
1
2
.
2
>
.
2
R
o
O
a
n
P
o
O
N
S
e
n
2
-
6
6
5
5
4
4
3
3
2
2
1
1
0
0
0
.
1
1
.
2
2
>
R
o
-
6
6
5
5
4
4
3
3
2
2
1
1
0
0
.
0
1
.
1
.
2
2
>
R
o

8/9/2019 SSRN-id878887Overview of the Indian Corporate Sector
http://slidepdf.com/reader/full/ssrn-id878887overview-of-the-indian-corporate-sector 23/41
F
g
e
1
D
s
b
o
o
P
o
a
y
o
C
m
e
(
C
n
P
B
T
O
S
e
n
1
P
B
T
O
S
e
n
1
4
3 3
2 2
1 1
5 0
-
3
-
2
-
2
-
1
-
1
-
0
.
0
.
0
.
1
.
1
.
2
.
2
.
3
.
3
>
R
o
P
B
T
O
S
e
n
2
4
3
t
T
3
o ^
2
a
2
£
1
\
S
1
0
—
1
1
1
1
4
3
3
o
I
2
1
G
1
5
0
-
3
-
2
-
2
-
1
-
1
-
0
.
0
.
0
.
1
.
1
.
2
.
2
.
3
.
3
>
R
o
t
o
t
o
P
B
T
O
S
e
n
2
4
3
?
3
o I
2
g
2
^
1
G
1
5 0
-
3
-
2
-
2
-
1
-
1
-
0
.
0
.
0
.
1
.
1
.
2
.
2
.
3
.
3
>
3
R
o
-
3
-
2
-
2
-
1
-
1
-
0
.
0
.
0
.
1
.
1
.
2
.
2
.
3
.
3
>
R
o

8/9/2019 SSRN-id878887Overview of the Indian Corporate Sector
http://slidepdf.com/reader/full/ssrn-id878887overview-of-the-indian-corporate-sector 24/41
F
g
e
1
D
s
b
o
o
P
o
a
y
o
C
m
e
(
C
u
P
B
T
O
G
o
F
x
A
s
n
1
P
B
T
O
G
o
F
x
A
s
n
1
-
1
1
0
0
0
1
1
2
2
3
3
4
4
5
5
6
6
7
7
8
8
R
o
P
B
T
O
G
o
F
x
A
s
n
2
2
1 1
0
-
1
1
0
0
0
1
1
2
2
3
3
4
4
5
5
6
6
7
7
8
8
R
o
P
B
T
O
G
o
F
x
A
s
n
2
2
1
-
1
1
0
0
0
1
1
2
2
3
3
4
4
5
5
6
6
7
7
8
R
o
-
1
1
0
0
0
1
1
2
2
3
3
4
4
5
5
6
6
7
7
8
R
o
S
c
C
M
I
E
P
o
w
e
d
a
a
a
h
s
e
m
e
1
T
n
m
o
m
v
y
o
e
s
m
e
p
o
2
E
u
h
0
5
a
9
1
p
c
e
o
c
m
e
e
n
d
a
o
e
s
m
e
y
s
o
a
o
a
d
d
s
o
o
o
m
e
e
m
o
e
t
o

8/9/2019 SSRN-id878887Overview of the Indian Corporate Sector
http://slidepdf.com/reader/full/ssrn-id878887overview-of-the-indian-corporate-sector 25/41
2 4
The transmission of shocks between the corporate and financial sectors depends on the
mutual financial exposure of the two sectors. As pointed by Beaumont et al. (2003), the
excessive dependence of
the
corporate sector on a particular source of financing (such as
bank loans) can raise the risk of a financial crisis stemming from corporate sector
weaknesses. Table 7 gives a breakdown of the major types of financial liabilities of the
Indian corporate sector.
14
While the share of bank borrowings is not particularly high, there
has been an upward trend in the 1990s, with the combined share of loans from commercial
banks and other FIs reaching 57 percent in 2002. The share of short-term bank borrowing
also increased from 51 percent in 1989 to 70 percent in 2002, consistent with the decline in
the share of long-term debt previously discussed. The increased use of commercial paper and
debentures is a positive development and reflects the introduction and growing popularity of
new financing options in the Indian capital market. Overall, there is no overwhelming
evidence that the corporate sector is entirely dependent on one particular source of debt
finance.
IV. CORPORATE
G O V E R N A N C E
IN INDIA
Currently, four main laws regulate corporate governance of Indian enterprises: the
Companies Act of 1956 (and amendments) aims to ensure adequate protection of the interests
of creditors and shareholders and regulates the issue, transfer, and allotment of securities; the
Securities Contracts (Regulation) Act of 1956 covers all aspects of securities trading and
regulates the operations of the stock market; the Securities and Exchange Board of India
(SEBI) Act of 1992 protects the interests of shareholders and promotes and regulates the
securities markets; and the Sick Industrial Companies (Special Provision) Act (SICA) deals
with financial reorganization (including bankruptcy procedures) of distressed companies.
The World Ba nk's R eport on Observance of Standards and Codes (ROSC) in 2000 found
India's corporate governance practices to generally fall short of OECD standards. Further
amendments of the Com panies Act were made in late 2000 to fill some of the gap by
imposing more stringent corporate disclosures norms (such as quarterly filings of
shareholding data, segmented reporting of business activities, disclosure and treatment of
related party transactions in directors' reports, mandatory appointment of an officer for
monitoring share transfers, and the establishment of audit committees on the board). Under
the currently existing laws:
• All shares carry propo rtional voting rights and are equal within one class.
15
Voting
through proxy is also allowed. All shares and all share transfers must be registered.
14
15
For a detailed study of
the
pattern of financing of Indian companies, see Shirai (2002).
There are two types of shares in India: (i) ordinary shares, which have a variable dividend
but give voting rights; and (ii) preference shares, which g ive the holder the right to a fixed
dividend but no right to vote. However, the latter are not widely used in India.

8/9/2019 SSRN-id878887Overview of the Indian Corporate Sector
http://slidepdf.com/reader/full/ssrn-id878887overview-of-the-indian-corporate-sector 26/41

8/9/2019 SSRN-id878887Overview of the Indian Corporate Sector
http://slidepdf.com/reader/full/ssrn-id878887overview-of-the-indian-corporate-sector 27/41
- 2 6 -
equity holdings by shareholder categories,
18
but disentangling share control is burdensome
owing to the mesh of cross-holdings across companies controlled by a business group. This
also makes it harder to track insider trading.
A number of actions aimed at strengthening corporate governance are under consideration, in
part in response to the Report on the Comm ittee on Corporate Aud it and Governance issued
in late 2002, which in light of corporate scandals abroad looked closely at audit standards,
management controls, and board effectiveness. Further amendments to the C ompanies Act
are expected to be made w hich tighten com panies' financial reporting requirements with the
Registrar of Companies, restrict auditors' activities for generating income from client
companies, and establish stricter protocol for forwarding auditors' reports (and
qualifications) to the SEBI. The Companies Act is also being amended so as to stipulate that
at least half of all directors of large companies must be independent and receive training
before appointment.
The SICA, which governs bankruptcy procedures, contains a number of flaws, which often
act to stymie financial restructuring. The definition of financial distress as the erosion of net
worth is a generally strict standard of corporate bankruptcy, which affects companies' ability
to undertake meaningful restructuring. Bankruptcy procedures are time consum ing and
cumbersome, owing to indefinite stays on all claims of creditors and frequent violations of
the absolute priority rule, and existing management is often allowed to run and control a
bankrupt com pany du ring financial reorganization. Liquidation under the Com panies Act is
even more complicated, and long court delays are commonplace. As a result, these laws
afford little effective protection for creditors.
The Corporate Insolvency Law, passed in early
2003,
sets the ground for the repealing of the
SICA and replacing the Board of Industrial and Financial Reconstruction (BIFR) with the
National Companies Law Tribunal (NCLT), in an effort to end the open-ended protection
debtors have enjoyed from creditors under the BIFR mechanism once a company is
recognized as sick or insolvent. The new law tightens the qualifications for being declared a
sick company
19
and imposes a 24 -mo nth time limit (subject to extension by the NCL T) on
resolution actions. In keeping with this legislation, the SICA was repealed by the lower house
of Parliament in late
2003.
Companies are required to disclose information on the equity shareholdings of individual
promoters, financial institutions, foreign institutional investors, foreign holdings, other
corporate bodies, top 50 shareholders, and other shareholders.
19
A sick industrial company is defined as an industrial firm that either (i) has annual
accumulated losses greater than or equal to 50 percent of average net worth during four years
immediately preceding the financial year; or (ii) has failed to repay its debts within any three
consecutive quarters on demand made in writing for repayment by a creditor or creditors.

8/9/2019 SSRN-id878887Overview of the Indian Corporate Sector
http://slidepdf.com/reader/full/ssrn-id878887overview-of-the-indian-corporate-sector 28/41
2 7
V . C O N C LU S IO N
The performance of the India's corporate sector weakened after 1997, and many of the
promising developments during the period of rapid economic growth following the econom ic
reforms of 1991 were partially reversed. Aggregate leverage increased and the maturity
structure of debt shifted slightly toward short-term borrowing. Compan ies also suffered from
declining profitability. An analysis of ICRs reveals that more than 30 percent of the
companies were unable to generate enough cash to cover their interest payments in 2002,
which is a potential risk to lenders. Disagg regated data pointed to significant differences
across companies. The distribution of financial ratios widened after the economic reforms as
companies faced greater domestic and foreign competition and the need to raise funds on the
liberalized capital markets.
Despite this weakening of the corporate sector in recent years, most indicators are still at
comfortable levels and there were signs of improvement in almost all indicators in 2002, the
last year in our sample, and in
2003,
with the soft interest rate regime and ongoing economic
recovery. Stress tests suggest that the financial health of the corporate sector would be
moderately affected by adverse interest rate shocks. Given the comparatively low level of
foreign debt as a source of funds for the corporate sector and India's strong foreign exchange
reserve position, the exposure of the Indian corporate sector to foreign exchange risk is
generally low at this point of
time.
Changes in the legal and regulatory framework in the
post-1991 period have been key to promoting greater competition, reducing the regulatory
burden, and, of late, strengthening corporate governance, which will continue to be of key
importance to India's growth prospects.

8/9/2019 SSRN-id878887Overview of the Indian Corporate Sector
http://slidepdf.com/reader/full/ssrn-id878887overview-of-the-indian-corporate-sector 29/41
2 8
Table 1. India: Growth in the Corporate Sector, 1989-2002 1/
Year Num ber of Estimated Paid-Up Capital
Com panies (In Rs. billions) (In percent of GDP )
1 Government companies
1 9 8 2
1 9 8 7
1 9 9 2
1 9 9 7
2002 2 /
894
1 053
1 180
1 2 2 0
1 261
133.1
328.7
579.1
843.2
1 099.2
7.9
10.6
8.9
6.2
4.8
2 Nongovernment companies
1 9 8 2
1 9 8 7
1 9 9 2
1 9 9 7
2002
2 /
3 . A l l companies
1 9 8 2
1 9 8 7
1 9 9 2
1 9 9 7
2002
2 /
71 508
139 617
249 181
449 730
587 985
72 402
140 670
250 361
450 950
589 246
56.3
1 1 1 . 0
267.3
1 062.0
2 771.1
1 8 9 . 4
439.7
846.4
1 905.2
3 870.2
3.3
3.6
4.1
7.8
12.1
11.2
14.1
13.0
13.9
16.9
Sources: Government of India, Ministry of Finance, Department of Comp any
Affairs, Forty-Sixth Annual Report on the Working and Administration of
the Companies Act, 1956; and author's estimates.
1 / As of end-March.
2 / Provisional.
8/9/2019 SSRN-id878887Overview of the Indian Corporate Sector
http://slidepdf.com/reader/full/ssrn-id878887overview-of-the-indian-corporate-sector 30/41
T
e
2
I
n
a
S
e
e
I
n
c
o
o
R
s
e
e
C
m
e
1
P
c
m
e
c
m
e
(
n
p
c
o
o
a
P
v
e
m
e
c
m
e
(
n
p
c
o
o
a
G
n
m
C
m
e
N
m
o
f
m
6
0
1
6
0
1
E
m
e
p
d
u
c
a
(
n
R
b
o
4
8
1
7
3
8
1
6
N
n
m
C
m
e
N
m
o
f
m
7
6
1
9
5
3
8
8
E
m
e
p
d
u
c
a
(
n
R
b
o
1
8
0
5
2
6
4
1
5
A
C
m
e
N
m
o
f
m
7
2
1
1
5
9
8
9
E
m
e
p
d
u
c
a
(
n
R
b
o
2
3
8
6
9
1
0
2
3
1
9
I
S
c
G
n
m
o
I
n
a
M
i
n
s
y
o
F
n
D
m
o
C
m
A
a
A
R
2
2
1
A
o
e
M
a
c
2
8/9/2019 SSRN-id878887Overview of the Indian Corporate Sector
http://slidepdf.com/reader/full/ssrn-id878887overview-of-the-indian-corporate-sector 31/41
T
e
3
I
n
a
P
e
n
o
E
y
O
h
p
o
R
s
e
e
C
m
e
n
2
1
M
e
E
y
H
d
n
(
n
p
c
P
o
m
e
4
6
5
3
7
7
6
2
5
9
5
2
4
3
4
3
5
7
4
5
P
v
e
c
p
a
e
b
e
9
8
8
2
4
1
3
7
5
5
8
4
9
9
6
3
8
9
1
0
F
e
g
5
0
7
4
4
2
5
6
1
5
1
3
6
7
7
9
6
3
5
2
B
a
F 2
7
7
0
7
9
4
5
1
2
4
7
2
6
1
5
4
8
2
6
M
u
u
f
u
1
0
2
6
3
0
2
3
4
1
1
8
0
8
4
0
1
9
0
8
Im
e
g
n
m
s
h
e
3
9
9
6
7
0
6
9
2
0
7
2
3
7
1
5
6
7
3
6
P
c
3
7
2
8
1
3
2
6
2
7
2
7
3
9
2
7
2
6
3
5
P
v
e
s
a
a
o
c
m
e
P
v
e
c
m
e
b
o
n
o
a
b
n
g
o
G
n
m
o
w
c
m
e
F
e
g
c
m
e
L
g
c
m
e
M
e
u
m
c
m
e
S
m
c
m
e
L
g
p
v
e
c
m
e
M
e
u
m
p
v
e
c
m
e
S
m
p
v
e
c
m
e
A
c
m
e
4
1
8
7
9
3
4
5
1
7
7
4
3
8
S
c
C
e
f
o
M
o
o
n
h
I
n
a
E
m
(
C
M
I
E
{
P
o
w
e
d
a
a
a
h
s
e
m
e
1
T
m
e
g
n
m
s
h
e
s
h
s
m
a
d
e
g
n
m
h
d
n
h
d
n
o
b
a
f
n
a
n
u
o
a
h
d
n
o
m
u
f
u
a
U

8/9/2019 SSRN-id878887Overview of the Indian Corporate Sector
http://slidepdf.com/reader/full/ssrn-id878887overview-of-the-indian-corporate-sector 32/41
- 3 1 -
Table 4: International Com parison of Key Financial R atios of the Corporate Sector (end-2002)
Ratios
Debt/
equity
1.27
0.50
1.31
0.47
0.16
0.58
1.00
1.90
0.99
0.52
1.12
Long-term/
total debt
0.63
1.00
0.60
0.81
0.79
0.80
0.49
0.48
0.75
0.50
0.77
Foreign/
total debt
0.16
0.05
0.13
0.17
0.23
0.31
0.33
0.26
0.09
0.36
0.05
Interest
coverage 1/
2.00
2.37
1.05
1.41
2.56
1.99
5.38
3.97
4.58
5.64
India 2/
China
Korea
Malaysia
Singapore
Thailand
France
Germany
Japan
United Kingdom
United States
Sources: CMIE {Prowess database); Bank for International Settlements; Begum and
Schumacher, 2001 (based on the Worldscope dataset); Claessens, Djankov, and Lang, 1998;
International Finance Corporation; and author's estimates.
1/ For 1998.
2/ The estimates for India are not directly comparable to the author's estimates in other sections
of the paper because of different data sources used to compute financial ratios.

8/9/2019 SSRN-id878887Overview of the Indian Corporate Sector
http://slidepdf.com/reader/full/ssrn-id878887overview-of-the-indian-corporate-sector 33/41
T
e
5
I
n
a
D
S
u
u
e
o
C
p
a
e
S
o
1
2
1
1
1
1
1
1
1
1
1
1
2
2
2
L
e
m
b
o
w
n
T
a
(
M
e
a
c
m
n
s
m
e
P
v
e
s
a
a
o
c
m
e
P
v
e
c
m
e
b
o
n
o
a
b
n
g
o
G
n
m
o
w
c
m
e
F
e
g
c
m
e
F
e
g
c
e
b
o
w
n
T
a
(
M
e
a
c
m
n
s
m
e
S
e
o
c
m
e
w
h
o
e
g
c
e
b
o
w
n
n
p
c
1
4
1
1
(
n
p
c
o
o
a
d
7
7
7
8
6
3
7
1
1
0
6
7
8
4
0
0
6
4
7
8
5
9
6
5
9
4
6
2
9
4
0
0
6
6
7
1
6
5
6
0
9
7
6
8
1
7
0
0
6
1
7
9
5
7
6
9
8
2
6
3
1
5
0
0
6
3
7
1
5
7
7
0
8
6
6
3
1
2
0
0
6
6
7
1
6
7
6
8
8
5
6
7
1
5
0
0
6
7
7
3
6
3
6
7
8
9
6
9
1
0
0
0
6
8
7
2
6
7
6
1
8
8
6
2
1
3
0
0
6
4
7
4
5
1
6
5
8
8
6
1
1
1
0
0
6
0
7
2
5
0
6
5
8
3
6
4
1
3
0
0
6
4
7
9
5
8
6
6
8
1
6
1
1
9
0
0
6
0
7
5
5
1
6
5
8
2
7
6
1
0
0
0
6
6
7
9
5
4
6
6
8
3
6
9
1
1
0
0
1
9
1
7
1
5
1
8
1
3
1
9
1
9
1
3
1
3
1
9
K
1
3
S
c
C
M
I
E
P
o
w
e
d
a
a
a
h
s
e
m
e

8/9/2019 SSRN-id878887Overview of the Indian Corporate Sector
http://slidepdf.com/reader/full/ssrn-id878887overview-of-the-indian-corporate-sector 34/41
T
e
6
I
n
a
L
q
d
y
A
y
s
o
C
p
a
e
S
o
1
2
(
n
p
c
o
s
m
e
c
m
e
w
h
a
a
o
<
1
0
u
e
o
h
w
s
n
c
e
1
C
o
A
c
m
e
P
v
e
s
a
o
c
m
e
P
v
e
c
m
e
b
o
n
o
a
b
n
g
o
G
n
m
o
w
c
m
e
F
g
c
m
e
L
g
c
m
e
M
e
u
m
c
m
e
S
m
c
m
e
I
n
e
c
o
A
c
m
e
P
v
e
s
a
o
c
m
e
P
v
e
c
m
e
b
o
n
o
a
b
n
g
o
G
n
m
o
w
c
m
e
F
g
c
m
e
L
g
c
m
e
M
e
u
m
c
m
e
S
m
c
m
e
1
1
6
9
2
1
6
1
4
7
1
7
5
1
3
1
4
1
0
1
9
1
0
3
2
1
0
8
2
1
4
2
7
1
1
5
1
4
1
8
2
1
1
1
7
6
1
8
2
5
1
3
1
8
9
1
3
8
7
9
8
0
1
2
2
3
1
1
8
1
7
1
6
2
8
8
9
9
3
1
5
2
8
1
3
1
1
1
0
3
6
7
7
6
0
1
7
2
9
1
1
6
1
2
1
2
2
9
7
8
9
0
1
6
2
6
1
9
1
8
1
8
3
0
1
2
9
4
1
6
1
7
1
1
3
2
3
1
0
3
4
1
0
1
4
1
5
2
9
1
5
1
1
1
2
4
7
1
4
1
1
1
4
2
7
1
1
5
1
7
1
5
3
0
1
5
9
0
1
5
2
3
1
1
1
5
1
3
4
0
1
4
1
3
1
7
1
3
1
1
5
1
0
1
7
3
3
1
4
9
5
1
3
2
3
1
5
1
8
1
3
4
3
1
0
7
4
1
8
1
1
1
1
2
1
0
1
9
4
4
1
5
1
5
1
6
1
8
1
5
1
5
1
5
4
3
1
3
1
1
1
8
2
9
1
1
9
1
9
1
6
4
3
1
8
1
3
1
1
2
7
2
3
2
3
2
0
4
6
2
1
1
0
1
5
3
1
1
2
8
2
8
2
0
5
8
1
0
1
7
1
1
2
2
2
6
3
9
2
9
5
7
1
8
1
7
2
4
4
0
1
2
0
2
2
2
8
5
0
2
8
2
7
2
2
3
8
3
7
3
2
3
9
5
3
2
1
2
0
2
5
4
8
2
2
6
2
3
2
4
5
6
2
2
2
6
2
8
3
0
3
8
3
3
3
9
5
3
2
2
2
4
2
6
3
9
2
2
4
2
7
3
4
5
1
2
2
2
5
2
4
3
6
3
5
3
6
3
2
5
9
2
4
2
9
2
1
3
9
2
2
4
2
4
3
6
5
7
1
4
2
2
2
5
2
2
3
0
2
6
3
7
5
9
1
6
2
5
2
3
3
5
S
o
m
e
n
o
m
n
o
N
i
n
o
a
a
o
c
m
e
n
p
S
o
N
n
o
a
o
b
s
e
c
m
a
b
n
p
1
S
v
y
a
y
S
o
m
e
N
a
e
a
1
p
a
p
n
i
n
n
n
e
e
S
o
m
e
N
a
e
a
3
p
d
o
i
n
P
T
2
1
4
1
2
1
0
1
4
1
5
1
0
1
6
1
9
1
2
2
7
3
2
3
2
3
5
3
4
2
0
2
0
2
0
1
0
1
7
1
4
1
7
1
7
1
4
1
4
2
6
2
7
2
1
2
7
2
3
2
8
1
1
1
4
2
2
2
5
4
1
3
7
4
1
3
4
1
9
1
7
1
5
1
3
2
9
2
3
1
9
1
4
1
5
2
3
3
6
3
5
3
2
3
8
S
C
M
I
E
P
r
w
e
d
a
R
v
B
o
n
a
S
a
c
T
e
R
a
n
o
B
o
n
a
a
T
a
P
o
B
n
n
n
a
o
a
a
h
s
e
m
e
1
F
1
1
p
c
s
o
b
o
y
2
P
T
p
o
b
o
d
a
o
n
e
p
m
a
a
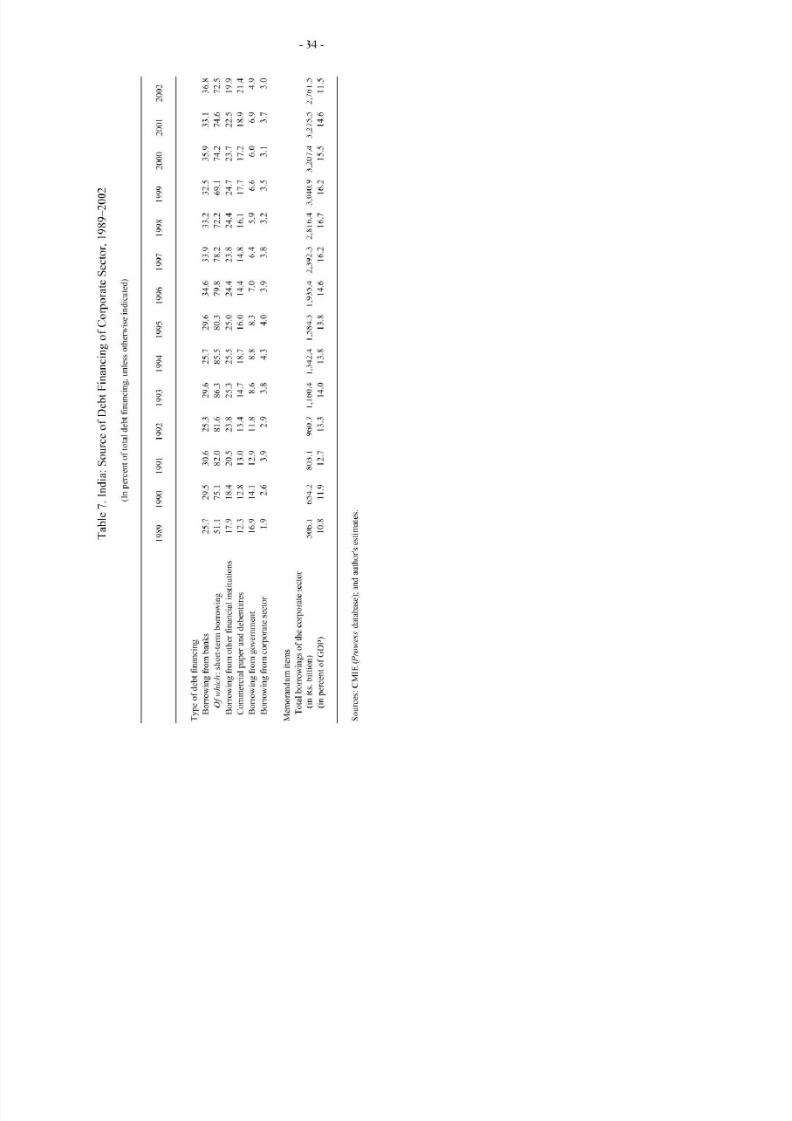
8/9/2019 SSRN-id878887Overview of the Indian Corporate Sector
http://slidepdf.com/reader/full/ssrn-id878887overview-of-the-indian-corporate-sector 35/41
T
e
7
I
n
a
S
c
o
D
F
n
n
o
C
p
a
e
S
o
1
2
(
n
p
c
o
o
a
d
n
n
u
e
o
h
w
s
n
c
e
1
1
1
1
1
1
1
1
1
1
2
2
2
T
o
d
n
n
B
o
w
n
o
m
b
O
f
w
h
c
s
h
e
m
b
o
w
n
B
o
w
n
o
m
o
h
n
a
n
u
o
C
m
c
a
p
a
d
u
e
B
o
w
n
o
m
g
n
m
B
o
w
n
o
m
c
p
a
e
s
o
M
e
m
a
m
e
m
T
a
b
o
w
n
o
h
c
p
a
e
s
o
(
n
R
b
o
(
n
p
c
o
G
2
7
5
1
1
9
1
3
1
9
1
9
2
5
7
1
1
4
1
8
1
1
2
6
3
6
8
0
2
5
1
0
1
9
3
9
2
3
8
6
2
8
1
4
1
8
2
9
2
6
8
3
2
3
1
7
8
6
3
8
2
7
8
5
2
5
1
7
8
8
4
3
2
6
8
3
2
0
1
0
8
3
4
0
3
6
7
8
2
4
1
4
7
0
3
9
3
9
7
2
2
8
1
8
6
4
3
8
3
2
7
2
2
4
1
1
5
9
3
2
3
5
6
1
2
7
1
7
3
5
3
9
7
2
2
7
1
2
6
0
3
1
3
1
7
6
2
5
1
9
6
9
3
7
3
8
7
5
1
9
2
4
4
9
3
0
5
1
6
2
8
1
9
7
1
1
4
1
3
4
1
5
3
1
9
4
2
3
3
2
8
4
3
0
9
3
2
4
3
2
5
2
7
5
1
8
1
9
1
7
1
3
1
0
1
8
1
8
1
6
1
2
1
7
1
2
1
5
1
6
1
5
S
c
C
M
I
E
P
o
w
e
d
a
a
a
h
s
e
m
e

8/9/2019 SSRN-id878887Overview of the Indian Corporate Sector
http://slidepdf.com/reader/full/ssrn-id878887overview-of-the-indian-corporate-sector 36/41
- 35 - APP END IX I
Data Sources
Th e data use d in this analysi s are from a firm-level dat aba se on In di a' s cor por ate sector ,
compiled by the Centre for Monitoring the Indian Economy, a private company in India. The
Prowess database contains information primarily from the income statements and balance
sheets of listed companies, which account for more than 70 percent of the economic activity
in the organized industrial sector of India. Because the dataset begins in 1989, we have
disaggregated data for only two years of the pre-reform period.
2 0
The size of the dataset
varies by year, as demonstrated in Table I.1 in this appendix. In some cases, companies exit
and reenter the database. However, overall exit rates are very low.
2 1
Data have been adjusted
to a calendar basis, unless otherwise indicated. In 2001 and 2002, the number of companies is
considerably lower than in preceding years because of partially reporting by companies'
accounts for that year at the time of compilation of the database.
A total of 4,175 different companies (largely in the manufacturing sector) are included for at
least one year in the Prowess database. Firms are categorized by industry according to the
National Industrial Classification Code and span the range of industries in the Indian
economy. The largest sectors in terms of number of companies are chemicals, basic metals,
food and beverages, and textiles. The database contains information on equity ownership,
with firms classified to four categories: stand-alone private Indian companies, private Indian
compani es associa ted with a business group, governm ent-o wned enterprises , and foreign
companies. The stand-alone companies represent the largest block of companies (more than
half of the total number of companies), but only account for 12 percent of total assets, sales,
and net worth of all companies. More than 40 percent of the companies were incorporated in
the past 18 years, but the older companies still control a large share of total assets and sales.
Additional summary statistics on these companies are provided in Tables I.2 and I.3,
inclu ding a br eak dow n by industry classification, own ersh ip, and year of incorp oration .
20
The Reserve Bank of India and ICICI Bank each tracked a small set of companies for the
period 1980-1990. These data are, however, not available to the public at a disaggregated
level.
21
A company is classified as having exited the sample if it does not appear in any subsequent
years after the first year it does not appear in the dataset. The drop in the number of
companies in the Prowess database in 2001 and especially 2002 is likely due to lags in
receiving and processing the necessary information or firms for these two years.

8/9/2019 SSRN-id878887Overview of the Indian Corporate Sector
http://slidepdf.com/reader/full/ssrn-id878887overview-of-the-indian-corporate-sector 37/41
- 3 6 -
APPENDIX I
Table I.1.. Sample Statistics, 1989-2002
Year
1989
1990
1991
1992
1993
1994
1995
1996
1997
1998
1999
2000
2001 1/
2002 1/
Number of Companies
in Sample
1,073
1,219
1,546
1,757
2,116
2,679
3,184
3,319
3,316
3,322
3,450
3,633
3,167
2,093
Companies That
Exited Sample
(In percent)
0.00
0.00
0.00
0.00
0.00
0.00
0.15
0.41
1.60
2.77
4.49
3.04
Sources: CMIE
{Prowess
database);
and
author's estimates.
1/
Provisional data, based on available sample from C MIE as of mid-2003.

8/9/2019 SSRN-id878887Overview of the Indian Corporate Sector
http://slidepdf.com/reader/full/ssrn-id878887overview-of-the-indian-corporate-sector 38/41
T
e
2
B
e
w
o
C
m
e
b
n
y
(
A
a
d
n
1
2
I
n
y
A
c
u
O
h
m
n
n
a
q
y
n
M
a
u
n
F
p
o
a
b
T
p
o
T
e
W
e
n
a
d
n
a
d
n
o
u
T
n
a
d
n
o
e
h
W
o
P
a
p
p
o
P
n
p
n
n
a
o
o
o
d
m
a
C
n
p
o
e
m
p
o
e
c
C
m
c
R
a
p
a
c
p
o
N
m
a
c
m
n
p
o
B
c
m
a
F
c
e
m
a
p
o
M
a
n
y
a
e
p
m
N
O
c
a
n
a
c
m
n
m
n
y
E
e
c
m
n
y
e
c
R
o
a
e
e
o
e
p
m
M
e
c
p
o
a
o
c
n
u
m
M
o
o
v
c
e
e
e
c
O
h
e
p
m
F
n
u
a
m
u
n
e
w
c
a
e
C
m
e
a
a
e
a
v
e
M
i
a
g
a
s
v
c
D
v
e
M
i
n
n
a
c
a
c
o
T
a
2
C
m
e
N
m
6 3
4
1
4
5
4
1
1
3 3
7
2
1
3
1
2
3
1 1
5
2
4
5
1
5
6
1
4
1
I
n
p
o
o
a
1
6
0
8
1
5
0
3
1
9
1
4
1
1
0
5
2
9
0
8
0
9
1
3
6
4
4
2
8
9
2
8
6
6
0
7
4
0
2
6
1
2
4
8
1
0
1
3
0
4
0
1
1
5
2
6
1
0
A
I
n
R
b
o
1
7
7
7
1
2
3
2
2
4
1
3
1
3
8
1
8
1
1
4
4
3
7
0
1
3
1
5
8
0
5
2
2
2
1
7
1
4
1
1
2
5
2
7
1
3
2
5
1
8
0
2
4
1
4
7
4
4
0
I
n
p o
o
a
0
4
0
2
4
4
0
7
6
0
0
3
0
3
0
2
1
8
0
4
1
9
1
9
2
7
4
1
1
1
1
3
5
4
0
4
2
5
2
6
0
6
5
3
2
8
0
6
0
3
0
0
9
6
1
1
1
0
S
e
I
n
R
b
o
1
2
2
5
2
5
6
4
2
2
9
2
1
2
5
6
5
9
1
7
8
1
6
8
1
6
1
5
4
6
4
1
2
3
2
4
1
8
9
9
1
7
2
4
8
5
2
4
1
2
0
1
3
7
4
5
4
0
2
I
n
p
o
o
a
0
5
0
1
5
6
1
5
5
0
0
2
0
4
0
1
1
4
0
4
2
9
1
0
2
8
3
3
1
4
1
1
5
2
0
6
2
7
2
4
0
4
6
3
2
2
0
7
0
4
0
0
8
4
1
0
1
0
N
W
o
h
I
n
p
I
n
R
b
o
7
3
3
1
5
3
1
6
3
8
4
2
5
0
2
0
2
3
9
0
1
1
2
2
3
1
4
9
2
2
1
7
5
2
7
5
3
9
3
7
5
5
7
4
1
5
1
0
8
8
0
1
1
4
1
6
1
2
2
o
o
a
0
6
0
2
4
6
1
0
2
8
0
3
0
4
0
2
1
8
0
7
1
7
1
5
2
6
3
3
1
4
1
1
4
2
0
6
2
6
2
6
0
4
6
2
1
4
0
9
0
7
0
0
1
1
1
2
1
0
S
C
M
I
E
P
w
e
d
a
a
a
h
s
e
m
e
1
n
c
a
1
p
c
2
R
h
o
a
n
m
o
c
m
e
o
w
c
d
a
a
e
n
h
P
w
e
d
a
d
n
h
p
o
1
2
2
O X

8/9/2019 SSRN-id878887Overview of the Indian Corporate Sector
http://slidepdf.com/reader/full/ssrn-id878887overview-of-the-indian-corporate-sector 39/41
T
e
I
3
B
e
w
o
C
m
e
b
T
o
O
h
p
a
Y
o
I
n
p
a
o
(
A
a
d
n
1
2
T
o
C
m
B
o
w
p
P
v
e
n
a
s
a
o
c
m
e
P
v
e
n
a
c
m
e
a
a
e
w
h
a
b
n
g
o
G
n
m
o
w
c
m
e
F
g
c
m
e
T
a
B
y
o
n
p
o
B
o
1
B
w
1
a
1
B
w
1
a
1
B
w
1
a
1
A
e
1
T
a
C
m
e
N
m
2
3
1
4
1
2
4
1
4
5
1
2
9 9
4
1
I
n
p
c
o
o
a
5
6
3
2
3
4
5
8
1
7
1
9
3
2
2
1
2
7
A
I
n
R
b
o
5
1
2
4
3
1
2
5
3
1
4
4
0
8
3
1
4
2
1
2
1
4
4
4
3
4
4
0
I
n
p
c
o
o
a
S
e
I
n
R
b
o
I
n
p
c
I
n
R
o
o
a
(
A
o
1
2
n
c
a
1
u
1
7
5
9
2
1
7
3
1
7
3
2
2
9
9
2
1
9
5
5
1
8
8
1
2
5
4
5
4
0
2
8
2
1
6
8
9
9
3
7
3
9
4
0
2
1
5
4
6
3
5
1
4
1
9
4
0
2
0
7
5
8
5
N
b
o
1
5
7
1
2
7
1
9
1
2
2
2
0
4
6
3
7
1
6
1
8
1
2
2
h
I
n
p
c
o
o
a
1
8
6
2
1
5
9
6
1
2
3
4
2
3
9
2
1
9
O
S
c
C
M
E
P
r
w
e
d
a
a
a
h
s
e
m
e
W
D
X

8/9/2019 SSRN-id878887Overview of the Indian Corporate Sector
http://slidepdf.com/reader/full/ssrn-id878887overview-of-the-indian-corporate-sector 40/41
- 3 9 -
References
Beaumont, C raig, Kenneth K ang, Yougesh Khatri, and Helene Poirson,
2003,
A Guidance
Note on Surveillance of the Corporate Sector in the Asia Pacific Department
(unpublished; Washington: International M onetary Fund).
Begum, Jahanara, and Liliana Schumacher, 200 1, International Comparison of Corporate
Leverage, International Mon etary Fund, Monetary and Exchange Affairs
Department Technical Note, TN/01/02.
Birla, Kumar Mangalam, 1999, Report of the Committee Appointed by the SEBI on
Corporate Governance Under the Chairmanship of Shri Kumar Mangalam Birla.
Claessens, Stijn, Simeon Djankov , and Larry Lang , 1998, East Asian Corpo rates: Grow th,
Financing and Risks over the Last Decade, Working Paper (unpublished;
Washington: World Bank).
Chopra, Ajai, et. al., 1995, India: Economic Reform and Growth, IMF Occasional Paper 134
(Washington: International M onetary Fund).
Cobham, David, and Ramesh Subramaniam, 1998, Corporate Finance in Developing
Countries: New Evidence for India,
World Development,
V ol. 26, No. 6,
pp. 1033-1047.
Ganesh-Kumar, A., Kunal Sen and Rajendra Vaidya, 2002, Does the Source of Financing
Matter? Financial Markets, Financial Intermediaries and Investment in India,
Journal of International Development,
V ol. 14, pp. 211-22 8.
Godbole, Madhav, 2002, Corporate Governance: Myth and Reality,
Economics and
Political
Weekly,
July 27 , p. 3099.
Goldman Sachs, 2000, NPL s: How High, How Structural, (Hong Kong: Goldman Sachs
Global Equity Research).
Goswami, Omkar, 2002, Corporate Governance in India,
Taking Action Against
Corruption in Asia and the Pacific (Manila: Asian Development Bank), Chapter 9.
Government of India, Ministry of Finance, Department of Company A ffairs,
2003,
Annual
Report 2001-02
(New Delhi: Department of Company Affairs).
, 2002,
Forty Sixth Annual Report on the W orking and Administration of the
Companies Act, 1956
(New Delhi: Department of Com pany Affairs).
Haksar, Vikram, and Piyabha Kongsamut, 2002, Corporate Performance in Thailand,
Thailand: Selected Issues and Statistical Appendix,
IMF Country Report No. 02/195
(Washington: International M onetary Fund).

8/9/2019 SSRN-id878887Overview of the Indian Corporate Sector
http://slidepdf.com/reader/full/ssrn-id878887overview-of-the-indian-corporate-sector 41/41
4 0
Heytens, Paul, and Cem Karacadag, 2001 , An Attempt to Profile the Finances of China's
Enterprise Sector, IMF Working Paper 01/182 (Washington: International M onetary
Fund).
Hviding, Ketil, and Laura Papi, 2002, The Mexican Corporate Sector: A V ulnerability
Analysis, Mexico: S elected Issues, IMF Country Report No. 02/238 (Washington:
International Mon etary Fund).
Kang, Kenneth, 2001 , Health of the Corporate Sector in Korea,
Korea: Selected Issues,
IMF Country Report No. 01/101 (Washington: International Mo netary Fund).
Khanna, Tarun, and Krishna Palepu, 1999, Emerging M arket Business Groups, Foreign
Investors, and Corporate Governance, NBE R Working Paper 6955 (Camb ridge:
National Bureau of Economic Research).
National Stock Exchange of India Ltd., 2002, Securities Market in India—An Overview ,
www.nseindia.com
Report of the Committee on Corporate Audit and Governance,
2002, prepared by the
Comm ittee on Corporate Aud it and Governance (Chair: Naresh C handra), Ministry of
Finance and Com pany Affairs, Department of Company Affairs, New D elhi.
Sarkar and Sarkar, 1999, The Governance of Indian Corporates, Indian Development
Report.
Shirai, Sayuri, 2002, Have Ind ia's Financial Market Reforms Changed Firm s' Corporate
Financing Patterns? ADB Institute, Research Paper N o. 38
(Manila: Asian Development Bank).
Singh, Ajit, and Javed Hamid, 1992, Corporate Financial Structures in Deve loping
Coun tries, IFC Technical Paper N o. 1 (Washington: International Finance
Corporation).
Singh, Ajit, 1995, Corporate Financial Patterns in Industrializing Economies. A
Comparative International Study, IFC Technical Paper
N o.
2 (Washington:
International Finance Corporation).
Standard and Poor's,
2003, Global Stock Markets Factbook 2002
(New York).
World Bank, 2000, India: Report on the Observance of Standards and Codes ROSC ),
Corporate G overnance Assessment and ROSC Module
www.worldbank.org/ifa/rosc cg india.html