Embed Size (px)
Citation preview

WATER ENVIRONMENT & FORESTRY TECHNOLOGY
AN OVERVIEW OF THE IMPACT OF MINING AND
MINERAL PROCESSING OPERATIONS ON
WATER RESOURCES AND WATER QUALITY
IN THE ZAMBEZI, LIMPOPO AND OLIFANTS
CATCHMENTS IN SOUTHERN AFRICA
Peter Ashton 1,
David Love 2, Harriet Mahachi 3 and Paul Dirks 3
1 CSIR-Environmentek, P.O. Box 395, Pretoria 0001, South Africa 2 Geology Department 3 Mineral Resources Centre
University of Zimbabwe, PO Box MP167, Mount Pleasant, Harare, Zimbabwe
August 2001
MINING, MINERALS AND SUSTAINABLE DEVELOPMENT PROJECT, SOUTHERN AFRICA
GEOLOGY DEPARTMENT UNIVERSITY OF ZIMBABWE
MINERAL RESOURCES CENTRE UNIVERSITY OF ZIMBABWE

ii
AN OVERVIEW OF THE IMPACT OF MINING AND
MINERAL PROCESSING OPERATIONS ON WATER
RESOURCES AND WATER QUALITY IN THE ZAMBEZI,
LIMPOPO AND OLIFANTS CATCHMENTS
IN SOUTHERN AFRICA
COPYRIGHT RESERVED This technical report documents an assignment that was carried out for the Mining, Minerals and Sustainable Development (SOUTHERN AFRICA) Project [MMSD(SA)] and remains the property of MMSD(SA). However, the intellectual property and insights acquired during the execution of this assignment remain vested in the authors of this report. No part of this report may be reproduced in any manner without written permission from MMSD(SA).
When used as a reference, this report should be cited as:
Ashton, P.J., D. Love, H. Mahachi, P.H.G.M. Dirks (2001). An Overview of the Impact of Mining and Mineral Processing Operations on Water Resources and Water Quality in the Zambezi, Limpopo and Olifants Catchments in Southern Africa. Contract Report to the Mining, Minerals and Sustainable Development (SOUTHERN AFRICA) Project, by CSIR-Environmentek, Pretoria, South Africa and Geology Department, University of Zimbabwe, Harare, Zimbabwe. Report No. ENV-P-C 2001-042. xvi + 336 pp.
MINING, MINERALS AND SUSTAINABLE DEVELOPMENT PROJECT, SOUTHERN AFRICA

iii
AN OVERVIEW OF THE IMPACT OF MINING AND
MINERAL PROCESSING OPERATIONS ON WATER
RESOURCES AND WATER QUALITY IN THE
ZAMBEZI, LIMPOPO AND OLIFANTS
CATCHMENTS IN SOUTHERN AFRICA
EXECUTIVE SUMMARY
The original Terms of Reference for this study (Research Topic 4) were extremely broad and required an
overview of all mining impacts on the biophysical environment throughout southern Africa. Though this
objective was desirable, and would provide an excellent background for management strategies in each of the
SADC countries, it was unrealistic in view of the time and budget constraints. Therefore, the main focus of this
research topic was restricted to water resources, in particular water quality, and attention confined to three key
river basins, namely the Zambezi, Limpopo and Olifants basins. Whilst the revised Terms of Reference remain
challenging, they represent a compromise that enabled a useful body of work to be produced.
The Project Team who conducted the investigation and report writing for Research Topic 4 comprised the
following individuals:
• Dr Peter Ashton – CSIR-Environmentek, South Africa – Research Co-ordinator and Project Manager;
• Mr David Love – Mineral Resources Centre, University of Zimbabwe – Principal Investigator;
• Professor Paul Dirks – Mineral Resources Centre, University of Zimbabwe – Project Supervisor and
Reviewer (Zimbabwe sector); and
• Ms Harriet Mahachi – Mineral Resources Centre, University of Zimbabwe – Assistant Investigator.
This report provides an overview of the impacts that mining and mineral processing activities have had, or are
likely to have, on the water resources (in particular, water quality aspects) of the Zambezi, Limpopo and Olifants
river basins. The report is the output of a collaborative research process involving scientists from CSIR-

iv
Environmentek, South Africa, and the Mineral Resources Centre of the University of Zimbabwe, and forms part
of the MMSD SOUTHERN AFRICA project.
The report has been structured into eight sections to provide a logical framework for synthesis of the information
and to facilitate transfer of insights, conclusions and recommendations to stakeholders.
The different types of typical chemical and physical impacts associated with diverse mining and mineral
processing operations are described to provide an overview of the specific types of impacts that are normally
associated with the mining or processing of specific minerals. In several cases, it was difficult to determine the
specific impact exerted by a mining operation, because the impact(s) also depended on the degree of
management control exerted during mining. Based on defined criteria, the impacts of mining and mineral
processing operations were classified into high, medium and low impacts. These descriptors were then used to
describe the scale and variety of impacts linked to mining activities in each of the sub-catchments.
Within the time and budget constraints of this Research Topic, it was not possible to collect high quality
quantitative data for each of the three river basins. Indeed, it was difficult to obtain water quality data for
Botswana, Malawi, Mozambique and Zambia and there was some sensitivity regarding possible
misinterpretation of the few data available for South Africa and Zimbabwe. Nevertheless, despite these
constraints, it was possible to estimate the extent and variety of historical and current mining and mineral
processing operations within each sub-catchment for each river basin. This information allowed the Project
Team to derive qualitative or semi-quantitative estimates of the probable extent of any impacts on water
resources and water quality, based on existing information and professional judgement. These were described
briefly in terms of both their potential severity and the spatial scale of the area they would be likely to affect.
In addition to this system of qualitative descriptions, attention was also paid to evaluating whether or not a
series of impacts within a single sub-catchment could interact or combine to exert a greater, cumulative effect
on water resources and water quality. In some cases, the cumulative effect of a group of otherwise relatively
“low-” or “medium-scale” impacts from individual mines in a single catchment can be seen as a dramatic
increase in both the severity and extent of adverse impacts exerted on catchment water resources and other
water users. In such cases, remediation often requires concerted management attention from the mines
concerned, as well as the relevant water authorities. Wherever possible, available water quality data were used
to substantiate descriptions of impacts.
Data for mining operations located in Zimbabwe and South Africa were restricted to those mining operations
that had achieved a minimum production specific to each commodity. This process of selection was not possible for other basin states due to the scarcity of data; all mining operations identified for the Angola,
Botswana, Malawi, Mozambique, Namibia and Tanzania sectors of the Zambezi and Limpopo basins were located on appropriate maps.
For all three of the river basins, numerous mining operations have been closed, abandoned or not proceeded
beyond initial prospecting and feasibility assessments. Unless these operations were likely to have a significant
impact on water resources and water quality in their immediate vicinity, these operations were not dealt with.
The study has confirmed the diverse array of mining and mineral processing activities that take place in the
Zambezi, Limpopo and Olifants basins. The extent and severity of the impacts is dependent on the commodity

v
exploited, the size of the facility, the climatic region in which the facility is situated and the efficiency and
effectiveness of management control. The variety and extent of impacts in the three river basins has been
segmented into the individual sub-catchments making up each basin. The overall impacts within each basin are
then summarized for clarity.
Several generic and specific conclusions were formed on the basis of the material examined during this study
and are reported in Section 6. Based on these conclusions and the supporting information, specific
recommendations have been listed in Section 7. These recommendations (Table 7.1) are listed here for
convenience.

vi
TABLE OF CONTENTS
Page
Executive Summary .............................................................................................................................. i
Table of Contents................................................................................................................................. v
List of Figures ........................................................................................................................................ ix
List of Tables ........................................................................................................................................ x
Acknowledgements.............................................................................................................................. xv
1. INTRODUCTION AND BACKGROUND INFORMATION................................................................. 1
1.1 Introduction................................................................................................................................. 1
1.2 Terms of Reference ................................................................................................................... 2
1.3 Approach to the project.............................................................................................................. 3
1.3.1 Project team................................................................................................................... 3
1.3.2 Information collection..................................................................................................... 3
1.3.3 Disclaimer....................................................................................................................... 4
1.3.4 Estimation of impacts..................................................................................................... 5
1.4 The availability of water............................................................................................................ 11
1.4.1 Introduction................................................................................................................... 11
1.4.2 Availability of water in southern Africa ........................................................................ 12
1.4.3 The extent of the water crisis facing southern Africa ................................................. 14
1.4.4 Factors contributing to conflict potential ..................................................................... 16
1.4.5 Strategies to avoid conflict or diminish conflict potential............................................ 18
1.5 Choice of catchments .............................................................................................................. 19
1.6 Types of data presented in this report..................................................................................... 21
1.6.1 Data on the location, nature, size and scale of mining
operations ........................................................................................................................ 21
1.6.2 Water quality and flow data on rivers and lakes......................................................... 23
1.6.3 Water quality data for certain individual mines........................................................... 24
1.6.4 Background spatially controlled data .......................................................................... 24
1.7 Purpose and structure of this document ................................................................................. 24
2. IMPACTS OF MINING AND MINERAL PROCESSING OPERATIONS ON THE BIOPHYSICAL
ENVIRONMENT.................................................................................................................................. 26
2.1 The mining and minerals processing sector in southern Africa............................................. 26
2.2 Types of mining activities and methods................................................................................... 28
2.3 Phases of mining and mineral processing operations ............................................................ 29
2.3.1 Exploration and surveying activities............................................................................. 31
2.3.2 Mine development and start-up ................................................................................... 31
2.3.3 Removal and storage of ores and waste material ...................................................... 32
2.3.4 Blasting, milling and grinding activities ........................................................................ 32
2.3.5 Smelting and refining activities..................................................................................... 35

vii
2.3.6 Stockpiling and transport of final product .................................................................... 36
2.3.7 Mine closure and post-operational waste management............................................. 36
2.4 Specific impacts of mining on water resources ....................................................................... 36
2.4.1 Acid mine drainage....................................................................................................... 37
2.4.2 Release of metals ......................................................................................................... 39
2.4.3 Cyanide ......................................................................................................................... 40
2.4.4 Siltation.......................................................................................................................... 40
2.4.5 Water use...................................................................................................................... 40
2.5 Small-scale mining .................................................................................................................... 41
2.5.1 Alluvial gold mining ....................................................................................................... 41
2.5.2 Small-scale chrome mining .......................................................................................... 41
2.5.3 Gemstones and semi-precious stones ........................................................................ 41
2.5.4 Tantalum and tin ........................................................................................................... 42 2.6 Differentiating between direct, indirect and cumulative impacts............................................. 42
2.7 The role and importance of natural weathering processes..................................................... 43
2.8 Legislative requirements for the control and management of impacts attributable to mining
operations in southern Africa.................................................................................................... 44
2.9 Legal and policy frameworks that influence or control mining and
minerals processing activities in Zimbabwe ................................................................................ 48
2.9.1 Introduction.................................................................................................................... 48
2.9.2 Mines and minerals legislation and policy ................................................................... 50
2.9.3 Water and environmental legislation and policy.......................................................... 54
2.9.4 Chamber of Mines Environmental Management Guidelines...................................... 59
2.9.5 Concluding Remarks .................................................................................................... 60
2.10 Principal approaches adopted to minimize and manage environmental impacts arising from
mining operations...................................................................................................................... 61
3. THE ZAMBEZI BASIN ....................................................................................................................... 64
3.1 Introduction............................................................................................................................... 64
3.1.1 Geology, topography and soils .................................................................................... 65
3.1.2 Climatic features ........................................................................................................... 67
3.1.3 Population and land use patterns ................................................................................ 67
3.1.4 Hydrological characteristics, water availability and patterns of
water use ...................................................................................................................... 69
3.1.5 Water management systems and institutions ............................................................. 71
3.1.6 Mining and mineral processing operations within the Zambezi
basin ............................................................................................................................... 74
3.2 The Kazungula sub-catchment................................................................................................ 86
3.3 The Chobe - Linyanti sub-catchment ...................................................................................... 87
3.4 The Luiana sub-catchment ...................................................................................................... 89
3.5 The Cuando sub-catchment .................................................................................................... 91
3.6 The Luanginga sub-catchment................................................................................................ 92
3.7 The Lungue Bungo sub-catchment......................................................................................... 94

viii
3.8 The Luena and Zambezi Headwaters sub-catchment........................................................... 95
3.9 The Kabompo sub-catchment ................................................................................................. 97
3.10 The Middle Zambezi sub-catchment....................................................................................... 99
3.11 The Lunga sub-catchment..................................................................................................... 100
3.12 The Upper Kafue sub-catchment .......................................................................................... 102
3.13 The Lower Kafue sub-catchment .......................................................................................... 107
3.14 The Kariba (Zambia) sub-catchment .................................................................................... 109
3.15 The Chirundu sub-catchment ................................................................................................ 112
3.16 The Mulungushi sub-catchment ............................................................................................ 114
3.17 The Luangwa sub-catchment ................................................................................................ 117
3.18 The Cahora Bassa (Mozambique) sub-catchment .............................................................. 119
3.19 The Shire (Malawi and Tanzania) sub-catchment................................................................ 122
3.20 The Mazowe (Mozambique) sub-catchment ........................................................................ 125
3.21 The Lower Zambezi (Mozambique) sub-catchment............................................................. 127
3.22 The Chamabonda sub-catchment......................................................................................... 129
3.23 The Matetsi sub-catchment ................................................................................................... 131
3.24 The Deka sub-catchment....................................................................................................... 133
3.25 The Gwayi sub-catchment..................................................................................................... 135
3.26 The Sebungwe and Lwizilukulu sub-catchments ................................................................. 139
3.27 The Sengwa sub-catchment.................................................................................................. 141
3.28 The Ume sub-catchment ....................................................................................................... 144
3.29 The Sanyati-Munyati sub-catchment .................................................................................... 146
3.30 The Mupfure sub-catchment.................................................................................................. 151
3.31 The Charara and Nyaodza sub-catchments......................................................................... 153
3.32 The Rukomeshe and Chewore sub-catchments.................................................................. 155
3.33 The Angwa sub-catchment.................................................................................................... 157
3.34 The Manyame sub-catchment............................................................................................... 161
3.35 The Musengezi sub-catchment ............................................................................................. 164
3.36 The Ruya sub-catchment....................................................................................................... 166
3.37 The Mazowe (Zimbabwe) sub-catchment ............................................................................ 168
3.38 The Ruenya sub-catchment .................................................................................................. 172
3.39 The Kairezi sub-catchment.................................................................................................... 175
3.40 Summary of impacts of mining operations on water resources and water quality in the
Zambezi basin ........................................................................................................................ 177
4. THE LIMPOPO BASIN..................................................................................................................... 181
4.1 Introduction............................................................................................................................. 181
4.1.1 Geology, topography and soils ................................................................................. 182
4.1.2 Climatic features ........................................................................................................ 183
4.1.3 Population and land use patterns .............................................................................. 184
4.1.4 Hydrological characteristics, water availability and patterns of
water use .................................................................................................................... 186
4.1.5 Water management systems and institutions ........................................................... 188

ix
4.1.6 Mining and mineral processing operations within the Limpopo
basin ............................................................................................................................ 190
4.2 The Ngotwane-Bonwapitse sub-catchment.......................................................................... 192
4.3 The Lotsane sub-catchment.................................................................................................. 194
4.4 The Motloutse sub-catchment ............................................................................................... 197
4.5 The Shashe - Tuli (Botswana and Zimbabwe) sub-catchment ........................................... 199
4.6 The Pazhi sub-catchment...................................................................................................... 202
4.7 The Mzingwane sub-catchment ............................................................................................ 204
4.8 The Diti sub-catchment.......................................................................................................... 207
4.9 The Bubye sub-catchment..................................................................................................... 209
4.10 The Mwenezi sub-catchment ................................................................................................ 211
4.11 The Mkgadikgadi sub-catchment .......................................................................................... 213
4.12 The Lower Limpopo (Mozambique) sub-catchment............................................................. 215
4.13 The Marico sub-catchment .................................................................................................... 218
4.14 The Crocodile-Elands-Pienaarsrivier sub-catchment........................................................... 221
4.15 The Matlabas-Mokolo sub-catchment................................................................................... 227
4.16 The Laphalala sub-catchment ............................................................................................... 230
4.17 The Theuniskloof sub-catchment .......................................................................................... 233
4.18 The Mogalakwena sub-catchment ........................................................................................ 235
4.19 The Setoka-Soutsloot sub-catchment................................................................................... 239
4.20 The Sand sub-catchment....................................................................................................... 242
4.21 The Nzhelele sub-catchment................................................................................................. 246
4.22 The Levuvhu sub-catchment ................................................................................................. 249
4.23 Summary of impacts of mining operations on water resources and water quality in the
Limpopo basin ........................................................................................................................ 253
5. THE OLIFANTS BASIN ................................................................................................................... 256
5.1 Introduction.............................................................................................................................. 256
5.1.1 Geology, topography and soils .................................................................................. 257
5.1.2 Climatic features ......................................................................................................... 258
5.1.3 Population and land use patterns .............................................................................. 259
5.1.4 Hydrological characteristics, water availability and patterns of
water use .................................................................................................................... 260
5.1.5 Water management systems and institutions ........................................................... 261
5.1.6 Mining and mineral processing operations within the Olifants
basin ............................................................................................................................. 262
5.2 The Wilge sub-catchment...................................................................................................... 263
5.3 The Little Olifants-Reit sub-catchment................................................................................... 266
5.4 The Middle Olifants sub-catchment........................................................................................ 272
5.5 The Steelpoort sub-catchment ............................................................................................... 277
5.6 The Blyde sub-catchment...................................................................................................... 282
5.7 The Selati sub-catchment ....................................................................................................... 286
5.8 The Middle and Great Letaba sub-catchment ....................................................................... 292

x
5.9 The Shingwedzi sub-catchment ............................................................................................. 297
5.10 The Timbavati - Klaserie sub-catchment .............................................................................. 300
5.11 The Lower Olifants (Mozambique) sub-catchment ............................................................... 303
5.12 Summary of impacts of mining operations on water resources and water quality in the
Olifants basin.......................................................................................................................... 305
6. CONCLUSIONS................................................................................................................................ 307
6.1 Extent and significance of impacts in the three river basins ................................................ 307
6.1.1 Acid mine drainage impacts ....................................................................................... 307
6.1.2 Impacts due to the release of potentially toxic metals .............................................. 309
6.1.3 Impacts due to the release of potentially toxic substances ...................................... 310
6.1.4 Salinity (total dissolved solids) impacts ..................................................................... 311
6.1.5 Suspended solids impacts.......................................................................................... 311
6.1.6 Impacts on patterns of water supply and demand.................................................... 312
6.1.7 Impacts caused by small-scale (artisan) mining ....................................................... 313
6.1.8 "Peripheral" or indirect impacts linked to mining ....................................................... 314
6.2 Current management approaches to prevent, minimize and abate
impacts caused by mining operations.................................................................................... 315
6.2.1 Improved and harmonized legislation........................................................................ 315
6.2.2 Improved stakeholder participation in decision-making............................................ 316
6.2.3 Collaborative, industry-wide initiatives....................................................................... 316
6.2.4 Use of specific technologies for effluent treatment ................................................... 317
6.2.5 Environmental management systems ....................................................................... 317
7. RECOMMENDATIONS .................................................................................................................... 318
8. REFERENCES.................................................................................................................................. 321

xi
LIST OF FIGURES
Figure 1.1: Comparison of surface runoff versus average annual rainfall for African countries 13
Figure 1.2: Diagrammatic maps comparing (A) the distribution of larger perennial rivers and lakes
in Africa, with (B) the locations of actual or potential water-related conflicts....... 13
Figure 1.3: A comparison of the likely outcomes of societies with different levels of social
adaptive capacity having to deal with two levels of water abundance per capita 15
Figure 1.4: Sketch map of southern Africa, showing the twelve mainland African countries of the
Southern African development Community (SADC, shaded) and the location and
extent of the Zambezi, Limpopo and Olifants basins ........................................... 20
Figure 3.1: Sketch map showing the distribution of mean annual rainfall over the Zambezi basin,
plus major rivers and lakes..................................................................................... 68
Figure 3.2: Map of Zimbabwe, showing hydrological zones, major rivers and positions of the
Zambezi and Limpopo catchments........................................................................ 72
Figure 3.3: Map of Zimbabwe, showing positions and numbering of water quality sampling sites
operated by ZINWA................................................................................................ 73
Figure 3.4: Sketch map of the Zambezi basin, showing major rivers, lakes and sub-catchments,
plus the locations and types of important mining operations ................................ 75
Figure 3.5: Map of Zimbabwe, showing distribution of different land use types ..................... 76
Figure 3.6: Map of Zimbabwe, showing distribution and extent of different geological units . 77
Figure 3.7: Map of Zimbabwe, showing locations of precious metal mine.............................. 78
Figure 3.8: Map of Zimbabwe, showing locations of mines for ferrous metals and ferralloy metals
................................................................................................................................. 79
Figure 3.9: Map of Zimbabwe, showing locations of non-ferrous metal mines....................... 80
Figure 3.10: Map of Zimbabwe, showing locations of mines for industrial minerals............... 81

xii
Figure 3.11: Map of Zimbabwe, showing locations of gemstone mines.................................. 82
Figure 3.12: Map of Zimbabwe, showing locations of mines for minor metals and non-metals 83
Figure 3.13: Map of Zimbabwe, showing locations of all metal smelters, furnaces and coking
plants..................................................................................................................... 84
Figure 3.14: Map of Zimbabwe, showing river reaches that are subjected to alluvial gold mining
and small-scale chrome mining............................................................................ 85
Figure 3.15: Landsat TM image (Bands 1, 4 and 5) taken in October 1998 of a portion of the
Zambian Copperbelt, showing the locations of towns and major rivers, as well as the
extent of subsistence agriculture and informal settlements ............................. 105
Figure 4.1: Sketch map of the Limpopo and Olifants basins, showing the distribution of mean
annual rainfall over the two basins and the positions of the major tributaries within
each basin............................................................................................................ 185
Figure 4.2: Sketch map of the Limpopo and Olifants basins, showing major tributaries with their
sub-catchments, plus the locations and types of all important mining operations
located within these basins. The South African sectors of the Limpopo and Olifants
basins are enlarged in Figure 4.3 for clarity....................................................... 189
Figure 4.3: Sketch map of the South African sectors of the Limpopo and Olifants basins, showing
locations and types of all important mining operations in each sub-catchment 191
LIST OF TABLES
Table 1.1: Chemical impacts of different types of mining and mineral processing operations 6
Table 1.2: Physical impacts of different types of mining and mineral processing operations 7
Table 1.3: Criteria for classification of impact size / significance for different types of mine and/or
mineral processing operation ................................................................................. 8
Table 1.4: Explanation of the management implications associated with the qualitative system of
impact descriptors used in this study ................................................................... 10
Table 1.5: List of sub-catchments in the Zambezi, Limpopo and Olifants basins ............... 21

xiii
Table 1.6: Minimum annual production limits (usually metric tonnes) for inclusion of mining
operations in this study ......................................................................................... 22
Table 2.1: Summary data for the twelve mainland SADC states to show the relative importance
of social and economic contributions made by the mining and minerals processing
sector in each country .......................................................................................... 26
Table 2.2: Overview of the potential environmental impacts associated with different phases of
mining activities ...................................................................................................... 29
Table 2.3: Weathering characteristics associated with different Weinert N values .............. 43
Table 2.4: Partial listing of relevant legislation relating to mining activities and the control of
environmental impacts in some of the SADC states ............................................ 46
Table 2.5: Summary of the relevant legislation in Zimbabwe ................................................ 49
Table 2.6: Activities and relevant legislation in Zimbabwe .................................................... 50
Table 2.7: Sections of the Mines and Minerals Act (1996) relevant to environmental protection in
Zimbabwe .............................................................................................................. 51
Table 2.8: Mining (Health and Sanitation) regulations with environmental control facets .... 52
Table 2.9: Prescribed activities for which EIAs are required ................................................. 59
Table 2.10: Comparison of various standards ......................................................................... 60
Table 3.1: Area statistics for the eight SADC states comprising the Zambezi basin ............ 64
Table 3.2: Population statistics for the eight SADC states comprising the Zambezi basin .. 69
Table 3.3: Mining operations in the Kazungula sub-catchment ............................................ 87
Table 3.4: Mining operations in the Cuando sub-catchment ................................................. 92
Table 3.5: Mining operations in the Lungue Bungo sub-catchment ...................................... 95

xiv
Table 3.6: Mining operations in the Luena sub-catchment .................................................... 96
Table 3.7: Mining operations in the Kabompo sub-catchment .............................................. 98
Table 3.8: Mining operations in the Middle Zambezi sub-catchment ................................. 100
Table 3.9: Mining operations in the Lunga sub-catchment ................................................. 102
Table 3.10: Mining operations in the Upper Kafue sub-catchment ...................................... 105
Table 3.11: Water quality in the upper Kafue River .............................................................. 106
Table 3.12: Mining operations in the Lower Kafue sub-catchment ...................................... 109
Table 3.13: Mining operations in the Kariba (Zambia) sub-catchment ................................ 111
Table 3.14: Mining operations in the Chirundu sub-catchment ............................................ 113
Table 3.15: Mining operations in the Mulungushi sub-catchment ........................................ 116
Table 3.16: Mining operations in the Luangwa sub-catchment ............................................ 118
Table 3.17: Mining operations in the Cahora Bassa sub-catchment ................................... 121
Table 3.18: Mining operations in the Shire (Tanzania) sub-catchment ................................ 124
Table 3.19: Mining operations in the Shire (Malawi) sub-catchment ................................... 124
Table 3.20: Mining operations in the Mazowe (Mozambique) sub-catchment .................... 126
Table 3.21: Mining operations in the Lower Zambezi sub-catchment .................................. 128
Table 3.22: Mining operations in the Matetsi sub-catchment ............................................... 132
Table 3.23: Mining operations in the Deka sub-catchment .................................................. 134
Table 3.24: Actual discharge from Wankie Colliery .............................................................. 135
Table 3.25: Mining operations in the Gwayi sub-catchment ................................................. 137

xv
Table 3.26: Mining operations in the Sebungwe and Lwizilukulu sub-catchment s ............. 141
Table 3.27: Mining operations in the Sengwa sub-catchment ............................................. 143
Table 3.28: Actual discharge from Sengwa Colliery ............................................................. 143
Table 3.29: Mining operations in the Sanyati-Munyati sub-catchment ................................ 148
Table 3.30: Mining operations in the Mupfure sub-catchment ............................................. 152
Table 3.31: Mining operations in the Charara and Nyaodza sub-catchments ..................... 154
Table 3.32: Mining operations in the Rukomeshe and Chewore sub-catchments .............. 157
Table 3.33: Mining operations in the Angwa sub-catchment ................................................ 159
Table 3.34: Mining operations in the Manyame sub-catchment ........................................... 162
Table 3.35: Mining operations in the Ruya sub-catchment .................................................. 167
Table 3.36: Mining operations in the Mazowe (Zimbabwe) sub-catchment ........................ 170
Table 3.37: Actual discharge from Trojan Mine .................................................................... 171
Table 3.38: Data from Mazowe area ..................................................................................... 172
Table 3.39: Mining operations in the Ruenya sub-catchment .............................................. 174
Table 3.40: Actual discharge from Inyati Mine ...................................................................... 175
Table 3.41: Summary of actual and anticipated water resources and water quality problems
associated with mining operations and mineral processing activities in the Zambezi
basin .................................................................................................................... 178
Table 4.1: Area statistics for the four states comprising the Limpopo basin ...................... 181
Table 4.2: Population statistics for the four SADC states comprising the Limpopo basin . 184

xvi
Table 4.3: Mining operations in the Ngotwane-Bonwapitse sub-catchment ...................... 194
Table 4.4: Mining operations in the Lotsane sub-catchment .............................................. 196
Table 4.5: Mining operations in the Motloutse sub-catchment ........................................... 198
Table 4.6: Mining operations in the Shashe (Botswana) sub-catchment ........................... 201
Table 4.7: Mining operations in the Shashe (Zimbabwe) sub-catchment .......................... 201
Table 4.8: Mining operations in the Pahzi sub-catchment .................................................. 203
Table 4.9: Mining operations in the Mzingwane sub-catchment ........................................ 206
Table 4.10: Mining operations in the Diti sub-catchment ...................................................... 208
Table 4.11: Mining operations in the Mwenezi sub-catchment ............................................ 212
Table 4.12: Mining operations in the Lower Limpopo (Mozambique) sub-catchment ......... 217
Table 4.13: Mining operations in the Marico sub-catchment ................................................ 220
Table 4.14: Mining operations in the Crocodile-Elands-Pienaars River sub-catchment ..... 224
Table 4.15: Water quality data for three sampling stations along the Crocodile River ........ 226
Table 4.16: Mining operations in the Matlabas-Mokolo sub-catchment ............................... 229
Table 4.17: Mining operations in the Laphalala sub-catchment ........................................... 232
Table 4.18: Mining operations in the Theuniskloof sub-catchment ...................................... 234
Table 4.19: Mining operations in the Mogalakwena sub-catchment .................................... 238
Table 4.20: Average values for selected water quality constituents in the upper, middle and lower
reaches of the Mogalakwena River .................................................................... 239
Table 4.21: Mining operations in the Setoka-Soutsloot sub-catchment ............................... 241
xvii
Table 4.22: Mining operations in the Sand sub-catchment .................................................. 244
Table 4.23: Water quality data for three sites along the Sand River .................................... 245
Table 4.24: Mining operations in the Nzhelele sub-catchment ............................................. 248
Table 4.25: Mining operations in the Levuvhu sub-catchment ............................................. 252
Table 4.26: Average annual values of a range of water quality characteristics at three DWAF
sampling sites on the Mutale and Levuvhu rivers ............................................. 252
Table 4.27: Summary of actual and anticipated water resources and water quality problems
associated with mining operations and mineral processing activities in the Limpopo
basin .................................................................................................................... 254
Table 5.1: Area statistics for the two states comprising the Olifants basin ........................ 256
Table 5.2: Population statistics for the two SADC states comprising the Olifants basin ... 259
Table 5.3: Mining operations in the Wilge sub-catchment .................................................. 265
Table 5.4: Representative water chemistry data for four major sewage treatment works in the
Little Olifants – Riet sub-catchment ................................................................... 269
Table 5.5: Mining operations in the Little Olifants - Riet sub-catchment ............................ 270
Table 5.6: Selected water chemistry data for acid mine drainage from coal mines in the Little
Olifants - Riet sub-catchment ............................................................................. 271
Table 5.7: Water quality data for three sites on the Olifants River in the Middle Olifants sub-
catchment ............................................................................................................ 275
Table 5.8: Mining operations in the Middle Olifants sub-catchment ................................... 276
Table 5.9: Mining operations in the Steelpoort sub-catchment .......................................... 280
Table 5.10: Water quality data from five sites on the Steelpoort and Dwars rivers close to chrome
and vanadium mining operations ....................................................................... 281
xviii
Table 5.11: Mining operations in the Blyde sub-catchment .................................................. 285
Table 5.12: Water quality data for four sites on the Blyde sub-catchment ........................... 286
Table 5.13: Comparison of water quality characteristics of samples collected from the Selati River
and the lower Olifants River ............................................................................... 290
Table 5.14: Mining operations in the Selati sub-catchment .................................................. 290
Table 5.15 Mining operations in the Middle and Great Letaba sub-catchment .................. 295
Table 5.16: Representative water quality data on the Great and Middle Letaba rivers and their
tributaries ............................................................................................................ 296
Table 5.17: Mining operations in the Shingwedzi sub-catchment ........................................ 296
Table 5.18: Summary of actual and anticipated water resources and water quality problems
associated with mining operations and mineral processing activities in the Olifants
basin .................................................................................................................... 306
Table 7.1: Summary of recommendations for stakeholder contributions to sustainable
development ....................................................................................................... 319
xix
ACKNOWLEDGEMENTS
Several enthusiastic individuals willingly discussed their work relating to portions of this investigation and
provided members of the Project Team with information, data, references and maps during this study. Their
contributions to the compilation of the material presented in this report are gratefully acknowledged. In
particular, the Project Team sincerely thank the following persons for their assistance and inputs:
In Zimbabwe: • Mr Gambara, Assistant Chief Mine Engineer at the Mine Ventilation and Environmental
Control Offices, Ministry of Mines and Energy, Gweru; • Ms Zimba, Head Office, Zimbabwe National Water Authority (ZINWA); • Ms Matenga, Manyame Catchment Council, Zimbabwe National Water Authority; • Ms Danda, Geology Department, University of Zimbabwe; • Ms Mabvira, Geology Department, University of Zimbabwe; • Dr Love, Chemistry Department, University of Zimbabwe; • Ms Mutambirwa, Southern African Regional Documentation Centre; • Mr Ian Wylie, Executive Director: Rio Tinto Zimbabwe Limited; and
• Mr Eric Booth, Group Manager: HSE Affairs, Rio Tinto Zimbabwe Ltd, Kadoma.
In South Africa:
• Mr Peter de Wet, Geological Information Systems Manager, Exploration and Acquisitions Division, Anglo
American plc, Johannesburg;
• Mr C.J. Vorster, Database Manager: South African Mineral Deposits Database (SAMINDABA), Council for
Geoscience, Pretoria;
• Ms Fatima Ferraz, Geographical Information Systems Specialist, Geophysics Department, Anglo American
plc, Johannesburg;
• Mr Mike King, Manager: Exploration, Richards Bay Minerals, Richards Bay;
• Mr Adrian van Tonder, Manager: EHS, Richards bay Minerals, Richards Bay;
• Mr Gabe van der Berg, Environmental and Health Manager, Palabora Mining Company, Phalaborwa;
• Ms Sarah Lukeman, Environmental Specialist: Palabora Mining Company, Phalaborwa; • Mr Beyers Havenga, Chief Engineer: Project Planning – Water Resources (North),
Department of Water Affairs and Forestry, Pretoria; • Mr Trevor Coleman, Director: Wates Meiring & Barnard Consulting Engineers, Midrand;
• Mr Reinie Meyer, Specialist Geohydrologist, CSIR-Environmentek, Pretoria;
• Mr Okkie Van Den Berg, Chief Engineer: Project Planning, Department of Water Affairs and Forestry, Pretoria;
• Mr Pieter Viljoen, Deputy Director: Water Quality Management, Water Quality Management Directorate,
Department of Water Affairs and Forestry, Pretoria;
• Ms Nicolene Fourie, Geographical Information Systems Specialist, Directorate: Geomatics, Department of
Water Affairs and Forestry, Pretoria;
• Mrs Heleen van der Merwe, Librarian: CSIR Information Services, Pretoria; and
• Mr Edwin Mekwa, Chief Librarian, Information Directorate, Department of Water Affairs and Forestry, Pretoria.

xx
In Namibia:
• Dr Gabi Schneider, Director, Geological Survey of Namibia, Windhoek;
• Dr Peter Tarr, Executive Director, Southern African Institute for Environmental Evaluation,
Windhoek;
• Mr Rainer Schneeweiss, Superintendent: Projects and Planning, Rössing Uranium Mine,
Swakopmund; and
• Mr Achmet Abrahams, Superintendent: Health and Environmental Management, Rössing Uranium Mine, Swakopmund.
International:
• Dr Steven Slater, Principal Environmental Consultant, Rio Tinto Technical Services, Melbourne, Australia;
• Mr Peter Glazebrook, Principal Advisor: Toxicology, Rio Tinto Technical Services, Melbourne, Australia;
• Mr Tom Burke, External Policy Advisor (External Affairs), Rio Tinto plc, London;
• Professor Jan Lundqvist, Department of Water and Environmental Studies, Linköping University, Linköping,
Sweden; and
• Dr Munyiradzi Chenje, United Nations Environment Programme, Nairobi, (previously of SARDC, Harare).

xxi
1. INTRODUCTION AND BACKGROUND INFORMATION
1.1 Introduction
The Mining, Minerals and Sustainable Development Project (MMSD) is an independent, participatory project
aimed at understanding how the mining and minerals sector can best contribute to the global transition towards
sustainable development. The enormous diversity of views and definitions of “sustainable development” have
created considerable uncertainty in the minds of many people. In an effort to reduce some of this uncertainty
and provide greater focus and cohesion for the research teams, the final MMSD report will provide greater
clarity on what is implied by the term “sustainable development”, as well as precise recommendations on how
the sector can best contribute to the global transition towards this ideal.
The range of views and issues amongst different groups and individuals across the world prompted the project
originators to launch six MMSD Projects in different geographical regions. The MMSD southern African regional
project (MMSD SOUTHERN AFRICA) is one of these six projects and addresses issues important to the mining and
minerals processing sector in southern Africa. In the context of this project, southern Africa has been taken as
the twelve mainland African countries forming the Southern African Development Community, namely (in
alphabetical order): Angola, Botswana, Democratic Republic of Congo, Lesotho, Malawi, Mozambique, Namibia,
South Africa, Swaziland, Tanzania, Zambia and Zimbabwe.
The primary objective of MMSD SOUTHERN AFRICA is to place the mining and minerals processing sector in
southern Africa within the context of the stated SADC goals for sustainable development, as outlined in Text Box 1.1, below.
Text Box 1.1: Goals for sustainable development in southern Africa.
The context provided by acceptance of the defined goals for sustainable development in SADC countries
(above) precludes the necessity to become engaged in the protracted debates that surround the numerous
definitions of sustainable development. Concentrating on the generic concepts or principles of sustainable
development will ensure that MMSD SOUTHERN AFRICA has regional relevance as well as applicability to the
mining and minerals processing sector. However, in addition to the three primary principles listed in Text Box 1.1, the transition towards sustainable development within the SADC region also requires stakeholders to:
• Actively contribute to processes and structures that support good governance;
• Participate in initiatives aimed at strengthening regional co-operation; and
• Recognize that the profits gained at the expense of environmental or social systems are short-term and
therefore non-sustainable.
The goals for sustainable development in the Southern African region are to:
• Accelerate economic growth with greater equity and self reliance;
• Improve the health, income and living conditions of the poor majority; and
• Ensure equitable and sustainable use of the environment and natural resources for the benefit
f f

xxii
Within the MMSD (SOUTHERN AFRICA) framework, six critical issues were identified as research topics during a
series of stakeholder meetings. Each of the six MMSD SOUTHERN AFRICA research topics is addressed in
separate studies undertaken by research teams drawn from organizations in different SADC countries. One of
these issues, Research Topic 4, “the impact of mining and mineral processing activities on the biophysical
environment”, forms the focus of this report. In the context of the MMSD project, the “biophysical environment”
was taken to include all aspects of the natural environment, and excluded aspects that dealt specifically with
social, economic, institutional and governance issues taken up in the other research topics.
1.2 Terms of Reference
The original Terms of Reference for this study (Research Topic 4) were extremely broad and required an
overview of all mining impacts on the biophysical environment throughout southern Africa. Though this
objective was highly desirable, and would provide an excellent background for management strategies in each
of the SADC countries, it was unrealistic in view of the time and budget constraints imposed. Therefore, the
main focus of this research topic was restricted to water resources, in particular water quality, and attention
confined to three key river basins. The essential elements of the revised Terms of Reference for Research
Topic 4 are shown in Text Box 1.2, with details of the actual scope of work to be covered. Whilst the revised
Terms of Reference are still challenging, they represent a constructive compromise that will enable a useful
body of work to be produced.
Text Box 1.2:
Key
element
s of the
Terms
of
Referen
ce for
Researc
h Topic
4.
The
specific
Terms
of
Referen
ce for
all six
MMSD SOUTHERN AFRICA research topics are listed on the MMSD SOUTHERN AFRICA website shown above (Text
1. Background The objective of this study is to determine how biophysical environmental impacts associated with the mining and minerals sector can be managed in line with sustainable development in Southern Africa.
This work must be undertaken within the context of sustainable development provided by the MMSD SOUTHERN AFRICA document: “Locating The Mining and Minerals Sector Within The
Southern African Vision For Sustainable Development”.
2. Scope of Work
• The report will provide an introductory, broad-brush overview of the types and significance of
impacts associated with the mining and minerals sector in southern Africa; • This will set the scene for the main emphasis of the report, namely: a close focus on impacts
on the water environment; • The focus on the water environment will be further restricted to focus on three specific
catchments in southern Africa, namely: the Zambezi, Limpopo and Olifants basins; • Close attention will be paid to the approaches that are in use across the SADC region to
manage and mitigate impacts on the biophysical (and especially water) environment; • The report will pay close attention to the various methodologies such as stakeholder
engagement processes, statutory requirements, and best industry practices, to achieve good environmental performance;
• The key success factors, as well as the principles and guidelines that guide management actions, will be highlighted; and
• Recommendations will be made as to the roles, responsibilities and accountabilities of key stakeholders in the process

xxiii
Box 1.2). Each research team is required to ensure that the emphasis of their work is directed towards helping
stakeholders understand how the mining and minerals processing sector in southern Africa can best contribute
to the region’s transition to sustainable development. Whilst it is imperative to identify the variety and scale of
impacts exerted by the mining and minerals processing sector on the environment, it is then equally important to
determine the most appropriate ways to minimize and manage these impacts.
1.3 Approach to the project
1.3.1 Project team
The Project Team who conducted the investigation and report writing for Research Topic 4 comprised the
following individuals:
• Dr Peter Ashton – CSIR-Environmentek, South Africa – Research Co-ordinator and Project Manager;
• Mr David Love – Mineral Resources Centre, University of Zimbabwe – Principal Investigator;
• Professor Paul Dirks – Mineral Resources Centre, University of Zimbabwe – Project Supervisor and
Reviewer (Zimbabwe sector); and
• Ms Harriet Mahachi – Mineral Resources Centre, University of Zimbabwe – Assistant Investigator.
Project Team members from the Mineral Resources Centre at the University of Zimbabwe focused on the
Zimbabwean sectors of the Zambezi and Limpopo basins; the remaining portions of the Zambezi, Limpopo and
Olifants basins were dealt with by the CSIR-Environmentek researcher.
1.3.2 Information collection
The time and budget constraints placed on this research topic necessitated a very structured and tightly
controlled approach to achieving the respective objectives within the time allowed. This required members of
the Project Team to focus attention only on the most relevant and important information that was readily
available, and precluded large data gathering campaigns to collect new data.
In view of these constraints, most attention was focused on:
1. Structured interviews with selected individuals who have long experience with general water management
issues in the mining and minerals processing sector;
2. Consultations with a few key stakeholders in the mining industry to obtain information related to specific
mining operations in the selected river basins;
3. Consultations with key stakeholders in relevant Government departments who are concerned with water
resource management and pollution control to obtain information related to the three river basins
investigated;
4. Retrieval of information and policy documents available from the SADC Mining Sector Co-ordinating Unit
website;
5. Retrieval of information from Internet sites maintained by major mining companies that are active within the
three river basins under investigation;

xxiv
6. Literature searches of large databases containing references to mining and minerals processing activities,
as well as to water management activities;
7. Retrieval of maps and specific published information relating to the location and size of mining operations in
the Zambezi, Limpopo and Olifants basins, as well as any details of their water management practices;
8. Consultation with the SAMINDABA Minerals Database Manager at the South African Council for
Geoscience to obtain the latest available information on the location, size, and materials produced by
operating mines in the South African sector of the Limpopo and Olifants river basins;
9. Discussions with knowledgeable individuals who have long experience with assessing and managing the
impacts of mining and minerals processing operations on the biophysical environment;
10. Compilation, synthesis and integration of information contained in scientific and technical publications on the
mining and minerals processing sector; and
11. Professional judgement of the members of the Project Team.
12. In Zimbabwe, staff members of the Mineral Resources Centre held meetings and discussions with various persons and experts, notably: • Mr Gambara, Assistant Chief Mine Engineer at the Mine Ventilation and
Environmental Control Offices, Ministry of Mines and Energy, Gweru; • Ms Zimba, Head Office, Zimbabwe National Water Authority; • Ms Matenga, Manyame Catchment Council, Zimbabwe National Water Authority; • Ms Danda, Geology Department, University of Zimbabwe; • Ms Mabvira, Geology Department, University of Zimbabwe; • Dr Love, Chemistry Department, University of Zimbabwe; and • Ms Mutambirwa, Southern African Regional Documentation Centre.
13. Consideration and classification of the potential impacts of each type of mining or minerals processing operation on the Zambezi and Limpopo catchments;
14. Discussion of the potential impact of mining and minerals processing operations on each sub-catchment within the Zambezi and Limpopo catchments and implications for water quality and quantity management; and
15. Discussion of the general impact of mining and minerals processing operations on each catchment as a system.
1.3.3 Disclaimer
In compilation of this report, specific attention should be given to the disclaimer given by the Mineral Resources
Centre, University of Zimbabwe, relating to the information provided for Zimbabwe. It is reproduced in full, below.
Considering the tight timing and budgetary constraints of the project no original fieldwork, field
verification or sampling has been possible. The data presented has therefore been restricted to that readily available in the public domain, along with some confidential data supplied under
specific confidentiality agreements. Data sources have been quoted in all instances.
All data contained in this report have been compiled and are presented by the MRC in good faith.
The MRC can make no guarantees as to the completeness and accuracy of the data supplied.
Inferences made in the course of this report, especially those relating to potential impact are meant
as an attempt of assessing the situation on the ground. They should not be construed as
statements of fact or allegations of misconduct.

xxv
The MRC cannot be held responsible for any conclusions made or actions taken by the client
based on data presented in this report.
In addition, it is important to note that the time and budget constraints limited the ability of the Project Team to
provide a complete picture of every aspect of mining-related impacts on the water resources of the three river
basins considered. In particular, very little information was available for mining-related activities in the Angola,
Malawi, Tanzania and Mozambique sectors of the Zambezi basin. Nevertheless, in the professional opinion of
the Project Team members, sufficient information could be compiled and synthesized to provide an overview
that would meet the requirements set out in the Terms of Reference for this research topic.
1.3.4 Estimation of impacts
The impact of a particular mining or minerals processing operation on the biophysical environment can take the
form of either or both chemical and physical impacts. Chemical impacts include changes in acidity or alkalinity
levels, and the release of arsenic, mercury and other heavy metals, and the release of cyanide from gold mining
operations. These impacts are mainly the result of treatment of ore. Additional impacts occur as the result of
washoff of chemicals deposited onto the catchment surface from dusts, vapours and gases emitted from mining
operations. Typical physical impacts on the biophysical environment include: salinization, siltation (increased
levels of suspended and deposited solids), changed patterns of water use, the excavation of large pits, the
diversion of rivers and streams from their original courses, and deforestation / de-vegetation of sites.
The different types of typical chemical and physical impacts associated with different mining and mineral
processing operations are shown in Table 1.1 and Table 1.2, respectively. These descriptions provide an
overview of the specific types of impacts that are normally associated with the mining or processing of specific
minerals. In several cases, it is difficult to determine the specific impact exerted by a mining operation, because
the impact(s) will also depend on the degree of management control exerted during mining. The criteria used to
segment impacts into “high”, “medium” or “low” categories are given in Table 1.3 for each mining type.
Chemical impacts relate mostly to waste rock and low-grade ore dumps, which are present at all sites, and to chemical treatment, with associated tailings dams, which are present at many mining sites. A wide variety of
chemical impacts are possible and these can include acid mine drainage, the less common alkaline mine drainage, the release of highly toxic metals (most notably arsenic, antimony and mercury), the release of heavy metals, such as nickel, copper, cobalt, lead and zinc, and the release of cyanide from gold mining operations.
Physical impacts on water resources include the use of water for a variety of mining operations, siltation of
water courses by contribution to suspended solids loads, salinization by contribution to dissolved solids loads, the creation of large pits (that act as rain water traps), diversions of watercourses and sometimes associated extensive deforestation or de-vegetation of mine sites with concomitant erosion problems. The area affected
can be segmented into three typical classes or groups, namely: the mine environs only (typically consisting only of the mine property), the local area (one or more properties that are adjacent to the mine property), or more
widespread (regional).
On the basis of these impacts, mining and mineral processing operations could be classified into high impact,
medium impact and low impact, as shown in Table 1.3. These descriptors were then used in descriptions of the
scale and variety of impacts linked to mining activities in each of the sub-catchments.

xxvi
Within the time and budget constraints of this Research Topic, it was not possible to collect and determine high
quality quantitative data for each of the three river basins. Indeed, it was difficult to obtain water quality data for
Botswana, Malawi, Mozambique and Zambia. In contrast, some water quality data could be obtained for South
Africa and Zimbabwe, though there was some sensitivity regarding possible misinterpretation of these data.
Nevertheless, despite these constraints, it was possible to derive an estimate of the extent and variety of
historical and current mining and mineral processing operations within each sub-catchment for each river basin.
This information allowed the Project Team to derive a qualitative or semi-quantitative estimate of the most
probable extent of any impacts on water resources and water quality, based on existing information and
professional judgement. These impacts were described briefly in terms of both their potential severity and the
spatial scale of the area they would be likely to affect.
Where possible, identified impacts were segmented into direct effects of the mining or mineral processing
activities, and indirect effects that arise as a result of ancillary activities linked to the mining operations. For
example, mine housing developments with their associated water supply and sanitation systems, as well as
clearing of land and planting of crops for food cultivation by the families of mineworkers, are considered to be
indirect impacts associated with mining operations. In contrast, the water required for mine processes, dust
suppression and hydraulic transport of tailings or other waste materials, as well as any effluent seepages or
discharges, would be considered to be direct impacts of mining. The qualitative system of impact descriptors is
described in Table 1.4.
In addition to this system of qualitative descriptions, attention was also paid to evaluating whether or not a
series of impacts within a single sub-catchment could interact or combine to exert a greater, cumulative effect
on water resources and water quality. In some cases, the cumulative effect of a group of otherwise relatively
“low-” or “medium-scale” impacts from individual mines in a single catchment can be seen as a dramatic
increase in both the severity and extent of adverse impacts exerted on catchment water resources and other
water users. In such cases, remediation often requires concerted management attention from the mines
concerned, as well as the relevant water authorities. Wherever possible, available water quality data were used
to substantiate descriptions of impacts.
Table 1.4: Explanation of the management implications associated with the qualitative system of impact
descriptions used in this study.
Descriptor Type and Extent of Impact Very large /
Very high
Impacts are considered to be very serious and require continual management
attention; Impacts often consist of gross damage or disturbance to water resources
and aquatic ecosystems, rendering these unfit for other water users and requiring
extensive remedial actions; Impacts often extend for considerable distances from
the site of origin.
Large / High Impacts are considered to be serious and require frequent management attention
and remedial actions; Impacts often have large-scale (extensive) effects on water
resources and aquatic ecosystems, with deleterious effects on water resources,
aquatic ecosystems and other water users.
Medium Impacts are considered to be important, but seldom require frequent or continual
management attention; Impacts may be experienced as temporary or continual loss

xxvii
of amenity or deterioration in water quality, and can extend over both small and
large areas; Other water users are likely to experience moderate loss of amenity,
and may need to implement remedial treatment of the water before use.
Low Impacts are considered to be important but are easily controlled by routine
management actions; Impacts can be experienced as low-intensity nuisances over
a relatively large area, or as minor disturbances over a smaller area; Other water
users are unlikely to experience significant loss of amenity and seldom need to
implement remedial actions before using the water.
Very low Impacts likely to consist of minor disturbance to aquatic ecosystems or local water
resources; Impacts often temporary in nature or, where they occur continually,
extend over a very small area.
Negligible Impacts are unlikely to have a measurable or discernable effect on water resources
or water quality, often due to the innocuous nature of the waste material or to the
lack of mobility of the waste material in a specific geographic area.
An additional important consideration was the need to provide some assessment of the associated impacts of mining and minerals processing on water resources and water quality. Here, particular attention was paid to
other emissions such as dusts, explosive residues, metal vapours, gases and fumes, which often settle out onto land surfaces and are then washed into nearby watercourses during rainstorms. In addition, the disposal and
discharge of sanitary waste from mines also poses potential problems for water resources and especially water quality. Virtually all of these associated impacts can be controlled effectively by the use of appropriate
technologies and management systems.
1.4 The availability of water
1.4.1 Introduction
Throughout the world, water is recognized as the most fundamental and indispensable of all natural resources and
it is clear that neither social and economic development, nor environmental diversity, can be sustained without
water. Today, virtually every country faces severe and growing challenges in their efforts to meet the rapidly
escalating demand for water that is driven by burgeoning populations (Biswas, 1993; Gleick, 1998; Ashton &
Haasbroek, 2001). Water supplies continue to dwindle because of resource depletion and pollution, whilst
demand is rising fast because population growth is coupled with rapid industrialization, mechanization and
urbanization (Falkenmark, 1994, 1999; Rosegrant, 1997; Gleick, 1998). This situation is particularly acute in the
more arid regions of the world where water scarcity, and associated increases in water pollution, limit social and
economic development and are linked closely to the prevalence of poverty, hunger and disease (Falkenmark,
1989; Gleick, 1998; Ashton & Haasbroek, 2001).
xxviii
In comparison to the rest of the world, the distribution of water resources in Africa is extremely variable and water
supplies are unequally distributed in both geographical extent and time. Large areas of the African continent have
been subjected to series of prolonged and extreme droughts; very often these droughts have been “broken” or
“relieved” by equally extreme flood events. There is also compelling, though as yet unproven, evidence that
projected trends in global climate change will worsen this situation. In addition to climatic variability, a significant
proportion of the continent’s water resources are comprised of large river basins or underground aquifers that are
shared between several countries. The countries sharing these water resources often have markedly different
levels of social, economic and political development, accompanied by very different levels of need for water. The
wide disparities between socio-economic development and needs for water further complicate the search for
equitable and sustainable solutions to water supply problems (Ashton, 2000, 2001).
In virtually every African country, population numbers have grown dramatically during the past century; these
trends are expected to continue. Despite obvious inequalities within a variety of social, economic and political
dispensations, this population growth has been accompanied by an equally dramatic increase in the demand for
water. Several African countries have already reached or passed the point considered by Falkenmark (1989) to
indicate severe water stress or water deficit, where the scarcity of water supplies effectively limits further
development. Based on present population trends and patterns of change in water use, many more African
countries will reach, and exceed, the limits of their economically usable, land-based water resources before the
year 2025 (Ashton, 2000, 2001). These sobering statistics emphasize the urgent need to find sustainable
solutions to the problem of ensuring secure and adequate water supplies for all African countries.
Equitable access to water is recognized as a fundamental right of all peoples (Gleick, 1999). However, in parallel
with this right of equitable access, it is vitally important that we develop a shared appreciation of the true value of
water, and understand the critically important need to change or redirect our approaches to water management
and utilization on regional and continental scales (Ashton & Haasbroek, 2001). Whilst water allocation and
distribution priorities in each country need to be closely aligned with national and regional development objectives,
greater emphasis now needs to be placed on concerted efforts to ensure that the continent’s scarce water
resources are used to derive the maximum long-term benefits for the peoples of Africa as a whole. However, this
goal can only be achieved if water resource management is both judicious and cautious. A key consideration is
the pressing need to ensure that all sectors of society have equitable access to and use of the available water
resources. This aspect is particularly important in the case of Africa’s shared river basins. Ideally, each country’s
water resource management strategies needs to be closely aligned with those of its neighbours if peace and
prosperity are to be maintained and conflict is to be avoided (Pallett, 1997; Turton, 1999a; Ashton, 2000; Ashton &
Haasbroek, 2001).
1.4.2 Availability of water in southern Africa
Both the southern and northern portions of Africa receive considerably less rainfall during any given annual
cycle than their equatorial neighbours. These drier areas also experience greater variability in year-to-year
rainfalls and generally have more extreme air temperatures and higher rates of evaporation. In combination,
these features reduce surface water flows in rivers and streams, and provide little recharge to ground waters.

xxix
Typically, river flows in the countries of southern Africa and North Africa range from some 20% of mean annual
rainfall in the wettest areas to zero in the deserts. On average, flows in the rivers draining the northern and
southern areas of Africa comprise less than 10% of the mean annual rainfall. This is in marked contrast to
many equatorial African countries where surface runoff often comprises over 30-40% of the mean annual rainfall
(Figure 1.1). Across the African continent, the geometric (spatial) average annual rainfall amounts to some 650
mm; this is approximately 24% less than the world average annual rainfall of 860 mm (SARDC, 1996).
The variable and erratic rainfall patterns, extremes of temperature and high evaporation rates across the
continent result in a striking absence of perennial rivers and lakes in both North Africa and the western parts of
southern Africa (Figure 1.2A; Ashton, 2000). A comparison between the distribution pattern of perennial rivers
and lakes, and those areas where some form of dispute or conflict has occurred or has been threatened, either
over the availability of water or over some aspect of water supply, shows a remarkable correspondence (Figure 1.2B).
The climatic, and especially rainfall, characteristics of Africa, outlined briefly above, indicate very clearly that the
average quantity of water available at a given time and place (within a country) will be a finite amount. Years of
above-average rainfall will provide short-term relief in the form of additional water, whilst lower rainfalls during
drought conditions will cause, or accentuate, water shortages. Several authors (e.g. Falkenmark, 1989;
Ohlsson, 1995a; SARDC, 1996; Gleick, 1998; Ashton, 2000, 2001) have repeatedly stressed the fact that
freshwater resources in Africa and elsewhere represent a finite and vulnerable resource.
Figure 1.1: Comparison of surface runoff (expressed as a percentage of annual rainfall) versus average annual
rainfall for African countries. Data taken from (FAO, 2000a).
Average Annual Rainfall (mm)0 500 1000 1500 2000 2500 3000
0
25
50
75
100
North Africa Southern AfricaC-East Africa West AfricaWorld Average
Rainfall =860 mm/year
Apparent relationshipbetween rainfall andrunoff

xxx
Figure 1.2: Diagrammatic maps comparing (A) the distribution of larger perennial rivers and lakes in Africa,
with (B) the locations of actual or potential water-related conflicts. It is clearly noticeable that rivers form the
international boundaries between several African countries (redrawn from Ashton, 2000).
A direct result of this realization is a growing awareness that increased population numbers and improved
quality of life (i.e. “development” in its widest sense) contribute to a continual and inevitable reduction in the
quantity of water that is available per person. This reduced per capita availability of water, coupled to an
escalating trend in the degradation of its quality, represents the most serious and tangible single threat to the
flows of various goods and services required by society (FAO, 2000b). However, on a very positive note, the
threats posed by the impending water crisis have enhanced public recognition of the values generated by or
linked to water, and have also expanded our understanding of the significant social and economic values that
are embodied in the many ecosystem services that depend on water (Falkenmark, 1994, 1999; FAO, 2000b).
1.4.3 The extent of the water crisis facing southern Africa
The potential threat to society posed by increasing pressures for finite quantities of water is one that is not
unique to Africa. Nevertheless, the broad scale and imminence of the threats posed to many African countries
demand our urgent attention if we are to avoid large-scale hardship and possible future conflicts. Many authors
have stressed the apparent inevitability of serious inter-state conflict over competition for diminishing water
resources in different parts of the world (Smith & Al-Rawahy, 1990; Gleick, 1993; Ohlsson, 1995b; Homer-Dixon
& Percival, 1996; Rosegrant, 1997). Some authorities have extended these arguments even further and
postulated the strong likelihood that reduced availability of water could ultimately lead to “water wars” between
countries that may compete for the same scarce resource (Smith & Al-Rawahy, 1990). Many of these
arguments appear to be based on two groups of similar assumptions, namely: that communities, societies and
even governments of countries have little or no choice in the matter, and that their only logical (or possible)
reaction to the crisis of water shortage is one that is based on strong (even violent) competition for the resource.
A B

xxxi
In simple terms, all of the proponents of these arguments rely on a relatively simplistic interpretation of what
Falkenmark and her co-workers call “the numbers game” (FAO, 2000b). Clearly, the “numbers” tell everyone
that there is a continual and dramatic decline in the quantity of water available per person. This is
incontrovertible. However, it is important to understand the emphasis that different authorities place on the
numbers. For example, most arguments state the problem in terms of the continual decline in the quantity of
water available per person (e.g. SARDC, 1996; Basson et al., 1997). Again, this is accepted fact: the quantity of
water available for each person in the world is declining steadily; nowhere is the rate of decline as dramatic as
we continue to see in Africa. Even a cursory examination of the geographic and demographic statistics listed for
each southern African country confirms this decline and highlights the severity of the water crisis (Ashton,
2000).
However, importantly, the available statistics also reveal that the decline in water available per person is not
uniform across Africa. Several countries will remain in a state of so-called “water abundance” (Falkenmark,
1986) for many years to come, whilst others will experience increasing levels of “water scarcity” and “water
deficit”.
It is important to remember that these purely numerical forecasts assume a steady (and unchanged) rate of
population growth with no change in the total quantity of water available; according to these forecasts, the
population of southern Africa will increase by over 50% (increasing from almost 198 Million to 334 Million)
between 2000 and 2025. However, the estimates of population growth should be treated with caution. Given
the widespread incidence of water-borne diseases such as malaria and cholera (SARDC, 1996; Pallett, 1997),
together with the enormous implications of the African HIV+/Aids pandemic (Whiteside & Sunter, 2000; Ashton
& Ramasar, 2001), and declining levels of social and economic stability (Biswas, 1993; FAO, 2000b), these
forecasts may well be an over-estimate for the southern African population in 2025.
An important consideration here is the availability of the necessary social, economic and technical resources
that are needed to take advantage of the available water. These features have been referred to as “the coping
capability” or “social adaptive capacity” of a society that enable it to take advantage of the available natural
resources (Ohlsson, 1995a, b; Turton, 1999b; Turton & Ohlsson, 1999; Ashton, 2000; Ashton & Haasbroek,
2001). In particular, this capability of a society depends on a high degree of human ingenuity and the ability to
adapt and adopt plans, strategies and tactics that will help to promote more effective and efficient use of water
(Ashton, 2000; Turton, 2000; Ashton & Haasbroek, 2001). Indeed, there is convincing evidence that countries
(such as Israel) which display a highly developed social adaptive capacity, have been able to overcome severe
water shortages, whilst other countries (such as Burundi) where there is less evidence of social adaptive
capacity, have not been able to do so (Turton, 1999b).
Societies with low or high levels of social adaptive capacity will have different abilities to deal with changing
levels of water availability (Turton, 1999b; Turton & Ohlsson, 1999). The typical set of consequences is
demonstrated in Figure 1.3. A society with low social adaptive capacity will be unable to deal effectively with
water scarcity, thereby entering a situation that Turton (1999b) has called “water poverty”.

xxxii
Figure 1.3: A comparison of the likely outcomes of societies with different levels of “second order resources”
(i.e. social adaptive capacity) having to deal with two levels of “first order resource” supply (i.e. water abundance
or water scarcity). Figure redrawn and modified from Turton (1999b).
In a similar fashion, low levels of coping skills will prevent a society from making full use of abundant water
resources, thereby forcing it to enter a condition of “structurally-induced social scarcity”. In contrast, a high level
of social adaptive capacity will allow a society to develop and implement a series of coping strategies that will
permit a situation of so-called “structurally-induced water abundance” (Turton, 1999b; Turton & Ohlsson, 1999).
Equally, a country that possesses and deploys a high level of social adaptive capacity and has access to
abundant water resources can be considered to be in a state of “water security” (Figure 1.3).
This straightforward comparison (Figure 1.3) demonstrates very clearly how important it is for societies to
develop and implement sets of coping strategies and skills to enable them to deal effectively with conditions of
impending water scarcity. Inevitably, every country in Africa will have to face the same prospect: dwindling
quantities of water that can be supplied to meet demands. Some countries are already “beyond the water
barrier” (Falkenmark, 1999; FAO, 2000b) and are dealing with this urgent matter now; other countries with more
water available now will have to deal with the issue in future. In any event, an enormous effort will be needed
from every country if the challenge is to be met successfully.
1.4.4 Factors contributing to conflict potential
Against this background, it is important to examine the series of factors or conditions that could contribute to a
heightened potential for conflict over scarce water resources. In this process it is useful to distinguish between
those sets of circumstances where the issue of water is likely to be incidental to any conflict, from those where
water is or will become a central issue. This aspect is particularly significant in the case of river basins that are
RELATIVE ABILITY TO DEVELOP AND ADOPT COPING STRATEGIES
LOW HIGH
WATERSECURITY
STRUCTURALLY-INDUCED WATER
SCARCITY
WATERPOVERTY
STRUCTURALLY-INDUCED WATER
ABUNDANCE
xxxiii
shared by more than one country, especially where the countries involved have different levels of social and
economic development (Ashton, 2000).
One of the remaining legacies of past colonial administrations is the apparently arbitrary fashion in which the
national boundaries of most African countries were set (Prescott, 1979). As a result, these boundaries seldom
conform to river catchments and virtually all of the larger river systems in Africa are shared by several countries
(Pallett, 1997). Consequently, several African countries have had to compete directly or indirectly to derive the
maximum possible benefits from the available water resources. This situation has been accentuated in those
situations where the downstream countries may be economically “poorer” or politically and militarily “weaker”
than their upstream neighbours (Ashton, 2000). This competition between “upstream” and “downstream”
countries for the same water resource is considered to pose the greatest potential threat of conflict over water in
Africa (Ashton, 2000).
However, the available evidence indicates very strongly that territorial sovereignty issues have been implicated
in virtually every dispute or conflict that has taken place over, or near to, water. In most cases, these disputes
have been linked to disagreements over the precise positions of territorial boundaries and have tended to
involve relatively small areas (Ashton, 2000). Indeed, there is ample supporting evidence that despite many
predictions to the contrary (e.g. Homer-Dixon & Percival, 1996), “true” water wars have happened very rarely, if
at all (Delli Priscoli, 1998).
More recently, attention has switched to the increasing number of water-related problems that are being
recorded from countries that share the water resources within a single river basin. In several reported cases,
increased water use by “upstream” countries, combined with increased levels of water pollution, has had
adverse effects on “downstream” countries. Whilst many of these incidents may only extend over a small
geographic scale, occur for a short period of time, or implicate few water users, they invariably elicit a very
strong reaction from the neighbouring state (SARDC, 1996; Pallett, 1997). This situation can be particularly
sensitive where the states sharing a river basin make use of the available water without due consideration for
each other’s needs (Heyns, 1995; Ashton, 2001).
In its widest sense, water is a critical component of the national prosperity of a country because it is inextricably
woven into irrigation and food production processes as well as into the provision of energy and, occasionally,
into transportation systems. Access to adequate water supplies is usually seen as a "life or death" issue; any
threat to disrupt or prevent access to essential water supplies becomes an emotionally charged and volatile
topic of intense debate (Ashton, 2001).
Everyone is aware that a river knows no boundaries. Whatever happens to a river at one point will be
transported, transformed and expressed along its entire length until it reaches the ocean. Where human
activities divert or interrupt the flow of water, or cause degradation in water quality, the consequences are
always attenuated, translated and transmitted downstream (Ashton, 2000). Since very few of the larger rivers
are contained within the borders of a single country or state, access to wholesome supplies of water
increasingly becomes a source of potential conflict whenever a river crosses an international boundary. This
issue becomes particularly acute where water resources are unevenly distributed and where a single river
system may traverse or form several international borders (Pallett, 1997; Ashton, 2000, 2001). The potential for
xxxiv
conflict in such situations is brought sharply into focus in the case of countries that have to rely on water
originating in neighbouring states for the major proportion of their fresh water supplies. For example, Egypt,
Botswana and Niger obtain, respectively, 97%, 94% and 68% of their total fresh water from neighbouring states;
this undoubtedly contributes to a sense of vulnerability (SARDC, 1996; Ashton, 2000, 2001).
The tensions characteristic of most “upstream-downstream” situations can be compounded by large seasonal
variations in flow and by periodic droughts and floods. In some cases, this has promoted international trade in
water; Lesotho is a case in point, earning valuable foreign exchange from the water it sells to South Africa.
However, in the context of "water trading", there appears to be very little shared understanding or agreement as to
the value of water; it is usually treated as a “migrant” or “fugitive” resource with a variable value. This absence of
an agreed system for valuing water also contributes to potential conflicts between neighbouring states. The value
of water may also vary with its availability; for example, during floods, the unit value of abundant water supplies is
considerably less than an equivalent unit of water that may be available during a drought (Ashton, 2000).
1.4.5 Strategies to avoid conflict or diminish conflict potential
The common-sense statement: "prevention is better than cure" provides a perfect outline of the goals and
objectives that should direct our strategies and actions when we seek to deal with the complex issues of water-
related conflicts. However, despite its apparent simplicity, this ideal often eludes us in practice (Ashton, 2000). A
large part of the reason for this lies in the diverse, and often contradictory, ways in which we attach value to water,
and the ways in which we strive to derive both individual and collective benefit from our use of water. Too often
our objectives have a short-term, local focus aimed at meeting objectives and solving problems today, rather than
a far longer-term focus on the sustainable and equitable use of our water resources on a regional or continental
scale (Ashton, 2000, 2001; FAO, 2000b).
If our demands for water outstrip our ability to manage water as a focus for cooperation and the achievement of
common goals, there is a very real risk that we will enter an ever-tightening spiral of poverty, whose social,
economic and environmental consequences will threaten the fabric of society. In contrast, if we can attain an
equitable balance between the demands we make for the services and goods that we derive from the use of water,
and our ability to exercise our custodianship of water, we will be able to achieve a far more harmonious and
sustainable situation. However, to achieve this, all our policies and strategies concerning water must be guided by
the values of sustainability, equity, mutual cooperation, and the attainment of optimal benefit for society (Asmal,
1998).
Clearly, the countries concerned should not attempt to answer these questions in isolation from one another; a
solution put forward by one country is likely to be rejected by the other states involved. Instead, the states
should first agree to form an appropriate, formal institutional structure that will take responsibility for the
judicious management of the shared water resource (Lundqvist, 1999). Several such institutional structures or
river basin organizations already exist in Africa and elsewhere in the world; these provide ideal examples to be
emulated. The formation of a suitable institutional structure should then be followed by agreement as to the

xxxv
most appropriate technical or investigative methods to use to answer the key questions, and, finally, agreement
to abide by the results or findings produced.
The formation of a suitable institutional structure probably represents one of the greatest obstacles that river
basin states need to overcome since this will formalize and legitimize the technical deliberations that take place.
The question as to what fraction of the water can be allocated for society’s use without jeopardizing or impairing
the water resource will depend on the importance that each country attributes to the necessity to maintain
essential ecosystem functions. This can be achieved by consensus-seeking approaches based on a thorough
analysis of the structure, functioning and characteristics of the water resource and associated terrestrial
systems in the catchment (Lundqvist, 1999; Ashton, 2000).
A final question: what constitutes a fair and equitable share of the water resource, is often viewed as the most
difficult one to answer and one where participating states are most likely to disagree. Clearly, the basis of the
answer will depend on the relative degree of importance that the participating states attach to the needs of their
people for water, and the necessity to maintain essential ecosystem functions and services (Wolf, 1999; FAO,
2000b). The principle of “reasonable and equitable use” embodied in Article 5 of the United Nations Convention
is somewhat vaguely worded, provides little guidance in this regard and is prone to subjective interpretations
(van der Zaag et al., 2000).
Essentially, each of the participating states needs to agree on the fraction of water to be reserved for ecosystem
functions, and the precise criteria that should be used to calculate the “fair and equitable share” that each
country is then entitled to (Wolf, 1999; van der Zaag et al., 2000). Preliminary evaluations of a set of six
tentative criteria have demonstrated that, if agreement can be reached on the precise nature of the criteria, then
it is a relatively simple procedure to derive the respective shares of the available water (van der Zaag et al.,
2000). Whilst this approach is not yet able to account for seasonal and year-to-year variations, it has an
inherent simplicity that will make it attractive to decision-makers. However, because it is still incomplete, further
development and testing are needed before it can be adopted.
1.5 Choice of catchments
An important principle of the MMSD SOUTHERN AFRICA project is the need to provide information on the mining
and minerals processing sector that is both relevant and useful to all southern African countries. This principle
required that the investigations carried out by the six Research Topics should be conducted at a wider scale
than that of a single country. In addition, it would also be possible to enhance the value of the information and
insights in each project by including researchers from different SADC countries in the research teams.
Against this background, and given that the most logical unit for water management is the river catchment or
basin, it was entirely logical to focus attention in Research Topic 4 on specific river basins. A secondary
consideration was the possibility of linking with work undertaken by the SADC Mining Sector Co-ordinating Unit
(SADC-MSCU) on the Zambezi basin and thereby ensuring that the outputs from this study supported the
SADC-MSCU activities.

xxxvi
Selection of the specific river basins for study was designed to achieve a balance between time and budget
constraints, the availability and accessibility of relevant information, and the need to provide information of
relevance to more than one SADC country. Ultimately, three river basins were selected for investigation,
namely: the Zambezi, Limpopo and Olifants basins. Whilst the Olifants river basin is in fact a sub-catchment of
the Limpopo system, its features are sufficiently distinct to warrant it being considered separately. The location
and extent of the three river basins in relation to the SADC countries is shown in Figure 1.4, whilst a list of the
different sub-catchments within each of these river basins is provided in Table 1.5. The impacts attributable to
mining and minerals processing activities in each of the three river basins are described in subsequent sections
of this report.

xxxvii
0 250 500 km
ZAMBIA
KENYAUGANDA
SUDAN ETHIOPIA
NAMIBIA
ANGOLA
BOTSW ANA
TANZANIA
MOZAMBIQUE
SOUTHAFRICA
DEMOCRATICREPUBLICOF CONGO
SWAZILAND
LESOTHO
MALAWI
ZIMBABWE
CONGOGABON
CAMEROUN
CENTRALAFRICANREPUBLIC
RWANDA
BURUNDI
Limpopo
Olifants
Zambezi
Figure 1.4: Sketch map of southern Africa, showing the twelve mainland African countries of the Southern
African Development Community (SADC, shaded) and the location and extent of the Zambezi, Limpopo and
Olifants basins.
Table 1.5: List of sub-catchments in the Zambezi, Limpopo and Olifants basins.

xxxviii
Zambezi Limpopo Olifants Cuando-Luiana Ngotwane – Bonwapitse Wilge
Luanginga Lotsane Little Olifants – Reit
Lungue Bungo Motloutse Middle Olifants
Luena Shashe-Tuli (Bots. + Zim.) Steelpoort
Zambezi headwaters Pazhi Blyde
Kabompo Mzingwane Selati
Lunga Diti Middle and Great Letaba
Kafue (upper and lower) Bubye Shingwedzi
Mulungushi Mwenezi Timbavati – Klaserie
Luangwa Mkgadikgadi Lower Olifants (Mozamb.)
Shire (plus Lake Malawi) L. Limpopo-Chagane (Moz.)
Lower Zambezi (Cahora Bassa) Marico
Kariba Crocodile–Elands-Pienaars
Chamabonda Matlabas – Mokolo
Matetsi Laphalala
Deka Theuniskloof
Gwayi Mogalakwena
Sebungwe and Lwizilukulu Setoka – Soutsloot
Sengwa Sand
Ume Nzhelele
Sanyati – Munyati Levuvhu
Mupfure
Charara and Nyaodza
Rukomeshe and Chewore
Angwa
Manyame
Musengezi
Ruya
Mazowe
Ruenya
Kayirezi
1.6 Types of data presented in this report
In essence, four types of data are presented in this report. Due to difficulties in collecting appropriate data for
each of the three river basins, the coverage of these basins is very uneven. In future work, this deficiency
should be remedied by a programme of focussed data collection and compilation.
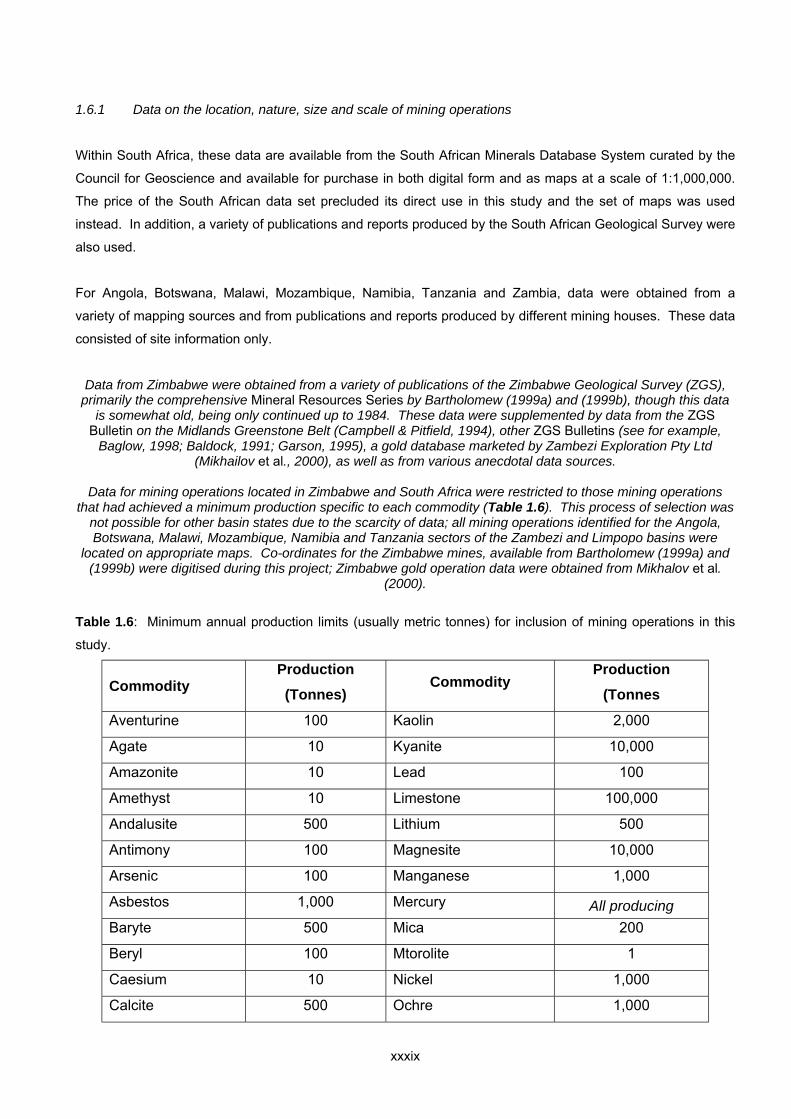
xxxix
1.6.1 Data on the location, nature, size and scale of mining operations
Within South Africa, these data are available from the South African Minerals Database System curated by the
Council for Geoscience and available for purchase in both digital form and as maps at a scale of 1:1,000,000.
The price of the South African data set precluded its direct use in this study and the set of maps was used
instead. In addition, a variety of publications and reports produced by the South African Geological Survey were
also used.
For Angola, Botswana, Malawi, Mozambique, Namibia, Tanzania and Zambia, data were obtained from a
variety of mapping sources and from publications and reports produced by different mining houses. These data
consisted of site information only.
Data from Zimbabwe were obtained from a variety of publications of the Zimbabwe Geological Survey (ZGS), primarily the comprehensive Mineral Resources Series by Bartholomew (1999a) and (1999b), though this data
is somewhat old, being only continued up to 1984. These data were supplemented by data from the ZGS Bulletin on the Midlands Greenstone Belt (Campbell & Pitfield, 1994), other ZGS Bulletins (see for example,
Baglow, 1998; Baldock, 1991; Garson, 1995), a gold database marketed by Zambezi Exploration Pty Ltd (Mikhailov et al., 2000), as well as from various anecdotal data sources.
Data for mining operations located in Zimbabwe and South Africa were restricted to those mining operations
that had achieved a minimum production specific to each commodity (Table 1.6). This process of selection was not possible for other basin states due to the scarcity of data; all mining operations identified for the Angola, Botswana, Malawi, Mozambique, Namibia and Tanzania sectors of the Zambezi and Limpopo basins were
located on appropriate maps. Co-ordinates for the Zimbabwe mines, available from Bartholomew (1999a) and (1999b) were digitised during this project; Zimbabwe gold operation data were obtained from Mikhalov et al.
(2000).
Table 1.6: Minimum annual production limits (usually metric tonnes) for inclusion of mining operations in this
study.
Commodity Production (Tonnes)
Commodity Production
(Tonnes Aventurine 100 Kaolin 2,000
Agate 10 Kyanite 10,000
Amazonite 10 Lead 100
Amethyst 10 Limestone 100,000
Andalusite 500 Lithium 500
Antimony 100 Magnesite 10,000
Arsenic 100 Manganese 1,000
Asbestos 1,000 Mercury All producing Baryte 500 Mica 200
Beryl 100 Mtorolite 1
Caesium 10 Nickel 1,000
Calcite 500 Ochre 1,000

xl
Chromium 100,000 Palladium 0.01
Citrine 10 Phosphate All producing Clay 100,000 Platinum 0.01
Coal All producing Pyrite 1,000
Cobalt 50 Salt 500
Copper 10,000 Sapphire and Ruby All producing Cordierite 0.05 Selenium 1,000
Corundum 1,000 Silica 10,000
Diamond All producing Sillimanite 10,000
Dimension stone All producing Silver 1
Dolomite 10,000 Talc 1,000
Emerald 0.005 Tantalum 5
Feldspar 1,000 Tin 100
Fireclay 10,000 Titanium 100
Flintclay 1,000 Topaz 0.1
Fluorite 1,000 Tungsten 50
Garnet - gemstone 1 Uranium All producing Garnet – industrial 10 Vanadium All producing Gold 0.05 Vermiculite 1,000
Graphite 1,000 Zinc 100
Iron 100,000 Zirconium 50
For all three of the river basins, a very large number of mining operations have been closed, abandoned or have
not proceeded beyond the initial prospecting and feasibility assessments. Unless these operations have had, or
can be expected to have, a significant impact on water resources and water quality in their immediate vicinity,
these operations are not dealt with in detail.
1.6.2 Water quality and flow data on rivers and lakes
For the South African sectors of the Limpopo and Olifants basins, river and lake water quality and flow data are
available from the South African Department of Water Affairs and Forestry. Data are collected routinely and
accessed into the Department’s hydrological and water quality databases and a small selection of data were
obtained for this study. Numerous studies have been conducted at different times and on different aspects of
the water quality and flow characteristics of different portions of these two catchments (for example: Annandale
et al., 1999; Boroto & Görgens, 1999; Brink et al., 1990; Brown, 1992, 1995; Cave, 1978; CSIR, 1993; CSIR &
Wates Meiring and Barnard, 1993; Dallas & Day, 1993; Du Plessis & Reynders, 1992; Funke, 1990; Hodgson &
Krantz, 1999; Holz, 1994; Pulles, 1992; Pulles et al., 1996a, b, c; Stimie et al., 2001; Thompson et al., 2001;
Toerien et al., 1980; Vadeveer & Carter, 1993; van Niekerk, 1993, 1998; van Vuuren & Deacon, 1995; Vorster,

xli
1997). In future studies, more attention needs to be directed towards a thorough and comprehensive analysis
of the available water quality data so that a whole catchment assessment can be determined with more
accuracy.
No water quality data could be obtained for portions of the Zambezi or Limpopo catchments located in Angola,
Botswana, Malawi, Mozambique, Namibia or Tanzania. A few published water quality data were available for
the upper Kafue River in Zambia, relating to specific studies undertaken on the Zambian Copperbelt (Chenje,
2000; Livingstone, 1999; Mwale, 1994; Mwase, 1994; Nkandu, 1996; Norrgren et al., 2000; Petterson & Ingri,
1993, 2000a, b; SADC-MSCU, 2001; SRK, 1998; Timberlake, 1998; Unrug, 1988).
In Zimbabwe, water quality data for selected rivers and lakes is available from the Zimbabwe National water
Authority (ZINWA). However, the data available were restricted to those from sampling points within the
Zambezi catchment that were readily available from the ZINWA Head Office in Harare. No water quality data
were available for the Zimbabwe sector of the Limpopo basin.
1.6.3 Water quality data for certain individual mines
In South Africa, water quality data from individual mine properties is not openly available to the general public.
These data are collected by the mines and are submitted to the Department of Water Affairs and Forestry as
part of routine pollution control monitoring operations. These data are considered to be “commercial in
confidence” and access is restricted.
A similar situation exists in Zimbabwe. However, a few data were made available to the Mineral Resources Centre by the Mine ventilation and Environmental Control Offices, Ministry of Mines, Gweru, on condition that
the identity of the mines concerned was not revealed. Selection of these data was at the discretion of the Assistant Chief Mining Engineer, Mine Ventilation and Environmental Control Offices, and have been used
simply to highlight some of the characteristic impacts of mining on certain water quality parameters.
No data on mine water quality could be obtained for Angola, Botswana, Malawi, Mozambique, Namibia and Tanzania. However, a few data for mine water quality on the Zambian Copperbelt were provided by the SADC
Mining Sector Coordinating Unit in their report (SADC-MSCU, 2001).
1.6.4 Background spatially controlled data
All of the locality data reported for Zimbabwe has been spatially controlled, as well as the data pertaining to
geology, land use, rivers and infrastructure. Spatially controlled data are also available for South African mining
operations.
1.7 Purpose and structure of this document
This report provides an overview of the impacts that mining and mineral processing activities have had, or are
likely to have, on the water resources (in particular, water quality aspects) of the Zambezi, Limpopo and Olifants

xlii
river basins. The report is the output of a collaborative research process involving scientists from CSIR-
Environmentek, South Africa, and the Mineral Resources Centre of the University of Zimbabwe, and forms part
of the MMSD SOUTHERN AFRICA project.
The researchers from the Mineral Resources Centre in Harare have compiled an enormous quantity of
information relating to the impacts of mining operations within Zimbabwe. Similarly, a considerable quantity of
information is available for the South African sector of the Limpopo and Olifants basins. In contrast, the quantity
of information available for mining operations in the other basin states (Angola, Botswana, Malawi,
Mozambique, Tanzania and Zambia) is considered to be sparse. Nevertheless, despite obvious imbalances in
the quantity and type of information available for inclusion in this report, the information presented here
represents the most comprehensive compilation of this nature that has ever been undertaken for these river
basins. As such, this document should guide future work on the issue and assist the SADC Mining Sector
Coordinating Unit to assess the impacts of mining on water resources throughout the SADC countries of
southern Africa.
The report has been structured into eight major sections to provide a logical framework for synthesis of the
information and to facilitate transfer of insights, conclusions and recommendations to stakeholders. The content
of each of the sections is described below.
Section 1 provides a brief background to this Research Topic and its relevance within the context of the MMSD
SOUTHERN AFRICA project, followed by an overview of the Terms of Reference and an outline of the approach
adopted during execution of the research programme. This section also includes an overview of the availability
of water in southern Africa, as well as an analysis of the factors that contribute to potential conflicts over water in
the region and strategies needed to prevent conflict.
Section 2 provides a short overview of the mining sector in southern Africa, followed by a description of the
different types of mining and mineral processing operations that characterize this sector in southern Africa. This
is followed by a concise summary of suitable methods used to distinguish between direct, indirect and
cumulative impacts and a brief description of the importance of natural weathering processes in exacerbating
environmental impacts from mining operations. The section concludes with an overview of the legislation that
controls mining impacts on water resources in the SADC countries and briefly reviews the principal methods
used to minimize and manage environmental impacts arising from mining operations.
Section 3 provides a brief overview of the water resources of the Zambezi basin and lists the available
evidence related to impacts on water resources and water quality that can be attributed to mining and mineral
processing activities the basin. This is supplemented with lists of all mining activities and maps showing the
locations of these operations in each sub-catchment.
Section 4 contains a brief overview of the water resources of the Limpopo basin and describes the available
evidence related to impacts on water resources and water quality that can be attributed to mining and mineral
processing activities the basin. This is supplemented with lists of all mining activities and maps showing the
locations of these operations in each sub-catchment.
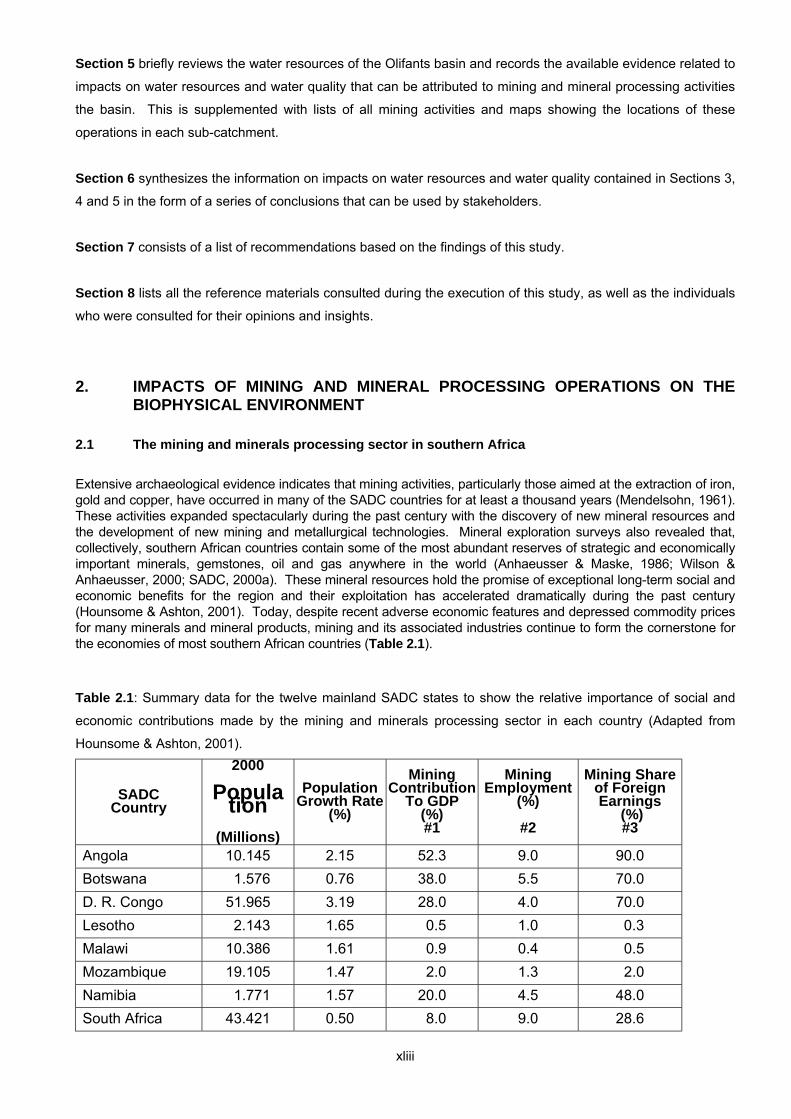
xliii
Section 5 briefly reviews the water resources of the Olifants basin and records the available evidence related to
impacts on water resources and water quality that can be attributed to mining and mineral processing activities
the basin. This is supplemented with lists of all mining activities and maps showing the locations of these
operations in each sub-catchment.
Section 6 synthesizes the information on impacts on water resources and water quality contained in Sections 3,
4 and 5 in the form of a series of conclusions that can be used by stakeholders.
Section 7 consists of a list of recommendations based on the findings of this study.
Section 8 lists all the reference materials consulted during the execution of this study, as well as the individuals
who were consulted for their opinions and insights.
2. IMPACTS OF MINING AND MINERAL PROCESSING OPERATIONS ON THE BIOPHYSICAL ENVIRONMENT
2.1 The mining and minerals processing sector in southern Africa Extensive archaeological evidence indicates that mining activities, particularly those aimed at the extraction of iron, gold and copper, have occurred in many of the SADC countries for at least a thousand years (Mendelsohn, 1961). These activities expanded spectacularly during the past century with the discovery of new mineral resources and the development of new mining and metallurgical technologies. Mineral exploration surveys also revealed that, collectively, southern African countries contain some of the most abundant reserves of strategic and economically important minerals, gemstones, oil and gas anywhere in the world (Anhaeusser & Maske, 1986; Wilson & Anhaeusser, 2000; SADC, 2000a). These mineral resources hold the promise of exceptional long-term social and economic benefits for the region and their exploitation has accelerated dramatically during the past century (Hounsome & Ashton, 2001). Today, despite recent adverse economic features and depressed commodity prices for many minerals and mineral products, mining and its associated industries continue to form the cornerstone for the economies of most southern African countries (Table 2.1).
Table 2.1: Summary data for the twelve mainland SADC states to show the relative importance of social and
economic contributions made by the mining and minerals processing sector in each country (Adapted from
Hounsome & Ashton, 2001).
SADC Country
2000
Population (Millions)
Population Growth Rate
(%)
Mining Contribution
To GDP (%) #1
Mining Employment
(%)
#2
Mining Share of Foreign Earnings
(%) #3
Angola 10.145 2.15 52.3 9.0 90.0 Botswana 1.576 0.76 38.0 5.5 70.0 D. R. Congo 51.965 3.19 28.0 4.0 70.0 Lesotho 2.143 1.65 0.5 1.0 0.3 Malawi 10.386 1.61 0.9 0.4 0.5 Mozambique 19.105 1.47 2.0 1.3 2.0 Namibia 1.771 1.57 20.0 4.5 48.0 South Africa 43.421 0.50 8.0 9.0 28.6

xliv
Swaziland 1.083 2.02 2.0 3.5 2.0 Tanzania 35.306 2.57 2.8 2.7 22.0 Zambia 9.582 1.95 12.1 9.0 80.0 Zimbabwe 11.343 0.26 8.0 7.0 40.0
#1: Converted from gross (national) GDP in 1999, in US Dollars, divided by 1999 population; includes onshore
and offshore oil and gas plus diamonds, plus all other formal land-based mining activities
(www.sadcreview.com/countryprofiles; and www.mbendi.co.za/indy/ming).
#2: Expressed as a percentage of total available adult workforce; excludes linked industries and artisan miners
(www.cia.gov/publications/factbook).
#3: Share of total foreign exchange earnings in 1999 that are directly attributable to sales of minerals and
mineral products; excludes allied industries and artisan mining (www.mbendi.co.za/indy/ming).
In southern Africa, the mining industry has been pivotal in the development of infrastructure and in the establishment of manufacturing industries. Although the direct contribution of mining to the economies of SADC countries has varied during the past 30 years, the importance of manufacturing industries based on a wide variety of minerals as raw materials has grown substantially. Some of the social and economic contributions currently made by mining to the economies of mainland SADC countries are highlighted in Table 2.1. Importantly, these data exclude associated industries and beneficiation programmes, and therefore represent a conservative estimate of the current (1999-2000) direct contributions made by the formal mining sector. The economic benefits attributable to the mining sector are reflected in the contribution to direct foreign exchange earnings in each country (Table 2.1). In particular, the economies of Angola, Botswana, Democratic Republic of Congo, Namibia, South Africa, Tanzania, Zambia and Zimbabwe obtain between 22% (Tanzania) and 90% (Angola) of their foreign exchange directly from mining and mineral exploitation activities. Overall, it is conservatively estimated that mining contributed an average of 40% to the direct foreign exchange earnings of SADC countries in 2000 (Mbendi, 2000; CIA, 2001; Hounsome & Ashton, 2001). Importantly, the estimates of foreign exchange earnings exclude the economic contribution made by “informal” or “artisan” miners to the economies of several countries. The figures shown in Table 2.1 also exclude “indirect” foreign exchange earned through the wages of migrant miners who, for example, work in South Africa and remit large portions of their earnings to their home country. These “indirect” foreign exchange earnings are estimated to contribute some 20% to Lesotho’s foreign exchange earnings (Mbendi, 2000; SADC, 2000a). Despite the prevailing economic pressures on the mining industry, the mining sector in the twelve mainland SADC countries employs some 5.3% of the SADC regions’ total available workforce, estimated at approximately 68 Million (Table 2.1). Whilst these figures emphasize the importance of the mining sector as a source of employment, they ignore the large numbers of migrant mine workers and exclude “artisan” and “informal” miners. This last group is problematic in the sense that accurate estimates for the numbers of people engaged in these activities are not easy to obtain as the activities vary from year to year. For example, the available estimates for numbers of artisan miners in Mozambique range from 25,000 to 200,000 whilst those for Tanzania range from 5,000 to 100,000 and for Zimbabwe range from 5,000 to 40,000 (Mbendi, 2000; SADC, 2000b). In these countries, artisan miners are engaged in the production of gold, tantalum and tin, as well as gemstones and semi-precious stones, that are often sold on “informal” or “illegal” markets (SADC, 2000b).
The scale and importance of the diverse activities comprising the mining sector in the economies of all southern
African countries have significant impacts on the social, economic and biophysical environment (Hounsome &
Ashton, 2001). Depending on their size, type and location, the impacts of mining activities and mineral
exploration programmes are often large enough to be regarded as drivers of environmental change, particularly
on the biophysical environment. In order to appreciate the ways in which mining activities affect the biophysical
environment, it is important to appreciate both the variety of mining activities and the different phases involved
in a typical mining operation.
2.2 Types of mining activities and methods

xlv
Mining methods vary widely and depend on the location, type and size of mineral resources. Surface mining methods are most economical in situations where mineral deposits occur close to the surface (e.g. coal, salts and other evaporite deposits or road quarry material) or form part of surface deposits (e.g. alluvial gold and diamonds, and heavy mineral sands). Typical surface mining methods include: strip mining and open pit mining, as well as dredge, placer and hydraulic mining in riverbeds, terraces and beaches. These activities always disrupt the surface and this, in turn, affects soils, surface water and near-surface ground water, fauna, flora and all alternative types of land-use (Fuggle & Rabie, 1996; Ashton, 1999). Shallow underground mining, up to about 50 metres below the surface, includes bord (room) and pillar mining (often used in coal mines), where pillars of the mineral seam are left to support overlying material. Many of the gold and copper mines in Zimbabwe, Zambia and the Democratic Republic of Congo are sited on historical workings that employed a variety of shallow underground mining techniques (Mendelsohn, 1961). In some of the older South African coalmines in the Witbank area, roof collapse has occurred after the mines were closed, allowing air to enter the old workings and promoting spontaneous combustion in the residual coal. Some of the abandoned workings in the Witbank area have continued to burn for many years and have resulted in unplanned surface collapse as well as ground and surface water contamination through acidification and salinization of local aquifers and streams (Wells et al., 1996; Fuggle & Rabie, 1996). Spontaneous combustion of exposed coal seams and stockpiles of coal fines is also experienced at the Hwange collieries in Zimbabwe and the Maamba Colliery in Zambia (SADC, 2001). A variety of deep underground mining techniques are required to extract ores located deep beneath the earth’s crust. Deep mining techniques include specialized ore extraction techniques, such as block caving and longwall mining, and require sophisticated infrastructure to ensure mine safety and maintain safe working environments. The principal environmental impacts associated with deep underground mining (for example, in gold, platinum, chrome and copper mines) are linked to the mine wastes and blasting residues brought to the surface by mine de-watering activities. These cause water pollution from leachates, as well as visual pollution, changes in land use, excessive dust, and surface subsidence as a result of mine dewatering activities. Offshore (sub-marine) mineral deposits such as diamonds, oil and gas, heavy mineral sands, phosphorite, glauconite and manganese occur off the shores of southern Africa and some of these are already exploited in various ways. These offshore mining activities differs according to the specific locality and the effects of the mining operation on intertidal, sub tidal or deep-sea marine environments (Gurney et al., 1996). Many offshore mining operations are vulnerable to inclement weather conditions that pose added risks of fuel and material spills and loss of human life (Ashton, 1999). Besides the rate and method of mining, the location, variety and scale of mine infrastructure also influences the nature and extent of impacts. Typical mine infrastructure includes: haul roads and ore dumps; ventilation shafts; surface facilities (e.g. offices, workshops, car parks and warehouses); tailings and waste rock disposal areas and methods; transport and service corridors (e.g. railway lines, roads, pipelines, conveyers, airstrips, port facilities, power, water and gas corridors); product stockpiles; ore processing facilities; chemicals and fuel storage and the locations of towns and housing facilities (Australian Environmental Protection Agency, 1995-1996; Fuggle & Rabie, 1996; Ashton, 1999; Weaver & Caldwell, 1999). Each mineral ore reacts in distinct ways when brought to the surface and comes into contact with air and water, affecting or altering the type of impact that may be expected from the mining operation. Whilst many environmental impacts can be fairly severe, it is important to acknowledge that several sophisticated mitigation measures have been devised through the sharing of best practice approaches in the mining industry.
2.3 Phases of mining and mineral processing operations The typical life cycle of a mining operation consists of a number of simultaneous or sequential phases and activities. For example: prospecting, development (including verification of the quantity and quality of ore and its amenability to various extraction and processing methods), construction, operation, staff housing and support, product stockpiling, mineral processing, waste management, rehabilitation and eventually, closure. The typical life span of a mine is in the region of 25 years although this can vary from less than 1 year to well over 100 years (Fuggle & Rabie, 1996).

xlvi
Different environmental interactions and possible impacts are usually associated with each of the phases of a mine's life span. The impacts associated with each mining phase have the potential to drive environmental change in several different ways and at various scales. These range from local- to national-scale changes and may even give rise to international environmental changes (for example air pollution plumes over the Southern African region). Table 2.2 outlines the stages of mine development from start-up to closure and lists the potential environmental impacts associated with each of these phases.
Table 2.2: Overview of the potential environmental impacts associated with different phases of mining
activities. [Information adapted from Environment Canada (1969) and Australian Environmental Protection
Agency (1995-1996)].
Mining Phase Activities Potential Environmental Impacts Exploration and Surveying
• Geochemical, geophysical
and airborne surveys
• Drilling and trenching
• Blasting of exploration
adits
• Exploration camp housing
• Vehicle and machinery
parks, fuel points and
service bays
• Access road construction
• Waste disposal (garbage)
• Camp sanitation systems
• Vegetation removal, damage and
destruction
• Habitat disturbance due to noise /
vibration
• Disturbance to wildlife and local residents
• Soil erosion along trenches and transects
• Dumping of drill cores and waste
• Demand on local water resources
• Discharge or spillage of contaminants
• Contamination of local ground waters by
drilling muds and exposed ores
• Restricted public access
Mine development start-up; sourcing and stockpiling of raw materials Mine development start-up; sourcing and stockpiling of raw materials (Continued)
• Mine construction • Stripping / storing
of soil “overburden”
• Installation of
power lines
• Surveying and
levelling of sites for
buildings and plant
• Installation of
mine and surface water
treatment plants
• Construction of
mine facilities, offices and
roads
• Construction of
processing plant, smelter
and refinery
• Construction of
storage facilities
• Landscaping of
site
• Fauna and flora habitat loss and
disturbance
• Reduction in biodiversity on site
• Potential loss of heritage sites
• Decreased aesthetic appeal of site
• Altered landforms due to construction
• Altered drainage patterns and runoff flows
• Increased erosion of site area
• Increased siltation of surface waters
• Contamination of surface and ground
waters by seepage and effluent discharges
• Discharge of contaminants via mine de-
watering activities
• Methane emissions from mine contributes
to greenhouse gases
• Increased demand on local water
resources
• Seepage / discharge of acid rock drainage
• Ground and surface water contamination
from seepage and radionuclides

xlvii
site
• Construction of
staff housing, infrastructure
and recreational facilities
• Construction of
railway lines and sidings
• Contamination from fuel spills and
leakages
• Increased demand for electrical power
Removal and storage of ores and waste materials
• Stripping / storing of soil
“overburden”
• Waste rock stockpiles
• Low grade ore stockpiles
• High grade ore stockpiles
• Land alienation from waste rock stockpiles
and disposal areas
• Disturbance from vehicle and machinery
noise and site illumination
• Acceleration of acid rock drainage through
exposure of ores to air and water
• Spontaneous combustion of coal fines • Increased erosion and siltation of nearby
surface waterbodies (rivers and lakes)
• Contamination of local ground waters
Blasting, milling and grinding
• Blasting of rock to release
ores
• Transport of ore to
crusher
• Extraction and preliminary
crushing of ore
• Milling and grinding of ore
• Flotation and chemical
concentration / leaching of
ore and final product
• Transport of ores to
smelter
• Ground surface disturbance
• Disturbance due to noise and vibrations
• Dust and fumes from explosives, mine
vehicles and transportation systems
• Contamination from explosive residues
• Discharge of contaminated water
• Windborne dust and radionuclides
• Sulphur dioxide emissions from roasters
and acid plants
• Metal vapour emissions from smelters
Smelting, refining and beneficiation
• Mineral processing
through smelting, roasting
and other methods for
refining ore
• Replenishment of refinery
plant processes /solutions
• Stockpiling of final product
• Discharge of contaminants to air,
including heavy metals, organics and SO2
• Leakages from electrolytic plant leading to site contamination
• Spillage of corrosive liquids
• Requirement for electrical power
Transport of final product to markets
• Packaging / loading of
final product into
transportation
• Transport of final product
via rail link
• Disturbance due to noise, vibration and
site illumination
• Dust and fumes from exposed product
stockpiles
Mine closure and post-operational waste
• Decommissioning of roads
• Dismantling buildings
• Subsidence, slumping and flooding of previously mined areas
• Underground fires in abandoned coal

xlviii
management • Reseeding/planting of
disturbed areas
• Re-contouring pit
walls/waste dumps
• Water quality treatment
• Fencing dangerous areas
• Monitoring of seepage
mines • Acid rock drainage from exposed ores • Continuing discharge of contaminants to
ground and surface water via seepage • Fauna and flora habitat loss and
disturbance • Windborne dust, including radionuclides • Dangerous areas that pose health risks
and possible loss of life (e.g. shafts, pits, etc.)
2.3.1 Exploration and surveying activities
Most of the potential environmental impacts associated with mining exploration and surveying activities occur at
a very much smaller scale than those recorded during mine operational activities, and are mainly restricted to
specific exploration areas and sites or slightly larger localities. However, the cumulative effects of exploration
activities at multiple sites within an area have the potential to drive environmental change, particularly from a
larger regional perspective (Table 2.2).
The more common and noticeable effects of these cumulative impacts include changes in aquatic and terrestrial
ecosystem health. The general environmental impacts of mining exploration include the removal of vegetation
for survey lines, vegetation damage and soil erosion from vehicle tracks, abandoned equipment and supplies,
soil, vegetation and water resource pollution and contamination.
Mining exploration impacts include local spillage and leakage of fuels, oils and drilling fluids resulting in site and
vegetation contamination. Potential surface water pollution may result from wastewater discharges, sewage
disposal and waste rock dump heavy metal and sediment drainage. Habitat disturbance and soil erosion
impacts are caused by vegetation clearing for access routes and drilling sites, and the use of bulldozers for
stripping overburden to examine the underlying bedrock.
2.3.2 Mine development and start-up
The development and start-up of a mining operation covers the period of time when considerable changes take
place as the mine infrastructure, plant and facilities are constructed, and when the ore body is first exposed (see
Table 2.2). In practical terms, the scale and sequence of events varies from mine to mine, but always entails
dramatic changes to most features of the local environment. Large areas of land are cleared of vegetation and
leveled prior to construction, whilst testing of ore processing and refining facilities is finalized. The spatial scale
of the mine site where impacts may be displayed can vary from a few tens of hectares to several square
kilometres. The most immediate impacts are seen as disruptions and disturbances to plant and animal
communities, accompanied by loss of aesthetic value and appeal.
During the development and start-up phase of mining, exposure of rocks, ores and soils to rainfall and winds
leads to relatively high levels of atmospheric contamination by dusts and water contamination by eroded and
oxidized materials, accompanied by increased erosion of the site and sedimentation of local water courses.

xlix
These effects are usually ameliorated by a variety of control measures, including: landscaping and re-
vegetation; constructed, realigned and protected drainage systems; regular use of dust suppression measures;
spoil capping with waste rock and stockpiled soil; collection and treatment of contaminated drainage water prior
to discharge.
Oxidation of exposed and stockpiled ores (both sub-economic and economic) and waste rock leads to increased
acid rock drainage as sulphide minerals are transformed. The resulting seepage has low pH values, as well as
high concentrations of dissolved metals and total dissolved salts. This leads to extensive adverse effects of
aquatic ecosystems and decreases the fitness of local water resources for use by other users.
2.3.3 Removal and storage of ores and waste material
The removal and storage (stockpiling) of ores prior to milling and extraction is usually the most intensive activity
on any mine operation. The process involves large-scale exposure of ore bodies, followed by blasting, loading
and transportation of various ore grades to the stockpile sites where the ores are separated on the basis of their
ore grade (see Table 2.2). Waste material, including waste rock and soil overburden, are separated and
stockpiled for possible later use during mine rehabilitation after closure. These activities are characterized by
large-scale disturbance due to noise, vibration and wind-blown dusts. Rainfall is contaminated by eroded and
oxidized materials, leading to varying degrees of sedimentation and pollution in local watercourses.
Remediation techniques are very difficult to apply to ore stockpiles since these are “live” and undergo changes
on a daily basis. Waste rock dumps can be rehabilitated as soon as they reach their planned extent.
2.3.4 Blasting, milling and grinding activities
The routine operational phases account for most of the environmental impacts associated with mining (see
Table 2.2) and are considered to have the greatest potential to drive environmental change. The extent to
which mining operational activities act as drivers of environmental change depends in part on the type, scale,
duration and magnitude of the activities, and the sensitivity of the receiving environment. General overviews of
the main types of impacts associated with the operational phases of mining are described briefly below.
2.3.4.1 Environmental changes associated with surface and underground mining methods
Surface mining methods, including strip mining, open pit mining, dredge, placer and hydraulic mining, may drive
environmental change of the affected land surface in the following ways (Brink et al., 1990):
• Changes in topography and surface drainage with the potential for increased soil erosion, long-term
compaction, subsidence and reduced agricultural capacity;
• Disturbance and disruption of the natural groundwater regime with the potential for both ground and surface
water pollution; and

l
• Changes in topsoil characteristics with the potential for increased acidity and salt content, development of
nutrient deficiencies or imbalances, surface crustiness or desiccation, changes in vegetation cover and land
use with the potential for production of atmospheric dust and other pollution.
The surface effects of underground mining are mostly associated with localized subsidence, sinkholes, rock
bursts and earth tremors, whilst roof collapse of shallow underground bord and pillar coal mine seams can
promote spontaneous combustion in the residual coal. Some of the older coal workings in the Witbank area
have continued to burn for many years and have resulted in unplanned surface collapse as well as ground and
surface water contamination through acidification and salinization of local aquifers and streams (Wells et al.,
1992). Further environmental effects associated with coal dump and fires in current Zambian and Zimbabwean
coal workings include sulphur dioxide emissions and associated acid rain (Chenje, 2000).
2.3.4.2 Changes to the groundwater environment
Mining operational activities often have several adverse hydrogeological impacts, including changes to the local
(and sometimes regional) groundwater dynamics, in terms of both the quality and quantity of water, and its flow
direction.
The location of many southern African mining operations in or close to dolomite formations is often of particular
concern to urban populations who rely on these dolomitic water resources for regular and emergency water
supplies (Brink et al., 1990). Most of the changes in groundwater quantity that are attributed to mining are
linked to dewatering activities, where the mines extract large volumes of good quality water to ensure safe and
economical mining operations. The environmental effects of dewatering include lowering of water tables, the
formation of sinkholes and localized subsidence.
Other hydrogeological impacts are often associated with the inappropriate placement of opencast and
underground mining waste disposal facilities such as tailings dams and slurry ponds on surface or in open pits.
These give rise to seepage mounds, decrease water quality and change the rate and direction of groundwater
movement (Brink et al., 1990).
In general, mining and milling processes result in the release of environmental pollutants which were previously
largely immobile. Probably the best-known example is that of acid rock drainage where the exposure of reactive
ores to oxygen, water and bacteria leads to the formation of deleterious leachates that have significant
environmental impacts. Sulphide minerals oxidize to acidic sulphate solutions with low pH values and high
sulphate and total dissolved salt concentrations. Potential sources of acid mine drainage include surface runoff
from open cast mining areas, seepage from leach ponds, runoff from residue dumps or ore stockpiles and
drainage from underground workings (Brink et al., 1990).
2.3.4.3 Changes to the surface water environment

li
Water quality changes are widely considered to be the most significant consequence of mining activities. This is
partly because of the wide variety of undesirable contaminants that are derived from mining operations, and
partly due to the frequency and persistence of these problems. Historical records of mining activities in the
sixteenth century clearly demonstrate the strongly antagonistic public opinion regarding the adverse effects of
mining on water quality (Agricola, 1556, cited in Environment Canada, 1996). In many areas, varying degrees
of adverse public opinion of mining activities continues to the present day (Viljoen & Reimold, 1999; Chenje,
2000).
Most mining operations share similar sets of activities or materials that generate contaminants and lead to
pollution of surface water resources. The following mining sources generate a diversity of contaminants that
have been shown to have adverse effects of varying intensity on surface waters, groundwater, aquatic plants,
surface water biota and submerged sediments (Pulles et al., 1996):
• Underground stopes;
• Surface rock and sand dumps;
• Slimes dams and delivery pipelines;
• Coal discard dumps;
• Coal fines;
• Rehabilitated opencast pits;
• Plant areas; and
• Explosives residues
Chemical contaminants in mine water systems are very varied and complex in nature. Often, these contaminants have synergistic effects on a variety of different environmental components and these can seldom
be reduced or ameliorated. Pulles et al., (1996) indicate that South African coal and gold mines have been unable to cost-effectively eliminate the following sources of water pollution:
• Acidic saline conditions with mobilized dissolved metals and nutrient enrichment caused by pyrite oxidation
and blasting residues;
• Eutrophication, pH fluctuations and decreased oxygen content caused by sewerage discharges; and
• Cyanide and radionuclide contamination of gold mine seepage water.
These problems are not unique to South Africa and are shared by every SADC country, as well as most mining
operations worldwide.
2.3.4.4 Landscape-scale ecological changes
The process of constructing, erecting and commissioning new mining infrastructure often results in large-scale
alteration of the environment, particularly at landscape and ecosystem levels. Infrastructure associated with
mine construction includes transport and service corridors (railway lines, roads, pipelines, conveyers, airstrips,
port facilities, power, water and gas corridors) and surface facilities (e.g. offices, laboratories, workshops,
vehicle parks and service bays, fuel storage and dispensing depots and warehouses), sinking of mine shafts
and the removal of soil, vegetation and rock to access ore deposits and create sites for tailings and waste
disposal areas. The landscape level environmental impacts are generally in the form of landscape alteration
and fragmentation or dispersal of biological habitats, populations, communities and ecosystems. They also
include altered patterns of stream flows, especially where mines have to be de-watered.

lii
2.3.4.5 Air pollution effects
The coal mining industry is one of the major sources of the greenhouse gas methane emitted into the
atmosphere every year. Mining processes release a variety of gases, metal vapours and dusts, as well as
radioactive particles, into the broader environment through discharge from smelter stacks, washoff or leachate
from unrehabilitated and revegetated mine dump and discard areas, or as constituents of mine dump dust. The
environmental impacts of wind-borne dust, gases and particulates from mining activities are primarily related to
human health and ecosystem damage. However, reports of copper toxicity to cattle and wildlife caused by
emissions from copper mines have also been recorded (CSIR & Wates Meiring and Barnard, 1993; Pettersson
& Ingri, 1993, 2000a, b).
2.3.4.6 Soil erosion and sedimentation
Mine construction results in widespread soil disturbance and is associated with accelerated soil erosion,
particularly in areas receiving high rainfalls. Soil, sediments and any associated contaminants are transported
into streams, rivers and other waterbodies, resulting in the loss or alteration of habitats for aquatic organisms,
as well as changes in water quality. Soil erosion also promotes a variety of terrestrial ecological changes
associated with disturbed areas, including the establishment of alien invasive plant species, altered plant
community species composition and loss of habitat for indigenous fauna and flora.
2.3.4.7 Tailing dams and impoundment leaks, seepage and breaches
Tailings dams, as well as earth-wall water storage dams and berms, contribute to contamination of local and regional water supplies via seepage through or around the dam walls or via breaches and/or failures of the
dams themselves. In the Vaal area of South Africa, it has been estimated that over 50,000 tonnes of salts seep out of tailings stockpiles into the Vaal barrage each year, resulting in extensive contamination of water, soil and
riparian vegetation (Booth, 1994).
Under severe circumstances, dam wall failure may result in large-scale soil contamination and loss of viable
land for agricultural and other forms of use, as well as potential loss of human life.
• 2.3.5 Smelting and refining activities
The primary environmental effects associated with smelting and refining processes include the contamination of
soils, watercourses, and even entire food chains caused by leaching and transportation of pollutants from ore
stockpiles and waste sites (Table 2.2).
All processes where ores are heated (to combust, melt or calcine specific minerals present in the ores) produce contaminated water, noxious gases and fine dust, and emit heavy metal vapours into the atmosphere (Booth,
1994). These substances settle out onto the surrounding landscape where they may have direct impacts on the area’s fauna and flora, particularly if emissions contain acidic substances such as sulphur dioxide. In addition,

liii
these substances are often mobilized during rainfall and transported by runoff into nearby watercourses where they have additional effects on components of the aquatic ecosystem as well as other water users.
2.3.6 Stockpiling and transport of final product
In most mining operations, the stockpiling and eventual transport of final product to markets is seldom
associated with significant impacts on the biophysical environment. However, the exception to this
generalization concerns those mining operations where the ore is transported for beneficiation elsewhere (for
example, coal, manganese and iron). In these cases, the primary impacts on the biophysical environment are
linked to noise disturbance and the emission of dusts and fumes from both the stockpiles and the transportation
system (Fuggle & Rabie, 1996).
• 2.3.7 Mine closure and post-operational waste management
Many mine-related environmental impacts often continue long after the mine has stopped production and has
been closed (see Table 2.2). Amongst the more pronounced post-closure impacts on record are landscape
scarring in the form of unrehabilitated waste rock dumps, mine tailings dams, discard dumps, old shafts and
underground fires. In addition, continuing environmental damage from polluted waters (including acid rock
drainage), wind-blown dusts and the dispersal of contaminated solid waste is a feature of mines throughout the
world (Johnson et al., 1994). Environmental changes that result from these impacts include the following (Carl
Duisberg Gesellschaft, 1999):
• Loss of productive land for alternative uses;
• Loss or degradation of groundwater quality;
• Pollution of surface water by sediments and/or salts, as well as lower pH values and increased metal
concentrations;
• Alterations to river channels by erosion and slumping;
• Changes in river flow regimes with sharper flow peaks and reduced dry season flows;
• Air pollution from dusts, radionuclides and toxic gases; and
• Risks of falls into abandoned shafts and pits that are not adequately protected.
2.4 Specific impacts of mining on water resources
Five key areas of impact that mining may have on water systems are: acid mine drainage (AMD), release of
metals, cyanide, siltation and water use. The set of impacts that any specific mining operation will have on the
environment, and especially the aquatic environment, depends on:
• The type of rock and ore being mined;
• The type of mining operation and the scale of operations;
• The efficiency and effectiveness of any environmental management systems that are deployed by mine
management; and
• The sensitivity of the receiving environment (including scarcity of water).

liv
Clearly, any large mining operation is likely to have a proportionately greater impact on the environment than a
smaller mining operation located in the same area. However, it is important to note that most large mining
operations also tend to employ more effective and efficient environmental management programmes than their
smaller counterparts. This feature tends to reduce the relative size and intensity of impacts associated with
larger operations. Indeed, many small mining operations very often cannot afford to implement effective
environmental management programmes and their impacts on the environment are sometimes
disproportionately large. This is clearly evident in the case of small-scale and artisan mining operations, where
little or no attention is directed towards minimizing impacts on the surrounding environment.
As a consequence, it is often extremely difficult to assign specific proportions of environmental impact to
different scales of mining operations where these occur on close proximity to one another. The only way to
separate the individual impacts in such a situation is through the application of a carefully structured monitoring
programme that examines both water quantity and water quality aspects.
2.4.1 Acid mine drainage
The breakdown of pyrite and other sulphides by water or air releases acid, sulphate and metals into the
environment. This is termed acid mine drainage (also referred to as acid rock drainage). The main reactions
involved (Loos et al., 1990) are:
2FeS2 + 2H2O + 7O2 → 2FeSO4 + 2H2SO4
4FeSO4 + O2 + 2H2SO4 → 2Fe2(SO4)3 + 2H2O
Fe2(SO4)3 + 6H2O → 2Fe(OH)3 + 3H2SO4
4Fe2+ + O2 + 4H+ → 4Fe3+ + 2H2O (bacterial catalysis)
FeS2 + 14Fe3+ + 8H2O → 15Fe2+ + 2SO42- + 16H+
The system is autocatalytic: the earlier reactions catalyse the later ones. This makes it difficult to stop the
reaction series once it has started (Mathesen et al., 1997).
It can be seen from these reactions that pyrite can remain in reduced form until exposed to air or water. Certain
chemolithotrophic bacteria, notably Thiobacillus ferrooxidans, use pyrite as an energy source, catalysing pyritic
decomposition. These bacteria have been found in water draining from various mine waste deposits, and in soil
in the seepage zone below the same deposits (Loos et al., 1990). They are also often found in streams near
mine dumps, where they aggregate in filamentous “streamers” of bacteria, coated in fibrillar polymers, which
they secrete (Kelly, 1988). The bacteria can function in an anaerobic environment, such as in a flooded mine.
According to comparisons of abiotic laboratory tests with field studies of sites with known Thiobacillus presence
(Kirby & Elder Brady, 1998), the bacteria can increase oxidation rates by five to eight orders of magnitude.

lv
The acidification of the water has immediate
deleterious effects on aquatic ecosystems. A direct
effect is the conversion below pH 4.2 of all carbonate
and bicarbonate into carbonic acid, which dissociates
into carbon dioxide and water. This destroys the
bicarbonate buffer system in the water, which acts as
a control on acidity. Secondly, since many
photosynthetic organisms use bicarbonate as their
inorganic carbon source, their ability to
photosynthesise is limited or destroyed altogether as
bicarbonate decomposes and becomes less available
(Kelly, 1988). Thirdly, decomposition (and hence
nutrient cycling) will be reduced and eventually cease,
in water bodies severely affected by acid inflow
(Dallas & Day, 1993). Fourthly, acid waters kill some
organisms, by destroying ionic balances, or damaging
cell components or carbonate exoskeletons (Kelly,
1988).
However, the most important effects of acidification of water are the changes that result in the speciation of
metals. The solubility, mobility and bio-availability of metals are generally increased by acidification of water.
This is probably the result of the combination of washout processes in rocks and soils in the catchment,
enhancing the mobility of metals, and the active remobilisation of metals from aquatic sediments (Förstner &
Salomons, 1991). Specifically:
1. At very low pH levels, aluminium is present as the toxic species Al3+. Al3+ is complexed by SO42- anions and
since these are a major component of water subject to acid mine drainage, the affect on aluminium may be
reduced somewhat by this process (Driscoll & Schecher, 1990).

lvi
2. The dissolution of feldspars and clay minerals becomes enhanced in acidic solution, and this results in the
release of aluminium into the water (Kelly, 1988).
3. Beryllium, cadmium, copper, cobalt, chromium, mercury, manganese, nickel, lead, vanadium and zinc
become more soluble in acidic solution (Dallas & Day, 1993; Edmunds & Smedley, 1996; Aström, 1998).
4. The formation of a sulphate-rich solution leads to the increasing solubility of arsenic, cobalt, iron,
magnesium, nickel and uranium (Brink et al., 1990).
When acidic mine waters on the surface evaporate, they leave behind metal-bearing salts, such as chalcanthite,
a complex hydrated copper sulphate. When the next pulse of water passes through the area, these salts re-
dissolve, releasing acid and metals into solution, leading to sharp seasonal peaks in metal content in water
systems (King, 1995).
Associated with acid mine drainage is the precipitation of iron (III) hydroxide and oxyhydroxide complexes,
which give the water an orange colour. These are referred to frequently as "ochres" or "yellow boy". The
hydroxides and sulphides are precipitated at moderately low pH (5-6), but once the pH drops below 4.3 they are
soluble. This often means that iron (III) stays in solution near the source of contamination, but precipitates
downstream, where the pH has been neutralized somewhat, and has risen above 4.3. These hydroxides form
flocs, which can block light penetration, clog the bottom of the river and have abrasive affects on biota.
Dissolved metals may re-precipitate when the iron (III) hydroxide flocs form at slightly raised pH (Kelly, 1988).
The accumulation of nickel, manganese and aluminium in these precipitates has been demonstrated (Rose &
Ghazi, 1998). Iron (III) flocs also precipitate in old, flooded mines, since once mining operations cease, no fresh
pyrite is exposed, and the pH gradually rises (Mining Journal, 1996). Some of the iron may also be precipitated
as iron phosphate, removing this nutrient from the water system (Kelly, 1998).
The release of sulphates and other sulphide breakdown products leads to increased suspended solids and
dissolved solids, and thus to salinization. This is enhanced by the dissolving effect of acidic waters on country
rock.
Acid mine drainage also leads to a reduction in dissolved oxygen concentration in the water system (Dallas &
Day, 1993).
Organisms such as dragonflies, damselflies, mayflies, bivalves and gastropods are often destroyed in water
systems subjected to acid mine drainage. Precipitation of iron hydroxides on aquatic plant leaves inhibits
photosynthesis (Dallas & Day, 1993).
2.4.2 Release of metals
Another major problem associated with mining operations is the release of metals into rivers and lakes.
Speciation refers to the proportion of the metal in different forms, such as ions, complex molecules or ion pairs
and combinations, colloids and precipitates. The impact of metals on aquatic life within a water system is
dependant on the specific complex that the metal is in, the ligands it is associated with, and the thermodynamic

lvii
and kinetic stability of the complex (Fernando, 1995). Different metal species have different bio-availabilities,
and some metal species are more toxic than others. For example, free Cu2+ ions are much more toxic than
most forms of Cu(II) which have been complexed by organic ligands (Moffat, 1997).
Much of the metal present in a water system will be either adsorbed onto particulate matter or in suspension,
rather than in solution as free ions (Kelly, 1988). Where metals are associated with a particulate phase, they
can be transported long distances from the original source.
Where anaerobic and reducing conditions develop in a water system, metal sulphides may form, and be
precipitated out of solution - although they can be re-dissolved when conditions change (Kelly, 1988). The
superoxide radical (O2-) is produced from photo-oxidation of coloured dissolved organic matter, and the radical
reacts quickly with inorganic iron and copper species in water. This results in the formation of reduced species,
and influences the overall speciation of metals such as iron and copper (Zafifiou & Voelker, 1997).
Increase in salt concentrations in the water increase solubility and mobility of sediment-bound metals, by
competition for sorption sites, and formation of soluble complexes (Förstner & Salomons, 1991).
Metal speciation and concentration are also affected by changes in river flow regimes, leading to settling, re-
suspension, sorption or co-precipitation. The drop in velocity that occurs when a river enters a lake results in
deposition of suspended material, and diffusion and mechanical dispersion occur. Lake-bottom sediments may
act as metal sinks. This is also affected by sediment or clay type, as dissolution, adsorption and precipitation
are partly determined by factors such as surface area (Kelly, 1988). The presence of organic material in the
sediments has been found to enhance the transfer of metals from water to sediments, taking them out (at least
temporarily) of the water system (Nriagu et al., 1981). This process essentially buffers the availability of these
metals, with high levels of carbon inhibiting mobility of some metals, such as copper (Hettler et al., 1997).
Seasonal variations in metal content (and pH) of water systems draining mining areas have been recorded. A
suggested factor influencing this is the occurrence of soluble sulphate mineral phases (e.g. copiapite,
chalcanthite) in the waste pile. During the rainy season, the increased precipitation leads to a greater amount of
these minerals being dissolved.
2.4.3 Cyanide
Cyanide, a highly toxic substance, is indispensable in the refining of gold. Large quantities of cyanide are used
to simultaneously oxidise gold and stabilize it in solution as a gold-cyanide complex (Marsden & House, 1993).
The two main methods by which this takes place are agitation leaching, the aeration of mixed cyanide solution
and ground ore, and heap leaching, where the cyanide solution slowly percolates through the finely ground ore
(Channon, 1991; Love, in preparation). The gold is later recovered, but cyanide remains in the waste slurry,
which ends up on the numerous tailings dams.

lviii
2.4.4 Siltation
Siltation is the process whereby fine solid particles build up on the bed of a river or lake and is the result of an
excessive load of suspended solids in a river or rivers. Mining operations produce large quantities of dust and
finely powdered rock, with much rock having been ground to particle sizes below 0.2 mm. Though the materials
that are dumped after removal of the commodity being mined have fine particle size and reasonable physical
characteristics that could permit plant growth and retain adequate amounts of water, these materials have been
formed from hard unweathered material and so may not contain much of the finest clay material and lack
organic or microbial activity. The result is that mine dumps may be very unstable, easily blown by wind when
they are dry and eroded by heavy rain when wet. The action of rain and wind thus removes fine particles into
nearby water systems, leading to a build up of suspended solids and ultimately siltation.
2.4.5 Water use
Mining operations are major users of water, most notably for:
1. Cooling; 2. Underground operations, such as hydraulic drills; and 3. Processing, such as flotation and leaching.
Larger mines also frequently use large quantities of water to supply nearby residential areas
attached to the mines, such as mine housing units.
In arid and semi-arid areas, the quantity of water used by a mining operation places it in
direct competition for water with other water users, especially domestic, agriculture and the
aquatic environment. This “competition” becomes heightened when the mining operation is
also responsible for any deterioration in water quality as a result of effluent discharges.
Typically, however, the authority responsible for granting the mining permit will also work in
collaboration with the authority responsible for granting permits for water abstraction and
effluent treatment and discharge. When this collaboration is effective, it ensures that the
quantity of water used by the mining operation is within the allowable limits posed by the
available water within the catchment concerned. If insufficient water is available in the
catchment, and the social and economic opportunities offered by the mining operation are
sufficiently attractive, additional water may be brought in from a neighbouring catchment.

lix
This process is carefully balanced to ensure that the prevailing principles of integrated water
resource management (or integrated catchment management) are upheld.
In certain mining operations, (e.g. the Witwatersrand gold mines), the mines may be located
in a dolomitic area that is characterized by large volumes of ground water. This ground water
normally has to be removed and discharged into surface streams and rivers so that the
underground mining operation may proceed. In such cases, this apparent “additional” water
may provide a useful source of water for other surface water users in the catchment.
2.5 Small-scale mining
2.5.1 Alluvial gold mining
Alluvial gold mining has been carried out in many rivers across Mozambique, Tanzania, Zambia and Zimbabwe,
mainly by small-scale operators using picks, shovels and panning dishes and sometimes sluice boxes. In
Zimbabwe, mechanized mining was also applied in areas such as the Angwa River and the Ruenya River, both
located in the Zambezi basin (Chiyanike, 1997). The numbers of small-scale gold miners fluctuate widely from
year to year, often in response to the presence or absence of alternative employment.
Given the large numbers of small-scale miners, there is substantial physical impact due to the extensive
diggings and workings, for example: the upper reaches of the Ruhuhu River in Tanzania and the Mazowe River
in Zimbabwe. The normal gold recovery process in Zimbabwe is the stamp mill and amalgam plate (Holloway,
1993) and subsequent recovery of the gold from the amalgam using mercury (Love, in preparation). Mercury is
frequently lost in this process, causing significant contamination of the water systems.
2.5.2 Small-scale chrome mining
Small-scale mining of chrome takes place along the length of the Great Dyke in Zimbabwe, especially in the
Mutorashanga and Lalapansi areas, as well as southeast of the Mweza Range. The most important impact that
these workings have is the stripping off of large quantities of soil, leading to enhanced erosion and increased
sedimentation of nearby watercourses.
2.5.3 Gemstones and semi-precious stones

lx
Small-scale mining of gemstones and semi-precious stones is widespread in almost all SADC countries, though
the mining of gemstones (diamond, emerald, sapphire, garnet and ruby) is considered to be “illegal” by most
SADC Governments because the small-scale mining operations are very often unlicensed.
The predominant semi-precious stones mined are: garnet, amethyst, aquamarine, citrine, topaz and beryl. Here
again, the major problems associated with this activity are enhanced soil erosion and increased sedimentation
of nearby watercourses, caused by inadequate control of surface spoil and waste rock heaps.
2.5.4 Tantalum and tin
There a re a few instances where small-scale miners work specific pegmatite deposits for tantalum and tin.
These two metals are relatively valuable and can be sorted manually from the surrounding rock matrix. In view
of the low numbers and small-scale of these operations, the associated impacts are negligible.
2.6 Differentiating between direct, indirect and cumulative impacts
Environmental factors (“impacts”) associated with, or caused by, mining, as distinct from those associated with
the subsequent use of the extracted minerals, are largely confined to relatively restricted areas in the vicinity of
the appropriate geological formation and downstream in the catchment where the deposit is located. These
impacts would normally be considered to be “direct” impacts that can be linked directly to the mining and ore
processing operations.
In contrast, there are many other types of impacts that are associated with mining activities, but do not occur as
a direct consequence of the mining activity itself. These would be considered to be “indirect” impacts. A typical
example would be the variety of impacts caused by the activities of individuals and organizations that take place
in areas peripheral to a mining operation. An example of this is the discharge of effluent and wastes from
households, businesses and factories in the towns that develop around or close to a particular mining operation.
In several instances, these indirect impacts can exceed the total environmental impact of the original mining
operation and thereby require a far greater degree of management attention.
The term “cumulative impacts” is generally applied to those situations where several impacts from different
processes and activities combine to exert a greater set of (usually adverse) effects than those that would be
predicted from the original activities. An example of this type of situation would be the combination of adverse
effects that a community would experience if it were exposed simultaneously to atmospheric emissions of
gases, wind blown dust and effluent discharged from a mining operation. A second example would be the
situation where effluents and discharges from several mining operations or industries in a single catchment
exerted a set of combined effects or impacts on the river system draining the basin.
In some circumstances, there may be synergistic effects, where the combined (cumulative) effect of two
different activities is greater than would be expected from a simple combination of the two isolated activities.
Similarly, there are also certain circumstances where the impacts from two different activities effectively

lxi
neutralize each other – this situation is often referred to as an “antagonistic” or “counteractive” interaction.
Three typical wastes provide a simple example of this type of situation, namely: acid rock drainage, raw sewage
and power station ash. Individually, these wastes exert serious adverse impacts on aquatic environments; in
combination, however, they neutralize and offset each other so that their combined effect on the aquatic
environment is often innocuous.
In the context of this study, these examples of cumulative impacts are highly relevant as the three river basins
evaluated in this study all contain very large numbers of mining operations as well as a wide variety of industries
and other forms of land use. In combination, therefore, there is a large potential for the impacts of mining
operations to add to, or possibly even counteract, some of the impacts from these other activities.
2.7 The role and importance of natural weathering processes
Natural weathering processes exert a marked influence on soil formation and also on the types and quantities of
materials that enter aquatic systems from the surrounding landscape. Whilst climatic features as well as the parent
rock material, degree of vegetation cover and prevailing landuse, control the specific type and extent of weathering
processes that are active within a given area, weathering zones can be delineated on the basis of the degree to
which chemical or mechanical weathering processes are dominant. A useful index of weathering processes is
provided by a simple relationship between annual precipitation and evaporation (Weinert, 1964). This
dimensionless index, the "Weinert N" value, is calculated as:
12 x EJ
N = ────
PA
Where: EJ = Mean evaporation (in millimetres) for the month of January, and
PA = Mean annual precipitation (in millimetres).
Where specific monthly evaporation data are scarce, taking 10% of the total annual evaporation can approximate
January evaporation values. The specific types of weathering processes that predominate in regions with different
Weinert N values are shown in Table 2.3.
Table 2.3: Weathering characteristics associated with different Weinert N values.
Weinert Index Value Weathering Characteristics 0.00 – 2.00 Predominantly chemical weathering
2.01 – 4.00 (Wet) Seasonal dominance of chemical weathering
4.01 – 5.00 Approximately equal chemical and physical weathering
> 5.00 Dominance of physical weathering processes
lxii
Mechanical weathering processes dominate in arid areas with low rainfall and high evaporation rates, causing the
fragmentation of primary minerals such as quartz into smaller fragments and soils are predominantly sandy.
Conversely, in warm, humid and wet landscapes chemical weathering processes dominate soil formation, giving
rise to extensive deposits of secondary clay minerals. In zones where intermediate rainfall and evaporation values
are recorded, both mechanical and chemical weathering processes are equally important. Mechanical weathering
processes increase in importance as the rainfall declines and chemical weathering processes decrease in
importance as determinants of soil formation.
Mines located in areas where Weinert N values are less than 2.00 usually show distinctive contributions to water
quality and often require concerted management attention to prevent, minimize and/or remediate problems
related to “water pollution”. Conversely, mines located in areas where Weinert N values are substantially
greater than 5.00 usually show little or no contribution to local water quality and often allow mine management
considerable leeway in their “pollution control” efforts.
2.8 Legislative requirements for the control and management of impacts attributable to mining operations in southern Africa
In southern Africa, the respective Constitutions of the different SADC countries provide the foundation for legislation to control environmental impacts by promoting the rights of all people to a "safe and healthy environment". Despite minor differences between the legislation in the different countries, the basic intentions are very similar. Currently, most countries still have several old and new sets of interlocking legislation that exert control over mining and related activities and their impacts on the environment. Many of these acts are now in the process of revision to reflect more clearly the principles embodied in their respective constitutions and the tenets of international treaties designed to minimize environmental degradation. Inevitably, the changes in existing legislative frameworks in each country are complicated by the fact that some pieces of legislation can be interpreted in ways which appear to conflict with the terms and conditions set out in other legislation. Similarly, there are situations where legislative requirements in neighbouring countries differ from each other, thereby complicating the process of managing impacts on shared resources (e.g. shared river basins). Nevertheless, despite these differences, the legislative framework in each country seeks to promote the economic benefits to be gained from mining whilst reducing to a minimum the risks to human safety and the adverse consequences of environmental degradation. From an environmental perspective, most attention is focused on minimization of waste products and associated sources of pollution or contamination, and the rehabilitation of land surfaces that have previously been mined or used for the disposal of waste products (Wells et al., 1996; Gurney et al., 1996; Chenje, 2000; SADC-MSCU, 2001). Clearly, this attention to minimizing the adverse consequences of mining activities is a welcome development. In this context, it is also clear that many older mining operations started at a time when there was little or no explicit concern for the surrounding environment. Disposal of wastes was carried out in a manner designed solely to minimize costs, rather than to prevent pollution or facilitate rehabilitation. In many instances, old mines were simply abandoned and no attempt was required (or made) to rehabilitate the surface workings when the economic life of the ore body was exhausted. This situation now places enormous responsibility for rehabilitation on the respective governments, and is accompanied by a considerable economic burden (Fuggle & Rabie, 1996; Chenje, 2000). In some SADC countries, however, certain pieces of legislation that cover air and water pollution are poorly enforced as a result of both weak institutional arrangements and inadequate or incomplete provisions in legislation. Chenje (2000) cites Zimbabwe’s Atmospheric Pollution Act of 1971 as being a case in point, where industries that existed prior to promulgation of the legislation are allowed to continue using outdated equipment and need not upgrade their facilities. In contrast, Zambia’s Air Emission Control Regulation Statutory Instrument No. 141 of 1996 is stronger and sets out emission limits for sulphur dioxide, dust and heavy metals, but ignores the problems of greenhouse gases
lxiii
(Chenje, 2000). Despite the recent improvements in atmospheric pollution legislation in many SADC countries, inadequate monitoring coupled to low penalties enable many companies to pay pollution fines and “continue operating as usual” (Chenje, 2000). In South Africa, recent enabling legislation, particularly the Water Act and the Environmental Management Act provide specific guidelines that exert control on the ways in which mining and quarrying activities may be conducted (Ashton, 1999). In many instances, the provisions of these two Acts complement and enhance components of the existing (and soon to be upgraded) Mines and Minerals Act that are designed to control mining activities. In terms of current legislation in virtually all SADC countries, an environmental impact assessment (EIA) must be carried out before a mining licence can be granted for all new terrestrial and offshore mining activities. As part of this process, mining companies are legally required to consult widely with the affected public during the EIA and also to ensure that all the necessary licences and permissions will be forthcoming from the relevant local, provincial or national authorities (Weaver & Caldwell, 1999). The South African situation is similar to that in most countries with established EIA legislation where virtually all mining activities are classified as "likely to significantly affect the environment" and require that a full-scale EIA be conducted before taking the decision to proceed (Donnelly et al., 1999). In some countries, this requirement relates to the size of a proposed mining or quarrying operation. In Canada, for example, a full EIA is required for all proposed construction, expansion, decommissioning or abandonment of any mining project with a "footprint" greater than 25 hectares or where the production capacity exceeds specific limits (Weaver & Caldwell, 1999). Whilst the "size limit" requirement for an EIA may be a useful and pragmatic approach, considerable caution is required in those cases where several "small" operations may be located in close proximity to one another and whose combined impacts may be very large. In such situations, it is useful to adopt a more "strategic" approach to the problem and thereby ensure that appropriate attention is paid to the likely cumulative impacts of several small operations (Buckley, 1998). This process will also help to eliminate instances of poor or inadequate planning, and reduce the potential risks associated with future rehabilitation costs. A case in point relates to the complicated situation which surrounds many small-scale, often "illegal" mining operations, particularly the situation of so-called "artisan miners" who are a common feature of the mining scene in several parts of southern Africa. In such cases, each individual operation is not only well below the minimum size limit that would require an EIA, but many of the operations are not registered or the claims are worked illegally. Furthermore, many of the so-called beneficiation techniques used not only pose potential environmental risks, but they also have the potential to cause significant human health problems (e.g. the use of mercury to concentrate gold). Perhaps more important than the absence of formal government control, however, is the fact that there appears to be very little effort made to ensure that these operations cause the least possible risk to human health and minimize the potential for environmental damage (Ashton, 1999). One of the most important objectives that the SADC countries should seek to attain in the short-term is a harmonization and rationalization of their respective pieces of legislation that relate to mining activities and to the control of environmental impacts, particularly those that relate to water. This would help to eliminate inconsistencies between countries and would also help to enhance a sense of shared or common purpose between the states. A partial listing of the relevant legislation for the different SADC states is given in Table 2.4. In recent years, SADC member states have succeeded in drawing up and ratifying several treaties and protocols designed to improve inter-country relations and complement the approaches adopted in each country. A notable example in this regard is the SADC Protocol on Shared Water Course Systems that seeks to harmonize relations between states in terms of their use and management of shared river basins and rivers in the region. The Mineral Resources Centre at the University of Zimbabwe have drawn up a comprehensive document that describes the history of mining in Zimbabwe, as well as the policy and statutory framework that governs mining and mineral processing, water resource management, environmental conservation and impacts on the environment. This document has been reproduced in full in Section 2.9 of this report and can serve as an example that should be emulated for each of the SADC countries. This would allow a comprehensive overview to be made of all policies and legislation related to mining impacts on the environment and would help harmonization between countries. Table 2.4: Partial listing of relevant legislation relating to mining activities and the control of environmental impacts in some of the SADC states. Country Sector / Area Laws or Regulations Angola Water Resources and • Decree of 1 December 1992

lxiv
Pollution Fisheries and Wildlife Land and Water Resources
• Decree Law No. 39193 of 1953 • Decree Law No. 40040 of 1955 • Decree Law No. 46186 of 1965 • Legislative Edict No. 3574 of 1965
Botswana Water Resources Environment Atmosphere Heath Mines, Quarries, Works
• Water Act, 1968 • Boat Regulations • Declaration of Infested Waters • National Conservation Strategy • Atmospheric Pollution (Prevention) Act,
No. 18 of 1971 • Declaration of Controlled Areas Order, No
109 of 1979 • Factories Act • Sanitary Accommodation Regulations • Public Health Act • Mines, Quarries, Works and Machinery Act
Lesotho Water • Water Resources Act No. 22 of 1978 Malawi Environmental Management
Land Use Management Fisheries Water
• Environmental Management Act, No. 23 of 1996
• National Parks and Wildlife Act, 1992 • Land Act of 1965 • Fisheries Management & Conservation Act
of 1997 • Water Resources Act of 1969, and its
Amendment of 1978 Mozambique Land
Water Resources Mining Health / Pollution Environment
• Land Act, 1979 • Water Act No. 16 of 1991 • Mining Act, 1986 • Pesticides Regulations, 1987 • General Environment Act, No. 20 of 1997
Namibia Land / Water Mines and Minerals Pollution Health
• Water Act No. 54 of 1956 • Water Amendment Act, No. 22 of 1985 • Minerals (Prospecting & Mining) Act, 1992 • Soil Conservation Act, 1969 • Agriculture (Commercial) Land Reform
Act, 1995 • Mines Regulations of 1993 • Prospecting and Mining Act, No. 33 of 1992 • Agricultural Pests Act, 1973 • Atmospheric Pollution Prevention
Ordinance, No. 11 of 1976 • Hazardous Substances Ordinance, Act
No. 14 of 1974 • Machinery and Occupational Safety Act,
No. 11 of 1992 • Labour Act of 1992 • Public Health Act, No. 36 of 1919
South Africa Environment Water Health Minerals and Mining Miners Health
• Environment Conservation Act No. 73 of 1989
• National Environmental Management Act (NEMA) No. 107 of 1998
• Environmental Laws Rationalization Act, No. 51 of 1997
• National Water Act, No. 36 of 1998 • Water Services Act, No. 108 of 1997 • Atmospheric Pollution Prevention Act, No
45 of 1965 • Occupational Health and Safety Act, No.
85 of 1993 • National Health Act, No. 63 of 1977 • Labour Relations Act No. 66 of 1995 • Minerals Act No. 50 of 1991 • Mine Health and Safety Act No. 29 of 1996 • Mines and Works Act No. 27 of 1956 • Mineral and Energy laws Amendment Act,
No. 47 of 1994

lxv
• Nuclear Energy Act, No. 46 of 1999 Swaziland Water
Environment
• Water Act of 1967 • Protection of Fresh Water Fish Act, 1938 • Swaziland Environment Authority Act, No.
15 of 1992 Tanzania Fisheries
Water Resources Mining Environment Petroleum Health
• Fisheries Act, 1970 • Water Utilization (Control & Regulation)
Act, 1974 and Amendment, 1981 • Mining Act, 1979 • National Environment Management Act,
1983 • Petroleum Act, 1980 • Public Health Ordinance CAP 336 • Protection from Radiation Act, 1983
Zambia Water Resources Health Land / Water Resources and Environment Mines and Minerals
• Water Act, Chapter 312 • Water Pollution (Effluent and Wastewater)
Regulations, 1993 • Zambezi River Authority Act, 1986 • Public Health Act, 1930 • Factories Act, 1967 • Action for Smoke Damage Act, 1959 • Air Pollution Control Regulations, 1996 • Environmental Protection and Pollution
Control Act No. 12 of 1990 • Environmental Protection Control
(Environmental Impact Assessment) Regulations, 1997
• Natural Resources Conservation Act, 1970 • Petroleum Act, 1985 • Explosives Act, 1974 • Mines and Minerals Act, 1995 • Mining (Dumps) Regulations, Act 31 of
1995 • Mines and Minerals (Environmental)
Regulations, 1997 • Mines and Minerals (Environmental
Protection Fund), 1998 Zimbabwe Natural Resources
Mines Pollution / Health / Atmosphere Land / Water Resources
• Natural Resources Act, 1996 • Parks and Wildlife Act, 1998 • Mines and Minerals Act, 1996 • Explosives Act, 1972 • Atmospheric Pollution Prevention Act, 1971 • Water Act of 1977 and its Amendment of
1998 • Hazardous Substances and Articles Act,
1961 2.9 Legal and policy frameworks that influence or control mining and minerals
processing activities in Zimbabwe
2.9.1 Introduction
Zimbabwe has a long history of mining, dating from at least the twelfth century. The early twentieth century
colonial economy was primarily a settler mining economy. This dated back to the occupation of the country in the
late nineteenth century. Indeed, Cecil Rhodes’ expectations of discovering a “Second Witwatersrand” in
Mashonaland were a major motivating factor behind the occupation. This attitude towards mining has translated

lxvi
into a bias in national legislation in favour of mining that is still current today. Mines and minerals legislation tends
to override all other legislation, including parts of the recent Water Act1.
The mining industry is a major water user: both in terms of consumption, and in terms of disposal of wastewater.
The management of water quality in mining operations relates mainly to two areas: disposal of wastewater, and
contamination of water from mining operations (Love & Hallbauer, 1999). Mines are also required to comply
with a variety of environmental impact assessment protocols and guidelines.
There are a number of other Acts with the power to regulate mining activities in Zimbabwe. Although
Zimbabwean water and environmental legislation has been revised in the last few years, the legislation remains
somewhat fragmented. Indeed, the existing legal basis for environmental protection is inadequate to address
conventional air and water pollution issues, let alone more recent environmental concerns such as hazardous
waste, emission of "greenhouse" gases, leaking underground storage tanks, or environmental emergency
"preparedness" plans. One reason for this inadequacy is the fact that amendments to the original statutes,
adopted from British laws in the 1960s and 1970s, have not kept pace with scientific advances or regulatory
improvements.
In recent years an increasing number of developers, trans-national firms and international donors have undertaken
environmental impact assessments (EIAs) for large and environmentally significant projects in Zimbabwe as global
awareness of the importance of environmental protection has accelerated. Furthermore, following recent revisions
of the Mines and Minerals Act, new mining operations involving investments in excess of US$ 100 Million, are now
required to submit an environmental report with their application for a special mining lease. In this regard, the
mining industry has made significant advances in environmental management of mining operations, and the
industry has implemented a number of initiatives to increase awareness of environmental matters.
In recognition of the shortcomings and gaps in its environmental laws and regulations, in 1992, the Ministry of
Environment and Tourism, through the Department of Natural Resources, initiated a programme to upgrade the
existing legislation. The programme intends to develop new laws, where needed, and integrate the nation's
overall approach to environmental protection. A key component of this effort is to develop regulations and
procedures to guide the preparation of EIAs for all environmentally significant projects undertaken in Zimbabwe.
In 1995 the Ministry published an "Interim EIA Policy" and guidelines for the preparation of EIAs.
The following discussion revolves around the legislation and how it regulates mining with respect to the
environment. It is not meant to be an exhaustive description of each Act. Tables 2.5 and 2.6 list the current
legislation, together with its controlling Ministry, which has a bearing on the issue of mining impacts of water
resources in Zimbabwe, and the series of activities that are subject to such legislation.
Table 2.5: Summary of relevant legislation in Zimbabwe.
Legislation Type CAP. Date Ministry Environmental Impact
Assessment Policy
Policy 1997 Environment and
Tourism
1 Section 5 of Act 31 of 1998

lxvii
Draft Environmental
Management Bill
Draft Bill 1998 Environment and
Tourism
Mines and Minerals Act Act 21:05 1996 Mines and Energy
Natural Resources Act Act 20:13 1996 Environment and
Tourism
The Parks and Wildlife Act Act 20:14 1998 Environment and
Tourism
Forest Act Act 19:05 1996 Environment and
Tourism
Explosives Act Act 307 1972 Mines and Energy
Communal Land Forest Produce
Act
Act 20 of
87
1987 Environment and
Tourism
Water Act Act 20:24 1998 Rural Resources and
Water Development
Public Health Act Act 15:09 1996 Health and Child Welfare
Hazardous Substances and
Articles Act
Act 322 1961 Health and Child Welfare
Table 2.6: Activities and relevant legislation in Zimbabwe.
Activity Responsible Authority Relevant Act Prospecting in protected
areas
Parks and Wildlife Board Parks and Wildlife Act
Environmental impact
assessment
Ministry of Mines and Energy Mines and Minerals Act
Allocation of water to mine Ministry of Mines and Energy Mines and Minerals Act
Water extraction Zimbabwe National Water
Authority (ZINWA)
Water Act
Health of workforce Ministry of Mines and Energy Mining (Health and Sanitation)
Regulations
Use of timber on private or
state land
Mining Timber Permit Board Forest Act
Manufacture, storage and use
of toxic material
Ministry of Health and Child
Welfare
Hazardous Substances Act
Manufacture, storage and use
of explosives
Ministry of Mines and Energy Explosives Act
Waste disposal into water;
disposal of wastewater
ZINWA Water (Waste and Effluent
Disposal) Regulations
Pollution of water Ministry of Rural Resources and Water (Waste and Effluent

lxviii
Water Development Disposal) Regulations
Rehabilitation and closure of
mine
Ministry of Mines and Energy Mines and Minerals Act
Alluvial mining Rural District Councils Mining (Alluvial Gold) (Public
Streams) Regulations
Consultation on water matters ZINWA National Water Authority Act
2.9.2 Mines and minerals legislation and policy
The Mines and Minerals Act was promulgated in 1961. Subsidiary legislation issued under the Mines and
Minerals Act includes General Regulations, Management and Safety Regulations and Alluvial Gold Regulations.
The relevance of these is discussed below.
2.9.2.1 Mines and Minerals Act (Chapter 21:05, Revised 1996)
The Mines and Minerals Act is continually under criticism from environmental groups, because it appears to
override all other legislation in Zimbabwe. Prospectors and miners are allowed access to almost all land within
the country, including National Parks (Section 26). However, there are some restrictions that include written
consent from the "owner" (Section 31). Prospectors and miners are allowed access to water (Section 29) and
timber (Section 36) with certain restrictions. Landowners may apply to the mining commissioner for a
reservation against the cutting of indigenous timber, but the miners may take up to 50% of the timber on the
land.
Section 159 (Special Mining Leases, 1994 Amendment) defines controls applicable to mines where the
investment will be either wholly or mainly in foreign currency and will exceed US$ 100 million, and where the
mines output is principally for export. An environmental impact report is required before these Special Mining
Leases are issued and requires the developers to adhere to the following.
(vii) a report on the anticipated impact of mining operations on the environment and any measures to be taken to assess, prevent or minimise such impact, including proposals for:
A. the prevention or treatment of pollution; and
B. the treatment and disposal of waste;
C. the protection of rivers and other sources of water; and
D. the reclamation and rehabilitation of land disturbed by mining operations; and
E. monitoring the effect of mining operations on the environment;
Perhaps the closest reference to any form of environmental control on standard mining leases mentioned in the
Mines and Minerals Act is seen in sections 234 to 241 (Appendix 2.1). In these sections a miner must submit a

lxix
siting of works plan for approval to the mining commissioner. This plan should also show rivers, hills and other
natural features. Section 236 allows for the lodging of objections within 21 days of their notification by the
mining commissioner. It should be noted that the miner may carry out certain works before the plan is
submitted. These works can include residential accommodation, roads and dumps.
There are several other sections within the Act that could be construed as rehabilitation regulations, but these
were largely developed with safety in mind (Table 2.7).
Table 2.7: Sections of the Mines And Minerals Act (1996) relevant to environmental protection in Zimbabwe. Section Comment
267 The miner may remove buildings and machinery from an abandoned, forfeited or
cancelled mining location.
269 The miner is required to fill in all shafts, open surface workings and excavations or
to deal with them otherwise to ensure the safety of people and livestock. This
should be done within 30 days of abandonment.
311 Timber on “Town Lands” cannot be cut without permission of the Mining
Commissioner.
312 Water from mining operations on “Town Lands” shall not pollute surface water with
mine water – but it must be disposed of in the nearest natural water channel.
370 Prospectors are required to fence or enclose the mouths of all shafts and other
open surface workings for the protection of people and livestock. He should
maintain these during the period that prospecting is continuing.
403 The minister can make regulations as deemed expedient regarding safety,
sanitation, housing and feeding of employees, welfare etc; amongst other
administrative matters.
The Act also recognises the powers of the Water Court, especially if it affects public water or irrigation projects.
2.9.2.2 Mining (Alluvial Gold) (Public Streams) Regulations, 1991 (SI 275/1991)
This statutory Instrument contains some environmental safeguards and is aimed at controlling the activities of
small scale panning locations. These include the distance of workings from the stream bank (3 metres), the
depth of unsupported workings (1.5 metres) and the use of machinery - which must be authorised by an
inspector of mines in consultation with the provincial natural resources officer.
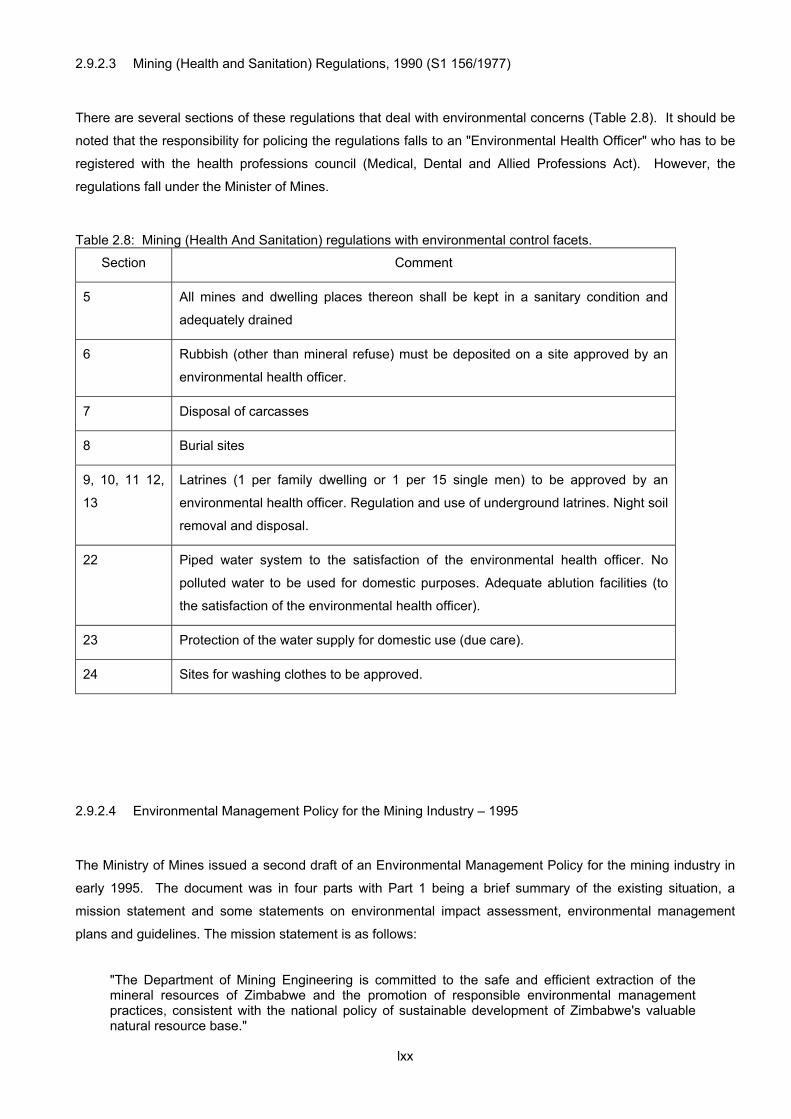
lxx
2.9.2.3 Mining (Health and Sanitation) Regulations, 1990 (S1 156/1977)
There are several sections of these regulations that deal with environmental concerns (Table 2.8). It should be
noted that the responsibility for policing the regulations falls to an "Environmental Health Officer" who has to be
registered with the health professions council (Medical, Dental and Allied Professions Act). However, the
regulations fall under the Minister of Mines.
Table 2.8: Mining (Health And Sanitation) regulations with environmental control facets.
Section Comment
5 All mines and dwelling places thereon shall be kept in a sanitary condition and
adequately drained
6 Rubbish (other than mineral refuse) must be deposited on a site approved by an
environmental health officer.
7 Disposal of carcasses
8 Burial sites
9, 10, 11 12,
13
Latrines (1 per family dwelling or 1 per 15 single men) to be approved by an
environmental health officer. Regulation and use of underground latrines. Night soil
removal and disposal.
22 Piped water system to the satisfaction of the environmental health officer. No
polluted water to be used for domestic purposes. Adequate ablution facilities (to
the satisfaction of the environmental health officer).
23 Protection of the water supply for domestic use (due care).
24 Sites for washing clothes to be approved.
2.9.2.4 Environmental Management Policy for the Mining Industry – 1995
The Ministry of Mines issued a second draft of an Environmental Management Policy for the mining industry in
early 1995. The document was in four parts with Part 1 being a brief summary of the existing situation, a
mission statement and some statements on environmental impact assessment, environmental management
plans and guidelines. The mission statement is as follows:
"The Department of Mining Engineering is committed to the safe and efficient extraction of the mineral resources of Zimbabwe and the promotion of responsible environmental management practices, consistent with the national policy of sustainable development of Zimbabwe's valuable natural resource base."

lxxi
The draft policy encourages developers to consult with the Department of Mining Engineering before conducting
an EIA. It also provides guidelines for the preparation of EIA reports on mining projects.
It is suggested that new small workings need only complete a brief "Statement of Environmental Effects" rather
than a full EIA. This statement should include a description of the project and a works plan. The possible
environmental hazards resulting from the mining operations and the mitigatory measures necessary for these
hazards should be identified2.
Annexure C of the document is the one in which environmental management guidelines for mining and
exploration in Zimbabwe are detailed. It covers tailings dams, waste rock dumps, shafts, open cast mines,
quarries, alluvial mining, processing plants and both mineral and oil/gas exploration (Appendix 2.2).
2.9.3 Water and environmental legislation and policy
2.9.3.1 Introduction
There are many aspects of water issues in mining, which are subject to legal controls and protections. The
concern about the pollution of water systems by mining was already being reflected in European legislation in
the middle of the last century, e.g. the UK 1861 Land Drainage Act and 1876 Rivers Pollution Prevention Act
(Fitzgerald 1902).
2.9.3.2 Water Act (20:24, No 31 of 1998)
The Water Act is to provide for the planning of the optimum development and utilisation of water resources. The
Act establishes Catchment Councils3, under the Zimbabwe National Water Authority (ZINWA), and confers
wide-ranging powers on them. Although this devolutionary reform process was designed to improve
stakeholder participation and to empower local water users, especially rural communities, it has been shown
that this is has not necessarily occurred. Problems include differential access to resources, the lack of a level
playing field, financial costs of consultation and the veto held by the government on most issues (Sithole, 2000).
In fact the Minister of Rural Resources and Water Development has extensive powers to override ZINWA and
the Catchment Councils, as well as to issue directives to them.
2 A major mine or quarry is defined as one in which more than 10 000 tons of ore or rock
are mined or milled or one in which a surface area of more than two hectares is disturbed each year.
3 Sections 20 - 22

lxxii
The Act, like its South African equivalent4, provides for national ownership of water and licenses for use of
water. However, unlike the South African law which vests ownership of water in the state, the Zimbabwean act
vests all ownership of water in the President5. Regulation and supervision of water use and issuing of water
permits is carried out by the Catchment Councils6.
Mining and mineral exploration operations retain rights granted to them by the Mines and Minerals Act with
respect to surface water for domestic and brick making purposes and to groundwater7. However, to abstract
water for purposes other than these, a mining operation must apply to the Mining Commissioner of the relevant
mining district for a permit8. The Mining Commissioner shall “transmit the application, together with a report
thereon by a government mining engineer, to the appropriate catchment council”9. This is presumably to
provide for expert recommendations on the mining operation’s needs. Records of the amount of water
abstracted must be maintained10. The abstraction of water in the absence of a permit is an offence punishable
by fine or imprisonment or both11.
The Act also addresses pollution of water. Many mines dispose of large quantities of wastewater: water from
processing, water in slimes and also groundwater pumped out of the mine (Love & Hallbauer, 1999). The Act
requires persons wishing to discharge waste to apply for a permit12. The Water (Waste and Effluent Disposal)
Regulations (SI 274/2000; Appendix 2.3) were promulgated to give effect to this provision, and to replace
regulations from the 1970s13. The 2000 regulations govern disposal of wastewater and disposal of waste into
water and fall under the jurisdiction of Pollution Control Unit (PCU) of the Zimbabwe National Water Authority
(ZINWA). These regulations require yearly permits for effluent and wastewater that is discharged or disposed of
into any surface water or groundwater14, excepting septic tanks, municipal dumps and agricultural application
of animal manure15. The PCU considers application for permits and may reject the application or award a
permit, specifying effluent standards16. An “environmental fee” is charged per Megalitre of liquid waste
disposed or for solid waste, and is increased for disposal of waste that constitutes a “high environmental
hazard”17.
Permit holders are required to notify the PCU and downstream water users of “any accidental disposal or
discharge of waste or effluent”18. What constitutes “accidental disposal or discharge” is not defined. However,
defining accidents or emergency incidents is very difficult: for example, the relevant South African legislation
4 National Water Act (Act No 36 of 1998), Republic of South Africa 5 Section 3 6 Sections 21 and 22 7 Section 5 8 Section 34(3) 9 Section 34(4) 10 Section 43 11 Section 118(1)(b) 12 Section 69 13 RGN 687/1977 14 Section 5(1) 15 Section 11(1) 16 Section 6 and 4th Schedule 17 Section 9(6) and (7) 18 Section 13

lxxiii
provides a definition but one which is extremely broad19. There are many occurrences in mining which could
apply, such as overflowing of discharge canals, flooding of tailings dams or settling ponds, overloading of
treatment works and the dumping of wastes (Love & Hallbauer, 1999). The Act also provides that pollution in
the absence of an appropriate permit is an offence that may be punishable by fine or imprisonment or both20.
The regulations also provide for sampling procedures21 and for public access to information on permits current,
applied for and rejected22. The attached schedules define river zones and the permissible levels of
contamination.
Alluvial mining or other mining operations that may affect the banks, bed or course of a river or stream of springs
or natural wetlands is subject to permission of the Catchment Council23. To carry out such activities without a
permit is an offence punishable by fine or imprisonment or both24.
The Minister of Rural Resources and Water Development may declare any area to be a water shortage area. In
these areas permits for the abstraction and use of underground water are required25.
2.9.3.3 Parks and Wildlife Act (20:14 – Revised 1996)
The Parks and Wildlife Act establishes a Parks and Wildlife Board and provides for the establishment of national
parks, botanical reserves, botanical gardens, sanctuaries, safari areas and recreational parks. It also makes
provision for the preservation, conservation, propagation, or control of wildlife, fish and plants of Zimbabwe and the
protection of her natural landscape and scenery. Permits are required for prospecting and mining within the Parks
and Wildlife Estate.
2.9.3.4 Forest Act (19:05 – Revised 1996)
The Forest Act establishes a commission for the administration, control and management of state forests as well
as a Mining Timber Permit Board. Other functions include the control of burning, regulation of trade of forest
produce and to provide for the conservation of timber resources. The Act has some regulations pertaining to the
use of timber by miners and prospectors that seems at odds with those stipulated in the Mines and Minerals Act.
Firstly no miner shall cut, injure or destroy any indigenous trees or timber from any State or private land unless
19 “Any incident or accident in which a substance (a) pollutes or has the potential to pollute a water resource; or (b) has a detrimental effect or is likely to have a detrimental effect on a water resource” Section 20(1) of the [South African] National Water Act (Act 36 of 1998) 20 Section 68 21 Section 8 22 Section 10 23 Section 46 24 Section 118(1)(g)

lxxiv
he/she is in possession of a permit issued by the Mining Timber Permit Board (Section 45). The Minister of Mines
and Energy may also require that certain measures be taken by the owner or occupier of private land to prevent
environmental damage resulting from tree felling or cutting methods (Section 56).
2.9.3.5 Natural Resources Act (20:13 – Revised 1996)
The Natural Resources Act provides for the conservation and improvement of natural resources both inside and
outside Communal Lands. It also allows for establishment of the Natural Resources Board, Intensive
Conservation Areas, and soil and water use restrictions. It does not provide legislative authority for the
establishment of a Natural Resources Ministry and Department to manage natural resources, control pollution or
carry out environmental assessments.
2.9.3.6 Hazardous Substances Act (Chapter 322 - 1972)
The Hazardous Substances and Articles Act assigns substances to one of three groups for regulation and control
and is administered by the Ministry of Health and Child Welfare. The Act can apply to any substance or mixture of
substances which may endanger the health of human beings, domestic or wild animals, birds or fishes as a result
of its toxic, corrosive, irritant, sensitory, inflammable or radio active nature.
2.9.3.7 Explosives Act (Chapter 307 - 1961)
The Explosives Act deals with the manufacture, purchase, possession, delivery, storage, use and conveyance of
explosives. Licences and/or permits are required for these activities. There are no sections within the regulations
or the Act that could be interpreted as being related to environmental protection.
2.9.3.8 Public Health Act (15:09 – Revised 1996)
The Public Health Act makes provisions to safeguard public health. In environmental terms it can prohibit or
regulate activities likely to pollute streams, which, in time, can become a nuisance or danger to health (Section 68).
In addition, nuisances are prohibited. Nuisance, as defined by the Act, covers a wide variety of health, safety and
hygiene aspects. The powers of this Act could be broad ranging if required.
25 Sections 61 - 66

lxxv
2.9.3.9 Zimbabwe Environmental Impact Assessment Policy, 1994
The Interim Policy issued by the Ministry of Environment and Tourism is based on seven principles that serve as
guidelines for decision-making on policy implementation. These principles are:
1). The EIA must enhance and not inhibit development, by contributing to environmental sustainability.
2). EIA is a means for project planning, and not just evaluation
3). Identifying means for managing project impacts is an essential component of the EIA Policy
4). The EIA Policy depends on the normal regulatory functions of permitting authorities to implement the EIA
results.
5). The EIA Policy involves the participation of all government agencies with a mandated interest in the
benefits and costs of a project.
6). The EIA Policy pays particular attention to the distribution of project costs and benefits
7). Public consultation is an essential part of EIA Policy26.
Compliance with the Policy is currently voluntary, but it is expected to be legislated soon. The Interim Policy is
administered by the Ministry of Environment and Tourism and applies to both private and public sector
developments. The document has a list of prescribed activities for which EIAs are required (Table 2.4). In addition
the Minister is empowered to prescribe other activities, which he/she feels may have significant environmental
impacts, or cause community disruption.
All submissions under the Interim Policy are made to the Minister, who will maintain a register of all activities being
appraised. Three levels of reports are possible27.
1) A Prospectus is a short (1 or 2 page) document informing the Minister that a prescribed activity is being
considered. Based on the prospectus the Minister has 21 days to decide if the second level of report - a
Preliminary EIA - is needed28.
2) The Preliminary EIA is a comprehensive initial assessment of the environmental impacts of a project.
Detailed Terms of Reference need to be approved by the Ministry, who may require that a joint scoping
exercise between the proponent and the Ministry be carried out before the Terms of Reference are
written. The Natural Resources Board, who may call in outside advisors, reviews the draft report. The
Ministry has 60 days in which to review the first draft and 30 days to review subsequent drafts. The final
document is either approved and the activity is allowed to proceed, subject to, if necessary, environmental
terms and conditions, or it is not granted and a detailed EIA is requested on the significant impacts29.
26 Section 3 27 Section 4 28 Section 4.1 29 Section 4.2
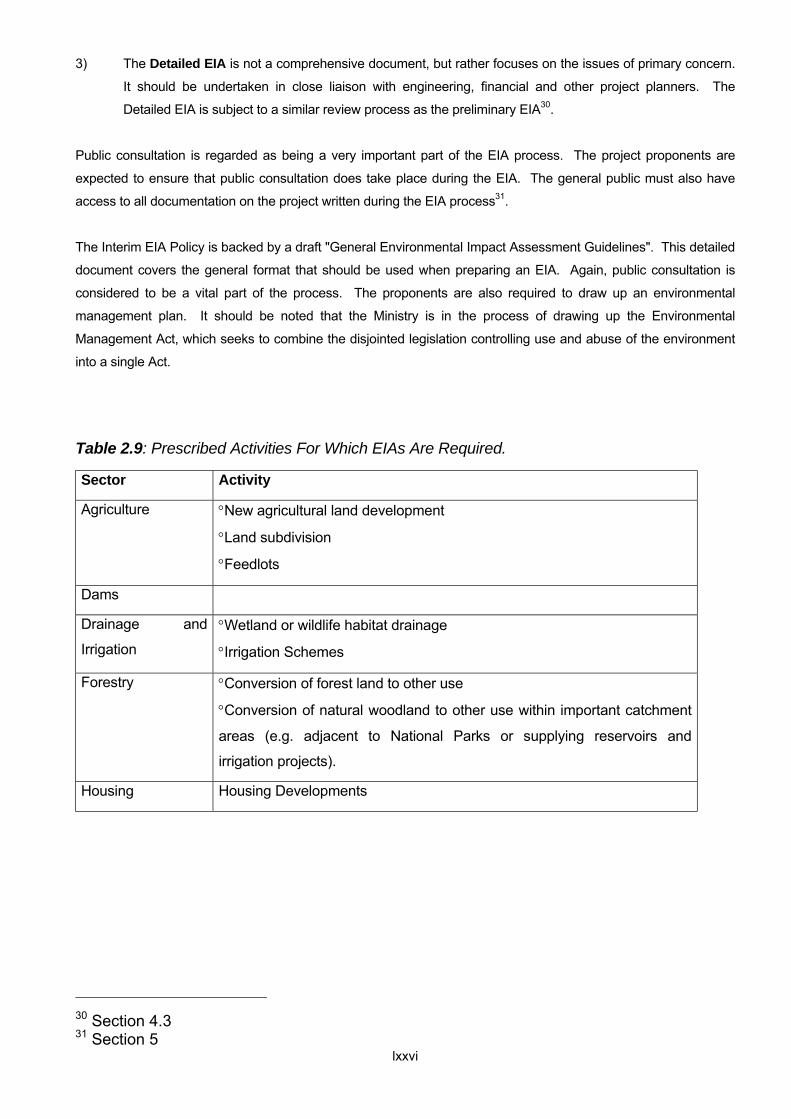
lxxvi
3) The Detailed EIA is not a comprehensive document, but rather focuses on the issues of primary concern.
It should be undertaken in close liaison with engineering, financial and other project planners. The
Detailed EIA is subject to a similar review process as the preliminary EIA30.
Public consultation is regarded as being a very important part of the EIA process. The project proponents are
expected to ensure that public consultation does take place during the EIA. The general public must also have
access to all documentation on the project written during the EIA process31.
The Interim EIA Policy is backed by a draft "General Environmental Impact Assessment Guidelines". This detailed
document covers the general format that should be used when preparing an EIA. Again, public consultation is
considered to be a vital part of the process. The proponents are also required to draw up an environmental
management plan. It should be noted that the Ministry is in the process of drawing up the Environmental
Management Act, which seeks to combine the disjointed legislation controlling use and abuse of the environment
into a single Act.
Table 2.9: Prescribed Activities For Which EIAs Are Required.
Sector Activity
Agriculture °New agricultural land development
°Land subdivision
°Feedlots
Dams
Drainage and
Irrigation °Wetland or wildlife habitat drainage
°Irrigation Schemes
Forestry °Conversion of forest land to other use
°Conversion of natural woodland to other use within important catchment
areas (e.g. adjacent to National Parks or supplying reservoirs and
irrigation projects).
Housing Housing Developments
30 Section 4.3 31 Section 5

lxxvii
Sector Activity
Industry °Chemical and Petrochemical plants °Lime plants
°Iron and Steel smelters and plants °Cement plants
°Smelters other than iron and steel °Tanneries
°Pulp and paper mills °Breweries
°Agro-industries
°Industries involving the use manufacture, handling, storage, transport or
disposal of hazardous or toxic materials
Infrastructure °New towns or townships °Highways
°Airports and airport facilities °New rail lines
°Industrial sites for medium and heavy industries
Mining and
Quarrying °Mineral prospecting and mining
°Ore processing and concentrating °Quarrying
Petroleum °Oil and gas exploration and development
°Oil and gas separation, processing, handling and storage
°Oil refineries °Pipelines
Power Generation
and Transmission °Thermal power stations °Hydro-power schemes
°High voltage transmission lines
Tourist, Resort and
Recreational
Development
°Resort facilities and hotels
°Marinas
°Safari operations
Waste Treatment
and Disposal °Toxic and hazardous waste, incineration plants, recovery plants,
wastewater treatment plants, landfill facilities and storage facilities.
°Municipal solid waste and sewage schemes
Water Supply °Groundwater development for industrial, agricultural or urban water
supplies.
°Water withdrawals from rivers or reservoirs
°Major pipelines or canals
°Cross-drainage water transfers
2.9.4 Chamber of Mines Environmental Management Guidelines, 1994
The Chamber of Mines prepared and released a set of Guidelines in response to developing
government environmental impact management policy (COM, 1994). It should be noted that this

lxxviii
predates the Zimbabwe Environmental Impact Assessment Policy, 1994. The Guidelines cover
rehabilitation32, effluent disposal33, re-vegetation and prevention of erosion34, river diversions35,
dumps and tailings dams36 and exploration activities37. However, the Guidelines are generally vague
and without detail. It is to be hoped that more detailed guidelines will be prepared by the Chamber
subsequent to the promulgation of proposed new environmental management legislation.
2.9.5 Concluding Remarks Much of the legislation governing environmental and water affairs applied to mining is still in its infancy, and
much remains to be done to work out how the many different laws and regulations interconnect and how the
spheres of activity and control of the various different government agencies interact. In the meantime, there is
little clarity on exactly where a mining operations legal responsibility towards water systems begins and ends.
There is no simple answer to what legally constitutes impact as such. However, the best guide is that provided
by the standards contained in the Water (Waste and Effluent Disposal) Regulations, see Appendix 2.3 and also
Table 2.10 below.
Table 2.10: Comparison of Various Standards. Values in ppm unless specified Parameter Maximum level
Zimbabwe South Africa
Aluminium * 0.15
Ammonia (NH3) 0.50 1.00
Arsenic (As) 0.05 0.01
Barium (Ba) 0.50 *
Biological Oxygen Demand 30.00 *
Boron (B) 1.00 *
Cadmium (Cd) 0.01 5.00
Chloride (Cl-) 250.00 100.00
Chlorine residual (free Chlorine) 0.10 *
Chromium (Cr (hex)) 0.05 0.50
Chromium total (Cr) 1.00 *
Cobalt (Co) * *
Chemical Oxygen Demand 50.00 *
Colour (TCU) 15.00 *
Conductivity (µS/cm) 1000.00 *
Copper (Cu) 1.00 1.00
32 Sections 2 – 4, 23, 24, 27, 28, 30, 32, 33 33 Sections 5 – 6, 35 34 Sections 11 - 13 35 Section 14 36 Sections 19 – 21, 29, 34 37 Sections 36 - 42

lxxix
Cyanides and related compounds (CN) 0.07 *
Free Cyanide (CN-) 0.07 *
Detergents 1.00 *
Faecal coliforms (No./100ml) 1000.00 0.00
Fluoride (F) 1.00 1.00
Grease & Oil 2.50 *
Helminth eggs (No/100ml) 1000.00 *
Iron (Fe) 1.00 0.10
Lead (Pb) 0.05 0.01
Manganese (Mn) 0.10 0.05
Mercury (Hg) 0.10 0.00
Nickel (Ni) 0.30 *
Nitrite Nitrogen (NO2) 3.00 6.00
Nitrogen total (N) 10.00 *
Oxygen absorbed 10.00 *
Phenolic compounds (phenol) 0.01 0.00
Phosphates Total (P) 0.50 *
Selenium (Se) 0.05 0.02
Sodium (Na) 200.00 100.00
Parameter Maximum level Zimbabwe South Africa
Sulphate (SO4) 250.00 200.00
Sulphide (S) 0.20 *
Total dissolved solids 500.00 450.00
Temperature deg. C 35.00 *
Total heavy metals 2.00 *
Total suspended solids 25.00 *
Turbidity (NTU) 5.00 1.00
Zinc (Zn) 0.50 3.00
Dissolved Oxygen % Saturation Minimum 60% *
pH (pH units) Range: 6 - 9 Range: 6 - 9
- * Means that no limit is specified
- Values in parts per million (ppm) unless specified
- Zimbabwean limits: “blue normal” limits specified by 4th Schedule of Water (Waste and Effluent Disposal)
Regulations
- South African limits: limits for domestic use (DWAF, 1996)
2.10 Principal approaches adopted to minimize and manage environmental impacts arising from mining operations

lxxx
Minimizing and managing the range of environmental impacts associated with mining and mineral processing
operations in the SADC countries poses several challenges to national, regional and local authorities, as well as
the companies responsible for operating the mines. Several different strategies are employed to meet these
challenges in each country and a brief overview is presented here.
In general terms, the SADC countries have responded to the threat of environmental degradation in their
respective countries by developing National Conservation Strategies (NCSs) and National Environmental Action
Plans (NEAPs), many of which have been decentralized to district level (e.g. Zambia and Zimbabwe; Chenje,
2000). These developments continue to be supported by international development and aid organizations such
as the United Nations Development Programme (UNDP), the World Conservation Union (IUCN) and the Global
Environment Facility (GEF).
Further programmes such as those directed towards cleaner production technologies and the Biodiversity
Strategic Action Plan (BSAP) deal with biodiversity and pollution prevention issues. These are implemented at
national and regional levels through support from both private sector and international development aid
agencies.
Every SADC country has an array of legislation, regulations and environmental standards that seek to regulate
developments that impact on the environment, monitor human impacts and help enforce environmental laws.
However, whilst these laws are in place, the regulation, monitoring and enforcement of these well-intentioned
pieces of legislation are hampered by a lack of resources, inadequate technical capacity and poor national and
regional co-ordination (Chenje, 2000).
Part of the reason for this situation is due to the fact that many government ministries in each country share
responsibility and accountability for different aspects of the environment, or activities that impact on the
environment, thereby complicating enforcement procedures and processes. As a result, companies that own or
operate mining undertakings are subject to several different pieces of legislation, each of which is often
administered by a different government department or authority. In the absence of proper co-ordination and
clear allocation of responsibility, it becomes difficult to develop and implement cost-effective management
strategies to minimize and control environmental impacts (Ashton, 1999; Chenje, 2000).
The uncertainties caused by inconsistent legislation and inadequate enforcement have inevitably led to
reservations in the minds of mine operators regarding the best approaches to prevent, minimize and remediate
the impacts that may be attributable to their mining operations. Growing international requirements for improved
environmental management systems in mining and mineral processing operations further complicates this
situation. Many marginal mines also face the prospect of closure as mineral commodity prices decline
worldwide; to these mines, environmental management and impact reduction activities represent an unwelcome
financial burden.
More recently, attention has been focussed on ensuring that environmental management actions are integrated
throughout the mine’s life cycle so that, on closure, the mine site is regarded as an “environmental asset”
(Smithen et al., 1997). A number of agencies worldwide promote this integrative approach to environmental
management in mining, for example, the Australian Environmental Protection Agency, the Canadian Department

lxxxi
of Natural Resources and the South African Department of Mineral and Energy Affairs (Australian Environmental
Protection Agency, 1995-1996; Weaver & Caldwell, 1999). The approach to integrating environmental
management into the full mine life cycle has also been adopted in South Africa (Freer, 1993).
Typical mining impact management and mitigation measures include the adherence to the Best Practice
Guidelines that have been developed for a range of mining activities (for example, water quality management),
investigating alternative locations for infrastructure and waste disposal sites, the adoption of different mining and
beneficiation technologies, the use of cleaner production technologies, recycling of water and specific materials,
pollution control measures, rehabilitation and landscaping, and the acquisition of additional property to
compensate for habitat loss (Ashton, 1999).
An important development in the improvement of environmental management practices in mining operations is
the growing awareness of, and acceptance of, formal management systems such as those developed by the
International Standards Organization (the ISO series of management guidelines). Increasing numbers of mining
operations are implementing the ISO 14000 series of environmental management plans, both in an attempt to
reduce and manage their environmental impacts, and to comply with growing international market requirements
for “certificates of environmental responsibility” by providers of goods and services. The ISO series of
guidelines is internationally accepted and provides mining companies with the necessary certification if an
environmental audit demonstrates that they comply with the conditions of their environmental management
plans.
In South Africa, mining environmental management practices are currently guided by the 1992 Aide Mémoire for the preparation of Environmental Management Programme Reports for Prospecting and Mining (Department of
Minerals and Energy, 1992) and enforced by both the Minerals Act, No. 50 of 1991, and the National Environmental Management Act, No. 107 of 1998. Recent developments aimed at improving environmental
management practices in the mining sector include the first draft of the new Minerals Development Bill, released for comment by the Department of Minerals and Energy in December 2000, while the Aide Mémoire is currently
being revised and expanded.
By the very nature of its activities, the mining sector will continue to drive environmental change, despite the
plethora of environmental guidelines, legislation and substantial impact mitigation and management measures
developed to address many of the adverse environmental affects. Perhaps the most important challenge facing
the mining sector today is the need to embrace the concept of sustainable development and, in doing so, to
improve public perceptions, particularly with regards to social and environmental issues of concern.
3. THE ZAMBEZI BASIN
In order to provide a suitable background for subsequent descriptions of the impacts of mining on water
resources in the Zambezi basin, this section starts with a brief overview of the catchment characteristics. This is
then followed by condensed descriptions of the information relating to mining activities and their impacts in each
sub-catchment.

lxxxii
3.1 Introduction
The Zambezi River is recognized as one of the largest and most important rivers in southern Africa and its basin
comprises portions of eight SADC states (Angola, Botswana, Malawi, Mozambique, Namibia, Tanzania, Zambia
and Zimbabwe; Table 3.1; Figure 1.1). The basin is located between 8 ° and 20 ° South latitude and between
16.5 ° and 36 ° East longitude, with a total area of some 1,281,800 km2, comprising approximately 23 % of the
total area of the basin states. The area contributed to the basin by each state varies between 1.9 % (Namibia)
and 42.1 % (Zambia), with four of the eights states (Angola, Mozambique Zambia and Zimbabwe) contributing a
combined total of 83.9 % of the entire basin area (Table 3.1).
Table 3.1: Area statistics for the eight SADC states comprising the Zambezi basin. [Data obtained from Chenje
(2000) and Ashton & Ramasar (2001)].
Country
Total Area of Country
(km2)
Country Area in Basin
(km2)
Proportion of Country Area
(%)
Proportion of Basin Area
(%) Angola 1,246,700 145,000 11.6 11.3
Botswana 600,370 34,000 5.7 2.7
Malawi 118,484 110,390 93.2 8.6
Mozambique 801,590 140,000 17.5 10.9
Namibia 825,418 24,000 2.9 1.9
Tanzania 945,087 37,000 3.9 2.9
Zambia 752,614 540,000 71.7 42.1
Zimbabwe 390,759 251,410 64.4 19.6
Totals: 5,680,843 1,281,800 22.6 100.0
The Zambezi River and its dense network of tributaries and associated ecosystems constitute one of southern
Africa’s most important natural resource systems. The basin is considered to be a regional centre of endemism
due to the extraordinary diversity of ecosystem components and the flora of the Zambezian unit is reported to
be one of the richest in Africa with over 6,000 species of flowering plants, as well as 650 species of birds and
over 200 species of mammals (Chenje, 2000). The basin also has some of the most important National Parks
in southern Africa, including Chobe in Botswana, Liwonde in Malawi, Gorongoza-Marromeu in Mozambique,
Kafue and Luangwa in Zambia and Hwange in Zimbabwe. In addition, several other protected areas and Game
Reserves are also located in the basin.
The Zambezi basin’s river systems provide most of the SADC region’s hydropower generation, support some of
the region’s poorest subsistence communities and represent a series of critical assets in terms of the region’s
tourism and recreational opportunities (Chenje, 2000).
lxxxiii
3.1.1 Geology, topography and soils
The Zambezi basin is located between the three Archaean Cratons: the Central African Craton to the northwest,
the Tanzanian Craton to the northeast and the Zimbabwe lobe of the Kalahari Craton to the south. The
Archaean Craton rocks comprise mainly granitic terrain, intruded by various Greenstone belts and dolerite
dykes and sills. Karoo System rocks overlie large areas of the central portion of the basin and these are
intruded by younger (Cretaceous) crystalline rocks, consisting predominantly of shales, sandstones and
conglomerates. Recent sedimentary deposits line most of the river valleys (SADC-MSCU, 1998; Chenje, 2000).
In the east, the southern extension of the east African Rift Valley, containing Lake Malawi, forms the eastern rim
of the basin. A second rifting structure, the Luangwa and Lunsemfwa Rift Valleys in Zambia lie almost parallel
to the Lake Malawi basin. The zones between the three Archaean Cratons are marked by several mobile belts
where considerable seismic activity has taken place and mineralization has occurred along fault and shear
planes (SADC-MSCU, 1998).
The crystalline rocks underlying the central region of the Zambezi basin have been formed through
metamorphosis of sedimentary deposits. These rocks have complex structures and contain most of the
mineralization recorded in the basin.
The topography of the Zambezi basin is very varied. The elevation of the catchment rim ranges from some
1,000 metres in the west (in Angola), to over 3,000 metres in the east at points along the eastern rim of the Lake
Malawi Rift Valley (e.g. the Zomba and Mulanje Mountains in Malawi), to sea level at the Zambezi mouth at
Chinde in Mozambique.
The terrain separating the Lake Malawi and Luangwa River rifts is also marked by several points of high
elevation, notably the Nyika and Viphya plateaux marking the border between Zambia and Malawi, as well as
the Livingstone Mountains along the northern border with Tanzania (Chenje, 2000). On its western flank, the
Luangwa Rift Valley is marked by the high Muchinga escarpment. The central portion of the Zambezi basin is
marked by undulating terrain with low hills and escarpments formed by outcrops of quartzites, granites, schists
and gneisses. In the north, the region of the Zambian Copperbelt, quartzitic sandstones outcrop at surface.
Many of these rocks are stained green by oxides and carbonates of copper (Mendelsohn, 1961).
In its upper reaches, the Zambezi River flows along a relatively broad, moderate-gradient valley, until reaching
the Victoria Falls. At this point, the river has incised through some 60 metres of Karoo Supergroup basalts and
flows in a deep, narrow gorge until reaching Lake Kariba. The river gradient in these middle reaches is
relatively low, and the river flows within a deep valley flanked on the Zambian and Zimbabwean banks by steep
terrain. At Cahora Bassa, the river gradient steepens slightly, flowing through a second set of narrow gorges
before emerging into the lower reaches within a broad shallow valley. Downstream of the town of Tete in
Mozambique, the Zambezi River meanders along a broad, flat-bottomed valley and is joined by the Shire River
from the north before reaching the delta at the coast. Features of the Zambezi delta (increased salinity, tidal
movements) are recognizable some 120 kilometres inland from the coast, and the riverbanks are marked by
noticeable flood levees along most of its length (Chenje, 2000).

lxxxiv
Soil formations across the Zambezi basin reflect the influence of parent rock material, climatic features and
biological activity. The dominant soil types in the basin are acidic, leached out tropical soils of low fertility known
as tropical red soils (ferrasols) that are derived from geologically old or ancient rock types.
More fertile soils are located in areas where younger geological strata form the underlying parent rock or where
humic materials are found. In general, the average fertility of the basin soils is considered to be low (Chenje,
2000). However, several areas of high quality vertisols (such as the type known as “black cotton soils”) are
found in the basin. These form important areas of agricultural activity wherever sufficient water is available and
appropriate fertilizer added.
Deep layers of wind-blown Kalahari sands cover large areas of the southwestern, western, and northwestern
portion of the Zambezi basin. Whilst agricultural production is severely limited in these areas and small-scale
subsistence agriculture seems the only option, these areas are often well timbered with economically important
hardwoods.
The valley-bottom soils of the middle Zambezi region are generally alluvial or colluvial in origin and support
extensive agriculture. This contrasts with those soils on slopes and river valleys immediately to the south and
north of Lakes Kariba and Cahora Bassa; these are fragile, shallow, stony soils with little agricultural potential.
The soils of the lower Zambezi basin are variable and predominantly sandy of sandy loams, overlying
weathered red ferralitic soils, and are considered to be amongst the most fertile in the basin. In the Malawi
sector of the basin, (the Lake Malawi and Shire River drainage system), the soils are deep sandy loams and
extremely fertile (Chenje, 2000).
Large areas of vertisols occur on the floodplains of the Kafue Flats and are usually associated with underlying
basalt and mudstone or shale formations. Similar soils are found on the Zambezi floodplain in Barotseland.
Hydromorphic soils with a high clay content, blocky nature and marked propensity to swell and shrink with
wetting and drying are found in areas subject to seasonal waterlogging. These are the characteristic “dambo
soils” of Angola, Zambia, Malawi, and parts of Zimbabwe. During the rainy season, the water table is located at
or close to the soil surface and these soils are intensively used for subsistence agriculture throughout the basin.
Small areas of dispersive sodic soils are found in areas where the parent rocks have a high sodium content and
are subject to intensive mechanical weathering.
3.1.2 Climatic features
Because of its geographic position, the climate of Zambezi basin is influenced by prevailing wind systems,
including tropical cyclones from the Indian Ocean. One of the most important rain-bearing systems is the Inter-
Tropical Convergence Zone (ITCZ) that moves seasonally along a north-south axis. In the southern portion of
the basin, south-easterly wind systems bring rainfalls from the Indian Ocean (Chenje, 2000).

lxxxv
Air temperatures across the Zambezi basin show a marked seasonal cycle, with hottest temperatures recorded
during the early Austral Summer months and lowest temperatures during the cool, dry winter months. Rainfalls
are also highly seasonal, falling predominantly as intense convective thunderstorms during the warmer summer
months (Chenje, 2000). Rainfalls vary from as little as 450 mm per annum in parts of the lower Zambezi valley
to over 2,000 mm per annum on the Mulanje Plateau and the Livingstone Mountains to the north of Malawi. The
“average” position of the ITCZ is located across the central and northern portions of Zambia; these areas
regularly receive rainfalls in excess of 1,500 mm each year. A sketch map showing the distribution of mean
annual rainfall over the Zambezi basin is shown in Figure 3.1. This figure also shows the main tributaries of the
Zambezi.
Evaporation rates across the Zambezi basin are both high and variable, ranging from some 2.4 metres per
annum in the south-western areas of Botswana, Namibia and Zimbabwe, to some 1.65 metres in the cooler,
mountainous regions to the north of Lake Malawi. In view of these evaporation rates, and the quantity of rainfall
received each year, several areas of the Zambezi show clear evidence of the dominance of physical weathering
processes (Weinert N values greater than 5.0). These areas are located in the southwestern portion of the
basin and along the middle Zambezi valley. Virtually all of the rest of the Zambezi basin is subject to chemical
weathering processes, either seasonally (Weinert N values below 4.0) or continually (Weinert N values below
2.0) (Weinert, 1964).
3.1.3 Population and land use patterns
The total population of the Zambezi basin is approximately 30.8 Million, with Malawi, Mozambique, Zambia and
Zimbabwe having the highest proportion of the basin population (Table 3.2). The Zambezi basin covers over
half of the area of Malawi, Zambia and Zimbabwe, containing the breadbasket districts of these three countries,
most of the largest cities and towns and most of the largest mines. As such, the basin includes the economic
heartland of these three countries.
All Zambezi basin states have skewed population distributions, and experience large-scale migration from rural
areas to urban settlements. In addition to this pattern of urbanization, several countries (especially Malawi and
Zambia) also house several million refugees who have escaped from various civil wars in Angola, Burundi,
Democratic Republic of Congo, Mozambique and Rwanda. These unfortunate people place a heavy additional
burden on the economies and fragile natural resources available in these two countries.

lxxxvi
Table 3.2: Population statistics for the eight SADC states comprising the Zambezi basin. [Data obtained from
Chenje (2000) and Ashton & Ramasar (2001)].
Country
Total Population of Country (Millions)
Country Population
in Basin (Millions)
Proportion of Country
Population (%)
Proportion of Basin
Population (%)
Angola 12.903 0.477 3.7 1.5
Botswana 1.639 0.013 0.8 0.04
Malawi 10.778 9.280 86.1 30.1
Mozambique 19.980 3.836 19.2 12.4
Namibia 1.739 0.050 2.9 0.2
Tanzania 33.744 1.282 3.8 4.2
Zambia 9.191 6.452 70.2 20.9
Zimbabwe 13.109 9.452 72.1 30.6
Totals: 103.083 30.842 29.9 100.0
Land is a critically important resource throughout the Zambezi basin upon which the livelihoods of residents and
the national economies of all basin states depend (Chenje, 2000). However, the specific types of land use that
are practiced are controlled by climatic factors, water availability and, importantly, by land tenure arrangements.
A large proportion of the land in all the Zambezi basin states is under communal or customary forms of tenure,
and land ownership is considered to be one of the major constraints to proper land use and conservation
(Chenje, 2000).
Overcrowding and insecure ownership in the smaller communal farming areas is a primary source of land
degradation in the basin. This feature is a critically important driver of poverty within the Zambezi basin and is
associated closely with declining indices of per capita agricultural production (Dalal-Clayton, 1997; Chenje,
2000).
Within the Zambezi basin, some 15.4 % of the total land surface is under some form of formal (commercial
irrigated and rain-fed, as well as small-scale) agriculture, whilst approximately 71 % is “open land” (usually
savannah, grassland or woodland) that is subjected to chitemene use (shifting agriculture). A further 5.6 % of
the basin is comprised of different forest types, whilst a total of some 7.7% is made up of river, lakes, marshes,
swamps or other forms of wetlands, and constructed reservoirs such as lakes Kariba and Cahora Bassa (Pallett,
1997; Chenje, 2000).
In many parts of the basin, progressive urbanization and the development of peripheral “informal” settlements
has been accompanied by the removal of large areas of natural vegetation for cultivation as well as for charcoal
lxxxvii
or fuelwood production. Similar patterns are also associated with the development of mining operations and
satellite towns in remote regions of the basin (Chenje, 2000).
3.1.4 Hydrological characteristics, water availability and patterns of water use
The quantity and timing of rainfall received in the Zambezi basin controls the quantity, timing and duration of
flows in the different tributary rivers. The uneven distribution of rainfall in the basin is reflected in the very
uneven distribution of water resources in the basin states. In turn, these influence the types of economic
activities undertaken by the residents in each country. The uneven distribution of water across the basin has
led to tensions and occasional disputes between some of the basin states regarding what can be constituted as
a “fair and equitable share” of the available water resources (Ashton, 2000).
The Zambezi and its larger tributaries are all perennial with seasonal cyclical patterns of high and low flows.
The Luangwa River in Zambia shows a very marked seasonality, and in dry years, flows cease altogether. The
western and southwestern parts of the basin that receive the lowest rainfalls have mainly seasonal or episodic
rivers that have no surface flow during the dry winter months (Chenje, 2000).
The available information on flows in the Zambezi River show the presence of a distinct long-term cycle, with a
period estimated at some 70-80 years. At Victoria Falls, flow measurements show that high flows average
some 3,500 Million m3/second, whilst low flows are some 60% below this level. In recent years (1985-1999),
however, dry season flows at Victoria Falls have been exceptionally low and parts of the Victoria Falls have
dried out completely for periods of several weeks.
The demand for water in the Zambezi basin is both high and unevenly spread. In particular, water demands by
industry, mining and the agricultural sector account for over 75% of all water used. Coupled with high
evaporation losses from Lakes Kariba and Cahora Bassa, flows in the lower reaches of the Zambezi River are
usually relatively small, unless they have been “boosted” by the arrival of a tropical cyclone (e.g. the cyclone
that arrived in 2000 and flooded large areas of Mozambique).
Flows in the lower Shire River are fed by outflows from Lake Malawi. Recent declines in the level of Lake
Malawi have resulted in significantly decreased outflows and, as a result, the Shire River has contributed
relatively little water to flows in the lower Zambezi River.
Large areas of important wetlands are found in several areas of the Zambezi basin (Timberlake, 1998). These
wetlands absorb and attenuate flows from upstream catchment areas, releasing this “trapped” water slowly over
a period of several months and maintaining flows during the dry winter months. The most important wetland
areas in the Zambezi basin are the Zambezi Floodplains in Barotseland, the Chobe-Linyanti Swamps in
northeastern Namibia and Botswana, the Busanga Swamps on the Lunga River (a tributary of the Kafue River),
and the Lukanga Swamps and the Kafue Floodplain on the Kafue River. Smaller wetland areas are located on
the lower reaches of the Luangwa River, as well as the Elephant Marsh near the town of Chiromo on the lower
Shire River in Malawi and Mozambique (Timberlake, 1998).

lxxxviii
The growing water shortages in Botswana and Zimbabwe have prompted several investigations of the feasibility
of transferring water from the Zambezi River to urban demand centres in these countries. South Africa (not a
Zambezi basin state) has also considered the feasibility of entering into an agreement with the Zambezi basin
states to withdraw water from the Zambezi and transfer it via pipeline to the Witwatersrand in South Africa
(Ashton, 2000). Whilst none of these water transfers have taken place, they do indicate the growing tension in
southern Africa around looming water shortages driven by population growth and development. The picture is
made somewhat more uncertain by the very real possibility that global climate changes will also have an
adverse effect on water availability in southern Africa (Ashton, 2000).
Throughout the length of the Zambezi River, water quality is generally very good and the water is entirely fit for
all designated uses. However, several communities continue to discharge untreated or partially treated
domestic effluent into the river (e.g. the towns of Livingstone in Zambia and Victoria Falls in Zimbabwe). Whilst
sufficient dilution remains and the river flows are turbulent, this practice is unlikely to have long-term or large-
scale detrimental effects. However, as effluent quantities increase and river flows decline, whilst demands for
water increase, it is inevitable that water quality problems will occur. This problem is likely to become more
acute further downstream, where several more towns (e.g. Siavonga, Kariba, Chirundu and Tete) rely on water
abstracted directly from the Zambezi River and who also discharge their effluent (treated and untreated) directly
into the Zambezi River.
In addition to water abstracted for domestic use, large volumes of water are also withdrawn for irrigation; for
example: the Gwembi Irrigation Project on Lake Kariba, The Chaiwa Irrigation Project downstream of the Kafue-
Zambezi confluence and the Sena Sugar Estate on the lower Zambezi in Mozambique. Similar irrigation
schemes for sugar cane also operate on the Shire River in Malawi (e.g. Sucoma Sugar Estate) and the Kafue
River in Zambia (e.g. the Nakambala Sugar Estate). In addition, large citrus estates such as the Mazowe Citrus
Estate in Zimbabwe also withdraw substantial volumes of water (Chenje, 2000). Most small-scale farmers rely
either on red-fed agriculture or on water drawn from shallow wells or nearby watercourse (Chenje, 2000).
3.1.5 Water management systems and institutions
Each of the basin states has their own water management systems and segments their respective territories
into Water Management Units. These divisions are normally in the form of sub-catchments, though some of the
larger sub-catchments are further sub-divided (e.g. the Kafue and Luangwa in Zambia; the Shire in Malawi).
The formal constitution of catchment councils or catchment management agencies has only taken place in
Zimbabwe. In the other basin states, water management is undertaken by central Government or is delegated
to Provincial Departments.
In Zimbabwe, the Zimbabwe National water Authority (ZINWA) segments the Zimbabwean sector of the
Zambezi Catchment into three Catchment Councils: Gwayi, Sanyati and Mazowe. These correspond to
Hydrological Zones A, C and D, respectively (ZSG, 1984). The Zimbabwe portion of the catchment is divided
into a series of sub-catchments for the purposes of this study, as shown in Figure 3.2. Water quality data is
available from a number of ZINWA sampling points in Zimbabwe (Figure 3.3). The only information that could
be obtained for the other basin states consisted of a few water quality data for the Kafue sub-catchment in

lxxxix
Zambia. Clearly, some water quality information must be available for the other basin states and concerted
attempts should be made to secure this information and synthesize it to provide a better overview of the
Zambezi basin.
The SADC Protocol on Shared Watercourse Systems is an important legislative instrument that promotes
regional co-operation and collaboration amongst all SADC states. However, inadequate and unequal
institutional and professional capacity within the member states hampers full expression of this protocol.
Zambia and Zimbabwe have jointly passed the Zambezi River Authority legislation in 1987 to form the Zambezi
River Authority (Pallett, 1997; Chenje, 2000). Whilst this move will certainly help to improve collaborative
management of the Zambezi basin, the fact that the other six basin states (Angola, Botswana, Malawi,
Mozambique, Namibia and Tanzania) are not included is seen as an impediment to the optimal functioning of
this authority. To date, the Zambezi River Authority (ZRA) has focused its activities on the section of the
Zambezi River shared by Zambia and Zimbabwe, with particular attention being paid to setting up an efficient
monitoring system and database (Chenje, 2000). Under the auspices of the ZRA, Zambia and Zimbabwe have
agreed to collaborate closely on the utilization, operation and maintenance of all existing infrastructure and
installations (e.g. dams, reservoirs, telemetry stations), as well as any future installations that may be
constructed in their spheres of influence.
Each basin state maintains its own system of meteorological and hydrological data collection, primarily for use
at the national level. Whilst these systems are at very different levels of coverage in the different states, all data
is fed into regional data systems such as the Drought Monitoring Centre in Harare, Zimbabwe, where the data
provides important information for national and regional agricultural planning systems. Recent improvements
include weather radar systems and satellite monitoring systems that are intended to expand the regional
coverage.
3.1.6 Mining and mineral processing operations in the Zambezi basin
There are a large number and wide variety of mining and minerals processing operations in the Zambezi
catchment; the locations of these are shown in Figures 3.4 and 3.7 to 3.14, whilst details of land use and
geology in Zimbabwe are given in Figures 3.5 and 3.6.
Data on the type of mine, size, operational status and location of mining operations in the Zambezi basin are
presented, along with inferences on their potential impacts. The inference for potential impact was arrived at
using the criteria in Table 1.3 and is summarized for each sub-catchment in the following sections. A
summarizing overview of the potential impacts on water resources and water quality in each sub-catchment of
the Zambezi basin is given in Section 3.40.
In the following portions of this section of the report that contain descriptions of the mining and mineral
processing activities in each sub-catchment, it is important to refer to Figure 3.2 and Figure 3.4 for the
positions of the different sub-catchments within the Zambezi basin.

xc
3.2 The Kazungula sub-catchment
3.2.1 General description
3.2.1.1 Hydrology
The catchment zone comprises the so-called “headwater zone” of the Chamabonda Stream, a series of small,
ephemeral streams with episodic flows that flow into Zimbabwe and enter the Zambezi River both above and
below the Victoria Falls. In the northern part of this small sub-catchment, a few small ephemeral streams flow
into the Zambezi River at Kazungula.
3.2.1.2 Geology and geomorphology
The Upper Karoo Batoka Basalt Formation, covered in a few areas by recent alluvial material and large
expanses of Kalahari Sands, underlies this small sub-catchment.
3.2.1.3 Pedology, agriculture and land use
The soils can be separated into two groups, namely: the Kalahari Sands and very shallow, gravelly soils
overlying the basalts. The area lies within an are of low rainfall (approximately 650 mm) in northeastern
Botswana. The predominance of Kalahari Sands makes the area generally unsuitable for agriculture, except
for small areas of subsistence agriculture along the richer soils on river terraces. Land use is largely given over
to forestry, with a minor emphasis on tourism. The area is traversed by the Kazangula – Nata – Francistown
road linking Zambia and Botswana, with a small road to the border post at Mpandamatenga on the Zimbabwe
border.
3.2.1.4 Surface water users
The only settlements of any size are the Botswana border post of Kazangula. A few small boreholes at
veterinary fences along the Kazungula – Nata road provide the only source of surface water away from the
Zambezi River. A borehole serves the Mpandamatenga border post.
3.2.1.5 Water management systems
This area falls under the management of the Botswana Department of Minerals, Energy and Water.

xci
3.2.1.6 Human impacts on water resources (excluding mining)
The following could be expected to have an impact on water resources:
• Minor non-point impact from sparse, subsistence agriculture located close to Kazungula and the veterinary
fence control points;
• Disposal of domestic and commercial solid waste at Kazangula;
• Minor non-point impact from subsistence agriculture and garbage disposal at the Mpandamatenga border
post; and
• Minor non-point impact from garbage along the Kazungula – Nata road.
3.2.2 Mining and mineral processing operations
One coal mining operation is located in this sub-catchment (Figure 3.4; Table 3.3). No information is available
regarding current prospecting in the area. There are no known minerals processing operations in the sub-
catchment.
Table 3.3: Mining operations in the Kazungula sub-catchment.
Code Number
Name of Mine Commodity (ies)
Mined Status
Relative Size
Probable Impact
B-1 Pandamatenga Coal Operating Small Very low
3.2.3 Alluvial mining
None recorded and none anticipated.
3.2.4 Monitoring systems
None.
3.2.5 Water quality data
None.
3.2.6 Implications for water quality and quantity management

xcii
None.
3.3 The Chobe - Linyanti sub-catchment
3.3.1 General description
3.3.1.1 Hydrology
The Linyanti – Chobe River system joins the Zambezi River at the base of this sub-catchment. Flows are
distinctly seasonal, with extensive flooding of eastern Caprivi. If the Zambezi floodwaters arrive earlier than the
floodwaters of the Chobe River, the Zambezi water may push upstream into the Chobe River as far as Lake
Liambezi.
3.3.1.2 Geology and geomorphology
The Upper Karoo Batoka Basalt Formation underlies the eastern portion of the catchment, outcropping at
surface along the Zambezi River.
3.3.1.3 Pedology, agriculture and land use
A deep layer of Kalahari Sands covers most of the sub-catchment, with rich alluvial soils on the river terraces
along the Chobe, Linyanti and Zambezi rivers. Much of the eastern Caprivi is flooded during the rainy season
and the soils support an extensive wetland area.
Land use is predominantly subsistence agriculture with livestock rearing, as well as tourism along the Chobe
and Zambezi rivers. A new sugar cane project (10,000 hectares in extent) is planned for the Namibian sector of
the Caprivi. This will draw water from the Chobe – Linyanti system.
3.3.1.4 Surface water users
The only settlements of any size in Botswana are border post at Ngoma Bridge and the small town of Kasane in
Botswana. In Namibia, the Provincial Capital of Caprivi Province, the town of Katima Mulilo is important, with
several smaller villages along the Namibian bank of the Chobe and Linyanti rivers.
Water for Katima Mulilo is drawn from the Zambezi River whilst Ngoma Bridge and Kasane take water from the
Chobe River. Other smaller villages also draw water from the Chobe and Linyanti rivers. If the planned sugar
cane project proceeds, this will become the largest water user in the sub-catchment.
3.3.1.5 Water management systems

xciii
The Botswana segment of this area falls under the management of the Botswana Department of Mineral,
Energy and Water. The Namibian segment falls under the jurisdiction of the Namibian Department of Water
Affairs who operates a regional office at the town of Katima Mulilo on the Zambezi River.
3.3.1.6 Human impacts on water resources (excluding mining)
Impacts on water resources consist of the following:
• Disposal of domestic and minor commercial solid waste at Katima Mulilo;
• Disposal of domestic and minor commercial solid waste at Kasane;
• Minor non-point impact from sparse, subsistence agriculture located close to Katima Mulilo and along the
Chobe River;
• Minor non-point source pollution from septic tank drainage systems at Kasane, Katima Mulilo and Chobe
River Lodge in the Chobe National Park;
• Minor non-point impact from subsistence agriculture and garbage disposal at the Ngoma Bridge border
post; and
• Minor non-point impact from garbage along the Kasane – Ngoma Bridge road.
3.3.2 Mining and mineral processing operations
None known.
3.3.3 Alluvial (small-scale) mining
None known and none anticipated.
3.3.4 Water management systems
Both the Botswanan and Namibian Governments operate controls on water abstraction from rivers and over the quality of water supplied for domestic consumption.
3.3.5 Monitoring systems
Both the Botswanan and Namibian Governments collect water samples from time to time and both also
collaborate on biological control programmes against the invasive waterweed Salvinia molesta (Kariba weed).
3.3.6 Water quality data
None available.

xciv
3.3.7 Implications for water quality and water resources management
The impacts of seepage into the Chobe and Zambezi rivers are likely to be small. There are no impacts of
mining or mineral processing on water resources or water quality in this sub-catchment.
3.4 The Luiana sub-catchment
3.4.1 General description
3.4.1.1 Hydrology
The Luiana River is a major tributary of the Cuando River in Angola. Flows are seasonal though there is no
information as to the size of the flows.
3.4.1.2 Geology
The Upper Karoo Batoka Basalt Formation underlies the lower reaches of the sub-catchment, covered by
Kalahari Sands. Archaean rocks of the Central African Craton underlie the headwaters of the sub-catchment.
3.4.1.3 Pedology, agriculture and land use
The soils are in two groups: the deeper ferralitic soils of the upper headwaters of the catchment, and Kalahari
Sands over most of the lower reaches of the sub-catchment. The predominance of Kalahari Sands makes the
area generally unsuitable for commercial agriculture, though subsistence agriculture occurs on floodplain levees
along the rivers.

xcv
3.4.1.4 Surface water users
The only settlements are small villages scattered throughout the sub-catchment, as well as anecdotal evidence
for the presence of UNITA army camps in the headwaters region of the sub-catchment.
3.4.1.5 Water management systems
This area falls under the management of the Angolan Department of Water Affairs.
3.4.1.6 Human impacts on water resources (excluding mining)
The following could be expected to have an impact on water resources:
• Disposal of domestic and solid waste and UNITA army camps in the headwaters; and
• Minor non-point impact from sparse, subsistence agriculture throughout the sub-catchment.
3.4.2 Mining and mineral processing operations
None known.
3.4.3 Alluvial mining
Neither known nor likely, except possibly for diamonds in the headwaters region.

xcvi
3.4.4 Monitoring systems
None.
3.4.5 Water quality data
None.
3.4.6 Implications for water quality and quantity management
None.
3.5 The Cuando sub-catchment
3.5.1 General description
3.5.1.1 Hydrology
The Cuando River drains the southeastern portion of the Bié Highlands in central Angola. Flows are seasonal
though there is no information as to the size of the flows.

xcvii
3.5.1.2 Geology
The Upper Karoo Batoka Basalt Formation underlies the lower reaches of the sub-catchment, covered by
Kalahari Sands. Archaean rocks of the Central African Craton underlie the headwaters of the sub-catchment.
3.5.1.3 Pedology, agriculture and land use
The soils are in two groups: the deeper ferralitic soils of the upper headwaters of the catchment, and Kalahari
Sands over most of the lower reaches of the sub-catchment. The predominance of Kalahari Sands makes the
area generally unsuitable for commercial agriculture, though subsistence agriculture occurs on floodplain levees
along the rivers.
3.5.1.4 Surface water users
The only settlements are small villages scattered throughout the sub-catchment, as well as anecdotal evidence
for the presence of UNITA army camps in the headwaters region of the sub-catchment. Prospecting teams in
the sub-catchment uses small volumes of water.
3.5.1.5 Water management systems
This area falls under the management of the Angolan Department of Water Affairs.
3.5.1.6 Human impacts on water resources (excluding mining)
The following could be expected to have an impact on water resources:
• Disposal of domestic and solid waste and UNITA army camps in the headwaters; and
• Minor non-point impact from sparse, subsistence agriculture throughout the sub-catchment.

xcviii
3.5.2 Mining and mineral processing operations
One good diamond prospect is under investigation (Table 3.4; Figure 3.4).
Table 3.4: Mining operations in the Cuando sub-catchment.
Code Number
Name of Mine Commodity (ies)
Mined Status
Relative Size
Probable Impact
A-3 Lumbala Nguimbo Diamond – kimberlite Prospecting Small Very low
3.5.3 Alluvial mining
Neither known nor likely, except possibly for diamonds in the headwaters region.
3.5.4 Monitoring systems
None.
3.5.5 Water quality data
None.

xcix
3.5.6 Implications for water quality and quantity management
None.
3.6 The Luanginga sub-catchment
3.6.1 General description
3.6.1.1 Hydrology
The Luanginga River drains the southeastern portion of the Bié Highlands in central Angola. Flows are
seasonal though there is no information as to the size of the flows.
3.6.1.2 Geology
The sub-catchment is underlain predominantly by sandstones and conglomerates of the middle Zambezi basin;
these are covered by deep Kalahari Sands. Archaean rocks of the Central African Craton underlie the
headwaters of the sub-catchment.
3.6.1.3 Pedology, agriculture and land use
The soils are in two groups: the deeper ferralitic soils of the upper headwaters of the catchment, and Kalahari
Sands over most of the lower reaches of the sub-catchment. The predominance of Kalahari Sands makes the
area generally unsuitable for commercial agriculture, though subsistence agriculture occurs on floodplain levees
along the rivers.
3.6.1.4 Surface water users

c
The only settlements are small villages scattered throughout the sub-catchment. Prospecting teams in the sub-
catchment uses small volumes of water.
3.6.1.5 Water management systems
Most of this area falls under the management of the Angolan Department of Water Affairs, with the lower
portions of the catchment falling within the jurisdiction of the Zambian Department of Water Affairs (Barotseland)
office at Mongu.
3.6.1.6 Human impacts on water resources (excluding mining)
The following could be expected to have an impact on water resources:
• Disposal of domestic and solid waste from small communities; and
• Minor non-point impact from sparse, subsistence agriculture throughout the sub-catchment.
3.6.2 Mining and mineral processing operations
None known.
3.6.3 Alluvial mining
Neither known nor likely, except possibly for diamonds in the headwaters region.

ci
3.6.4 Monitoring systems
None.
3.6.5 Water quality data
None.
3.6.6 Implications for water quality and quantity management
None.
3.7 The Lungue Bungo sub-catchment
3.7.1 General description
3.7.1.1 Hydrology
The Lungue Bungo River drains the astern portion of the Bié Highlands in central Angola. Flows are seasonal
though there is no information as to the size of the flows.
3.7.1.2 Geology

cii
The sub-catchment is underlain predominantly by sandstones and conglomerates of the middle Zambezi basin;
these are covered by deep Kalahari Sands. Archaean rocks of the Central African Craton underlie the
headwaters of the sub-catchment.
3.7.1.3 Pedology, agriculture and land use
The soils are in two groups: the deeper ferralitic soils of the upper headwaters of the catchment, and Kalahari
Sands over most of the lower reaches of the sub-catchment. The predominance of Kalahari Sands makes the
area generally unsuitable for commercial agriculture, though subsistence agriculture occurs on floodplain levees
along the rivers.
3.7.1.4 Surface water users
The only settlements are small villages scattered throughout the sub-catchment. Prospecting teams in the sub-
catchment uses small volumes of water. Small administrative centres are located near the town of Kalabo in
Zambia.
3.7.1.5 Water management systems
Most of this area falls under the management of the Angolan Department of Water Affairs, with the lower
portions of the catchment falling within the jurisdiction of the Zambian Department of Water Affairs (Barotseland)
office at Kalabo.
3.7.1.6 Human impacts on water resources (excluding mining)
The following could be expected to have an impact on water resources:
• Disposal of domestic and solid waste from small communities; and
• Minor non-point impact from sparse, subsistence agriculture throughout the sub-catchment.

ciii
3.7.2 Mining and mineral processing operations
One small coal deposit is being utilized (Table 3.5; Figure 3.4).
Table 3.5: Mining operations in the Lungue Bungo sub-catchment.
Code Number
Name of Mine Commodity (ies)
Mined Status
Relative Size
Probable Impact
A-4 Muangai Coal Operating Small Very low
Most of the lower reaches of the catchment area are under prospecting permits for diamonds.
3.7.3 Alluvial mining
Neither known nor likely, except possibly for diamonds in the headwaters region.
3.7.4 Monitoring systems
None.
3.7.5 Water quality data
None.

civ
3.7.6 Implications for water quality and quantity management
None.
3.8 The Luena and Zambezi Headwaters sub-catchments
3.8.1 General description
3.8.1.1 Hydrology
The Luena River drains the eastern portion of the Bié Highlands in central Angola and joins the Zambezi River
in its headwater zone. Flows are seasonal though there is no information as to the size of the flows.
3.8.1.2 Geology
These two sub-catchments are underlain predominantly by sandstones and conglomerates of the middle
Zambezi basin; these are covered by deep Kalahari Sands. Archaean rocks of the Central African Craton
underlie the headwaters of the sub-catchments.
3.8.1.3 Pedology, agriculture and land use
The soils consist almost entirely of deep, well-leached ferralitic soils, with subsistence agriculture on the richer
soils located on floodplain levees along the riverbanks.
3.8.1.4 Surface water users
The only settlements are small villages scattered throughout the sub-catchment. Prospecting teams in the sub-
catchments uses small volumes of water. Small administrative centres are located near the town of Luena in
Angola. Prospecting teams active in the area will also use water.

cv
3.8.1.5 Water management systems
This area falls under the management of the Angolan Department of Water Affairs.
3.8.1.6 Human impacts on water resources (excluding mining)
The following could be expected to have an impact on water resources:
• Disposal of domestic and solid waste from small communities; and
• Minor non-point impact from sparse, subsistence agriculture throughout the sub-catchment.
3.8.2 Mining and mineral processing operations
See Figure 3.4 and Table 3.6. The Macondo Copper Mine was abandoned several years ago as a result of the
Angolan Civil War. The Alto Zambezi kimberlites show good prospects for diamonds.
Table 3.6: Mining operations in the Luena sub-catchment.
Code Number
Name of Mine Commodity (ies)
Mined Status
Relative Size
Probable Impact
A-1 Alto Zambezi Diamond – kimberlite Prospecting Small Very low
A-2 Macondo Copper Abandoned Small Unknown
A-5 Macondo – A Iron Prospecting Medium Very low
A-6 Macondo - B Fluorite Prospecting Medium Very low
3.8.3 Alluvial mining
Anecdotal evidence for alluvial diamond mining in the headwaters of the Luena River.

cvi
3.8.4 Monitoring systems
None.
3.8.5 Water quality data
None.
3.8.6 Implications for water quality and quantity management
None.
3.9 The Kabompo sub-catchment
3.9.1 General description
3.9.1.1 Hydrology
The Kabompo River drains the northwestern portion of the watershed between Northern Zambia and the
Democratic republic of Congo (Figure 3.2) and joins the Zambezi River after it flows out of Angola. Flows are
seasonal though there is no information as to the size of the flows.
cvii
3.9.1.2 Geology
This sub-catchment is underlain predominantly by copper-rich sandstones, quartzites, arenites and
conglomerates of the Copperbelt region.
3.9.1.3 Pedology, agriculture and land use
The soils consist almost entirely of deep, well-leached ferralitic soils. Subsistence agriculture occurs on the
richer soils located on floodplain levees along the riverbanks.
3.9.1.4 Surface water users
The only settlements are small villages scattered throughout the sub-catchment. Prospecting teams in the sub-
catchment uses small volumes of water. Prospecting teams active in the area will also use water.
3.9.1.5 Water management systems
This area falls under the management of the Zambian Department of Water Affairs.
3.9.1.6 Human impacts on water resources (excluding mining)
The following could be expected to have an impact on water resources:
• Disposal of domestic and solid waste from small communities;
• Disposal of domestic and solid waste from prospecting camps; and
• Minor non-point impact from sparse, subsistence agriculture throughout the sub-catchment.
3.9.2 Mining and mineral processing operations

cviii
See Figure 3.4 and Table 3.7. Major new copper, cobalt, zinc and uranium deposits have been found at
Lumwana and Kalumbila; a mine has started operating at Lumwana. The Kalengwa Copper Mine has closed
down and there are good prospects for iron and nickel.
Table 3.7: Mining operations in the Kabompo sub-catchment.
Code Number
Name of Mine Commodity (ies)
Mined Status
Relative Size
Probable Impact
A-7 Macondo-C Iron Prospecting Medium Very low
A-8 Macondo-D Iron Prospecting Medium Very low
Z-40 Kalengwa Copper, Silver Closed Medium Low-Medium
Z-41 Kalumbila Copper, Cobalt, Zinc Operating Small-Med Low-Medium
Z-54 Kabompo Iron Prospecting Medium Low
Z-55 Kalumbila-Nickel Nickel, Copper Prospecting Medium Low
Z-71 Lumwana Copper, Cobalt, U Operating Medium Medium
Z-72 Mwinilunga Copper Prospecting Small Very low
Z-73 Luamata Copper Prospecting Small Very low
Z-74 Kawanga Uranium Prospecting Small Low
Z-77 Mufumbwe Copper Start-up Medium Low
Z-78 Lalafuta Copper Prospecting Small Very low
Z-86 Balovale Amethyst Prospecting Small Very low
3.9.3 Alluvial mining
None known.
3.9.4 Monitoring systems
Sporadic water quality monitoring is carried out at Kalabo.

cix
3.9.5 Water quality data
None available.
3.9.6 Implications for water quality and quantity management
None, bar minor adverse effects of increased soil erosion around new mining operations and close to
prospecting trenches.
3.10 The Middle Zambezi sub-catchment
3.10.1 General description
3.10.1.1 Hydrology
This sub-catchment covers the Zambezi Floodplain in Barotseland. During the seasonal floods, the Zambezi
spills its banks, often reaching 48-50 kilometres in width. Several large tributaries arising in the Angolan sector
of the basin join the Zambezi in this sub-catchment.
3.10.1.2 Geology
This sub-catchment is underlain predominantly by the Karoo Supergroup basalts and sandstones overlain by
deposits of Kalahari Sands.
3.10.1.3 Pedology, agriculture and land use
The soils consist almost entirely of alluvial soils and hydromorphic vertisols. Smaller tributaries in the eastern
portion of this catchment have sandy-loam soils. Some of the soils in the northern (higher rainfall) section of the

cx
sub-catchment have deep, well-leached ferralitic soils. Subsistence agriculture occurs on the richer soils
located on floodplain levees along the riverbanks.
3.10.1.4 Surface water users
The only settlements are small towns and villages scattered throughout the sub-catchment. The Provincial
capital, Mongu, is located on the banks of the Zambezi River and the smaller town of Sesheke is also located on
the banks of the Zambezi River, opposite the town of Katima Mulilo in Caprivi. Prospecting teams also use
water from the river.
3.10.1.5 Water management systems
This area falls under the management of the Zambian Department of Water Affairs.
3.10.1.6 Human impacts on water resources (excluding mining)
The following could be expected to have an impact on water resources:
• Disposal of domestic and solid waste from small towns and communities;
• Disposal of domestic and solid waste from prospecting camps; and
• Minor non-point impact from sparse, subsistence agriculture throughout the sub-catchment.
3.10.2 Mining and mineral processing operations
See Figure 3.4 and Table 3.8. The only mining operations in this segment of the Zambezi basin are three
small amethyst mines.
Table 3.8: Mining operations in the Middle Zambezi sub-catchment.
Code Number
Name of Mine Commodity (ies)
Mined Status
Relative Size
Probable Impact

cxi
Z-87 Mulobezi Amethyst Operating Very small Very low
Z-88 Njoko Amethyst Operating Very small Very low
Z-89 Loazamba Amethyst Operating Very small Very low
3.10.3 Alluvial mining
None known.
3.10.4 Monitoring systems
Sporadic water quality monitoring is carried out at Mongu and Sesheke.
3.10.5 Water quality data
None available.
3.10.6 Implications for water quality and quantity management
None.
3.11 The Lunga sub-catchment
3.11.1 General description

cxii
3.11.1.1 Hydrology
The Lunga River is the most important tributary of the Kafue River and drains the central portion of the
watershed between Northern Zambia and the Democratic Republic of Congo (Figure 3.4). Flows are seasonal
though there is no information as to the size of the flows.
3.11.1.2 Geology
This sub-catchment is underlain predominantly by copper-rich sandstones, quartzites, arenites and
conglomerates of the Copperbelt region.
3.11.1.3 Pedology, agriculture and land use
The soils consist almost entirely of deep, well-leached ferralitic soils. Subsistence agriculture occurs on the
richer soils located on floodplain levees along the riverbanks. Considerable numbers of people have flocked to
the town of Solwezi near the headwaters of this river, attracted by the increase in mining activity. Large areas of
Miombo woodland have been cleared for the layout of mining infrastructure and housing, as well as for the
provision of fuelwood. Large areas of subsistence agriculture occur around Solwezi.
3.11.1.4 Surface water users
The major settlement is the town of Solwezi, though there are several small villages scattered throughout the
sub-catchment. Prospecting teams in the sub-catchment uses small volumes of water.
3.11.1.5 Water management systems
This area falls under the management of the Zambian Department of Water Affairs, Copperbelt office.
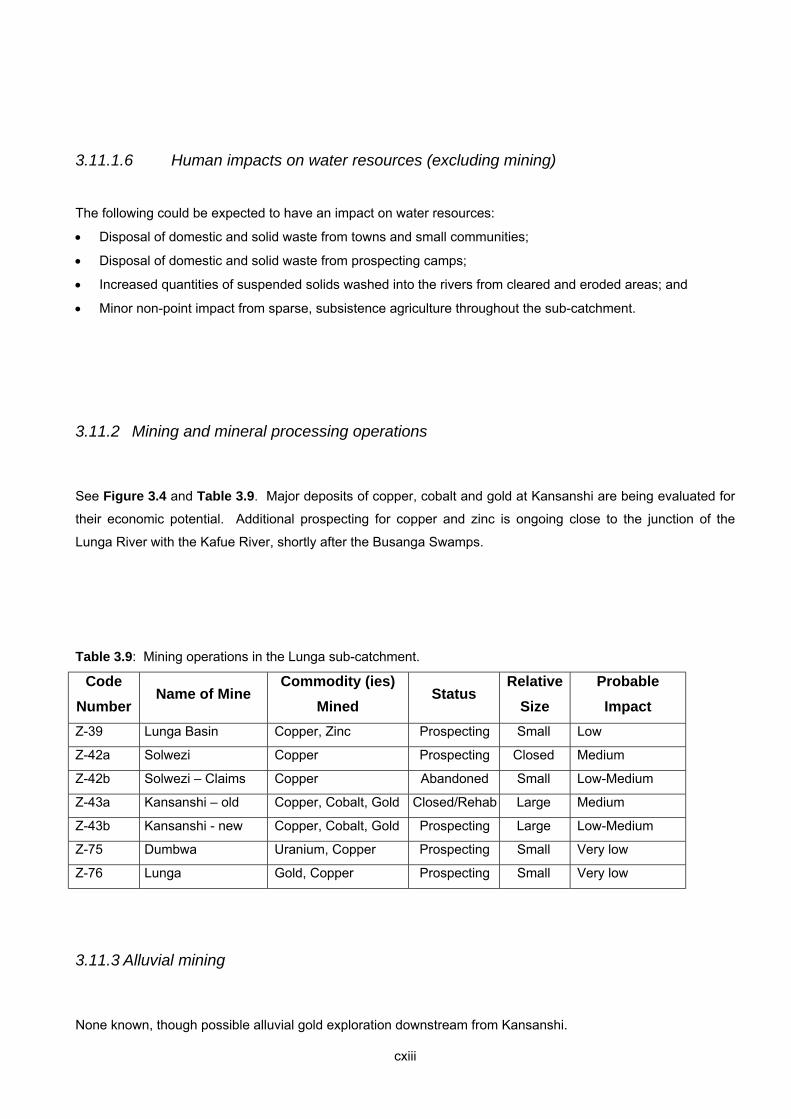
cxiii
3.11.1.6 Human impacts on water resources (excluding mining)
The following could be expected to have an impact on water resources:
• Disposal of domestic and solid waste from towns and small communities;
• Disposal of domestic and solid waste from prospecting camps;
• Increased quantities of suspended solids washed into the rivers from cleared and eroded areas; and
• Minor non-point impact from sparse, subsistence agriculture throughout the sub-catchment.
3.11.2 Mining and mineral processing operations
See Figure 3.4 and Table 3.9. Major deposits of copper, cobalt and gold at Kansanshi are being evaluated for
their economic potential. Additional prospecting for copper and zinc is ongoing close to the junction of the
Lunga River with the Kafue River, shortly after the Busanga Swamps.
Table 3.9: Mining operations in the Lunga sub-catchment.
Code Number
Name of Mine Commodity (ies)
Mined Status
Relative Size
Probable Impact
Z-39 Lunga Basin Copper, Zinc Prospecting Small Low
Z-42a Solwezi Copper Prospecting Closed Medium
Z-42b Solwezi – Claims Copper Abandoned Small Low-Medium
Z-43a Kansanshi – old Copper, Cobalt, Gold Closed/Rehab Large Medium
Z-43b Kansanshi - new Copper, Cobalt, Gold Prospecting Large Low-Medium
Z-75 Dumbwa Uranium, Copper Prospecting Small Very low
Z-76 Lunga Gold, Copper Prospecting Small Very low
3.11.3 Alluvial mining
None known, though possible alluvial gold exploration downstream from Kansanshi.
cxiv
3.11.4 Monitoring systems
Sporadic water quality monitoring is carried out at Solwezi.
3.11.5 Water quality data
None available.
3.11.6 Implications for water quality and quantity management
None, bar minor adverse effects of increased soil erosion around new mining operations and close to
prospecting trenches. If mines become operational, acid mine drainage is also possible.
3.12 The Upper Kafue sub-catchment
3.12.1 General description
3.12.1.1 Hydrology
The Upper Kafue River is the probably the most important river in Zambia as it drains the mineral and economic
heartland of the country. The river flows south-westwards, draining the eastern portion of the watershed
between Northern Zambia and the Democratic Republic of Congo (Figure 3.4), before swinging southwards to
join the Lunga River and enter the Kafue Floodplain. Flows are highly seasonal though there is no information
available as to the size of the flows.

cxv
3.12.1.2 Geology
This sub-catchment is underlain predominantly by copper-rich sandstones, quartzites, arenites and
conglomerates of the Copperbelt region. The region hosts substantial deposits of copper and cobalt, and has
several emerald-bearing pegmatites. Large deposits of high-grade limestone are found at Ndola, the site of a
very large cement works. Very large numbers of pegmatite deposits and intrusions of Greenstone formations in
the eastern portion of this sub-catchment hold good prospects for gemstones and gold. Zinc and lead are found
in the south near the well-known Broken Hill deposit at the town of Kabwe.
3.12.1.3 Pedology, agriculture and land use
The soils consist almost entirely of deep, well-leached ferralitic soils. Subsistence agriculture occurs on the
richer soils located on floodplain levees along the riverbanks. Considerable numbers of people have flocked to
the Copperbelt towns of Ndola, Kitwe, Luanshya, Mufulira, Chingola, Chililabombwe, Kalulushi and Chambishi
in search of work or to join their families. Each of the Copperbelt towns now has enormous numbers of informal
settlements around its periphery, accompanied by extensive areas of subsistence agriculture. Large-scale de-
vegetation takes place as people use the Miombo (Brachystegia) woodlands for fuelwood. These peripheral
impacts can be considered as both “indirect” and “cumulative” impacts linked to mining operations. A Landsat
TM image (Figure 3.15) provides an overview of the extent of the impacted area associated with the different
Copperbelt mining towns.
3.12.1.4 Surface water users
All of the towns use substantial quantities of water for domestic and industrial purposes and the mining
operations also use considerable volumes of water. The numerous small “informal” settlements and
communities around the periphery of the Copperbelt towns rely on shallow hand-dug wells in nearby dambos, or
draw water directly from nearby rivers and streams.
3.12.1.5 Water management systems
This area falls under the management of the Zambian Department of Water Affairs, Copperbelt office.

cxvi
3.12.1.6 Human impacts on water resources (excluding mining)
The following could be expected to have an impact on water resources:
• Disposal of domestic and solid waste from towns, industries and small communities;
• Disposal of domestic and solid waste from peripheral industries (e.g. cement factories);
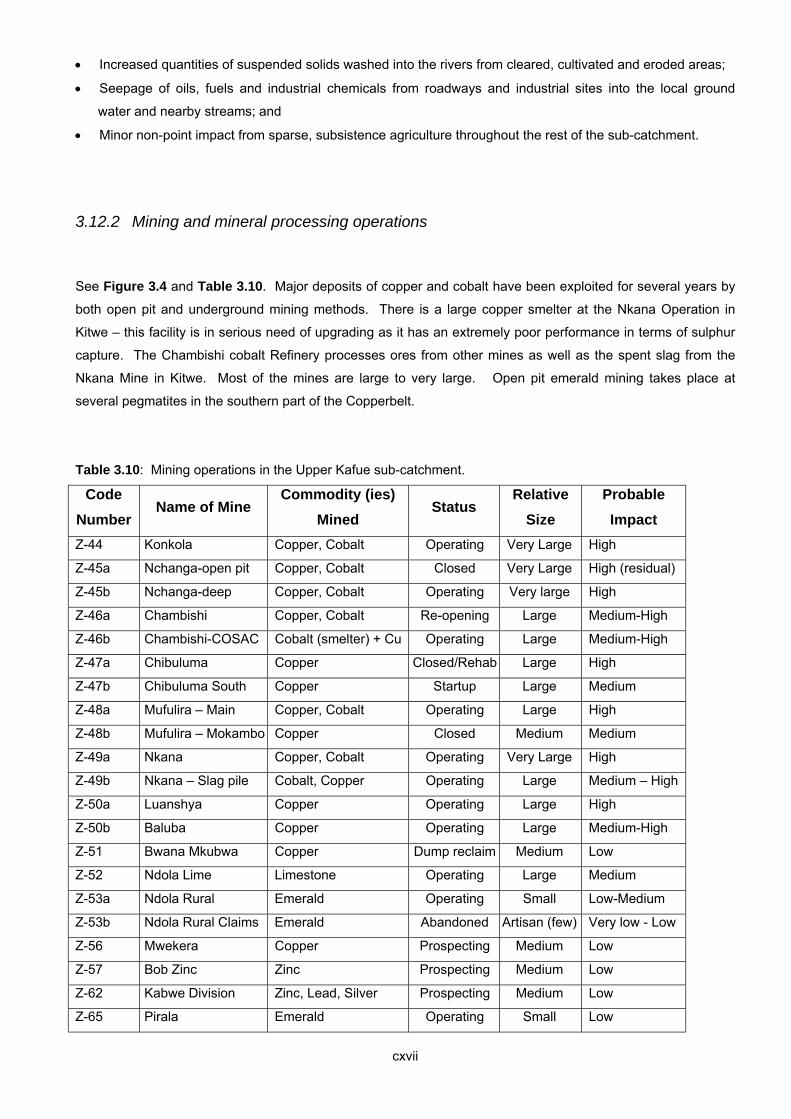
cxvii
• Increased quantities of suspended solids washed into the rivers from cleared, cultivated and eroded areas;
• Seepage of oils, fuels and industrial chemicals from roadways and industrial sites into the local ground
water and nearby streams; and
• Minor non-point impact from sparse, subsistence agriculture throughout the rest of the sub-catchment.
3.12.2 Mining and mineral processing operations
See Figure 3.4 and Table 3.10. Major deposits of copper and cobalt have been exploited for several years by
both open pit and underground mining methods. There is a large copper smelter at the Nkana Operation in
Kitwe – this facility is in serious need of upgrading as it has an extremely poor performance in terms of sulphur
capture. The Chambishi cobalt Refinery processes ores from other mines as well as the spent slag from the
Nkana Mine in Kitwe. Most of the mines are large to very large. Open pit emerald mining takes place at
several pegmatites in the southern part of the Copperbelt.
Table 3.10: Mining operations in the Upper Kafue sub-catchment.
Code Number
Name of Mine Commodity (ies)
Mined Status
Relative Size
Probable Impact
Z-44 Konkola Copper, Cobalt Operating Very Large High
Z-45a Nchanga-open pit Copper, Cobalt Closed Very Large High (residual)
Z-45b Nchanga-deep Copper, Cobalt Operating Very large High
Z-46a Chambishi Copper, Cobalt Re-opening Large Medium-High
Z-46b Chambishi-COSAC Cobalt (smelter) + Cu Operating Large Medium-High
Z-47a Chibuluma Copper Closed/Rehab Large High
Z-47b Chibuluma South Copper Startup Large Medium
Z-48a Mufulira – Main Copper, Cobalt Operating Large High
Z-48b Mufulira – Mokambo Copper Closed Medium Medium
Z-49a Nkana Copper, Cobalt Operating Very Large High
Z-49b Nkana – Slag pile Cobalt, Copper Operating Large Medium – High
Z-50a Luanshya Copper Operating Large High
Z-50b Baluba Copper Operating Large Medium-High
Z-51 Bwana Mkubwa Copper Dump reclaim Medium Low
Z-52 Ndola Lime Limestone Operating Large Medium
Z-53a Ndola Rural Emerald Operating Small Low-Medium
Z-53b Ndola Rural Claims Emerald Abandoned Artisan (few) Very low - Low
Z-56 Mwekera Copper Prospecting Medium Low
Z-57 Bob Zinc Zinc Prospecting Medium Low
Z-62 Kabwe Division Zinc, Lead, Silver Prospecting Medium Low
Z-65 Pirala Emerald Operating Small Low

cxviii
Z-79 Sakania Gold, Copper Abandoned Small Very low
Z-80 Hippo Copper Prospecting Small Very low
Z-81 Silver King Copper, Silver Prospecting Medium Very low
Z-82 Sable Antelope Copper, Gold Prospecting Medium Very low
3.12.3 Alluvial mining
None known.
3.12.4 Monitoring systems
Regular water quality monitoring is carried out at points both upstream and downstream of major tailings dams
and effluent discharge points on the Kafue River. Zambian and Swedish researchers have undertaken
extremely detailed investigations of tailings geochemistry and water quality associated with the mines near
Kitwe and Chingola (Petterson & Ingri, 1993; 2000a, 2000b; Mwale, 1994; Mwase, 1994; Nkandu, 1996;
Norrgren et al., 2000).
3.12.5 Water quality data
Some published water quality data is available from the publications of Petterson & Ingri (1993, 2000a, 2000b;
Table 3.11). These workers have shown that the acid mine drainage emanating from the Copperbelt mines is
largely neutralized by the carbonate-rich rocks and sediments of local geological formations. As a result, the
concentrations of dissolved copper and cobalt in the Kafue River are extremely low, though larger quantities
are present as suspended (adsorbed) material. In the past, this suspended copper has been implicated in the
death of cattle that drank from the Mwambashi River (Figure 3.15; Mwale, 1994; Petterson & Ingri, 2000a,
2000b).
Table 3.11: Analyses of water quality (dissolved substances) at three sites in the Kafue River, from upstream of
Chingola (Fischer’s Farm), 20 km downstream of Kitwe (Raglan’s Farm) and 100 km downstream of the
Zambian Copperbelt (Machiya Ferry). Data provided are averages of monthly samples collected between
March 1995 and April 1996; all data units are given in microgrammes per litre (µg/litre) (Pettersson & Ingri,
2000a, 2000b).

cxix
Determinant Fischer’s Farm Raglan’s Farm Machiya Ferry
Silica (Si) 3,395 18,932 4,755
Aluminium (Al) 1,687 12,674 1,594
Calcium (Ca) 442 1,261 653
Magnesium (Mg) 223 1,106 252
Potassium (K) 270 2,481 522
Sodium (Na) 189 223 159
Iron (Fe) 2,076 5,936 1,444
Manganese (Mn) 106 363 671
Phosphorus (P) 77 234 160
Titanium (Ti) 79 451 58
Barium (Ba) 12 90 20
Strontium (Sr) 1.92 11 5
Cobalt (Co) 1.27 115 16
Copper (Cu) 4.7 662 79
Chrome (Cr) 1.37 4.87 0.96
Nickel (Ni) 0.72 4.97 1.15
Lead (Pb) 0.46 37 1.33
Zinc (Zn) 14 117 29
The concerted sampling programme conducted by Pettersson and Ingri (2000a, 2000b) showed very clearly that the concentrations of every determinant examined increased dramatically as a result of mining activities on the Zambian Copperbelt. In addition to the dissolved fraction, these authors also found very large concentrations of
particulate material in the Kafue River, and that the concentrations of most heavy metals (Cobalt, Copper, Chrome, Lead, Zinc) were occasionally up to ten time higher (than the dissolved concentrations) as adsorbed ions onto the particulate material. These authors also found even higher concentrations of metals in sediment
samples collected from the bed of the Kafue River.
Overall, Pettersson and Ingri (2000a, 2000b) have concluded that the background geology and soils of the
Zambian Copperbelt are able to neutralize most of the dissolved seepage and effluent discharge from the
copper-cobalt mining operations, but that the process of neutralization results in most of the material entering
the particulate phase that is then sedimented out of the water column. Wetland areas located downstream of
the Zambian Copperbelt are able to trap large quantities of this particulate material so that very little reaches the
lower Kafue River or the Zambezi River.
Whilst the predominance of heavy metals as (suspended) particulate material or as components within the river
sediments suggests that they are likely to have very little effect on aquatic biota and other water users, these
metals will become available as soon as the sediments and particulate material are oxidized. This could pose
several important water quality problems for water resource managers in the area.

cxx
3.12.6 Implications for water quality and quantity management
The very large population that is now resident in this sub-catchment has considerable implications for overall
water resource and water quality management. The sheer volume of treated sewage effluent and industrial
effluent that is discharged into the Kafue River suggests very strongly that water quality problems will continue
to worsen in the future. The situation is exacerbated by seepage of acid mine drainage from mining operations,
as well as the erosion of particulate material in the form of fines from poorly-sited and badly protected tailings
dams close to the Kafue River.
3.13 The Lower Kafue sub-catchment
3.13.1 General description
3.13.1.1 Hydrology
This sub-catchment covers the Kafue River Floodplain in the Central province of Zambia. During seasonal
floods, the Kafue spills its banks, often reaching 15-20 kilometres in width across the floodplain. Several small
tributaries join the Kafue in this sub-catchment. The Kafue River is dammed at the Itezhitezhi gap and at the
Kafue Gorge; both dams are designed for hydroelectric power generation and supplement the power gained
from the Kariba North hydroelectric power station at the Kariba Dam.
3.13.1.2 Geology
This sub-catchment is underlain predominantly by the Karoo basalts and sandstones overlain by sedimentary
and alluvial deposits.
3.13.1.3 Pedology, agriculture and land use
The soils consist almost entirely of alluvial soils and hydromorphic vertisols, with some well-leached ferralitic
soils in the northern portion of this sub-catchment. The Kafue Floodplain supports the Kafue National Park as
well as two smaller National Parks (Lochinvar and Blue Lagoon). Extensive cultivation of rice and sugar cane
occurs on the floodplains, whilst subsistence agriculture occurs on the richer soils located on floodplain levees
along the riverbanks. The southern portion of this catchment supports a thriving livestock rearing area.

cxxi
3.13.1.4 Surface water users
There are several small towns and villages scattered throughout the sub-catchment. The Provincial capital,
Mumbwa, is located north of the Kafue River, whilst the smaller towns of Chilanga and Kafue are located near to
the downstream end of this sub-catchment. Considerable quantities of water are used for sugar cane irrigation
as well as for livestock rearing.
3.13.1.5 Water management systems
This area falls under the management of the Zambian Department of Water Affairs.
3.13.1.6 Human impacts on water resources (excluding mining)
The following could be expected to have an impact on water resources:
• Disposal of domestic and solid waste from small towns and communities;
• Salinized return flows from extensive irrigation schemes;
• Discharge and seepage of water from livestock farms; and
• Minor non-point impact from sparse, subsistence agriculture throughout the sub-catchment.
3.13.2 Mining and mineral processing operations
A variety of small to medium mining operations are located in this sub-catchment (Table 3.12; Figure 3.4).
Several areas are also under prospecting licence for gemstones, copper, nickel and gold.
Table 3.12: Mining operations in the Lower Kafue sub-catchment.
Code Number
Name of Mine Commodity (ies)
Mined Status
Relative Size
Probable Impact
Z-25 Chilanga Limestone Operating Large Low-Medium
Z-26 Nampundwe Iron Pyrites, Copper Operating Medium Medium

cxxii
Z-27 Matala Gold, Silver Operating Small Low-Medium
Z-28 Munali Nickel Prospecting Small Low
Z-29 Luwana Copper Operating Small Low
Z-30 Luiri- Dunrobin Gold, Silver, Copper Operating Medium Medium
Z-31 Shimwyoka Iron Operating Medium Low
Z-37 Itezhitezhi Aquamarine Operating Small Low
Z-38 Kaindu Amethyst Operating Small Low
Z-58 Argosy Copper Prospecting Medium Low
Z-59 Chongwe Copper Prospecting Medium Low
Z-83 Kamiyobo Copper, iron Prospecting Small Very low
Z-84 Nambala Iron Operating Small Very low
Z-85 Lochinvar Gypsum Prospecting Small Very low
3.13.3 Alluvial mining
None known.
3.13.4 Monitoring systems
Regular water quality monitoring is carried out at Kafue and at the two hydroelectric dam sites.
3.13.5 Water quality data
None available.
3.13.6 Implications for water quality and quantity management
cxxiii
The Nampundwe pyrite mine poses a risk of contamination from acid mine drainage, as do the Dunrobin and
Luiri gold mines. The Chilanga Cement Works poses a potential problem from alkaline dust.
3.14 The Kariba (Zambia) sub-catchment
3.14.1 General description
3.14.1.1 Hydrology
This area comprises a series of small sub-catchments, whose rivers flow from the surrounding plateau down
steeply inclined riverbeds into Lake Kariba. None of these rivers are perennial, though continual seepage from
Maamba Colliery gives the appearance of perennial flow in a nearby stream.
3.14.1.2 Geology
The plateau is composed of quartzites and associated rocks, underlain by Karoo Supergroup sedimentary rocks
and basalt. These rock formations are deeply incised by the numerous streams flowing from the plateau to
Lake Kariba.
3.14.1.3 Pedology, agriculture and land use
Soils in the sub-catchment can be divided into three groups:
• Very shallow, gravely soils derived from Upper Karoo sediments and basalts;
• Moderately deep sandy soils derived from Lower Karoo sediments;
• Moderately deep kaolin tic sandy to loamy sand soils derived from quartzites and associated rocks.
The sub-catchment experiences low and erratic rainfall; usually below 650 mm per year; the exception being the
higher elevation plateau that receives slightly more.
Land use comprises the sparsely populated communal lands with subsistence agriculture, commercial stock
farming (beef cattle and goats) on the plateau and some cash cropping of tobacco. Several small towns are
located along the watershed marking the plateau, Zimba, Monze, Choma and Kalomo being the most important
centres. A small urban centre has developed close to the Maamba Colliery to house the colliery staff.

cxxiv
3.14.1.4 Surface water users
There is some consumption of water for small-scale agriculture in the communal lands along the escarpment,
whilst most of the water used for domestic purposes in the towns is obtained either from the Kafue River or from
local boreholes. Some water is used at the Maamba Colliery.
3.14.1.5 Water management systems
The area falls under the jurisdiction of the Zambian Department of Water Affairs.
3.14.1.6 Human impacts on water resources (excluding mining)
The following could be expected to have an impact on water resources:
• Disposal of solid waste at Maamba Colliery and local towns;
• Disposal of liquid effluent at local towns;
• Urban run off from towns;
• Non-point sources of domestic effluent in the rural areas; and
• Litter and garbage on the main road between Livingstone and Lusaka.
3.14.2 Mining and mineral processing operations
The Maamba Colliery is the largest mining operation in this sub-catchment; the other operations are all small or
very small (Table 3.13; Figure 3.4). There are several identified coal resources and a few pegmatites with
semi-precious stones located in this sub-catchment.
Table 3.13: Mining operations in the Kariba (Zambia) sub-catchment.
Code Number
Name of Mine Commodity (ies)
Mined Status
Relative Size
Probable Impact
Z-32 Chipepo Coal Prospecting Small Low
Z-33 Maamba Coal Operating Large High – Very high
Z-34 Simani Amethyst Operating Very small Very low – Low
Z-35a Kabanga Tin Operating Very small Very low – Low
Z-35b Kalomo Claims Amethyst Abandoned Very small Very low
Z-36 Senkobo Amethyst Operating Very small Very low – Low
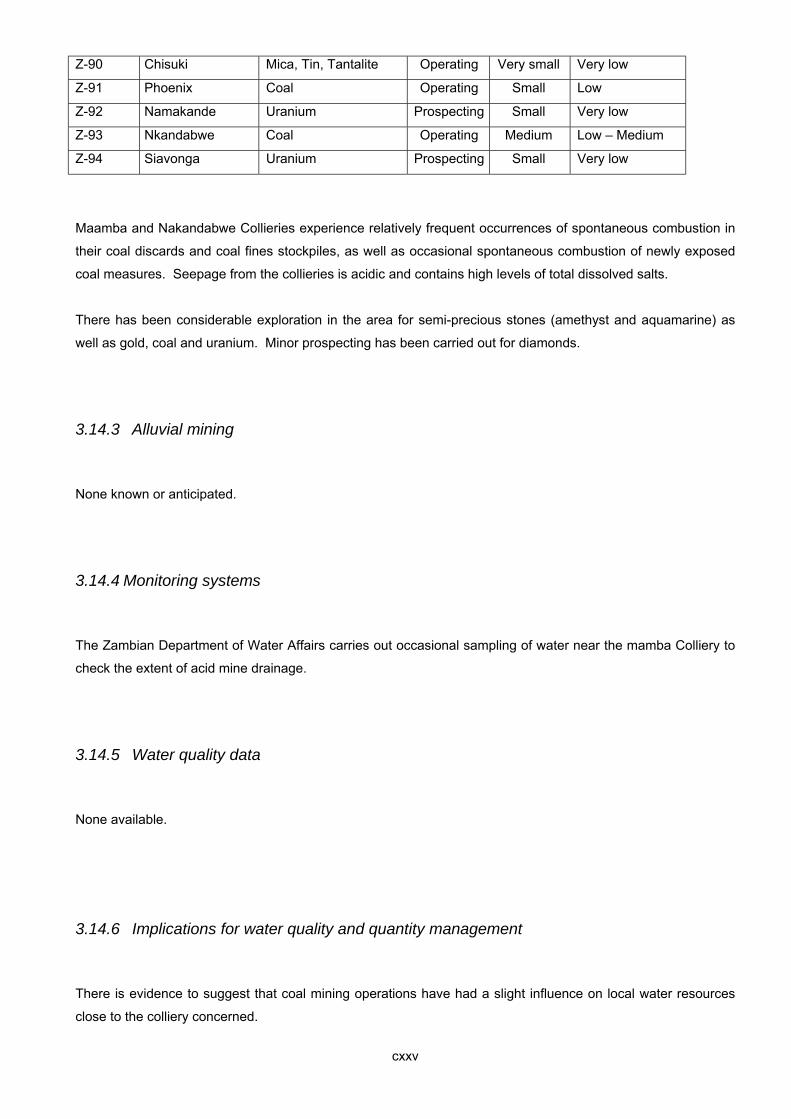
cxxv
Z-90 Chisuki Mica, Tin, Tantalite Operating Very small Very low
Z-91 Phoenix Coal Operating Small Low
Z-92 Namakande Uranium Prospecting Small Very low
Z-93 Nkandabwe Coal Operating Medium Low – Medium
Z-94 Siavonga Uranium Prospecting Small Very low
Maamba and Nakandabwe Collieries experience relatively frequent occurrences of spontaneous combustion in
their coal discards and coal fines stockpiles, as well as occasional spontaneous combustion of newly exposed
coal measures. Seepage from the collieries is acidic and contains high levels of total dissolved salts.
There has been considerable exploration in the area for semi-precious stones (amethyst and aquamarine) as
well as gold, coal and uranium. Minor prospecting has been carried out for diamonds.
3.14.3 Alluvial mining
None known or anticipated.
3.14.4 Monitoring systems
The Zambian Department of Water Affairs carries out occasional sampling of water near the mamba Colliery to
check the extent of acid mine drainage.
3.14.5 Water quality data
None available.
3.14.6 Implications for water quality and quantity management
There is evidence to suggest that coal mining operations have had a slight influence on local water resources
close to the colliery concerned.

cxxvi
3.15 The Chirundu sub-catchment
3.15.1 General description
3.15.1.1 Hydrology
This area comprises a series of small sub-catchments, whose rivers flow south-eastwards towards the Zambezi
Valley, incising relatively deep channels through the edge of the escarpment from the surrounding plateau.
None of these rivers are perennial and only contain appreciable flow after rainstorms.
The plateau inland of the Zambezi Escarpment comprises relatively undulating terrain with several small
wetland areas and seeps, as well as small sinkholes in areas underlain by limestone deposits.
3.15.1.2 Geology
The plateau is composed of quartzites and associated rocks, underlain by Karoo Supergroup sedimentary rocks
and basalt. These rock formations are deeply incised by the numerous streams flowing from the plateau to the
Zambezi River. High quality limestone deposits are found at a few places on the plateau, testifying to the
marine origin of these rocks. The Zambezi Mobile Belt contains several occurrences of gold.
3.15.1.3 Pedology, agriculture and land use
Soils in the sub-catchment can be divided into four groups:
• Very shallow, gravely soils derived from Upper Karoo sediments and basalts;
• Moderately deep sandy soils derived from Lower Karoo sediments;
• Moderately deep kaolinitic sandy to loamy sand soils derived from quartzites and associated rocks;
• Moderately deep, sandy loams on areas underlain by limestone deposits.
The sub-catchment experiences moderate rainfalls of around 800-850 mm on the higher-lying plateau, grading
down to some 650 mm per year in the Zambezi Valley.
Land use comprises a mixture of sparsely populated communal lands with subsistence agriculture, densely
populated urban areas of Lusaka and Chilanga, with commercial stock farming (beef cattle and goats) on the
plateau and some cash cropping and commercial farming of maize. Several small communities are located

cxxvii
along the major roads between Chirundu and Lusaka. Large-scale irrigated sugar cane farming is located at the
junction of the Kafue and Zambezi rivers.
3.15.1.4 Surface water users
There is some consumption of water for small-scale agriculture in the communal lands along the escarpment,
whilst most of the water used for domestic purposes in the larger towns and cities is obtained either from the
Kafue River or from local boreholes and dolomite aquifers. Large volumes of water are used by commercial
farmers, including large-scale irrigation of sugar cane at the junction of the Kafue and Zambezi rivers.
3.15.1.5 Water management systems
The area falls under the jurisdiction of the Zambian Department of Water Affairs.
3.15.1.6 Human impacts on water resources (excluding mining)
The following could be expected to have an impact on water resources:
• Disposal of solid and liquid wastes at Lusaka, Chilanga, Kafue and Chirundu;
• Urban run off from towns and cities;
• Non-point sources of domestic effluent in the urban and rural areas;
• Contaminated (fertilizers and pesticides) return flows from irrigated agriculture and commercial farming
enterprises; and
• Litter and garbage on the main road between Chirundu and Lusaka.
3.15.2 Mining and mineral processing operations
There are several small gold mines in the area and new copper prospects seem to be commercially viable
(Table 3.14; Figure 3.4). A small zinc and lead mine is starting operations to the north of Lusaka. There are
several prospecting attempts to locate workable gold and semi-precious stones.
Table 3.14: Mining operations in the Chirundu sub-catchment.
Code Number
Name of Mine Commodity (ies)
Mined Status
Relative Size
Probable Impact

cxxviii
Z-18 Chumbwe Gold Operating Small Low – Very low
Z-19 Chakwenga Gold Operating Small Low – Very low
Z-24 Star Zinc, Lead Startup Small Low
Z-60 Chongwe East Copper Prospecting Medium Low
Z-61 Cheowa Copper Prospecting Medium Low
Z-95 Chakwenga Gold, Copper Prospecting Small Very low
Z-98 Pamba Iron Prospecting Small Very low
Minor seepage of cyanide is associated with the gold mining operations, especially from tailings dumps. The
zinc deposit is a sulphide ore so acid mine drainage is a potential problem.
3.15.3 Alluvial mining
None known, but can be anticipated if additional gold deposits are found.
3.15.4 Monitoring systems
The Zambian Department of Water Affairs carries out occasional sampling of water to test the quality of water
supplied to towns.
3.15.5 Water quality data
None available.
3.15.6 Implications for water quality and quantity management
There is no evidence to suggest that mining operations have had any effect on local water resources.
3.16 The Mulungushi sub-catchment

cxxix
3.16.1 General description
3.16.1.1 Hydrology
This area comprises a series of small sub-catchments, whose rivers flow in a southerly direction towards the
Luano Rift valley, where they swing westwards to join the Luangwa River. The two main rivers, the Mulungushi
and the Lusemfwa, are both perennial and have incised relatively deep channels through the edge of the
escarpment where they drop into the Luano Rift Valley. Both of these rivers have been dammed for
hydroelectric power, at the Mulungushi and Mita Hills dams, respectively. Smaller, non-perennial and perennial
tributaries that drain the higher rainfall region to the north of the sub-catchment feed both of these rivers. There
are several small wetland areas and seeps in the upper reaches of the rivers.
3.16.1.2 Geology
The plateau is composed of quartzites, sandstones, arenites and associated rocks, underlain by sedimentary
rocks and some basalt to the south. These rock formations are intruded by small Greenstone formations that
are normally associated with gold and copper mineralization. The Kabwe lead-zinc-vanadium deposit is
associated with a dolomite and limestone outcrop. The mobile belt marking the rim of the Luano Rift Valley
hosts several pegmatite deposits with high quality mica and other pegmatite minerals, as well as small
quantities of gold.
3.16.1.3 Pedology, agriculture and land use
Soils in the sub-catchment can be divided into four groups:
• Moderately deep, well-leached ferralitic soils in the wetter northern parts;
• Moderately deep sandy soils derived from quartzites and sandstones associated with the Luano Rift Valley;
• Moderately deep kaolinitic sandy to loamy sand soils derived from quartzites and associated rocks along the
floor of the rift valley;
• Moderately deep, sandy loams on areas underlain by limestone deposits.
Much of the sub-catchment experiences annual rainfalls in excess of 1,000 mm, whilst areas in the Luano Rift
Valley receive lower rainfalls of around 850 mm.
Land use comprises a mixture of sparsely populated communal lands with subsistence agriculture, densely
populated urban areas of Kabwe and Kapiri Mposhi, with commercial stock farming (beef cattle and goats) and

cxxx
commercial maize and tobacco growing on the plateau. Several small communities are located along the major
roads between Kabwe and Ndola, as well as the great North Road from Kapiri Mposhi through Mkushi to Mpika.
3.16.1.4 Surface water users
There is some consumption of water for small-scale agriculture in the communal lands along the Luano
escarpment, whilst most of the water used for domestic purposes in the larger towns and cities is obtained
either from the Mulungushi River or from local boreholes and dolomite aquifers.
3.16.1.5 Water management systems
The area falls under the jurisdiction of the Zambian Department of Water Affairs.
3.16.1.6 Human impacts on water resources (excluding mining)
The following could be expected to have an impact on water resources:
• Disposal of solid and liquid wastes at Kabwe, Kapiri Mposhi and Mkushi;
• Urban run off from towns and cities;
• Non-point sources of domestic effluent in the urban and rural areas;
• Contaminated (fertilizers and pesticides) return flows from large-scale farming enterprises; and
• Litter and garbage on the main road between Lusaka and Ndola.
3.16.2 Mining and mineral processing operations
There are several small gold mines in the area, whilst the Mkushi gold and copper mines have closed. There
are good prospects for commercial monazite and strontium deposits at Mbolwe Hill, whilst several promising
new copper prospects are located in the north of this sub-catchment (Table 3.15; Figure 3.4). The old lead-
zinc-vanadium deposit at Kabwe is being re-examined with a view to re-working the tailings dumps with
improved extraction technologies.
Table 3.15: Mining operations in the Mulungushi sub-catchment.
Code Number
Name of Mine Commodity (ies)
Mined Status
Relative Size
Probable Impact
Z-15 Lusemfwa Gold Abandoned Very Small Low

cxxxi
Z-17 Jessie Gold Starting Very Small Low-Medium
Z-20a Mkushi Copper, Silver Closed Small Low-Medium
Z-20b Mkushi Claims Copper, Silver Abandoned Very small Very low
Z-21 Mita Hills Pegmatite-Muscovite Closed Very Small Very low
Z-22 Mulungushi Pegmatite-Muscovite Operating Very Small Very low
Z-23 Kabwe Lead, Zinc, Vanadium Exhausted Large Medium-High
Z-66 Mbolwe Hills Monazite, Strontium Prospecting Small Very low
Z-67 Munshiwemba Copper Closed Medium Low
Z-69 Sebembere Copper Prospecting Medium Low
Z-70 Mufukushi Copper Prospecting Medium Low
Z-96 Green Hills Copper Prospecting Small Very low
Z-97 Kampumba Iron, Manganese Prospecting Medium Low
Z-99 Serenje - A Gold Prospecting Small Very low
Z-100 Lonshi Copper Prospecting Small Very low
Z-101 Mtuga Copper Prospecting Small Very low
Z-103 Muchinga Zinc Prospecting Small Very low
Minor seepage of cyanide is associated with the abandoned gold mining operations at the Lusemfwa Mine,
especially from tailings dumps. The lead-zinc-vanadium deposit at Kabwe is a sulphide ore and acid mine
drainage as well as sulphuric acid fumes from the old smelter are a management problem. This mine was the
first mine to operate in the country, starting in 1906. New copper and gold prospects in the Mkushi District show
great promise.
3.16.3 Alluvial mining
None known, but can be anticipated if additional gold deposits are found near Mkushi or in the Luano Rift
Valley.
3.16.4 Monitoring systems
The Zambian Department of Water Affairs carries out occasional sampling of water to test the quality of water
supplied to towns.
3.16.5 Water quality data
cxxxii
None available.
3.166 Implications for water quality and quantity management
There is some evidence to suggest that the mining operations at Kabwe have had adverse effects on the local
environment. Large (but localized) areas are denuded of vegetation as a result of atmospheric pollution from
the smelter and seepage from the waste dumps.
3.17 The Luangwa sub-catchment
3.17.1 General description
3.17.1.1 Hydrology
This area comprises one large sub-catchment containing the Luangwa River, with a series of smaller streams
and rivers that drain into the Luangwa. The Luangwa River flows in a south-southwesterly direction, draining
the Luangwa Rift Valley and also receiving flows from the Mulungushi sub-catchment before swinging
southwards to join the Zambezi River at the town of Feira on the Mozambique border.
The Luangwa River is perennial, though dry season flows are barely discernable. The Luangwa Rift Valley lies
in a rain shadow that reduces rainfall from the southeasterly winds, and annual rainfalls average some 750 mm.
The Luangwa River meanders across a broad floodplain, leaving many isolated oxbow lakes and lagoons. The
central portion of the Luangwa Valley contains the Luangwa North and Luangwa South National parks.
The smaller, perennial and non-perennial streams that drain the Muchinga Escarpment to the west and the
Nyika and Viphya Plateaux to the east have steep gradients and have incised deeply into the country rock.
3.17.1.2 Geology
The plateaux on both sides of the Luangwa Rift Valley are composed of quartzites, sandstones, granites and
gneisses, underlain by sedimentary rocks with coal measures to the east. These rock formations are intruded
by numerous small pegmatites that are host to a variety of high-quality semi-precious stone deposits (amethyst,
garnet, aquamarine).

cxxxiii
Small intrusions of Greenstone formations occur along the mobile belt and these host deposits of gold. A single
occurrence of diamond-bearing kimberlite has been located on the Muchinga Escarpment. The mobile belt
rocks along the lower reaches of the Luangwa River host gold, lead and zinc deposits.
3.17.1.3 Pedology, agriculture and land use
Soils in the sub-catchment can be divided into three groups:
• Moderately deep, well-leached ferralitic soils in the wetter northern, western and southeastern parts of the
sub-catchment;
• Moderately deep sandy soils derived from quartzites and sandstones and associated alluvial material along
the floor of the Luangwa Rift Valley;
• Moderately deep, sandy loams on areas underlain by limestone deposits.
Land use comprises a mixture of sparsely populated communal lands with subsistence agriculture, densely
populated urban areas of Chipata and Lundazi, with commercial stock farming (beef cattle and goats) and
commercial maize and tobacco growing on the wetter southern portions of the sub-catchment. Tourism is
important in the two National Parks. Several small communities are located along the major roads between
Chipata and Lundazi, and north to Songwe, as well as the Great East Road from Lusaka through Chipata to
Lilongwe in Malawi.
3.17.1.4 Surface water users
There is some consumption of water for small-scale agriculture in the communal lands along the Luangwa
escarpment, whilst most of the water used for domestic purposes in the larger towns is obtained from nearby
streams or boreholes. Water used for tourist camps in the national parks is drawn directly from the Luangwa
River.
3.17.1.5 Water management systems
The area falls under the jurisdiction of the Zambian Department of Water Affairs.
3.17.1.6 Human impacts on water resources (excluding mining)
The following could be expected to have an impact on water resources:
• Disposal of solid and liquid wastes at Chipata and Lundazi;

cxxxiv
• Urban run off from towns and villages;
• Non-point sources of domestic effluent in the urban and rural areas;
• Contaminated (fertilizers and pesticides) return flows from larger farms; and
• Litter and garbage on the main road between Lusaka and Chipata.
3.17.2 Mining and mineral processing operations
There are several small alluvial gold operations in the area, with many artisan miners managing to eke out a
living. In addition, numerous artisan miners also extract semiprecious stones (especially garnet and
aquamarine) from pegmatites in the Lundazi District. The Tazara diamond kimberlite appears to be promising
(Table 3.16; Figure 3.4). The old asbestos mine at Lukusuzi has been abandoned.
Table 3.16: Mining operations in the Luangwa sub-catchment.
Code Number
Name of Mine Commodity (ies)
Mined Status
Relative Size
Probable Impact
Z-1 Mbeya Aquamarine Operating Very Small Very low – Low
Z-2 Chama-A Garnet Operating Very Small Very low
Z-3 Chama-B Aquamarine, Garnet Operating Small Low
Z-4 Lundazi-A Aquamarine Operating Artisan (many) Very low
Z-5 Lundazi Coal Operating Small Low
Z-6 Lundazi-B Aquamarine Operating Very Small Very low
Z-7 Lukusuzi Chrysotile asbestos Abandoned Small Very low
Z-8a Lundazi-C Aquamarine Operating Small Very low – Low
Z-8b Lundazi Claims Aquamarine Abandoned Artisan (many) Very low
Z-9 Tazara Diamond – kimberlite Prospecting Very small Very low
Z-10 Sasore Gold – alluvial Operating Small Low
Z-12 Nyimba-A Aquamarine Operating Small Very low
Z-13 Nyimba-B Aquamarine Operating Small Very low
Z-14 Luangwa Gold – alluvial Prospecting Small Low
Z-16 Hillcrest Gold – alluvial Prospecting Small Low
Z-63 Mpongo Lead, Zinc Prospecting Medium Low
Z-64 Chipirinyuma Lead, Zinc Prospecting Medium Low
Z-68 Chipata claims Gold - alluvial Operating Artisan (many) Low - Medium
3.17.3 Alluvial mining

cxxxv
Several stretches of streams and rivers near Chipata are worked by artisan miners for gold. Further prospecting
may reveal additional gold deposits along the Luangwa Mobile Belt and its associated Greenstone formations.
3.17.4 Monitoring systems
The Zambian Department of Water Affairs carries out occasional sampling of water to test the quality of water
supplied to towns.
3.17.5 Water quality data
None available.
3.17.6 Implications for water quality and quantity management
There is some evidence to suggest that the artisan mining operations near Lundazi have contributed small
amounts of suspended material to nearby rivers. There appears to be no evidence of any other impact due to
mining activities in this sub-catchment, possibly due to the dominance of physical weathering processes in the
southern portion where most of the mines are located.
3.18 The Cahora Bassa (Mozambique) sub-catchment
3.18.1 General description
3.18.1.1 Hydrology
This area comprises the Zambezi River zone that stretches from the town of Feira on the Zimbabwe-Zambia
border down to the junction with the Mazowe River. A large number of seasonal and a few perennial streams
drain northwards from Zimbabwe into this zone, as well as southwards from the Zambian and Malawi border.
The very large Cahora Bassa dam is located here, upstream of the town of Tete.

cxxxvi
This portion of the Zambezi Valley lies in a relatively dry zone with annual rainfalls averaging between 650 and
750 mm. Below the Cahora Bassa dam, the Zambezi River flows through the deeply incised Cebrasbassa
Gorge before emerging onto a broad, flat-bottomed river valley where the river meanders between high flood
levees.
The smaller, perennial and non-perennial streams that drain the escarpments from the north and south all have
steep gradients and only contain significant quantities of water after rainfalls.
3.18.1.2 Geology
The plateaux on both sides of the Luangwa Rift Valley are composed of quartzites, sandstones, granites and
gneisses, underlain by Karoo Supergroup sedimentary rocks with extensive coal measures running from west to
east. These rock formations are intruded by numerous small pegmatites and Greenstone formations that are
host to a variety of semi-precious stone deposits and gold.
The intrusions of Greenstone formations and the coal measures mark the position of the Zambezi Mobile Belt
and its associated mineralization. A significant deposit of uranium is also located in this zone.
3.18.1.3 Pedology, agriculture and land use
Soils in the sub-catchment can be divided into two main groups:
• Moderately deep, well-leached soils in the wetter northern and eastern parts of the sub-catchment; and
• Moderately deep sandy soils derived from quartzites and sandstones and associated alluvial material along
the floor of the Zambezi Valley.
Land use comprises a mixture of sparsely populated communal lands with subsistence agriculture, the densely
populated urban area of Tete, and the small communities associated with the various mining ventures in this
sub-catchment. Livestock consists almost entirely of goats and most families rely on fish caught from the
Zambezi River. Several small communities are located along the major roads between Zimbabwe and Blantyre
in Malawi and between Tete and the Cahora Bassa Dam. Large areas of vegetation have been removed to
make charcoal for fuel.
3.18.1.4 Surface water users
There is some consumption of water for small-scale agriculture, whilst water used for domestic purposes in the
larger towns is obtained from the Zambezi River.

cxxxvii
3.18.1.5 Water management systems
The area falls under the jurisdiction of the Mozambican Ministerio De Aguas.
3.18.1.6 Human impacts on water resources (excluding mining)
The following could be expected to have an impact on water resources:
• Minor disposal of solid and liquid wastes at Cahora Bassa and Tete;
• Non-point sources of domestic effluent in the urban and rural areas;
• Litter and garbage on the main road between Zimbabwe and Blantyre in Malawi.
3.18.2 Mining and mineral processing operations
This sub-catchment hosts several small alluvial gold operations in the area immediately downstream of the
Cahora Bassa Dam and the gorge, with many artisan miners managing to eke out a living. In addition,
numerous artisan miners also extract semiprecious stones (especially aquamarine) from pegmatites close to the
border with Zambia. The Moatize Coal Mine is the largest mine in the area (Table 3.17; Figure 3.4).
Table 3.17: Mining operations in the Cahora Bassa (Mozambique) sub-catchment.
Code Number
Name of Mine Commodity (ies) Mined
Status Relative
Size Probable Impact
Z-11 Capoche Aquamarine Prospecting Small Very low
Z-102 Gambito Gold Abandoned Small Very low
M-1 Missale Gold - alluvial Operating Artisan (many) Low
M-2 Fingoè Coal Prospecting Small Very low
M-3 Furancungo Coal Operating Very small Very low
M-4 Tsangano Coal Operating Very small Very low
M-5 Zambezi diggings Gold - alluvial Operating Artisan (many) Low – Medium
M-6 Zambezi Coal Abandoned Small Very low
M-7 Mphende Coal Prospecting Small Very low
M-8 Songo – Coal Coal Operating Very small Low
M-9 Matangua Uranium, Thorium Operating Very small Medium
M-10 Moatize Coal Operating Medium Medium
M-22 Moatize – Iron A Iron Prospecting Small Very low

cxxxviii
M-23 Moatize – Iron B Iron Prospecting Small Very low
M-24 Tete Coal Prospecting Medium Low
M-25 Tete North – A Fluorite Abandoned Small Very low
M-26 Tete North – B Iron Prospecting Medium Very low
M-27 Tete North – C Iron Prospecting Small Very low
M-28 Cassoca – Iron Iron Prospecting Small Very low
M-29 Cassoca Alluvial Gold – Alluvial Operating Artisan (many) High
M-30 Ulongue Iron Prospecting Small Very low
M-31 Ulongue – A Fluorite Prospecting Small Very low
M-32 Ulongue – B Fluorite Prospecting Small Very low
M-33 Cahora Bassa-A Iron Prospecting Small Very low
M-34 Cahora Bassa-B Iron Prospecting Small Very low
M-35 Fingoè – Iron Iron Abandoned Small Very low
M-36 Zumbo – East Nickel Prospecting Small Very low
M-37 Zumbo Iron Abandoned Small Very low
M-39 Songo Copper Prospecting Small Very low
3.18.3 Alluvial mining
Several stretches of streams and rivers near Cahora Bassa are worked by artisan miners for gold. Further
prospecting may reveal additional gold deposits along the Zambezi Mobile Belt and its associated Greenstone
formations.
3.18.4 Monitoring systems
The Mozambican Departimento De Aguas carries out sporadic sampling of water to test the quality of water
supplied to towns.
3.18.5 Water quality data
None available.

cxxxix
3.18.6 Implications for water quality and quantity management
There is some evidence to suggest that the Moatize Coal Mine may have had a minor-medium impact on local
water quality whilst other mining operations are likely to have had small, localized impacts at most. The artisan
gold diggings have contributed to a considerable increase in the suspended sediment load of the Zambezi River
during periods of low flow. The Matangua uranium and thorium deposit holds the risk of contaminating local
water supplies.
3.19 The Shire (Malawi) sub-catchment (including Tanzania)
3.19.1 General description
3.19.1.1 Hydrology
This area comprises one large sub-catchment containing the Lake Malawi and its outflow, the Shire River, with
a series of smaller streams and rivers that drain into Lake Malawi from the Malawi and Tanzanian portions of
the rift valley.
In the Tanzanian sector, the most import inflow is the Ruhuhu River, with smaller rivers draining the Livingstone
Mountains and entering Lake Malawi at Songwe. All of these rivers are short, with steep gradients and carry
large volumes of water since they drain areas that receive annual rainfalls in excess of 2,000 mm.
Lake Malawi also receives inflows from several smaller perennial streams and rivers that drain the Rift Valley
and flow into the lake. Outflows from Lake Malawi flow down the Shire River to the Zambezi River.
The Shire River is perennial, though flows have declined in recent years due to a drop in the water level of Lake
Malawi. The lower portion of the Lake Malawi Rift Valley lies in a partial rain shadow that reduces rainfall from
the southeasterly winds, and annual rainfalls average some 850 mm. Slightly further south, the Mulanje Plateau
receives over 2,500 mm of rainfall and provides strong inflows into the Shire River.
All of the smaller, perennial and non-perennial streams that drain the Rift Valley into Lake Malawi have steep
gradients and have incised deeply into the country rock.
3.19.1.2 Geology

cxl
The plateaux on both sides of the Lake Malawi Rift Valley are composed of quartzites, sandstones, granites and
gneisses, underlain by sedimentary rocks with coal measures to the east. In the south and north, these rock
formations are intruded by numerous small Greenstone formations that host gold deposits.
In the southern portion of the Shire catchment, extensive deposits of limestone and gypsum are found, as well
as good quality bauxite on Mulanje Mountain. A small deposit of monazite is also found near to Lake Chilwa in
the south.
3.19.1.3 Pedology, agriculture and land use
Soils in the sub-catchment can be divided into three groups:
• Moderately deep to very deep, well-leached ferralitic soils in the wetter northern, western and southeastern
parts of the sub-catchment;
• Moderately deep sandy soils derived from quartzites and sandstones and associated alluvial material along
the floor of the Lake Malawi Rift Valley;
• Moderately deep, sandy loams on areas underlain by limestone deposits; and
• Small areas of sodic soils in the far south of the sub-catchment.
Land use comprises a mixture of densely populated communal lands with extensive subsistence agriculture,
densely populated urban areas of Lilongwe, Zomba, Blantyre, Kotakota and Karonga, with commercial
cultivation of maize, cotton and tobacco. Some stock farming (beef cattle and goats) takes place in the central
and southern portions of the sub-catchment. Tourism on Lake Malawi is extremely important and several
National Parks are located along the length of the rift valley. Numerous small and large communities are
located along the major roads running north south alongside Lake Malawi, and alongside the main roads that
connect Malawi with Zambia, Mozambique and Zimbabwe.
3.19.1.4 Surface water users
Large volumes of water are consumed by small- and medium-scale irrigation agriculture along the banks of
rivers leading to the lake. Most of the water used for domestic consumption in the larger towns is obtained from
nearby streams or dolomite formations.
3.19.1.5 Water management systems
The area falls under the jurisdiction of the Malawi Department of Water Affairs.
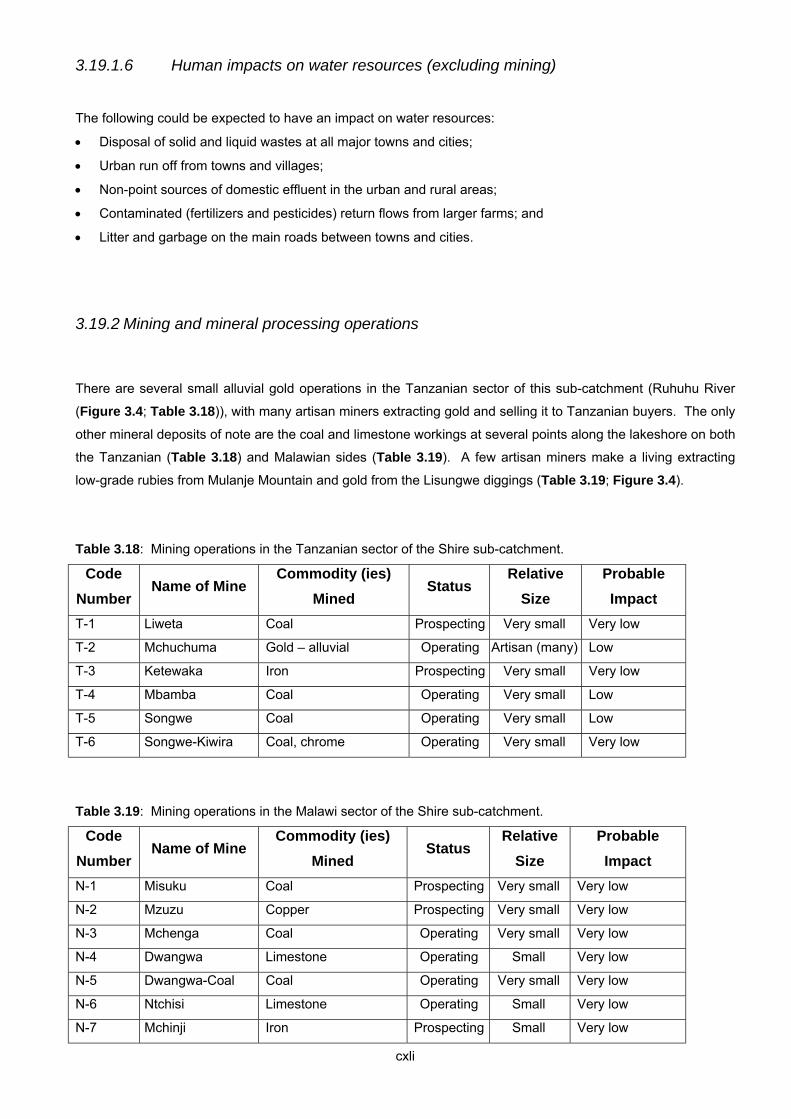
cxli
3.19.1.6 Human impacts on water resources (excluding mining)
The following could be expected to have an impact on water resources:
• Disposal of solid and liquid wastes at all major towns and cities;
• Urban run off from towns and villages;
• Non-point sources of domestic effluent in the urban and rural areas;
• Contaminated (fertilizers and pesticides) return flows from larger farms; and
• Litter and garbage on the main roads between towns and cities.
3.19.2 Mining and mineral processing operations
There are several small alluvial gold operations in the Tanzanian sector of this sub-catchment (Ruhuhu River
(Figure 3.4; Table 3.18)), with many artisan miners extracting gold and selling it to Tanzanian buyers. The only
other mineral deposits of note are the coal and limestone workings at several points along the lakeshore on both
the Tanzanian (Table 3.18) and Malawian sides (Table 3.19). A few artisan miners make a living extracting
low-grade rubies from Mulanje Mountain and gold from the Lisungwe diggings (Table 3.19; Figure 3.4).
Table 3.18: Mining operations in the Tanzanian sector of the Shire sub-catchment.
Code Number
Name of Mine Commodity (ies)
Mined Status
Relative Size
Probable Impact
T-1 Liweta Coal Prospecting Very small Very low
T-2 Mchuchuma Gold – alluvial Operating Artisan (many) Low
T-3 Ketewaka Iron Prospecting Very small Very low
T-4 Mbamba Coal Operating Very small Low
T-5 Songwe Coal Operating Very small Low
T-6 Songwe-Kiwira Coal, chrome Operating Very small Very low
Table 3.19: Mining operations in the Malawi sector of the Shire sub-catchment.
Code Number
Name of Mine Commodity (ies)
Mined Status
Relative Size
Probable Impact
N-1 Misuku Coal Prospecting Very small Very low
N-2 Mzuzu Copper Prospecting Very small Very low
N-3 Mchenga Coal Operating Very small Very low
N-4 Dwangwa Limestone Operating Small Very low
N-5 Dwangwa-Coal Coal Operating Very small Very low
N-6 Ntchisi Limestone Operating Small Very low
N-7 Mchinji Iron Prospecting Small Very low
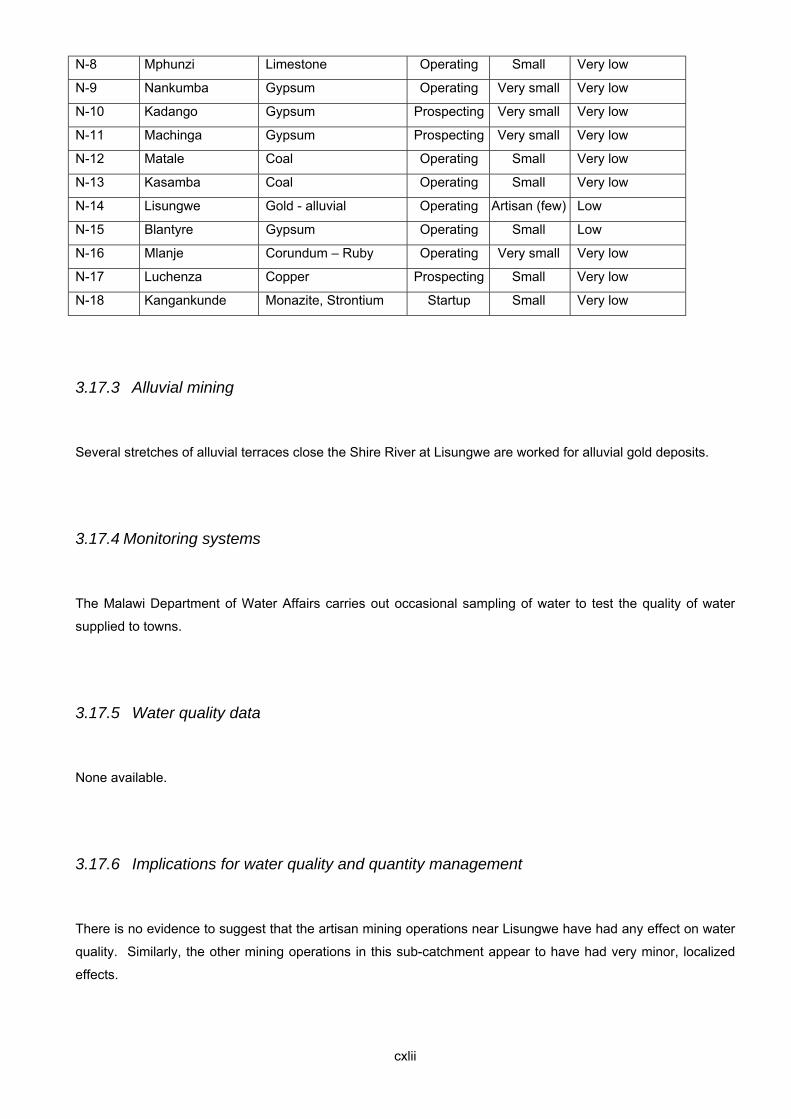
cxlii
N-8 Mphunzi Limestone Operating Small Very low
N-9 Nankumba Gypsum Operating Very small Very low
N-10 Kadango Gypsum Prospecting Very small Very low
N-11 Machinga Gypsum Prospecting Very small Very low
N-12 Matale Coal Operating Small Very low
N-13 Kasamba Coal Operating Small Very low
N-14 Lisungwe Gold - alluvial Operating Artisan (few) Low
N-15 Blantyre Gypsum Operating Small Low
N-16 Mlanje Corundum – Ruby Operating Very small Very low
N-17 Luchenza Copper Prospecting Small Very low
N-18 Kangankunde Monazite, Strontium Startup Small Very low
3.17.3 Alluvial mining
Several stretches of alluvial terraces close the Shire River at Lisungwe are worked for alluvial gold deposits.
3.17.4 Monitoring systems
The Malawi Department of Water Affairs carries out occasional sampling of water to test the quality of water
supplied to towns.
3.17.5 Water quality data
None available.
3.17.6 Implications for water quality and quantity management
There is no evidence to suggest that the artisan mining operations near Lisungwe have had any effect on water
quality. Similarly, the other mining operations in this sub-catchment appear to have had very minor, localized
effects.

cxliii
3.20 The Mazowe (Mozambique) sub-catchment
3.20.1 General description
3.20.1.1 Hydrology
This area comprises the downstream portion of the Mazowe River after it flows out of Zimbabwe. A large
number of seasonal streams drain eastwards from Zimbabwe into this zone. This portion of the Zambezi basin
lies in a relatively dry zone with annual rainfalls averaging between 550 and 650 mm.
3.20.1.2 Geology
This sub-catchment is underlain by quartzites, sandstones, granites and gneisses, underlain by Karoo
Supergroup sedimentary rocks. The rock formations are intruded by occasional small pegmatites and
Greenstone formations that are host to a variety of minerals including small deposits of gold.
3.20.1.3 Pedology, agriculture and land use
Soils in the sub-catchment can be divided into two main groups:
• Shallow to moderate, sandy soils on the hillslopes and valleys; and
• Moderately deep sandy soils derived from quartzites and sandstones and associated alluvial material along
the floor of the Mazowe River valley.
Land use comprises a mixture of sparsely populated areas with subsistence agriculture and the small
communities associated with the small active mining ventures in this sub-catchment. Livestock consists almost
entirely of goats and most families rely on fish caught from the Mazowe River. Areas of vegetation have been
removed around settlements to make charcoal for fuel.
3.20.1.4 Surface water users
There is some consumption of water for small towns and communities, as well as for subsistence agriculture.

cxliv
3.20.1.5 Water management systems
The area falls under the jurisdiction of the Mozambican Ministerio De Aguas.
3.20.1.6 Human impacts on water resources (excluding mining)
The following could be expected to have an impact on water resources:
• Minor disposal of solid and liquid wastes at urban centres; and
• Non-point sources of domestic effluent in the urban and rural areas;
3.20.2 Mining and mineral processing operations
This sub-catchment hosts three small mining operations, one of which was abandoned during the civil war
(Table 3.20; Figure 3.4).
Table 3.20: Mining operations in the Mazowe (Mozambique) sub-catchment.
Code Number
Name of Mine Commodity (ies) Mined
Status Relative
Size Probable Impact
M-11 Mazowe Fluorspar Abandoned Very small Very low
M-12 Luenha – A Kyanite Operating Very small Very low
M-13 Guro Kyanite Operating Very small Very low
M-15 Guro – South Kyanite Abandoned Small Very low
M-17 Luenha – Iron Iron Prospecting Small Very low
M-18 Luanha – B Iron Prospecting Small Very low
M-19 Luanha – C Kyanite Operating Very small Very low
3.20.3 Alluvial mining
No evidence available, though it is highly likely that artisan miners work the reaches of the Mazowe River for
alluvial gold.

cxlv
3.20.4 Monitoring systems
This area falls within the jurisdiction of the e Mozambican Departimento De Aguas.
3.20.5 Water quality data
None available.
3.20.6 Implications for water quality and quantity management
There is no evidence to suggest that any of the mines located within this sub-catchment have had any adverse
effects on water quality. However, the Mazowe River contains poor water quality caused by the numerous
alluvial gold diggers upstream in Zimbabwe.
3.21 The Lower Zambezi (Mozambique) sub-catchment
3.21.1 General description
3.21.1.1 Hydrology
This area comprises the most downstream portion of the Zambezi basin as it flows to the Indian Ocean. A large
number of seasonal streams drain northwards from the mountainous region on the border between Zimbabwe
and Mozambique, into the Zambezi River. This portion of the Zambezi basin lies in a relatively moist zone with
annual rainfalls averaging over 1,000 mm.
3.21.1.2 Geology
This sub-catchment is underlain by crystalline basement rocks, predominantly quartzites, sandstones, granites
and gneisses. Many of these rocks outcrop at surface and are easily visible as large dwalas or batholiths.

cxlvi
3.21.1.3 Pedology, agriculture and land use
Soils in the sub-catchment can be divided into two main groups:
• Moderately deep to deep sandy soils across most of the sub-catchment;
• Shallow, sandy soils on the hillslopes; and
• Deep deposits of rich alluvial soils on the river terraces flanking both banks of the Zambezi River.
Land use comprises a mixture of sparsely populated areas with subsistence agriculture and small administrative
centres, as well as larger commercial farming enterprises that are engaged in growing irrigated sugar cane,
cashew nuts and some cotton. Livestock consists entirely of goats and most families rely on fish caught from
the Zambezi River.
3.21.1.4 Surface water users
There is some consumption of water for small towns and communities, as well as for subsistence agriculture.
Irrigation of sugar cane and cashew nut plantations occurs closer to the coast, using water abstracted from the
Zambezi River.
3.21.1.5 Water management systems
The area falls under the jurisdiction of the Mozambican Ministerio De Aguas.
3.21.1.6 Human impacts on water resources (excluding mining)
The following could be expected to have an impact on water resources:
• Minor disposal of solid and liquid wastes at urban centres; and
• Non-point sources of domestic effluent in the urban and rural areas;
3.21.2 Mining and mineral processing operations
This sub-catchment hosts a few small prospecting operations and an extensive area of artisan mining (Table 3.21; Figure 3.4).

cxlvii
Table 3.21: Mining operations in the Lower Zambezi (Mozambique) sub-catchment.
Code Number
Name of Mine Commodity (ies) Mined
Status Relative
Size Probable Impact
M-14 Luenha Alluvial Gold - Alluvial Operating Artisan (many) High
M-16 Zambezi – A Iron Prospecting Small Very low
M-20 Zambezi – B Fluorite Prospecting Small Very low
M-21 Zambezi – C Fluorite Prospecting Small Very low
There is some evidence that the artisan mining for gold at Luenha causes an extensive amount of sediment to
enter the nearby rivers and mercury is also released into the water from gold processing operations. There are
also extensive deposits of heavy mineral sands along the coast near the Zambezi Delta at Chinde.
3.21.3 Alluvial mining
No evidence available.
3.21.4 Monitoring systems
This area falls within the jurisdiction of the e Mozambican Departimento De Aguas.
3.21.5 Water quality data
None available.
3.21.6 Implications for water quality and quantity management
None.

cxlviii
3.22 The Chamabonda sub-catchment
3.22.1 General description
3.22.1.1 Hydrology
This is Zone Z1 of Area A (ZSG, 1984), located in the extreme northwest of Zimbabwe (Figure 3.2). The
catchment zone comprises a series of small, ephemeral rivers that flow into the Zambezi shortly above or
shortly below Victoria Falls. The largest river is the Chamabonda Vlei.
3.22.1.2 Geology
The Upper Karoo Batoka Basalt Formation underlies the catchment, covered in some areas by Kalahari Sands
(Figure 3.6; ZGS, 1999).
3.22.1.3 Pedology, agriculture and land use
The soils are in two groups: the Kalahari Sands and very shallow, gravelly soils overlying the basalts (DRSS,
1979). It lies within Natural Regions IV and V: fairly low and unreliable rainfall under 650mm per annum (ZSG,
1997; Surveyor General and AGRITEX, 1998). The predominance of Kalahari Sands makes the area generally
unsuitable for agriculture. Land use is largely Parks & Wildlife Land and Forestry Commission Land38, with
sparsely populated Communal Land in the east and a few private farms, some devoted to the tourist industry,
along the railway line (ZSG, 1998).
3.22.1.4 Surface water users
38 Zambezi National Park, Victoria Falls National Park, Matetsi Safari Area and Panda Masuie Forest Land

cxlix
The only settlements of any size are the resort town of Victoria Falls and the border post of Kazangula. The
other main use of water is tourist use of the Zambezi River: boating, canoe safaris, white water rafting, scenic
value, fishing and game viewing. The Zambezi River, along with a few boreholes, is the only source of water for
wild animals in the Parks & Wildlife Land in the dry season.
3.22.1.5 Water management systems
This area falls under the management of the Gwayi Catchment Council under ZINWA.
3.22.1.6 Human impacts on water resources (excluding mining)
The following could be expected to have an impact on water resources:
• Disposal of domestic and commercial solid waste, Victoria Falls and Kazangula;
• Disposal of domestic and commercial liquid effluent, Victoria Falls and Kazangula;
• Fuel loss and litter on the main roads and the railway;
• Run off from Victoria Falls International Airport;
• Minor non-point impact from sparse, subsistence agriculture in Hwange Communal lands; and
• Non-point impact from minefield in northeast.
3.22.2 Mining and mineral processing operations
The catchment falls under the Bulawayo Mining District (ZGS, 1995). There are no known mining or mineral
processing operations in the area. There are no current legal mineral exploration activities39 (ZGS, 2001).
There are no known minerals processing operations in the sub-catchment.
39 This refers to current Exclusive Prospecting Orders

cl
3.22.3 Alluvial mining
Neither known nor likely.
3.22.4 Monitoring systems
None.
3.22.5 Water quality data
None.
3.22.6 Implications for water quality and quantity management
None.
3.23 The Matetsi sub-catchment

cli
3.23.1 General description
3.23.1.1 Hydrology
This is Zone M (ZSG, 1984), located in the extreme northwest of Zimbabwe (Figure 3.2). The catchment is that
of the Matetsi River which flows into the Zambezi shortly below the Batoka Gorge. The western end of the
catchment contains the Kazuma Pan wetlands, a permanent wetland and grassy pan depression area.
3.23.1.2 Geology
The Upper Karoo Batoka Basalt Formation underlies the catchment, covered in some areas by Kalahari Sands
(Figure 3.6; ZGS, 1999).
3.23.1.3 Pedology, agriculture and land use
The soils are in two groups: the Kalahari Sands and very shallow, gravelly soils overlying the basalts (DRSS,
1979). It lies within Natural Regions IV and V: fairly low and unreliable rainfall under 650mm per annum (ZSG,
1997; Surveyor General and AGRITEX, 1998). Land use is largely Parks & Wildlife Land and Forestry
Commission Land40, with sparsely populated Communal Land in the east and a few private farms along the
railway line (ZSG, 1998). Farming is generally extensive to semi-extensive: livestock and a few drought
resistant crops.
3.23.1.4 Surface water users
The only settlement of any size is the border post of Mpandamatenga. The other main use of water is use of
the Zambezi River for tourist purposes: white water rafting, scenic value, fishing and game viewing. The
Kazuma Pan wetlands are of critical importance to wildlife, including migratory birds (DNP&WM, 1990).
40 Kazuma Pan National Park, Matetsi Safari Area and Kazuma and Fuller Forest Lands

clii
3.23.1.5 Water management systems
This area falls under the management of the Gwayi Catchment Council under ZINWA.
3.23.1.6 Human impacts on water resources (excluding mining)
The following could be expected to have an impact on water resources:
• Disposal of domestic solid waste, Mpandamatenga;
• Disposal of domestic liquid effluent, Mpandamatenga;
• Fuel loss and litter on the main road and the railway; and
• Minor impact from sparse, subsistence agriculture in Hwange Communal lands.
3.23.2 Mining and mineral processing operations
The catchment falls under the Bulawayo Mining District (ZGS, 1995). There are a few calcite deposits, all now
out of production (Table 3.22).
Table 3.22: Mining operations in the Matetsi sub-catchment. Name Commodity Status Total produced /t Potential Impact
Rhocal Calcite Closed 1940 54776.0 Low
See ZGS (1988a) for locations.
There are no current legal mineral exploration activities (ZGS, 2001). There are no known minerals processing operations in the sub-catchment.
3.23.3 Alluvial mining
Neither known nor likely.

cliii
3.23.4 Monitoring systems
None.
3.23.5 Water quality data
None.
3.23.6 Implications for water quality and quantity management
It is possible that Rhocal and associated calcite deposits contributed somewhat to the silt load in the Matetsi
River in the first half of the last century. However, current impact is likely to be minimal.
3.24 The Deka sub-catchment
3.24.1 General description
3.24.1.1 Hydrology
This is Zone D of Area A (ZSG, 1984), located in the northwest of Zimbabwe. The catchment is that of the Deka
River which flows into the Zambezi shortly above the Devil’s Gorge (Figure 3.2). The southwestern end of the
catchment, and headwaters of the Deka River, is the Tom’s Vlei wetlands, a wetland and grassy pan depression
area.
3.24.1.2 Geology

cliv
The sub-catchment is underlain by the Upper Karoo Batoka Basalt Formation in the southwest, Lower Karoo
Group sediments, containing the Hwange coal seams, in the central area, Upper Karoo Group sediments in the
north and Kalahari Sands in the south (Figure 3.6; ZGS, 1999).
3.24.1.3 Pedology, agriculture and land use
The soils are in two groups: the Kalahari Sands and very shallow, gravelly soils overlying the basalts (DRSS,
1979). It lies within Natural Regions IV and V: fairly low and unreliable rainfall under 650mm per annum (ZSG,
1997; Surveyor General and AGRITEX, 1998). Land use comprises Parks & Wildlife Land41 in the south, the
Hwange Town and sparsely populated Communal Land in the north (ZSG, 1998).
3.24.1.4 Surface water users
Wankie Colliery and Hwange Thermal Power Station are the main water users, extracting water from the
Zambezi River via a pipeline from the Deka Drum site. Hwange Town is also a water user for domestic and
commercial purposes. The other main use of water is use of the Zambezi River for tourist purposes: white
water rafting, scenic value, fishing and game viewing. The Deka River, when flowing, and the Tom’s Vlei
wetlands in the southwest are of importance to wildlife.
3.24.1.5 Water management systems
This area falls under the management of the Gwayi Catchment Council under ZINWA.
3.24.1.6 Human impacts on water resources (excluding mining)
The following could be expected to have an impact on water resources:
• Disposal of waste from the Power Station
• Disposal of domestic and commercial solid waste, Hwange Town
• Disposal of domestic and commercial liquid effluent, Hwange Town
• Run off, Hwange Town Airport.
• Fuel loss and litter on the main road and the railway
• Minor non-point impact from sparse, subsistence agriculture in Hwange Communal lands
41 Hwange National Park and Matetsi Safari Area

clv
• Non-point impact from minefield in far north.
3.24.2 Mining and mineral processing operations
The catchment falls under the Bulawayo Mining District (ZGS, 1995). The main mining operation is Wankie
Colliery, where coal is mined from the Lower Karoo sediments. There is also a coking plant. Tin was mined at
Labyrinth Mine in the south, but not any longer. There also are a few calcite deposits, all now out of production
(Table 3.23).
Table 3.23: Mining Operations in the Deka sub-catchment.
Name Commodity Status Total produced /t Potential Impact
Antenup Calcite Closed 1964 5413.0 Low
Calrho Calcite Closed 1964 12776.0 Low
Gobe Calcite Closed 1964 14968.0 Low
Kalanga Calcite Closed 1966 8499.0 Low
Mwemba/Deka Calcite Closed 1968 13702.0 Low
PJG Calcite Closed 1965 60735.0 Low
Store Calcite Closed 1967 5012.0 Low
Wankie Coal In operation 145149888.0 High
Wankie Pyrite In operation 91276.0 High
See ZGS (1988a) for locations.
There is exploration for diamonds (ZGS, 2001).
3.24.3 Alluvial mining
Neither known nor likely.
3.24.4 Monitoring systems
No public monitoring currently. ZINWA intends to establish a few monitoring points. Wankie Colliery operates
an internal monitoring system.

clvi
3.24.5 Water quality data
None available from ZINWA. The following data (Table 3.24) covers actual discharge from Wankie Colliery.
Table 3.24: Actual Discharge from Wankie Colliery, after Chenje and others (1998). pH 8.4 Conductivity 290.5µS/cm TDS 1699.4ppm Total
hardness
109.0ppm
Alkalinity 601.2ppm BOD 180.0ppm COD 3600ppm Ammonia 2.7ppm N
HCO3- 733.5ppm Cl- 171.9ppm PO4
3- 0.6ppm SO42- 1589.6ppm
NO3- 20.8ppm N Na 88.0ppm Fe 1.4ppm K 15.6ppm
Mg 11.0ppm Ca 27.3ppm K 15.6ppm
3.24.6 Implications for water quality and quantity management
In the absence of any water quality data from the Deka River, it is only possible to make some general
interpretations. The major concern is Wankie Colliery and Hwange Power Station. The production of coal and
pyrite, and the conversion of coal to coke, is likely to be associated with acid mine drainage, and release of iron
and sulphate into the Deka River. However, the data provided by Chenje et al. (1998) suggests that ammonia
and nitrate, presumably from explosive residues, may also be a problem. Fly ash and hot water effluent from
the power station are also possible areas of concern.
3.25 The Gwayi sub-catchment
3.25.1 General description
3.25.1.1 Hydrology

clvii
This is Zones G1-G6, B1-B3, S1-S6, IN and L of Area A (ZSG, 1984). The large Gwayi Sub-catchment
comprises over half of Matabeleland North Province, stretching from the Devil’s Gorge on the Zambezi River in
the north to the City of Bulawayo on the central watershed (Figure 3.2). The Gwayi River is perennial, as are its
major tributaries, the Shangani and Bembezi Rivers. The two major wetlands in the sub-catchment are the
central Shangani valley (Zone S4 and the eastern part of Zone S2 of Area A of ZSG (1984)) and the Dandari
Vlei at the head of the Lukosi River (southern Zone L of Area A; ZSG, (1984)).
3.25.1.2 Geology
See Figure 3.6 (ZGS, 1999). Karoo Supergroup rocks, covered by Kalahari Sands in many areas, underlie the
northern and central thirds of the sub-catchment. The Karoo System rocks are broken by the crystalline
Kamativi-Dete Inlier. The Archaean Zimbabwe Craton, comprising granitic terrain and the Bulawayo, Inyati and
Midlands Greenstone Belts, underlies the southern third of the sub-catchment.
3.25.1.3 Pedology, agriculture and land use
Soils in the sub-catchment can be divided into five groups:
• Kalahari Sands;
• Very shallow, gravelly soils derived from Upper Karoo sediments and basalts;
• Moderately deep sandy soils derived from Lower Karoo sediments;
• Shallow to moderately shallow clays and loams formed from Greenstone Belt rocks;
• Moderately shallow, coarse-grained sandy, kaolinitic soils derived from granites (DRSS, 1979).
The sub-catchment lies generally within Natural Region IV: fairly low rainfall of 450mm to 650mm per annum
(ZSG, 1997; Surveyor General and AGRITEX, 1998).
Land use is mainly Communal Lands in the northern and central areas and commercial and resettlement
farming in the south (ZSG, 1998). Farming is generally extensive to semi-extensive: livestock and a few
drought resistant crops. In parts of the southeast, irrigation allows the growing of more sensitive crops on the
commercial farms. There is some Parks & Wildlife Land and Forestry Commission Land42 in the northwest.
The major settlements are the Cities of Bulawayo in the far southeast and Gweru in the far east, Nkayi Village
and Lupane Town in the central area and Kamativi and Dete Villages in the north. The most densely populated
areas away from the cities are Lupane and Nkayi Communal lands in the central area and the Resettlement
Areas in Bubi and Umguza Districts (ZSG, 1998).
42 Hwange National Park, Deka Safari Area and Sikumi, Ngamo and Gwayi group Forest Lands

clviii
3.25.1.4 Surface water users
The City of Bulawayo draws water from the Khami and Mguza Rivers (tributaries of the upper Gwayi River:
Zones G3 and G5 of Area A (ZSG, 1984). Bulawayo also extracts considerable water from the Nyamandhlovu
Aquifer, which may have a deleterious affect on water levels in rivers in Zones G4, G5 and G6 (ZSG, 1984).
Irrigation by commercial agriculture is a major water user in Zones S5, S6 (note Shangani Tiyabenzi Dam), B3,
G3, G4, G5 and G6 (ZSG, 1984). There are major irrigation projects in the middle Shangani valley, notably the
rice project (Zones S2 and S4 in ZSG (1984)).
3.25.1.5 Water management systems
The sub-catchment falls under the Gwayi Catchment Council of ZINWA. This sub-catchment is also the site of
the proposed Zambezi Bulawayo Pipeline Project, which is scheme designed to extract water from the Zambezi
River and transport it by pipeline across the Gwayi Sub-catchment to Lupane, Nyamandhlovu and ultimately the
water-stressed City of Bulawayo.
3.25.1.6 Human impacts on water resources (excluding mining)
The following could be expected to have an impact on water resources:
• Landfills, urban areas of Bulawayo, Gweru, Lupane, Dete and Kamativi;
• Disposal of liquid effluent, urban areas of Bulawayo, Gweru, Lupane, Dete and Kamativi;
• Urban run off, urban areas of Bulawayo, Gweru, Lupane, Dete and Kamativi;
• Non-point domestic effluent, rural areas;
• Non-point impact of agriculture (pesticides, fertilizers, etc), especially in the south and southeast where
commercial agriculture is practiced;
• Non-point impact of irrigation in redistribution of river waters;
• Minor non point impact from sparse, subsistence agriculture in Communal lands;
• Sawmills, Gwayi Forest Land and neighbouring Forest Lands;
• Fuel loss and litter on the main roads and railways;
• Run off, Bulawayo International Airport, Induna Airport (Bulawayo) and Moffat Airport (Gweru); and
• Non-point impact from minefield in far north.
3.25.2 Mining and mineral processing operations

clix
The catchment falls mainly under the Bulawayo Mining District, as well as the Gweru Mining District in the
southeast (ZGS, 1995). The main mining activity is gold mining in the Greenstone Belts in the south, the
Shangani nickel mine and, historically, tin mining in the Kamativi-Dete Inlier in the north. Fireclay and kaolin are
quarried in the central area (Table 3.25).
Table 3.25: Mining operations in the Gwayi sub-catchment.
Name Commodity Status Total produced /t
Potential Impact
Chikodzi Agate Closed 1982 29.0 Low
Mazibope Agate Closed 1974 46.7 Low
Chikodzi Amethyst Closed 1982 25.5 Low
Mazibope Amethyst Closed 1974 18.3 Low
Gothic Antimony Closed 1984 1083.0 High
Bet Asbestos Closed 1954 1056.2 Low
Bemas Clay Closed 1984 375739.0 Low
Shangani Cobalt In operation 227.4 High: AMD possible
Clare Diamond Closed 1913 0.74ct Low
Colossus Diamond Closed 1941 143.6ct Low
Somabula Diamond Close 1960 15896ct Medium
Wessels Diamond Closed 1912 81ct Low
Berg Fireclay Closed 1984 11269.0 Low
Dagamella Fireclay Closed 1980 32176.0 Low
Firdon Fireclay Open in 1984 348625.0 Low
Inyantue Fireclay Closed 1977 99564.0 Low
Entuba Fluorite Closed 1965 1395.0 Low
Fluorite The First Fluorite Closed 1967 3177.0 Low
Isabella (B & S or
Motapa)
Gold Operational 9.5 High: Arsenic possible,
large open pits
Lonely Gold Closed, reworking
dumps
34.9 High: Size
Old Nic Gold Closed 6.6 Medium
Queens Gold 5.2 Medium
Sunace Gold 8.2 Medium
Turk Gold In operation 12.6 High: Arsenic possible
Athi Kaolin Closed 1979 2315.3 Low
Fuesi Kaolin Closed 1976 3440.2 Low
Elbas Lead Closed 1970 183.0 Medium: AMD possible
Pilgrim Mercury Closed 1941 0.0064 High
Shangani Nickel In operation 29443.0 High: AMD possible
Ivene Quartz Closed 1959 43756.0 Low

clx
Leek Quartz Closed 1984 384338.0 Low
Osage Silver Open in 1984 5.9 Medium: AMD possible
Athi Talc Closed 1968 2633.0 Low
Gwaai Tantalum Closed 1981 34.6 Low
Kamativi Tantalum Closed 1984 559.1 Low
Lutope Tantalum Closed 1979 7.8 Low
Wolf Cub Tantalum Closed 1968 8.2 Low
Gwaai Tin Closed 1983 454.7 Low
Kamativi Tin Closed 1980s 23834.0 Medium
Lutope Tin Closed 1983 996.000 Low
RHA Tungsten Closed 1979 1247.7 Low
For locations, see ZGS (1988a) and ZGS (1988b).
There is considerable exploration taking place in the south, mainly for gold, silver, nickel, diamonds, asbestos
and various base metals, and a single EPO for diamonds and garnet south of Hwange (ZGS, 2001).
3.25.3 Alluvial mining
Chiyanike (1997) has reported alluvial mining of gold from the Gwayi, Shangani and Bembezi Rivers. It may
also take place in tributaries of these rivers, especially the Mguza and Gweru.
3.25.4 Monitoring systems
ZINWA has a number of water quality monitoring points on the Gwayi and Mgusa Rivers. It is in the process of
establishing regular monthly sampling operations. Some mines carry out their own monitoring.
3.25.5 Water quality data
Water quality data are available from ZINWA for two monitoring stations on the Mgusa River.
3.25.6 Implications for water quality and quantity management

clxi
The two lone water quality data points lie in an area of historical gold mining, and it is possible that this activity
may relate to the elevated levels of total dissolved and suspended solids and sodium reported in the diagrams
above. However, it is more likely that this effect arises from the impact of the City of Bulawayo, some few
kilometres upstream.
Mining and minerals processing operations in the sub-catchment that have high potential impact fall into groups:
• Various gold mines in the Bubi Greenstone Belt, which might contribute arsenic and acid mine drainage;
• Shangani mine, which might contribute acid mine drainage and metals such as nickel, copper and cobalt;
• Pilgrim mine in the Bubi Greenstone Belt, now closed, may still contribute mercury contamination
• Gothic mine in the Lower Gweru Greenstone Belt, which may contribute acid mine drainage and metals
such as nickel, copper and cobalt antimony
• Alluvial gold mining in the Upper Gwayi River and its tributaries
• Lead and tin mining in the Kamativi-Dete Inlier
• The Kamativi tin smelter, now defunct
The larger gold, tin and nickel mines all have large waste rock and tailing dumps.
Thus it can be seen that the major impact of mining operations in the sub-catchment is likely to come from the
Greenstone Belts that lie in the headwaters of the Gwayi and its tributaries. Such impact as they have is
therefore likely to be felt to some extent, throughout the river system, although dilution will have an effect over
distance. There is no significant impact of mining in the Lupane – Nkayi (central) areas, but mining once again
has a potential impact on the river system in the Kamativi area, where shallow soils increase water system
vulnerability.
3.26 The Sebungwe and Lwizilukulu sub-catchments
3.26.1 General description
3.26.1.1 Hydrology
This is Zones Z2 and R of Area A (ZSG, 1984). The area comprises a series of small sub-catchments, whose
rivers flow from the Chizarira Plateau into Lake Kariba. The largest of these rivers are the Mlibizi, Sebungwe
and Lwizilukulu (Rwizi Ruhuru). None are perennial (Figure 3.2). There is a small wetland associated with the
Chibwatata Hot Springs, near Binga Town.
3.26.1.2 Geology

clxii
See Figure 3.6 (ZGS, 1999). The Chizarira Plateau is composed of Sijarira Group quartzites and associated
rocks. Karoo Supergroup sedimentary rocks underlie the remainder of the area.
3.26.1.3 Pedology, agriculture and land use
Soils in the sub-catchment can be divided into three groups:
• Very shallow, gravelly soils derived from Upper Karoo sediments and basalts;
• Moderately deep sandy soils derived from Lower Karoo sediments;
• Moderately deep kaolinitic sandy to loamy sand soils derived from Sijarira Group sediments (DRSS, 1979).
The sub-catchment lies generally within Natural Region V: low and erratic rainfall: below 650mm; the exception
is the Chizarira Plateau, which is in Natural Region III with higher rainfall and deeper soils (ZSG, 1997; Surveyor
General and AGRITEX, 1998).
Land use comprises the sparsely populated Manjolo and Siabuwa Communal Lands and Parks & Wildlife Land
and Forestry Commission Land43 (ZSG, 1998). Such farming as takes place is limited to livestock production
(especially goats) and a few drought resistant crops. The major settlement is Binga.
3.26.1.4 Surface water users
There is some consumption of water for small-scale agriculture in the Communal Lands, as well as extraction
for Binga Town. The other major use is tourism on Lake Kariba: boating, fishing and game viewing.
3.26.1.5 Water management systems
The area falls under the Gwayi Catchment Council of ZINWA.
3.26.1.6 Human impacts on water resources (excluding mining)
The following could be expected to have an impact on water resources:
• Disposal of solid waste, Binga;
• Disposal of liquid effluent, Binga;
• Urban run off, Binga;
43 Chizarira National Park, Chete Safari Area and Sijarira and Kavira Forest Lands

clxiii
• Non-point domestic effluent, rural areas;
• Minor non-point impact from sparse, subsistence agriculture in Communal lands;
• Fuel loss and litter on the main road to Binga;
• Litter and fuel loss from boating, Lake Kariba.
3.26.2 Mining and mineral processing operations
The catchment falls under the Bulawayo Mining District (ZGS, 1995). There are limited coal resources and a
few pegmatites in the area (Table 3.26).
Table 3.26: Mining operations in Sebungwe and Lwizilukulu sub-catchments.
Name Commodity Status Total produced /t Potential Impact
Tinde Fluorite Closed 1978 5980.0 Low
Sebungwe Diamond 0.0031ct Low
See ZGS (1988a) for location.
There is no legal exploration taking place (ZGS, 2001), although historically there has been much exploration for
diamonds in the area.
3.26.3 Alluvial mining
Neither known nor likely.
3.26.4 Monitoring systems
None.
3.26.5 Water quality data
None available.

clxiv
3.26.6 Implications for water quality and quantity management
There is no evidence to suggest that mining operations have had an influence on water quality in the area.
3.27 The Sengwa sub-catchment
3.27.1 General description
3.27.1.1 Hydrology
This is Zone Z3 of Area A (ZSG, 1984). The sub-catchment comprises the valley of the Sengwa River and its
tributaries, the Busi and the Rutope (Lutope) (Figure 3.2). None of the rivers are perennial. There are some
small wetlands associated with the Upper Busi River.
3.27.1.2 Geology
See Figure 3.6 (ZGS, 1999). The geology consists mainly of Karoo Supergroup sediments, capped on the
Mafungabusi (Mapfungautse) Plateau by Karoo basalt, Gokwe Formation sediments and Kalahari Sands.
3.27.1.3 Pedology, agriculture and land use
Soils in the sub-catchment can be divided into four groups:
• Kalahari Sands;
• Moderately deep sandy soils derived from Karoo sediments;
• Moderately deep kaolinitic sandy to loamy sand soils derived from Sijarira Group sediments; and
• A few locally developed salty vertisols (DRSS, 1979).
The sub-catchment lies in three Natural Regions: Region V in the Zambezi Valley: low and erratic rainfall: below
650mm; Region IV in the middle Sengwa Valley: fairly low rainfall of 450mm to 650mm per annum; Region III on
the Mafungabusi Plateau and in the Rutope valley: higher rainfall and deeper soils (ZSG, 1997; Surveyor
General and AGRITEX, 1998).

clxv
Land use comprises the Siabuwa, Omay, Kana and Gokwe Communal Lands and Parks & Wildlife Land and
Forestry Commission Land44 (ZSG, 1998). Such farming as takes place in the north is limited to livestock
production (especially goats) and a few drought resistant crops, with more croppage in the Gokwe and Kana
Communal Lands. The Zambezi Valley is sparsely populated, but the Rutope Valley is more densely settled.
The largest settlement is Siabuhwa Village.
3.27.1.4 Surface water users
There is some consumption of water for small-scale agriculture in the Communal Lands. The other use is
tourism on Lake Kariba: boating, fishing and game viewing.
3.27.1.5 Water management systems
The area falls under the Sanyati Catchment Council of ZINWA.
3.27.1.6 Human impacts on water resources (excluding mining)
The following could be expected to have an impact on water resources:
• Non-point domestic effluent, rural areas;
• Minor non-point impact from sparse, subsistence agriculture in Communal lands;
• Fuel loss and litter on the main road from Gokwe to Sengwa Colliery;
• Litter and fuel loss from boating, Lake Kariba.
3.27.2 Mining and mineral processing operations
The catchment falls under the Bulawayo, Harare and Gweru Mining Districts (ZGS, 1995). There are limited
coal resources in the area.
Table 3.27: Mining operations in the Sengwa sub-catchment.
Name Commodity Status Total produced /t Potential Impact
Sengwa Coal Closed some in late 1980s Medium
See ZGS (1988a) for location.
44 Chizarira National Park, Chirisa Safari Area and Mafungabusi Forest Land
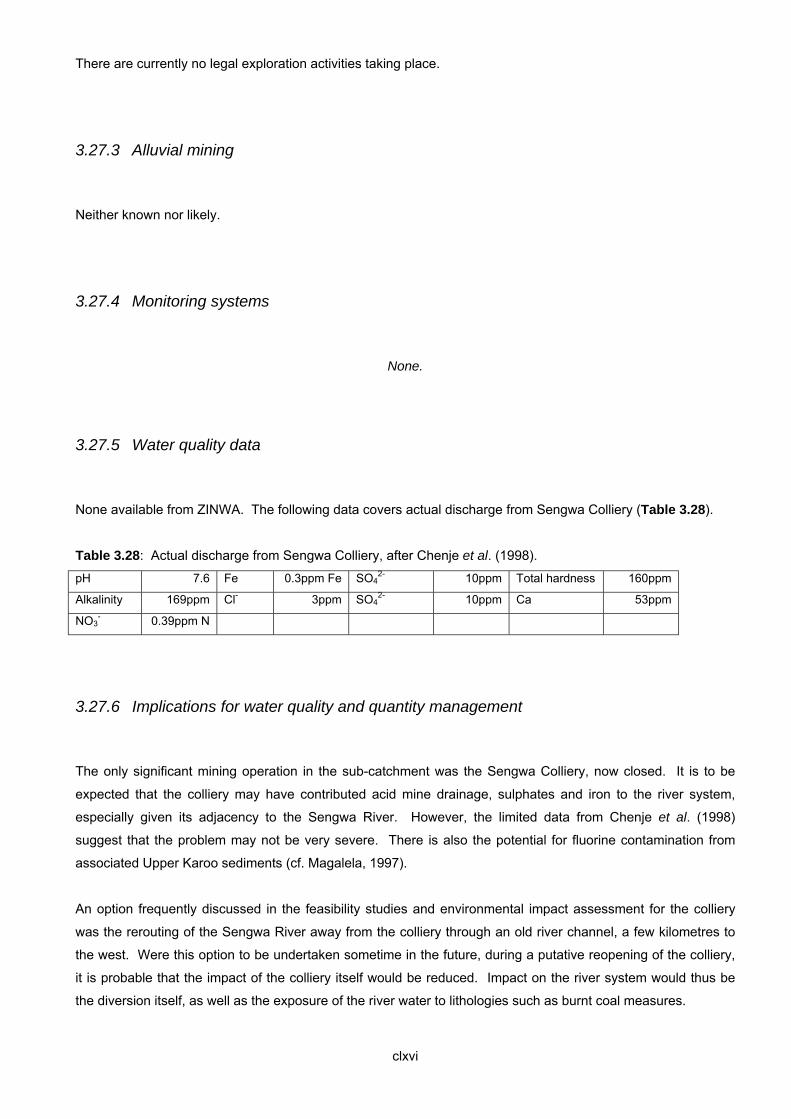
clxvi
There are currently no legal exploration activities taking place.
3.27.3 Alluvial mining
Neither known nor likely.
3.27.4 Monitoring systems
None.
3.27.5 Water quality data
None available from ZINWA. The following data covers actual discharge from Sengwa Colliery (Table 3.28).
Table 3.28: Actual discharge from Sengwa Colliery, after Chenje et al. (1998). pH 7.6 Fe 0.3ppm Fe SO4
2- 10ppm Total hardness 160ppm
Alkalinity 169ppm Cl- 3ppm SO42- 10ppm Ca 53ppm
NO3- 0.39ppm N
3.27.6 Implications for water quality and quantity management
The only significant mining operation in the sub-catchment was the Sengwa Colliery, now closed. It is to be
expected that the colliery may have contributed acid mine drainage, sulphates and iron to the river system,
especially given its adjacency to the Sengwa River. However, the limited data from Chenje et al. (1998)
suggest that the problem may not be very severe. There is also the potential for fluorine contamination from
associated Upper Karoo sediments (cf. Magalela, 1997).
An option frequently discussed in the feasibility studies and environmental impact assessment for the colliery
was the rerouting of the Sengwa River away from the colliery through an old river channel, a few kilometres to
the west. Were this option to be undertaken sometime in the future, during a putative reopening of the colliery,
it is probable that the impact of the colliery itself would be reduced. Impact on the river system would thus be
the diversion itself, as well as the exposure of the river water to lithologies such as burnt coal measures.

clxvii
3.28 The Ume sub-catchment
3.28.1 General description
3.28.1.1 Hydrology
This is Zone Z5 of Area A (ZSG, 1984). The sub-catchment comprises the valley of the Ume River and its
tributary, the Sessami (Figure 3.2). Neither is perennial.
3.28.1.2 Geology
See Figure 3.6 (ZGS, 1999). The geology consists mainly of Karoo Supergroup sediments, capped on the
Mafungabusi (Mapfungautse) Plateau by Karoo basalt, Gokwe Formation sediments and Kalahari Sands. The
Matuzviadonha (Matusadona) Mountains are formed of a crystalline inlier.
3.28.1.3 Pedology, agriculture and land use
Soils in the sub-catchment can be divided into four groups:
• Moderately deep sandy soils derived from Karoo sediments (most of the sub-catchment);
• Very shallow, gravelly soils derived from the crystalline inliers; and
• Moderately deep kaolinitic sandy to loamy sand soils derived from Karoo basalts on the Mafungabusi
Plateau (DRSS, 1979).
The sub-catchment lies in three Natural Regions: Region V in the Zambezi Valley: low and erratic rainfall: below
650mm; Region IV in the middle Sengwa Valley: fairly low rainfall of 450mm to 650mm per annum; Region III on
the Mafungabusi Plateau and in the Rutope valley: higher rainfall and deeper soils (ZSG, 1997; Surveyor
General and AGRITEX, 1998).
Land use comprises the Omay and Gokwe Communal Lands and Parks & Wildlife Land and Forestry
Commission Land45 (ZSG, 1998). Such farming as takes place in the north is limited to livestock production
(especially goats) and a few drought resistant crops, with more croppage in the Gokwe Communal Land. The
Zambezi Valley is sparsely populated, but the Sessami Valley is more densely settled. The largest settlements
are Gokwe Town, and Bumi Hills and Siakobvu Villages.
45 Matusadona National Park and Mafungabusi Forest Land

clxviii
3.28.1.4 Surface water users
There is some consumption of water by Gokwe Town and for small-scale agriculture in the Communal Lands.
The other use is tourism on Lake Kariba: boating, fishing and game viewing.
3.28.1.5 Water management systems
The area falls under the Sanyati Catchment Council of ZINWA.
3.28.1.6 Human impacts on water resources (excluding mining)
The following could be expected to have an impact on water resources:
• Landfills, Gokwe;
• Disposal of liquid effluent, Gokwe;
• Urban run off, Gokwe;
• Non-point domestic effluent, rural areas;
• Non-point impact of agriculture (pesticides, fertilizers, etc);
• Fuel loss and litter on the main road from Gokwe to Sengwa Colliery;
• Litter and fuel loss from boating, Lake Kariba.
3.28.2 Mining and mineral processing operations
The catchment falls under the Gweru and Harare Mining Districts (ZGS, 1995). There are limited coal
resources in the area.
Currently, there are no legal exploration activities taking place.
3.28.3 Alluvial mining
Neither known nor likely.

clxix
3.28.4 Monitoring systems
None.
3.28.5 Water quality data
None.
3.28.6 Implications for water quality and quantity management
None, unless coal exploration or mining is begun.
3.29 The Sanyati-Munyati sub-catchment
3.29.1 General description
3.29.1.1 Hydrology
This is Zones S, UN1-UN6 and US of Area C (ZSG, 1984). The large Sanyati-Munyati Sub-catchment stretches
from Lake Kariba to the Midlands towns of Kwekwe and Kadoma and to Chivhu in Mashonaland East (Figure 3.2). The Sanyati River is referred to as Munyati above the confluence with the tributary Mupfure (see Section
3.10). The main tributaries of the Munyati are the Msweswe (Zone US of Area C in ZSG (1984) and the
Sebakwe (Zone UN3 and UN4 of Area C in ZSG (1984)). All these rivers are perennial.
The Sebakwe is dammed at Sebakwe and Lower Zhivagwe (Dutchman’s Pool) to provide water for the City of
Kwekwe. The Ngezi, a tributary of the Upper Munyati (Zone UN5 of Area C in ZSG (1984), is dammed to

clxx
provide water for Munyati Thermal Power Station. The Msweswe is dammed at Claw Dam to provide water for
Kadoma Town.
3.29.1.2 Geology
See Figure 3.6 (ZGS, 1999). The sub-catchment is generally underlain by crystalline rocks: granitic terrain east
of Kwekwe and Kadoma, the Midlands Greenstone Belt in the Kadoma – Kwekwe – Empress triangle, Magondi
Supergroup metasediments and gneisses in the area around Sanyati Mission and Copper Queen, Sijarira
quartzites and associated rocks in the area around Machihiri and gneisses in the lower Sanyati valley. The
Great Dyke cuts north to south across the sub-catchment west of Ngezi dam. An outlier of Upper Karoo
sediments and basalts underlies the Featherstone area.
3.29.1.3 Pedology, agriculture and land use
Soils in the sub-catchment can be divided into five groups:
• Very shallow, gravelly soils in the Sanyati valley;
• Moderately shallow hydromorphic silty clay loams, derived from the Magondi rocks;
• Shallow to moderately shallow kaolinitic clays and loams formed from Greenstone Belt rocks;
• Moderately shallow sands and loamy sands, coarse grained in places, formed from Upper Karoo sediments
and basalts;
• Moderately shallow, coarse grained sandy, kaolinitic soils derived from granites, sodic in places; and
• Deep clays on the Great Dyke (DRSS, 1979).
The sub-catchment lies generally within Natural Region III: high rainfall and deep soils; the Sanyati valley is
generally Region IV: fairly low rainfall of 450mm to 650mm per annum (ZSG, 1997; Surveyor General and
AGRITEX, 1998).
Land use is mainly commercial farming, private and resettlement land with Communal Lands in the Sanyati
valley and between Ngezi Dam and Featherstone (ZSG, 1998). Farming generally involves livestock
production, cash crops and fodder crops, except in the Sanyati valley where poor soils and low rainfall limit
agriculture to some livestock and a few drought resistant crops.
The major settlements are the City of Kwekwe and Kadoma Town, with settlements along the road and rail link
between them, Empress Mine, Mvuma and Chivhu. The most densely populated areas are the Communal
Lands and resettlement areas in the Munyati valley.

clxxi
3.29.1.4 Surface water users
The City of Kwekwe draws water from the Sebakwe River, and Kadoma Town from the Msweswe River. Ngezi
Dam supplies the Munyati Thermal Power Station.
Irrigation by commercial agriculture is a major water user in Zones UN2 - UN6 and S in Area C (ZSG, 1984).
3.29.1.5 Water management systems
The sub-catchment falls under the Sanyati Catchment Council of ZINWA.
3.29.1.6 Human impacts on water resources (excluding mining)
The following could be expected to have an impact on water resources:
• Landfills, urban areas of Kwekwe, Kadoma, Chivhu, Mvuma and Empress;
• Disposal of liquid effluent, urban areas of Kwekwe, Kadoma, Chivhu, Mvuma and Empress;
• Urban run off, urban areas of Kwekwe, Kadoma, Chivhu, Mvuma and Empress;
• Non-point domestic effluent, rural areas;
• Non-point impact of agriculture (pesticides, fertilizers, etc), especially where commercial agriculture is
practiced;
• Non-point impact of irrigation in redistribution of river waters;
• Minor non-point impact from sparse, subsistence agriculture in the Sanyati valley;
• Fuel loss and litter on the main roads and railways; and
• Run off, Kwekwe and Eiffel Flats Airports and Thornhill Air Base.
3.29.2 Mining and mineral processing operations
The catchment falls under the Gweru and Kadoma Mining Districts (ZGS, 1995). The main mining activity is
gold mining in the Greenstone Belts, iron at Redcliff (historically) and chrome along the Great Dyke (Table 3.29).
Table 3.29: Mining operations in the Sanyati-Munyati sub-catchment.
Name Commodity Status Total produced /t
Potential Impact

clxxii
Anzac Antimony Closed 1970 973.5 High
BD Antimony Closed 1984 686.8 High
Cam and Motor Antimony Closed 1969 247.4 High
Dalling Antimony Closed 1982 245.9 High
Globe and
Phoenix
Antimony Closed 1971 1832.9 High
Glover Antimony Closed 1977 402.1 High
Indarama Antimony Closed 1979 1591.7 High
Janet Antimony Closed 1971 169.9 High
Argosy Barytes Closed 1977 8793.3 Low
Cagal Beryl Closed 1974 479.7 Low
Gumbo's Dream Beryl Closed 1964 105.7 Low
Tengwe Beryl Closed 1963 102.8 Low
Cambrai Chromium Closed 1984 776791.0 Low
Netherburn Chromium Closed 1984 776086.0 Low
Falcon Copper Closed 1955 31225.4 Medium
Rivclay Fireclay Closed1966 15002.0 Low
Athens Gold Closed 5.9 High: Arsenic possible
Bell-Riverlea Gold In operation 10.0 High: Arsenic possible
Brompton Gold Closed? 7.8 Medium: Arsenic in Try Me
body
Cam and Motor Gold Dump retreatment 147.2 High: Arsenic possible
Comrades
Extension
Gold Dump retreatment 5.7 High: Arsenic possible
Connemara Gold In operation 16.7 Medium
Eiffel blue Gold Closed 7.2 High: Arsenic possible
Falcon Gold Closed 12.7 High: Arsenic possible
Gaika Gold In operation 22.7 High: Size & Sb possible
Globe and
Phoenix
Gold Closed 124.1 High: Size & Sb possible
Golden Valley Gold In operation 31.1 High: Size
Indarama Gold In operation 6.1 High: Arsenic & Sb possible
Kanyemba Gold 7.6 High: Arsenic possible
Mali Gold 6.3 Medium
Owl Gold 5.2 Medium
Patchway Gold Care &
maintenance
since 2000
18.0 Medium
Piper Moss Gold 5.4 High: Arsenic & Sb possible
Sherwood Starr Gold Closed 15.2 High: Arsenic & Sb possible
Spectacle Gold 8.6 Medium
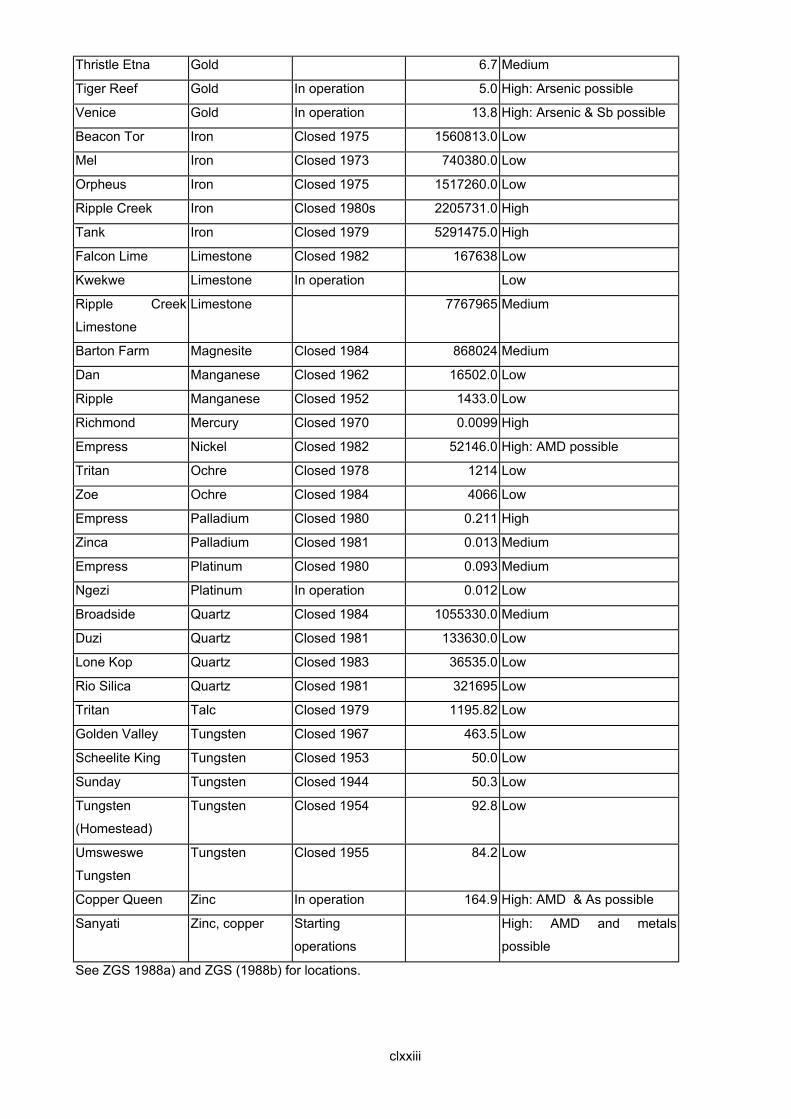
clxxiii
Thristle Etna Gold 6.7 Medium
Tiger Reef Gold In operation 5.0 High: Arsenic possible
Venice Gold In operation 13.8 High: Arsenic & Sb possible
Beacon Tor Iron Closed 1975 1560813.0 Low
Mel Iron Closed 1973 740380.0 Low
Orpheus Iron Closed 1975 1517260.0 Low
Ripple Creek Iron Closed 1980s 2205731.0 High
Tank Iron Closed 1979 5291475.0 High
Falcon Lime Limestone Closed 1982 167638 Low
Kwekwe Limestone In operation Low
Ripple Creek
Limestone
Limestone 7767965 Medium
Barton Farm Magnesite Closed 1984 868024 Medium
Dan Manganese Closed 1962 16502.0 Low
Ripple Manganese Closed 1952 1433.0 Low
Richmond Mercury Closed 1970 0.0099 High
Empress Nickel Closed 1982 52146.0 High: AMD possible
Tritan Ochre Closed 1978 1214 Low
Zoe Ochre Closed 1984 4066 Low
Empress Palladium Closed 1980 0.211 High
Zinca Palladium Closed 1981 0.013 Medium
Empress Platinum Closed 1980 0.093 Medium
Ngezi Platinum In operation 0.012 Low
Broadside Quartz Closed 1984 1055330.0 Medium
Duzi Quartz Closed 1981 133630.0 Low
Lone Kop Quartz Closed 1983 36535.0 Low
Rio Silica Quartz Closed 1981 321695 Low
Tritan Talc Closed 1979 1195.82 Low
Golden Valley Tungsten Closed 1967 463.5 Low
Scheelite King Tungsten Closed 1953 50.0 Low
Sunday Tungsten Closed 1944 50.3 Low
Tungsten
(Homestead)
Tungsten Closed 1954 92.8 Low
Umsweswe
Tungsten
Tungsten Closed 1955 84.2 Low
Copper Queen Zinc In operation 164.9 High: AMD & As possible
Sanyati Zinc, copper Starting
operations
High: AMD and metals
possible
See ZGS 1988a) and ZGS (1988b) for locations.

clxxiv
There is exploration for diamonds, gold, silver, copper, lead, zinc, nickel, cobalt, platinum, and arsenic (ZGS, 2001).
3.29.3 Alluvial mining
Alluvial mining of gold is widespread, especially in the Sanyati, Munyati, Msweswe and Sebakwe Rivers (Figure 3.14; Chiyanike, 1997).
3.29.4 Monitoring systems
ZINWA has a large number of sampling points in the sub-catchment, mainly on the Sanyati, Munyati, Kwekwe
and Sebakwe Rivers.
3.29.5 Water quality data
Water quality data are available from ZINWA for several monitoring stations.
3.29.6 Implications for water quality and quantity management
The major impact of mining on the sub-catchment is to be expected from the gold mines, many of which also
produce antimony, mainly located in the Midlands Greenstone Belt between Kwekwe and Kadoma. These gold
mines, many of which are extensive in size, with six mines that have produced over 15t of gold and two that
have produced over 100t of gold, are likely to contribute acid mine drainage, iron and sulphate to the many local
streams and rivers that pass through the area. Many of these gold mines also contain arsenic and antimony
sulphides, potentially releasing these highly toxic metals into the local waters. Some gold mines have mercury
associated with them, e.g. Cactus Mine, and some are associated with bismuth.
The large iron ore mines, now closed, at Ripple Creek and Tank, are likely to have a high impact on the local
stream systems, due to their immense size (over seven million tons of iron ore were extracted from the two sites
alone) as well as acid mine drainage and iron possibly released into the water.
Three heavy metal mines in the sub-catchment deserve mention: Empress Mine, a one-time producer of nickel
and palladium; zinc and copper producer, Copper Queen, and the recently started copper-lead-zinc mine at

clxxv
Sanyati, all may well contribute or have contributed acidity and heavy metals such as nickel, lead, copper,
cobalt and zinc to the local rivers. Copper Queen and Sanyati are located on highly vulnerable shallow, sandy
soils. There was also a small mercury mine at Richmond, near to the Munyati River, where the main railway
line crosses it.
Further high impact is to be expected from the three chrome smelters located in the sub-catchment, as well as
the nickel smelter at Empress and the blast furnaces at Redcliff. Hexavalent chromium is associated with
effluent from chrome smelters. The ZISCO and ZIMASCO smelters in the Kwekwe area are very close to the
Sebakwe River, a major perennial tributary. The Empress smelter is in close proximity to the Munyati River
itself.
There is extensive alluvial gold mining from the Midlands Greenstone Belt downstream and small-scale chrome
mining along the Great Dyke (Figure 3.14).
Examination of the water quality data presented above shows elevated levels of total dissolved and suspended
solids, total hardness, nitrates, phosphates and iron. The sites that figure most prominently in terms of values in
excess of the “blue” limits are all located in the Kwekwe area46. This could be related to the very dense
concentration of gold, antimony and iron producing mines, current and historical, in the Kwekwe area, as well as
the Kwekwe smelter. However, the impact of the Kwekwe urban area cannot be discounted in this
consideration, and commercial farming is quite likely to be the source of nitrates and phosphates.
The Sanyati – Munyati Sub-catchment is the most heavily mined area in the country, both currently and
historically. The impact of mining is concentrated in the Midlands Greenstone Belt and the series of heavy
metal producers in the lower Munyati and Sanyati valleys. The impact of the Midlands Greenstone Belt is
accentuated by the fact that all the major rivers in the sub-catchment flow through it.
Extensive exploration continues, notably for gold and base metals. It is therefore indicated that the impact of
mining on this sub catchments is not likely to decrease in the foreseeable future.
3.30 The Mupfure sub-catchment
3.30.1 General description
3.30.1.1 Hydrology
46 Sites CR62,63,64 and 65

clxxvi
This is Zones UF1-UF4 of Area C (ZSG, 1984). The Mupfure River is a major tributary of the Sanyati River (see
Section 3.9; Figure 3.2).
3.30.1.2 Geology
See Figure 3.6 (ZGS, 1999). The sub-catchment is generally underlain by crystalline rocks: granitic terrain
southeast of Chegutu, the Midlands Greenstone Belt in the Chegutu – Chakari area, Magondi Supergroup
metasediments and gneisses in the area around Chirau and Chigaro. The Great Dyke cuts north to south
across the sub-catchment, through Kutama and Selous. An outlier of Upper Karoo sediments underlies the
area south of Beatrice.
3.30.1.3 Pedology, agriculture and land use
Soils in the sub-catchment can be divided into six groups:
• Very shallow, gravelly soils in the lower Mupfure valley;
• Moderately shallow hydromorphic silty clay loams, derived from the Magondi rocks;
• Moderately deep kaolinitic sandy clay loams and deep kaolinitic clays formed from Greenstone Belt rocks;
• Moderately shallow sands and loamy sands, formed from Upper Karoo sediments;
• Moderately shallow, coarse grained sandy, kaolinitic soils derived from granites, sodic in places; and
• Deep clays on the Great Dyke (DRSS, 1979).
The lower Mupfure valley lies within Natural Region III: high rainfall and deep soils; the upper Mupfure valley is
within Region IIb: high rainfall of up to 1000mm per annum and deep soils (ZSG, 1997; Surveyor General and
AGRITEX, 1998).
Land use is mainly commercial farming, private and resettlement land with Communal Lands in the southeast
(ZSG, 1998). Farming is generally intensive cash crops or livestock production.
The major settlements are Chegutu and Chakari Towns, with settlements along the road and rail link between
Kadoma and Harare.
3.30.1.4 Surface water users
Chegutu and Chakari Towns draw water from the Mupfure River. Irrigation by commercial agriculture is a major
water user.

clxxvii
3.30.1.5 Water management systems
The sub-catchment falls under the Sanyati Catchment Council of ZINWA.
3.30.1.6 Human impacts on water resources (excluding mining)
The following could be expected to have an impact on water resources:
• Landfills, urban areas of Chegutu and Chakari;
• Disposal of liquid effluent, urban areas of Chegutu and Chakari;
• Urban run off, urban areas of Chegutu and Chakari;
• Non-point domestic effluent, rural areas;
• Non-point impact of agriculture (pesticides, fertilizers, etc), throughout the sub-catchment;
• Non-point impact of irrigation in redistribution of river waters; and
• Fuel loss and litter on the main roads and railways.
3.30.2 Mining and mineral processing operations
The catchment falls under the Harare and Kadoma Mining Districts (ZGS, 1995). The main mining activities are
gold mining in the Greenstone Belt and platinum and chrome along the Great Dyke (Figures 3.6, 3.7 and 3.8).
Table 3.30: Mining operations in the Mupfure sub-catchment.
Name Commodity Status Total produced /t
Potential Impact
Dalny Gold In operation 64.0 High: Arsenic possible
Giant Gold Closed 17.5 High: Arsenic possible
Pickstone Gold 11.7 High: Arsenic possible
Tom Kaolin Closed 1984 28199.0 Low
Lambourne Limestone Closed 1978 166018 Low
Perserverane Nickel Closed 1980 4657.0 High: AMD possible
Hartley(Selous) Palladium Operations suspended High
Hartley (Selous) Platinum Operations suspended High
See ZGS (1988a) and ZGS (1988b) for locations.
There is exploration for nickel, copper, PGEs, diamond, gold, silver and platinum (ZGS, 2001).

clxxviii
3.30.3 Alluvial mining
Alluvial mining of gold is widespread, especially along the Mupfure River (Figure 3.14; Chiyanike, 1997).
3.30.4 Monitoring systems
ZINWA conducts some monitoring within the sub-catchment.
3.30.5 Water quality data
Water quality data are available from ZINWA for several monitoring stations.
3.30.6 Implications for water quality and quantity management
High impact is expected from three sources:
• The arseniferous gold mines in the Chakari and Gadzema areas; and
• The large Hartley platinum mine and smelter.
The water quality data available from ZINWA is sparse, but two points are worth mentioning:
• High nitrate levels at Shurushuru in the Chakari area; and
• High iron levels in the Beatrice area.
Given the paucity of data, it is not possible to make any interpretations.
3.31 The Charara and Nyaodza sub-catchments
3.31.1 General description
3.31.1.1 Hydrology

clxxix
This is Zone Z1 of Area C (ZSG, 1984). The area comprises a series of small sub catchments, whose rivers
flow from the hills south of Makuti and Vuti into the eastern basin of Lake Kariba (Figure 3.2). The largest of
these are the Charara (Chalala) and Nyaodza, neither of which is perennial.
3.31.1.2 Geology
See Figure 3.6 (ZGS, 1999). Mainly gneisses underlie the area, with Karoo Supergroup sedimentary rocks in
the land bordering Lake Kariba.
3.31.1.3 Pedology, agriculture and land use
Soils in the area are all very shallow and gravelly (DRSS, 1979). The lakeshore area lies within Natural Region
V: low and erratic rainfall: below 650mm, and the hinterland lies within Natural Region IV: fairly low rainfall of
450mm to 650mm per annum (ZSG, 1997; Surveyor General and AGRITEX, 1998).
Land use comprises Hurungwe Communal Land and Zambezi Parks & Wildlife Land47 (ZSG, 1998). Farming
is mainly livestock production and drought resistant crops. The major settlements are Kariba Town and the
growing Magunje village.
3.31.1.4 Surface water users
There is some consumption of water for agriculture in the Communal Lands, as well as by Magunje. The other
major use is tourism on Lake Kariba: boating, fishing and game viewing.
3.31.1.5 Water management systems
The area falls under the Sanyati Catchment Council of ZINWA.
3.31.1.6 Human impacts on water resources (excluding mining)
The following could be expected to have an impact on water resources:
47 Charara Safari Area

clxxx
• Disposal of solid waste, Magunje and Kariba;
• Disposal of liquid effluent, Magunje and Kariba;
• Urban run off, Magunje and Kariba;
• Non-point domestic effluent, rural areas;
• Minor non-point impact from agriculture in Communal lands;
• Fuel loss and litter on the roads to Kariba and to Magunje; and
• Litter and fuel loss from boating, Lake Kariba; and
• Run off, Kariba Airport.
3.31.2 Mining and mineral processing operations
The catchment falls under the Harare Mining District (ZGS, 1995). Graphite is mined and there are numerous
pegmatites in the south of the area.
Table 3.31: Mining operations in the Charara and Nyaodza sub-catchments.
Name Commodity Status Total produced /t Potential Impact
Kariba Glitterstone Low
Lynx Graphite Closed 1984 130785.0 Low
Catkin Mica Closed 1960 333.9 Low
Muyenza Sillimanite Closed 1966 76.2 Low
See ZGS (1988a) for locations.
There is some exploration for beryl and gold (ZGS, 2001).
3.31.3 Alluvial mining
Neither known nor likely.
3.31.4 Monitoring systems
ZINWA has a single monitoring station on the upper Nyaodza River.
clxxxi
3.31.5 Water quality data
Only one sampling point (Figure 3.3).
3.31.6 Implications for water quality and quantity management
Slightly elevated iron levels are reported from the upper Nyaodza monitoring point, however, there are no
mining operations in the vicinity.
The only current mining activities in the area, quarrying of certain gemstones and dimension stones, mostly
small-scale, are likely to have minimal impact on local rivers. Such impact as there is will be substantially
diluted in the Zambezi, as the rivers all flow into Lake Kariba.
3.32 The Rukomeshe and Chewore sub-catchments
3.32.1 General description
3.32.1.1 Hydrology
This is Zone Z2 of Area C (ZSG, 1984). The area comprises a series of small sub-catchments, whose rivers
flow from the hills north of Makuti and Vuti into the Zambezi River below Lake Kariba (Figure 3.2). The largest
of these are the Rukomeshe (Rukomechi), Sapi and Chewore; none are perennial. There are wetlands at the
confluences of the Sapi and Chewore Rivers with the Zambezi.
3.32.1.2 Geology
See Figure 3.6 (ZGS , 1999). The area is underlain mainly by Karoo Supergroup sedimentary rocks, with
gneisses in the hill country above the Zambezi Escarpment.
3.32.1.3 Pedology, agriculture and land use
Soils in the area can be divided into three groups:

clxxxii
• Very shallow and gravelly soils in the east; and
• Deep, heavily textured calcareous soils in the west; and
• Widespread, locally developed patches of Jesse Sand, a derivative of the Kalahari Sands(DRSS, 1979).
The area lies within Natural Region V: low and erratic rainfall: below 650mm, and the hinterland lies within
Natural Region IV: fairly low rainfall of 450mm to 650mm per annum and Natural Region III: higher rainfall and
deeper soils (ZSG, 1997; Surveyor General and AGRITEX, 1998).
Land use comprises Mukwichi Communal Land, Vuti resettlement area and Zambezi Parks & Wildlife Land48
(ZSG, 1998). Farming is mainly semi intensive livestock production, fodder crops and some cash crops. The
major settlements are Makuti and Chirundu Villages.
3.32.1.4 Surface water users
There is some consumption of water for agriculture in the Communal Lands, as well as extraction for Makuti
Town. The other major use is tourism on the Zambezi River: boating, fishing and game viewing. The Zambezi
River provides the only dry season source of water for wildlife in the Zambezi Parks & Wildlife Land, which is an
important tourist destination.
3.32.1.5 Water management systems
The area falls under the Manyame Catchment Council of ZINWA.
3.32.1.6 Human impacts on water resources (excluding mining)
The following could be expected to have an impact on water resources:
• Disposal of solid waste, Makuti and Chirundu;
• Disposal of liquid effluent, Makuti and Chirundu;
• Urban run off, Makuti and Chirundu;
• Non-point domestic effluent, rural areas;
• Minor non-point impact from agriculture in Communal lands; and
• Fuel loss and litter on the road from Makuti to Chirundu.
48 Mana Pools National Park and Hurungwe, Sapi and Chewore Safari Areas: this is a World Heritage Site

clxxxiii
3.32.2 Mining and mineral processing operations
The catchment falls under the Harare Mining District (ZGS, 1995). Cordierite and emeralds have been mined in
the hills in the south (Table 3.32).
Table 3.32: Mining operations in the Rukomeshe and Chewore sub-catchments.
Name Commodity Status Total produced /t
Potential Impact
Chirundu Uranium Exploration only Low
Makuti Cordierite Open in 1984 0.0756 Low
See ZGS (1988a) for location.
There is limited exploration for gold, copper, nickel and PGEs (ZGS, 2001).
3.32.3 Alluvial mining
Neither known nor likely.
3.32.4 Monitoring systems
None.
3.32.5 Water quality data
None available.
3.32.6 Implications for water quality and quantity management
There is no evidence to suggest impact of mining within this area.

clxxxiv
3.33 The Angwa sub-catchment
3.33.1 General description
3.33.1.1 Hydrology
This is Zones A1-A2 of Area C (ZSG, 1984). The Angwa River flows from near Chinhoyi Caves to Lake Cahora
Bassa in Mozambique (Figure 3.2). There are many wetlands in the Manyati area of the middle Angwa, Zone
A1.
3.33.1.2 Geology
See Figure 3.6 (ZGS, 1999). Magondi Supergroup gneisses and metasediments underlie most of the sub-
catchment. Karoo Supergroup and Dande Formation sediments underlie the area north of the Zambezi
Escarpment. The area around Mwami, east of Karoi, is intruded by numerous pegmatites, many of which are
mined. For a more detailed description of these pegmatites, see Wiles (1961).
3.33.1.3 Pedology, agriculture and land use
Soils in the sub-catchment can be divided into four groups:
• Very shallow, gravelly soils in the area along the Zambezi Escarpment and the Manyame Range;
• Moderately shallow to moderately deep hydromorphic silty clay loams, derived from Magondi
metasediments;
• Moderately shallow, fine grained and highly micaceous sandy loams, derived from Magondi gneisses; and
• Moderately shallow sands and loamy sands, often sodic, formed from Upper Karoo and Dande sediments
(DRSS, 1979).
The lower Angwa valley (below the Zambezi Escarpment) lies within Natural Region IV: fairly low rainfall of
450mm to 650mm per annum. The middle Angwa valley (from Darwin Gorge to the Zambezi Escarpment) lies
within Natural Region III: high rainfall and deep soils. The upper Angwa valley (above Darwin Gorge) is within
Region IIa: high and reliable rainfall of up to 1000mm per annum and deep soils (ZSG, 1997; Surveyor General
and AGRITEX, 1998).
clxxxv
Land use above the Zambezi Escarpment is mainly commercial farming: private and resettlement land (ZSG,
1998). Farming is generally intensive cash crops or livestock production. The Dande Communal Land (below
the escarpment) is very sparsely populated, with some limited livestock and cotton production. There is some
Parks & Wildlife Land in the northwest and east49.
The major settlements are Karoi and Mhangura Towns, and Alaska and Lions Den Villages.
3.33.1.4 Surface water users
Irrigation by commercial agriculture is a major water user. Karoi and Mhangura Towns, and Alaska and Lions
Den Villages draw water from within the sub-catchment.
3.33.1.5 Water management systems
The sub-catchment falls under the Manyame Catchment Council of ZINWA.
3.33.1.6 Human impacts on water resources (excluding mining)
The following could be expected to have an impact on water resources:
• Landfills, urban areas of Karoi, Mhangura, Alaska and Lions Den;
• Disposal of liquid effluent, urban areas of Karoi, Mhangura, Alaska and Lions Den;
• Urban run off, urban areas of Karoi, Mhangura, Alaska and Lions Den;
• Non-point domestic effluent, rural areas;
• Non-point impact of agriculture (pesticides, fertilizers, etc), throughout the sub-catchment;
• Non-point impact of irrigation in redistribution of river waters;
• Fuel loss and litter on the main roads from Chinhoyi to Karoi and Mhangura and from the railway to Lions
Den; and
• Run off, Chinhoyi Airport.
3.33.2 Mining and mineral processing operations
49 Chewore and Doma Safari Areas

clxxxvi
The catchment falls under the Harare Mining District (ZGS, 1995). The main mining activities are copper mining
in the Magondi Belt (historical) and mining of pegmatites around Mwami (Miami).
Table 3.33: Mining operations in the Angwa sub-catchment.
Name Commodity Status Total produced /t
Potential Impact
Alaska Copper Closed 1977 32736.0 Medium
Mangula Copper Closed, smelter closed 315306.0 High
Norah Copper Closed 1984 40759.0 Medium
Shackleton Copper Closed ? 67052.0 High
Shamrocke Copper Closed 1968 25363.0 Low
Gundi Park Dolomite Closed 1981 182320.0 Low
Sinoia Lime Dolomite Closed 1984 33264.0 Low
Springbok
(Alaska dolomite)
Dolomite In operation 872723.0 Medium
Whitelux Dolomite In operation 13363.0 Low
I Wonder Garnet industrial Closed 1974 90.7 Low
Golden Kopje Gold 6.0 Medium
Chipungwe Kyanite Closed 1984 15141 Low
Sheba Group Kyanite Closed 1982 10510 Low
Beckett Mica Closed 1971 256.36 Low
Grand Parade Mica Closed 1956 540.79 Low
Last Hope Mica Closed 1981 206.02 Low
Mangula Palladium Closed 1980s 0.199 High
Mangula Platinum Closed 1980s 0.103 High
Float Quartz Closed 1975 22247.0 Low
Mangula Selenium Closed 1980s 1.9 Medium: AMD possible
Mangula Silver Closed 1980s 119.3 Medium
Shackleton Silver Closed 1984 54.3 Medium
St Anns Topaz Closed 1981 0.93631 Low
Honey Tungsten Closed 1983 95.7 Low
Makashi Tungsten Closed 1979 59.2 Low
See ZGS (1988a) and ZGS (1988b) for locations.
There is exploration for gold, lead copper and zinc (ZGS, 2001).
3.33.3 Alluvial mining

clxxxvii
Extensive alluvial mining of gold takes place in the Angwa River (Figure 3.14; Chiyanike, 1997). Some of this is
in the form of formalised claims through the Mining Commissioner, whilst the remainder is the work of small-
scale panners, whose operations falls under Special Grants held by the Rural District Councils.
3.33.4 Monitoring systems
ZINWA has a number of monitoring stations in the sub-catchment.
3.33.5 Water quality data
Water quality data is available from ZINWA for several monitoring stations in this sub-catchment (Figure 3.3).
3.33.6 Implications for water quality and quantity management
Impact is expected from four sources:
• Historical copper mining operations, possibly contributing heavy metals and acid mine drainage;
• The Alaska copper smelter, which might contribute a similar impact;
• Alluvial gold mining in the Angwa River; and
• Impact of the numerous small-scale pegmatite workings (tungsten, tantalum, kyanite, mica, among others)
in the country around Mwami.
The alluvial workings have a particularly high impact in the Angwa valley, since, prior to the arrival of panners,
the valley was largely unsettled. Informal settlements developed by the panners have led to extensive
deforestation in a previously pristine area.
Examination of the water quality data shows that total suspended solids, sulphate, fluoride and iron are elevated
(though sulphate and fluoride are still within the “blue” limits) in the Angwa River after it receives drainage from
the vicinity of the Alaska smelter. It is thus possible that the smelter is responsible for these elevations,
although recent and current housing developments in the same area could also be responsible.
The Mwami River shows elevated levels of total suspended solids, chloride and magnesium: although only the
first mentioned of these is outside the “blue” limits.
3.34 The Manyame sub-catchment

clxxxviii
3.34.1 General description
3.34.1.1 Hydrology
This is Zones H1-H5 of Area C (ZSG, 1984). The long Manyame Sub-catchment stretches from Lake Cahora
Bassa to the capital city of Harare and to Waddilove Mission in Mashonaland East (Figure 3.2). The Manyame
River is perennial. The Manyame is dammed at Chivero (Hunyani Poort / McIlwaine) and Manyame Dam
(Robertson) to provide water for the City of Harare, and at Seke (Prince Edward) and Harava (Henry Hallam) to
provide water for the City of Chitungwiza.
3.34.1.2 Geology
See Figure 3.6 (ZGS, 1999). The sub-catchment lies mainly on the Zimbabwe Craton, underlain by granites in
the central and southern areas, with the Harare Greenstone Belt in the southeast and the Chinhoyi Greenstone
Belt in the west. The Great Dyke crosses the sub-catchment NNE to SSW. The Zambezi Valley in the north is
underlain by Dande Formation sediments (in contrast to ZGS (1999)).
3.34.1.3 Pedology, agriculture and land use
Soils in the sub-catchment can be divided into four groups:
• Very shallow, gravelly soils in the hills along the Zambezi Escarpment, the Manyame Range and the Mvurwi
Range;
• Moderately shallow, coarse grained sandy, kaolinitic soils derived from granites;
• Deep kaolinitic clays, formed from the Greenstone Belt rocks;
• Moderately shallow to moderately deep sands, sodic in places, formed from Dande sediments (DRSS,
1979).
The sub-catchment lies generally within Natural Region IIa: high and reliable rainfall of up to 1000mm per
annum and deep soils; the Zambezi valley is in Region IV: fairly low rainfall of 450mm to 650mm per annum
(ZSG, 1997; Surveyor General and AGRITEX, 1998).
Land use is mainly commercial farming, private and resettlement land with Communal Lands in the Zambezi
valley (ZSG, 1998). Farming is generally intensive livestock and cash crop production, except in the Zambezi
valley where poor soils and low rainfall limit agriculture to some livestock, cotton and a few drought resistant
crops.

clxxxix
The major settlements are the metropolitan area of the Cities of Harare and Chitungwiza, and Chinhoyi and
Norton Towns, with settlements along the road and rail link from Harare to Chinhoyi. Mahuwe Village at the foot
of the Zambezi Escarpment is a growth point for the surrounding Communal Lands.
3.34.1.4 Surface water users
The Cities of Harare and Chitungwiza, including the Harare Thermal Power Station, draw water from the
Manyame River.
Irrigation by commercial agriculture is a major water user above the Zambezi escarpment. There is a large
ARDA estate near Mushumbi Pools, growing cotton under irrigation from the Manyame River.
3.34.1.5 Water management systems
The sub-catchment falls under the Manyame Catchment Council of ZINWA.
3.34.1.6 Human impacts on water resources (excluding mining)
The following could be expected to have an impact on water resources:
• Landfills, urban areas of Harare, Chinhoyi, Norton and Chitungwiza (cf. Moyo, 1997, Rakodi, 1995);
• Disposal of liquid effluent, urban areas of Harare and Chitungwiza, which is done into tributaries feeding
Manyame and Chivero Dams (cf. Moyo, 1997, Rakodi, 1995), as well as Chinhoyi and Norton;
• Urban run off, urban areas of Harare, Chinhoyi, Norton and Chitungwiza;
• Non-point domestic effluent, rural areas;
• Non-point impact of agriculture (pesticides, fertilizers, etc), especially where commercial agriculture is
practiced;
• Non-point impact of irrigation in redistribution of river waters;
• Minor non-point impact from sparse subsistence agriculture in the Zambezi valley;
• Fuel loss and litter on the main roads and railways; and
• Run off, Harare International and Charles Prince Airports.
3.34.2 Mining and mineral processing operations
The catchment falls under the Harare Mining District (ZGS, 1995). The main mining activity is chrome mining
along the Great Dyke and some gold mines, now mostly out of production.

cxc
Table 3.34: Mining operations in the Manyame sub-catchment.
Name Commodity Status Total produced /t Potential Impact
Ethel Asbestos Closed 1966 38177.0 Low
Caesar Chromium Closed 1982 552719.0 Low
Feock Chromium Open in 1984 1193688.0 Medium
Sutton Chromium Open in 1984 794948.0 Low
Umvukwe Chrome Chromium Open in 1984 2054504.0 Medium
Vanad Chromium Open in 1984 785294.0 Low
Barry Clay Closed 1971 130191.0 Low
Muriel Copper Closing in 2002 13759.0 Low
Muriel Gold Closing in 2002 29.7 Medium
Eldorado Gold In operation 15.3 Medium
Eureka Gold Closed High: large pits, AMD
possible
Kia Ora
Gold 13.4 High: Size
Jester Mtorolite Closed 1984 7.577 Medium
Lomsil Quartz Closed 1980 18104.0 Low
See ZGS (1988a) and ZGS (1988b) for locations.
There is exploration for gold, copper, zinc, silver arsenic, PGEs and nickel (ZGS, 2001).
3.34.3 Alluvial mining
Alluvial mining of gold takes place in the Manyame River (Figure 3.14; Chiyanike, 1997).
3.34.4 Monitoring systems
ZINWA carries out extensive monitoring of the Manyame River, although this is mainly in the vicinity of the
Harare – Chitungwiza metropolitan area.
3.34.5 Water quality data
Water quality data are available from ZINWA for several monitoring stations.

cxci
3.34.6 Implications for water quality and quantity management
Impact from mining is expected from three main sources:
• Chrome mining, both large scale and small scale, along the Great Dyke, with extensive excavations;
• Historical gold mining operations in the Chinhoyi Greenstone Belt, notably Kia Ora, with associated acid
mine drainage; and
• Alluvial gold mining of the Manyame river and its tributaries in the area north of Banket.
Examination of the available water quality data shows clear affects of the Harare – Chitungwiza metropolitan
area on various parameters. This issue has been explored extensively by authorities such as Machena (1997),
Mathuthu and others (1997) Staneva (1997) and Zaranyika (1997). Unfortunately, no water quality data were
available on the Manyame River downstream of the main mining areas of the Great Dyke and the Chinhoyi
Greenstone Belt.
3.35 The Musengezi sub-catchment
3.35.1 General description
3.35.1.1 Hydrology
This is Zones UG1 and UG2 of Area C (ZSG, 1984). The Musengezi Sub-catchment stretches from Lake
Cahora Bassa to the Mvurwi area (Figure 3.2) and is perennial. Its main tributaries are the Hoya and the
Mukumbura.
3.35.1.2 Geology
See Figure 3.6 (ZGS, 1999). Granites in the south and Zambezi Mobile Belt gneisses in the north underlie the
upper part of the sub-catchment. The lower part of the catchment – the Zambezi Valley – is underlain by Upper
Karoo Group and Dande Formation sediments (in contrast to Figure 3.6). The northernmost end of the Great
Dyke enters the sub-catchment from the west.

cxcii
3.35.1.3 Pedology, agriculture and land use
Soils in the sub-catchment can be divided into three groups:
• Very shallow, gravelly soils in the hills along the Zambezi Escarpment;
• Moderately shallow, coarse grained sandy, kaolinitic soils derived from granites; and
• Moderately shallow to moderately deep sands, highly sodic in places, formed from Upper Karoo and Dande
sediments (DRSS, 1979).
Above the Zambezi Escarpment, the sub-catchment lies generally within Natural Region IIa: high and reliable
rainfall of up to 1000mm per annum and deep soils. Land below the escarpment is in Region IV: fairly low
rainfall of 450mm to 650mm per annum (ZSG, 1997; Surveyor General and AGRITEX, 1998).
Land use is commercial farming, private and resettlement land, south of the Zambezi Escarpment (ZSG, 1998),
with intensive livestock and cash crop production. Below the escarpment are Communal Lands and an ARDA
Estate, where poor soils and low rainfall limit agriculture to some livestock, cotton and a few drought resistant
crops.
The major settlements are Muzarabani, Centenary and Mvurwi Towns. Population is growing significantly in the
Muzarabani area.
3.35.1.4 Surface water users
Irrigation by commercial agriculture is a major water user above the Zambezi Escarpment, and at the ARDA
estate near Muzarabani. The town draws water for domestic use.
3.35.1.5 Water management systems
The sub-catchment falls under the Manyame Catchment Council of ZINWA.
3.35.1.6 Human impacts on water resources (excluding mining)
The following could be expected to have an impact on water resources:
• Landfills, urban areas of Centenary, Muzarabani and Mvurwi;
• Disposal of liquid effluent, urban areas of Centenary, Muzarabani and Mvurwi;

cxciii
• Urban run off, urban areas of Centenary, Muzarabani and Mvurwi;
• Non-point domestic effluent, rural areas;
• Non-point impact of agriculture (pesticides, fertilizers, etc), especially where commercial agriculture is
practiced;
• Non-point impact of irrigation in redistribution of river waters;
• Minor non-point impact from sparse subsistence agriculture in the Zambezi valley; and
• Fuel loss and litter on the main roads from Mvurwi to Muzarabani.
3.35.2 Mining and mineral processing operations
The catchment falls under the Harare Mining District (ZGS, 1995). The main mining activity is small-scale
chrome mining along the Great Dyke.
There is exploration for gold, silver, nickel, PGEs, and diamonds (ZGS, 2001).
3.35.3 Alluvial mining
Not reported, and unlikely.
3.35.4 Monitoring systems
None.
3.35.5 Water quality data
None available.
3.35.6 Implications for water quality and quantity management

cxciv
The only impact from mining to be expected is that which may arise from small-scale chrome mining along the
Great Dyke.
3.36 The Ruya sub-catchment
3.36.1 General description
3.36.1.1 Hydrology
This is Zone M2 of Area D (ZSG, 1984; Figure 3.2). The Ruya River is dammed at Frogmore near Mvurwi.
3.36.1.2 Geology
See Figure 3.6 (ZGS, 1999). North of Mount Darwin, Zambezi Mobile Belt gneisses underlie the sub-
catchment. South of Mount Darwin is the Darwin Greenstone Belt and granitic terrain.
3.36.1.3 Pedology, agriculture and land use
Soils in the sub-catchment can be divided into two groups:
• Moderately shallow, coarse grained kaolinitic sands and sandy loams, derived from the granites and
gneisses; and
• Moderately deep to deep, granular clays, formed from the Greenstone Belt (DRSS, 1979).
South and northwest of Mount Darwin, the sub-catchment lies generally within Natural Region IIa: high and
reliable rainfall of up to 1000mm per annum and deep soils. Northwest of Mount Darwin is in Region III, high
rainfall and deep soils and Region IV: fairly low rainfall of 450mm to 650mm per annum (ZSG, 1997; Surveyor
General and AGRITEX, 1998).
Land use south and northwest of Mount Darwin is commercial farming, private and resettlement land (ZSG,
1998), with intensive livestock and cash crop production. Northeast of Mount Darwin are Communal Lands,
soils are somewhat poorer and rainfall slightly lower, limiting agriculture to drought resistant crops and livestock
supported by fodder crops.
The major settlements are Mount Darwin, Mutepatepa and Rushinga.

cxcv
3.36.1.4 Surface water users
The towns draw water from within the sub-catchment. Irrigation by commercial agriculture is a major water user.
3.36.1.5 Water management systems
The sub-catchment falls under the Mazowe Catchment Council of ZINWA.
3.36.1.6 Human impacts on water resources (excluding mining)
The following could be expected to have an impact on water resources:
• Landfills, urban areas of Mount Darwin, Mutepatepa and Rushinga;
• Disposal of liquid effluent, urban areas of Mount Darwin, Mutepatepa and Rushinga;
• Urban run off, urban areas of Mount Darwin, Mutepatepa and Rushinga;
• Non-point domestic effluent, rural areas;
• Non-point impact of agriculture (pesticides, fertilizers, etc), especially where commercial agriculture is
practiced;
• Non-point impact of irrigation in redistribution of river waters;
• Minor non-point impact from sparse, subsistence agriculture in the Zambezi valley; and
• Fuel loss and litter on the main roads from to Mount Darwin and Rushinga.
3.36.2 Mining and mineral processing operations
The catchment falls under the Harare Mining District (ZGS, 1995). The main mining activities are pegmatite
mining.
Table 3.35: Mining operations in the Ruya sub-catchment.
Name Commodity Status Total produced /t
Potential Impact
Mount Darwin "Black Granite"
Dolerite
Medium
Rushinga Dolomite Closed 1984 66204.0 Low

cxcvi
Dolomite
Kaseke Talc Production started
in 1985
Low
Birthday Gift Tantalum Closed 1980 6.7 Low
See ZGS (1988a) for locations.
There is also small-scale production of glitterstone in the Rushinga area (Barton and others, 1991).
There is exploration for PGEs, vanadium and diamond (ZGS, 2001).
3.36.3 Alluvial mining
Alluvial mining of gold takes place in the Ruya River (Chiyanike, 1997), as well as most tributaries draining the
greenstone belts (Figure 3.14). This has been taking place since early in the twentieth century (Leitner and
Phaup, 1974). There has also been eluvial mining of tantalum (Leitner and Phaup, 1974).
3.36.4 Monitoring systems
ZINWA is currently setting one up.
3.36.5 Water quality data
None available.
3.36.6 Implications for water quality and quantity management
The major impact of mining is expected to be that arising from alluvial mining of gold. Some impact from exploitation of dimension stone (mainly dolerite) and industrial minerals may also take place, principally in terms
of siltation.
3.37 The Mazowe sub-catchment
3.37.1 General description

cxcvii
3.37.1.1 Hydrology
This is Zones M1, M3-M7, UR1-UR4, IY1-IY3 and N1-N3 of Area D (ZSG, 1984). The major
tributaries of the perennial Mazowe (Mazoe) River are the Nyadiri (Zones N1-N3), Nyagui
(IY1-IY3) and Marodzi (Umrodsi) (UR1-UR4) (Figure 3.2). The Mazowe is dammed at
Mazowe Dam in the Iron Mask Range (Zone M7).
3.37.1.2 Geology
See Figure 3.6 (ZGS, 1999). The Zimbabwe Craton underlies most of the sub-catchment: Dindi Greenstone
Belt, Makaha Greenstone Belt, Harare-Bindura-Shamva Greenstone Belt and granitic terrain. Zambezi Mobile
Belt gneisses underlie the far north. The granites in the Mutoko and Murehwa areas are widely intruded by
Mashonaland Dolerites.
3.37.1.3 Pedology, agriculture and land use
Soils in the sub-catchment can be divided into two groups:
• Moderately shallow to deep, coarse grained kaolinitic sands and sandy loams, tending towards clays in the
area north of Marondera, derived from the granites and gneisses; and
• Moderately deep to deep, granular clays, formed from the Greenstone Belt and the dolerites (DRSS, 1979).
The western half of the sub-catchment, from Harare to Bindura, Murehwa and Shamva, lies within Natural
Region II: high and reliable to semi reliable rainfall of up to 1000mm per annum and deep soils. Mutoko and
Katiyo lie in Region III, with moderately high rainfall and deep soils . The northeast of the sub-catchment,
beyond Mutoko, lies in Region IV: fairly low rainfall of 450mm to 650mm per annum (ZSG, 1997; Surveyor
General and AGRITEX, 1998).
Land in the south and west is commercial farming, private and resettlement land (ZSG, 1998), with intensive
livestock and cash crop production. In the north and east land use is Communal Land and conventional
resettlement land, with soils that are somewhat poorer and rainfall slightly lower, limiting agriculture to drought
resistant crops and livestock supported by fodder crops.

cxcviii
The major settlements are the eastern edges of the City of Harare, and the towns of Goromonzi, Mazowe,
Bindura, Shamva, Murehwa and Mutoko.
3.37.1.4 Surface water users
Goromonzi, Bindura, Shamva, Murehwa and Mutoko draw water from within the sub-catchment. The City of
Marondera, although located in the Save Catchment, draws its water supply from Longlands Dam on the
Nyambuya River, a tributary of the Nyagui. The City of Harare draws water from outside the sub-catchment.
Irrigation by commercial agriculture is a major water user, notably use of water from Mazowe Dam for citrus
estates.
3.37.1.5 Water management systems
The sub-catchment falls under the Mazowe Catchment Council of ZINWA.
3.37.1.6 Human impacts on water resources (excluding mining)
The following could be expected to have an impact on water resources:
• Landfills, urban areas of Harare, Goromonzi, Mazowe, Bindura, Shamva, Murehwa and Mutoko;
• Disposal of liquid effluent, urban areas of Harare, Goromonzi, Mazowe, Bindura, Shamva, Murehwa and
Mutoko;
• Urban run off, urban areas of Harare, Goromonzi, Mazowe, Bindura, Shamva, Murehwa and Mutoko;
• Non-point domestic effluent, rural areas;
• Non-point impact of agriculture (pesticides, fertilizers, etc), especially where commercial agriculture is
practiced;
• Non-point impact of irrigation in redistribution of river waters;
• Minor non-point impact from sparse, subsistence agriculture in the northeast;
• Fuel loss and litter on the main roads and railways; and
• Run off from Trojan Airport.
3.37.2 Mining and mineral processing operations

cxcix
The catchment falls under the Harare Mining District (ZGS, 1995). The main mining activities are gold
production, nickel mining, dolerite quarrying and pegmatite mining:
Table 3.36: Mining operations in the Mazowe sub-catchment.
Name Commodity Status Total produced /t
Potential Impact
Murehwa "Black Granite" Dolerite Medium
Ganyanhewe Amazonite Closed 1967 2503.0 Medium
Kataha Amazonite Closed 1972 1145.0 Medium
Dodge Barytes In operation 30524.0 Low
Augustus Beryl Closed 1961 168.7 Low
Eagle Beryl Closed 1970 155.4 Low
Fungwe Beryl Closed 1970 140.3 Low
God's Gift Group Beryl Closed 1983 330.7 Low
Hotspur Beryl Closed 1970 157.1 Low
Mabelle Beryl Closed 1970 102.2 Low
Mistress Beryl Closed 1982 233.3 Low
Rabbit Warren Beryl Closed 1969 115.5 Low
Benson Caesium Closed 1965 22.7 Low
New Barakaat Caesium Closed 1967 25.1 Low
Ulva Citrine Closed 1983 21.5 Low
Madziwa Cobalt In operation 146.2 High: AMD possible
Trojan Cobalt In operation 252.7 High: AMD possible
Ndiri Corundum Closed 1980 2511.9 Low
O'Briens Corundum Closed 1983 162237.7 Low
Weluzani Corundum Closed 1979 1421.8 Low
Augustus Feldspar Closed 1974 6647.0 Low
Mistress Feldspar Closed 1984 7730.0 Low
Patronage Feldspar Closed 1981 1677.0 Low
Lucky Fish Garnet Gem Closed 1969 4.1 Low
Treasure Casket Garnet Gem Closed 1969 7.4 Low
Lindemann Garnet industrial Closed 1977 112.0 Low
Manyuchi Garnet industrial Closed 1983 245.1 Low
Acturus/Planet Gold In operation 36.0 High: Arsenic possible
Freda Rebecca Gold In operation 17.4 High: Arsenic possible
Gladstone Gold In operation 5.7 High: Arsenic possible
Jumbo Gold In operation 5.3 High: Size
Kimberley Reefs Gold 8.0 High: Arsenic possible
Mazowe Gold In operation 31.8 High: Size
Prince of Wales Gold Closed 15.5 High: Arsenic possible

cc
Shamva Gold In operation 68.7 High: Size & Arsenic
possible
Ky Kyanite Closed 1977 31453 Low
Early Worm Limestone Open in 1984 576463 Medium
Mbebi Limestone Closed 1984 115983 Low
Sternblick Limestone Open in 1984 5789587 Medium
Arcadia Lithium Closed 1972 7750.0 Low
Casa Ventura Lithium Closed 1981 606.0 Low
Fungwe Lithium Closed 1969 601.0 Low
Mauve Lithium Closed 1958 4922.0 Low
Mistress Lithium Closed 1971 1740.0 Low
Winston Lithium Closed 1967 1122.0 Low
Madziwa Nickel In operation 29306.0 High: AMD possible
Trojan Nickel In operation 69937.0 High: AMD possible
Trojan Platinum In operation Medium
Iron Duke Pyrite In operation 2180495.0 High
Barauta Sapphire Closed 1971 0.00019 Low
Benson Group Tantalum Closed 1983 167.0 Low
Beryl Rose Tantalum Open in 1984 26.8 Low
Bush Ridge Tantalum Closed 1981 8.8 Low
Joking Tantalum Closed 1963 5.4 Low
Mabelle Tantalum Closed 1982 5.2 Low
Mauve Tantalum Closed 1983 22.8 Low
Mistress Tantalum Closed 1984 31.0 Low
Mkanga Tantalum Closed 1981 6.9 Low
Patronage Tantalum Closed 1980 6.6 Low
Wanroo Tantalum Closed 1962 5.1 Low
Alton Tungsten Closed 1971 532.35 Low
Ball Tungsten Closed 1971 294.250 Low
Hill Top Tungsten Closed 1980 65.120 Low
Kakonde Tungsten Closed 1972 76.9 Low
RAN Tungsten W closed 1965,
producing Au only
772.0 Low
Scheelite King Tungsten Closed 1981 860.3 Low
Winter's Tale Vermiculite Closed 1959 1647.18 Low
See ZGS (1988a) and ZGS (1988b) for locations.
There is exploration for gold, copper, zinc, lead, tantalum, PGEs, arsenic, silver, nickel, kyanite and mica (ZGS,
2001).

cci
3.37.3 Alluvial mining
Alluvial mining of gold is reported by Chiyanike (1997) from the Mazowe, Nyadiri and Nyagui Rivers (Figure 3.14). Other tributaries, such as the Mufurudzi River, are also alluvial mined. The alluvial mining is very
extensive.
3.37.4 Monitoring systems
ZINWA is currently setting up a monitoring system.
3.37.5 Water quality data
None available from ZINWA. Chenje and other (1998) provided data on discharges from Trojan Mine.
Table 3.37: Actual discharge from Trojan Mine, after Chenje et al. (1998).
PH 7.07 Alkalinity 140ppm TDS 221ppm Total
hardness
84ppm
NO3- 8.06ppm N Cl- 2ppm PO4
3- 0.2ppm SO42- 13ppm
Mg 8ppm Ca 34ppm K 4.6ppm
Gratwicke (1999), in a study on rivers downstream of the Mazowe Group and iron Duke Mines, provides the following data (Table 3.38):
Table 3.38: Data from Mazowe area: range over 9 months, after Gratwicke (1999).
Site name (Gratwicke 1999)
Mine Citrus Bridge After confluence
pH 3.10 – 6.90 6.95 – 7.94 6.29 – 7.92
Conductivity / µS/cm 125 – 5000 348 – 475 330 – 490
Dissolved O / ppm 0.00 – 6.84 5.18 – 7.52 4.10 – 7.40
Location relative to mines Below Iron Duke Below Mazowe Group Below both
3.37.6 Implications for water quality and quantity management
The most significant impacts of mining to be expected are:-

ccii
• Alluvial mining of gold in the Mazowe River and many of its tributaries;
• Several large and arseniferous gold mines in the Harare-Bindura-Shamva50 Greenstone Belt, with possible
associated acid mine drainage;
• Two large nickel-cobalt producing mines near Bindura, and the associated Trojan smelter, with acid mine
drainage and heavy metal release: data from Chenje and others (1998) suggests that nitrate contamination
may also be a problem; and
• Iron Duke pyrite mine, with possible acid mine drainage.
Gratwicke’s (1999) study shows serious acidity and salinization problems associated with Iron Duke Mine, but
also shows that these are limited beyond the confluence of the Yellow Jacket River (which drains the Iron Duke
Mine area) and the Mazowe river. Furthermore, recent dump rehabilitation at iron Duke should have improved
the situation.
Widespread quarrying of dolerite (“black granite”) alters local drainage patterns and provides depressions for
development of stagnant pools of water.
The Mazowe Sub-catchment contains several of Zimbabwe’s largest current mining operations as well as some
of the greatest concentrations of alluvial gold mining. The sub-catchment is also densely populated and a major
grain producer. The sub-catchment thus definitely deserves further study, especially given the continuation of
exploration activities in the area.
3.38 The Ruenya sub-catchment
3.38.1 General description
3.38.1.1 Hydrology
This is Zones R1-R6 of Area D (ZSG, 1984). The main tributaries of the Ruenya (Luenha) River are the
Nyangadzi (Zone R4) and the Nyangombe (Zones R5 and R6). The Mudzi River (Zone R1) flows into the
Ruenya in Mozambique (Figure 3.2).
3.38.1.2 Geology
See Figure 3.6 (ZGS, 1999). The Zimbabwe Craton underlies most of the sub-catchment: the Makaha
Greenstone Belt and granitic terrain. Zambezi Mobile Belt gneisses underlie the far north. The granites are
50 Arsenic contamination has been a major problem associated with mining in the Shamva area fro quite some
time (Stidolph, 1977)

cciii
widely intruded by Mashonaland Dolerites. Umkondo sediments and dolerites underlie the southeast edge of
the sub-catchment.
3.38.1.3 Pedology, agriculture and land use
Soils in the sub-catchment can be divided into two groups:
• Moderately shallow to deep, coarse grained kaolinitic sands and sandy loams, derived from the granites and
gneisses; and
• Moderately deep to deep, granular clays, formed from the Greenstone Belt and the dolerites (DRSS, 1979).
The area south and west of Chiendambuya lie within Natural Region II: high and reliable to semi reliable rainfall
of up to 1000mm per annum and deep soils. Mapako and Mayo lie in Region III, with moderately high rainfall
and deep soils. The northeast lies in Region IV: fairly low rainfall of 450mm to 650mm per annum. The area
around Nyanga, Sanyatwe and Juliasdale lies in Region I, with over 900mm rainfall and over 1700m altitude
(ZSG, 1997; Surveyor General and AGRITEX, 1998).
Land in the south and west is commercial farming, private and resettlement land (ZSG, 1998), with intensive
livestock and cash crop production. Land use in the mountain country around Nyanga is specialised agriculture,
mainly tea, coffee and fruit growing, and forestry. In the northeast land use is Communal Land and
conventional resettlement land, with soils that are somewhat poorer and rainfall slightly lower, limiting
agriculture to drought resistant crops and livestock supported by fodder crops.
The major settlements are Nyamapanda border post and Nyanga town.
3.38.1.4 Surface water users
Irrigation by commercial agriculture is a major water user. The towns of Nyamapanda and Nyanga draw
drinking water from within the sub-catchment.
3.38.1.5 Water management systems
The sub-catchment falls under the Mazowe Catchment Council of ZINWA.
3.38.1.6 Human impacts on water resources (excluding mining)

cciv
The following could be expected to have an impact on water resources:
• Landfills, urban areas of Nyamapanda and Nyanga;
• Disposal of liquid effluent, urban areas of Nyamapanda and Nyanga;
• Urban run off, urban areas of Nyamapanda and Nyanga;
• Non-point domestic effluent, rural areas;
• Non-point impact of agriculture (pesticides, fertilizers, etc), especially where commercial agriculture is
practiced;
• Non-point impact of irrigation in redistribution of river waters; and
• Minor non-point impact from sparse, subsistence agriculture in the northeast.
3.38.2 Mining and mineral processing operations
The catchment falls under the Harare Mining District (ZGS, 1995). The main mining activities are alluvial gold
production, nickel mining, dolerite quarrying and pegmatite mining.
Table 3.39: Mining operations in the Ruenya sub-catchment.
Name Commodity Status Total produced /t
Potential Impact
Mutoko "Black Granite" Dolerite Medium
Good Days Beryl Closed 1970 315.9 Low
Jordywitt Beryl Closed 1960 105.2 Low
Inyati Copper Closed 69496.0 High
Inyati Silver Closed 10.8 Medium
Inyati Gold Closed Medium
Gray Talc Closed 1976 2554.8 Low
Matedza (Jeep) Talc Closed 1973 1971.8 Low
Takagara Talc Closed 1976 1816.8 Low
See ZGS (1988a) for locations.
There is exploration for beryl, silver, gold, tantalum and base metals (ZGS, 2001).
3.38.3 Alluvial mining
Alluvial mining of gold takes place in the Ruenya River (Figure 3.14; Chiyanike, 1997). It may also take place in
the Mudzi River.

ccv
3.38.4 Monitoring systems
ZINWA is currently setting one up.
3.38.5 Water quality data
None available from ZINWA. Chenje and others (1998) provide some data on discharges from Inyati Mine
(Table 3.40).
Table 3.40: Actual Discharge from Inyati Mine, after Chenje et al. (1998). PH 6.8 TDS 1060ppm Total hardness 155ppm SO4
2- 560ppm
NO3- 4ppm N Na 35ppm
3.38.6 Implications for water quality and quantity management
The main impact to be expected is from the Inyati Mine, with possible heavy metals and acid mine drainage.
Alluvial gold mining will also affect the rivers. Widespread quarrying of dolerite (“black granite”) alters local
drainage patterns and provides depressions for development of stagnant pools of water.
3.39 The Kairezi sub-catchment
3.39.1 General description
3.39.1.1 Hydrology
This is Zones G1-G2 of Area F (ZSG, 1984). The main tributary of the Kairezi (Gairezi) River is the Matisi River.
3.39.1.2 Geology

ccvi
See Figure 3.6 (ZGS, 1999). Umkondo sediments and dolerites, along with some granites and Mashonaland
Dolerites, underlie most of the sub-catchment. Mozambique Belt gneisses underlie the far north.
3.39.1.3 Pedology, agriculture and land use
Soils in the sub-catchment can be divided into two groups:
• Moderately shallow to deep, coarse grained kaolinitic sands and sandy loams, derived from the granites and
gneisses; and
• Moderately deep to deep, granular clays, formed from the dolerites (DRSS, 1979).
Most of the sub-catchment lies in Region I: over 900mm rainfall and over 1700m altitude. North of Nyamaropa
lies in Region IV: fairly low rainfall of 450mm to 650mm per annum (ZSG, 1997; Surveyor General and
AGRITEX, 1998).
Land use in the mountain country is specialised agriculture, mainly tea, coffee and fruit growing, and forestry. In
the north, land use is Communal Land and conventional resettlement land, with soils that are poorer and rainfall
lower, limiting agriculture to drought resistant crops and livestock supported by fodder crops.
3.39.1.4 Surface water users
Irrigation by tea and coffee estates and fruit plantations is a major water user, as is the Nyamaropa irrigation
project.
3.39.1.5 Water management systems
The sub-catchment falls under the Mazowe Catchment Council of ZINWA.
3.39.1.6 Human impacts on water resources (excluding mining)
The following could be expected to have an impact on water resources:
• Non-point domestic effluent, rural areas;
• Non-point impact of agriculture (pesticides, fertilizers, etc), especially where commercial agriculture is
practiced;
• Non-point impact of irrigation in redistribution of river waters; and
• Minor non-point impact from sparse, subsistence agriculture in the north.

ccvii
3.39.2 Mining and mineral processing operations
The catchment falls under the Harare Mining District (ZGS, 1995). The only mining activity is quarrying of
kyanite in the far north.
There is no current legal exploration.
3.39.3 Alluvial mining
Alluvial mining of gold takes place along the Kairezi River and some of its tributaries (Figure 3.14).
3.39.4 Monitoring systems
None.
3.39.5 Water quality data
None available.
3.39.6 Implications for water quality and quantity management
The major impact to be expected is that arising from the alluvial mining of gold along the Kayirezi River and its
tributaries.
3.40 Summary of impacts of mining operations on water resources and water quality in the Zambezi basin
The wide variety of mining operations and mineral processing activities located within the Zambezi basin have
differing degrees of impact on both the water resources available to other users and on the water quality of
these resources. From the available data, it seems clear that those mining operations that are located within

ccviii
low rainfall regions of the basin (where physical weathering processes predominate) have relatively low and/or
localized impacts on the water resources. In contrast, mining operations located in the wetter regions of the
basin where chemical weathering processes predominate tend to have far more extensive impacts. This seems
to be due to the presence of ample moisture within the soil profile that enables continual chemical changes to
take place and allows the water available to mobilize and transport the different contaminants that become
available.
A summarized overview of the actual and anticipated impacts of mining operations and mineral processing
plants in each sub-catchment of the Zambezi basin is given in Table 3.41. This information provides a useful
impression that could be used to focus water resource management plans and water quality management plans
in the different component areas of the Zambezi basin.

ccix
4. THE LIMPOPO BASIN
In order to provide a suitable background for subsequent descriptions of the impacts of mining on water
resources in the Limpopo basin, this section starts with a brief overview of the catchment characteristics. This is
then followed by condensed descriptions of the information relating to mining activities and their impacts in each
sub-catchment.
The Olifants basin is actually a sub-catchment of the Limpopo basin but has been treated separately in this
report (see Section 5). As a result, the figures used in this report for the catchment area, runoff, and population
of the Limpopo basin exclude the relevant details for the Olifants basin.
4.1 Introduction
The Limpopo River is one of the most important rivers in southern Africa and its basin comprises portions of four
SADC states (Botswana, Mozambique, South Africa and Zimbabwe; Table 4.1; Figure 1.1). The basin is
located between 19.5 ° and 26.5 ° South latitude and between 25.5 ° and 34.5 ° East longitude, with a total
basin area of approximately 282,000 km2, comprising roughly 9% of the total area of the four basin states. The
area contributed to the basin by each state varies between 7.4% (Mozambique) and 12.8% (Botswana; Table 4.1).
Table 4.1: Area statistics for the four SADC states comprising the Limpopo basin (excluding the Olifants sub-
basin, which is dealt with in Section 5). [Data obtained from Midgley et al. (1995), SARDC (1996) and Boroto &
Görgens (1999)].
Country Total Area of Country (km2)
Country Area in Basin (km2)
Proportion of Country Area (%)
Proportion of Basin Area (%)
Botswana 600,370 70,000 11.7 24.8
South Africa 1,219,912 102,900 8.4 36.5
Mozambique 801,590 59,000 7.4 20.9
Zimbabwe 390,759 49,900 12.8 17.8
Totals: 3,012,631 281,800 9.4 100.0
The Limpopo River has a relatively dense network of tributary streams and rivers, though most of these
tributaries only have either seasonal or episodic flows. In historical times, the Limpopo River was considered to
be a strong-flowing perennial river but is now regarded as a weakly perennial river where flows frequently cease
and, during drought periods, no surface water is present over large stretches of the middle and lower reaches of
the river.

ccx
The Limpopo basin encompasses an important ecological transition zone that marks the junction of four
separate bio-climatic regions. The area is considered to be very important in terms of the diversity of its fauna
and flora and also contains several important conservation areas. In addition, the Limpopo basin supports a
very large population, including some of the region’s poorest rural communities, as well as numerous urban
areas and farming communities and important forestry areas.
4.1.1 Geology, topography and soils
The Limpopo basin is located over the northern lobe of the Kalahari Craton, with the Limpopo River valley
marking the approximate position of the Limpopo Mobile Belt where considerable mineralization has taken
place. The Archaean Craton rocks comprise predominantly crystalline granitic and gneissic rocks, intruded by
various Greenstone belts as well as dolerite dykes and sills. Karoo System rocks overlie large areas of the
southern portion of the basin and these are also associated with younger sedimentary and crystalline rocks
consisting predominantly of sandstones, mudstones, conglomerates and shales. Recent sedimentary deposits
line most of the river valleys and provide important farming areas (Du Toit, 1960).
In the southern (South African) portion of the basin, the Bushveld Igneous Complex forms an extremely
important feature and contains a very large proportion of the region’s mineral wealth. The geological features
of this area consist mostly of basic mafic and ultramafic intrusive rocks, accompanied by extensive areas of
acidic and intermediate intrusive rocks. At the southern periphery of this area, large dolomite and limestone
formations occur, accompanied by extensive mineralization along their contact zones. Large areas of the
central portion of the Limpopo basin consist of various deposits of consolidated and unconsolidated sedimentary
rocks, with important belts of intrusive Greenstone rocks that are heavily mineralised. The north-south trending
rhyolites and lavas of the Lebombo Mountains mark the eastern border between South Africa and Mozambique.
Elsewhere, harder, silicified sandstones and cherts, as well as syenitic and granitic outcrops, form erosional
remnants that protrude above the generally undulating terrain (Du Toit, 1960).
In the western portion of the basin, large areas are covered with deep layers of sedimentary rocks comprising
sandstones, siltstones, mudstones and shales. The northern-western areas are also marked by extensive
intrusions of Greenstones and schists that contain significant gold, copper and nickel mineralization. Older
Karoo System rocks that contain important coal deposits also underlie these areas.
The northern and northeastern portions of the Limpopo basin located in Zimbabwe consist of large expanses of
undifferentiated gneisses and granites, with numerous mineralised Greenstone intrusions. The Great Dyke of
Zimbabwe intrudes into the northeastern corner of the Limpopo basin.
The eastern (Mozambique) portion of the Limpopo basin consists largely of unconsolidated and consolidated
sedimentary rocks with granitic intrusions exposed as erosional remnants in the landscape.
The topography of the Limpopo basin is extremely varied, ranging from sea level in Mozambique to over 2,400
metres in the mountainous region marking the transverse position of the northern extension of the Drakensberg

ccxi
Mountains. Most of the basin consists of relatively undulating terrain between ranges of hills and mountains.
The northward flowing (South African) tributaries of the Limpopo River have incised deep gorges through the
hills and mountain ranges that are visible as erosional remnants. Elsewhere, the river valleys are broad and
flat-bottomed. The Limpopo River occupies a broad, sandy channel that is incised into the surrounding flat
countryside.
Large portions of the central and western parts of the Limpopo basin have very little or poor drainage, and are
usually considered to be endorheic (internally draining). These areas are often marked by the formation of
saltpans or clay-bottomed pans where rainfall collects and evaporates. These areas are generally subjected to
mechanical (physical) weathering processes, in contrast to the predominance of chemical weathering processes
in the wetter headwater regions of most tributaries.
The Mozambique portion of the Limpopo basin consists of gently undulating terrain with numerous small
tributary streams and pools forming part of the Chagane drainage system. This tributary rises close to the
Zimbabwe-Mozambique border, meanders across the Mozambique coastal plain and joins the Limpopo River
very close to its mouth on the coast near the town of Xai-Xai.
Soil formations across the Limpopo basin reflect the influence of underlying parent rock material, climatic
features and biological activity. The dominant soil types in the basin are moderately deep sandy to sandy-clay
loams in the south, grading to shallower, sandy soils in the north and deeper sandy soils in the west and east.
The deeper loam soils are extremely important for agricultural activities and support extensive irrigation
developments along many of the tributary rivers. A few extensive areas of black vertisols in the southern parts
of the basin also support important agricultural developments.
Deep layers of wind-blown Kalahari sands cover large areas of the western portion of the Limpopo basin, whilst
the sandy soils of the eastern (Mozambique) portion are derived from old, unconsolidated marine sands. These
sandy soils support important hardwood timber resources.
The valley bottom soils along all of the tributary rivers and the Limpopo main channel are generally of colluvial
or alluvial origin and support extensive areas of commercial and subsistence agriculture. In contrast, hilly or
steeply sloping areas have fragile, shallow, stony soils with little agricultural potential. In the endorheic areas,
most soils have a relatively high sodium and clay content and are dispersive.
4.1.2 Climatic features
Because of its geographic position, the climate of Limpopo basin is influenced by prevailing wind systems,
including tropical cyclones from the Indian Ocean. The most important of these rain-bearing winds are the
southeasterly wind systems that bring rainfalls from the Indian Ocean. In some years, the Inter-Tropical
Convergence Zone (ITCZ) moves sufficiently far southwards to influence rainfalls in the northern parts of the
basin.
Air temperatures across the Limpopo basin show a marked seasonal cycle, with hottest temperatures recorded
during the early Austral Summer months and lowest temperatures during the cool, dry winter months. Rainfalls

ccxii
are also highly seasonal, falling predominantly as intense convective thunderstorms during the warmer summer
months. Rainfalls vary from as little as 400 mm per annum in the central parts of the Limpopo valley to over
1,000 mm per annum on the Drakensberg Mountains and close to the mouth of the Limpopo River at Xai-Xai. A
sketch map showing the distribution of mean annual rainfall over the Limpopo basin is shown in Figure 4.1.
This figure also shows the main tributaries of the Limpopo River.
Evaporation rates across the Limpopo basin are both high and variable, ranging from some 3.1 metres per
annum in the western and central areas of the basin to some 1.7 metres in the cooler, mountainous regions in
the southeastern portion of the basin. In view of these evaporation rates, and the quantity of rainfall received
each year, several areas of the Limpopo basin show clear evidence of the dominance of physical weathering
processes (Weinert N values greater than 5.0). These areas are located in the western and central portions of
the basin and along the middle Limpopo valley. Virtually all of the rest of the Limpopo basin is subject to
chemical weathering processes, either seasonally (Weinert N values below 4.0) or continually (Weinert N values
below 2.0) (Weinert, 1964).
4.1.3 Population and land use patterns
The total population of the Limpopo basin is approximately 10.5 Million, with almost 60% of Botswana’s
population located within the basin (Table 4.2). The Limpopo basin also contains a large proportion of the
population comprising South Africa’s Gauteng Province, as well as the population of the Northern Province, and
almost all of the agricultural areas, towns and cities, mines and power stations of these two provinces. As a
result, the basin includes most of the critically important economic and energy heartland of South Africa.
Table 4.2: Population statistics for the four SADC states comprising the Limpopo basin (excluding the Olifants
sub-basin, which is dealt with in Section 5). [Data obtained from SARDC (1996), Basson et al. (1997), Chenje
(2000)].
Country
Total Population of
Country (Millions)
Country Population in Basin (Millions)
Proportion of Country
Population (%)
Proportion of Basin
Population (%)
Botswana 1.639 0.975 59.5 9.3
South Africa 43.421 7.950 18.3 76.1
Mozambique 19.980 1.150 5.8 11.0
Zimbabwe 13.109 0.375 3.0 3.6
Totals: 78.149 10.450 13.4 100.0
In Botswana, the Limpopo catchment supports several important towns and the capital City of Gaborone. The
South African sector of the Limpopo Catchment supports several large and medium-sized towns as well as
numerous smaller communities. Pietersburg, capital of the Northern Province, is also located here. In addition,

ccxiii
the City of Pretoria and the northern suburbs of the City of Johannesburg and the northern part of the Gauteng
province are also located in the basin. Throughout the country portions comprising this catchment, a wide
variety of mining operations as well as different forms of agriculture (subsistence and commercial cultivation,
game farming, livestock and dairy production) are the economic mainstays of the catchment.

ccxiv
All Limpopo basin states have skewed population distributions, and experience large-scale migration from rural
areas to urban settlements. The Northern province of South Africa comprises mostly extensive rural
populations that occupy former Apartheid self-governing “homelands”. As a consequence a large proportion of
the basin’s population is extremely poor and lack access to basic services and amenities such as clean water
and adequate sanitation.
Similar to the Zambezi basin, land is a critically important resource throughout the Limpopo basin and the
livelihoods of residents and the national economies of all basin states depend (Chenje, 2000). However, the
specific types of land use that are practiced are controlled by climatic factors, water availability and, importantly,
by land tenure arrangements. A large proportion of the land in the Limpopo basin states is under communal or
customary forms of tenure, and land ownership is considered to be one of the major constraints to proper land
use and conservation (Chenje, 2000).
Overcrowding and insecure ownership in the smaller communal farming areas (e.g. the Levuvhu and Nzhelele
sub-catchments in South Africa) is a primary source of land degradation in the basin. This feature is a critically
important driver of poverty within the Limpopo basin and is associated closely with declining indices of per
capita agricultural production (Dalal-Clayton, 1997). In many parts of the Limpopo basin, progressive
urbanization has been accompanied by the development of peripheral “informal” settlements around the major
urban areas.
In comparison to the Zambezi Catchment, the Zimbabwe and Mozambique portions of the Limpopo Catchment
are considered to be poor and sparsely settled part, whilst the Botswana and South African sectors have far
higher numbers of people and are more densely settled (Table 4.2). In the Zimbabwe and Mozambique
portions, there are no large cities and the only towns of any size are the Matabeleland South provincial capital of
Gwanda in Zimbabwe, and the coastal town of Xai-Xai located close to the mouth of the Limpopo River in
Mozambique. The Mozambique sector of the basin has numerous small villages and settlements scattered
along the lower reaches of the Limpopo.
4.1.4 Hydrological characteristics, water availability and patterns of water use
The quantity and timing of rainfall received in the Limpopo basin controls the quantity, timing and duration of
flows in the different tributary rivers. The uneven distribution of rainfall in the basin is reflected in the very
uneven distribution of water resources in the four basin states. In turn, these influence the types of economic
activities undertaken by the residents in each country. The uneven distribution of water across the basin has
led to tensions and occasional disputes between some of the basin states regarding what can be constituted as
a “fair and equitable share” of the available water resources (Ashton, 2000).
The Limpopo and its larger tributaries all exhibit marked seasonal cyclical patterns of high and low flows and
many of the smaller tributaries are entirely seasonal or episodic. As mentioned earlier, the Limpopo River
shows a very marked pattern of seasonal flows and, in dry years, surface flows cease altogether though water

ccxv
continues to flow in the deeper alluvial deposits. The western and central parts of the basin that receive the
lowest rainfalls have mainly seasonal or episodic rivers that have no surface flow during the dry winter months.
Recent studies on the Limpopo River (Boroto & Görgens, 1999) have focussed on the development of an
accurate hydrological modelling system that can incorporate the flow contributions of the four basin states. The
available information on flows in the Limpopo River is relatively poor and there are significant differences
between the flows gauged by different countries. An important hydrological characteristic of the Limpopo River
is the very large transmission losses (> 40%) that occur along its length. Whilst a part of the water loss can be
accounted for by the large volumes of water transpired by riparian vegetation, there is still uncertainty as to
where the remaining losses occur (Boroto & Görgens, 1999). Overall, flows decline along the length of the
Limpopo River and very little water discharges to the sea at Xai-Xai.
The demand for water throughout the Limpopo basin is both high and unevenly spread. In particular, water
demands by industry, mining and especially the formal (irrigation) agricultural sector account for over 75% of all
water used. Coupled with high evaporation losses from the numerous small dams and larger water supply
impoundments, flows in the lower reaches of the Limpopo River are usually relatively small, unless they have
been “boosted” by the arrival of a tropical cyclone (e.g. the cyclone that arrived in 2000 and flooded large
coastal areas of Mozambique).
Several small, though ecologically important, wetlands are found in the Limpopo basin (Midgley et al., 1995;
Boroto & Görgens, 1999). These wetlands occur predominantly along shallow-gradient reaches of tributary
rivers in the South African portion of the basin and the Mozambique coastal plain. The most important wetland
areas in the Limpopo basin are the Nylsvley and Mogalakwena floodplains in South Africa, and the mosaic of
wetlands on the Chagane floodplain in Mozambique.
The growing water shortage in Botswana prompted the construction of the North-South Carrier, a pipeline
system that transports water from the Motloutse River southwards to the City of Gaborone. This has also been
supplemented by an inter-basin transfer scheme where water from the Marico Dam in South Africa is
transferred over the border to Gaborone in Botswana. Further investigations are underway to determine the
feasibility of extending the pipeline northwards to draw water from the Zambezi River at Kazungula. Elsewhere
in the South African portion of the basin, numerous inter-basin transfer schemes convey water from one sub-
catchment to another to meet growing demands for water. In addition, three inter-basin transfer schemes
deliver water from the Vaal system in South Africa into the headwaters of the Crocodile and Olifants rivers to
provide domestic water supplies as well as cooling water for several coal-fired thermal power stations. The
overall water supply “picture” is made somewhat uncertain by the very real possibility that global climate
changes will also have an adverse effect on water availability throughout southern Africa (Ashton, 2000).
Throughout the length of the Limpopo River and its tributaries, water quality is generally good and the water is
usually fit for most designated uses. There are water quality problems due to increasing salinity in the central
parts of the basin, making the water less suitable for irrigation purposes and for domestic use. In addition, most
cities, towns and smaller communities discharge untreated or partially treated domestic and industrial effluent
into the various rivers (e.g. the cities and towns of the northern Pretoria – Witwatersrand metropolitan complex
in South Africa). As long as there is sufficient dilution, this practice does not have long-term or large-scale
ccxvi
detrimental effects. However, with increasing quantities of effluent and declining river flows due to escalating
demands for water, water quality problems are occurring more frequently. In some sub-catchments (e.g. the
Crocodile-Pienaars in South Africa), it is estimated that treated effluent comprises more than 60% of all flows in
this river system. The water quality problems caused effluent discharge become more acute further
downstream, as more and more towns contribute their effluent to the total river flow and evaporative
concentration accentuates the effects of rising salinity and increasing eutrophication.
In addition to water abstracted for domestic use, large volumes of water are also withdrawn for irrigation; for
example: the extensive irrigation areas along all of the tributary rivers and along parts of the Limpopo River.
Most small-scale farmers have to rely either on red-fed agriculture or on water drawn from shallow wells or
nearby watercourses. Overall, the competition for the limited water resources available is likely to become more
intense in future.
Within each of the four basin states, the Limpopo catchment has been divided into a series of sub-catchments
for the purposes of this study; these sub-catchments are shown in Figures 3.3 and 4.2.
4.1.5 Water management systems and institutions
Each of the basin states has their own water management systems and segments their respective territories
into Water Management Units or Water Management Areas. These divisions are normally in the form of sub-
catchments, though some of the larger sub-catchments may be further sub-divided. The formal constitution of
catchment councils or catchment management agencies has only taken place in Zimbabwe. In the other basin
states, water management is undertaken by central Government or is delegated to Provincial Departments. In
South Africa, the process of setting up formal Catchment Management Agencies for the nineteen Water
Management Areas in the country has started. At this time, the preparatory work for one such agency, the
Crocodile West-Marico Catchment Management Agency is now nearing completion. This agency will become
the first South African catchment management agency to deal with water resource management in a part of the
Limpopo basin.
The SADC Protocol on Shared Watercourse Systems is an important legislative instrument that promotes
regional co-operation and collaboration amongst all SADC states. However, unequal institutional and
professional capacity within the four member states hampers full expression of this protocol. The four basin
states comprising the Limpopo basin have jointly formed a Joint Permanent Technical Commission (JPTC) to
deal with matters of common interest relating to the Limpopo River and its tributaries. This Commission deals
with matters such as joint flow gauging exercises and inter-basin transfers, as well as dealing with proposed
new water development projects by each of the member states.

ccxvii
Each basin state maintains its own system of meteorological and hydrological data collection, primarily for use
at the national level. Whilst these systems are at very different levels of coverage in the different states, the
data does enable the four basin states to contribute to joint exercises to monitor and predict rainfall and runoff in
the Limpopo basin. Recent improvements in weather radar systems and satellite monitoring systems help to
expand and improve the regional coverage.
The Botswana Department of Mineral and Energy Affairs is responsible for all water management issues, and
operates a good system of flow recording and water quality monitoring on the tributary rivers within its national
boundaries.
The South African Department of Water Affairs and forestry maintains a comprehensive system of flow and
water quality monitoring on all of the tributary rivers within its area of jurisdiction. Whilst these data are the most
comprehensive available for the Limpopo basin, they are not entirely adequate for accurate predictions of flow
and water quality in the Limpopo River. Eleven sub-catchments are recognized within the South African sector
of the Limpopo basin.
In the Zimbabwean sector of the Limpopo basin, the Zimbabwean National Water Authority (ZINWA) places the
Zimbabwean portion of the Limpopo basin under a single Catchment Council: Mzingwane, which corresponds to
Hydrological Zone B (ZSG, 1984). Six sub-catchments of the Limpopo basin are recognized in Zimbabwe
(Figure 3.3). No water quality data are available from ZINWA for the Zimbabwe sector of the Limpopo basin.
In the Mozambican sector of the Limpopo basin, two sub-catchments are recognized: the lower Limpopo and
the Chagane. A few flow monitoring data are available from the Mozambique sector but these are not entirely
adequate for accurate modelling purposes (Boroto & Görgens, 1999).
4.1.6 Mining and mineral processing operations within the Limpopo basin
There are a large number of mining operations exploiting a wide variety of minerals in the Limpopo basin; the
locations of these operations are shown in Figure 4.2, whilst the mines located in the South African sector of
the Limpopo basin are shown in more detail in Figure 4.3. Within Zimbabwe, there are a smaller number and
variety of mining and minerals processing operations in the Limpopo Catchment than in the Zambezi catchment,
but mining is still widespread (Figures 3.7 to 3.14).
Data on the type of mine, size, operational status and location of mining operations are presented in the
respective sections on the individual sub-catchment, along with inferences on potential impact. The
high/medium/low inference for potential impact was arrived at using the criteria in Table 1.3 and is discussed
sub-catchment by sub-catchment in the following sections. A summarizing overview of the actual and potential
impacts on water resources and water quality in each sub-catchment of the Limpopo basin is given in Section 4.23.

ccxviii
In the following portions of this sections of the report that contain descriptions of the mining and mineral
processing activities in each sub-catchment, it is important to refer to Figures 4.2 and 4.3, as well as Figure 3.2
for the positions of the different sub-catchments within the Limpopo basin.
4.2 The Ngotwane-Bonwapitse sub-catchment
4.2.1 General description
4.2.1.1 Hydrology
The Ngotwane River and its major tributary the Bonwapitse River rise in a range of low sandstone hills at the
edge of the Kalahari Desert to the southwest of the Botswana capital, Gaborone, and north of Gaborone,
respectively. The Ngotwane River flows in a north-easterly direction to join the Limpopo River some 50
kilometres downstream of the confluence of the Marico and Crocodile rivers, near Steenbokpan. The
Bonwapitse River also flows in a north-easterly direction, joining the Limpopo River some 60 kilometres
downstream of the Ngotwane-Limpopo confluence.
The Ngotwane River is dammed near Gaborone (Gaborone Dam) and provides the main source of domestic
and industrial water for the city. Several small farm dams and numerous boreholes provide water for small-
scale irrigation and stock watering in several parts of this sub-catchment.
4.2.1.2 Geology
The rocks of the Kalahari Craton underlie this sub-catchment. Large areas of the sub-catchment have
exposures of Gaborone and Mahalapye granites, as well as rocks of the Palapye Suite and Lobatse and Kanye
formations. Karoo System rocks in the area contain economic sources of coal.
4.2.1.3 Pedology, agriculture and land use
Soils in the sub-catchment can be divided into five groups:
• Moderately shallow, coarse-grained feldspathic sands, derived from the Gaborone and Mahalapye granites;
• Moderately shallow sandy loams, formed from gneisses; and
• Shallow, clay soils with high sodium content in internally draining areas.
The sub-catchment receives low and unreliable rainfalls (under 500 mm per year) with high evaporation rates.
Soils are generally shallow and poor to medium quality. Areas with high sodium content pose a salinization risk
to irrigation farmers. Soils become progressively sandier towards the northeast of the sub-catchment as
rainfalls decline and evaporation rates increase.

ccxix
Land use in the upper parts of the sub-catchment consist of small- and large-scale commercial farming of
drought resistant crops, as well as extensive livestock rearing, particularly of goats and donkeys. The main
settlements are the capital city Gaborone, and the important towns Kanye, Thamaga, Tlokweng, Molepolole and
Mochudi, Mahalapye and Mmamabula as well as numerous smaller settlements, particularly along the road
between Gaborone and Francistown.
4.2.1.4 Surface water users
All towns and settlements rely on whatever surface water they can obtain from local streams and rivers, as well
as an extensive system of boreholes. Gaborone obtains a large proportion of its water from the Gaborone dam,
supplemented by water transferred from the Marico Dam in South Africa, and the North-South Pipeline that
brings water to Gaborone from the Motloutse sub-catchment to the north. Towns located along the route
followed by the North-South Pipeline obtain their water from this pipeline and local boreholes. Most irrigation
water use is based on water pumped from local boreholes.
4.2.1.5 Water management systems
The Botswana Department of Water Affairs (Gaborone office and Mahalapye office) is responsible for
management of all water resources in this sub-catchment. Close liaison is maintained with the South African
Department of Water Affairs and Forestry over water transferred from the Marico Dam and regarding flows in
the Limpopo River, by means of a Joint Permanent Technical Commission (JPTC). Both countries collaborate
in the gauging of river flows and exchange of water quality and flow data. Routine flow gauging is carried out at
two stations on the Ngotwane River and at one station on the Bonwapitse River (Boroto & Görgens, 1999).
4.2.1.6 Human impacts on water resources (excluding mining)
The following can be expected to impact on water resources in this sub-catchment:
• Landfills and solid waste disposal sites at Gaborone, Kanye, Thamaga, Tlokweng, Molepolole, Mochudi,
Mahalapye and Mmamabula, as well as numerous smaller settlements;
• Disposal of liquid (domestic and some light industrial) effluent at Gaborone, Kanye, Thamaga, Tlokweng,
Molepolole, Mochudi, Mahalapye and Mmamabula;
• Non-point domestic effluent via soak-aways in rural areas;
• Non-point impact of irrigation and redistribution of river waters;
• Minor non-point impact from non-intensive commercial or subsistence agriculture; and
• Fuel loss and litter on the roads between Ramotswa, Thamaga, Kanye, Gaborone, Mochudi and
Mahalapye.
4.2.2 Mining and mineral processing operations

ccxx
A single small coal mine is in operation at Mmamabula (Table 4.3).
Table 4.3: Mining operations in the Ngotwane-Bonwapitse sub-catchment.
Code Number
Name of Mine Commodity (ies)
Mined Status
Relative Size
Probable Impact
Bots-1 Mmamabula Coal Operating Small Low, localized
4.2.3 Alluvial mining
None known.
4.2.4 Monitoring systems
Three flow gauging sites are located on the Ngotwane River (two sites) and the Bonwapitse River (one site).
The Botswana Department of Water Affairs conducts regular monitoring of water quality in all the water supply
dams, as well as water supplied to towns and smaller communities from the Marico Dam and via the North-
South Pipeline. The geohydrology section within the Department of water Affairs also tests borehole water
quality at regular intervals.
4.2.5 Water quality data
None obtainable in time for this report, but data are available from the Botswana Department of Water Affairs.
4.2.6 Implications for water quality and quantity management
Very minor impacts can be anticipated from the Mmamabula Colliery, in terms of possible elevated
concentrations of suspended solids, total dissolved salts and sulphate. Very small impacts of acid mine
drainage can be anticipated.
4.3 The Lotsane sub-catchment
4.3.1 General description
4.3.1.1 Hydrology
The Lotsane River and its minor tributary streams rise in a range of low sandstone hills at the eastern edge of
the Kalahari Desert, to the west of the town of Serowe. The Lotsane River flows in an easterly direction to join

ccxxi
the Limpopo River some 100 kilometres downstream of the confluence of the Bonwapitse and Limpopo rivers.
The river is normally seasonal and only carries surface water during the summer months.
The Lotsane River has a small water supply dam near the town of Palapye and this provides the main source of
domestic water for the town, as well as water drawn from the North-South Pipeline. Several small farm dams
and boreholes provide water for stock watering in several parts of this dry sub-catchment.
4.3.1.2 Geology
The rocks of the Kalahari Craton underlie this sub-catchment. Large areas of the sub-catchment have
exposures of Gaborone and Mahalapye granites, as well as rocks of the Palapye Suite and the Lebung
Formation of the Karoo System. The Karoo System rocks in the area contain economic sources of coal.
4.3.1.3 Pedology, agriculture and land use
Soils in the sub-catchment can be divided into five groups:
• Moderately shallow, coarse-grained feldspathic to kaolinitic sands, derived from the Gaborone and
Mahalapye granites;
• Moderately shallow sandy loams, formed from gneisses; and
• Shallow, clay-rich soils with high sodium content in internally draining areas.
The sub-catchment receives low and unreliable rainfalls (under 500 mm per year) with high evaporation rates.
Soils are generally shallow and poor to medium quality. Areas with high sodium content pose a salinization risk
for irrigation schemes. Soils become progressively sandier towards the eastern portion of the sub-catchment as
rainfalls decline and evaporation rates increase.
Land use in the sub-catchment consists mostly of small-scale commercial and subsistence farming of drought
resistant crops, as well as livestock rearing of goats and donkeys. The main settlements are the towns of
Serowe, Palapye, Mokoro and Maunatlala, with numerous smaller settlements located along the North-South
Pipeline route and along the many roads traversing the sub-catchment.
4.3.1.4 Surface water users
All towns and settlements rely on whatever surface water they can obtain from the seasonal flows in local
streams and rivers, as well as an extensive system of boreholes. Larger towns such as Serowe and Palapye
obtain most of their water from the North-South Pipeline as well as from local boreholes. Small areas of
irrigation rely on local boreholes for their water supplies.
4.3.1.5 Water management systems

ccxxii
The Botswana Department of Water Affairs (Mahalapye and Serowe offices) is responsible for management of
all water resources in this sub-catchment. River flows are gauged at one site on the Lotsane River (Boroto &
Görgens, 1999).
4.3.1.6 Human impacts on water resources (excluding mining)
The following can be expected to impact on water resources in this sub-catchment:
• Landfills and solid waste disposal sites at Serowe and Palapye, as well as at numerous smaller settlements;
• Disposal of liquid (domestic) effluent at Serowe and Palapye;
• Non-point domestic effluent via soak-aways in rural areas;
• Non-point impact of localized, small-scale irrigation;
• Minor non-point impact from subsistence agriculture; and
• Fuel loss and litter on the roads between Groblers Bridge and Serowe, and between Mahalapye and
Francistown, as well as along numerous smaller roads in the sub-catchment.
4.3.2 Mining and mineral processing operations
A single small coal mine is in operation at Morupele-Moijabana (Table 4.3).
Table 4.4: Mining operations in the Lotsane sub-catchment.
Code Number
Name of Mine Commodity (ies)
Mined Status
Relative Size
Probable Impact
Bots-2 Morupele-Moijabana Coal Operating Small Low
4.3.3 Alluvial mining
None known.
4.3.4 Monitoring systems
One flow-gauging site is located on the Lotsane River downstream of the town of Palapye. The Botswana
Department of Water Affairs conducts regular monitoring of water quality in all the water supply dams, as well
as water supplied to towns and smaller communities from the North-South Pipeline. The geohydrology section
within the Department of water Affairs also tests borehole water quality at regular intervals.
4.3.5 Water quality data

ccxxiii
None obtainable in time for this report, but data are available from the Botswana Department of Water Affairs.
4.3.6 Implications for water quality and quantity management
Very minor impacts can be anticipated from the Morupele-Moijabana Colliery, in terms of possible elevated
concentrations of suspended solids, total dissolved salts and sulphate. Very small localized impacts of acid
mine drainage can be anticipated.
4.4 The Motloutse sub-catchment
4.4.1 General description
4.4.1.1 Hydrology
The Motloutse River and its minor tributary streams rise in a range of low hills at the eastern edge of the
Kalahari Desert, to the south-west of Francistown. The Motloutse River flows in an easterly direction to join the
Limpopo River some 40 kilometres upstream of the confluence of the Shashe and Limpopo rivers. The river is
normally seasonal and only carries surface water during the summer months.
The Motloutse River has a small water supply dam near the town of Selibe-Phikwe and this provides the main
source of domestic water for the town and mine, as well as water drawn from the North-South Pipeline. Several
small farm dams and boreholes provide water for stock watering in several parts of this dry sub-catchment.
4.4.1.2 Geology
The rocks of the Kalahari Craton underlie this sub-catchment. Large areas of the sub-catchment have
exposures of Gaborone and Mahalapye granites, as well as rocks of the Palapye Suite and the Lebung
Formation of the Karoo System. The Karoo System rocks in the area contain economic sources of coal. The
Selibe-Phikwe copper-nickel mine is located on a contact zone of intense mineralization at the edge of a large
Gaborone Granite formation.
4.4.1.3 Pedology, agriculture and land use
Soils in the sub-catchment can be divided into five groups:
• Moderately shallow, coarse-grained feldspathic to kaolinitic sands, derived from the Gaborone and
Mahalapye granites;
• Moderately shallow sandy loams, formed from gneisses; and

ccxxiv
• Shallow, clay-rich soils with high sodium content in internally draining areas.
The sub-catchment receives low and unreliable rainfalls (mostly under 400 mm per year) with high evaporation
rates. Soils are generally shallow and poor to medium quality. Areas with high sodium content pose a
salinization risk for irrigation schemes. Soils become progressively coarser and sandier towards the eastern
portion of the sub-catchment as rainfalls decline and evaporation rates increase.
Land use in the sub-catchment consists mostly of small-scale subsistence farming of drought resistant crops, as
well as livestock rearing of goats and donkeys. The main settlements are the towns of Selibe-Phikwe and
Serule, with numerous smaller settlements located along the North-South Pipeline route and along the main
roads.
4.4.1.4 Surface water users
All towns and settlements rely on whatever surface water they can obtain from the seasonal flows in local
streams and rivers, as well as an extensive system of boreholes. Larger towns such as Serule and Selibe-
Phikwe obtain most of their water from the North-South Pipeline as well as from local boreholes. Small
settlements rely on local boreholes and hand-dug wells for their water supplies.
4.4.1.5 Water management systems
This sub-catchment is located entirely within Botswana and therefore falls under the jurisdiction of the
Department of Water Affairs in the Ministry of Mineral and Energy Affairs. Routine flow gauging is carried out at
one station on the middle reaches of the Motloutse River, though the flow record is incomplete (Boroto &
Görgens, 1999).
4.4.1.6 Human impacts on water resources (excluding mining)
The following can be expected to impact on water resources in this sub-catchment:
• Landfills and solid waste disposal sites at Serule and Selibe-Phikwe, as well as at numerous smaller
settlements;
• Disposal of liquid (domestic) effluent at Serule and Selibe-Phikwe;
• Non-point domestic effluent via soak-aways in rural areas;
• Minor non-point impact from subsistence agriculture; and
• Fuel loss and litter on the roads between Martins Drift and Selibe-Phikwe, and along the main road between
Serowe and Francistown, as well as along numerous smaller roads in the sub-catchment.

ccxxv
4.4.2 Mining and mineral processing operations
Two mining operations are located in this sub-catchment (Table 4.5). The Selibe-Phikwe copper-nickel mine is
the largest base metal mine in Botswana.
Table 4.5: Mining operations in the Motloutse sub-catchment.
Code Number
Name of Mine Commodity (ies)
Mined Status
Relative Size
Probable Impact
Bots-3 Bobonong Coal Operating Medium Low
Bots-4 Selibe Phikwe Nickel, Copper Operating Large Medium
4.4.3 Alluvial mining
None known.
4.4.4 Monitoring systems
One flow-gauging site is located on the Motloutse River upstream of the town of Selibe-Phikwe. The Botswana
Department of Water Affairs conducts regular monitoring of water quality in all the water supply dams, as well
as water supplied to towns, mines and smaller communities from the North-South Pipeline. The geohydrology
section within the Department of water Affairs also tests borehole water quality at regular intervals.
4.4.5 Water quality data
None obtainable in time for this report, but data are available from the Botswana Department of Water Affairs.
4.4.6 Implications for water quality and quantity management
Medium-scale impacts can be anticipated from the Selibe-Phikwe copper-nickel mine and its smelter, in terms of
elevated concentrations of suspended solids, total dissolved salts, copper, nickel and sulphate. Very small
localized impacts of acid mine drainage can also be anticipated. Impacts from the Bobonong Colliery are
expected to be very small and localized in extent.
4.5 The Shashe-Tuli (Botswana and Zimbabwe) sub-catchment

ccxxvi
4.5.1 General description
4.5.1.1 Hydrology
The Zimbabwe portion of this sub-catchment is Zones S1-S6, T1-T5, M and R of Area B (ZSG, 1984). The
major tributaries of the perennial Shashe (Shashi) River are the Thuli (Tuli) (Zones T1-T5 and M), Shashani
(Zones S2 and S3) Simukwe (Zones S4 and S5) and Ramakwebana (Ramaquebane) (ZSG, 1984). The
Shashani is dammed at Gulameta, the Chavezi, a tributary of the Thuli, is dammed near Silobi, and the Ingwezi,
a tributary of the Ramakwebana, is dammed near Domborefu.
In Botswana, small water supply dams on the Shashe River provide water for local communities and mining
operations, as well as small-scale irrigation farms.
4.5.1.2 Geology
See Figure 3.6 (ZGS, 1999). The Zimbabwe Craton underlies most of the sub-catchment, including the
Botswana portion. Important formations include: Gwanda Greenstone Belt, Lower Gwanda Greenstone Belt,
Mphoengs Greenstone Belt and granitic terrain. The south is underlain by Limpopo Belt gneisses, and the far
south (Thuli Village area) by Karoo basalts. In the western (Botswana) portion of the sub-catchment, Archaean
granites and gneisses are intruded by numerous Greenstone belts, with associated Karoo System rocks and
silicified sandstones.
4.5.1.3 Pedology, agriculture and land use
Soils in the sub-catchment can be divided into five groups:
• Moderately shallow, coarse-grained kaolinitic sands, derived from the granites;
• Very shallow to moderately shallow sandy loams, formed from gneisses;
• Very shallow to moderately shallow clays, formed from the Greenstone Belts;
• Shallow, clay soils with high sodium content in internally draining areas; and
• Very shallow sands, derived from the basalts (DRSS, 1979).
From Kezi northwards in Zimbabwe, the sub-catchment is in Natural Region IV, with low (under 650mm) and
unreliable rainfall, and poor soils. South of Kezi is in Region V, with poor soils, rainfall under 600mm and in
places under 450mm (ZSG, 1997). In the Botswana sector of the sub-catchment, rainfalls decline steadily
towards the west and south, reaching some 350-400 mm per annum at the Sashe-Limpopo junction.
North of Kezi, land use is commercial farming, private and resettlement land (ZSG, 1998), mainly livestock
rearing with some drought resistant crops. The south is Communal Lands, and agriculture limited mainly to
livestock, especially goats. The main settlements are Kezi and Maphisa Villages.

ccxxvii
In the Botswana sector of the sub-catchment, land use is primarily some commercial farming of livestock and
small irrigation areas along the rivers, with game ranching in drier areas. Most livestock are goats and donkeys.
Several settlements and towns are located in this area, as well as a number of mining operations.
4.5.1.4 Surface water users
Maphisa draws water from Gulameta Dam on the Shashani. Irrigation by commercial agriculture uses water
from Ingwezi Dam in the west.
4.5.1.5 Water management systems
In Zimbabwe, the sub-catchment falls under the Mzingwane Catchment Council of ZINWA. In Botswana, the
sub-catchment falls under the jurisdiction of the Department of Water in the Ministry of Mineral and Energy
Affairs. Routine flow gauging is carried out at one station on the Shashe River in Botswana, though the flow
record is incomplete.
4.5.1.6 Human impacts on water resources (excluding mining)
The following could be expected to have an impact on water resources:
• Landfills, Kezi and Maphisa in Zimbabwe, and Francistown, Sebina and Tonotha-Shashe in Botswana;
• Disposal of liquid effluent, Kezi and Maphisa in Zimbabwe, and Francistown, Tonotha-Shashe in Botswana;
• Non-point domestic effluent in rural areas;
• Non-point impact of irrigation and redistribution of river waters in the west;
• Minor non-point impact from non-intensive commercial or subsistence agriculture; and
• Fuel loss and litter on the roads to Ngwesi, Maphisa and St Joseph’s in Zimbabwe, and between the border
at Plumtree and Francistown in Botswana.
4.5.2 Mining and mineral processing operations
In Botswana, most mining is associated with the mineralised Greenstone belts, with copper, gold and nickel the
most important commodities mined (Table 4.6).
The Zimbabwe portion of the sub-catchment falls mainly under the Bulawayo Mining District (ZGS, 1995). The
main mining activity is gold mining in the western part of the Gwanda Greenstone Belt (Table 4.7) and
previously in the Lower Gwanda Greenstone Belt. Asbestos, copper, nickel, pyrite and tungsten have also been
mined (Tyndale-Biscoe, 1940). Several centuries ago, extensive gold mining took place in the Gwanda
Greenstone Belt, in places over 70m deep (Tyndale-Biscoe, 1940), although the exact date has not been
determined.

ccxxviii
Table 4.6: Mining operations in the Shashe (Botswana) sub-catchment.
Code Number
Name of Mine Commodity (ies)
Mined Status
Relative Size
Probable Impact
Bots-7 Matsitama Copper Operating Small Very low
Bots-8 Tati Gold Operating Small Low–Medium (As)
Bots-9 Selkirk Copper, Nickel Operating Small Low
Table 4.7: Mining operations in the Shashe (Zimbabwe) Sub-catchment.
Name Commodity Status Total
produced /t Potential Impact
Champion Arsenic Closed 1924 1022.7 High
Hydra Arsenic Closed 1946 553.3 High
Vubachikwe Arsenic Closed 1949 110.1 High
Antelope Gold Closed 9.2 Medium
Blanket Gold In operation 27.0 High: Arsenic possible
Freda Gold In operation 10.5 High: Arsenic possible
Horn Gold Dump retreatment 5.0 High: Arsenic & bismuth
possible
Vubachikwe
Black Jack
Gold In operation 25.1 High: Size & Arsenic possible
Noel Nickel Closed 1963 4651.9 High: Arsenic possible
Hampden Iron Pyrite Closed 1942 1492.0 High
See ZGS (1988a) and ZGS (1988b) for locations.
A copper smelter was operated at Valley, west of West Nicholson, during the first half of the twentieth century
(Tyndale-Biscoe, 1940).
In Zimbabwe, there is exploration for diamond, arsenic, nickel, gold, copper and lead (ZGS, 2001).
4.5.3 Alluvial mining
Alluvial mining of gold takes place in the Thuli River in Zimbabwe (Figure 3.14; Chiyanike, 1997). There
appears to be no alluvial mining taking place in the Botswana sector of the sub-catchment.
4.5.4 Monitoring systems
ZINWA is currently setting one up and the Botswana Department of Water plans to expand its current
monitoring programme.
ccxxix
4.5.5 Water quality data
None available.
4.5.6 Implications for water quality and quantity management
In Zimbabwe, the major impacts to be expected are from arseniferous gold and nickel mines and arsenic mines
in the western Gwanda and the Lower Gwanda Greenstone Belt: acid mine drainage and release of toxic
metals, such as arsenic and bismuth are possible. There are minor impacts from alluvial gold mining in the
Thuli River.
In Botswana, minor impacts are anticipated from arseniferous gold, nickel and copper mines, with minor acid
mine drainage.
4.6 The Pazhi sub-catchment
4.6.1 General description
4.6.1.1 Hydrology
This is Zone L1 of Area B (ZSG, 1984). The area consists of the catchments of several small rivers, which flow
directly into the Limpopo. The two largest are the Pazhi and the Mutshilashokwe.
4.6.1.2 Geology
Karoo basalts underlie most of the sub-catchment, whilst Limpopo Belt gneisses underlie the east (Figure 3.6;
ZGS, 1999).
4.6.1.3 Pedology, agriculture and land use
Soils in the sub-catchment can be divided into two groups:
• Very shallow to moderately shallow sandy loams, formed from gneisses; and
• Very shallow sands, derived from the basalts (DRSS, 1979).
The sub-catchment is entirely in Natural Region V, with poor soils rainfall under 600mm and in places under
450mm (ZSG, 1997). Land use is mainly Communal Lands, with subsistence agriculture: mainly livestock
production. The southeast corner is commercial farming land with livestock production.

ccxxx
4.6.1.4 Surface water users
There is limited extraction of water for rural domestic use and for subsistence agriculture.
4.6.1.5 Water management systems
The sub-catchment falls under the Mzingwane Catchment Council of ZINWA.
4.6.1.6 Human impacts on water resources (excluding mining)
The following could be expected to have an impact on water resources:
• Non-point domestic effluent; and
• Minor non-point impact from non-intensive commercial or subsistence agriculture.
4.6.2 Mining and mineral processing operations
The catchment falls mainly under the Masvingo Mining District (ZGS, 1995). The main mining activity is
diamond production from River Ranch, although this mine is currently not in production and is kept on a care
and maintenance basis.
Table 4.8: Mining operations in the Pazhi Sub-catchment.
Name Commodity Status Total
produced /t Potential Impact
River Ranch Diamond Care and maintenance Low
See ZGS (1988a) for location.
Currently, there are no legal exploration activities (ZGS, 2001).
4.6.3 Alluvial mining
Neither known nor likely.
4.6.4 Monitoring systems
None.

ccxxxi
4.6.5 Water quality data
None available.
4.6.6 Implications for water quality and quantity management
The impact of River Ranch, the only mining operation in the area (now closed), is likely to be restricted to a
minor contribution to siltation.
4.7 The Mzingwane sub-catchment
4.7.1 General description
4.7.1.1 Hydrology
This sub-catchment comprises Zones UZ1-UZ4, IN1-IN2, IK and NC of Area B (ZSG, 1984). The Mzingwane
(Umzingwani) River rises near Bulawayo and flows south to the Limpopo. Its major tributary is the Insiza
(Zones IN1-IN2). The Mzingwane, Ncema, Inyakuni and Insiza are all dammed in the Esigodini area (Zones
UZ1, NC, IK and IN1 respectively). The lower Insiza is dammed at Silabiuhwa (Zone IN2). The lower
Mzingwane is dammed at Zhove, near Mazunga in Zone UZ1.
4.7.1.2 Geology
See Figure 3.6 (ZZGS, 1999). The northern half of the sub-catchment is underlain by the Zimbabwe Craton:
Bulawayo Greenstone Belt, Gwanda Greenstone Belt, Filabusi Greenstone Belt and granitic terrain. The
southern half is underlain by Limpopo Belt gneisses, except for the area around Mazunga, which is underlain by
Karoo basalts.
4.7.1.3 Pedology, agriculture and land use
Soils in the sub-catchment can be divided into four groups:
• Moderately shallow, coarse-grained kaolinitic sands, derived from the granites;
• Very shallow to moderately shallow sandy loams, formed from gneisses;
• Very shallow to moderately shallow clays, formed from the Greenstone Belts; and
• Very shallow sands, derived from the basalts (DRSS, 1979).
From Gwanda northwards, the sub-catchment is in Natural Region IV, with low (under 650mm) and unreliable
rainfall, and poor soils. South of Gwanda is in Region V, with poor soils, rainfall under 600mm and in places
under 450mm (ZSG, 1997).

ccxxxii
North of Kezi, land use is commercial farming, private and resettlement land (ZSG, 1998), mainly livestock
rearing with some drought resistant crops. The south is Communal Lands, and agriculture limited mainly to
livestock, especially goats.
The main settlements are Gwanda Town and Esibomvu, Esigodini, West Nicholson and Colleen Bawn Villages.
4.7.1.4 Surface water users
The City of Bulawayo draws much of its water supply from the Esigodini area dams: Insiza, Inyankuni,
Mzingwane and Ncema. Commercial agriculture is a major water user, especially north of Gwanda, where crop
production takes place.
4.7.1.5 Water management systems
The sub-catchment falls under the Mzingwane Catchment Council of ZINWA.
4.7.1.6 Human impacts on water resources (excluding mining)
The following could be expected to have an impact on water resources:
• Landfills, Gwanda, Esibomvu, Esigodini, West Nicholson and Colleen Bawn;
• Disposal of liquid effluent, Gwanda, Esibomvu, Esigodini, West Nicholson and Colleen Bawn;
• Urban run off, Gwanda, Esibomvu, Esigodini, West Nicholson and Colleen Bawn;
• Non-point domestic effluent, rural areas;
• Minor non-point impact from non-intensive commercial or subsistence agriculture;
• Runoff from Gwanda airport; and
• Fuel loss and litter on the main Bulawayo – Beitbridge road and railway link.
4.7.2 Mining and mineral processing operations
The catchment falls under the Bulawayo and Masvingo Mining Districts (ZGS, 1995). The main mining activity is
gold mining in the eastern part of the Gwanda Greenstone Belt and the Filabusi Greenstone Belt. Historically,
asbestos and tungsten have been mined in the Bulawayo and Filabusi Greenstone Belts.
There is exploration for nickel, gold, copper, lead, tungsten, cobalt, silver, diamond, platinum, and arsenic (ZGS,
2001).

ccxxxiii
Table 4.9: Mining operations in the Mzingwane Sub-catchment.

ccxxxiv
See
ZGS
(1988a
) and
ZGS
(1988b
) for
locatio
ns.
4.7.3 Alluvial
Alluvial
mining
of gold
takes
place
in the
Mzing
wane
and
Insiza
Rivers
(Chiya
nike,
1997),
and
more
genera
lly
throug
hout
the
Filabus
i
Greens
tone
Belt
(Figure
3.14).
Name Commodity Status Total
produced /t
Potential Impact
Beta Asbestos Closed 1972 3291.5 Low
Croft Asbestos Closed 1968 24674.5 Low
Kudu Asbestos Closed 1980 6377.6 Low
Lenninhurst Asbestos Closed 1967 5893.5 Low
Pangani Asbestos Closed 1981 123135.9 Low
Recompense Asbestos Closed 1961 1129.2 Low
Thornwood Asbestos Closed 1981 59683.0 Low
Wynnes Asbestos Closed 1976 25005.0 Low
Greenhill Aventurine Closed 1975 160.4 Low
Jopempe Aventurine Closed 1984 191.5 Low
Dick Mick Barytes Closed 1963 580.6 Low
Cement Clay Closed 1977 696139.0 Medium
Korbut Clay Closed 1984 471926.0 Low
Willsgrove Clay Closed 1984 4000000.0 Medium
Epoch Cobalt Closed 1999 94.0 High: AMD possible
Coen's Luck Emerald Closed 1977 0.00542 Low
Felspar Feldspar Closed 1951 4667.0 Low
Finact Flintclay Closed 1984 1400.0 Low
Red Mite Garnet industrial Closed 1976 16.9 Low
Bushtick Gold Closed 15.0 Medium
Fred Gold In operation 17.8 High: Arsenic possible
Geelong Gold 5.4 Medium
How Gold In operation 25.5 High: As possible
Jessie Gold 13.7 Medium
Colleen Bawn Limestone In operation 11797070 Medium
Epoch Nickel Closed 1999 15124.0 High: AMD possible
Fernando / Fred Tungsten Closed 1980 66.21 Low
Fit Tungsten Closed 1982 86 Low
Good Hope Tungsten Closed 1971 138.3 Low
Hope Tungsten Closed 1968 78.0 Low
Killarney Tungsten Closed 1981 106.3 Low
Lioness Group Tungsten Closed 1982 426.0 Low
Mustard Tungsten Closed 1979 74.1 Low
Richardson
Group
Tungsten Closed 1970 200.9 Low
Sapphire Blue Tungsten Closed 1973 71.7 Low
Sydkom Tungsten Closed 1984 635.9 Low
Union Jack Tungsten Closed 1971 59.5 Low
ccxxxv
4.7.4 Monitoring systems
ZINWA is currently setting one up.
4.7.5 Water quality data
None available.
4.7.6 Implications for water quality and quantity management
Impact is to be expected from three sources:
• Epoch nickel and cobalt mine, with potential acid mine drainage;
• The arseniferous How and Fred gold mines, with potential acid mine drainage; and
• Alluvial gold mining.
All three of these are associated with the greenstone belts, as is the medium level impact of numerous smaller
gold mines. The Mzingwane sub-catchment is the most intensely mined in the Limpopo Catchment in
Zimbabwe.
4.8 The Diti sub-catchment
4.8.1 General description
4.8.1.1 Hydrology
This is Zone L2 of Area B (ZSG, 1984). The area consists of the catchments of several small rivers, which flow
directly into the Limpopo. The two largest are the Diti and the Shashashi.
4.8.1.2 Geology
See Figure 3.6 (ZGS, 1999). Limpopo Belt gneisses underlie most of the sub-catchment, with some Karoo
sediments in the southeast.
4.8.1.3 Pedology, agriculture and land use

ccxxxvi
Soils in the sub-catchment are generally very shallow to moderately shallow sandy loams, formed from gneisses
(DRSS, 1979).
The sub-catchment is entirely in Natural Region V, with poor soils rainfall under 600mm and in places under
450mm (ZSG, 1997). Land use is mainly Communal Lands, with subsistence agriculture: mainly livestock
production.
4.8.1.4 Surface water users
There is limited extraction of water for rural domestic use and for subsistence agriculture. Beitbridge extracts
water from the Limpopo River, mainly for domestic use.
4.8.1.5 Water management systems
The sub-catchment falls under the Mzingwane Catchment Council of ZINWA.
4.8.1.6 Human impacts of water resources (excluding mining)
The following could be expected to have an impact on water resources:
• Landfills, Beitbridge;
• Disposal of liquid effluent, Beitbridge;
• Urban run off, urban areas of Beitbridge;
• Non-point domestic effluent;
• Minor non-point impact from non-intensive commercial or subsistence agriculture; and
• Runoff from Beitbridge airport.
4.8.2 Mining and mineral processing operations
The catchment falls mainly under the Masvingo Mining District (ZGS, 1995). Historically, magnesite and
corundum have been produced, but no commodities are currently in production.
Table 4.10: Mining operations in the Diti Sub-catchment.
Name Commodity Status Total
produced /t Potential Impact
Pande Magnesite Closed 1984 836308 Medium
See ZGS (1988a) for locations.
ccxxxvii
There is exploration for diamonds (ZGS, 2001).
4.8.3 Alluvial mining
Neither known nor likely.
4.8.4 Monitoring systems
None.
4.8.5 Water quality data
None available.
4.8.6 Implications for water quality and quantity management
The Pande mine is situated on two large serpentine bodies (Light and Broderick, 1998), so it is possible that its
operations may have been associated with some alkaline mine drainage. It is also possible that the Pande
quarry had some impact in terms of siltation in the area.
4.9 The Bubye sub-catchment
4.9.1 General description
4.9.1.1 Hydrology
This is Zones B1-B3 and L3 of Area B (ZSG, 1984). The Bubye flows from the Masase area to the Limpopo
near Crook’s Corner. There are wetlands along the Kwaluzi River in Zone B2 and at the Bubye – Limpopo
confluence, Zones B1 and L3. The Bubye is dammed at Ripple Creek in Zone B3.
4.9.1.2 Geology
See Figure 3.6 (ZGS, 1999). Most of the sub-catchment is underlain by Limpopo Belt gneises, except for
Karoo basalts in the Gongwe area, post Karoo granites in the Mateke Hills and Karoo sediments in the
Selungwe area.

ccxxxviii
4.9.1.3 Pedology, agriculture and land use
Soils in the sub-catchment can be divided into four groups:
• Moderately shallow, coarse-grained kaolinitic sands, derived from the granites;
• Very shallow to moderately shallow sandy loams, formed from gneisses and Karoo sediments;
• Very shallow to moderately shallow clays, formed from the Greenstone Belts; and
• Very shallow sands, derived from the basalts (DRSS, 1979).
The Masase area in the far north is in Natural Region IV, with low (under 650mm) and unreliable rainfall, and
poor soils. The remainder of the sub-catchment is in Region V, with poor soils, rainfall under 600mm and in
places under 450mm (ZSG, 1997).
Land use is mainly commercial farming, private and resettlement land (ZSG, 1998), mainly livestock rearing with
some drought resistant crops. The far south is Communal Lands, and agriculture limited mainly to livestock,
especially goats.
4.9.1.4 Surface water users
Commercial agriculture is a major water user, including drawing water from Ripple Creek dam.
Water is pumped from the Limpopo near Crook’s Corner to the border post at Sango – Chicualacuala, some
50km to the northeast.
4.9.1.5 Water management systems
The sub-catchment falls under the Mzingwane Catchment Council of ZINWA.
4.9.1.6 Human impacts of water resources (excluding mining)
The following could be expected to have an impact on water resources:
• Non-point domestic effluent, rural areas;
• Minor non-point impact from non-intensive commercial or subsistence agriculture; and
• Fuel loss and litter on the Masvingo – Beitbridge road and railway link.
4.9.2 Mining and mineral processing operations
The catchment falls mainly under the Masvingo Mining District (ZGS, 1995). A small quantity of magnesite was
produced from Freedom Mine on the southern end of the Great Dyke, up until 1943. Otherwise, mineral
resources, such as coal, in the sub-catchment have not been exploited.

ccxxxix
There is exploration, mainly for diamond, as well as gold, silver, PGEs, copper and nickel (ZGS, 2001).
4.9.3 Alluvial mining
Neither known nor likely.
4.9.4 Monitoring systems
ZINWA is currently setting one up.
4.9.5 Water quality data
None available.
4.9.6 Implications for water quality and quantity management
Until such time as any exploration activities prove fruitful, there will be no significant impact of mining in the sub-
catchment.
4.10 The Mwenezi sub-catchment
4.10.1 General description
4.10.1.1 Hydrology
This is Zones N1-N3 of Area B (ZSG, 1984). The Mwenezi rises west of Mberengwa and flows into the
Limpopo in Mozambique. The Mwenezi is dammed at Manyuchi in Zone N2.
4.10.1.2 Geology
See Figure 3.6 (ZGS, 1999). The Zimbabwe Craton underlies the northwest: granites and the Filabusi,
Belingwe and Mweza Greenstone Belts. The Great Dyke passes through the northwest of the sub-catchment.
The central area is underlain by Limpopo Belt gneises. Karoo basalts underlie the southeast and rhyolites, post
Karoo granites in the Mateke Hills and post Karoo sediments in the east.

ccxl
4.10.1.3 Pedology, agriculture and land use
Soils in the sub-catchment can be divided into six groups:
• Moderately shallow, coarse-grained kaolinitic sands, derived from the Zimbabwe Craton granites;
• Very shallow to moderately shallow sandy loams, formed from gneisses and post Karoo sediments;
• Shallow to moderately shallow clays, with toxic levels of Ni and/or Cr in some areas, formed from the
Filabusi and Belingwe Greenstone Belts;
• Very shallow sands formed from the Mateke Hills granites and the Mweza Greenstone Belt;
• Moderately deep to very shallow sands, derived from the basalts; and
• Deep sands formed from post Karoo sediments in the Guluene-Chefu area (DRSS, 1979).
Northwest of Manyuchi Dam is in Natural Region IV, with low (under 650mm) and unreliable rainfall, and poor
soils. The remainder of the sub-catchment is in Region V, with poor soils, rainfall under 600mm and in places
under 450mm (ZSG, 1997).
Land use is mixed commercial farming, private and resettlement land (ZSG, 1998) and Communal Lands, with
the area east of the Mwenezi River in the south forming part of Gonarezhou National Park. Agriculture is mainly
livestock rearing with some cash and fodder crops, principally in the northwest.
The main settlements are Mwenezi, Rutenga and Mataga Villages.
4.10.1.4 Surface water users
Agriculture is a major water user, including drawing water from Manyuchi Dam. Permanent pools on the
Mwenezi River are the main source of water for game animals in western Gonarezhou National Park during the
dry season, and are used as game viewing sites by tourists.
4.10.1.5 Water management systems
The sub-catchment falls under the Mzingwane Catchment Council of ZINWA.
4.10.1.6 Human impacts of water resources (excluding mining)
The following could be expected to have an impact on water resources:
• Non-point domestic effluent, rural areas;
• Minor non point impact from commercial or subsistence agriculture; and
• Fuel loss and litter on the Masvingo – Beitbridge and Rutenga – Sango road and railway links.

ccxli
4.10.2 Mining and mineral processing operations
The catchment falls under the Masvingo Mining District (ZGS, 1995). The major mining activities are production
of chrome at Inyala and Rhonda, gold in the eastern part of the Filabusi Greenstone Belt and emeralds at
Sandawana.
Table 4.11: Mining operations in the Mwenezi Sub-catchment.
Name Commodity Status Total
produced /t Potential Impact
Bend Asbestos Closed 1973 28652.0 Low
Peak Asbestos Closed 1970 2306.1 Low
Vanguard Asbestos Open in 1984 414265.0 Low
Inyala Chromium In operation 562034.0 Low
Rhonda Chromium In operation 182653 Low
Belingwe Corundum Closed 1959 2948.8 Low
Haybert Emerald Closed 1983 0.06820 Low
Sandawana
Group Emerald In operation 0.02229 Low
Sihande Emerald Closed 1984 0.15130 Low
Umtasa Emerald Closed 1979 0.02163 Low
Vidan East Emerald Closed 1983 0.00626 Low
Calac Magnesite Closed 1970 13739 Low
See ZGS (1988a) for locations.
There are extensive small-scale chrome workings in the Rhonda area (Figure 3.14).
There is exploration, mainly for diamonds, as well as nickel, copper, PGEs and gold (ZGS, 2001).
4.10.3 Alluvial mining
Neither known nor likely.
4.10.4 Monitoring systems
ZINWA is currently setting one up.
4.10.5 Water quality data

ccxlii
None available.
4.10.6 Implications for water quality and quantity management
Available evidence does not suggest any high impacts of mining on the Mwenezi Sub-catchment. Such impacts
as occur will relate to the extensive chrome and emerald workings in the south of Mberengwa District.
4.11 The Mkgadikgadi catchment
4.11.1 General description
4.11.1.1 Hydrology
This is Zones K, T and N of Area A (ZSG, 1984). The Nata (Manzamnyama) River, and its main tributaries, the
Tegwani and the Maitengwe, flows from the Bulawayo – Plumtree area northwestwards into the Kalahari Desert,
where they ultimately flow into the Mkgadikgadi Pans. The Gwabazabuya or Dzivanini River, which flows
occasionally from the area west of Tsholotsho, joins the Nata in Botswana. Although the Mkgadikgadi Pans
normally form a closed drainage system, during very infrequent times of flood, they overflow into the headwaters
of the Motloutse River, a tributary of the Limpopo. For this reason, the Mkgadikgadi Catchment is discussed
under the Limpopo Catchment.
4.11.1.2 Geology
See Figure 3.6 (ZGS, 1999). Most of the catchment is underlain Kalahari Sands. South of Stanley, granites
and gneisses of the Zimbabwe Craton underlie the catchment. Between the Kalahari Sands and the Craton,
there is a small area of Karoo basalts and sediments.
4.11.1.3 Pedology, agriculture and land use
Soils in the sub-catchment can be divided into four groups:
• Very deep Kalahari Sands,
• Moderately shallow, coarse-grained kaolinitic sands, derived from the granites;
• Moderately shallow to moderately deep, medium grained loamy sands and sandy loams, derived from the
Karoo sediments; and
• Very shallow sands, derived from the basalts (DRSS, 1979).
The catchment is in Natural Region IV, with low (under 650mm) and unreliable rainfall, and poor soils (ZSG,
1997). Land use is mainly Communal Lands and the northern third of the catchment falling under the immense

ccxliii
Hwange National Park (ZSG, 1998). Agriculture is mainly subsistence livestock rearing with some drought
resistant crops. The south is Communal Lands, and agriculture limited mainly to livestock, especially goats.
The main settlement is Plumtree Town.
4.11.1.4 Surface water resources
Plumtree draws water from Questeds Dam on the upper Tegwani.
4.11.1.5 Water management systems
The catchment falls under the Sanyati Catchment Council of ZINWA.
4.11.1.6 Human impacts on water resources (excluding mining)
The following could be expected to have an impact on water resources:
• Landfills, Plumtree;
• Disposal of liquid effluent, Plumtree;
• Non-point domestic effluent, rural areas; and
• Minor non-point impact from non-intensive agriculture.
4.11.2 Mining and mineral processing operations
The catchment falls under the Bulawayo Mining District (ZGS, 1995). There have not, to date, been any mining
activities in the catchment, although some exploration is taking place. There is exploration for gold, copper, zinc
and nickel (ZGS, 2001).
4.11.3 Alluvial mining
Neither known nor likely.
4.11.4 Monitoring systems
None.
4.11.5 Water quality data

ccxliv
None available.
4.11.6 Implications for water quality and quantity management
Unless a mine is opened as result of current exploration activities, there is and will be neither mining nor any
impacts of mining taking place.
4.12 The Lower Limpopo and Chagane (Mozambique) sub-catchment
4.12.1 General description
4.12.1.1 Hydrology
This sub-catchment consists of the main stem of the Limpopo River, from the border with South Africa and
Zimbabwe, to the coast at Xai-Xai (Figure 4.2). The Mwenezi River from Zimbabwe joins the Limpopo River,
some 70 kilometres downstream of Pafuri, whilst the Olifants River flows into the Limpopo River a further 120
kilometres downstream. Shortly before the Limpopo River reaches its mouth at the coast, the Chagane River
joins it. The Chagane River drains a very large area of coastal plain and consists almost entirely of seasonal or
episodic streams and pools (Figure 4.2). The Limpopo River downstream of its confluence with the Olifants
River supports a very large irrigation scheme at Chokwe. The Chokwe Irrigation Scheme is estimated to consist
of some 290 km2 of demarcated irrigation area, though not all of this appears to be utilized (Boroto & Görgens,
1999).
The Olifants River basin is dealt with separately in this report (Section 5) and is not included here under the
Limpopo basin.
Dry season (June 1998) flows in the Limpopo River at Crooks Corner close to Pafuri, where the borders of
South Africa, Mozambique and Zimbabwe meet, consist almost entirely of flows contributed by the Mutale-
Levuvhu river system (P.J. Ashton, personal observations). The Limpopo River upstream of Crooks Corner is
usually dry for several months during winter each year (Boroto & Görgens, 1999).
4.12.1.2 Geology
Most of this sub-catchment is underlain by extensive Quaternary deposits of semi-consolidated sandstones and
mudstones, with slightly older deposits of Tertiary age from the Mazamba, Jofane and Cheringoma formations.
In addition, there are also areas of the Grunja and Sena post-Karoo complexes, consisting predominantly of
alkaline dolerites and shales, with minor evidence of non-economic coal measures in small outliers of the
Stormberg Series along the western portion of the sub-catchment close to the Lebombo Mountains. Recent
alluvial deposits and discrete flood terraces characterize the valley bottom along the Limpopo River.

ccxlv
4.12.1.3 Pedology, agriculture and land use
Soils in the sub-catchment can be divided into four groups:
• Relatively deep, unconsolidated sands of marine origin covering much of the Chagane sub-catchment;
• Moderately shallow, coarse-grained sands derived from the Rhyolites of the Lebombo Mountains;
• Moderately shallow to moderately deep, medium-grained loamy sands and silty sands along river channels
and flood terraces; and
• Shallow, coarse-grained sandy soils derived from Karoo Series basalts.
Soils in the Chokwe Irrigation Scheme located downstream of the Limpopo-Olifants confluence consist
predominantly of silty or loamy sands derived from earlier flood events. Crops produced consist of Cotton,
Sorghum and Maize, with some cultivation of fruit trees (Mangoes and Cashew Nuts).
Land use outside of the Chokwe Irrigation Scheme consists predominantly of subsistence agriculture and minor
livestock rearing, with small-scale tourism activities along the coastline at Xai-Xai.
4.12.1.4 Surface water users
The largest water users in this sub-catchment are the Chokwe Irrigation Scheme (Boroto & Görgens, 1999) and
the town of Xai-Xai. The Chokwe Irrigation Scheme covers a potential area of 29,000 hectares (290 km2) and
its water demand has been estimated at over 500 million cubic metres per year (Boroto & Görgens, 1999). It
can be anticipated that some of this water will return to the Limpopo River as seepage contaminated by
whatever agro-chemicals are used in these sandy soils.
Elsewhere in the sub-catchment, water users consist of a large number of small settlements along the Limpopo
River and in the Chagane sub-catchment. Where perennial surface water is absent, these users rely on hand-
dug wells for all their water requirements.
4.12.1.5 Water management systems
The Mozambique Department of Water Affairs is responsible for the management of all water resources within
this sub-catchment and monitors flows irregularly at three points along the Limpopo River. These data are
apparently insufficient for accurate modelling purposes (Boroto & Görgens, 1999).
4.12.1.6 Human impacts on water resources (excluding mining)
Impacts on water resources in this sub-catchment are expected to consist of:
• Contaminated return flows seeping from the Chokwe Irrigation Scheme;

ccxlvi
• Landfills at Xai-Xai;
• Disposal of liquid effluent, Xai-Xai (probably discharged to sea);
• Non-point domestic effluent from soak aways in rural areas; and
• Minor non-point impact from non-intensive agriculture.
4.12.2 Mining and mineral processing operations
An extensive source of heavy mineral sands (containing titanium, illmenite and zirconium) is under prospecting
licence close to the town of Xai-Xai at the mouth of the Limpopo River (Table 4.12).
Table 4.12: Mining operations in the Lower Limpopo (Mozambique) sub-catchment.
Code Number
Name of Mine Commodity (ies)
Mined Status
Relative Size
Probable Impact
Moz-1 Rio Limpopo Titanium, Illmenite Prospecting Large Very low
4.12.3 Alluvial mining
None known or anticipated.
4.12.4 Monitoring systems
The Mozambique Department of Water Affairs monitors flows in the Limpopo River at three flow gauging
stations (Boroto & Görgens, 1999). No details are available of any water quality monitoring of water supplies
provided to towns and settlements.
4.12.5 Water quality data
None available.
4.12.6 Implications for water quality and quantity management
No impacts on water resources are anticipated from the prospecting activities located close to the mouth of the
Limpopo River.

ccxlvii
4.13 The Marico sub-catchment
4.13.1 General description
4.13.1.1 Hydrology
This sub-catchment consists of the area drained by the Marico River, from its headwaters in the dolomitic
aquifers between the towns of Zeerust and Lichtenburg, to its confluence with the Ngotwane River to form the
Limpopo River (Figure 4.2). There are four relatively large water supply dams located in this sub-catchment,
of which the Marico Dam also supplies water to the City of Gaborone in Botswana. The main stem of the
Marico River is perennial, but most of its tributaries have seasonal or episodic flows. In addition to the larger
water supply dams, the sub-catchment also contains a large number of smaller farm dams used to trap runoff
in seasonal channels and supply this water either for livestock watering or for small-scale irrigation schemes.
Extensive areas of the lower reaches of this sub-catchment are internally draining and provide little or no runoff
to flows in the Marico River.
4.13.1.2 Geology
In the upper reaches of this sub-catchment, the geological features are characterized by the presence of
extensive dolomite and limestone formations. Extensive areas of unconsolidated and semi-consolidated
sedimentary rocks of the Transvaal Supergroup underlie the northern areas of the catchment. These are
intruded by wide belts of basic or mafic lavas in the south, with intrusions of basic, mafic and ultramafic rocks in
the north. Virtually the entire northern portion of the sub-catchment is underlain by wide expanses of acid and
intermediate intrusive rocks, with intercalated assemblages of compact sedimentary and intrusive rocks. The
limestone and dolomite formations contain very large volumes of water that provide perennial flows to the
Marico River.
4.13.1.3 Pedology, agriculture and land use
Soils in the sub-catchment can be divided into four main groups:
• Moderate to deep clayey loam soils on flat and undulating terrain overlying dolomite and limestone in the
upper reaches of the catchment;
• Moderate to deep clay loam soils over much of the middle portions of the sub-catchment, overlying the more
porous unconsolidated sedimentary material;
• Moderately shallow to moderately deep, clayey loam to clay-rich, fine-grained soils over most of the lower
reaches of the sub-catchment; and
• Coarser-grained sandy soils long river channels and flood terraces.

ccxlviii
Most of the clayey loam soils would be suitable for commercial agriculture if sufficient water were available.
However, most of the land use is given over to small-scale irrigation along river courses, and the raising of small
and large livestock and game animals. All irrigation water use occurs within Government Water Control Areas
situated along the main river channels. The main crops produced consist of Cotton, Sorghum and Maize, with
some cultivation of citrus and soft fruits.
Several small towns with some light industry and mining operations are present.
4.13.1.4 Surface water users
All towns and settlements in the sub-catchment rely on water supplied from the larger impoundments, or from
run-of-river abstraction points and, occasionally, from local boreholes. Most of the water used in the sub-
catchment is consumed by the numerous irrigation schemes in the Government Water Control Areas along the
Marico River and the South African bank of the Limpopo River.
4.13.1.5 Water management systems
The South African Department of Water Affairs and Forestry is responsible for the management of all water
supply and water use in the sub-catchment. Close liaison is maintained between the Department and their
Botswana colleagues for the supply of water to Gaborone from the Marico Dam.
The Department of Water Affairs and Forestry (DWAF) operates a comprehensive system of flow gauging at all
dams in the sub-catchment and particular attention is paid to monitoring the quantity of water supplied to
irrigation schemes and towns, as well as some attention to the quality of agricultural return flows and effluent
discharges to the Marico River. The quality of dolomite springs is monitored regularly.
This sub-catchment (and its eastern neighbour, the Elands-Crocodile-Pienaarsrivier sub-catchment) are likely to
become the first official Catchment Management Agency that will take over responsibility for al aspects of water
resource management and water supply. The preliminary documentation is being finalized and catchment
studies are either in progress or have been completed.
4.13.1.6 Human impacts on water resources (excluding mining)
The following activities can be expected to have an impact on water resources in the sub-catchment:
• Landfills and solid waste disposal sites at Zeerust, Groot Marico, Swartruggens and Derdepoort;
• Disposal of liquid (domestic and some light industrial) effluent at Zeerust, Groot Marico, Swartruggens and
Derdepoort;
• Minor volumes of run off from urban areas;
• Non-point domestic effluent from numerous small settlements and farms;
• Minor non-point impact from non-intensive commercial or subsistence agriculture;

ccxlix
• Major non-point impact of agricultural return flows from intensive irrigation areas; and
• Litter and domestic garbage alongside roads traversing the sub-catchment.
4.13.2 Mining and mineral processing operations
The positions of the mining operations in the Marico sub-catchment are shown in Figures 4.2 and 4.3. Details
of each operation are given in Table 4.13.
Table 4.13: Mining operations in the Marico sub-catchment.
Code Number
Name of Mine Commodity (ies)
Mined Status
Relative Size
Probable Impact
C6-4 Kameelboom Vanadium Prospecting Small Very low
C6-6 Hightop Manganese Manganese Prospecting Small Very low
C6-7 Dwaalboom Dolomite/Limestone Operating Medium Very low
C6-26 Marico Fibre Chrysotile asbestos Prospecting Small Very low
C6-27 Marico Andalusite A Andalusite Prospecting Small Very low
D6-1 Zeerust Chrome Operating Medium Low – Medium
D6-2 Marico Chrome Operating Medium Low – Medium
D6-3 Nietverdiend Chrome Operating Medium Low – Medium
D6-16 Androfax Andalusite Operating Medium Low
D6-17 Helam Diamond - kimberlite Operating Medium Low
D6-27 Witkop Marico Fluorspar Operating Medium Low – Medium
D6-47 Autumn Slate Dimension stone Operating Small Low
D6-49 Rosmincol Dimension stone Operating Medium Low
D6-50 Marico Prospect A Lead Prospecting Small Very low
D6-51 Marico Prospect B Lead Prospecting Small Very low
D6-52 Witkop Mangaan A Manganese Prospecting Small Very low
D6-53 Witkop Mangaan B Manganese Prospecting Small Very low
D6-54 Marico Andalusite B Vanadium, Andalusite Prospecting Small Very low
4.13.3 Alluvial mining
None known or anticipated.
4.13.4 Monitoring systems
The Department of Water Affairs and Forestry have provided data for the Malmanie Eye and the
Rhenosterfontein Eye, both of which are dolomitic springs in the headwaters of the sub-catchment. No specific
details of monitoring of agricultural return flows or effluent discharges could be obtained in time for this report.

ccl
4.13.5 Water quality data
The available water quality data refer only to the water quality in two dolomitic springs located at the headwaters
of the sub-catchment. As such, the data provide little insight into the general water quality of the sub-
catchment. Future studies should seek to obtain details of all effluents discharged to the sub-catchment, as well
as information on agricultural return flows. These data will help decision-makers to appreciate the implications
of deteriorating water quality for irrigation water users.
4.13.6 Implications for water quality and quantity management
Most of the mining operations in this sub-catchment are relatively small or are still under prospecting permits.
Minor contamination can be anticipated from the operating chrome mines in the form of possible toxic
hexavalent chrome. Minor acid mine drainage impacts can also be expected but, since this is a relatively dry
area, this is unlikely to be significant. Some increase in suspended solids can be anticipated in the rivers and
streams located close to mining and quarrying (dimension stone) operations.
4.14 The Crocodile-Elands-Pienaarsrivier sub-catchment
4.14.1 General description
4.14.1.1 Hydrology
This sub-catchment consists of the area drained by the Crocodile River and its two main tributaries, the Elands
and Pienaars Rivers, from the area immediately to the north of the City of Johannesburg, to its confluence with
the Limpopo River (Figure 4.2). Elands River drains the area to the northwest of Johannesburg, whilst the
Pienaars River drains the area from Pretoria northwards to the Waterberg Mountains near the town of
Warmbaths. All these rivers are perennial and their flows are supplemented by substantial discharges of
treated domestic and industrial effluent. Flows in these rivers are also enhanced by water imported from the
Vaal River system to the south of Johannesburg, which is used principally for domestic and industrial water
supplies prior to treatment and discharge.
There are sixteen relatively large water supply dams located in this sub-catchment, all of which supply water for
domestic and industrial use as well as for irrigation activities. In addition to the larger water supply dams, the
sub-catchment also contains a very large number (> 850) of smaller farm dams that are used to trap runoff in
seasonal channels and supply this water either for livestock watering or for small-scale irrigation schemes.
Extensive areas of the lower reaches of this sub-catchment are internally draining and provide little or no runoff
to flows in the Limpopo River.

ccli
Several thermal springs are located in the area around the Waterberg Mountains; most of these are used as
medicinal spas.
4.14.1.2 Geology
In the upper reaches of the Crocodile River, the geological features are characterized by the presence of
extensive dolomite and limestone formations surrounding a central core of acidic and intermediate intrusive
rocks. The Elands River rises in an area characterized by unconsolidated sedimentary strata and mafic and
ultramafic intrusive rocks. In contrast, the headwaters of the Pienaars River are located in an area underlain by
formations of acid and intermediate lavas, arenaceous and argillaceous strata, and basic and acidic rocks of the
Bushveld Complex and the granites of the Waterberg Formation.
Extensive areas of unconsolidated and semi-consolidated sedimentary rocks of the Transvaal Supergroup
underlie the northern areas of the catchment. These are intruded by wide belts of basic or mafic lavas in the
south, with intrusions of basic, mafic and ultramafic rocks in the north. Virtually the entire northern portion of the
sub-catchment is underlain by wide expanses of acid and intermediate intrusive rocks, with intercalated
assemblages of compact sedimentary and intrusive rocks.
4.14.1.3 Pedology, agriculture and land use
Soils in the sub-catchment can be divided into four main groups:
• Moderate to deep sandy loam soils on flat and undulating terrain overlying dolomite, limestone and
sandstones in the upper reaches of the catchment;
• Moderate to deep sandy loam soils lining long stretches of the Crocodile River valley in its middle reaches;
• Moderate to deep clay loam soils over much of the middle portions of the sub-catchment (located away from
the river channels), overlying the more porous unconsolidated sedimentary material; and
• Moderately shallow to moderately deep, clayey loam to clay-rich, fine-grained soils over most of the lower
reaches of the sub-catchment.
Most of the clayey loam soils are highly suitable for commercial agriculture when sufficient water is provided.
Virtually all of the suitable soils are contained within the jurisdiction of formal irrigation boards or Government
Water Control Areas. Further away from the main river channels, most of the land use is given over to small-
scale irrigation from farm dams as well as the raising of small and large livestock and game animals. A very
wide variety of crops are produced, ranging from intensive vegetable production to Tobacco, Maize, Cotton,
Citrus and Sub-tropical Fruits, Sorghum, Sunflowers and Soya bean. Minor areas of plantation forestry (mostly
Eucalyptus, with some Pine) are also located in the wetter portions of the sub-catchment. The timber is used
primarily for fencing poles and house construction.
Several large cities and numerous smaller towns are present in the upper reaches of the sub-catchment. The
number and density of population declines with increasing distance from the upper reaches. A wide variation of

cclii
both light and heavy industry is present in the cities and larger towns, with many industries geared specifically to
meeting the needs of the extensive mining sector.
4.14.1.4 Surface water users
All cities, towns and settlements in the sub-catchment rely on water supplied from the larger water supply
impoundments, or from run-of-river abstraction points and, occasionally (in the lower reaches), from local
boreholes. Most of the water used in the sub-catchment is consumed by the extensive urban areas that are
spread across the headwaters of the sub-catchment, whilst the numerous irrigation schemes in the Government
Water Control Areas along the Crocodile River and its major tributaries also require very large volumes of water.
Water supplies are supplemented by water imported from the Vaal River system to the south of Johannesburg;
this water is used primarily for domestic and industrial use. Extensive informal settlements have sprung up
around the periphery of the major urban centres. These settlements lack access to basic services such as
clean water supplies and suitable sanitation systems.
The extensive mining developments in the mineral-rich Bushveld Igneous Complex compete with irrigation
agriculture in the sharing of the relatively meagre water resources that are available (Midgley et al., 1995).
Historically, irrigation development preceded the more recent emphasis on mining of chrome, platinum-group
minerals, iron ore, phosphates, fluorspar and coal. Unless the water supplies to large areas under irrigation can
be “cannibalised”, additional supplies of water will need to be imported into this sub-catchment to meet the
rapidly rising demands for water that result from continued mining development and the possible construction
and operation of future coal-fired power stations (Midgley et al., 1995).
4.14.1.5 Water management systems
The South African Department of Water Affairs and Forestry (DWAF) is responsible for the management of all
aspects of water supply and water use in the sub-catchment. The Department operates a comprehensive
system of flow gauging at all dams in the sub-catchment and particular attention is paid to monitoring the
quantity of water supplied to irrigation schemes and towns, as well as increasing attention to the quality of
agricultural return flows and effluent discharges to the Crocodile River.
This sub-catchment (and its western neighbour, the Marico River sub-catchment) are likely to become the first
official Catchment Management Agency that will take over responsibility for al aspects of water resource
management and water supply. The preliminary documentation is being finalized and catchment studies are
either in progress or have already been completed.
4.14.1.6 Human impacts on water resources (excluding mining)
The following activities can be expected to have an impact on water resources in the sub-catchment:
• Landfills and solid waste disposal sites at all cities and towns;
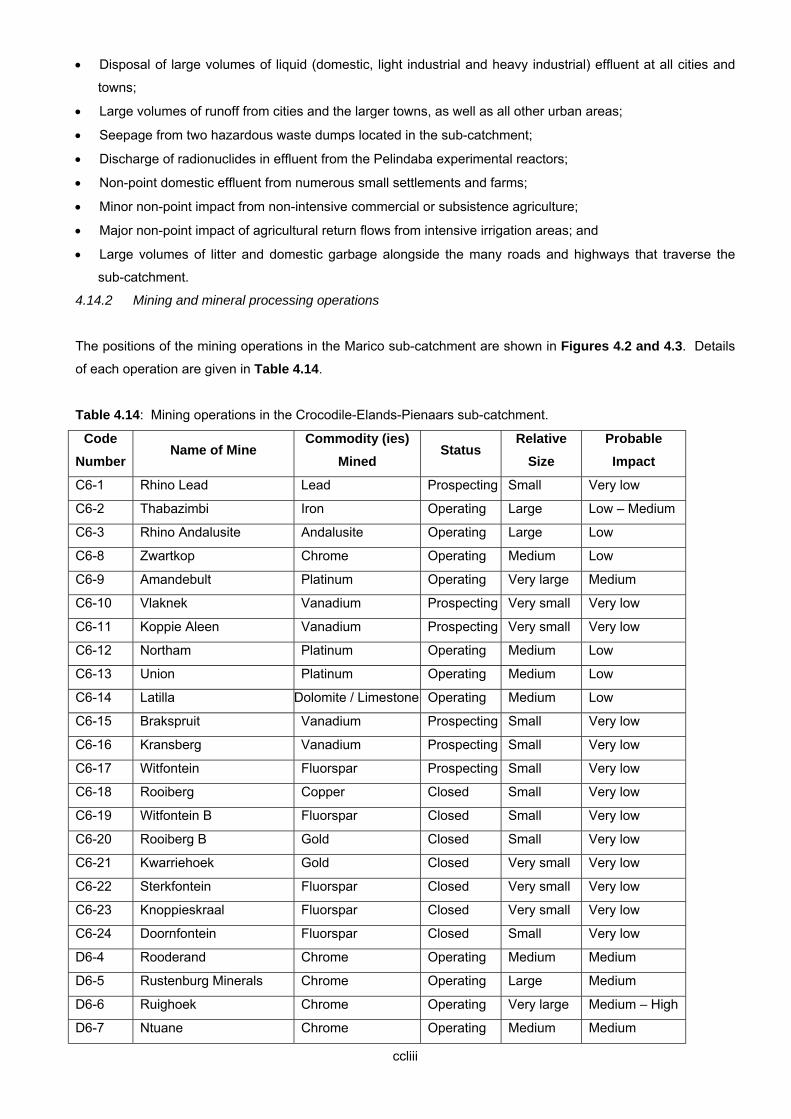
ccliii
• Disposal of large volumes of liquid (domestic, light industrial and heavy industrial) effluent at all cities and
towns;
• Large volumes of runoff from cities and the larger towns, as well as all other urban areas;
• Seepage from two hazardous waste dumps located in the sub-catchment;
• Discharge of radionuclides in effluent from the Pelindaba experimental reactors;
• Non-point domestic effluent from numerous small settlements and farms;
• Minor non-point impact from non-intensive commercial or subsistence agriculture;
• Major non-point impact of agricultural return flows from intensive irrigation areas; and
• Large volumes of litter and domestic garbage alongside the many roads and highways that traverse the
sub-catchment.
4.14.2 Mining and mineral processing operations
The positions of the mining operations in the Marico sub-catchment are shown in Figures 4.2 and 4.3. Details
of each operation are given in Table 4.14.
Table 4.14: Mining operations in the Crocodile-Elands-Pienaars sub-catchment.
Code Number
Name of Mine Commodity (ies)
Mined Status
Relative Size
Probable Impact
C6-1 Rhino Lead Lead Prospecting Small Very low
C6-2 Thabazimbi Iron Operating Large Low – Medium
C6-3 Rhino Andalusite Andalusite Operating Large Low
C6-8 Zwartkop Chrome Operating Medium Low
C6-9 Amandebult Platinum Operating Very large Medium
C6-10 Vlaknek Vanadium Prospecting Very small Very low
C6-11 Koppie Aleen Vanadium Prospecting Very small Very low
C6-12 Northam Platinum Operating Medium Low
C6-13 Union Platinum Operating Medium Low
C6-14 Latilla Dolomite / Limestone Operating Medium Low
C6-15 Brakspruit Vanadium Prospecting Small Very low
C6-16 Kransberg Vanadium Prospecting Small Very low
C6-17 Witfontein Fluorspar Prospecting Small Very low
C6-18 Rooiberg Copper Closed Small Very low
C6-19 Witfontein B Fluorspar Closed Small Very low
C6-20 Rooiberg B Gold Closed Small Very low
C6-21 Kwarriehoek Gold Closed Very small Very low
C6-22 Sterkfontein Fluorspar Closed Very small Very low
C6-23 Knoppieskraal Fluorspar Closed Very small Very low
C6-24 Doornfontein Fluorspar Closed Small Very low
D6-4 Rooderand Chrome Operating Medium Medium
D6-5 Rustenburg Minerals Chrome Operating Large Medium
D6-6 Ruighoek Chrome Operating Very large Medium – High
D6-7 Ntuane Chrome Operating Medium Medium

ccliv
D6-8 Beestekraal Dolomite / Limestone Operating Large Very low
D6-9 Bafokeng Platinum Operating Large Medium
D6-10 Impala Platinum Operating Medium Medium
D6-11 Boshoek Chrome Operating Medium Medium
D6-12 Wildebeestfontein Platinum Operating Large Medium
D6-13 Boekenhoutfontein Chrome Operating Medium Medium
D6-14 Rustenburg Granite Dimension stone Operating Small Very low
D6-15 Bospoort Dimension stone Operating Small Very low
D6-18 Impala – W’beestfontein Platinum Operating Large Medium
D6-19 Ba-Magopa Vanadium Operating Medium Low – Medium
D6-20 Marikana - Geluk Dimension stone Operating Small Very low
D6-21 Marikana Granite Dimension stone Operating Small Very low
D6-22 Paardekraal Platinum Operating Medium Medium
D6-23 Maroela Chrome Operating Medium Medium
D6-24 Noordwes Chrome Operating Medium Medium
D6-25 Rustenburg – Waterval Platinum Operating Medium Medium
D6-26 Crocodile River Platinum Operating Medium Medium
D6-28 Keeley Slate Dimension stone Operating Medium Very low
D6-29 Mazista Slate Dimension stone Operating Medium Very low
D6-30 Miusell Chrome Operating Medium Medium
D6-31/32 Harmse – Waterkloof Chrome Operating Medium Medium
D6-33 Karee Platinum Operating Medium Medium
D6-34 Western Platinum Platinum Operating Large Medium – High
D6-35 Eastern Platinum Platinum Operating Large Medium – High
D6-36 Kroondal Platinum Operating Large Medium – High
D6-37 Marikana Platinum Operating Large Medium – High
D6-38 Kroondal B Chrome Operating Medium Medium
D6-39 Rustenburg Chrome Operating Medium Medium
D6-40 Wonderkop Chrome Operating Medium Medium
D6-41 Kafferskraal Chrome Operating Medium Medium
D6-42 Elandsdrift Chrome Operating Medium Medium
D6-43/44 Elandskraal – Mooinooi Chrome Operating Medium Medium
D6-45 Western Buffelsfontein Chrome Operating Medium Medium
D6-46 De Rust Glass sand Operating Large Low
D6-48 Beau Rivage Dimension stone Operating Medium Low
D6-55 Silver Hills Lead, Silver Closed Small Very low
D6-56 Buffelspoort Fluorspar Closed Small Very low
D6-57 Ruigtesloo Fluorspar Closed Small Very low
E6-1 Reef Quarries Limestone / Dolomite Operating Medium Low
C7-16 Buffalo Fluorspar Fluorspar Operating Medium Low – Medium
D7-3 Sabrix Clay minerals Operating Small Very low
D7-6 Roodepoort 1 Clay minerals Operating Large Low

cclv
D7-13 Premier Diamond – kimberlite Operating Large Medium
D7-14 Kameeldrift Clay minerals Operating Small Very low
D7-15 Boekenhoutkloof Clay minerals Operating Medium Low
D7-17 Fortsig Chrysotile asbestos Operating Small Very low
D7-19 Donkerhoek Glass sand Operating Small Very low
D7-20 Mooiplaas Limestone / Dolomite Operating Medium Low
D7-21 Puntlyk Glass sand Operating Small Very low
D7-22 Samancor Lyttleton Limestone / Dolomite Operating Medium Low
D7-23 Noel Lancaster Glass sand Operating Small Very low
D7-25 Grootfontein Clay minerals Operating Medium Low
D7-31 Hippo Olifantsfontein Limestone / Dolomite Operating Medium Low
D7-37 Bourke Fluorspar Closed Small Very low
D7-38 Rust de Winter Fluorspar Closed Small Very low
4.14.3 Alluvial mining
None known or anticipated.
4.14.4 Monitoring systems
The Department of Water Affairs and Forestry (DWAF) operate a comprehensive monitoring system of flow
measurements and water quality measurements in the sub-catchment. In addition, DWAF also regulate the
quantity and quality of all effluent discharges through a system of effluent discharge permits or licences. Each
licensed effluent discharger is required to carry out a routine monitoring programme of the flow and quality of
their effluent and supply this to DWAF. The Department then conducts a randomised series of audit samples to
check the veracity of the effluent returns submitted by each discharger.
4.14.5 Water quality data
The Department of Water Affairs and Forestry have provided data for the main stem of the Crocodile River at
three points along its length (Table 4.15). These data reveal that the water quality in the Crocodile River is very
poor in the upper reaches due to contamination from effluents and seepage. There is a minor improvement in
orthophosphate (PO4-P) concentrations in Hartbeespoort Dam, but further deterioration occurs downstream,
probably as a result of irrigation return flows and discharges containing fertilizers. Concentrations of total
dissolved salts and pH values increase downstream, indicating progressive salinization. No details of specific
agricultural return flows or effluent discharges could be obtained in time for this report. This information is also
regarded as very sensitive and normally has to be dealt with confidentially.
Table 4.15: Water quality data for three sampling stations along the Crocodile River (Annual averages, in
mg/litre, provided by Department of Water Affairs and Forestry).

cclvi
Station pH TDS PO4-P A2H12 7.6 485 1.4
A2H52 7.7 510 0.7
A2H60 7.9 535 2.0
4.14.6 Implications for water quality and quantity management
There are a very large number of mining operations of differing sizes in this sub-catchment, and a wide variety
of mineral commodities are exploited. In addition to the mining operations listed in Table 4.14, there are also a
relatively large number of mining operations that have either been closed or abandoned (C.J. Vorster, personal
communication). Some prospecting permits have also been issued but no details were available for this report.
Perhaps the most significant impacts associated with mining in this sub-catchment are those linked to chrome
mining and refining. The defunct African Chrome Smelter at Brits, currently being evaluated for refurbishment,
has previously contaminated local ground water resources with toxic hexavalent chrome (Cr6+). Minor
contamination by hexavalent chrome can also be anticipated from the operating chrome mines located near to
the town of Rustenburg. Another contaminant that can pose significant problems is Vanadium, which is known
to be toxic to plants and animals when present in high concentrations. The vanadium mines near Rustenburg,
and those mines where vanadium is a secondary product (Table 4.14) all have the potential to pose vanadium
toxicity problems.
Some minor problems associated with elevated metal concentrations can also be expected from the platinum
mines and the now-closed base metal mines (lead, silver, tin, zinc, copper). All of these mines have sulphide
orebodies and minor acid mine drainage can be anticipated from these mines. The large iron ore mines at
Thabazimbi are likely to contribute elevated concentrations of iron and manganese to local waterbodies via
wind-blown dusts. Minor contamination by elevated fluoride concentrations can be anticipated in the middle
reaches of this sub-catchment, where local streams drain fluoride-rich areas being mined in the western side of
the Waterberg Plateau.
The lower reaches of the sub-catchment are relatively dry, with high Weinert N weathering indices indicating
that mechanical weathering processes dominate. Consequently, any contaminants emitted by mines in this
area would not normally be expected to be very mobile. This contrasts with the lower Weinert N weathering
indices of the upper reaches of the sub-catchment, where chemical weathering processes will dominate and
contaminants would be more mobile.
All of the metal mining operations and those quarrying operations that extract dimension stone (predominantly
granite) as well as dolomite and limestone can be expected to contribute elevated levels of suspended solids to
local waterways.
4.15 The Matlabas-Mokolo sub-catchment

cclvii
4.15.1 General description
4.15.1.1 Hydrology
This sub-catchment consists of the area drained by the Matlabas and Mokolo rivers and their main tributary
streams. These two small river systems flow northwards or north-westwards from the area to the east of the
town of Thabazimbi, joining the Limpopo River (Figure 4.2). The flow patterns in these two rivers is very
variable as a result of the prevailing low and unpredictable rainfalls (average 450 mm) and the rivers normally
only contain surface water during the summer months. Most of their tributary streams are episodic and only
flow for short periods of time after local rainfalls in their vicinity. The two rivers contain four small dams and
numerous smaller farm dams that are used to supply water for domestic and irrigation purposes, as well as
livestock watering (Boroto & Görgens, 1999).
4.15.1.2 Geology
The geological features of this sub-catchment are relatively simple. Porous consolidated and partially
consolidated sedimentary strata, predominantly sandstones, underlie the upper two-thirds of the sub-catchment.
This is succeeded by a broad band of intercalated arenaceous and argillaceous strata and undifferentiated
sedimentary extrusive and intrusive rocks, mainly granites and gneisses, together with coal-bearing rocks of the
Karoo Supergroup, in the lowest reaches alongside the Limpopo River (Midgley et al., 1994).
4.15.1.3 Pedology, agriculture and land use
Soils in the sub-catchment can be divided into three main groups:
• Moderate to deep sandy loam soils on the sloping and undulating terrain in the upper reaches of the sub-
catchment;
• Moderately deep sandy loam soils lining long stretches of the valley bottoms in the middle reaches of the
sub-catchment; and
• Shallow to moderately deep sandy soils in flat and undulating terrain in the lower reaches of the sub-
catchment.
Most of the clayey loam soils are highly suitable for commercial agriculture when sufficient water is provided.
Virtually all of the suitable soils along the Mokolo River are contained within the jurisdiction of formal irrigation
boards or Government Water Control Areas. Further away from the main river channels, most of the land use is
given over to small-scale livestock farming as well as the raising of game animals. Virtually no irrigation takes
place along the Matlabas River due to the scarcity of water. In the Mokolo irrigation schemes, a very wide
variety of drought-tolerant crops are produced, ranging from Cotton, Citrus and Sub-tropical Fruits, to Sorghum,
Sunflowers and Soya bean.
A few small towns and several small settlements are present in the upper reaches of the sub-catchment, though
population densities decline with increasing distance downstream. The north-eastern portions of this sub-

cclviii
catchment support large numbers of small-scale subsistence farmers in areas that were previously part of the
Apartheid system of “self-governing homelands”.
4.15.1.4 Surface water users
All of the towns and settlements in the sub-catchment rely on water supplied from the water supply
impoundments, or from run-of-river abstraction points and, occasionally (in the lower reaches), from local
boreholes. Most of the water used in the sub-catchment is consumed by the extensive formal irrigation along
the Mokolo River. The sub-catchment has very unreliable supplies of water and there seems to be little
opportunity for expansion of the irrigated areas without the importation of additional water supplies (Midgley et
al., 1999). The Matimba Power Station located close to the Groot Geluk Colliery also uses large volumes of
cooling water.
A few informal settlements have sprung up around the periphery of the minor towns in the sub-catchment.
These settlements lack access to basic services such as clean water supplies and suitable sanitation systems.
In addition, the large numbers of subsistence farmers in the north-eastern portion of the sub-catchment have to
rely on boreholes and hand-dug wells for their meagre water supplies. The Department of Water Affairs and
Forestry is undertaking a concerted campaign to provide water supplies to these and other nearby areas in the
Laphalala and Mogalakwena sub-catchments in an attempt to alleviate the hardships experienced by these
residents.
4.15.1.5 Water management systems
The South African Department of Water Affairs and Forestry (DWAF) is responsible for the management of all
aspects of water supply and water use in the sub-catchment. The Department operates a routine system of flow
gauging at all dams in the sub-catchment and particular attention is paid to monitoring the quantity of water
supplied to irrigation schemes and towns, as well as increasing attention to the quality of agricultural return
flows and any effluent discharges to the Mokolo River.
4.15.1.6 Human impacts on water resources (excluding mining)
The following activities can be expected to have an impact on water resources in the sub-catchment:
• Landfills and solid waste disposal sites at towns;
• Disposal of liquid (domestic) effluent at all towns;
• Minor volumes of urban runoff from towns;
• Seepage / discharge of cooling water from Matimba Power station;
• Non-point domestic effluent from numerous small settlements and farms;
• Minor non-point impact from non-intensive commercial or subsistence agriculture;
• Non-point impacts of agricultural return flows from intensive irrigation areas; and
• Litter and domestic garbage discarded alongside the roads.

cclix
4.15.2 Mining and mineral processing operations
There are only two small mining concerns in this sub-catchment (Table 4.16).
Table 4.16: Mining operations in the Matlabas-Mokolo sub-catchment.
Code Number
Name of Mine Commodity (ies)
Mined Status
Relative Size
Probable Impact
B6-1 Grootgeluk Coal Operating Very large Medium
B6-2 Steenbokpan Phosphate Prospecting Very small Very low
4.15.3 Alluvial mining
None known or anticipated.
4.15.4 Monitoring systems
The Department of Water Affairs and Forestry (DWAF) conduct routine monitoring of river flows and water
quality at a few sites in this sub-catchment. In addition, in accordance with their statutory responsibility, DWAF
also regulate the quantity and quality of all effluent discharges through a system of effluent discharge permits or
licences. Each licensed effluent discharger is required to carry out a routine monitoring programme of the flow
and quality of their effluent and supply this to DWAF. The Department then conducts a randomised series of
audit samples to check the veracity of the effluent returns submitted by each discharger.
4.15.5 Water quality data
No specific water quality data for this sub-catchment could be obtained in time for this report. In view of the
very limited mining activity, this deficiency is not considered to be important.
4.15.6 Implications for water quality and quantity management
The available evidence suggests that the only likely source of any impact on local water resources and water
quality would be the large Groot Geluk Colliery and its coking plant. These impacts would most likely be
localized and consist almost entirely of minor acid mine drainage linked to the oxidation of pyrite in the coal.
4.16 The Laphalala sub-catchment

cclx
4.16.1 General description
4.16.1.1 Hydrology
This sub-catchment consists of the area drained by the Laphalala River and its tributary streams. This river
system flow northwards or north-westwards from the area to the west of the town of Nylstroom, joining the
Limpopo River downstream of the Mokolo River (Figure 4.2). The flow pattern in this river is very variable as
a result of the prevailing low and unpredictable rainfalls (average 450 mm) and the long stretches of the river
normally only contain surface water during the summer months. Most of their tributary streams are episodic
and only flow for short periods of time after local rainfalls in their vicinity. The Laphalala River contains several
small dams and numerous off-channel farm dams that are used to supply water for domestic and irrigation
purposes, as well as livestock watering (Boroto & Görgens, 1999).
4.16.1.2 Geology
The geological features of the Laphalala sub-catchment are relatively complex since they consist of several
different formations of widely differing ages. Most of the upper reaches of the sub-catchment are underlain by a
variety of porous consolidated and partially consolidated sedimentary strata, predominantly sandstones,
quartzites and felsites of the Waterberg and Soutpansberg Groups. These have been variously intruded by
acidic and basic granites and lavas of the Bushveld Complex, which in turn overlie the crystalline gneissic rocks
of the Basement Complex.
Further downstream, the sub-catchment is underlain by a sequence of sandstones and quartzites, followed by
carbon-rich mudstones and shales, and then basalts, of the Karoo Sequence. The sandstones are silicified and
resistant to weathering, remaining as harder protruding rock formations that stand well clear of the surrounding
undulating terrain to form local mountains or ranges of hills. The erosion-resistant rocks of the Waterberg
Group show a similar tendency, standing well clear of the surrounding countryside.
Large areas of the central parts of the sub-catchment are overlain by recent (Quaternary) deposits of
unconsolidated or poorly consolidated sandy material.
4.16.1.3 Pedology, agriculture and land use
Soils in the sub-catchment can be divided into three main groups:
• Moderate to deep sandy-clay loam soils on the sloping and undulating terrain in the upper reaches of the
sub-catchment;
• Moderately deep sandy loam soils lining long stretches of the valley bottoms in the middle reaches of the
sub-catchment; and
• Shallow to moderately deep sandy soils in flat and undulating terrain in the lower reaches of the sub-
catchment.

cclxi
Most of the clayey loam soils in the upper parts of the sub-catchment are suitable for irrigation when sufficient
water is available. There are two small portions of formal irrigation board control areas in the upper part of the
sub-catchment, with two more small irrigation areas in the central reaches. The area along the banks of the
Limpopo River is part of a formal irrigation area, and uses water that is pumped either from the bed of the
Limpopo River or from boreholes sunk next to the riverbed. Further away from the main river channel, the land
use consists almost entirely of small-scale livestock farming as well as the raising of game animals.
A few small towns and several small settlements are present in the upper reaches of the sub-catchment, though
population densities decline with increasing distance downstream. The northern and eastern portions of this
sub-catchment support large numbers of small-scale subsistence farmers.
4.16.1.4 Surface water users
All of the towns and settlements in the sub-catchment rely on water supplied from numerous small water supply
impoundments, or from run-of-river abstraction points and, occasionally (in the lower reaches), from local
boreholes. Most of the water used in the sub-catchment is consumed by the extensive formal irrigation along
the Laphalala River. The sub-catchment has very unreliable supplies of water and there is little opportunity to
expand the irrigated areas without importing additional water supplies (Midgley et al., 1999).
The large numbers of subsistence farmers in the northern and eastern portion of the sub-catchment rely on
boreholes and hand-dug wells for their water supplies. The Department of Water Affairs and Forestry is
undertaking a concerted campaign to provide water supplies to these and other nearby areas in the Mokolo and
Mogalakwena sub-catchments in an attempt to alleviate the hardships experienced by these residents.
4.16.1.5 Water management systems
The South African Department of Water Affairs and Forestry (DWAF) is responsible for the management of all
aspects of water supply and water use in the sub-catchment. The Department operates a routine system of flow
gauging at all water supply dams in the sub-catchment and particular attention is paid to monitoring the quantity
of water supplied to irrigation schemes and towns, as well as increasing attention to the quality of agricultural
return flows and any effluent discharges to the Laphalala River. Irrigation Boards are locally responsible for
providing allocations of water to their members, though they are not responsible for the quality of the water
supplied or for the quality of any irrigation return flows that seep back to nearby watercourses.
4.16.1.6 Human impacts on water resources (excluding mining)
The following activities can be expected to have an impact on water resources in the Laphalala sub-catchment:
• Minor seepage from small landfill sites and solid waste disposal sites at towns;
• Disposal of liquid (domestic) effluent at towns;
• Minor volumes of urban runoff from towns;
• Non-point domestic effluent from numerous small settlements and farms;

cclxii
• Minor non-point impact from non-intensive commercial or subsistence agriculture;
• Non-point impacts of agricultural return flows from intensive irrigation areas; and
• Litter and domestic garbage discarded alongside the roads.
4.16.2 Mining and mineral processing operations
Three mining operations are of interest in this sub-catchment (Figures 4.2 and 4.3; Table 4.17).
Table 4.17: Mining operations in the Laphalala sub-catchment.
Code Number
Name of Mine Commodity (ies)
Mined Status
Relative Size
Probable Impact
B7-6 Abbot’s Poort Phosphate Prospecting Small Very low
C7-1 Dorset Lead Prospecting Small Very low
C7-25 Mooihoek Tin Closed Small Very low
4.16.3 Alluvial mining
None known or anticipated.
4.16.4 Monitoring systems
The Department of Water Affairs and Forestry (DWAF) conduct routine monitoring of river flows and water
quality at a few sites in this sub-catchment. In addition, in accordance with their statutory responsibility, DWAF
also regulate the quantity and quality of all effluent discharges through a system of effluent discharge permits or
licences. Each licensed effluent discharger is required to carry out a routine monitoring programme of the flow
and quality of their effluent and supply this to DWAF. The Department then conducts a randomised series of
audit samples to check the veracity of the effluent returns submitted by each discharger.
4.16.5 Water quality data
No specific water quality data for the Laphalala sub-catchment could be obtained in time for this report. In
view of the very limited mining activity, this deficiency is not considered to be important.
4.16.6 Implications for water quality and quantity management
The available evidence suggests that the very limited mining activities in this sub-catchment are unlikely to have
had any significant impact on either the local water resources or on water quality in the area.

cclxiii
4.17 The Theuniskloof sub-catchment
4.17.1 General description
4.17.1.1 Hydrology
This sub-catchment consists of the area drained by two small seasonal – episodic streams, and is located
between the Laphalala and Mogalakwena sub-catchments (Figures 4.2 and 4.3). These two stream systems
flow northwards to join the Limpopo River downstream of the Laphalala River (Figure 4.2). Flow patterns are
very variable as a result of the prevailing low and unpredictable rainfalls (average 380 mm) and the streams
normally only contain surface water immediately after rainfalls during the summer months. The sub-catchment
contains a few very small farm dams that provide water to livestock (Boroto & Görgens, 1999).
4.17.1.2 Geology
This small sub-catchment is underlain by a sequence of silicified sandstones and quartzites, accompanied by
minor carbon-rich mudstones and shales, and then basalts, of the Karoo Sequence. The sandstones are
resistant to weathering and remain as harder outcropping rock formations that stand clear of the surrounding
terrain to form small ranges of hills. Quaternary deposits of unconsolidated or poorly consolidated sandy
material overlie large areas of the sub-catchment. A few intrusive, diamondiferous kimberlite pipes have been
discovered in the area.
4.17.1.3 Pedology, agriculture and land use
Soils in the sub-catchment can be divided into two main groups:
• Moderately deep sandy loam soils on the sloping and undulating terrain in the upper reaches of the sub-
catchment; and
• Relatively shallow sandy soils in flat and undulating terrain in the lower reaches of the sub-catchment.
The area along the banks of the Limpopo River is part of a formal irrigation area, and uses water that is pumped
either from the bed of the Limpopo River or from boreholes sunk next to the riverbed. Further away from the
main river channel, the land use consists of small-scale livestock farming and the raising of game animals.
A few small settlements are present in the sub-catchment, though population densities are very low.
4.17.1.4 Surface water users
All of the settlements in the sub-catchment rely on water supplied from local boreholes or run-of-river
abstraction points in the bed of the Limpopo River. Most of the water used in the sub-catchment is consumed

cclxiv
by irrigation along the banks of the Limpopo River (Midgley et al., 1999). The Department of Water Affairs and
Forestry is evaluating the need for provision of additional water supplies to the sub-catchment.
4.17.1.5 Water management systems
The South African Department of Water Affairs and Forestry (DWAF) is responsible for the management of all
aspects of water supply and water use in the sub-catchment. Due to the absence of surface water supplies in
the sub-catchment, the Department does not have any flow gauging or water quality monitoring points in this
sub-catchment.
Irrigation Boards are locally responsible for providing allocations of water to their members, though they are not
responsible for the quality of the water supplied or for the quality of any irrigation return flows that seep back to
nearby watercourses.
4.17.1.6 Human impacts on water resources (excluding mining)
The following activities can be expected to have an impact on water resources in the Theuniskloof sub-
catchment:
• Non-point domestic effluent from small settlements and farms;
• Minor non-point impact from subsistence agriculture;
• Non-point impacts of agricultural return flows from irrigation areas; and
• Litter and domestic garbage discarded alongside the roads.
4.17.2 Mining and mineral processing operations
Two mining operations are of interest in this sub-catchment (Figures 4.2 and 4.3; Table 4.18).
Table 4.18: Mining operations in the Theuniskloof sub-catchment.
Code Number
Name of Mine Commodity (ies)
Mined Status
Relative Size
Probable Impact
A7-7 The Oaks Diamond –
kimberlite Operating Small Very low
B7-4 Rooikoppie Iron Prospecting Small Very low
4.17.3 Alluvial mining
None known or anticipated, though alluvial diamonds may be present downstream of The Oaks Diamond Mine.
cclxv
4.17.4 Monitoring systems
The Department of Water Affairs and Forestry (DWAF) do not carry out any monitoring of river flows or water
quality in this sub-catchment because of the scarcity of surface water. However, the department does
occasionally monitor the quality of water in local boreholes as part of its national ground water monitoring
system.
4.17.5 Water quality data
No water quality data were available for this sub-catchment. In view of the very limited mining activity, this
deficiency is not considered to be important.
4.17.6 Implications for water quality and quantity management
The available evidence suggests that the very limited mining activities in this sub-catchment are unlikely to have
had any significant impact on either the local water resources or on water quality in the area. Any impact would
be likely to consist of a minor increase in suspended solids concentrations during periods of high flow.
4.18 The Mogalakwena sub-catchment
4.18.1 General description
4.18.1.1 Hydrology
This sub-catchment consists of the area drained by the Mogalakwena River and its tributary streams, notably
the Nyl River in the upper reaches. This river system flows northwards from the area around the town of
Nylstroom and joins the Limpopo River downstream of the Laphalala River (Figure 4.2). The flow pattern in
this river is variable as a result of the prevailing low and unpredictable rainfalls (average 540 mm) though the
river is normally perennial and only dries up during severe droughts. Summer rainfalls cause a dramatic
increase in the flows of this river, though most of the tributary streams are highly seasonal and tend to flow
only during the summer months. The Nylsvley wetland is an extremely important wetland in the upper reaches
of the catchment and attenuates the flows contributed by the Nyl River to the Mogalakwena River.
The Mogalakwena sub-catchment contains several hundred small farm dams that are used to supply water for
domestic and irrigation purposes, as well as livestock watering (Boroto & Görgens, 1999). These farm dams are
responsible for most of the reduced flows that now characterize the Mogalakwena River.
Additional water supplies are piped into the catchment by the Magalies Water Board to meet the growing
demand for potable and industrial water in this sub-catchment.

cclxvi
4.18.1.2 Geology
Like the Laphalala sub-catchment, the geological features of the Mogalakwena sub-catchment are relatively
complex and consist of several different formations of widely differing ages. Most of the upper reaches of the
sub-catchment are underlain by a variety of porous consolidated and partially consolidated sedimentary strata,
predominantly sandstones, quartzites and felsites of the Waterberg and Soutpansberg Groups. These have
been variously intruded by acidic and basic granites and lavas of the Bushveld Igneous Complex and the
Transvaal Sequence, which in turn overlie the crystalline rocks of the Basement Complex.
Further downstream, the sub-catchment is underlain by sequences of silicified sandstones and quartzites,
followed by carbon-rich mudstones and shales, and then basalts, of the Karoo Sequence. The sandstones are
highly resistant to weathering and stand well above the surrounding undulating terrain to form local mountains
or ranges of hills (e.g. Wolkberg Mountain). Erosion-resistant rocks of the Waterberg Group show a similar
tendency, standing well clear of the surrounding countryside to form distinctive landscape features.
Large areas of the central parts of the sub-catchment are overlain by recent (Quaternary) deposits of
unconsolidated or poorly consolidated sandy material.
4.18.1.3 Pedology, agriculture and land use
Soils in the sub-catchment can be divided into four main groups:
• Moderate to deep sandy-clay loam soils on the sloping and undulating terrain in the upper reaches of the
sub-catchment;
• Shallow to moderately deep sandy loam soils lining the valley bottoms in the middle reaches of the sub-
catchment;
• Shallow to moderately deep sandy soils in flat and undulating terrain in the lower reaches of the sub-
catchment; and
• Black to mottled, clay-rich, blocky vertisols (often overlying leached sands) in wetland areas subjected to
continuous or seasonal inundation (e.g. Nylsvley).
Most of the clayey loam soils in the upper parts of the sub-catchment are very suitable for irrigation when
sufficient water is available. Large stretches of the upper and lower reaches of the Mogalakwena River are
under the jurisdiction of formal irrigation boards. In addition, the area along the banks of the Limpopo River is
also part of a formal irrigation area, and uses water that is pumped either from the bed of the Limpopo River or
from boreholes sunk next to the riverbed. Further away from the main channel of the Mogalakwena River, land
use consists almost entirely of small-scale livestock farming as well as game farming.
Several towns and numerous small settlements are located in the upper and middle reaches of the sub-
catchment, though population densities are much lower as the Limpopo River is approached. The central and
eastern portions of this sub-catchment support very large numbers of small-scale subsistence farmers.

cclxvii
4.18.1.4 Surface water users
All of the towns and settlements in the sub-catchment rely on water supplied from numerous small water supply
impoundments, or from run-of-river abstraction points and, occasionally (in the lower reaches), from local
boreholes. The extensive areas of irrigation along the Mogalakwena River consume most of the water used in
the upper and central reaches of the sub-catchment. The sub-catchment has very unreliable supplies of water
and the Magalies Water Board provides additional water supplies via a pipeline from Pretoria.
The large numbers of subsistence farmers in the central and eastern portion of the sub-catchment rely on
boreholes and hand-dug wells for their water supplies. The Department of Water Affairs and Forestry is
undertaking a concerted campaign to provide water supplies to these and other nearby areas in the Mokolo and
Laphalala sub-catchments in an attempt to improve the reliability of their water supplies.
4.18.1.5 Water management systems
The South African Department of Water Affairs and Forestry (DWAF) is responsible for the management of all
aspects of water supply and water use in the sub-catchment. The Department operates a routine system of flow
gauging at all major water supply dams in the sub-catchment and particular attention is paid to monitoring the
quantity of water supplied to irrigation schemes and towns, as well as increasing attention to the quality of
agricultural return flows and any effluent discharges to the Mogalakwena River. Extensive surveys of the sub-
catchment’s ground water potential have been carried out by DWAF so as to facilitate selection of appropriate
locations for water supply boreholes.
Irrigation Boards are locally responsible for providing allocations of water to their members, though they are not
responsible for the quality of the water supplied or for the quality of any irrigation return flows that seep back to
nearby watercourses.
4.18.1.6 Human impacts on water resources (excluding mining)
The following activities can be expected to have an impact on water resources in the Mogalakwena sub-
catchment:
• Minor seepage from small landfill sites and solid waste disposal sites at several of the larger towns;
• Disposal of liquid (domestic and some light industrial) effluent at all towns;
• Minor volumes of urban runoff from the larger towns;
• Non-point domestic effluent from numerous small settlements and farms;
• Minor non-point impact from non-intensive subsistence agriculture;
• Non-point impacts of agricultural return flows from intensive irrigation areas; and
• Litter and domestic garbage discarded alongside the extensive road system that traverses the sub-
catchment.

cclxviii
4.18.2 Mining and mineral processing operations
The following mining operations are of interest in this sub-catchment (Figures 4.2 and 4.3; Table 4.19).
Table 4.19: Mining operations in the Mogalakwena sub-catchment.
Code Number
Name of Mine Commodity (ies)
Mined Status
Relative Size
Probable Impact
A7-6 Tolwe Copper Prospecting Very small Very low
B7-3 Buffelshoek Lead Prospecting Very small Very low
B7-5 Baltimore Phosphate Prospecting Very small Very low
B7-14 Potgietersrus Platinum Platinum Operating Medium Low
B7-15 Bakenberg Vanadium Prospecting Small Very low
B7-16 Lebowa Granite Dimension stone Operating Medium Very low
B7-17 Zandrivier Gold Operating Small Low
C7-2 Vaalkop Vanadium Prospecting Small Very low
C7-3 Zebediela Clay minerals Operating Small Very low
C7-9 Naboomspruit Quarry Dimension stone Operating Small Very low
C7-15 Hartbeesfontein Fluorspar Closed Small Very low
C7-22 Sterkrivier Vanadium, Chrome Prospecting Small Very low
C7-26 Union Tin Tin Closed Small Very low
4.18.3 Alluvial mining
None known or anticipated.
4.18.4 Monitoring systems
The Department of Water Affairs and Forestry (DWAF) conduct routine monitoring of river flows and water
quality at several sites in the Mogalakwena sub-catchment. In addition, in accordance with their statutory
responsibility, DWAF also regulate the quantity and quality of all effluent discharges through a system of effluent
discharge permits or licences. Each licensed effluent discharger is required to carry out a routine monitoring
programme of the flow and quality of their effluent and supply this to DWAF. The Department then conducts a
randomised series of audit samples to check the veracity of the effluent returns submitted by each discharger.
4.18.5 Water quality data

cclxix
Water quality data for three sites along the Mogalakwena River (upper, middle and lower reaches of the sub-
catchment) were obtained from the Department of water Affairs and Forestry. These data are presented in
Table 4.20, below.
Table 4.20: Average values for selected water quality constituents in the upper, middle and lower reaches of
the Mogalakwena River. (All data presented as mg/litre, except electrical conductivity (milliSiemens/metre) and
pH values). River Reach
Parameter Upper Middle Lower Electrical Conductivity 34.5 26.3 32.0
pH 7.5 7.6 7.9
Total Dissolved Salts 266 216 261
Ca 23 28 25.1
Na 33 14 32.1
K 5.8 2.6 6.4
F 0.3 0.3 0.3
Cl 30 9.6 48.4
SO4 8.7 4.0 3.4
4.18.6 Implications for water quality and quantity management
The available evidence suggests that the only likely source of any impact on local water resources and water
quality would be the Potgietersrus Platinum Mine and its associated processing plants and tailings dams.
These impacts would most likely consist of localized acid mine drainage linked to the oxidation of sulphide
minerals. In addition, the Rustenburg Platinum Mine and the other operating and closed or abandoned mining
operations can be expected to contribute increased quantities of suspended solids to local streams and rivers
during and after rainfalls.
4.19 The Setoka-Soutsloot sub-catchment
4.19.1 General description
4.19.1.1 Hydrology
This sub-catchment consists of the area drained by several small seasonal and episodic streams, and is located
between the Mogalakwena and Sand sub-catchments (Figures 4.2 and 4.3). These stream systems all flow

cclxx
northwards to join the Limpopo River downstream of the Mogalakwena River (Figure 4.2). Flow patterns are
very variable as a result of the prevailing low and unpredictable rainfalls (average 375 mm) and the streams
normally only contain surface water immediately after rainfalls during the summer months. The sub-catchment
contains one water supply dam for the Vinetia Diamond Mine and a few very small farm dams that provide
water to livestock (Boroto & Görgens, 1999).
4.19.1.2 Geology
This small sub-catchment is underlain by a sequence of silicified sandstones and quartzites, accompanied by
minor carbon-rich mudstones and shales, and then basalts, of the Karoo Sequence. The sandstones are
resistant to weathering and remain as harder outcropping rock formations that stand clear of the surrounding
terrain to form small, steep-sided ranges of hills. Quaternary deposits of unconsolidated or poorly consolidated
sandy material overlie large areas of the sub-catchment. An important diamondiferous kimberlite pipe is located
in the area and is being worked (Vinetia Diamond Mine).
4.19.1.3 Pedology, agriculture and land use
Soils in the sub-catchment can be divided into two main groups:
• Moderately deep sandy soils on the sloping and undulating terrain in the upper reaches of the sub-
catchment; and
• Relatively shallow, coarse-grained sandy soils and silt deposits in flat and undulating terrain in the lower
reaches of the sub-catchment, particularly along the flood terraces of streams.
The area along the banks of the Limpopo River is part of a formal irrigation area, and uses water that is pumped
either from the bed of the Limpopo River or from boreholes sunk next to the riverbed. Further away from the
main river channel, the land use consists of small-scale livestock farming and the raising of game animals. A
few small settlements are present, though population densities are very low.
4.19.1.4 Surface water users
All of the farmsteads and settlements in the sub-catchment rely on water supplied from local boreholes or run-
of-river abstraction points in the bed of the Limpopo River. Most of the water used in the sub-catchment is
consumed by irrigation along the banks of the Limpopo River, though the Vinetia Diamond Mine is also an
important water user (Midgley et al., 1999).
4.19.1.5 Water management systems
The South African Department of Water Affairs and Forestry (DWAF) is responsible for the management of all
aspects of water supply and water use in the sub-catchment. Due to the absence of significant surface water

cclxxi
supplies in the sub-catchment, the Department does not have any flow gauging or water quality monitoring
points in this sub-catchment. The Vinetia Diamond Mine monitors the quantity and quality of water in their water
supply impoundment (water is supplied from boreholes in the bed of the Limpopo River).
Irrigation Boards are locally responsible for providing allocations of water to their members, though they are not
responsible for the quality of the water supplied or for the quality of any irrigation return flows that seep back to
the Limpopo River.
4.19.1.6 Human impacts on water resources (excluding mining)
The following activities can be expected to have an impact on water resources in the Setoka-Soutsloot sub-
catchment:
• Non-point domestic effluent from small settlements and farms;
• Minor non-point impact from subsistence agriculture;
• Non-point impacts of agricultural return flows from irrigation areas; and
• Litter and domestic garbage discarded alongside the roads.
4.19.2 Mining and mineral processing operations
The following mining operations are of interest in this sub-catchment (Figures 4.2 and 4.3; Table 4.21).
Table 4.21: Mining operations in the Setoka-Soutsloot sub-catchment.
Code Number
Name of Mine Commodity (ies) Mined
Status Relative Size
Probable Impact
A7-1 Limpopo Alluvial Diamond - alluvial Closed Very small Very low
A7-2 Skutwater Coal Prospecting Small Very low
A7-3 Venetia Alluvial Diamond – alluvial Closed Very small Very low
A7-4 Venetia Diamond – kimberlite Operating Medium Low
4.19.3 Alluvial mining
Small-scale alluvial diamond mining activities have been carried out downstream of the Vinetia Diamond Mine in
the past.
4.19.4 Monitoring systems
The Department of Water Affairs and Forestry (DWAF) do not carry out any monitoring of river flows or water
quality in this sub-catchment because of the scarcity of surface water. However, the Department does

cclxxii
occasionally monitor the quality of water in local boreholes as part of its national ground water monitoring
system. In addition, the Vinetia Diamond Mine is required to submit regular returns to the Department showing
the quantity and quality of water abstracted from the bed of the Limpopo River and the results of seepage
control monitoring.
4.19.5 Water quality data
No specific water quality data for the Setoka-Soutsloot sub-catchment could be obtained in time for this report.
4.19.6 Implications for water quality and quantity management
The available evidence suggests that the very limited mining activities in this sub-catchment are unlikely to have
had any significant impact on either the local water resources or on water quality in the area. Any impact would
be likely to consist of a minor increase in suspended solids concentrations during periods of high flow.
4.20 Mining operations in the Sand sub-catchment
4.20.1 General description
4.20.1.1 Hydrology
This sub-catchment consists of the area drained by the Sand River and its tributary streams, notably the Brak,
Hout, Dwars and Dorp rivers in the upper and middle reaches. As the names of some tributaries imply, they
usually contain little or no water. This river system flows northwards from the area around the town of
Pietersburg and joins the Limpopo River close to the town of Messina (Figure 4.2). The flow pattern in this
river is highly variable as a result of the prevailing low and unpredictable rainfalls (average 480-500 mm) and
the river is not normally perennial. During drought periods, the Sand River may remain without surface water
for periods of several consecutive months. Summer rainfalls cause a dramatic increase in the flows of this river,
though most of the tributary streams are highly seasonal.
The Sand sub-catchment contains over 700 small farm dams that are used to supply water mainly for livestock
watering purposes (Boroto & Görgens, 1999). These farm dams are responsible for most of the reduced and
episodic flows that now characterize the Sand River and its tributaries.
The Department of Water Affairs and Forestry has completed the feasibility studies aimed at transferring water
to the Sand sub-catchment from the middle reaches of the Olifants River to the southeast, and from the upper
reaches of the Levuvhu River located to the east of the Sand River (Figure 4.2).

cclxxiii
4.20.1.2 Geology
Like the Mogalakwena sub-catchment, the geological features of the Sand sub-catchment are relatively complex
and consist of several different formations of widely differing ages. A variety of acidic, intrusive granites and
gneisses of the Sand River Formation underlie most of the upper reaches of the sub-catchment. Younger
consolidated and silicified sedimentary strata, predominantly sandstones and quartzites of the Soutpansberg
Group have in turn intruded these.
Further downstream, the sub-catchment is underlain by sequences of silicified sandstones and quartzites of the
Soutpansberg Group, followed by carbon-rich mudstones and shales, and then basalts, of the Karoo Sequence.
The sandstones are highly resistant to weathering and stand well above the surrounding undulating terrain to
form local mountains or ranges of hills (e.g. the Soutpansberg Mountains). Erosion-resistant rocks of the
Soutpansberg Group tend to stand well clear of the surrounding countryside to form distinctive landscape
features.
Large areas of the central parts of the sub-catchment are overlain by recent (Quaternary) deposits of
unconsolidated or poorly consolidated sandy material.
4.20.1.3 Pedology, agriculture and land use
The soils in the Sand sub-catchment can be divided into four main groups:
• Moderately shallow to deep sandy-clay loam soils on the sloping and undulating terrain in the upper reaches
of the sub-catchment;
• Shallow to moderately deep sandy loam soils lining the valley bottoms in the middle reaches of the sub-
catchment;
• Shallow sandy soils in foothill areas and on flat and undulating terrain in the lower reaches of the sub-
catchment; and
• Clay-rich, blackish soils with a high sodium content lining internal drainage areas and with dispersive
characteristics.
Most of the clayey loam soils in the upper parts of the sub-catchment would be suitable for irrigation if sufficient
water were available. Two relatively small areas in the upper and lower portions of the Sand River sub-
catchment are under the jurisdiction of formal water control boards or irrigation boards. In addition, the area
along the banks of the Limpopo River is also part of a formal irrigation area, and uses water that is pumped
either from the bed of the Limpopo River or from boreholes sunk next to the riverbed. Further away from the
main channel of the Sand River, land use consists almost entirely of subsistence rain-fed cultivation of drought-
resistant crops, small-scale livestock farming and game farming.
Several large towns and numerous small settlements are located in the upper and middle reaches of the sub-
catchment, including the City of Pietersburg, capital of the Northern Province. However, population densities

cclxxiv
decline rapidly in the area to the north of the town of Louis Trichardt and the Soutpansberg Mountains, until the
town of Messina is reached close to the Limpopo River. The upper and central portions of this sub-catchment
support very large numbers of small-scale subsistence farmers.
4.20.1.4 Surface water users
All of the cities, towns and settlements in the Sand sub-catchment rely on water supplied from numerous small
water supply impoundments, or from run-of-river abstraction points and, occasionally (in the lower reaches),
from local boreholes. These water supplies are supplemented by water transferred into the sub-catchment from
the Olifants River and from the headwaters of the Levuvhu River. The relatively small areas of irrigation
consume a significant proportion of the water used in the upper and lower-central reaches of the sub-catchment.
Most of the large numbers of subsistence farmers in the upper and central portions of the sub-catchment rely on
boreholes and hand-dug wells for their water supplies. The Department of Water Affairs and Forestry is
undertaking a concerted campaign to provide water supplies (usually ground water via boreholes) to these
residents in an attempt to improve the reliability of their water supplies.
4.20.1.5 Water management systems
The South African Department of Water Affairs and Forestry (DWAF), through its Provincial office in
Pietersburg, is responsible for the management of all aspects of water supply and water use in the sub-
catchment. The Department operates a routine system of flow gauging at all major water supply dams in the
sub-catchment and particular attention is paid to monitoring the quantity of water supplied to irrigation schemes
and towns, as well as increasing attention to the quality of agricultural return flows and any effluent discharges
to the Sand River. Extensive surveys of the sub-catchment’s ground water potential have been carried out by
DWAF so as to facilitate selection of appropriate locations for water supply boreholes.
Irrigation Boards are locally responsible for providing allocations of water to their members, though they are not
responsible for the quality of the water supplied or for the quality of any irrigation return flows that seep back to
nearby watercourses.
4.20.1.6 Human impacts on water resources (excluding mining)
The following activities can be expected to have an impact on water resources in the Sand sub-catchment:
• Minor seepage from landfill sites and solid waste disposal sites at several of the larger towns and cities;
• Disposal of liquid (domestic and some light industrial) effluent at all towns;
• Minor volumes of urban runoff from the larger towns;
• Non-point domestic effluent from numerous small settlements and farms;

cclxxv
• Minor non-point impact from non-intensive subsistence agriculture;
• Non-point impacts of agricultural return flows from intensive irrigation areas; and
• Litter and domestic garbage discarded alongside the extensive road system that traverses the sub-
catchment.
4.20.2 Mining and mineral processing operations
The following mining operations are of interest in this sub-catchment (Figures 4.2 and 4.3; Table 4.22).
Table 4.22: Mining operations in the Sand sub-catchment.
Code Number
Name of Mine Commodity (ies) Mined
Status Relative Size
Probable Impact
A8-5 Messina Copper Copper Closed Medium Low-Medium
A8-6 Baobab Vermiculite Vermiculite Operating Small Very low
A7-5 Soutpansberg Salt Salt Operating Medium Low-Medium
B7-1 Goetgedacht Vermiculite Prospecting Small Very low
B7-2 Potgietersrand Tin Prospecting Very small Very low
B7-7 Bandelierkop Corundum Operating Very small Very low
B7-9 Mangata alluvial Gold Artisan (few) Very small Low, some As
B7-10 Kolkbank alluvial Gold Artisan (few) Very small Low, some As
B7-11 Fort Klipdam Silicon Operating Small Very low
B7-12 Witkop Silica Silicon Operating Medium Very low
4.20.3 Alluvial mining
A few small-scale alluvial gold mining activities occur in this sub-catchment.
4.20.4 Monitoring systems
The Department of Water Affairs and Forestry (DWAF) Regional office in Pietersburg carries out routine
monitoring of river flows and water quality in this sub-catchment, as well as other sub-catchments in the
Northern Province. In addition, the Department also monitors the quality of water in local boreholes as part of
its national ground water monitoring system. All industries are required to submit regular returns to the
Department showing the quantity and quality of water used and the results of all effluent discharge and seepage
control monitoring.
4.20.5 Water quality data

cclxxvi
Water quality data for three sites along the Sand River (middle, lower-middle and lower reaches of the sub-
catchment) were obtained from the Department of water Affairs and Forestry. These data are presented in
Table 4.23, below.
Table 4.23: Water quality data (median and 95th percentile values) for three sites along the Sand River. All
values are in mg/litre except and electrical conductivity (milliSiemens/metre), and pH.
River Reach Parameter
Middle Lower-Middle Lower pH 7.67 - 8.48 7.05 - 8.03 7.65 - 8.30
Electrical Conductivity 59.1 - 115.2 9.5 - 39.1 59.0 - 79.3
Ca 28.2 - 62 6.2 - 22 31.2 - 41.8
Mg 21.2 - 54 3.4 - 12.9 20.2 - 27.2
Na 46.5 - 125.3 5.3 - 32.8 55.1 - 81.4
K 4.2 - 7.1 0.9 - 4.2 4.5 - 5.5
Total alkalinity (CaCO3) 172 - 345 26.7 - 117.2 159.9 - 192.4
Cl 54.6 - 178.1 10.3 - 33.9 66.5 - 112.7
F 0.23 - 0.43 0.08 - 0.26 0.27 - 0.43
Si 9.4 - 13.3 7.7 - 9.9 9.73 - 12.08
SO4 12.5 - 40.9 3.6 - 10.7 14.7 - 34.3
NH4-N 0.06 - 0.21 0.05 - 0.12 0.05 - 0.21
NO3-N 0.02 - 0.45 0.06 - 0.35 0.02 - 0.35
PO4-P 0.03 - 0.11 0.01 - 0.05 0.03 - 0.08
These data (Table 4.23) show that the Sand River water is moderately mineralised and is subject to enrichment
by plant nutrients (nitrogen and phosphorus), probably as a result of agricultural return flows and discharges of
treated sewage effluent. The concentration ranges of the normal water quality parameters indicate that the
water is generally of a good quality and fit for most uses except irrigation on sensitive soils.
4.20.6 Implications for water quality and quantity management
The available evidence suggests that the very limited mining activities in this sub-catchment are unlikely to have
any significant impact on either the local water resources or on water quality in the area. Most impacts would be
likely to consist of a minor increase in suspended solids concentrations during periods of high flow following
rainfalls. The possible exceptions to this statement would be a possibility of minor acid mine drainage from the
abandoned pits and adits of the Messina Copper Mine and the presence of small quantities of arsenic
associated with alluvial gold diggings. If these alluvial miners use mercury to separate out the gold, then there
is also a risk of mercury contamination.
The Soutpansberg Salt Works extract salt from evaporite deposits located to the south of the town of Louis
Trichardt. There is a minor risk of localized ground water contamination in this area.

cclxxvii
4.21 The Nzhelele sub-catchment
4.21.1 General description
4.21.1.1 Hydrology
This sub-catchment consists of the area drained by the Nzhelele and Tshipise rivers and their small tributary
streams. These two small rivers flows almost due northwards from the northern slopes of the Soutpansberg
Mountains to the Limpopo River, downstream of the town of Messina (Figure 4.2). The flow patterns in these
rivers are highly variable as a result of the prevailing low and unpredictable rainfalls (average 350-400 mm) and
the rivers are not normally perennial. During drought periods, both rivers may remain without surface water for
periods of several consecutive months. Summer rainfalls cause a dramatic increase in flows, though the
tributary streams are episodic and only contain water after rainfalls.
The Nzhelele sub-catchment contains two large dams and over 80 smaller dams that are used to supply water
mainly for domestic use and livestock watering purposes (Boroto & Görgens, 1999). These dams are
responsible for most of the reduced and episodic flows in the lower reaches of the Nzhelele and Tshipise rivers.
A strongly flowing thermal spring is located at Tshipise and forms the centre of a resort development there.
4.21.1.2 Geology
Similar to the northern parts of the Sand River sub-catchment, the geological features of the Nzhelele sub-
catchment consist of several different formations of widely differing ages. A variety of acidic, intrusive granites
and gneisses of the Sand River Formation underlie the uppermost reaches of the sub-catchment, whilst younger
consolidated and silicified sedimentary strata, predominantly sandstones and quartzites of the Soutpansberg
Group have in turn intruded these to form the spectacular, steep-sided hills and mountains of the eastern limb of
the Soutpansberg Mountains.
Further downstream, the sub-catchment is underlain by sequences of silicified sandstones and quartzites of the
Soutpansberg Group, followed by carbon-rich mudstones and shales, and then basalts, of the Karoo Sequence.
Compact sedimentary extrusive and intrusive rocks of the Beit Bridge Complex mark the position of the Limpopo
Mobile Belt, underlying the northern part of the catchment closest to the Limpopo River.
Large areas of the central and northern parts of the sub-catchment are overlain by recent (Quaternary) deposits
of poorly consolidated sandy material.
4.21.1.3 Pedology, agriculture and land use

cclxxviii
The soils in the Nzhelele sub-catchment can be divided into three main groups:
• Moderately deep sandy-clay loam soils on the tops of the hill slopes and undulating terrain in the uppermost
reaches of the sub-catchment;
• Shallow to moderately deep sandy soils lining the valley bottoms in the middle reaches of the sub-
catchment; and
• Small areas of clay-rich soils with a high sodium content lining internal drainage areas close to the Limpopo
River, and having dispersive characteristics.
Most of the sandy-clay loam soils in the upper parts of the sub-catchment fall within a zone of higher rainfall and
support extensive plantation forestry activities. The sub-catchment is under the jurisdiction of a formal water
control a board board that is responsible for irrigation water allocations from the two storage reservoirs. In
addition, the area along the banks of the Limpopo River is also part of a formal irrigation area, and uses water
that is pumped either from the bed of the Limpopo River or from boreholes sunk next to the riverbed. Several
areas of intensive (irrigated) cultivation of drought-resistant crops such as cotton are located within the irrigation
areas. Further away from the main channel of the Nzhelele and Tshipise rivers, land use consists almost
entirely of subsistence rain-fed cultivation of drought-resistant crops, small-scale livestock farming and game
farming.
Several large and small settlements are located in the upper and middle reaches of the sub-catchment. The
central portion of this sub-catchment also supports large numbers of small-scale subsistence farmers.
4.21.1.4 Surface water users
Most of the water used in the sub-catchment is consumed by irrigation in the central and lower reaches of this
sub-catchment (Midgley et al., 1999). Most farms and settlements in the sub-catchment rely heavily on water
supplied from local boreholes and small farm dams. The hot spring resort at Tshipise uses water obtained
directly from the thermal spring and other (cooler) springs in the area.
4.21.1.5 Water management systems
The South African Department of Water Affairs and Forestry (DWAF), through its Provincial office in
Pietersburg, is responsible for the management of all aspects of water supply and water use in the sub-
catchment. The Department operates a routine system of flow gauging at the two major water supply dams in
the sub-catchment and particular attention is paid to monitoring the quantity of water supplied to irrigation
schemes and towns, as well as increasing attention to the quality of agricultural return flows to the Nzhelele and
Tshipise rivers. Some surveys of the sub-catchment’s ground water potential have been carried out by DWAF
so as to facilitate selection of appropriate locations for water supply boreholes.
Irrigation Boards are locally responsible for providing allocations of water to their members, though they are not
responsible for the quality of the water supplied or for the quality of any irrigation return flows that seep back to
nearby watercourses.

cclxxix
4.21.1.6 Human impacts on water resources (excluding mining)
The following activities can be expected to have an impact on water resources in the Nzhelele sub-catchment:
• Minor seepage from solid waste disposal sites at several of the larger settlements;
• Non-point domestic effluent from numerous small settlements and farms;
• Minor non-point impact from non-intensive subsistence agriculture;
• Non-point impacts of agricultural return flows from intensive irrigation areas; and
• Litter and domestic garbage along the roads that traverse the sub-catchment.
4.21.2 Mining and mineral processing operations
The following mining operations are of interest in this sub-catchment (Figures 4.2 and 4.3; Table 4.24).
Table 4.24: Mining operations in the Nzhelele sub-catchment.
Code Number
Name of Mine Commodity (ies) Mined
Status Relative Size
Probable Impact
A8-1 Limpopo Nickel, Lead Closed Very small Very low
A8-7 Shangani Coal Prospecting Very small Very low
4.21.3 Alluvial mining
None known or anticipated.
4.21.4 Monitoring systems
The Department of Water Affairs and Forestry (DWAF) Regional office in Pietersburg carries out irregular
monitoring of river flows and water quality in this sub-catchment, as well as some borehole monitoring.
4.21.5 Water quality data
No specific water quality data for this sub-catchment could be obtained in time for this report.
4.21.6 Implications for water quality and quantity management
The available evidence suggests that the very limited mining activities in this sub-catchment are unlikely to have
had any significant impact on either the local water resources or on water quality in the area. Any impact would
be likely to consist of a minor increase in suspended solids concentrations during periods of high flow following
rainfalls.

cclxxx
4.22 Mining operations in the Levuvhu sub-catchment
4.22.1 General description
4.22.1.1 Hydrology
This sub-catchment consists of the area drained by the Levuvhu River and its main tributary the Mutale River,
together with a variety of smaller tributary streams. The Levuvhu and Mutale rivers flows north-eastwards from
the north-eastern slopes of the Soutpansberg Mountains to the Limpopo River, joining the Limpopo River at
Crooks Corner where the borders of South Africa, Mozambique and Zimbabwe meet (Figure 4.2). The flow
patterns in these two rivers are fairly variable as a result of the prevailing unpredictable rainfalls, though the
upper reaches of the sub-catchment receive over 1,000 mm of rainfall per year. There is an extremely steep
gradient in rainfall from the upper reaches of the sub-catchment to the Limpopo River where annual rainfalls
average some 250 mm per year. Both the Mutale and the Levuvhu rivers are normally perennial, though the
Levuvhu River has been extensively exploited and now contains very little water. During drought periods, the
lower reaches of both rivers may stop flowing for periods of several months. Summer rainfalls cause a dramatic
increase in flows, though the tributary streams are episodic and only contain water after rainfalls.
The Levuvhu sub-catchment contains four large dams and over 180 smaller dams that are used to supply water
mainly for domestic use and livestock watering purposes (Boroto & Görgens, 1999), as well as some water that
is transferred out of this sub-catchment into the Sand sub-catchment. In addition, the Venda sacred lake, Lake
Fundudzi, is located on the upper reaches of the Mutale River.
4.22.1.2 Geology
The geological characteristics of the Levuvhu sub-catchment share several similarities with neighbouring sub-
catchments to the west. A variety of acidic, intrusive granites and gneisses of the Sand River Formation
underlie the uppermost reaches of the sub-catchment, whilst younger consolidated and silicified sedimentary
strata, predominantly sandstones and quartzites of the Soutpansberg Group have in turn intruded and overlain
these to form the spectacular, steep-sided hills and mountains of the eastern limb of the Soutpansberg
Mountains, located in the headwaters of this sub-catchment.
Further downstream, the sub-catchment is underlain by sequences of silicified sandstones and quartzites of the
Soutpansberg Group, followed by carbon-rich mudstones, shales and basalts, of the Karoo Sequence.
Compact sedimentary extrusive and intrusive rocks of the Beit Bridge Complex mark the position of the highly
mineralised Limpopo Mobile Belt, underlying the northern part of the catchment closest to the Limpopo River.
Recent (Quaternary) deposits of semi consolidated sandy material overlie large areas of the central and
northern parts of the sub-catchment.

cclxxxi
4.22.1.3 Pedology, agriculture and land use
The soils in the Levuvhu sub-catchment can be divided into three main groups:
• Moderately deep, red-coloured sandy-clay loam soils on the tops of the hill slopes and undulating terrain in
the uppermost reaches of the sub-catchment;
• Shallow to moderately deep, reddish to tan coloured sandy soils lining the valley bottoms in the middle
reaches of the sub-catchment; and
• Small areas of clay-rich, blackish or mottled soils with a high organic content covering flood terraces close
to the lower reaches of the Levuvhu River and the Limpopo River; in some parts (e.g. the Pafuri Floodplain,
these soils have a high sodium content and dispersive characteristics).
Most of the sandy-clay loam soils in the upper parts of the sub-catchment fall within a zone of higher rainfall and
support extensive plantation forestry activities. The sub-catchment is under the jurisdiction of a formal water
control a board that is responsible for irrigation water allocations from the four storage reservoirs. Further away
from the main channels of the Mutale and Levuvhu rivers, land use consists almost entirely of subsistence rain-
fed cultivation of drought-resistant crops and small-scale livestock farming.
The overall pattern of land use in the Levuvhu sub-catchment is relatively complex, and includes towns,
collected or grouped (but not collective) villages and settlements, traditional family units, commercial and
subsistence cropping of cultivated lands, natural forests and forest plantations, Nature Reserves and National
Parks (the northern portion of the Kruger National Park).
Land use in the upper reaches of the sub-catchment comprises mainly commercial framing and large plantation
forestry estates, with natural forests on the watershed dividing the Mutale and Levuvhu catchments. The town
of Louis Trichardt located on the sub-catchment boundary to the west is the main service and industrial centre
for the upper portion of the sub-catchment.
In the central reaches of the sub-catchment, the predominant land use consists of groups of villages serving
nearby collected (but not collective) agricultural plots. This development hinges around the rapidly expanding
urban centre of Thohoyandou, which is located close to the Levuvhu River. The central portion of the sub-
catchment is also used extensively for small and large livestock rearing. Further to the east, there is a transition
in land use from villages and agricultural plots to traditional single-family subsistence agriculture. In the
lowermost reaches of the sub-catchment, land use is entirely devoted to conservation in Nature Reserves and
the Kruger National Park.
The Tshikondeni Colliery is located close to the lower reaches of the Levuvhu River, whilst several closed and
abandoned mines, as well as alluvial diamond prospecting areas, are located closer to the Limpopo River.
4.22.1.4 Surface water users

cclxxxii
Most of the water used in the sub-catchment is consumed by formal (large-scale) and small-scale irrigation in
the central reaches of the Levuvhu River and Mutale River (Midgley et al., 1999). Most farms and settlements
that are locate away from river channels in the sub-catchment rely heavily on water supplied from local
boreholes and small farm dams. Livestock are watered at small natural springs on the hill slopes or at watering
points along the river channels.
The large urban centre of Thohoyandou is one of the largest water users in the sub-catchment, with water being
supplied to domestic users as well as a wide variety of light industries. A relatively small volume of water is
transferred from this sub-catchment to the Sand sub-catchment to supplement water supplies to the town of
Louis Trichardt.
4.22.1.5 Water management systems
The South African Department of Water Affairs and Forestry (DWAF), through its office in Thohoyandou, is
responsible for the management of all aspects of water supply and water use in the Levuvhu sub-catchment.
The Department operates a routine system of flow gauging at the four major water supply dams in the sub-
catchment and particular attention is paid to monitoring the quantity of water supplied to irrigation schemes,
towns and the Tshikondeni Colliery. Some surveys of the sub-catchment’s ground water potential have been
carried out by DWAF so as to facilitate selection of appropriate locations for water supply boreholes.
Irrigation Boards are locally responsible for providing allocations of water for irrigation, though they are not
responsible for the quality of the water supplied or for the quality of any irrigation return flows that seep back to
nearby watercourses.
4.22.1.6 Human impacts on water resources (excluding mining)
The following activities can be expected to impact on water resources in the Levuvhu sub-catchment:
• Minor seepage from solid waste disposal sites (rubbish dumps) at the towns and most larger settlements;
• Discharge of effluent (domestic and light industrial) from Thohoyandou;
• Non-point domestic effluent from numerous small settlements and farms;
• Minor non-point impact from non-intensive subsistence agriculture;
• Non-point impacts of agricultural return flows from intensive irrigation areas; and
• Litter and domestic garbage along the roads that traverse the sub-catchment.
4.22.2 Mining and mineral processing operations
The following mining operations are of interest in this sub-catchment (Figures 4.2 and 4.3; Table 4.25).
Table 4.25: Mining operations in the Levuvhu sub-catchment.
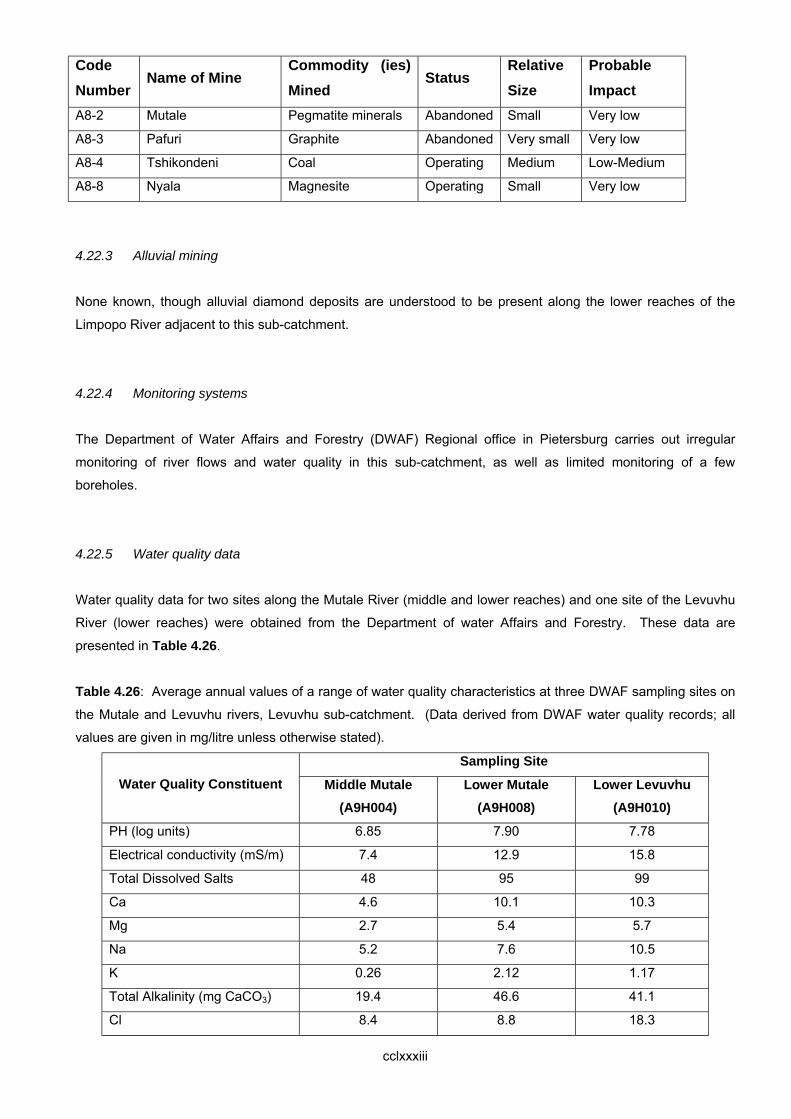
cclxxxiii
Code Number
Name of Mine Commodity (ies) Mined
Status Relative Size
Probable Impact
A8-2 Mutale Pegmatite minerals Abandoned Small Very low
A8-3 Pafuri Graphite Abandoned Very small Very low
A8-4 Tshikondeni Coal Operating Medium Low-Medium
A8-8 Nyala Magnesite Operating Small Very low
4.22.3 Alluvial mining
None known, though alluvial diamond deposits are understood to be present along the lower reaches of the
Limpopo River adjacent to this sub-catchment.
4.22.4 Monitoring systems
The Department of Water Affairs and Forestry (DWAF) Regional office in Pietersburg carries out irregular
monitoring of river flows and water quality in this sub-catchment, as well as limited monitoring of a few
boreholes.
4.22.5 Water quality data
Water quality data for two sites along the Mutale River (middle and lower reaches) and one site of the Levuvhu
River (lower reaches) were obtained from the Department of water Affairs and Forestry. These data are
presented in Table 4.26.
Table 4.26: Average annual values of a range of water quality characteristics at three DWAF sampling sites on
the Mutale and Levuvhu rivers, Levuvhu sub-catchment. (Data derived from DWAF water quality records; all
values are given in mg/litre unless otherwise stated).
Sampling Site Water Quality Constituent Middle Mutale
(A9H004) Lower Mutale
(A9H008) Lower Levuvhu
(A9H010) PH (log units) 6.85 7.90 7.78
Electrical conductivity (mS/m) 7.4 12.9 15.8
Total Dissolved Salts 48 95 99
Ca 4.6 10.1 10.3
Mg 2.7 5.4 5.7
Na 5.2 7.6 10.5
K 0.26 2.12 1.17
Total Alkalinity (mg CaCO3) 19.4 46.6 41.1
Cl 8.4 8.8 18.3

cclxxxiv
SO4 3.5 4.2 3.8
F 0.05 0.12 0.11
Si 5.03 6.94 4.81
NH4-N 0.05 0.05 0.07
NO3-N 0.14 0.40 0.08
PO4-P 0.011 0.017 0.016
These water quality data (Table 4.26) indicate that water quality in both the Mutale and Levuvhu rivers is
relatively good, though that of the Levuvhu River can be considered to be marginally poorer. This is a reflection
of the intensive and extensive patterns of land use along the banks of the Levuvhu River.
4.22.6 Implications for water quality and quantity management
The available evidence suggests that the very limited mining activities in this sub-catchment are unlikely to have
had any significant impact on either the local water resources or on water quality in the area. Any impact would
be likely to consist of a minor increase in suspended solids concentrations during periods of high flow and,
possibly, minor acid mine drainage with lower pH values and higher dissolved salts concentrations from the
Tshikondeni Colliery.
4.23 Summary of impacts of mining operations on water resources and water quality in the Limpopo basin
The wide variety of mining operations and mineral processing activities located within the Limpopo basin have
differing degrees of impact on both the water resources available to other users and on the water quality of
these resources. From the available data, it seems clear that those mining operations that are located within
low rainfall regions of the basin (where physical weathering processes predominate) have relatively low and/or
localized impacts on the water resources. In contrast, mining operations located in the wetter regions of the
basin where chemical weathering processes predominate tend to have far more extensive impacts. This seems
to be due to the presence of ample moisture within the soil profile that enables continual chemical changes to
take place and allows the water available to mobilize and transport the different contaminants that become
available.
A summarized overview of the actual and anticipated impacts of mining operations and mineral processing
plants in each sub-catchment of the Limpopo basin is given in Table 4.27. This information provides a useful
impression that could be used to focus water resource management plans and water quality management plans
in the different component areas of the Limpopo basin.
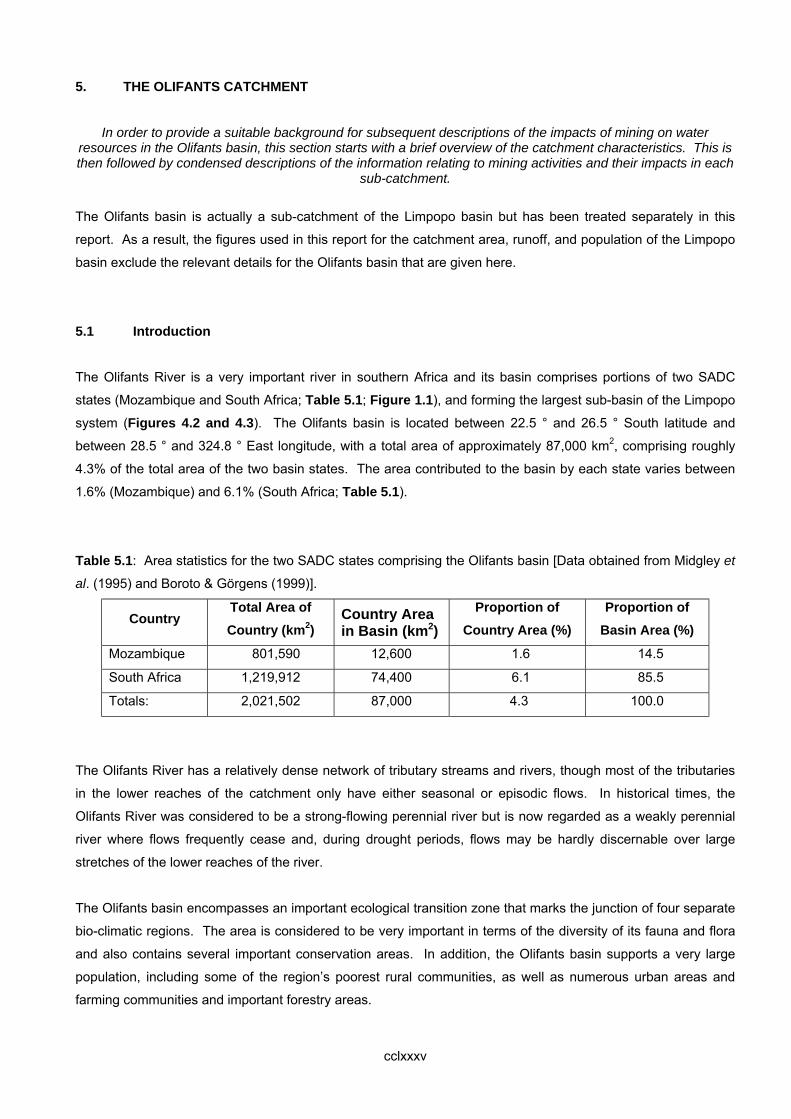
cclxxxv
5. THE OLIFANTS CATCHMENT
In order to provide a suitable background for subsequent descriptions of the impacts of mining on water resources in the Olifants basin, this section starts with a brief overview of the catchment characteristics. This is then followed by condensed descriptions of the information relating to mining activities and their impacts in each
sub-catchment.
The Olifants basin is actually a sub-catchment of the Limpopo basin but has been treated separately in this
report. As a result, the figures used in this report for the catchment area, runoff, and population of the Limpopo
basin exclude the relevant details for the Olifants basin that are given here.
5.1 Introduction
The Olifants River is a very important river in southern Africa and its basin comprises portions of two SADC
states (Mozambique and South Africa; Table 5.1; Figure 1.1), and forming the largest sub-basin of the Limpopo
system (Figures 4.2 and 4.3). The Olifants basin is located between 22.5 ° and 26.5 ° South latitude and
between 28.5 ° and 324.8 ° East longitude, with a total area of approximately 87,000 km2, comprising roughly
4.3% of the total area of the two basin states. The area contributed to the basin by each state varies between
1.6% (Mozambique) and 6.1% (South Africa; Table 5.1).
Table 5.1: Area statistics for the two SADC states comprising the Olifants basin [Data obtained from Midgley et
al. (1995) and Boroto & Görgens (1999)].
Country Total Area of Country (km2)
Country Area in Basin (km2)
Proportion of Country Area (%)
Proportion of Basin Area (%)
Mozambique 801,590 12,600 1.6 14.5
South Africa 1,219,912 74,400 6.1 85.5
Totals: 2,021,502 87,000 4.3 100.0
The Olifants River has a relatively dense network of tributary streams and rivers, though most of the tributaries
in the lower reaches of the catchment only have either seasonal or episodic flows. In historical times, the
Olifants River was considered to be a strong-flowing perennial river but is now regarded as a weakly perennial
river where flows frequently cease and, during drought periods, flows may be hardly discernable over large
stretches of the lower reaches of the river.
The Olifants basin encompasses an important ecological transition zone that marks the junction of four separate
bio-climatic regions. The area is considered to be very important in terms of the diversity of its fauna and flora
and also contains several important conservation areas. In addition, the Olifants basin supports a very large
population, including some of the region’s poorest rural communities, as well as numerous urban areas and
farming communities and important forestry areas.

cclxxxvi
5.1.1 Geology, topography and soils
The Olifants basin is located over the eastern lobe of the Kalahari Craton, forming the largest sub-basin of the
Limpopo basin. The Archaean Craton rocks comprise predominantly crystalline granitic and gneissic rocks,
intruded by various Greenstone belts as well as dolerite dykes and sills, and silicified sedimentary formations.
Karoo System rocks overlie large areas of the southwestern portion of the basin and these are also associated
with younger sedimentary and crystalline rocks consisting predominantly of sandstones, carbon-rich mudstones,
conglomerates and shales. Recent sedimentary deposits line most of the river valleys and provide important
farming areas (Du Toit, 1960).
In the western (South African) portion of the Olifants basin, the Bushveld Igneous Complex forms an extremely
important feature and contains a very large proportion of the region’s mineral wealth. The geological features of
this area consist mostly of basic mafic and ultramafic intrusive rocks, accompanied by extensive areas of acidic
and intermediate intrusive rocks. At the southern and eastern periphery of this area, large dolomite and
limestone formations occur, accompanied by extensive mineralization along their contact zones. Several areas
of the northern portion of the Olifants basin consist of various deposits of consolidated and unconsolidated
sedimentary rocks, with important belts of intrusive Greenstone rocks that are heavily mineralised.
The north-south trending rhyolites and lavas of the Lebombo Mountains mark the eastern border between South
Africa and Mozambique, and separate the South African and Mozambican portions of the basin. The eastern
(Mozambique) portion of the Olifants basin consists largely of unconsolidated and consolidated sedimentary
rocks with granitic intrusions exposed as erosional remnants in the landscape
In the southern portion of the basin, the extensive, carbon-rich sedimentary rocks of the Karoo System contain
enormous economic reserves of coal and are the site of intensive coal mining activities. Elsewhere, and
particularly prominent in the northern and eastern parts of the basin, harder, silicified sandstones and cherts, as
well as syenitic and granitic outcrops, form stack-like erosional remnants that protrude above the generally
undulating terrain (Du Toit, 1960).
The topography of the Olifants basin is extremely varied, ranging from approximately 150 metres above sea
level where it joins the Limpopo River in Mozambique, to over 2,000 metres in the mountainous region marking
the transverse position of the northern extension of the Drakensberg Mountains. Most of the basin consists of
relatively undulating terrain separated by ranges of steep-sided hills and mountains. The northeastward flowing
Olifants River and its major tributaries have incised deep gorges through the hills and mountain ranges that form
spectacular landscape units. Generally, the river valleys tend to be broad and flat-bottomed, with river channels
that are slightly or moderately incised into the surrounding parent material.
Several small sections of the northeastern parts of the Olifants basin (especially in the Shingwedzi and Letaba
sub-catchments) have very little or poor drainage, and are usually considered to be endorheic (internally
draining). These areas are often marked by the formation of clay-bottomed pans where rainfall collects and
evaporates to leave small deposits of salts. The drier northern and eastern portions of the Olifants basin are
generally subjected to mechanical (physical) weathering processes, in contrast to the predominance of chemical
weathering processes in the wetter headwater regions of most tributaries.

cclxxxvii
Soil formations across the Olifants basin reflect the strong influence of underlying parent rock material, climatic
features and biological activity. The dominant soil types in the basin are moderately deep sandy to sandy-clay
loams in the west and south, grading to shallower, sandy or gravely soils in the north and east. The deeper
loam soils are extremely important for agricultural activities and support extensive irrigation developments along
the Olifants River as well as many of its tributaries. A few areas of black vertisols in the southern and western
parts of the basin also support important agricultural developments.
The valley bottom soils along all of the tributary rivers and the Olifants main channel are generally of colluvial or
alluvial origin and support extensive areas of commercial and subsistence agriculture. In contrast, hilly or
steeply sloping areas tend to have fragile, shallow, stonier soils with less agricultural potential. In the endorheic
areas, most soils have a relatively high sodium and clay content and are dispersive.
5.1.2 Climatic features
Because of its geographic position, the prevailing wind systems, including tropical cyclones from the Indian
Ocean, have a strong influence on the climate of the Olifants basin. The most important of the rain-bearing
winds are the southeasterly wind systems that bring rainfalls from the Indian Ocean. In some years, unusual
southward movements of the Inter-Tropical Convergence Zone (ITCZ) have been sufficient to influence rainfalls
in the northern parts of the Olifants basin for short periods of time.
Air temperatures across the Olifants basin show a marked seasonal cycle, with hottest temperatures recorded
during the early Austral Summer months and lowest temperatures during the cool, dry winter months. Rainfalls
are also highly seasonal, falling predominantly as intense convective thunderstorms during the warmer summer
months. Rainfalls vary from as little as 400 mm per annum in the eastern parts of the Olifants basin, along the
border with Mozambique, to over 1,000 mm per annum on the Drakensberg Mountains. A sketch map showing
the distribution of mean annual rainfall over the Olifants and Limpopo basins is shown in Figure 4.1; this map
also shows the main tributaries of the Olifants River.
Evaporation rates across the Olifants basin are both high and variable, ranging from some 2.4-2.6 metres per
annum in the eastern areas of the basin to some 1.7 metres in the cooler, mountainous regions in the
southwestern portion of the basin. In view of these evaporation rates, and the quantity of rainfall received each
year, several portions of the Olifants basin show clear evidence of the dominance of physical weathering
processes (with Weinert N values greater than 5.0). These areas are located predominantly in the eastern and
northeastern portions of the basin and along the lower reaches of the Olifants valley. Virtually all of the rest of
the Limpopo basin is subject to chemical weathering processes, either seasonally (Weinert N values below 4.0)
or continually (Weinert N values below 2.0) (Weinert, 1964).
5.1.3 Population and land use patterns
The total population of the Olifants basin is estimated to be approximately 10.5 Million, with South Africans
comprising some 85% of the basin population (Table 5.2). The Olifants basin also contains a large proportion

cclxxxviii
of the population of South Africa’s Gauteng Province, as well as parts of the populations of the Northern and
Mpumalanga Provinces. The Olifants basin contains virtually all of the important coalmines and thermal power
stations, as well as critically important agricultural areas, towns and cities. Consequently, the Olifants basin is
correctly considered to house the energy heartland of South Africa.
Table 5.2: Population statistics for the two SADC states comprising the Olifants basin. [Data obtained from
SARDC (1996) and Basson et al. (1997)].
Country
Total Population of
Country (Millions)
Country Population in Basin (Millions)
Proportion of Country
Population (%)
Proportion of Basin Population
(%)
Mozambique 19.980 275,000 1.4 87.1
South Africa 43.421 1,850,000 4.3 12.9
Totals: 63.401 2,125,000 3.4 100.0
In Mozambique, the Olifants basin supports several scattered communities and small to moderate-sized
settlements, but no towns or cities; the Mozambican population of the Olifants basin is essentially rural in
character.
In contrast, the much larger South Africans sector of the Olifants basin supports several large and medium-
sized towns as well as numerous smaller communities and subsistence farmers. Throughout the South African
portions of the Olifants basin, a wide variety of mining operations as well as different forms of agriculture
(subsistence and commercial cultivation, game farming, livestock and dairy production) provide the economic
cornerstone for development in the basin.
Both South Africa and Mozambique have “skewed” population distributions, and experience large-scale
migration from rural areas to urban settlements. The Olifants basin in South Africa contains areas of extensive
rural and peri-urban populations that occupy former Apartheid self-governing “homelands”. As a consequence
of past iniquities, a large proportion of the basin’s population is extremely poor and lack access to basic services
and amenities such as clean water and adequate sanitation.
Similar to other parts of southern Africa, land is a critically important resource throughout the Olifants basin and
the livelihoods of residents and the national economies of both basin states depend on access to land (Chenje,
2000). However, the specific types of land use that are practiced in the basin are controlled by climatic factors,
water availability and, importantly, by land tenure arrangements. A large proportion of the land in the Olifants
basin is under communal or customary forms of tenure, and land ownership is considered to be one of the major
constraints to proper land use and conservation (Chenje, 2000).
Overcrowding and insecure ownership in the smaller communal farming areas (e.g. the Shingwedzi, Selati, and
Middle Olifants sub-catchments in the Olifants basin) is a primary source of land degradation in the basin. This
feature is a critically important driver of poverty within the Olifants basin and is associated closely with declining

cclxxxix
indices of per capita agricultural production (Dalal-Clayton, 1997). In many parts of the Olifants basin,
progressive urbanization has been accompanied by the development of peripheral “informal” settlements
around the major urban areas.
In stark comparison to the Zambezi Catchment, the South African and Mozambique portions of the Olifants
Catchment are relatively densely settled (Table 5.2). Whilst the Olifants basin does not contain any very large
cities, there are numerous medium- and small-sized towns and villages. In the Mozambique portion of the
basin, the population is more evenly spread and the only sizeable groups of people are those associated with
irrigation activities near the Massingir Dam and the nearby Chokwe Irrigation Scheme (which is located just
outside the Olifants basin).
5.1.4 Hydrological characteristics, water availability and patterns of water use
The quantity and timing of rainfall received in the Olifants basin controls the quantity, timing and duration of
flows in the different tributary rivers. The uneven distribution of rainfall in the basin is reflected in the very
uneven distribution of water resources in the different sub-catchments. In turn, these influence the types of
economic activities undertaken by the residents in each area. The uneven distribution of water across the
basin, coupled with increasing competition for the available water resources, has led to tensions and occasional
disputes between individuals and communities as to what can be considered as a “fair and equitable share” of
the available water resources (Ashton, 2000).
The Olifants River and its larger tributaries all exhibit marked seasonal cyclical patterns of high and low flows
and many of the smaller tributaries are entirely seasonal or episodic. In some, drier years, surface flows cease
in several tributaries though some water continues to flow in the deeper alluvial deposits. The northern and
eastern parts of the basin that receive the lowest rainfalls have many seasonal or episodic rivers that have no
surface flow during the dry winter months.
The demand for water throughout the Olifants basin is both high and unevenly spread. In particular, water
demands by industry, mining and especially the formal (irrigation) agricultural sector account for over 75% of all
water used. Coupled with high evaporation losses from the numerous small dams and larger water supply
impoundments, flows in the lower reaches of the Olifants River are usually relatively small, unless they have
been “boosted” by the arrival of a tropical cyclone (e.g. the cyclone that arrived in 2000 and flooded large
coastal areas of Mozambique).
The escalating competition for water and the continued water shortage in the upper reaches of the Olifants
basin prompted the importation of additional water supplies from the Vaal and Komati basins to the south.
These water supplies are seen to be essential for continued operation of the many thermal (coal-fired) power
stations and their satellite collieries. The overall water supply “picture” is made even more uncertain by the very
real possibility that global climate changes will also have an adverse effect on water availability throughout
southern Africa (Ashton, 2000).

ccxc
Throughout the length of the Olifants River and its tributaries, water quality is considered to be generally good
and the water is usually fit for most designated uses. However, several areas in the central and lower reaches
of the basin experience serious water quality problems due to increasing salinity, making the water less suitable
for irrigation purposes and for domestic use. In addition, most cities, towns and smaller communities discharge
untreated or partially treated domestic and industrial effluent into the various rivers (e.g. the cities and towns of
the Mpumalanga Highveld). As long as the waste material is innocuous and there is sufficient dilution, this
practice does not have long-term or large-scale detrimental effects. However, with increasing quantities of
effluent and declining river flows due to escalating demands for water, water quality problems now occur more
frequently. Water quality problems caused by seepages and effluent discharge tend to become more acute
further downstream, as more and more towns contribute their effluent to the total river flow and evaporative
concentration accentuates the effects of rising salinity and increasing eutrophication. Seepage losses or
discharges of effluent containing potentially toxic compounds compound these problems.
In some sub-catchments where the rivers are normally seasonal and only flow during the wet summer months,
effluent discharges and seepage from mining operations have transformed the river into a perennially flowing
system. In the case of a river such as the Selati, effluent discharges and seepage now comprises the entire dry
season flow of this river and often equal the flow in the lower Olifants River itself.
In addition to water abstracted for domestic use, large volumes of water are also withdrawn for irrigation; for
example: the extensive irrigation areas along the main stem of the Olifants River and many of its major
perennial tributaries. Most small-scale farmers have to rely either on red-fed agriculture or on water drawn from
shallow wells or nearby watercourses. Overall, the competition for the limited water resources available is likely
to become more intense in future.
The Olifants basin has been divided into a series of sub-catchments for the purposes of this study; these sub-
catchments are shown in Figures 4.2 and 4.3.
5.1.5 Water management systems and institutions
Both South Africa and Mozambique have their own water management systems and segments their respective
territories into Water Management Units or Water Management Areas. These divisions are normally in the form
of sub-catchments, though some of the larger sub-catchments may be further sub-divided.
In the South African sector of the Olifants basin, the South African Department of Water Affairs and Forestry
(DWAF) is the authority responsible for all aspects of water resource and water quality management. The
Department delegates the responsibility of water supply to communities and industries to Local Authorities or
Water Utilities wherever possible. In future, the Department will constitute formal Catchment Management
Agencies to deal with all aspects of water resource management and water supply. In Mozambique, the
equivalent functions are fulfilled by the Mozambique Department of Water.
The SADC Protocol on Shared Watercourse Systems provides an important legislative instrument that promotes
regional co-operation and collaboration amongst all SADC states. However, unequal institutional and

ccxci
professional capacity within the member states hampers full expression of this protocol. Since the Olifants
basin is considered to be a sub-basin of the Limpopo basin, South Africa and Mozambique are part of a larger
group of four basin states with have jointly formed a Joint Permanent Technical Commission (JPTC) to deal with
matters of common interest relating to the Limpopo River and all its tributaries. This Commission deals with
matters such as joint flow gauging exercises and inter-basin transfers, as well as dealing with proposed new
water development projects by each of the member states. This institutional arrangement appears to work well
at an operational level.
Both South Africa and Mozambique maintain their own system of meteorological and hydrological data collection, primarily for use at the national level. Whilst these systems are at very different levels of coverage,
the data does enable the basin states to collaborate on monitoring programmes and predict rainfall and runoff in the Olifants basin. Recent improvements in weather radar systems and satellite monitoring systems help to
expand and improve the regional coverage.
Nine sub-catchments have been recognized in the South African sector of the Olifants basin, with one additional
sub-catchment located in Mozambique. Both flow and water quality data for the South African sector of the
Olifants basin are obtainable from the Department of Water Affairs and Forestry (DWAF). No water quality or
flow data are available for the Mozambique sector of the Olifants basin.
5.1.6 Mining and mineral processing operations within the Olifants basin
There are a large number of mining operations exploiting a wide variety of minerals in the Olifants basin; the
locations of these operations are shown in Figure 4.2, whilst the mines located in the South African sector of
the Olifants basin are shown in more detail in Figure 4.3. In Mozambique, there are no mining operations
located within the Olifants basin.
Data on the type of mine, size, operational status and location of mining operations are presented in the
respective sections for each sub-catchment, along with inferences on potential impact. The high/medium/low
inference for potential impact was arrived at using the criteria in Table 1.3 and is discussed sub-catchment by
sub-catchment in the following sections. A summarizing overview of the actual and potential impacts on water
resources and water quality in each sub-catchment of the Olifants basin is given in Section 5.11.
In the following portions of this sections of the report that contain descriptions of the mining and mineral
processing activities in each sub-catchment, it is important to refer to Figures 4.2 and 4.3 for the positions of
the different sub-catchments within the Olifants basin.
5.2 The Wilge sub-catchment
5.2.1 General description
5.2.1.1 Hydrology
This sub-catchment consists of the area drained by the Wilge River and its tributary stream, down to the point
where the Wilge River joins the Olifants River immediately upstream of the Loskop Dam (Figure 4.2). The

ccxcii
Wilge River drains a relatively small area to the east of Pretoria and, primarily due to the continual release of
water from the dolomite and limestone formations, the streams and rivers are all perennial. Minor discharges of
treated domestic effluent from Bronkhorstspruit and Cullinan supplement flows in the Wilge River.
The sub-catchment contains one relatively large water supply dam (Bronkhorstspruit Dam), which supplies
domestic and industrial water to the town of Bronkhorstspruit, as well as irrigation water to the extensive areas
of irrigation downstream of the dam. In addition, the sub-catchment has numerous small farm dams that are
used to trap runoff in seasonal channels and supply this water for livestock watering.
There are also a very large number of small wetlands located along almost every stream and river in this sub-
catchment (Marneweck et al., 2001). These are formed at the uphill side of protruding dolerite formations
(typically dykes and sills) that dip gently to the south. These dolerite formations act as impermeable barriers
and water collects on their uphill sides, saturating the soils. The downstream end of each wetland is usually
marked by a dolerite exposure where the water reaches the ground surface and flows over the dolerite barrier.
This system of inter-connected wetlands provides an extremely important attenuation mechanism that ensures
water is released throughout the year, thereby maintaining perennial stream and river flows in this sub-
catchment.
5.2.1.2 Geology
In the upper reaches of the Wilge River, the geological features are characterized by the presence of extensive
dolomite and limestone formations surrounding and a small area of Karoo Supergroup rocks consisting of
consolidated layers of carbon-rich shales and intercalated arenaceous strata. Further downstream, centering
on the Bronkhorstspruit Dam, the sub-catchment is underlain by large areas of porous unconsolidated and
semi-consolidated sedimentary strata, principally quartzitic sandstones, and an area of Dwyka tillite. Close to
the confluence of the Wilge and Olifants rivers, a small area of acidic and intermediate intrusive granites of the
Waterberg Group underlies the northern portion of this sub-catchment.
The dolomite and limestone formations provide excellent aquifer characteristics and overly thick layers of
carbon-rich dolerites and shales of the Karoo Supergroup.
5.2.1.3 Pedology, agriculture and land use
Soils in the sub-catchment can be divided into five main groups: • Moderate to deep sandy loam soils on flat and undulating terrain overlying dolomite and limestone in the
upper reaches of the catchment;
• Moderate to deep sandy loam soils lining long stretches of the Wilge River valley in its middle reaches;
• Moderate to deep clay loam soils over much of the middle portions of the sub-catchment (located away from
the river channels), overlying the more porous unconsolidated sedimentary material; and
• Moderately shallow to moderately deep, clayey loam to clay-rich, fine-grained soils over most of the lower
reaches of the sub-catchment; and

ccxciii
• Dark grey to blackish, mottled vertisols located along low-gradient reaches of most streams and river
sections, forming characteristic wetland soils.
Most of the clayey loam soils are highly suitable for commercial agriculture when sufficient water is available.
Virtually all of the areas with suitable soils, particularly the area downstream of the Bronkhorstspruit Dam, are
contained within the jurisdiction of formal irrigation boards or Government Water Control Areas. Further away
from the main river channels, most of the land use is given over to small- and medium-scale livestock farming
operations. A relative small variety of crops are produced on the irrigated and rain-fed areas, primarily maize,
Lucerne, potatoes and sunflowers. Minor areas of plantation forestry (principally Wattle) are also located in the
wetter portions of the sub-catchment.
Several small towns (e.g. Bronkhorstspruit and Cullinan) and numerous smaller settlements and farming
communities are present in the upper reaches of the sub-catchment. Population numbers and density decline
with increasing distance from the upper reaches. Some light and heavy industry is present in the town of
Bronkhorstspruit, with many industries geared specifically to meeting the needs of the extensive mining sector in
the region.
5.2.1.4 Surface water users
All towns in the sub-catchment rely on water supplied from water supply reservoirs, principally the
Bronkhorstspruit Dam and, in the case of Cullinan, from the Rand water reticulation system. The larger
settlements are also being supplied with water to varying degrees by the Rand Water reticulation system.
Smaller settlements and farmsteads rely on boreholes for their water requirements. The Wilge and Kendal
thermal power stations are also supplied with water drawn from local water supplies.
The extensive irrigation areas downstream of the Bronkhorstspruit Dam consume most of the water used in the
sub-catchment. Extensive informal settlements have sprung up around the periphery of the urban centres;
these settlements lack access to basic services such as clean water supplies and suitable sanitation systems.
5.2.1.5 Water management systems
The South African Department of Water Affairs and Forestry (DWAF) is responsible for the management of all
aspects of water supply and water use in the sub-catchment. The Department operates a system of routine flow
gauging at the Bronkhorstspruit Dam and pays particular attention to monitoring the quantity of water supplied to
irrigation schemes and towns, as well as increasing attention to the quality of agricultural return flows and
effluent discharges to the Wilge River. The local irrigation board is responsible for the day-to-day management
of water allocations for irrigation.
5.2.1.6 Human impacts on water resources (excluding mining)

ccxciv
The following activities can be expected to have an impact on water resources in the Wilge sub-catchment:
• Landfills and solid waste disposal sites at all towns;
• Disposal of liquid (domestic and light industrial) effluent at all towns;
• Disposal or seepage of high salinity power station cooling water;
• Moderate volumes of runoff from towns, as well as all other urbanized areas;
• Non-point domestic effluent from numerous small settlements and farms;
• Minor non-point impact from non-intensive commercial or subsistence agriculture;
• Minor non-point impact of agricultural return flows from intensive irrigation areas; and
• Litter and domestic garbage discarded alongside the many roads and highways that traverse the sub-
catchment.
5.2.2 Mining and mineral processing operations
The following mining operations are of interest in the Wilge sub-catchment (Figures 4.2 and 4.3; Table 5.3).
Table 5.3: Mining operations in the Wilge sub-catchment.
Code Number
Name of Mine Commodity (ies) Mined
Status Relative Size
Probable Impact
C7-19 Marble Hall Limestone / Dolomite Operating Medium Low
D7-2 Pienarsrivier Limestone / Dolomite Operating Small Very low
D7-4 Vergenoeg Fluorspar Operating Large Low – Medium
D7-6 Nooitgedacht Clay minerals Operating Large Low
D7-8 Cullinan Clay minerals Operating Large Low
D7-10 Belfast Clay minerals Operating Small Very low
D7-11 Rietfontein Clay minerals Operating Small Very low
D7-39 Enkeldoring Gold Closed Small Very low
5.2.3 Alluvial mining
None known or anticipated.
5.2.4 Monitoring systems
The Department of Water Affairs and Forestry (DWAF) regularly monitor flows and water quality at the Bronkhorstspruit Dam, as well as two other sites further downstream. In addition, DWAF also regulate the
quantity and quality of all effluent discharges through a system of effluent discharge permits or licences. Each licensed effluent discharger is required to carry out a routine monitoring programme of the flow and quality of
their effluent and supply this to DWAF. The Department then conducts a randomised series of audit samples to check the veracity of the effluent returns submitted by each discharger.

ccxcv
5.2.5 Water quality data
No specific water quality data for this sub-catchment could be obtained in time for this report. In view of the very
limited mining activity, this deficiency is not considered to be important.
5.2.6 Implications for water quality and quantity management
The available evidence suggests that the limited mining and quarrying activities carried out in this catchment
would be likely to have very minor, localized impacts on the water resources of the sub-catchment. These
impacts would be likely to consist of very slight instances of acid mine drainage and an increase in suspended
sediment loads in nearby streams and rivers as soil is eroded from exposed areas. There is also a likelihood
that seepage of high salinity power station cooling water and seepage from coal ash dumps at the two thermal
power stations.
5.3 The Little Olifants - Riet sub-catchment
5.3.1 General description
5.3.1.1 Hydrology
The hydrological features of this sub-catchment are very similar to those of its eastern neighbour, the Wilge sub-
catchment. The Little Olifants - Riet sub-catchment consists of the area drained by the upper reaches of the
Olifants, Little Olifants and Riet rivers and their tributary streams, down to the point where the Olifants River
joins the Wilge River at the Loskop Dam (Figure 4.2). The Olifants, Little Olifants and Riet rivers drain a
relatively small area that includes the coal-mining towns of Witbank and Middelburg located to the east of
Pretoria. The sub-catchment receives additional water via three inter-basin transfer schemes from the Vaal,
Usutu and Komati systems, whilst relatively large discharges of treated domestic and industrial effluent from
Witbank and Middelburg supplement flows in the Olifants and Little Olifants rivers. All rivers and streams in this
sub-catchment are perennial.
The sub-catchment contains four water supply dams, one of which (Loskop Dam) also supplies water for the
extensive irrigation agriculture areas downstream of this sub-catchment. The other dams all supply domestic
and industrial water to the towns of Witbank and Middelburg as well as the numerous collieries and smaller
settlements in the sub-catchment. In addition, the sub-catchment has numerous small farm dams that trap
runoff in seasonal channels and supply this water for limited livestock watering.
The sub-catchment also contains an enormous number of small wetlands located every stream and river
(Marneweck et al., 2001). These are formed at the uphill side of protruding dolerite formations (typically dykes
and sills) that dip gently to the south. These dolerite formations act as impermeable barriers and water collects
on their uphill sides, saturating the soils. The downstream end of each wetland is usually marked by a dolerite
exposure where the water reaches the ground surface and flows over the dolerite barrier. This system of inter-

ccxcvi
connected wetlands provides an extremely important attenuation mechanism that ensures water is released
throughout the year, thereby maintaining perennial stream and river flows in this sub-catchment. However,
mining activities (blasting, ground clearing, overburden stripping, acid mine drainage) have damaged or broken
several of these dolerite formations in recent years. This has resulted in increased summer flows, reduced
attenuation and therefore lower winter flows, and a steady decline in water quality in downstream reaches
(Toerien et al., 1980; Johnson & Du Toit, 1997; Hodgson & Krantz, 1999; Marneweck et al., 2001).
5.3.1.2 Geology
In the upper reaches of the Little Olifants, Riet and Olifants rivers, the geological features consist almost entirely
of rocks of the Ecca Group and Dwyka Formation of the Karoo Supergroup. The Ecca Group rocks consist of
consolidated layers of silicified sandstone, shale and coal, together with interbedded mudstones, siltstones and
shales. The important Witbank and Highveld coal deposits located near to the town of Witbank form the centre
of this group. Rocks of the Dwyka Formation, principally tillite, shale and siltstones, underlie the Ecca Group
rocks. Extensive dolerite dykes and sills have intruded both of these formations.
The northern part of this sub-catchment is underlain by acid and intermediate intrusive formations of the
Waterberg Group, as well as by mafic and ultramafic intrusive formations. Small areas of dolomite and
limestone, as well as silicified sandstone are also found in the northern reaches of this sub-catchment.
5.3.1.3 Pedology, agriculture and land use
Soils in the sub-catchment can be divided into five main groups: • Shallow to moderately deep sandy-clay loam soils on flat and undulating terrain overlying rocks of the Ecca
Group, principally shales and silicified sandstones, in the upper reaches of the catchment;
• Moderate to deep sandy loam soils lining long stretches of the Olifants River valley in its middle reaches;
• Moderate to deep clay loam soils over much of the lower portions of the sub-catchment (located away from
the river channels), overlying the more porous unconsolidated sedimentary material;
• Moderately shallow to moderately deep, clayey loam to clay-rich, fine-grained soils over granitic areas in the
lower reaches of the sub-catchment; and
• Dark grey to blackish, mottled vertisols located along low-gradient reaches of streams and river sections in
the upper reaches of the sub-catchment, forming characteristic wetland soils.
Most of the soils are highly suitable for commercial agriculture when sufficient water is available. Virtually all of
the areas with suitable soils, particularly the area downstream of the Loskop Dam, are contained within the
jurisdiction of formal irrigation boards or Government Water Control Areas. Further away from the main river
channels, and downstream of the coal mining operations in the upper parts of the sub-catchment, land use is
given over to small- and medium-scale livestock farming operations. A relative small variety of crops are
produced on the irrigated and rain-fed areas, primarily maize, lucerne, potatoes and sunflowers.

ccxcvii
Several towns (e.g. Witbank and Middelburg) and numerous smaller settlements and farming communities are
present in the upper reaches of the sub-catchment. Population numbers and density initially decline with
increasing distance from the upper reaches, and then increase again in the intensively farmed irrigation areas.
Light and heavy industry is present in the towns of Witbank and Middelburg, with many industries geared
specifically to meeting the needs of the extensive coal-mining sector in the region.
5.3.1.4 Surface water users
All towns, mines, power stations and industries in the sub-catchment rely on water supplied from water supply
reservoirs. Additional water is brought into the sub-catchment via inter-basin transfer schemes from the Komati,
Usutu and Vaal systems, principally to meet the large volumes requirements of the eight power stations located
in this sub-catchment. Smaller settlements and farmsteads, particularly those in the lower reaches of the sub-
catchment, rely on boreholes for their water requirements.
The extensive irrigation areas downstream of the Loskop Dam consume most of the water used in the lower
reaches of this sub-catchment. Extensive informal settlements have sprung up around the periphery of the
urban centres (e.g. Witbank and Middelburg). These settlements lack access to basic services such as clean
water supplies and suitable sanitation systems.
5.3.1.5 Water management systems
The South African Department of Water Affairs and Forestry (DWAF) is responsible for the management of all
aspects of water supply and water use in the sub-catchment. The Department operates a system of routine flow
gauging at the Loskop Dam, and other water supply dams, and pays particular attention to monitoring the
quantity of water supplied to irrigation schemes and towns, as well as increasing attention to the quality of
agricultural return flows and effluent discharges to the Wilge River. The irrigation boards are responsible for the
day-to-day management of water allocations for irrigation.
Each coalmine and thermal power station also collaborates in the management of their water supplies and in
the disposal of their wastes and effluents. At present, no cost-effective cure is available for the problems
associated with the extensive acid mine drainage that characterizes seepage and discharges from the collieries
in the Witbank and Highveld coal-mining areas. All of the mining companies who are active in this area
collaborate actively in joint research programmes to devise solutions for this perennial problem. At the present
time, a very ambitious project, named “COALTECH 2020” has been launched to discover alternative ways of
dealing with the variety of problems faced by collieries in this area, and to extend the economic lifespan of the
mines (Beukes, 2000). This programme involves representatives from 15 international and 15 national
organizations, including all the major mining houses, the Department of Water Affairs and Forestry, the
Department of Mineral and Energy Affairs, The Department of Environmental Affairs and Tourism, the CSIR and
academia (three South African universities). This concerted, collaborative approach has already led to
improvements in both the understanding of the various problems and in the management of some of the water
problem areas.

ccxcviii
5.3.1.6 Human impacts on water resources (excluding mining)
The following activities can be expected to have an impact on water resources in the Little Olifants - Riet sub-
catchment:
• Landfills and solid waste disposal sites at all towns;
• Disposal of liquid (domestic, light and heavy industrial) effluent at all towns;
• Seepage from power station ash dumps;
• Disposal or seepage of high salinity power station cooling water;
• Moderate volumes of runoff from towns, as well as all other urbanized areas;
• Non-point domestic effluent from numerous small settlements and farms;
• Minor non-point impact from non-intensive commercial or subsistence agriculture;
• Non-point impact of agricultural return flows from intensive irrigation areas; and
• Litter and domestic garbage discarded alongside the many roads and highways that traverse the sub-
catchment.
Examples of the types of effluents that are discharged into this sub-catchment are shown in Table 5.4, which list
the water quality characteristics of four sewage treatment plant effluents.
Table 5.4: Representative water chemistry data for four major sewage treatment works in the Little Olifants –
Riet sub-catchment. (Data taken from Hodgson & Krantz, 1999).
Sewage Works Name Parameter Middelburg Naauwpoort Ferrobank Riverview PH 7.7 7.9 7.8 7.9
Total Dissolved salts 385 562 618 628
Suspended Solids 1.0 6.4 13.2 11.6
Electrical Conductivity 76 93 96 99
C.O.D. 3.0 53 55 64
Na - 88 108 96
K - 15 13 22
SO4 250 182 249 192
Cl 62 45 54 79
Total Alkalinity 130 182 124 210
NH4-N 0.6 4.8 9.6 21
NO3+NO2-N 4.8 0.1 6.3 0.4
PO4-N 4.3 2.1 5.8 7.8
These treated sewage effluents will result in eutrophication of the receiving waters and will probably render the
water unfit for domestic consumption and irrigation on sensitive soils.
5.3.2 Mining and mineral processing operations

ccxcix
The following mining operations are of interest in the Little Olifants and Riet sub-catchment (Figures 4.2 and 4.3; Table 5.5).
Table 5.5: Mining operations in the Riet and Little Olifants sub-catchments.
Code Number
Name of Mine Commodity (ies) Mined
Status Relative
Size Probable Impact
C7-18 Black Wattle Copper Operating Medium Low
D7-18 Vaalbank Coal Operating Small Low - Medium
D7-26 Rondebult Coal Operating Small Low – Medium
D7-27 Elandsfontein Coal Operating Small Low – Medium
D7-28 Landau Coal Operating Medium Medium – High
D7-29 Arnot Coal Operating Medium Medium – High
D7-30 Strathrae Coal Operating Small Low – Medium
D7-32 Greenside Coal Operating Medium Medium – High
D7-33 Middelburg Coal Operating Large High
D7-34 Duvha Coal Operating Medium Medium – High
D7-35 Douglas Coal Operating Medium Medium – High
D7-36 Arnot Optimum Coal Operating Large High
D7-41 Rooikraal Copper Closed Small Very low
D7-42 Kruisrivier Copper Closed Small Very low
D7-43 Kameeldoring Copper Closed Very small Very low
E7-1 Waterpan Coal Operating Small Low - Medium
E7-2 Bank Coal Operating Medium Medium – High
E7-3 Kleinkoppie Coal Operating Medium Medium – High
E7-5 Tweefontein Coal Operating Medium Medium – High
E7-6 Phoenix Coal Operating Medium Medium – High
E7-7 Goedehoop Coal Operating Medium Medium – High
E7-8 Koornfontein Coal Operating Medium Medium – High
E7-9 Sterling Dimension stone Operating Small Very low
E7-11 Boschmans Coal Operating Medium Medium – High
E7-12 Khutala Coal Operating Medium Medium – High
E7-14 Kriel Coal Operating Small Low – Medium
E7-15 Leeuwfontein Coal Operating Small Low – medium
E7-16 Stuart Coal Coal Operating Small Low – Medium
E7-17 Delmas Silica Dimension stone Operating Small Very low
E7-18 Leeuwpan Coal Operating Small Low – Medium
E7-19 Tavistock Coal Operating Small Low – Medium
E7-22 Matla Coal Operating Medium Medium – High

ccc
5.3.3 Alluvial mining
None known and none anticipated.
5.3.4 Monitoring systems
The Department of Water Affairs and Forestry (DWAF) regularly monitor flows and water quality at the Loskop Dam, as well as other upstream and downstream sites. In addition, DWAF also regulate the quantity and quality
of all effluent discharges through a system of effluent discharge permits or licences. Each licensed effluent discharger is required to carry out a routine monitoring programme of the flow and quality of their effluent and
supply this to DWAF. The Department then conducts a randomised series of audit samples to check the veracity of the effluent returns submitted by each discharger.
5.3.5 Water quality data
A selection of water quality data have been obtained to demonstrate some of the different effects that deep
versus shallow coal mining has on water quality, and to show the changes that take place when mine water
seeps, or is discharged into, surface streams (Table 5.6).
Table 5.6: Selected water chemistry data for water samples from a deep underground coal mine, a shallow
underground coal mine and three surface water (stream) samples collected at different distances from their
shallow underground coalmine source. (Data adapted from Hodgson & Krantz, 1999).
Sampling Sites
Parameter Deep
Underground Mine
Shallow Underground
Mine
Surface Flow (Close to source)
Surface Flow (0.75 km
from source)
Surface Flow (1.5 km from
source) pH 8.06 6.78 3.41 3.20 3.12
EC (mS/m) 164 228 120 212 219
Ca 186 561 60 139 144
Mg 89 107 38 83 91
Na 120 15 46 44 40
Cl 13 3 66 52 44
SO4 910 1,767 562 1,460 1,509
Al - < 0.1 27 110 107
Co - 0.04 0.92 1.63 1.58
Fe - 21 2.7 5.6 11.8
Mn - 3.2 25.5 37.5 36.7
Ni - 0.1 0.39 1.13 0.94
Zn - 0.36 0.74 2.05 1.95

ccci
5.3.6 Implications for water quality and quantity management
The available evidence suggests that the extensive areas of coal mining in this sub-catchment have had, and
will continue to have, very high impacts on the sub-catchment’s water resources and particularly, the water
quality of all streams and rivers. The primary cause of these impacts is the extensive acid mine drainage where
water of low pH, with high concentrations of total dissolved salts and metals, enters local water courses and
results in a complete change in the water chemistry. The large volumes of acid mine drainage and the long
period of time over which these discharges and seepages have taken place has resulted in the impacts still
being discernable (as altered water chemistry characteristics) over two hundred kilometres downstream from
the Witbank and Highveld Coalfields
These effects are also accentuated by seepages from power station ash dumps, as well as effluent discarded
by different industries, including the Highveld Steel Plant and various foundry operations. The small, closed
copper mining operations in the lower reaches of this sub-catchment have no impacts on the basin’s water
resources.
One of the positive aspects of increased salinity values caused by acid mine drainage is that the increased salt
concentrations tend to diminish the presence of suspended sediments in local streams and rivers by auto-
flocculating sediments.
Overall, the serious nature of the impacts caused by mining or attributable to mining in this sub-catchment has
been the subject of concerted research and management attention for several years. The latest development
has been the launching of the COALTECH 2020 programme that seeks to harness the collaborative efforts of all
role players in a concerted attempt to derive appropriate and cost-effective management strategies that will help
to resolve these problems.
5.4 The Middle Olifants sub-catchment
5.4.1 General description
5.4.1.1 Hydrology
This sub-catchment comprises the portion of the Olifants basin between Loskop Dam and the junction of the
Selati and Olifants rivers. It receives upstream inflows from the Wilge and Little Olifants-Riet sub-catchments,
as well as the Steelpoort and Blyde sub-catchments. Within this sub-catchment, the most important tributaries
are the perennial Elands, Moses, Selons, Bloed and Makhutswi rivers, whilst several smaller tributaries, both
perennial and seasonal or episodic, enter from the north-west and south-east.
One very large impoundment on the Olifants River, the Mogoma Matlala (Arabie) Dam, provides water supplies
to numerous small towns and settlements in the sub-catchment, as well as large volumes of water for irrigation
schemes along both banks of the Olifants River. Nine other medium-sized dams are also located in this sub-
catchment and supply water for domestic use and for irrigation. Many of the mines and industries in this sub-

cccii
catchment, as well as numerous small and large settlements, rely on water supplied from these ten dams, or
use local boreholes or direct run-of-river abstraction from perennial rivers and streams. There are also over 500
small farm dams located in this sub-catchment and these trap water for domestic purposes and for limited areas
of small-scale irrigation, as well as livestock watering.
Flow patterns in this portion of the Olifants River are relatively stable as they are controlled by water releases
from the Loskop Dam, as well as from the Mogoma Matlala and Arabie dams. This sub-catchment receives
relatively low rainfalls (average 600 mm per year) because large portions of the sub-catchment are located in a
rain shadow zone. The large volumes of water that are used for irrigation, combined with high rates of
evaporative loss, result in relatively low outflows from this sub-catchment to the Phalaborwa Barrage. In
addition, severe veld degradation over several decades has resulted in extensive areas of soil erosion. As a
consequence of this, the Olifants River carries large loads of suspended sediments. Much of this sediment is
trapped by the larger impoundments, reducing their effective storage volume. A case in point is the relatively
small Phalaborwa Barrage (with a full supply capacity of 11 million cubic metres); this impoundment normally
has 60-70% of its volume taken up by accumulated sediments. During periods of high flows in the Olifants
River, the Phalaborwa Water Board opens the scour gates at the Phalaborwa Barrage in an attempt to flush out
some of the accumulated sediments. This results in extremely high concentrations of suspended sediments
(55,000 – 70,000 mg/litre) further downstream in the Kruger National Park. In turn, the Massingir Dam in
Mozambique traps these sediments and gradually loses its effective storage volume.
5.4.1.2 Geology
The geological features of this sub-catchment consist of a variety of different formations of greatly differing ages
and compositions. The upper (south-western) reaches of this sub-catchment are underlain by the acid and
intermediate intrusive rocks of the Waterberg Group, as well as small areas of mafic and ultramafic formations.
The western portion of the sub-catchment is underlain by extensive Karoo Supergroup formations, principally
basalts of the Lebombo Group and Clarens Formation sandstones, with smaller areas of Ecca Group shales,
siltstones and mudstones. The central and eastern portions of this sub-catchment are underlain by a variety of
rocks of the Bushveld igneous Complex. The most important of these are the Lebowa Granite suite to the
south, with outcrops of the Rashoop Granophyre Suite, followed by rocks of the Rustenburg Layered Suite
further to the north and east. Much of the northern portion of this sub-catchment is underlain by rocks of the
Transvaal Sequence, with the silicified sandstones and quartzites of the Black Reef Quartzite Formation being
very prominent, together with Chuniespoort dolomites and Pretoria group shales, hornfels and quartzites.
These rock formations form the spectacular rock formations of the Drakensberg Mountain range through which
the Olifants River has cut a steep-sided gorge. Quartzitic rocks of the Pretoria Group also outcrop at several
points in the central portions of this sub-catchment.
In the most easterly portion of this sub-catchment, granitic and gneissic rocks of the Basement Complex
underlie most of the area east and north of the Drakensberg Mountains. These formations have been intruded
by rocks of the Gravelotte Group (part of the Murchison Sequence) and Rooiwater Complex. Here, quartzites,
schists, basic lava and granitic rocks dominate the Gravelotte Group lithology, whilst easily erodable felsites and
gabbros dominate the Rooiwater Complex lithology.

ccciii
5.4.1.3 Pedology, agriculture and land use
Soils in the sub-catchment can be divided into six main groups: • Shallow to moderately deep sandy-clay loam soils on flat and undulating terrain overlying rocks of the Ecca
Group, principally shales and silicified sandstones, in the western reaches of the catchment;
• Deep, black, blocky vertisols of the Springbok Flats in the south-western and western regions;
• Moderate to deep sandy loam soils lining long stretches of the Olifants River valley in its middle reaches;
• Shallow, sandy to sandy loam soils overlying granitic rocks of the Lebowa Granite Suite in the south-eastern
portions of the sub-catchment;
• Moderate to deep clay loam soils over much of the lower portions of the sub-catchment (located away from
the river channels), overlying the more porous unconsolidated sedimentary material; and
• Moderately shallow to moderately deep, clayey loam to clay-rich, fine-grained soils over granitic areas in the
lower reaches of the sub-catchment.
Most of the soils are suitable for commercial agriculture when sufficient water is available. Virtually all of the
areas with suitable soils, particularly the area downstream of the Loskop and Arabie dams, are contained within
the jurisdiction of formal irrigation boards or Government Water Control Areas. Further away from the main river
channels, land use is given over to small- and medium-scale livestock farming operations. A relatively wide
variety of crops are produced on the irrigated and rain-fed areas, primarily maize, wheat, sorghum, cotton,
tobacco, lucerne, potatoes, vegetables, sunflowers and soya bean. Large-scale citrus estates and sub-tropical
fruit orchards are located in the northern (e.g. Zebediela Estate) and north-eastern portions of the sub-
catchment. The black vertisols of the Springbok Flats area are highly productive and most irrigation water is
provided from high-yielding boreholes. This region is perhaps the most economically important agricultural area
in the sub-catchment.
Large areas of the former Lebowa are given over to small-scale cattle ranching and the raising of goats and
donkeys. Much of the stock-rearing area in the central portions of this sub-catchment has been heavily
overgrazed and soils erosion is very prevalent.
Several towns (e.g. Marble Hall, Roedtan and Lebowakgomo) and numerous smaller settlements and farming
communities are present in the upper and middle reaches of the sub-catchment. Population numbers and
density are greatest in the upper and central reaches of this sub-catchment and decline somewhat towards the
downstream reaches. Some light industry is present in the towns of Marble Hall and Roedtan and these
industries are geared specifically to meet the needs of the extensive agricultural in the sub-catchment.
5.4.1.4 Surface water users
All the towns in the sub-catchment rely on water supplied from the small and large water supply impoundments.
In contrast, most of the numerous settlements in the sub-catchment have to rely on water supplied from
boreholes, springs, and hand-dug wells or from run-of-river abstraction points. The large areas of irrigation

ccciv
agriculture consume most of the water used in the upper and central reaches of the sub-catchment. Formal
irrigation boards control the allocation of water to each of the irrigation schemes in the sub-catchment.
Contamination of local water resources by faecal coliform bacteria is a consequence of inadequate sanitation
and the simultaneous use of water resources for domestic supplies and stock watering. Most of the mines and
industries in the sub-catchment rely on water supplies from local boreholes.
5.4.1.5 Water management systems
The South African Department of Water Affairs and Forestry (DWAF) is responsible for the management of all
aspects of water supply and water use in the sub-catchment. The Department operates a system of routine flow
gauging at the Arabie Dam and other water supply dams, and pays particular attention to monitoring the
quantity of water supplied to irrigation schemes and towns, as well as increasing attention to the quality of
agricultural return flows and effluent discharges to the Olifants River. The various irrigation boards are
responsible for the day-to-day management of water allocations for irrigation.
5.4.1.6 Human impacts on water resources (excluding mining)
The following activities can be expected to have an impact on water resources in the Middle Olifants sub-
catchment:
• Landfills and solid waste disposal sites at all towns and larger settlements;
• Disposal of liquid (domestic, light and heavy industrial) effluent at all towns;
• Moderate volumes of runoff from towns, as well as all other urbanized areas;
• Non-point domestic effluent from numerous small settlements and farms;
• Minor non-point impact from non-intensive commercial or subsistence agriculture;
• Non-point impact of agricultural return flows from intensive irrigation areas; and
• Litter and domestic garbage discarded alongside the many roads that traverse the sub-catchment.
Examples of the types of effluents that are discharged into this sub-catchment are shown in Table 5.7, which list
the water quality characteristics of four sewage treatment plant effluents.
Table 5.7: Water quality data for three sites on the Olifants River in the Middle Olifants sub-catchment. [All
data are given in mg/litre, except pH (log units) and electrical conductivity (mS/metre)].
Parameter Loskop Outflow Olifantspoort Rooipoort pH 7.3 8.0 8.0
Conductivity 150 140 120
TDS 1105 900 800
Ca 75 60 45
Mg 60 55 50
Na 240 200 160

cccv
K 5.5 5 4.5
Cl 380 350 200
F 1.0 1.0 0.9
SO4 155 100 80
Total Alkalinity 200 170 180
NH4-N 0.06 0.05 0.05
NO3-N 1.3 1.2 0.8
PO4-P 0.03 0.02 0.02
These data reflect the important influence of agricultural return flows in the upper and central reaches of this
sub-catchment, as well as the dilution effect due to inflows of better quality water downstream of the
Olifantspoort sampling site.
5.4.2 Mining and mineral processing operations
The following mining operations are of interest in the Middle Olifants sub-catchment (Figures 4.2 and 4.3;
Table 5.8).
Table 5.8: Mining operations in the Middle Olifants sub-catchment.
Code Number
Name of Mine Commodity (ies) Mined
Status Relative Size
Probable Impact
B7-13 Kopermyn Gold Closed Small Very low
B7-18 Doornfontein Gold Closed Very small Very low
C7-4 Mont Mare Gold Closed Very small Very low
C7-5 Marsfontein Diamond - kimberlite Operating Small Very low
C7-6 Hoegenoeg Andalusite Operating Medium Very low
C7-7 Lebowa Kgomo Manganese Closed Small Very low
C7-8 Pelongwe Chrome, Platinum Prospecting Small Very low
C7-9 Wonderboom Platinum Prospecting Small Very low
C7-10 Seogeng Quarry Clay minerals Operating Very small Very low
C7-11 Klipspringer Diamond - kimberlite Operating Small Very low
C7-12 Inca Limestone / Dolomite Operating Small Very low
C7-13 Calais Clay minerals Operating Medium Very low
C7-14 Karkaw Limestone / Dolomite Operating Medium Very low
C7-17 Stavoren Zinc, Tin Closed Small Very low
C7-24 Sekhukune Andalusite Prospecting Small Very low
C7-26 Lebowa Platinum Chrome, Platinum Operating Large Medium – High
C8-2 Freddies Feldspar Operating Medium Low
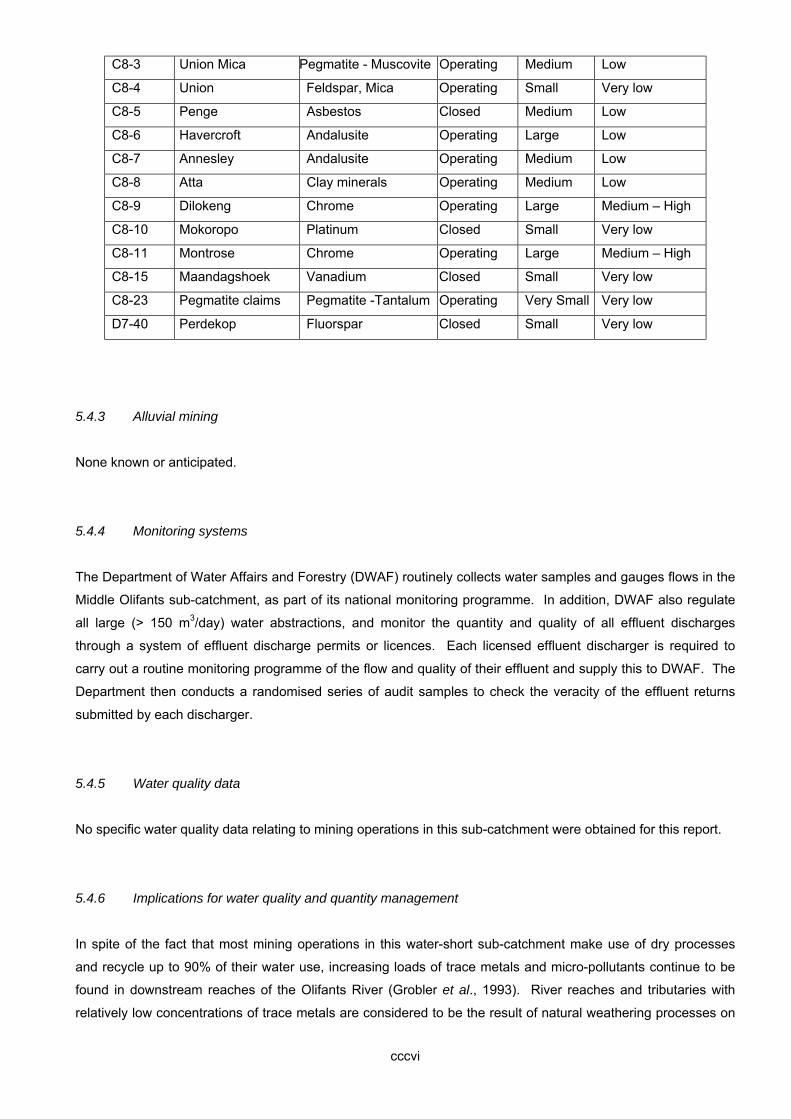
cccvi
C8-3 Union Mica Pegmatite - Muscovite Operating Medium Low
C8-4 Union Feldspar, Mica Operating Small Very low
C8-5 Penge Asbestos Closed Medium Low
C8-6 Havercroft Andalusite Operating Large Low
C8-7 Annesley Andalusite Operating Medium Low
C8-8 Atta Clay minerals Operating Medium Low
C8-9 Dilokeng Chrome Operating Large Medium – High
C8-10 Mokoropo Platinum Closed Small Very low
C8-11 Montrose Chrome Operating Large Medium – High
C8-15 Maandagshoek Vanadium Closed Small Very low
C8-23 Pegmatite claims Pegmatite -Tantalum Operating Very Small Very low
D7-40 Perdekop Fluorspar Closed Small Very low
5.4.3 Alluvial mining
None known or anticipated.
5.4.4 Monitoring systems
The Department of Water Affairs and Forestry (DWAF) routinely collects water samples and gauges flows in the
Middle Olifants sub-catchment, as part of its national monitoring programme. In addition, DWAF also regulate
all large (> 150 m3/day) water abstractions, and monitor the quantity and quality of all effluent discharges
through a system of effluent discharge permits or licences. Each licensed effluent discharger is required to
carry out a routine monitoring programme of the flow and quality of their effluent and supply this to DWAF. The
Department then conducts a randomised series of audit samples to check the veracity of the effluent returns
submitted by each discharger.
5.4.5 Water quality data
No specific water quality data relating to mining operations in this sub-catchment were obtained for this report.
5.4.6 Implications for water quality and quantity management
In spite of the fact that most mining operations in this water-short sub-catchment make use of dry processes
and recycle up to 90% of their water use, increasing loads of trace metals and micro-pollutants continue to be
found in downstream reaches of the Olifants River (Grobler et al., 1993). River reaches and tributaries with
relatively low concentrations of trace metals are considered to be the result of natural weathering processes on

cccvii
local geological formations. High concentrations of the same trace metals in other river reaches are attributed
to the consequences of mining activities.
In some areas, complaints have been voiced about the prevalence of asbestos fibres in water used for domestic
consumption and laundry purposes. This is probably due to rain-induced erosion of waste rock dumps at the
closed Penge Asbestos Mine.
5.5 The Steelpoort sub-catchment
5.5.1 General description
5.5.1.1 Hydrology
This sub-catchment consists of the area drained by the Steelpoort River and its main tributaries, the Klip,
Dwars, Waterval and Spekboom rivers (Figure 4.2). All of these tributary rivers are perennial and rise on the
western slopes of the north-south trending Drakensberg Mountains and flow north-north-eastwards where they
join. The Steelpoort River then flows north-eastwards through a gorge in the escarpment before joining the
middle reaches of the Olifants River. Ground water inflows from the Chuniespoort dolomites provide an
important component of the water in the Steelpoort River.
Two small impoundments on the Dwars River provide water supplies to numerous small towns and settlements
in the sub-catchment. Most of the mines and industries, as well as several settlements, rely either on ground
water supplies via boreholes or direct run-of-river abstraction from the perennial rivers and streams in the sub-
catchment. Several small farm dams in the upper reaches of the Steelpoort River and its tributaries trap water
for domestic purposes and for limited areas of commercial irrigation along the Steelpoort valley, as well as
livestock watering.
Flow patterns in the upper reaches of the Steelpoort River and its tributaries are relatively stable as these rivers
drain an area that receives some of the highest rainfalls recorded in South Africa (average rainfalls in the
headwater regions of these two rivers exceeds 1,100 mm per year). Whilst all the rivers are perennial, flows
increase during the summer months when rain is received. Smaller tributary streams in the upper reaches are
also perennial, though their flows are more variable.
5.5.1.2 Geology
The underlying geological formations beneath the Steelpoort sub-catchment consist predominantly of basic
rocks of the Bushveld Igneous Complex, consisting predominantly of magnetite-rich gabbros, norites,
anorthosites, pyroxenites and gabbroic rocks of the Rustenburg Layered Suite (RLS). These rocks form the
base of the relatively flat-bottomed valley areas as well as forming the watershed marked by the steep-sided,
more mountainous or hilly terrain to the east and west of the Steelpoort River.

cccviii
The mountainous area located to the northeast of the sub-catchment (close to the confluence of the Steelpoort
and Olifants rivers) consists predominantly of erosion-resistant quartzites shales and silicified shales of the
Transvaal Sequence. These rocks form steep-sided hills and cliffs with little surface soil.
The Steelpoort Valley itself is a steep-sided valley that trends in a predominantly northeasterly direction as a
result of the Steelpoort Fault. This regional structure appears to have been exploited by the Steelpoort River
during its evolution. The valley floor is covered with extensive, deep deposits of colluvium (hillwash), with more
recent (Quaternary) alluvial deposits located on the flood terraces on either side of the Steelpoort River.
5.5.1.3 Pedology, agriculture and land use
Soils in the sub-catchment can be divided into three main groups:
• Moderate to deep, stony sandy-clay loam soils on the foot slopes, as well as the sloping and undulating
terrain in the upper reaches of the sub-catchment;
• Shallow to moderately deep clayey loam soils lining the valley bottoms in the middle reaches of the sub-
catchment; and
• Shallow to moderately deep fine to coarse sandy alluvial soils lining flood terraces on either side of the river
channels, particularly in the central and lower reaches of the sub-catchment.
Most of the clayey loam soils in the upper and central parts of the sub-catchment are very suitable for cultivation
and extensive rain-fed and irrigation agriculture is practiced in these regions. Water is pumped either directly
from the Steelpoort River or from small storage dams on tributary streams for small-scale irrigation. Minor use
is made of borehole water for irrigation, especially in the central and lower reaches, due to problems with
vanadium contamination and possible toxicity. Further away from the main channel of the Steelpoort River, land
use consists almost entirely of small- and medium-scale livestock (dairy and beef cattle) farming.
A few towns and several small settlements are located in the upper and middle reaches of the sub-catchment,
though population densities become much lower in the lower reaches of the sub-catchment. The central and
western portions of this sub-catchment support several small-scale subsistence farmers.
5.5.1.4 Surface water users
All the relatively small towns in the Steelpoort sub-catchment rely on water supplied from the water supply
impoundments. In contrast, most of the numerous settlements in the sub-catchment have to rely on water
supplied from boreholes, springs, and hand-dug wells or from run-of-river abstraction points. The areas of
irrigation agriculture consume moderate quantities of water in the upper and central reaches of the sub-
catchment. Formal irrigation boards control the allocation of water to each of the irrigation schemes in the sub-
catchment. Most of the mines and industries in the sub-catchment rely on water supplies from local boreholes.
5.5.1.5 Water management systems

cccix
The South African Department of Water Affairs and Forestry (DWAF) is responsible for the management of all
aspects of water supply and water use in the Steelpoort sub-catchment. The Department operates a system of
routine flow gauging at the major water supply dams and reservoirs, and pays particular attention to monitoring
the quantity of water supplied to irrigation schemes and towns, as well as increasing attention to the quality of
agricultural return flows and effluent discharges to the Steelpoort River. The various irrigation boards are
responsible for the day-to-day management of water allocations for irrigation.
5.5.1.6 Human impacts on water resources (excluding mining)
The following activities can be expected to have an impact on water resources in the Steelpoort sub-catchment:
• Small landfills and solid waste disposal sites at all towns and larger industries;
• Disposal of liquid (domestic) effluent at all towns and industries;
• Small volumes of runoff from the towns and urbanized areas;
• De-vegetation and other forms of veld degradation, leading to increased erosion and loads of suspended
sediments in most streams and rivers;
• Non-point domestic effluent from numerous small settlements and farms;
• Minor non-point impact from non-intensive commercial or subsistence agriculture;
• Minor non-point impact of agricultural return flows from intensive irrigation areas; and
• Litter and domestic garbage alongside the roads that traverse the sub-catchment.
5.5.2 Mining and mineral processing operations
The following mining operations are of interest in the Steelpoort sub-catchment (Figures 4.2 and 4.3; Table 5.9).
Table 5.9: Mining operations in the Steelpoort sub-catchment.
Code No
Name of Mine Commodity (ies) Mined
Status Relative Size
Probable Impact
C7-23 Magneetshoogte Iron, Vanadium Prospecting Small Very low
C8-12 Winterveld Chrome Operating Very large High
C8-13 Doornbosch Platinum Closed Small Very low
C8-14 Lannex Chrome Operating Large Medium – High
C8-15 Boskloof Vanadium Prospecting Small Very low
C8-16 Kennedy’s Vale Vanadium Operating Medium Medium – High
C8-17 Tweefontein Chrome, Platinum Operating Very large Medium – High
C8-18 Kruger’s Post Andalusite Operating Large Low
C8-21 Thorncliffe Chrome Operating Large Medium – High
D7-1 Mapochs Vermiculite Vermiculite Operating Small Very low

cccx
D7-7 Nyala Dimension stone Operating Small Very low
D7-9 Belfast Granite Dimension stone Operating Medium Low
D7-12 Belfast #2 Dimension stone Operating Small Very low
D7-16 Marlin Dimension stone Operating Small Very low
D7-44 Baviaanskloof Vermiculite Prospecting Small Very low
D7-45 Mapochs Vanadium, Copper Operating Large Medium – High
D7-46 Vanadiumkop Vanadium Prospecting Small Very low
D7-47 Driefontein Vanadium Closed Small Very low
5.5.3 Alluvial mining
None known or anticipated.
5.5.4 Monitoring systems
The Department of Water Affairs and Forestry (DWAF) routinely collects water samples and gauges flows in the
Steelpoort sub-catchment, as part of its national monitoring programme. In addition, DWAF also regulate all
large (> 150 m3/day) water abstractions, and monitor the quantity and quality of all effluent discharges through a
system of effluent discharge permits or licences. Each licensed effluent discharger is required to carry out a
routine monitoring programme of the flow and quality of their effluent and supply this to DWAF. The Department
then conducts a randomised series of audit samples to check the veracity of the effluent returns submitted by
each discharger.
5.5.5 Water quality data
A set of water quality data are available for the Steelpoort River and the Dwars River, collected from sites
upstream and downstream of a group of chrome and vanadium mining operations. These data are presented in
Table 5.10. The data reveal clear effects of mining on general water quality (most probably due to forms of
acidic seepage) but the data for chrome and vanadium concentrations are anomalous in that they show no clear
indications of the chrome and vanadium mines having any effect on these substances in the rivers.
Table 5.10: Water quality data from five sites on the Steelpoort and Dwars rivers, close to chrome and
vanadium mining operations. The sampling sites are as follows: (1) = Dwars River upstream of Tweefontein
Chrome Mine; (2) = Dwars River downstream of Tweefontein Chrome Mine; (3) = Steelpoort River upstream of
junction with Dwars River; (4) = Steelpoort River downstream of Vantec Vanadium Mine; (5) = Steelpoort River
downstream of Lannex Section Chrome Mine; (6) = Steelpoort River downstream of Tubatse Ferrochrome
Smelter. [All values given in mg/litre except pH (log units)].
Sampling Sites Parameter
1 2 3 4 5 6

cccxi
pH 8.5 8.3 8.8 8.7 8.8 8.9
TDS 439 721 566 1255 570 647
Ca 34 42 38 74 38 29
Mg 36 50 33 107 38 60
Na 18 29 74 145 63 60
K 0.3 1.6 2.5 2.8 2.5 2.7
Cl 7 20 88 101 55 55
F 0.1 0.1 0.2 0.2 0.1 0.1
SO4 11 8 28 544 53 53
Total Alkalinity 273 438 246 204 263 310
Cr 0.003 0.003 0.003 0.135 0.003 0.003
V 0.003 0.003 0.032 0.017 0.003 0.015
5.5.6 Implications for water quality and quantity management
The available evidence (Table 5.10) indicates that mining operations in the Steelpoort sub-catchment do have
adverse effects on water quality in the river systems. However, there does not appear to be a clear indication
(from these data) that the mines are contributing significant quantities of either chrome or vanadium to the
rivers. Instead, it is possible that there is “natural background contamination” by chrome and vanadium, as
reflected in the “upstream” samples.
The precise extent and nature of any contamination from mining activities in the Steelpoort sub-catchment
needs to be resolved unequivocally. There is considerable tension between farmers, irrigators and mine
operators in this region around allegations of various types of metal toxicity to crops and livestock and the
matter must be clarified as soon as possible. Concerted attention should be paid to a sampling and monitoring
campaign that must be designed to prove whether or not there is indeed any form of metal contamination and, if
so, the extent of such contamination and the precise source of such contamination. Only then can potential
management options be evaluated and implemented.
5.6 The Blyde sub-catchment
5.6.1 General description
5.6.1.1 Hydrology
This sub-catchment consists of the area drained by the Blyde River and its main tributary, the Ohrigstad River
(Figure 4.2). Both the Blyde and Ohrigstad rivers rise on the western slopes of the north-south trending
Drakensberg Mountains and flow northwards towards the escarpment edge where they join at the Blydepoort
Dam, which is located at the edge of the escarpment. From the Blydepoort dam, the Blyde River cascades
down a steep series of rapids to its lower reaches, where the river again flows northwards to join the Olifants

cccxii
River north of the town of Hoedspruit. Ground water from the Chuniespoort dolomites provides an important
component of the water in the Blyde River.
The Blydepoort Dam is the largest impoundment on the Blyde River and regulates flows in the lower reaches.
Several small farm dams in the upper reaches of the Blyde and Ohrigstad rivers trap water for domestic
purposes and for limited areas of commercial irrigation, as well as livestock watering. The small Ohrigstad Dam
provides water for the town of Ohrigstad.
Flow patterns in the upper reaches of the Blyde and Ohrigstad rivers are relatively stable as these rivers drain
an area that receives some of the highest rainfalls recorded in South Africa (average rainfalls in the headwater
regions of these two rivers exceeds 1,500 mm per year). Both rivers are therefore perennial, though flows
increase during the summer months when rain is received. Smaller tributary streams in the upper reaches are
also perennial, though their flows are more variable. In its lower reaches, the Blyde River receives small
quantities of water from several episodic tributary streams that only contain water during the summer months.
5.6.1.2 Geology
The geological characteristics of the Blyde sub-catchment consist of a relatively complex series of lithological
formations that underlie the area forming the Drakensberg Mountains. In the eastern portion of the upper
reaches of the sub-catchment, the most important features are the deep layers of dolomites of the Chuniespoort
Formation, interspersed with alternating layers of indurated shales and quartzites of the Pretoria Series of the
Transvaal Sequence. In the western portion of this zone, the sub-catchment is underlain by complex
sequences of shales, conglomerates, silicified sandstones and quartzites of the Transvaal Sequence. The hard,
erosion-resistant rocks forming the northward continuation of the Drakensberg Mountains rise steeply from the
Mpumalanga Lowveld, forming conspicuous, steep-sided cliffs.
Water moving through the deep layers of Chuniespoort dolomites in the upper parts of the sub-catchment
becomes saturated with calcium carbonate; this precipitates out to form tufa when the water appears above
ground level. As a consequence, most of the waterfalls in the area are layered with thick, “growing” deposits of
tufa.
In the northern parts of the sub-catchment, downstream of the Blydepoort Dam, crystalline gneissic and granitic
rocks of the Basement Complex underlie the catchment. These coarse- to fine-grained, feldspar-rich rocks
have been intruded by numerous hard, fine-grained syenite “plugs” that are more erosion-resistant; these are
visible as stack-like features across the otherwise undulating terrain in the lower parts of the sub-catchment. In
addition to the intrusive syenite formations, the basement complex has also been intruded by a large number of
dolerite dykes. These dolerites are softer and more easily eroded than the Basement Complex rocks and the
dykes are often visible as troughs in the landscape. These troughs collect rainfall and act as local
watercourses; this water enhances the erosion process.
5.6.1.3 Pedology, agriculture and land use

cccxiii
Soils in the sub-catchment can be divided into four main groups:
• Moderate to deep sandy and clay-loam soils on flat, gently-sloping and undulating terrain overlying
dolomite, limestone and sandstones in the upper reaches of the catchment;
• Moderate to deep sandy to clay loam soils lining long stretches of the Blyde and Ohrigstad river valleys in
their middle reaches;
• Moderate to deep clay loam soils over much of the middle portions of the sub-catchment (located away from
the river channels), overlying the more porous unconsolidated sedimentary and hillwash material; and
• Moderately shallow to moderately deep, coarse-grained sandy loam to clay-rich, fine-grained soils derived
from granites and gneisses over most of the lower reaches of the sub-catchment.
Most of the clayey loam soils are very suitable for irrigated agriculture when sufficient water is provided.
Virtually all of the suitable soils are contained within the jurisdiction of formal irrigation boards or Government
Water Control Areas. Further away from the main river channels, most of the land use is given over to small-
scale irrigation from farm dams as well as the raising of small and large livestock (dairy and beef cattle, goats
and sheep). A wide variety of crops are produced, ranging from intensive vegetable production to tobacco,
maize, citrus and sub-tropical fruits, sorghum and sunflowers. Minor areas of plantation forestry (mostly Pines
and Eucalyptus) are also located in the wetter portions of the sub-catchment.
A few small towns and numerous smaller communities are present in the upper reaches of the sub-catchment,
whilst numerous scattered settlements and small towns characterize the lower portions of the sub-catchment.
The number and density of population declines with increasing distance from the upper reaches. Most of the
towns in the sub-catchment are service centres for the agricultural sector and have small fruit and vegetable
processing operations.
5.6.1.4 Surface water users
All the towns in the sub-catchment rely on water supplied from small water supply impoundments located
nearby. In contrast, most of the settlements have to rely on water supplied from boreholes or from run-of-river
abstraction points and, occasionally (in the lower reaches), from local boreholes. The areas of irrigation
agriculture consume most of the water used in the upper reaches of the sub-catchment. Immediately
downstream of the Blydepoort dam, the large Blyderivierspoort Irrigation Scheme is a major water user. Water
from the Blydepoort Dam is also released on demand to flow downstream to the Phalaborwa Barrage on the
Olifants River, where it is used to supplement the declining Olifants River flows that are available to water users
in the urban-industrial complex at the town of Phalaborwa. Recent estimates suggest that the water from the
Blydepoort Dam may account for some 30% of the total water used by Phalaborwa.
A formal Irrigation Board controls the Blyderivierspoort Irrigation Scheme. Recent improvements in the methods
of delivering water to the farmers are likely to achieve a 40% reduction in water use by this irrigation scheme.
However, this “water saving” is seen as an ideal opportunity to improve the reliability of water supplies to the
large number of settlements in the lower reaches of this sub-catchment who lack access to formal water supply
infrastructure.

cccxiv
5.6.1.5 Water management systems
The South African Department of Water Affairs and Forestry (DWAF) is responsible for the management of all
aspects of water supply and water use in the sub-catchment. The Department operates a system of routine flow
gauging at the Blydepoort Dam and pays particular attention to the quantity of water supplied to irrigation
schemes and towns, as well as increasing attention to the quality of agricultural return flows and effluent
discharges to the Blyde and Ohrigstad rivers.
The Blyderivierspoort Irrigation Board is the only formal irrigation board located in this sub-catchment and it is
responsible for al aspects of water supply to the irrigation scheme as well as for releases to the Phalaborwa
barrage.
5.6.1.6 Human impacts on water resources (excluding mining)
The following activities can be expected to have an impact on water resources in the sub-catchment:
• Small landfills and solid waste disposal sites at all towns;
• Disposal of liquid (domestic) effluent at all towns;
• Small volumes of runoff from the towns and urbanized areas;
• De-vegetation and other forms of veld degradation, leading to increased erosion and loads of suspended
sediments in most streams and rivers;
• Non-point domestic effluent from numerous small settlements and farms;
• Minor non-point impact from non-intensive commercial or subsistence agriculture;
• Minor non-point impact of agricultural return flows from intensive irrigation areas; and
• Moderate amounts of litter and domestic garbage alongside the roads that traverse the sub-catchment.
5.6.2 Mining and mineral processing operations
The following mining operations are of interest in the Blyde sub-catchment (Figures 4.2 and 4.3; Table 5.11).
Table 5.11: Mining operations in the Blyde sub-catchment.
Code Number
Name of Mine Commodity (ies) Mined
Status Relative Size
Probable Impact
C8-19 Morgenzon Gold Operating Small Low
C8-20 Astra Gold Operating Small Low
5.6.3 Alluvial mining

cccxv
No information is available on the present situation, though it is well known that large numbers of alluvial miners
panned for gold near the town of Pilgrims Rest during the late 19th and early 20th Century. It can be anticipated
that a few small-scale miners will still undertake occasional exploratory work in the upper reaches of this sub-
catchment.
5.6.4 Monitoring systems
The Department of Water Affairs and Forestry (DWAF) routinely collects water samples and gauges flows in this
sub-catchment, as part of its national monitoring programme. In addition, DWAF also regulate all large (> 150
m3/day) water abstractions, and monitor the quantity and quality of all effluent discharges through a system of
effluent discharge permits or licences. Each licensed effluent discharger is required to carry out a routine
monitoring programme of the flow and quality of their effluent and supply this to DWAF. The Department then
conducts a randomised series of audit samples to check the veracity of the effluent returns submitted by each
discharger.
5.6.5 Water quality data
A few water quality data for four sites along the upper reaches of the Blyde and Ohrigstad rivers were available
from the Department of water Affairs and Forestry. These data are presented in Table 5.12, below.
Table 5.12: Water quality data for four sites on the Blyde sub-catchment. All values are given in mg/litre,
except pH (log units).
Sampling Site
Parameter Blyde River at Willemsoord
Blyde River at Chester
Blydepoort Dam
Ohrigstad Dam
TDS 140 140 140 46
pH 7.55 7.35 8.30 6.65
Ca 30 28 32 31
Mg 8 11 11 10.8
Cl 5.4 5.3 4.6 7.2
SO4 7 6 9 5
Total Alkalinity 64 67 70 56
NH4-N 0.08 0.07 0.2 0.13
NO3-N 0.23 0.29 0.35 0.15
PO4-P 0.010 0.009 0.009 0.007
These data reflect the influence of the dolomitic formations on the water chemistry and also the presence of
agricultural return flows enriched with fertilizers.

cccxvi
5.6.6 Implications for water quality and quantity management
The available evidence suggests that the only likely source of any impact on local water resources and water
quality would be the two small gold mines located near the town of Pilgrims Rest (Table 5.12). These impacts
would most likely be localized and consist almost entirely of minor increases in suspended sediment
concentrations and, possibly, the risk of small cyanide spills from the extractive workings. It is also likely that
the many (> 100) small, abandoned gold mines and surface workings around Pilgrims Rest will be subject to
acid mine drainage linked to the oxidation of pyrite in the gangue rock. A few small associations of arsenopyrite
in the gangue rock suggest that arsenic may also cause minor, localized problem in a few streams.
5.7 The Selati sub-catchment
5.7.1 General description
5.7.1.1 Hydrology
The Selati River rises on the eastern slopes of the Wolkberg Mountains, which form part of the Drakensberg
Mountain chain. From its source in this high rainfall zone, the river flows eastward for approximately 140
kilometres before joining the Olifants River some 10 kilometres to the east of the town of Phalaborwa. The
Selati River has two main tributaries in its upper reaches; these are the Ngwabitsi and Mulati rivers.
The upper reaches of the Selati sub-catchment consist of steep-sided valleys with sharply defined cliff faces on
the eastern side of the escarpment. The local relief changes dramatically as the escarpment drops sharply on
its eastern flank to the flat or undulating terrain of the dry Lowveld region. Here, the topography is characterized
by gently sloping valleys and isolated outcrops of granitic rocks.
Immediately downstream of the Gravelotte road bridge, the Selati River is partially impounded by a series of 10
small weirs over a distance of some 20 kilometres. These weirs mark the points where irrigation water is
abstracted for large-scale commercial irrigation farms.
In its upper reaches, the Selati River is perennial. However, the combination of little or no inflows from seasonal
tributary streams in its middle and lower reaches, coupled with large-scale water abstractions in the middle
reaches, has resulted in the Selati River being a seasonal river over most of its lower reaches. At the town of
Phalaborwa, discharges of treated domestic effluent and seepage from large-scale tailings dams provide a
source of “perennial” flows for the final few kilometres before it joins the Olifants River. In effect, the final few
kilometres of the Selati River only contain effluent during the dry winter months, though this becomes “diluted”
when normal summer flows resume.
5.7.1.2 Geology

cccxvii
In its upper reaches, the sub-catchment is underlain by rocks of the Transvaal Sequence, which form the major
portion of the Drakensberg Mountain range. The lithology is dominated by quartzites, chert, hornfels, basic lava
and dolomite. The dolomite outcrops, in particular, are important sources of good quality water in the upper
catchment and contribute water throughout the year.
Further to the east and south, rocks of the Gravelotte Group (part of the Murchison Sequence) and Rooiwater
Complex outcrop in the vicinity of the town of Gravelotte. Quartzite, schists, basic lava and granitic rocks
dominate the Gravelotte Group lithology. These greenstone formations contain important deposits of antimony
and gold, with minor deposits of mercury and zinc. An extensive deposit of heavy mineral sands (illmenite, rutile
and zirconium) is located near the town of Gravelotte.
The felsites and gabbros of the Rooiwater Complex are easily eroded and contribute increased levels of
sediments in the valley depressions and river channels. Further to the east, the rocks of the crystalline
Basement Complex outcrop at various points across the Lowveld. These rocks consist mainly of potassium-rich
granites and gneisses with feldspar and mica outcrops. The exposed weathered granites are easily eroded,
particular where the vegetation cover is sparse or denuded. Accelerated rates of sediment production occur in
this region, with large amounts of coarse and fine sediments accumulating in river channels. The slightly harder
rocks of the Mashimale Suite are intrusive into the rocks of the Basement Complex and are visible as stack-like
outcrops of fine-grained, light-coloured granites.
The Phalaborwa area is underlain by granite and gneiss rocks of the Basement Complex. These were intruded
by a cyclical series of alkaline-rich magmas that have given rise to the highly mineralised carbonatite and
pyroxenite rocks of the Phalaborwa Complex. Plugs and dykes of fine-grained syenite that were intruded during
the alkaline phase of the Phalaborwa Complex are resistant to weathering and remain as conspicuous stack-like
hills and ridges.
North-east to south-west trending dykes and sills of undifferentiated mafic intrusives (mainly Karoo age dolerite)
occur over much of the Lowveld Basement Complex, with particularly well-developed examples of dyke swarms
in and around the Phalaborwa area. These rocks are less resistant to weathering than their granite and gneiss
host rocks and give rise to negatively weathered linear features in the landscape, often forming or delineating
drainage lines.
5.7.1.3 Pedology, agriculture and land use
Soils in the Selati sub-catchment can be divided into four broad groups or regions:
• Small areas of shallow, sandy or gravely soils the upper reaches;
• Areas of sandy colluvial soils at the foot of the escarpment, grading into red apedal soils in the western part
of the sub-catchment;
• Shallow, brownish to greyish-brown sandy soils overlying coarsely weathered rock in the eastern portion of
the sub-catchment; and
• Transported alluvial deposits of coarse to fine-grained sands and silts located along drainage lines.

cccxviii
The upper reaches of the Selati sub-catchment contain small areas of plantation forestry (Pines) and there are
important natural forests on the steep escarpment slopes. The central portion of the sub-catchment supports
extensive rain-fed and irrigated agriculture, consisting primarily of citrus and sub-tropical fruits, as well as
smaller areas of vegetables. The central and lower reaches of the Selati River provide an important source of
water for game farms and a few livestock (cattle and goats) rearing farms. In areas located away from the main
river channel, rain-fed subsistence agriculture is important, with livestock rearing of cattle, goats and donkeys.
The town of Phalaborwa is the largest town in the sub-catchment and forms the regional service centre for the
entire area with the development of light and heavy industries associated with the mining activities in the area.
The smaller towns of Namagale and Lulekane serve principally as dormitory towns for staff employed on nearby
mines and industries. Several smaller settlements are located in rural areas or communal lands within the
former homeland states of Gazankulu and Lebowa.
5.7.1.4 Surface water users
The mines and larger industries in the town of Phalaborwa receive either domestic quality or industrial quality
water from the Phalaborwa Water Board. The town of Phalaborwa and its associated mines and industries is
the largest and most important water user in the Selati sub-catchment. The Phalaborwa Water Board provides
almost all of the water required by the town of Phalaborwa from the Phalaborwa Barrage, located on the Olifants
River. When water levels in the Phalaborwa Barrage fall to low levels, the Board requests releases of additional
water from the Blydepoort Dam to supplement inflows to the Phalaborwa Barrage and assure water supplies to
the town.
All the other smaller towns in the sub-catchment rely on water supplied from small water supply impoundments
or, in the case of the town of Gravelotte, water transferred into the sub-catchment from the Letaba sub-
catchment. Most of the smaller settlements in the sub-catchment have to rely on water supplied from boreholes
or from run-of-river abstraction points and, occasionally (in the middle reaches), from local boreholes or hand-
dug wells. The small areas of irrigation agriculture are important water users in the middle reaches of the sub-
catchment.
The Selati sub-catchment is considered to be water-stressed and relies almost entirely on inflows from the
Olifants River. The promising deposits of heavy mineral sands near Gravelotte cannot be exploited cost-
effectively because of the general shortage of water in the sub-catchment.
5.7.1.5 Water management systems
The South African Department of Water Affairs and Forestry (DWAF) is responsible for the management of all
aspects of water supply and water use in the sub-catchment. The Department operates a system of routine flow
gauging and water quality sampling at specific points and pays particular attention to the quantity of water
supplied to irrigation schemes and towns, as well as increasing attention to the quality of agricultural return
flows and effluent discharges.

cccxix
The Phalaborwa Water Board has been delegated the responsibility for all aspects of water supply to, and
effluent discharge from, the town of Phalaborwa. In addition, the Board also controls flow releases from the
Blydepoort Dam on the Blyde River. Small irrigation boards control the allocation of water for irrigation in the
upper reaches of the Selati River.
5.7.1.6 Human impacts on water resources (excluding mining)
Given that the lower reaches of the Selati River are “normally” seasonal, but now are perennial as a result of
continual seepage and effluent discharges from Phalaborwa and its mines and industries, it is difficult to
separate “non-mining” impacts from those that are directly attributable to mining operations. Nevertheless, an
impression can be gained by comparing the analyses of water samples collected upstream and downstream on
the lower reaches of the Selati River with those in the nearby Olifants Barrage and the Olifants River nearby
(Table 5.13).
What is immediately evident is that the quality of the water in the Selati River immediately upstream of the town
of Phalaborwa is already very poor, probably as a result of agricultural return flows and other effluent discharges
upstream. After the inflow of the seepage and effluent from Phalaborwa, the concentrations of a few
constituents increases but there is no overall improvement or worsening of water quality. In contrast, the water
quality in the Phalaborwa Barrage is comparatively good and, when mixed with water from the Selati River,
there is a marked deterioration in water quality as shown by the results for Mamba Weir (Table 5.13). At the
time when these samples were collected, September, the flow from the Phalaborwa Barrage was almost exactly
equal to the flow of the lower reaches of the Selati River, approximately 0.5 m3/second; this would suggest that
the water from the Selati River would have been diluted by about 50% by water from the Olifants River.
Table 5.13: Comparison of water quality characteristics of samples collected from the Selati River upstream of
Phalaborwa and downstream of all effluent discharges, with water samples collected from the Olifants River at
the Phalaborwa Barrage and at Mamba Weir (B7M015) below the confluence of the Selati and Olifants Rivers.
[All data are given as mg/litre, except ph (log units) and conductivity (mS/metre)].
Parameter Selati River (Upstream)
Selati River (Downstream)
Phalaborwa Barrage
Mamba Weir (B7M015)
Conductivity 342 358 48 192
pH 7.5 7.2 7.9 7.9
Ca 142 104 26 61
Mg 214 204 25 100
Na 280 325 38 141
K 84 113 1 63
Cl 1,322 1,230 34 128
F 4.3 4.4 0.3 2.1

cccxx
SO4 531 594 19 254
Si 9 18 8 11.0
Total Alkalinity 266 145 170 162
NH4-H 0.21 0.16 0.04 0.05
NO2-N + NO3-N 0.24 0.07 0.10 0.02
PO4-P 0.08 0.35 0.01 0.16
Fe 0.031 0.132 - 0.131
Mn 0.095 0.332 - 0.045
Cu 0.004 0.006 - 0.002
5.7.2 Mining and mineral processing operations
The following mining operations are of interest in the Selati sub-catchment (Figures 4.2 and 4.3; Table 5.14).
Table 5.14: Mining operations in the Selati sub-catchment.
Code Number
Name of Mine Commodity (ies) Mined
Status Relative Size
Probable Impact
B8-12 Letaba Zinc, Silver, Copper Operating Medium Low
B8-13 Athens Antimony Operating Medium Low
B8-14 Alpha Gravelotte Antimony Operating Medium Low
B8-15 Discovery Gold Operating Medium Low
B8-16 Lenyenye Clay minerals Operating Medium Low – Medium
B8-17 Foskor Phosphate, Zirconium Operating V. Large Large
B8-18 Palabora Copper Copper, Titanium Operating V. Large Large
B8-19 Foskor Vermiculite Operating Large Low -Medium
C8-1 Inyoni Astra Gold Operating Small Low
C8-22 Cobra Emerald Emerald Operating Small Low-Very low
5.7.3 Alluvial mining
None known or anticipated, though there is some small-scale prospecting for tantalite and columbite in
pegmatite formations upstream of the town of Phalaborwa.
5.7.4 Monitoring systems
The Department of Water Affairs and Forestry (DWAF) routinely collects water samples and gauges flows in this
sub-catchment, as part of its national monitoring programme. In addition, DWAF also regulate all large (> 150

cccxxi
m3/day) water abstractions, and monitor the quantity and quality of all effluent discharges through a system of
effluent discharge permits or licences. Each licensed effluent discharger is required to carry out a routine
monitoring programme of the flow and quality of their effluent and supply this to DWAF. The Department then
conducts a randomised series of audit samples to check the veracity of the effluent returns submitted by each
discharger. Each industry and mining operation in Phalaborwa regularly monitors its effluent discharge quality
and reports the results to the Department.
5.7.5 Water quality data
The water quality data for the lower Selati River shown in Table 5.13 are representative of the typical water
quality of this reach during the dry months of the year. During the summer months when “normal” runoff
patterns resume, the water quality improves dramatically. Nevertheless, aquatic ecosystems are exposed to
greatest stress during the dry winter months when river flows are lowest; at this time of year, the poor quality
water in the Selati River can b expected to have the greatest impact on water in the lower Olifants River.
5.7.6 Implications for water quality and quantity management
The “new” inflows of effluents from mining operations into the lower reaches of the Selati River has a positive
effect in that, despite its poor quality, this water supplements the flows in the lower Olifants River. However, the
resultant water quality of the lower Olifants River is not considered to be suitable for protection of aquatic
ecosystems (DWAF, 1996) and is also unfit for human consumption at the Olifants and Balule rest camps in the
Kruger National Park. In addition, the quality of water entering the Massingir Dam in Mozambique would also
be unsuitable for irrigation of sensitive crops and may contravene the requirements of international agreements
between South Africa and Mozambique. This aspect needs to be checked very carefully and, if verified, a
concerted effort should be made to improve the quality of mining effluents discharged into the lower reaches of
the Selati River.
5.8 The Middle and Great Letaba sub-catchment
5.8.1 General description
5.8.1.1 Hydrology
This sub-catchment consists of the area drained by the Great and Middle Letaba rivers and their main
(perennial) tributaries, the Klein Letaba, Molatotsi, Nsama, Politsi, Letsitele, Thabina rivers, as well as the
episodically flowing tributaries, the Ngwenyeni, Shipikani and Tsende rivers (Figure 4.2). The tributaries of the
Great and Middle Letaba rise on the high rainfall northern slopes of the east-west trending Drakensberg

cccxxii
Mountains, flowing first to the north-east and then east-south-east to join the Olifants River inside the Kruger
National Park shortly before it enters Mozambique. The “perennial” of the Great and Middle Letaba rivers are
only perennial in their upper reaches, becoming progressively more seasonal and episodic as they flow
eastwards. The three episodic tributaries rise at different points in the drier eastern portion of this sub-
catchment within the Kruger National Park.
From the mid-1960s, flows in the Great Letaba River have declined progressively sue to rapidly increasing
water abstraction in the upper reaches. For the last twenty-five years, flows in the lower reaches of this river
have been entirely seasonal with no surface flow recorded during the dry winter months. This has posed
several problems for the Kruger National Park, as the Great Letaba River is an important source of water for
game animals. Accordingly, several small reservoirs were constructed along the lower reaches of the Great
Letaba River inside the Kruger National Park to provide assured supplies of water during the dry winter months.
There are several water supply dams and reservoirs located in the headwater zones of all the tributaries of the
Great and Middle Letaba rivers. These reservoirs supply water for domestic consumption in the several towns,
as well as irrigation water for the extensive areas of irrigation agriculture at the foothills of the Drakensberg
Mountains and along both banks of the larger rivers. In the drier central and eastern portions of this sub-
catchment, the many settlements, farmsteads and small towns rely on boreholes or run-of-river abstraction for
their water supplies. During the dry winter months, these communities depend entirely on borehole water
supplies.
The sub-catchment also contains several hundred small farm dams. These provide important sources of water
for small farming operations, livestock watering and domestic consumption.
5.8.1.2 Geology
In its upper reaches, this sub-catchment is underlain by rocks of the Transvaal Sequence, which form the major
portion of the Drakensberg Mountain range. Quartzites, silicified sandstones, chert, hornfels, basic lava and
dolomite dominate the lithology. The dolomite outcrops, in particular, are important sources of good quality
water in the upper catchment and contribute water throughout the year. These rocks form prominent landscape
units along the watershed.
Further to the east and north-east, rocks of the Gravelotte Group (part of the Murchison Sequence) and
Rooiwater Complex outcrop and are visible as a range of low hills that trend south-west to north-east.
Quartzite, schists, basic lava and granitic rocks, with considerable base metal mineralization and numerous
pegmatites on the periphery of this formation, dominate the lithology. In the south, these greenstone formations
are referred to as the “Murchison Greenstones” and contain important deposits of antimony and gold, with minor
deposits of mercury and zinc. In the north, these formations also outcrop as low ranges of folded hills and are
named the “Giyani Greenstones”. The Giyani Greenstone area has a very similar lithology to that of the
Murchison Group and is also heavily mineralised, with important gold deposits. An unfortunate aspect of the
lithology here is the presence of arsenopyrite.

cccxxiii
In the south-west of the sub-catchment, felsites and gabbros of the Rooiwater Complex are found at the foot of
steep hill slopes. Similar outcrops, comprising rocks of the Banderlierkop Complex, outcrop in the north-
western portion of the sub-catchment. Both of these rock types are relatively easily eroded and contribute
increased levels of sediments in the valley depressions and river channels. Granitic and gneissic rocks of the
crystalline Basement Complex underlie most of the central and eastern portions of the sub-catchment. These
rocks outcrop at various points across the Lowveld, forming prominent hills or koppies. The exposed weathered
granites are easily eroded, particular where the vegetation cover is sparse or denuded. Accelerated rates of
sediment production occur in this region, with large amounts of coarse and fine sediments accumulating in river
channels. The eastern portion of the sub-catchment is marked by the Lebombo Mountains, consisting of acidic
and intermediate rhyolites and lavas of the Karoo Sequence. Small areas of Quaternary deposits line the broad
shallow bed of the Great Letaba River along its lower reaches.
A large number of dolerite dykes and sills have intruded the Basement Complex granites and gneisses. These
rocks are less resistant to weathering than their granite and gneiss host rocks and give rise to negatively
weathered linear features in the landscape, often forming or delineating drainage lines that become filled with
coarse rock and gravel fragments.
5.8.1.3 Pedology, agriculture and land use
Soils in the Selati sub-catchment can be divided into four broad groups or regions:
• Large areas of moderately deep to deep, reddish clay-rich soils in the upper reaches, occasionally
becoming leached to form pale-coloured kaolinitic deposits;
• Areas of sandy colluvial soils at the foot of the escarpment, grading into red sandy-clay soils in the western
part of the sub-catchment;
• Shallow, brownish to greyish-brown sandy soils overlying coarsely weathered rock in the central and
eastern portion of the sub-catchment; and
• Transported alluvial deposits of coarse to fine-grained sands and silts located along drainage lines.
The upper reaches of the Great and Middle Letaba sub-catchment contain large areas of plantation forestry
(both Pines and Eucalyptus) and there are important natural forests on the steep escarpment slopes and upland
areas. The central portion of the sub-catchment supports extensive rain-fed and irrigated agriculture, consisting
primarily of citrus and sub-tropical fruits, as well as smaller areas of cotton, oil seeds and vegetables. The
central and lower reaches of the Great Letaba River provide an important source of water for game farms and
livestock (cattle and goats) rearing farms. In areas located away from the main river channel, rain-fed
subsistence agriculture of drought-tolerant crops is important, with livestock rearing of cattle, goats and
donkeys.
Land use in the entire eastern portion of the sub-catchment is wildlife conservation, with the Kruger National
Park occupying the largest area. Several smaller game reserves and game farms are also located close to the
western border of the Kruger National Park in some of the driest areas of the sub-catchment.
cccxxiv
The towns of Tzaneen and Giyani are the largest towns in the sub-catchment and form regional service centres
with the development of a few light industries associated with the agricultural activities in the area. Several
smaller settlements are located in rural areas or communal lands within the former homeland states of
Gazankulu, Lebowa and Venda.
5.8.1.4 Surface water users
The larger towns and their associated industrial activities receive domestic water supplies from nearby water
storage reservoirs. These water storage reservoirs also supply irrigation water to a number of irrigation boards
located in the upper and middle reaches of the Great and Middle Letaba rivers, as well as their larger tributaries.
Irrigation is by far the largest water user in this sub-catchment. The demand for water in this sub-catchment far
exceeds the available supplies and this sub-catchment is considered to be water stressed.
Most of the smaller towns and settlements in the sub-catchment rely on water supplied from small farm dams or
local boreholes. In some cases, the smaller settlements have to rely on run-of-river abstraction (when surface
water is available) or on hand-dug wells and boreholes.
5.8.1.5 Water management systems
The Department of Water Affairs and Forestry (DWAF) are responsible for all aspects of water use and effluent
discharge in this sub-catchment. The responsibility for supply of irrigation water has been delegated to several
irrigation boards. These organizations are required to submit regular returns informing DWAF as to the quantity
of water delivered and any permits issued or cancelled.
The Department also regulates all large (> 150 m3/day) water abstractions, and monitors the quantity and
quality of all effluent discharges through a system of effluent discharge permits or licences. Each licensed
effluent discharger is required to carry out a routine monitoring programme of the flow and quality of their
effluent and supply this to DWAF. The Department then conducts random audits to check the veracity of the
effluent returns submitted by each discharger.
5.8.1.6 Human impacts on water resources (excluding mining)
The following activities can be expected to have an impact on water resources in the Great and Middle Letaba
sub-catchment:
• Small landfills and solid waste disposal sites at all towns;
• Disposal of liquid (domestic) effluent at all towns;
• Small volumes of runoff from the towns and urbanized areas;
• De-vegetation and other forms of veld degradation, leading to increased erosion and loads of suspended
sediments in most streams and rivers;
• Non-point domestic effluent from numerous small settlements and farms;
• Minor non-point impact from non-intensive commercial or subsistence agriculture;

cccxxv
• Minor non-point impact of agricultural return flows from intensive irrigation areas; and
• Moderate amounts of litter and domestic garbage alongside the roads that traverse the sub-catchment.
5.8.2 Mining and mineral processing operations
The following mining operations are of interest in the Middle Letaba and Great Letaba sub-catchment (Figures 4.2 and 4.3; Table 5.15).
Table 5.15: Mining operations in the Middle Letaba and Great Letaba sub-catchments.
Code Number
Name of Mine Commodity (ies) Mined
Status Relative Size
Probable Impact
B7-8 Soekmekaar Corundum Operating Small Low
B8-2 Giyani alluvial Gold Artisan (few) V. small Low - Medium
B8-4 Giyani Phosphate Phosphate Prospecting Small Very low
B8-5 Letaba Vermiculite Vermiculite Prospecting Small Very low
B8-6 Marikani Vermiculite Prospecting Small Very low
B8-7 Letaba Vermiculite Prospecting Small Very low
B8-8 Main Mine Gold Operating Small Low
B8-9 Main Stone Dimension stone Operating Medium Very low
B8-10 Golden Davey Gold Operating Small Low
B8-11 Davey Feldspar Operating Small Very low
5.8.3 Alluvial mining
Alluvial gold mining takes place along the Nsama River where it crosses the Giyani Greenstone formation. The
number of people involved in this activity is apparently low, but their activities contribute mercury and arsenic to
the river.
5.8.4 Monitoring systems
The Department of Water Affairs and Forestry (DWAF) routinely collects water samples and gauges flows at a
few sites in this sub-catchment, as part of its national monitoring programme.
5.8.5 Water quality data
A selection of water quality data has been obtained for this sub-catchment (Table 5.16). Whilst these data do
not refer specifically to the implications of mining activities, they do provide a picture of the general water quality
in the rivers of the sub-catchment

cccxxvi
Table 5.16: Representative water quality data for the Great and Middle Letaba rivers, as well as the Nsama,
Thabina, Klein Letaba and Letsitele rivers. [All data are given as mg/litre, except pH (log units) and electrical
conductivity (mS/metre)].
Parameter G. Letaba (Tzaneen)
G. Letaba (KNP)
M. Letaba K. Letaba Thabina Letsitele Nsama
pH 6.4 7.45 7.3 7.4 7.6 7.3 7.7
Conductivity 4.0 21.4 20.6 28.6 26.1 19.5 32
TDS 37 165 162 219 221 162 248
Ca 2 14 18 18 28 20 21
Mg 1 7 8 14 12 7 14
Na 4 18 9 17 9 11 23
K 1.2 4.2 4.5 2.8 0.8 2.1 4.4
Si 6.4 7.3 5.8 14.8 9.9 8.9 11.1
Total Alkal. 11 71 89 108 122 75 123
Cl 4 23 5 11 6 13 15
F 0 0.1 0.2 0.1 0.2 0.1 0.2
SO4 4 5 4 9 7 5 8
Fe 0.57 1.58 0.19 0.38 0.93 0.19 0.41
Mn 0.05 0.22 0.06 0.04 0.26 0.06 0.10
These data demonstrate that the general water quality in the Great and Middle Letaba rivers and their main
tributaries is generally good. The declining water quality along the length of the Great Letaba River probably
reflects a combination of evaporative concentration and irrigation return flows.
5.8.6 Implications for water quality and quantity management
The available evidence suggests that there is little evidence of any adverse effects that could be attributed to
mining activities. However, given the alluvial mining activities in the Nsama River, it would be prudent to
examine the water quality of this tributary more closely.
The other mining and quarrying activities in the upper reaches of the Middle Letaba River would be likely to
increase suspended sediment levels.
5.9 The Shingwedzi sub-catchment
5.9.1 General description
5.9.1.1 Hydrology
This sub-catchment consists of the area drained by the Shingwedzi River and its major tributaries, the
Phugwane, Mphongolo and Shisha rivers in South Africa, as well as the slightly smaller Mozambican portion

cccxxvii
(Figure 4.2). The tributaries of the Shingwedzi River rise on the eastern slopes of the range of low, north to
south trending hills that mark the watershed between this sub-catchment and that of the Levuvhu sub-
catchment of the Limpopo basin. All the tributaries of the Shingwedzi River are located in low rainfall areas and
therefore only have seasonal or episodic flows during the wet summer months of each year. Most of the
catchment area of the Shingwedzi River and its tributaries lies within the boundaries of the Kruger National
Park.
From the mid-1960s, flows in the Great Letaba River have declined progressively sue to rapidly increasing
water abstraction in the upper reaches. For the last twenty-five years, flows in the lower reaches of this river
have been entirely seasonal with no surface flow recorded during the dry winter months. This has posed
several problems for the Kruger National Park, as the Great Letaba River is an important source of water for
game animals. Accordingly, several small reservoirs were constructed along the lower reaches of the Great
Letaba River inside the Kruger National Park to provide assured supplies of water during the dry winter months.
There are a few small farm dams located in the headwater zones of all the tributaries of the Shingwedzi River;
these supply water for domestic consumption in several small settlements and mines. In the drier central and
eastern portions of this sub-catchment within the Kruger National Park, boreholes are used to supplement
water supplies during the dry winter months. In the eastern portion of this sub-catchment located within
Mozambique, the residents of the many small settlements located along the banks of the Shingwedzi River rely
on hand-dug wells in the river and stream beds for their water supplies.
5.9.1.2 Geology
The geological features of the Shingwedzi sub-catchment consist predominantly of large areas of granitic and
gneissic rocks of the crystalline Basement Complex underlying the western and central portions of the sub-
catchment, together with the acidic and intermediate rhyolites and lavas of the Karoo Sequence that form the
northern extension to the Lebombo Mountains. Within Mozambique, extensive Quaternary deposits of semi-
consolidated sandstones and mudstones, with slightly older Tertiary deposits of the Mazamba, Jofane and
Cheringoma Formations, underlie the sub-catchment. In addition, there are a few outcrops of Grunja and Sena
post-Karoo complex rocks that consist predominantly of alkaline dolerites and shales. Recent alluvial deposits
are present along wide flood terraces on either side of the Shingwedzi River.
The granitic and gneissic rocks of the Basement Complex outcrop at various points across the central area of
the sub-catchment, forming prominent hills or koppies. These exposed weathered granites erode easily, and
accelerated rates of sediment production occur in this region, with large amounts of coarse and fine sediments
accumulating in river channels.
Small outcrops of the Giyani Greenstone Formation occur in the western and southern portions of this sub-
catchment, together with outcrops of Timbavati Gabbro close to the Lebombo Mountains. Several dolerite
dykes and sills have intruded the Basement Complex granites and gneisses across the central and southern
portions of this sub-catchment. These rocks are less resistant to weathering than their granite and gneiss host

cccxxviii
rocks and give rise to negatively weathered linear features in the landscape, often forming or delineating
drainage lines that become filled with coarse rock and gravel fragments.
5.9.1.3 Pedology, agriculture and land use
Soils in the Shingwedzi sub-catchment can be divided into three broad groups:
• Areas of sandy colluvial soils at the foot of hills, grading into shallow, reddish-coloured sandy-loam soils in
the western part of the sub-catchment;
• Shallow, brownish to greyish-brown sandy soils overlying coarsely weathered rock in the central and
eastern portion of the sub-catchment; and
• Transported alluvial deposits of coarse to fine-grained sands and silts located along drainage lines.
Land use in the upper reaches of the Shingwedzi River and its tributaries consists of small-scale subsistence
agriculture and some game farming and wildlife conservation in nature reserves. The central portion of the sub-
catchment is located within the Kruger National Park and land use therefore consists entirely of wildlife
conservation.
Land use in the eastern (Mozambican) portion of the sub-catchment consists almost entirely of small-scale
subsistence agriculture, with most cultivated areas being located on flood terraces close to stream and river
channels. Some Mozambican settlements also grow a few Mango and Cashew Nut trees and raise a few
livestock.
No towns of any size occur within the sub-catchment.
5.9.1.4 Surface water users
Water use within this sub-catchment consists almost entirely of subsistence agriculture and wildlife
conservation. Domestic water supplies to the small settlements located along the banks of the Shingwedzi
River in Mozambique are provided from hand-dug wells. Boreholes provide domestic water supplies to the
tourist camps located within the Kruger National Park.
5.9.1.5 Water management systems
The Department of Water Affairs and Forestry (DWAF) are responsible for all aspects of water resource
management in the upper (South African) reaches of the Shingwedzi sub-catchment.
In Mozambique, the Mozambican Department of Water Affairs does not monitor flows or water quality in the
Shingwedzi River, but does monitor the Olifants River downstream of the Shingwedzi-Olifants confluence.

cccxxix
5.9.1.6 Human impacts on water resources (excluding mining)
The following activities can be expected to have an impact on water resources in the Shingwedzi sub-
catchment:
• Small landfills and solid waste disposal sites at tourist camps in the Kruger National Park;
• De-vegetation and other forms of veld degradation, leading to increased erosion and loads of suspended
sediments in most streams and rivers;
• Non-point domestic effluent from numerous small settlements and farms;
• Minor non-point impact from non-intensive commercial or subsistence agriculture;
• Minor amounts of litter and domestic garbage alongside the few roads that traverse the upper reaches of
the sub-catchment.
5.9.2 Mining and mineral processing operations
The following mining operations are of interest in the Shingwedzi sub-catchment (Figures 4.2 and 4.3; Table 5.17).
Table 5.17: Mining operations in the Shingwedzi sub-catchment.
Code Number
Name of Mine Commodity (ies) Mined
Status Relative Size
Probable Impact
A8-9 Shingwedzi Gold Abandoned Very small Very low
B8-1 Shingwedzi Alluvial Gold Abandoned Artisan (few) Very low
B8-2 Giyani Alluvial Gold Operating Artisan (few) Low – Medium
B8-3 Golden Pocket Gold Prospecting Very small Very low
5.9.3 Alluvial mining
There are two sets of alluvial gold mining activities in this sub-catchment, one of which has apparently been
abandoned (Figures 4.2 and 4.3; Table 5.17). The Giyani alluvial goldfield apparently spreads over the
watershed between this sub-catchment and the Letaba sub-catchment to the south; hence it is recorded in both
sets of information.
5.9.4 Monitoring systems
Monitoring of water quality is conducted in South Africa only.
5.9.5 Water quality data

cccxxx
No water quality data for this sub-catchment could be obtained in time for inclusion in this report.
5.9.6 Implications for water quality and quantity management
The alluvial gold mining activities in this sub-catchment are the only ones likely to have any implications for
water quality. The rocks of the Giyani Greenstone Formation contain deposits of arsenopyrite and the artisan
gold miners also use mercury to separate out the gold. Therefore, there is a small possibility that arsenic and
mercury may pose localized problems in the upper reaches of this sub-catchment.
5.10 The Timbavati-Klaserie sub-catchment
5.10.1 General description
5.10.1.1 Hydrology
This sub-catchment consists of the lowest portion of the Olifants basin in South Africa and contains the area
drained by the Timbavati and Klaserie rivers, as well as the Nhlaralumi and several smaller tributary streams
(Figure 4.2). The Klaserie River rises on the eastern slopes of the Drakensberg Mountains, whilst the
Timbavati Rivers rises in the foothills of the Drakensberg Mountains. The other tributary streams rise from
outcrops of low granitic hills scattered across the Lowveld within the boundaries of the Kruger National Park
(KNP). The Klaserie River is perennial only in its upper reaches and most of its water is lost by evaporation or
abstraction for irrigation. Apart from the Klaserie River, all the other rivers and streams have episodic flows only
during the wetter summer months. Overall, the predominantly episodic tributary rivers in this sub-catchment do
not provide very large quantities of water to the Olifants River.
Most of the catchment area of the Timbavati and Klaserie rivers and their tributaries lies within the boundaries of
the KNP, with a small portion located between the foot of the Drakensberg Mountains in the west and the
western boundary of the KNP. There are several small farm dams located in the headwater zones of the
Timbavati and Klaserie rivers outside the KNP, as well as one larger water supply impoundment on the Klaserie
River. Most farms outside the KNP and the tourist camps inside the KNP rely on boreholes for their water
supplies, particularly during the dry winter months of the year.
5.10.1.2 Geology
The geological features of the Timbavati – Klaserie sub-catchment are similar to those of the Shingwedzi sub-
catchment. Most of the area is underlain by large areas of granitic and gneissic rocks of the crystalline
Basement Complex, with the acidic and intermediate rhyolites and lavas of the Karoo Sequence to the east
forming the northern extension to the Lebombo Mountains. In the western portion of the sub-catchment, rocks
of the Transvaal Sequence forming the Drakensberg Mountains underlie the western edges of the area drained

cccxxxi
by the upper Klaserie River. Recent alluvial deposits are present along wide terraces on the banks of all of the
larger rivers and streams, and particularly the lower reaches of the Olifants River.
The granitic and gneissic rocks of the Basement Complex outcrop at various points across the central area of
the sub-catchment, forming prominent hills or koppies. These exposed weathered granites erode easily, and
accelerated rates of sediment production occur in this region, with large amounts of coarse and fine sediments
accumulating in river channels.
Small outcrops of the Murchison Greenstone Formation occur in the northwestern and northern portions of this
sub-catchment, together with outcrops of Timbavati Gabbro close to the Lebombo Mountains. Several dolerite
dykes and sills have intruded the Basement Complex granites and gneisses across the central and southern
portions of this sub-catchment. These rocks are less resistant to weathering than their granite and gneiss host
rocks and give rise to negatively weathered linear features in the landscape, often forming or delineating
drainage lines that become filled with coarse rock and gravel fragments.
5.10.1.3 Pedology, agriculture and land use
Soils in the Timbavati-Klaserie sub-catchment can be divided into three broad groups:
• Areas of sandy-clay colluvial soils at the foot of the Drakensberg Mountains, grading into shallow, reddish-
coloured sandy-loam soils in the western part of the sub-catchment;
• Shallow, brownish to greyish-brown sandy soils overlying coarsely weathered rock in the central and
eastern portion of the sub-catchment; and
• Transported alluvial deposits of coarse to fine-grained sands and silts located along drainage lines.
Land use in the uppermost reaches of the Timbavati-Klaserie sub-catchment consists of small-scale irrigation
agriculture, subsistence agriculture and game farming. The central and eastern portions of the sub-catchment
are located within the Kruger National Park and land use therefore consists entirely of wildlife conservation.
Hoedspruit is the only town of any size in this sub-catchment.
5.10.1.4 Surface water users
Water use within this sub-catchment consists almost entirely of irrigation, subsistence agriculture and wildlife
conservation. Domestic and irrigation water supplies to the farms and small settlements located in the upper
reaches of this sub-catchment are provided by irrigation water released from the Jan Wassenaar Dam.
Boreholes and hand dug wells provide water for most of the smaller settlements located away from riverbanks.
Boreholes are usually the only source of water for the tourist camps in the many game farms and private nature
reserves. The Kruger National Park tourist rest camps at located at Balule and Olifants receive their water
supplies directly from the lower reaches of the Olifants River.

cccxxxii
5.10.1.5 Water management systems
The Department of Water Affairs and Forestry (DWAF) are responsible for the management of water resources
and the allocation of permits for water use and effluent discharge. The responsibility for supply of irrigation
water is delegated to the local irrigation board.
5.10.1.6 Human impacts on water resources (excluding mining)
The following activities can be expected to have an impact on water resources in the Timbavati-Klaserie sub-
catchment:
• Small landfills and solid waste disposal sites at the town of Hoedspruit, as well as at tourist camps in the
Kruger National Park and on private game reserves;
• Over-grazing and other forms of veld degradation, leading to increased erosion and loads of suspended
sediments in most streams and rivers;
• Non-point domestic effluent from several tourist camps and farms;
• Minor non-point impact from non-intensive commercial or subsistence agriculture;
• Minor amounts of litter and domestic garbage alongside the few roads that traverse the upper reaches of
the sub-catchment.
5.10.2 Mining and mineral processing operations
None known.
5.10.3 Alluvial mining
None known or anticipated.
5.10.4 Monitoring systems
The Department of Water Affairs and Forestry (DWAF) collect a few water samples and gauge flows in the
perennial upper reaches of the Klaserie River, whilst staff members of the Kruger National Park assist with flow
gauging and water quality monitoring at two sites along the lower Olifants River.
5.10.5 Water quality data
No water quality data were available for this sub-catchment.

cccxxxiii
5.10.6 Implications for water quality and quantity management
In the absence of any mining activities, there are no implications for water quality or water resources in this sub-
catchment.
5.11 The Lower Olifants (Mozambique) sub-catchment
5.11.1 General description
5.11.1.1 Hydrology
This sub-catchment consists of the lowest portion of the Olifants basin in Mozambique and contains the area
drained by the Olifants River as it emerges into Mozambique from South Africa, down to its confluence with the
lower reaches of the Limpopo River (Figure 4.2). A few small episodic tributary streams also enter the Olifants
River in this sub-catchment and the Olifants River is known in Mozambique as the ‘Rio des Olifantes’.
The large Massingir Dam is located in this sub-catchment and controls all flows in the lower reaches of the
Olifants River before it joins the Limpopo River. Water is released from Massingir Dam to supplement flows in
the lower Limpopo River and to provide irrigation water for the large Chokwe irrigation Scheme. Most of the
small settlements located in this sub-catchment rely either on the Massingir Dam or on shallow hand-dug wells
for their water supplies.
5.11.1.2 Geology
The acidic and intermediate rhyolites and lavas of the Karoo Sequence that form the Lebombo Mountains, mark
the western boundary and dominate the geological features of the lower Olifants sub-catchment. Elsewhere,
extensive Quaternary deposits of the Mazamba, Jofane and Cheringoma Formations, underlie the sub-
catchment. In addition, there are a few outcrops of Grunja and Sena post-Karoo complex rocks that consist
predominantly of alkaline dolerites and shales. Recent alluvial deposits are present along wide flood terraces
on either side of the lower Olifants River.
5.11.1.3 Pedology, agriculture and land use
Soils in the lower Olifants sub-catchment can be divided into three broad groups:
• Areas of sandy colluvial soils at the foot of the Lebombo Mountains, grading into shallow, reddish- or
greyish-coloured sandy-loam soils in the western part of the sub-catchment;
• Deep, brownish to greyish-brown sandy soils overlying coarsely weathered sedimentary rocks in the central
and eastern portion of the sub-catchment; and
• Transported alluvial deposits of coarse to fine-grained sands and silts located along drainage lines and
riverbanks.

cccxxxiv
Land use in the lower reaches of the Olifants River and its few episodic tributaries consists entirely of small-
scale subsistence agriculture and some irrigation, with most cultivated areas being located on flood terraces
close to stream and river channels. Some Mozambican settlements also grow a few Mango and Cashew Nut
trees and raise a few livestock. No towns of any size occur within the sub-catchment.
5.11.1.4 Surface water users
Water use within this sub-catchment consists almost entirely of rain-fed subsistence agriculture and irrigation.
Domestic water supplies to the small settlements located in this sub-catchment are provided primarily from
hand-dug wells.
5.11.1.5 Water management systems
The Mozambican Department of Water Affairs is responsible for management of water supplies and water
quality in this sub-catchment.
5.11.1.6 Human impacts on water resources (excluding mining)
The following activities can be expected to have an impact on water resources in the lower Olifants sub-
catchment:
• De-vegetation and other forms of veld degradation, leading to increased erosion and loads of suspended
sediments in streams and rivers;
• Non-point domestic effluent from numerous small settlements; and
• Minor non-point impact from non-intensive commercial or subsistence agriculture;
5.11.2 Mining and mineral processing operations
None known.
5.11.3 Alluvial mining
None known or anticipated.
5.11.4 Monitoring systems

cccxxxv
In Mozambique, the Mozambican Department of Water Affairs monitors flows in the Olifants River downstream
of the confluence of the Olifants and Shingwedzi rivers as part of its regulation of irrigation water to the Chokwe
irrigation Scheme.
5.11.5 Water quality data
No water quality data are available for this sub-catchment.
5.11.6 Implications for water quality and quantity management
The complete absence of any information on possible mining activities in this sub-catchment prevents
conclusions being drawn.
5.12 Summary of impacts of mining operations on water resources of the Olifants basin
The wide variety of mining operations and mineral processing activities located within the Olifants basin have
differing degrees of impact on both the water resources available to other users and on the water quality of
these resources. From the available data, it seems clear that those mining operations that are located within
low rainfall regions of the basin (predominantly the north-eastern and eastern regions, where physical
weathering processes dominate) have relatively low and/or localized impacts on the water resources. In
contrast, mining operations located in the wetter regions of the basin (predominantly the southern regions,
where chemical weathering processes prevail) tend to have far more extensive impacts. This seems to be due
to the presence of ample moisture within the soil profile that enables continual chemical changes to take place
and allows the water available to mobilize and transport the different contaminants that become available.
A summarized overview of the actual and anticipated impacts of mining operations and mineral processing
plants in each sub-catchment of the Olifants basin is given in Table 5.17. This information provides a useful
impression that could be used to focus water resource management plans and water quality management plans
in the different component areas of the Olifants basin.

cccxxxvi
6. CONCLUSIONS
This study on the impacts of mining and mineral processing on water resources and water quality in the
Zambezi, Limpopo and Olifants basins was carried out within extremely tight time and budget constraints. As a
result, it was not always possible to obtain sufficient information on mining activities or their impacts on water
resources and water quality, nor was it possible to ensure an equitable spread of information between the
different river basins. Nevertheless, despite these constraints, this study represents the first attempt to present
a holistic overview of the extent of mining activities in the three river basins and their actual or potential impacts
on the water resources within these basins.
An important point that must be emphasized at the outset is that this study does not seek to assign blame or to
allege misconduct by any mining operation or water resource management authority. This study simply aimed
to compile, collate, synthesize and analyze available information, and then to present this is a form that could be
used by all stakeholders involved in the “mining and sustainable development” debate.
Although this study was conducted within a very short period of time, a wide range of informed opinion was
consulted and extensive use was made of information available in technical reports and published sources.
Whilst some data sets could not be obtained because they were too costly, the Project Team was still able to
compile, collate and synthesize a considerable amount of information to produce this report. In essence,
therefore, this report represents a first step towards a more comprehensive analysis of the impacts of mining
and mineral processing activities on the biophysical environment. As such, the report should prove to be useful
for a wide range of stakeholders and should also be used as a basis for directing future investigations and
research activities in this arena.
Against this introductory background, it is important to recognize that several types of mining activities in
different geographic areas are under-reported in this document. Similarly, the report does not contain a
comprehensive set of data or information relating to mining and mineral processing impacts on water resources.
In particular, the Project Team had great difficulty in obtaining full details of mining operations in several SADC
countries, and could seldom gain access to sensitive data on water resource and water quality impacts
attributable to mining. These deficiencies should be remedied in future work so that a more complete picture
can be obtained.
Arising from the data and information presented in this report, a series of conclusions have been drawn; these
are presented below in no specific order of precedence.
6.1 The extent and significance of impacts in the three river basins
6.1.1 Acid mine drainage impacts on water resources and water quality

cccxxxvii
Acid mine drainage (AMD) represents the most widespread and pervasive mining-related impact in the three basins studied. Almost all of the mineralised targets for mining consist of sulphide ore bodies or are
contaminated with sulphides, especially iron sulphide (“pyrites”). Whenever these ores are exposed to air and moisture, the sulphide minerals present start to oxidize via a well-known set of autocatalytic reactions to give high concentrations of total dissolved salts (particularly sulphates), low pH values and high concentrations of
dissolved metal ions (especially iron). The resulting solution is toxic to most forms of aquatic life and can lead to dramatic changes in ecosystem functioning as well as changes in the structure and chemical composition of soils. The process of sulphide oxidation is very difficult to stop once it has started and the resulting AMD can
persist for centuries, as proven in some English lead and tin mines.
Specific areas of concern around AMD in the three river basins studied are:
• The prevalence of AMD in the high-sulphur coalfields located within the Olifants basin in South Africa.
These problems of AMD are accentuated both by the number of collieries and by their size, as well as the
long time periods over which they have operated (decades), and the relatively abundant supplies of water
that are available in this area. Water quality changes attributable to AMD from this area can be discerned
(principally as changes in the sulphate to chloride ratio in water samples) for up to two hundred kilometres
downstream in the Olifants River.
• The large-scale AMD problems associated with mines on the Zambian Copperbelt, where numerous, very
large copper mines have operated for decades. Many of the Zambian copper mines appear to have
operated for prolonged periods without due attention being paid to the correct siting and operation of tailings
dams, and proper treatment of effluent before discharge to the Kafue River. Fortunately, the carbonate-rich
local lithology provides some safety in the form of a large buffering capacity that can effectively neutralize
much of the AMD produced. However, this situation is not sustainable indefinitely and concerted effort will
be needed to redesign, and perhaps even relocate, some of the tailings dams, whilst improving general
housekeeping practices and effluent treatment process efficiencies.
• At a smaller scale, gold and base metal mines that exploit these commodities in the different Greenstone
Formations in the three basins studied here also experience problems due to AMD. In these cases,
however, the presence of arsenopyrite in the gangue rock provides an added problem in the form of arsenic
liberation during sulphide oxidation. This arsenic is highly toxic and can have dramatic negative effects on
aquatic ecosystems, coupled to adverse impacts on human health if water users drink contaminated water
downstream of these operations.
• The extent of AMD impacts and perceptions of their severity appears to be closely related to the tendency
for the acidic solution to move away from its source and contaminate water resources progressively further
away from its origin. In sites where the AMD remains close to its source, the severity of the problem is
perceived to be less. This contrasts with situations where the influence of AMD can be seen several tens of
kilometres away from its source; here the problem is perceived to be far worse, even if the total quantities of
acid involved are similar. This so-called “mobility” of AMD, is the result of increased quantities of water
being available to “move” the AMD away from its starting point. The water responsible for “moving” the acid
from its source can be derived either from high local rainfalls, or from mining operations that use large
volumes of process water that must be discarded after use.

cccxxxviii
Where the available moisture exceeds the losses due to evaporation, AMD can be expected to “move” away from its source and pose a larger problem for a mining operation. This tendency is reflected in the use of the Weinert N weathering index. Physical or mechanical weathering processes dominate in areas with a high Weinert N index experience; available moisture levels are low and AMD is seldom a problem. The converse holds for moister areas with a low Weinert N index. Whilst this understanding will not resolve existing AMD problems, it provides useful information as to the most suitable types of effluent processing and control processes that will be needed for new mines in specific areas.
• No universal or permanent “cure” for the AMD “problem” has yet been found, though temporary, site-specific
solutions have been demonstrated in several southern African mining operations. It is therefore possible
that AMD problems will continue to persist for the foreseeable future despite the enormous expenditures
and concerted attention paid to the problem so far. However, despite this somewhat gloomy outlook, the
collaborative COALTECH 2020 initiatives in South Africa have shown real promise in devising innovative
ways to manage the AMD problem. This initiative involves representatives of all the major mining houses,
as well as scientists, engineers and academics, and seems to offer the greatest opportunity of dealing with
the AMD issue successfully.
6.1.2 Impacts due to the release of potentially toxic metals
No mining operation is ever fully successful in recovering every part of the metal or metals that it seeks to
extract. Residual metals that pass through the mining processes enter the external environment where they
have the potential to pose varying types of problem to the biophysical environment. The most noticeable
problems concern the toxicity of nearly all metals when they are present as metal ions in solution. Almost every
metal has the potential to cause some form of harm to aquatic life if it is present in sufficiently high
concentrations. The more important “problem” metals are mercury, cadmium, chrome, vanadium, zinc, copper,
and, to a lesser extent, iron and manganese, because these metals exert toxic effects at relatively low
concentrations if they are present in specific oxidation states or forms.
Specific areas of concern around potentially toxic metals are:
• The release of hexavalent chrome from chrome mining operations and from ferroalloy smelters and
refineries in South Africa and Zimbabwe. If discharged to the aquatic environment, hexavalent chrome can
be extremely toxic to aquatic life.
• The persistent use of mercury to concentrate gold by artisan gold miners poses toxicity risks to the aquatic
environment and to the health of the miners. It appears that almost every artisan gold mining operation in
Malawi, Mozambique, South Africa, Tanzania, Zambia and Zimbabwe uses mercury extraction methods
• Vanadium and chrome contamination of ground and surface waters by vanadium and chrome mines located
on the Bushveld Igneous Complex in South Africa, particularly the Steelpoort Valley and the region around
Rustenburg in the Crocodile sub-catchment.

cccxxxix
• Antimony, cadmium and tin contamination of surface waters in Greenstone Formations mined for these
metals, or as contaminants in gold mining operations located in Greenstone rock formations in South Africa
and Zimbabwe. Specific examples are the Murchison and Giyani Greenstone Formations in South Africa.
• Copper contamination of various levels arising from copper mines and smelters on the Zambian Copperbelt,
the areas close to the Great Dyke in Zimbabwe, the Selibe-Phikwe copper-nickel mine in eastern Botswana
and the Phalaborwa area in South Africa.
• Iron and manganese contamination of surface streams, either in solution or as unsightly oxy-hydroxide
precipitates, caused by aeration of iron-rich acidic solutions associated with pyrite oxidation and AMD.
Specific examples occur in several iron ore mines and in gold and coalmines in South Africa and Zimbabwe.
• Zinc and lead contamination associated with AMD of low-grade ore stockpiles at Kabwe in Zambia and the
Letaba Mine in South Africa.
• Antimony contamination associated with mines located on the Murchison Greenstone Formation in South
Africa.
6.1.3 Impacts due to the release of potentially toxic substances
The most important issues here relates to the potential for contamination posed by organics and solvents used
to separate metals from their ores during the processing phases. Most attention has been paid to cyanide used
in gold mining because of the very large volumes of cyanide that are used and its toxicity to most forms of life.
Importantly, cyanide can exist in numerous different forms and not all of these forms are equally toxic. In
addition, cyanide is rapidly photo-oxidized to harmless carbon dioxide and nitrogen gas in sunlight, thereby
greatly reducing the potential toxicity risk; the general public seldom appreciates this feature.
Discussions with stakeholders have revealed that their specific areas of concern around potentially toxic
substances relate entirely to issues associated with cyanide and are seldom attributable to any specific mine or
mining operation:
• The discharge of cyanide-rich tailings to tailings dams at most gold mines and their subsequent seepage
from these sites into the aquatic environment.
• Inadequate control maintained over cyanide processes on gold mines such that spillages occur and
contamination results.
• Occasional spillages caused by rupturing of cyanide storage tanks at gold mines, resulting in localized
contamination.
• The potential for the release of toxic hydrocyanic acid (HCN) gas from cyanide-rich tailings at most gold
mines.

cccxl
• Small-scale (non artisan) gold mines not being able to adequately manage their cyanidation processes and
causing localized cyanide pollution.
6.1.4 Salinity impacts
The most important issues associated with impacts caused by salinity (or total dissolved salts) relate to the
potential for deterioration water quality for other water users and the aquatic environment. In particular, acid
mine drainage is often closely associated with increased salinity levels and decreased fitness for use of the
water.
Specific areas of concern around salinity impacts are:
• Reduced crop yields when the salinity of irrigation water is increased due to contaminated by mining and
metal processing operations such as those experienced in areas affected by AMD. Specific examples are
those experienced in the middle reaches of the Olifants River downstream of the Witbank and Highveld
coalfields, and the middle reaches of the Crocodile River downstream of the Thabazimbi iron ore mines.
• Flocculation of clay particles in soils irrigated with high salinity water such that the soil structure is adversely
affected. Examples of this feature can be seen along the Middle and Great Letaba rivers where increasing
salinities have exacerbated the dispersive characteristics of some soils near Letaba Ranch.
• Adverse osmotic effects on aquatic plants and animals caused by increased salinity levels and altered
sodium : potassium ratios. In turn, this reduces the ability of aquatic plants to withstand adverse
temperature effects during the summer months, prevents completion of seed-setting and germination
processes, disrupts aquatic plant life cycles and interferes with nutrient transformation processes in the
aquatic environment. Examples of this can be seen in the upper reaches of the Riet, Steenkool and Olifants
rivers where benthic algal communities have been altered by increased salinities and lowered pH values
associated with AMD.
• Decreased rates of photosynthesis in aquatic plants exposed to increased salinity levels leads to reduced
productivity and altered community structures in aquatic ecosystems. Examples of this can be seen in the
lower reaches of the Olifants River where benthic algal communities have disappeared from certain
habitats.
6.1.5 Impacts due to suspended solids
The most important impacts associated with increased suspended solids levels are the often very visible
changes that occur to aquatic habitats and the aquatic biota. Specific areas of concern are:

cccxli
• Decreased light penetration to the bottom sediments, leading to a dramatic loss of benthic photosynthetic
organisms. Examples are to be found in the lower reaches of the Olifants River following sediment scouring
of the Phalaborwa Barrage.
• Clogging of fish gills, preventing them from breathing and leading rapidly to death. This can cause a
dramatic change in the composition of fish populations, with only those species able to breathe air being
able to survive (e.g. Barbel, Clarias gariepinus). Examples of this feature are to be seen downstream of
some clay pits near Pretoria, where large volumes of fine sediments are occasionally released during
rainfalls.
• Coating the surface of aquatic plant leaves with a layer of fine sediments that prevent photosynthesis and
lead to the death of the plants. Examples can be seen in the middle reaches of the Olifants River where
accelerated erosion of mine waste rock piles leads to increased levels of suspended sediments.
• Deposition of (previously suspended sediments onto the bottom of river beds when water flow rates decline
leads to the smothering of both micro- and macro-habitats for aquatic invertebrates. This loss or alteration
of habitat results in a rapid loss of these organisms and interruptions in the food webs of the affected area.
Again, specific examples of this can be seen in the middle and lower reaches of the Olifants River in South
Africa. An additional example is provided by the lower reaches of the Mazowe River in Zimbabwe and
Mozambique where artisan alluvial gold mining has caused a dramatic increase in suspended sediment
levels. A similar situation has been recorded from the artisan alluvial gold mining on the Luenha River in
Mozambique.
• Suspended sediments occur in a variety of different particle sizes and often “carry” considerable quantities
of adsorbed ions, especially metal ions; these present a potential toxicity problem to both aquatic and
terrestrial organisms. Occasional examples of this have been recorded from the Mwambashi River on the
Zambian Copperbelt, where cattle died after drinking river water containing particles of suspended /
adsorbed copper.
6.1.6 Changes to patterns of water supply and demand
All mining activities require water for a wide variety of processes, from dust suppression after blasting and
during ore conveying, to dissolution of the commodity of interest and to transportation of waste sludge and
tailings to disposal sites. In addition, water is also needed for domestic purposes for mine workers and their
families. Impacts associated with changes to patterns of water supply and demand are normally greatest in arid
and semi-arid areas. Specific concerns relate to:
• In arid areas, the quantity of water required by a specific mining operation can have a dramatic influence on
the regional water balance. Inevitably, the promise of economic returns from mining will have an influence
on decision-making by water supply authorities as to whether or not the required water should be supplied.
In turn, the provision of water to a mining operation will mean that less water is available for other users,
including the aquatic environment.

cccxlii
• Any effluent discharged by a mining operation affects the quality of the receiving environment and the
fitness of the receiving water for other users. In arid areas, mining effluents lead to increased salinities and
their associated effects. Examples of this can be seen in the drier regions of all three of the river basins
evaluated in this report.
• Importantly, mining operations need reliable water supplies that will be provided with a very high level of
assurance. This is necessary to avoid the risk of any processing problems in the hydro-metallurgical
processes that may be caused by water shortages. Because of the unreliability and variability of rainfall in
many parts of southern Africa, dams and water supply reservoirs are needed to ensure that the mining
operations receives the water it needs. Construction of a dam on a river has far-reaching impacts on both
ground water and river flows, as well as water quality, downstream of the structure. Typical examples can
be seen at the Phalaborwa Barrage in the Olifants basin, downstream of the Vinetia Diamond Mine near the
Limpopo River, and downstream of the Selibe-Phikwe copper-nickel mine near the Macloutse River in
Botswana. Similar, related, effects occur when hydroelectric impoundments are built to supply electricity
needed for mining and for metal refineries. The Kariba Dam that supplies electrical power to the Zambian
Copperbelt is a good example of this type of effect.
6.1.7 Impacts caused by small-scale (artisan) mining
Small-scale mining activities, particularly the unlicensed (artisan) type, seldom have access to appropriate
technologies or mining methods. Most of the activities are not subject to proper health, safety and
environmental controls, nor are they easily manageable by mining authorities. Specific concerns relate to:
• Accelerated erosion of areas adjacent to workings that have been de-vegetated for construction materials or
fuel wood leads to increased suspended sediment loads in nearby streams and rivers. Examples of this can
be seen around the Ndola Rural emerald workings and the Lundazi aquamarine workings in Zambia
• Excavation of flood terraces and riverbanks increases the instability of these riverbanks and enhances the
likelihood of increased flood scouring. Examples of this have been recorded from alluvial gold diggings on
the Mazowe River in Zimbabwe and Mozambique.
• Excavation of river sediments exposes these sediments to oxidizing conditions and enhances the
solubilization and release of any metal ions that may previously have been previously trapped as insoluble
sulphides. Examples of this can be seen in the Mazowe River in Zimbabwe.
• Gold panning and operation of sluice boxes increases loads of suspended sediments in downstream
reaches. Examples of this have been recorded from the alluvial gold diggings on the Luenha River in
Mozambique, the Mazowe River in Zimbabwe and Ruhuhu River in Tanzania.
• Washoff of mercury used to concentrate gold leads to increased risks of mercury toxicity to aquatic and
terrestrial organisms, as well as to the miners. Examples of this have been recorded on the Mazowe alluvial
gold diggings in Zimbabwe.

cccxliii
6.1.8 “Peripheral” or indirect impacts linked to mining
The pivotal nature of mining activities in the general development of southern Africa means that they inevitably
have had several “peripheral” or indirect impacts on the biophysical environment. A few specific examples are
highlighted here to sketch the scope of the concerns:
• The influx of miners and their families and dependents into existing and new mining areas is often
accompanied by the development of informal and unserviced settlements. In turn, these are characterized
by poor or inadequate sanitation systems with the result that nearby watercourses become contaminated
with sewage and domestic garbage. This can be clearly seen in several areas of the Zambian Copperbelt
(See Figure 3.15) in the Kafue sub-catchment of the Zambezi basin, as well as the platinum and chrome
mines of the Crocodile sub-catchment in the Limpopo basin and the Witbank and Highveld coalfields in the
Olifants basin of South Africa.
• Settlements that develop in the peripheral areas of mining operations often rely on subsistence agriculture
for their livelihoods. This results in progressive de-vegetation of the areas around such mines as trees are
cleared for fuel wood and to open up areas for cultivation. Good examples of this can be seen around many
towns on the Zambian Copperbelt (See Figure 3.15). In extreme cases, the subsistence agriculture may
extend into local wetlands or ‘dambos’, thereby reducing their ability to attenuate stream flows and prevent
flooding.
• Increased population numbers places greater pressure on every natural resource in an area. This pressure
varies from demands for fuel and water, housing and construction materials, to accelerated exposure of the
catchment surface to erosion processes. Singly, many of these effects may well be non-significant.
However, when they occur simultaneously, their significance may increase by orders of magnitude. Once
again, these “cumulative effects” are clearly visible on the Zambian Copperbelt.
• The construction of the Kariba Dam to provide an assured source of hydroelectric power (principally for the
Zambian Copperbelt, but also for cities and towns in Zimbabwe) had a number of “unanticipated” or
“peripheral” effects. Whilst the most noticeable of these was probably the dramatic rescue of thousands of
animals from newly flooded areas and the explosive spread of Kariba Weed on the newly formed lake, some
55,000 people had to be resettled from the flood basin. This had a sequence of profound social and
economic consequences that had not been anticipated and the process has helped to fuel the growing
debate on the relative costs and benefits associated with the construction of large dams.
6.2 Current management approaches to prevent, minimize and abate impacts caused by mining operations
Over the years, increasing consciousness of the need to minimize impacts on the biophysical environment has
driven considerable international and local debate around the impacts of mining and mineral processing

cccxliv
operations. This has proceeded in tandem with a mounting awareness that modern society is completely reliant
on minerals and the goods and services acquired from and/or with minerals. The process has been
accompanied by new and progressive developments in regional and international legislation that seek to
balance the costs of environmental impacts to society against the benefits derived so as to ensure greater
equity for all beneficiaries and stakeholders.
Most miners are fully aware that it makes good business sense to prevent unnecessary impacts and that
efficient management of their mining operations will help to maintain costs at low levels. In achieving a balance
between the need to minimize impacts on the environment, enhance the wider social benefits of mining, and
maintain shareholder confidence in their investments, the mining sector as a whole has had to collaborate
progressively more closely. This has helped to develop a wider acceptance of mining amongst society in
general and has allowed mine operators the opportunity to demonstrate their commitment to sustainable
development principles. Some examples of current and proposed management approaches in the mining
sector as a whole are listed below.
6.2.1 Improved and harmonized legislation
In the past, mining has been subject to legislation that contained conflicting principles, policies and requirements
and was passed by several different government departments. This made it extremely difficult for mine
operators to comply fully with legislation and exposed them to unnecessary legal problems. Recent
developments include:
• In each southern African country, greater attention is being paid to harmonizing different pieces of
legislation that control or affect mining activities and their consequences in an effort to eliminate
inconsistencies and unnecessary duplication of effort. This activity is being extended beyond national
borders in an effort to ensure that the different pieces of legislation in each SADC country are aligned and
congruent with one another.
• The new draft Minerals Bill in South Africa represents a fundamentally new way of approaching the whole
issue of mineral rights and the responsibilities of the different parties involved in mineral exploitation
activities. Government is consulting with all stakeholders in the process of developing specific clauses in
the new Minerals Bill.
• In South Africa, the Department of Mineral and Energy Affairs is in the process of revising and updating the
Aide Mémoire for environmental management programmes on mines. This will facilitate prevention of
environmental impacts (particularly those on the water environment) and assist mine management to
undertake targeted remedial actions where these are required.
6.2.2 Improved stakeholder participation in decision-making

cccxlv
Worldwide, the general public has expressed a keen desire to participate fully in all aspects of decision-making
and southern Africa is no exception to this trend. The governments of all SADC countries are extending the
range of debates and processes that enable all stakeholders to contribute. Some typical examples are listed
below:
• The proponents of all new developments (including mining) are required to identify and seek out the
relevant stakeholders and help them to participate fully in decisions that may affect their livelihoods.
• The Environmental Impact Assessment (EIA) process is now established in almost all SADC countries and,
in each case, stakeholder participation is required by law.
• Water resource management legislation in several SADC countries now makes specific provision for
stakeholders to take an active part in decision-making processes and in the execution of water conservation
and management practices.
• The SADC protocols on water resource management and the sharing of trans-boundary watercourse
systems have been ratified by all SADC states and represent two examples where all the countries in the
region will ensure full collaboration.
6.2.3 Collaborative, industry-wide initiatives
In the past, many different mining companies tended to develop their own, in-house solutions to specific
problems that affected their operations and these were seldom shared with competing companies. Inevitably,
this led to considerable duplication of effort and unnecessary expenditure in those areas where the problems
that were tackled were common to all mining operations (e.g. acid mine drainage). Gradually, this situation has
changed until, today, there is widespread inter-company collaboration. Two examples will suffice here:
• A consortium of gold mining companies in South Africa and Australia collaborated closely on a detailed
research programme that was designed to better understand the chemistry of cyanide in gold mine tailings,
and to develop appropriate treatment technologies and management actions.
• The COALTECH 2020 project involves representatives from the coal mining industry, government
departments, consulting engineers and scientists, academics and local authorities in a team-based
approach to the multi-facetted problems facing the South African coalmining industry. One of the most
intractable problems that is being addressed in this project is the thorny issue of acid mine drainage from
collieries. The most promising approaches so far identified include joint efforts to trap and collect acid mine
drainage, followed by its treatment at centralized treatment facilities. This would bind the different
coalmining companies into an effective partnership and help to eliminate situations where one mine might
neglect its responsibilities.
6.2.4 Use of specific technologies for effluent treatment

cccxlvi
Over the years, considerable attention has been paid to the development and refinement of cost-effective
treatment technologies for almost all of the important contaminants found in mine wastes. Whilst the specific
configuration of a particular treatment process will depend on the detailed chemistry of the waste stream to be
treated, the generic technologies are now well understood. One example will suffice:
• The Water Research Commission and the firm Pulles Howard and DeLange have produced a series of
detailed manuals describing specific effluent treatment processes that can deal with the important
contaminants found in mine wastewaters. This information provides a firm foundation that enables a mine
operator to customize a particular process to suit his specific circumstances. The manuals also define
clearly the administrative processes that must be followed to obtain effluent discharge permits.
6.2.5 Environmental management systems
In recent years, there has been far greater awareness of the need for effective and efficient management
control systems that will help to maximize the effectiveness of waste control systems, ensure a standard level of
quality control, and make sure that all staff members within a mining operation are fully aware of their
responsibilities. The most widespread systems in use today are those of the International Standards
organization (ISO), in particular the ISO14000+ series of environmental management systems. The added
benefit of these systems is that they represent an internationally accepted system of accreditation and
certification that provides all stakeholders with a guarantee of specific levels of performance and care.
• Unfortunately, not all mining operations have implemented a formal system of environmental management
such as the ISO14000+ system advocated here. Many smaller mines, all alluvial gold mining operations
and most quarrying operations have no formal environmental management system in place.
• A concerted effort should be made by the relevant authorities to enhance the awareness of all mine
operators that an environmental management system such as the ISO 14000+ series will help to minimize
any adverse effects their operations may have and will also help to improve the effectiveness and efficiency
of their operations.
7. RECOMMENDATIONS
Arising from the detailed findings presented and the conclusions drawn in this report, the following five
recommendations can be made:
1. That this report be accepted as having fulfilled the requirements set out in the Terms of Reference for
this assignment;

cccxlvii
2. That copies of this report should be circulated to relevant stakeholders in the MMSD (SOUTHERN AFRICA)
Project and its Steering Committee;
3. That the detailed conclusions drawn in Section 6 of this report should be studied carefully and,
wherever appropriate, the necessary remedial actions and decisions should be taken by the relevant
stakeholders;
4. That the specific recommendations listed in Table 7.1 should be carefully evaluated by the MMSD
(SOUTHERN AFRICA) Project Team and that copies be communicated to all the relevant stakeholders;
and
5. That a copy of this report be provided to the SADC Mining Sector Co-ordinating Unit to assist them in
their efforts to develop and expand the mining industry in all SADC countries.

cccxlviii
8. REFERENCES
Anhaeusser, C.R. & S. Maske (Eds) (1986). The Mineral Deposits of Southern Africa, Volumes I and II. The Geological Society of South Africa, Johannesburg. 2376 pp. Annandale, J.G., N.Z. Jovanovic, N. Benade & P.D. Tanner (1999). Modelling the long-term effect of irrigation with gypsiferous water on soil and water resources. Agriculture, Ecosystems and Environment, 76(2-3): 109-119. Ashton, P.J. (1999). Using environmental impact assessments to determine the consequences of mining
activities and to highlight the costs of sustainable development. In: Proceedings of the Conference on
Environmental Management Systems in Mining, 11-13 October 1999, Kempton Park, South Africa. 12pp.
Ashton, P.J. (2000). Southern African water conflicts: are they inevitable or preventable? In: Solomon, H. and
Turton, A.R. (eds), Water Wars: Enduring Myth or Impending Reality, Africa Dialogue Monograph Series No. 2.
The African Centre for the Constructive Resolution of Disputes (ACCORD), Durban, South Africa, pp. 62-105.
Ashton, P.J. (2001). Avoiding conflicts over Africa’s water resources. Ambio, (submitted for publication).
Ashton, P.J. & B. Haasbroek (2001). Water demand management and social adaptive capacity: A South African case study. In: (A.R. Turton & R. Henwood (Eds), “Hydropolitics in the Developing World: A Southern African Perspective”. African Water Issues Research Unit (AWIRU) and International Water Management Institute (IWMI), Pretoria. 21 pages (In press).
Ashton, PJ & H.M. MacKay (1996). The philosophy and practice of integrated catchment management:
implications for water resource management in South Africa Water Research Commission Report TT81/96.
Ashton, P.J. & V. Ramasar (2001). Water and HIV/AIDS: Some strategic considerations in southern Africa. In:
(A.R. Turton & R. Henwood (Eds), “Hydropolitics in the Developing World: A Southern African Perspective”.
African Water Issues Research Unit (AWIRU) and International Water Management Institute (IWMI), Pretoria.
20 pages (In press).
Asmal, K. (1998). Water as a metaphor for governance: issues in the management of water resources in Africa.
Water Policy, 1: 95-101.
Aström, M. (1998). Mobility of Al, Co, Cr, Cu, Fe, Mn, Ni and V in sulphide-bearing fine-grained sediments
exposed to atmospheric O2: an experimental study Environmental Geology 36 219-226.
Baglow, N. (1998). The geology of the Filabusi Greenstone Belt and surrounding granitic terrain Zimbabwe
Geological Survey Bulletin 91.
Baldock, J.W. (1991). The geology of the Harare Greenstone Belt and surrounding granitic terrain Zimbabwe
Geological Survey Bulletin 94.

cccxlix
Banks, D., P.L. Younger, R.T. Arnesen, E.R. Iversen & S.B. Banks (1997). Mine-water chemistry: the good, the bad and the ugly. Environmental Geology, 32(3): 157-174.
Bartholomew, D.S. (1990a). Base metal and industrial mineral deposits of Zimbabwe Zimbabwe Geological
Survey Mineral Resources Series 22.
Bartholomew, D.S. (1990b). Gold deposits of Zimbabwe Zimbabwe Geological Survey Mineral Resources
Series 23.
Barton,C.M., J.N. Carney, M.J. Crow, P.N. Dunkley & S. Simango (1991). The geology of the country around
Rushinga and Nyamapanda Zimbabwe Geological Survey Bulletin 92.
Basson, M.S., van Niekerk, P.H. & J.A. van Rooyen (1997). Overview of Water Resources Availability and
Utilisation in South Africa. Department of Water Affairs & Forestry and BKS (Pty) Ltd., DWAF Report No. P
RSA/00/0197, Pretoria. 72 pp.
Beukes, J.S. (2000). COALTECH 2020: A South African coal mining collaborative research programme. Plenary
paper delivered at the 12th ICCR Conference on Coal Research, 12-15 September 2000. 11 pp.
Biswas, A.K. (1993). Management of International Water: Problems and Perspective. UNESCO, Paris. 142 pp.
Boroto, R.A.J. & A.H.M. Görgens (1999). Hydrological Modelling of the Limpopo River Main Stem. Report by
Department of Civil Engineering, University of Stellenbosch and Ninham Shand Consulting Engineers, to
Department of Water Affairs & Forestry. DWAF Report No. PA000/00/0399. 105 pp.
Booth, A (1994). Pollution. In: (Chenje, M. & Johnson, P. Eds), State of the Environment in Southern Africa.
Southern African Research & Documentation Centre, Harare. Pp. 227-252.
Bowell-R.J., A. Warren, H.A. Minjera & N. Kimaro (1995). Environmental impact of former gold mining on the Orangi River, Serengeti National Park, Tanzania. Biogeochemistry, 28(3): 131-160. Brink, A.B., A. Van Schalkwyk, T.C. Partridge, D.C. Midgley, J.M. Ball & S.J. Geldenhuis (1990). The changing impact of urbanization and mining on the geological environment. South African Journal of Science, 86(7-10): 434-440. Brown, S.A.P. (1992). Water quality management regarding the mining industry. EMPRs - The water quality management aspects. Proceedings of the Symposium on Environmental Management in the Mining Industry, 26 Nov 1992, Randfontein Estates Gold Mine, South Africa. 5 pp. Brown, S.A.P. (1995). Middle Steelpoort River Catchment: Groundwater Management Plan. Situation Analysis. Volume 5. Effect on Irrigation Water by Tweefontein Chrome Mine. Report to the Department of Water Affairs & Forestry by Wates, Meiring & Barnard Inc., WMB Report No. 2733/1118/16/W. 76 pp.

cccl
Campbell, S.D.G. & P.E.J. Pitfield (1994). Structural control of gold mineralisation in the Zimbabwe Craton –
exploration guidelines Zimbabwe Geological Survey Bulletin 101.
Carl Duisberg Gesellschaft (1999). Report on the International Round Table on Mining and the Environment:
Berlin 22 – 26 November 1999. Carl Duisberg Gesellschaft e.V, Berlin. 63 pp.
Caruso, B.S. & R.C. Ward (1998). Assessment of non-point source pollution from inactive mines using a watershed-based approach. Environmental Management, 22 (2): 225-243. Cave, A.N. (1978). Strip mining: The environmental consequences. South African Mining and Engineering Journal, 89: 71-83. Channon, W.P. (1991). Two gold heap leach operations in Zimbabwe African Mining ’91 London: Elsevier Applied Science and Institute of Mining Metallurgy. Chenje, M. (Ed.) (2000). State of the Environment in the Zambezi Basin 2000. Report by Southern African Development Community (SADC-ELMS and WSCU), World Conservation Union (IUCN), Zambezi River Authority (ZRA) and Southern African Research and Documentation Centre – Musokotwane Environment Resource Centre for Southern Africa (SARDC-IMERCSA). Maseru, Lusaka, Harare. 334 pp. Chenje, M., L. Sola & D. Paleczny (Eds) (1998). The State of Zimbabwe’s Environment 1998 Harare: Ministry of Mines, Environment and Tourism [now Ministry of Environment and Tourism]. Chivasa, M. & M. Chenje (1996). Climate and water availability, in Chenje, M and Johnson, P, Eds: Water in Southern Africa. Harare: Southern African Development Community, International Union for the Conservation of Nature and Southern African Research and Documentation Centre.
Chiyanike, T. (1997). Some notes on alluvial gold mining in Zimbabwe Annals of the Zimbabwe Geological
Survey 18, 37-41.
CIA (2000). The World Factbook (Country Listing). Central Intelligence Agency of the
United States of America, [Online]. Accessed on 12 June 2001. Available at website:
(http://www.cia/gov/cia/publications/factbook/geos/).
Cole, D.I. (1998). Diamonds in the SADC Region. Southern African Development Community Mining Sector
Coordinating Unit, Mineral Resources Survey Programme No. 3. Council for Geoscience, Pretoria. 52 pp.
COM (Chamber of Mines) (1994). Environmental Management Guidelines for Mining and Exploration in
Zimbabwe Harare: COM.
Craig, J.R. & D.J. Vaughan (1981). Ore Microscopy and Ore Petrography Chichester: John Wiley and Sons.
Crowson, P. (1997). Issues and challenges for the mining industry. Chamber of Mines Journal, 39(6): 49-50.

cccli
CSIR (1993). An Environmental Impact Report for the Proposed Underground Extension at the Palabora Mine. Report to Palabora Copper Mine by Division of Water, Environment & Forestry Technology, CSIR, Pretoria. 155 pp. CSIR and Wates, Meiring & Barnard (1993). Phalaborwa Mining and Industrial Complex: Lower Selati and Olifants Rivers Waste Load Allocation and Investigation of Water Use and Wastewater Options – Volumes 1 - 3. Report to Foskor Ltd, Palabora Mining Company Ltd and Fedmis – Phalaborwa Ltd., by CSIR, Pretoria. 256 pp. Dalal-Clayton, B. (1997). Southern Africa Beyond the Millenium: Environmental Trends and Scenarios to 2015. Environmental Planning Issues No. 13, International Institute for Environment and Development, London. 104 pp.
Dallas, H.F. & J.A. Day (1993). The effect of water quality variables on riverine ecosystems: a review Water
Research Commission Report TT61/93.
Delli Priscoli, J. (1998). Water and civilization: Conflict, cooperation and the roots of a new eco-realism. In:
Proceedings of the Eighth Stockholm World Water Symposium, 10-13 August 1998, Stockholm, Sweden. 17 pp.
Department of Minerals and Energy (1992). Aide Mémoire for the Preparation of Environmental Management
Programme Reports for Prospecting and Mining. Department of Minerals and Energy, Pretoria. 34 pp.
Dill, S. (1998). Biotechnology in mine water treatment: environment. Mining World, 3: 34-36.
DNP&WM (Department of National Parks and Wildlife Management) (1990). Kazuma Pan National Park
Information brochure, Harare: DNP&WM.
Dollhopf, D.J., G.W. Wendt, J.D. Goering & D.W. Hedberg (1979). Hydrogeology of a watershed with subirrigated alluvial materials in crop production. I. Mined land reclamation. Montana Agricultural Experiment Station Bulletin No 715. 86 pp.
Driscoll, C.T. & E.D. Schecher (1990). The chemistry of aluminum in the environment Environmental
Geochemistry and Health 12, 28-49DRSS (Department of Research and Specialist Services) 1979. Provisional
Soil Map of Zimbabwe Rhodesia 2nd Edition, Harare: DRSS.
Duda, A.M. & D.L. Penrose (1980). Impact of mining activities on water quality in western North Carolina. Water Resources Bulletin, 16(6): 1034-1040. Du Plessis, H.M. & A.G. Reynders (1992). Potential impact of gold mines on the surface water environment. EMPRs - the water quality management aspects. Proceedings of the Symposium on Environmental Management in the Mining Industry, 26 Nov 1992, Randfontein Estates Gold Mine, South Africa. 2 pp. Du Toit, A.L. (1956). The Geology of South Africa. Oliver and Boyd, London. 611 pp.
DWAF (Department of Water Affairs and Forestry [of South Africa]) (1996). Domestic Use South African Water
Quality Guidelines 1 2nd Edition.
Edmunds, W.M. & P.L. Smedley (1996). Groundwater geochemistry and health: an overview In: Appleton, JD,
Fuge, R and McCall, GJH, Eds, Environmental Geochemistry and Health, with special reference to developing
countries Geological Society Special Publication 113, 91-105.

ccclii
Environment Canada (1996). The State of Canada’s Environment. Government of Canada, Ottawa. 237 pp.
Environmental Policy Initiative (2001). Mining, Environment and Sustainable Development Update. EPI News
No.9, Cape Town.
Evans, K.G. (2000). Methods for assessing mine site rehabilitation design for erosion impact. Australian Journal of Soil Research, 38(2): 231-247.
Falkenmark, M. (1986). Fresh water – time for a modified approach. Ambio, 15(4): 192-200.
Falkenmark, M. (1989). The massive water scarcity now threatening Africa: why isn't it being addressed? Ambio,
18(2): 112-118.
Falkenmark, M. (1994). The dangerous spiral: near-future risks for water-related eco-conflicts. In: Proceedings of
the ICRC Symposium "Water and War: Symposium on Water in Armed Conflicts", International Committee of the
Red Cross, Montreux, Switzerland, 21-23 November 1994. 16 pp.
Falkenmark, M. (1999). Competing freshwater and ecological services in the river basin perspective - an
expanded conceptual framework. In: Proceedings of the SIWI/IWRA Seminar "Towards Upstream/Downstream
Hydrosolidarity", Stockholm. pp.: 19-30.
FAO. (2000a). New Dimensions in Water Security - Water, Society and Ecosystem Services in the 21st Century.
Land and Water Development Division, Food and Agriculture Organization of the United Nations, Rome. FAO
Report: AGL/MISC/25/2000. 82pp.
FAO. (2000b). Aquastat Information Service on Water in Agriculture and Rural Development. Food and
Agriculture Organization of the United Nations, Land and Water Division.
(http://www.fao.org/waicent/FaoInfo/Agricult/AGL/AGLW/AQUASTAT/afric.htm).
Fernando, Q. (1995). Metal speciation in environmental and biological systems. Environmental Health
Perspectives 103 (Suppl 1) 13-16.
Fitzgerald, J.V.V. (1902). The Law affecting the Pollution of Rivers and Water Generally London: Knight.
Förstner, U. & W. Salomong (1991). Mobilization of metals from sediments In: Merian, E, Ed Metals and Their
Compounds in the Environment: occurrence, analysis and biological relevance Weinheim, Germany: VCH
Verslagsgesellschaft, 379-398.
Frimpter, M.H. & A. Maevsky (1979). Geohydrological impacts of coal development in the Narragansett Basin, Massachusetts and Rhode Island. USA Geological Survey Water Supply Paper 2062. 35 pp.

cccliii
Fuggle, R.F. & M.A. Rabie (1996). Environmental Management in South Africa. Juta & Co,
Johannesburg. 823 pp.
Funke, J.W. (1990). The Water Requirements and Pollution Potential of South African Gold and Uranium Mines. Water Research Commission Report No. KV9/90, 197 pp.
Garson, M.S. (1995). The geology of the BulawayoGreenstone Belt and surrounding granitic terrain Zimbabwe
Geological Survey Bulletin 93.
Gleick, P.H. (1993). Water and conflict: fresh water resources and international security. International Security,
18(1): 84-117.
Gleick, P.H. (1998). The World's Water 1998-1999: Biennial Report on Freshwater Resources. Island Press,
Washington DC. 217 pp.
Gleick, P.H. (1999). The human right to water. Water Policy, 1: 487-503.
Gratwicke, B. (1999). The Effects of Season on a Biotic Water Quality Index: a case Study of the Yellow Jacket
and Mazowe Rivers BSc Honours project report, Department of Biological Sciences, University of Zimbabwe.
Hettler, J., G. Irion & B. Lehmann (1997). Environmental impact of mining waste disposal on a tropical lowland
river system: a case study on the Ok Tedi mine, Papua New Guinea Mineralium Deposita 32, 280-291.
Heyns, P.S.v.H. (1995). The Namibian perspective on regional collaboration in the joint development of
international water resources. International Journal of Water Resources Development, 11(4): 483-491.
Hodgson, F.D.I. & R.M. Krantz (1999). Possible deterioration of groundwater quality in the Olifants River catchment investigated: groundwater. SA Water Bulletin, 25(5): 17-18. Holz, P. (1994). Controlling the impact: environment. South African Mining, Coal, Gold & Base Minerals, 19.
Homer-Dixon, T. & V. Percival (1996). Environmental Scarcity and Violent Conflict. Report of the Population and
Sustainable Development Project, American Association for the Advancement of Science and University of
Toronto, Washington DC.
Hounsome, R. & P.J. Ashton (2001). Sustainable Development for the Mining and Minerals Sector in Southern Africa. Draft Position Paper for the Mining, Minerals and Sustainable Development Project (MMSD SOUTHERN AFRICA), Stellenbosch. 16 pp. Hungwe, A. (1998). Water resources management in Zimbabwe: water resources. Chamber of Mines Journal, 40(1): 31-37. Jennett, J.C. & J.L. Foil (1979). Trace metal transport from mining, milling and smelting watersheds. Journal of the Water Pollution Control Federation, 51(2): 378-404.

cccliv
Johnson, M.S., Cooke, J.A. & J.K.W. Stevenson (1994). Revegetation of Metalliferous Wastes and Land after
Metal Mining. In: (Hester, R.E. & R.M. Harrison, Eds), Mining and its Environmental Impact. Royal Society of
Chemistry, Cambridge.
Johnstone, A. & I. Du Toit (1997). Session 6. Coal mines and groundwater predictions of impacts. Proceedings of the Second International Conference on Mining and Industrial Waste Management, 2 to 4 Jun 1997, Johannesburg, South Africa. 8 pp. Kelly, D. (2000). World-first mine water treatment plant soon to become a reality. Mining Mirror, 12(8): 10-13.
Kelly, M. (1988). Mining and the Freshwater Environment London: Elsevier Applied Science.
Khanna, T. (2000). Mining and the environmental agenda: green topics. Journal of the South African Institute of Mining & Metallurgy, 100(1): 45-47. King, L.C. (1951). South African Scenery. Oliver and Boyd, London. 379 pp.
King, T.V.V (Ed.) (1995). Environmental considerations of active and abandoned mine lands: lessons from
Summitville, Colorado United States Geological Survey Bulletin 2220.
Kirby, C.S. & J.A. Elder Brady (1998). Field determination of Fe2+ oxidation rates in acid mine drainage using a
continuously-stirred tank reactor Applied Geochemistry 13 509-520.
Kruger, F.J. & T. Greyling (1997). Sustainable development and the environment: lessons from the St Lucia Environmental Impact Assessment. South African Journal of Science, 93(1): 23-33.
Leitner, E.G. & A.E. Phaup (1974). The geology of the country around Mount Darwin Zimbabwe Geological
Survey Bulletin 73.
Light, M.P.R. & T.J. Broderick (1998). The geology of the country east of Beitbridge Zimbabwe Geological
Survey Bulletin 87.
Livingstone, S.W. (1999). Environmental Impact Statement for the Development of a Slag Smelter and Support
Infrastructure for Project COSAC - the Processing of Cobalt Rich Slag from the Nkana Smelter. Report submitted
to Chambishi Metals PLC in terms of The Mines and Minerals (Environmental) Regulations, 1997, of the
Government of the Republic of Zambia. 126 pp. + maps, diagrams and attachments.
Loos, M.A., J.M. Conradie, P.A. Whillier, J. Maré & C. Bosch (1990). Research on the inhibition of bacterial
oxidation of pyrite and concomitant acid mine drainage: Part 1. Investigation of gold sand dumps. Water
Research Commission Report 132/1/90.
Love, D. & D.K. Hallbauer (1999). Implications of the National Water Act (Act No 36 of 1998) for water quality
management in the mining industry Ninth South African National Hydrology Symposium, University of the
Western Cape, Bellville, 29-30 November.

ccclv
Love, D. & D.K. Hallbauer (2000). Mining and integrated catchment management under the National Water Act
Geocongress 2000, University of Stellenbosch, July 2000. Published in Journal of African Earth Sciences 31
(1A), 41.
Love, I. in preparation. The chemistry of gold extraction in Zimbabwe (manuscript in preparation).
Lundqvist, J. (1999). Rules and roles in water policy and management - classification of rights and obligations.
In: Proceedings of the SIWI/IWRA Seminar "Towards Upstream/Downstream Hydrosolidarity", Stockholm. pp.:
61-67.
Mabvira-Meck, M. (1999). Minimising the effects of mining on water quality. Chamber of Mines Journal, 41(10): 12-15.
Machena, C. (1997). The pollution and self-purification capacity if the Mukuvisi River in Moyo, NAG, Ed, Lake
Chivero: a Polluted Lake Harare: University of Zimbabwe Publications.
Magalela, W. (1997). Some aspects of saline ground waters in the Gokwe District Annals of the Zimbabwe
Geological Survey 18, 32-36.
Marsden, J. & I. House (1993). The Chemistry of Gold Extraction Hemel Hempstead: Ellis Horwood.
Marneweck, G., A.L. Batchelor & J. Turpie (2001). Ecological and Economic Valuation of Wetlands in the
Upper Olifants Catchment. Water Research Commission Project Report No. K5/1162. (In progress).
Marszalek, H. & M. Wasik (2000). Influence of arsenic-bearing gold deposits on water quality in Zloty Stok mining area (SW Poland). Environmental Geology, 39(8): 888-792.
Mathesen, M., S.S. Kim & F.M. Doyle (1997). Stabilization of mining wastes to mitigate acid rock drainage and
permit revegetation University of California Toxic Substances Research and Teaching Program Research
Abstract.
Mathuthu, A.S., K. Mwanga & A. Simoro (1997). Impact assessment of industrial and sewage effluents on the
water quality of the receiving Marimba River in Harare in Moyo, NAG, Ed, Lake Chivero: a Polluted Lake
Harare: University of Zimbabwe Publications.
Matter, W.J. & J.J. Ney (1981). The impact of surface mine reclamation on headwater streams in southwest Virginia. Hydrobiologia, 78(1): 63-71.
Mbendi (2000). Mbendi Information For Africa. Mining and Industrial Statistics for Individual SADC Countries,
[Online]. Accessed on 17 June 2001. Available at website: (http://mbendi.co.za/indy/ming/af/).
Mendelsohn, F. (Ed.) (1961). The Geology of the Northern Rhodesian Copperbelt. Macdonald, London. 523 pp.
Mikhailov, A., P.H.G.M. Dirks & B. Barber (2000). A Gold Investment Guide for Zimbabwe Harare: Zambezi
Explorations Pvt. Ltd.

ccclvi
Mining Journal (1996). Water issues when mines close. Mining Journal 13/09/96.
Moffat, J.W. (1997). The relationship between copper speciation and cyanobacteria distribution in harbors and
other coastal environments Woods Hole Oceanographic Institute Grant/Contract Summary N00014-93-1-0833.
Moyo, N.A.G. (Ed.) (1997). Lake Chivero: a Polluted Lake Harare: University of Zimbabwe Publications.
Mukuzunga, F. (1997). ITDG leads research into environmental impact of mining. Chamber of Mines Journal, 39(6): 24. Mwale, A. (1994). An Overview of the Environmental Impact of the Copper Industry on the Quality of the Kafue River Basin. Unpublished Masters Thesis, University of Wales, Bangor. Mwase, M. (1994). Biological Impact of Anthropogenic Emissions on Fish Living in the Kafue River, Zambia, with Special Reference to Metals and Pesticides. Unpublished Masters Thesis, Department of Pathology, Faculty of Veterinary Medicine, Swedish University of Agricultural Sciences. Nkandu, C. (1996). An Investigation into the Effects of Mining and Other Operations on the Water and Air Quality in the Chingola Area of the Zambian Copperbelt. Environmental Research Report, Zambia Mines Safety department, Kitwe, Zambia. Norrgren, L., U.T. Pettersson, S. Öhrn & P.-A. Bergqvist (2000). Environmental monitoring of the Kafue River, Zambia, using caged threespot Tilapia (Oreochromis andersonii). Archives of Environmental Toxicology, (In Press).
Ohlsson, L. (1995a). Water and Security in Southern Africa. Publications on Water Resources, No. 1. Swedish
International Development Agency (SIDA), Department for Natural Resources and the Environment.
Ohlsson, L. (1995b). The role of water and the origins of conflict. In: Ohlsson, L. (ed.), Hydropolitics: Conflicts
Over Water as a Development Constraint. Zed Publishers, London. 236 pp.
Olson, G.J. & S.C. Turbak (1979). Impact on western coal mining. 2. Microbiological studies. Water Research, 13(11): 1033-1041. Pallett, J. (1997). Sharing Water in Southern Africa. Desert Research Foundation of Namibia, Windhoek, Namibia. 121 pp. Pentz, S.B. & R.A. Kostaschuk (1999). Effects of placer mining on suspended sediment in reaches of sensitive fish habitat. Environmental Geology, 37(1-2): 78-89. Pettersson, U.T. & J. Ingri (1993). The Effects of Mining Activities on Water Quality in the Kafue River, Copperbelt, Zambia: A Pilot Study. Unpublished Master of Geotechnology Thesis, Tulea 1993:44. Luleå University of Technology, Sweden. Pettersson, U.T. & J. Ingri (2000a). Dissolved, suspended and deposited elements in the Kafue River upstream from the Copperbelt mining area, Zambia: A study of a Zambezi River tributary. (Submitted to Aquatic Geochemistry for publication).

ccclvii
Pettersson, U.T. & J. Ingri (2000b). Impacts from mining activities on the water quality in the Kafue River, Copperbelt, Zambia: A study of dissolved-suspended solids and deposited sediment in a Zambezi River tributary.
Prescott, J.R.V. (1979). Africa's boundary problems. Optima, 28(1): 2-21.
Pulles, W. (1992). Water pollution: Its management and control in the South African gold mining industry. Journal of the Mine Ventilation Society of South Africa, 45(2): 18-36. Pulles, W. (1999). Development of best practice guidelines for water quality management in the South African mining industry. Journal of the South African Institute of Mining & Metallurgy, 99(4): 197-200.
Pulles, W., Howie, D., Otto, D. & Easton, J. (1996a). A Manual on Mine Water Treatment and Management
Practices in South Africa. Appendix Volume 1: Literature Reviews. Water Research Commission Report No.
527/1/96. 188 pp.
Pulles, W., D. Howie, D. Otto & J. Easton (1996b). A Manual on Mine Water Treatment and Management Practices in South Africa. Appendix. Volume 2: Coal Mine Site Visit Reports. Water Research Commission Report No. 527/2/96. 233 pp. Pulles, W., D. Howie, D. Otto & J. Easton (1996c). A Manual on Mine Water Treatment and Management Practices in South Africa. Appendix. Volume 3: Gold Mine Site Visit Reports. Water Research Commission Report No. 527/3/96. 245 pp. Raats, H. (1998). Legal action stalls R500m coal strip-mine: Sasol projects update. Martin Craemer's Engineering News, 18(17): 19.
Rakodi, C. (1995). Harare: Inheriting a Settler-Colonial City: Change or Continuity? Chichester: John Wiley and
Sons.
Richards, L. (1998). An environmental management framework for Tanzania. Journal of the South African Institute of Mining & Metallurgy, 98(7): 327-332. Rooseboom, A., E. Verster, H.L. Zietsman & H.H. Lotriet (1992). The Development of the New Sediment Yield Map of Southern Africa. Water Research Commission Report No. 297/2/92. 122 pp.
Rose, S. & A.M. Ghazi (1998). Experimental study of the stability of metals associated with iron oxyhydroxides
precipitated in acid mine drainage Environmental Geology 36 364-370.
Rosegrant, M.W. (1997). Water Resources in the Twenty-First Century: Challenges and Implications for Action.
Food, Agriculture, and the Environment Discussion Paper No. 20, International Food Policy Research Institute,
Washington DC. 27 pp.
SADC (2000a). SADC Review and Country Profiles. Southern African Development Community Country
Profiles, [Online]. Accessed on 11 June 2001. Available at website:
(http://www.sadcreview.com/country%20profiles%202000/).

ccclviii
SADC (2000b). SADC Sectoral Reports – Mining. Southern African Development Community Sectoral
Reports - Mining, [Online]. Accessed on 11 June 2001. Available at website:
(http://www.sadcreview.com/Sectoral%20Reports%202000/mining.htm).
SARDC (1996). Water in Southern Africa. Southern African Research and Documentation Centre, Harare,
Zimbabwe. 238 pp.
SARRCUS (1981). A System for the Classification of Soil Erosion in the SARRCUS Region. Department of Agriculture and Fisheries, Pretoria. 112 pp. Seltzpatrash, A. (1980). Surface mine regulations complicate reclamation. Civil Engineering, 50(9): 85-89.
Sithole, B. (2000). Telling it like it is: Devolution in the Water Reform Process in Zimbabwe Harare: Centre for
Applied Social Studies.
Smith, S.E. & M. Al-Rawahy (1990). The Blue Nile: Potential for conflict and alternatives for meeting future
demands. Water International, 15: 217-222.
Smith, A., A. Ward & D. Harpley (1987). Predicting the quality of waste-disposal seepage for desalination treatment. Journal of the South African Institute of Mining and Metallurgy, 87(3): 79-84.
SRK (1998). External Environmental Audit of the Chambishi Mining Licence Area - LML11. Report to Zambia
Consolidated Copper Mines Limited by SRK Consulting Engineers and Scientists, December 1998. 70 pp.
Staneva, M. (1997). Pollution from industrial effluents in Moyo, NAG, Ed, Lake Chivero: a Polluted Lake
Harare: University of Zimbabwe Publications.
Stidolph, P.A. (1977). The geology of the country around Shamva Zimbabwe Geological Survey Bulletin 78.
Stimie, C.M., E. Richters, H. Thompson, S. Perret, M. Matete, K. Abdallah, J. Kau & E. Mulibana (2001).
Hydro-institutional Mapping in the Steelpoort River Basin, South Africa. Working Paper 17 (South African
Working Paper No. 6), International Water Management Institute, Colombo, Sri Lanka.
Surveyor General and AGRITEX (Department of Agricultural, Technical and Extension Services) (1998). Map
of the Natural Regions and Provisional Farming Areas of Zimbabwe 3rd Edition, Harare: Surveyor General.
Thompson, H., C.M. Stimie, E. Richters & S. Perret (2001). Policies, Legislation and Organizations Related to
Water in South Africa, With Special Reference to the Olifants River Basin. Working paper 18 (South African
Working Paper No. 7), International water Management Institute, Colombo, Sri Lanka.
Timberlake, J. (Ed.) (1998). Biodiversity of the Zambezi Basin Wetlands. Phase I: Review and Preliminary Assessment of Available Information. Volume I: Main Report. The Zambezi Society and Biodiversity Foundation for Africa, Harare, Zimbabwe. ix + 124 pp.
Turton, A.R. (1999a). Water and conflict in an African context. Conflict Trends, 5: 24-27.

ccclix
Turton, A.R. (1999b). Water scarcity and social adaptive capacity: towards an understanding of the social
dynamics of managing water scarcity in developing countries. MEWREW Occasional Paper No. 9, University of
London, School of Oriental and African Studies (SOAS), Water Issues Study Group.
Turton, A.R. (2000). Water wars in southern Africa: Challenging conventional wisdom. In: Water For Peace in the
Middle East and Southern Africa. Green Cross International, Geneva, Switzerland, pp. 112-130.
Turton, A.R. & L. Ohlsson (1999). Water scarcity and social stability: towards a deeper understanding of the key
concepts needed to manage water scarcity in developing countries. In: Proceedings of the Ninth Stockholm Water
Conference, Stockholm, Sweden, 9-12 August 1999. 24 pp.
Tyndale-Biscoe, R. (1940). The geology of the country around Gwanda Zimbabwe Geological Survey Bulletin
36.
Toerien, D.F., A.J. Pieterse, J.H. Barnard, P. Van Der Spuy & J.C. Roos (1980). Influence of Existing and Planned Development on the Aquatic Environment of the Upper Olifants River Catchment Area, Transvaal. Report of the University of the Orange Free State Institute for Environmental Sciences, Bloemfontein. 230 pp. Unrug, R. (1988). Mineralization controls and source of metals in the Lufilian fold belt, Shaba (Zaire), Zambia and Angola. Economic Geology, 83: 1247-1258.
Van der Zaag, P., I.M. Seyam & H.H.G. Savenije (2000). Towards objective criteria for the equitable sharing of
international water resources. In: Proceedings of the Fourth Biennial Congress of the African Division of the
International Association of Hydraulic Research, Windhoek, Namibia, 7-9 June 2000. 9 pp.
Vadeveer, S. & J.A. Carter (1993). The Use of Remotely Sensed Data for Observing Spatial and Temporal Changes in Mining Areas and the Implications for Water Quality Monitoring, with Emphasis on Coal Mining in the Witbank Area. Department of Water Affairs & Forestry Technical Report. 67 pp. Van Niekerk, A.M. (1993). Preparation of an assessment of the impact by mining operations on the water environment. Proceedings of a Colloquium on Preparation of EMPs for Mines: Facing the Realities, 3 Aug 1993, Mintek, Randburg, South Africa. 16 pp. Van Niekerk, A.M. (1998). Opencast mining - water model developed: mine water. SA Water Bulletin, 24(5): 14-15. Van Vuren, J.H.J. & A.R. Deacon (1995). Researchers study pollution in the Olifants River: effect of pollutants on the physiology of fish in the Olifants River (Eastern Transvaal). SA Water Bulletin, 21(4): 22. Van Zyl, H.C. (1993). Towards achieving ‘Receiving Water Quality Objectives’ (RWQO) in the Enyati Valley. Proceedings of a Colloquium on Preparation of EMPs for Mines: Facing the Realities, 3 Aug 1993, Mintek, Randburg, South Africa. 3 pp.
Viljoen, M.J. & Reimold, W.U. (1999). An Introduction to South Africa’s Geological and Mining Heritage. Mintek,
Randburg. 156 pp.
ccclx
Viljoen, P., J.L.J. van der Westhuizen & A.H.M. Görgens (1998). National Water Act 1998: Institutions for
resource planning and catchment management WISA 98 Papers 1, 1B-5 Halfway House: Water Institute of
Southern Africa.
Vorster, H. (1997). Changing dynamics of SA gold mining industry; Environmental impact assessment for proposed supply of coal to Majuba Power Station. Mining Mirror, 10(4): 25-31. Vorster, H. (1999). Environmental impact assessment for Gope Botswana mine. Mining Mirror, 11(9): 4-5.
Weaver, A.v.B. & P. Caldwell (1999). Environmental impact assessment for mining projects. In: (J. Petts, Ed.),
Handbook of Environmental Impact Assessment: Volume 2: Environmental Impact Assessment in Practice:
Impact and Limitations. Blackwell Science, Oxford, United Kingdom. pp 377-403.
Weinert, H.H. (1964). Basic Igneous Rocks in Road Foundations. CSIR Research Report No. 218, Soil Mechanics Division, National Institute for Roads Research, CSIR, Pretoria. 47pp.
Wells, J.D., Van Meurs, L.H. & M.A. Rabie (1992). Terrestrial Minerals. In: (Fuggle, R.F. & M.A. Rabie, Eds),
Environmental Management in South Africa. Juta and Co., Johannesburg.
Whiteside, A. & C. Sunter (2000). AIDS: The Challenge for South Africa. Human & Rousseau, Tafelberg. South
Africa. 179 pp.
Whitton, B.A. & B.M. Diaz (1981). Influence of environmental factors on photosynthetic species composition in highly acidic waters. Proceedings of the Biennial Conference of the International Association of Theoretical and Applied Limnology, (Stuttgart), 21(3): 1459-1465.
Wiles, J.W. (1961). The geology of the Miami Mica Field (Urungwe District) Zimbabwe Geological Survey
Bulletin 51.
Wilson, M.G.C. & C.R. Anhaeusser (Eds) (1998). The Mineral Resources of South Africa, Sixth Edition. Handbook No. 16, Council for Geoscience, Pretoria. 740 pp. Woessner, W.W. & C.B. Andrews (1979). The impacts of coal strip mining on the hydrogeologic system of the Northern Great Plains: Case study of potential impacts on the Northern Cheyenne Reservation. Journal of Hydrology, 43(1-4): 445-467.
Wolf, A.T. (1999). Criteria for equitable allocations: the heart of international water conflict. Natural Resources
Forum, 23(1999): 3-30.
Wood, A. (1989). Wetlands in the amelioration of acid mine drainage. South African Mining World, 8(5): 37-41.
World Bank (1992). World Development Report, 1992: Development and the Environment. Oxford University
Press, New York.

ccclxi
World Bank (1998). World Development Indicators – 1998. Development Data Centre, The World Bank,
Washington. Also available at website:
(http://www.worldbank.org/wdi).
World Commission on Environment and Development (1987), Our Common Future. Oxford
University Press, Oxford.
WRI (2001). World Resources 2000-2001. World Resources Institute Country Profiles and Data Tables,
[Online]. Accessed on 12 June 2001. Available at website: (http://www.wri.org/wr2000/).
Wright, E.A. (1993). Environmental cost considerations in planning and operating small mines. Canadian Mining Journal, 35(3): 30-33. Younger, P.L. (1997). The longevity of minewater pollution: a basis for decision-making. The Science of the Total Environment, 194(1-6): 457-466.
Zafifiou, O.C. B.M. Voelker (1997). Effect of superoxide on copper and iron speciation in marine systems
Woods Hole Oceanographic Institute Grant/Contract Summary OCE-9529448.
Zaranyika, M.F. (1997). Sources and levels of pollution along the Mukuvisi River: a review in Moyo, NAG, Ed,
Lake Chivero: a Polluted Lake Harare: University of Zimbabwe Publications.
ZCCM (Zambia Consolidated Copper Mines) (1982). A Review of Factors Relevant to the Reported Incidence of Cattle Losses on Farms Bordering the Mwambashi River. Mining Industry Technical Services, Pollution Control Department. Report No. MITS/PA/30/82.
ZGS (Zimbabwe Geological Survey) (1988a). Map of Base Metal and Industrial Mineral Deposits, Zimbabwe
Harare: ZGS.
ZGS (Zimbabwe Geological Survey) (1988b). Map of Gold Deposits, Zimbabwe Harare: ZGS.
ZGS (Zimbabwe Geological Survey) (1995). Zimbabwe Mining Districts Map Harare: ZGS.
ZGS (Zimbabwe Geological Survey) (1999). Geological Map of Zimbabwe 7th Edition, Harare: ZGS.
ZGS (Zimbabwe Geological Survey) (2001). Map of Current Exclusive Prospecting Areas, Zimbabwe Harare:
ZGS.
ZSG (Zimbabwe Surveyor General) (1984). Map of Zimbabwe Hydrological Zones, 3rd Edition. ZGS, Harare,
Zimbabwe.
ZSG (Zimbabwe Surveyor General) (1997). Natural Regions and Provisional Farming Areas Map. ZSG,
Harare, Zimbabwe.

ccclxii
ZSG (Zimbabwe Surveyor General) (1998). Land Classification Map of Zimbabwe, 2nd Edition. ZSG, Harare, Zimbabwe.