Embed Size (px)
Citation preview

1
Overview of the Global Coffee Sector Supply Chain
This overview has been prepared as part of the World Bank’s Agriculture Global Practice Discussion Paper on improving the risk management and access to finance in the coffee sector. It provides a brief review of the sector as a whole, together with pricing aspects, an example of the coffee value chain and summary information on individual coffee producing countries. 1
There are substantial differences between the coffee sectors of individual coffee producing countries with some making substantial progress over the years, i.e. Brazil and Vietnam, and production elsewhere only just stable or even declining. Kenya, for example, routinely exports some of the world’s most expensive coffee, yet current production remains below that of the late 1990’s. In some other countries production has declined despite periods of high prices. Why this is the case needs more in-depth review as there are many reasons, but there can be little doubt that the sector or enabling environment in individual countries plays an important role in the success or otherwise of their coffee industry. Yet it would be a mistake to believe that the Brazilian and Vietnamese sector environments are the same with the former extremely well structured and the latter often relying more on impromptu initiatives. Similarly, types and levels of risk also vary between individual country supply chains, meaning that the impact or feasibility of potential risk mitigation options is equally variable.
1. Background facts
1.1 Economic importance. Coffee (Arabica and Robusta) is produced in some 70 countries and is an important commodity in world trade. In 2010 the ICO estimated total sector employment at about 26 million persons in the 52 main producing countries (Doc. ICC 105-5).2 In calendar year 2013 world exports were some 6.79 million tonnes, valued at US$19.2 Billion to which should be added domestic consumption in coffee producing countries themselves of some 2.68 million tonnes. The value of the latter is difficult to quantify but is estimated to be anywhere between US$3 billion and US$4 billion3.
1 This brief overview of the industry may assist those who may not be immediately familiar with different aspects. In most instances additional
and more detailed information is available at www.ico.org and at http://www.intracen.org/The-Coffee-Exporters-Guide---Third-Edition/ (also in French and Spanish). See also www.supremo.be for their Coffee Encyclopaedia that provides helpful information on the coffee industry in individual producing countries.
2 Of course, coffee also generates considerable employment in importing countries. 3 Valued in terms of green bean, FOB

2
Table 1 - World exports by value and volume
World coffee exports, by value and volume, 2005–2013
Calendar year US$ billion Million bags* Cts/lb (FOB)**
1990 6.9 80.6 72
1995 11.6 67.6 138
2000 8.2 89.5 64
2005 9.2 87.6 89
2010 16.5 96.7 147
2011 24.7 104.1 210
2012 22.3 110.7 156
2013 19.2 113.2 120
Source: ICO. * Bags of 60 Kg net. **Rounded to nearest cent.
Coffee plays an important part in the economy of a number of producing countries, as shown
below.
Figure 1 – Value of coffee as a percentage of all goods exported 2008-2012.
Source: ICO
67%62%
28%27%
21%19%
14%13%
6%6%
5%4%4%
3%3%3%3%3%2%2%
0% 10% 20% 30% 40% 50% 60% 70% 80%
Timor-Leste
Ethiopia
Rwanda
Guatemala
El Salvador
Colombia
Tanzania
Costa Rica
Laos
Vietnam

3
In the past decade or so the industry has seen considerable change. Increasing and widespread
emphasis on sustainability issues; strongly growing domestic consumption in producing countries
themselves; and more recently a marked increase in demand for Robusta (driven by the inclusion
of higher percentages of Robusta in major consumer blends). On the threat side, price volatility
and continuing concentration of buying power apart, the looming impact of climate change today
possibly constitutes the most significant factor. Climate change brings risks that require new and
imaginative sector support measures: the bulk of world production emanates from smallholders
who often are the least able to cope.
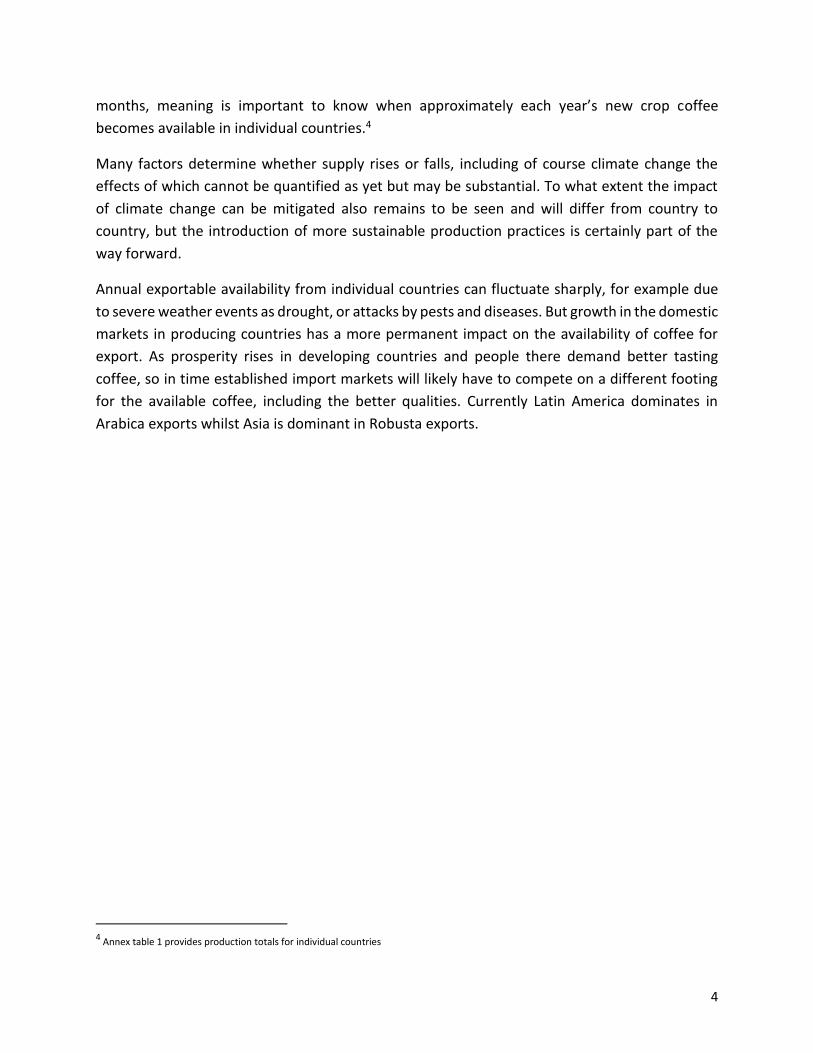
1.2 Production. Coffee is indigenous to Africa, with Arabica coffee (about 60 to 70% of world production) reportedly originating from Ethiopia and Robusta (about 30 to 40% of world production) from the Atlantic Coast (Kouilou region and in and around Angola) and the Great Lakes region. Today it is widely grown but the bulk of the world’s coffee, however, is produced in Latin America, particularly in Brazil which dominates world production. But both individual country and regional production shares are subject to change with, for example, Vietnam now the world’s second largest producer (even though regular exports only began in the early 1990’s) and Asia as a whole looming as a potential coffee power house. It also remains to be seen to what extent climate change may exacerbate shifts in production between both individual countries and regions.
Figures 2, and 3 – Annual Arabica and Robusta Production 1981/86 and 2009/14
1.3 Supply and demand. Supply is the sum of annual production plus stocks carried over in
producing countries. But a certain amount of working stocks is always needed in producing
countries and this, together with what is required for in-country domestic consumption, has to
be deducted from the available supply to arrive at exportable production. Of course this is not all
available at once because harvesting and export processing are spread out over a number of
0
5
10
15
20
25
30
35
40
Brazil Colombia Africa Others
Mil
lio
n b
ag
s
Arabica Production
1981/86 2009/14
0
5
10
15
20
25
Vietnam Brazil Indonesia Africa Others
Mil
lio
n b
ag
s
Robusta Production
1981/86 2009/14
4
months, meaning is important to know when approximately each year’s new crop coffee
becomes available in individual countries.4
Many factors determine whether supply rises or falls, including of course climate change the
effects of which cannot be quantified as yet but may be substantial. To what extent the impact
of climate change can be mitigated also remains to be seen and will differ from country to
country, but the introduction of more sustainable production practices is certainly part of the
way forward.
Annual exportable availability from individual countries can fluctuate sharply, for example due
to severe weather events as drought, or attacks by pests and diseases. But growth in the domestic
markets in producing countries has a more permanent impact on the availability of coffee for
export. As prosperity rises in developing countries and people there demand better tasting
coffee, so in time established import markets will likely have to compete on a different footing
for the available coffee, including the better qualities. Currently Latin America dominates in
Arabica exports whilst Asia is dominant in Robusta exports.
4 Annex table 1 provides production totals for individual countries

5
Table 2 Coffee exports by type 2007-2013
Coffee Years 2007 2008 2009 2010 2011 2012 2013
Arabicas Of which from:
58,510 59,182 56,703 60,874 61,225 60,571 62,813
Brazil 23,325 23,958 26,254 28,573 27,478 23,819 26,711
Colombia 10,701 10,354 7,258 7,161 7,121 6,557 9,062
Other Latin America 16,308 17,401 16,011 16,685 19,308 20,897 18,148
Africa 5,345 5,301 4,648 5,788 5,090 5,980 5,687
Asia and the Pacific 2,831 2,169 2,532 2,667 2,228 3,318 3,205
Robustas, Of which from
30,532 30,787 32,787 28,301 32,631 41,021 35,959
Brazil 1,402 2,075 1,119 1,169 2,663 1,145 1,305
Other Latin America 211 115 359 277 459 407 187
Vietnam 17,911 16,087 17,044 14,212 17,646 25,299 18,190
Indonesia 2,870 4,984 6,810 4,463 3,447 6,196 7,454
Other Asia and Pacific 2,228 2,074 1,852 2,836 3,694 3,028 3,171
Cőte d’Ivoire 1,814 1,149 1,455 1,628 502 1,371 1,568
Uganda 2,193 2,799 2,323 1,923 2,463 1,900 2,833
Other Africa 1,963 1,502 1,824 1,793 1,755 1,675 1,251
Roasted Coffee 230 260 293 229 266 305 295
Soluble Of which from
7,024 7,365 6,422 7,523 10,158 11,425 10,245
Brazil 3,373 3,365 2,881 3,226 3,305 3,320 3,439
Other Latin America 2,053 2,121 1,905 2,149 2,257 2,478 2,554
Africa 384 342 352 285 274 341 377
Asia 1,214 1,538 1,284 1,863 4,615 5,216 3,875
Shares (per cent)
Arabicas 60.7 60.7 58.9 62.8 58.5 53.5 57.5
Robustas 31.8 31.5 34.1 29.2 31.2 36.2 32.9
Roasted 0.2 0.3 0.3 0.2 0.3 0.3 0.2
Soluble 7.3 7.5 6.7 7.8 10.0 10.0 9.4
Exports of roasted coffee from producing countries are low and stagnant. This is a constant
feature, always attracting much discussion, but of course does not mean there is no vibrant
roasting industry in producing countries themselves. In many there is and domestic consumption
in producing countries has been growing steadily.

6
Table 3 Coffee Consumption in Selected Coffee Producing Countries - 2013
Country Population Production
(million bags)
Imports (million bags)* Per capita
consumption
(kg)*
Additional Information
Green Roasted Soluble
Brazil 198.66 49.15 0 0.03 0.03 6.09
Domestic consumption 20.33million bags Total imports only
amount to 62,000 bags divided almost equally between roasted
and soluble coffee mainly from Europe.
Ethiopia 91.73 6.60 0 0 0 2.22 Domestic consumption 3.65 million bags, which is around 55% of
overall production.
India 1,236.67 5.19 0.46 <0.01 <0.01 0.09
Domestic consumption, 1.92 million bags, is growing at annual rate
of around 3%, but appears to be slowing. Nevertheless the growth
in consumption can be attributed to rising disposable income,
shifting urbanisation as well as a rapid growth in population with
54% of the population of 1.24 billion aged under 25
Indonesia 246.86 11.66 0.24 0 0 0.87
Domestic consumption 4.17 million bags. Out of home
consumption accounts for around 22% of the total market and
although roasted coffee remains the most popular form of coffee
consumed, 3-in-1 preparations are rapidly gaining market share
and in 2013 accounted for around 30% of the market.
Mexico 120.85 3.90 0.72 0 0 1.17
Domestic consumption 2.35 million bags. A survey undertaken in 2009 showed that 57% of consumers use soluble coffee, 23% consume roasted coffee and 15% a combination of both. Nestle is the market leader.
Vietnam 88.77 27.50 0.22 0 0 1.05
Domestic consumption 1.58 million bags. Soluble coffee accounts
for the bulk of consumption with Nestle as the market leader but
modern cafes continue to proliferate in all of the major cities of the
country.
* Green Bean Equivalent. Source: ICO and other trade sources

7
In the last twenty years domestic consumption in producing countries has literally doubled and now
is a major marketing and pricing factor in a number of them with Brazil likely to become the world’s
leading consumer nation, ahead of the United States. And as the quality and therefore popularity of
domestic coffee blends generally grows, so this trend is likely to continue. Given the population
densities of some Asian producing countries the next major move upwards in domestic consumption
will likely be in that region. Indonesia is a good example already of a vibrant domestic market
whereas coffee’s popularity is definitely on the increase in Vietnam. For many China of course
remains the ultimate prize even though the country also grows and exports coffee itself.
1.4 Quality. Different markets, regions and groups of consumers prefer different types and qualities
of coffee but in general terms coffee quality, for both Arabica and Robusta, can be broadly
differentiated as follows, with the comment that the majority of Robusta is used as a filler in blends.
Exemplary quality: Offers a unique taste experience, usually is of limited availability and, is mostly
marketed as single estate or single area/origin coffee with links to producers etc. Because of their
exclusiveness and niche market status Exemplary coffees usually sell at high to very high premiums
to other market segments and are largely insulated from general market fluctuations. However this
assumes that their availability is and will remain limited.5
Premium quality: Offers a good to very good but not ‘amazing’ taste experience, is available in
reasonable quantities and is often marketed as single origin but is also presented as top blends.
Whilst availability may be reasonable, demand for these coffees is high and as such they sell at
sometimes considerable premiums over Mainstream quality. Whilst their quality offers a certain
amount of ‘price safety’ these coffees are not immune from general market behavior.
Mainstream quality: Offers an average but acceptable taste experience that varies from market to
market, is available in large to very large quantities and is nearly always marketed as blends with
little or absolutely no indication of origin. Components of these blends are largely interchangeable,
meaning if one origin is not available then coffee from another can be substituted. Prices for these
coffees are directly linked to the futures markets and what transpires there. As a result prices are
widely known and can fluctuate considerably.
It is generally accepted that between 80 to perhaps 90% of all coffee worldwide is of mainstream
quality. However, there are no clear data available to confirm or deny this, partly also because
‘quality and taste’ are subjective judgments that vary from person to person.
5 The term ‘gourmet’ is today used to describe a huge number of different products and no longer conveys the idea of uniqueness.

8
2. The coffee trade
The international coffee trade, trade houses and importers alike, plays a major role in the marketing
and distribution of coffee, often providing services that are out of the reach of local exporters. Much
of the world’s coffee imports, especially mainstream, are delivered ‘just in time’ at roasting plants
and many importers have to guarantee ‘quality on delivery as per contract’ failing which they have
to arrange for a replacement. Coffee is also often sold on (extended) credit, particularly in the
specialty segment where ‘approval of quality on delivery to plant’ can add a further complication.
Many importers also bring in full container loads (18 to 20 tons) that are then distributed on an ex-
store basis to numerous small roasters. Of course there are notable exceptions to the foregoing in
that a number of producers/exporters in different countries are managing to do successful business
directly with roasters abroad. Generally speaking however the discussion around ‘direct sales’ from
origin should also highlight that while such sales are possible and can be beneficial, in many instances
bypassing the so-called middle man is not a realistic option.
Large multi-national trade houses are today a dominant presence. This is often the subject of much
debate because of their greater resources and access to (usually cheaper) finance. However, in many
instances their participation can and does result in increased competition at the farm gate level,
something that ought to be beneficial to coffee growers. Whilst local traders and exporters may feel
disadvantaged the real issue is perhaps not whether such competition is fair but rather that the local
playing field may not be level. And this is where policy, the ‘enabling environment’ comes in…
Figure 4 – Major coffee trading companies – 2013
Source: Trade estimates – subject to constant change

9
2.1 Major import markets. In most established consumer markets coffee is generally procured by
international trade houses, dealers and traders but some roasters also maintain their own in-house
buying companies, which deal directly with origin. But many if not the majority of roasters tend to
buy from trade houses or specialized importers, and agents who represent specific exporters in
producing countries. Sales from origin are usually priced FOB (free on board) but in the United States
most roasters prefer to buy basis ex-dock where the supplier clears and presents the goods ready for
use. Delivery to roasting plants is often on a just-in-time basis with coffee delivered on a fixed date
and time, especially so in Europe. Small roasters often prefer to buy small lots that are delivered to
them on request.
All this requires the intervention of middlemen who generally perform useful functions. And whilst increased concentration at the roasting end of the mainstream industry previously reduced their numbers quite substantially, recent years of growth in the specialty segment have brought about the rebirth of numerous small roasters who however could not conduct their business without the services of green coffee importers. Interestingly, in the Nordic countries there are no importers at all, only roasters and agents, whereas in other countries many roasters only buy through importers and trade houses. This suggests that producers and exporters should have the flexibility to utilise all available sales channels, including middle men such as importers and also agents to whom they will pay sales commissions. 2.2 Consumption. It is difficult to estimate to what extent consumers influence demand and,
therefore, prices for individual types or qualities of coffee. Prices for exemplary and high quality
coffees are clearly and directly driven by consumer preferences but this is not so obvious for
mainstream qualities where it could be questioned whether price levels reflect actual consumer
preferences or rather simply the total demand ‘for coffee’. This assumption is supported by the fact
that the individual component coffees of most mainstream blends are largely interchangeable, i.e.
they can be substituted. As a result their prices are closely linked to futures prices that reflect the
supply and demand situation of coffee generally.
This incidentally raises an issue that is not often discussed but is nevertheless pertinent. Component
coffees in mainstream blends of course have to satisfy certain requirements: they must be fit for
human consumption and they must do the job within a blend that is expected of them. And, the
quality must be stable and fluctuate as little as possible. This suggests that stability could be more
important than trying to improve what already is acceptable mainstream quality and will always
remain ‘average’. If so then producers of inherently average quality coffees should perhaps think
twice before investing in costly actions to try and enhance that quality beyond what the mainstream
roasters actually want. And for which they may not pay more. At times it may be better to provide
exactly what is demanded and to do so as efficiently and reliably as possible, resulting in enduring
relationships.
10
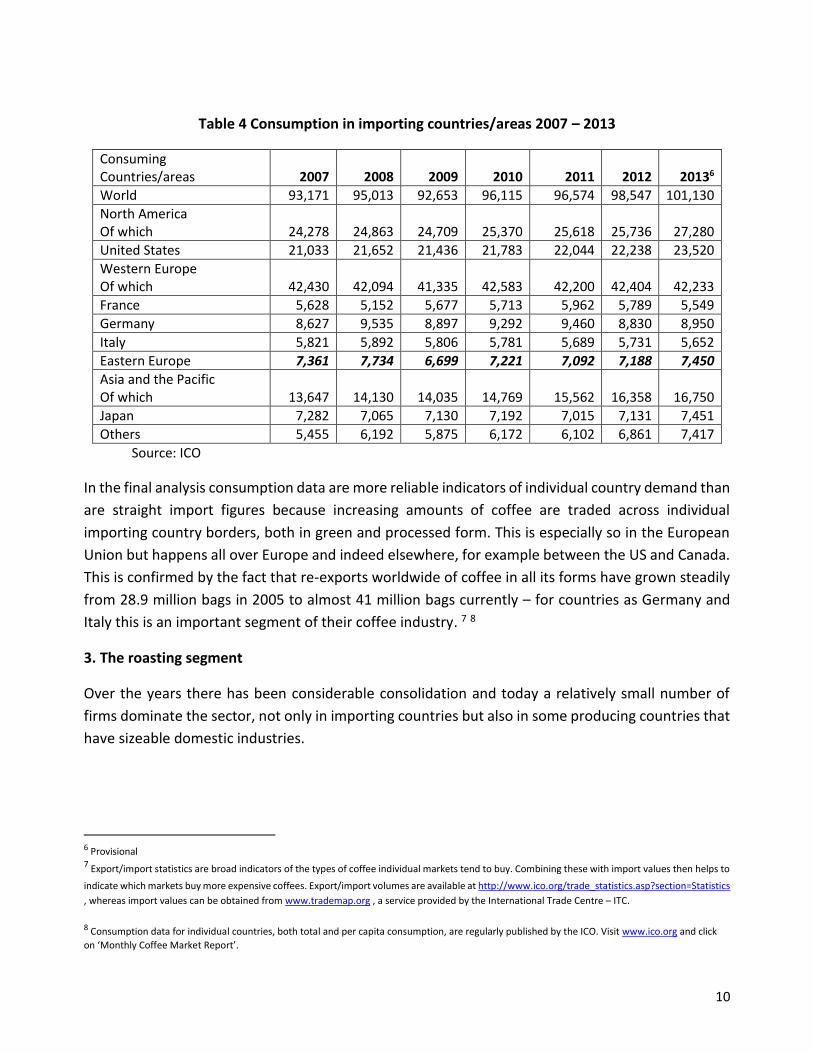
Table 4 Consumption in importing countries/areas 2007 – 2013
Consuming Countries/areas 2007 2008 2009 2010 2011
2012 20136
World 93,171 95,013 92,653 96,115 96,574 98,547 101,130
North America Of which 24,278 24,863 24,709 25,370 25,618 25,736 27,280
United States 21,033 21,652 21,436 21,783 22,044 22,238 23,520
Western Europe Of which 42,430 42,094 41,335 42,583 42,200 42,404 42,233
France 5,628 5,152 5,677 5,713 5,962 5,789 5,549
Germany 8,627 9,535 8,897 9,292 9,460 8,830 8,950
Italy 5,821 5,892 5,806 5,781 5,689 5,731 5,652
Eastern Europe 7,361 7,734 6,699 7,221 7,092 7,188 7,450
Asia and the Pacific Of which 13,647 14,130 14,035 14,769 15,562 16,358 16,750
Japan 7,282 7,065 7,130 7,192 7,015 7,131 7,451
Others 5,455 6,192 5,875 6,172 6,102 6,861 7,417
Source: ICO
In the final analysis consumption data are more reliable indicators of individual country demand than
are straight import figures because increasing amounts of coffee are traded across individual
importing country borders, both in green and processed form. This is especially so in the European
Union but happens all over Europe and indeed elsewhere, for example between the US and Canada.
This is confirmed by the fact that re-exports worldwide of coffee in all its forms have grown steadily
from 28.9 million bags in 2005 to almost 41 million bags currently – for countries as Germany and
Italy this is an important segment of their coffee industry. 7 8
3. The roasting segment
Over the years there has been considerable consolidation and today a relatively small number of
firms dominate the sector, not only in importing countries but also in some producing countries that
have sizeable domestic industries.
6 Provisional 7 Export/import statistics are broad indicators of the types of coffee individual markets tend to buy. Combining these with import values then helps to
indicate which markets buy more expensive coffees. Export/import volumes are available at http://www.ico.org/trade_statistics.asp?section=Statistics
, whereas import values can be obtained from www.trademap.org , a service provided by the International Trade Centre – ITC.
8 Consumption data for individual countries, both total and per capita consumption, are regularly published by the ICO. Visit www.ico.org and click
on ‘Monthly Coffee Market Report’.

11
Figure 5 – Leading roasting companies worldwide – 2013
Source: Various trade estimates and subject to constant change. To note that in 2012 Kraft Foods’ coffee business was
renamed Mondelȇz International. The Sara Lee Company split off its coffee business into a separate unit, DE Master
Blenders 1753 that subsequently (2014) acquired the Mondelȇz coffee business with the combined companies now
named Jacobs Douwe Egberts.
The coffee intake of most of these firms is such that they not possibly rely on supply from just one
or two origins although it would be difficult if not impossible for any of them to do without coffee
from Brazil and Vietnam. Security of supply is achieved through the purchasing of different but
substitutable coffees, each of which will more or less do the same job in terms of end product quality.
Giving a supplier the freedom to supply one out of a pre-agreed selection or ‘basket’ of coffees,
provided the quality is as per contract, facilitates purchasing and achieves maximum response to
buying enquiries. This is one of the reasons why trade houses play such an important role but of
course often they also undertake to physically deliver the coffee to a roasting plant, at a date and
time agreed in the contract, only invoicing it then. Clearly this kind of service is beyond the ability of
any but the most powerful origin exporters but even those may not necessarily wish to become
involved in this kind of extended service. 9
9 Such a basket could consist of, for example, Guatemala prime washed, and/or El Salvador central standard, and/or Costa Rica hard bean.

12
Individual roasters have different quality requirements that potential suppliers should understand.
But the overriding requirement is that what was sold is delivered, not something that is ‘just a little
different’ or ‘almost as good’. If that was acceptable then the roaster would have bought this lesser
quality in the first place! Receiving inferior quality disrupts the manufacturing sequence and from
the roaster’s perspective can be little short of disastrous. Roasters will therefore not buy direct from
origins or suppliers with a poor record in terms of contract execution, preferring instead to use the
intermediary of trade houses and importers.
3.1 Mainstream roast and ground coffee or R&G. This is by far the largest segment of the global
retail market, estimated at around three quarters of all coffee consumed. The R&G segment
continues to be dominated by the large roasters, as is the international trade in roasted coffee
between consuming countries themselves. Much R&G if not most is in the form of blends, tailored
to both taste preferences (and sometimes also domestic water quality) in different markets.
Exporters of roasted coffee from origin face the issue that not only does single origin roasted coffee
seldom match the general quality large markets require, but the supplier also has to compete against
well-established domestic roasters. In addition the shelf life of roasted coffee is limited, therefore
usually requiring expensive airfreight to get the product there quickly. In the case of the US there has
however been considerable growth in roasted coffee imports from Mexico through the shared land
border whereas France has traditionally imported certain types of roasted coffee in bulk.
Nevertheless these two markets are exceptions and total recorded origin exports of roasted coffee
were 305,00010 bags only in 2013 with the vast majority originating from re-exports by consuming
countries.11
10 Provisional 11 Data on imports of roasted coffee into consuming countries is inconsistent with data on exports of roasted coffee from producing countries. This is
thought to be the result of confusion over the identification and reporting of the origin, or provenance, of coffee processed in other consuming countries, especially in regards to single origin roasted coffee blends where the provenance is sometimes mistakenly designated as the green bean origin rather than the country in which it was roasted or processed.
13
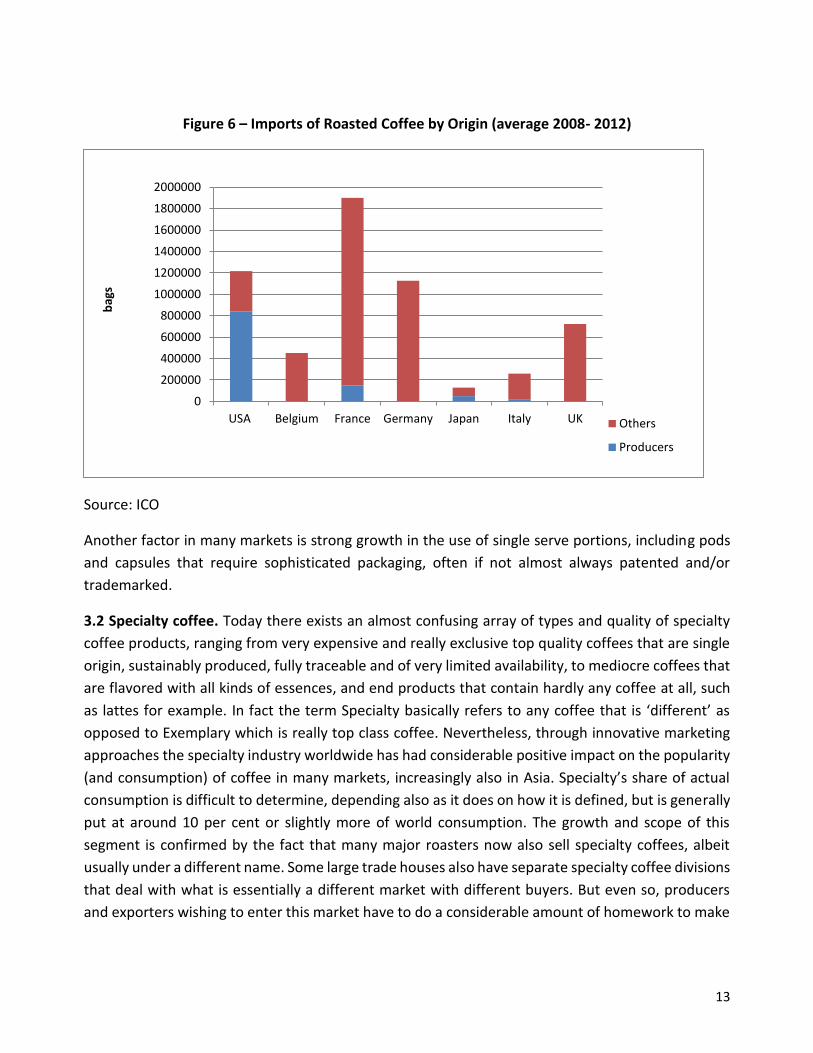
Figure 6 – Imports of Roasted Coffee by Origin (average 2008- 2012)
Source: ICO
Another factor in many markets is strong growth in the use of single serve portions, including pods
and capsules that require sophisticated packaging, often if not almost always patented and/or
trademarked.
3.2 Specialty coffee. Today there exists an almost confusing array of types and quality of specialty
coffee products, ranging from very expensive and really exclusive top quality coffees that are single
origin, sustainably produced, fully traceable and of very limited availability, to mediocre coffees that
are flavored with all kinds of essences, and end products that contain hardly any coffee at all, such
as lattes for example. In fact the term Specialty basically refers to any coffee that is ‘different’ as
opposed to Exemplary which is really top class coffee. Nevertheless, through innovative marketing
approaches the specialty industry worldwide has had considerable positive impact on the popularity
(and consumption) of coffee in many markets, increasingly also in Asia. Specialty’s share of actual
consumption is difficult to determine, depending also as it does on how it is defined, but is generally
put at around 10 per cent or slightly more of world consumption. The growth and scope of this
segment is confirmed by the fact that many major roasters now also sell specialty coffees, albeit
usually under a different name. Some large trade houses also have separate specialty coffee divisions
that deal with what is essentially a different market with different buyers. But even so, producers
and exporters wishing to enter this market have to do a considerable amount of homework to make
0
200000
400000
600000
800000
1000000
1200000
1400000
1600000
1800000
2000000
USA Belgium France Germany Japan Italy UK
bag
s
Others
Producers

14
sure that the quality of their product and the publicity or ‘story’ around it warrant the effort and
expense, remembering also that most small specialty roasters tend to buy on credit terms.
3.3 Soluble coffee. Consumption of soluble coffee has been rising, not only in the traditional mass
markets but also through the introduction of premium brands. The trade in soluble coffee from origin
is very much larger than that of roasted coffee with some 10.3 million12 bags shipped in 2013.
Premium brands of soluble coffee are manufactured in the importing markets themselves however.
Figure 7. Imports of Soluble Coffee by Origin (average 2008 - 2012)
However, in terms of value added the picture is not very clear in that compared to the ICO Composite
Indicator Price the premium appears to be relatively modest. However, in some instances the
transformation process may allow the use of lower quality green coffee that otherwise would have
to be exported at discounted prices.
3.4 Organic coffee. Despite the publicity around organic products generally the demand for organic
coffee remains relatively limited. Precise details of world production and exports are difficult to come
by because not all countries report exports of organic coffee separately. It is accepted fact however
that whenever availability increases the price premium tends to reduce which demonstrates that
demand has its limitations. Indeed industry sources suggest some types of organic coffee are
12 Provisional
0
200000
400000
600000
800000
1000000
1200000
1400000
1600000
1800000
USA Belgium France Germany Japan Italy UK
bag
s
Others
Producers

15
overproduced, partly also because not all producers realise that, organic or not, this coffee still has
to be of excellent quality to attract a reasonable premium that covers the costs of conversion and
certification. Trade estimates suggest that total imports in 2011 may have been between 1.7 and 1.8
million bags, compared to around 1 million bags in 2006. Latin America, especially Peru, is by far the
main producing area followed by Africa, particularly Ethiopia.
3.5 Retail. In most major consumption markets a combination of large retail chains and coffee house
chains (some of which are roaster-owned) dominates the sector. In addition there is the independent
specialty roaster segment that has been showing strong growth in the past decade or so. However,
some of these ‘independents’ are in fact also owned by major roasters. The main difference between
retail chains and other marketing channels is of course the buying and pricing power of the large
retailers who allocate ‘must have’ shelf space to individual brands. This is another reason for low
volumes of roasted coffee exports from origin. In addition there is the institutional or catering
segment, the out-of-home market. In most countries the in-home consumption segment has
traditionally been by far the largest although prior to the 2008 financial crisis there had been a
notable shift to out-of-home consumption in some markets. But this seems to be losing some
momentum again. Single serve portions (pods, capsules etc) for in-home brewing continue to gain
ground however but the impression is that in established markets this is at the expense of traditional
R&G.
Single origin coffees carried by the large retail chains tend to be from larger origins that can
guarantee year-round availability or, are well-known specialty coffees such as Kenya for example.
But the real market for single origin coffees lies in the coffee shop and specialty segment. However,
these are nearly always roasted and packaged in the importing country and, as referred to earlier,
some countries conduct a large re-export business in processed coffees.
It would be a mistake however to concentrate on the traditional and well-established markets only
because consumption growth there tends to have stabilized, i.e. there is not much likelihood of
further growth. New markets such as Eastern Europe but especially Asia, together with the domestic
markets in producing countries themselves, look like being the areas for future growth.
3.6 Food security. Coffee is food – it is consumed by humans. As such coffee imports are subject to
stringent food safety rules in most developed import markets. In the main these require coffee to be
free of prohibited chemicals and free of all contamination, including mould and live insects.
Furthermore, in recent years the possibility of bio-terrorism has drawn increasing regulatory
attention, particularly so in the United States and the European Union. Both markets now require all
those engaged in the food chain to be registered with their relevant authorities, including coffee

16
exporters. Particular attention is also placed on the risk posed by mycotoxins that themselves are
caused by mould with the main emphasis for green coffee on Ochratoxin A or OTA. 13
Traceability (‘farm to fork’ or ‘plough to plate’ etc) of foodstuffs is part and parcel of to-day’s coffee
industry and the obligation to provide it cannot be avoided. Alternatively, those who do not provide
it risk finding themselves gradually shut out from important consumer markets. Food safety
requirements in coffee are not restrictions of trade - none of the established major import markets
grow any coffee themselves! 14
The largest import markets (EU, US/Canada, Japan) do not levy any duties on green coffee imports
nor does the Russian Federation. However, with the exception of the US and Canada who also have
nil tariffs on processed coffee, import tariffs apply to processed coffee in quite a number of
established import markets.15
3.7 Sustainability. There is growing interest in ‘sustainable’ or ‘responsible’ agriculture, partly as a
result of consumer demand but also, and perhaps more so, because consumers expect retailers and
their suppliers not to stock items that are produced through unacceptable practices as child labor,
or practices that harm the environment. Most major roasters today, worldwide, have sustainability
programs in place, complete with undertakings to ensure that future procurement will be sustainably
produced. In part due to front-running initiatives in the Specialty sector this has given rise to two
different approaches: high visibility certification standards that are directly promoted to consumers
at the retail end (for example Rain Forest Alliance, Utz Certified) and, subsequently, a more
mainstream entry level standard as 4C (The Common Code for the Coffee Community) that relies on
verification and is promoted by way of general corporate statements. In addition some individual
roasters have set their own in-house standards. Of course alongside all this there is the well-known
Fair Trade movement that particularly emphasizes the improvement of conditions of trade in a
number of sectors, including coffee. There is a huge amount of information in the public domain
about sustainability but for a good introduction see the Conservation Principles for Coffee Production
at www.conservation.org.
The object here is not to go into detail. ITC’s www.standardsmap.org gives an overview of the main
aspects of the different standards and more detail is available from the standards directly. Instead
the point is that in time adherence to one or the other of these will be the norm and buying interest
for coffees lacking certification may dwindle which could affect prices. Participation on the other
13 For more information visit www.fda.gov. and look for the New FDA Food Safety Modernization Act – FSMA. See also www.ncausa.org and
www.fda.gov/Food/FoodDefense/Bioterrorism . For European Food Law generally visit www.ec.europa.eu/food/food/foodlaw/index_en.htm . For information on OTA see www.coffee-ota.org. Information on food safety rules in many individual countries can be traced at http://spsims.wto.org or at http://ipfsaph.org 14 With the exception of the US where Hawaii and Puerto Rico both produce small amounts of coffee. 15 See ICO Document ICC-111-6 (Obstacles to Consumption) at www.ico.org

17
hand should enhance both farm management and a coffee’s marketability, both important
considerations in the review of credit applications.
4. Some aspects of coffee trade pricing
4.1 Differentials
Futures markets for coffee are intended to combine the sum of all available information regarding
global supply and demand in ‘a price for coffee’ with New York representing standardised, average
quality Arabica, and London the same for Robusta. In how far this assumption is always true is
debatable given the influence of commodity funds and other investment vehicles as well as ‘flash or
hi-frequency trading’ with the impact of the latter currently (2014) under investigation by US
Authorities. But how are futures linked to actual green coffee trading?
Numerous individual and different types/qualities of physical or green coffee from many countries
are traded between producers and end users in the physical or cash market. Individual coffees are
linked to the futures price by way of a differential that expresses the difference between the coffee
in question and what is represented by the standardized average quality futures market. If the quality
is better the differential will be ‘plus’ – if it is lower the differential will be ‘minus’ as shown below.
RESULTANT ASKING PRICE FOB ORIGIN
Guatemala SHB EP
160 cts/lb
Vietnam Grade 2, 5% defects
USD 2062/mt
FUTURES PRICE ON 07.02.2013
All washed arabica in New York
Delivery May 2013 = 145 cts/lb ex-dock
All natural robusta in London
Delivery May 2013 = USD 2072/MT ex-dock
QUOTED DIFFERENTIAL ON 07.02.2013
Guatemala SHB EP, Plus 15
Shipment March 2013
Vietnam Grade 2, 5% defects, Minus 10
Shipment March 2013

18
The Arabica example shows that the international trade valued Guatemala SHB EP16 15 cts/lb above
the average quality represented by the New York Futures Market. Vietnam Robusta Grade 2 on the
other hand was quoted slightly below the equivalent for Robusta coffee traded in London. This is a
snapshot only because both futures and differentials fluctuate all the time.17
Today most coffee is priced by way of a differential, plus or minus, vis-a-vis the price for a given
futures delivery month, partly because stakeholders seek price protection but also because many
lenders insist on it. However, futures markets only offer the possibility of hedging (protecting) the
risk that the price for all coffee may rise or fall, meaning one can hedge the general price risk but not
the risk that the price for the basis, i.e. the particular green coffee that was bought or sold, changes.
For example if there is drought in the producing country, causing the price for that coffee to react
independently of the market as a whole. This risk is called the basis or differential risk, for obvious
reasons. Basis risk is less than price risk because it usually is much less volatile but it nevertheless is
a risk. 18
4.2 Trading coffee Price to Be Fixed – PTBF
Using the differential system the trade has developed a way of trading coffee without stipulating the
final price at the time of contract – instead a PTBF contract only sets the differential (plus or minus)
and the manner in which this differential is to be combined later with the price of a stipulated futures
delivery month. This action is called fixing. In brief, the contract will state the timing (earliest and/or
latest date permitted to fix the price), how this will be done (what action to take on the futures
market) and who will do the fixing (seller = seller’s call, or buyer = buyer’s call). Huge volumes are
traded PTBF and whilst the arrangement certainly facilitates the pricing of different coffees,
seemingly ever-increasing volatility on the futures markets makes life extremely difficult for
producers and exporters. As a result many lenders prefer to see only outright or fixed price contracts
(with approved buyers) but this brings issues of a different kind.
4.3 Why is coffee traded in US currency?
Because coffee prices are notoriously volatile both stakeholders and lenders look for price protection
on the futures markets of New York and London (operated by The InterContinental Exchange or ICE
– a US company). Both markets are priced in US currency to ensure the maximum level of liquidity –
in fact in 1992 the London market was forced to discard trading in Sterling for precisely that reason.
16 Strictly Hard Bean, Extra Prime = a trade quality description. 17 The link March to May is because March shipment physicals from origin would only become available ex-dock New York or London around end April
or even slightly later. A ‘Plus Differential’ usually suggests the quality is considered superior to the standard quality quoted on the futures markets whereas a ‘Minus Differential’ suggests the opposite. However, many other factors also play a role in determining differential levels such as ocean freight, reliability of supplier, availability and demand in the producing country itself etc. 18 Clearly the better the quality of a coffee the higher the differential will be. There are times that the plus differential for certain coffees is (much)
higher than the futures price itself, meaning that such coffees are much less likely to be influenced by movements on the futures markets.

19
Quoting/trading all coffee internationally in US currency means all quotations can be compared
instantly and all positions can be priced/hedged instantly as well. The huge amount of PTBF trades
of course further motivates the use of these US Dollar based coffee futures markets. At times pricing
coffee exports in a different currency may look attractive but would mean more complicated (and
more costly) price risk management for the buyer, likely resulting in reduced differentials… Hence
individual producers/exporters and end-users have to manage the risk that the value of their own
currency fluctuates against the US Dollar themselves. 19
Table 1 - Total production by exporting countries Crop years 2008 – 2013 Source ICO – in 1000’s bags
Crop year commencing 2008 2009 2010 2011 2012 2013 estimated
TOTAL 128 637 122 953 132 984 132 296 145 441 145 717
Arabicas 78 902 72 883 84 108 81 870 88 890 85 402
Colombian Milds 9 964 9 160 9 705 8 720 12 010 12 238
Other Milds 27 056 26 526 28 789 32 030 29 102 26 425
Brazilian Naturals 41 882 37 198 45 614 41 119 47 778 46 739
Robustas 49 735 50 069 48 876 50 426 56 551 60 315
Africa 16 017 16 000 16 053 15 715 16 529 16 451 Cameroon 725 902 503 574 366 400 Côte d'Ivoire 2 397 1 795 982 1 886 2 046 2 100 Ethiopia 4 949 6 931 7 500 6 798 6 233 6 600 Kenya 541 630 641 757 875 850 Tanzania 1 186 675 846 544 1 109 750 Uganda 3 290 2 845 3 203 2 817 3 698 3 600 Others 2 929 2 222 2 377 2 338 2 201 2 151 Arabicas 7 910 9 153 10 125 9 084 9 360 9 309 Robustas 8 107 6 847 5 928 6 631 7 169 7 142
Asia & Oceania 34 995 37 222 36 016 37 897 42 707 47 320 India 3 950 4 806 4 728 5 117 5 303 5 192 Indonesia 9 612 11 380 9 129 7 288 13 048 11 667 Papua New Guinea 1 028 1 038 870 1 414 717 1 000 Thailand 675 795 828 831 608 638 Vietnam 18 438 17 825 19 467 22 289 22 030 27 500 Others 1 292 1 379 994 959 1 002 1 323 Arabicas 4 467 5 189 5 217 6 050 6 541 6 886 Robustas 30 528 32 033 30 799 31 847 36 166 40 434
Mexico & Central America 17 236 16 685 18 021 20 282 18 595 15 995
Costa Rica 1 287 1 304 1 392 1 462 1 618 1 344
19 For more detailed information on both futures and options as well as the mechanics of coffee trading see http://www.intracen.org/The-Coffee-
Exporters-Guide---Third-Edition/

20
El Salvador 1 410 1 065 1 814 1 152 1 360 844 Guatemala 3 785 3 835 3 950 3 840 3 743 3 130 Honduras 3 450 3 603 4 331 5 903 4 537 4 200 Mexico 4 651 4 109 4 001 4 563 4 327 3 900 Nicaragua 1 445 1 871 1 634 2 193 1 884 1 500 Others 1 209 899 899 1 168 1 125 1 077 Arabicas 17 094 16 553 17 835 20 045 18 401 15 808 Robustas 142 132 187 236 193 187
South America 60 389 53 045 62 893 58 402 67 610 65 951 Brazil 45 992 39 470 48 095 43 484 50 826 49 152 Colombia 8 664 8 098 8 523 7 653 10 413 10 900 Ecuador 771 813 854 825 828 676 Peru 3 872 3 286 4 069 5 373 4 453 4 200 Others 1 090 1 377 1 353 1 067 1 090 1 023 Arabicas 49 432 41 988 50 931 46 690 54 588 53 398 Robustas 10 957 11 056 11 962 11 712 13 022 12 553

21
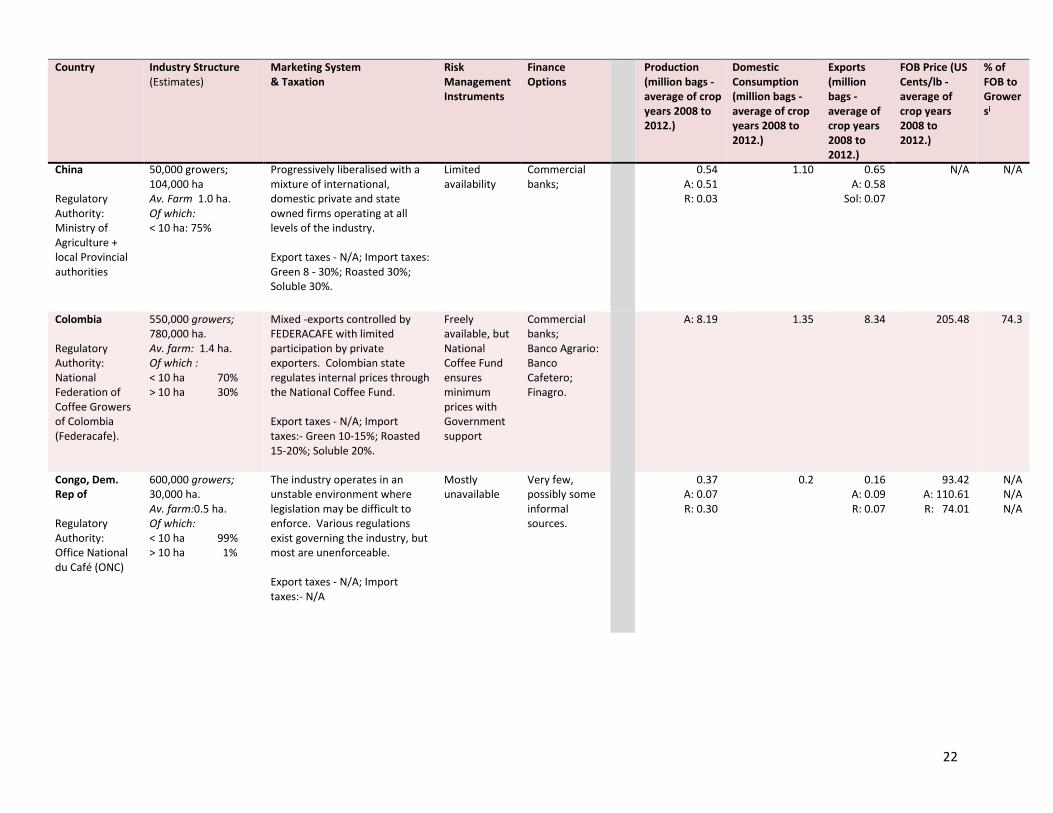
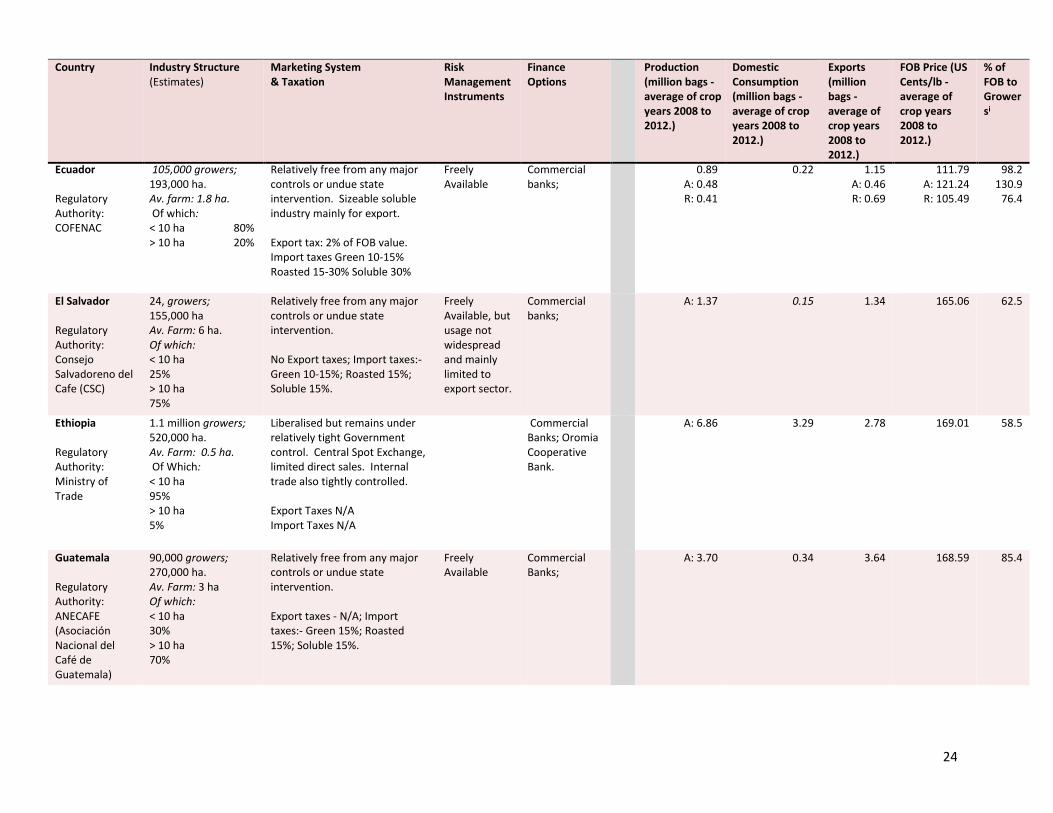
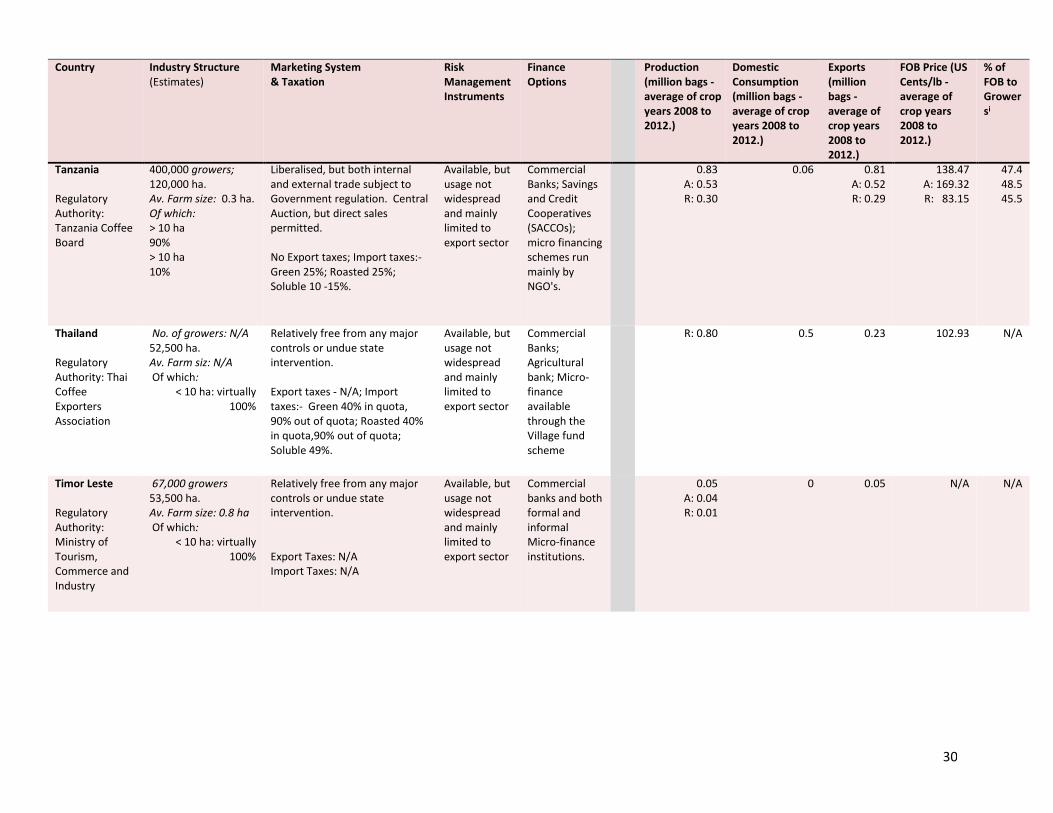
Table 5 – Origin Overview
Country Industry Structure (Estimates)
Marketing System & Taxation
Risk Management Instruments
Finance Options
Production (million bags - average of crop years 2008 to 2012.)
Domestic Consumption (million bags - average of crop years 2008 to 2012.)
Exports (million bags - average of crop years 2008 to 2012.)
FOB Price (US Cents/lb - average of crop years 2008 to 2012.)
% of FOB to Growersi
Brazil Regulatory Authority: Coffee Department, Ministry of agriculture
290,000 growers; 2.4 million ha Av. Farm: 8 ha. of which: < 10 ha 35% 10 to 50 ha 30% > 50 ha 35%
Free from any major intervention. Highly organised, 220 registered exporters; Functioning domestic coffee-futures market; Well-developed soluble coffee processing industry; & a well-developed domestic market. No export taxes; Import taxes:- Green 10%; Roasted 10%; Soluble 16%.
Freely available - many available via Funcafe
Commercial banks; Funcafe; PRONAF; ABC Program.
45.57 A: 34.33 R: 11.25
19.15
30.94 A: 27.66 R: 3.28
145.15 A: 148.53 R: 116.68
86.7 87.8 77.1
Burundi Regulatory Authority: Coffee Sector Regulatory Authority (ARFIC)
650,000 growers; 70,000 ha. Av. farm: 0.1 ha. Of which: < 10 ha: virtually 100%
Industry largely Privatised. Direct exports but internal trade fairly tightly controlled. Export taxes - N/A; Import taxes:- Green 40%; Roasted 40%; Soluble 40%.
Very limited availability
Commercial banks (all with substantial Government stakeholding); Micro-financing institutions.
0.32
0.02
0.29
154.24
49.5
Cameroon Regulatory Authority: Office National du Café et du Cacao
400,000 growers; 226,000 ha Av. Farm 0.5 ha. Of which: < 10 ha: virtually 100%
Entirely free since 1994/95 although exports subject to tight control. Export taxes - N/A; Import taxes:- Green 5 - 30%; Roasted 30%; Soluble 30%.
Very limited availability
Commercial banks; Informal sector - comprising private moneylenders, informal traders and the Tontines (small, informal savings and loan associations).
0.70 A: 0.09 R: 0.61
0.07
0.59 A: 0.05 R: 0.54
91.16 A: 173.60 R: 83.47
64.1 62.8 64.2
22
Country Industry Structure (Estimates)
Marketing System & Taxation
Risk Management Instruments
Finance Options
Production (million bags - average of crop years 2008 to 2012.)
Domestic Consumption (million bags - average of crop years 2008 to 2012.)
Exports (million bags - average of crop years 2008 to 2012.)
FOB Price (US Cents/lb - average of crop years 2008 to 2012.)
% of FOB to Growersi
China Regulatory Authority: Ministry of Agriculture + local Provincial authorities
50,000 growers; 104,000 ha Av. Farm 1.0 ha. Of which: < 10 ha: 75%
Progressively liberalised with a mixture of international, domestic private and state owned firms operating at all levels of the industry. Export taxes - N/A; Import taxes: Green 8 - 30%; Roasted 30%; Soluble 30%.
Limited availability
Commercial banks;
0.54 A: 0.51 R: 0.03
1.10 0.65 A: 0.58
Sol: 0.07
N/A N/A
Colombia Regulatory Authority: National Federation of Coffee Growers of Colombia (Federacafe).
550,000 growers; 780,000 ha. Av. farm: 1.4 ha. Of which : < 10 ha 70% > 10 ha 30%
Mixed -exports controlled by FEDERACAFE with limited participation by private exporters. Colombian state regulates internal prices through the National Coffee Fund. Export taxes - N/A; Import taxes:- Green 10-15%; Roasted 15-20%; Soluble 20%.
Freely available, but National Coffee Fund ensures minimum prices with Government support
Commercial banks; Banco Agrario: Banco Cafetero; Finagro.
A: 8.19
1.35
8.34
205.48
74.3
Congo, Dem. Rep of Regulatory Authority: Office National du Café (ONC)
600,000 growers; 30,000 ha. Av. farm:0.5 ha. Of which: < 10 ha 99% > 10 ha 1%
The industry operates in an unstable environment where legislation may be difficult to enforce. Various regulations exist governing the industry, but most are unenforceable. Export taxes - N/A; Import taxes:- N/A
Mostly unavailable
Very few, possibly some informal sources.
0.37 A: 0.07 R: 0.30
0.2
0.16 A: 0.09 R: 0.07
93.42 A: 110.61 R: 74.01
N/A N/A N/A

23
Country Industry Structure (Estimates)
Marketing System & Taxation
Risk Management Instruments
Finance Options
Production (million bags - average of crop years 2008 to 2012.)
Domestic Consumption (million bags - average of crop years 2008 to 2012.)
Exports (million bags - average of crop years 2008 to 2012.)
FOB Price (US Cents/lb - average of crop years 2008 to 2012.)
% of FOB to Growersi
Costa Rica Regulatory Authority: ICAFE (Instituto del Café de Costa Rica)
51,000 growers; 110,000 ha. Av. farm: 2.0 ha. Of which: < 10 ha 95% > 10 ha 5%
Tight control over exports as well as over internal industry and prices. Export taxes - 1.5%; Import taxes:- Green 9-14%; Roasted 14%; Soluble 14%.
Freely available via ICAFE or directly
Commercial banks; FINAR credit Scheme; Rural Credit Union; Microfinance institutions.
A: 1.41
0.25
1.3
185.37
79.1
Côte d'Ivoire Regulatory Authority: Conseil du Café & Cacao (CCC)
400,000 growers; 532,000 ha. Av. farm: 1.3 ha. Of which: < 10 ha: virtually 100%
Coffee marketing was fully liberalised in 1998 but minimum producer prices have since been reintroduced and the sector is once again strictly regulated. Export taxes - N/A; Import taxes:- Green 20%; Roasted 20%; Soluble 10-20%.
Very few available
Commercial banks; and Micro-Finance Institutions
R: 1.82
0.32
1.54
86.74
50.0
Cuba Regulatory Authority: Ministry of Agriculture
35,000 growers; 27,000 ha Av. Farm: 0.8 ha. Of which: < 10 ha 100%
Coffee marketing centrally controlled, all exports by Central Government Agency No Export taxes; Import taxes:- Green 5% to 10%; Roasted 30%; Soluble 30%.
Very few available
Limited, but a number of Commercial banks operate in Cuba as well as some micro finance institutions.
A: 07 0.22 0.01 289.35 0.35
Dominican Republic Regulatory Authority: Codocafé
90,000 growers; 130,000 ha. Av. Farm: 1.4 ha. Of which: < 10 ha 75% > 10 ha 25%
Relatively free from any major controls or undue state intervention; Well-developed domestic industry. No Export taxes; Import taxes:- Green 14%; Roasted 20%; Soluble 20%.
Freely Available, but usage not widespread and mainly limited to export sector
Commercial banks; and Micro-Finance Institutions
A: 0.38
0.38
0.09
183.25
74.8
24
Country Industry Structure (Estimates)
Marketing System & Taxation
Risk Management Instruments
Finance Options
Production (million bags - average of crop years 2008 to 2012.)
Domestic Consumption (million bags - average of crop years 2008 to 2012.)
Exports (million bags - average of crop years 2008 to 2012.)
FOB Price (US Cents/lb - average of crop years 2008 to 2012.)
% of FOB to Growersi
Ecuador Regulatory Authority: COFENAC
105,000 growers; 193,000 ha. Av. farm: 1.8 ha. Of which: < 10 ha 80% > 10 ha 20%
Relatively free from any major controls or undue state intervention. Sizeable soluble industry mainly for export. Export tax: 2% of FOB value. Import taxes Green 10-15% Roasted 15-30% Soluble 30%
Freely Available
Commercial banks;
0.89 A: 0.48 R: 0.41
0.22
1.15 A: 0.46 R: 0.69
111.79 A: 121.24 R: 105.49
98.2 130.9
76.4
El Salvador Regulatory Authority: Consejo Salvadoreno del Cafe (CSC)
24, growers; 155,000 ha Av. Farm: 6 ha. Of which: < 10 ha 25% > 10 ha 75%
Relatively free from any major controls or undue state intervention. No Export taxes; Import taxes:- Green 10-15%; Roasted 15%; Soluble 15%.
Freely Available, but usage not widespread and mainly limited to export sector.
Commercial banks;
A: 1.37
0.15
1.34
165.06
62.5
Ethiopia Regulatory Authority: Ministry of Trade
1.1 million growers; 520,000 ha. Av. Farm: 0.5 ha. Of Which: < 10 ha 95% > 10 ha 5%
Liberalised but remains under relatively tight Government control. Central Spot Exchange, limited direct sales. Internal trade also tightly controlled. Export Taxes N/A Import Taxes N/A
Commercial Banks; Oromia Cooperative Bank.
A: 6.86
3.29
2.78
169.01
58.5
Guatemala Regulatory Authority: ANECAFE (Asociación Nacional del Café de Guatemala)
90,000 growers; 270,000 ha. Av. Farm: 3 ha Of which: < 10 ha 30% > 10 ha 70%
Relatively free from any major controls or undue state intervention. Export taxes - N/A; Import taxes:- Green 15%; Roasted 15%; Soluble 15%.
Freely Available
Commercial Banks;
A: 3.70
0.34
3.64
168.59
85.4

25
Country Industry Structure (Estimates)
Marketing System & Taxation
Risk Management Instruments
Finance Options
Production (million bags - average of crop years 2008 to 2012.)
Domestic Consumption (million bags - average of crop years 2008 to 2012.)
Exports (million bags - average of crop years 2008 to 2012.)
FOB Price (US Cents/lb - average of crop years 2008 to 2012.)
% of FOB to Growersi
Haiti Regulatory Authority: National Coffee Institute (INCAH)
150,000 growers 115,000 ha. Av. Farm: 0.8 ha Of which: < 10 ha 85% > 10 ha 15%
Relatively free from any major controls or undue state intervention. Export taxes - N/A; Import taxes:- Green 15%; Roasted 15%; Soluble 15%.
Not widely available
Very limited some commercial banks and micro finance institutions operate in the country but interest rates are high.
A: 0.35 0.34 0.01 N/A N/A
Honduras Regulatory Authority: IHCAFE (Instituto Hondureño del Café)
87,000 growers; 265,000 ha. Av. Farm: 3 ha. Of which: < 10 ha 85% > 10 ha 15%
Relatively free from any major controls or undue state intervention. Export taxes - N/A; Import taxes:- Green 10-15%; Roasted 15%; Soluble 15%.
Freely Available
Commercial Banks;
A: 4.44
0.32
3.83
167.96
75.5
India Regulatory Authority: Coffee Board of India
221,000 growers; 360,000 ha Av. farm: 1.6 ha. Of which: < 10 ha 70% > 10 ha 30%
Liberalised and relatively free from any major controls or undue state intervention. No Export taxes; Import taxes:- Green 100%; Roasted 100%; Soluble 30%.
Freely accessible, a number of which including insurance (both life and crop), as well as a price stabilisation scheme are provided by the Coffee Board.
Commercial Banks; Micro finance institutions: Plus interest rate subsidies are available via the Coffee Board of India; The Central Bank (RBI) through the banking network; through NABARD; and from State Governments covering the Cooperatives.
4.86 A: 1.55 R: 3.31
1.78
4.43 1.44 2.99
117.64 146.56 103.72
91.3 96.0 89.1

26
Country Industry Structure (Estimates)
Marketing System & Taxation
Risk Management Instruments
Finance Options
Production (million bags - average of crop years 2008 to 2012.)
Domestic Consumption (million bags - average of crop years 2008 to 2012.)
Exports (million bags - average of crop years 2008 to 2012.)
FOB Price (US Cents/lb - average of crop years 2008 to 2012.)
% of FOB to Growersi
Indonesia Regulatory Authority: Ministry of Agriculture; AEKI (Indonesian Coffee Exporters' Association)
1.0 million growers; 1.3 million ha. Av. Farm: 1.3 ha. Of which:
< 10 ha 95%
> 10 ha 5%
Both the internal and export trade is entirely in the hands of the private sector. Substantial domestic market. No Export taxes; Import taxes:- Green 0-5%; Roasted 5%; Soluble 5%.
Freely Available, but usage not widespread and mainly limited to export sector
Commercial Banks;
10.00 A: 2.00 R: 8.00
3.40
7.18 A: 1.31 R: 5.87
94.31 145.23
82.94
N/A
Kenya Regulatory Authority: Coffee Board of Kenya
600,000 growers; 160,000 ha. Av. Farm: 0.3 ha. Of which: < 10 ha 58% > 10 ha 42%
Some state control; Private exporters but sales via Central Auction and direct sales; internal market channels highly regulated. No Export taxes; Import taxes:- Green 25%; Roasted 25%; Soluble 10-25%.
Freely accessible
Commercial Banks; Coffee Dev Fund; Co-operative Bank; Micro-Financing Institutions/SACCOS (saving and Credit Cooperatives); Marketing Agents.
A: 0.67
0.05
0.60
217.67
N/A
Laos Regulatory Authority: Lao Coffee National Committee/Lao Coffee Board (public and private sector)
40,000 growers 77,300 ha. Av. Farm: 0.5 ha. Of which: < 10 ha 80% > 10 ha 20%
Liberalised and relatively free from any major controls or undue state intervention. Export & Import taxes: N/A
Not widely available
Very limited, some commercial banks and micro finance institutions operate in the country.
0.51 A: 0.21 R: 0.30
0.15 0.36 81.50 N/A

27
Country Industry Structure (Estimates)
Marketing System & Taxation
Risk Management Instruments
Finance Options
Production (million bags - average of crop years 2008 to 2012.)
Domestic Consumption (million bags - average of crop years 2008 to 2012.)
Exports (million bags - average of crop years 2008 to 2012.)
FOB Price (US Cents/lb - average of crop years 2008 to 2012.)
% of FOB to Growersi
Madagascar Regulatory Authority: Comite National de Commercialisation du Café (CNCC)
350,000 growers; 155,000 ha. Av. Farm: 0.4 ha. Of which: < 10 ha: virtually 100%
Liberalised and relatively free from any major controls or undue state intervention. Export taxes - N/A; Import taxes:- Green 20%; Roasted 20%; Soluble 20%.
Mostly unavailable
Mainly from Micro-finance institutions (both formal and informal); very limited finance available from Commercial banks;
R: 0.58
0.47
0.11
92.57
N/A
Mexico Regulatory Authority: The Secretariat of Agriculture, Livestock, Rural Development, Fisheries and Food, (SAGARPA); Asociación Mexicana de la Cadena Productiva del Café (AMECAFE)
300,000 growers; 690,000 ha. Av. Farm: 2.3 ha. Of which: < 10 ha 70% > 10 ha 30%
Relatively free from any major controls or undue state intervention. No Export taxes; Import taxes:- Green 20%; Roasted 72%; Soluble 140.4%.
Price risk management tools and facilities are made available under a programme operated by the Secretariat of Agriculture, Livestock, Rural Development, Fisheries and Food, (SAGARPA)
Commercial banks; plus AMECAFE together with SACARPA operate a revolving fund which provides credit guarantees
A: 4.49
2.29
2.84
172.56
73.5

28
Country Industry Structure (Estimates)
Marketing System & Taxation
Risk Management Instruments
Finance Options
Production (million bags - average of crop years 2008 to 2012.)
Domestic Consumption (million bags - average of crop years 2008 to 2012.)
Exports (million bags - average of crop years 2008 to 2012.)
FOB Price (US Cents/lb - average of crop years 2008 to 2012.)
% of FOB to Growersi
Nicaragua Regulatory Authority: National Coffee Council Nicaragua-(CONACAFE)
48,000 growers; 120,000 ha. Av. Farm: 2.5 ha. Of which: < 10 ha 65% > 10 ha 35%
Relatively free from any major controls or undue state intervention. No Export taxes; Import taxes:- Green 10-15%; Roasted 15%; Soluble 15%.
Freely Available, but usage not widespread and mainly limited to export sector
Commercial Banks; Fondo de Desarrallo local; National development Bank (BANADES); Micro-financing through Nicargua Credit Unions; Nicargaua Rural credit Fund.
A: 1.70
0.20
1.63
171.98
43.1
Panama Regulatory Authority: Ministerio de Desarrollo Agropecuario (MIDA)
8,050 growers 30,000 ha. Av. Farm: 3.5 ha. Of which: < 10 ha 55% > 10 ha 45%
Relatively free from any major controls or undue state intervention. Export taxes: N/A Import taxes:- Green 30%; Roasted 54%; Soluble 30% – 81%.
Freely Available
Commercial Banks;
A: 0.11 0.07 0.06 202.50 N/A
Philippines Department of Trade and Industry
276,000 growers 120,000 ha. Av. Farm: 1.5 ha. Of which: < 10 ha 95% > 10 ha 5%
Relatively free from any major controls or undue state intervention. Export taxes: Green N/A; Roasted 40%; Soluble N/A Import taxes:- Green 10%; Roasted 10%; Soluble 10%.
Freely Available
Commercial Banks;
0.36 2.09 <0.01 N/A N/A

29
Country Industry Structure (Estimates)
Marketing System & Taxation
Risk Management Instruments
Finance Options
Production (million bags - average of crop years 2008 to 2012.)
Domestic Consumption (million bags - average of crop years 2008 to 2012.)
Exports (million bags - average of crop years 2008 to 2012.)
FOB Price (US Cents/lb - average of crop years 2008 to 2012.)
% of FOB to Growersi
Papua New Guinea Regulatory Authority: Coffee Industry Corporation (CIC)
400,000 growers; 60,000 ha. Av. Farm: 0.15 ha. Of which: < 10 ha 85% > 10 ha 15%
Relatively free from any major controls or undue state intervention. No Export taxes; Import taxes:- Green 25%; Roasted 25%; Soluble 25%.
Freely Available, but usage not widespread and mainly limited to export sector
Commercial Banks; National Development Bank; a small number of micro-financing schemes.
1.11 A: 1.10 R: 0.01
0.02
1.04 A: 1.03 R: 0.01
169.37 A: 169.97 R: 107.41
52.5 52.7 29.5
Peru Regulatory Authority: Junta Nacional del Café; Peruvian Chamber of Coffee and Cocoa
160,000 growers; 370,000 ha. Av. Farm size: 2.4 ha. Of which: < 10 ha 90% > 10 ha 10%
Relatively free from any major controls or undue state intervention. Export taxes - N/A; Import taxes:- Green 17%; Roasted 9-17%; Soluble 0%.
Freely Available, but usage not widespread and mainly limited to export sector
Commercial Banks; Peruvian microfinance institution ARARIWA; Cajas Rurales de Ahorro y Credito (CRAC);
A: 4.31 0.25 3.93 170.98 N/A
Rwanda Regulatory Authority: National Agricultural Export Development Board (NAEB)
500,000 growers; 37,500 ha. Av. Farm size: 0.07 ha. Of which: < 10 ha: virtually 100%
Liberalised and relatively free from any major controls or undue state intervention. No Export taxes; Import taxes:- Green 5-15%; Roasted 30%; Soluble 30%.
Available, but usage not widespread and mainly limited to export sector
Commercial Banks; Banque Populaire, Cooperatives; Savings and Credit Associations plus other Informal sources.
A: 0.32
0.001
0.28
181.16
N/A
30
Country Industry Structure (Estimates)
Marketing System & Taxation
Risk Management Instruments
Finance Options
Production (million bags - average of crop years 2008 to 2012.)
Domestic Consumption (million bags - average of crop years 2008 to 2012.)
Exports (million bags - average of crop years 2008 to 2012.)
FOB Price (US Cents/lb - average of crop years 2008 to 2012.)
% of FOB to Growersi
Tanzania Regulatory Authority: Tanzania Coffee Board
400,000 growers; 120,000 ha. Av. Farm size: 0.3 ha. Of which: > 10 ha 90% > 10 ha 10%
Liberalised, but both internal and external trade subject to Government regulation. Central Auction, but direct sales permitted. No Export taxes; Import taxes:- Green 25%; Roasted 25%; Soluble 10 -15%.
Available, but usage not widespread and mainly limited to export sector
Commercial Banks; Savings and Credit Cooperatives (SACCOs); micro financing schemes run mainly by NGO's.
0.83 A: 0.53 R: 0.30
0.06
0.81 A: 0.52 R: 0.29
138.47 A: 169.32 R: 83.15
47.4 48.5 45.5
Thailand Regulatory Authority: Thai Coffee Exporters Association
No. of growers: N/A 52,500 ha. Av. Farm siz: N/A Of which:
< 10 ha: virtually 100%
Relatively free from any major controls or undue state intervention. Export taxes - N/A; Import taxes:- Green 40% in quota, 90% out of quota; Roasted 40% in quota,90% out of quota; Soluble 49%.
Available, but usage not widespread and mainly limited to export sector
Commercial Banks; Agricultural bank; Micro-finance available through the Village fund scheme
R: 0.80
0.5
0.23
102.93
N/A
Timor Leste Regulatory Authority: Ministry of Tourism, Commerce and Industry
67,000 growers 53,500 ha. Av. Farm size: 0.8 ha Of which:
< 10 ha: virtually 100%
Relatively free from any major controls or undue state intervention. Export Taxes: N/A Import Taxes: N/A
Available, but usage not widespread and mainly limited to export sector
Commercial banks and both formal and informal Micro-finance institutions.
0.05 A: 0.04 R: 0.01
0 0.05 N/A N/A

31
Country Industry Structure (Estimates)
Marketing System & Taxation
Risk Management Instruments
Finance Options
Production (million bags - average of crop years 2008 to 2012.)
Domestic Consumption (million bags - average of crop years 2008 to 2012.)
Exports (million bags - average of crop years 2008 to 2012.)
FOB Price (US Cents/lb - average of crop years 2008 to 2012.)
% of FOB to Growersi
Uganda Regulatory Authority: Uganda Coffee Development Authority (UCDA)
500,000 growers; 320,000 ha. Av. Farm size: 0.6 ha. Of which: > 10 ha 99% > 10 ha 1%
Liberalised and relatively free from any major controls or undue state intervention Export taxes - N/A; Import taxes:- Green 25%; Roasted 25%; Soluble 10-25%.
Available, but usage not widespread and mainly limited to export sector
Commercial Banks (including the Centenary Rural Development Bank Ltd); Micro-financing agencies.
3.03 A: 0.61 R: 2.42
0.14
2.96 A: 0.68 R: 2.28
91.34 A: 129.78 R: 79.88
76.1 65.6 79.2
Vietnam Regulatory Authority: Vietnam Coffee and Cocoa Association (VICOFA)
500,000 growers; 570,000 ha. Av. Farm size: 1.1 ha. Of which: < 10 ha 85% > 10 ha 15%
Tight control over exports as well as over internal industry. No Export taxes; Import taxes:- Green 16-20%; Roasted 35%; Soluble 43%.
Extensive Government support including price and input subsidies.
Commercial Banks; Agribank;
A: 0.12 R: 20.39
1.4
18.08
A: 158.57ii R: 85.9
94.9
Yemen Regulatory Authority: Department of Agriculture & Irrigation
100,000 growers 35,000 ha. Av. Farm size: 0.3 ha. Of which: > 10 ha 100%
Free from any major controls or undue state intervention. Export Taxes: N/A Import Taxes: N/A
Not Available Commercial Banks and some donor led micro finance institutions
A: 0.17 0.13 0.05 N/A N/A
i Caution is required when interpreting and comparing these figures, as reported producer prices do not necessarily always relate to the same point in the marketing chain in all
countries. ii Based on limited data.