Embed Size (px)
Citation preview

Overview of Quality Assessment for Visual Signals and Newly Emerged Trends
1
King N. Ngan†, and Lin Ma†‡
†Department of Electronic Engineering, The Chinese University of Hong Kong, Hong Kong‡Lenovo Corporate Research Hong Kong Branch, Hong Kong

Outline
• Introduction• Quality assessment for traditional visual
signals• Quality assessment for newly emerged visual
signals• Conclusions
2

Introduction
• Most of information is represented in the form of digital visual signals, such as images, videos, etc.
• Products (phone cameras) and services (YouTube) based upon visual signals have grown at an exponential rate.
• Quality assessment of visual signals are very important.
3

Introduction
• Quality assessment: shape the full spectrum of technology development and enable new applications– Visual signal acquisition– Compression– Processing– Transmission
4

Introduction
• Quality assessment– Subjective measurement
• Benefits– Most reliable
• Drawbacks– Time-consuming, laborious, and expensive– Infeasible for on-line or real-time signal manipulations– Depend on the assessor’s physical conditions, emotion, and so on.
• Subjective measurement is employed to build the visual signal subjective database.
5

Introduction• Subjective
quality database– Image: LIVE,
A57, IRCCy/IVC, MICT, TID2008, and so on.
– Video: LIVE, IVP, MMSP , NYU, VQEG, and so on.
6
1. VQEG. (2000) Final Report From the Video Quality Experts Group on the Validation of Objective Models of Video Quality Assessment. [online] Available: http://www.vqeg.org.
2. H. R. Sheikh, M. F. Sabir, and A. C. Bovik, “A Statistical Evaluation of Recent Full Reference Image Quality Assessment Algorithms”, IEEE Trans. Image Process., Vol. 15, pp. 3441-3452, 2006.
3. S. Winkler, “Analysis of public image and video database for quality assessment”, IEEE Journal of Selected Topics in Signal Processing, vol. 6, no. 6, pp. 616-625, Oct. 2012

Introduction
• Objective measurement– Build computational model
• Visual signal as input, and output a number to indicate the perceptual quality.
• Quality metrics for traditional visual signals have been extensively researched1.
71. W. Lin, and J. C. C. Kuo, “Perceptual visual quality metrics: a survey”, Journal of Visual Communication and Image
Representation, vol. 22, no. 4, pp. 297-312, 2011.

Introduction
• New device/service development newly emerged visual signals– Scalable and mobile video– High dynamic range (HDR) images– Image segmentation– 3D image/video– Retargeted image/video
• New challenges for designing quality metric of newly emerged visual signals.
8

Outline
• Introduction• Quality assessment for traditional visual
signals• Quality assessment for newly emerged visual
signals• Conclusions
9

Quality assessment for traditional visual signals
• Quality metrics can be roughly categorized:– Full-reference: original signal is available
• Watermarking• Compression
– Reduced-reference: partial information is available• Quality monitoring• Error concealment
– No-reference: only distorted visual signal• Denoising• Enhancement
10

Full-Reference Quality Metric
• Original visual signal is available– Mean square error (MSE) and peak signal to noise ratio (PSNR)– Structural similarity index (SSIM)1
– Visual information fidelity (VIF)2
– Feature similarity index (FSIM)3
– Internal generative mechanism (IGM)4
• New trends:– Impairment decoupling approach– Machine learning approach
11
1. Z. Wang, A. C. Boviik, H. R. Sherkh, et al. “Image quality assessment: from error visibility to structural similarity”, TIP, vol. 13, no. 4, pp. 600-612, 2004.
2. H. R. Sherkh, and A. C. Bovik, “Image information and visual quality”, TIP, vol. 15, no. 2, pp. 430-444, 2006.3. L. Zhang, L. Zhang, X. Mou, and D. Zhang, “FSIM: A Feature Similarity Index for Image Quality Assessment,” TIP, vol. 20, no.
8, pp. 2378-2386, 2011.4. J. Wu, W. Lin, G. Shi, et al. “A perceptual quality metric with internal generative mechanism”. TIP, vol. 22, no. 1, pp. 43-54,
2013.

Impairment Decoupling Approach
• Impairment decoupling1,2,3 – Detail losses– Additive impairments
• Different distortion are treated separately• Different distortion correlates with HVS
perception differently.
12
1. Songnan Li, Lin Ma, and King N. Ngan, "Full-reference Video Quality Assessment by Decoupling Detail Losses and Additive Impairments", TCSVT, vol. 22, no. 7, pp. 1100-1112, Jul. 2012.
2. Songnan Li, Fan Zhang, Lin Ma, and King N. Ngan, "Image Quality Assessment by Separately Evaluating Detail Losses and Additive Impairments", TMM. vol. 13, no. 5, pp. 935-949, Oct. 2011.
3. Songnan Li, Lin Ma, and King N. Ngan, "Video Quality Assessment by Decoupling Additive Impairments and Detail losses", QoMEX 2011.

Impairment Decoupling Approach
13
(a) Separating the test image into the original image and the difference image.
(b) Separating the difference image into the detail loss image and the additive impairment image.
(c) Separating the test image into the restored and the additive impairment image.
1. Songnan Li, Lin Ma, and King N. Ngan, "Full-reference Video Quality Assessment by Decoupling Detail Losses and Additive Impairments", TCSVT, vol. 22, no. 7, pp. 1100-1112, Jul. 2012.
Machine Learning Approach
• Machine learning approach1,2,3
• Features extraction– Original image– Distorted image
• Feature comparison– Machine learning approach
• Learn complex data pattern• Model complex HVS property
14
1. M. Narwaria, W. Lin, A. E. Cetin, “Scalable image quality assessment with 2D mel-cepstrum and machine learning approach”, Pattern Recognition, vol. 45, no. 1. pp. 299-313, 2011.
2. M. Narwaria, W. Lin, “Objective image quality assessment based on support vector regression”, TNN, vol. 21, no. 3, pp. 515-519, 2010.
3. T. J. Liu, W. Lin, J. C. C. Kuo, “A multi-metric fusion approach to visual quality assessment”, QoMEX, 2011.

Reduced-Reference Quality Metric• Distortion modeling1,2
– Modeling the distortion behavior• HVS property modeling3,4
– HVS related features for quality assessment• Natural image/video statistics5,6,7
– Statistics variation can represent the distortion level.
15
1. S. Wolf, and M. Pinson, “Low bandwidth reduced reference video quality monitoring system”, VPQM, 2005.2. M. Tagliasacchi, G. Valenzise, M. Naccari, “Reduced-reference structural similarity approximation for videos corrupted by channel errors”, Multimedia
Tools Applications, vol. 48, no. 3, pp. 471-492, 2010.3. P. Le Callet, C. Viard-Gaudin, D. Barba, “A convolutional neural network approach for objective video quality assessment”, TNN, vol. 17, no. 5, pp.
1316-1327, 2006.4. M. H. Pinson, S. Wolf, “A new standardized method for objectively measuring video quality”, IEEE transactions on Broadcasting, vol. 50, no. 3, pp. 312-
322, 2004.5. Lin Ma, Songnan Li, and King N. Ngan, "Reduced-Reference Video Quality Assessment of Compressed Video Sequences“, TCSVT , vol. 22, no. 10,
pp. 1441-1456, Oct. 2012.6. Lin Ma, Songnan Li, Fan Zhang, and King N. Ngan, "Reduced-Reference Image Quality Assessment Using Reorganized DCT-Based Image
Representation", TMM, vol. 13, no. 4, pp. 824-829, Aug. 2011.7. Lin Ma, Songnan Li, and King N. Ngan, "Reduced-Reference Image Quality Assessment in Reorganized DCT Domain", Signal Processing: Image
Communication.
Reduced-Reference Quality Metric
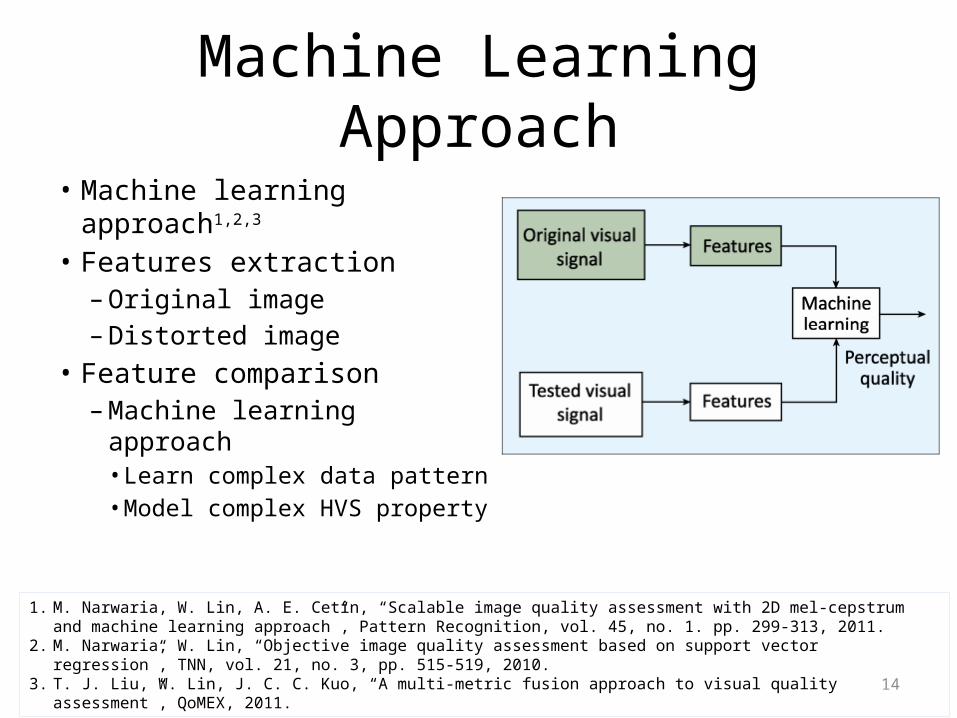
• Sender side: feature extraction and representation– DCT coefficient reorganization – GGD modeling the DCT coefficient distribution– RR parameters are represented by 162 bits.
• Receiver side: quality analysis– Histogram building for each reorganized DCT subband– City block distance (CBD) measures the difference between original and
distorted image.
16
R eference Im age
Sender S ide
R eceiver S ide
D istorted Im age R eorganization D C T
G G D M odeling
H istogram B uilding
R eorganization D C T
),( kd
kkcity ppd
C ity-block D istancefor Each Subband
K
k
kd
kkcitydist ppd
cV
110 |),(|
11log
V isual Q uality of Im age
1. Lin Ma, Songnan Li, Fan Zhang, and King N. Ngan, "Reduced-Reference Image Quality Assessment Using Reorganized DCT-Based Image Representation", TMM, vol. 13, no. 4, pp. 824-829, Aug. 2011.

No-Reference Quality Metric
• Specific distortion– JPEG1
– JPEG 20002
– Blurring3
• Generic NR metrics4,5,6
– Different NR metrics designed for specific distortions are fused together
17
1. L. Liang, S. Wang, J. Chen, et al. “No-reference perceptual image quality metric using gradient profiles for JPEG 2000”, SPIC, vol. 25, no. 7, pp. 502-516, 2010.
2. T. brandao, M. P. Queluz, “No-reference image quality assessment based on DCT domain statistics”, Signal Processing, vol. 88, no. 4, pp. 822-833, 2008.
3. R. Ferzli, L. Karam, “No-reference objective image sharpness metric based on the notion of just noticeable blur”, TIP, vol. 18, no. 4, pp. 717-728, 2009.4. A. Mittal, G. S. Muralidhar, J. Ghosh, et al. “Blind image quality assessment without human training using latent quality factors”, SPL, vol. 19, no. 2, pp.
75-78, 2012.5. M. A. Saad, A. C. Bovik, et al., “A perceptual DCT statistics based blind image quality metric”, SPL, vol. 17, no. 6, pp. 583-586, 2010.6. A. K. Moorthy, A. C. Bovik, “Blind image quality assessment: from natural scene statistics to perceptual quality”, TIP, vol. 20, no. 12, pp. 3350-3364,
2011.

Quality assessment for traditional visual signals
• Experimental results– Statistical parameters1,2: LCC, SROCC, and RMSE
18
1. VQEG. (2000) Final Report From the Video Quality Experts Group on the Validation of Objective Models of Video Quality Assessment. [online] Available: http://www.vqeg.org.
2. H. R. Sheikh, M. F. Sabir, and A. C. Bovik, “A Statistical Evaluation of Recent Full Reference Image Quality Assessment Algorithms”, IEEE Trans. Image Process., Vol. 15, pp. 3441-3452, 2006.
Comparison of different image quality metrics
Comparison of different video quality metrics

Outline
• Introduction• Quality assessment for traditional visual
signals• Quality assessment for newly emerged visual
signals• Conclusions
19

Scalable and Mobile Video Quality Assessment
• Scalable video quality assessment– HD video needs to be displayed in different
resolutions.– Scalable video coding (SVC) for content
distribution1
• Video codec, content, spatial resolution, temporal resolution, and frame quality.
– Public SVC video database1 was created by a pair-wise comparison.
201. J. S. Lee, et al., “Subjective evaluation of scalable video coding for content distribution”, ACM MM, 2010.

Scalable and Mobile Video Quality Assessment
• Mobile video quality assessment– Smartphones and tablets require more and more
mobile videos.– Perceptual quality assessment of mobile videos
are needed.– A public database1 is created on mobile phones
and tablets.
21
1. A. K. Moorthy, et al., “Video quality assessment on mobile devices: subjective, behavioral and objective studies”, J-STSP, vol. 6, no. 6, pp. 652-671, Oct. 2012.

Scalable and Mobile Video Quality Assessment
• Mobile video quality assessment1
– PSNR, SSIM, VIF, VQM, MOVIE are not suitable for evaluating mobile videos.
– Video content, bit rate, frame resolution, frame rate needs to be further considered.
22
Quality metric comparisons on the mobile database1
1. A. K. Moorthy, et al., “Video quality assessment on mobile devices: subjective, behavioral and objective studies”, J-STSP, vol. 6, no. 6, pp. 652-671, Oct. 2012.

1. H. Yeganeh, and Z. Wang, “Objective quality assessment of tone mapped images”, TIP, accepted. 2. H. Yeganeh, and Z. Wang, “Objective quality assessment of tone mapping algorithms”, ICIP, 2010.
High Dynamic Range Image Quality Assessment
• High dynamic range (HDR) image quality– Tone mapped image quality assessment1,2
• Structural fidelity:– Slocal compares the LDR and HDR image patch
• Statistical naturalness– Histograms of mean and standard deviation can be well fitted
using a Gaussian Pm and Beta probability Pd .
23

1. M. Cadik, O. Hajdok, A. Lejsek, et al., “Evaluation of tone mapping operators”, http://dcgi.felk.cvut.cz/home/cadikm/tmo/.
High Dynamic Rang Image Quality Assessment
• Quality model
• Validation on subject–rated image database1
• It can be observed that naturalness of image is not well depicted, while structural fidelity performs more reliably.
24
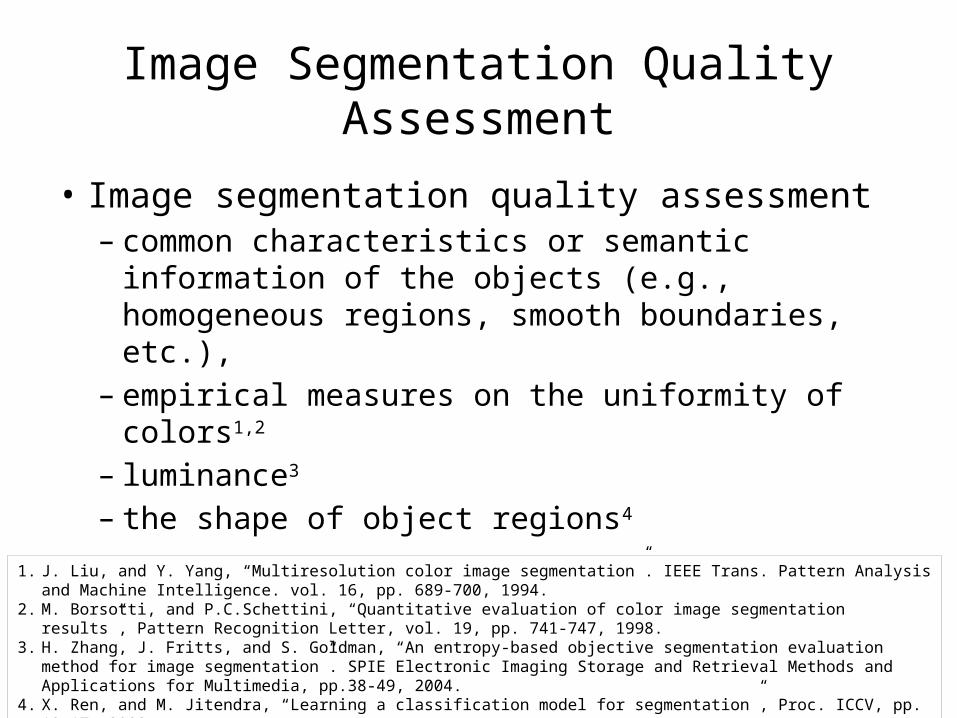
Image Segmentation Quality Assessment
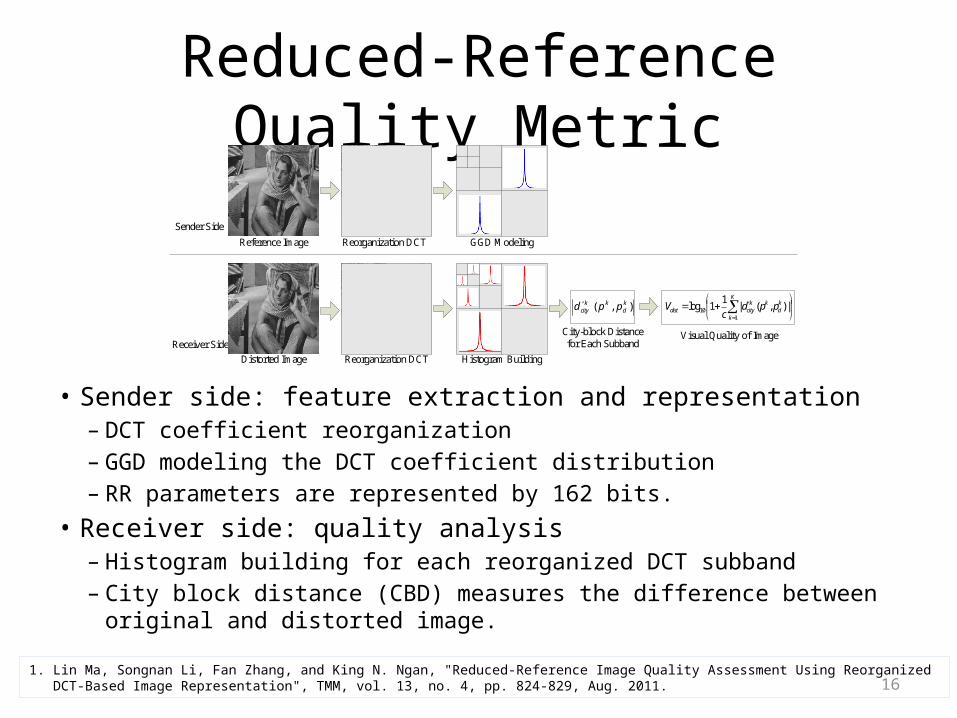
• Image segmentation quality assessment– common characteristics or semantic information
of the objects (e.g., homogeneous regions, smooth boundaries, etc.),
– empirical measures on the uniformity of colors1,2
– luminance3
– the shape of object regions4
25
1. J. Liu, and Y. Yang, “Multiresolution color image segmentation”. IEEE Trans. Pattern Analysis and Machine Intelligence. vol. 16, pp. 689-700, 1994.
2. M. Borsotti, and P.C.Schettini, “Quantitative evaluation of color image segmentation results”, Pattern Recognition Letter, vol. 19, pp. 741-747, 1998.
3. H. Zhang, J. Fritts, and S. Goldman, “An entropy-based objective segmentation evaluation method for image segmentation”. SPIE Electronic Imaging Storage and Retrieval Methods and Applications for Multimedia, pp.38-49, 2004.
4. X. Ren, and M. Jitendra, “Learning a classification model for segmentation”, Proc. ICCV, pp. 10-17, 2003.

26
External Region
External Region
Object Region
True Object
Ground Truth
Image Segmentation Quality Assessment
Quantity
)()(
)(1
1
regionexternalregionobject
regionexternalquantity
RNumRArea
RAreaS

27
Image Segmentation Quality Assessment
2area
pre recS
pre rec
Harmonic mean
( )
( )true object
object region
Area Rpre
Area R
( )
( )true object
ground truth
Area Rrec
Area R
Area
pre = precision; rec = recall

28
Image Segmentation Quality Assessment
( )( )G
G
G G
refdisf x
refdis D x
G Grefdis k length
x I,
External Contour
contour topixel of distanceshortest )(
box; bounding of diagonal distance; reference
xD
lengthrefdis
G
GG

29
Image Segmentation Quality Assessment
External Contour
min( ( ), ( ))
max( ( ), ( ))
G S
G S
xcontour
x
f x f xS
f x f x
object region area contourS S S
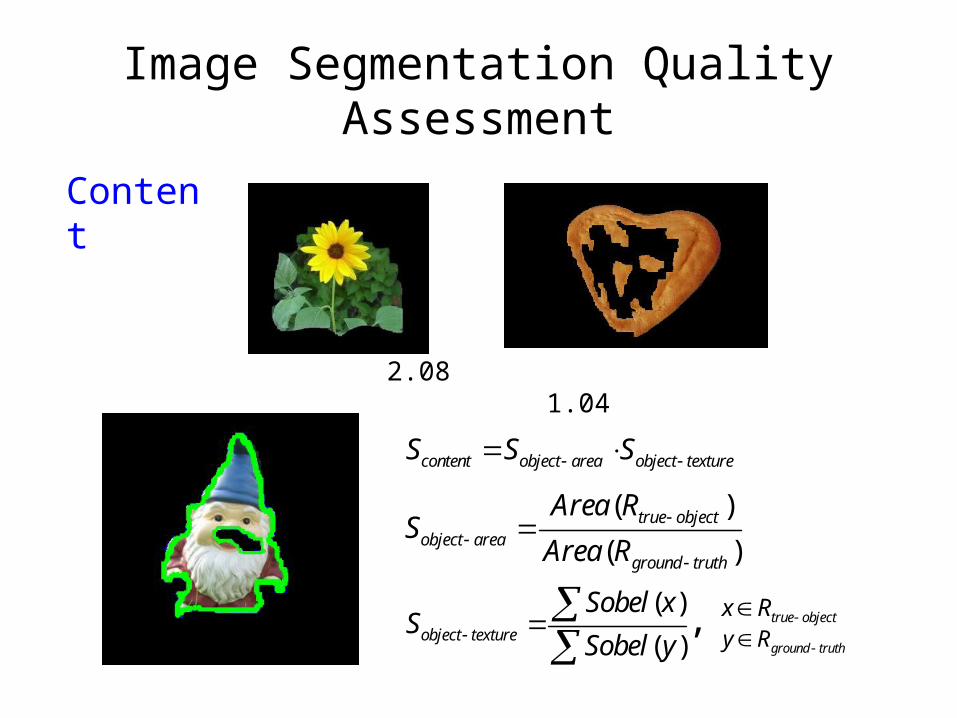
Image Segmentation Quality Assessment
Content
2.08 1.04
( )
( )true object
object areaground truth
Area RS
Area R
content object area object textureS S S
( )
( )object texture
Sobel xS
Sobel y
true objectx R ground truthy R
,
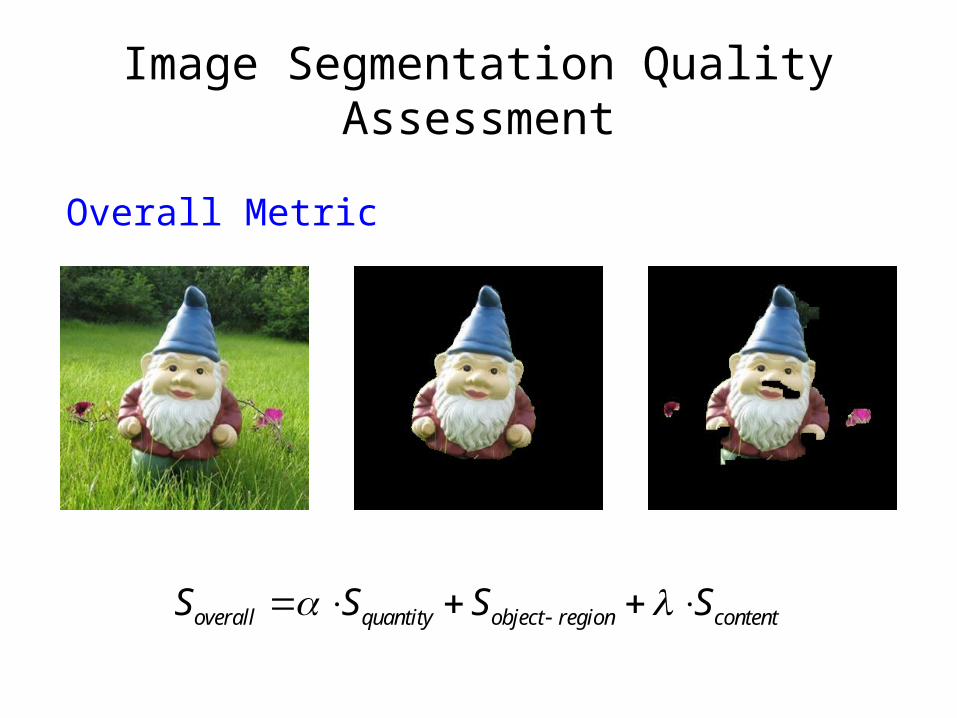
Image Segmentation Quality Assessment
Overall Metric
overall quantity object region contentS S S S

Image Segmentation Quality Assessment
Experimental Results
[1, 2]Jaccard
Index [3]Proposed
(without )Proposed
76 images by Achanta
SROCC 0.74 0.80 0.82 0.83
LCC 0.70 0.79 0.81 0.84
76 images by Rahtu
SROCC 0.84 0.85 0.88 0.89
LCC 0.85 0.89 0.89 0.91
Overall 152 images
SROCC 0.81 0.84 0.87 0.89
LCC 0.82 0.84 0.85 0.88
SROCC: Spearman Rank-Order Correlation Coefficients LCC: Linear Correlation Coefficient
1. R. Achanta, S. Hemami, F. Estrada, and S. Susstrunk, “Frequency-tuned salient region detection”, Proc. IEEE CVPR, pp. 1597-1604, Miami, USA, Jun. 2009.2. E. Rahtu, J. Kannala, M. Salo, and J. Heikkila, “Segmenting salient objects from images and videos”, Proc. ECCV, pp. 366-379, Crete, Greece, Sep. 2010. 3. F. Ge, S. Wang and T. Liu, “New benchmark for image segmentation evaluation”, Journal of Electronic Imaging, vol.16,no.3, 033011, Jul-Sep. 2007.
F measure
contentS

1. A. K. Moorthy, C. Su, A. Mittal, et al. LIVE 3D Image Quality Database.2. A. Benoit, P. Le Callet, P. Campisi, R. Cousseau. IRCCyN/IVC 3D Image Quality Database.3. L. Goldmann, F. De Simone, T. Ebrahimi, MMSP 3D Image Quality Assessment Database.4. L. Goldmann, F. De Simone, T. Ebrahimi, MMSP 3D Video Quality Assessment Database.
3D Image/Video Quality Assessment
• Stereoscopic/3D image and video quality assessment is becoming more and more important.
• Many 3D image/video subjective quality databases have been created1,2,3,4.
• Depth information should be considered and has already been incorporated in the database1.
33

3D Image/Video Quality Assessment
• 3D image/video quality assessment– 3D image database without considering depth
information
341. A. K. Moorthy, C. C. Su, A. Mittal and A. C. Bovik, “Subjective evaluation of stereoscopic image quality,” SPIC, 2013, accepted.2. A. K. Moorthy, A. C. Bovik, “A two-step framework for constructing blind image quality indices”, SPL, vol. 17, no. 2, pp. 287-599, 2011.

3D Image/Video Quality Assessment
• 3D image/video quality assessment– 3D image database with depth information1
35
1. A. K. Moorthy, C. C. Su, A. Mittal and A. C. Bovik, “Subjective evaluation of stereoscopic image quality,” SPIC, 2013, accepted.2. A. Benoit, P. Le Callet, P. Campisi, and R. Cousseau, “Quality assessment of stereoscopic images”, EURASIP Journal on Image and Video
Processing, pp. 1–13, 2009. 3. C.T.E.R. Hewage, and M.G. Martini, “Reduced-reference quality metric for 3D depth map transmission”, Proc. ICIP, 2010. 4. J. You, L. Xing, A. Perkis, and X.Wang, “Perceptual quality assessment for stereoscopic images based on 2D image quality metrics and
disparity analysis”, Proceedings of the International Workshop on Video Processing and Quality Metrics, 2010.

3D Image/Video Quality Assessment
• 2D IQA performs well in terms of correlation with human subjectivity.
• Considering disparity/depth in 3D quality metric cannot materially improve the performance.– 3D metric is simply extension of 2D metric.– Incorporating depth/disparity is not based on any
perceptual principles.
36

3D Image/Video Quality Assessment
• Depth information is important– Displaying– Rendering– Interaction– Segmentation
• 3D image/video quality assessment– Depth image-based rendering (DIBR)1 based synthesized view
evaluation problem. Different view synthesis algorithms are evaluated.
– RR quality metric for 3-D videos2
• depth edges and color images in the areas in the proximity of edges are extracted for the RR quality metric
37
1. E. Bosc, R. Pepion, P. Le Callet, M. Koppel, P. Mdjiki-Nya, M. Pressigout, and L. Morin, “Towards a new quality metric for 3-D synthesized view assessment”, IEEE Journal of Selected Topics in Signal Processing, vol. 5, no. 7, pp. 1332-1343, Nov. 2011.
2. C. T. E. R. Hewage, and M. G. Martini, “Reduced-reference quality assessment for 3D video compression and transmission”, IEEE Trans. Consumer Electronics, vol. 57, no. 3, pp. 1185-1193, Aug. 2011.
1. M. Rubinstein, et al., “A comparative study of image retargeting”, in Proc. SIGGRAPH Asia 2010.2. L. Ma, W. Lin, C. Deng, and K. N. Ngan, “Image retargeting quality assessment: a study of subjective scores and objective metrics”, IEEE
Journal of Selected Topics in Signal Processing, vol. 6, no. 6, pp. 626-639, Oct. 2012.
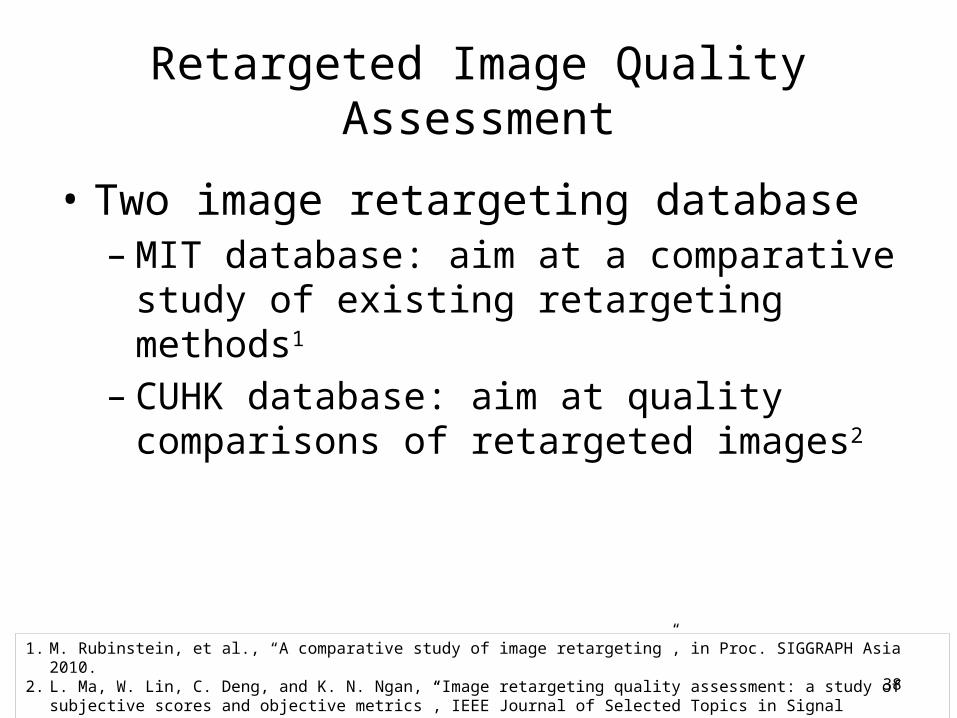
Retargeted Image Quality Assessment
• Two image retargeting database– MIT database: aim at a comparative study of
existing retargeting methods1
– CUHK database: aim at quality comparisons of retargeted images2
38

Retargeted Image Quality Assessment
Source image– Frequently encountered attributes
• Face and people• Clear foreground object• Natural scenery (containing smooth or texture region)• Geometric structure (evident lines or edges)
39

1. A. Shamir et al., “Seam-carving for media retargeting”, Communication of the ACM, vol. 52, no. 1, pp. 77-85, Jan. 2009.2. W. Dong et al., “Optimized image resizing using seam carving and scaling”, in Proc. SIGGRAPH 2009.3. L. Wolf, M. Guttmann, D. Cohen-Or, “Non-homogeneous content-driven video-retargeting”, in Proc. ICCV 2007.4. Y. Wang, C. Tai, O. Sorkine, and T. Lee, “Optimized scale-and-stretch for image resizing”, in Proc. SIGGRAPH Asia 2008.5. Y. Pritch, E. Kav-Venaki, and S. Peleg, “Shift-map image editing”, in Proc. ICCV 2009.6. M. Rubinstein, A. Shamir, and S. Avidan, “Multi-operator media retargeting”, in Proc. SIGGRAPH 2009.7. Z. Karni et al., “Energy-based image deformation”, in Proc. Symposium on Geometry Processing 2009.8. P. Krahenbuhl et al., “A system for retargeting of streaming video”, in Proc. SIGGRAPH Asia 2009.
Retargeted Image Quality Assessment• Retargeting methods
– Crop– Scale– Seam carving 1
– Optimized seam carving and scale2
– Non-homogeneous retargeting3
– Scale and stretch4
– Shift-map editing5
– Multi-operator6
– Energy-based deformation7
– Streaming video8
• Retargeting is restricted in only one dimension.• Two resizing scales (the source image is shrunk to 75% and 50%)
40

1. ITU-R Recommendation BT.500-11, “Methodology for the subjective assessment of the quality of television pictures”, International Telecommunications Union, Tech. Rep., 2000.
2. Video Quality Experts Group. Available at http://www.its.bldrdoc.gov/vqeg/
Retargeted Image Quality Assessment
• Subjective Testing– Simultaneous double stimulus for continuous
evaluation (SDSCE)1
• Source image should be presented to the viewers
– Absolute category rating scale2
• 5-discrete category rating
– User interface– On-line subjective testing
• http://137.189.32.220:8080/war/
41

Retargeted Image Quality Assessment
• Subjective Testing– Viewers have normal vision (with or without corrective
glasses).– Two sessions are employed to reduce the effect of
viewer fatigue.– First session
• 15 viewers are experts• 15 viewers are non-experts
– Second session• 18 viewers are experts• 16 viewers are non-experts
42

Retargeted Image Quality Assessment
• Subjective score processing1,2
43
The horizontal axis corresponds to the image number and the vertical axis corresponds to the MOS value. The blue star indicates the obtained MOS value. And the red error bar indicates the standard deviation of the subjective scores
1. ITU-R Recommendation BT.500-11, “Methodology for the subjective assessment of the quality of television pictures”, International Telecommunications Union, Tech. Rep., 2000.
2. Video Quality Experts Group. [Online]. Available: http://www.its.bldrdoc.gov/vqeg/
1. O. Pele, and M. Werman, “Fast and Robust Earth Mover’s Distances”, in Proc. ICCV, 2009.2. Y. Rubner, et al. “The earth mover’s distance as a metric for image retrieval”. IJCV, vol. 40, no. 2, pp. 99-121, 2000.3. D. Simakov Yaron Caspi et al., “Summarizing visual data using bidirectional similarity”, in Porc. CVPR, 2008.3. C. Barnes, et al., “Patchmatch: a randomized correspondence algorithm for structural image editing”, in Proc. SIGGRAPH,
2009.4. B. S. Manjunath, J. R. Ohm, V. V. Vasudevan, and A. Yamada, “Color and texture descriptors”, IEEE Trans. Circuits Syst.
Video Techno., vol. 11, no. 6, pp. 703-715, Jun. 2001.5. C. Liu, et al., “SIFT flow: dense correspon-dence across different scenes”, in Proc. ECCV, 2008.
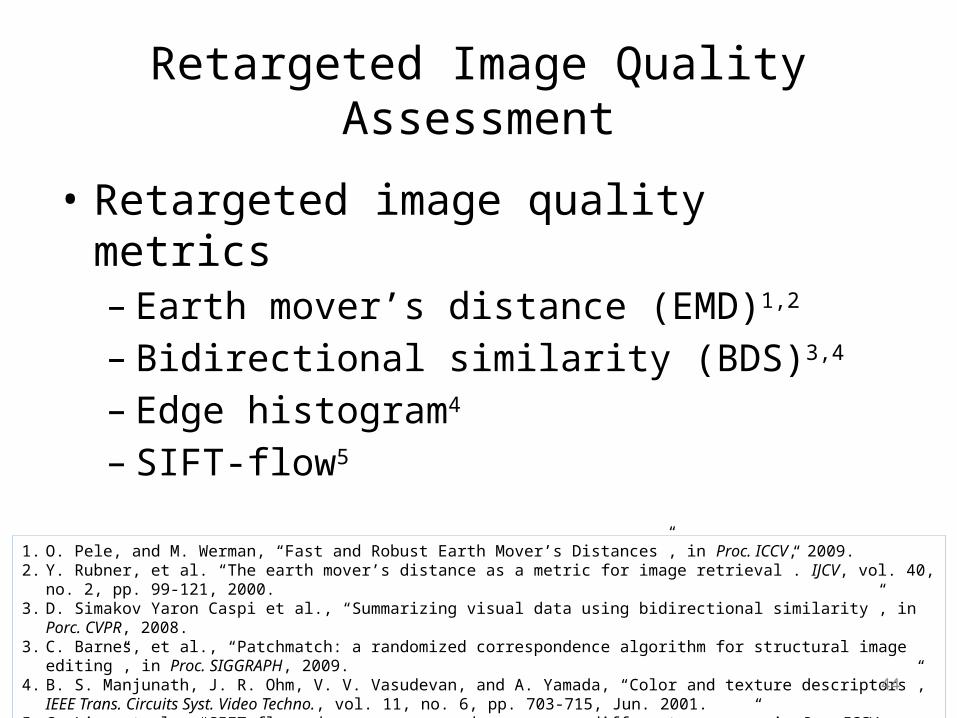
Retargeted Image Quality Assessment
• Retargeted image quality metrics– Earth mover’s distance (EMD)1,2
– Bidirectional similarity (BDS)3,4
– Edge histogram4
– SIFT-flow5
44

Retargeted Image Quality Assessment
45
EMD: Represents feature distribution
BDS: information loss Captures how much information one image conveys of the other
SIFT-flow: object shape Detects the correspondence between two images
EH: object shape Edge histogram
Fusion of the four metrics: considering both information loss and object shape

Outline
• Introduction• Quality assessment for traditional visual
signals• Quality assessment for newly emerged visual
signals• Conclusions
46

Conclusions
• Overview of the quality assessment development
• Traditional 2D visual signals• Newly emerged visual signals
– Scalable and mobile video– HDR image– Image segmentation– 3D image/video– Retargeted image quality assessment
47

48
Thank you!