Embed Size (px)
Citation preview
Fisheries and OceansScience
Pêches et OcéansSciences
C S A SCanadian Science Advisory Secretariat
S C C SSecrétariat canadien de consultation scientifique
* This series documents the scientific basis forthe evaluation of fisheries resources inCanada. As such, it addresses the issues ofthe day in the time frames required and thedocuments it contains are not intended asdefinitive statements on the subjectsaddressed but rather as progress reports onongoing investigations.
* La présente série documente les basesscientifiques des évaluations des ressourceshalieutiques du Canada. Elle traite desproblèmes courants selon les échéanciersdictés. Les documents qu’elle contient nedoivent pas être considérés comme desénoncés définitifs sur les sujets traités, maisplutôt comme des rapports d’étape sur lesétudes en cours.
Research documents are produced in theofficial language in which they are provided tothe Secretariat.
This document is available on the Internet at:
Les documents de recherche sont publiés dansla langue officielle utilisée dans le manuscritenvoyé au Secrétariat.
Ce document est disponible sur l’Internet à:http://www.dfo-mpo.gc.ca/csas/
ISSN 1480-4883Ottawa, 2001
Research Document 2001/066 Document de recherche 2001/066
Not to be cited withoutpermission of the authors *
Ne pas citer sansautorisation des auteurs *
Overview of Physical andBiological Oceanographic
Conditions on Georges Bank
Survol des conditionsocéanographiques physiques etbiologiques sur le banc Georges
F. H. Page1, R. Losier1, K. Drinkwater2, B. Petrie2, G. Harrison2 and D. Sameoto2
1Department of Fisheries and Oceans, Biological Station, 531 Brandy Cove Road, St. Andrews,N.B., Can., E5B 2L9
2Department of Fisheries and Oceans, Bedford Institute of Oceanography, Box 1006, Halifax, N.S.,Can., B2Y 4A2


2
Abstract
A description of the physical and biological oceanographic conditions on GeorgesBank in recent years is given and compared to historical conditions. The dataexamined includes hydrographic data from research vessels and ships ofopportunity, sea surface temperature and chlorophyll estimates obtained fromsatellite remote sensing programs and plankton data from the Continuous PlanktonRecorder program. The data indicate the water temperatures on Georges Bank inrecent years have been about 1°C above normal. The degree of verticalstratification has been relatively constant for the past 20 years. The shelf/slopefront and Gulf Stream was closer to Georges Bank in 2000 than the long-termnormals and the concentration of chlorophyll on the Bank was higher in 2000 thanin 1999 or 1998. The abundance of Calanus finmarchicus has been decreasingwithin the Gulf of Maine since the late 1980s. The physical conditions observedduring the recent Canadian groundfish bottom-trawl surveys also reflect thesepatterns. Although the temperatures are above normal in recent years, they arestill within the range normally associated with demersal stages of cod and haddockcaught within the Georges Bank and Scotian Shelf areas.
Résumé
Les conditions océanographiques physiques et biologiques sur le banc Georgesau cours des dernières années sont décrites, puis comparées aux conditionshistoriques. Les données examinées incluent des données hydrographiquesrecueillies par des navires de recherche et des navires de passage, desestimations de la température de la surface de la mer et de la concentration dechlorophylle issues de programmes de télédétection par satellite et des donnéessur le plancton provenant du Programme continu d’enregistrement du plancton.Les données indiquent que les températures de l’eau sur le banc Georges aucours des dernières années se situaient à environ 1 oC au-dessus de la normale,bien que le niveau de stratification verticale soit demeuré relativement constant aucours des 20 dernières années. Le Gulf Stream et le front de la pente et de laplate-forme étaient plus près du banc Georges en 2000 que la normale à longterme et la concentration de chlorophylle sur le banc était plus élevée en 2000qu’en 1999 ou 1998. En outre, l’abondance de Calanus finmarchicus dans le golfedu Maine est à la baisse depuis la fin des années 1980. Les conditions physiquesobservées pendant les derniers relevés canadiens du poisson de fond au chalutreflètent aussi ces tendances. Bien que les températures se situaient au-dessusde la normale durant les dernières années, elles s’inscrivent encore dans lafourchette de températures normalement associées aux stades démersaux de lamorue et de l’aiglefin, capturés dans les eaux du banc Georges et de la plate-forme Scotian.

3
INTRODUCTION
This paper describes some of the physical and biological oceanographicconditions on Georges Bank in recent years and compares these to historicalconditions. The observations used to define the environmental conditions arederived from archives that include hydrographic data from research vessels andships of opportunity, sea surface temperature (SST) and chlorophyll estimatesfrom satellite sensors, and plankton from Continuous Plankton Recorder (CPR)records.
The overview provides an indication of the spatial and temporal trends ofphysical and biological indicators. It can identify unusual conditions that may signalcaution when interpreting or forecasting the status of living resources. It may alsobe useful for generating hypotheses about environmental linkages to fishproduction relevant to fisheries resource management.
The initial sections of the overview contain time series of physical andbiological variables for Georges Bank that have been compiled and presented atthe March 2001 annual meeting of the Fisheries Oceanography Committee of theCanadian Stock Assessment Secretariat by Drinkwater et al. (2001a,b), Harrison etal. (2001) and DFO (2001). In some instances additional detail is presented here.This initial section includes data to the end of the year 2000. The material providesa broad context in which the research vessel surveys that are directed towardassessing the abundance of specific resources occur. The final section provides anoverview of the near-bottom hydrographic conditions observed during theCanadian research vessel groundfish surveys conducted on Georges Bank fromthe year 1987 to 2001 with an emphasis on the recent years. Although lessextensive, this overview follows the format used by Page, Losier and McRuer(1994, 1995, 1996, 1997a,b) who summarized the conditions in some of theprevious surveys.
Although all authors have contributed material to this overview, they havenot had time to review the manuscript due to the necessity for the lead author toput this overview together quickly at the last minute.
Physical Conditions
Temperature
Temperature may influence both the real and perceived production of fishby affecting fish distribution and physiological processes such as the rate of growthand maturation. Hence, knowledge of the nature of the inter-annual variability inthe temperature may help lead to better understanding of fish population andcommunity dynamics and ultimately to improvements in the management offisheries resources.
4
Temperature Time Series Constructed from Archived Hydrographic Data
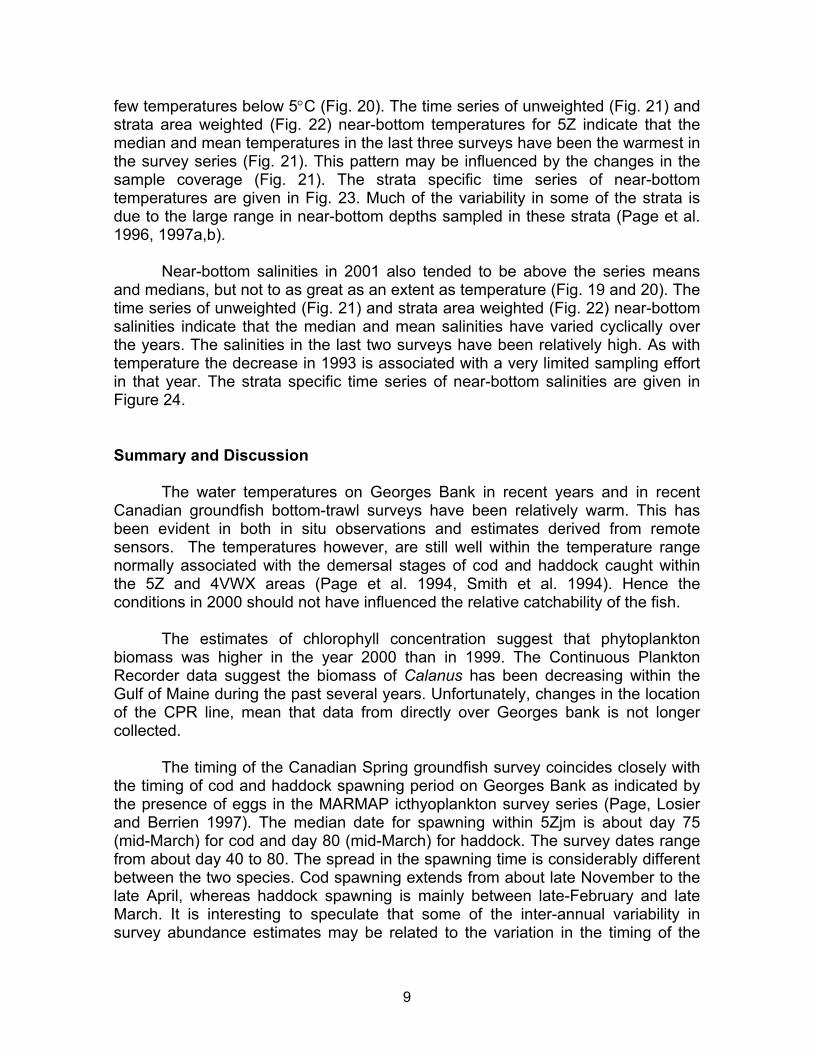
Drinkwater and Trites (1987) divided the Scotian Shelf, eastern Gulf ofMaine and eastern Georges Bank into irregularly shaped polygons (Fig.1) andestimated the depth specific monthly mean temperatures within each of thesepolygons from temperature data available to them. These monthly means havebeen revised and updated regularly from data stored in the Bedford Institute ofOceanography’s historical hydrographic database (AFAP) which is also updatedwith newly acquired data and synchronized with the Canadian MarineEnvironmental Data Service’s (MEDS) database that is maintained in Ottawa.Monthly anomalies are calculated by subtracting the long-term monthly mean fromeach monthly mean. The long-term mean is calculated as the mean of the monthlymeans over the 30-year baseline period 1961-1990. The monthly anomaly timeseries are highly variable. This is caused in large part by the sparse nature of thedata. Monthly means are often calculated from very few observations and the long-term monthly means may be derived from data from different years over the 1961-1990 period. Hence, high frequency (month to month) variations in the data shouldbe interpreted cautiously. The running mean anomalies are much smoother andmore robust. They are calculated as the 5 year running mean of the annual meanswhere each annual mean is calculated as the mean of all the monthly means withina year. Examples of recently updated time series for several of the polygons aregiven in Drinkwater et al. (2001a).
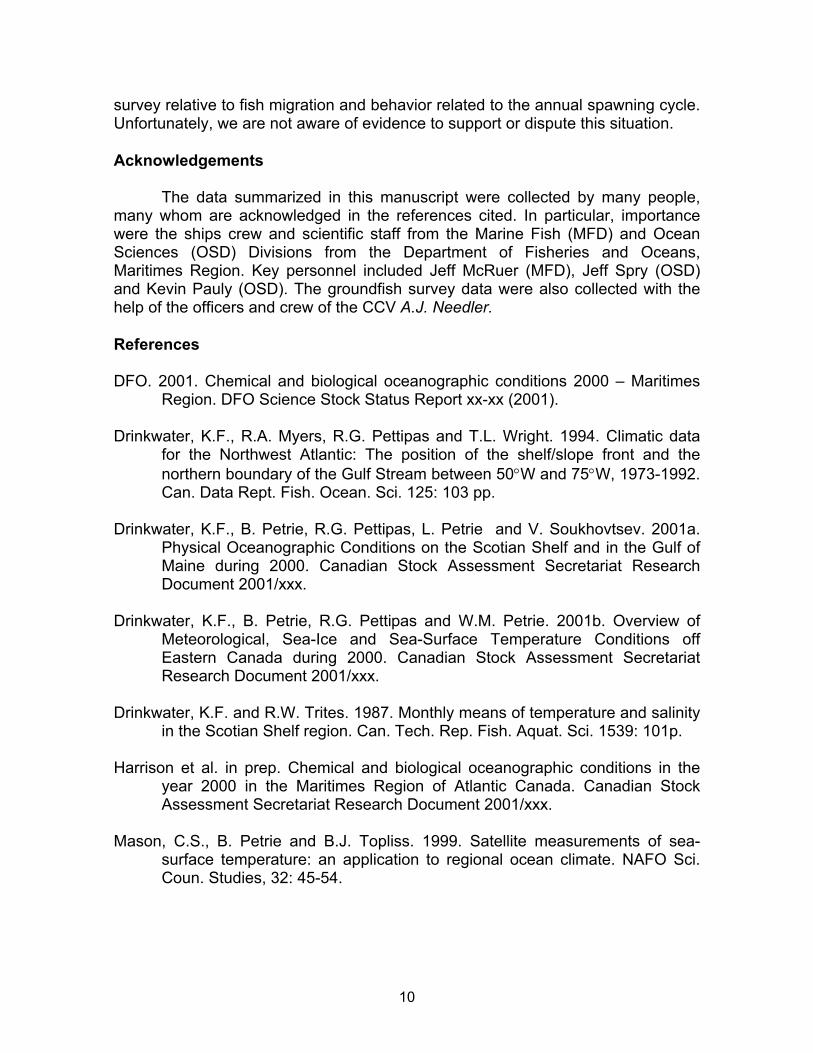
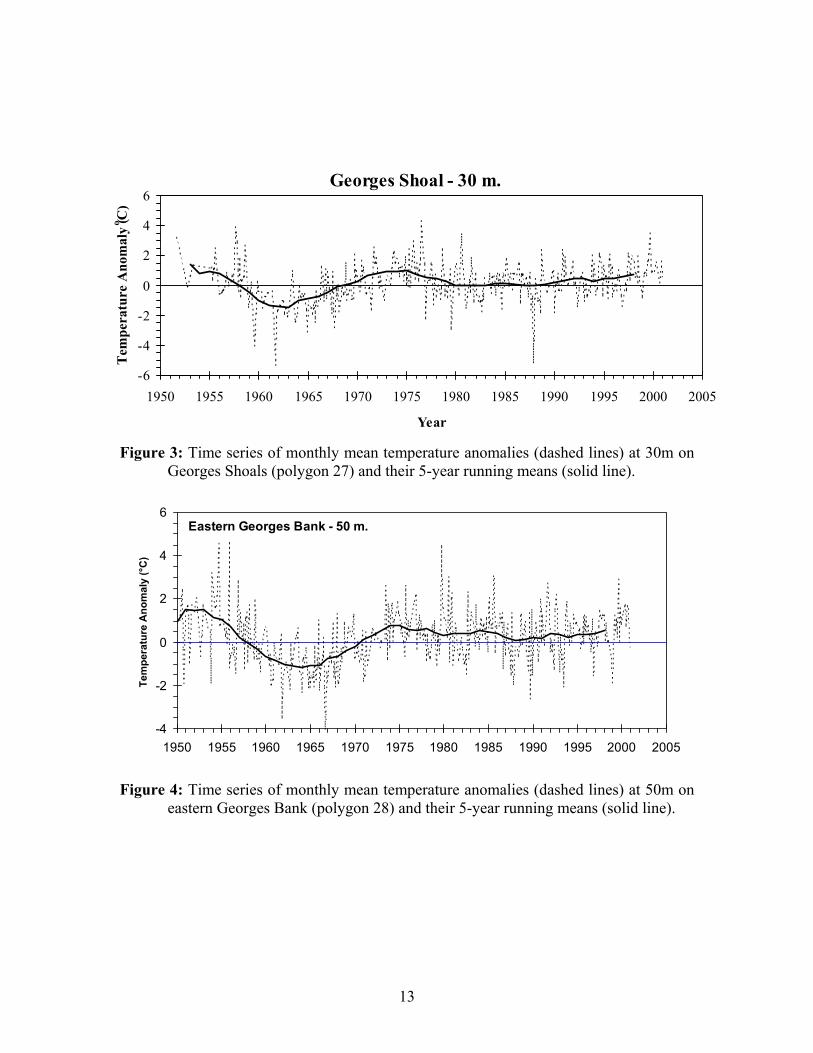
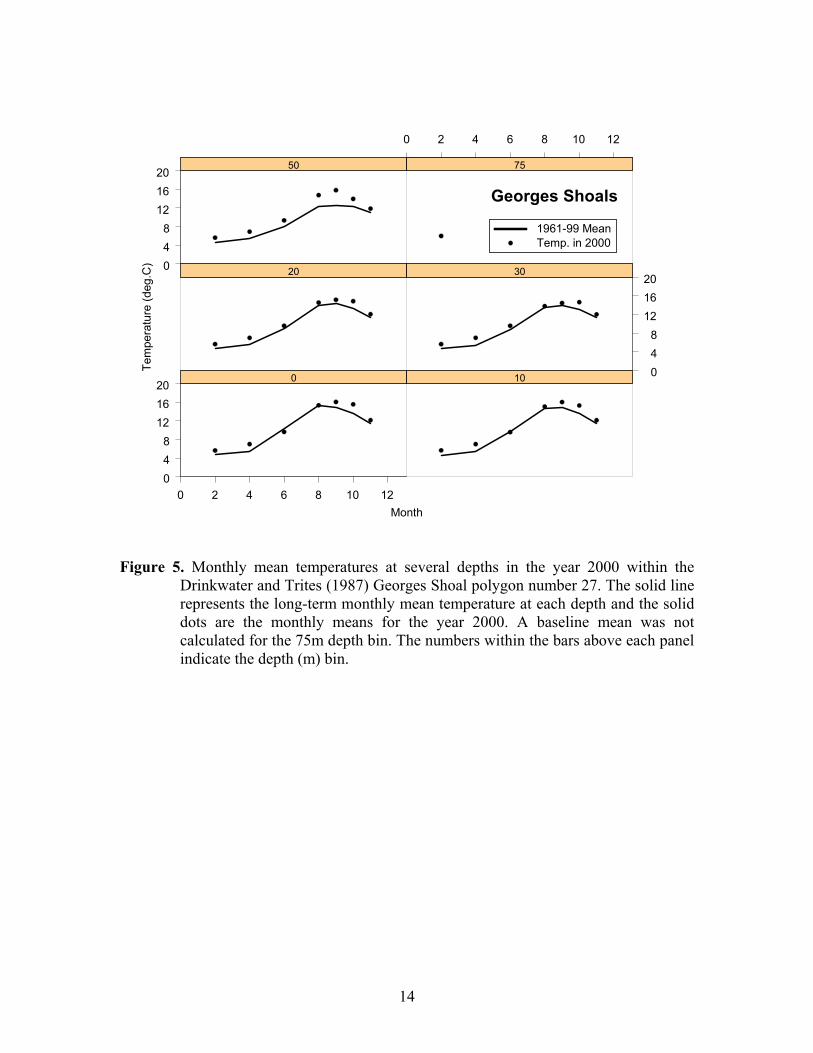
The updated time series for Georges Basin, Georges Shoals and easternGeorges Bank are shown in Figures 2-4. Each figure shows the monthly anomalyand five-year running means of the annual anomalies. The temporal pattern intemperatures is similar in both series. The running mean anomalies were positiveduring the 1950s, negative during the 1960s and positive since the early 1970s.The monthly mean temperatures for the 3 polygons in the year 2000 weregenerally above long-term means (Fig.2-5).
Vertical Stratification
Vertical stratification affects many processes that may influence the growthand survival of fish during their life history. For example, stratification influencesvertical mixing, the timing and magnitude of plankton blooms, perhaps thestructure of the plankton community and the structure of currents.
Drinkwater et al. (2001a) calculated time series of vertical stratification forthe Drinkwater and Trites (1987) geographic polygons referred to earlier. Thestratification index they used was defined from the archived hydrographic data asthe difference in the monthly mean density of the seawater at 0 and 50m depth.The units of the index are (g/ml)/m and a value of 0.1 (g/ml)/m corresponds to adifference of 0.5 sigma-t units over the 50m-depth interval. As with temperature,they calculated the monthly anomaly in density stratification by subtracting the1961-1999 monthly mean from each individual monthly mean. The annual

5
anomalies were calculated as the mean of the available monthly means withineach year. These annual mean anomalies were then smoothed with a five-yearrunning mean.
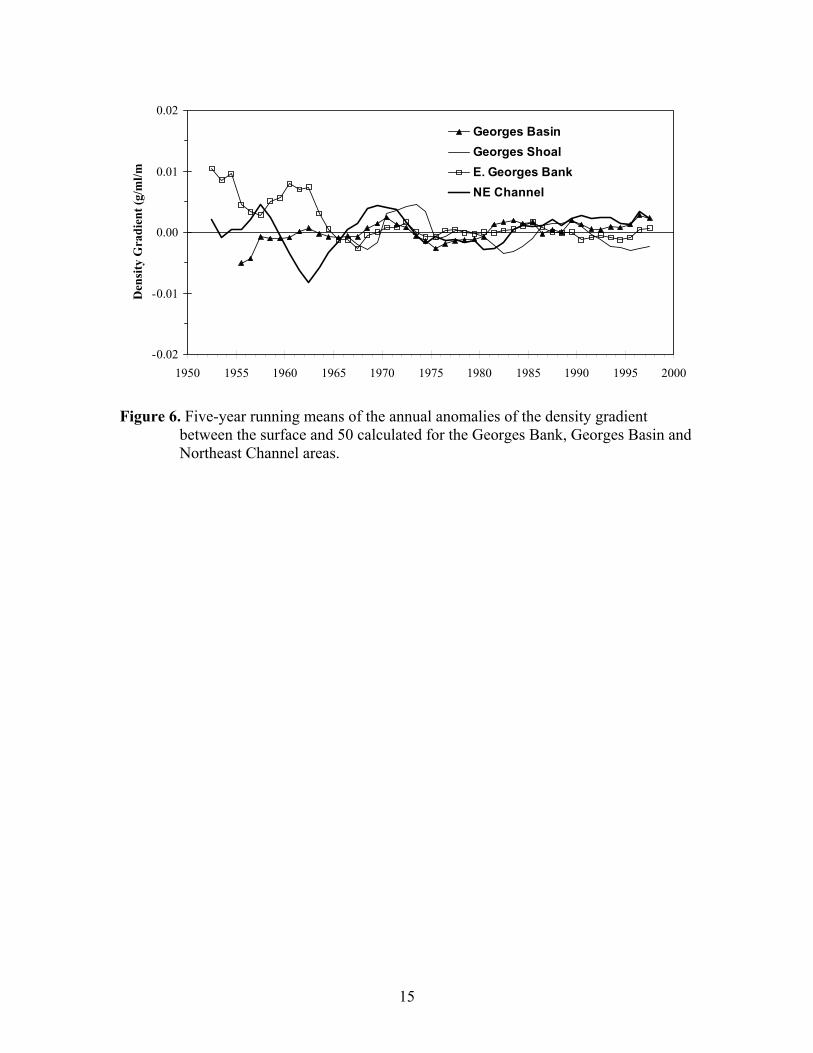
The five-year running mean time series of the annual anomalies in thevertical stratification index are presented in Fig. 6 for the Georges Basin, GeorgesShoals, Eastern Georges Bank and Northeast Channel polygons. In all series thestratification has varied by less than 0.01 (g/ml)/m or less than 0.05 sigma-t unitsper 50m. Each series shows relatively large variability during the 1950s, 1960s andearly 1970s and a pronounced lack of inter-annual variability since about 1975.This pattern is not like that on the Scotian Shelf. Stratification on the Scotian Shelfin recent years has been enhanced and characterized by positive anomalies ofabout 0.05 (g/ml)/m (Drinkwater et al. (2001a).
Satellite Derived SST
The above environmental indicators are based on data collected at sea fromvarious platforms. The data is often limited in space and time. A more completespatial and temporal sampling for the sea surface is obtained from environmentalindices derived from satellites. We therefore include satellite based indicators ofsea surface temperature (SST).
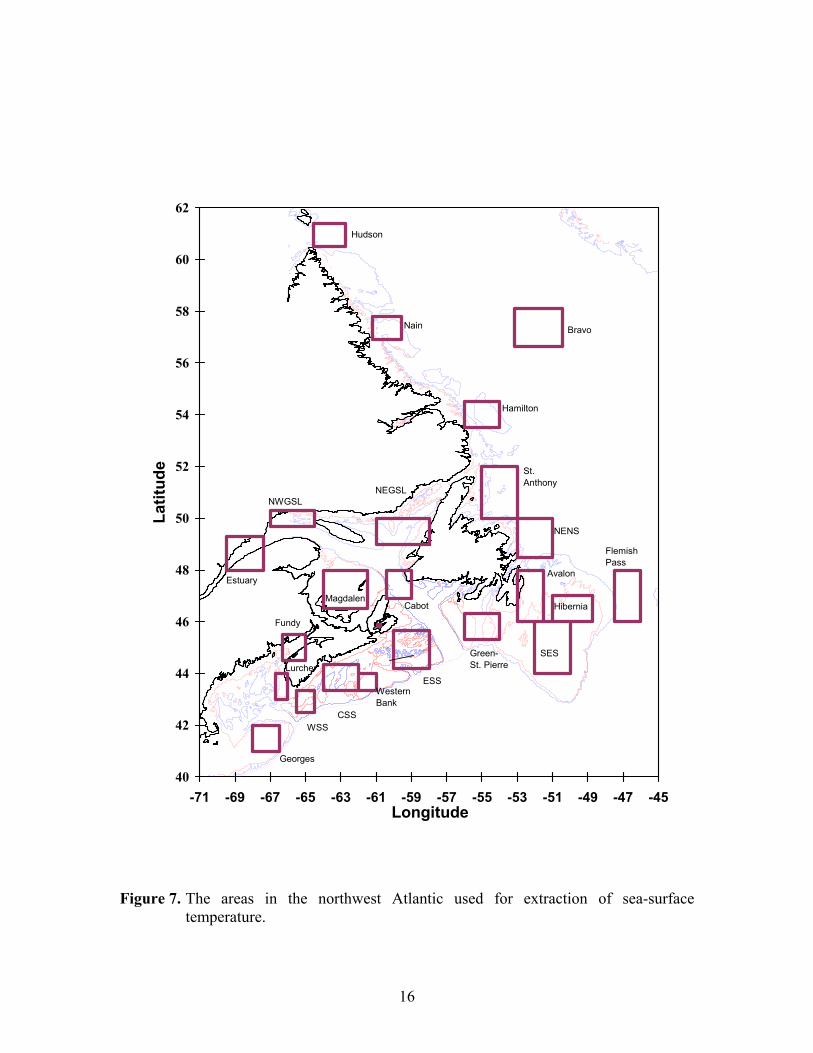
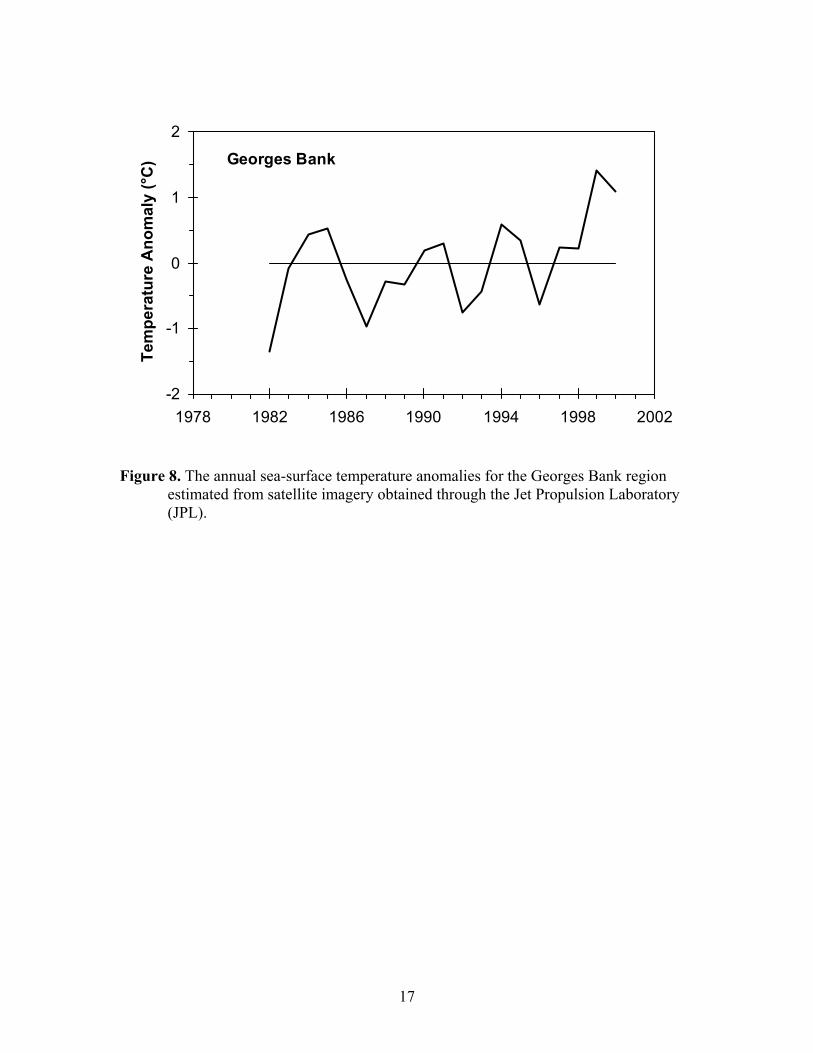
Sea Surface Temperatures (SST) estimated from satellite observationsmade by the Jet Propulsion Laboratory are archived at the Bedford Institute ofOceanography. The data series begins in October 1981. Mason et al. (1999) andPetrie and Mason (2000) provide a discussion of their accuracy and utility as aclimate indicator. Drinkwater et al. (2001b) calculated monthly mean SSTestimates from the archived data for 23 geographic boxes distributed throughoutAtlantic Canada (Fig.7). Within each box the long-term monthly means are derivedfor the period 1981-2000 and the monthly anomalies were calculated bysubtracting the long-term means from each monthly mean. The time series of theannual anomalies for the Georges Bank box are plotted in Fig. 8. The annual SSTanomaly in the years 1999 and 2000 was about +1°C and higher than all previousyears. This pattern is similar to that on the Scotian and Newfoundland Shelves(Drinkwater et al. 2001b).
Frontal Analysis: Shelf/Slope Front
The waters on the Scotian Shelf and in the Gulf of Maine have distincttemperature and salinity characteristics from those found in the adjacent offshorewaters. The boundary between the shelf and offshore slope waters is regularlydetected in satellite thermal imagery. Positions of this boundary, referred to as theshelf-slope front, were digitized from satellite derived SST charts for the regionbetween 50°W and 75°W for the years 1973 to 1992 (Drinkwater et al., 1994).From January 1973 until May 1978, the charts covered the region north toGeorges Bank, but in June 1978 the areal coverage was extended to 55°W.
6
Monthly mean positions of the shelf/slope front in degrees latitude at each degreeof longitude were estimated. NOAA updated this dataset until October 1995. Acommercial company has continued the analysis but did not begin until April 1996.Their initial charts did not contain data east of 60°W but within a year wereextended east to 55°W. Data for 2000 have been digitized, estimates of monthlymean positions determined and anomalies relative to the 20-year period, 1978 to1997, were calculated. During the past 2 years, the charts only extend east to56°W.
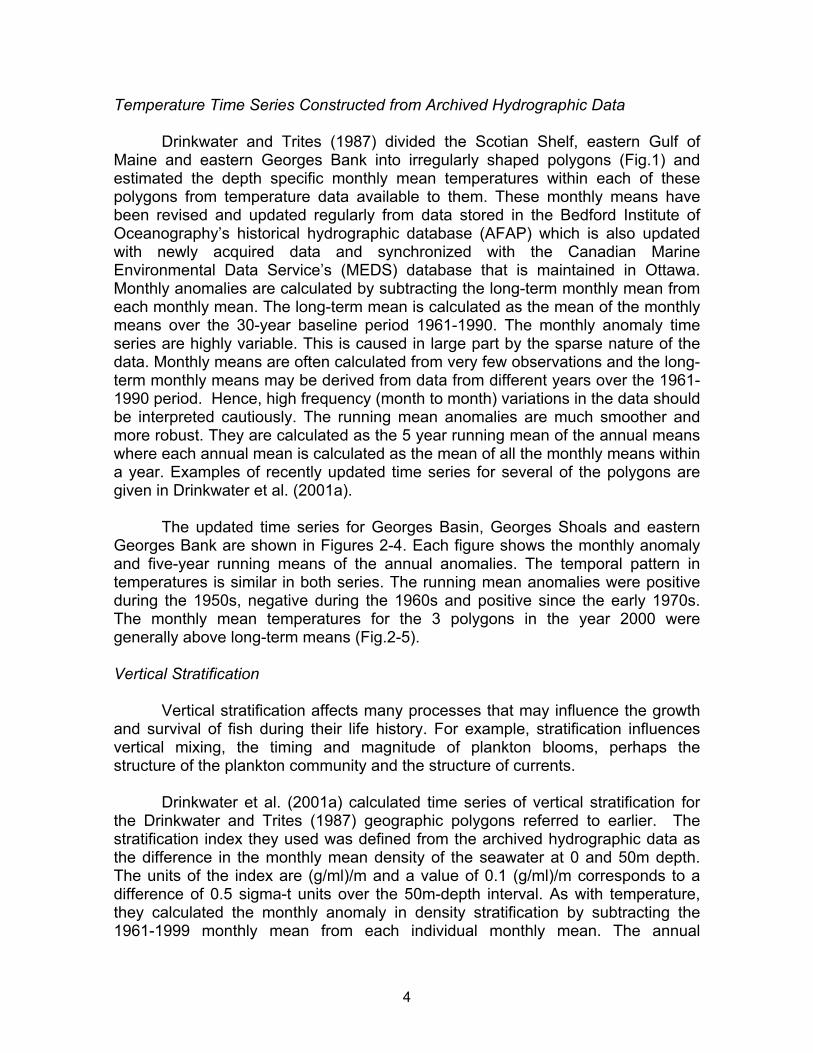
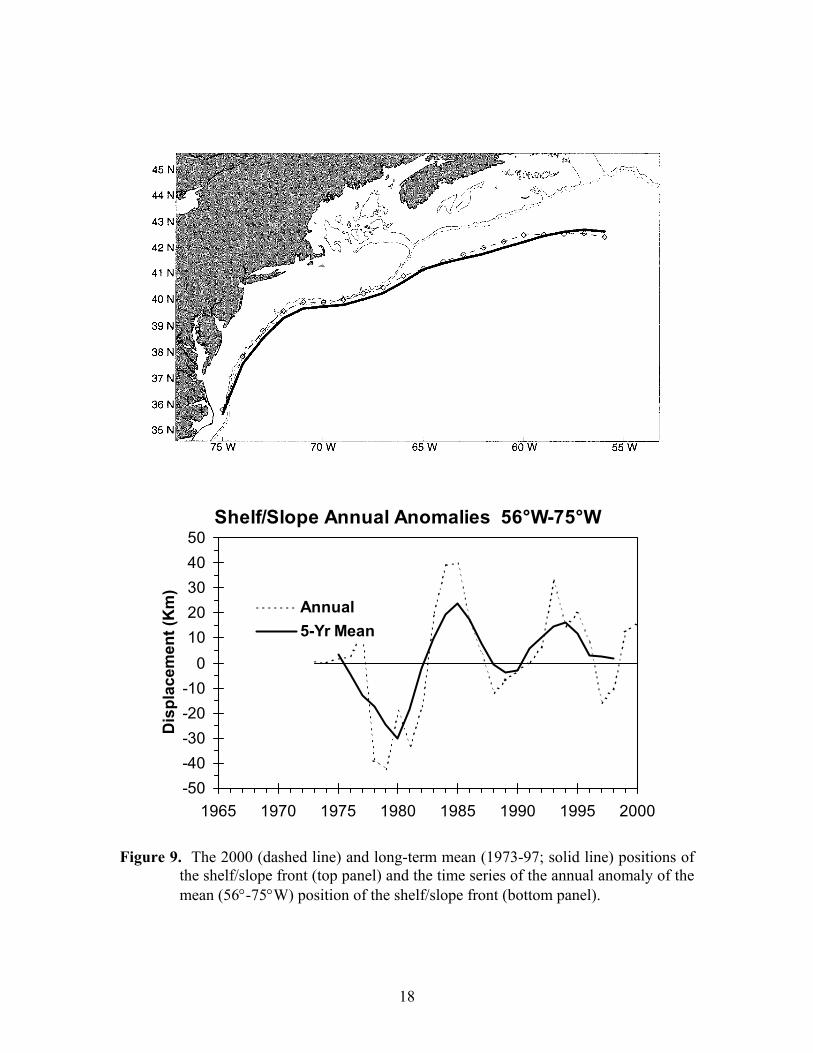
The overall mean position of the Shelf/Slope front and annual mean positionfor the year 2000 is shown in Figure 9. Although not evident in the annual meanposition, the front is generally farthest offshore in winter and farthest onshore inlate summer and early autumn. During the year 2000, the shelf/slope front wasshoreward of its long-term mean position except at its eastern end. The largestpositive deviations occurred just east of Cape Hatteras. The time series of theannual mean position (averaged over 56°W-75°W) shows the front was at aminimum seaward location in 1985 and again in 1993 (Fig. 9). Since 1993, thefront moved steadily seaward approximately 40 km, reaching its most southerlyposition in 1997. From 1998 to 2000, the position of the Shelf/Slope front movednorthward with the largest increase from 1998 to 1999. The position in 2000 wasslightly farther north than in 1999.
Frontal Analysis: North wall of the Gulf Stream
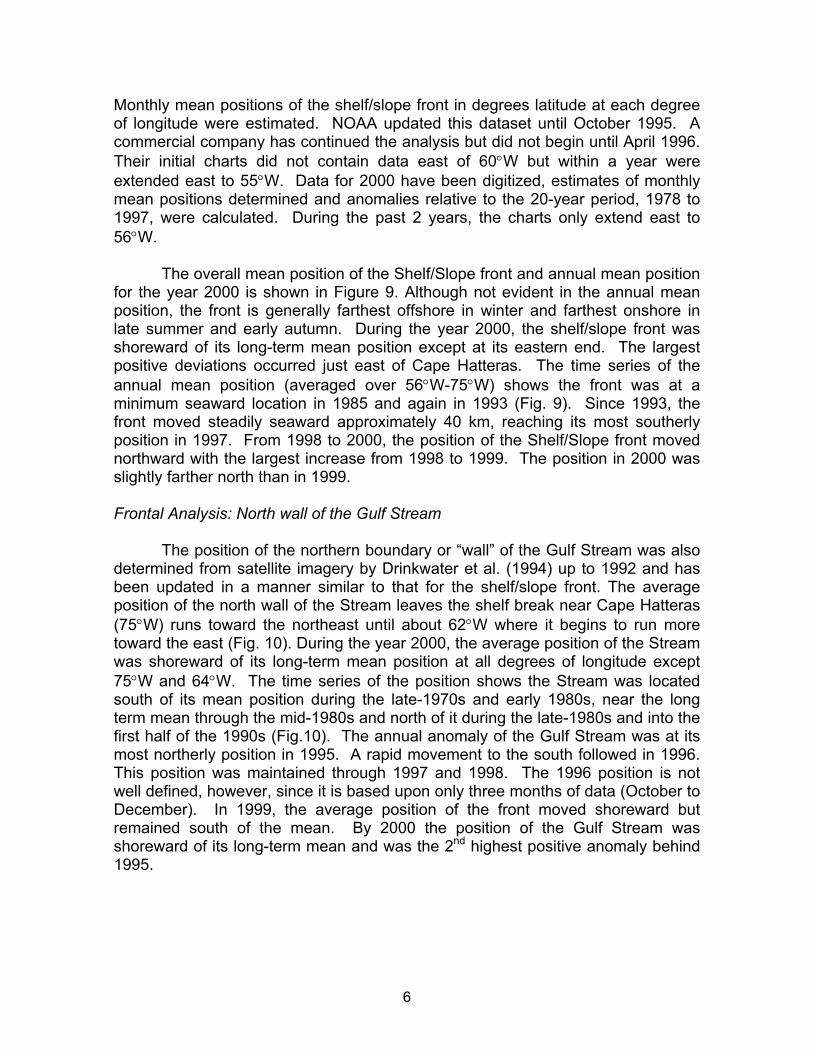
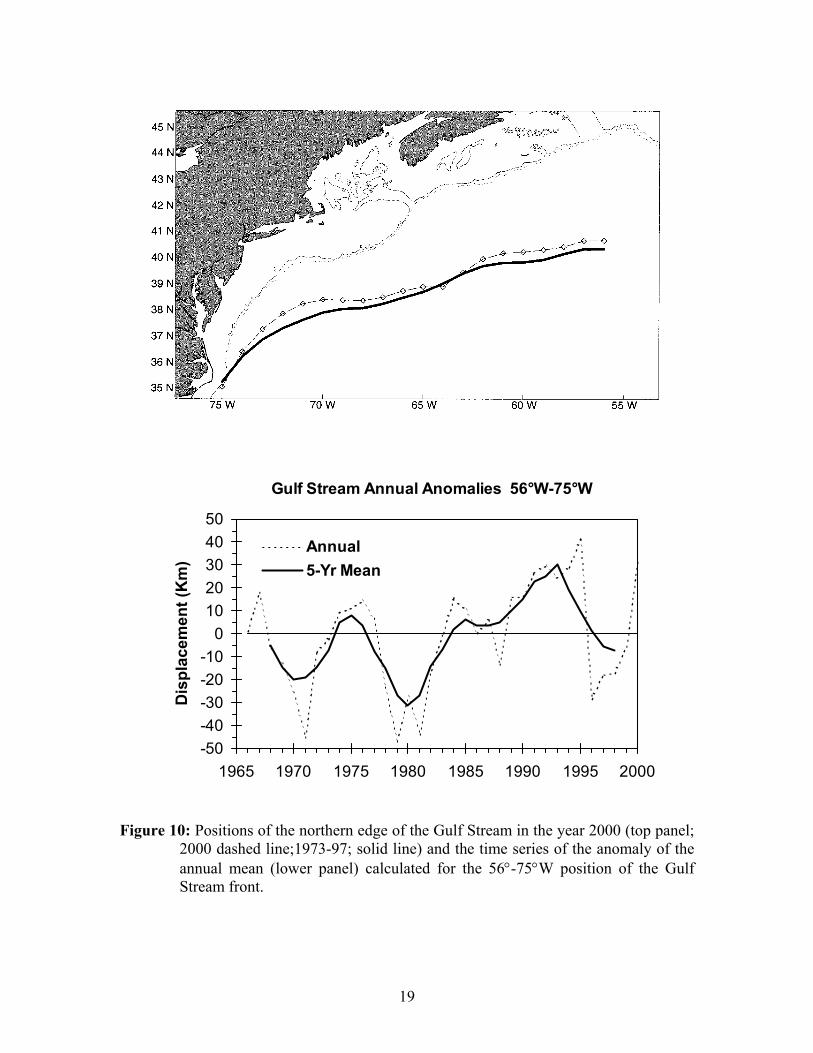
The position of the northern boundary or “wall” of the Gulf Stream was alsodetermined from satellite imagery by Drinkwater et al. (1994) up to 1992 and hasbeen updated in a manner similar to that for the shelf/slope front. The averageposition of the north wall of the Stream leaves the shelf break near Cape Hatteras(75°W) runs toward the northeast until about 62°W where it begins to run moretoward the east (Fig. 10). During the year 2000, the average position of the Streamwas shoreward of its long-term mean position at all degrees of longitude except75°W and 64°W. The time series of the position shows the Stream was locatedsouth of its mean position during the late-1970s and early 1980s, near the longterm mean through the mid-1980s and north of it during the late-1980s and into thefirst half of the 1990s (Fig.10). The annual anomaly of the Gulf Stream was at itsmost northerly position in 1995. A rapid movement to the south followed in 1996.This position was maintained through 1997 and 1998. The 1996 position is notwell defined, however, since it is based upon only three months of data (October toDecember). In 1999, the average position of the front moved shoreward butremained south of the mean. By 2000 the position of the Gulf Stream wasshoreward of its long-term mean and was the 2nd highest positive anomaly behind1995.
7
Biological Conditions
Phytoplankton
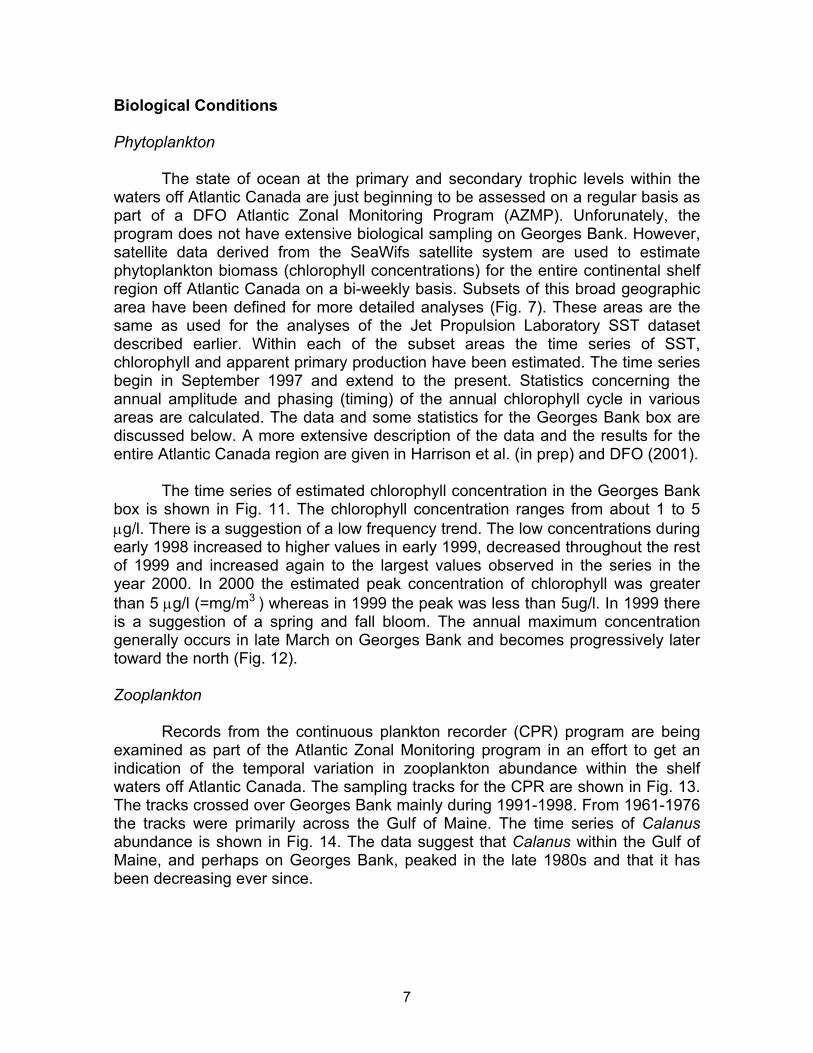
The state of ocean at the primary and secondary trophic levels within thewaters off Atlantic Canada are just beginning to be assessed on a regular basis aspart of a DFO Atlantic Zonal Monitoring Program (AZMP). Unforunately, theprogram does not have extensive biological sampling on Georges Bank. However,satellite data derived from the SeaWifs satellite system are used to estimatephytoplankton biomass (chlorophyll concentrations) for the entire continental shelfregion off Atlantic Canada on a bi-weekly basis. Subsets of this broad geographicarea have been defined for more detailed analyses (Fig. 7). These areas are thesame as used for the analyses of the Jet Propulsion Laboratory SST datasetdescribed earlier. Within each of the subset areas the time series of SST,chlorophyll and apparent primary production have been estimated. The time seriesbegin in September 1997 and extend to the present. Statistics concerning theannual amplitude and phasing (timing) of the annual chlorophyll cycle in variousareas are calculated. The data and some statistics for the Georges Bank box arediscussed below. A more extensive description of the data and the results for theentire Atlantic Canada region are given in Harrison et al. (in prep) and DFO (2001).
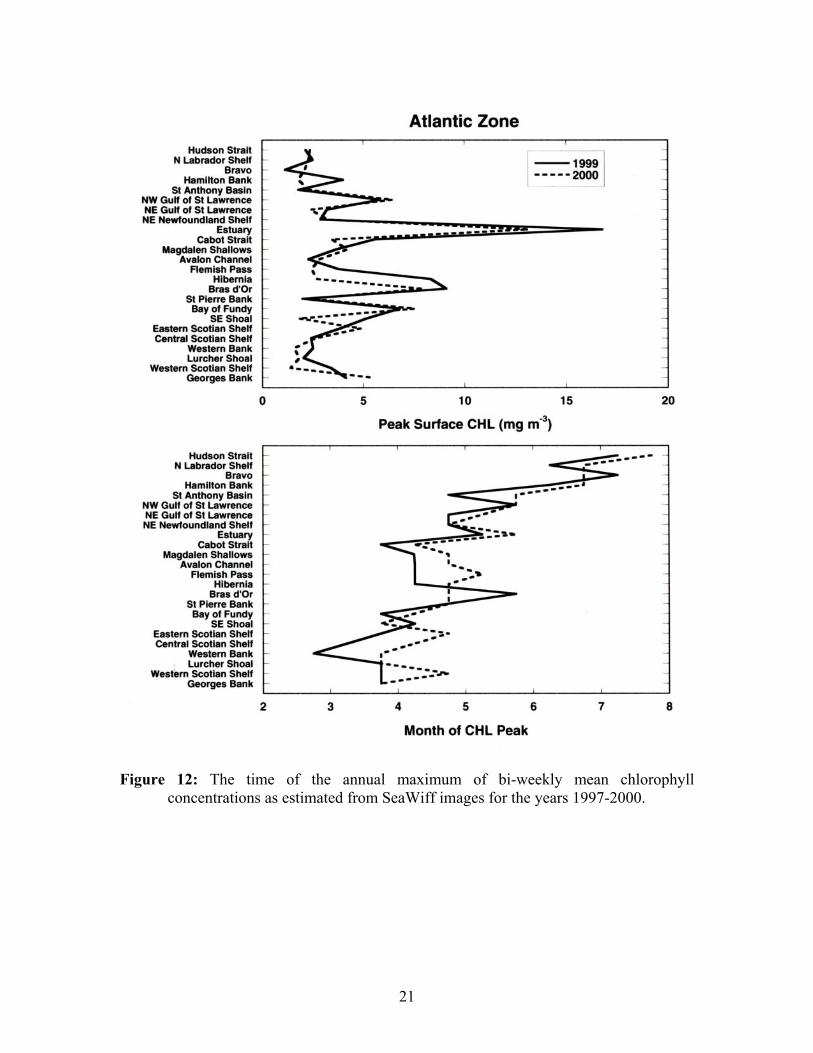
The time series of estimated chlorophyll concentration in the Georges Bankbox is shown in Fig. 11. The chlorophyll concentration ranges from about 1 to 5µg/l. There is a suggestion of a low frequency trend. The low concentrations duringearly 1998 increased to higher values in early 1999, decreased throughout the restof 1999 and increased again to the largest values observed in the series in theyear 2000. In 2000 the estimated peak concentration of chlorophyll was greaterthan 5 µg/l (=mg/m3 ) whereas in 1999 the peak was less than 5ug/l. In 1999 thereis a suggestion of a spring and fall bloom. The annual maximum concentrationgenerally occurs in late March on Georges Bank and becomes progressively latertoward the north (Fig. 12).
Zooplankton
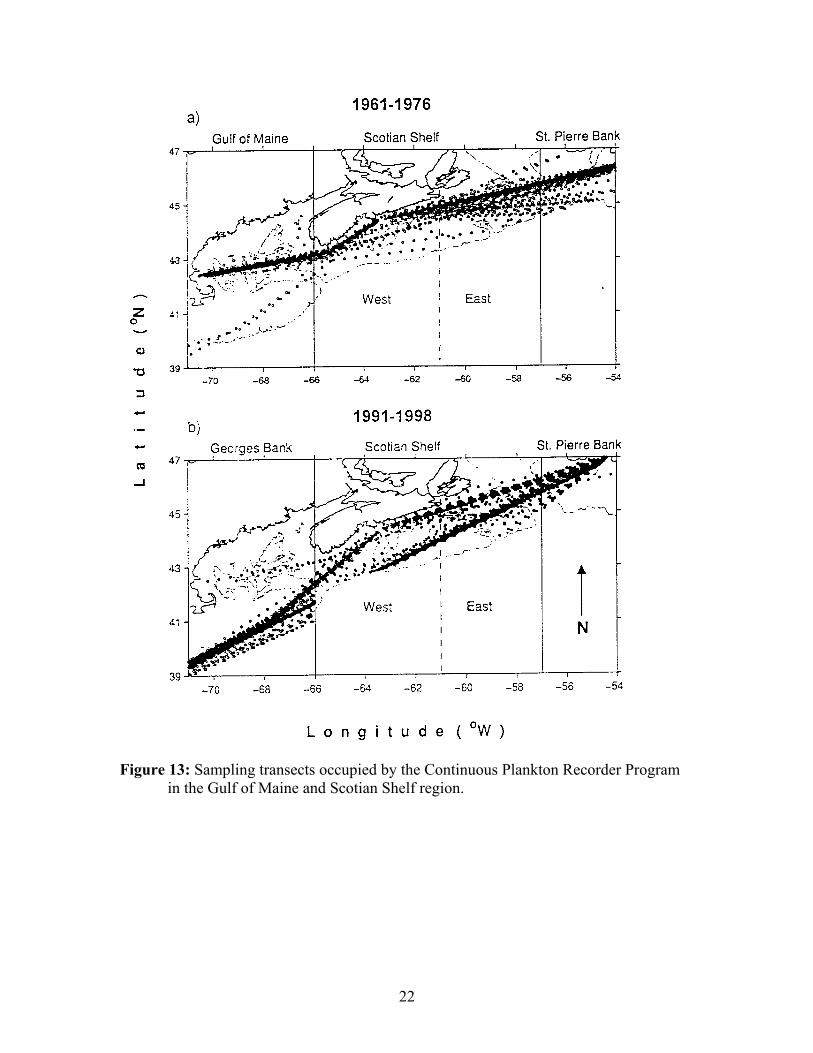
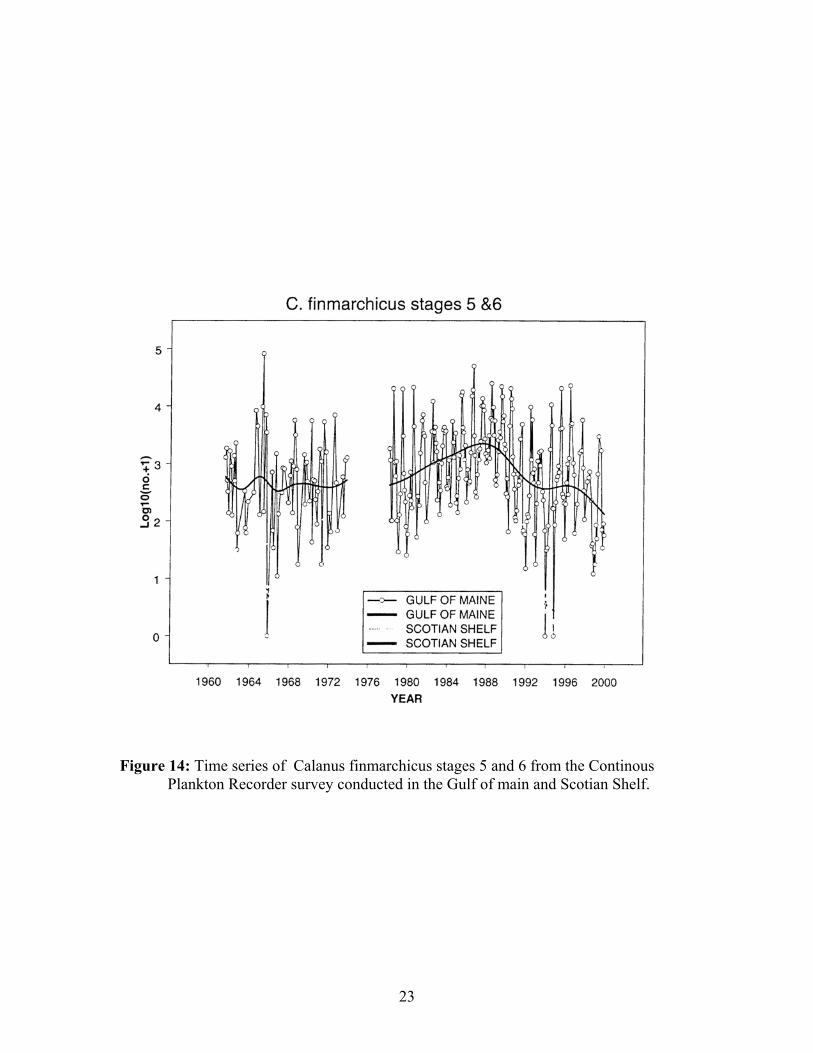
Records from the continuous plankton recorder (CPR) program are beingexamined as part of the Atlantic Zonal Monitoring program in an effort to get anindication of the temporal variation in zooplankton abundance within the shelfwaters off Atlantic Canada. The sampling tracks for the CPR are shown in Fig. 13.The tracks crossed over Georges Bank mainly during 1991-1998. From 1961-1976the tracks were primarily across the Gulf of Maine. The time series of Calanusabundance is shown in Fig. 14. The data suggest that Calanus within the Gulf ofMaine, and perhaps on Georges Bank, peaked in the late 1980s and that it hasbeen decreasing ever since.
8
Physical Conditions During the Canadian Groundfish Spring Surveys
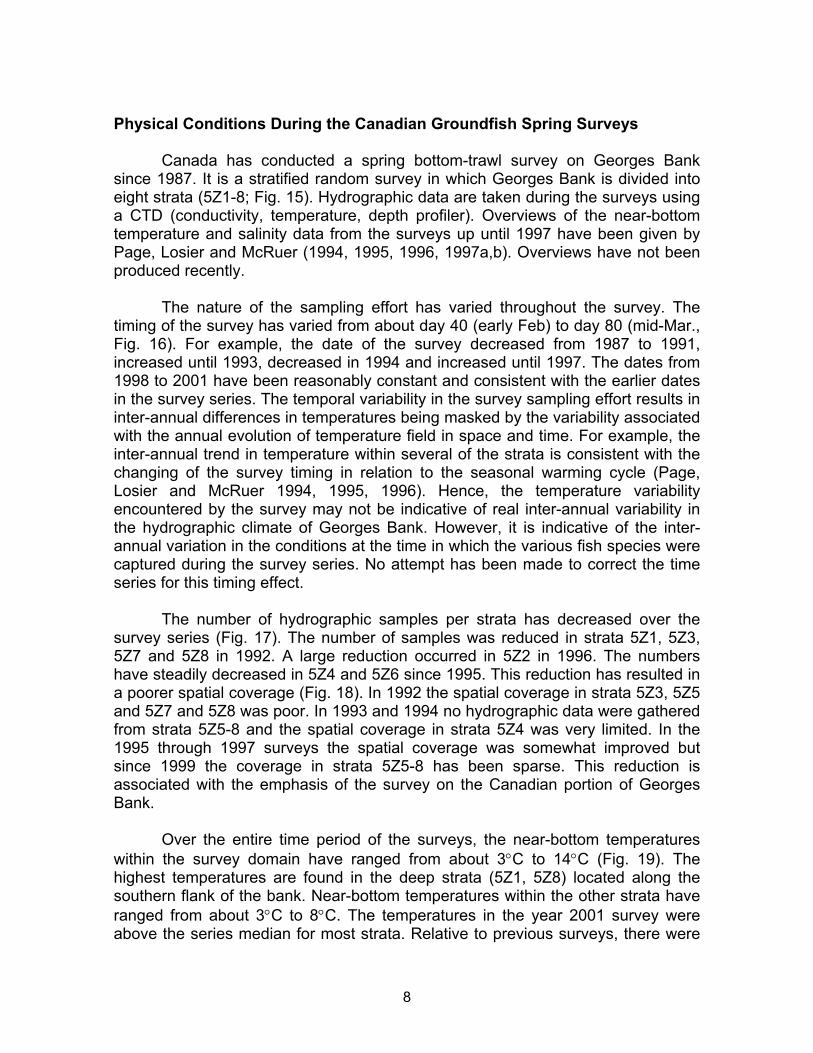
Canada has conducted a spring bottom-trawl survey on Georges Banksince 1987. It is a stratified random survey in which Georges Bank is divided intoeight strata (5Z1-8; Fig. 15). Hydrographic data are taken during the surveys usinga CTD (conductivity, temperature, depth profiler). Overviews of the near-bottomtemperature and salinity data from the surveys up until 1997 have been given byPage, Losier and McRuer (1994, 1995, 1996, 1997a,b). Overviews have not beenproduced recently.
The nature of the sampling effort has varied throughout the survey. Thetiming of the survey has varied from about day 40 (early Feb) to day 80 (mid-Mar.,Fig. 16). For example, the date of the survey decreased from 1987 to 1991,increased until 1993, decreased in 1994 and increased until 1997. The dates from1998 to 2001 have been reasonably constant and consistent with the earlier datesin the survey series. The temporal variability in the survey sampling effort results ininter-annual differences in temperatures being masked by the variability associatedwith the annual evolution of temperature field in space and time. For example, theinter-annual trend in temperature within several of the strata is consistent with thechanging of the survey timing in relation to the seasonal warming cycle (Page,Losier and McRuer 1994, 1995, 1996). Hence, the temperature variabilityencountered by the survey may not be indicative of real inter-annual variability inthe hydrographic climate of Georges Bank. However, it is indicative of the inter-annual variation in the conditions at the time in which the various fish species werecaptured during the survey series. No attempt has been made to correct the timeseries for this timing effect.
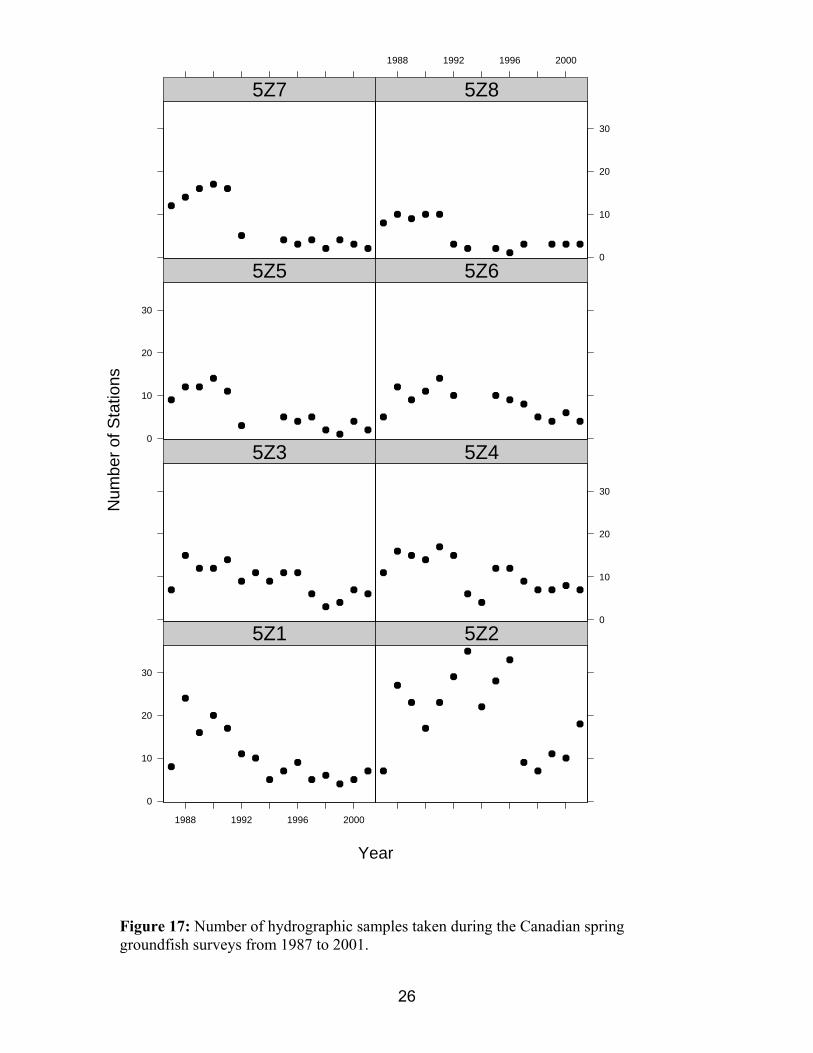
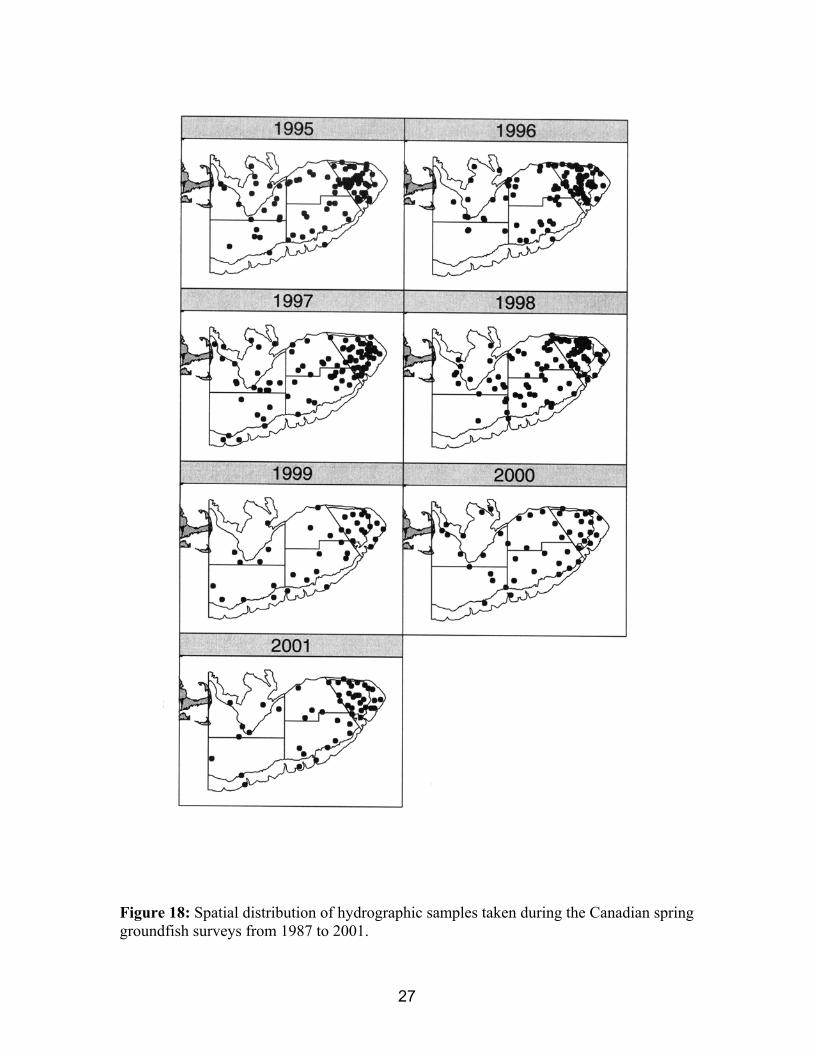
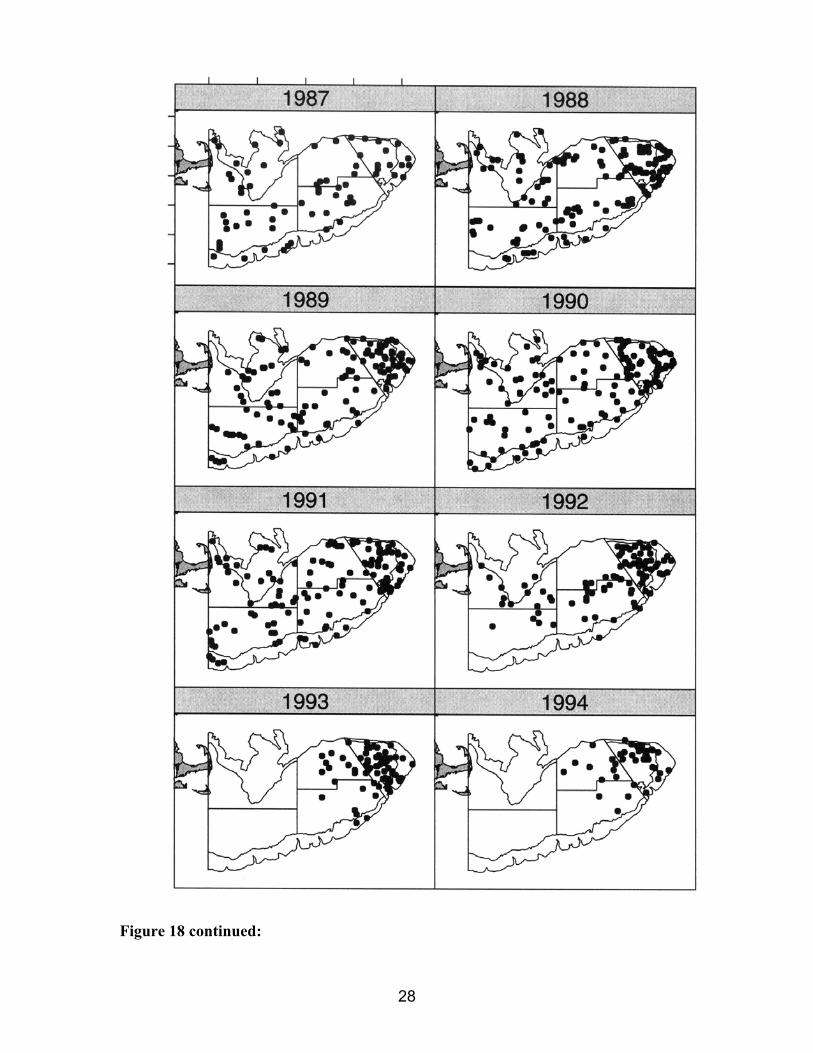
The number of hydrographic samples per strata has decreased over thesurvey series (Fig. 17). The number of samples was reduced in strata 5Z1, 5Z3,5Z7 and 5Z8 in 1992. A large reduction occurred in 5Z2 in 1996. The numbershave steadily decreased in 5Z4 and 5Z6 since 1995. This reduction has resulted ina poorer spatial coverage (Fig. 18). In 1992 the spatial coverage in strata 5Z3, 5Z5and 5Z7 and 5Z8 was poor. In 1993 and 1994 no hydrographic data were gatheredfrom strata 5Z5-8 and the spatial coverage in strata 5Z4 was very limited. In the1995 through 1997 surveys the spatial coverage was somewhat improved butsince 1999 the coverage in strata 5Z5-8 has been sparse. This reduction isassociated with the emphasis of the survey on the Canadian portion of GeorgesBank.
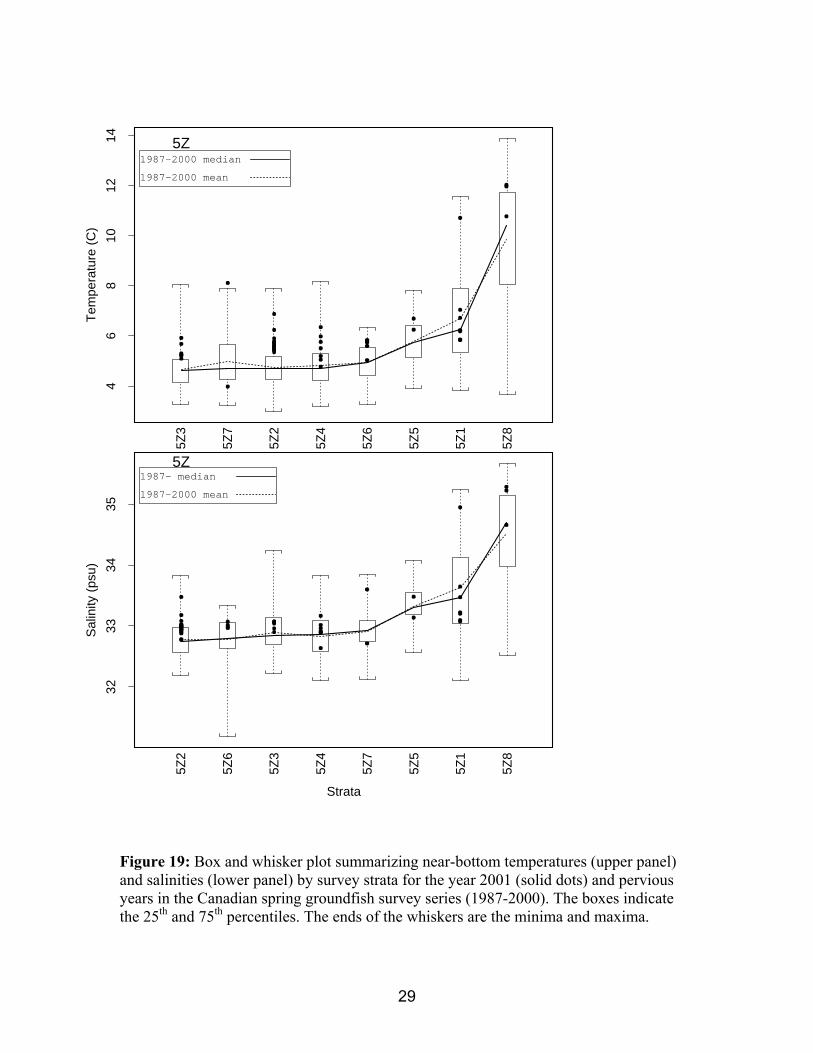
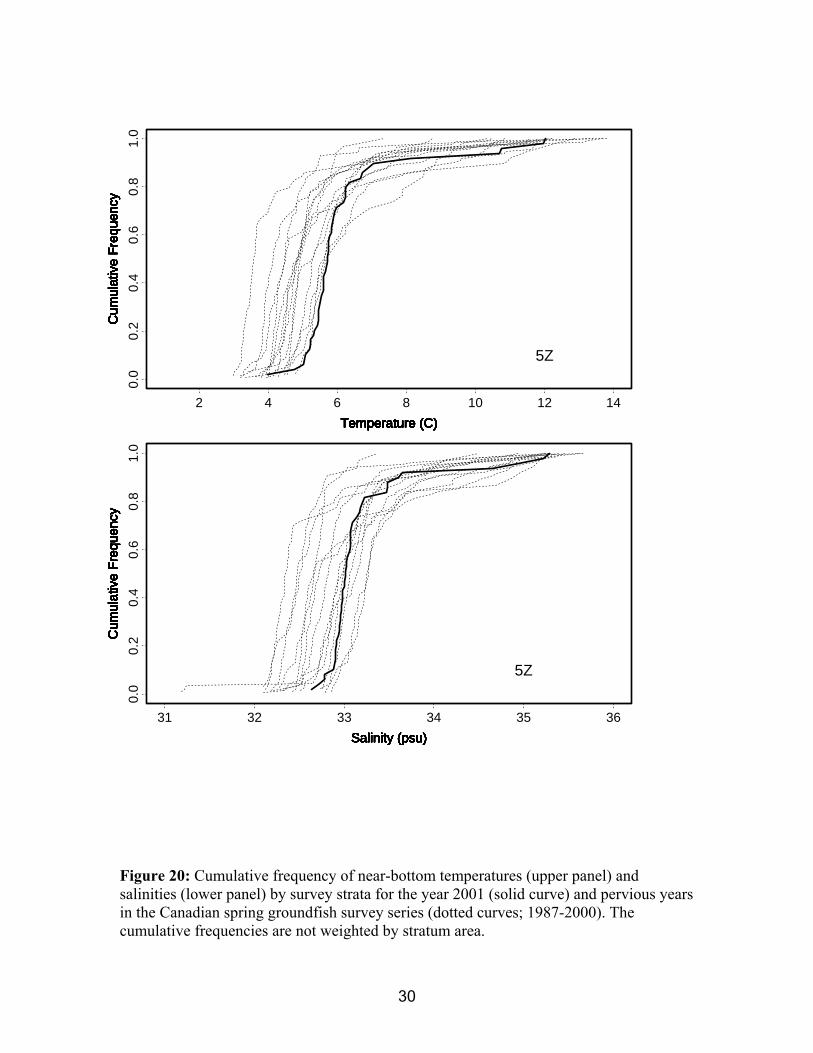
Over the entire time period of the surveys, the near-bottom temperatureswithin the survey domain have ranged from about 3°C to 14°C (Fig. 19). Thehighest temperatures are found in the deep strata (5Z1, 5Z8) located along thesouthern flank of the bank. Near-bottom temperatures within the other strata haveranged from about 3°C to 8°C. The temperatures in the year 2001 survey wereabove the series median for most strata. Relative to previous surveys, there were
9
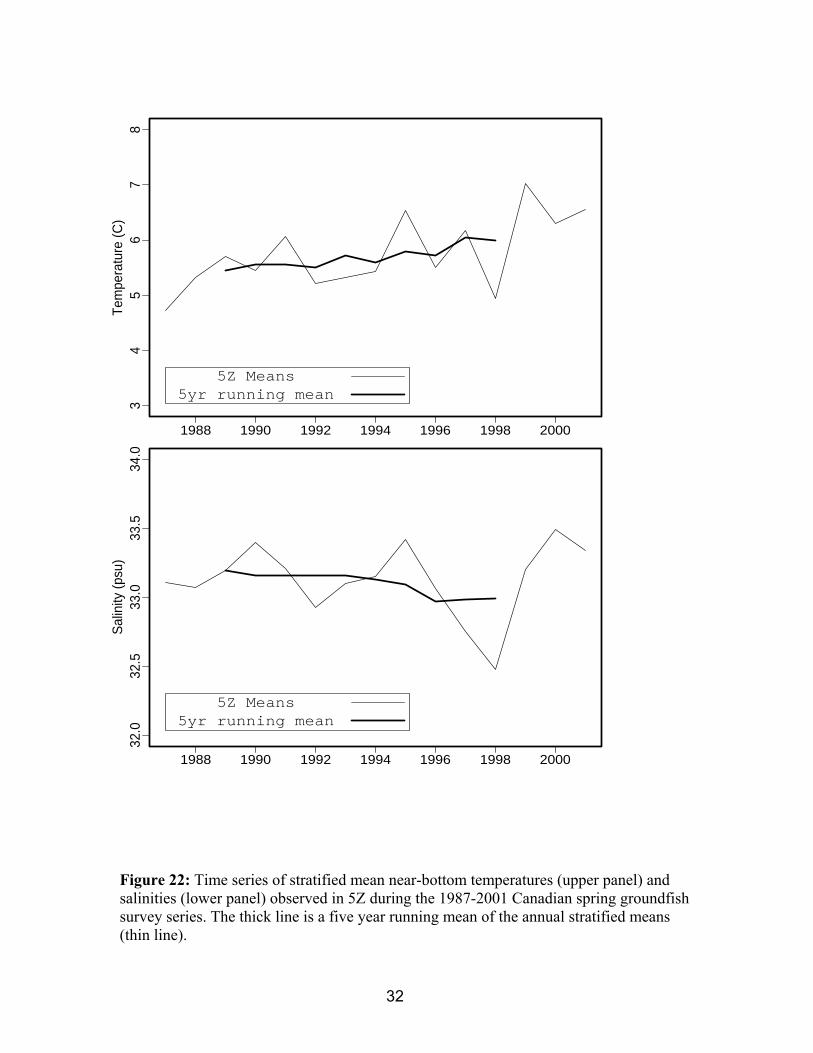
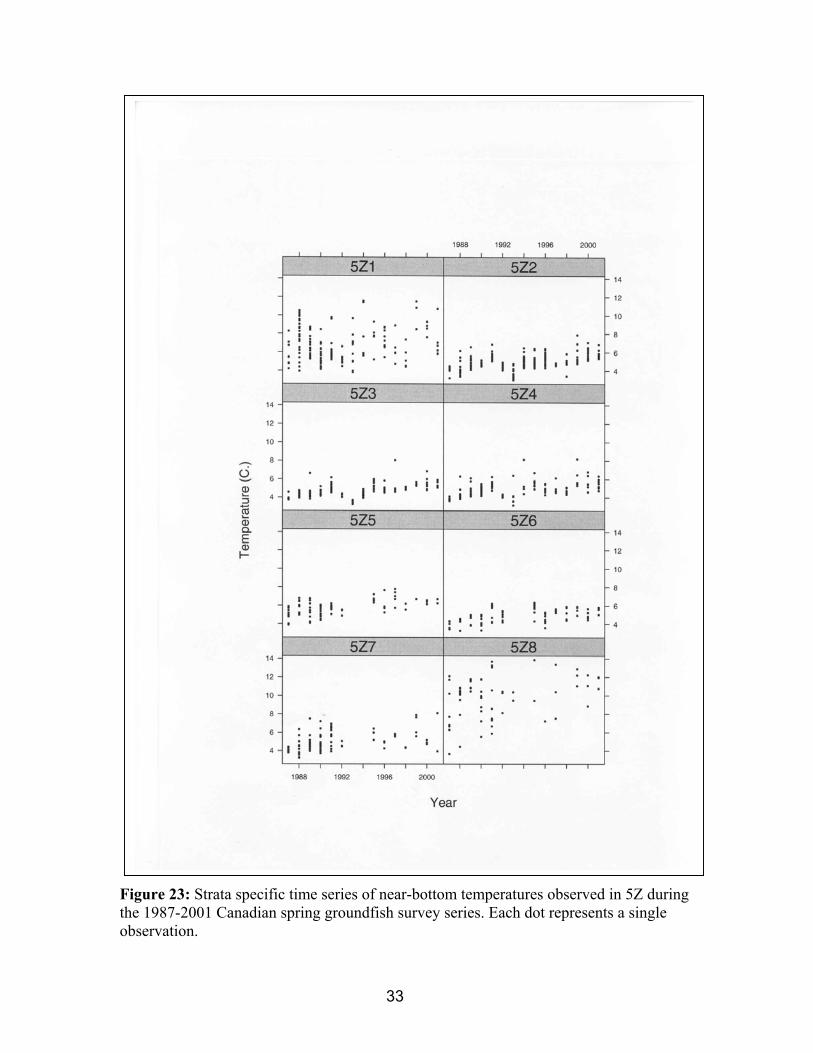
few temperatures below 5°C (Fig. 20). The time series of unweighted (Fig. 21) andstrata area weighted (Fig. 22) near-bottom temperatures for 5Z indicate that themedian and mean temperatures in the last three surveys have been the warmest inthe survey series (Fig. 21). This pattern may be influenced by the changes in thesample coverage (Fig. 21). The strata specific time series of near-bottomtemperatures are given in Fig. 23. Much of the variability in some of the strata isdue to the large range in near-bottom depths sampled in these strata (Page et al.1996, 1997a,b).
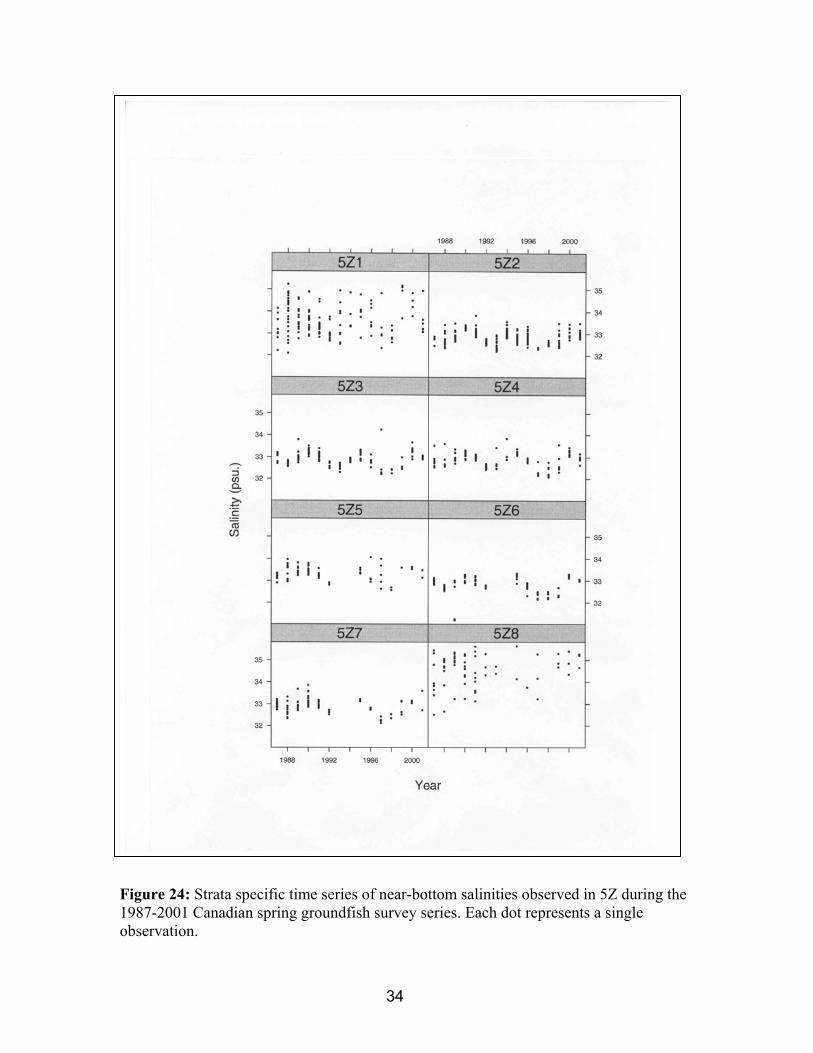
Near-bottom salinities in 2001 also tended to be above the series meansand medians, but not to as great as an extent as temperature (Fig. 19 and 20). Thetime series of unweighted (Fig. 21) and strata area weighted (Fig. 22) near-bottomsalinities indicate that the median and mean salinities have varied cyclically overthe years. The salinities in the last two surveys have been relatively high. As withtemperature the decrease in 1993 is associated with a very limited sampling effortin that year. The strata specific time series of near-bottom salinities are given inFigure 24.
Summary and Discussion
The water temperatures on Georges Bank in recent years and in recentCanadian groundfish bottom-trawl surveys have been relatively warm. This hasbeen evident in both in situ observations and estimates derived from remotesensors. The temperatures however, are still well within the temperature rangenormally associated with the demersal stages of cod and haddock caught withinthe 5Z and 4VWX areas (Page et al. 1994, Smith et al. 1994). Hence theconditions in 2000 should not have influenced the relative catchability of the fish.
The estimates of chlorophyll concentration suggest that phytoplanktonbiomass was higher in the year 2000 than in 1999. The Continuous PlanktonRecorder data suggest the biomass of Calanus has been decreasing within theGulf of Maine during the past several years. Unfortunately, changes in the locationof the CPR line, mean that data from directly over Georges bank is not longercollected.
The timing of the Canadian Spring groundfish survey coincides closely withthe timing of cod and haddock spawning period on Georges Bank as indicated bythe presence of eggs in the MARMAP icthyoplankton survey series (Page, Losierand Berrien 1997). The median date for spawning within 5Zjm is about day 75(mid-March) for cod and day 80 (mid-March) for haddock. The survey dates rangefrom about day 40 to 80. The spread in the spawning time is considerably differentbetween the two species. Cod spawning extends from about late November to thelate April, whereas haddock spawning is mainly between late-February and lateMarch. It is interesting to speculate that some of the inter-annual variability insurvey abundance estimates may be related to the variation in the timing of the
10
survey relative to fish migration and behavior related to the annual spawning cycle.Unfortunately, we are not aware of evidence to support or dispute this situation.
Acknowledgements
The data summarized in this manuscript were collected by many people,many whom are acknowledged in the references cited. In particular, importancewere the ships crew and scientific staff from the Marine Fish (MFD) and OceanSciences (OSD) Divisions from the Department of Fisheries and Oceans,Maritimes Region. Key personnel included Jeff McRuer (MFD), Jeff Spry (OSD)and Kevin Pauly (OSD). The groundfish survey data were also collected with thehelp of the officers and crew of the CCV A.J. Needler.
References
DFO. 2001. Chemical and biological oceanographic conditions 2000 – MaritimesRegion. DFO Science Stock Status Report xx-xx (2001).
Drinkwater, K.F., R.A. Myers, R.G. Pettipas and T.L. Wright. 1994. Climatic datafor the Northwest Atlantic: The position of the shelf/slope front and thenorthern boundary of the Gulf Stream between 50°W and 75°W, 1973-1992.Can. Data Rept. Fish. Ocean. Sci. 125: 103 pp.
Drinkwater, K.F., B. Petrie, R.G. Pettipas, L. Petrie and V. Soukhovtsev. 2001a.Physical Oceanographic Conditions on the Scotian Shelf and in the Gulf ofMaine during 2000. Canadian Stock Assessment Secretariat ResearchDocument 2001/xxx.
Drinkwater, K.F., B. Petrie, R.G. Pettipas and W.M. Petrie. 2001b. Overview ofMeteorological, Sea-Ice and Sea-Surface Temperature Conditions offEastern Canada during 2000. Canadian Stock Assessment SecretariatResearch Document 2001/xxx.
Drinkwater, K.F. and R.W. Trites. 1987. Monthly means of temperature and salinityin the Scotian Shelf region. Can. Tech. Rep. Fish. Aquat. Sci. 1539: 101p.
Harrison et al. in prep. Chemical and biological oceanographic conditions in theyear 2000 in the Maritimes Region of Atlantic Canada. Canadian StockAssessment Secretariat Research Document 2001/xxx.
Mason, C.S., B. Petrie and B.J. Topliss. 1999. Satellite measurements of sea-surface temperature: an application to regional ocean climate. NAFO Sci.Coun. Studies, 32: 45-54.
11
Page, F.H., R. Losier and J. McRuer. 1994. Overview of temperature and salinityconditions within NAFO Areas 4VWX and 5Z, during Canadian 1993groundfish research vessel surveys. DFO Atl. Fish. Res. Doc. 94/94, 53 p.
Page, F.H., R. Losier and J. McRuer. 1995. Overview of temperature and salinityconditions within the Scotia-Fundy Region, NAFO Areas 4VWX and 5Z,during Canadian 1994 groundfish research vessel surveys. DFO Atl. Fish.Res. Doc. 95/138, 63 p.
Page, F.H., R. Losier and J. McRuer. 1996. Overview of near-bottom watertemperature and salinity conditions observed during the groundfish researchvessel surveys conducted within the Scotia-Fundy Region, NAFO Areas4VWX and 5Z in 1995. DFO Atl. Fish. Res. Doc. 96/20, 68p.
Page, F.H., R. Losier and J. McRuer. 1997a. Overview of 1996 hydrographicsampling effort and near-bottom water temperature and salinity conditionsduring the Canadian spring research vessel groundfish surveys conductedon the eastern Scotian Shelf (4VsW) and Georges Bank (5Z). Can. StockAssess. Secretariat Res. Doc 97/12, 29p.
Page, F.H., R. Losier and J. McRuer. 1997b. Overview of 1997 hydrographicsampling effort and near-bottom temperature and salinity conditions duringthe Canadian research vessel groundfish surveys conducted during thespring on the eastern Scotian Shelf (4VsW) and Georges Bank (5Z). Can.Stock Assess. Secretariat Res. Doc 97/127, 29p.
Page, F., R. Losier, S. Smith, and K. Hatt. 1994. Associations between cod, andtemperature, salinity and depth within the Canadian Groundfish bottom-trawlsurveys (1970-93) conducted within NAFO Divisions 4VWX and 5Z.Can.Tech. Rep. Fish. Aquat. Sci. 1958: vii + 160 p.
Petrie, B. and C.S. Mason. 2000. Satellite measurements of sea-surfacetemperature: an application to regional ocean climate. Can. Stock Assess.Secretariat Res. Doc. 2000/061, 24 pp.
Smith, S., R. Losier, F. Page and K. Hatt. 1994. Associations between haddock,and temperature, salinity and depth within the Canadian Groundfish bottom-trawl surveys (1970-93) conducted within NAFO Divisions 4VWX and 5Z.Can. Tech. Rep. Fish. Aquat. Sci. 1959: vi + 70 p.
12
Figure 1: Areas on the Scotian Shelf and eastern Gulf of Maine from Drinkwater andTrites (1987).
Georges Basin - 200 m.
-3
-2
-1
0
1
2
3
1950 1955 1960 1965 1970 1975 1980 1985 1990 1995 2000 2005
Tem
pera
ture
Ano
mal
y (°
C)
Figure 2: Time series of monthly mean temperature anomalies (dashed lines) at 200m inGeorges Basin (polygon 26) and their 5-year running means (solid line).
13
Figure 3: Time series of monthly mean temperature anomalies (dashed lines) at 30m onGeorges Shoals (polygon 27) and their 5-year running means (solid line).
Eastern Georges Bank - 50 m.
-4
-2
0
2
4
6
1950 1955 1960 1965 1970 1975 1980 1985 1990 1995 2000 2005
Tem
pera
ture
Ano
mal
y (°
C)
Figure 4: Time series of monthly mean temperature anomalies (dashed lines) at 50m oneastern Georges Bank (polygon 28) and their 5-year running means (solid line).
Georges Shoal - 30 m.
-6
-4
-2
0
2
4
6
1950 1955 1960 1965 1970 1975 1980 1985 1990 1995 2000 2005
Year
Tem
pera
ture
Ano
mal
y (o C
)
14
Figure 5. Monthly mean temperatures at several depths in the year 2000 within theDrinkwater and Trites (1987) Georges Shoal polygon number 27. The solid linerepresents the long-term monthly mean temperature at each depth and the soliddots are the monthly means for the year 2000. A baseline mean was notcalculated for the 75m depth bin. The numbers within the bars above each panelindicate the depth (m) bin.
0 2 4 6 8 10 12
0 2 4 6 8 10 12
Month
048
121620
048
121620
048
121620
Tem
pera
ture
(deg
.C)
0 10
20 30
50 75
1961-99 MeanTemp. in 2000
Georges Shoals
15
-0.02
-0.01
0.00
0.01
0.02
1950 1955 1960 1965 1970 1975 1980 1985 1990 1995 2000
Den
sity
Gra
dien
t (g/
ml/m
Georges BasinGeorges ShoalE. Georges BankNE Channel
Figure 6. Five-year running means of the annual anomalies of the density gradientbetween the surface and 50 calculated for the Georges Bank, Georges Basin andNortheast Channel areas.
16
40
42
44
46
48
50
52
54
56
58
60
62
-71 -69 -67 -65 -63 -61 -59 -57 -55 -53 -51 -49 -47 -45Longitude
Latit
ude
Hudson
BravoNain
Hamilton
St.Anthony
NENS
Avalon
SESGreen-St. Pierre
Estuary
NWGSLNEGSL
MagdalenCabot
Fundy
WSSCSS
ESS
Georges
Lurcher
WesternBank
FlemishPass
Hibernia
Figure 7. The areas in the northwest Atlantic used for extraction of sea-surfacetemperature.
17
Georges Bank
-2
-1
0
1
2
1978 1982 1986 1990 1994 1998 2002
Tem
pera
ture
Ano
mal
y (°
C)
Figure 8. The annual sea-surface temperature anomalies for the Georges Bank regionestimated from satellite imagery obtained through the Jet Propulsion Laboratory(JPL).
18
Shelf/Slope Annual Anomalies 56°W-75°W
-50-40-30-20-10
01020304050
1965 1970 1975 1980 1985 1990 1995 2000
Dis
plac
emen
t (K
m)
Annual5-Yr Mean
Figure 9. The 2000 (dashed line) and long-term mean (1973-97; solid line) positions ofthe shelf/slope front (top panel) and the time series of the annual anomaly of themean (56°-75°W) position of the shelf/slope front (bottom panel).
19
Gulf Stream Annual Anomalies 56°W-75°W
-50-40-30-20-10
01020304050
1965 1970 1975 1980 1985 1990 1995 2000
Dis
plac
emen
t (K
m)
Annual5-Yr Mean
Figure 10: Positions of the northern edge of the Gulf Stream in the year 2000 (top panel;2000 dashed line;1973-97; solid line) and the time series of the anomaly of theannual mean (lower panel) calculated for the 56°-75°W position of the GulfStream front.

20
Figure 11: Time series of bi-weekly mean chlorophyll concentrations as estimated fromSeaWif images for the years 1997-2000. The chlorophyll units are µg/L(=mg/m3).
21
Figure 12: The time of the annual maximum of bi-weekly mean chlorophyllconcentrations as estimated from SeaWiff images for the years 1997-2000.
22
Figure 13: Sampling transects occupied by the Continuous Plankton Recorder Programin the Gulf of Maine and Scotian Shelf region.
23
Figure 14: Time series of Calanus finmarchicus stages 5 and 6 from the ContinousPlankton Recorder survey conducted in the Gulf of main and Scotian Shelf.

24
Figure 15: Map of Georges Bank showing the boundaries of the Canadian springgroundfish survey strata (top panel) and the location of the hydrographic samples takenin the 2000 survey.
40.0
41.0
42.0
5Z15Z2
5Z3
5Z4
5Z5
5Z6
5Z7
5Z8<= 50 fm51 to 100 fm<= 100 fm
-70 -69 -68 -67 -66
40.0
41.0
42.0

25
Figure 16: Timing of hydrographic samples taken during the Canadian spring groundfishsurveys from 1987 to 2001.
26
Figure 17: Number of hydrographic samples taken during the Canadian springgroundfish surveys from 1987 to 2001.
0
10
20
30
1988 1992 1996 2000
5Z1 5Z2
5Z3
0
10
20
30
5Z40
10
20
30
5Z5 5Z6
5Z7
0
10
20
30
1988 1992 1996 2000
5Z8
Year
Num
ber
of S
tatio
ns
27
Figure 18: Spatial distribution of hydrographic samples taken during the Canadian springgroundfish surveys from 1987 to 2001.
28
Figure 18 continued:
29
Figure 19: Box and whisker plot summarizing near-bottom temperatures (upper panel)and salinities (lower panel) by survey strata for the year 2001 (solid dots) and perviousyears in the Canadian spring groundfish survey series (1987-2000). The boxes indicatethe 25th and 75th percentiles. The ends of the whiskers are the minima and maxima.
46
810
1214
5Z3
5Z7
5Z2
5Z4
5Z6
5Z5
5Z1
5Z8
Tem
pera
ture
(C
)
5Z1987-2000 median
1987-2000 mean
3233
3435
5Z2
5Z6
5Z3
5Z4
5Z7
5Z5
5Z1
5Z8
Strata
Sal
inity
(ps
u)
5Z1987- median
1987-2000 mean
30
Figure 20: Cumulative frequency of near-bottom temperatures (upper panel) andsalinities (lower panel) by survey strata for the year 2001 (solid curve) and pervious yearsin the Canadian spring groundfish survey series (dotted curves; 1987-2000). Thecumulative frequencies are not weighted by stratum area.
Temperature (C)
Cum
ulat
ive
Fre
quen
cy
2 4 6 8 10 12 14
0.0
0.2
0.4
0.6
0.8
1.0
Temperature (C)
Cum
ulat
ive
Fre
quen
cy
Temperature (C)
Cum
ulat
ive
Fre
quen
cy
Temperature (C)
Cum
ulat
ive
Fre
quen
cy
Temperature (C)
Cum
ulat
ive
Fre
quen
cy
Temperature (C)
Cum
ulat
ive
Fre
quen
cy
Temperature (C)
Cum
ulat
ive
Fre
quen
cy
Temperature (C)
Cum
ulat
ive
Fre
quen
cy
Temperature (C)
Cum
ulat
ive
Fre
quen
cy
Temperature (C)
Cum
ulat
ive
Fre
quen
cy
Temperature (C)
Cum
ulat
ive
Fre
quen
cy
Temperature (C)
Cum
ulat
ive
Fre
quen
cy
Temperature (C)
Cum
ulat
ive
Fre
quen
cy
Temperature (C)
Cum
ulat
ive
Fre
quen
cy
Temperature (C)
Cum
ulat
ive
Fre
quen
cy
5Z
Salinity (psu)
Cum
ulat
ive
Fre
quen
cy
31 32 33 34 35 36
0.0
0.2
0.4
0.6
0.8
1.0
Salinity (psu)
Cum
ulat
ive
Fre
quen
cy
Salinity (psu)
Cum
ulat
ive
Fre
quen
cy
Salinity (psu)
Cum
ulat
ive
Fre
quen
cy
Salinity (psu)
Cum
ulat
ive
Fre
quen
cy
Salinity (psu)
Cum
ulat
ive
Fre
quen
cy
Salinity (psu)
Cum
ulat
ive
Fre
quen
cy
Salinity (psu)
Cum
ulat
ive
Fre
quen
cy
Salinity (psu)
Cum
ulat
ive
Fre
quen
cy
Salinity (psu)
Cum
ulat
ive
Fre
quen
cy
Salinity (psu)
Cum
ulat
ive
Fre
quen
cy
Salinity (psu)
Cum
ulat
ive
Fre
quen
cy
Salinity (psu)
Cum
ulat
ive
Fre
quen
cy
Salinity (psu)
Cum
ulat
ive
Fre
quen
cy
Salinity (psu)
Cum
ulat
ive
Fre
quen
cy
5Z

31
Figure 21: Time series of unweighted near-bottom temperatures (upper panel) andsalinities (lower panel) observed in 5Z during the 1987-2001 Canadian spring groundfishsurvey series. Whiskers indicate the annual minima nad maxima. The boxes indicate theannual 25th and 75th quartiles. The dotted and solid lines connect the annual means andmedians respectively.
46
810
1214
1987
1988
1989
1990
1991
1992
1993
1994
1995
1996
1997
1998
1999
2000
2001
Tem
pera
ture
(C
)
••
• ••
•
•
••
••
•• • •
5Z1987-2000 median
1987-2000 mean
3233
3435
1987
1988
1989
1990
1991
1992
1993
1994
1995
1996
1997
1998
1999
2000
2001
Year
Sal
inity
(ps
u)
••
••
•
••
••
•
••
•
••
5Z1987-2000 median
1987-2000 mean
32
Figure 22: Time series of stratified mean near-bottom temperatures (upper panel) andsalinities (lower panel) observed in 5Z during the 1987-2001 Canadian spring groundfishsurvey series. The thick line is a five year running mean of the annual stratified means(thin line).
Tem
pera
ture
(C)
1988 1990 1992 1994 1996 1998 2000
34
56
78
5Z Means5yr running mean
Sal
inity
(psu
)
1988 1990 1992 1994 1996 1998 2000
32.0
32.5
33.0
33.5
34.0
5Z Means5yr running mean
33
Figure 23: Strata specific time series of near-bottom temperatures observed in 5Z duringthe 1987-2001 Canadian spring groundfish survey series. Each dot represents a singleobservation.
34
Figure 24: Strata specific time series of near-bottom salinities observed in 5Z during the1987-2001 Canadian spring groundfish survey series. Each dot represents a singleobservation.