Embed Size (px)
Citation preview

Part 3 – Fiscal Strategy and Outlook
64
Attachment D
AUSTRALIA’S FEDERAL RELATIONS
This attachment provides information on payments for specific purposes and general revenue assistance provided to the States and Territories (the States).
The current framework for federal financial relations under the Intergovernmental Agreement on Federal Financial Relations (Intergovernmental Agreement) was introduced on 1 January 2009.
The Commonwealth is working in partnership with the States in a number of key reform areas. Significant progress has been made in implementing the reform agenda through the federal financial relations framework. The framework has proved to be flexible and dynamic including through facilitating national health reform, and responding to the global recession, and more recently, natural disasters.
More detailed information on the Intergovernmental Agreement and Australia’s federal financial relations is provided in Budget Paper No. 3, Australia’s Federal Relations 2011-12 and on the federal financial relations website at www.federalfinancialrelations.gov.au.
Overview of payments to the States
The States receive significant financial support from the Commonwealth. In 2011-12, total payments to the States are estimated to be $96.3 billion, or 25.9 per cent of total Commonwealth expenditure. The Commonwealth will provide the States with payments for specific purposes of $47.6 billion and general revenue assistance of $48.7 billion.
Table 3.21 shows payments for specific purposes and general revenue assistance to the States.

Part 3 – Fiscal Strategy and Outlook
65
Table 3.21: Commonwealth payments to the States, 2011-12 to 2014-15 $million NSW VIC QLD WA SA TAS ACT NT Total(a)
2011-12Payments for specif ic
purposes 15,039 10,662 9,642 4,716 4,106 1,120 671 819 47,574General revenue assistance 14,716 10,720 8,973 3,616 4,417 1,713 892 2,614 48,745Total payments to the States 29,755 21,382 18,615 8,332 8,523 2,833 1,563 3,433 96,320
2012-13Payments for specif ic
purposes 12,930 10,393 8,803 4,656 3,190 977 648 641 42,895General revenue assistance 15,996 11,545 9,743 3,683 4,655 1,818 951 2,826 52,234Total payments to the States 28,926 21,938 18,545 8,339 7,845 2,795 1,599 3,467 95,129
2013-14Payments for specif ic
purposes 13,517 11,361 9,280 5,024 3,025 953 700 699 45,081General revenue assistance 17,050 12,048 10,839 3,654 4,855 1,844 954 2,920 55,188Total payments to the States 30,567 23,409 20,118 8,678 7,880 2,798 1,654 3,619 100,269
2014-15Payments for specif ic
purposes 12,878 10,874 8,627 4,638 2,970 930 755 604 43,220General revenue assistance 17,852 12,679 11,414 3,924 5,038 1,905 999 3,005 57,834Total payments to the States 30,730 23,553 20,040 8,562 8,008 2,835 1,754 3,608 101,053
Note: The data in this table have been amended from the published MYEFO document. Total expenses remain unchanged. A minor adjustment has been made to the State shares of some National Specific Purpose Payments. (a) State allocations are not yet finalised for a number of National Partnership payments; unallocated
payments are not included in State totals.
Payments for specific purposes
The Commonwealth provides payments to the States for specific purposes to pursue important national policy objectives in areas that may be administered by the States. Payments to the States for specific purposes will total $47.6 billion in 2011-12, a decrease of 7.7 per cent compared with the $51.6 billion the States received in 2010-11. This decrease largely reflects the change in accounting treatment of payments made to the States under the Natural Disaster Relief and Recovery Arrangements (NDRRA) as reported in the 2010-11 Final Budget Outcome. Payments to the States for specific purposes are estimated to represent 12.8 per cent of total Commonwealth expenditure in 2011-12.
The Commonwealth provides the following types of Specific Purpose Payments (SPPs) to the States:
• National Specific Purpose Payments (National SPPs) in respect of key service delivery sectors;
• National Health Reform funding (from 1 July 2012); and
• National Partnership payments — project payments, facilitation payments and reward payments.
Part 3 – Fiscal Strategy and Outlook
66
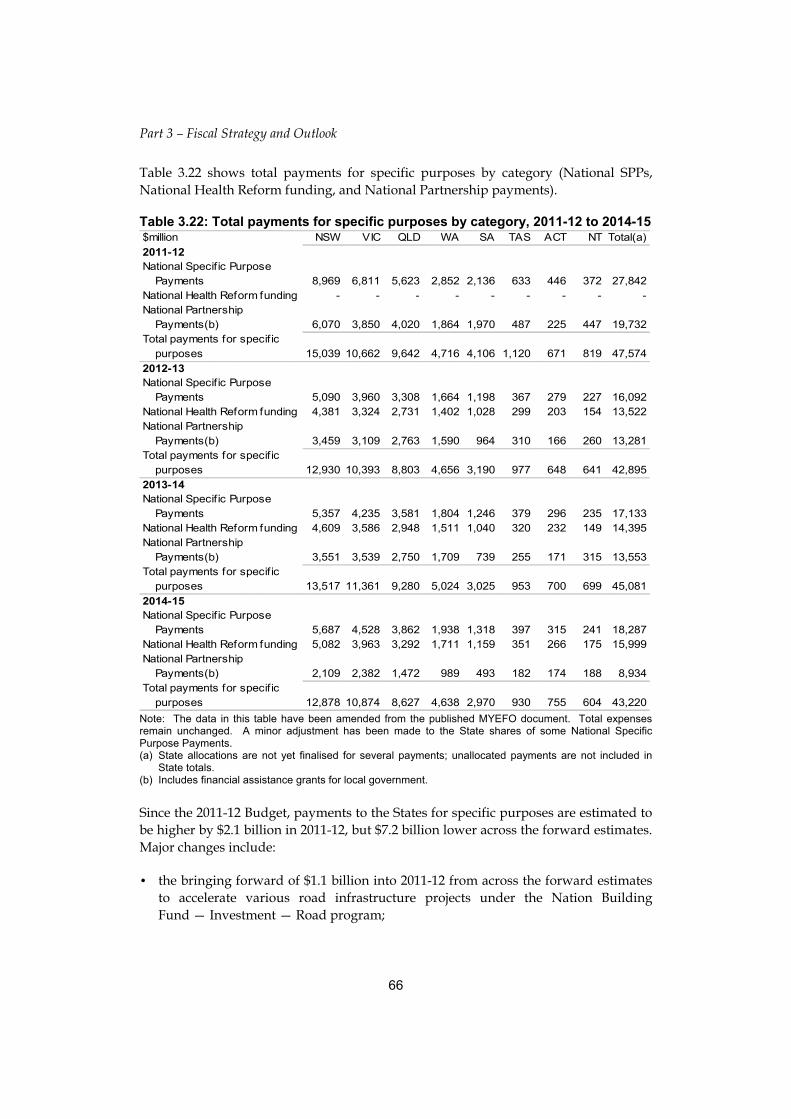
Table 3.22 shows total payments for specific purposes by category (National SPPs, National Health Reform funding, and National Partnership payments).
Table 3.22: Total payments for specific purposes by category, 2011-12 to 2014-15 $million NSW VIC QLD WA SA TAS ACT NT Total(a)
2011-12National Specif ic Purpose
Payments 8,969 6,811 5,623 2,852 2,136 633 446 372 27,842National Health Reform funding - - - - - - - - -National Partnership
Payments(b) 6,070 3,850 4,020 1,864 1,970 487 225 447 19,732Total payments for specif ic
purposes 15,039 10,662 9,642 4,716 4,106 1,120 671 819 47,574
2012-13National Specif ic Purpose
Payments 5,090 3,960 3,308 1,664 1,198 367 279 227 16,092National Health Reform funding 4,381 3,324 2,731 1,402 1,028 299 203 154 13,522National Partnership
Payments(b) 3,459 3,109 2,763 1,590 964 310 166 260 13,281Total payments for specif ic
purposes 12,930 10,393 8,803 4,656 3,190 977 648 641 42,895
2013-14National Specif ic Purpose
Payments 5,357 4,235 3,581 1,804 1,246 379 296 235 17,133National Health Reform funding 4,609 3,586 2,948 1,511 1,040 320 232 149 14,395National Partnership
Payments(b) 3,551 3,539 2,750 1,709 739 255 171 315 13,553Total payments for specif ic
purposes 13,517 11,361 9,280 5,024 3,025 953 700 699 45,081
2014-15National Specif ic Purpose
Payments 5,687 4,528 3,862 1,938 1,318 397 315 241 18,287National Health Reform funding 5,082 3,963 3,292 1,711 1,159 351 266 175 15,999National Partnership
Payments(b) 2,109 2,382 1,472 989 493 182 174 188 8,934Total payments for specif ic
purposes 12,878 10,874 8,627 4,638 2,970 930 755 604 43,220 Note: The data in this table have been amended from the published MYEFO document. Total expenses remain unchanged. A minor adjustment has been made to the State shares of some National Specific Purpose Payments. (a) State allocations are not yet finalised for several payments; unallocated payments are not included in
State totals. (b) Includes financial assistance grants for local government.
Since the 2011-12 Budget, payments to the States for specific purposes are estimated to be higher by $2.1 billion in 2011-12, but $7.2 billion lower across the forward estimates. Major changes include:
• the bringing forward of $1.1 billion into 2011-12 from across the forward estimates to accelerate various road infrastructure projects under the Nation Building Fund — Investment — Road program;

Part 3 – Fiscal Strategy and Outlook
67
• a decrease of $6.8 billion across the forward estimates reflecting changes in the accounting treatment of the NDRRA (further details on this change are detailed below);
• the rephasing of $250 million into 2011-12 from 2012-13 to accelerate various projects under the Building Australia Fund — Road and Rail;
• the bringing forward of around $230 million into 2011-12 from across the forward estimates to reflect higher than expected completion rates by the States and payment for the early delivery of milestones under the National Partnership Agreement on Remote Indigenous Housing;
• a reprofiling of approximately $160 million related to projects funded under the Health and Hospitals Fund including amounts related to the Victorian Comprehensive Cancer Centre and Midland Health Campus;
• a rephasing of around $150 million from the Reward Payments for School Improvement Program to allow for greater stakeholder consultation, with funding provided to develop and implement the National Schools Improvement Framework, including testing pilot projects;
• a movement of reward funding under the National Partnership Agreement on Improving Public Hospital Services expected to be paid in 2012-13 (and later years) into 2013-14 (and subsequent years) to better reflect expected reporting and payment timeframes. Earlier payments may be possible if reporting processes can be facilitated earlier; and
• an additional $50 million over three years from 2011-12 in reward funding under a new National Partnership agreement to support the assessment of impacts of coal seam gas and large coal developments.
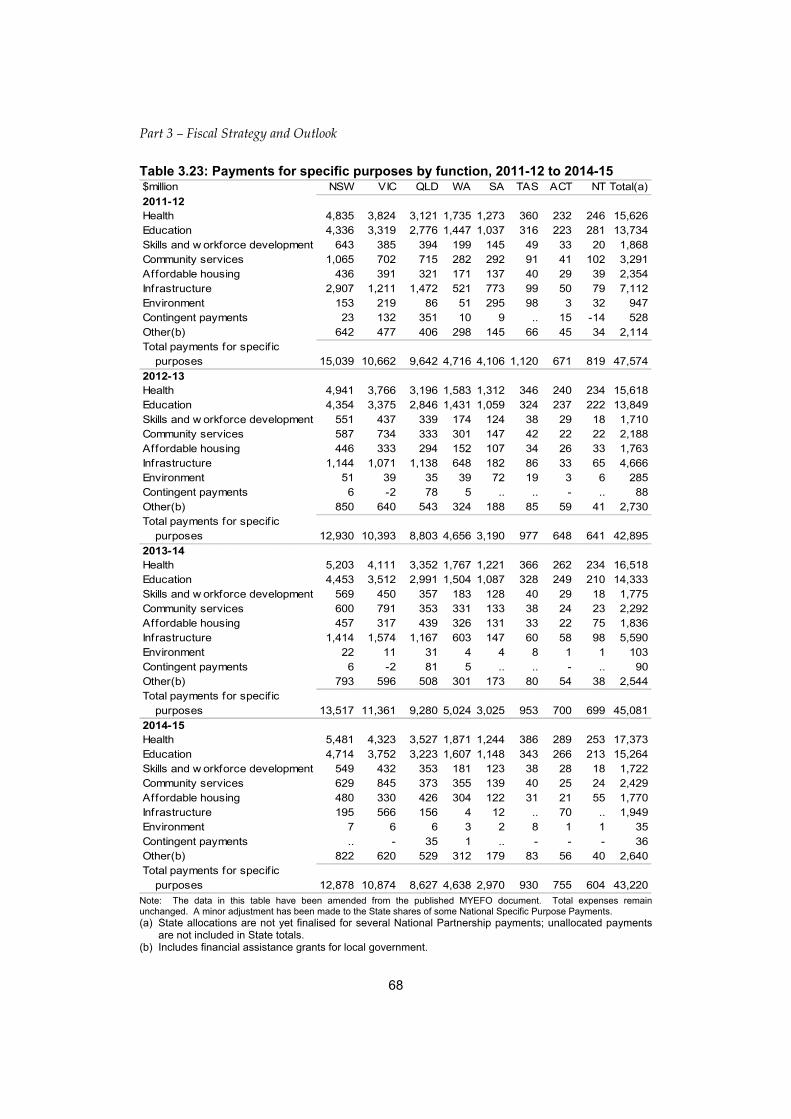
Payments for specific purposes cover most functional areas of state and local government activity — including health, education, skills and workforce development, community services, affordable housing, infrastructure and environment. Table 3.23 shows total payments for specific purposes by function.
Part 3 – Fiscal Strategy and Outlook
68
Table 3.23: Payments for specific purposes by function, 2011-12 to 2014-15 $million NSW VIC QLD WA SA TAS ACT NT Total(a)
2011-12Health 4,835 3,824 3,121 1,735 1,273 360 232 246 15,626Education 4,336 3,319 2,776 1,447 1,037 316 223 281 13,734Skills and w orkforce development 643 385 394 199 145 49 33 20 1,868Community services 1,065 702 715 282 292 91 41 102 3,291Affordable housing 436 391 321 171 137 40 29 39 2,354Infrastructure 2,907 1,211 1,472 521 773 99 50 79 7,112Environment 153 219 86 51 295 98 3 32 947Contingent payments 23 132 351 10 9 .. 15 -14 528Other(b) 642 477 406 298 145 66 45 34 2,114Total payments for specif ic
purposes 15,039 10,662 9,642 4,716 4,106 1,120 671 819 47,574
2012-13Health 4,941 3,766 3,196 1,583 1,312 346 240 234 15,618Education 4,354 3,375 2,846 1,431 1,059 324 237 222 13,849Skills and w orkforce development 551 437 339 174 124 38 29 18 1,710Community services 587 734 333 301 147 42 22 22 2,188Affordable housing 446 333 294 152 107 34 26 33 1,763Infrastructure 1,144 1,071 1,138 648 182 86 33 65 4,666Environment 51 39 35 39 72 19 3 6 285Contingent payments 6 -2 78 5 .. .. - .. 88Other(b) 850 640 543 324 188 85 59 41 2,730Total payments for specif ic
purposes 12,930 10,393 8,803 4,656 3,190 977 648 641 42,895
2013-14Health 5,203 4,111 3,352 1,767 1,221 366 262 234 16,518Education 4,453 3,512 2,991 1,504 1,087 328 249 210 14,333Skills and w orkforce development 569 450 357 183 128 40 29 18 1,775Community services 600 791 353 331 133 38 24 23 2,292Affordable housing 457 317 439 326 131 33 22 75 1,836Infrastructure 1,414 1,574 1,167 603 147 60 58 98 5,590Environment 22 11 31 4 4 8 1 1 103Contingent payments 6 -2 81 5 .. .. - .. 90Other(b) 793 596 508 301 173 80 54 38 2,544Total payments for specif ic
purposes 13,517 11,361 9,280 5,024 3,025 953 700 699 45,081
2014-15Health 5,481 4,323 3,527 1,871 1,244 386 289 253 17,373Education 4,714 3,752 3,223 1,607 1,148 343 266 213 15,264Skills and w orkforce development 549 432 353 181 123 38 28 18 1,722Community services 629 845 373 355 139 40 25 24 2,429Affordable housing 480 330 426 304 122 31 21 55 1,770Infrastructure 195 566 156 4 12 .. 70 .. 1,949Environment 7 6 6 3 2 8 1 1 35Contingent payments .. - 35 1 .. - - - 36Other(b) 822 620 529 312 179 83 56 40 2,640Total payments for specif ic
purposes 12,878 10,874 8,627 4,638 2,970 930 755 604 43,220 Note: The data in this table have been amended from the published MYEFO document. Total expenses remain unchanged. A minor adjustment has been made to the State shares of some National Specific Purpose Payments. (a) State allocations are not yet finalised for several National Partnership payments; unallocated payments
are not included in State totals. (b) Includes financial assistance grants for local government.

Part 3 – Fiscal Strategy and Outlook
69
Total payments for specific purposes by function, and category (National SPPs, National Health Reform funding, and National Partnership payments) are shown in Table 3.24.
Table 3.24: Payments for specific purposes by function and category, 2011-12 to 2014-15 $million 2011-12 2012-13 2013-14 2014-15Health
National Healthcare SPP 12,696 - - -National Health Reform funding - 13,522 14,395 15,999National Partnerships 2,930 2,096 2,123 1,374
EducationNational Schools SPP 11,337 12,173 13,107 14,129National Partnerships 2,397 1,675 1,226 1,135
Skills and workforce developmentNational Skills and Workforce
Development SPP 1,363 1,392 1,418 1,446National Partnerships 505 318 357 276
Community servicesNational Disability SPP(a) 1,204 1,260 1,318 1,397National Partnerships 2,088 928 974 1,032
Affordable housingNational Affordable Housing SPP 1,243 1,267 1,290 1,315National Partnerships 1,111 495 546 456
InfrastructureNational Partnerships 7,112 4,666 5,590 1,949
EnvironmentNational Partnerships 947 285 103 35
Contingent paymentsNational Partnerships 528 88 90 36
OtherNational Partnerships(b) 2,114 2,730 2,544 2,640
Total payments for specif ic purposes 47,574 42,895 45,081 43,220 (a) Includes adjustment to the National Disability SPP to achieve budget neutrality under National Health
Reform (see footnote to Table A.4 in Annex A for details). (b) Includes financial assistance grants for local government.
Detailed tables of payments for specific purposes are provided in Annex A. This Annex provides accrual estimates of Commonwealth payments to the States.
In 2010-11, the Commonwealth reviewed the accounting treatment of payments made to the States under the NDRRA. The accounting treatment previously applied by the Commonwealth was to recognise grant liabilities under the NDRRA to the extent that (i) the services required to be performed by the State had been performed or (ii) the grant eligibility criteria had been satisfied, but payments due had not been made. The change in accounting treatment has resulted in the Commonwealth recognising a liability equal to the discounted value of estimated future payments to the State under the NDRRA. This is regardless of whether or not a State has completed eligible disaster reconstruction work or submitted an eligible claim under the NDRRA. The estimated NDRRA cash payments are shown in Table 3.25 below (see Table A.8 in Annex A for accrual estimates).

Part 3 – Fiscal Strategy and Outlook
70
Table 3.25: Estimated NDRRA cash payments, 2011-12 to 2014-15 $'000 NSW VIC QLD WA SA TAS ACT NT Total2011-12 126,772 151,124 2,992,878 - - - - - 3,270,7742012-13 - - - 1,318 2,693 1,410 - 8,087 13,5082013-14 170,039 -48,150 1,385,336 120,418 50 2,775 - 4,182 1,634,6502014-15 38 - 1,045,922 24,618 50 - - - 1,070,628
GST and general revenue assistance
General revenue assistance is a broad category of payments that are provided to the States without conditions to spend according to their own budget priorities.
In 2011-12, the States will receive $48.7 billion in general revenue assistance from the Commonwealth, comprising $47.5 billion in GST entitlements and $1.2 billion in other general revenue assistance. This is a 3.8 per cent increase in general revenue assistance, compared with the $47.0 billion the States received in 2010-11. Total general revenue assistance to the States is estimated to represent 13.1 per cent of total Commonwealth expenditure in 2011-12.
Table 3.26 summarises GST and general revenue assistance payments to the States. Detailed tables of GST and general revenue assistance, including state shares of each payment, are provided in Annex A.
Table 3.26: GST and general revenue assistance, 2011-12 to 2014-15 $million 2011-12 2012-13 2013-14 2014-15GST entitlements 47,500.0 51,050.0 54,000.0 56,650.0Other payments
ACT municipal services 36.1 36.8 37.5 38.2Reduced royalties 77.1 73.8 71.2 71.5Snow y Hydro Ltd tax compensation 48.2 57.0 57.0 57.0Royalties 1,084.0 1,016.2 1,022.3 1,017.2
Total other 1,245.4 1,183.8 1,188.0 1,183.9Total GST and other payments 48,745.4 52,233.8 55,188.0 57,833.9 GST
GST revenue variations since the 2011-12 Budget
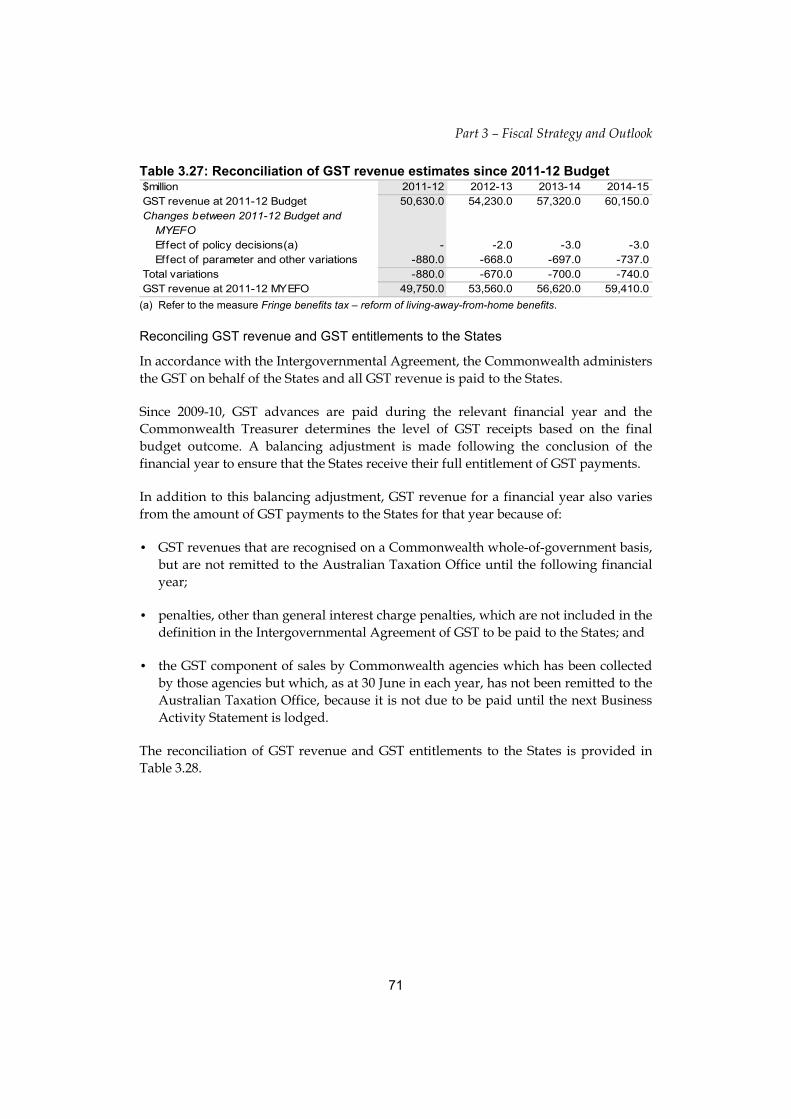
Table 3.27 is a reconciliation of the GST revenue estimates since the 2011-12 Budget. The reconciliation accounts for policy decisions, parameter and other variations.
GST revenue in 2011-12 has been revised down by $880 million since Budget, reflecting lower forecast growth for taxable consumption.
Part 3 – Fiscal Strategy and Outlook
71
Table 3.27: Reconciliation of GST revenue estimates since 2011-12 Budget $million 2011-12 2012-13 2013-14 2014-15GST revenue at 2011-12 Budget 50,630.0 54,230.0 57,320.0 60,150.0Changes between 2011-12 Budget and
MYEFOEffect of policy decisions(a) - -2.0 -3.0 -3.0Effect of parameter and other variations -880.0 -668.0 -697.0 -737.0
Total variations -880.0 -670.0 -700.0 -740.0GST revenue at 2011-12 MYEFO 49,750.0 53,560.0 56,620.0 59,410.0
(a) Refer to the measure Fringe benefits tax – reform of living-away-from-home benefits.
Reconciling GST revenue and GST entitlements to the States
In accordance with the Intergovernmental Agreement, the Commonwealth administers the GST on behalf of the States and all GST revenue is paid to the States.
Since 2009-10, GST advances are paid during the relevant financial year and the Commonwealth Treasurer determines the level of GST receipts based on the final budget outcome. A balancing adjustment is made following the conclusion of the financial year to ensure that the States receive their full entitlement of GST payments.
In addition to this balancing adjustment, GST revenue for a financial year also varies from the amount of GST payments to the States for that year because of:
• GST revenues that are recognised on a Commonwealth whole-of-government basis, but are not remitted to the Australian Taxation Office until the following financial year;
• penalties, other than general interest charge penalties, which are not included in the definition in the Intergovernmental Agreement of GST to be paid to the States; and
• the GST component of sales by Commonwealth agencies which has been collected by those agencies but which, as at 30 June in each year, has not been remitted to the Australian Taxation Office, because it is not due to be paid until the next Business Activity Statement is lodged.
The reconciliation of GST revenue and GST entitlements to the States is provided in Table 3.28.

Part 3 – Fiscal Strategy and Outlook
72
Table 3.28: GST revenue and GST entitlements to the States Outcome
$million 2010-11 2011-12 2012-13 2013-14 2014-15GST revenue 48,093.0 49,750.0 53,560.0 56,620.0 59,410.0less change in GST receivables 2,010.2 2,087.0 2,330.6 2,430.6 2,560.1GST receipts 46,082.8 47,663.0 51,229.4 54,189.4 56,849.9less non-GIC penalties collected 114.7 160.0 180.0 190.0 200.0less GST collected by Commonw ealth agencies but not yet remitted to
the ATO 80.9 3.0 -0.6 -0.6 -0.1GST entitlements to the States 45,887.2 47,500.0 51,050.0 54,000.0 56,650.0
Estimates
Table 3.29 below provides information on the balancing adjustment relating to 2010-11 which will be paid in 2011-12.
Table 3.29: Balancing adjustment relating to 2010-11 $million TotalGST entitlements to the States in 2010-11 45,887.2less advances of GST revenues made throughout 2010-11 45,450.0equals follow ing year balancing adjustment 437.2
Distribution of GST payments among the States
As agreed by all parties in the Intergovernmental Agreement, GST payments are distributed among the States in accordance with the principle of horizontal fiscal equalisation and having regard to the recommendations of the Commonwealth Grants Commission. The calculations for the distribution of the GST pool in 2011-12 are shown in Table 3.30.
Table 3.30: Distribution of the GST pool, 2011-12
Estimated State Share of 2011-1231 December revenue Adjusted adjusted GST
2011 sharing population population entitlementpopulation relativities (1) x (2) per cent $million
(1) (2)(a) (3) (4) (5)NSW 7,342,659 0.95776 7,032,505 30.9 14,683.9VIC 5,666,223 0.90476 5,126,572 22.5 10,704.3QLD 4,627,580 0.92861 4,297,217 18.9 8,972.6WA 2,362,817 0.71729 1,694,825 7.5 3,538.8SA 1,664,683 1.27070 2,115,313 9.3 4,416.8TAS 512,999 1.59942 820,501 3.6 1,713.2ACT 367,263 1.11647 410,038 1.8 856.2NT 233,711 5.35708 1,252,009 5.5 2,614.2Total 22,777,935 na 22,748,979 100.0 47,500.0
(a) These figures reflect the relativities applied for the purposes of distributing GST to the States. When all Commonwealth payments to the States are taken into account, the distribution is far closer to an equal per capita basis.
The calculations for the distribution of the 2010-11 balancing adjustment are shown in Table 3.31. This adjustment will be made to each State’s 2011-12 GST entitlement following the underpayment of $437.2 million in 2010-11.

Part 3 – Fiscal Strategy and Outlook
73
Table 3.31: Distribution of the GST balancing adjustment, 2010-11(a) Estimated State Share of 2010-11 2010-11
31 December revenue Adjusted adjusted GST GST Balancing 2010 sharing population population entitlement advances adjustment
population relativities (1) x (2) per cent $million $million $million(1) (2) (3) (4) (5) (5) (5)
NSW 7,272,158 0.95205 6,923,458 30.9 14,157.8 14,023.4 134.4VIC 5,585,566 0.93995 5,250,153 23.4 10,736.0 10,629.5 106.6QLD 4,548,661 0.91322 4,153,928 18.5 8,494.4 8,413.6 80.8WA 2,317,064 0.68298 1,582,508 7.1 3,236.1 3,202.1 34.0SA 1,650,377 1.28497 2,120,685 9.5 4,336.6 4,296.1 40.5TAS 509,292 1.62091 825,516 3.7 1,688.1 1,671.7 16.4ACT 361,914 1.15295 417,269 1.9 853.3 841.8 11.5NT 229,874 5.07383 1,166,342 5.2 2,385.1 2,372.0 13.1Total 22,474,906 na 22,439,859 100.0 45,887.2 45,450.0 437.2
(a) Total may not equal sum of State totals.
GST administration costs
As the GST has a national tax base, the Intergovernmental Agreement provides for the Australian Taxation Office to administer the GST on behalf of the States. Given that all GST revenue is provided to the States, the States compensate the Commonwealth for the agreed costs incurred by the Australian Taxation Office in administering the GST, as shown in Table 3.32.
Table 3.32: GST administration budget, 2010-11 to 2014-15 Actual
$million 2010-11 2011-12 2012-13 2013-14 2014-15Australian Taxation Off ice budget 666.6 683.2 699.3 699.7 607.1less prior year adjustment -8.2 5.9equals State government payments 674.8 677.3 699.3 699.7 607.1less Australian Taxation Office outcome(a) 660.7equals Commonwealth budget impact 14.1
plus prior year adjustment -8.2
equals follow ing year adjustment 5.9
Estimates
(a) Estimated outcome for 2010-11 pending confirmation by the Australian National Audit Office.
The preliminary outcome for the 2010-11 GST administration expenses of $660.7 million differs from the amount paid by the States and the prior year adjustment by $5.9 million. Once the outcome for GST administration in 2010-11 is audited, the final adjustment will be incorporated into the States’ administration costs for 2011-12.

Part 3 – Fiscal Strategy and Outlook
74
Annex A
PAYMENTS TO THE STATES
This annex provides accrual estimates of Commonwealth payments to the States (and local governments). This includes Commonwealth advances (loans) to the States, including new advances, interest on advances and repayments of advances. Most of these advances were funded from borrowings made on behalf of the States under previous Australian Loan Council arrangements.
Each table presents estimated payments to the States for the period 2011-12 to 2014-15 as follows:
A.1 — health;
A.2 — education;
A.3 — skills and workforce development;
A.4 — community services;
A.5 — affordable housing;
A.6 — infrastructure;
A.7 — environment;
A.8 — contingent payments;
A.9 — other;
A.10 — GST and general revenue assistance;
A.11 — advances, repayment of advances and interest payments; and
A.12 — payments presented on the Australian Bureau of Statistics Government Finance Statistics (GFS) functional basis.

7575
Part 3 – Fiscal Strategy and Outlook
Tab
le A
.1:
Est
imat
ed p
aym
ents
to
su
pp
ort
sta
te h
ealt
h s
ervi
ces,
by
year
an
d S
tate
$'0
00
NS
WV
ICQ
LD
WA
SA
TA
SA
CT
NT
To
tal
2011-1
2N
ati
on
al H
ealt
hcare
SP
P4,1
36,9
00
3,0
99,8
13
2,5
47,0
59
1,3
08,2
91
989,1
50
279,6
71
183,2
84
151,5
89
12,6
95,7
57
Nati
on
al P
art
ne
rsh
ip p
aym
en
tsN
ati
on
al H
ealt
h R
efo
rmIm
pro
vin
g P
ublic
Hospita
l Serv
ices
Fle
xib
le f
undin
g p
ool f
or
em
erg
ency
depart
ments
, ele
ctiv
e s
urg
ery
and
subacute
care
(a)
7,0
44
5,5
91
4,7
24
2,7
16
2,0
75
1,0
73
944
833
25,0
00
Natio
nal E
merg
ency A
ccess T
arg
et
em
erg
ency d
epart
ments
(b)
Capita
l fundin
g14,4
82
11,4
28
9,6
07
5,3
90
12,1
37
1,9
41
3,3
38
1,4
37
59,7
60
Facilita
tion a
nd r
ew
ard
fundin
g32,4
53
18,6
70
20,1
33
11,5
71
10,4
08
1,7
18
2,9
16
916
98,7
85
Natio
nal E
lectiv
e S
urg
ery
Targ
et(
c)
Capita
l fundin
g6,7
19
5,3
85
4,5
90
2,7
50
6,4
89
1,2
44
3,3
76
1,0
24
31,5
77
Facilita
tion a
nd r
ew
ard
fundin
g49,0
90
43,8
78
29,7
65
9,5
06
33,6
17
2,2
57
2,2
11
1,1
90
171,5
14
New
subacute
beds g
uara
nte
e f
undin
g131,4
25
92,9
50
76,1
25
38,1
25
28,1
50
8,4
25
8,5
42
4,1
25
387,8
67
Expansio
n o
f subacute
care
in
multi
-purp
ose s
erv
ices
16,2
00
5,2
00
6,7
00
11,4
00
8,7
00
1,7
00
-100
50,0
00
Fin
ancia
l assis
tance f
or
long s
tay o
lder
patie
nts
32,9
05
12,7
38
21,2
29
15,9
22
18,0
45
3,1
84
1,0
61
1,0
61
106,1
45
Clo
sin
g t
he
Gap
in
th
e N
ort
he
rnT
err
ito
ryIn
dig
enous h
ealth
and r
ela
ted s
erv
ices
- -
- -
- -
-4,1
20
4,1
20
He
alt
h a
nd
ho
sp
ital w
ork
forc
e r
efo
rmA
ctiv
ity b
ased f
undin
g12,2
70
10,9
90
7,0
00
4,1
10
3,5
80
1,2
40
980
1,2
30
41,4
00

Part 3 – Fiscal Strategy and Outlook
76
Tab
le A
.1:
Est
imat
ed p
aym
ents
to
su
pp
ort
sta
te h
ealt
h s
ervi
ces,
by
year
an
d S
tate
(co
nti
nu
ed)
$'0
00
NS
WV
ICQ
LD
WA
SA
TA
SA
CT
NT
To
tal
2011-1
2H
ealt
h in
fras
tru
ctu
reH
ealth
and H
ospita
ls F
und
Hospita
l infr
astr
uctu
re a
nd o
ther
pro
jects
of
natio
nal s
ignific
ance
64,5
00
4,5
00
145,0
00
205,0
00
53,0
00
5,5
00
-19,5
00
497,0
00
Natio
nal c
ancer
syste
m
80,3
81
299,0
45
72,9
45
23,4
50
37,6
30
10,6
84
11,4
28
-535,5
63
Regio
nal p
riority
round
23,6
16
13,0
59
7,0
30
2,4
48
10,6
00
20,0
00
2,3
37
23,6
48
102,7
38
Tra
nsla
tional r
esearc
h a
nd w
ork
forc
etr
ain
ing
-26,0
00
- -
- -
- -
26,0
00
Oth
er
Health
infr
astr
uctu
re p
aym
ents
Cairns in
tegra
ted c
ancer
centr
e
- -
2,0
00
- -
- -
-2,0
00
Child
ren’s
cancer
centr
e, A
dela
ide
- -
- -
1,5
00
- -
-1,5
00
Fundin
g f
or
Gra
fton H
ospita
l5,0
00
- -
- -
- -
-5,0
00
Health
infr
astr
uctu
re p
roje
cts
in
Tasm
ania
- -
- -
-1,4
00
- -
1,4
00
Tasm
ania
n h
ealth
packa
ge
Patie
nt tr
ansport
and
accom
modatio
n s
erv
ices
- -
- -
-1,1
50
- -
1,1
50
Radia
tion o
ncolo
gy s
erv
ices in
N
ort
h/N
ort
h W
est Tasm
ania
-
- -
- -
430
- -
430
He
alt
h s
erv
ice
sEarly in
terv
entio
n p
ilot pro
gra
m625
- -
- -
- -
-625
Exte
nsio
n o
f th
e C
OA
G L
ong S
tay
Old
er
Patie
nts
Initi
ativ
e12,9
90
9,5
20
10,1
00
6,6
40
3,3
30
1,4
85
300
600
44,9
65
Health
care
gra
nts
for
the T
orr
es S
trait
- -
8,1
35
- -
- -
-8,1
35
Health
y k
ids h
ealth
checks
490
381
383
425
151
98
69
95
2,0
92
Hum
an q
uara
ntin
e s
erv
ices
156
102
130
76
68
63
62
51
708
Impro
vin
g e
ar
health
serv
ices f
or
Indig
enous A
ustr
alia
n c
hild
ren —
pro
ject agre
em
ent
886
287
1,1
00
1,5
20
1,0
41
- -
1,2
70
6,1
04

Part
77
Part 3 – Fiscal Strategy and Outlook
Tab
le A
.1:
Est
imat
ed p
aym
ents
to
su
pp
ort
sta
te h
ealt
h s
ervi
ces,
by
year
an
d S
tate
(co
nti
nu
ed)
$'0
00
NS
WV
ICQ
LD
WA
SA
TA
SA
CT
NT
To
tal
2011-1
2H
ealt
h s
erv
ice
s (
co
nti
nu
ed
)Im
pro
vin
g tra
chom
a c
ontr
ol s
erv
ices f
or
Indig
enous A
ustr
alia
ns —
pro
ject
agre
em
ent
130
- -
818
794
- -
1,4
33
3,1
75
Natio
nal b
ow
el c
ancer
scre
enin
g
-444
357
183
143
106
89
76
1,3
98
Natio
nal P
erinata
l Depre
ssio
n In
itiativ
e4,5
17
3,7
49
3,1
65
1,9
57
648
493
420
508
15,4
57
Nort
hern
Terr
itory
medic
al s
chool —
fu
ndin
g c
ontr
ibutio
n -
- -
- -
- -
1,6
28
1,6
28
OzFoodN
et
328
242
241
188
188
174
131
136
1,6
28
Sate
llite
renal d
ialy
sis
facilitie
s in
rem
ote
Nort
hern
Terr
itory
com
muniti
es
- -
- -
- -
-131
131
Sexual a
ssault
counselling in
rem
ote
Nort
hern
Terr
itory
are
as
- -
- -
- -
-1,0
75
1,0
75
Torr
es S
trait
health
pro
tectio
n s
trate
gy
- -
1,0
89
- -
- -
-1,0
89
Reducin
g a
cute
rheum
atic
heart
fever
am
ong In
dig
enous c
hild
ren
- -
810
810
- -
-810
2,4
30
Royal D
arw
in H
ospita
l — e
quip
ped,
pre
pare
d a
nd r
eady
- -
- -
- -
-14,4
81
14,4
81
Vaccin
e-p
reventa
ble
dis
eases
surv
eillance
445
507
377
189
75
80
83
103
1,8
59
Vic
torian c
yto
logy s
erv
ice
-7,7
00
- -
- -
- -
7,7
00
Me
nta
l H
ealt
hExpandin
g the E
arly P
sychosis
Pre
ventio
n
and In
terv
entio
n C
entr
e m
odel(d)
1,0
12
1,0
12
1,0
12
1,0
12
1,0
13
1,0
13
1,0
13
1,0
13
8,1
00
Menta
l health
refo
rm(e
)6,8
86
5,3
09
4,3
41
2,2
13
1,5
60
481
342
220
21,3
52

Part 3 – Fiscal Strategy and Outlook
78
Tab
le A
.1:
Est
imat
ed p
aym
ents
to
su
pp
ort
sta
te h
ealt
h s
ervi
ces,
by
year
an
d S
tate
(co
nti
nu
ed)
$'0
00
NS
WV
ICQ
LD
WA
SA
TA
SA
CT
NT
To
tal
2011-1
2P
reve
nti
ve
he
alt
hEnablin
g in
frastr
uctu
re
816
620
500
252
188
58
40
26
2,5
00
Health
y c
hild
ren
10,6
62
7,8
26
6,6
48
3,3
01
2,3
16
786
509
407
32,4
55
Health
y c
om
muniti
es
6,1
68
5,3
27
5,0
46
3,6
45
3,0
84
841
280
1,4
02
25,7
93
Health
y w
ork
ers
10,6
75
8,2
51
6,8
82
3,6
06
2,4
51
738
602
347
33,5
52
Socia
l mark
etin
g
1,9
59
1,4
87
1,1
99
606
451
140
97
62
6,0
01
Oth
er
Com
monw
ealth
Denta
l Health
Pro
gra
m -
- -
- -
- -
- -
East K
imberley d
evelo
pm
ent
packa
ge —
health
-rela
ted p
roje
cts
- -
-14,5
70
- -
- -
14,5
70
Ele
ctiv
e s
urg
ery
waiti
ng li
st
reductio
n p
lan
45,3
89
29,8
97
30,8
73
12,2
05
12,1
03
3,1
02
1,3
10
821
135,7
00
Essentia
l vaccin
es
112,2
82
91,4
16
76,3
79
36,5
87
27,0
38
8,3
41
5,5
94
4,2
62
361,8
99
Indig
enous e
arly c
hild
hood
develo
pm
ent —
ante
nata
l and
repro
ductiv
e h
ealth
5,7
40
1,1
23
6,9
62
3,4
40
1,2
09
645
230
4,1
91
23,5
40
Indig
enous m
obile
denta
l pro
gra
m -
-1,0
21
- -
- -
-1,0
21
Tota
l4,8
35,1
41
3,8
24,4
47
3,1
20,6
57
1,7
34,9
22
1,2
72,9
32
360,2
61
231,5
88
245,9
21
15,6
25,8
69
Mem
ora
ndum
ite
m -
paym
ents
dir
ect to
local gove
rnm
ents
inclu
ded in p
aym
ents
ab
ove
Health
y c
om
muniti
es
6,1
68
5,3
27
5,0
46
3,6
45
3,0
84
841
280
1,4
02
25,7
93
Tota
l6,1
68
5,3
27
5,0
46
3,6
45
3,0
84
841
280
1,4
02
25,7
93
(a
) S
ince
the
2011
-12
Bud
get,
the
na
me
of th
is c
ompo
nent
has
cha
nge
d fr
om F
lexi
ble
fund
ing
for
em
erg
enc
y de
part
men
ts,
elec
tive
surg
ery
and
suba
cute
car
e.
(b)
Sin
ce th
e 20
11-1
2 B
udge
t, th
e n
am
e of
this
com
pone
nt h
as c
hang
ed
from
Fo
ur h
our
nat
iona
l acc
ess
targ
et fo
r e
mer
genc
y de
part
men
ts.
(c)
Sin
ce th
e 20
11-1
2 B
udge
t, th
e n
am
e of
this
com
pone
nt h
as c
hang
ed
from
Im
pro
ving
acc
ess
to e
lect
ive
surg
ery.
(d
) Y
earl
y p
rofil
es a
nd S
tate
spl
its a
re in
dica
tive
dist
ribut
ions
onl
y an
d ha
ve b
een
allo
cate
d on
an
equa
l bas
is to
all
Sta
tes.
(e
) Y
earl
y p
rofil
es a
nd S
tate
spl
its a
re in
dica
tive
dist
ribut
ions
onl
y an
d ha
ve b
een
allo
cate
d on
an
equa
l per
cap
ita b
asis
to a
ll S
tate
s.

Part
79
Part 3 – Fiscal Strategy and Outlook
Tab
le A
.1:
Est
imat
ed p
aym
ents
to
su
pp
ort
sta
te h
ealt
h s
ervi
ces,
by
year
an
d S
tate
(co
nti
nu
ed)
$'0
00
NS
WV
ICQ
LD
WA
SA
TA
SA
CT
NT
To
tal
2012-1
3N
ati
on
al H
ealt
h R
efo
rm f
un
din
g4,3
81,4
09
3,3
23,9
19
2,7
31,0
96
1,4
01,6
62
1,0
28,4
29
298,8
46
202,7
83
154,1
92
13,5
22,3
36
Nati
on
al P
art
ne
rsh
ip p
aym
en
tsN
ati
on
al H
ealt
h R
efo
rmIm
pro
vin
g P
ublic
Hospita
l Serv
ices
Fle
xib
le f
undin
g p
ool f
or
em
erg
ency
depart
ments
, ele
ctiv
e s
urg
ery
and
subacute
care
(a)
7,0
44
5,5
91
4,7
24
2,7
16
2,0
75
1,0
73
944
833
25,0
00
Natio
nal E
merg
ency A
ccess T
arg
et
em
erg
ency d
epart
ments
(b)
Capita
l fundin
g14,4
82
11,4
28
9,6
07
5,3
90
4,0
46
1,9
41
1,6
69
1,4
37
50,0
00
Facilita
tion a
nd r
ew
ard
fundin
g(c
)16,0
16
12,4
16
10,2
77
5,2
45
3,6
14
1,1
16
796
522
50,0
02
Natio
nal E
lectiv
e S
urg
ery
Targ
et(
d)
Capita
l fundin
g -
- -
- -
- -
- -
Facilita
tion a
nd r
ew
ard
fundin
g(c
) -
- -
- -
- -
- -
New
subacute
beds g
uara
nte
e f
undin
g145,0
00
111,1
00
89,8
00
45,9
00
32,8
00
10,6
00
7,0
00
4,3
00
446,5
00
Expansio
n o
f subacute
care
in
multi
-purp
ose s
erv
ices
11,3
00
3,6
00
4,7
00
8,0
00
6,1
00
1,2
00
-100
35,0
00
Fin
ancia
l assis
tance f
or
long s
tay o
lder
patie
nts
28,7
09
11,1
14
18,5
22
13,8
92
15,7
43
2,7
78
926
926
92,6
10
Clo
sin
g t
he
Gap
in
th
e N
ort
he
rnT
err
ito
ryIn
dig
enous h
ealth
and r
ela
ted s
erv
ices
- -
- -
- -
-829
829
He
alt
h a
nd
ho
sp
ital w
ork
forc
e r
efo
rmA
ctiv
ity b
ased f
undin
g16,4
50
14,7
30
9,3
80
5,5
20
4,8
00
1,6
60
1,3
20
1,6
60
55,5
20

Part 3 – Fiscal Strategy and Outlook
80
Tab
le A
.1:
Est
imat
ed p
aym
ents
to
su
pp
ort
sta
te h
ealt
h s
ervi
ces,
by
year
an
d S
tate
(co
nti
nu
ed)
$'0
00
NS
WV
ICQ
LD
WA
SA
TA
SA
CT
NT
To
tal
2012-1
3H
ealt
h in
fras
tru
ctu
reH
ealth
and H
ospita
ls F
und
Hospita
l infr
astr
uctu
re a
nd o
ther
pro
jects
of
natio
nal s
ignific
ance
9,4
00
-82,0
00
-103,0
00
1,0
00
-7,5
00
202,9
00
Natio
nal c
ancer
syste
m
40,4
09
29,0
28
61,3
20
2,2
91
34,1
00
3,2
36
10,0
00
-180,3
84
Regio
nal p
riority
round
38,4
00
27,7
92
10,8
21
7,5
56
14,7
31
- -
21,8
54
121,1
54
Tra
nsla
tional r
esearc
h a
nd w
ork
forc
etr
ain
ing
-25,0
00
- -
- -
- -
25,0
00
Oth
er
Health
infr
astr
uctu
re p
aym
ents
Cairns in
tegra
ted c
ancer
centr
e
- -
- -
- -
- -
-C
hild
ren’s
cancer
centr
e, A
dela
ide
- -
- -
- -
- -
-Fundin
g f
or
Gra
fton H
ospita
l -
- -
- -
- -
- -
Health
infr
astr
uctu
re p
roje
cts
in
Tasm
ania
- -
- -
- -
- -
-Tasm
ania
n h
ealth
packa
ge
Patie
nt tr
ansport
and
accom
modatio
n s
erv
ices
- -
- -
- -
- -
-R
adia
tion o
ncolo
gy s
erv
ices in
N
ort
h/N
ort
h W
est Tasm
ania
-
- -
- -
400
- -
400
He
alt
h s
erv
ice
sEarly in
terv
entio
n p
ilot pro
gra
m222
- -
- -
- -
-222
Exte
nsio
n o
f th
e C
OA
G L
ong S
tay
Old
er
Patie
nts
Initi
ativ
e12,9
90
9,5
20
6,7
50
3,3
20
3,3
30
990
300
300
37,5
00
Health
care
gra
nts
for
the T
orr
es S
trait
- -
4,3
69
- -
- -
-4,3
69
Health
y k
ids h
ealth
checks
502
403
418
227
158
99
71
98
1,9
76
Hum
an q
uara
ntin
e s
erv
ices
35
19
20
12
75
57
110
Impro
vin
g e
ar
health
serv
ices f
or
Indig
enous A
ustr
alia
n c
hild
ren —
pro
ject agre
em
ent
855
295
1,3
64
1,3
68
770
- -
1,8
79
6,5
31

Part
81
Part 3 – Fiscal Strategy and Outlook
Tab
le A
.1:
Est
imat
ed p
aym
ents
to
su
pp
ort
sta
te h
ealt
h s
ervi
ces,
by
year
an
d S
tate
(co
nti
nu
ed)
$'0
00
NS
WV
ICQ
LD
WA
SA
TA
SA
CT
NT
To
tal
2012-1
3H
ealt
h s
erv
ice
s (
co
nti
nu
ed
)Im
pro
vin
g tra
chom
a c
ontr
ol s
erv
ices f
or
Indig
enous A
ustr
alia
ns —
pro
ject
agre
em
ent
70
-359
736
1,0
48
- -
1,7
12
3,9
25
Natio
nal b
ow
el c
ancer
scre
enin
g
- -
- -
- -
- -
-N
atio
nal P
erinata
l Depre
ssio
n In
itiativ
e2,4
78
2,0
56
1,7
34
1,0
70
596
266
226
274
8,7
00
Nort
hern
Terr
itory
medic
al s
chool —
fu
ndin
g c
ontr
ibutio
n -
- -
- -
- -
2,2
14
2,2
14
OzFoodN
et
332
245
243
189
190
176
131
138
1,6
44
Sate
llite
renal d
ialy
sis
facilitie
s in
rem
ote
Nort
hern
Terr
itory
com
muniti
es
- -
- -
- -
- -
-S
exual a
ssault
counselling in
rem
ote
Nort
hern
Terr
itory
are
as
- -
- -
- -
-461
461
Torr
es S
trait
health
pro
tectio
n s
trate
gy
- -
930
- -
- -
-930
Reducin
g a
cute
rheum
atic
heart
fever
am
ong In
dig
enous c
hild
ren
- -
841
841
- -
-841
2,5
23
Royal D
arw
in H
ospita
l — e
quip
ped,
pre
pare
d a
nd r
eady
- -
- -
- -
-14,7
70
14,7
70
Vaccin
e-p
reventa
ble
dis
eases
surv
eillance
187
178
155
79
76
31
31
44
781
Vic
torian c
yto
logy s
erv
ice
-8,0
85
- -
- -
- -
8,0
85
Me
nta
l H
ealt
hExpandin
g the E
arly P
sychosis
Pre
ventio
n
and In
terv
entio
n C
entr
e m
odel(e)
3,5
25
3,5
25
3,5
25
3,5
25
3,5
25
3,5
25
3,5
25
3,5
25
28,2
00
Menta
l health
refo
rm(f
)13,9
71
10,8
16
8,8
77
4,5
33
3,1
58
972
697
449
43,4
73

Part 3 – Fiscal Strategy and Outlook
82
Tab
le A
.1:
Est
imat
ed p
aym
ents
to
su
pp
ort
sta
te h
ealt
h s
ervi
ces,
by
year
an
d S
tate
(co
nti
nu
ed)
$'0
00
NS
WV
ICQ
LD
WA
SA
TA
SA
CT
NT
To
tal
2012-1
3P
reve
nti
ve
he
alt
hEnablin
g in
frastr
uctu
re
816
620
500
252
188
58
40
26
2,5
00
Health
y c
hild
ren
21,3
24
15,6
52
13,2
97
6,6
02
4,6
33
1,5
73
1,0
18
813
64,9
12
Health
y c
om
muniti
es
6,2
85
5,4
28
5,1
42
3,7
14
3,1
43
857
286
1,4
28
26,2
83
Health
y w
ork
ers
19,9
04
15,3
85
12,8
31
6,7
24
4,5
69
1,3
75
1,1
22
646
62,5
56
Socia
l mark
etin
g
1,9
59
1,4
87
1,1
99
606
451
140
97
62
6,0
01
Oth
er
Com
monw
ealth
Denta
l Health
Pro
gra
m30,3
60
24,1
50
17,5
60
7,8
70
8,2
20
3,3
60
1,3
70
1,4
10
94,3
00
East K
imberley d
evelo
pm
ent
packa
ge —
health
-rela
ted p
roje
cts
- -
-2,8
30
- -
- -
2,8
30
Ele
ctiv
e s
urg
ery
waiti
ng li
st
reductio
n p
lan
- -
- -
- -
- -
-Essentia
l vaccin
es
111,1
95
90,6
50
76,8
07
36,5
79
26,9
00
8,2
60
5,5
18
4,5
17
360,4
26
Indig
enous e
arly c
hild
hood
develo
pm
ent —
ante
nata
l and
repro
ductiv
e h
ealth
5,7
40
1,3
25
7,1
46
3,7
60
1,2
61
705
240
4,0
80
24,2
57
Indig
enous m
obile
denta
l pro
gra
m -
- -
- -
- -
- -
Tota
l4,9
41,3
69
3,7
65,5
57
3,1
96,3
14
1,5
83,0
09
1,3
11,6
61
346,2
42
240,1
15
233,8
47
15,6
18,1
14
Mem
ora
ndum
ite
m -
paym
ents
dir
ect to
local gove
rnm
ents
inclu
ded in p
aym
ents
ab
ove
Health
y c
om
muniti
es
6,2
85
5,4
28
5,1
42
3,7
14
3,1
43
857
286
1,4
28
26,2
83
Tota
l6,2
85
5,4
28
5,1
42
3,7
14
3,1
43
857
286
1,4
28
26,2
83
(a
) S
ince
the
2011
-12
Bud
get,
the
na
me
of th
is c
ompo
nent
has
cha
nge
d fr
om F
lexi
ble
fund
ing
for
em
erg
enc
y de
part
men
ts,
elec
tive
surg
ery
and
suba
cute
car
e.
(b)
Sin
ce th
e 20
11-1
2 B
udge
t, th
e n
am
e of
this
com
pone
nt h
as c
hang
ed
from
Fo
ur h
our
nat
iona
l acc
ess
targ
et fo
r e
mer
genc
y de
part
men
ts.
(c)
Re
war
d
fund
ing
in
itial
ly
exp
ecte
d to
be
p
aid
in
this
ye
ar
has
been
m
oved
in
to
the
subs
eque
nt
year
to
b
ette
r re
flect
ex
pec
ted
repo
rtin
g an
d pa
ymen
t tim
efra
mes
. Ear
lier
paym
ent
ma
y be
pos
sibl
e if
repo
rtin
g pr
oces
ses
can
be f
acili
tate
d ea
rlier
. T
he m
ovem
ent
of r
ew
ard
pa
yme
nts
does
not
impa
ct o
n th
e tim
ing
of
an
y fa
cilit
atio
n p
aym
en
ts.
(d)
Sin
ce th
e 20
11-1
2 B
udge
t, th
e n
am
e of
this
com
pone
nt h
as c
hang
ed
from
Im
pro
ving
acc
ess
to e
lect
ive
surg
ery.
(e
) Y
earl
y p
rofil
es a
nd S
tate
spl
its a
re in
dica
tive
dist
ribut
ions
onl
y an
d ha
ve b
een
allo
cate
d on
an
equa
l bas
is to
all
Sta
tes.
(f
) Y
earl
y p
rofil
es a
nd S
tate
spl
its a
re in
dica
tive
dist
ribut
ions
onl
y an
d ha
ve b
een
allo
cate
d on
an
equa
l per
cap
ita b
asis
to a
ll S
tate
s.

Part
83
Part 3 – Fiscal Strategy and Outlook
Tab
le A
.1:
Est
imat
ed p
aym
ents
to
su
pp
ort
sta
te h
ealt
h s
ervi
ces,
by
year
an
d S
tate
(co
nti
nu
ed)
$'0
00
NS
WV
ICQ
LD
WA
SA
TA
SA
CT
NT
To
tal
2013-1
4N
ati
on
al H
ealt
h R
efo
rm f
un
din
g4,6
08,5
18
3,5
86,0
22
2,9
48,2
92
1,5
11,2
27
1,0
40,1
95
319,7
98
231,9
57
148,7
98
14,3
94,8
07
Nati
on
al P
art
ne
rsh
ip p
aym
en
tsN
ati
on
al H
ealt
h R
efo
rmIm
pro
vin
g P
ublic
Hospita
l Serv
ices
Fle
xib
le f
undin
g p
ool f
or
em
erg
ency
depart
ments
, ele
ctiv
e s
urg
ery
and
subacute
care
(a)
- -
- -
- -
- -
-N
atio
nal E
merg
ency A
ccess T
arg
et
em
erg
ency d
epart
ments
(b)
Capita
l fundin
g -
- -
- -
- -
- -
Facilita
tion a
nd r
ew
ard
fundin
g15,8
95
12,3
93
10,3
94
5,3
26
3,5
34
1,0
94
810
553
49,9
99
Natio
nal E
lectiv
e S
urg
ery
Targ
et(
c)
Capita
l fundin
g -
- -
- -
- -
- -
Facilita
tion a
nd r
ew
ard
fundin
g15,7
50
12,3
26
10,5
50
5,4
25
3,4
00
873
673
493
49,4
90
New
subacute
beds g
uara
nte
e f
undin
g203,8
00
154,7
00
125,9
00
64,3
00
46,0
00
14,0
00
9,9
00
6,9
00
625,5
00
Expansio
n o
f subacute
care
in
multi
-purp
ose s
erv
ices
11,3
00
3,6
00
4,7
00
8,0
00
6,1
00
1,2
00
-100
35,0
00
Fin
ancia
l assis
tance f
or
long s
tay o
lder
patie
nts
24,3
00
9,4
05
15,6
77
11,7
57
13,3
25
2,3
52
785
785
78,3
86
Clo
sin
g t
he
Gap
in
th
e N
ort
he
rnT
err
ito
ryIn
dig
enous h
ealth
and r
ela
ted s
erv
ices
- -
- -
- -
- -
-H
ealt
h a
nd
ho
sp
ital w
ork
forc
e r
efo
rmA
ctiv
ity b
ased f
undin
g -
- -
- -
- -
- -

Part 3 – Fiscal Strategy and Outlook
84
Tab
le A
.1:
Est
imat
ed p
aym
ents
to
su
pp
ort
sta
te h
ealt
h s
ervi
ces,
by
year
an
d S
tate
(co
nti
nu
ed)
$'0
00
NS
WV
ICQ
LD
WA
SA
TA
SA
CT
NT
To
tal
2013-1
4H
ealt
h in
fras
tru
ctu
reH
ealth
and H
ospita
ls F
und
Hospita
l infr
astr
uctu
re a
nd o
ther
pro
jects
of
natio
nal s
ignific
ance
- -
15,0
00
62,6
00
16,0
00
- -
-93,6
00
Natio
nal c
ancer
syste
m
736
67,0
00
28,2
31
-3,2
66
700
-1,2
00
101,1
33
Regio
nal p
riority
round
83,3
68
49,3
48
23,6
39
14,8
01
26,7
00
- -
37,0
32
234,8
88
Tra
nsla
tional r
esearc
h a
nd w
ork
forc
etr
ain
ing
-20,0
00
- -
- -
- -
20,0
00
Oth
er
Health
infr
astr
uctu
re p
aym
ents
Cairns in
tegra
ted c
ancer
centr
e
- -
- -
- -
- -
-C
hild
ren’s
cancer
centr
e, A
dela
ide
- -
- -
- -
- -
-Fundin
g f
or
Gra
fton H
ospita
l -
- -
- -
- -
- -
Health
infr
astr
uctu
re p
roje
cts
in
Tasm
ania
- -
- -
- -
- -
-Tasm
ania
n h
ealth
packa
ge
Patie
nt tr
ansport
and
accom
modatio
n s
erv
ices
- -
- -
- -
- -
-R
adia
tion o
ncolo
gy s
erv
ices in
N
ort
h/N
ort
h W
est Tasm
ania
-
- -
- -
- -
- -
He
alt
h s
erv
ice
sEarly in
terv
entio
n p
ilot pro
gra
m -
- -
- -
- -
- -
Exte
nsio
n o
f th
e C
OA
G L
ong S
tay
Old
er
Patie
nts
Initi
ativ
e12,9
90
9,5
20
6,7
50
3,3
20
3,3
30
990
300
300
37,5
00
Health
care
gra
nts
for
the T
orr
es S
trait
- -
4,4
47
- -
- -
-4,4
47
Health
y k
ids h
ealth
checks
501
403
421
231
160
102
72
100
1,9
90
Hum
an q
uara
ntin
e s
erv
ices
35
19
20
13
76
57
112
Impro
vin
g e
ar
health
serv
ices f
or
Indig
enous A
ustr
alia
n c
hild
ren —
pro
ject agre
em
ent
95
31
151
152
86
- -
162
677

Part
85
Part 3 – Fiscal Strategy and Outlook
Tab
le A
.1:
Est
imat
ed p
aym
ents
to
su
pp
ort
sta
te h
ealt
h s
ervi
ces,
by
year
an
d S
tate
(co
nti
nu
ed)
$'0
00
NS
WV
ICQ
LD
WA
SA
TA
SA
CT
NT
To
tal
2013-1
4H
ealt
h s
erv
ice
s (
co
nti
nu
ed
)Im
pro
vin
g tra
chom
a c
ontr
ol s
erv
ices f
or
Indig
enous A
ustr
alia
ns —
pro
ject
agre
em
ent
- -
-82
117
- -
190
389
Natio
nal b
ow
el c
ancer
scre
enin
g
- -
- -
- -
- -
-N
atio
nal P
erinata
l Depre
ssio
n In
itiativ
e2,4
78
2,0
56
1,7
34
1,0
70
596
266
226
274
8,7
00
Nort
hern
Terr
itory
medic
al s
chool —
fu
ndin
g c
ontr
ibutio
n -
- -
- -
- -
2,2
54
2,2
54
OzFoodN
et
337
249
249
192
193
179
134
140
1,6
73
Sate
llite
renal d
ialy
sis
facilitie
s in
rem
ote
Nort
hern
Terr
itory
com
muniti
es
- -
- -
- -
- -
-S
exual a
ssault
counselling in
rem
ote
Nort
hern
Terr
itory
are
as
- -
- -
- -
- -
-Torr
es S
trait
health
pro
tectio
n s
trate
gy
- -
946
- -
- -
-946
Reducin
g a
cute
rheum
atic
heart
fever
am
ong In
dig
enous c
hild
ren
- -
857
857
- -
-857
2,5
71
Royal D
arw
in H
ospita
l — e
quip
ped,
pre
pare
d a
nd r
eady
- -
- -
- -
-15,0
22
15,0
22
Vaccin
e-p
reventa
ble
dis
eases
surv
eillance
192
183
157
80
77
32
33
45
799
Vic
torian c
yto
logy s
erv
ice
-8,4
89
- -
- -
- -
8,4
89
Me
nta
l H
ealt
hExpandin
g the E
arly P
sychosis
Pre
ventio
n
and In
terv
entio
n C
entr
e m
odel(d)
6,2
75
6,2
75
6,2
75
6,2
75
6,2
75
6,2
75
6,2
75
6,2
75
50,2
00
Menta
l health
refo
rm(e
)14,1
76
11,0
22
9,0
77
4,6
44
3,1
98
984
709
459
44,2
69

Part 3 – Fiscal Strategy and Outlook
86
Tab
le A
.1:
Est
imat
ed p
aym
ents
to
su
pp
ort
sta
te h
ealt
h s
ervi
ces,
by
year
an
d S
tate
(co
nti
nu
ed)
$'0
00
NS
WV
ICQ
LD
WA
SA
TA
SA
CT
NT
To
tal
2013-1
4P
reve
nti
ve
he
alt
hEnablin
g in
frastr
uctu
re
- -
- -
- -
- -
-H
ealth
y c
hild
ren
31,9
85
23,4
78
19,9
45
9,9
04
6,9
49
2,3
59
1,5
27
1,2
20
97,3
67
Health
y c
om
muniti
es
- -
- -
- -
- -
-H
ealth
y w
ork
ers
28,0
50
21,6
82
18,0
83
9,4
76
6,4
39
1,9
39
1,5
81
911
88,1
61
Socia
l mark
etin
g
- -
- -
- -
- -
-O
the
rC
om
monw
ealth
Denta
l Health
Pro
gra
m30,6
70
24,3
80
17,7
30
7,9
40
8,3
00
3,8
90
1,8
80
1,9
10
96,7
00
East K
imberley d
evelo
pm
ent
packa
ge —
health
-rela
ted p
roje
cts
- -
- -
- -
- -
-Ele
ctiv
e s
urg
ery
waiti
ng li
st
reductio
n p
lan
- -
- -
- -
- -
-Essentia
l vaccin
es
106,3
44
87,3
78
75,3
12
35,6
88
25,7
26
7,8
74
5,3
46
4,6
92
348,3
60
Indig
enous e
arly c
hild
hood
develo
pm
ent —
ante
nata
l and
repro
ductiv
e h
ealth
5,5
01
1,4
23
7,6
48
3,9
28
1,1
20
736
250
3,7
57
24,3
63
Indig
enous m
obile
denta
l pro
gra
m -
- -
- -
- -
- -
Tota
l5,2
03,2
96
4,1
11,3
82
3,3
52,1
85
1,7
67,2
88
1,2
21,0
93
365,6
49
262,4
63
234,4
36
16,5
17,7
92
Mem
ora
ndum
ite
m -
paym
ents
dir
ect to
local gove
rnm
ents
inclu
ded in p
aym
ents
ab
ove
Health
y c
om
muniti
es
- -
- -
- -
- -
-Tota
l -
- -
- -
- -
- -
(a
) S
ince
the
2011
-12
Bud
get,
the
na
me
of th
is c
ompo
nent
has
cha
nge
d fr
om F
lexi
ble
fund
ing
for
em
erg
enc
y de
part
men
ts,
elec
tive
surg
ery
and
suba
cute
car
e.
(b)
Sin
ce th
e 20
11-1
2 B
udge
t, th
e n
am
e of
this
com
pone
nt h
as c
hang
ed
from
Fo
ur h
our
nat
iona
l acc
ess
targ
et fo
r e
mer
genc
y de
part
men
ts.
(c)
Sin
ce th
e 20
11-1
2 B
udge
t, th
e n
am
e of
this
com
pone
nt h
as c
hang
ed
from
Im
pro
ving
acc
ess
to e
lect
ive
surg
ery.
(d
) Y
earl
y p
rofil
es a
nd S
tate
spl
its a
re in
dica
tive
dist
ribut
ions
onl
y an
d ha
ve b
een
allo
cate
d on
an
equa
l bas
is to
all
Sta
tes.
(e
) Y
earl
y p
rofil
es a
nd S
tate
spl
its a
re in
dica
tive
dist
ribut
ions
onl
y an
d ha
ve b
een
allo
cate
d on
an
equa
l per
cap
ita b
asis
to a
ll S
tate
s.

Part
87
Part 3 – Fiscal Strategy and Outlook
Tab
le A
.1:
Est
imat
ed p
aym
ents
to
su
pp
ort
sta
te h
ealt
h s
ervi
ces,
by
year
an
d S
tate
(co
nti
nu
ed)
$'0
00
NS
WV
ICQ
LD
WA
SA
TA
SA
CT
NT
To
tal
2014-1
5N
ati
on
al H
ealt
h R
efo
rm f
un
din
g(a
)5,0
81,8
09
3,9
63,3
28
3,2
91,9
81
1,7
11,0
13
1,1
58,8
69
350,7
71
266,1
73
175,1
16
15,9
99,0
60
Nati
on
al P
art
ne
rsh
ip p
aym
en
tsN
ati
on
al H
ealt
h R
efo
rmIm
pro
vin
g P
ublic
Hospita
l Serv
ices
Fle
xib
le f
undin
g p
ool f
or
em
erg
ency
depart
ments
, ele
ctiv
e s
urg
ery
and
subacute
care
(b)
- -
- -
- -
- -
-N
atio
nal E
merg
ency A
ccess T
arg
et
em
erg
ency d
epart
ments
(c)
Capita
l fundin
g -
- -
- -
- -
- -
Facilita
tion a
nd r
ew
ard
fundin
g15,8
95
12,3
93
10,3
94
5,3
26
3,5
34
1,0
94
810
553
49,9
99
Natio
nal E
lectiv
e S
urg
ery
Targ
et(
d)
Capita
l fundin
g -
- -
- -
- -
- -
Facilita
tion a
nd r
ew
ard
fundin
g15,7
50
12,3
26
10,5
50
5,4
25
3,4
00
873
673
493
49,4
90
New
subacute
beds g
uara
nte
e f
undin
g -
- -
- -
- -
- -
Expansio
n o
f subacute
care
in
multi
-purp
ose s
erv
ices
- -
- -
- -
- -
-Fin
ancia
l assis
tance f
or
long s
tay o
lder
patie
nts
- -
- -
- -
- -
-C
los
ing
th
e G
ap
in
th
e N
ort
he
rnT
err
ito
ryIn
dig
enous h
ealth
and r
ela
ted s
erv
ices
- -
- -
- -
- -
-H
ealt
h a
nd
ho
sp
ital w
ork
forc
e r
efo
rmA
ctiv
ity b
ased f
undin
g -
- -
- -
- -
- -

Part 3 – Fiscal Strategy and Outlook
88
Tab
le A
.1:
Est
imat
ed p
aym
ents
to
su
pp
ort
sta
te h
ealt
h s
ervi
ces,
by
year
an
d S
tate
(co
nti
nu
ed)
$'0
00
NS
WV
ICQ
LD
WA
SA
TA
SA
CT
NT
To
tal
2014-1
5H
ealt
h in
fras
tru
ctu
reH
ealth
and H
ospita
ls F
und
Hospita
l infr
astr
uctu
re a
nd o
ther
pro
jects
of
natio
nal s
ignific
ance
- -
-50,0
00
- -
- -
50,0
00
Natio
nal c
ancer
syste
m
-67,0
00
- -
-4,7
79
-600
72,3
79
Regio
nal p
riority
round
111,8
17
57,3
10
38,3
97
9,2
88
10,7
00
- -
38,2
88
265,8
00
Tra
nsla
tional r
esearc
h a
nd w
ork
forc
etr
ain
ing
- -
- -
- -
- -
-O
ther
Health
infr
astr
uctu
re p
aym
ents
Cairns in
tegra
ted c
ancer
centr
e
- -
- -
- -
- -
-C
hild
ren’s
cancer
centr
e, A
dela
ide
- -
- -
- -
- -
-Fundin
g f
or
Gra
fton H
ospita
l -
- -
- -
- -
- -
Health
infr
astr
uctu
re p
roje
cts
in
Tasm
ania
- -
- -
- -
- -
-Tasm
ania
n h
ealth
packa
ge
Patie
nt tr
ansport
and
accom
modatio
n s
erv
ices
- -
- -
- -
- -
-R
adia
tion o
ncolo
gy s
erv
ices in
N
ort
h/N
ort
h W
est Tasm
ania
-
- -
- -
- -
- -
He
alt
h s
erv
ice
sEarly in
terv
entio
n p
ilot pro
gra
m -
- -
- -
- -
- -
Exte
nsio
n o
f th
e C
OA
G L
ong S
tay
Old
er
Patie
nts
Initi
ativ
e12,9
90
9,5
20
6,7
50
3,3
20
3,3
30
990
300
300
37,5
00
Health
care
gra
nts
for
the T
orr
es S
trait
- -
4,5
32
- -
- -
-4,5
32
Health
y k
ids h
ealth
checks
501
403
421
231
160
102
72
100
1,9
90
Hum
an q
uara
ntin
e s
erv
ices
36
20
20
13
76
57
114
Impro
vin
g e
ar
health
serv
ices f
or
Indig
enous A
ustr
alia
n c
hild
ren —
pro
ject agre
em
ent
- -
- -
- -
- -
-

Part
89
Part 3 – Fiscal Strategy and Outlook
Tab
le A
.1:
Est
imat
ed p
aym
ents
to
su
pp
ort
sta
te h
ealt
h s
ervi
ces,
by
year
an
d S
tate
(co
nti
nu
ed)
$'0
00
NS
WV
ICQ
LD
WA
SA
TA
SA
CT
NT
To
tal
2014-1
5H
ealt
h s
erv
ice
s (
co
nti
nu
ed
)Im
pro
vin
g tra
chom
a c
ontr
ol s
erv
ices f
or
Indig
enous A
ustr
alia
ns —
pro
ject
agre
em
ent
- -
- -
- -
- -
-N
atio
nal b
ow
el c
ancer
scre
enin
g
- -
- -
- -
- -
-N
atio
nal P
erinata
l Depre
ssio
n In
itiativ
e2,4
78
2,0
56
1,7
34
1,0
70
596
266
226
274
8,7
00
Nort
hern
Terr
itory
medic
al s
chool —
fu
ndin
g c
ontr
ibutio
n -
- -
- -
- -
2,2
97
2,2
97
OzFoodN
et
343
253
253
197
197
183
137
143
1,7
06
Sate
llite
renal d
ialy
sis
facilitie
s in
rem
ote
Nort
hern
Terr
itory
com
muniti
es
- -
- -
- -
- -
-S
exual a
ssault
counselling in
rem
ote
Nort
hern
Terr
itory
are
as
- -
- -
- -
- -
-Torr
es S
trait
health
pro
tectio
n s
trate
gy
- -
964
- -
- -
-964
Reducin
g a
cute
rheum
atic
heart
fever
am
ong In
dig
enous c
hild
ren
- -
874
874
- -
-874
2,6
22
Royal D
arw
in H
ospita
l — e
quip
ped,
pre
pare
d a
nd r
eady
- -
- -
- -
-15,3
07
15,3
07
Vaccin
e-p
reventa
ble
dis
eases
surv
eillance
199
187
161
81
78
32
33
46
817
Vic
torian c
yto
logy s
erv
ice
-8,9
14
- -
- -
- -
8,9
14
Me
nta
l H
ealt
hExpandin
g the E
arly P
sychosis
Pre
ventio
n
and In
terv
entio
n C
entr
e m
odel(e)
8,7
75
8,7
75
8,7
75
8,7
75
8,7
75
8,7
75
8,7
75
8,7
75
70,2
00
Menta
l health
refo
rm(f
)14,3
77
11,2
24
9,2
73
4,7
53
3,2
37
995
721
469
45,0
49

Part 3 – Fiscal Strategy and Outlook
90
Tab
le A
.1:
Est
imat
ed p
aym
ents
to
su
pp
ort
sta
te h
ealt
h s
ervi
ces,
by
year
an
d S
tate
(co
nti
nu
ed)
$'0
00
NS
WV
ICQ
LD
WA
SA
TA
SA
CT
NT
To
tal
2014-1
5P
reve
nti
ve
he
alt
hEnablin
g in
frastr
uctu
re
- -
- -
- -
- -
-H
ealth
y c
hild
ren
42,9
65
31,5
37
26,7
92
13,3
03
9,3
34
3,1
69
2,0
52
1,6
38
130,7
90
Health
y c
om
muniti
es
- -
- -
- -
- -
-H
ealth
y w
ork
ers
33,4
55
25,8
61
21,5
68
11,3
02
7,6
80
2,3
12
1,8
86
1,0
86
105,1
50
Socia
l mark
etin
g
- -
- -
- -
- -
-O
the
rC
om
monw
ealth
Denta
l Health
Pro
gra
m31,9
00
25,3
70
18,4
50
8,2
60
8,6
40
3,5
10
1,4
20
1,4
50
99,0
00
East K
imberley d
evelo
pm
ent
packa
ge —
health
-rela
ted p
roje
cts
- -
- -
- -
- -
-Ele
ctiv
e s
urg
ery
waiti
ng li
st
reductio
n p
lan
- -
- -
- -
- -
-Essentia
l vaccin
es
104,8
88
86,9
74
74,7
79
35,4
45
25,4
24
7,7
19
5,3
00
4,4
75
345,0
04
Indig
enous e
arly c
hild
hood
develo
pm
ent —
ante
nata
l and
repro
ductiv
e h
ealth
2,5
83
- -
2,0
10
482
377
-502
5,9
54
Indig
enous m
obile
denta
l pro
gra
m -
- -
- -
- -
- -
Tota
l5,4
80,7
61
4,3
23,4
51
3,5
26,6
68
1,8
70,6
86
1,2
44,4
43
385,9
53
288,5
83
252,7
93
17,3
73,3
38
Mem
ora
ndum
ite
m -
paym
ents
dir
ect to
local gove
rnm
ents
inclu
ded in p
aym
ents
ab
ove
Health
y c
om
muniti
es
- -
- -
- -
- -
-Tota
l -
- -
- -
- -
- -
(a
) T
he e
ffici
ent
gro
wth
fun
ding
com
pone
nt o
f N
atio
nal
Hea
lth R
efor
m f
undi
ng i
n 20
14-1
5 is
dis
trib
uted
on
a pe
r ca
pita
bas
is f
or
illus
trat
ive
purp
oses
onl
y. T
he
dist
ribut
ion
of e
ffici
ent g
row
th fu
ndin
g w
ill b
e de
term
ined
by
effic
ient
gro
wth
in e
ach
Sta
te.
(b)
Sin
ce th
e 20
11-1
2 B
udge
t, th
e n
am
e of
this
com
pone
nt h
as c
hang
ed
from
Fle
xibl
e fu
ndin
g fo
r e
me
rge
ncy
depa
rtm
ents
, el
ectiv
e su
rger
y an
d su
bacu
te c
are
. (c
) S
ince
the
2011
-12
Bud
get,
the
na
me
of th
is c
ompo
nent
has
cha
nge
d fr
om F
our
ho
ur n
atio
nal a
cces
s ta
rget
for
em
erge
ncy
depa
rtm
ents
. (d
) S
ince
the
2011
-12
Bud
get,
the
na
me
of th
is c
ompo
nent
has
cha
nge
d fr
om I
mp
rovi
ng a
cces
s to
ele
ctiv
e su
rger
y.
(e)
Yea
rly
pro
files
and
Sta
te s
plits
are
indi
cativ
e di
strib
utio
ns o
nly
and
have
bee
n al
loca
ted
on a
n eq
ual b
asis
to a
ll S
tate
s.
(f)
Yea
rly
pro
files
and
Sta
te s
plits
are
indi
cativ
e di
strib
utio
ns o
nly
and
have
bee
n al
loca
ted
on a
n eq
ual p
er c
apita
bas
is to
all
Sta
tes.

Part
91
Part 3 – Fiscal Strategy and Outlook
Tab
le A
.2:
Est
imat
ed p
aym
ents
to
su
pp
ort
sta
te e
du
cati
on
ser
vice
s, b
y ye
ar a
nd
Sta
te
$'0
00
NS
WV
ICQ
LD
WA
SA
TA
SA
CT
NT
To
tal
2011-1
2N
ati
on
al S
ch
oo
ls S
PP
3,5
74,1
50
2,8
00,5
66
2,3
08,4
23
1,1
66,6
35
868,2
50
259,8
82
198,3
88
160,7
51
11,3
37,0
45
Nati
on
al P
art
ne
rsh
ip p
aym
en
tsC
losin
g the G
ap in
the N
ort
hern
Terr
itory
Qualit
y teachin
g, accele
rate
d li
tera
cy
- -
- -
- -
-12,2
89
12,2
89
Support
ing r
em
ote
schools
—additi
onal t
eachers
-
- -
- -
- -
32,3
00
32,3
00
Teacher
housin
g -
- -
- -
- -
722
722
Dig
ital E
ducatio
n R
evolu
tion
63,4
40
47,5
30
42,4
95
20,8
81
15,0
84
4,8
42
3,8
04
1,9
24
200,0
00
Early C
hild
hood E
ducatio
n —
univ
ers
al a
ccess to e
arly e
ducatio
n82,2
69
59,1
03
90,2
88
29,7
00
20,1
96
5,9
40
3,5
64
5,9
40
297,0
00
East K
imberley d
evelo
pm
ent packa
ge —
educatio
n-r
ela
ted p
roje
cts
- -
-16,8
30
- -
- -
16,8
30
Educatio
n In
vestm
ent Fund
11,6
87
- -
13,1
90
- -
- -
24,8
77
Em
pow
ering L
ocal S
chools
(a)
12,5
53
9,3
50
7,5
70
5,0
28
4,0
11
2,0
27
1,3
16
1,7
22
43,5
77
Fort
Str
eet H
igh S
chool n
ois
e in
sula
tion
7,5
00
- -
- -
- -
-7,5
00
Help
ing O
ur
Kid
s U
nders
tand F
inances —
Pro
fessio
nal l
earn
ing a
nd
MoneyS
mart
schools
215
202
162
110
105
82
74
91
1,0
41
Indig
enous e
arly c
hild
hood d
evelo
pm
ent —
child
ren a
nd f
am
ily c
entr
es
24,4
50
1,0
26
25,6
00
11,6
50
10,9
67
2,3
87
1,1
15
16,9
47
94,1
42
Natio
n B
uild
ing a
nd J
obs p
lan —
Build
ing the E
ducatio
n R
evolu
tion —
Prim
ary
schools
for
the 2
1st centu
ry157,4
39
104,5
72
72,2
66
55,8
59
6,3
77
2,1
53
3,0
77
6,1
70
407,9
13
Natio
nal q
ualit
y a
genda f
or
early
child
hood e
ducatio
n a
nd c
are
5,9
37
3,1
55
911
751
1,4
98
192
157
492
13,0
93
Natio
nal S
ola
r S
chools
Pro
gra
m15,6
83
12,5
44
12,2
04
9,0
77
5,5
28
2,3
15
1,7
47
2,8
32
61,9
30
Rew
ard
for
School I
mpro
vem
ent(
a)
3,2
65
2,3
77
1,7
98
1,1
25
819
283
134
199
10,0
00
School P
ath
ways P
rogra
m -
- -
519
1,3
36
- -
-1,8
55

Part 3 – Fiscal Strategy and Outlook
92
Tab
le A
.2:
Est
imat
ed p
aym
ents
to
su
pp
ort
sta
te e
du
cati
on
ser
vice
s, b
y ye
ar a
nd
Sta
te (
con
tin
ued
) $'0
00
NS
WV
ICQ
LD
WA
SA
TA
SA
CT
NT
To
tal
2011-1
2S
chools
— s
upport
for
impro
vin
g le
arn
ing
experiences a
nd e
ducatio
nal o
utc
om
es
for
school s
tudents
with
dis
ability
(b)
25,0
15
18,9
96
16,2
41
8,0
19
5,7
60
1,8
32
1,3
48
879
78,0
90
Secure
Schools
Pro
gra
m2,3
47
1,9
60
584
535
50
-233
-5,7
09
Sm
art
er
Schools
Impro
vin
g teacher
qualit
y(c
)75,3
59
59,8
80
46,5
53
23,9
04
17,2
04
5,5
94
4,2
10
2,8
96
235,6
00
Lite
racy a
nd n
um
era
cy(c
)48,3
85
53,2
13
48,5
22
32,0
20
14,1
36
5,9
23
2,3
28
7,0
11
211,5
38
Low
SES
school c
om
muniti
es(c
)148,3
13
68,8
12
53,9
69
24,1
88
39,9
38
17,5
31
750
17,5
31
371,0
32
Tra
de tra
inin
g c
entr
es in
schools
78,1
36
75,7
40
48,0
72
27,4
07
25,6
03
4,9
78
628
9,8
09
270,3
73
Tota
l4,3
36,1
43
3,3
19,0
26
2,7
75,6
58
1,4
47,4
28
1,0
36,8
62
315,9
61
222,8
73
280,5
05
13,7
34,4
56
Me
mo
ran
du
m it
em
— p
aym
en
ts fo
r no
n-g
ove
rnm
en
t sc
ho
ols
inc
lud
ed
in p
aym
en
ts a
bo
ve
Natio
nal S
chools
SPP
2,3
27,3
04
1,9
24,0
83
1,5
49,6
47
789,1
72
589,0
88
161,0
50
141,8
50
100,6
87
7,5
82,8
81
Dig
ital E
ducatio
n R
evolu
tion
23,1
95
17,9
68
15,3
24
8,1
50
5,7
20
1,4
48
1,6
15
580
74,0
00
Natio
n B
uild
ing a
nd J
obs p
lan —
Build
ing the E
ducatio
n R
evolu
tion —
Prim
ary
schools
for
the 2
1st centu
ry51,0
93
11,6
44
8,4
50
15,4
61
3,3
91
2,1
53
3,0
77
-95,2
69
Natio
nal S
ola
r S
chools
Pro
gra
m2,8
41
2,2
69
850
455
131
287
108
197
7,1
38
Schools
— s
upport
for
impro
vin
g le
arn
ing
experiences a
nd e
ducatio
nal o
utc
om
es
for
school s
tudents
with
dis
ability
(b)
5,9
88
4,2
23
3,1
62
1,9
00
1,0
04
278
278
95
16,9
28
Secure
Schools
Pro
gra
m2,3
47
1,9
60
584
535
50
-233
-5,7
09
Tra
de tra
inin
g c
entr
es in
schools
17,0
03
22,7
74
15,7
94
5,9
46
5,1
90
1,6
70
494
165
69,0
36
Tota
l2,4
29,7
71
1,9
84,9
21
1,5
93,8
11
821,6
19
604,5
74
166,8
86
147,6
55
101,7
24
7,8
50,9
61
N
ote:
T
he
data
in t
his
tabl
e ha
ve b
een
amen
ded
from
the
pub
lishe
d M
YE
FO
doc
umen
t. T
otal
exp
ense
s re
mai
n un
chan
ged.
A
min
or a
djus
tmen
t ha
s be
en m
ade
to t
he
S
tate
sha
res
of t
he N
atio
nal S
peci
fic P
urpo
se P
aym
ent.
(a)
Gov
ernm
ent
sch
ools
onl
y (n
on-g
ove
rnm
ent t
o be
pro
vide
d).
(b)
Yea
rly
pro
files
and
Sta
te s
plits
are
indi
cativ
e di
strib
utio
ns o
nly.
(c
) In
clud
es g
over
nmen
t and
non
-go
vern
men
t sch
ools
. The
pa
ymen
ts t
o no
n-go
vern
me
nt s
choo
ls a
re n
ot s
how
n in
the
Mem
oran
dum
item
.

Part
93
Part 3 – Fiscal Strategy and Outlook
Tab
le A
.2:
Est
imat
ed p
aym
ents
to
su
pp
ort
sta
te e
du
cati
on
ser
vice
s, b
y ye
ar a
nd
Sta
te (
con
tin
ued
) $'0
00
NS
WV
ICQ
LD
WA
SA
TA
SA
CT
NT
To
tal
2012-1
3N
ati
on
al S
ch
oo
ls S
PP
3,8
02,5
08
3,0
05,5
42
2,5
12,4
21
1,2
65,7
20
925,4
48
276,8
45
213,6
33
171,0
42
12,1
73,1
59
Nati
on
al P
art
ne
rsh
ip p
aym
en
tsC
losin
g the G
ap in
the N
ort
hern
Terr
itory
Qualit
y teachin
g, accele
rate
d li
tera
cy
- -
- -
- -
- -
-S
upport
ing r
em
ote
schools
—additi
onal t
eachers
-
- -
- -
- -
12,4
00
12,4
00
Teacher
housin
g -
- -
- -
- -
- -
Dig
ital E
ducatio
n R
evolu
tion
63,4
40
47,5
30
42,4
95
20,8
81
15,0
84
4,8
42
3,8
04
1,9
24
200,0
00
Early C
hild
hood E
ducatio
n —
univ
ers
al a
ccess to e
arly e
ducatio
n137,8
98
109,5
34
97,5
97
47,6
02
30,9
27
10,4
15
7,0
80
5,9
47
447,0
00
East K
imberley d
evelo
pm
ent packa
ge —
educatio
n-r
ela
ted p
roje
cts
- -
-4,2
10
- -
- -
4,2
10
Educatio
n In
vestm
ent Fund
3,7
69
- -
- -
- -
-3,7
69
Em
pow
ering L
ocal S
chools
(a)
- -
- -
- -
- -
-Fort
Str
eet H
igh S
chool n
ois
e in
sula
tion
- -
- -
- -
- -
-H
elp
ing O
ur
Kid
s U
nders
tand F
inances —
Pro
fessio
nal l
earn
ing a
nd
MoneyS
mart
schools
215
202
162
110
105
82
74
91
1,0
41
Indig
enous e
arly c
hild
hood d
evelo
pm
ent —
child
ren a
nd f
am
ily c
entr
es
16,2
50
3,3
60
19,2
44
7,0
00
2,7
92
1,1
80
1,1
10
5,5
99
56,5
35
Natio
n B
uild
ing a
nd J
obs p
lan —
Build
ing the E
ducatio
n R
evolu
tion —
Prim
ary
schools
for
the 2
1st centu
ry -
- -
- -
- -
- -
Natio
nal q
ualit
y a
genda f
or
early
child
hood e
ducatio
n a
nd c
are
9,5
95
5,1
39
1,5
94
1,1
65
2,4
48
303
227
857
21,3
28
Natio
nal S
ola
r S
chools
Pro
gra
m7,4
08
3,1
17
5,5
71
4,2
48
1,7
72
686
807
1,1
84
24,7
93
Rew
ard
for
School I
mpro
vem
ent(
a)
2,1
21
1,5
41
1,1
42
719
516
180
99
122
6,4
40
School P
ath
ways P
rogra
m -
- -
529
1,1
75
- -
-1,7
04

Part 3 – Fiscal Strategy and Outlook
94
Tab
le A
.2:
Est
imat
ed p
aym
ents
to
su
pp
ort
sta
te e
du
cati
on
ser
vice
s, b
y ye
ar a
nd
Sta
te (
con
tin
ued
) $'0
00
NS
WV
ICQ
LD
WA
SA
TA
SA
CT
NT
To
tal
2012-1
3S
chools
— s
upport
for
impro
vin
g le
arn
ing
experiences a
nd e
ducatio
nal o
utc
om
es
for
school s
tudents
with
dis
ability
(b)
25,1
01
19,0
61
16,2
95
8,0
46
5,7
80
1,8
38
1,3
53
882
78,3
56
Secure
Schools
Pro
gra
m2,0
56
1,7
18
513
470
44
-204
-5,0
05
Sm
art
er
Schools
Impro
vin
g teacher
qualit
y(c
)61,7
25
49,0
50
38,1
41
19,5
86
14,0
93
4,5
83
3,4
48
2,3
74
193,0
00
Lite
racy a
nd n
um
era
cy(c
) -
- -
- -
- -
- -
Low
SES
school c
om
muniti
es(c
)143,8
63
66,7
48
55,3
58
23,4
62
38,7
39
17,0
05
728
17,0
05
362,9
08
Tra
de tra
inin
g c
entr
es in
schools
78,3
80
62,7
34
55,1
08
27,5
33
19,8
41
6,2
07
4,7
87
2,3
10
256,9
00
Tota
l4,3
54,3
29
3,3
75,2
76
2,8
45,6
41
1,4
31,2
81
1,0
58,7
64
324,1
66
237,3
54
221,7
37
13,8
48,5
48
Me
mo
ran
du
m it
em
— p
aym
en
ts fo
r no
n-g
ove
rnm
en
t sc
ho
ols
inc
lud
ed
in p
aym
en
ts a
bo
ve
Natio
nal S
chools
SPP
2,4
86,7
32
2,0
69,4
22
1,6
87,0
91
861,1
66
632,9
74
174,0
39
152,9
86
110,4
82
8,1
74,8
92
Dig
ital E
ducatio
n R
evolu
tion
23,1
95
17,9
68
15,3
24
8,1
50
5,7
20
1,4
48
1,6
15
580
74,0
00
Natio
n B
uild
ing a
nd J
obs p
lan —
Build
ing the E
ducatio
n R
evolu
tion —
Prim
ary
schools
for
the 2
1st centu
ry -
- -
- -
- -
- -
Natio
nal S
ola
r S
chools
Pro
gra
m2,7
43
2,1
90
820
439
126
277
104
190
6,8
89
Schools
— s
upport
for
impro
vin
g le
arn
ing
experiences a
nd e
ducatio
nal o
utc
om
es
for
school s
tudents
with
dis
ability
(b)
6,0
10
4,2
37
3,1
72
1,9
06
1,0
08
279
279
95
16,9
86
Secure
Schools
Pro
gra
m2,0
56
1,7
18
513
470
44
-204
-5,0
05
Tra
de tra
inin
g c
entr
es in
schools
30,4
98
26,5
98
21,3
44
11,6
46
7,9
22
1,9
24
2,1
19
709
102,7
60
Tota
l2,5
51,2
34
2,1
22,1
33
1,7
28,2
64
883,7
77
647,7
94
177,9
67
157,3
07
112,0
56
8,3
80,5
32
N
ote:
T
he
data
in t
his
tabl
e ha
ve b
een
amen
ded
from
the
pub
lishe
d M
YE
FO
doc
umen
t. T
otal
exp
ense
s re
mai
n un
chan
ged.
A
min
or a
djus
tmen
t ha
s be
en m
ade
to t
he
S
tate
sha
res
of t
he N
atio
nal S
peci
fic P
urpo
se P
aym
ent.
(a)
Gov
ernm
ent
sch
ools
onl
y (n
on-
gove
rnm
ent
to b
e pr
ovid
ed).
(b
) Y
earl
y pr
ofile
s an
d S
tate
spl
its a
re in
dica
tive
dist
ribut
ions
onl
y.
(c)
Incl
udes
gov
ernm
ent a
nd n
on-g
over
nmen
t sch
oo
ls. T
he p
aym
ent
s to
non
-gov
ern
men
t sch
ools
are
not
sho
wn
in th
e M
emor
andu
m it
em.

Part
95
Part 3 – Fiscal Strategy and Outlook T
able
A.2
: E
stim
ated
pa
ymen
ts t
o s
up
po
rt s
tate
ed
uca
tio
n s
ervi
ces,
by
year
an
d S
tate
(co
nti
nu
ed)
$'0
00
NS
WV
ICQ
LD
WA
SA
TA
SA
CT
NT
To
tal
2013-1
4N
ati
on
al S
ch
oo
ls S
PP
4,0
47,5
33
3,2
33,7
88
2,7
49,6
89
1,3
80,3
03
987,0
22
294,0
36
230,5
21
183,8
37
13,1
06,7
29
Nati
on
al P
art
ne
rsh
ip p
aym
en
tsC
losin
g the G
ap in
the N
ort
hern
Terr
itory
Qualit
y teachin
g, accele
rate
d li
tera
cy
- -
- -
- -
- -
-S
upport
ing r
em
ote
schools
—additi
onal t
eachers
-
- -
- -
- -
- -
Teacher
housin
g -
- -
- -
- -
- -
Dig
ital E
ducatio
n R
evolu
tion
63,4
40
47,5
30
42,4
95
20,8
81
15,0
84
4,8
42
3,8
04
1,9
24
200,0
00
Early C
hild
hood E
ducatio
n —
univ
ers
al a
ccess to e
arly e
ducatio
n146,8
71
114,3
61
95,1
46
48,6
16
33,0
65
10,2
12
7,3
18
4,8
21
460,4
10
East K
imberley d
evelo
pm
ent packa
ge —
educatio
n-r
ela
ted p
roje
cts
- -
- -
- -
- -
-Educatio
n In
vestm
ent Fund
- -
- -
- -
- -
-Em
pow
ering L
ocal S
chools
(a)
- -
- -
- -
- -
-Fort
Str
eet H
igh S
chool n
ois
e in
sula
tion
- -
- -
- -
- -
-H
elp
ing O
ur
Kid
s U
nders
tand F
inances —
Pro
fessio
nal l
earn
ing a
nd
MoneyS
mart
schools
- -
- -
- -
- -
-In
dig
enous e
arly c
hild
hood d
evelo
pm
ent —
child
ren a
nd f
am
ily c
entr
es
13,4
90
3,2
46
7,9
97
8,9
00
4,1
92
1,6
90
1,1
10
5,5
30
46,1
55
Natio
n B
uild
ing a
nd J
obs p
lan —
Build
ing the E
ducatio
n R
evolu
tion —
Prim
ary
schools
for
the 2
1st centu
ry -
- -
- -
- -
- -
Natio
nal q
ualit
y a
genda f
or
early
child
hood e
ducatio
n a
nd c
are
8,4
74
4,6
28
1,4
68
881
2,2
97
280
212
840
19,0
80
Natio
nal S
ola
r S
chools
Pro
gra
m -
- -
- -
- -
- -
Rew
ard
for
School I
mpro
vem
ent(
a)
1,9
12
1,3
93
1,0
44
474
646
151
99
81
5,8
00
School P
ath
ways P
rogra
m -
- -
540
746
- -
-1,2
86

Part 3 – Fiscal Strategy and Outlook
96
Tab
le A
.2:
Est
imat
ed p
aym
ents
to
su
pp
ort
sta
te e
du
cati
on
ser
vice
s, b
y ye
ar a
nd
Sta
te (
con
tin
ued
) $'0
00
NS
WV
ICQ
LD
WA
SA
TA
SA
CT
NT
To
tal
2013-1
4S
chools
— s
upport
for
impro
vin
g le
arn
ing
experiences a
nd e
ducatio
nal o
utc
om
es
for
school s
tudents
with
dis
ability
(b)
12,5
48
9,5
30
8,1
47
4,0
22
2,8
90
919
676
441
39,1
73
Secure
Schools
Pro
gra
m2,0
56
1,7
18
513
470
44
-204
-5,0
05
Sm
art
er
Schools
Impro
vin
g teacher
qualit
y(c
) -
- -
- -
- -
- -
Lite
racy a
nd n
um
era
cy(c
) -
- -
- -
- -
- -
Low
SES
school c
om
muniti
es(c
)88,2
46
40,9
44
37,1
18
14,3
92
23,7
63
10,4
31
446
10,4
31
225,7
71
Tra
de tra
inin
g c
entr
es in
schools
68,0
34
54,8
52
47,8
16
24,0
69
17,2
59
5,2
99
4,2
02
1,9
69
223,5
00
Tota
l4,4
52,6
04
3,5
11,9
90
2,9
91,4
33
1,5
03,5
48
1,0
87,0
08
327,8
60
248,5
92
209,8
74
14,3
32,9
09
Me
mo
ran
du
m it
em
— p
aym
en
ts fo
r no
n-g
ove
rnm
en
t sc
ho
ols
inc
lud
ed
in p
aym
en
ts a
bo
ve
Natio
nal S
chools
SPP
2,6
55,0
27
2,2
31,7
82
1,8
44,4
82
943,2
36
680,2
84
187,6
10
165,5
70
122,4
18
8,8
30,4
09
Dig
ital E
ducatio
n R
evolu
tion
23,1
95
17,9
68
15,3
24
8,1
50
5,7
20
1,4
48
1,6
15
580
74,0
00
Natio
n B
uild
ing a
nd J
obs p
lan —
Build
ing the E
ducatio
n R
evolu
tion —
Prim
ary
schools
for
the 2
1st centu
ry -
- -
- -
- -
- -
Natio
nal S
ola
r S
chools
Pro
gra
m -
- -
- -
- -
- -
Schools
— s
upport
for
impro
vin
g le
arn
ing
experiences a
nd e
ducatio
nal o
utc
om
es
for
school s
tudents
with
dis
ability
(b)
3,0
04
2,1
18
1,5
86
953
504
140
139
48
8,4
92
Secure
Schools
Pro
gra
m2,0
56
1,7
18
513
470
44
-204
-5,0
05
Tra
de tra
inin
g c
entr
es in
schools
29,8
77
26,0
57
20,9
10
11,4
09
7,7
61
1,8
85
2,0
76
694
100,6
69
Tota
l2,7
13,1
59
2,2
79,6
43
1,8
82,8
15
964,2
18
694,3
13
191,0
83
169,6
04
123,7
40
9,0
18,5
75
N
ote:
T
he
data
in t
his
tabl
e ha
ve b
een
amen
ded
from
the
pub
lishe
d M
YE
FO
doc
umen
t. T
otal
exp
ense
s re
mai
n un
chan
ged.
A
min
or a
djus
tmen
t ha
s be
en m
ade
to t
he
S
tate
sha
res
of t
he N
atio
nal S
peci
fic P
urpo
se P
aym
ent.
(a)
Gov
ernm
ent
sch
ools
onl
y (n
on-
gove
rnm
ent
to b
e pr
ovid
ed).
(b
) Y
earl
y pr
ofile
s an
d S
tate
spl
its a
re in
dica
tive
dist
ribut
ions
onl
y.
(c)
Incl
udes
gov
ernm
ent a
nd n
on-g
over
nmen
t sch
oo
ls. T
he p
aym
ent
s to
non
-gov
ern
men
t sch
ools
are
not
sho
wn
in th
e M
emor
andu
m it
em.

Part
97
Part 3 – Fiscal Strategy and Outlook T
able
A.2
: E
stim
ated
pa
ymen
ts t
o s
up
po
rt s
tate
ed
uca
tio
n s
ervi
ces,
by
year
an
d S
tate
(co
nti
nu
ed)
$'0
00
NS
WV
ICQ
LD
WA
SA
TA
SA
CT
NT
To
tal
2014-1
5N
ati
on
al S
ch
oo
ls S
PP
4,3
41,4
86
3,4
85,0
25
2,9
93,9
49
1,4
96,6
03
1,0
55,7
93
312,5
23
249,0
92
194,4
79
14,1
28,9
50
Nati
on
al P
art
ne
rsh
ip p
aym
en
tsC
losin
g the G
ap in
the N
ort
hern
Terr
itory
Qualit
y teachin
g, accele
rate
d li
tera
cy
- -
- -
- -
- -
-S
upport
ing r
em
ote
schools
—additi
onal t
eachers
-
- -
- -
- -
- -
Teacher
housin
g -
- -
- -
- -
- -
Dig
ital E
ducatio
n R
evolu
tion
63,4
40
47,5
30
42,4
95
20,8
81
15,0
84
4,8
42
3,8
04
1,9
24
200,0
00
Early C
hild
hood E
ducatio
n —
univ
ers
al a
ccess to e
arly e
ducatio
n146,8
71
114,3
61
95,1
46
48,6
16
33,0
65
10,2
12
7,3
18
4,8
21
460,4
10
East K
imberley d
evelo
pm
ent packa
ge —
educatio
n-r
ela
ted p
roje
cts
- -
- -
- -
- -
-Educatio
n In
vestm
ent Fund
- -
- -
- -
- -
-Em
pow
ering L
ocal S
chools
(a)
- -
- -
- -
- -
-Fort
Str
eet H
igh S
chool n
ois
e in
sula
tion
- -
- -
- -
- -
-H
elp
ing O
ur
Kid
s U
nders
tand F
inances —
Pro
fessio
nal l
earn
ing a
nd
MoneyS
mart
schools
- -
- -
- -
- -
-In
dig
enous e
arly c
hild
hood d
evelo
pm
ent —
child
ren a
nd f
am
ily c
entr
es
- -
- -
- -
- -
-N
atio
n B
uild
ing a
nd J
obs p
lan —
Build
ing the E
ducatio
n R
evolu
tion —
Prim
ary
schools
for
the 2
1st centu
ry -
- -
- -
- -
- -
Natio
nal q
ualit
y a
genda f
or
early
child
hood e
ducatio
n a
nd c
are
8,4
15
4,5
77
1,4
68
881
2,3
70
280
212
877
19,0
80
Natio
nal S
ola
r S
chools
Pro
gra
m -
- -
- -
- -
- -
Rew
ard
for
School I
mpro
vem
ent(
a)
9,2
25
6,7
25
5,1
00
1,4
50
3,9
75
675
525
250
27,9
25
School P
ath
ways P
rogra
m -
- -
- -
- -
- -

Part 3 – Fiscal Strategy and Outlook
98
Tab
le A
.2:
Est
imat
ed p
aym
ents
to
su
pp
ort
sta
te e
du
cati
on
ser
vice
s, b
y ye
ar a
nd
Sta
te (
con
tin
ued
) $'0
00
NS
WV
ICQ
LD
WA
SA
TA
SA
CT
NT
To
tal
2014-1
5S
chools
— s
upport
for
impro
vin
g le
arn
ing
experiences a
nd e
ducatio
nal o
utc
om
es
for
school s
tudents
with
dis
ability
(b)
- -
- -
- -
- -
-S
ecure
Schools
Pro
gra
m -
- -
- -
- -
- -
Sm
art
er
Schools
Impro
vin
g teacher
qualit
y(c
) -
- -
- -
- -
- -
Lite
racy a
nd n
um
era
cy(c
) -
- -
- -
- -
- -
Low
SES
school c
om
muniti
es(c
)67,2
35
31,1
95
30,2
28
10,9
65
18,1
05
7,9
48
340
7,9
48
173,9
64
Tra
de tra
inin
g c
entr
es in
schools
77,3
09
62,2
76
54,3
36
27,3
28
19,6
08
6,0
32
4,7
68
2,2
43
253,9
00
Tota
l4,7
13,9
81
3,7
51,6
89
3,2
22,7
22
1,6
06,7
24
1,1
48,0
00
342,5
12
266,0
59
212,5
42
15,2
64,2
29
Me
mo
ran
du
m it
em
— p
aym
en
ts fo
r no
n-g
ove
rnm
en
t sc
ho
ols
inc
lud
ed
in p
aym
en
ts a
bo
ve
Natio
nal S
chools
SPP
2,8
66,3
50
2,4
09,5
96
1,9
91,8
76
1,0
18,5
06
734,5
46
202,5
49
178,9
01
132,0
48
9,5
34,3
72
Dig
ital E
ducatio
n R
evolu
tion
23,1
95
17,9
68
15,3
24
8,1
50
5,7
20
1,4
48
1,6
15
580
74,0
00
Natio
n B
uild
ing a
nd J
obs p
lan —
Build
ing the E
ducatio
n R
evolu
tion —
Prim
ary
schools
for
the 2
1st centu
ry -
- -
- -
- -
- -
Natio
nal S
ola
r S
chools
Pro
gra
m -
- -
- -
- -
- -
Schools
— s
upport
for
impro
vin
g le
arn
ing
experiences a
nd e
ducatio
nal o
utc
om
es
for
school s
tudents
with
dis
ability
(b)
- -
- -
- -
- -
-S
ecure
Schools
Pro
gra
m -
- -
- -
- -
- -
Tra
de tra
inin
g c
entr
es in
schools
33,4
86
29,2
04
23,4
35
12,7
88
8,6
99
2,1
12
2,3
26
778
112,8
28
Tota
l2,9
23,0
31
2,4
56,7
68
2,0
30,6
35
1,0
39,4
44
748,9
65
206,1
09
182,8
42
133,4
06
9,7
21,2
00
N
ote:
T
he
data
in t
his
tabl
e ha
ve b
een
amen
ded
from
the
pub
lishe
d M
YE
FO
doc
umen
t. T
otal
exp
ense
s re
mai
n un
chan
ged.
A
min
or a
djus
tmen
t ha
s be
en m
ade
to t
he
S
tate
sha
res
of t
he N
atio
nal S
peci
fic P
urpo
se P
aym
ent.
(a)
Gov
ernm
ent
sch
ools
onl
y (n
on-
gove
rnm
ent
to b
e pr
ovid
ed).
(b
) Y
earl
y pr
ofile
s an
d S
tate
spl
its a
re in
dica
tive
dist
ribut
ions
onl
y.
(c)
Incl
udes
gov
ernm
ent a
nd n
on-g
over
nmen
t sch
oo
ls. T
he p
aym
ent
s to
non
-gov
ern
men
t sch
ools
are
not
sho
wn
in th
e M
emor
andu
m it
em.

Part
99
Part 3 – Fiscal Strategy and Outlook T
able
A.3
: E
stim
ated
pa
ymen
ts t
o s
up
po
rt s
kills
& w
ork
forc
e d
evel
op
men
t se
rvic
es, b
y ye
ar a
nd
Sta
te
$'0
00
NS
WV
ICQ
LD
WA
SA
TA
SA
CT
NT
To
tal
2011-1
2N
ati
on
al S
kills
& W
ork
forc
eD
eve
lop
me
nt
SP
P447,9
89
338,1
41
269,0
07
138,2
91
101,3
78
31,4
31
22,7
94
14,1
01
1,3
63,1
32
Nati
on
al P
art
ne
rsh
ip p
aym
en
tsB
uild
ing A
ustr
alia
's F
utu
re W
ork
forc
e —
Vocatio
nal e
ducatio
n a
nd tra
inin
g -
- -
- -
- -
- -
Tra
inin
g p
laces f
or
sin
gle
and
teen p
are
nts
2,1
42
1,6
58
1,3
61
696
485
149
106
69
6,6
66
Natio
nal D
isaste
r Q
ueensla
nd —
Com
munity
Work
Pla
cem
ents
- -
4,7
50
- -
- -
-4,7
50
Pro
ductiv
ity P
laces P
rogra
m(a
)161,1
54
-98,6
88
50,2
56
36,9
68
14,9
38
8,5
28
5,3
31
375,8
63
TA
FE f
ee w
aiv
ers
for
child
care
qualif
icatio
ns
6,6
80
15,8
37
4,4
75
1,9
53
210
613
455
83
30,3
06
Youth
attain
ment and tra
nsiti
ons —
Maxim
isin
g e
ngagem
ent, a
ttain
ment and
successfu
l tra
nsiti
ons(b
)8,4
93
17,0
40
5,5
95
2,8
11
1,9
37
606
662
358
37,5
02
Year
12 a
ttain
ment and tra
nsiti
ons
16,2
89
12,3
96
10,0
28
5,0
80
3,7
32
1,1
58
804
513
50,0
00
Tota
l642,7
47
385,0
72
393,9
04
199,0
87
144,7
10
48,8
95
33,3
49
20,4
55
1,8
68,2
19
N
ote:
T
he
data
in t
his
tabl
e ha
ve b
een
amen
ded
from
the
pub
lishe
d M
YE
FO
doc
umen
t. T
otal
exp
ense
s re
mai
n un
chan
ged.
A
min
or a
djus
tmen
t ha
s be
en m
ade
to t
he
S
tate
sha
res
of t
he N
atio
nal S
peci
fic P
urpo
se P
aym
ent.
(a)
The
Pro
duc
tivity
Pla
ces
Pro
gram
will
exp
ire in
20
11-
12 a
nd w
ill b
e re
plac
ed b
y th
e B
uild
ing
Aus
tral
ia’s
Fut
ure
Wor
kfo
rce
— V
ocat
iona
l edu
catio
n an
d tr
aini
ng
initi
ativ
e an
d ot
her
mea
sure
s w
hich
the
Com
mon
we
alth
is d
eliv
erin
g in
par
tne
rshi
p w
ith in
dust
ry.
(b
) T
he a
mou
nt o
f fu
ndin
g pa
id to
Vic
toria
incl
udes
$43
mill
ion
acro
ss 2
011-
12 to
201
3-1
4 to
be
used
to im
plem
ent t
he s
choo
l bu
sine
ss c
omm
unity
par
tner
ship
bro
kers
pr
ogra
m th
rou
gh it
s lo
cal l
earn
ing
and
empl
oym
ent
netw
ork.

Part 3 – Fiscal Strategy and Outlook
100
Tab
le A
.3:
Est
imat
ed p
aym
ents
to
su
pp
ort
ski
lls &
wo
rkfo
rce
dev
elo
pm
ent
serv
ices
, by
year
an
d S
tate
(co
nti
nu
ed)
$'0
00
NS
WV
ICQ
LD
WA
SA
TA
SA
CT
NT
To
tal
2012-1
3N
ati
on
al S
kills
& W
ork
forc
eD
eve
lop
me
nt
SP
P453,5
86
345,7
34
278,0
54
142,7
80
102,5
72
31,7
17
22,9
92
14,3
91
1,3
91,8
26
Nati
on
al P
art
ne
rsh
ip p
aym
en
tsB
uild
ing A
ustr
alia
's F
utu
re W
ork
forc
e —
Vocatio
nal e
ducatio
n a
nd tra
inin
g76,5
94
59,3
04
48,6
69
24,8
55
17,3
13
5,3
32
3,8
20
2,4
64
238,3
51
Tra
inin
g p
laces f
or
sin
gle
and
teen p
are
nts
6,4
27
4,9
76
4,0
84
2,0
86
1,4
53
447
320
207
20,0
00
Natio
nal D
isaste
r Q
ueensla
nd —
Com
munity
Work
Pla
cem
ents
- -
- -
- -
- -
-Pro
ductiv
ity P
laces P
rogra
m -
- -
- -
- -
- -
TA
FE f
ee w
aiv
ers
for
child
care
qualif
icatio
ns
5,8
38
10,2
64
2,9
95
1,2
36
502
353
757
84
22,0
29
Youth
attain
ment and tra
nsiti
ons —
Maxim
isin
g e
ngagem
ent, a
ttain
ment and
successfu
l tra
nsiti
ons(a
)8,4
93
17,0
40
5,5
95
2,8
11
1,9
37
606
662
358
37,5
02
Year
12 a
ttain
ment and tra
nsiti
ons
- -
- -
- -
- -
-Tota
l550,9
38
437,3
18
339,3
97
173,7
68
123,7
77
38,4
55
28,5
51
17,5
04
1,7
09,7
08
N
ote:
T
he
data
in t
his
tabl
e ha
ve b
een
amen
ded
from
the
pub
lishe
d M
YE
FO
doc
umen
t. T
otal
exp
ense
s re
mai
n un
chan
ged.
A
min
or a
djus
tmen
t ha
s be
en m
ade
to t
he
S
tate
sha
res
of t
he N
atio
nal S
peci
fic P
urpo
se P
aym
ent.
(a)
The
am
ount
of f
und
ing
paid
to V
icto
ria in
clud
es $
43 m
illio
n ac
ross
201
1-12
to 2
013-
14
to b
e us
ed to
impl
emen
t the
sch
ool b
usin
ess
com
mun
ity p
artn
ersh
ip b
roke
rs
prog
ram
thro
ugh
its
loca
l lea
rnin
g an
d em
plo
ymen
t ne
twor
k.

Part
101
Part 3 – Fiscal Strategy and Outlook T
able
A.3
: E
stim
ated
pa
ymen
ts t
o s
up
po
rt s
kills
& w
ork
forc
e d
evel
op
men
t se
rvic
es, b
y ye
ar a
nd
Sta
te (
con
tin
ued
) $'0
00
NS
WV
ICQ
LD
WA
SA
TA
SA
CT
NT
To
tal
2013-1
4N
ati
on
al S
kills
& W
ork
forc
eD
eve
lop
me
nt
SP
P457,6
23
352,8
52
287,2
30
147,4
44
103,3
21
31,8
47
23,1
37
14,6
77
1,4
18,1
31
Nati
on
al P
art
ne
rsh
ip p
aym
en
tsB
uild
ing A
ustr
alia
's F
utu
re W
ork
forc
e —
Vocatio
nal e
ducatio
n a
nd tra
inin
g76,5
94
59,3
04
48,6
69
24,8
55
17,3
13
5,3
32
3,8
20
2,4
64
238,3
51
Tra
inin
g p
laces f
or
sin
gle
and
teen p
are
nts
8,5
69
6,6
35
5,4
45
2,7
81
1,9
37
597
427
276
26,6
67
Natio
nal D
isaste
r Q
ueensla
nd —
Com
munity
Work
Pla
cem
ents
- -
- -
- -
- -
-Pro
ductiv
ity P
laces P
rogra
m -
- -
- -
- -
- -
TA
FE f
ee w
aiv
ers
for
child
care
qualif
icatio
ns
6,0
26
10,5
96
3,0
92
1,2
76
519
365
781
86
22,7
41
Youth
attain
ment and tra
nsiti
ons —
Maxim
isin
g e
ngagem
ent, a
ttain
ment and
successfu
l tra
nsiti
ons(a
)4,2
46
8,5
20
2,7
98
1,4
06
968
303
331
179
18,7
51
Year
12 a
ttain
ment and tra
nsiti
ons
16,2
89
12,3
96
10,0
28
5,0
80
3,7
32
1,1
58
804
513
50,0
00
Tota
l569,3
47
450,3
03
357,2
62
182,8
42
127,7
90
39,6
02
29,3
00
18,1
95
1,7
74,6
41
N
ote:
T
he
data
in t
his
tabl
e ha
ve b
een
amen
ded
from
the
pub
lishe
d M
YE
FO
doc
umen
t. T
otal
exp
ense
s re
mai
n un
chan
ged.
A
min
or a
djus
tmen
t ha
s be
en m
ade
to t
he
S
tate
sha
res
of t
he N
atio
nal S
peci
fic P
urpo
se P
aym
ent.
(a)
The
am
oun
t of
fund
ing
paid
to V
icto
ria in
clud
es $
43 m
illio
n ac
ross
201
1-12
to 2
013
-14
to b
e us
ed to
impl
emen
t the
sch
ool b
usin
ess
com
mun
ity p
artn
ersh
ip b
roke
rs
prog
ram
thro
ugh
its
loca
l lea
rnin
g an
d em
plo
ymen
t ne
twor
k.

Part 3 – Fiscal Strategy and Outlook
102
Tab
le A
.3:
Est
imat
ed p
aym
ents
to
su
pp
ort
ski
lls &
wo
rkfo
rce
dev
elo
pm
ent
serv
ices
, by
year
an
d S
tate
(co
nti
nu
ed)
$'0
00
NS
WV
ICQ
LD
WA
SA
TA
SA
CT
NT
To
tal
2014-1
5N
ati
on
al S
kills
& W
ork
forc
eD
eve
lop
me
nt
SP
P461,3
08
360,4
07
297,2
53
152,6
56
103,8
98
31,9
03
23,2
89
15,0
00
1,4
45,7
14
Nati
on
al P
art
ne
rsh
ip p
aym
en
tsB
uild
ing A
ustr
alia
's F
utu
re W
ork
forc
e —
Vocatio
nal e
ducatio
n a
nd tra
inin
g76,5
94
59,3
04
48,6
69
24,8
55
17,3
13
5,3
32
3,8
20
2,4
64
238,3
51
Tra
inin
g p
laces f
or
sin
gle
and
teen p
are
nts
8,5
69
6,6
35
5,4
45
2,7
81
1,9
37
597
427
276
26,6
67
Natio
nal D
isaste
r Q
ueensla
nd —
Com
munity
Work
Pla
cem
ents
- -
- -
- -
- -
-Pro
ductiv
ity P
laces P
rogra
m -
- -
- -
- -
- -
TA
FE f
ee w
aiv
ers
for
child
care
qualif
icatio
ns
3,0
12
5,2
98
1,5
46
638
260
183
391
43
11,3
71
Youth
attain
ment and tra
nsiti
ons —
Maxim
isin
g e
ngagem
ent, a
ttain
ment and
successfu
l tra
nsiti
ons
- -
- -
- -
- -
-Y
ear
12 a
ttain
ment and tra
nsiti
ons
- -
- -
- -
- -
-Tota
l549,4
83
431,6
44
352,9
13
180,9
30
123,4
08
38,0
15
27,9
27
17,7
83
1,7
22,1
03

Part
103
Part 3 – Fiscal Strategy and Outlook
Tab
le A
.4:
Est
imat
ed p
aym
ents
to
su
pp
ort
sta
te c
om
mu
nit
y se
rvic
es, b
y ye
ar a
nd
Sta
te
$'0
00
NS
WV
ICQ
LD
WA
SA
TA
SA
CT
NT
To
tal
2011-1
2N
ati
on
al D
isab
ilit
y S
PP
396,4
09
284,5
75
237,2
59
109,8
59
113,9
89
34,9
96
17,9
49
12,6
04
1,2
07,6
40
Ch
an
ge
d r
ole
s a
nd
re
sp
on
sib
ilit
ies
—ad
jus
tme
nt
to a
ch
ieve
bu
dg
et
ne
utr
ality
(a)
17,5
31
-14,4
49
--3
1,8
10
-5,4
73
-554
2,1
37
-3,7
20
Nati
on
al P
art
ne
rsh
ip p
aym
en
tsTra
nsiti
onin
g r
esponsib
ilitie
s f
or
aged
care
and d
isability
serv
ices
Basic
com
munity
care
main
tenance
and s
upport
serv
ices
464,7
49
325,1
71
379,0
80
139,7
23
132,0
48
45,1
84
19,7
13
8,6
56
1,5
14,3
24
Specia
list dis
ability
serv
ices
55,4
56
-17,0
46
-41,6
82
5,6
83
785
4,6
40
125,2
92
Aged c
are
assessm
ent
29,2
10
22,9
89
15,1
70
8,7
11
9,2
26
2,2
70
1,0
49
1,2
50
89,8
75
Cert
ain
concessio
ns f
or
pensio
ners
and
senio
rs c
ard
hold
ers
Cert
ain
concessio
ns f
or
pensio
ners
88,5
31
63,2
91
44,1
96
22,2
55
25,1
80
8,0
83
1,7
99
1,2
32
254,5
67
Natio
nal r
ecip
rocal t
ransport
concessio
ns
6,6
21
1,8
34
4,2
42
454
410
126
190
81
13,9
58
Clo
sin
g the G
ap in
the N
ort
hern
Terr
itory
Com
munity
safe
ty —
fam
ily s
upport
- -
- -
- -
-5,4
76
5,4
76
Fie
ld o
pera
tions
- -
- -
- -
-4,2
78
4,2
78
Food s
ecurity
- -
- -
- -
-220
220
Rem
ote
polic
ing
- -
- -
- -
-54,5
48
54,5
48
Substa
nce a
buse
- -
- -
- -
-7,2
46
7,2
46
Hom
e a
nd C
om
munity
Care
— s
erv
ices
for
vete
rans
6,3
82
3,8
32
3,6
36
1,4
47
1,5
00
595
322
48
17,7
62
Tota
l1,0
64,8
89
701,6
92
715,0
78
282,4
49
292,2
25
91,4
64
41,2
53
102,4
16
3,2
91,4
66
N
ote:
T
he
data
in t
his
tabl
e ha
ve b
een
amen
ded
from
the
pub
lishe
d M
YE
FO
doc
umen
t. T
otal
exp
ense
s re
mai
n un
chan
ged.
A
min
or a
djus
tmen
t ha
s be
en m
ade
to t
he
S
tate
sha
res
of t
he N
atio
nal S
peci
fic P
urpo
se P
aym
ent.
(a)
Fro
m 2
011
-12,
the
Com
mon
wea
lth w
ill m
ake
an a
djus
tmen
t to
the
Nat
iona
l D
isab
ility
SP
P t
o en
sure
tha
t th
e ch
ange
s to
Com
mon
wea
lth a
nd S
tate
rol
es a
nd
resp
onsi
bilit
ies
for
aged
ca
re a
nd d
isab
ility
ser
vice
s ar
e bu
dget
neu
tral
. V
icto
ria a
nd W
este
rn A
ustr
alia
are
no
t pa
rtic
ipat
ing
in
thes
e ar
rang
em
ents
and
no
ad
just
men
t w
ill b
e m
ade
to th
e N
atio
nal D
isab
ility
SP
P fo
r th
ese
two
juris
dict
ions
.

Part 3 – Fiscal Strategy and Outlook
104
Tab
le A
.4:
Est
imat
ed p
aym
ents
to
su
pp
ort
sta
te c
om
mu
nit
y se
rvic
es, b
y ye
ar a
nd
Sta
te (
con
tin
ued
) $'0
00
NS
WV
ICQ
LD
WA
SA
TA
SA
CT
NT
To
tal
2012-1
3N
ati
on
al D
isab
ilit
y S
PP
415,1
32
306,9
22
252,8
73
123,1
62
109,2
63
33,7
39
19,6
05
13,3
65
1,2
74,0
61
Ch
an
ge
d r
ole
s a
nd
re
sp
on
sib
ilit
ies
—ad
jus
tme
nt
to a
ch
ieve
bu
dg
et
ne
utr
ality
(a)
13,8
85
-10,8
80
--3
4,1
88
-6,4
10
-884
2,3
95
-14,3
22
Nati
on
al P
art
ne
rsh
ip p
aym
en
tsTra
nsiti
onin
g r
esponsib
ilitie
s f
or
aged
care
and d
isability
serv
ices
Basic
com
munity
care
main
tenance
and s
upport
serv
ices
-351,4
33
-151,7
16
- -
- -
503,1
49
Specia
list dis
ability
serv
ices
57,2
05
-17,5
53
-43,1
95
6,0
05
786
4,8
00
129,5
44
Aged c
are
assessm
ent
2,9
44
2,1
17
1,5
28
877
782
229
95
115
8,6
87
Cert
ain
concessio
ns f
or
pensio
ners
and
senio
rs c
ard
hold
ers
Cert
ain
concessio
ns f
or
pensio
ners
92,9
85
66,4
70
46,4
15
23,3
74
26,4
44
8,4
91
1,8
89
1,2
93
267,3
61
Natio
nal r
ecip
rocal t
ransport
concessio
ns
4,0
05
3,1
04
2,5
69
1,3
11
903
279
199
130
12,5
00
Clo
sin
g the G
ap in
the N
ort
hern
Terr
itory
Com
munity
safe
ty —
fam
ily s
upport
- -
- -
- -
- -
-Fie
ld o
pera
tions
- -
- -
- -
- -
-Food s
ecurity
- -
- -
- -
- -
-R
em
ote
polic
ing
- -
- -
- -
- -
-S
ubsta
nce a
buse
- -
- -
- -
- -
-H
om
e a
nd C
om
munity
Care
— s
erv
ices
for
vete
rans
960
3,8
03
1,3
27
434
292
143
149
29
7,1
37
Tota
l587,1
16
733,8
49
333,1
45
300,8
74
146,6
91
42,4
76
21,8
39
22,1
27
2,1
88,1
17
N
ote:
T
he
data
in t
his
tabl
e ha
ve b
een
amen
ded
from
the
pub
lishe
d M
YE
FO
doc
umen
t. T
otal
exp
ense
s re
mai
n un
chan
ged.
A
min
or a
djus
tmen
t ha
s be
en m
ade
to t
he
S
tate
sha
res
of t
he N
atio
nal S
peci
fic P
urpo
se P
aym
ent.
(a)
Fro
m 2
011
-12,
the
Com
mon
wea
lth w
ill m
ake
an a
djus
tmen
t to
the
Nat
iona
l D
isab
ility
SP
P t
o en
sure
tha
t th
e ch
ange
s to
Com
mon
wea
lth a
nd S
tate
rol
es a
nd
resp
onsi
bilit
ies
for
aged
ca
re a
nd d
isab
ility
ser
vice
s ar
e bu
dget
neu
tral
. V
icto
ria a
nd W
este
rn A
ustr
alia
are
no
t pa
rtic
ipat
ing
in
thes
e ar
rang
em
ents
and
no
ad
just
men
t w
ill b
e m
ade
to th
e N
atio
nal D
isab
ility
SP
P fo
r th
ese
two
juris
dict
ions
.
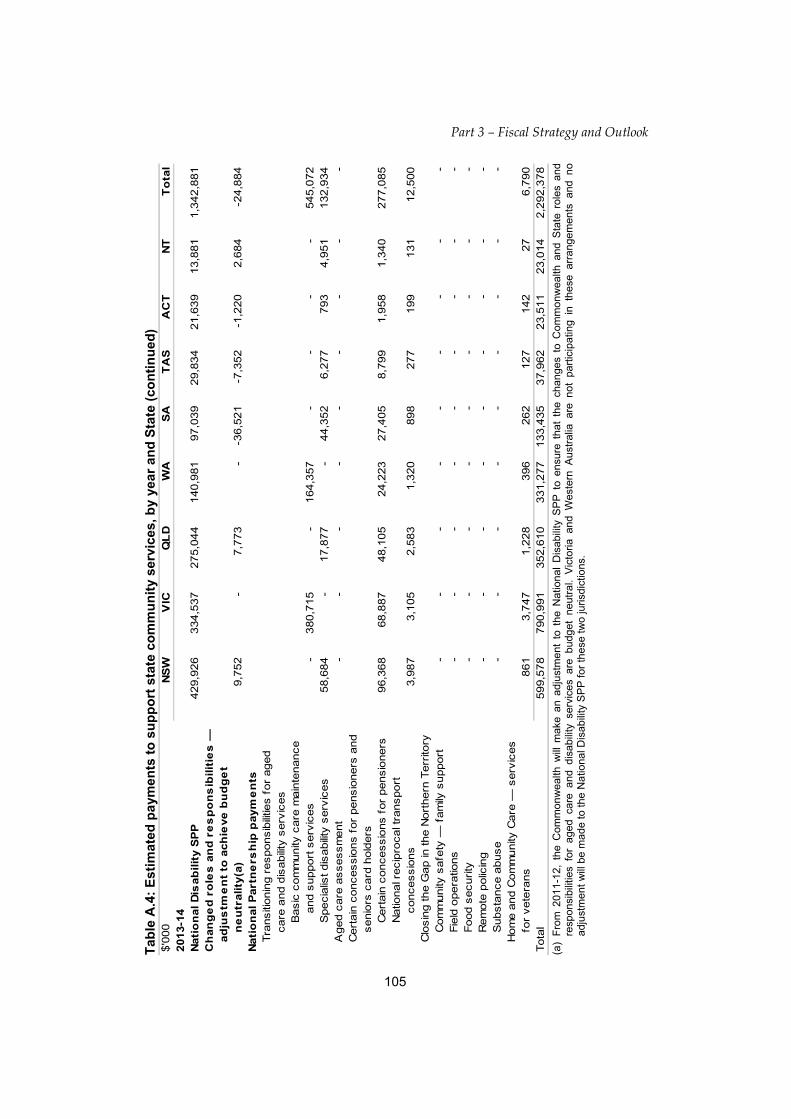
Part
105
Part 3 – Fiscal Strategy and Outlook T
able
A.4
: E
stim
ated
pa
ymen
ts t
o s
up
po
rt s
tate
co
mm
un
ity
serv
ices
, by
year
an
d S
tate
(co
nti
nu
ed)
$'0
00
NS
WV
ICQ
LD
WA
SA
TA
SA
CT
NT
To
tal
2013-1
4N
ati
on
al D
isab
ilit
y S
PP
429,9
26
334,5
37
275,0
44
140,9
81
97,0
39
29,8
34
21,6
39
13,8
81
1,3
42,8
81
Ch
an
ge
d r
ole
s a
nd
re
sp
on
sib
ilit
ies
—ad
jus
tme
nt
to a
ch
ieve
bu
dg
et
ne
utr
ality
(a)
9,7
52
-7,7
73
--3
6,5
21
-7,3
52
-1,2
20
2,6
84
-24,8
84
Nati
on
al P
art
ne
rsh
ip p
aym
en
tsTra
nsiti
onin
g r
esponsib
ilitie
s f
or
aged
care
and d
isability
serv
ices
Basic
com
munity
care
main
tenance
and s
upport
serv
ices
-380,7
15
-164,3
57
- -
- -
545,0
72
Specia
list dis
ability
serv
ices
58,6
84
-17,8
77
-44,3
52
6,2
77
793
4,9
51
132,9
34
Aged c
are
assessm
ent
- -
- -
- -
- -
-C
ert
ain
concessio
ns f
or
pensio
ners
and
senio
rs c
ard
hold
ers
Cert
ain
concessio
ns f
or
pensio
ners
96,3
68
68,8
87
48,1
05
24,2
23
27,4
05
8,7
99
1,9
58
1,3
40
277,0
85
Natio
nal r
ecip
rocal t
ransport
concessio
ns
3,9
87
3,1
05
2,5
83
1,3
20
898
277
199
131
12,5
00
Clo
sin
g the G
ap in
the N
ort
hern
Terr
itory
Com
munity
safe
ty —
fam
ily s
upport
- -
- -
- -
- -
-Fie
ld o
pera
tions
- -
- -
- -
- -
-Food s
ecurity
- -
- -
- -
- -
-R
em
ote
polic
ing
- -
- -
- -
- -
-S
ubsta
nce a
buse
- -
- -
- -
- -
-H
om
e a
nd C
om
munity
Care
— s
erv
ices
for
vete
rans
861
3,7
47
1,2
28
396
262
127
142
27
6,7
90
Tota
l599,5
78
790,9
91
352,6
10
331,2
77
133,4
35
37,9
62
23,5
11
23,0
14
2,2
92,3
78
(a
) F
rom
201
1-1
2, t
he C
omm
onw
ealth
will
mak
e an
adj
ustm
ent
to t
he N
atio
nal
Dis
abili
ty S
PP
to
ensu
re t
hat
the
chan
ges
to C
omm
onw
ealth
and
Sta
te r
oles
and
re
spon
sibi
litie
s fo
r ag
ed c
are
and
dis
abili
ty s
ervi
ces
are
budg
et n
eutr
al.
Vic
toria
and
Wes
tern
Aus
tral
ia a
re n
ot
part
icip
atin
g i
n th
ese
arra
nge
men
ts a
nd n
o
adju
stm
ent
will
be
mad
e to
the
Na
tiona
l Dis
abili
ty S
PP
for
thes
e tw
o ju
risdi
ctio
ns.

Part 3 – Fiscal Strategy and Outlook
106
Tab
le A
.4:
Est
imat
ed p
aym
ents
to
su
pp
ort
sta
te c
om
mu
nit
y se
rvic
es, b
y ye
ar a
nd
Sta
te (
con
tin
ued
) $'0
00
NS
WV
ICQ
LD
WA
SA
TA
SA
CT
NT
To
tal
2014-1
5N
ati
on
al D
isab
ilit
y S
PP
454,1
94
354,8
50
292,6
69
150,3
02
102,2
96
31,4
12
22,9
30
14,7
68
1,4
23,4
21
Ch
an
ge
d r
ole
s a
nd
re
sp
on
sib
ilit
ies
—ad
jus
tme
nt
to a
ch
ieve
bu
dg
et
ne
utr
ality
(a)
10,3
20
-8,2
87
--3
8,5
73
-7,7
57
-1,2
94
2,8
59
-26,1
58
Nati
on
al P
art
ne
rsh
ip p
aym
en
tsTra
nsiti
onin
g r
esponsib
ilitie
s f
or
aged
care
and d
isability
serv
ices
Basic
com
munity
care
main
tenance
and s
upport
serv
ices
-411,6
29
-177,7
03
- -
- -
589,3
32
Specia
list dis
ability
serv
ices
60,0
11
-18,0
92
-45,4
38
6,5
38
793
5,0
96
135,9
68
Aged c
are
assessm
ent
- -
- -
- -
- -
-C
ert
ain
concessio
ns f
or
pensio
ners
and
senio
rs c
ard
hold
ers
Cert
ain
concessio
ns f
or
pensio
ners
99,9
62
71,4
58
49,8
98
25,1
26
28,4
27
9,1
28
2,0
31
1,3
90
287,4
20
Natio
nal r
ecip
rocal t
ransport
concessio
ns
3,9
87
3,1
05
2,5
83
1,3
20
898
277
199
131
12,5
00
Clo
sin
g the G
ap in
the N
ort
hern
Terr
itory
Com
munity
safe
ty —
fam
ily s
upport
- -
- -
- -
- -
-Fie
ld o
pera
tions
- -
- -
- -
- -
-Food s
ecurity
- -
- -
- -
- -
-R
em
ote
polic
ing
- -
- -
- -
- -
-S
ubsta
nce a
buse
- -
- -
- -
- -
-H
om
e a
nd C
om
munity
Care
— s
erv
ices
for
vete
rans
861
3,7
45
1,2
29
397
263
127
142
27
6,7
91
Tota
l629,3
35
844,7
87
372,7
58
354,8
48
138,7
49
39,7
25
24,8
01
24,2
71
2,4
29,2
74
(a
) F
rom
201
1-1
2, t
he C
omm
onw
ealth
will
mak
e an
adj
ustm
ent
to t
he N
atio
nal
Dis
abili
ty S
PP
to
ensu
re t
hat
the
chan
ges
to C
omm
onw
ealth
and
Sta
te r
oles
and
re
spon
sibi
litie
s fo
r ag
ed c
are
and
dis
abili
ty s
ervi
ces
are
budg
et n
eutr
al.
Vic
toria
and
Wes
tern
Aus
tral
ia a
re n
ot
part
icip
atin
g i
n th
ese
arra
nge
men
ts a
nd n
o
adju
stm
ent
will
be
mad
e to
the
Na
tiona
l Dis
abili
ty S
PP
for
thes
e tw
o ju
risdi
ctio
ns.

Part
107
Part 3 – Fiscal Strategy and Outlook T
able
A.5
: E
stim
ated
pa
ymen
ts t
o s
up
po
rt s
tate
aff
ord
able
ho
usi
ng
ser
vic
es, b
y ye
ar a
nd
Sta
te
$'0
00
NS
WV
ICQ
LD
WA
SA
TA
SA
CT
NT
To
tal
2011-1
2N
ati
on
al A
ffo
rdab
le H
ou
sin
g S
PP
395,8
29
288,3
98
246,3
29
129,0
18
95,1
65
32,5
69
24,2
29
31,0
66
1,2
42,6
03
Nati
on
al P
art
ne
rsh
ip p
aym
en
tsB
uild
ing B
etter
Regio
nal C
ities(a
)~
~~
~~
~~
~30,0
00
East K
imberley d
evelo
pm
ent packa
ge —
Socia
l and tra
nsiti
onal h
ousin
g p
roje
cts
- -
-4,3
60
- -
- -
4,3
60
First H
om
e O
wners
Boost
5,5
25
13,3
47
1,5
31
918
848
432
1,3
43
103
24,0
47
Hom
ele
ssness
34,4
84
25,9
17
33,3
70
16,5
58
9,9
94
2,5
75
2,4
01
6,2
02
131,5
01
Natio
n B
uild
ing a
nd J
obs P
lan
Socia
l housin
g —
Second s
tage c
onstr
uctio
n -
63,7
96
39,5
23
20,0
21
30,7
09
4,5
64
1,3
65
2,0
22
162,0
00
Rem
ote
Indig
enous h
ousin
g(b
)~
~~
~~
~~
~759,1
43
Tota
l435,8
38
391,4
58
320,7
53
170,8
75
136,7
16
40,1
40
29,3
38
39,3
93
2,3
53,6
54
Mem
ora
ndum
ite
m —
paym
ents
dir
ect to
local gove
rnm
ents
inclu
ded in p
aym
ents
ab
ove
Build
ing B
etter
Regio
nal C
ities(a
)~
~~
~~
~~
~30,0
00
Tota
l~
~~
~~
~~
~30,0
00
2012-1
3N
ati
on
al A
ffo
rdab
le H
ou
sin
g S
PP
404,5
05
301,3
46
253,9
75
132,0
38
95,2
73
31,5
45
23,2
84
25,4
89
1,2
67,4
55
Nati
on
al P
art
ne
rsh
ip p
aym
en
tsB
uild
ing B
etter
Regio
nal C
ities(a
)~
~~
~~
~~
~35,0
00
East K
imberley d
evelo
pm
ent packa
ge —
Socia
l and tra
nsiti
onal h
ousin
g p
roje
cts
- -
- -
- -
- -
-First H
om
e O
wners
Boost
118
262
28
21
14
10
28
1482
Hom
ele
ssness
41,4
09
31,1
92
39,7
45
19,6
08
11,9
69
2,5
75
2,4
01
7,6
02
156,5
01
Natio
n B
uild
ing a
nd J
obs P
lan
Socia
l housin
g —
Second s
tage c
onstr
uctio
n -
- -
- -
- -
- -
Rem
ote
Indig
enous h
ousin
g(b
)~
~~
~~
~~
~303,2
08
Tota
l446,0
32
332,8
00
293,7
48
151,6
67
107,2
56
34,1
30
25,7
13
33,0
92
1,7
62,6
46
Mem
ora
ndum
ite
m —
paym
ents
dir
ect to
local gove
rnm
ents
inclu
ded in p
aym
ents
ab
ove
Build
ing B
etter
Regio
nal C
ities(a
)~
~~
~~
~~
~35,0
00
Tota
l~
~~
~~
~~
~35,0
00
N
ote:
T
he d
ata
in t
his
tabl
e ha
ve b
een
amen
ded
from
the
pub
lishe
d M
YE
FO
doc
umen
t. T
otal
exp
ense
s re
mai
n un
chan
ged.
A
min
or a
djus
tmen
t ha
s be
en m
ade
to t
he S
tate
sha
res
of t
he
Nat
iona
l Spe
cific
Pur
pose
Pay
men
t. (a
) S
tate
allo
catio
ns a
re y
et to
be
final
ised
. (b
) D
ue t
o th
e hi
gher
tha
n ex
pect
ed c
ompl
etio
n ra
tes,
Sta
tes
will
be
paid
for
ear
ly d
eliv
ery
of m
ilest
ones
. S
tate
spl
its a
re in
the
proc
ess
of b
eing
fina
lised
.

Part 3 – Fiscal Strategy and Outlook
108
Tab
le A
.5:
Est
imat
ed p
aym
ents
to
su
pp
ort
sta
te a
ffo
rdab
le h
ou
sin
g s
ervi
ces
, by
year
an
d S
tate
(co
nti
nu
ed)
$'0
00
NS
WV
ICQ
LD
WA
SA
TA
SA
CT
NT
To
tal
2013-1
4N
ati
on
al A
ffo
rdab
le H
ou
sin
g S
PP
412,0
14
314,1
69
261,7
23
135,1
76
94,9
55
30,3
30
22,2
45
19,6
57
1,2
90,2
69
Nati
on
al P
art
ne
rsh
ip p
aym
en
tsB
uild
ing B
etter
Regio
nal C
ities(a
)~
~~
~~
~~
~35,0
00
East K
imberley d
evelo
pm
ent packa
ge —
Socia
l and tra
nsiti
onal h
ousin
g p
roje
cts
- -
- -
- -
- -
-First H
om
e O
wners
Boost
- -
- -
- -
- -
-H
om
ele
ssness
- -
- -
- -
- -
-N
atio
n B
uild
ing a
nd J
obs P
lan
Socia
l housin
g —
Second s
tage c
onstr
uctio
n -
- -
- -
- -
- -
Rem
ote
Indig
enous h
ousin
g44,7
68
2,5
00
177,5
32
191,2
78
36,4
14
2,8
54
-55,7
32
511,0
78
Tota
l456,7
82
316,6
69
439,2
55
326,4
54
131,3
69
33,1
84
22,2
45
75,3
89
1,8
36,3
47
Mem
ora
ndum
ite
m —
paym
ents
dir
ect to
local gove
rnm
ents
inclu
ded in p
aym
ents
ab
ove
Build
ing B
etter
Regio
nal C
ities(a
)~
~~
~~
~~
~35,0
00
Tota
l~
~~
~~
~~
~35,0
00
2014-1
5N
ati
on
al A
ffo
rdab
le H
ou
sin
g S
PP
419,5
31
327,7
67
270,3
32
138,8
31
94,4
88
29,0
14
21,1
80
13,6
41
1,3
14,7
84
Nati
on
al P
art
ne
rsh
ip p
aym
en
tsB
uild
ing B
etter
Regio
nal C
ities
- -
- -
- -
- -
-East K
imberley d
evelo
pm
ent packa
ge —
Socia
l and tra
nsiti
onal h
ousin
g p
roje
cts
- -
- -
- -
- -
-First H
om
e O
wners
Boost
- -
- -
- -
- -
-H
om
ele
ssness
- -
- -
- -
- -
-N
atio
n B
uild
ing a
nd J
obs P
lan
Socia
l housin
g —
Second s
tage c
onstr
uctio
n -
- -
- -
- -
- -
Rem
ote
Indig
enous h
ousin
g60,6
54
2,5
00
155,5
91
165,6
49
27,7
62
2,4
64
-40,9
80
455,6
00
Tota
l480,1
85
330,2
67
425,9
23
304,4
80
122,2
50
31,4
78
21,1
80
54,6
21
1,7
70,3
84
Mem
ora
ndum
ite
m —
paym
ents
dir
ect to
local gove
rnm
ents
inclu
ded in p
aym
ents
ab
ove
Build
ing B
etter
Regio
nal C
ities
- -
- -
- -
- -
-Tota
l -
- -
- -
- -
- -
N
ote:
T
he d
ata
in t
his
tabl
e ha
ve b
een
amen
ded
from
the
pub
lishe
d M
YE
FO
doc
umen
t. T
otal
exp
ense
s re
mai
n un
chan
ged.
A
min
or a
djus
tmen
t ha
s be
en m
ade
to t
he S
tate
sha
res
of t
he
Nat
iona
l Spe
cific
Pur
pose
Pay
men
t. (a
) S
tate
allo
catio
ns a
re y
et to
be
final
ised
.

Part
109
Part 3 – Fiscal Strategy and Outlook
Tab
le A
.6:
Est
imat
ed p
aym
ents
to
su
pp
ort
sta
te in
fras
tru
ctu
re s
ervi
ces,
by
year
an
d S
tate
$'0
00
NS
WV
ICQ
LD
WA
SA
TA
SA
CT
NT
To
tal
2011-1
2N
ati
on
al P
art
ne
rsh
ip p
aym
en
tsC
ente
nary
of
Canberr
a 2
013 —
a g
ift to
the n
atio
nal c
apita
l -
- -
- -
-27,0
00
-27,0
00
East K
imberley d
evelo
pm
ent packa
ge —
oth
er
infr
astr
uctu
re p
roje
cts
- -
-3,0
75
- -
- -
3,0
75
Inte
rsta
te r
oad tra
nsport
39,2
66
22,8
48
8,0
90
3,3
81
10,3
02
426
426
426
85,1
65
Local G
overn
ment and R
egio
nal D
evelo
pm
ent
Infr
astr
uctu
re e
mplo
ym
ent pro
jects
-2,0
00
3,1
39
6,5
00
-10,0
00
- -
21,6
39
Natio
n B
uild
ing P
rogra
mIn
vestm
ent
Rail
94,4
00
7,2
85
-495
-27,9
00
- -
130,0
80
Road
1,5
25,3
71
545,4
92
1,1
43,2
32
292,9
97
382,0
04
28,0
18
479
53,2
07
3,9
70,8
00
Bla
ck
spot pro
jects
24,0
99
17,5
66
17,0
78
7,4
85
4,7
00
1,6
06
966
1,0
00
74,5
00
Off
-netw
ork
pro
jects
Rail
-10,0
65
30,0
00
40,0
00
-6,1
00
- -
86,1
65
Road
24,1
67
20,3
56
53,7
49
18,1
27
-10,3
09
4,5
00
13,0
40
144,2
48
Supple
menta
ry(a
)3,4
17
6,6
98
7,0
66
14,1
76
150
254
- -
31,7
61
Impro
vin
g the n
atio
nal n
etw
ork
(a)
- -
7,0
23
4,8
14
2,6
89
- -
-14,5
26
Heavy v
ehic
le s
afe
ty a
nd p
roductiv
ity6,1
00
3,4
00
6,2
00
1,4
02
4,1
40
1,0
00
40
400
22,6
82
Roads to R
ecovery
97,5
16
71,2
19
71,2
00
51,2
00
31,4
80
11,4
00
5,6
00
10,2
00
349,8
15
Impro
vin
g lo
cal r
oads(a
) -
- -
-1,0
28
- -
-1,0
28
Natio
n B
uild
ing P
lan f
or
the F
utu
reM
ajo
r C
ities
Rail
- -
-60,6
00
- -
- -
60,6
00
Build
ing A
ustr
alia
Fund
Rail
-468,0
00
- -
311,2
00
- -
-779,2
00
Road
1,0
48,0
00
- -
- -
-9,5
00
-1,0
57,5
00
Nort
h P
enrith
Thorn
ton P
ark
Car
Park
2,0
00
- -
- -
- -
-2,0
00
Regio
nal a
nd L
ocal C
om
munity
Infr
astr
uctu
re P
rogra
m32,6
10
29,0
22
13,7
32
6,1
97
5,2
22
1,6
41
1,0
52
24
89,5
00

Part 3 – Fiscal Strategy and Outlook
110
Tab
le A
.6:
Est
imat
ed p
aym
ents
to
su
pp
ort
sta
te in
fras
tru
ctu
re s
ervi
ces,
by
year
an
d S
tate
(co
nti
nu
ed)
$'0
00
NS
WV
ICQ
LD
WA
SA
TA
SA
CT
NT
To
tal
2011-1
2R
egio
nal I
nfr
astr
uctu
re F
und
Str
eam
1 —
Com
mitt
ed in
frastr
uctu
repro
jects
- -
104,0
00
7,4
00
- -
- -
111,4
00
Str
eam
2 —
Econom
ic in
frastr
uctu
repro
jects
- -
- -
- -
- -
-S
tream
3 —
Regio
nal D
evelo
pm
ent
Austr
alia
Fund
- -
- -
- -
- -
-S
eam
less N
atio
nal E
conom
yN
atio
nal H
eavy V
ehic
les T
ransport
Regula
tor
- -
1,8
00
- -
- -
-1,8
00
Natio
nal R
ail
Tra
nsport
Safe
tyR
egula
tor
- -
- -
1,4
00
- -
-1,4
00
Supple
menta
ry r
oad f
undin
g to
South
Austr
alia
for
local r
oads
- -
- -
16,2
32
- -
-16,2
32
Susta
inable
Austr
alia
Liv
eable
citi
es(b
)3,2
12
2,4
89
2,0
40
1,0
44
727
224
161
103
10,0
00
Managed m
oto
rways(b
)6,4
10
4,9
67
4,0
70
2,0
82
1,4
50
446
322
205
19,9
52
Tow
nsville C
onventio
n a
nd E
nte
rtain
ment
Centr
e -
- -
- -
- -
- -
Tota
l2,9
06,5
68
1,2
11,4
07
1,4
72,4
19
520,9
75
772,7
24
99,3
24
50,0
46
78,6
05
7,1
12,0
68

Part
111
Part 3 – Fiscal Strategy and Outlook
Tab
le A
.6:
Est
imat
ed p
aym
ents
to
su
pp
ort
sta
te in
fras
tru
ctu
re s
ervi
ces,
by
year
an
d S
tate
(co
nti
nu
ed)
$'0
00
NS
WV
ICQ
LD
WA
SA
TA
SA
CT
NT
To
tal
2011-1
2M
em
ora
nd
um
ite
m —
pa
ym
en
ts d
ire
ct t
o lo
ca
l go
vern
me
nts
inc
lud
ed
in p
aym
en
ts a
bo
ve
East K
imberley d
evelo
pm
ent packa
ge —
oth
er
infr
astr
uctu
re p
roje
cts
- -
-1,6
25
- -
- -
1,6
25
Local G
overn
ment and R
egio
nal D
evelo
pm
ent
Infr
astr
uctu
re e
mplo
ym
ent pro
jects
-2,0
00
139
- -
- -
-2,1
39
Natio
n B
uild
ing P
rogra
mO
ff-n
etw
ork
pro
jects
Rail
-3,3
50
- -
- -
- -
3,3
50
Road
8,6
00
-50,0
00
4,6
27
- -
- -
63,2
27
Supple
menta
ry3,4
17
6,6
98
7,0
66
14,1
76
150
254
- -
31,7
61
Roads to R
ecovery
96,8
00
71,2
00
71,2
00
51,2
00
24,1
40
11,4
00
-5,6
00
331,5
40
Nort
h P
enrith
Thorn
ton P
ark
Car
Park
2,0
00
- -
- -
- -
-2,0
00
Regio
nal a
nd L
ocal C
om
munity
Infr
astr
uctu
re P
rogra
m32,6
10
29,0
22
13,7
32
6,1
97
5,2
22
1,6
41
1,0
52
24
89,5
00
Susta
inable
Austr
alia
Liv
eable
citi
es
3,2
12
2,4
89
2,0
40
1,0
44
727
224
161
103
10,0
00
Tow
nsville C
onventio
n a
nd E
nte
rtain
ment
Centr
e -
- -
- -
- -
- -
Tota
l146,6
39
114,7
59
144,1
77
78,8
69
30,2
39
13,5
19
1,2
13
5,7
27
535,1
42
(a
) F
igur
es r
epre
sen
t exp
ense
s in
curr
ed a
gain
st p
repa
ymen
ts m
ade
to t
he S
tate
s in
prio
r ye
ars.
(b
) Y
earl
y p
rofil
es a
nd S
tate
spl
its a
re in
dica
tive
dist
ribut
ions
onl
y an
d ha
ve b
een
allo
cate
d on
an
equa
l per
cap
ita b
asis
to a
ll S
tate
s.

Part 3 – Fiscal Strategy and Outlook
112
Tab
le A
.6:
Est
imat
ed p
aym
ents
to
su
pp
ort
sta
te in
fras
tru
ctu
re s
ervi
ces,
by
year
an
d S
tate
(co
nti
nu
ed)
$'0
00
NS
WV
ICQ
LD
WA
SA
TA
SA
CT
NT
To
tal
2012-1
3N
ati
on
al P
art
ne
rsh
ip p
aym
en
tsC
ente
nary
of
Canberr
a 2
013 —
a g
ift to
the n
atio
nal c
apita
l -
- -
- -
-25,0
00
-25,0
00
East K
imberley d
evelo
pm
ent packa
ge —
oth
er
infr
astr
uctu
re p
roje
cts
- -
- -
- -
- -
-In
ters
tate
road tra
nsport
41,2
30
23,9
91
8,4
95
3,5
50
10,8
16
447
447
447
89,4
23
Local G
overn
ment and R
egio
nal D
evelo
pm
ent
Infr
astr
uctu
re e
mplo
ym
ent pro
jects
- -
- -
- -
- -
-N
atio
n B
uild
ing P
rogra
mIn
vestm
ent
Rail
235,6
00
- -
12,8
50
-38,9
47
- -
287,3
97
Road
397,7
98
351,7
04
583,4
08
357,7
64
56,5
12
19,6
77
479
48,6
93
1,8
16,0
35
Bla
ck
spot pro
jects
19,0
99
13,5
66
12,0
78
6,4
85
4,7
00
1,6
06
966
1,0
00
59,5
00
Off
-netw
ork
pro
jects
Rail
-17,7
50
20,0
00
33,0
00
-6,2
72
- -
77,0
22
Road
52,8
00
42,9
02
2,0
50
25,0
00
-7,3
00
-4,0
00
134,0
52
Supple
menta
ry -
- -
- -
- -
- -
Impro
vin
g the n
atio
nal n
etw
ork
- -
- -
- -
- -
-H
eavy v
ehic
le s
afe
ty a
nd p
roductiv
ity -
- -
- -
- -
- -
Roads to R
ecovery
97,5
16
71,2
19
71,2
00
51,2
00
31,4
80
11,4
00
5,6
00
10,2
00
349,8
15
Impro
vin
g lo
cal r
oads
- -
- -
- -
- -
-N
atio
n B
uild
ing P
lan f
or
the F
utu
reM
ajo
r C
ities
Rail
- -
-101,2
00
- -
- -
101,2
00
Build
ing A
ustr
alia
Fund
Rail
-542,0
00
- -
58,4
00
- -
-600,4
00
Road
290,0
00
-400,0
00
- -
- -
-690,0
00
Nort
h P
enrith
Thorn
ton P
ark
Car
Park
- -
- -
- -
- -
-R
egio
nal a
nd L
ocal C
om
munity
Infr
astr
uctu
re P
rogra
m -
- -
- -
- -
- -

Part
113
Part 3 – Fiscal Strategy and Outlook
Tab
le A
.6:
Est
imat
ed p
aym
ents
to
su
pp
ort
sta
te in
fras
tru
ctu
re s
ervi
ces,
by
year
an
d S
tate
(co
nti
nu
ed)
$'0
00
NS
WV
ICQ
LD
WA
SA
TA
SA
CT
NT
To
tal
2012-1
3R
egio
nal I
nfr
astr
uctu
re F
und
Str
eam
1 —
Com
mitt
ed in
frastr
uctu
repro
jects
- -
24,0
00
53,3
00
- -
- -
77,3
00
Str
eam
2 —
Econom
ic in
frastr
uctu
repro
jects
(a)
~~
~~
~~
~~
300,0
01
Str
eam
3 —
Regio
nal D
evelo
pm
ent
Austr
alia
Fund
- -
- -
- -
- -
-S
eam
less N
atio
nal E
conom
yN
atio
nal H
eavy V
ehic
les T
ransport
Regula
tor
- -
998
- -
- -
-998
Natio
nal R
ail
Tra
nsport
Safe
tyR
egula
tor
- -
- -
602
- -
-602
Supple
menta
ry r
oad f
undin
g to
South
Austr
alia
for
local r
oads
- -
- -
16,9
85
- -
-16,9
85
Susta
inable
Austr
alia
Liv
eable
citi
es(b
)3,2
02
2,4
91
2,0
48
1,0
50
723
222
161
103
10,0
00
Managed m
oto
rways(b
)6,4
17
4,9
94
4,1
06
2,1
05
1,4
49
445
323
207
20,0
46
Tow
nsville C
onventio
n a
nd E
nte
rtain
ment
Centr
e -
-10,0
00
- -
- -
-10,0
00
Tota
l1,1
43,6
62
1,0
70,6
17
1,1
38,3
83
647,5
04
181,6
67
86,3
16
32,9
76
64,6
50
4,6
65,7
76

Part 3 – Fiscal Strategy and Outlook
114
Tab
le A
.6:
Est
imat
ed p
aym
ents
to
su
pp
ort
sta
te in
fras
tru
ctu
re s
ervi
ces,
by
year
an
d S
tate
(co
nti
nu
ed)
$'0
00
NS
WV
ICQ
LD
WA
SA
TA
SA
CT
NT
To
tal
2012-1
3M
em
ora
nd
um
ite
m —
pa
ym
en
ts d
ire
ct t
o lo
ca
l go
vern
me
nts
inc
lud
ed
in p
aym
en
ts a
bo
ve
East K
imberley d
evelo
pm
ent packa
ge —
oth
er
infr
astr
uctu
re p
roje
cts
- -
- -
- -
- -
-Local G
overn
ment and R
egio
nal D
evelo
pm
ent
Infr
astr
uctu
re e
mplo
ym
ent pro
jects
- -
- -
- -
- -
-N
atio
n B
uild
ing P
rogra
mO
ff-n
etw
ork
pro
jects
Rail
-750
- -
- -
- -
750
Road
5,3
50
- -
5,0
00
- -
- -
10,3
50
Supple
menta
ry -
- -
- -
- -
- -
Roads to R
ecovery
96,8
00
71,2
00
71,2
00
51,2
00
24,1
40
11,4
00
-5,6
00
331,5
40
Nort
h P
enrith
Thorn
ton P
ark
Car
Park
- -
- -
- -
- -
-R
egio
nal a
nd L
ocal C
om
munity
Infr
astr
uctu
re P
rogra
m -
- -
- -
- -
- -
Susta
inable
Austr
alia
Liv
eable
citi
es
3,2
02
2,4
91
2,0
48
1,0
50
723
222
161
103
10,0
00
Tow
nsville C
onventio
n a
nd E
nte
rtain
ment
Centr
e -
-10,0
00
- -
- -
-10,0
00
Tota
l105,3
52
74,4
41
83,2
48
57,2
50
24,8
63
11,6
22
161
5,7
03
362,6
40
(a
) S
tate
allo
catio
ns fo
r th
is s
trea
m a
re y
et to
be
final
ised
. (b
) Y
earl
y p
rofil
es a
nd S
tate
spl
its a
re in
dica
tive
dist
ribut
ions
onl
y an
d ha
ve b
een
allo
cate
d on
an
equa
l per
cap
ita b
asis
to a
ll S
tate
s.

Part
115
Part 3 – Fiscal Strategy and Outlook
Tab
le A
.6:
Est
imat
ed p
aym
ents
to
su
pp
ort
sta
te in
fras
tru
ctu
re s
ervi
ces,
by
year
an
d S
tate
(co
nti
nu
ed)
$'0
00
NS
WV
ICQ
LD
WA
SA
TA
SA
CT
NT
To
tal
2013-1
4N
ati
on
al P
art
ne
rsh
ip p
aym
en
tsC
ente
nary
of
Canberr
a 2
013 —
a g
ift to
the n
atio
nal c
apita
l -
- -
- -
-5,0
00
-5,0
00
East K
imberley d
evelo
pm
ent packa
ge —
oth
er
infr
astr
uctu
re p
roje
cts
- -
- -
- -
- -
-In
ters
tate
road tra
nsport
43,2
93
25,1
91
8,9
19
3,7
27
11,3
57
469
469
469
93,8
94
Local G
overn
ment and R
egio
nal D
evelo
pm
ent
Infr
astr
uctu
re e
mplo
ym
ent pro
jects
- -
40,0
00
- -
- -
-40,0
00
Natio
n B
uild
ing P
rogra
mIn
vestm
ent
Rail
233,8
00
- -
12,8
06
-19,8
80
- -
266,4
86
Road
946,5
13
505,3
62
882,8
66
307,2
33
84,0
35
11,7
25
477
80,4
72
2,8
18,6
83
Bla
ck
spot pro
jects
22,2
45
12,6
04
7,0
78
9,2
27
4,7
00
1,8
36
966
844
59,5
00
Off
-netw
ork
pro
jects
Rail
-25,7
50
83,0
00
32,0
00
- -
- -
140,7
50
Road
14,3
19
68,2
22
-29,1
68
-14,0
22
-4,0
07
129,7
38
Supple
menta
ry -
- -
- -
- -
- -
Impro
vin
g the n
atio
nal n
etw
ork
- -
- -
- -
- -
-H
eavy v
ehic
le s
afe
ty a
nd p
roductiv
ity -
- -
- -
- -
- -
Roads to R
ecovery
106,5
52
73,7
22
65,8
60
51,2
23
27,8
50
11,8
36
560
12,0
81
349,6
84
Impro
vin
g lo
cal r
oads
- -
- -
- -
- -
-N
atio
n B
uild
ing P
lan f
or
the F
utu
reM
ajo
r C
ities
Rail
- -
-37,0
00
- -
- -
37,0
00
Build
ing A
ustr
alia
Fund
Rail
-858,0
00
- -
- -
- -
858,0
00
Road
41,0
00
- -
- -
-50,0
00
-91,0
00
Nort
h P
enrith
Thorn
ton P
ark
Car
Park
- -
- -
- -
- -
-R
egio
nal a
nd L
ocal C
om
munity
Infr
astr
uctu
re P
rogra
m -
- -
- -
- -
- -
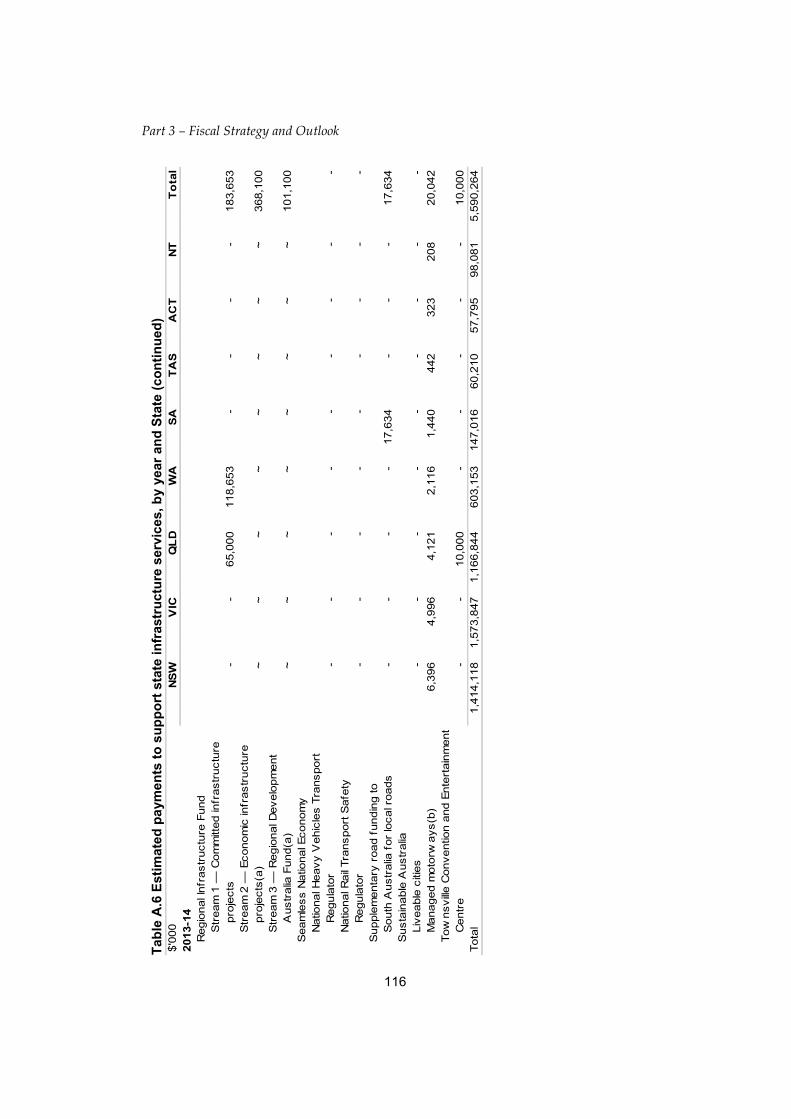
Part 3 – Fiscal Strategy and Outlook
116
Tab
le A
.6 E
stim
ated
pa
ymen
ts t
o s
up
po
rt s
tate
infr
astr
uct
ure
ser
vice
s, b
y ye
ar a
nd
Sta
te (
con
tin
ued
) $'0
00
NS
WV
ICQ
LD
WA
SA
TA
SA
CT
NT
To
tal
2013-1
4R
egio
nal I
nfr
astr
uctu
re F
und
Str
eam
1 —
Com
mitt
ed in
frastr
uctu
repro
jects
- -
65,0
00
118,6
53
- -
- -
183,6
53
Str
eam
2 —
Econom
ic in
frastr
uctu
repro
jects
(a)
~~
~~
~~
~~
368,1
00
Str
eam
3 —
Regio
nal D
evelo
pm
ent
Austr
alia
Fund(a
)~
~~
~~
~~
~101,1
00
Seam
less N
atio
nal E
conom
yN
atio
nal H
eavy V
ehic
les T
ransport
Regula
tor
- -
- -
- -
- -
-N
atio
nal R
ail
Tra
nsport
Safe
tyR
egula
tor
- -
- -
- -
- -
-S
upple
menta
ry r
oad f
undin
g to
South
Austr
alia
for
local r
oads
- -
- -
17,6
34
- -
-17,6
34
Susta
inable
Austr
alia
Liv
eable
citi
es
- -
- -
- -
- -
-M
anaged m
oto
rways(b
)6,3
96
4,9
96
4,1
21
2,1
16
1,4
40
442
323
208
20,0
42
Tow
nsville C
onventio
n a
nd E
nte
rtain
ment
Centr
e -
-10,0
00
- -
- -
-10,0
00
Tota
l1,4
14,1
18
1,5
73,8
47
1,1
66,8
44
603,1
53
147,0
16
60,2
10
57,7
95
98,0
81
5,5
90,2
64

Part
117
Part 3 – Fiscal Strategy and Outlook
Tab
le A
.6 E
stim
ated
pa
ymen
ts t
o s
up
po
rt s
tate
infr
astr
uct
ure
ser
vice
s, b
y ye
ar a
nd
Sta
te (
con
tin
ued
) $'0
00
NS
WV
ICQ
LD
WA
SA
TA
SA
CT
NT
To
tal
2013-1
4M
em
ora
nd
um
ite
m —
pa
ym
en
ts d
ire
ct t
o lo
ca
l go
vern
me
nts
inc
lud
ed
in p
aym
en
ts a
bo
ve
East K
imberley d
evelo
pm
ent packa
ge —
oth
er
infr
astr
uctu
re p
roje
cts
- -
- -
- -
- -
-Local G
overn
ment and R
egio
nal D
evelo
pm
ent
Infr
astr
uctu
re e
mplo
ym
ent pro
jects
- -
40,0
00
- -
- -
-40,0
00
Natio
n B
uild
ing P
rogra
mO
ff-n
etw
ork
pro
jects
Rail
-750
- -
- -
- -
750
Road
3,4
00
- -
3,5
84
- -
- -
6,9
84
Supple
menta
ry -
- -
- -
- -
- -
Roads to R
ecovery
105,1
20
73,6
89
65,8
60
51,2
23
20,8
86
11,8
36
-7,1
72
335,7
86
Nort
h P
enrith
Thorn
ton P
ark
Car
Park
- -
- -
- -
- -
-R
egio
nal a
nd L
ocal C
om
munity
Infr
astr
uctu
re P
rogra
m -
- -
- -
- -
- -
Susta
inable
Austr
alia
Liv
eable
citi
es
- -
- -
- -
- -
-Tow
nsville C
onventio
n a
nd E
nte
rtain
ment
Centr
e -
-10,0
00
- -
- -
-10,0
00
Tota
l108,5
20
74,4
39
115,8
60
54,8
07
20,8
86
11,8
36
-7,1
72
393,5
20
(a
) S
tate
allo
catio
ns fo
r th
is s
trea
m a
re y
et to
be
final
ised
. (b
) Y
earl
y p
rofil
es a
nd S
tate
spl
its a
re in
dica
tive
dist
ribut
ions
onl
y an
d ha
ve b
een
allo
cate
d on
an
equa
l per
cap
ita b
asis
to a
ll S
tate
s.

Part 3 – Fiscal Strategy and Outlook
118
Tab
le A
.6 E
stim
ated
pa
ymen
ts t
o s
up
po
rt s
tate
infr
astr
uct
ure
ser
vice
s, b
y ye
ar a
nd
Sta
te (
con
tin
ued
) $'0
00
NS
WV
ICQ
LD
WA
SA
TA
SA
CT
NT
To
tal
2014-1
5N
ati
on
al P
art
ne
rsh
ip p
aym
en
tsC
ente
nary
of
Canberr
a 2
013 —
a g
ift to
the n
atio
nal c
apita
l -
- -
- -
-5,0
00
-5,0
00
East K
imberley d
evelo
pm
ent packa
ge —
oth
er
infr
astr
uctu
re p
roje
cts
- -
- -
- -
- -
-In
ters
tate
road tra
nsport
45,4
55
26,4
50
9,3
65
3,9
14
11,9
25
493
493
493
98,5
88
Local G
overn
ment and R
egio
nal D
evelo
pm
ent
Infr
astr
uctu
re e
mplo
ym
ent pro
jects
- -
- -
- -
- -
-N
atio
n B
uild
ing P
rogra
m(a
)In
vestm
ent
Rail
150,0
00
- -
- -
- -
-150,0
00
Road
-40,0
00
136,3
00
- -
- -
-176,3
00
Bla
ck
spot pro
jects
- -
- -
- -
- -
-O
ff-n
etw
ork
pro
jects
Rail
- -
- -
- -
- -
-R
oad
- -
- -
- -
- -
-S
upple
menta
ry -
- -
- -
- -
- -
Impro
vin
g the n
atio
nal n
etw
ork
- -
- -
- -
- -
-H
eavy v
ehic
le s
afe
ty a
nd p
roductiv
ity -
- -
- -
- -
- -
Roads to R
ecovery
- -
- -
- -
- -
-Im
pro
vin
g lo
cal r
oads
- -
- -
- -
- -
-N
atio
n B
uild
ing P
lan f
or
the F
utu
reM
ajo
r C
ities
Rail
- -
- -
- -
- -
-B
uild
ing A
ustr
alia
Fund
Rail
-500,0
00
- -
- -
- -
500,0
00
Road
- -
- -
- -
64,5
00
-64,5
00
Nort
h P
enrith
Thorn
ton P
ark
Car
Park
- -
- -
- -
- -
-R
egio
nal a
nd L
ocal C
om
munity
Infr
astr
uctu
re P
rogra
m -
- -
- -
- -
- -

Part
119
Part 3 – Fiscal Strategy and Outlook
Tab
le A
.6 E
stim
ated
pa
ymen
ts t
o s
up
po
rt s
tate
infr
astr
uct
ure
ser
vice
s, b
y ye
ar a
nd
Sta
te (
con
tin
ued
) $'0
00
NS
WV
ICQ
LD
WA
SA
TA
SA
CT
NT
To
tal
2014-1
5R
egio
nal I
nfr
astr
uctu
re F
und
Str
eam
1 —
Com
mitt
ed in
frastr
uctu
repro
jects
- -
- -
- -
- -
-S
tream
2 —
Econom
ic in
frastr
uctu
repro
jects
(b)
~~
~~
~~
~~
665,5
00
Str
eam
3 —
Regio
nal D
evelo
pm
ent
Austr
alia
Fund(b
)~
~~
~~
~~
~279,2
00
Seam
less N
atio
nal E
conom
yN
atio
nal H
eavy V
ehic
les T
ransport
Regula
tor
- -
- -
- -
- -
-N
atio
nal R
ail
Tra
nsport
Safe
tyR
egula
tor
- -
- -
- -
- -
-S
upple
menta
ry r
oad f
undin
g to
South
Austr
alia
for
local r
oads
- -
- -
- -
- -
-S
usta
inable
Austr
alia
Liv
eable
citi
es
- -
- -
- -
- -
-M
anaged m
oto
rways
- -
- -
- -
- -
-Tow
nsville C
onventio
n a
nd E
nte
rtain
ment
Centr
e -
-10,0
00
- -
- -
-10,0
00
Tota
l195,4
55
566,4
50
155,6
65
3,9
14
11,9
25
493
69,9
93
493
1,9
49,0
88

Part 3 – Fiscal Strategy and Outlook
120
Tab
le A
.6 E
stim
ated
pa
ymen
ts t
o s
up
po
rt s
tate
infr
astr
uct
ure
ser
vice
s, b
y ye
ar a
nd
Sta
te (
con
tin
ued
) $'0
00
NS
WV
ICQ
LD
WA
SA
TA
SA
CT
NT
To
tal
2014-1
5M
em
ora
nd
um
ite
m —
pa
ym
en
ts d
ire
ct t
o lo
ca
l go
vern
me
nts
inc
lud
ed
in p
aym
en
ts a
bo
ve
East K
imberley d
evelo
pm
ent packa
ge —
oth
er
infr
astr
uctu
re p
roje
cts
- -
- -
- -
- -
-Local G
overn
ment and R
egio
nal D
evelo
pm
ent
Infr
astr
uctu
re e
mplo
ym
ent pro
jects
- -
- -
- -
- -
-N
atio
n B
uild
ing P
rogra
mO
ff-n
etw
ork
pro
jects
Rail
- -
- -
- -
- -
-R
oad
- -
- -
- -
- -
-S
upple
menta
ry -
- -
- -
- -
- -
Roads to R
ecovery
- -
- -
- -
- -
-N
ort
h P
enrith
Thorn
ton P
ark
Car
Park
- -
- -
- -
- -
-R
egio
nal a
nd L
ocal C
om
munity
Infr
astr
uctu
re P
rogra
m -
- -
- -
- -
- -
Susta
inable
Austr
alia
Liv
eable
citi
es
- -
- -
- -
- -
-Tow
nsville C
onventio
n a
nd E
nte
rtain
ment
Centr
e -
-10,0
00
- -
- -
-10,0
00
Tota
l -
-10,0
00
- -
- -
-10,0
00
(a
) N
atio
n B
uild
ing
Pro
gram
2 w
ill c
omm
ence
in 2
014
-15.
Pro
visi
on fo
r th
is h
as b
een
mad
e in
the
cont
inge
ncy
rese
rve.
(b
) S
tate
allo
catio
ns fo
r th
is s
trea
m a
re y
et to
be
final
ised
.

Part
121
Part 3 – Fiscal Strategy and Outlook
Tab
le A
.7:
Est
imat
ed p
aym
ents
to
su
pp
ort
sta
te e
nvi
ron
men
t se
rvic
es, b
y ye
ar a
nd
Sta
te
$'0
00
NS
WV
ICQ
LD
WA
SA
TA
SA
CT
NT
To
tal
2011-1
2N
ati
on
al P
art
ne
rsh
ip p
aym
en
tsA
ssessm
ent of
impacts
of
coal s
eam
gas a
nd
larg
e c
oal d
evelo
pm
ents
(a)
~~
~~
~~
~~
10,0
00
Caring f
or
our
Countr
y35,2
51
27,5
20
23,0
20
24,1
03
17,3
46
11,1
14
1,3
59
3,6
87
143,4
00
Environm
enta
l managem
ent of
the
form
er
Rum
Jungle
min
e s
ite -
- -
- -
- -
2,4
00
2,4
00
Exotic
Dis
ease P
repare
dness P
rogra
m241
36
7,5
01
36
15
10
10
15
7,8
64
Gre
at A
rtesia
n B
asin
Susta
inability
Initi
ativ
e8,0
00
-9,0
00
-792
- -
-17,7
92
Imple
menta
tion o
f th
e T
asm
ania
n F
ore
sts
In
terg
overn
menta
l Agre
em
ent
- -
- -
-50,0
00
- -
50,0
00
Natu
ral d
isaste
r re
covery
and r
ebuild
ing
relie
f appeals
— C
om
monw
ealth
contr
ibutio
ns
- -
1,0
76
- -
- -
-1,0
76
Natu
ral d
isaste
r re
silience
6,6
82
4,1
28
5,9
20
3,0
84
2,0
59
5,5
40
1,2
85
1,2
90
29,9
88
Pla
nt dis
ease a
nd e
radic
atio
n207
800
802
470
1,2
50
- -
-3,5
29
Renew
able
rem
ote
pow
er
genera
tion
120
- -
4,7
65
880
117
-3,3
61
9,2
43
Wate
r fo
r th
e F
utu
reN
atio
nal U
rban W
ate
r and D
esalin
atio
n P
lan
-7,5
00
-1,4
00
226,3
00
- -
-235,2
00
Natio
nal W
ate
r S
ecurity
Pla
n f
or
Citi
es a
nd T
ow
ns
30,0
57
5,0
00
19,9
83
11,1
79
6,1
60
3,6
91
-20,2
50
96,3
20
Susta
inable
Rura
l Wate
r U
se a
nd In
frastr
uctu
re71,9
76
174,2
53
18,5
96
6,1
86
40,4
16
27,5
96
187
778
339,9
88
Tota
l152,5
34
219,2
37
85,8
98
51,2
23
295,2
18
98,0
68
2,8
41
31,7
81
946,8
00
Mem
ora
ndum
ite
m —
paym
ents
dir
ect to
local gove
rnm
ents
inclu
ded in p
aym
ents
ab
ove
Wate
r fo
r th
e F
utu
reN
atio
nal U
rban W
ate
r and D
esalin
atio
n P
lan
- -
- -
3,9
00
- -
-3,9
00
Natio
nal W
ate
r S
ecurity
Pla
n f
or
Citi
es a
nd T
ow
ns
28,8
07
-4,4
63
2,0
00
1,1
55
3,6
91
- -
40,1
16
Susta
inable
Rura
l Wate
r U
se a
nd In
frastr
uctu
re3,6
16
- -
- -
- -
-3,6
16
Tota
l32,4
23
-4,4
63
2,0
00
5,0
55
3,6
91
- -
47,6
32
(a
) S
tate
allo
catio
ns a
re y
et to
be
final
ised
.
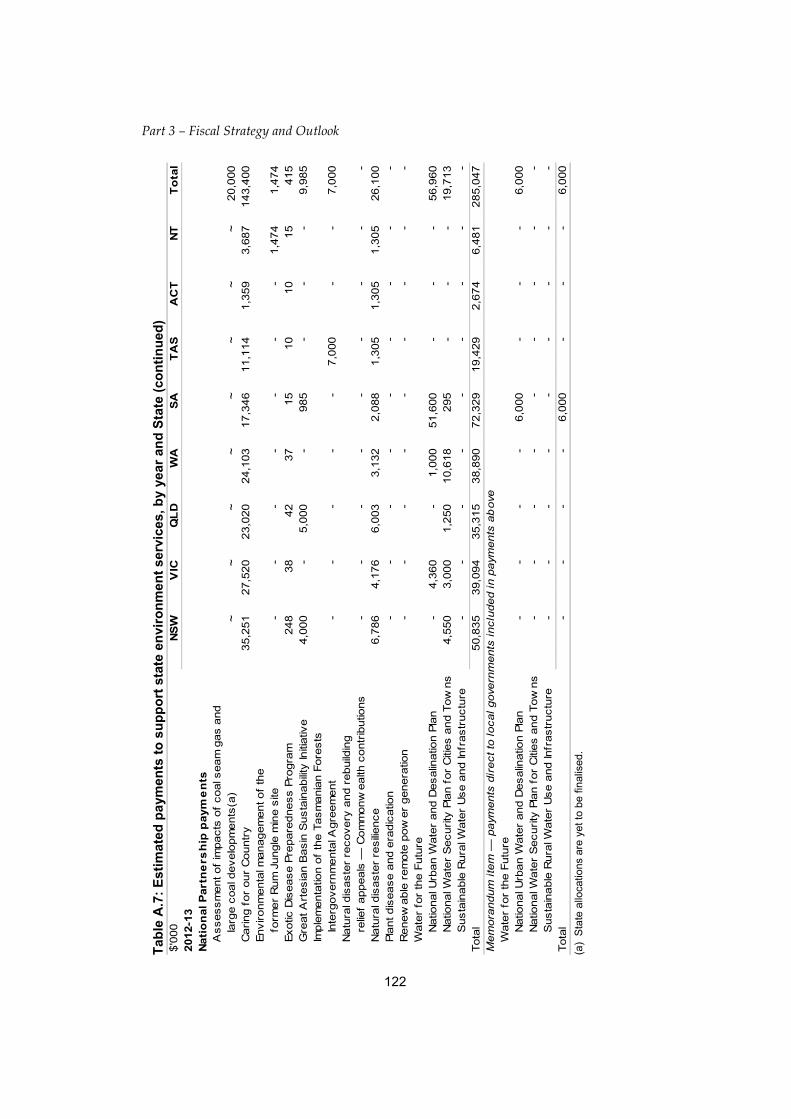
Part 3 – Fiscal Strategy and Outlook
122
Tab
le A
.7:
Est
imat
ed p
aym
ents
to
su
pp
ort
sta
te e
nvi
ron
men
t se
rvic
es, b
y ye
ar a
nd
Sta
te (
con
tin
ued
) $'0
00
NS
WV
ICQ
LD
WA
SA
TA
SA
CT
NT
To
tal
2012-1
3N
ati
on
al P
art
ne
rsh
ip p
aym
en
tsA
ssessm
ent of
impacts
of
coal s
eam
gas a
nd
larg
e c
oal d
evelo
pm
ents
(a)
~~
~~
~~
~~
20,0
00
Caring f
or
our
Countr
y35,2
51
27,5
20
23,0
20
24,1
03
17,3
46
11,1
14
1,3
59
3,6
87
143,4
00
Environm
enta
l managem
ent of
the
form
er
Rum
Jungle
min
e s
ite -
- -
- -
- -
1,4
74
1,4
74
Exotic
Dis
ease P
repare
dness P
rogra
m248
38
42
37
15
10
10
15
415
Gre
at A
rtesia
n B
asin
Susta
inability
Initi
ativ
e4,0
00
-5,0
00
-985
- -
-9,9
85
Imple
menta
tion o
f th
e T
asm
ania
n F
ore
sts
In
terg
overn
menta
l Agre
em
ent
- -
- -
-7,0
00
- -
7,0
00
Natu
ral d
isaste
r re
covery
and r
ebuild
ing
relie
f appeals
— C
om
monw
ealth
contr
ibutio
ns
- -
- -
- -
- -
-N
atu
ral d
isaste
r re
silience
6,7
86
4,1
76
6,0
03
3,1
32
2,0
88
1,3
05
1,3
05
1,3
05
26,1
00
Pla
nt dis
ease a
nd e
radic
atio
n -
- -
- -
- -
- -
Renew
able
rem
ote
pow
er
genera
tion
- -
- -
- -
- -
-W
ate
r fo
r th
e F
utu
reN
atio
nal U
rban W
ate
r and D
esalin
atio
n P
lan
-4,3
60
-1,0
00
51,6
00
- -
-56,9
60
Natio
nal W
ate
r S
ecurity
Pla
n f
or
Citi
es a
nd T
ow
ns
4,5
50
3,0
00
1,2
50
10,6
18
295
- -
-19,7
13
Susta
inable
Rura
l Wate
r U
se a
nd In
frastr
uctu
re -
- -
- -
- -
- -
Tota
l50,8
35
39,0
94
35,3
15
38,8
90
72,3
29
19,4
29
2,6
74
6,4
81
285,0
47
Mem
ora
ndum
ite
m —
paym
ents
dir
ect to
local gove
rnm
ents
inclu
ded in p
aym
ents
ab
ove
Wate
r fo
r th
e F
utu
reN
atio
nal U
rban W
ate
r and D
esalin
atio
n P
lan
- -
- -
6,0
00
- -
-6,0
00
Natio
nal W
ate
r S
ecurity
Pla
n f
or
Citi
es a
nd T
ow
ns
- -
- -
- -
- -
-S
usta
inable
Rura
l Wate
r U
se a
nd In
frastr
uctu
re -
- -
- -
- -
- -
Tota
l -
- -
-6,0
00
- -
-6,0
00
(a
) S
tate
allo
catio
ns a
re y
et to
be
final
ised
.

Part
123
Part 3 – Fiscal Strategy and Outlook
Tab
le A
.7:
Est
imat
ed p
aym
ents
to
su
pp
ort
sta
te e
nvi
ron
men
t se
rvic
es, b
y ye
ar a
nd
Sta
te (
con
tin
ued
) $'0
00
NS
WV
ICQ
LD
WA
SA
TA
SA
CT
NT
To
tal
2013-1
4N
ati
on
al P
art
ne
rsh
ip p
aym
en
tsA
ssessm
ent of
impacts
of
coal s
eam
gas a
nd
larg
e c
oal d
evelo
pm
ents
(a)
~~
~~
~~
~~
20,0
00
Caring f
or
our
Countr
y -
- -
- -
- -
- -
Environm
enta
l managem
ent of
the
form
er
Rum
Jungle
min
e s
ite -
- -
- -
- -
- -
Exotic
Dis
ease P
repare
dness P
rogra
m257
38
42
37
15
10
10
15
424
Gre
at A
rtesia
n B
asin
Susta
inability
Initi
ativ
e14,8
00
-24,4
00
-1,5
85
- -
-40,7
85
Imple
menta
tion o
f th
e T
asm
ania
n F
ore
sts
In
terg
overn
menta
l Agre
em
ent
- -
- -
-7,0
00
- -
7,0
00
Natu
ral d
isaste
r re
covery
and r
ebuild
ing
relie
f appeals
— C
om
monw
ealth
contr
ibutio
ns
- -
- -
- -
- -
-N
atu
ral d
isaste
r re
silience
6,7
86
4,1
76
6,0
03
3,1
32
2,0
88
1,3
05
1,3
05
1,3
05
26,1
00
Pla
nt dis
ease a
nd e
radic
atio
n -
- -
- -
- -
- -
Renew
able
rem
ote
pow
er
genera
tion
- -
- -
- -
- -
-W
ate
r fo
r th
e F
utu
reN
atio
nal U
rban W
ate
r and D
esalin
atio
n P
lan
-5,5
90
- -
- -
- -
5,5
90
Natio
nal W
ate
r S
ecurity
Pla
n f
or
Citi
es a
nd T
ow
ns
600
1,0
00
1,0
34
400
- -
- -
3,0
34
Susta
inable
Rura
l Wate
r U
se a
nd In
frastr
uctu
re -
- -
- -
- -
- -
Tota
l22,4
43
10,8
04
31,4
79
3,5
69
3,6
88
8,3
15
1,3
15
1,3
20
102,9
33
Mem
ora
ndum
ite
m —
paym
ents
dir
ect to
local gove
rnm
ents
inclu
ded in p
aym
ents
ab
ove
Wate
r fo
r th
e F
utu
reN
atio
nal U
rban W
ate
r and D
esalin
atio
n P
lan
- -
- -
- -
- -
-N
atio
nal W
ate
r S
ecurity
Pla
n f
or
Citi
es a
nd T
ow
ns
- -
- -
- -
- -
-S
usta
inable
Rura
l Wate
r U
se a
nd In
frastr
uctu
re -
- -
- -
- -
- -
Tota
l -
- -
- -
- -
- -
(a
) S
tate
allo
catio
ns a
re y
et to
be
final
ised
.

Part 3 – Fiscal Strategy and Outlook
124
Tab
le A
.7:
Est
imat
ed p
aym
ents
to
su
pp
ort
sta
te e
nvi
ron
men
t se
rvic
es, b
y ye
ar a
nd
Sta
te (
con
tin
ued
) $'0
00
NS
WV
ICQ
LD
WA
SA
TA
SA
CT
NT
To
tal
2014-1
5N
ati
on
al P
art
ne
rsh
ip p
aym
en
tsA
ssessm
ent of
impacts
of
coal s
eam
gas a
nd
larg
e c
oal d
evelo
pm
ents
- -
- -
- -
- -
-C
aring f
or
our
Countr
y -
- -
- -
- -
- -
Environm
enta
l managem
ent of
the
form
er
Rum
Jungle
min
e s
ite -
- -
- -
- -
- -
Exotic
Dis
ease P
repare
dness P
rogra
m264
32
37
37
16
10
20
15
431
Gre
at A
rtesia
n B
asin
Susta
inability
Initi
ativ
e -
- -
- -
- -
- -
Imple
menta
tion o
f th
e T
asm
ania
n F
ore
sts
In
terg
overn
menta
l Agre
em
ent
- -
- -
-7,0
00
- -
7,0
00
Natu
ral d
isaste
r re
covery
and r
ebuild
ing
relie
f appeals
— C
om
monw
ealth
contr
ibutio
ns
- -
- -
- -
- -
-N
atu
ral d
isaste
r re
silience
6,7
86
4,1
76
6,0
03
3,1
32
2,0
88
1,3
05
1,3
05
1,3
05
26,1
00
Pla
nt dis
ease a
nd e
radic
atio
n -
- -
- -
- -
- -
Renew
able
rem
ote
pow
er
genera
tion
- -
- -
- -
- -
-W
ate
r fo
r th
e F
utu
reN
atio
nal U
rban W
ate
r and D
esalin
atio
n P
lan
-1,5
50
- -
- -
- -
1,5
50
Natio
nal W
ate
r S
ecurity
Pla
n f
or
Citi
es a
nd T
ow
ns
- -
- -
- -
- -
-S
usta
inable
Rura
l Wate
r U
se a
nd In
frastr
uctu
re -
- -
- -
- -
- -
Tota
l7,0
50
5,7
58
6,0
40
3,1
69
2,1
04
8,3
15
1,3
25
1,3
20
35,0
81
Mem
ora
ndum
ite
m —
paym
ents
dir
ect to
local gove
rnm
ents
inclu
ded in p
aym
ents
ab
ove
Wate
r fo
r th
e F
utu
reN
atio
nal U
rban W
ate
r and D
esalin
atio
n P
lan
- -
- -
- -
- -
-N
atio
nal W
ate
r S
ecurity
Pla
n f
or
Citi
es a
nd T
ow
ns
- -
- -
- -
- -
-S
usta
inable
Rura
l Wate
r U
se a
nd In
frastr
uctu
re -
- -
- -
- -
- -
Tota
l -
- -
- -
- -
- -

Part
125
Part 3 – Fiscal Strategy and Outlook
Tab
le A
.8:
Est
imat
ed c
on
tin
gen
t p
aym
ents
to
th
e S
tate
s, b
y ye
ar a
nd
Sta
te
$'0
00
NS
WV
ICQ
LD
WA
SA
TA
SA
CT
NT
To
tal
2011-1
2N
ati
on
al P
art
ne
rsh
ip p
aym
en
tsExceptio
nal C
ircum
sta
nces A
ssis
tance
6,5
42
- -
-9,1
72
- -
-15,7
14
Hepatit
is C
settle
ment fu
nd
1,1
06
- -
42
154
-42
56
1,4
00
Natu
ral d
isaste
r re
covery
and r
ebuild
ing(a
)15,6
97
132,2
06
351,2
11
10,4
33
117
249
14,6
56
-13,7
82
510,7
87
Tota
l23,3
45
132,2
06
351,2
11
10,4
75
9,4
43
249
14,6
98
-13,7
26
527,9
01
2012-1
3N
ati
on
al P
art
ne
rsh
ip p
aym
en
tsExceptio
nal C
ircum
sta
nces A
ssis
tance
- -
- -
- -
- -
-H
epatit
is C
settle
ment fu
nd
- -
- -
- -
- -
-N
atu
ral d
isaste
r re
covery
and r
ebuild
ing(a
)5,5
48
-1,5
70
78,1
44
4,7
48
96
138
-409
87,5
13
Tota
l5,5
48
-1,5
70
78,1
44
4,7
48
96
138
-409
87,5
13
2013-1
4N
ati
on
al P
art
ne
rsh
ip p
aym
en
tsExceptio
nal C
ircum
sta
nces A
ssis
tance
- -
- -
- -
- -
-H
epatit
is C
settle
ment fu
nd
- -
- -
- -
- -
-N
atu
ral d
isaste
r re
covery
and r
ebuild
ing(a
)5,7
42
-1,6
25
80,8
73
4,8
67
594
-141
90,0
97
Tota
l5,7
42
-1,6
25
80,8
73
4,8
67
594
-141
90,0
97
2014-1
5N
ati
on
al P
art
ne
rsh
ip p
aym
en
tsExceptio
nal C
ircum
sta
nces A
ssis
tance
- -
- -
- -
- -
-H
epatit
is C
settle
ment fu
nd
- -
- -
- -
- -
-N
atu
ral d
isaste
r re
covery
and r
ebuild
ing(a
)2
-35,3
04
831
3 -
- -
36,1
40
Tota
l2
-35,3
04
831
3 -
- -
36,1
40
(a
) N
atur
al
disa
ster
re
cove
ry
and
rebu
ildin
g re
late
s to
re
imbu
rsem
ents
m
ade
und
er
the
Nat
ura
l D
isas
ter
Rel
ief
and
Rec
over
y A
rra
ngem
ents
(N
DR
RA
).
The
C
omm
onw
ealth
rec
ogni
ses
a lia
bilit
y eq
ual t
o th
e pr
esen
t va
lue
of f
utur
e pa
ymen
ts e
xpec
ted
to b
e m
ade
to t
he S
tate
s un
der
the
ND
RR
A.
The
est
imat
ed e
xpen
ses
in t
he t
able
abo
ve r
efle
ct t
he ‘u
nw
indi
ng o
f th
e di
scou
nt’ o
n th
e p
rovi
sion
, w
hich
ref
lect
s th
e tim
e va
lue
of m
one
y. T
he
cash
est
imat
es f
or t
he N
DR
RA
are
pre
sent
ed
in T
able
3.2
5.

Part 3 – Fiscal Strategy and Outlook
126
Tab
le A
.9:
Est
imat
ed p
aym
ents
to
su
pp
ort
oth
er s
tate
ser
vice
s, b
y ye
ar a
nd
Sta
te
$'0
00
NS
WV
ICQ
LD
WA
SA
TA
SA
CT
NT
To
tal
2011-1
2N
ati
on
al P
art
ne
rsh
ip p
aym
en
tsC
ente
nary
of
Canberr
a 2
013 —
join
t natio
nal p
rogra
m -
- -
- -
-2,6
00
-2,6
00
Com
monw
ealth
Heads o
f G
overn
ment
Meetin
g 2
011
- -
-43,3
00
- -
- -
43,3
00
Crim
Tra
c p
olic
e r
efe
rence s
yste
m391
224
457
524
787
388
384
565
3,7
20
Dig
ital R
egio
ns In
itiativ
e7,1
35
2,2
45
3,5
63
922
3,1
76
2,2
78
-2,4
75
21,7
94
Dig
ital R
egio
ns In
itiativ
e —
local
govern
ment
-99
- -
- -
- -
99
Fin
ancia
l assis
tance g
rants
506,1
32
380,4
65
319,5
04
191,2
84
109,4
58
51,6
70
33,9
41
23,0
76
1,6
15,5
30
Legal a
ssis
tance s
erv
ices
61,5
98
43,6
44
40,4
84
19,5
83
15,4
34
5,8
36
4,3
55
3,8
50
194,7
84
Local G
overn
ment and R
egio
nal
Develo
pm
ent
Local G
overn
ment R
efo
rm F
und
2,4
37
863
1,1
07
999
1,7
34
1,1
55
295
1,1
93
9,7
83
Pilo
t of
dro
ught re
form
measure
s in
W
este
rn A
ustr
alia
- -
-16,7
82
- -
- -
16,7
82
Rem
ote
Indig
enous p
ublic
inte
rnet
access
144
-344
692
142
- -
691
2,0
13
Seam
less N
atio
nal E
conom
y64,2
13
49,5
54
41,0
10
20,6
83
14,7
25
4,5
33
3,2
20
2,0
62
200,0
00
Sin
king f
und o
n S
tate
debt
25
1 -
-2
- -
-28
World S
ailing C
ham
pio
nship
s -
- -
3,6
00
- -
- -
3,6
00
Tota
l642,0
75
477,0
95
406,4
69
298,3
69
145,4
58
65,8
60
44,7
95
33,9
12
2,1
14,0
33

Part
127
Part 3 – Fiscal Strategy and Outlook
Tab
le A
.9:
Est
imat
ed p
aym
ents
to
su
pp
ort
oth
er s
tate
ser
vice
s, b
y ye
ar a
nd
Sta
te (
con
tin
ued
) $'0
00
NS
WV
ICQ
LD
WA
SA
TA
SA
CT
NT
To
tal
2012-1
3N
ati
on
al P
art
ne
rsh
ip p
aym
en
tsC
ente
nary
of
Canberr
a 2
013 —
join
t natio
nal p
rogra
m -
- -
- -
-2,0
40
-2,0
40
Com
monw
ealth
Heads o
f G
overn
ment
Meetin
g 2
011
- -
- -
- -
- -
-C
rim
Tra
c p
olic
e r
efe
rence s
yste
m233
133
272
313
469
231
229
337
2,2
17
Dig
ital R
egio
ns In
itiativ
e3,5
53
1,4
30
2,2
11
441
1,3
96
1,7
58
-1,3
25
12,1
14
Dig
ital R
egio
ns In
itiativ
e —
local
govern
ment
-4
- -
- -
- -
4Fin
ancia
l assis
tance g
rants
703,8
12
530,5
08
446,8
18
267,4
92
151,9
70
71,7
95
47,2
04
32,2
87
2,2
51,8
86
Legal a
ssis
tance s
erv
ices
62,7
72
44,4
75
41,2
55
19,9
56
15,7
26
5,9
47
4,4
29
3,9
16
198,4
76
Local G
overn
ment and R
egio
nal
Develo
pm
ent
Local G
overn
ment R
efo
rm F
und
-1,3
40
32
1,1
00
91
10
708
20
3,3
01
Pilo
t of
dro
ught re
form
measure
s in
W
este
rn A
ustr
alia
- -
-7,7
72
- -
- -
7,7
72
Rem
ote
Indig
enous p
ublic
inte
rnet
access
147
-356
712
147
- -
713
2,0
75
Seam
less N
atio
nal E
conom
y79,9
11
61,9
43
51,5
82
26,0
21
18,3
16
5,6
21
4,0
26
2,5
80
250,0
00
Sin
king f
und o
n S
tate
debt
25
1 -
-2
- -
-28
World S
ailing C
ham
pio
nship
s -
- -
- -
- -
- -
Tota
l850,4
53
639,8
34
542,5
26
323,8
07
188,1
17
85,3
62
58,6
36
41,1
78
2,7
29,9
13

Part 3 – Fiscal Strategy and Outlook
128
Tab
le A
.9:
Est
imat
ed p
aym
ents
to
su
pp
ort
oth
er s
tate
ser
vice
s, b
y ye
ar a
nd
Sta
te (
con
tin
ued
) $'0
00
NS
WV
ICQ
LD
WA
SA
TA
SA
CT
NT
To
tal
2013-1
4N
ati
on
al P
art
ne
rsh
ip p
aym
en
tsC
ente
nary
of
Canberr
a 2
013 —
join
t natio
nal p
rogra
m -
- -
- -
-991
-991
Com
monw
ealth
Heads o
f G
overn
ment
Meetin
g 2
011
- -
- -
- -
- -
-C
rim
Tra
c p
olic
e r
efe
rence s
yste
m -
- -
- -
- -
- -
Dig
ital R
egio
ns In
itiativ
e -
- -
- -
- -
- -
Dig
ital R
egio
ns In
itiativ
e —
local
govern
ment
- -
- -
- -
- -
-Fin
ancia
l assis
tance g
rants
728,8
55
551,0
50
465,2
89
278,7
30
157,1
16
74,3
01
48,9
95
33,5
73
2,3
37,9
09
Legal a
ssis
tance s
erv
ices
63,8
08
45,2
09
41,9
35
20,2
85
15,9
87
6,0
45
4,4
95
3,9
74
201,7
38
Local G
overn
ment and R
egio
nal
Develo
pm
ent
Local G
overn
ment R
efo
rm F
und
- -
- -
- -
- -
-Pilo
t of
dro
ught re
form
measure
s in
W
este
rn A
ustr
alia
- -
-1,1
57
- -
- -
1,1
57
Rem
ote
Indig
enous p
ublic
inte
rnet
access
154
-364
725
153
- -
727
2,1
23
Seam
less N
atio
nal E
conom
y -
- -
- -
- -
- -
Sin
king f
und o
n S
tate
debt
25
1 -
-2
- -
-28
World S
ailing C
ham
pio
nship
s -
- -
- -
- -
- -
Tota
l792,8
42
596,2
60
507,5
88
300,8
97
173,2
58
80,3
46
54,4
81
38,2
74
2,5
43,9
46

Part
129
Part 3 – Fiscal Strategy and Outlook
Tab
le A
.9:
Est
imat
ed p
aym
ents
to
su
pp
ort
oth
er s
tate
ser
vice
s, b
y ye
ar a
nd
Sta
te (
con
tin
ued
) $'0
00
NS
WV
ICQ
LD
WA
SA
TA
SA
CT
NT
To
tal
2014-1
5N
ati
on
al P
art
ne
rsh
ip p
aym
en
tsC
ente
nary
of
Canberr
a 2
013 —
join
t natio
nal p
rogra
m -
- -
- -
- -
- -
Com
monw
ealth
Heads o
f G
overn
ment
Meetin
g 2
011
- -
- -
- -
- -
-C
rim
Tra
c p
olic
e r
efe
rence s
yste
m -
- -
- -
- -
- -
Dig
ital R
egio
ns In
itiativ
e -
- -
- -
- -
- -
Dig
ital R
egio
ns In
itiativ
e —
local
govern
ment
- -
- -
- -
- -
-Fin
ancia
l assis
tance g
rants
756,2
82
573,4
82
485,4
11
290,9
78
162,7
63
77,0
46
50,9
51
34,9
79
2,4
31,8
92
Legal a
ssis
tance s
erv
ices
65,0
84
46,1
14
42,7
74
20,6
90
16,3
06
6,1
66
4,5
85
4,0
53
205,7
72
Local G
overn
ment and R
egio
nal
Develo
pm
ent
Local G
overn
ment R
efo
rm F
und
- -
- -
- -
- -
-Pilo
t of
dro
ught re
form
measure
s in
W
este
rn A
ustr
alia
- -
- -
- -
- -
-R
em
ote
Indig
enous p
ublic
inte
rnet
access
157
-373
743
156
- -
742
2,1
71
Seam
less N
atio
nal E
conom
y -
- -
- -
- -
- -
Sin
king f
und o
n S
tate
debt
25
1 -
-2
- -
-28
World S
ailing C
ham
pio
nship
s -
- -
- -
- -
- -
Tota
l821,5
48
619,5
97
528,5
58
312,4
11
179,2
27
83,2
12
55,5
36
39,7
74
2,6
39,8
63

Part 3 – Fiscal Strategy and Outlook
130
Tab
le A
.10:
GS
T a
nd
gen
eral
rev
enu
e as
sist
ance
pa
ymen
ts t
o t
he
Sta
tes,
by
year
an
d S
tate
$'0
00
NS
WV
ICQ
LD
WA
SA
TA
SA
CT
NT
To
tal
2011-1
2G
ST
en
titl
em
en
ts14,6
83,9
11
10,7
04,3
12
8,9
72,6
14
3,5
38,8
04
4,4
16,7
85
1,7
13,2
11
856,1
62
2,6
14,2
01
47,5
00,0
00
Oth
er
paym
en
tsA
CT M
unic
ipal S
erv
ices
- -
- -
- -
36,1
10
-36,1
10
Reduced r
oyalti
es
- -
-77,0
86
- -
- -
77,0
86
Royalti
es
- -
-nfp
- -
-nfp
1,0
83,9
89
Snow
y H
ydro
Ltd
tax c
om
pensatio
n32,1
24
16,0
62
- -
- -
- -
48,1
86
Tota
l14,7
16,0
35
10,7
20,3
74
8,9
72,6
14
3,6
15,8
90
4,4
16,7
85
1,7
13,2
11
892,2
72
2,6
14,2
01
48,7
45,3
71
2012-1
3G
ST
en
titl
em
en
ts15,9
57,7
39
11,5
26,1
36
9,7
42,7
42
3,6
09,6
73
4,6
54,6
59
1,8
18,2
90
914,5
38
2,8
26,2
23
51,0
50,0
00
Oth
er
paym
en
tsA
CT M
unic
ipal S
erv
ices
- -
- -
- -
36,8
32
-36,8
32
Reduced r
oyalti
es
- -
-73,7
56
- -
- -
73,7
56
Royalti
es
- -
-nfp
- -
-nfp
1,0
16,2
38
Snow
y H
ydro
Ltd
tax c
om
pensatio
n38,0
00
19,0
00
- -
- -
- -
57,0
00
Tota
l15,9
95,7
39
11,5
45,1
36
9,7
42,7
42
3,6
83,4
29
4,6
54,6
59
1,8
18,2
90
951,3
70
2,8
26,2
23
52,2
33,8
26
2013-1
4G
ST
en
titl
em
en
ts17,0
12,2
25
12,0
29,1
34
10,8
38,9
04
3,5
83,1
10
4,8
55,4
94
1,8
44,3
44
916,4
28
2,9
20,3
61
54,0
00,0
00
Oth
er
paym
en
tsA
CT M
unic
ipal S
erv
ices
- -
- -
- -
37,4
95
-37,4
95
Reduced r
oyalti
es
- -
-71,2
07
- -
- -
71,2
07
Royalti
es
- -
-nfp
- -
-nfp
1,0
22,3
20
Snow
y H
ydro
Ltd
tax c
om
pensatio
n38,0
00
19,0
00
- -
- -
- -
57,0
00
Tota
l17,0
50,2
25
12,0
48,1
34
10,8
38,9
04
3,6
54,3
17
4,8
55,4
94
1,8
44,3
44
953,9
23
2,9
20,3
61
55,1
88,0
22
2014-1
5G
ST
en
titl
em
en
ts17,8
14,0
81
12,6
60,4
91
11,4
13,7
30
3,8
52,9
92
5,0
37,8
53
1,9
05,2
74
960,7
33
3,0
04,8
46
56,6
50,0
00
Oth
er
paym
en
tsA
CT M
unic
ipal S
erv
ices
- -
- -
- -
38,2
08
-38,2
08
Reduced r
oyalti
es
- -
-71,4
78
- -
- -
71,4
78
Royalti
es
- -
-nfp
- -
-nfp
1,0
17,2
40
Snow
y H
ydro
Ltd
tax c
om
pensatio
n38,0
00
19,0
00
- -
- -
- -
57,0
00
Tota
l17,8
52,0
81
12,6
79,4
91
11,4
13,7
30
3,9
24,4
70
5,0
37,8
53
1,9
05,2
74
998,9
41
3,0
04,8
46
57,8
33,9
26
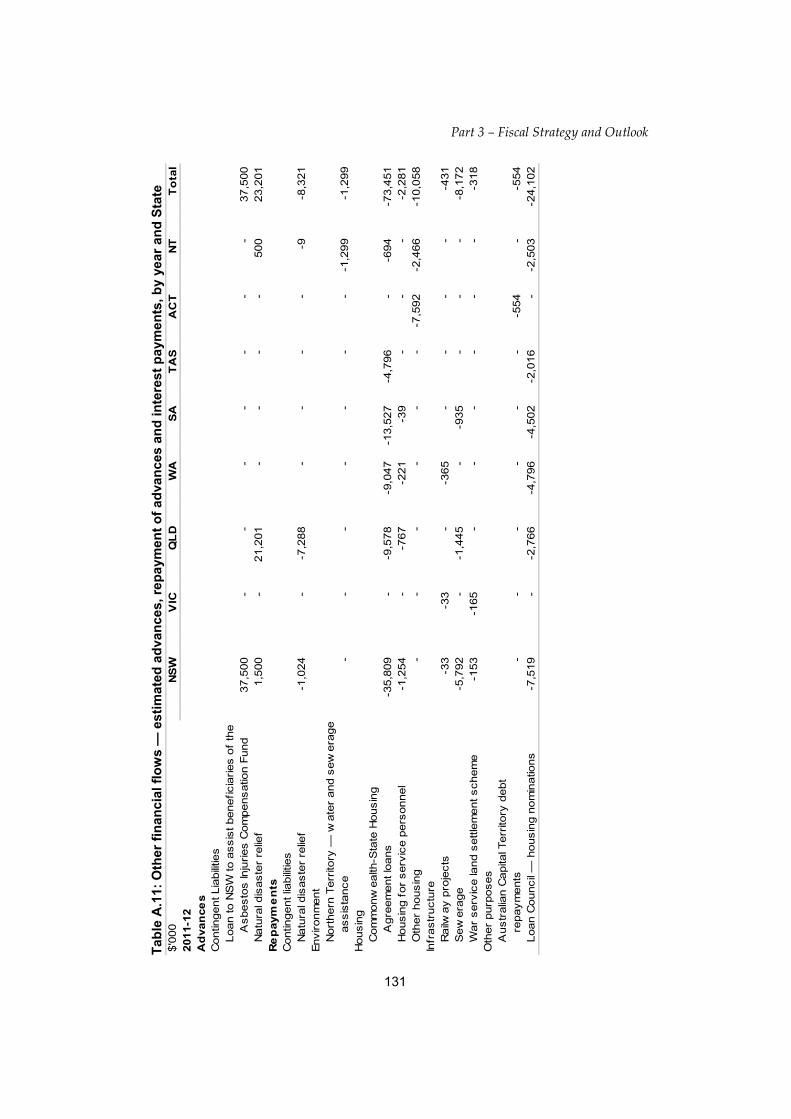
Part
131
Part 3 – Fiscal Strategy and Outlook
Tab
le A
.11:
Oth
er f
inan
cial
flo
ws
— e
stim
ated
ad
van
ces,
rep
aym
ent
of
adva
nce
s an
d in
tere
st p
aym
ents
, by
year
an
d S
tate
$'0
00
NS
WV
ICQ
LD
WA
SA
TA
SA
CT
NT
To
tal
2011-1
2A
dvan
ce
sC
ontin
gent Lia
bilitie
sLoan to N
SW
to a
ssis
t beneficia
ries o
f th
e
Asbesto
s In
juries C
om
pensatio
n F
und
37,5
00
- -
- -
- -
-37,5
00
Natu
ral d
isaste
r re
lief
1,5
00
-21,2
01
- -
- -
500
23,2
01
Re
paym
en
tsC
ontin
gent lia
bilitie
sN
atu
ral d
isaste
r re
lief
-1,0
24
--7
,288
- -
- -
-9-8
,321
Environm
ent
Nort
hern
Terr
itory
— w
ate
r and s
ew
era
ge
assis
tance
- -
- -
- -
--1
,299
-1,2
99
Housin
gC
om
monw
ealth
-Sta
te H
ousin
gA
gre
em
ent lo
ans
-35,8
09
--9
,578
-9,0
47
-13,5
27
-4,7
96
--6
94
-73,4
51
Housin
g f
or
serv
ice p
ers
onnel
-1,2
54
--7
67
-221
-39
- -
--2
,281
Oth
er
housin
g -
- -
- -
--7
,592
-2,4
66
-10,0
58
Infr
astr
uctu
reR
ailw
ay p
roje
cts
-33
-33
--3
65
- -
- -
-431
Sew
era
ge
-5,7
92
--1
,445
--9
35
- -
--8
,172
War
serv
ice la
nd s
ettle
ment schem
e-1
53
-165
- -
- -
- -
-318
Oth
er
purp
oses
Austr
alia
n C
apita
l Terr
itory
debt
repaym
ents
- -
- -
- -
-554
--5
54
Loan C
ouncil
— h
ousin
g n
om
inatio
ns
-7,5
19
--2
,766
-4,7
96
-4,5
02
-2,0
16
--2
,503
-24,1
02

Part 3 – Fiscal Strategy and Outlook
132
Tab
le A
.11:
Oth
er f
inan
cial
flo
ws
— e
stim
ated
ad
van
ces,
rep
aym
ent
of
adva
nce
s an
d in
tere
st p
aym
ents
, by
year
an
d S
tate
(c
on
tin
ued
) $'0
00
NS
WV
ICQ
LD
WA
SA
TA
SA
CT
NT
To
tal
2011-1
2In
tere
st
Contin
gent lia
bilitie
sLoan to N
SW
to a
ssis
t beneficia
ries o
f th
e
Asbesto
s In
juries C
om
pensatio
n F
und
-960
- -
- -
- -
--9
60
Natu
ral d
isaste
r re
lief
-437
--4
,695
- -
- -
-73
-5,2
05
Housin
gC
om
monw
ealth
-Sta
te H
ousin
gA
gre
em
ent lo
ans
-39,1
22
--1
1,0
43
-10,4
22
-17,1
33
-5,4
25
--1
,476
-84,6
21
Housin
g f
or
serv
ice p
ers
onnel
-2,1
24
--1
,195
-203
-94
- -
--3
,616
Oth
er
housin
g -
- -
- -
--7
,997
-3,8
66
-11,8
63
Infr
astr
uctu
reR
ailw
ay p
roje
cts
-2-2
--1
36
- -
- -
-140
Sew
era
ge
-2,6
16
--7
18
--5
56
- -
--3
,890
War
serv
ice la
nd s
ettle
ment schem
e-1
7-1
4 -
- -
- -
--3
1O
ther
purp
oses
Austr
alia
n C
apita
l Terr
itory
debt
repaym
ents
- -
- -
- -
-836
--8
36
Loan C
ouncil
— h
ousin
g n
om
inatio
ns
-21,6
67
--7
,763
-13,2
80
-13,0
46
-5,7
23
--7
,508
-68,9
87
Net Fin
ancia
l Flo
w-7
9,5
29
-214
-26,0
57
-38,4
70
-49,8
32
-17,9
60
-16,9
79
-19,3
94
-248,4
35

Part
133
Part 3 – Fiscal Strategy and Outlook
Tab
le A
.11:
Oth
er f
inan
cial
flo
ws
— e
stim
ated
ad
van
ces,
rep
aym
ent
of
adva
nce
s an
d in
tere
st p
aym
ents
, by
year
an
d S
tate
(c
on
tin
ued
) $'0
00
NS
WV
ICQ
LD
WA
SA
TA
SA
CT
NT
To
tal
2012-1
3A
dvan
ce
sC
ontin
gent Lia
bilitie
sLoan to N
SW
to a
ssis
t beneficia
ries o
f th
e
Asbesto
s In
juries C
om
pensatio
n F
und
50,0
00
- -
- -
- -
-50,0
00
Natu
ral d
isaste
r re
lief
1,5
00
-96,3
48
- -
- -
500
98,3
48
Re
paym
en
tsC
ontin
gent lia
bilitie
sN
atu
ral d
isaste
r re
lief
-145
--7
,282
- -
- -
-9-7
,436
Environm
ent
Nort
hern
Terr
itory
— w
ate
r and s
ew
era
ge
assis
tance
- -
- -
- -
--1
,299
-1,2
99
Housin
gC
om
monw
ealth
-Sta
te H
ousin
gA
gre
em
ent lo
ans
-36,2
64
--9
,689
-9,1
67
-14,1
23
-4,8
61
--7
25
-74,8
29
Housin
g f
or
serv
ice p
ers
onnel
-1,3
30
--8
19
-227
-42
- -
--2
,418
Oth
er
housin
g -
- -
- -
--7
,629
-2,5
84
-10,2
13
Infr
astr
uctu
reR
ailw
ay p
roje
cts
-9-9
--3
65
- -
- -
-383
Sew
era
ge
-6,3
70
--1
,588
--1
,042
- -
--9
,000
War
serv
ice la
nd s
ettle
ment schem
e-1
47
-84
- -
- -
- -
-231
Oth
er
purp
oses
Austr
alia
n C
apita
l Terr
itory
debt
repaym
ents
- -
- -
- -
-554
--5
54
Loan C
ouncil
— h
ousin
g n
om
inatio
ns
-7,8
58
--2
,891
-5,0
12
-4,7
05
-2,1
07
--2
,616
-25,1
89

Part 3 – Fiscal Strategy and Outlook
134
Tab
le A
.11:
Oth
er f
inan
cial
flo
ws
— e
stim
ated
ad
van
ces,
rep
aym
ent
of
adva
nce
s an
d in
tere
st p
aym
ents
, by
year
an
d S
tate
(c
on
tin
ued
) $'0
00
NS
WV
ICQ
LD
WA
SA
TA
SA
CT
NT
To
tal
2012-1
3In
tere
st
Contin
gent lia
bilitie
sLoan to N
SW
to a
ssis
t beneficia
ries o
f th
e
Asbesto
s In
juries C
om
pensatio
n F
und
-3,5
68
- -
- -
- -
--3
,568
Natu
ral d
isaste
r re
lief
-391
--5
,874
- -
- -
-74
-6,3
39
Housin
gC
om
monw
ealth
-Sta
te H
ousin
gA
gre
em
ent lo
ans
-37,3
84
--1
0,5
86
-9,9
86
-16,4
94
-5,1
95
--1
,445
-81,0
90
Housin
g f
or
serv
ice p
ers
onnel
-2,0
68
--1
,162
-221
-92
- -
--3
,543
Oth
er
housin
g -
- -
- -
--7
,655
-3,7
41
-11,3
96
Infr
astr
uctu
reR
ailw
ay p
roje
cts
- -
--1
16
- -
- -
-116
Sew
era
ge
-2,0
39
--5
74
--4
47
- -
--3
,060
War
serv
ice la
nd s
ettle
ment schem
e-9
-5 -
- -
- -
--1
4O
ther
purp
oses
Austr
alia
n C
apita
l Terr
itory
debt
repaym
ents
- -
- -
- -
-766
--7
66
Loan C
ouncil
— h
ousin
g n
om
inatio
ns
-21,3
70
--7
,651
-13,0
85
-12,8
65
-5,6
41
--7
,407
-68,0
19
Net Fin
ancia
l Flo
w-6
7,4
52
-98
48,2
32
-38,1
79
-49,8
10
-17,8
04
-16,6
04
-19,4
00
-161,1
15

Part
135
Part 3 – Fiscal Strategy and Outlook
Tab
le A
.11:
Oth
er f
inan
cial
flo
ws
— e
stim
ated
ad
van
ces,
rep
aym
ent
of
adva
nce
s an
d in
tere
st p
aym
ents
, by
year
an
d S
tate
(c
on
tin
ued
) $'0
00
NS
WV
ICQ
LD
WA
SA
TA
SA
CT
NT
To
tal
2013-1
4A
dvan
ce
sC
ontin
gent Lia
bilitie
sLoan to N
SW
to a
ssis
t beneficia
ries o
f th
e
Asbesto
s In
juries C
om
pensatio
n F
und
50,0
00
- -
- -
- -
-50,0
00
Natu
ral d
isaste
r re
lief
1,5
00
-7,4
97
- -
- -
500
9,4
97
Re
paym
en
tsC
ontin
gent lia
bilitie
sN
atu
ral d
isaste
r re
lief
-102
--1
0,5
28
- -
- -
-9-1
0,6
39
Environm
ent
Nort
hern
Terr
itory
— w
ate
r and s
ew
era
ge
assis
tance
- -
- -
- -
--1
,299
-1,2
99
Housin
gC
om
monw
ealth
-Sta
te H
ousin
gA
gre
em
ent lo
ans
-36,7
10
--9
,790
-9,2
94
-14,7
47
-4,9
45
--7
58
-76,2
44
Housin
g f
or
serv
ice p
ers
onnel
-1,4
13
--8
74
-238
-47
- -
--2
,572
Oth
er
housin
g -
- -
- -
--7
,619
-2,7
08
-10,3
27
Infr
astr
uctu
reR
ailw
ay p
roje
cts
- -
--3
50
- -
- -
-350
Sew
era
ge
-7,0
04
--1
,746
--1
,165
- -
--9
,915
War
serv
ice la
nd s
ettle
ment schem
e -
- -
- -
- -
- -
Oth
er
purp
oses
Austr
alia
n C
apita
l Terr
itory
debt
repaym
ents
- -
- -
- -
-554
--5
54
Loan C
ouncil
— h
ousin
g n
om
inatio
ns
-8,2
11
--3
,021
-5,2
37
-4,9
17
-2,2
02
--2
,733
-26,3
21

Part 3 – Fiscal Strategy and Outlook
136
Tab
le A
.11:
Oth
er f
inan
cial
flo
ws
— e
stim
ated
ad
van
ces,
rep
aym
ent
of
adva
nce
s an
d in
tere
st p
aym
ents
, by
year
an
d S
tate
(c
on
tin
ued
) $'0
00
NS
WV
ICQ
LD
WA
SA
TA
SA
CT
NT
To
tal
2013-1
4In
tere
st
Contin
gent lia
bilitie
sLoan to N
SW
to a
ssis
t beneficia
ries o
f th
e
Asbesto
s In
juries C
om
pensatio
n F
und
-6,3
08
- -
- -
- -
--6
,308
Natu
ral d
isaste
r re
lief
-385
--9
,607
- -
- -
-74
-10,0
66
Housin
gC
om
monw
ealth
-Sta
te H
ousin
gA
gre
em
ent lo
ans
-35,6
08
--1
0,1
18
-9,5
40
-15,8
15
-4,9
61
--1
,414
-77,4
56
Housin
g f
or
serv
ice p
ers
onnel
-2,0
10
--1
,125
-211
-90
- -
--3
,436
Oth
er
housin
g -
- -
- -
--7
,312
-3,6
10
-10,9
22
Infr
astr
uctu
reR
ailw
ay p
roje
cts
- -
--9
6 -
- -
--9
6S
ew
era
ge
-1,4
04
--4
16
--3
26
- -
--2
,146
War
serv
ice la
nd s
ettle
ment schem
e -
- -
- -
- -
- -
Oth
er
purp
oses
Austr
alia
n C
apita
l Terr
itory
debt
repaym
ents
- -
- -
- -
-697
--6
97
Loan C
ouncil
— h
ousin
g n
om
inatio
ns
-21,0
54
--7
,532
-12,8
79
-12,6
73
-5,5
55
--7
,301
-66,9
94
Net Fin
ancia
l Flo
w-6
8,7
09
--4
7,2
60
-37,8
45
-49,7
80
-17,6
63
-16,1
82
-19,4
06
-256,8
45

Part
137
Part 3 – Fiscal Strategy and Outlook
Tab
le A
.11:
Oth
er f
inan
cial
flo
ws
— e
stim
ated
ad
van
ces,
rep
aym
ent
of
adva
nce
s an
d in
tere
st p
aym
ents
, by
year
an
d S
tate
(c
on
tin
ued
) $'0
00
NS
WV
ICQ
LD
WA
SA
TA
SA
CT
NT
To
tal
2014-1
5A
dvan
ce
sC
ontin
gent Lia
bilitie
sLoan to N
SW
to a
ssis
t beneficia
ries o
f th
e
Asbesto
s In
juries C
om
pensatio
n F
und
22,5
00
- -
- -
- -
-22,5
00
Natu
ral d
isaste
r re
lief
1,5
00
-7,5
44
- -
- -
500
9,5
44
Re
paym
en
tsC
ontin
gent lia
bilitie
sN
atu
ral d
isaste
r re
lief
-19
--2
5,1
53
- -
- -
-9-2
5,1
81
Environm
ent
Nort
hern
Terr
itory
— w
ate
r and s
ew
era
ge
assis
tance
- -
- -
- -
--1
,299
-1,2
99
Housin
gC
om
monw
ealth
-Sta
te H
ousin
gA
gre
em
ent lo
ans
-37,0
96
--9
,920
-9,4
24
-15,3
98
-5,0
28
--7
92
-77,6
58
Housin
g f
or
serv
ice p
ers
onnel
-1,5
03
--9
15
-248
-52
- -
--2
,718
Oth
er
housin
g -
- -
- -
--7
,755
-2,8
39
-10,5
94
Infr
astr
uctu
reR
ailw
ay p
roje
cts
- -
--3
24
- -
- -
-324
Sew
era
ge
-7,7
03
--1
,919
--1
,037
- -
--1
0,6
59
War
serv
ice la
nd s
ettle
ment schem
e -
- -
- -
- -
- -
Oth
er
purp
oses
Austr
alia
n C
apita
l Terr
itory
debt
repaym
ents
- -
- -
- -
-555
--5
55
Loan C
ouncil
— h
ousin
g n
om
inatio
ns
-8,5
81
--3
,157
-5,4
73
-5,1
38
-2,3
01
--2
,856
-27,5
06

Part 3 – Fiscal Strategy and Outlook
138
Tab
le A
.11:
Oth
er f
inan
cial
flo
ws
— e
stim
ated
ad
van
ces,
rep
aym
ent
of
adva
nce
s an
d in
tere
st p
aym
ents
, by
year
an
d S
tate
(c
on
tin
ued
) $'0
00
NS
WV
ICQ
LD
WA
SA
TA
SA
CT
NT
To
tal
2014-1
5In
tere
st
Contin
gent lia
bilitie
sLoan to N
SW
to a
ssis
t beneficia
ries o
f th
e
Asbesto
s In
juries C
om
pensatio
n F
und
-8,6
13
- -
- -
- -
--8
,613
Natu
ral d
isaste
r re
lief
-385
--9
,515
- -
- -
-74
-9,9
74
Housin
gC
om
monw
ealth
-Sta
te H
ousin
gA
gre
em
ent lo
ans
-33,7
94
--9
,643
-9,0
84
-15,0
97
-4,7
20
--1
,381
-73,7
19
Housin
g f
or
serv
ice p
ers
onnel
-1,9
47
--1
,087
-200
-88
- -
--3
,322
Oth
er
housin
g -
- -
- -
--6
,969
-3,4
73
-10,4
42
Infr
astr
uctu
reR
ailw
ay p
roje
cts
- -
--7
6 -
- -
--7
6S
ew
era
ge
-705
--2
42
--1
89
- -
--1
,136
War
serv
ice la
nd s
ettle
ment schem
e -
- -
- -
- -
- -
Oth
er
purp
oses
Austr
alia
n C
apita
l Terr
itory
debt
repaym
ents
- -
- -
- -
-627
--6
27
Loan C
ouncil
— h
ousin
g n
om
inatio
ns
-20,7
20
--7
,407
-12,6
61
-12,4
71
-5,4
64
--7
,189
-65,9
12
Net Fin
ancia
l Flo
w-9
7,0
66
--6
1,4
14
-37,4
90
-49,4
70
-17,5
13
-15,9
06
-19,4
12
-298,2
71

Part
139
Part 3 – Fiscal Strategy and Outlook T
able
A.1
2: T
ota
l pa
ymen
ts t
o t
he
Sta
tes
by
GF
S f
un
ctio
n
$'0
00
NS
WV
ICQ
LD
WA
SA
TA
SA
CT
NT
To
tal(
a)
2011-1
2G
enera
l public
serv
ices
64,2
13
49,5
54
41,0
10
20,6
83
14,7
25
4,5
33
3,2
20
2,0
62
200,0
00
Public
ord
er
and s
afe
ty64,3
36
45,8
28
41,5
25
63,9
42
16,2
71
6,2
24
4,9
72
66,2
09
309,3
07
Educatio
n4,9
18,7
86
3,6
85,4
13
3,1
25,5
13
1,6
11,3
12
1,1
63,5
29
359,9
62
252,9
70
280,6
89
15,3
98,1
74
Health
4,8
53,7
78
3,8
24,4
47
3,1
35,1
06
1,7
34,9
64
1,2
41,2
76
354,7
88
231,0
76
248,1
14
15,6
23,5
49
Socia
l security
and w
elfare
1,0
77,7
45
705,8
73
727,1
40
294,8
50
336,5
00
99,5
16
43,0
79
55,9
24
3,3
40,6
27
Housin
g a
nd c
om
munity
am
eniti
es
480,9
83
427,5
95
354,8
72
208,6
81
156,8
48
67,0
18
59,1
43
46,8
73
2,6
01,1
56
Recre
atio
n a
nd c
ultu
re-
--
3,6
00
--
2,6
00
-6,2
00
Fuel a
nd e
nerg
y15,8
03
12,5
44
12,2
04
13,8
42
6,4
08
2,4
32
1,7
47
6,1
93
71,1
73
Agricultu
re, fo
restr
y a
nd f
ishin
g117,0
23
187,5
89
55,8
82
36,0
53
284,1
05
81,2
97
197
21,0
43
783,1
89
Min
ing, m
anufa
ctu
ring a
nd c
onstr
uctio
n-
--
--
--
--
Tra
nsport
and c
om
munic
atio
n2,8
76,0
25
1,1
80,2
40
1,4
57,4
15
505,7
73
753,8
61
89,7
37
21,8
33
81,6
44
6,9
66,5
28
Oth
er
econom
ic a
ffairs
11,6
87
-4,7
50
13,1
90
--
--
29,6
27
Oth
er
purp
oses(b
)15,2
74,9
36
11,2
62,9
31
9,6
59,2
44
3,8
24,8
03
4,5
49,5
50
1,7
67,9
26
942,2
16
2,6
24,7
12
50,9
90,3
07
Tota
l paym
ents
to the S
tate
s29,7
55,3
15
21,3
82,0
14
18,6
14,6
61
8,3
31,6
93
8,5
23,0
73
2,8
33,4
33
1,5
63,0
53
3,4
33,4
63
96,3
19,8
37
less
paym
ents
'thro
ugh' t
he S
tate
s2,5
23,1
06
2,0
60,0
38
1,6
92,4
25
858,8
11
652,3
78
178,8
96
159,2
83
113,7
52
8,2
38,6
89
less
fin
ancia
l assis
tance g
rants
for
local g
overn
ment
506,1
32
380,4
65
319,5
04
191,2
84
109,4
58
51,6
70
33,9
41
23,0
76
1,6
15,5
30
less
paym
ents
direct 'to
' lo
cal g
overn
ment
185,2
30
120,0
86
153,6
86
84,5
14
38,3
78
18,0
51
1,4
93
7,1
29
638,5
67
equals
tota
l paym
ents
'to' t
he S
tate
s f
or
ow
n-p
urp
ose e
xpenses
26,5
40,8
47
18,8
21,4
25
16,4
49,0
46
7,1
97,0
84
7,7
22,8
59
2,5
84,8
16
1,3
68,3
36
3,2
89,5
06
85,8
27,0
51
N
ote:
T
he
data
in t
his
tabl
e ha
ve b
een
amen
ded
from
the
pub
lishe
d M
YE
FO
doc
umen
t. T
otal
exp
ense
s re
mai
n un
chan
ged.
A
min
or a
djus
tmen
t ha
s be
en m
ade
to t
he
S
tate
sha
res
of s
ome
Nat
iona
l Sp
ecifi
c P
urpo
se P
aym
ents
. (a
) T
otal
col
umn
may
not
equ
al s
um o
f S
tate
tot
als.
The
re i
s no
bas
is o
n w
hich
to
estim
ate
Sta
te a
lloca
tions
for
sev
eral
pa
ymen
ts,
whi
ch a
re n
ot r
efle
cted
in
Sta
te
tota
ls.
(b)
Pa
ymen
ts fo
r ‘O
ther
pur
pose
s’ in
clud
es g
ener
al r
even
ue a
ssis
tanc
e to
the
Sta
tes.

140140
Part 3 – Fiscal Strategy and Outlook
Tab
le A
.12:
To
tal p
aym
ents
to
th
e S
tate
s b
y G
FS
fu
nct
ion
(co
nti
nu
ed)
$'0
00
NS
WV
ICQ
LD
WA
SA
TA
SA
CT
NT
To
tal(
a)
2012-1
3G
enera
l public
serv
ices
79,9
11
61,9
43
51,5
82
26,0
21
18,3
16
5,6
21
4,0
26
2,5
80
250,0
00
Public
ord
er
and s
afe
ty65,0
61
46,3
26
42,0
40
20,7
39
16,2
39
6,1
78
4,8
62
4,2
53
205,6
98
Educatio
n4,8
66,1
89
3,7
99,2
60
3,1
58,1
16
1,5
92,1
66
1,1
75,4
85
360,4
52
263,5
57
231,6
01
15,4
46,8
26
Health
4,9
55,2
54
3,7
65,5
57
3,2
07,1
94
1,5
83,0
09
1,2
77,4
73
339,8
32
239,2
31
236,2
42
15,6
03,7
92
Socia
l security
and w
elfare
599,0
76
742,3
48
343,1
03
309,0
39
186,1
19
50,3
69
24,0
60
26,1
88
2,2
80,3
02
Housin
g a
nd c
om
munity
am
eniti
es
491,2
71
366,9
87
334,8
19
179,9
52
127,4
13
46,7
71
53,5
38
39,6
61
1,9
98,6
20
Recre
atio
n a
nd c
ultu
re-
--
--
-2,0
40
-2,0
40
Fuel a
nd e
nerg
y7,4
08
3,1
17
5,5
71
4,2
48
1,7
72
686
807
1,1
84
24,7
93
Agricultu
re, fo
restr
y a
nd f
ishin
g8,7
98
7,3
98
6,2
92
19,4
27
52,8
95
7,0
10
10
15
101,8
45
Min
ing, m
anufa
ctu
ring a
nd c
onstr
uctio
n-
--
--
--
--
Tra
nsport
and c
om
munic
atio
n1,1
44,1
60
1,0
69,5
60
1,1
28,9
02
647,6
07
165,5
02
87,8
52
7,8
15
66,5
85
4,6
17,9
84
Oth
er
econom
ic a
ffairs
3,7
69
--
--
--
-3,7
69
Oth
er
purp
oses(b
)16,7
05,1
24
12,0
75,4
15
10,2
67,7
36
3,9
56,7
69
4,8
23,8
03
1,8
90,2
33
999,2
82
2,8
58,9
39
54,5
93,5
39
Tota
l paym
ents
to the S
tate
s28,9
26,0
21
21,9
37,9
11
18,5
45,3
55
8,3
38,9
77
7,8
45,0
17
2,7
95,0
04
1,5
99,2
28
3,4
67,2
48
95,1
29,2
08
less
paym
ents
'thro
ugh' t
he S
tate
s2,6
95,1
98
2,2
34,8
13
1,8
31,7
97
934,2
89
705,2
62
189,7
96
171,1
87
124,0
07
8,8
86,3
49
less
fin
ancia
l assis
tance g
rants
for
local g
overn
ment
703,8
12
530,5
08
446,8
18
267,4
92
151,9
70
71,7
95
47,2
04
32,2
87
2,2
51,8
86
less
paym
ents
direct 'to
' lo
cal g
overn
ment
111,6
37
79,8
69
88,3
90
60,9
64
34,0
06
12,4
79
447
7,1
31
429,9
23
equals
tota
l paym
ents
'to' t
he S
tate
s f
or
ow
n-p
urp
ose e
xpenses
25,4
15,3
74
19,0
92,7
21
16,1
78,3
50
7,0
76,2
32
6,9
53,7
79
2,5
20,9
34
1,3
80,3
90
3,3
03,8
23
83,5
61,0
50
N
ote:
T
he
data
in t
his
tabl
e ha
ve b
een
amen
ded
from
the
pub
lishe
d M
YE
FO
doc
umen
t. T
otal
exp
ense
s re
mai
n un
chan
ged.
A
min
or a
djus
tmen
t ha
s be
en m
ade
to t
he
S
tate
sha
res
of s
ome
Nat
iona
l Sp
ecifi
c P
urpo
se P
aym
ents
. (a
) T
otal
col
umn
may
not
equ
al s
um o
f S
tate
tot
als.
The
re i
s no
bas
is o
n w
hich
to
estim
ate
Sta
te a
lloca
tions
for
sev
eral
pa
ymen
ts,
whi
ch a
re n
ot r
efle
cted
in
Sta
te
tota
ls.
(b)
Pa
ymen
ts fo
r ‘O
ther
pur
pose
s’ in
clud
es g
ener
al r
even
ue a
ssis
tanc
e to
the
Sta
tes.

141141
Part 3 – Fiscal Strategy and Outlook
Tab
le A
.12:
To
tal p
aym
ents
to
th
e S
tate
s b
y G
FS
fu
nct
ion
(co
nti
nu
ed)
$'0
00
NS
WV
ICQ
LD
WA
SA
TA
SA
CT
NT
To
tal(
a)
2013-1
4G
enera
l public
serv
ices
--
--
--
--
-Public
ord
er
and s
afe
ty65,8
64
46,9
27
42,4
48
20,7
55
16,0
31
6,0
45
4,6
99
3,9
74
206,7
43
Educatio
n4,9
97,9
31
3,9
52,7
01
3,3
38,7
17
1,6
76,1
39
1,2
08,2
65
365,4
92
276,3
66
221,6
99
16,0
37,3
10
Health
5,2
13,0
48
4,1
11,3
82
3,3
59,9
58
1,7
67,2
88
1,1
84,5
72
358,2
97
261,2
43
237,1
20
16,4
92,9
08
Socia
l security
and w
elfare
611,7
90
798,8
65
354,3
02
341,0
58
176,4
45
47,2
84
26,0
53
26,7
00
2,3
82,4
97
Housin
g a
nd c
om
munity
am
eniti
es
463,5
68
320,8
45
495,2
58
329,5
86
133,4
57
34,4
89
28,5
50
76,6
94
2,0
38,5
47
Recre
atio
n a
nd c
ultu
re-
--
--
-991
-991
Fuel a
nd e
nerg
y-
--
--
--
--
Agricultu
re, fo
restr
y a
nd f
ishin
g15,6
57
6,6
28
25,4
76
1,5
94
1,6
00
7,0
10
10
15
57,9
90
Min
ing, m
anufa
ctu
ring a
nd c
onstr
uctio
n-
--
--
--
--
Tra
nsport
and c
om
munic
atio
n1,4
14,2
72
1,5
73,8
47
1,1
17,2
08
603,8
78
129,5
35
60,2
10
52,7
95
98,8
08
5,4
18,6
53
Oth
er
econom
ic a
ffairs
--
--
--
--
-O
ther
purp
oses(b
)17,7
84,8
47
12,5
97,5
60
11,3
85,0
66
3,9
37,9
14
5,0
30,2
51
1,9
18,7
39
1,0
02,9
18
2,9
54,0
75
57,6
33,6
90
Tota
l paym
ents
to the S
tate
s30,5
66,9
77
23,4
08,7
55
20,1
18,4
33
8,6
78,2
12
7,8
80,1
56
2,7
97,5
66
1,6
53,6
25
3,6
19,0
85
100,2
69,3
29
less
paym
ents
'thro
ugh' t
he S
tate
s2,8
66,6
93
2,3
96,8
98
1,9
83,8
72
1,0
15,7
27
754,1
80
202,7
02
178,6
55
134,8
75
9,5
33,6
02
less
fin
ancia
l assis
tance g
rants
for
local g
overn
ment
728,8
55
551,0
50
465,2
89
278,7
30
157,1
16
74,3
01
48,9
95
33,5
73
2,3
37,9
09
less
paym
ents
direct 'to
' lo
cal g
overn
ment
108,5
20
74,4
39
115,8
60
54,8
07
20,8
86
11,8
36
-7,1
72
428,5
20
equals
tota
l paym
ents
'to' t
he S
tate
s f
or
ow
n-p
urp
ose e
xpenses
26,8
62,9
09
20,3
86,3
68
17,5
53,4
12
7,3
28,9
48
6,9
47,9
74
2,5
08,7
27
1,4
25,9
75
3,4
43,4
65
87,9
69,2
98
N
ote:
T
he
data
in t
his
tabl
e ha
ve b
een
amen
ded
from
the
pub
lishe
d M
YE
FO
doc
umen
t. T
otal
exp
ense
s re
mai
n un
chan
ged.
A
min
or a
djus
tmen
t ha
s be
en m
ade
to t
he
S
tate
sha
res
of s
ome
Nat
iona
l Sp
ecifi
c P
urpo
se P
aym
ents
. (a
) T
otal
col
umn
may
not
equ
al s
um o
f S
tate
tot
als.
The
re i
s no
bas
is o
n w
hich
to
estim
ate
Sta
te a
lloca
tions
for
sev
eral
pa
ymen
ts,
whi
ch a
re n
ot r
efle
cted
in
Sta
te
tota
ls.
(b)
Pa
ymen
ts fo
r ‘O
ther
pur
pose
s’ in
clud
es g
ener
al r
even
ue a
ssis
tanc
e to
the
Sta
tes.

Part 3 – Fiscal Strategy and Outlook
142
Tab
le A
.12:
To
tal p
aym
ents
to
th
e S
tate
s b
y G
FS
fu
nct
ion
(co
nti
nu
ed)
$'0
00
NS
WV
ICQ
LD
WA
SA
TA
SA
CT
NT
To
tal(
a)
2014-1
5G
enera
l public
serv
ices
--
--
--
--
-Public
ord
er
and s
afe
ty65,0
84
46,1
14
42,7
74
20,6
90
16,3
06
6,1
66
4,5
85
4,0
53
205,7
72
Educatio
n5,2
55,0
49
4,1
78,7
56
3,5
74,1
67
1,7
86,7
73
1,2
69,0
38
380,2
47
293,7
74
229,4
48
16,9
67,2
52
Health
5,4
91,0
81
4,3
23,4
51
3,5
34,9
55
1,8
70,6
86
1,2
05,8
70
378,1
96
287,2
89
255,6
52
17,3
47,1
80
Socia
l security
and w
elfare
627,4
30
849,3
64
365,9
39
355,7
29
179,6
92
47,7
62
26,3
07
22,2
89
2,4
74,5
12
Housin
g a
nd c
om
munity
am
eniti
es
486,9
71
334,4
43
441,9
26
307,6
12
124,3
38
32,7
83
27,4
85
55,9
26
2,0
90,6
84
Recre
atio
n a
nd c
ultu
re-
--
--
--
--
Fuel a
nd e
nerg
y-
--
--
--
--
Agricultu
re, fo
restr
y a
nd f
ishin
g264
1,5
82
37
37
16
7,0
10
20
15
8,9
81
Min
ing, m
anufa
ctu
ring a
nd c
onstr
uctio
n-
--
--
--
--
Tra
nsport
and c
om
munic
atio
n195,6
12
566,4
50
146,0
38
4,6
57
12,0
81
493
64,9
93
1,2
35
1,6
57,0
59
Oth
er
econom
ic a
ffairs
--
--
--
--
-O
ther
purp
oses(b
)18,6
08,3
90
13,2
52,9
74
11,9
34,4
45
4,2
16,2
79
5,2
00,6
21
1,9
82,3
20
1,0
49,8
92
3,0
39,8
25
60,3
01,9
86
Tota
l paym
ents
to the S
tate
s30,7
29,8
81
23,5
53,1
34
20,0
40,2
81
8,5
62,4
63
8,0
07,9
62
2,8
34,9
77
1,7
54,3
45
3,6
08,4
43
101,0
53,4
26
less
paym
ents
'thro
ugh' t
he S
tate
s3,0
77,1
89
2,5
75,7
08
2,1
32,2
05
1,0
91,4
23
784,2
78
217,7
28
191,5
37
139,6
32
10,2
09,7
00
less
fin
ancia
l assis
tance g
rants
for
local g
overn
ment
756,2
82
573,4
82
485,4
11
290,9
78
162,7
63
77,0
46
50,9
51
34,9
79
2,4
31,8
92
less
paym
ents
direct 'to
' lo
cal g
overn
ment
--
10,0
00
--
--
-10,0
00
equals
tota
l paym
ents
'to' t
he S
tate
s f
or
ow
n-p
urp
ose e
xpenses
26,8
96,4
10
20,4
03,9
44
17,4
12,6
65
7,1
80,0
62
7,0
60,9
21
2,5
40,2
03
1,5
11,8
57
3,4
33,8
32
88,4
01,8
34
N
ote:
T
he
data
in t
his
tabl
e ha
ve b
een
amen
ded
from
the
pub
lishe
d M
YE
FO
doc
umen
t. T
otal
exp
ense
s re
mai
n un
chan
ged.
A
min
or a
djus
tmen
t ha
s be
en m
ade
to t
he
S
tate
sha
res
of s
ome
Nat
iona
l Sp
ecifi
c P
urpo
se P
aym
ents
. (a
) T
otal
col
umn
may
not
equ
al s
um o
f S
tate
tot
als.
The
re i
s no
bas
is o
n w
hich
to
estim
ate
Sta
te a
lloca
tions
for
sev
eral
pa
ymen
ts,
whi
ch a
re n
ot r
efle
cted
in
Sta
te
tota
ls.
(b)
Pa
ymen
ts fo
r ‘O
ther
pur
pose
s’ in
clud
es g
ener
al r
even
ue a
ssis
tanc
e to
the
Sta
tes.