Embed Size (px)
Citation preview

28
OVERVIEW OF OUR BUSINESS
Our activities are carried out through the following six reportable segments:
(i) NAFTA: our operations to support distribution and sale of mass-market vehicles in the United States, Canada, Mexico and Caribbean islands, primarily under the Jeep, Ram, Dodge, Chrysler, Fiat, Alfa Romeo and Abarth brands.
(ii) LATAM: our operations to support the distribution and sale of mass-market vehicles in South and Central America, primarily under the Fiat, Jeep, Dodge and Ram brands, with the largest focus of our business in Brazil and Argentina.
(iii) APAC: our operations to support the distribution and sale of mass-market vehicles in the Asia Pacific region (mostly in China, Japan, Australia, South Korea and India) carried out in the region through both subsidiaries and joint ventures, primarily under the Jeep, Fiat, Alfa Romeo, Abarth, Fiat Professional, Dodge and Chrysler brands.
(iv) EMEA: our operations to support the distribution and sale of mass-market vehicles in Europe (which includes the 28 members of the European Union and the members of the European Free Trade Association), the Middle East and Africa, primarily under the Fiat, Fiat Professional, Jeep, Alfa Romeo, Lancia, Abarth, Ram and Dodge brands.
(v) Maserati: the design, engineering, development, manufacturing, worldwide distribution and sale of luxury vehicles under the Maserati brand.
(vi) Components: production and sale of lighting components, body control units, suspensions, shock absorbers, electronic systems, and exhaust systems and activities in powertrain (engine and transmissions) components, engine control units, plastic molding components and in the after-market carried out under the Magneti Marelli brand name; cast iron components for engines, gearboxes, transmissions and suspension systems, and aluminum cylinder heads and engine blocks under the Teksid brand name; and design and production of industrial automation systems and related products for the automotive industry under the Comau brand name.
We also hold interests in companies operating in other activities and businesses. These activities are grouped under “Other Activities”, which primarily consists of companies that provide services, including accounting, payroll, tax, insurance, purchasing, information technology, facility management and security for the Group, and manage central treasury activities.
Design and Manufacturing
We sell mass-market vehicles in the SUV, passenger car, truck and light commercial vehicle markets. Our SUV and CUV portfolio includes the Jeep Grand Cherokee, Jeep Cherokee, Jeep Renegade, the all-new Jeep Compass and the all-new Alfa Romeo Stelvio. Our passenger car product portfolio includes vehicles such as the Fiat 500, Alfa Romeo Giulia, Dodge Challenger and Charger and minivans such as the Chrysler Pacifica. We sell light and heavy-duty pickup trucks such as the Ram 1500 and 2500/3500 or the Fiat Toro and our light commercial vehicles include vans such as the Fiat Professional Doblò, Fiat Professional Ducato and Ram ProMaster.
Our efforts to respond to customer demand have led to a number of important initiatives, including localized production of Jeep vehicles in Italy, China, India and Brazil.
We have deployed World Class Manufacturing (“WCM”) principles throughout our manufacturing operations. WCM principles were developed by the WCM Association, a non-profit organization dedicated to developing superior manufacturing standards. We are the only OEM that is a member of the WCM Association. WCM fosters a manufacturing culture that targets improved safety, quality and efficiency, as well as the elimination of all types of waste. Unlike some other advanced manufacturing programs, WCM is designed to prioritize issues, focus on those initiatives believed likely to yield the most significant savings and improvements, and direct resources to those initiatives. We also offer several types of WCM programs to our suppliers whereby they can learn and incorporate WCM principles into their own operations.

29
Sales Overview
New vehicle sales represent sales of FCA vehicles primarily by dealers and distributors, or, in some cases, directly by us, to retail customers and fleet customers. Sales include mass-market and luxury vehicles manufactured at our plants, as well as vehicles manufactured by our joint ventures and third party contract manufacturers and distributed under our brands and through our network. Sales figures exclude sales of vehicles that we contract manufacture for other OEMs. While vehicle sales are illustrative of our competitive position and the demand for our vehicles, sales are not directly correlated to our Net revenues, Cost of revenues or other measures of financial performance, as such results are primarily driven by our vehicle shipments to dealers and distributors. For a discussion of our shipments, see Operating Results—Shipment Information. The following table shows new vehicle sales by geographic market for the periods presented.
Years ended December 312017 2016 2015
(millions of units)NAFTA 2.4 2.6 2.6LATAM 0.5 0.5 0.6APAC 0.3 0.2 0.2EMEA 1.5 1.4 1.3Total Mass-Market Vehicle Brands 4.7 4.7 4.7Maserati 0.05 0.04 0.04Total Worldwide 4.8 4.7 4.7
NAFTA
NAFTA Sales and Competition
The following table presents mass-market vehicle sales and estimated market share in the NAFTA segment for the periods presented:
Years ended December 312017(1),(2) 2016(1),(2) 2015(1),(2),(3)
NAFTA Sales Market Share Sales Market Share Sales Market Share Thousands of units (except percentages)
U.S. 2,059 11.7 % 2,244 12.6 % 2,253 12.6 %Canada 267 13.0 % 279 14.2 % 291 15.1 %Mexico and Other 86 5.5 % 88 5.3 % 87 6.3 %Total 2,412 11.4% 2,611 12.2% 2,631 12.4%
________________________________(1) Certain fleet sales that are accounted for as operating leases are included in vehicle sales. (2) Estimated market share data presented are based on management’s estimates of industry sales data, which use certain data provided by third-party sources, including IHS Markit and Ward’s Automotive.(3) Sales information has been restated to be consistent with reporting methodology disclosed in the FCA US press release issued July 26, 2016.

30
The following table presents estimated new vehicle market share information for us and our principal competitors in the U.S., our largest market in the NAFTA segment:
Years ended December 31U.S. 2017 2016 2015
Automaker Percentage of industryGM 17.1 % 17.0 % 17.3 %Ford 14.7 % 14.6 % 14.7 %Toyota 13.9 % 13.7 % 14.0 %FCA 11.7% 12.6% 12.6%Honda 9.3 % 9.2 % 8.9 %Nissan 9.1 % 8.8 % 8.3 %Hyundai/Kia 7.3 % 8.0 % 7.8 %Other 16.9 % 16.1 % 16.4 %Total 100.0% 100.0% 100.0%
After a sharp decline from 2007 to 2010, the U.S. automotive market sales steadily improved through 2015, remained stable in 2016 and slightly declined in 2017. U.S. industry sales, including medium and heavy-duty vehicles, increased from 10.6 million units in 2009 to 17.9 million units in 2016, before slightly decreasing to 17.6 million units in 2017. The strong recovery in the automotive sector in 2015 was supported by robust macroeconomic and automotive specific factors, such as growth in per capita disposable income, improved consumer confidence, the increasing age of vehicles in operation, improved consumer access to affordably priced financing and higher prices of used vehicles. While these contributing factors remain relatively strong, some of them have begun to moderate in 2016 and 2017, which has resulted in a plateauing of auto sales, albeit at high levels on a historic basis.
Our vehicle line-up in the NAFTA segment leverages the brand recognition of the Jeep, Ram, Dodge and Chrysler brands to offer utility vehicles, pickup trucks, cars and minivans under those brands, as well as vehicles in smaller segments, such as the Fiat 500 in the micro/small-segment and the Fiat 500X and Jeep Renegade in the small SUV/crossover segment. Our vehicle sales and profitability in the NAFTA segment are generally weighted towards larger vehicles such as utility vehicles, trucks and vans, while overall industry sales in the NAFTA segment generally are more evenly weighted between smaller and larger vehicles. In 2017 we began to distribute the all-new Alfa Romeo Giulia and Stelvio in the NAFTA region.
NAFTA Distribution
In the NAFTA segment, our vehicles are sold primarily to dealers in our dealer network for sale to retail consumers and fleet customers. Fleet sales in the commercial channel are typically more profitable than sales in the government and daily rental channels since they more often involve customized vehicles with more optional features and accessories; however, vehicle orders in the commercial channel are usually smaller in size than the orders made in the daily rental channel. Fleet sales in the government channel are generally more profitable than fleet sales in the daily rental channel primarily due to the mix of products included in each respective channel.
NAFTA Dealer and Customer Financing
In the NAFTA segment, we do not have a captive finance company or joint venture and instead rely upon independent financial service providers, including Santander Consumer USA Inc. (“SCUSA”) to provide financing for dealers and retail customers in the U.S. In February 2013, we entered into a private label financing agreement with SCUSA (the “SCUSA Agreement”), under which SCUSA provides a wide range of wholesale and retail financial services to our dealers and retail customers in the U.S., under the Chrysler Capital brand name and covering the Chrysler, Jeep, Dodge, Ram and Fiat brands.

31
The SCUSA Agreement has a ten year term from February 2013, subject to early termination in certain circumstances, including the failure by a party to comply with certain of its ongoing obligations under the agreement. Under the SCUSA Agreement, SCUSA has certain rights, including limited exclusivity to participate in specified minimum percentages of certain retail financing rate subvention programs. SCUSA’s exclusivity rights are subject to SCUSA maintaining certain performance standards and price competitiveness based on minimum approval rates and market benchmark rates to be determined through a steering committee process as set out in the SCUSA Agreement.
As of December 31, 2017, SCUSA was providing wholesale lines of credit to approximately 9 percent of our dealers in the U.S., while Ally Financial Inc. (“Ally”) was at 35 percent. For the year ended December 31, 2017, we estimate that approximately 85 percent of the vehicles purchased by our U.S. retail customers were financed or leased of which approximately 44 percent financed or leased through SCUSA (26 percent) and Ally (18 percent). Alfa Romeo brand development within the U.S. is also supported by dealer and retail customer financing with primary financial institutions. Additionally, we have arrangements with a number of financial institutions to provide a variety of dealer and retail customer financing programs in Canada and a private label agreement with Inbursa Group in Mexico.
LATAM
LATAM Sales and Competition
The following table presents mass-market vehicle sales and market share in the LATAM segment for the periods presented:
Years ended December 312017(1) 2016(1) 2015(1)
LATAM Sales Market Share Sales Market Share Sales Market Share Thousands of units (except percentages)
Brazil 380 17.5 % 365 18.4 % 483 19.5 %Argentina 105 12.2 % 79 11.6 % 74 11.9 %Other LATAM 28 2.5 % 29 2.9 % 27 2.7 %Total 513 12.4% 473 12.9% 584 14.2%
______________________________(1) Estimated market share data presented are based on management’s estimates of industry sales data, which use certain data provided by third-party sources, including IHS Markit, National Organization of Automotive Vehicles Distribution and Association of Automotive Producers.
The following table presents our mass-market vehicle market share information and our principal competitors in Brazil, our largest market in the LATAM segment:
Brazil Years ended December 312017(1) 2016(1) 2015(1)
Automaker Percentage of industryGM 18.1 % 17.4 % 15.6 %FCA 17.5% 18.4% 19.5%Volkswagen 12.5 % 12.1 % 15.2 %Ford 9.5 % 9.1 % 10.2 %Other 42.4 % 43.0 % 39.5 %Total 100.0% 100.0% 100.0%
__________________________________(1) Our estimated market share data presented are based on management’s estimates of industry sales data, which use certain data provided by third-party sources, including IHS
Markit, National Organization of Automotive Vehicles Distribution and Association of Automotive Producers.
The automotive industry within which the LATAM segment operates increased 13 percent from 2016, to 4.1 million vehicles (cars and light commercial vehicles) in 2017, which was primarily driven by a 9 percent increase in Brazil's industry vehicle sales reflecting improving market conditions, combined with an increase of 26 percent in Argentina's industry vehicle sales.

32
Although Group revenues in LATAM increased 29 percent from 2016, the Group's market share decreased 50 basis points from 12.9 percent to 12.4 percent due to strong competition. In Brazil, overall market share decreased from 18.4 percent to 17.5 percent while in Argentina, overall market share increased to 12.2 percent from 11.6 percent in 2016.
Vehicle sales in the LATAM segment leverage the name recognition of Fiat and the relatively urban population of countries like Brazil to offer Fiat brand Segment A and B vehicles in our key markets in the LATAM segment. In Brazil, Fiat also leads the pickup truck market with the Fiat Strada and all-new Fiat Toro at 19.4 percent and 17.9 percent respectively, while Jeep is continuing its momentum in the small and medium SUV segments with the all-new Jeep Compass increasing market share to 12.2 percent and the Jeep Renegade having a segment share of 9.5 percent.
LATAM Distribution
In the LATAM segment, we generally enter into multiple dealer agreements with a single dealer, covering one or more points of sale. Outside Brazil and Argentina, our major markets, we distribute our vehicles mainly through general distributors and their dealer networks.
LATAM Dealer and Customer Financing
In the LATAM segment, we provide access to dealer and retail customer financing through both 100 percent owned captive finance companies and through strategic relationships with financial institutions.
We have two 100 percent owned captive finance companies in the LATAM segment: Banco Fidis S.A. (“Banco Fidis”) in Brazil and FCA Compañia Financiera S.A. in Argentina. These captive finance companies offer dealer and retail customer financing. In addition, in Brazil we have two significant commercial partnerships with Banco Itaù and Bradesco to provide financing to retail customers purchasing FCA branded vehicles. Banco Itaù is a leading vehicle retail financing company in Brazil. This partnership was renewed in August 2013 for a ten-year term ending in 2023. Under this agreement, Banco Itaù has exclusivity on our promotional campaigns and preferential rights on non-promotional financing. We receive commissions in connection with each vehicle financing above a certain threshold. This agreement applies only to our retail customers purchasing Fiat branded vehicles. In July 2015, FCA Fiat Chrysler Automoveis Brasil (“FCA Brasil”) and Banco Fidis signed a ten-year partnership contract with Bradesco, one of the leading Brazilian banks, through its affiliate Bradesco Financiamentos, whereby Bradesco Financiamentos finances retail sales of Jeep, Chrysler, Dodge and Ram vehicles in Brazil. Under this agreement, Bradesco has exclusivity on promotional campaigns and FCA Brasil promotes Bradesco as its official financial partner. Banco Fidis is in charge of the commercial management of this partnership and receives commissions for this partnership agreement and for acting as banking agent, based on profitability and penetration.

33
APAC
APAC Sales and Competition
The following table presents vehicle sales in the APAC segment for the periods presented:
Years ended December 312017(1),(4) 2016(1),(4) 2015(1),(4)
APAC Sales Market Share Sales Market Share Sales Market ShareThousands of units (except percentages)
China(2) 215 0.9% 176 0.8% 139 0.8%Japan 21 0.5% 20 0.5% 17 0.4%India(3) 15 0.5% 7 0.2% 9 0.3%Australia 13 1.1% 18 1.6% 35 3.1%South Korea 8 0.5% 7 0.4% 7 0.4%APAC 5 major Markets 272 0.8% 228 0.7% 207 0.7%Other APAC 5 — 5 — 8 —Total 277 — 233 — 215 —
__________________________________(1) Estimated market share data presented are based on management’s estimates of industry sales data, which use certain data provided by third-party sources, including IHS
Markit and National Automobile Manufacturing Associations. (2) Sales data include vehicles sold by our joint ventures in China. (3) India market share is based on wholesale volumes. (4) Sales reflect retail deliveries. APAC industry reflects aggregate for major markets where the Group competes (China, Australia, Japan, South Korea, and India). Market share
is based on retail registrations except, as noted above, in India where market share is based on wholesale volumes.
The automotive industry in the APAC segment has shown a year-over-year growth. Industry sales in the five key markets (China, India, Japan, Australia and South Korea) where we compete increased from 16.1 million in 2009 to 33.5 million in 2017, a compound annual growth rate (“CAGR”) of approximately 10 percent. Industry demand increased across the region in 2017 with growth in India (+9 percent) and Japan (+6 percent), with China and Australia flat, offsetting a 3 percent decrease in South Korea.
We sell a range of vehicles in the APAC segment, including small and compact cars and utility vehicles. Although our smallest mass-market segment by vehicle sales, we believe the APAC segment represents a significant growth opportunity and we have invested in building relationships with key joint venture partners in China and India in order to increase our presence in the region. In 2010, the GAC FCA JV was formed for the production of Fiat brand passenger cars due to the demand for mid-size vehicles in China. In 2015, we expanded local production by the GAC FCA JV with the production of the Jeep Cherokee and in 2016, we continued the transition to local SUV production in China with the production of the Jeep Renegade and the all-new Jeep Compass at the Guangzhou plant of the GAC FCA JV. In 2016, the Jeep brand made its return to India, with the launches of the imported Jeep Wrangler and Jeep Grand Cherokee. In 2017, we launched the imported Alfa Romeo Giulia and Alfa Romeo Stelvio in China and local production of the all-new Jeep Compass was launched in the Ranjangaon, India plant for sale in India and other right-hand drive countries. In other parts of the APAC segment, we distribute vehicles that we manufacture in the U.S. and Europe through our dealers and distributors.
APAC Distribution
In the key markets in the APAC segment (China, Australia, India, Japan and South Korea), we sell our vehicles through 100 percent owned subsidiaries or through our joint venture to local independent dealers. In other markets where we do not have a substantial presence, we have agreements with general distributors for the distribution of our vehicles through their networks.
APAC Dealer and Customer Financing
In the APAC segment, we operate a 100 percent owned captive finance company, FCA Automotive Finance Co., Ltd, which supports, on a non-exclusive basis, our sales activities in China through dealer and retail customer financing. Cooperation agreements are also in place with third party financial institutions to provide dealer network and retail customer financing in India, South Korea, Australia and Japan.

34
EMEA
EMEA Sales and Competition
The following table presents passenger car and light commercial vehicle sales in the EMEA segment for the periods presented:
Years ended December 312017(1),(2),(3) 2016(1),(2),(3) 2015(1),(2),(3)
EMEAPassenger Cars Sales Market Share Sales Market Share Sales Market Share
Thousands of units (except percentages)Italy 558 28.3% 528 28.9% 446 28.3%Germany 104 3.0% 97 2.9% 90 2.8%France 88 4.2% 80 4.0% 71 3.7%Spain 67 5.4% 60 5.2% 47 4.5%UK 60 2.4% 84 3.1% 83 3.2%Other Europe 158 3.6% 136 3.3% 127 3.3%Europe* 1,035 6.6% 985 6.5% 864 6.1%Other EMEA** 116 — 113 — 124 —Total 1,151 — 1,098 — 988 —
_____________________________* 28 members of the European Union and members of the European Free Trade Association (other than Italy, Germany, UK, France, and Spain). ** Market share not included in Other EMEA because our presence is less than one percent.(1) Certain fleet sales accounted for as operating leases are included in vehicle sales. (2) Estimated market share data is presented based on the European Automobile Manufacturers Association (ACEA) Registration Databases and national Registration Offices
databases. (3) Sale data includes vehicle sales by our joint venture in Turkey.
Years ended December 312017(1),(2),(3) 2016(1),(2),(3) 2015(1),(2),(3)
EMEALight CommercialVehicles Group Sales Market Share Group Sales Market Share Group Sales Market Share
Thousands of units (except percentages)Europe* 260 11.4% 250 11.6% 217 11.3%Other EMEA** 75 — 69 — 77 —Total 335 — 319 — 294 —
______________________________* 28 members of the European Union and members of the European Free Trade Association. ** Market share not included in Other EMEA because our presence is less than one percent.(1) Certain fleet sales accounted for as operating leases are included in vehicle sales. (2) Estimated market share data is presented based on the national Registration Offices databases on products categorized under light commercial vehicles. (3) Sale data includes vehicle sales by our joint venture in Turkey.

35
The following table summarizes new vehicle market share information and our principal competitors in Europe, our largest market in the EMEA segment:
Years ended December 31
Europe-Passenger Cars 2017(*) 2016(*) 2015(*)
Automaker Percentage of industryVolkswagen 23.8 % 24.1 % 24.8 %PSA 12.1 % 9.7 % 10.4 %Renault 10.4 % 10.1 % 9.6 %FCA (1) 6.7% 6.6% 6.1%BMW 6.7 % 6.8 % 6.6 %Ford 6.6 % 6.9 % 7.2 %Daimler 6.3 % 6.2 % 5.9 %Toyota 4.6 % 4.3 % 4.3 %GM 3.8 % 6.6 % 6.7 %Other 19.0 % 18.7 % 18.4 %Total 100.0% 100.0% 100.0%
______________________________* Including all 28 European Union (EU) Member States and the 4 European Free Trade Association member states, or EFTA member states. (1) Market share data is presented based on the European Automobile Manufacturers Association, or ACEA Registration Databases, which also includes Maserati within our
Group for all periods presented; includes Ferrari within our Group for 2015.
In 2017, the Fiat brand continued its leadership in the European A minicar segment in EU 28+EFTA, with Fiat 500 and Fiat Panda accounting for 29.1 percent of market share in the segment, and Fiat 500 remaining segment leader, with sales up 3.5 percent. The Fiat brand increased its presence also in the medium-compact and compact sedan segments thanks to the ramp up of the Fiat Tipo.
Volumes were higher in the light commercial vehicle segment, with industry sales up 6 percent over the prior year to about 2.3 million units. Overall Alfa Romeo sales increased 29.5 percent over 2016, with the all-new Alfa Romeo Stelvio introduced during the year.
In Europe, FCA’s sales are largely weighted to passenger cars, with approximately 38.8 percent of our total vehicle sales in the small car segment for 2017, reflecting demand for smaller vehicles due to driving conditions prevalent in many European cities and stringent environmental regulations.
EMEA Distribution
In Europe, our relationship with individual dealer entities can be represented by a number of contracts (typically, we enter into one agreement per brand of vehicles to be sold), and the dealer can sell those vehicles through one or more points of sale. In many markets, points of sale tend to be physically small and carry limited inventory.
In Europe, we sell our vehicles directly to independent and our own dealer entities located in most European markets, as well as to fleet customers (including government and rental). In other markets in the EMEA segment in which we do not have a substantial presence, we have agreements with general distributors for the distribution of our vehicles through their existing distribution networks.

36
EMEA Dealer and Customer Financing
In the EMEA segment, dealer and retail customer financing is primarily managed by FCA Bank, our joint venture with Crédit Agricole Consumer Finance S.A. (“CACF”). FCA Bank operates in Europe, including the five major markets of Italy, France, Germany, Spain and the UK. We began this joint venture in 2007, and in July 2013 we reached an agreement with Crédit Agricole to extend its term through December 31, 2021. Under the agreement, FCA Bank will continue to benefit from the financial support of Crédit Agricole while continuing to strengthen its position as an active player in the securitization and debt markets. FCA Bank provides dealer and retail financing and, within selected countries, also rental, to support our mass-market vehicle brands. FCA Bank provides its services to Maserati and Ferrari luxury brands, as well as certain other OEMs.
We also operate a joint venture, Koc Fiat Kredi, providing financial services to retail customers in Turkey, and operate vendor programs with bank partners in other markets to provide access to dealer and retail customer financing in those markets.
Maserati
Maserati, a luxury vehicle brand founded in 1914, became part of the Group in 1993. In 2013, the Maserati brand was re-launched by the introduction of the next generation Quattroporte and the introduction of the all-new Ghibli (luxury four door sedans), the first addressed the flagship large sedan segment and the second was designed to address the luxury full-size sedan vehicle segment. Maserati’s current vehicles also include the GranTurismo, the brand’s first modern two door, four seat coupe, also available in a convertible version and the Maserati Levante, the first SUV in Maserati's history, which in 2017 accounted for more than 50% of the Maserati volumes.
The following table shows the distribution of Maserati sales by geographic regions as a percentage of total sales for each year ended December 31, 2017, 2016 and 2015:
As a percentageof 2017 sales
As a percentageof 2016 sales
As a percentageof 2015 sales
China 30 % 30 % 22 %
U.S. 28 % 31 % 37 %
Europe Top 4 countries(1) 16 % 15 % 14 %
Japan 4 % 3 % 5 %
Other countries 22 % 21 % 22 %Total 100% 100% 100%
_____________________________(1) Europe Top 4 Countries by sales, includes Italy, UK, Germany and Switzerland.
In 2017, a total of 49 thousand Maserati vehicles were sold to retail consumers, an increase of 22 percent compared to 2016, with increased sales in all major regions over the prior year.
FCA Bank provides access to dealer and retail customer financing for Maserati brand vehicles in Europe and our 100 percent owned captive finance company, FCA Automotive Finance Co. Ltd, provides dealer and retail financing on a non-exclusive basis in China. In other regions, we rely on local agreements with financial services providers for financing of Maserati brand vehicles to dealers and customers.

37
Components
We sell components and production systems under the following brands:
Magneti Marelli. Founded in 1919 as a joint venture between Fiat and Ercole Marelli, Magneti Marelli is focused on the design and production of state-of-the-art automotive systems and components. Through Magneti Marelli, we design and manufacture automotive lighting systems, powertrain (engines and transmissions) components and engine control units, electronic systems, suspension systems, shock absorbers, exhaust systems, and plastic components and modules. The Automotive Lighting business line, headquartered in Reutlingen, Germany, is dedicated to the development, production and sale of automotive exterior lighting products worldwide. The Powertrain business line is dedicated to the production of engine and transmission components for automobiles, motorbikes and light commercial vehicles and has a global presence due to its own research and development centers, applied research centers and production plants. The Electronic Systems business line provides know-how in the development and production of hardware and software in mechatronics, instrument clusters, telematics and satellite navigation. We also provide aftermarket parts and services and operate in the motor-sport business, in particular electronic and electro-mechanical systems for championship motor-sport racing, under the Magneti Marelli brand.
In 2017, Magneti Marelli acquired a stake in LeddarTech, a Canadian company that develops proprietary LiDAR (Light Detection And Ranging) technology for autonomous vehicles and driver assistance systems, for joint development of this technology for autonomous driving.
With 85 production facilities and 46 research and development centers (including joint ventures), Magneti Marelli has a presence in 19 countries and supplies all the major OEMs across the globe. In several countries, Magneti Marelli’s activities are carried out through a number of joint ventures with local partners with the goal of entering more easily into new markets by leveraging the partners' local relationships. Thirty-four percent of Magneti Marelli’s 2017 revenue is derived from sales to the Group.
Teksid. Originating from Fiat’s 1917 acquisition of Ferriere Piemontesi, the Teksid brand was established in 1978 and today specializes in castings production. Teksid produces iron engine blocks, cylinder heads, engine components, transmission parts, gearboxes and suspensions. Teksid Aluminum produces aluminum engine blocks and cylinder heads. Forty-four percent of Teksid’s 2017 revenue is derived from sales to the Group.
Comau. Founded in 1973, Comau, which originally derived its name from the acronyms of COnsorzio MAcchine Utensili (consortium of machine tools), supplies advanced manufacturing systems through an international network. Comau operates primarily in the field of integrated automation technology, delivering advanced turnkey systems to its customers. Through Comau, we develop and sell a wide range of industrial applications, including robotics, and provide support service and training to customers. Comau’s main activities include innovative and high performance body welding and assembly systems and robotics, powertrain metal-cutting systems, mechanical assembly systems and testing. Comau’s automation technology is primarily used in the automotive industry, and also in other industries. Comau also provides maintenance services in Latin America. Twenty-five percent of Comau’s 2017 revenue is derived from sales to the Group.

38
OPERATING RESULTS
Non-GAAP Financial Measures
We monitor our operations through the use of several non-generally accepted accounting principles (“non-GAAP”) financial measures: Net debt, Net industrial debt, Adjusted Earnings Before Interest and Taxes (“Adjusted EBIT”), Adjusted net profit and certain information provided on a constant exchange rate (“CER”) basis. We believe that these non-GAAP financial measures provide useful and relevant information regarding our operating results and enhance the overall ability to assess our financial performance and financial position. They provide us with comparable measures which facilitate management’s ability to identify operational trends, as well as make decisions regarding future spending, resource allocations and other operational decisions. These and similar measures are widely used in the industry in which we operate, however, these financial measures may not be comparable to other similarly titled measures of other companies and are not intended to be substitutes for measures of financial performance and financial position as prepared in accordance with IFRS as issued by the IASB as well as IFRS adopted by the European Union.
Net Debt and Net Industrial Debt
We believe Net debt is useful in providing a measure of the Group’s total indebtedness after consideration of cash and cash equivalents and current securities.
Due to different sources of cash flows used for the repayment of the financial debt between industrial activities and financial services (by cash from operations for industrial activities and by collection of financial receivables for financial services) and the different business structure and leverage implications, we provide a separate analysis of Net debt between industrial activities and financial services.
The division between industrial activities and financial services represents a sub-consolidation based on the core business activities (industrial or financial services) of each Group company. The sub-consolidation for industrial activities also includes companies that perform centralized treasury activities, such as raising funding in the market and financing Group companies, but do not, however, provide financing to third parties. Financial services includes companies that provide retail and dealer financing as well as leasing and rental services in support of the mass-market vehicle brands in certain geographical segments and for the Maserati luxury brand. In addition, activities of financial services include providing factoring services to industrial activities, as an alternative to factoring from third parties. Operating results of such financial services activities are included within the respective region or sector in which they operate.
Net industrial debt (i.e., Net debt of industrial activities) is management’s primary measure for analyzing our financial leverage and capital structure and is one of the key targets used to measure our performance. Net industrial debt is computed as: debt plus derivative financial liabilities related to industrial activities less (i) cash and cash equivalents, (ii) current available-for-sale and held-for-trading securities, (iii) current financial receivables from Group or jointly controlled financial services entities and (iv) derivative financial assets and collateral deposits; therefore, debt, cash and cash equivalents and other financial assets/liabilities pertaining to financial services entities are excluded from the computation of Net industrial debt. Net industrial debt should not be considered as a substitute for cash flows or other financial measures under IFRS; in addition, Net industrial debt depends on the amount of cash and cash equivalents at each balance sheet date, which may be affected by the timing of monetization of receivables and the payment of accounts payable, as well as changes in other components of working capital, which can vary from period to period due to, among other things, cash management initiatives and other factors, some of which may be outside of the Group’s control. Net industrial debt should therefore be evaluated alongside these other measures as reported under IFRS for a complete view of the Company’s capital structure and liquidity.
Refer to Operating Results—Liquidity and Capital Markets—Net Debt below for further information and the reconciliation of these non-GAAP measures to Debt, which is the most directly comparable measure included in our Consolidated Statement of Financial Position.

133
FIAT CHRYSLER AUTOMOBILES N.V. AND SUBSIDIARIES
Index to the Consolidated Financial Statements
Page
Consolidated Income StatementConsolidated Statement of Comprehensive Income/(Loss)Consolidated Statement of Financial PositionConsolidated Statement of Cash FlowsConsolidated Statement of Changes in EquityNotes to Consolidated Financial Statements
(1) Principal Activities(2) Basis of preparation(3) Scope of consolidation(4) Net revenues(5) Research and development costs(6) Net financial expenses(7) Tax expense(8) Other information by nature (9) Goodwill and intangible assets with indefinite useful lives(10) Other intangible assets(11) Property, plant and equipment(12) Investments accounted for using the equity method(13) Other financial assets(14) Inventories(15) Trade, other receivables and tax receivables(16) Derivative financial assets and liabilities (17) Cash and cash equivalents (18) Share-based compensation (19) Employee benefits liabilities (20) Provisions (21) Debt (22) Other liabilities and Tax payables(23) Fair value measurement (24) Related party transactions (25) Guarantees granted, commitments and contingent liabilities (26) Equity(27) Earnings per share (28) Segment reporting (29) Explanatory notes to the Consolidated Statement of Cash Flows (30) Qualitative and quantitative information on financial risks (31) Subsequent events
134135136137138139139139159163163164165169169171172173176177177179182182186193194200201203206212215216221223228
134
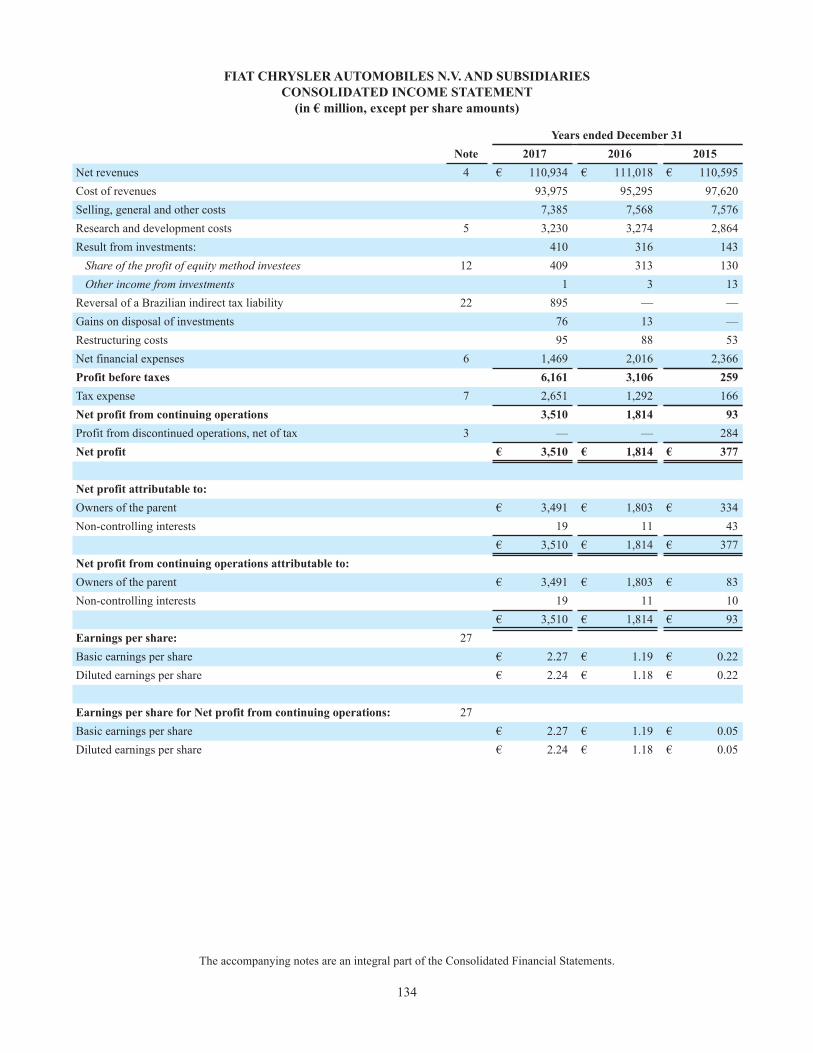
FIAT CHRYSLER AUTOMOBILES N.V. AND SUBSIDIARIESCONSOLIDATED INCOME STATEMENT
(in € million, except per share amounts)
Years ended December 31Note 2017 2016 2015
Net revenues 4 € 110,934 € 111,018 € 110,595Cost of revenues 93,975 95,295 97,620Selling, general and other costs 7,385 7,568 7,576Research and development costs 5 3,230 3,274 2,864Result from investments: 410 316 143
Share of the profit of equity method investees 12 409 313 130Other income from investments 1 3 13
Reversal of a Brazilian indirect tax liability 22 895 — —Gains on disposal of investments 76 13 —Restructuring costs 95 88 53Net financial expenses 6 1,469 2,016 2,366Profit before taxes 6,161 3,106 259Tax expense 7 2,651 1,292 166Net profit from continuing operations 3,510 1,814 93Profit from discontinued operations, net of tax 3 — — 284Net profit € 3,510 € 1,814 € 377
Net profit attributable to:Owners of the parent € 3,491 € 1,803 € 334Non-controlling interests 19 11 43
€ 3,510 € 1,814 € 377Net profit from continuing operations attributable to:Owners of the parent € 3,491 € 1,803 € 83Non-controlling interests 19 11 10
€ 3,510 € 1,814 € 93Earnings per share: 27Basic earnings per share € 2.27 € 1.19 € 0.22Diluted earnings per share € 2.24 € 1.18 € 0.22
Earnings per share for Net profit from continuing operations: 27Basic earnings per share € 2.27 € 1.19 € 0.05Diluted earnings per share € 2.24 € 1.18 € 0.05
The accompanying notes are an integral part of the Consolidated Financial Statements.

135
FIAT CHRYSLER AUTOMOBILES N.V. AND SUBSIDIARIESCONSOLIDATED STATEMENT OF COMPREHENSIVE INCOME
(in € million)
Years ended December 31Note 2017 2016 2015
Net profit (A) € 3,510 € 1,814 € 377
Items that will not be reclassified to the Consolidated Income Statement insubsequent periods: 26
(Losses)/gains on re-measurement of defined benefit plans (64) 584 679Share of gains/(losses) on re-measurement of defined benefit plans forequity method investees 2 (5) (2)Related tax impact (21) (261) (201)Items relating to discontinued operations, net of tax — — 3
Total items that will not be reclassified to the Consolidated IncomeStatement in subsequent periods (B1) (83) 318 479
Items that may be reclassified to the Consolidated Income Statements insubsequent periods: 26
Gains/(losses) on cash flow hedging instruments 147 (249) 186Gains on available-for-sale financial assets 14 15 11Exchange (losses)/gains on translating foreign operations (1,942) 458 1,002
Share of Other comprehensive (loss) for equity method investees (121) (122) (17)Related tax impact (10) 69 (48)Items relating to discontinued operations, net of tax — — 18
Total items that may be reclassified to the Consolidated IncomeStatement in subsequent periods (B2) (1,912) 171 1,152
Total Other comprehensive (loss)/income, net of tax (B1)+(B2)=(B) (1,995) 489 1,631
Total Comprehensive income (A)+(B) € 1,515 € 2,303 € 2,008
Total Comprehensive income attributable to:Owners of the parent € 1,491 € 2,288 € 1,953Non-controlling interests 24 15 55
€ 1,515 € 2,303 € 2,008
Total Comprehensive income attributable to owners of the parent:Continuing operations € 1,491 € 2,288 € 1,685Discontinued operations — — 268
€ 1,491 € 2,288 € 1,953
The accompanying notes are an integral part of the Consolidated Financial Statements.

136
FIAT CHRYSLER AUTOMOBILES N.V. AND SUBSIDIARIESCONSOLIDATED STATEMENT OF FINANCIAL POSITION (in € million)
At December 31Note 2017 2016
AssetsGoodwill and intangible assets with indefinite useful lives 9 € 13,390 € 15,222Other intangible assets 10 11,542 11,422Property, plant and equipment 11 29,014 30,431Investments accounted for using the equity method 12 2,008 1,793Other financial assets 13 482 649Deferred tax assets 7 2,004 3,699Other receivables 15 666 581Tax receivables 15 83 93Accrued income and prepaid expenses 328 372Other non-current assets 508 359 Total Non-current assets 60,025 64,621Inventories 14 12,922 12,121Assets sold with a buy-back commitment 1,748 1,533Trade and other receivables 15 7,887 7,273Tax receivables 15 215 206Accrued income and prepaid expenses 377 389Other financial assets 13 487 762Cash and cash equivalents 17 12,638 17,318Assets held for sale 3 — 120 Total Current assets 36,274 39,722 Total Assets € 96,299 € 104,343Equity and liabilitiesEquity 26Equity attributable to owners of the parent € 20,819 € 19,168Non-controlling interests 168 185 Total Equity 20,987 19,353LiabilitiesLong-term debt 21 10,726 16,111Employee benefits liabilities 19 8,584 9,052Provisions 20 5,770 6,520Other financial liabilities 16 1 16Deferred tax liabilities 7 388 194Tax payables 22 74 25Other liabilities 22 2,500 3,603 Total Non-current liabilities 28,043 35,521Trade payables 21,939 22,655Short-term debt and current portion of long-term debt 21 7,245 7,937Other financial liabilities 16 138 681Employee benefit liabilities 19 694 811Provisions 20 9,009 9,317Tax payables 22 309 162Other liabilities 22 7,935 7,809Liabilities held for sale 3 — 97 Total Current liabilities 47,269 49,469 Total Equity and liabilities € 96,299 € 104,343
The accompanying notes are an integral part of the Consolidated Financial Statements.

137
FIAT CHRYSLER AUTOMOBILES N.V. AND SUBSIDIARIESCONSOLIDATED STATEMENT OF CASH FLOWS (in € million)
Years ended December 31Note 2017 2016 2015
Cash flows from operating activities:Net profit from continuing operations € 3,510 € 1,814 € 93Amortization and depreciation 5,890 5,956 5,414Net losses on disposal of tangible and intangible assets 16 13 18Net gains on disposal of investments (76) (13) —Other non-cash items 29 (199) 111 812Dividends received 102 123 112Change in provisions 555 1,519 3,206Change in deferred taxes 1,057 389 (279)Change due to assets sold with buy-back commitments and GDP vehicles (11) (95) 6Change in inventories (1,666) (471) (958)Change in trade receivables (206) 177 (191)Change in trade payables 1,086 776 1,571Change in other payables and receivables 327 295 (580)Cash flows from operating activities - discontinued operations — — 527Total 10,385 10,594 9,751Cash flows used in investing activities:Investments in property, plant and equipment and intangible assets (8,666) (8,815) (8,819)Investments in joint ventures, associates and unconsolidated subsidiaries (18) (116) (266)Proceeds from the sale of tangible and intangible assets 61 36 29Proceeds from disposal of other investments 4 55 —Net change in receivables from financing activities (838) (483) 410Change in securities 175 299 (239)Other changes (14) (15) 11Cash flows used in investing activities - discontinued operations — — (426)Total (9,296) (9,039) (9,300)Cash flows (used in) /from financing activities: 29Issuance of notes — 1,250 2,840Repayment of notes (2,235) (2,373) (7,241)Proceeds of other long-term debt 833 1,342 3,061Repayment of other long-term debt (3,439) (4,618) (4,412)Net change in short-term debt and other financial assets/liabilities 371 (591) (36)Net proceeds from initial public offering of 10 percent of Ferrari N.V. 3 — — 866Distributions paid (1) (18) (283)Other changes (2) (119) 10Cash flows from financing activities - discontinued operations — — 2,067Total (4,473) (5,127) (3,128)Translation exchange differences (1,296) 228 681Total change in Cash and cash equivalents (4,680) (3,344) (1,996)Cash and cash equivalents at beginning of the period 17,318 20,662 22,840Cash and cash equivalents at end of the period - included within Assets heldfor distribution — — 182Cash and cash equivalents at end of the period 17 € 12,638 € 17,318 € 20,662
The accompanying notes are an integral part of the Consolidated Financial Statements.

138
FIAT CHRYSLER AUTOMOBILES N.V. AND SUBSIDIARIESCONSOLIDATED STATEMENT OF CHANGES IN EQUITY
(in € million)
Attributable to owners of the parent
Sharecapital
Otherreserves
Cash flowhedge
reserve
Currencytranslationdifferences
Available-for-sale
financialassets
Remeasure-ment ofdefined
benefit plans
Cumulativeshare ofOCI ofequity
methodinvestees
Non-controlling
interests Total
At December 31, 2014 € 17 € 14,338 € (69) € 1,479 € (37) € (1,578) € (86) € 313 € 14,377
Distributions — (17) — — — — — (283) (300)
Share-based compensation — 80 — — — — — — 80
Net profit — 334 — — — — — 43 377Initial public offering of 10 percent Ferrari N.V — 869 7 (4) — 1 — (7) 866Other comprehensive income/(loss) — — 132 1,016 11 479 (19) 12 1,631
Other changes — (149) — 1 — — — 85 (63)
At December 31, 2015 17 15,455 70 2,492 (26) (1,098) (105) 163 16,968
Capital increase — — — — — — — 18 18Mandatory Convertible Securities (Note 26) 2 (2) — — — — — — —
Share-based compensation — 98 — — — — — — 98Net profit — 1,803 — — — — — 11 1,814Other comprehensive income/(loss) — — (182) 456 15 324 (128) 4 489
Other changes — (42) 49 (36) — 6 — (11) (34)
At December 31, 2016 19 17,312 (63) 2,912 (11) (768) (233) 185 19,353
Capital increase — — — — — — — 3 3Demerger of Itedi S.p.A — (64) — — — 5 — (28) (87)
Distributions — — — — — — — (1) (1)
Share-based compensation — 115 — — — — — — 115
Net profit — 3,491 — — — — — 19 3,510Other comprehensive income/(loss) — — 131 (1,942) 14 (84) (119) 5 (1,995)
Other changes — 67 — — — 37 — (15) 89
At December 31, 2017 € 19 € 20,921 € 68 € 970 € 3 € (810) € (352) € 168 € 20,987
The accompanying notes are an integral part of the Consolidated Financial Statements.

139
FIAT CHRYSLER AUTOMOBILES N.V. AND SUBSIDIARIESNOTES TO THE CONSOLIDATED FINANCIAL STATEMENTS
1. Principal Activities
On January 29, 2014, the Board of Directors of Fiat S.p.A. (“Fiat”) approved a proposed corporate reorganization resulting in the formation of Fiat Chrysler Automobiles N.V. and establishing Fiat Chrysler Automobiles N.V., organized in the Netherlands, as the parent of the Group with its principal executive offices located at 25 St. James's Street, London SW1A 1HA, United Kingdom. Fiat Chrysler Automobiles N.V. was incorporated as a public limited liability company (naamloze vennootschap) under the laws of the Netherlands on April 1, 2014 under the name Fiat Investments N.V.
On October 12, 2014, the cross-border legal merger of Fiat into its 100 percent owned direct subsidiary Fiat Investments N.V. (the “Merger”) became effective. The Merger, which took the form of a reverse merger, resulted in Fiat Investments N.V. being the surviving entity and was renamed Fiat Chrysler Automobiles N.V. (“FCA NV”).
Unless otherwise specified, the terms “Group”, “FCA Group”, “Company” and “FCA”, refer to FCA NV, together with its subsidiaries and its predecessor prior to the completion of the Merger, or any one or more of them, as the context may require. Any references to “Fiat” refer solely to Fiat S.p.A., the predecessor of FCA NV prior to the Merger.
The Group and its subsidiaries, of which the most significant is FCA US LLC (“FCA US”), together with its subsidiaries, are engaged in the design, engineering, manufacturing, distribution and sale of automobiles and light commercial vehicles, engines, transmission systems, automotive-related components, metallurgical products and production systems. In addition, the Group is also involved in certain other activities, including services (mainly captive), which represent an insignificant portion of the Group's business.
All references in this report to “Euro” and “€” refer to the currency introduced at the start of the third stage of European Economic and Monetary Union pursuant to the Treaty on the Functioning of the European Union, as amended. The Group’s financial information is presented in Euro. All references to “U.S. Dollars,” “U.S. Dollar”, “U.S.$” and “$” refer to the currency of the United States of America (or “U.S.”).
2. Basis of Preparation
Authorization of Consolidated Financial Statements and compliance with International Financial Reporting Standards
The Consolidated Financial Statements, together with notes thereto of FCA, at December 31, 2017 were authorized for issuance by the Board of Directors on February 20, 2018 and have been prepared in accordance with the International Financial Reporting Standards (“IFRS”) as issued by the International Accounting Standards Board (“IASB”), as well as IFRS as adopted by the European Union. There is no effect on these consolidated financial statements resulting from differences between IFRS as issued by the IASB and IFRS as adopted by the European Union. The designation “IFRS” also includes International Accounting Standards (“IAS”) as well as all interpretations of the IFRS Interpretations Committee (“IFRIC”).
Basis of Preparation
The Consolidated Financial Statements are prepared under the historical cost method, modified as required for the measurement of certain financial instruments, as well as on a going concern basis. In this respect, the Group’s assessment is that no material uncertainties (as defined in IAS 1- Presentation of Financial Statements) exist about its ability to continue as a going concern.
For presentation of the Consolidated Income Statement, the Group uses a classification based on the function of expenses, rather than based on their nature, as it is more representative of the format used for internal reporting and management purposes and is consistent with international practice in the automotive sector.

140
Significant Accounting Policies
Basis of Consolidation
Subsidiaries
Subsidiaries are entities over which the Group has control. Control is achieved when the Group has power over the investee, when it is exposed to, or has rights to, variable returns from its involvement with the investee, and has the ability to use its power over the investee to affect the amount of the investor’s returns. Subsidiaries are consolidated on a line by line basis from the date which control is achieved by the Group. The Group reassesses whether or not it controls an investee if facts and circumstances indicate that there are changes to one or more of the three elements of control listed above.
The Group recognizes a non-controlling interest in the acquiree on a transaction-by-transaction basis, either at fair value or at the non-controlling interest’s share of the recognized amounts of the acquiree’s identifiable net assets. Net profit or loss and each component of Other comprehensive income/(loss) are attributed to Equity attributable to owners of the parent and to Non-controlling interests. Total comprehensive income/(loss) of subsidiaries is attributed to Equity attributable to the owners of the parent and to the non-controlling interest even if this results in a deficit balance in Non-controlling interests.
Changes in the Group’s ownership interests in a subsidiary that do not result in the Group losing control over the subsidiary are accounted for as equity transactions. The carrying amounts of the Equity attributable to owners of the parent and Non-controlling interests are adjusted to reflect the changes in their relative interests in the subsidiary. Any difference between the carrying amount of the non-controlling interests and the fair value of the consideration paid or received in the transaction is recognized directly in the Equity attributable to the owners of the parent.
Subsidiaries are deconsolidated from the date which control ceases. When the Group ceases to have control over a subsidiary, it derecognizes the assets (including any goodwill) and liabilities of the subsidiary at their carrying amounts, derecognizes the carrying amount of non-controlling interests in the former subsidiary and recognizes the fair value of any consideration received from the transaction. Any retained interest in the former subsidiary is then remeasured to its fair value.
All intra-group balances and transactions, and any unrealized gains and losses arising from intra-group transactions, are eliminated in preparing the Consolidated Financial Statements.
Interests in Joint Ventures and Associates
A joint venture is a joint arrangement whereby the parties that have joint control of the arrangement have rights to the net assets of the arrangement.
An associate is an entity over which the Group has significant influence. Significant influence is the power to participate in the financial and operating policy decisions of the investee but does not have control or joint control over those policies.
Joint ventures and associates are accounted for using the equity method of accounting from the date joint control and significant influence is obtained. On acquisition of the investment, any excess of the cost of the investment and the Group’s share of the net fair value of the investee’s identifiable assets and liabilities is recognized as goodwill and is included in the carrying amount of the investment. Any excess of the Group’s share of the net fair value of the investee’s identifiable assets and liabilities over the cost of the investment is included as income in the determination of the Group’s share of the investee’s profit/(loss) in the acquisition period.
Under the equity method, the investments are initially recognized at cost and adjusted thereafter to recognize the Group’s share of the profit/(loss) and other comprehensive income/(loss) of the investee. The Group’s share of the investee’s profit/(loss) is recognized in the Consolidated Income Statement. Distributions received from an investee reduce the carrying amount of the investment. Post-acquisition movements in Other comprehensive income/(loss) are recognized in Other comprehensive income/(loss) with a corresponding adjustment to the carrying amount of the investment.

141
Unrealized gains on transactions between the Group and its joint ventures and associates are eliminated to the extent of the Group’s interest in the joint venture or associate. Unrealized losses are also eliminated unless the transaction provides evidence of an impairment of the asset transferred.
When the Group’s share of the losses of a joint venture or associate exceeds the Group’s interest in that joint venture or associate, the Group discontinues recognizing its share of further losses. Additional losses are provided for, and a liability is recognized, only to the extent that the Group has incurred legal or constructive obligations or made payments on behalf of the joint venture or associate.
The Group discontinues the use of the equity method from the date the investment ceases to be an associate or a joint venture, or when it is classified as available-for-sale.
Interests in Joint Operations
A joint operation is a joint arrangement whereby the parties that have joint control of the arrangement have rights to the assets and obligations for the liabilities relating to the arrangement. Joint control is the contractually agreed sharing of control of an arrangement, which exists only when decisions about the relevant activities require the unanimous consent of the parties sharing control.
When the Group undertakes its activities under joint operations, it recognizes its related interest in the joint operation including: (i) its assets, including its share of any assets held jointly, (ii) its liabilities, including its share of any liabilities incurred jointly, (iii) its revenue from the sale of its share of the output arising from the joint operation, (iv) its share of the revenue from the sale of the output by the joint operation and (v) its expenses, including its share of any expenses incurred jointly.
Assets held for sale, Assets held for distribution and Discontinued Operations
Pursuant to IFRS 5 - Non-current Assets Held for Sale and Discontinued Operations, non-current assets and disposal groups are classified as held for sale if their carrying amount will be recovered principally through a sale transaction rather than through continuing use. This condition is regarded as met only when the asset or disposal group is available for immediate sale in its present condition subject only to terms that are usual and customary for sales of such asset or disposal group and the sale is highly probable, with the sale expected to be completed within one year from the date of classification.
Non-current assets and disposal groups classified as held for sale are measured at the lower of their carrying amount and fair value less costs to sell and are presented separately in the Consolidated Statement of Financial Position. Non-current assets and disposal groups are not classified as held for sale within the comparative period presented for the Consolidated Statement of Financial Position.
A discontinued operation is a component of the Group that either has been disposed of or is classified as held for sale and (i) represents either a separate major line of business or a geographical area of operations, (ii) is part of a single coordinated plan to dispose of a separate major line of business or geographical area of operations, or (iii) is a subsidiary acquired exclusively with a view to resell and the disposal involves loss of control.
Classification as a discontinued operation occurs upon disposal or when the asset or disposal group meets the criteria to be classified as held for sale, if earlier. When the asset or disposal group is classified as a discontinued operation, the comparative information is reclassified within the Consolidated Income Statement as if the asset or disposal group had been discontinued from the start of the earliest comparative period presented.
The classification, presentation and measurement requirements of IFRS 5 - Non-current Assets Held for Sale and Discontinued Operations also apply to an asset or disposal group that is classified as held for distribution to owners, whereby there must be commitment to the distribution, the asset or disposal group must be available for immediate distribution and the distribution must be highly probable.

142
Foreign currency
The functional currency of the Group’s entities is the currency of their respective primary economic environment. In individual companies, transactions in foreign currencies are recorded at the exchange rate prevailing at the date of the transaction. Monetary assets and liabilities denominated in foreign currencies are translated at the exchange rate prevailing at the date of the Consolidated Statement of Financial Position. Exchange differences arising on the settlement of monetary items, or on reporting monetary items at rates different from those initially recorded, are recognized in the Consolidated Income Statement.
All assets and liabilities of foreign consolidated companies with a functional currency other than the Euro are translated using the closing rates at the date of the Consolidated Statement of Financial Position. Income and expenses are translated into Euro at the average exchange rate for the period. Translation differences resulting from the application of this method are classified within Other comprehensive income/(loss) until the disposal of the subsidiary. Average exchange rates for the period are used to translate the cash flows of foreign subsidiaries in preparing the Consolidated Statement of Cash Flows.
The principal exchange rates used to translate other currencies into Euro were as follows:
2017 2016 2015Average At December 31 Average At December 31 Average At December 31
U.S. Dollar (U.S.$) 1.130 1.199 1.107 1.054 1.109 1.089Brazilian Real (BRL) 3.605 3.973 3.857 3.431 3.699 4.312Chinese Renminbi (CNY) 7.629 7.804 7.352 7.320 6.972 7.061Canadian Dollar (CAD) 1.465 1.504 1.466 1.419 1.418 1.512Mexican Peso (MXN) 21.329 23.661 20.664 21.772 17.611 18.915Polish Zloty (PLN) 4.257 4.177 4.363 4.410 4.184 4.264Argentine Peso (ARS) 18.683 22.595 16.327 16.707 10.271 14.136Pound Sterling (GBP) 0.877 0.887 0.819 0.856 0.726 0.734Swiss Franc (CHF) 1.112 1.170 1.090 1.074 1.068 1.084
Intangible assets
Goodwill
Goodwill represents the excess of the fair value of consideration paid over the fair value of net tangible and identifiable intangible assets acquired in a business combination. Goodwill is not amortized, but is tested for impairment annually or more frequently if events or changes in circumstances indicate that it might be impaired. After initial recognition, Goodwill is measured at cost less any accumulated impairment losses.
Intangible assets with indefinite useful lives
Intangible assets with indefinite useful lives consist principally of brands which have no legal, contractual, competitive, economic, or other factors that limit their useful lives. Intangible assets with indefinite useful lives are not amortized, but are tested for impairment annually, or more frequently if events or changes in circumstances indicate that the asset may be impaired.
Development expenditures
Development expenditures for vehicle production and related components, engines and production systems are recognized as an asset if both of the following conditions within IAS 38 – Intangible assets are met: (i) that development expenditure can be measured reliably and (ii) that the technical feasibility of the product, volumes and pricing support the view that the development expenditure will generate future economic benefits. Capitalized development expenditures include all direct and indirect costs that may be directly attributed to the development process. All other development expenditures are expensed as incurred.

143
Capitalized development expenditures are amortized on a straight-line basis from the beginning of production over the expected life cycle of the models (generally 5-6 years) or powertrains developed (generally 10-12 years).
Property, plant and equipment
Cost
Property, plant and equipment is initially recognized at cost and includes the purchase price, any costs directly attributable to bringing the assets to the location and condition necessary to be capable of operating in the manner intended by management and any initial estimate of the costs of dismantling and removing the item and restoring the site on which it is located. Self-constructed assets are initially recognized at production cost. Subsequent expenditures and the cost of replacing parts of an asset are capitalized only if they increase the future economic benefits embodied in that asset. All other expenditures are expensed as incurred. When such replacement costs are capitalized, the carrying amount of the parts that are replaced is recognized in the Consolidated Income Statement.
Assets held under finance leases, which provide the Group with substantially all the risks and rewards of ownership, are recognized as assets of the Group at their fair value or at the present value of the minimum lease payments, if lower. The corresponding liability to the lessor is included in the Consolidated Statement of Financial Position within Debt.
Depreciation
During years ended December 31, 2017, 2016 and 2015, assets were depreciated on a straight-line basis over their estimated useful lives using the following rates:
Depreciation rates
Buildings 3% - 8%
Plant, machinery and equipment 3% - 33%
Other assets 5% - 33%
Leases under which the lessor retains substantially all the risks and rewards of ownership of the leased assets are classified as operating leases. Operating lease expenditures are expensed on a straight-line basis over the respective lease term.
Borrowing Costs
Borrowing costs that are directly attributable to the acquisition, construction or production of property, plant or equipment or an intangible asset that is deemed to be a qualifying asset as defined in IAS 23 - Borrowing Costs are capitalized. The amount of borrowing costs eligible for capitalization corresponds to the actual borrowing costs incurred during the period, less any investment income on the temporary investment of any borrowed funds not yet used. The amount of borrowing costs capitalized at December 31, 2017 and 2016 was €225 million and €244 million, respectively.
Impairment of long-lived assets
At the end of each reporting period, the Group assesses whether there is any indication that its finite-lived intangible assets (including capitalized development expenditures) and its property, plant and equipment may be impaired.
If indications of impairment are present, the carrying amount of the asset is reduced to its recoverable amount which is the higher of fair value less costs of disposal and its value in use. The recoverable amount is determined for the individual asset, unless the asset does not generate cash inflows that are largely independent of those from other assets or groups of assets, in which case the asset is tested as part of the cash-generating unit (“CGU”) to which the asset belongs. A CGU is the smallest identifiable group of assets that generates cash inflows that are largely independent of the cash inflows from other assets or groups of assets. In assessing the value in use of an asset or CGU, the estimated future cash flows are discounted to their present value using a discount rate that reflects current market assessments of the time value of money and the risks specific to the asset or CGU. An impairment loss is recognized if the recoverable amount is lower than the carrying amount.

144
When an impairment loss for assets no longer exists or has decreased, the carrying amount of the asset or CGU is increased to the revised estimate of its recoverable amount, but not in excess of the carrying amount that would have been recorded had no impairment loss been recognized. The reversal of an impairment loss is recognized in the Consolidated Income Statement. Refer to the section — Use of Estimates below for additional information.
Financial assets and liabilities
Financial assets, as defined in IAS 39 – Financial Instruments: Recognition and Measurement, primarily include trade receivables, receivables from financing activities, securities that represent temporary investments of available funds and do not satisfy the requirements for being classified as cash equivalents (which include available-for-sale, held-for-trading and held-to-maturity securities), investments in other companies, derivative financial instruments, as well as Cash and cash equivalents.
Cash and cash equivalents include cash at banks, units in money market funds and other money market securities, primarily comprised of commercial paper and certificates of deposit that are readily convertible into cash, with original maturities of three months or less at the date of purchase. Cash and cash equivalents are subject to an insignificant risk of changes in value, and consist of balances across various primary national and international money market instruments. Money market funds consist of investments in high quality, short-term, diversified financial instruments which can generally be liquidated on demand.
Financial liabilities primarily consist of Debt, Derivative financial instruments, Trade payables and Other liabilities.
Measurement
Financial assets are recognized on the basis of the settlement date and, on initial recognition, are measured at acquisition cost, including transaction costs. Subsequent to initial recognition, available-for-sale and held-for-trading securities are measured at fair value. When market prices are not directly available, the fair value of available-for-sale and held-for trading securities is measured using appropriate valuation techniques (e.g. discounted cash flow analysis based on market information available at the balance sheet date).
Gains and losses on available-for-sale securities are recognized in Other comprehensive income/(loss) until the financial asset is disposed of or is impaired. When the asset is disposed of, the cumulative gains or losses, including those previously recognized in Other comprehensive income/(loss), are reclassified to the Consolidated Income Statement during the period and are recognized within Net financial expenses. Gains and losses arising from changes in the fair value of held-for-trading securities are recognized in the Consolidated Income Statement. When the asset is impaired, the losses are recognized in the Consolidated Income Statement.
Loans and receivables which are not held by the Group for trading (loans and receivables originating in the ordinary course of business) and held-to-maturity securities are measured, to the extent that they have a fixed term, at amortized cost, using the effective interest method. When these financial assets do not have a fixed term, they are measured at acquisition cost. Receivables with maturities of over one year which bear no interest, or have an interest rate significantly lower than market rates, are discounted using market rates. Assessments are made regularly as to whether there is any objective evidence that the asset or group of assets may be impaired. If any such evidence exists, the impairment loss is recognized in the Consolidated Income Statement.
Investments in other companies are measured at fair value. Equity investments that do not have a quoted market price in an active market and whose fair value cannot be reliably measured are measured at cost, less any impairment losses. For investments classified as available-for-sale, gains or losses arising from changes in fair value are recognized in Other comprehensive income/(loss) until the assets are sold or are impaired, at which time, the cumulative Other comprehensive income/(loss) is recognized in the Consolidated Income Statement. Gains and losses arising from changes in the fair value of held-for-trading investments are recognized in the Consolidated Income Statement. Investments in other companies for which fair value is not available are stated at cost less any impairment losses. Dividends received are included in Other income from investments.
Except for derivative financial instruments, which are described in more detail below, financial liabilities are measured at amortized cost using the effective interest method.

145
Derivative financial instruments
Derivative financial instruments are used for economic hedging purposes in order to reduce currency, interest rate and market price risks (primarily related to commodities and securities). In accordance with IAS 39 - Financial Instruments: Recognition and Measurement, derivative financial instruments are recognized on the basis of the settlement date and, on initial recognition, are measured at acquisition cost, including transaction costs. Subsequent to initial recognition, all derivative financial instruments are measured at fair value. Furthermore, derivative financial instruments qualify for hedge accounting only when there is formal designation and documentation of the hedging relationship at inception of the hedge, the hedge is expected to be highly effective, its effectiveness can be reliably measured and it is highly effective throughout the financial reporting periods for which it is designated.
When derivative financial instruments qualify for hedge accounting, the following accounting treatments apply:
• Fair value hedges – Where a derivative financial instrument is designated as a hedge of the exposure to changes in fair value of a recognized asset or liability that is attributable to a particular risk and could affect the Consolidated Income Statement, the gain or loss from remeasuring the hedging instrument at fair value is recognized in the Consolidated Income Statement. The gain or loss on the hedged item attributable to the hedged risk adjusts the carrying amount of the hedged item and is recognized in the Consolidated Income Statement.
• Cash flow hedges – Where a derivative financial instrument is designated as a hedge of the exposure to variability in future cash flows of a recognized asset or liability or a highly probable forecasted transaction and could affect the Consolidated Income Statement, the effective portion of any gain or loss on the derivative financial instrument is recognized directly in Other comprehensive income/(loss). The cumulative gain or loss is reclassified from Other comprehensive income/(loss) to the Consolidated Income Statement at the same time as the economic effect arising from the hedged item that affects the Consolidated Income Statement. The gain or loss associated with a hedge or part of a hedge that has become ineffective is recognized in the Consolidated Income Statement immediately. When a hedging instrument or hedge relationship is terminated but the hedged transaction is still expected to occur, the cumulative gain or loss realized to the point of termination remains in Other comprehensive income/(loss) and is recognized in the Consolidated Income Statement at the same time as the underlying transaction occurs. If the hedged transaction is no longer probable, the cumulative unrealized gain or loss held in Other comprehensive income/(loss) is recognized in the Consolidated Income Statement immediately.
• Hedges of a net investment – If a derivative financial instrument is designated as a hedging instrument for a net investment in a foreign operation, the effective portion of the gain or loss on the derivative financial instrument is recognized in Other comprehensive income/(loss). The cumulative gain or loss is reclassified from Other comprehensive income/(loss) to the Consolidated Income Statement upon disposal of the foreign operation.
If hedge accounting cannot be applied, the gains or losses from the fair value measurement of derivative financial instruments are recognized immediately in the Consolidated Income Statement.
Refer to Note 16, Derivative financial assets and liabilities for additional information on the Group's derivative financial instruments.
Transfers of financial assets
The Group derecognizes financial assets when the contractual rights to the cash flows arising from the asset are no longer held or if it transfers substantially all the risks and rewards of ownership of the financial asset. On derecognition of financial assets, the difference between the carrying amount of the asset and the consideration received or receivable for the transfer of the asset is recognized in the Consolidated Income Statement.

146
The Group transfers certain of its financial, trade and tax receivables, mainly through factoring transactions. Factoring transactions may be either with recourse or without recourse. Certain transfers include deferred payment clauses (for example, when the payment by the factor of a minor part of the purchase price is dependent on the total amount collected from the receivables) requiring first loss cover, whereby the transferor has priority participation in the losses, or requires a significant exposure to the variability of cash flows arising from the transferred receivables to be retained. These types of transactions do not meet the requirements of IAS 39 – Financial Instruments: Recognition and Measurement, for the derecognition of the assets since the risks and rewards connected with ownership of the financial asset are not transferred, and accordingly the Group continues to recognize these receivables within the Consolidated Statement of Financial Position and recognizes a financial liability for the same amount under Asset-backed financing, which is included within Debt. The gains and losses arising from the transfer of these receivables are recorded only when they are derecognized.
Inventories
Inventories of raw materials, semi-finished products and finished goods are stated at the lower of cost and net realizable value, with cost being determined on a first-in, first-out (“FIFO”) basis. The measurement of Inventories includes the direct cost of materials and labor as well as indirect costs (variable and fixed). A provision is made for obsolete and slow-moving raw materials, finished goods, spare parts and other supplies based on their expected future use and realizable value. Net realizable value is the estimated selling price in the ordinary course of business, less the estimated costs of completion and the estimated costs for sale and distribution.
The measurement of production systems construction contracts is based on the stage of completion determined as the proportion of cost incurred at the balance sheet date over the estimated total contract cost. These items are presented net of progress billings received from customers. Any losses on such contracts are recorded in the Consolidated Income Statement when they are known.
Employee benefits
Defined contribution plans
Costs arising from defined contribution plans are expensed as incurred.
Defined benefit plans
The Group’s net obligations are determined separately for each plan by estimating the present value of future benefits that employees have earned and deducting the fair value of any plan assets. The present value of defined benefit obligations are measured using actuarial techniques and actuarial assumptions that are unbiased, mutually compatible and attribute benefits to periods in which the obligation to provide post-employment benefits arise by using the Projected Unit Credit Method. Plan assets are recognized and measured at fair value.
When the net obligation is a potential asset, the recognized amount is limited to the present value of any economic benefits available in the form of future refunds or reductions in future contributions to the plan (asset ceiling).
The components of the defined benefit cost are recognized as follows:
• Service cost is recognized in the Consolidated Income Statement by function and is presented in the relevant line items (Cost of revenues, Selling, general and other costs and Research and development costs);
• Net interest on the defined benefit liability or asset is recognized in the Consolidated Income Statement within Net financial expenses and is determined by multiplying the net liability/(asset) by the discount rate used to discount obligations taking into account the effect of contributions and benefit payments made during the year; and
• Re-measurement components of the net obligations, which comprise actuarial gains and losses, the return on plan assets (excluding interest income recognized in the Consolidated Income Statement) and any change in the effect of the asset ceiling are recognized immediately in Other comprehensive income/(loss). These re-measurement components are not reclassified to the Consolidated Income Statement in a subsequent period.

147
Past service costs arising from plan amendments and curtailments and gains and losses on the settlement of a plan are recognized immediately in the Consolidated Income Statement.
Other long term employee benefits
The Group’s obligations represent the present value of future benefits that employees have earned in return for their service. Re-measurement components on other long term employee benefits are recognized in the Consolidated Income Statement in the period in which they arise.
Share-based compensation
We have various compensation plans that provide for the granting of share-based compensation to certain employees and directors. Share-based compensation plans are accounted for in accordance with IFRS 2 - Share-based Payment, which requires the recognition of share-based compensation expense based on fair value. Compensation expense for equity-classified awards is measured at the grant date based on the fair value of the award and using the Monte Carlo simulation model, which requires the input of subjective assumptions, including the expected volatility of our common stock, interest rates and a correlation coefficient between our common stock and the relevant market index. For those awards with post-vesting contingencies, we apply an adjustment to account for the probability of meeting the contingencies.
Management uses its best estimates incorporating both publicly observable data and discounted cash flow methodologies in the measurement of fair value for liability-classified awards, which are remeasured to fair value at each balance sheet date until the award is settled.
Compensation expense is recognized over the vesting period with an offsetting increase to equity or other liabilities depending on the nature of the award. Share-based compensation expense related to plans with graded vesting are recognized using the graded vesting method. Share-based compensation expense is recognized within Selling, general and other costs within the Consolidated Income Statement.
Revenue recognition
Revenue from the sale of vehicles and service parts is recognized if it is probable that the economic benefits associated with a transaction will flow to the Group and the revenue can be reliably measured. Revenue is recognized when the risks and rewards of ownership are transferred to our customers, the sales price is agreed or determinable and collectability is reasonably assured. For vehicles, this generally corresponds to the date when the vehicles are made available to dealers or distributors, or when the vehicles are released to the carrier responsible for transporting vehicles to dealers or distributors. Revenue from the sale of vehicles, which subsequent to the sale become subject to the issuance of a residual value guarantee to an independent financing provider, is recognized consistent with the timing noted above, provided that significant risks related to the vehicle have been transferred to our customers. At that same time, a provision is made for the estimated residual value risk. Revenues are recognized net of discounts, including but not limited to, sales incentives and customer bonuses. The estimated costs of sales incentive programs include incentives offered to dealers and retail customers, and granting of retail financing at a significant discount to market interest rates. These costs are recognized at the time of the sale of the vehicle.
New vehicle sales with a buy-back commitment, or through the Guarantee Depreciation Program (“GDP”) under which the Group guarantees the residual value, or otherwise assumes responsibility for the minimum resale value of the vehicle, are not recognized at the time of delivery but are accounted for similar to an operating lease. Rental income is recognized over the contractual term of the lease on a straight-line basis. At the end of the lease term, the Group recognizes revenue for the portion of the vehicle sales price which had not been previously recognized as rental income and recognizes the remainder of the cost of the vehicle within Cost of revenues.
Revenue from services contracts, separately-priced extended warranty and from construction contracts is recognized over the contract period in proportion to the costs expected to be incurred based on historical information. A loss on these contracts is recognized if the sum of the expected costs for services under the contract exceeds unearned revenue.
148
Cost of revenues
Cost of revenues comprises expenses incurred in the manufacturing and distribution of vehicles and parts, of which the cost of materials and components are the most significant. The remaining costs primarily include labor costs, consisting of direct and indirect wages, depreciation of property, plant and equipment and amortization of other intangible assets relating to production and transportation costs. In addition, expenses which are directly attributable to the financial services companies, including interest expense related to their financing as a whole and provisions for risks and write-downs of assets, are recorded within Cost of revenues (€53 million, €77 million and €115 million for the years ended December 31, 2017, 2016 and 2015, respectively). Cost of revenues also included €397 million, €384 million and €432 million related to the decrease in value for assets sold with buy-back commitments for the years ended December 31, 2017, 2016 and 2015, respectively. In addition, estimated costs related to product warranty and recall campaigns are recorded within Cost of revenues (refer to the section —Use of Estimates below for further information).
Government Grants
Government grants are recognized in the Consolidated Financial Statements when there is reasonable assurance of the Group's compliance with the conditions for receiving such grants and that the grants will be received. Government grants are recognized as income over the periods necessary to match them with the related costs which they are intended to offset.
The benefit of a government loan at a below-market rate of interest is treated as a government grant. The benefit of the below-market rate of interest is measured as the difference between the initial carrying amount of the loan (fair value plus transaction costs) and the proceeds received, and it is accounted for in accordance with the policies used for the recognition of government grants.
Taxes
Income taxes include all taxes based on the taxable profits of the Group. Current and deferred taxes are recognized as a benefit or expense and are included in the Consolidated Income Statement for the period, except tax arising from (i) a transaction or event which is recognized, in the same or a different period, either in Other comprehensive income/(loss) or directly in Equity, or (ii) a business combination.
Deferred taxes are accounted for under the full liability method. Deferred tax liabilities are recognized for all taxable temporary differences between the carrying amounts of assets or liabilities and their tax base, except to the extent that the deferred tax liabilities arise from the initial recognition of goodwill or the initial recognition of an asset or liability in a transaction which is not a business combination and at the time of the transaction, affects neither accounting profit nor taxable profit. Deferred tax assets are recognized for all deductible temporary differences to the extent that it is probable that taxable profit will be available against which the deductible temporary differences can be utilized, unless the deferred tax assets arise from the initial recognition of an asset or liability in a transaction that is not a business combination and at the time of the transaction, affects neither accounting profit nor taxable profit.
Deferred tax assets and liabilities are measured at the substantively enacted tax rates in the respective jurisdictions in which the Group operates that are expected to apply to the period when the asset is realized or liability is settled.
The Group recognizes deferred tax liabilities associated with the existence of a subsidiary’s undistributed profits, except when it is able to control the timing of the reversal of the temporary difference, and it is probable that this temporary difference will not reverse in the foreseeable future. The Group recognizes deferred tax assets associated with the deductible temporary differences on investments in subsidiaries only to the extent that it is probable that the temporary differences will reverse in the foreseeable future and taxable profit will be available against which the temporary difference can be utilized.
Deferred tax assets relating to the carry-forward of unused tax losses and tax credits as well as those arising from deductible temporary differences, are recognized to the extent that it is probable that future profits will be available against which they can be utilized. The Group monitors unrecognized deferred tax assets at each reporting date and recognizes a previously unrecognized deferred tax asset to the extent that it has become probable that future taxable profit will allow the deferred tax asset to be recovered.
149
Current income taxes and deferred taxes are offset when they relate to the same taxation authority and there is a legally enforceable right of offset. Other taxes not based on income, such as property taxes and capital taxes, are included within Selling, general and other costs.
Fair Value Measurement
Fair value for measurement and disclosure purposes is determined as the price that would be received to sell an asset or paid to transfer a liability in an orderly transaction between market participants at the measurement date, regardless of whether that price is directly observable or estimated using a valuation technique. Fair value measurement is based on the presumption that the transaction to sell the asset or transfer the liability takes place either:
• in the principal market for the asset or liability; or
• in the absence of a principal market, in the most advantageous market for the asset or liability.
The fair value of an asset or a liability is measured using the assumptions that market participants would use when pricing the asset or liability, assuming that market participants act in their economic best interest. A fair value measurement of a non-financial asset takes into account a market participant's ability to generate economic benefits by using the asset in its highest and best use or by selling it to another market participant that would use the asset in its highest and best use. In estimating fair value, we use market-observable data to the extent it is available. When market-observable data is not available, we use valuation techniques that maximize the use of relevant observable inputs and minimize the use of unobservable inputs.
IFRS 13 - Fair Value Measurement establishes a hierarchy which prioritizes the inputs used in measuring fair value. The hierarchy gives the highest priority to quoted prices (unadjusted) in active markets for identical assets and liabilities (level 1 inputs) and the lowest priority to unobservable inputs (level 3 inputs). In some cases, the inputs used to measure the fair value of an asset or a liability might be categorized within different levels of the fair value hierarchy. In those cases, the fair value measurement is categorized in its entirety in the same level of the fair value hierarchy at the lowest level input that is significant to the entire measurement.
Levels used in the hierarchy are as follows:
• Level 1 inputs include quoted prices (unadjusted) in active markets for identical assets and liabilities that the Group can access at the measurement date. Level 1 primarily consists of financial instruments such as cash and cash equivalents and certain available-for-sale and held-for-trading securities.
• Level 2 inputs include those which are directly or indirectly observable as of the measurement date. Level 2 instruments include commercial paper and non-exchange-traded derivatives such as over-the-counter currency and commodity forwards, swaps and option contracts, which are valued using models or other valuation methodologies. These models are primarily industry-standard models that consider various assumptions, including quoted forward prices for similar instruments in active markets, quoted prices for identical or similar inputs not in active markets, and observable inputs.
• Level 3 inputs are unobservable from objective sources in the market and reflect management judgment about the assumptions market participants would use in pricing the instruments. Instruments in this category include non-exchange-traded derivatives such as over-the-counter commodity option and swap contracts.
Refer to Note 23, Fair value measurement, for additional information on fair value measurements.
Use of Estimates
The Consolidated Financial Statements are prepared in accordance with IFRS which require the use of estimates, judgments and assumptions that affect the carrying amount of assets and liabilities, the disclosure of contingent assets and liabilities and the amounts of income and expenses recognized. The estimates and associated assumptions are based on elements that are known when the financial statements are prepared, on historical experience and on any other factors that are considered to be relevant.

150
The estimates and underlying assumptions, which are based on management's best judgment, are reviewed by the Group periodically and when circumstances require. Actual results could differ from the estimates, which would require adjustment accordingly. The effects of any changes in estimates are recognized in the Consolidated Income Statement in the period in which the adjustment is made, or in future periods.
The items requiring estimates for which there is a risk that a material difference may arise in respect of the carrying amounts of assets and liabilities in the future are discussed below.
Employee Benefits
The Group provides post-employment benefits for certain of its active employees and retirees, which vary according to the legal, fiscal and economic conditions of each country in which the Group operates and may change periodically. The plans are classified by the Group on the basis of the type of benefit provided as follows: pension benefits, health care and life insurance plans, and other post-employment benefits.
Group companies provide certain post-employment benefits, such as pension or health care benefits, to their employees under defined contribution plans whereby the Group pays contributions to public or private plans on a legally mandatory, contractual, or voluntary basis. The Group recognizes the cost for defined contribution plans as incurred and classifies this by function within Cost of revenues, Selling, general and other costs and Research and development costs in the Consolidated Income Statement.
Pension plans
The Group sponsors both non-contributory and contributory defined benefit pension plans primarily in the U.S. and Canada. The majority of the plans are funded plans. The non-contributory pension plans cover certain hourly and salaried employees and the benefits are based on a fixed rate for each year of service. Additionally, contributory benefits are provided to certain salaried employees under the salaried employees’ retirement plans. In the United Kingdom, the Group participates, amongst others, in a pension plan financed by various entities belonging to the Group, called the “Fiat Group Pension Scheme” covering mainly deferred and retired employees.
The Group’s defined benefit pension plans are accounted for on an actuarial basis, which requires the use of estimates and assumptions to determine the net liability or net asset. The Group estimates the present value of the projected future payments to all participants taking into consideration parameters of a financial nature such as discount rates, the rates of salary increases and the likelihood of potential future events estimated by using demographic assumptions, which may have an effect on the amount and timing of future payments, such as mortality, dismissal and retirement rates, which are developed to reflect actual and projected plan experience. Mortality rates are developed using our plan-specific populations, recent mortality information published by recognized experts in this field, primarily the U.S. Society of Actuaries and the Canadian Institute of Actuaries, and other data where appropriate to reflect actual and projected plan experience. The expected amount and timing of contributions is based on an assessment of minimum funding requirements. From time to time contributions are made beyond those that are legally required.
Plan obligations and costs are based on existing retirement plan provisions. Assumptions regarding any potential future changes to benefit provisions beyond those to which the Group is presently committed are not made. Significant differences in actual experience or significant changes in the following key assumption may affect the pension obligations and pension expense:
• Discount rates. Our discount rates are based on yields of high-quality (AA-rated) fixed income investments for which the timing and amounts of maturities match the timing and amounts of the projected benefit payments.
The effects of actual results differing from assumptions and of amended assumptions are included in Other comprehensive income/(loss). The weighted average discount rates used to determine the defined benefit obligation for the defined benefit plans were 3.7 percent and 4.3 percent at December 31, 2017 and 2016, respectively.

151
At December 31, 2017, the effect on the defined benefit obligation of the indicated decrease or increase in the discount rate holding all other assumptions constant was as follows:
Effect on pension benefitobligation( € million)
10 basis point decrease in discount rate 30610 basis point increase in discount rate (299)
Refer to Note 19, Employee benefits liabilities, for additional information on the Group’s pension plans.
Other post-employment benefits
The Group provides health care, legal, severance, indemnity life insurance benefits and other postretirement benefits to certain hourly and salaried employees. Upon retirement, these employees may become eligible for continuation of certain benefits. Benefits and eligibility rules may be modified periodically.
These other post-retirement employee benefits (“OPEB”) are accounted for on an actuarial basis, which requires the selection of various assumptions. The estimation of the Group’s obligations, costs and liabilities associated with OPEB requires the use of estimates of the present value of the projected future payments to all participants, taking into consideration the likelihood of potential future events estimated by using demographic assumptions, which may have an effect on the amount and timing of future payments, such as mortality, dismissal and retirement rates, which are developed to reflect actual and projected plan experience, as well as legal requirements for retirement in respective countries. Mortality rates are developed using our plan-specific populations, recent mortality information published by recognized experts in this field and other data where appropriate to reflect actual and projected plan experience.
Plan obligations and costs are based on existing plan provisions. Assumptions regarding any potential future changes to benefit provisions beyond those to which the Group is presently committed are not made.
Significant differences in actual experience or significant changes in the following key assumptions may affect the OPEB obligation and expense:
• Discount rates. Our discount rates are based on yields of high-quality (AA-rated) fixed income investments for which the timing and amounts of maturities match the timing and amounts of the projected benefit payments.
• Health care cost trends. The Group’s health care cost trend assumptions are developed based on historical cost data, the near-term outlook, and an assessment of likely long-term trends.
At December 31, 2017, the effect of the indicated decreases or increases in the key assumptions affecting the health care, life insurance plans and Italian severance indemnity (trattamento di fine rapporto or “TFR”), holding all other assumptions constant, is shown below:
Effect on health care and life
insurance benefit obligationEffect on the TFR benefit obligation
(€ million)
10 basis point / (100 basis point for TFR) decrease in discount rate 30 54
10 basis point / (100 basis point for TFR) increase in discount rate (30) (47)
100 basis point decrease in health care cost trend rate (45) —
100 basis point increase in health care cost trend rate 54 —
Refer to Note 19, Employee benefits liabilities, for additional information on the Group’s OPEB liabilities.

152
Recoverability of non-current assets with definite useful lives
Non-current assets with definite useful lives include property, plant and equipment, intangible assets and assets held for sale. Intangible assets with definite useful lives mainly consist of capitalized development expenditures primarily related to the NAFTA and EMEA segments. The Group periodically reviews the carrying amount of non-current assets with definite useful lives when events or circumstances indicate that an asset may be impaired. The recoverability of non-current assets with definite useful lives is based on the estimated future cash flows, using the Group’s current business plan, of the cash generating units to which the assets relate. The global automotive industry is experiencing significant change as a result of evolving regulatory requirements for fuel efficiency, greenhouse gas emissions and other tailpipe emissions and emerging technology changes, such as autonomous driving. Our business plan could change in response to these evolving requirements and emerging technologies, which may result in changes to our estimated future cash flows and could affect the recoverability of our non-current assets with definite useful lives. Any change in recoverability would be accounted for at the time such change to the business plan occurs.
For the years ended December, 31, 2017, 2016 and 2015, the impairment tests performed compared the carrying amount of the assets included in the respective CGUs to their value in use and was determined using a discounted cash flow methodology. The value in use of the CGUs, which was based primarily on unobservable inputs, was determined using pre-tax estimated future cash flows attributable to the CGUs that were discounted using a pre-tax discount rate reflecting current market assessments of the time value of money and the risks specific to the CGUs.
During the year ended December 31, 2017, impairment losses totaling €229 million were recognized. The most significant components of this impairment loss were in EMEA, related to changes in the global product portfolio, and in LATAM, related to product portfolio changes. It was determined that the carrying amount of the CGUs exceeded their value in use and accordingly an impairment charge of €142 million was recognized in EMEA and €56 million in LATAM. In addition, during the second quarter of 2017, due to the continued deterioration of the economic conditions in Venezuela, an impairment test, which compared the carrying amount of certain of FCA Venezuela's assets to their fair value using a market approach, resulted in impairment losses of €21 million.
During the year ended December 31, 2016, impairment losses totaling €195 million were recognized. The most significant component of this impairment loss related to the impairment of capitalized development expenditures for the locally produced Fiat Viaggio and Ottimo vehicles as a result of the Group's capacity realignment to SUV production in China. It was determined that the carrying amount of the CGUs exceeded the capitalized development expenditures' value in use which resulted in an impairment charge of €90 million. In addition, due to the continued deterioration of the economic conditions in Venezuela, an impairment test which compared the carrying amount of certain of FCA Venezuela's assets to their fair value using a market approach, resulted in an impairment charge of €43 million.
During the year ended December 31, 2015, impairment losses totaling €713 million were recognized. The most significant component of this impairment loss related to the decision taken by the Group during the fourth quarter of 2015 to realign a portion of its manufacturing capacity in the NAFTA region, as part of the plan to improve NAFTA margins and to better meet market demand for Ram pickup trucks and Jeep vehicles within the Group's existing plant infrastructure. The approval of this plan was deemed to be an indicator of impairment for certain of our vehicle platform CGUs due to the significant changes to the extent to which the assets are expected to be used. It was determined that the carrying amount of the CGUs exceeded their value in use and an impairment charge of €598 million was recorded for the year ended December 31, 2015, of which €422 million related to tangible asset impairments and €176 million related to the impairment of capitalized development expenditures.
Recoverability of Goodwill and Intangible assets with indefinite useful lives
In accordance with IAS 36 - Impairment of Assets, goodwill and intangible assets with indefinite useful lives are not amortized and are tested for impairment annually or more frequently if facts or circumstances indicate that the asset may be impaired.

153
Goodwill and intangible assets with indefinite useful lives are allocated to operating segments or to CGUs within the operating segments. The impairment test is performed by comparing the carrying amount (which mainly comprises property, plant and equipment, goodwill, brands and capitalized development expenditures) and the recoverable amount of each CGU or group of CGUs to which Goodwill has been allocated. The recoverable amount of a CGU is the higher of its fair value less costs of disposal and its value in use. The balance of Goodwill and intangible assets with indefinite useful lives recognized by the Group primarily relates to the acquisition of FCA US. Goodwill has been allocated to the NAFTA, EMEA, APAC and LATAM operating segments.
The assumptions used in the impairment test represent management’s best estimate for the period under consideration. The estimate of the recoverable amount, for purposes of performing the annual impairment test for each of the operating segments, was determined using fair value less costs of disposal for the year ended December 31, 2017 and was based on the following assumptions:
• The expected future cash flows covering the period from 2018 through 2022. These expected cash flows reflect the current expectations regarding economic conditions and market trends as well as the Group’s initiatives for the period 2018 to 2022. These cash flows relate to the respective CGUs in their condition when preparing the financial statements and exclude the estimated cash flows that might arise from restructuring plans or other structural changes. Volumes and sales mix used for estimating the future cash flow are based on assumptions that are considered reasonable and sustainable and represent the best estimate of expected conditions regarding market trends and segment, brand and model share for the respective operating segment over the period considered. With regards to the LATAM operating segment, expected future cash flows also include the extension of tax benefits and other government grants to the extent such events are considered probable.
• The expected future cash flows include a normalized terminal period to estimate the future result beyond the time period explicitly considered which incorporates a long-term growth rate assumption of 2 percent.
• Post-tax cash flows have been discounted using a post-tax discount rate which reflects the current market assessment of the time value of money for the period being considered and the risks specific to the operating segment and cash flows under consideration. The Weighted Average Cost of Capital (“WACC”) ranged from approximately 12.3 percent to approximately 18.6 percent. The WACC was calculated using the Capital Asset Pricing Model technique.
The value estimated as described above was determined to be in excess of the book value of the net capital employed for each operating segment to which Goodwill has been allocated. As such, no impairment charges were recognized for Goodwill and Intangible assets with indefinite useful lives for the year ended December 31, 2017.
There were no impairment charges resulting from the impairment tests performed for the years ended December 31, 2016 and 2015.
Recoverability of deferred tax assets
Deferred tax assets are recognized to the extent that it is probable that sufficient taxable profit will be available to allow the benefit of part or all of the deferred tax assets to be utilized. The recoverability of deferred tax assets is dependent on the Group’s ability to generate sufficient future taxable income in the period in which it is assumed that the deductible temporary differences reverse and tax losses carried forward can be utilized. In making this assessment, the Group considers future taxable income arising on the most recent budgets and plans, prepared by using the same criteria described for testing the impairment of assets and goodwill. Moreover, the Group estimates the impact of the reversal of taxable temporary differences on earnings and it also considers the period over which these assets could be recovered.
The estimates and assumptions are subject to uncertainty especially as it relates to future performance in Latin America and the Eurozone. Therefore changes in current estimates due to unanticipated events could have a significant impact on our Consolidated Financial Statements.

154
Sales incentives
The Group records the estimated cost of sales incentive programs offered to dealers and consumers as a reduction to revenue at the time of sale to the dealer. This estimated cost represents the incentive programs offered to dealers and consumers, as well as the expected modifications to these programs in order to facilitate sales of the dealer inventory. Subsequent adjustments to sales incentive programs related to vehicles previously sold to dealers are recognized as an adjustment to Net revenues in the period the adjustment is determinable.
The Group uses price discounts to adjust vehicle pricing in response to a number of market and product factors, including pricing actions and incentives offered by competitors, economic conditions, the amount of excess industry production capacity, the intensity of market competition, consumer demand for the product and the desire to support promotional campaigns. The Group may offer a variety of sales incentive programs at any given point in time, including cash offers to dealers and consumers and subvention programs offered to customers, or lease subsidies, which reduce the retail customer’s monthly lease payment or cash due at the inception of the financing arrangement, or both. Sales incentive programs are generally brand, model and region specific for a defined period of time.
Multiple factors are used in estimating the future incentive expense by vehicle line including the current incentive programs in the market, planned promotional programs and the normal incentive escalation incurred as the model year ages. The estimated incentive rates are reviewed monthly and changes to planned rates are adjusted accordingly, thus impacting revenues. As there are a multitude of inputs affecting the calculation of the estimate for sales incentives, an increase or decrease of any of these variables could have a significant effect on Net revenues.
Product warranties, recall campaigns and product liabilities
The Group establishes reserves for product warranties at the time the sale is recognized. The Group issues various types of product warranties under which the performance of products delivered is generally guaranteed for a certain period or term. The accrual for product warranties includes the expected costs of warranty obligations imposed by law or contract, as well as the expected costs for policy coverage, recall actions and buyback commitments. The estimated future costs of these actions are principally based on assumptions regarding the lifetime warranty costs of each vehicle line and each model year of that vehicle line, as well as historical claims experience for the Group’s vehicles. In addition, the number and magnitude of additional service actions expected to be approved and policies related to additional service actions are taken into consideration. Due to the uncertainty and potential volatility of these estimated factors, changes in the assumptions used could materially affect the results of operations.
The Group periodically initiates voluntary service and recall actions to address various customer satisfaction as well as safety and emissions issues related to vehicles sold. Included in the reserve is the estimated cost of these service and recall actions. In NAFTA, we accrue estimated costs for recalls at the time of sale, which are based on historical claims experience as well as an additional actuarial analysis that gives greater weight to the more recent calendar year trends in recall campaign activity. In other regions and sectors, however, there generally is not sufficient historical data to support the application of an actuarial-based estimation technique. As a result, estimated recall costs for the other regions and sectors are accrued at the time when they are probable and reasonably estimable, which typically occurs once a specific recall campaign is approved and is announced.
Estimates of the future costs of these actions are inevitably imprecise due to numerous uncertainties, including the enactment of new laws and regulations, the number of vehicles affected by a service or recall action and the nature of the corrective action. It is reasonably possible that the ultimate cost of these service and recall actions may require the Group to make expenditures in excess of (or less than) established reserves over an extended period of time and in a range of amounts that cannot be reasonably estimated. The estimate of warranty and additional service and recall action obligations is periodically reviewed during the year. Experience has shown that initial data for any given model year can be volatile; therefore, our process relies upon long-term historical averages until sufficient data is available. As actual experience becomes available, it is used to modify the historical averages to ensure that the forecast is within the range of likely outcomes. Resulting accruals are then compared with current spending rates to ensure that the balances are adequate to meet expected future obligations.

155
In addition, the Group makes provisions for estimated product liability costs arising from property damage and personal injuries including wrongful death, and potential exemplary or punitive damages alleged to be the result of product defects. By nature, these costs can be infrequent, difficult to predict and have the potential to vary significantly in amount. The valuation of the reserve is actuarially determined on an annual basis based on, among other factors, the number of vehicles sold and product liability claims incurred. Costs associated with these provisions are recorded in the Consolidated Income Statement and any subsequent adjustments are recorded in the period in which the adjustment is determined.
Litigation
Various legal proceedings, claims and governmental investigations are pending against the Group on a wide range of topics, including vehicle safety, emissions and fuel economy, competition, tax and securities laws, labor, dealer, supplier and other contractual relationships, intellectual property rights, product warranties and environmental matters. Some of these proceedings allege defects in specific component parts or systems (including airbags, seats, seat belts, brakes, ball joints, transmissions, engines and fuel systems) in various vehicle models or allege general design defects relating to vehicle handling and stability, sudden unintended movement or crashworthiness. These proceedings seek recovery for damage to property, personal injuries or wrongful death and in some cases include a claim for exemplary or punitive damages. Adverse decisions in one or more of these proceedings could require the Group to pay substantial damages, or undertake service actions, recall campaigns or other costly actions.
Litigation is subject to many uncertainties, and the outcome of individual matters is not predictable with assurance. Moreover, the cases and claims against the Group are often derived from complex legal issues which are subject to differing degrees of uncertainty, including the facts and circumstances of each particular case, the manner in which the applicable law is likely to be interpreted and applied and the jurisdiction and the different laws involved. An accrual is established in connection with pending or threatened litigation if it is probable there will be an outflow of funds and when the amount can be reasonably estimated. If an outflow of funds becomes probable, but the amount cannot be estimated, the matter is disclosed in the notes to the Consolidated Financial Statements. Since these accruals represent estimates, the resolution of some of these matters could require the Group to make payments in excess of the amounts accrued or may require the Group to make payments in an amount or range of amounts that could not be reasonably estimated.
The Group monitors the status of pending legal procedures and consults with experts on legal and tax matters on a regular basis. As such, the provisions for the Group’s legal proceedings and litigation may vary as a result of future developments in pending matters.
New standards and amendments effective from January 1, 2017
The following new standards and amendments applicable from January 1, 2017 were adopted by the Group:
• Amendments to IAS 12 - Income Taxes that clarify how to account for deferred tax assets related to debt instruments measured at fair value. There was no effect to our Consolidated Financial Statements from the adoption of these amendments.
• Amendments to IAS 7 - Statement of Cash Flows introducing additional disclosures that enable users of financial statements to evaluate changes in liabilities arising from financing activities. The required disclosures have been included in Note 29, Explanatory notes to the Consolidated Statement of Cash Flows.
• Amendments to IFRS 12 - Disclosure of Interests in Other Entities, included within the Annual Improvements to IFRS Standards 2014–2016 Cycle. There was no effect to our Consolidated Financial Statements from the adoption of these amendments.
New standards, amendments and interpretations not yet effective
The following new standards and amendments were issued by the IASB. We will comply with the relevant guidance no later than their respective effective dates:

156
• IFRS 15 – Revenue from contracts with customers (“IFRS 15”), which was issued by the IASB in May 2014 and amended in September 2015 and has an effective date from January 1, 2018, the Group will adopt the provisions of IFRS 15 and all its amendments using the modified retrospective method with a cumulative adjustment to equity as of January 1, 2018. The standard requires a company to recognize revenue upon transfer of control of goods or services to a customer at an amount that reflects the consideration it expects to receive using a five-step process. The new standard also requires additional disclosures about the nature, amount, timing and uncertainty of revenue and cash flows arising from customer contracts. The majority of our revenue will continue to be recognized in a manner consistent with accounting guidance in prior years with the exception of certain GDP vehicles as well as shipping and handling activities that occur after control of the vehicle passes to the customer. Under the new standard, a GDP vehicle sale that contains no option to repurchase or includes a put option for which the customer does not have a significant economic incentive to exercise will be recognized as revenue when control transfers upon shipment of the vehicles, rather than treated as an operating lease in accordance with prior guidance. Shipping and handling activities, when arranged by FCA after control of the vehicle passes to the customer, will be a separate performance obligation in the vehicle sale arrangement for which control passes when the shipping activities are complete. Under current guidance, these activities are not considered a separately identifiable component from the vehicle. The total impact of the cumulative adjustment to equity as of January 1, 2018 is expected to be less than €50 million, and the impact to the Group’s Net profit is expected to be immaterial on an ongoing basis.
• In July 2014, the IASB issued IFRS 9 - Financial Instruments (“IFRS 9”). The standard is effective for financial years beginning on January 1, 2018. IFRS 9 introduces improvements in the accounting requirements for classification and measurement of financial assets, for impairment of financial assets and for hedge accounting. The Group will apply practical expedients permitted by the standard and not restate prior periods. For hedge accounting, the Group will apply the standard prospectively.
Financial assets will be classified and measured on the basis of the Group’s business model and characteristics of the financial asset’s cash flows. A financial asset is initially measured either at “amortized cost”, at “fair value through other comprehensive income” or at “fair value through profit or loss”. At the date of initial application of IFRS 9, except for certain receivables managed solely with the intent to be transferred to third parties before maturity that are measured at fair value through profit or loss and certain investments in other companies designated as measured at fair value through other comprehensive income, the measurement of the Group’s financial assets under IFRS 9 has not changed compared to IAS 39. The classification of financial liabilities under IFRS 9 is unchanged compared with the current accounting requirements of IAS 39.
The new impairment model requires the recognition of impairment provisions based on expected credit losses rather than only incurred losses as is the case under IAS 39. The expected credit losses will be recorded either on a 12-month or lifetime basis. The Group will apply the simplified approach and record lifetime expected losses on trade and other receivables. For receivables from financing activities the Group will apply the general approach recording the credit losses either on a 12-month or lifetime basis.
The new hedge accounting rules will align the accounting for hedge instruments more closely with the Group’s risk management practices. Generally, under IFRS 9 more hedge relationships will be eligible for hedge accounting, as the standard introduces a more principles-based approach. The Group has undertaken an assessment of its IAS 39 hedge relationships against the requirements of IFRS 9 and has concluded that the Group’s current hedge relationships will qualify as continuing hedges upon the adoption of IFRS 9. The new standard also introduces expanded disclosure requirements and changes in presentation.
Overall, the total impact of the cumulative adjustment to equity as of January 1, 2018 and the impact to the Group’s net profit is expected to be immaterial.
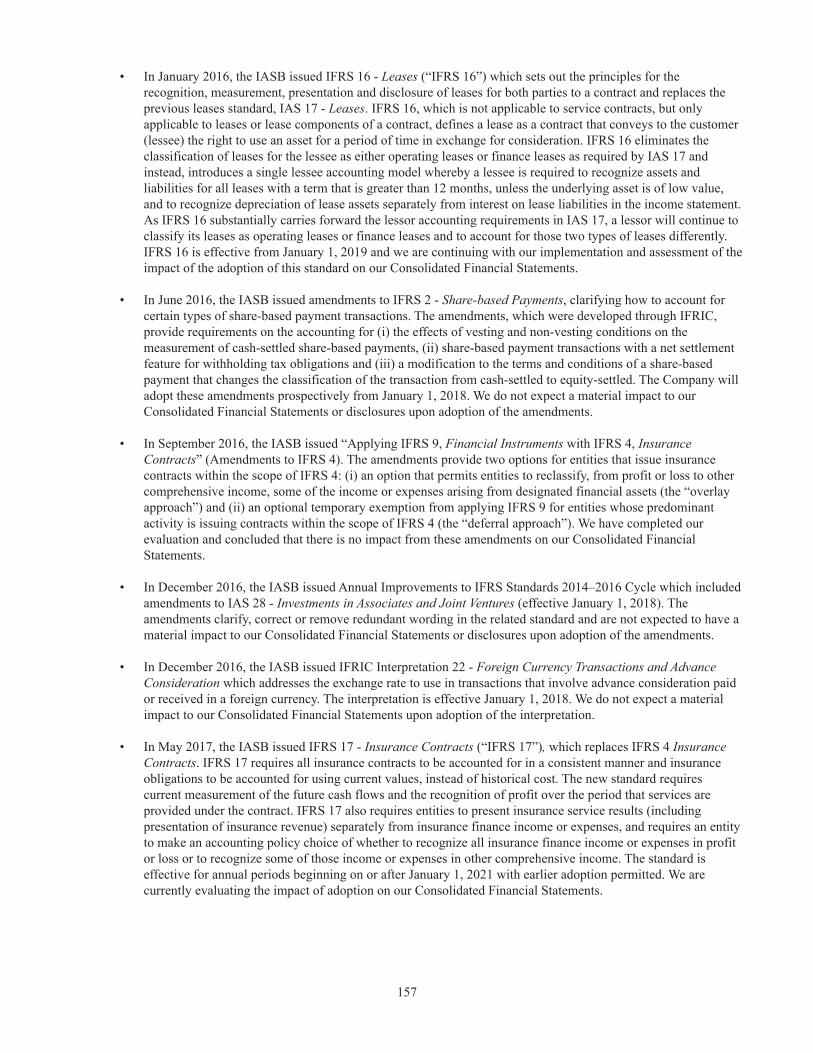
157
• In January 2016, the IASB issued IFRS 16 - Leases (“IFRS 16”) which sets out the principles for the recognition, measurement, presentation and disclosure of leases for both parties to a contract and replaces the previous leases standard, IAS 17 - Leases. IFRS 16, which is not applicable to service contracts, but only applicable to leases or lease components of a contract, defines a lease as a contract that conveys to the customer (lessee) the right to use an asset for a period of time in exchange for consideration. IFRS 16 eliminates the classification of leases for the lessee as either operating leases or finance leases as required by IAS 17 and instead, introduces a single lessee accounting model whereby a lessee is required to recognize assets and liabilities for all leases with a term that is greater than 12 months, unless the underlying asset is of low value, and to recognize depreciation of lease assets separately from interest on lease liabilities in the income statement. As IFRS 16 substantially carries forward the lessor accounting requirements in IAS 17, a lessor will continue to classify its leases as operating leases or finance leases and to account for those two types of leases differently. IFRS 16 is effective from January 1, 2019 and we are continuing with our implementation and assessment of the impact of the adoption of this standard on our Consolidated Financial Statements.
• In June 2016, the IASB issued amendments to IFRS 2 - Share-based Payments, clarifying how to account for certain types of share-based payment transactions. The amendments, which were developed through IFRIC, provide requirements on the accounting for (i) the effects of vesting and non-vesting conditions on the measurement of cash-settled share-based payments, (ii) share-based payment transactions with a net settlement feature for withholding tax obligations and (iii) a modification to the terms and conditions of a share-based payment that changes the classification of the transaction from cash-settled to equity-settled. The Company will adopt these amendments prospectively from January 1, 2018. We do not expect a material impact to our Consolidated Financial Statements or disclosures upon adoption of the amendments.
• In September 2016, the IASB issued “Applying IFRS 9, Financial Instruments with IFRS 4, Insurance Contracts” (Amendments to IFRS 4). The amendments provide two options for entities that issue insurance contracts within the scope of IFRS 4: (i) an option that permits entities to reclassify, from profit or loss to other comprehensive income, some of the income or expenses arising from designated financial assets (the “overlay approach”) and (ii) an optional temporary exemption from applying IFRS 9 for entities whose predominant activity is issuing contracts within the scope of IFRS 4 (the “deferral approach”). We have completed our evaluation and concluded that there is no impact from these amendments on our Consolidated Financial Statements.
• In December 2016, the IASB issued Annual Improvements to IFRS Standards 2014–2016 Cycle which included amendments to IAS 28 - Investments in Associates and Joint Ventures (effective January 1, 2018). The amendments clarify, correct or remove redundant wording in the related standard and are not expected to have a material impact to our Consolidated Financial Statements or disclosures upon adoption of the amendments.
• In December 2016, the IASB issued IFRIC Interpretation 22 - Foreign Currency Transactions and Advance Consideration which addresses the exchange rate to use in transactions that involve advance consideration paid or received in a foreign currency. The interpretation is effective January 1, 2018. We do not expect a material impact to our Consolidated Financial Statements upon adoption of the interpretation.
• In May 2017, the IASB issued IFRS 17 - Insurance Contracts (“IFRS 17”), which replaces IFRS 4 Insurance Contracts. IFRS 17 requires all insurance contracts to be accounted for in a consistent manner and insurance obligations to be accounted for using current values, instead of historical cost. The new standard requires current measurement of the future cash flows and the recognition of profit over the period that services are provided under the contract. IFRS 17 also requires entities to present insurance service results (including presentation of insurance revenue) separately from insurance finance income or expenses, and requires an entity to make an accounting policy choice of whether to recognize all insurance finance income or expenses in profit or loss or to recognize some of those income or expenses in other comprehensive income. The standard is effective for annual periods beginning on or after January 1, 2021 with earlier adoption permitted. We are currently evaluating the impact of adoption on our Consolidated Financial Statements.

158
• In June 2017, the IASB issued IFRIC Interpretation 23 - Uncertainty over Income Tax Treatment, (the “Interpretation”), which clarifies application of recognition and measurement requirements in IAS 12 - Income Taxes when there is uncertainty over income tax treatments. The Interpretation specifically addresses the following: (i) whether an entity considers uncertain tax treatments separately, (ii) the assumptions an entity makes about the examination of tax treatments by taxation authorities, (iii) how an entity determines taxable profit (tax loss), tax bases, unused tax losses, unused tax credits and tax rates and (iv) how an entity considers changes in facts and circumstances. The Interpretation does not add any new disclosure requirements, however it highlights the existing requirements in IAS 1 - Presentation of Financial Statements, related to disclosure of judgments, information about the assumptions made and other estimates and disclosures of tax-related contingencies within IAS 12 - Income Taxes. The Interpretation is applicable for annual reporting periods beginning on or after January 1, 2019 and it provides a choice of two transition approaches: (i) retrospective application using IAS 8 - Accounting Policies, Changes in Accounting Estimates and Errors, only if the application is possible without the use of hindsight, or (ii) retrospective application with the cumulative effect of the initial application recognized as an adjustment to equity on the date of initial application and without restatement of the comparative information. The date of initial application is the beginning of the annual reporting period in which an entity first applies this Interpretation. We are currently evaluating the implementation and the impact of adoption of the interpretation on our Consolidated Financial Statements.
• In October 2017, the IASB issued Prepayment Features with Negative Compensation (Amendments to IFRS 9), allowing companies to measure particular prepayable financial assets with so-called negative compensation at amortized cost or at fair value through other comprehensive income if a specified condition is met, instead of at fair value through profit or loss, effective January 1, 2019. We are currently evaluating the impact of adoption on our Consolidated Financial Statements.
• In October 2017, the IASB issued Long-term interests in associates and joint ventures (Amendments to IAS 28), which clarifies that companies account for long-term interests in an associate or joint venture, to which the equity method is not applied, using IFRS 9, effective January 1, 2019. We are currently evaluating the impact of adoption on our Consolidated Financial Statements.
• In December 2017, the IASB issued the Annual Improvements to IFRSs 2015-2017, a series of amendments to IFRSs in response to issues raised mainly on IFRS 3 - Business Combinations, which clarifies that a company remeasure its previously held interest in a joint operation when it obtains control of the business, on IFRS 11 - Joint Arrangements, a company does not remeasure its previously held interest in a joint operation when it obtains joint control of the business, on IAS 12 - Income Taxes, which clarifies that all income tax consequences of dividends (i.e. distribution of profits) should be recognized in profit or loss, regardless of how the tax arises, and on IAS 23 - Borrowing Costs, which clarifies that a company treats as part of general borrowing any borrowing originally made to develop an asset when the asset is ready for its intended use or sale. The effective date of the amendments is January 1, 2019. We are currently evaluating the impact of adoption on our Consolidated Financial Statements.
• In February 2018, the IASB issued Plan Amendment, Curtailment or Settlement (Amendments to IAS 19) which specifies how companies determine pension expenses when changes to a defined benefit pension plan occur. IAS 19 Employee Benefits specifies how a company accounts for a defined benefit plan. When a change to a plan-an amendment, curtailment or settlement-takes place, IAS 19 requires a company to remeasure its net defined benefit liability or asset. The amendments require a company to use the updated assumptions from this remeasurement to determine current service cost and net interest for the remainder of the reporting period after the change to the plan. The amendments are effective on or after 1 January 2019. We are currently evaluating the impact of adoption on our Consolidated Financial Statements.
159
3. Scope of consolidation
The following table sets forth a list of the principal subsidiaries of FCA, which are grouped according to each of our reportable segments as well as our holding and other companies:
Name Country Percentage
Interest Held NAFTA
FCA US LLC USA (Delaware) 100.00
FCA Canada Inc. Canada 100.00FCA Mexico, S.A. de C.V. Mexico 100.00LATAM
FCA Fiat Chrysler Automoveis Brasil LTDA Brazil 100.00
FCA Automobiles Argentina S.A. Argentina 100.00
Banco Fidis S.A. Brazil 100.00APACChrysler Group (China) Sales Limited People’s Republic of China 100.00FCA Japan Ltd. Japan 100.00FCA Australia Pty Ltd. Australia 100.00FCA Automotive Finance Co. Ltd. People’s Republic of China 100.00EMEA
FCA Italy S.p.A. Italy 100.00FCA Melfi S.r.l. Italy 100.00FCA Poland Spólka Akcyjna Poland 100.00FCA Powertrain Poland Sp. z o.o. Poland 100.00FCA Serbia d.o.o. Kragujevac Serbia 66.67
FCA Germany AG Germany 100.00FCA France S.A. France 100.00Fiat Chrysler Automobiles UK Ltd. United Kingdom 100.00Fiat Chrysler Automobiles Spain S.A. Spain 100.00
Fidis S.p.A. Italy 100.00Maserati
Maserati S.p.A. Italy 100.00Maserati (China) Cars Trading Co. Ltd. People's Republic of China 100.00
Maserati North America Inc. USA (Delaware) 100.00
ComponentsMagneti Marelli S.p.A. Italy 99.99 (1)
Automotive Lighting LLC USA (Delaware) 100.00Automotive Lighting Reutlingen GmbH Germany 99.99
Teksid S.p.A. Italy 100.00
Comau S.p.A. Italy 100.00COMAU LLC USA (Delaware) 100.00
Holding Companies and Other CompaniesFCA North America Holdings LLC USA (Delaware) 100.00
Fiat Chrysler Finance S.p.A. Italy 100.00
Fiat Chrysler Finance Europe S.A. Luxembourg 100.00__________________________(1) FCA holds 100 percent of the voting interest in Magneti Marelli S.p.A.
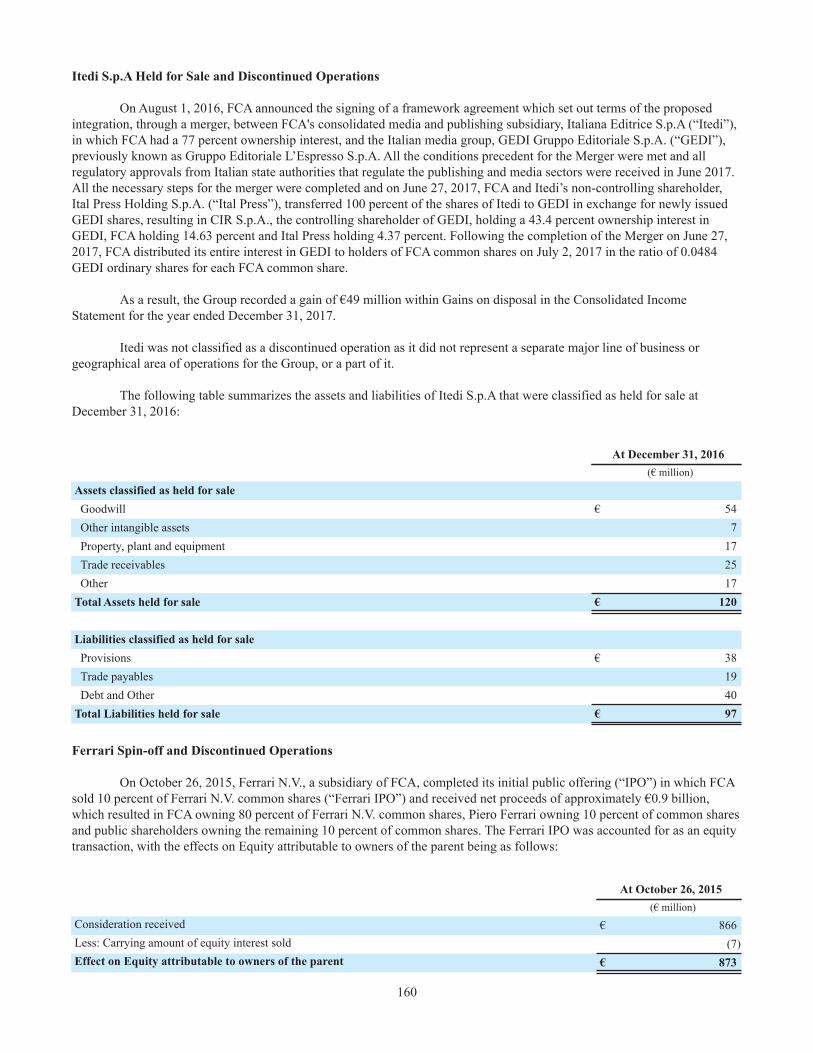
160
Itedi S.p.A Held for Sale and Discontinued Operations
On August 1, 2016, FCA announced the signing of a framework agreement which set out terms of the proposed integration, through a merger, between FCA's consolidated media and publishing subsidiary, Italiana Editrice S.p.A (“Itedi”), in which FCA had a 77 percent ownership interest, and the Italian media group, GEDI Gruppo Editoriale S.p.A. (“GEDI”), previously known as Gruppo Editoriale L’Espresso S.p.A. All the conditions precedent for the Merger were met and all regulatory approvals from Italian state authorities that regulate the publishing and media sectors were received in June 2017. All the necessary steps for the merger were completed and on June 27, 2017, FCA and Itedi’s non-controlling shareholder, Ital Press Holding S.p.A. (“Ital Press”), transferred 100 percent of the shares of Itedi to GEDI in exchange for newly issued GEDI shares, resulting in CIR S.p.A., the controlling shareholder of GEDI, holding a 43.4 percent ownership interest in GEDI, FCA holding 14.63 percent and Ital Press holding 4.37 percent. Following the completion of the Merger on June 27, 2017, FCA distributed its entire interest in GEDI to holders of FCA common shares on July 2, 2017 in the ratio of 0.0484 GEDI ordinary shares for each FCA common share.
As a result, the Group recorded a gain of €49 million within Gains on disposal in the Consolidated Income Statement for the year ended December 31, 2017.
Itedi was not classified as a discontinued operation as it did not represent a separate major line of business or geographical area of operations for the Group, or a part of it.
The following table summarizes the assets and liabilities of Itedi S.p.A that were classified as held for sale at December 31, 2016:
At December 31, 2016(€ million)
Assets classified as held for saleGoodwill € 54Other intangible assets 7Property, plant and equipment 17Trade receivables 25Other 17
Total Assets held for sale € 120
Liabilities classified as held for saleProvisions € 38Trade payables 19Debt and Other 40
Total Liabilities held for sale € 97
Ferrari Spin-off and Discontinued Operations
On October 26, 2015, Ferrari N.V., a subsidiary of FCA, completed its initial public offering (“IPO”) in which FCA sold 10 percent of Ferrari N.V. common shares (“Ferrari IPO”) and received net proceeds of approximately €0.9 billion, which resulted in FCA owning 80 percent of Ferrari N.V. common shares, Piero Ferrari owning 10 percent of common shares and public shareholders owning the remaining 10 percent of common shares. The Ferrari IPO was accounted for as an equity transaction, with the effects on Equity attributable to owners of the parent being as follows:
At October 26, 2015(€ million)
Consideration received € 866Less: Carrying amount of equity interest sold (7)Effect on Equity attributable to owners of the parent € 873

161
In connection with the Ferrari IPO and in preparation for the spin-off of the remaining common shares of Ferrari N.V. owned by FCA, FCA carried out an internal corporate restructuring. As part of this reorganization, FCA transferred its shares of Ferrari S.p.A. to Ferrari N.V. and also provided a capital contribution to Ferrari N.V., while Ferrari N.V. issued a note payable to FCA in the amount of €2.8 billion. This internal restructuring was a common control transaction and did not have an accounting impact on the Consolidated Financial Statements. As a result, and in connection with the transactions in which Piero Ferrari exchanged his shares in Ferrari S.p.A. for Ferrari N.V. shares, FCA paid €280 million to Piero Ferrari as consideration for the dilution of his share value due to the issuance of the €2.8 billion note payable, which was recorded as a reduction to non-controlling interests.
On December 3, 2015, an extraordinary general meeting of FCA shareholders was held, whereby the transactions intended to separate FCA’s remaining ownership interest in Ferrari N.V. and to distribute that ownership interest to holders of FCA shares and mandatory convertible securities were approved.
As the spin-off of Ferrari N.V. became highly probable with the aforementioned shareholders' approval and since it was available for immediate distribution at that date, the Ferrari segment met the criteria to be classified as a disposal group held for distribution to owners and a discontinued operation pursuant to IFRS 5 - Non-current Assets Held for Sale and Discontinued Operations at December 31, 2015. Since Exor N.V., which controls and consolidates FCA (refer to Note 24, Related party transactions), continued to control and consolidate Ferrari N.V. after the spin-off, this was deemed to be a common control transaction and was accounted for at book value.
The operating results of Ferrari were excluded from the Group's continuing operations and presented as a single line item within the Consolidated Income Statement, Consolidated Statement of Comprehensive Income and Consolidated Statement of Cash flows for the year ended December 31, 2015.
The following table summarizes the operating results of Ferrari that were excluded from the Consolidated Income Statement for the year end December 31, 2015:
For the year ended December 31, 2015 (1)
(€ million)
Net revenues € 2,596Expenses 2,152Net financial expenses/(income) 16Profit before taxes from discontinued operations 428Tax expense 144Profit from discontinued operations, net of tax € 284
________________________________(1) Amounts presented are not representative of the income statement and the financial position of Ferrari on a stand-alone basis; amounts are net of transactions between Ferrari and other companies of the Group.
The spin-off of Ferrari N.V. from the Group was completed on January 3, 2016. The assets and liabilities of the Ferrari segment were distributed to holders of FCA shares and mandatory convertible securities without any gain or loss on distribution. FCA shareholders received one common share of Ferrari N.V. for every ten common shares of FCA and holders of the mandatory convertible securities were entitled to receive 0.77369 common shares of Ferrari N.V. for each mandatory convertible security of U.S.$100 notional amount held of record on January 5, 2016. In addition, FCA shareholders participating in the FCA loyalty voting structure received one special voting share of Ferrari N.V. for every ten special voting shares of FCA held of record on January 5, 2016. On January 13, 2016, holders of FCA shares also received a cash payment of €0.01, less any required applicable withholding tax, for each share held of record as of January 5, 2016.

162
Deconsolidation of FCA Venezuela
Throughout 2017, macroeconomic conditions in Venezuela continued to deteriorate. In the second quarter of 2017, asset impairment charges of €21 million relating to certain real estate assets in Venezuela were recognized, recorded within Selling, general and other costs. In December 2017, due to the restrictive monetary policy in Venezuela coupled with the inability to pay dividends and the U.S. Dollar obligations, as well as the deteriorating economic conditions, which has constrained the ability to maintain normal production in Venezuela, we concluded we are no longer able to exert control over our Venezuela operations in order to affect our returns. As such, in accordance with IFRS 10 - Consolidated Financial Statements, as of December 31, 2017, we deconsolidated our subsidiary FCA Venezuela LLC (“FCA Venezuela”), which resulted in a pre-tax, non-cash charge of €42 million recorded within Selling, general and other costs in the Consolidated Income Statement for the year ended December 31, 2017. Upon deconsolidation, FCA's investment in FCA Venezuela was recognized at fair value, which was nil at December 31, 2017 and will be accounted for at cost in subsequent periods.
In March 2016, the Venezuelan government modified its foreign currency exchange systems and the official exchange rate, CENCOEX, was replaced with DIPRO, only available for purchases and sales of essential items, such as food and medicine. In addition, the official exchange rate was devalued from 6.3 VEF to 10 VEF per U.S. Dollar and the SICAD exchange system was terminated. The SIMADI exchange rate was replaced with the “floating” Sistema de Divisa Complementaria, or the “DICOM” exchange rate, available for all transactions not subject to the DIPRO exchange rate. In 2016, the DICOM exchange rate was used to complete the majority of FCA Venezuela's transactions to exchange VEF for U.S. Dollars. At December 31, 2016, the DICOM exchange rate of 674 VEF per U.S. Dollar and total re-measurement charges, including the devaluation and the write-down of SICAD receivables, of €19 million were recorded within Cost of revenues in the Consolidated Income Statement for the year ended December 31, 2016.
In February 2015, the SIMADI rate introduced by the Venezuelan government began trading at 170.0 Venezuelan Bolivar (“VEF”) to U.S. Dollar for entities in the private sector. Also in February 2015, the Venezuelan government also announced that the Supplementary Foreign Currency Administration System (“SICAD I”) and the additional system introduced in March 2014 (“SICAD II”) would be merged into the SICAD, a single exchange system, with a rate starting at 12.0 VEF to U.S. Dollar. As of March 31, 2015, the SICAD exchange rate was expected to be used to complete the majority of FCA Venezuela's transactions and as such, it was deemed the appropriate rate to use to convert our VEF denominated monetary assets and liabilities to U.S. Dollar. At June 30, 2015, the Group then adopted the SIMADI exchange rate and recorded a re-measurement charge on our VEF denominated net monetary assets in Venezuela of €53 million using an exchange rate of 197.3 VEF per U.S. Dollar. In addition, we recorded a €27 million charge for the write-down of inventory in Venezuela, as due to pricing controls, we were unable to increase VEF sales prices to compensate for the devaluation. The total charge of €80 million was recorded within Cost of revenues in the Consolidated Income Statement for the year ended December 31, 2015.
The following significant transactions with non-controlling interests occurred:
2017
• Disposal of the 16.0 percent of the Group's interest in FMM Pernambuco to the minority interest in January 2017, and subsequent loss of control during the third quarter of 2017 resulting in a gain on disposal of €19 million.
2016
• There were no significant transactions with non-controlling interests.
2015
• Acquisition of the remaining 15.2 percent interest in Teksid S.p.A. from Renault in December 2015. As a result, all the rights and obligations arising from the previous shareholder agreement between FCA and Renault, including the put option, were canceled.

163
4. Net revenues
Net revenues were as follows:
Years ended December 312017 2016 2015
(€ million)Revenues from:
Sales of goods € 107,219 € 107,497 € 107,095Services provided 2,217 2,237 1,600Contract revenues 929 737 1,309Lease installments from assets sold with a buy-back commitment 421 405 403Interest income of financial services activities 148 142 188
Total Net revenues € 110,934 € 111,018 € 110,595
Net revenues attributed by geographical area were as follows:
Years ended December 312017 2016 2015
(€ million)
Net revenues in:North America € 68,374 € 71,047 € 71,979Italy 8,755 8,478 7,165Brazil 6,406 4,953 5,103China 4,240 4,493 4,720Germany 3,990 4,160 3,794France 3,487 3,266 2,852Argentina 1,817 1,409 1,175Spain 1,569 1,467 1,254Turkey 1,456 1,705 1,682United Kingdom 1,366 1,632 1,744Japan 816 713 625Australia 497 473 936Other countries 8,161 7,222 7,566
Total Net revenues € 110,934 € 111,018 € 110,595
5. Research and development costs
Research and development costs were as follows:
Years ended December 312017 2016 2015
(€ million)
Research and development expenditures expensed € 1,696 € 1,661 € 1,449Amortization of capitalized development expenditures 1,424 1,492 1,194Impairment and write-off of capitalized development expenditures 110 121 221Total Research and development costs € 3,230 € 3,274 € 2,864

164
The impairment and write-off of capitalized development expenditures during the year ended December 31, 2017 mainly related to global product portfolio changes in EMEA and changes in the LATAM product portfolio.
The impairment and write-off of capitalized development expenditures during the year ended December 31, 2016 mainly related to the Group's capacity realignment to SUV production in China, which resulted in an impairment charge of €90 million for the locally produced Fiat Viaggio and Ottimo vehicles.
The impairment and write-off of capitalized development expenditures during the year ended December 31, 2015 mainly related to the Group's plan to realign a portion of its manufacturing capacity in NAFTA to better meet demand for Ram pickup trucks and Jeep vehicles within the Group's existing plant infrastructure, which resulted in an impairment charge of €176 million for capitalized development expenditures that had no future economic benefit.
Refer to Note 10, Other intangible assets, for information on capitalized development expenditures.
6. Net financial expenses
The following table summarizes the Group’s financial income and expenses included within the Net financial expenses line item:
Years ended December 312017 2016 2015
(€ million)
Interest income and other financial income € 182 € 226 € 365
Financial expenses:Interest expense and other financial expenses: 1,128 1,500 2,084
Interest expense on notes 568 749 1,112Interest expense on borrowings from bank 372 472 512Other interest cost and financial expenses 188 279 460
Write-down of financial assets 23 76 43Losses on disposal of securities 5 6 28Net interest expense on employee benefits provisions 310 348 350
Total Financial expenses 1,466 1,930 2,505Net expenses from derivative financial instruments and exchange rate differences 185 312 226Total Financial expenses and Net expenses from derivative financialinstruments and exchange rate differences 1,651 2,242 2,731
Net Financial expenses € 1,469 € 2,016 € 2,366
Other interest cost and financial expenses for the year ended December 31, 2017 included a loss of €3 million in relation to the prepayment by FCA US in February 2017 of the outstanding principal and accrued interest for its tranche B term loan (refer to Note 21, Debt). Other interest cost and financial expenses for the year ended December 31, 2017 included a gain on extinguishment of debt of €9 million related to the prepayment of all scheduled payments due on the Canada Health Care Trust (“HCT”) Tranche B Note (refer to Note 21, Debt).
Other interest cost and financial expenses for the year ended December 31, 2016 included a loss on extinguishment of debt totaling €10 million related to the U.S.$2.0 billion (€1.8 billion) voluntary prepayment, with cash on hand, of the principal at par of FCA US's tranche B term loan maturing on May 24, 2017 and FCA US's tranche B term loan maturing on December 31, 2018. Other interest cost and financial expenses for the year ended December 31, 2016 also included a loss on extinguishment of debt of €8 million related to the prepayment of all scheduled payments due on the Canada Health Care Trust (“HCT”) Tranche C Note (refer to Note 21, Debt).

165
Other interest cost and financial expenses for the year ended December 31, 2015 included a loss on extinguishment of debt totaling €168 million related to the prepayment of the secured senior notes of FCA US due in 2019 and 2021.
7. Tax expense
The following table summarizes Tax expense:
Years ended December 312017 2016 2015
(€ million)
Current tax expense € 901 € 869 € 445Deferred tax expense/(benefit) 1,773 391 (277)Tax expense/(benefit) relating to prior periods (23) 32 (2)Total Tax expense € 2,651 € 1,292 € 166
The applicable tax rate used to determine the theoretical income taxes was the statutory rate in the United Kingdom (“UK”), the tax jurisdiction in which FCA NV is resident. The reconciliation between the theoretical income taxes calculated on the basis of the theoretical tax rate of 19.25 percent in 2017 (20 percent in 2016 and 20.25 percent in 2015) and income taxes recognized was as follows:
Years ended December 312017 2016 2015
(€ million)
Theoretical income taxes € 1,186 € 621 € 51Tax effect on:
Recognition and utilization of previously unrecognized deferred tax assets (164) (42) (20)Permanent differences (397) (194) (36)Tax credits (23) (340) (238)Deferred tax assets not recognized and write-downs 1,092 531 303Differences between foreign tax rates and the theoretical applicable tax rate andtax holidays 924 587 70
Taxes relating to prior years (23) 32 (2)Tax rate changes (22) — —Withholding tax 83 61 49Other differences 0 (8) (36)
Total Tax expense, excluding IRAP 2,656 1,248 141Effective tax rate 43.0% 40.2% 54.4%IRAP (current and deferred) (5) 44 25Total Tax expense € 2,651 € 1,292 € 166
In 2017, the Company recognized Regional Italian Income Tax (“IRAP”) current tax expense of €33 million (and an expense of €36 million in 2016 and an expense of €16 million in 2015) and the recognized IRAP deferred tax benefit of €38 million (an expense of €8 million in 2016 and an expense of €9 million in 2015). As the IRAP taxable basis differs from Profit before taxes, it is excluded from the effective tax rates above.
The increase in the effective tax rate to 43.0 percent in 2017 from 40.2 percent in 2016 was mainly due to (i) reduced generation and utilization of tax credits in NAFTA and (ii) a decrease in Brazilian deferred tax assets; partially offset by (iii) tax benefits recorded on changes to prior years’ tax positions and (iv) improved performance in EMEA and LATAM.
The Tax Cuts and Jobs Act (the “Tax Act”) was enacted into law in the U.S. on December 22, 2017. The Tax Act includes various changes to U.S. tax law, including a permanent reduction in the U.S. federal corporate income tax rate. The Tax Act also imposes a one-time tax, at a special reduced tax rate, on the deemed repatriation of the post-1986 unremitted earnings from their non-U.S. subsidiaries to the Company’s U.S. subsidiaries.

166
Based on the information available as of December 31, 2017, the Company estimated net tax expense of €88 million in 2017 for the effects of the changes in the tax rate, which includes an expense of €117 million, primarily related to the deemed repatriation resulting from the Tax Act. The expense may be adjusted, potentially materially, as a result of regulations or regulatory guidance that may be issued, changes in interpretations affecting assumptions underlying the estimate, refinement of our calculations, and actions that may be taken, including actions in response to the Tax Act.
The Group recognizes the amount of Deferred tax assets less the Deferred tax liabilities of the individual companies within Deferred tax assets, where these may be offset. Amounts recognized were as follows:
At December 312017 2016
(€ million)
Deferred tax assets € 2,004 € 3,699Deferred tax liabilities (388) (194)Total Net deferred tax assets € 1,616 € 3,505
The decrease in Net deferred tax assets at December 31, 2017 from December 31, 2016 was mainly due to (i) a €1,268 million decrease related to the utilization of U.S. tax credit carryforwards, revaluation of U.S. deferred tax assets and liabilities due to the Tax Act and reductions to other NAFTA deferred tax assets, and (ii) a €734 million decrease to Brazil deferred tax assets; partially offset by (iii) a €178 million increase to EMEA deferred tax assets.
The decrease in Deferred tax assets in Brazil was primarily composed of €281 million related to the reversal of the Brazilian indirect tax liability (refer to Note 22, Other liabilities and Tax payables) and €453 million that was written off as the Group revised its outlook on Brazil to reflect the slower pace of recovery and outlook for the subsequent years, largely resulting from increased political uncertainty, and concluded that a portion of the deferred tax assets in Brazil was no longer recoverable.
The Tax Act reduces the U.S. federal corporate income tax rate from 35% to 21% effective January 1, 2018. We estimated the related changes in our deferred tax assets and deferred tax liabilities, which resulted in a €137 million decrease in Net deferred tax liability (€29 million to the Consolidated Income Statement and €108 million to Equity), and a €71 million decrease in Net deferred tax assets recorded to Other Comprehensive Income. The net tax benefit may be revised in future quarters as the related temporary differences are further evaluated.
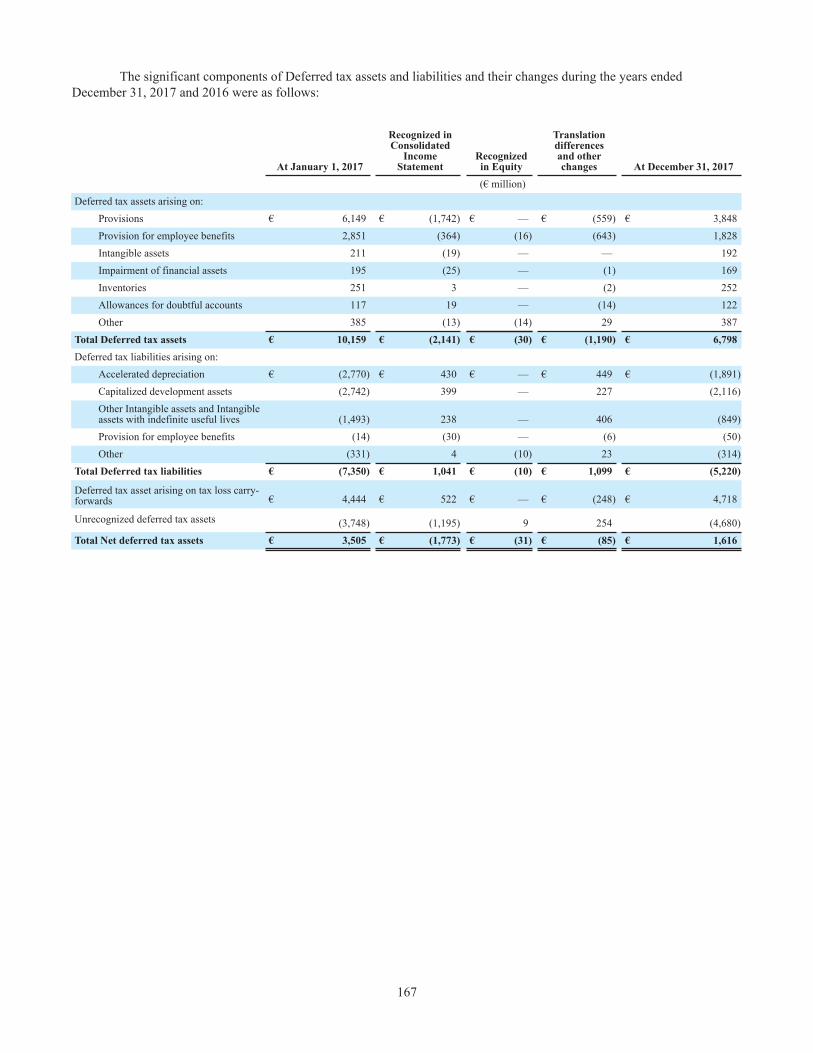
167
The significant components of Deferred tax assets and liabilities and their changes during the years ended December 31, 2017 and 2016 were as follows:
At January 1, 2017
Recognized in Consolidated
Income Statement
Recognized in Equity
Translationdifferencesand otherchanges At December 31, 2017
(€ million)Deferred tax assets arising on:
Provisions € 6,149 € (1,742) € — € (559) € 3,848Provision for employee benefits 2,851 (364) (16) (643) 1,828Intangible assets 211 (19) — — 192Impairment of financial assets 195 (25) — (1) 169Inventories 251 3 — (2) 252Allowances for doubtful accounts 117 19 — (14) 122Other 385 (13) (14) 29 387
Total Deferred tax assets € 10,159 € (2,141) € (30) € (1,190) € 6,798Deferred tax liabilities arising on:
Accelerated depreciation € (2,770) € 430 € — € 449 € (1,891)Capitalized development assets (2,742) 399 — 227 (2,116)Other Intangible assets and Intangible assets with indefinite useful lives (1,493) 238 — 406 (849)Provision for employee benefits (14) (30) — (6) (50)Other (331) 4 (10) 23 (314)
Total Deferred tax liabilities € (7,350) € 1,041 € (10) € 1,099 € (5,220)
Deferred tax asset arising on tax loss carry-forwards € 4,444 € 522 € — € (248) € 4,718
Unrecognized deferred tax assets (3,748) (1,195) 9 254 (4,680)Total Net deferred tax assets € 3,505 € (1,773) € (31) € (85) € 1,616

168
At January 1,
2016
Recognized inConsolidated
IncomeStatement
Recognizedin Equity
Transfer toassets held for
sale
Translationdifferences and
otherchanges
AtDecember31, 2016
(€ million)Deferred tax assets arising on:
Provisions € 6,028 € (4) € — € (6) € 131 € 6,149Provision for employee benefits 2,866 (11) (263) — 259 2,851Intangible assets 249 (42) — — 4 211Impairment of financial assets 155 47 — (2) (5) 195Inventories 243 6 — — 2 251Allowances for doubtful accounts 87 21 — (2) 11 117Other 691 (270) 64 — (100) 385
Total Deferred tax assets € 10,319 € (253) € (199) € (10) € 302 € 10,159Deferred tax liabilities arising on:
Accelerated depreciation € (2,746) € (53) € — € 1 € 28 € (2,770)Capitalized development expenditures (2,376) (310) — — (56) (2,742)Other Intangible assets and Intangibleassets with indefinite useful lives (1,427) 23 — 7 (96) (1,493)Provision for employee benefits (14) — 2 1 (3) (14)Other (390) 67 5 — (13) (331)
Total Deferred tax liabilities € (6,953) € (273) € 7 € 9 € (140) € (7,350)Deferred tax asset arising on tax loss carry-forwards € 3,717 € 662 € — € (20) € 85 € 4,444Unrecognized deferred tax assets (3,183) (527) — 20 (58) (3,748)Total Net deferred tax assets € 3,900 € (391) € (192) € (1) € 189 € 3,505
As of December 31, 2017, the Group had Deferred tax assets on deductible temporary differences of €6,798 million (€10,159 million at December 31, 2016), of which €940 million was not recognized (€551 million at December 31, 2016). As of December 31, 2017, the Group also had Deferred tax assets on tax loss carry-forwards of €4,718 million (€4,444 million at December 31, 2016), of which €3,740 million was not recognized (€3,197 million at December 31, 2016).
As of December 31, 2017, the Group had total Net deferred tax assets of €3,256 million (€2,902 million at December 31, 2016) in Italy primarily attributable to Italian tax loss carry-forwards that can be carried forward indefinitely. The Group has determined that it is probable that sufficient Italian taxable income will be generated in future periods that will allow us to realize €898 million of Italian Net deferred tax assets (€750 million at December 31, 2016). As a result, €2,358 million of Net deferred tax assets in Italy were not recognized as of December 31, 2017 (€2,152 million at December 31, 2016).
As of December 31, 2017, the Group had total Net deferred tax assets of €1,287 million in Brazil (€1,276 million at December 31, 2016) primarily attributable to Brazilian tax loss carry-forwards which can be carried forward indefinitely. The Group continues to recognize Brazilian Net deferred tax assets of €148 million (€976 million at December 31, 2016) as the Group considers it probable that we will have sufficient taxable income in the future that will allow us to realize these net deferred tax assets. As a result,€1,139 million of Net deferred tax assets in Brazil, which include Brazil tax losses, were not recognized as of December 31, 2017 (€300 million at December 31, 2016).
Deferred tax liabilities on the undistributed earnings of subsidiaries have not been recognized, except in cases where it is probable the distribution will occur in the foreseeable future.

169
Total gross deductible and taxable temporary differences and accumulated tax losses at December 31, 2017, together with the amounts for which deferred tax assets have not been recognized, analyzed by year of expiration, were as follows:
Year of expirationAt December
31, 2017 2018 2019 2020 2021Beyond
2021Unlimited/
Indeterminable(€ million)
Temporary differences and taxlosses relating to corporatetaxation:
Deductible temporarydifferences € 28,720 € 3,665 € 2,974 € 2,786 € 3,293 € 15,512 € 490Taxable temporary differences (23,028) (2,390) (2,304) (2,323) (2,324) (10,390) (3,297)Tax losses 18,133 147 142 136 155 3,844 13,709Amounts for which deferredtax assets were not recognized (17,534) (640) (292) (147) (649) (3,464) (12,342)
Temporary differences and taxlosses relating to corporatetaxation € 6,291 € 782 € 520 € 452 € 475 € 5,502 € (1,440)Temporary differences and taxlosses relating to local taxation (i.e.IRAP in Italy):
Deductible temporarydifferences € 9,657 € 1,177 € 761 € 599 € 1,149 € 5,909 € 62Taxable temporary differences (7,993) (691) (658) (671) (681) (5,153) (139)Tax losses 3,715 53 36 33 120 2,902 571Amounts for which deferredtax assetswere not recognized (4,439) (398) (157) (82) (635) (2,601) (566)
Temporary differences and taxlosses relating to local taxation € 940 € 141 € (18) € (121) € (47) € 1,057 € (72)
8. Other information by nature
Personnel costs for the Group for the years ended December 31, 2017, 2016 and 2015 amounted to €13.2 billion, €13.2 billion and €13.4 billion, respectively, and included costs that were capitalized mainly in connection with product development activities.
For the years ended December 31, 2017, 2016 and 2015, FCA had an average number of employees of 237,150, 235,481 and 236,559, respectively.
9. Goodwill and intangible assets with indefinite useful lives
Goodwill and intangible assets with indefinite useful lives at December 31, 2017 and 2016 are summarized below:
At January 1, 2017Translation
differences and Other At December 31, 2017(€ million)
Gross amount € 12,299 € (1,449) € 10,850Accumulated impairment losses (482) 28 (454)Goodwill 11,817 (1,421) 10,396Brands 3,405 (411) 2,994Total Goodwill and intangible assets withindefinite useful lives € 15,222 € (1,832) € 13,390

170
At January 1, 2016Translationdifferences
Transfer to Assets held for sale At December 31, 2016
(€ million)
Gross amount € 11,966 € 387 € (54) € 12,299Accumulated impairment losses (469) (13) — (482)Goodwill 11,497 374 (54) 11,817Brands 3,293 112 — 3,405Total Goodwill and intangible assetswith indefinite useful lives € 14,790 € 486 € (54) € 15,222
Translation differences in 2017 and 2016 primarily related to foreign currency translation of the U.S. Dollar to the Euro.
Brands
Brands, composed of the Chrysler, Jeep, Dodge, Ram and Mopar brands, resulted from the acquisition of FCA US and are allocated to the NAFTA segment. These rights are protected legally through registration with government agencies and through the continuous use in commerce. As these rights have no legal, contractual, competitive or economic term that limits their useful lives, they are classified as intangible assets with indefinite useful lives and are therefore not amortized but are instead tested annually for impairment.
For the purpose of impairment testing, the carrying value of Brands is tested jointly with the goodwill allocated to the NAFTA segment.
Goodwill
At December 31, 2017, Goodwill included €10,311 million from the acquisition of FCA US (€11,731 million at December 31, 2016). At December 31, 2016, €54 million of goodwill was classified within Assets held for sale as a result of Itedi meeting the held for sale criteria (see Note 3, Scope of consolidation).
There were no impairment charges recognized in respect of Goodwill and intangible assets with indefinite lives during the years ended December 31, 2017, 2016 and 2015.
The following table summarizes the allocation of Goodwill between FCA's reportable segments:
At December 312017 2016
(€ million)
NAFTA € 8,453 € 9,618APAC 1,099 1,250LATAM 529 602EMEA 253 285Components 62 62Total Goodwill € 10,396 € 11,817

171
10. Other intangible assets
Externallyacquired
developmentexpenditures
Internallygenerated
developmentexpenditures
Patents,concessions,licenses and
credits
Otherintangible
assets Total(€ million)
Gross carrying amount at January 1, 2016 € 9,262 € 6,487 € 3,120 € 701 € 19,570Additions 1,546 1,012 490 58 3,106Divestitures (1) (49) (80) (7) (137)Translation differences and other changes 265 217 22 87 591Transfer to Assets held for sale — — — (38) (38)At December 31, 2016 11,072 7,667 3,552 801 23,092Additions 1,997 589 356 65 3,007Divestitures (289) (40) (16) (1) (346)Translation differences and other changes (967) (130) (309) (61) (1,467)At December 31, 2017 11,813 8,086 3,583 804 24,286Accumulated amortization and impairment lossesat January 1, 2016 3,993 3,617 1,583 431 9,624Amortization 962 530 210 56 1,758Impairment losses and asset write-offs 29 92 — 1 122Divestitures — (37) (20) (6) (63)Translation differences and other changes 108 86 35 31 260Transfer to Assets held for sale — — — (31) (31)At December 31, 2016 5,092 4,288 1,808 482 11,670Amortization 829 595 371 61 1,856Impairment losses and asset write-offs 52 58 — — 110Divestitures (289) (35) (10) — (334)Translation differences and other changes (315) (73) (140) (30) (558)At December 31, 2017 5,369 4,833 2,029 513 12,744Carrying amount at December 31, 2016 € 5,980 € 3,379 € 1,744 € 319 € 11,422Carrying amount at December 31, 2017 € 6,444 € 3,253 € 1,554 € 291 € 11,542
Additions included capitalized development expenditures of €2,586 million (€2,558 million in 2016), primarily consisting of material costs and personnel related expenses relating to engineering, design and development focused on content enhancement of existing vehicles, new models and powertrain programs. In 2017, €110 million of impairment losses and asset write-offs were recognized as described in Note 5, Research and development costs.
In 2016, of the total €122 million impairment losses and asset write-offs, €90 million related to the locally produced Fiat Viaggio and Ottimo vehicles in China, as described in Note 5, Research and development costs.
Translation differences primarily related to foreign currency translation of the U.S. Dollar to the Euro. Amortization of internally and externally generated intangible assets is recognized within Research and development costs within Consolidated Income Statement, as described in Note 5, Research and development costs. Amortization of Patents, concessions, licenses and credits and Other intangibles are recognized within Cost of revenues and Selling, general and other costs.
At December 31, 2017 and 2016, the Group had contractual commitments for the purchase of intangible assets amounting to €601 million and €417 million, respectively.

172
11. Property, plant and equipment
Land Industrial buildings
Plant, machinery and equipment
Other assets
Advances and tangible assets
in progress Total (€ million)
Gross carrying amount at January 1, 2016 € 900 € 8,108 € 43,908 € 2,734 € 4,086 € 59,736Additions 6 303 3,330 453 1,617 5,709Divestitures (11) (22) (729) (70) (11) (843)Translation differences 57 431 1,749 120 225 2,582Transfer to Assets held for sale — — (92) (10) — (102)Other changes (4) 110 2,223 (4) (2,269) 56At December 31, 2016 948 8,930 50,389 3,223 3,648 67,138Additions 20 256 3,768 187 1,428 5,659Divestitures (11) (17) (1,163) (88) (4) (1,283)Change in the scope of consolidation (2) (104) (618) (21) (5) (750)Translation differences (71) (639) (3,167) (301) (325) (4,503)Other changes 1 68 1,844 3 (1,930) (14)At December 31, 2017 885 8,494 51,053 3,003 2,812 66,247Accumulated depreciation and impairmentlosses at January 1, 2016 44 2,782 28,000 1,443 13 32,282Depreciation — 309 3,582 307 — 4,198Divestitures (5) (12) (697) (63) (1) (778)Impairment losses and asset write-offs — 44 25 1 3 73Translation differences 2 93 875 64 1 1,035Transfer to Assets held for sale — — (77) (8) — (85)Other changes — (3) (14) — (1) (18)At December 31, 2016 41 3,213 31,694 1,744 15 36,707Depreciation — 313 3,440 279 — 4,032Divestitures (2) (11) (1,126) (78) — (1,217)Impairment losses and asset write-offs 1 22 83 6 7 119Change in the scope of consolidation (1) (76) (287) (18) — (382)Translation differences (1) (163) (1,693) (152) (1) (2,010)Other changes (1) — (29) 19 (5) (16)At December 31, 2017 37 3,298 32,082 1,800 16 37,233Carrying amount at December 31, 2016 € 907 € 5,717 € 18,695 € 1,479 € 3,633 € 30,431Carrying amount at December 31, 2017 € 848 € 5,196 € 18,971 € 1,203 € 2,796 € 29,014
For the year ended December 31, 2017, the Group recognized a total of €119 million of impairment losses and asset write-offs, of which €21 million related to certain of FCA Venezuela's assets due to the continued deterioration of the economic conditions in Venezuela prior to deconsolidation. The remaining impairment losses relates to changes in global product portfolio in EMEA and product portfolio changes in LATAM.
For the year ended December 31, 2016, the Group recognized a total of €73 million of impairment losses and asset write-offs, of which €43 million related to certain of FCA Venezuela's assets due to the continued deterioration of the economic conditions in Venezuela. This impairment charge was recognized within Selling, administrative and other expenses in the Consolidated Income Statement for the year ended December 31, 2016.
In 2017, translation differences of €2,493 million primarily reflected the weakening of the U.S Dollar, Mexican Peso and the Brazilian Real against the Euro. In 2016, translation differences of €1,547 million mainly reflected the strengthening of the Brazilian Real and the U.S. Dollar against the Euro.

173
The net carrying amount of assets leased under finance lease agreements includes assets that are legally owned by suppliers but which are recognized in the Consolidated Financial Statements in accordance with IFRIC 4 - Determining Whether an Arrangement Contains a Lease, with the recognition of a corresponding financial lease payable, as the arrangement conveys a right to control the use of a specific asset even if that asset is not explicitly referred to in the arrangement. The total net carrying amount of assets leased under finance lease agreements included in Property, plant and equipment were as follows:
At December 312017 2016
(€ million)
Industrial buildings € 209 € 251Plant, machinery and equipment 193 602Total Property, plant and equipment under finance lease € 402 € 853
The carrying amounts of Property, plant and equipment of the Group (excluding FCA US) reported as pledged as security for debt are summarized as follows:
At December 312017 2016
(€ million)
Land and industrial buildings pledged as security for debt € 1,031 € 1,239Plant and machinery pledged as security for debt and other commitments 1,324 698Other assets pledged as security for debt and other commitments 17 3Total Property, plant and equipment pledged as security for debt € 2,372 € 1,940
Information on the assets of FCA US subject to lien is set out in Note 21, Debt.
At December 31, 2017 and 2016, the Group had contractual commitments for the purchase of Property, plant and equipment amounting to €540 million and €950 million, respectively.
12. Investments accounted for using the equity method
The following table summarizes Investments accounted for using the equity method:
At December 312017 2016
(€ million)
Joint ventures € 1,866 € 1,680Associates 94 62Other 48 51Total Investments accounted for using the equity method € 2,008 € 1,793

174
FCA's ownership percentages and the carrying value of investments in joint ventures accounted for under the equity method were as follows:
Ownership percentage Investment balanceAt December 31 At December 31
2017 2016 2017 2016
Joint ventures Ownership percentage (€ million)
FCA Bank S.p.A. 50% 50% € 1,178 € 1,044Tofas-Turk Otomobil Fabrikasi A.S. 37.9% 37.9% 298 302GAC Fiat Chrysler Automobiles Co. 50% 50% 287 237Others 103 97Total € 1,866 € 1,680
FCA Bank is a joint venture with Crédit Agricole Consumer Finance S.A. (“CACF”) which operates in Europe, primarily in Italy, France, Germany, UK and Spain. In July 2013, the Group reached an agreement with Crédit Agricole to extend the term of the joint venture through to December 31, 2021. FCA Bank provides retail and dealer financing and long-term rental services in the automotive sector, directly or through its subsidiaries as a partner of the Group's mass-market vehicle brands and for Maserati vehicles.
The financial statements of FCA Bank as at and for the year ended December 31, 2017 have not been authorized for issuance as of the date of issuance of the FCA Consolidated Financial Statements. As such, the most recent publicly available financial information is included in the tables below.
The most recently available information was used to estimate FCA's share of FCA Bank net income and net equity. Any difference between this data and actual results will be adjusted in the 2018 FCA Consolidated Financial Statements when available.
The following tables include summarized financial information relating to FCA Bank:
At June 30, 2017 At December 31, 2016(€ million)
Financial assets € 21,867 € 20,201Of which: Cash and cash equivalents — —
Other assets 3,378 3,083Financial liabilities 21,557 19,887Other liabilities 1,265 1,159Equity (100%) 2,423 2,238Net assets attributable to owners of the parent 2,382 2,199Group's share of net assets 1,191 1,100Elimination of unrealized profits and other adjustments (13) (56)Carrying amount of interest in FCA Bank(1) € 1,178 € 1,044
________________________(1) Amounts as at December 31, 2017 and 2016 respectively.

175
Six monthsended June
30 Years ended December 312017 2016 2015
(€ million)
Interest and similar income € 437 € 764 € 729Interest and similar expenses (147) (263) (285)Income tax expense (70) (105) (110)Profit from continuing operations 190 312 249Net profit 190 312 249Net profit attributable to owners of the parent (A) 188 309 248Other comprehensive income/(loss) attributable to owners of the parent (B) (7) (64) 29Total Comprehensive income attributable to owners of the parent (A+B) € 181 € 245 € 277Group’s share of net profit(1) € 190 € 154 € 124
_____________________________________(1) Amounts for the years ended December 31, 2017, 2016 and 2015 respectively
Tofas-Turk Otomobil Fabrikasi A.S. (“Tofas”), is a joint venture with Koç Holding which is registered with the Turkish Capital Market Board and listed on the stanbul Stock Exchange. At December 31, 2017, the fair value of the Group’s interest in Tofas was €1,375 million (€1,258 million at December 31, 2016).
GAC Fiat Chrysler Automobiles Co. (“GAC FCA JV”) is a joint venture with Guangzhou Automobile Group Co., Ltd., which locally produces Jeep vehicles for the Chinese market.
The Group's proportionate share of the earnings of our joint ventures, associates and interests in unconsolidated subsidiaries accounted for using the equity method is reflected within Result from investments in the Consolidated Income Statement. The following table summarizes the share of profits of equity method investees included within Result from investments:
Years ended December 312017 2016 2015
(€ million)
Joint Ventures € 390 € 291 € 155Associates 9 7 (27)Other 10 15 2Total Share of the profit of equity method investees € 409 € 313 € 130

176
Immaterial Joint Ventures and Associates
The aggregate amounts recognized for the Group’s share in all individually immaterial joint ventures and associates accounted for using the equity method were as follows:
Years ended December 312017 2016 2015
(€ million)
Joint ventures:Profit from continuing operations € 201 € 137 € 31Net profit 201 137 31Other comprehensive income/(loss) (105) (90) (30)Total Other comprehensive income € 96 € 47 € 1
Associates:Income/(loss) from continuing operations € 9 € 7 € (27)Net income/(loss) 9 7 (27)Other comprehensive income/(loss) (3) (1) 3Total Other comprehensive income/(loss) € 6 € 6 € (24)
13. Other Financial assets
Other financial assets consisted of the following:
At December 312017 2016
Note CurrentNon-
current Total CurrentNon-
current Total(€ million)
Derivative financial assets 16 € 265 € 19 € 284 € 448 € 31 € 479Debt securities measured at fair value through othercomprehensive income 23 4 — 4 38 — 38Debt securities measured at fair value throughprofit or loss 23 172 59 231 203 60 263Debt securities held-to-maturity — 2 2 — 2 2Equity instruments measured at cost — 43 43 — 41 41Equity instruments measured at fair value throughother comprehensive income 23 — 23 23 — 151 151Held-for-trading investments 23 46 — 46 49 — 49Financial receivables — 275 275 — 320 320Collateral deposits(1) 23 — 61 61 24 44 68Total Other financial assets € 487 € 482 € 969 € 762 € 649 € 1,411
___________________________________________(1) Collateral deposits are held in connection with derivative transactions and debt obligations
On March 21, 2017, the Group completed the sale of its available-for-sale investment in CNH Industrial N.V. (“CNHI”), which consisted of 15,948,275 common shares representing 1.17 percent of CNHI’s common shares for an amount of €144 million. The sale did not result in a material gain. The additional 15,948,275 special voting shares owned by the Group and which had not been attributed any value, expired upon the sale of the CNHI common shares. At December 31, 2016, the available-for-sale investment in CNHI had a carrying value of €132 million.
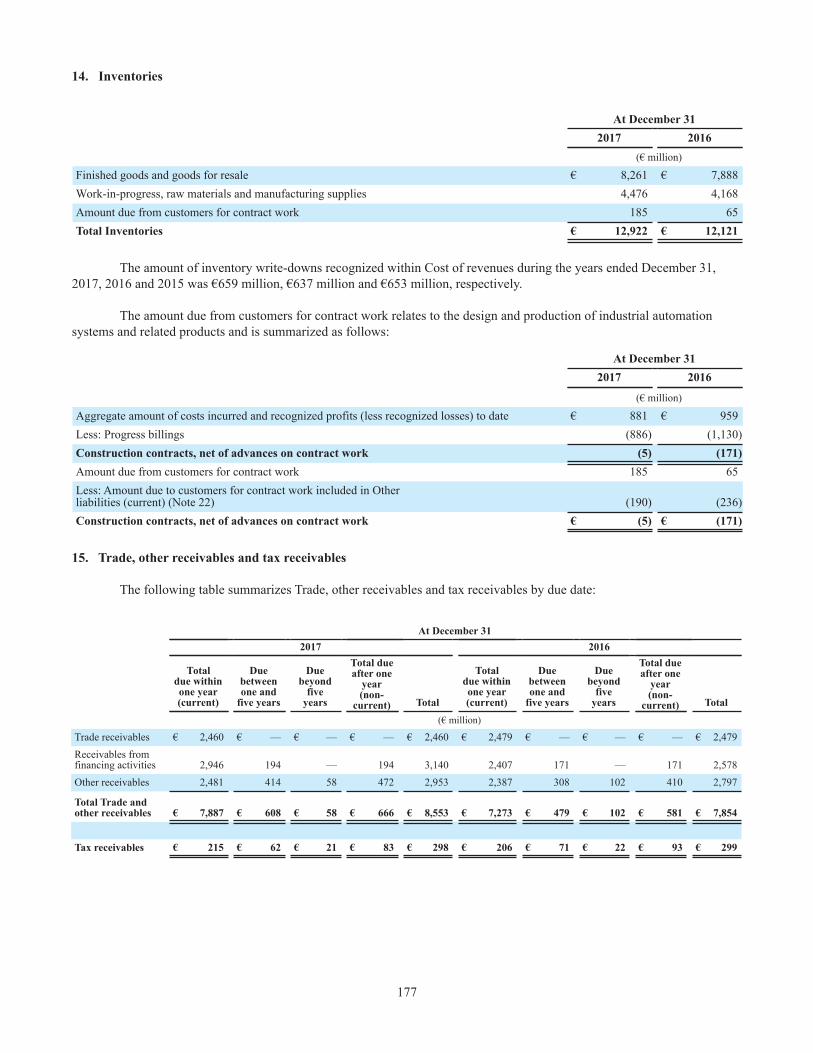
177
14. Inventories
At December 312017 2016
(€ million)
Finished goods and goods for resale € 8,261 € 7,888Work-in-progress, raw materials and manufacturing supplies 4,476 4,168Amount due from customers for contract work 185 65Total Inventories € 12,922 € 12,121
The amount of inventory write-downs recognized within Cost of revenues during the years ended December 31, 2017, 2016 and 2015 was €659 million, €637 million and €653 million, respectively.
The amount due from customers for contract work relates to the design and production of industrial automation systems and related products and is summarized as follows:
At December 312017 2016
(€ million)
Aggregate amount of costs incurred and recognized profits (less recognized losses) to date € 881 € 959Less: Progress billings (886) (1,130)Construction contracts, net of advances on contract work (5) (171)Amount due from customers for contract work 185 65Less: Amount due to customers for contract work included in Otherliabilities (current) (Note 22) (190) (236)Construction contracts, net of advances on contract work € (5) € (171)
15. Trade, other receivables and tax receivables
The following table summarizes Trade, other receivables and tax receivables by due date:
At December 312017 2016
Totaldue withinone year(current)
Due between one and
five years
Due beyond
five years
Total dueafter one
year(non-
current) Total
Totaldue withinone year(current)
Duebetweenone and
five years
Duebeyond
fiveyears
Total dueafter one
year(non-
current) Total(€ million)
Trade receivables € 2,460 € — € — € — € 2,460 € 2,479 € — € — € — € 2,479Receivables from financing activities 2,946 194 — 194 3,140 2,407 171 — 171 2,578Other receivables 2,481 414 58 472 2,953 2,387 308 102 410 2,797
Total Trade and other receivables € 7,887 € 608 € 58 € 666 € 8,553 € 7,273 € 479 € 102 € 581 € 7,854
Tax receivables € 215 € 62 € 21 € 83 € 298 € 206 € 71 € 22 € 93 € 299

178
Trade receivables
Trade receivables are shown net of the allowance for doubtful accounts, which is calculated on the basis of historical losses on receivables. Changes in the allowance for trade receivables were as follows:
At January 1, 2017 ProvisionUse and
other changes At December 31, 2017(€ million)
Allowance for doubtful accounts € 275 € 76 € (82) € 269
Receivables from financing activities
Receivables from financing activities mainly relate to the business of financial services companies fully consolidated by the Group and are summarized as follows.
At December 312017 2016
(€ million)
Dealer financing € 2,295 € 2,115Retail financing 420 286Finance leases 4 6Other 421 171Total Receivables from financing activities € 3,140 € 2,578
Receivables from financing activities are shown net of an allowance for doubtful accounts determined on the basis of specific insolvency risks. Changes in the allowance for receivables from financing activities were as follows:
At January 1, 2017 ProvisionUse and
other changes At December 31, 2017(€ million)
Allowance for Receivables from financingactivities € 45 € 66 € (66) € 45
Receivables for dealer financing are typically generated by sales of vehicles and are generally managed under dealer network financing programs as a component of the portfolio of the financial services companies. These receivables are interest bearing, with the exception of an initial limited, non-interest bearing period. The contractual terms governing the relationships with the dealer networks vary from country to country, although payment terms range from two to six months.
Other receivables
At December 31, 2017, Other receivables primarily consisted of tax receivables for VAT and other indirect taxes of €2,153 million (€1,933 million at December 31, 2016).
Transfer of financial assets
At December 31, 2017, the Group had receivables due after that date which had been transferred without recourse and which were derecognized in accordance with IAS 39 – Financial Instruments: Recognition and Measurement, amounting to €7,866 million (€6,573 million at December 31, 2016). The transfers related to trade receivables and other receivables for €6,752 million (€5,467 million at December 31, 2016) and receivables from financing activities for €1,114 million (€1,106 million at December 31, 2016). These amounts included receivables of €4,933 million (€4,077 million at December 31, 2016), mainly due from the sales network, transferred to jointly controlled financial services companies (FCA Bank).

179
At December 31, 2017 and 2016, the carrying amount of transferred financial assets not derecognized and the related liabilities were as follows:
At December 312017 2016
Tradereceivables
Receivables from
financing activities Total
Tradereceivables
Receivables from
financing activities Total
(€ million)
Carrying amount of assets transferred and notderecognized € 22 € 335 € 357 € 34 € 376 € 410
Carrying amount of the related liabilities (Note 21) € 22 € 335 € 357 € 34 € 376 € 410
16. Derivative financial assets and liabilities
The following table summarizes the fair value of the Group's derivative financial assets and liabilities:
At December 312017 2016
Positive fairvalue
Negative fairvalue
Positive fairvalue
Negative fairvalue
(€ million)
Fair value hedges:Interest rate risk - interest rate swaps € 2 € — € 31 € (1)Interest rate and exchange rate risk - combined interest rateand currency swaps — — — (115)
Total Fair value hedges 2 — 31 (116)Cash flow hedges:
Currency risks - forward contracts, currency swaps andcurrency options 100 (95) 213 (304)Interest rate risk - interest rate swaps 4 (7) — —Interest rate and currency risk - combined interest rate andcurrency swaps 9 — 87 —Commodity price risk – commodity swaps and commodityoptions 30 (1) 21 (2)
Total Cash flow hedges 143 (103) 321 (306)Net investment hedges:
Currency risks - forward contracts, currency swaps andcurrency options 5 — — (47)
Total Net investment hedges 5 — — (47)Derivatives for trading 134 (36) 127 (228)Total Fair value of derivative financial assets/(liabilities) € 284 € (139) € 479 € (697)Financial derivative assets/(liabilities) - current € 265 € (138) € 448 € (681)Financial derivative assets/(liabilities) - non-current € 19 € (1) € 31 € (16)
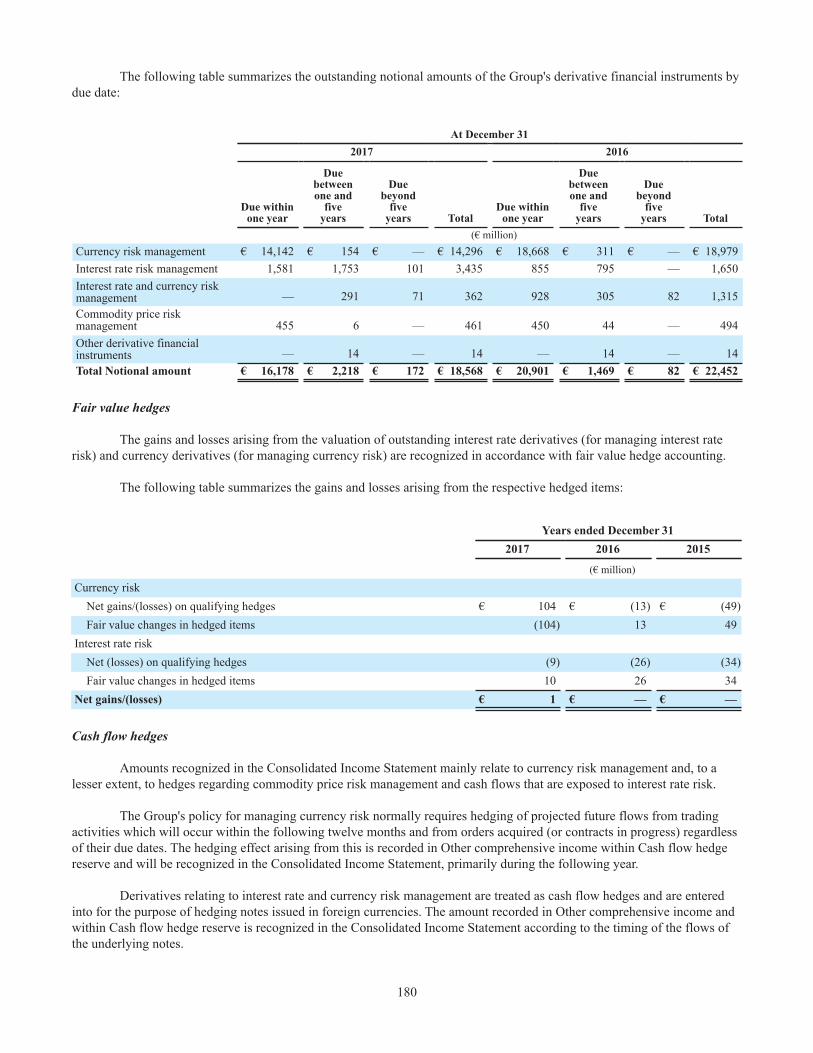
180
The following table summarizes the outstanding notional amounts of the Group's derivative financial instruments by due date:
At December 312017 2016
Due withinone year
Duebetweenone and
fiveyears
Duebeyond
fiveyears Total
Due withinone year
Duebetweenone and
fiveyears
Duebeyond
fiveyears Total
(€ million)Currency risk management € 14,142 € 154 € — € 14,296 € 18,668 € 311 € — € 18,979Interest rate risk management 1,581 1,753 101 3,435 855 795 — 1,650Interest rate and currency riskmanagement — 291 71 362 928 305 82 1,315Commodity price riskmanagement 455 6 — 461 450 44 — 494Other derivative financialinstruments — 14 — 14 — 14 — 14Total Notional amount € 16,178 € 2,218 € 172 € 18,568 € 20,901 € 1,469 € 82 € 22,452
Fair value hedges
The gains and losses arising from the valuation of outstanding interest rate derivatives (for managing interest rate risk) and currency derivatives (for managing currency risk) are recognized in accordance with fair value hedge accounting.
The following table summarizes the gains and losses arising from the respective hedged items:
Years ended December 312017 2016 2015
(€ million)
Currency riskNet gains/(losses) on qualifying hedges € 104 € (13) € (49)Fair value changes in hedged items (104) 13 49
Interest rate riskNet (losses) on qualifying hedges (9) (26) (34)Fair value changes in hedged items 10 26 34
Net gains/(losses) € 1 € — € —
Cash flow hedges
Amounts recognized in the Consolidated Income Statement mainly relate to currency risk management and, to a lesser extent, to hedges regarding commodity price risk management and cash flows that are exposed to interest rate risk.
The Group's policy for managing currency risk normally requires hedging of projected future flows from trading activities which will occur within the following twelve months and from orders acquired (or contracts in progress) regardless of their due dates. The hedging effect arising from this is recorded in Other comprehensive income within Cash flow hedge reserve and will be recognized in the Consolidated Income Statement, primarily during the following year.
Derivatives relating to interest rate and currency risk management are treated as cash flow hedges and are entered into for the purpose of hedging notes issued in foreign currencies. The amount recorded in Other comprehensive income and within Cash flow hedge reserve is recognized in the Consolidated Income Statement according to the timing of the flows of the underlying notes.

181
The Group entered in interest rate swaps in order to hedge against the increase in interest rates in relation to future Debt. The swaps are designated as a cash flow hedge. For the year ended December 31, 2017, losses of €3 million related to such derivatives were recognized in Other comprehensive (loss)/income within Cash flow hedge Reserve.
The following table summarizes the amounts, net of tax, that were reclassified from Other comprehensive (loss)/income to the Consolidated Income Statement in respect of cash flow hedges:
Years ended December 312017 2016 2015
(€ million)
Currency riskIncrease in Net revenues € 16 € 236 € 33(Increase)/Decrease in Cost of revenues (103) (44) 101Net financial income/(expenses) (22) 34 (148)Result from investments 28 26 1
Interest rate riskIncrease in Cost of revenues — — (10)Result from investments (1) (1) (2)Net financial expenses (3) (4) (77)
Commodity price riskDecrease/(Increase) in Cost of revenues 28 (39) (23)
Ineffectiveness and discontinued hedges 4 12 1Tax expense/(benefit) 27 (49) (97)Total recognized in Net profit from continuing operations (26) 171 (221)Recognized in Profit from discontinued operations, net of tax — — (116)Total recognized in Net profit € (26) € 171 € (337)
Net investment hedges
In order to manage the Group's foreign currency risk related to its investments in foreign operations, the Group enters into net investment hedges, in particular foreign currency swaps and forward contracts. For the year ended December 31, 2017, gains of €15 million related to net investment hedges were recognized in Other comprehensive (loss)/income within Currency translation differences. There was no ineffectiveness for the year ended December 31, 2017.
For the year ended December 31, 2016, losses of €75 million related to net investment hedges were recognized in Other comprehensive (loss)/income within Currency translation differences. There was no ineffectiveness for the year ended December 31, 2016.
Derivatives for trading
At December 31, 2017 and 2016, Derivatives for trading primarily consisted of derivative contracts entered into for hedging purposes which do not qualify for hedge accounting and one embedded derivative in a bond issuance in which the yield is determined as a function of trends in the inflation rate and related hedging derivative, which converts the exposure to a floating rate (the total value of the embedded derivative is offset by the value of the hedging derivative).
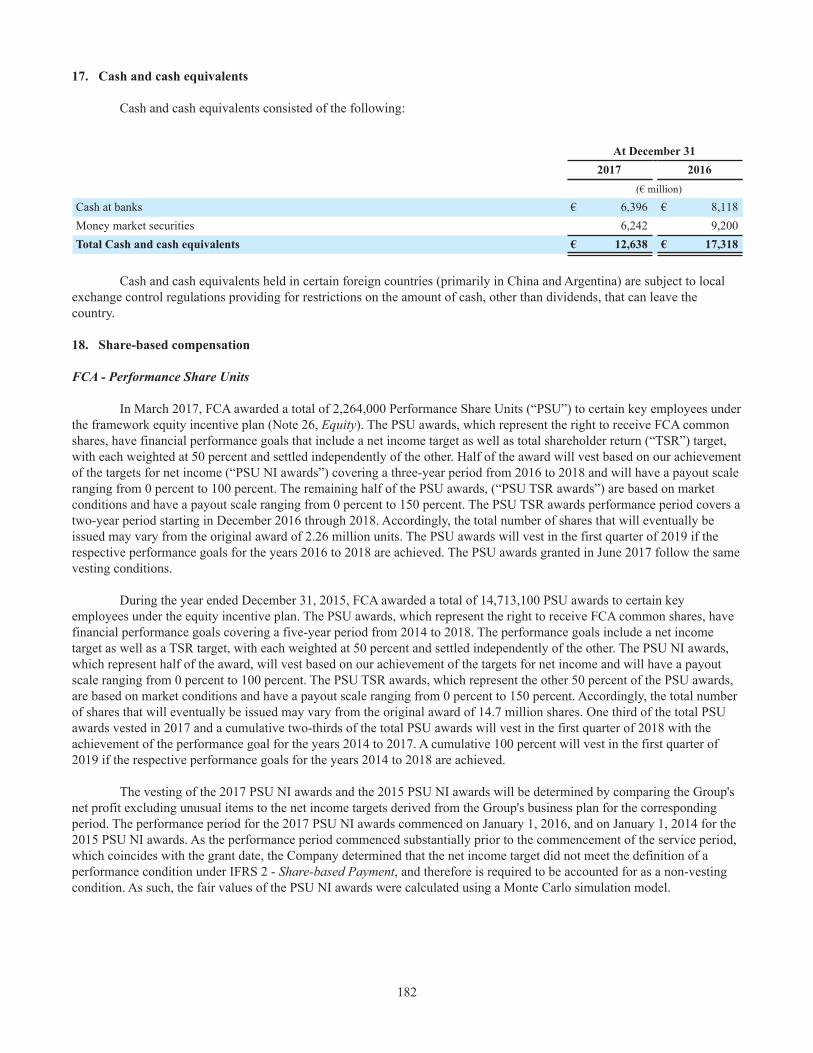
182
17. Cash and cash equivalents
Cash and cash equivalents consisted of the following:
At December 312017 2016
(€ million)
Cash at banks € 6,396 € 8,118Money market securities 6,242 9,200Total Cash and cash equivalents € 12,638 € 17,318
Cash and cash equivalents held in certain foreign countries (primarily in China and Argentina) are subject to local exchange control regulations providing for restrictions on the amount of cash, other than dividends, that can leave the country.
18. Share-based compensation
FCA - Performance Share Units
In March 2017, FCA awarded a total of 2,264,000 Performance Share Units (“PSU”) to certain key employees under the framework equity incentive plan (Note 26, Equity). The PSU awards, which represent the right to receive FCA common shares, have financial performance goals that include a net income target as well as total shareholder return (“TSR”) target, with each weighted at 50 percent and settled independently of the other. Half of the award will vest based on our achievement of the targets for net income (“PSU NI awards”) covering a three-year period from 2016 to 2018 and will have a payout scale ranging from 0 percent to 100 percent. The remaining half of the PSU awards, (“PSU TSR awards”) are based on market conditions and have a payout scale ranging from 0 percent to 150 percent. The PSU TSR awards performance period covers a two-year period starting in December 2016 through 2018. Accordingly, the total number of shares that will eventually be issued may vary from the original award of 2.26 million units. The PSU awards will vest in the first quarter of 2019 if the respective performance goals for the years 2016 to 2018 are achieved. The PSU awards granted in June 2017 follow the same vesting conditions.
During the year ended December 31, 2015, FCA awarded a total of 14,713,100 PSU awards to certain key employees under the equity incentive plan. The PSU awards, which represent the right to receive FCA common shares, have financial performance goals covering a five-year period from 2014 to 2018. The performance goals include a net income target as well as a TSR target, with each weighted at 50 percent and settled independently of the other. The PSU NI awards, which represent half of the award, will vest based on our achievement of the targets for net income and will have a payout scale ranging from 0 percent to 100 percent. The PSU TSR awards, which represent the other 50 percent of the PSU awards, are based on market conditions and have a payout scale ranging from 0 percent to 150 percent. Accordingly, the total number of shares that will eventually be issued may vary from the original award of 14.7 million shares. One third of the total PSU awards vested in 2017 and a cumulative two-thirds of the total PSU awards will vest in the first quarter of 2018 with the achievement of the performance goal for the years 2014 to 2017. A cumulative 100 percent will vest in the first quarter of 2019 if the respective performance goals for the years 2014 to 2018 are achieved.
The vesting of the 2017 PSU NI awards and the 2015 PSU NI awards will be determined by comparing the Group's net profit excluding unusual items to the net income targets derived from the Group's business plan for the corresponding period. The performance period for the 2017 PSU NI awards commenced on January 1, 2016, and on January 1, 2014 for the 2015 PSU NI awards. As the performance period commenced substantially prior to the commencement of the service period, which coincides with the grant date, the Company determined that the net income target did not meet the definition of a performance condition under IFRS 2 - Share-based Payment, and therefore is required to be accounted for as a non-vesting condition. As such, the fair values of the PSU NI awards were calculated using a Monte Carlo simulation model.

183
Changes during 2017, 2016 and 2015 for the PSU NI awards under the framework equity incentive plan were as follows:
2017 2016 2015
PSU NI
Weighted average fair value at the grant date
(€) PSU NI
Weighted average fair value at the grant date
(€) PSU NI
Weighted average fair value at the grant date
(€)
Outstanding shares unvested atJanuary 1 11,379,445 € 5.65 7,356,550 € 8.78 — € —Anti-dilution adjustment 65,751 5.62 4,001,962 5.68 — —Granted 1,136,250 7.91 168,593 3.61 7,356,550 8.78Vested (3,758,870) 5.65 — — — —Canceled — — (147,660) 5.83 — —Forfeited (18,750) 7.91 — — — —Outstanding shares unvested atDecember 31 8,803,826 € 5.89 11,379,445 € 5.65 7,356,550 € 8.78
The key assumptions utilized to calculate the grant-date fair values for the PSU NI awards are summarized below:
Key assumptions2017 PSU NI
Awards Range2015 PSU NI
Awards RangeGrant date stock price €9.74 - €10.39 €13.44 - €15.21Expected volatility 40 % 40%Risk-free rate (0.8)% 0.7%
The expected volatility was based on the observed historical volatility for common shares of FCA. The risk-free rate was based on the yields of government and treasury bonds with similar terms to the vesting date of each PSU NI award.
Changes during 2017, 2016 and 2015 for the PSU TSR awards under the framework equity incentive plan were as follows:
2017 2016 2015
PSU TSR
Weighted average fair value at the grant date
(€) PSU TSR
Weighted average fair value at the grant date
(€) PSU TSR
Weighted average fair value at the grant date
(€)
Outstanding shares unvested atJanuary 1 11,379,446 € 10.64 7,356,550 € 16.52 — € —Anti-dilution adjustment 65,750 10.58 4,001,962 10.70 — —Granted 1,136,250 10.84 168,593 6.71 7,356,550 16.52Vested (3,758,869) 10.63 — — — —Canceled — — (147,659) 10.84 — —Forfeited (18,750) 10.84 — — — —Outstanding shares unvested atDecember 31 8,803,827 € 10.58 11,379,446 € 10.64 7,356,550 € 16.52
The weighted average fair value of the PSU TSR awards granted during the year ended December 31, 2017 was calculated using a Monte Carlo simulation model. The key assumptions utilized to calculate the grant date fair values for the PSU TSR awards issued are summarized below:

184
Key assumptions2017 PSU TSRAwards Range
2015 PSU TSRAwards Range
Grant date stock price €9.74 - €10.39 €13.44 - €15.21Expected volatility 44% 37% - 39%Dividend yield —% —%Risk-free rate 0.8% 0.7% - 0.8%
The expected volatility was based on the observed historical volatility for common shares of FCA. The risk-free rate was based on the yields of government and treasury bonds with similar terms to the vesting date of each PSU TSR award. In addition, since the volatility of each member of the defined peer group are not wholly independent of one another, a correlation coefficient was developed based on historical share price changes for FCA and the defined peer group over a three-year period leading up to the grant date of the awards.
FCA - Restricted Share Units
In March 2017, FCA awarded 2,264,000 Restricted Share Units (“RSUs”) to certain key employees of the Company which represent the right to receive FCA common shares. These shares will vest in two equal tranches in the first quarter of 2018 and 2019. The fair values of the awards were measured using the FCA stock price on the grant date. The RSU awards granted in June and September 2017 follow the same vesting conditions.
During the year ended December 31, 2015, FCA awarded 5,196,550 RSUs to certain key employees of the Company, which represent the right to receive FCA common shares. One third of the awards vested in February of 2017 with the remaining two tranches to vest equally in February of 2018 and 2019.
Changes during 2017, 2016 and 2015 for the RSU awards under the framework equity incentive plan were as follows:
2017 2016 2015
RSUs
Weighted average fair value at the grant date
(€) RSUs
Weighted average fair value at the grant date
(€) RSUs
Weighted average fair value at the grant date
(€)
Outstanding shares unvested atJanuary 1 7,969,623 € 8.69 5,196,550 € 13.49 — € —Anti-dilution adjustment 46,189 8.64 2,826,922 8.74 — —Granted 2,293,940 10.43 94,222 5.73 6,816,550 13.90Vested (2,671,939) 8.64 — — (1,620,000) 15.21Canceled — — (148,071) 9.25 — —Forfeited (37,500) 10.39 — — — —Outstanding shares unvested atDecember 31 7,600,313 € 9.17 7,969,623 € 8.69 5,196,550 € 13.49
Anti-dilution adjustments - PSU awards and RSU awards
The documents governing FCA's long-term incentive plans contain anti-dilution provisions which provide for an adjustment to the number of awards granted under the plans in order to preserve, or alternatively, prevent the enlargement of the benefits intended to be made available to the recipients of the awards should an event occur that impacts our capital structure. In January 2017, as a result of the distribution of the Company's 16.7 percent ownership interest in RCS Media Group S.p.A. to holders of its common shares on May 1, 2016, the Compensation Committee of FCA approved a conversion factor of 1.005865 that was applied to outstanding PSU awards and RSU awards issued prior to December 31, 2016 to make equity award holders whole for the resulting diminution in the value of an FCA common share. There was no change to the total cost of these awards to be amortized over the remaining vesting period as a result of these adjustments.
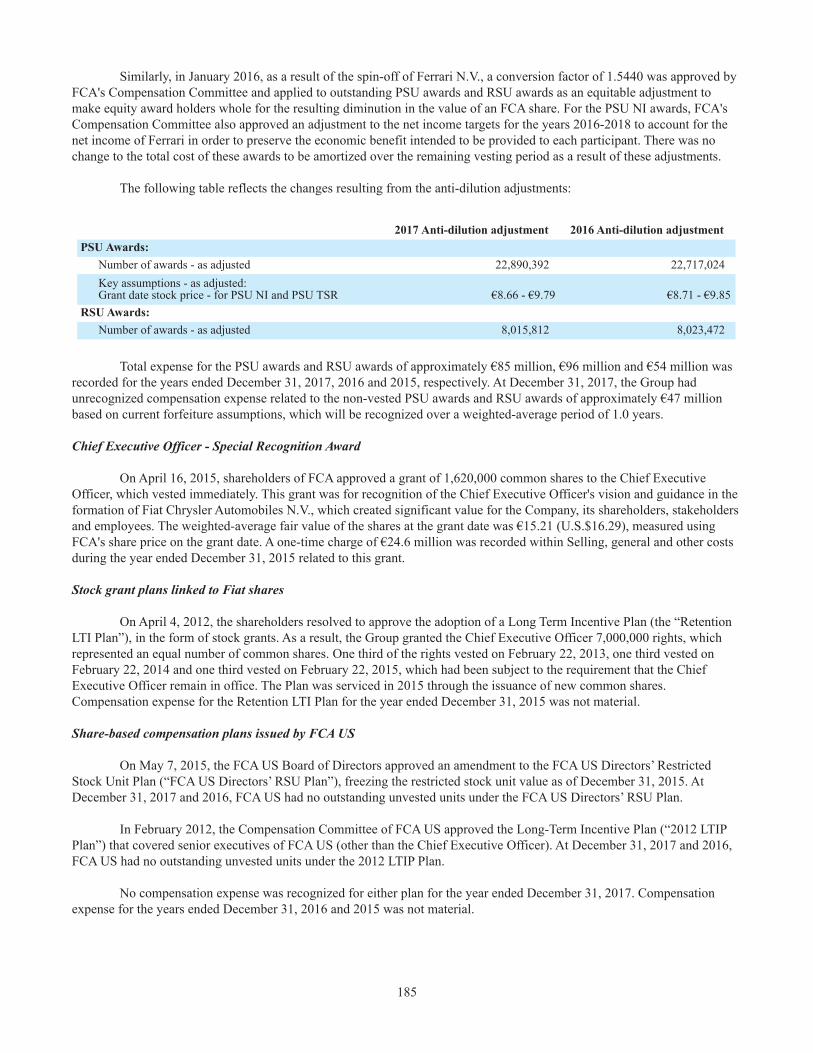
185
Similarly, in January 2016, as a result of the spin-off of Ferrari N.V., a conversion factor of 1.5440 was approved by FCA's Compensation Committee and applied to outstanding PSU awards and RSU awards as an equitable adjustment to make equity award holders whole for the resulting diminution in the value of an FCA share. For the PSU NI awards, FCA's Compensation Committee also approved an adjustment to the net income targets for the years 2016-2018 to account for the net income of Ferrari in order to preserve the economic benefit intended to be provided to each participant. There was no change to the total cost of these awards to be amortized over the remaining vesting period as a result of these adjustments.
The following table reflects the changes resulting from the anti-dilution adjustments:
2017 Anti-dilution adjustment 2016 Anti-dilution adjustmentPSU Awards: Number of awards - as adjusted 22,890,392 22,717,024 Key assumptions - as adjusted: Grant date stock price - for PSU NI and PSU TSR €8.66 - €9.79 €8.71 - €9.85RSU Awards: Number of awards - as adjusted 8,015,812 8,023,472
Total expense for the PSU awards and RSU awards of approximately €85 million, €96 million and €54 million was recorded for the years ended December 31, 2017, 2016 and 2015, respectively. At December 31, 2017, the Group had unrecognized compensation expense related to the non-vested PSU awards and RSU awards of approximately €47 million based on current forfeiture assumptions, which will be recognized over a weighted-average period of 1.0 years.
Chief Executive Officer - Special Recognition Award
On April 16, 2015, shareholders of FCA approved a grant of 1,620,000 common shares to the Chief Executive Officer, which vested immediately. This grant was for recognition of the Chief Executive Officer's vision and guidance in the formation of Fiat Chrysler Automobiles N.V., which created significant value for the Company, its shareholders, stakeholders and employees. The weighted-average fair value of the shares at the grant date was €15.21 (U.S.$16.29), measured using FCA's share price on the grant date. A one-time charge of €24.6 million was recorded within Selling, general and other costs during the year ended December 31, 2015 related to this grant.
Stock grant plans linked to Fiat shares
On April 4, 2012, the shareholders resolved to approve the adoption of a Long Term Incentive Plan (the “Retention LTI Plan”), in the form of stock grants. As a result, the Group granted the Chief Executive Officer 7,000,000 rights, which represented an equal number of common shares. One third of the rights vested on February 22, 2013, one third vested on February 22, 2014 and one third vested on February 22, 2015, which had been subject to the requirement that the Chief Executive Officer remain in office. The Plan was serviced in 2015 through the issuance of new common shares. Compensation expense for the Retention LTI Plan for the year ended December 31, 2015 was not material.
Share-based compensation plans issued by FCA US
On May 7, 2015, the FCA US Board of Directors approved an amendment to the FCA US Directors’ Restricted Stock Unit Plan (“FCA US Directors’ RSU Plan”), freezing the restricted stock unit value as of December 31, 2015. At December 31, 2017 and 2016, FCA US had no outstanding unvested units under the FCA US Directors’ RSU Plan.
In February 2012, the Compensation Committee of FCA US approved the Long-Term Incentive Plan (“2012 LTIP Plan”) that covered senior executives of FCA US (other than the Chief Executive Officer). At December 31, 2017 and 2016, FCA US had no outstanding unvested units under the 2012 LTIP Plan.
No compensation expense was recognized for either plan for the year ended December 31, 2017. Compensation expense for the years ended December 31, 2016 and 2015 was not material.

186
19. Employee benefits liabilities
Employee benefits liabilities consisted of the following:
At December 312017 2016
CurrentNon-
current Total CurrentNon-
current Total(€ million)
Pension benefits € 34 € 4,789 € 4,823 € 38 € 4,980 € 5,018Health care and life insurance plans 126 2,153 2,279 145 2,321 2,466Other post-employment benefits 109 878 987 110 877 987Other provisions for employees 425 764 1,189 518 874 1,392Total Employee benefits liabilities € 694 € 8,584 € 9,278 € 811 € 9,052 € 9,863
The Group recognized a total of €1,643 million for the cost for defined contribution and state plans for the year ended December 31, 2017 (€1,540 million in 2016 and €1,541 million in 2015).
The following table summarizes the fair value of defined benefit obligations and the fair value of the related plan assets:
At December 312017 2016
(€ million)
Present value of defined benefit obligations:Pension benefits € 25,528 € 28,065Health care and life insurance plans 2,279 2,466Other post-employment benefits 987 987
Total present value of defined benefit obligations (a) 28,794 31,518
Fair value of plan assets (b) 21,218 23,409Asset ceiling (c) 14 12Total net defined benefit plans (a - b + c) 7,590 8,121of which:
Net defined benefit liability (d) 8,089 8,471Defined benefit plan asset (499) (350)
Other provisions for employees (e) 1,189 1,392Total Employee benefits liabilities (d + e) € 9,278 € 9,863

187
Pension benefits
Liabilities arising from the Group's defined benefit plans are usually funded by contributions made by Group subsidiaries, and at times by their employees, into legally separate trusts from which the employee benefits are paid. The Group’s funding policy for defined benefit pension plans is to contribute the minimum amounts required by applicable laws and regulations. Occasionally, additional discretionary contributions in excess of those legally required are made to achieve certain desired funding levels. In the U.S., these excess amounts are tracked and the resulting credit balance can be used to satisfy minimum funding requirements in future years. At December 31, 2017, the combined credit balances for the U.S. and Canada qualified pension plans were approximately €2.0 billion, and the usage of the credit balances to satisfy minimum funding requirements is subject to the plans maintaining certain funding levels. During the years ended December 31, 2017, 2016 and 2015, the Group made pension contributions in the U.S. and Canada totaling €124 million, €445 million and €202 million, respectively. The Group contributions to pension plans for 2018 are expected to be €92 million, of which €56 million relate to the U.S. and Canada, with €2 million being discretionary contributions and €54 million which will be made to satisfy minimum funding requirements.
The expected benefit payments for pension plans are as follows:
Expected benefitpayments(€ million)
2018 € 1,5922019 € 1,5622020 € 1,5502021 € 1,5352022 € 1,5242023-2027 € 7,556
The following table summarizes the changes in the pension plans:
2017 2016
Obligation
Fair valueof planassets
Assetceiling
Liability(asset) Obligation
Fair valueof planassets
Assetceiling
Liability(asset)
(€ million)
At January 1 € 28,065 € (23,409) € 12 € 4,668 € 27,547 € (22,415) € 11 € 5,143Included in the Consolidated IncomeStatement 1,259 (817) — 442 1,322 (849) — 473Included in Other comprehensiveincome:
Actuarial (gains)/losses from:
Demographic and other assumptions (42) — — (42) (49) (6) — (55)Financial assumptions 1,567 — — 1,567 346 — — 346Return on assets — (1,589) — (1,589) — (861) — (861)Changes in the effect of limiting netassets — — 3 3 — — — —Changes in exchange rates (3,006) 2,445 (1) (562) 907 (817) 1 91
Other: Employer contributions — (141) — (141) — (454) — (454) Plan participant contributions — (3) — (3) 3 (4) — (1) Benefits paid (1,751) 1,735 — (16) (2,015) 1,999 — (16) Settlements paid (563) 563 — — — — — — Other changes (1) (2) — (3) 4 (2) — 2At December 31 € 25,528 € (21,218) € 14 € 4,324 € 28,065 € (23,409) € 12 € 4,668

188
Amounts recognized in the Consolidated Income Statement were as follows:
Years ended December 312017 2016 2015
(€ million)
Current service cost € 172 € 175 € 196Interest expense 1,090 1,157 1,143Interest income (911) (944) (912)Other administration costs 94 95 92Past service costs/(credits) and gains/(losses) arising from settlements/curtailments (3) (10) (8)Total recognized in the Consolidated Income Statement € 442 € 473 € 511
During the year ended December 31, 2017, the Group entered into an annuity buyout relating to two of its U.S. defined benefit plans. A total of €563 million was paid to a third-party insurance company in settlement of FCA's obligations, resulting in a settlement loss of €1 million that was recognized within Cost of revenues and Selling, general and other in the Consolidated Income Statement for the year ended December 31, 2017.
During the year ended December 31, 2016, the Group amended its U.S. defined benefit plan for salaried employees to allow certain terminated vested participants to accept a lump-sum amount. A total of €214 million was paid to those participants who accepted the offer in December 2016. The plan amendment resulted in a settlement gain of €29 million that was recognized within Selling, general and other costs in the Consolidated Income Statement for the year ended December 31, 2016. There were no significant plan amendments or curtailments to the Group's pension plans for the year ended December 31, 2015.
The fair value of plan assets by class was as follows:
At December 312017 2016
Amount
of which have aquoted market
price in an active market Amount
of which have aquoted market
price in an activemarket
(€ million)
Cash and cash equivalents € 628 € 611 € 862 € 816U.S. equity securities 1,426 1,426 1,641 1,633Non-U.S. equity securities 1,098 1,098 1,170 1,170Commingled funds 2,684 1,138 3,149 216
Equity instruments 5,208 3,662 5,960 3,019Government securities 2,601 803 2,611 858Corporate bonds (including convertible and high yield bonds) 5,864 — 6,353 58Other fixed income 1,071 114 907 9
Fixed income securities 9,536 917 9,871 925Private equity funds 1,962 — 1,979 —Commingled funds 165 162 147 118Mutual funds — — 3 3Real estate funds 1,374 13 1,460 —Hedge funds 1,893 49 2,466 —
Investment funds 5,394 224 6,055 121Insurance contracts and other 452 50 661 156Total fair value of plan assets € 21,218 € 5,464 € 23,409 € 5,037

189
Non-U.S. Equity securities are invested broadly in developed international and emerging markets. Fixed income securities are debt instruments which are primarily comprised of long-term U.S. Treasury and global government bonds, as well as developed international and emerging market companies’ debt securities diversified by sector, geography and through a wide range of market capitalization. Private equity funds include those in limited partnerships that invest primarily in operating companies that are not publicly traded on a stock exchange. Commingled funds include common collective trust funds, mutual funds and other investment entities. Real estate fund investments include those in limited partnerships that invest in various commercial and residential real estate projects both domestically and internationally. Hedge fund investments include those seeking to maximize absolute return using a broad range of strategies to enhance returns and provide additional diversification.
The investment strategies and objectives for pension assets primarily in the U.S. and Canada reflect a balance of liability-hedging and return-seeking investment considerations. The investment objectives are to minimize the volatility of the value of the pension assets relative to the pension liabilities and to ensure assets are sufficient to pay plan obligations. The objective of minimizing the volatility of assets relative to liabilities is addressed primarily through asset diversification, partial asset–liability matching and hedging. Assets are broadly diversified across many asset classes to achieve risk–adjusted returns that, in total, lower asset volatility relative to the liabilities. Additionally, in order to minimize pension asset volatility relative to the pension liabilities, a portion of the pension plan assets are allocated to fixed income securities. The Group policy for these plans ensures actual allocations are in line with target allocations as appropriate.
Assets are actively managed primarily by external investment managers. Investment managers are not permitted to invest outside of the asset class or strategy for which they have been appointed. The Group uses investment guidelines to ensure investment managers invest solely within the mandated investment strategy. Certain investment managers use derivative financial instruments to mitigate the risk of changes in interest rates and foreign currencies impacting the fair values of certain investments. Derivative financial instruments may also be used in place of physical securities when it is more cost-effective and/or efficient to do so. Plan assets do not include shares of FCA or properties occupied by Group companies, with the possible exception of commingled investment vehicles where FCA does not control the investment guidelines.
Sources of potential risk in pension plan assets measurements relate to market risk, interest rate risk and operating risk. Market risk is mitigated by diversification strategies and as a result, there are no significant concentrations of risk in terms of sector, industry, geography, market capitalization, or counterparty. Interest rate risk is mitigated by partial asset–liability matching. The fixed income target asset allocation partially matches the bond–like and long–dated nature of the pension liabilities. Interest rate increases generally will result in a decline in the fair value of the investments in fixed income securities and the present value of the obligations. Conversely, interest rate decreases will generally increase the fair value of the investments in fixed income securities and the present value of the obligations.
The weighted average assumptions used to determine the defined benefit obligations were as follows:
At December 312017 2016
U.S. Canada UK U.S. Canada UKDiscount rate 3.8% 3.5% 2.7% 4.4% 3.9% 2.7%Future salary increase rate —% 3.5% 3.2% —% 3.5% 3.1%
The average duration of the U.S. and Canadian liabilities was approximately 11 years and 13 years, respectively. The average duration of the UK pension liabilities was approximately 20 years.

190
Health care and life insurance plans
Liabilities arising from these plans comprise obligations for retiree health care and life insurance granted to employees and to retirees in the U.S. and Canada. Upon retirement from the Group, these employees may become eligible for continuation of certain benefits. Benefits and eligibility rules may be modified periodically. These plans are unfunded. The expected benefit payments for unfunded health care and life insurance plans are as follows:
Expected benefit payments(€ million)
2018 € 1252019 € 1252020 € 1242021 € 1242022 € 1252023-2027 € 634
Changes in the net defined benefit obligations for healthcare and life insurance plans were as follows:
2017 2016(€ million)
Present value of obligations at January 1 € 2,466 € 2,459Included in the Consolidated Income Statement 120 130Included in Other comprehensive income:Actuarial (gains)/losses from:- Demographic and other assumptions (52) (77)- Financial assumptions 160 10
Effect of movements in exchange rates (278) 83Other: Benefits paid (137) (139) Other changes — —Present value of obligations at December 31 € 2,279 € 2,466
Amounts recognized in the Consolidated Income Statement were as follows:
Years ended December 312017 2016 2015
(€ million)
Current service cost € 22 € 26 € 32Interest expense 98 107 102Past service costs/(credits) and losses/(gains) arising from settlements — (3) —Total recognized in the Consolidated Income Statement € 120 € 130 € 134
Health care and life insurance plans are accounted for on an actuarial basis, which requires the selection of various assumptions. In particular, it requires the use of estimates of the present value of the projected future payments to all participants, taking into consideration the likelihood of potential future events such as health care cost increases and demographic experience.

191
The weighted average assumptions used to determine the defined benefit obligations were as follows:
At December 312017 2016
U.S. Canada U.S. CanadaDiscount rate 3.9% 3.6% 4.5% 4.0%Salary growth 1.5% 1.0% 1.5% 1.0%Weighted average ultimate healthcare cost trend rate 4.5% 4.5% 4.5% 4.4%
The average duration of the U.S. and Canadian liabilities was approximately 13 years and 16 years, respectively.
The annual rate of increase in the per capita cost of covered U.S. health care benefits assumed for next year and used in the 2017 plan valuation was 6.8 percent (7.0 percent in 2016). The annual rate was assumed to decrease gradually to 4.5 percent after 2029 and remain at that level thereafter. The annual rate of increase in the per capita cost of covered Canadian health care benefits assumed for next year and used in the 2017 plan valuation was 4.8 percent (4.7 percent in 2016). The annual rate was assumed to decrease gradually to 4.5 percent in 2029 and remain at that level thereafter.
Other post-employment benefits
Other post-employment benefits include other employee benefits granted to Group employees in Europe and comprises, amongst others, the Italian employee severance indemnity (trattamento di fine rapporto, or “TFR”) obligation, required under Italian Law, amounting to €752 million at December 31, 2017 and €775 million at December 31, 2016.
The amount of TFR to which each employee is entitled must be paid when the employee leaves the Group and is calculated based on the period of employment and the taxable earnings of each employee. Under certain conditions, the entitlement may be partially advanced to an employee during their working life.
The legislation regarding this scheme was amended by Law 296 of December 27, 2006 and subsequent decrees and regulations issued in 2007. Under these amendments, companies with at least 50 employees were obliged to transfer the TFR to the “Treasury fund” managed by the Italian state-owned social security body (“INPS”) or to supplementary pension funds. Prior to the amendments, accruing TFR for employees of all Italian companies could be managed by the company itself. Consequently, the Italian companies’ obligation to INPS and the contributions to supplementary pension funds take the form of defined contribution plans under IAS 19 - Employee Benefits, whereas the amounts recorded in the provision for employee severance pay retain the nature of defined benefit plans. Accordingly, the provision for employee severance indemnity in Italy consisted of the residual obligation for TFR through December 31, 2006. This is an unfunded defined benefit plan as the benefits have already been entirely earned, with the sole exception of future revaluations. Since 2007, the scheme has been classified as a defined contribution plan and the Group recognizes the associated cost over the period in which the employee renders service.

192
Changes in defined benefit obligations for other post-employment benefits were as follows:
2017 2016(€ million)
Present value of obligations at January 1 € 987 € 969Included in the Consolidated Income Statement 23 26Included in Other comprehensive income:Actuarial (gains)/losses from:- Demographic and other assumptions 18 36- Financial assumptions (3) 29
Effect of movements in exchange rates (5) 1Other:
Benefits paid (48) (58)Transfer to Liabilities held for sale — (14)Other changes 15 (2)
Present value of obligations at December 31 € 987 € 987
Amounts recognized in the Consolidated Income Statement were as follows:
Years ended December 312017 2016 2015
(€ million)
Current service cost € 11 € 8 € 10Interest expense 13 17 6Past service costs (credits) and (gains)/losses arising from settlements (1) 1 —Total recognized in the Consolidated Income Statement € 23 € 26 € 16
The discount rates used for the measurement of the Italian TFR obligation are based on yields of high-quality (AA rated) fixed income securities for which the timing and amounts of maturities match the timing and amounts of the projected benefit payments. For this plan, the single weighted average discount rate that reflects the estimated timing and amount of the scheme future benefit payments for 2017 was 1.2 percent (1.0 percent in 2016). The average duration of the Italian TFR is approximately 7 years. Retirement or employee leaving rates are developed to reflect actual and projected Group experience and law requirements for retirement in Italy.
Other provisions for employees
Other provisions for employees primarily include long-term disability benefits, supplemental unemployment benefits, variable and other deferred compensation, as well as bonuses granted for tenure at the Company.

193
20. Provisions
Provisions consisted of the following:
At December 312017 2016
CurrentNon-
current Total CurrentNon-
current Total(€ million)
Product warranty and recall campaigns € 2,676 € 4,049 € 6,725 € 2,905 € 4,637 € 7,542Sales incentives 5,377 — 5,377 5,749 — 5,749Legal proceedings and disputes 125 551 676 54 530 584Commercial risks 481 334 815 250 412 662Restructuring 26 44 70 26 46 72Other risks 324 792 1,116 333 895 1,228Total Provisions € 9,009 € 5,770 € 14,779 € 9,317 € 6,520 € 15,837
Changes in Provisions were as follows:
AtJanuary 1,
2017Additionalprovisions Settlements
Unusedamounts
Translationdifferences
Changes inthe scope of
consolidationand otherchanges
AtDecember
31,2017
(€ million)
Product warranty and recallcampaigns € 7,542 € 3,196 € (3,262) € — € (746) € (5) € 6,725Sales incentives 5,749 13,850 (13,675) (3) (567) 23 5,377Legal proceedings and disputes 584 200 (69) (38) (49) 48 676Commercial risks 662 432 (181) (34) (64) — 815Restructuring costs 72 91 (55) (3) (3) (32) 70Other risks 1,228 229 (187) (97) (62) 5 1,116Total Provisions € 15,837 € 17,998 € (17,429) € (175) € (1,491) € 39 € 14,779
Product warranty and recall campaigns
At December 31, 2017, the Product warranty and recall campaigns provision included €102 million of charges recognized within Cost of revenues in the Consolidated Income Statement for the year ended December 31, 2017 for the estimated costs associated with an extension of the recall campaigns related to an industry-wide recall of airbag inflators resulting from parts manufactured by Takata, of which €29 million related to the previously announced recall in NAFTA and €73 million related to the preventative safety campaigns in LATAM. Refer to Note 25, Guarantees granted, commitments and contingent liabilities, for additional information.
At December 31, 2016, the Product warranty and recall campaigns provision included €414 million of charges recognized within Cost of revenues in the Consolidated Income Statement for the year ended December 31, 2016 for the additional estimated costs associated with the recall campaigns related to an industry wide recall of airbag inflators resulting from parts manufactured by Takata. Refer to Note 25, Guarantees granted, commitments and contingent liabilities, for additional information. In addition, the Product warranty and recall campaigns provision included €132 million of estimated net costs recognized within Cost of revenues in the Consolidated Income Statement for the year ended December 31, 2016 associated with a recall for which costs are being contested with a supplier. Although FCA believes the supplier has responsibility for the recall, only a partial recovery of the estimated costs has been recognized pursuant to a cost sharing agreement. The cash outflow for the non-current portion of the Product warranty and recall campaigns provision is primarily expected within a period through 2022.

194
Sales incentives, Legal proceedings and disputes, Commercial risks and Other risks
As described within Note 2, Basis of preparation (Use of Estimates section), the Group records the estimated cost of sales incentive programs offered to dealers and consumers as a reduction to revenue at the time of sale of the vehicle to the dealer.
None of the provisions within the total Legal proceedings and disputes provision are individually significant. As described within Note 2, Basis of preparation (Use of Estimates section), a provision for legal proceedings is recognized when it is deemed probable that the proceedings will result in an outflow of resources. As the ultimate outcome of pending litigation is uncertain, the timing of cash outflow for the Legal proceedings and disputes provision is also uncertain.
Commercial risks arise in connection with the sale of products and services such as onerous maintenance contracts and as a result of certain regulatory emission requirements. For items such as onerous maintenance contracts, a provision is recognized when the expected costs to complete the services under these contracts exceed the revenues expected to be realized. A provision for fines related to certain regulatory emission requirements that can be settled with cash fines is recognized at the time vehicles are sold based on the estimated cost to settle the obligation measured as the sum of the cost of regulatory credits previously purchased plus the amount, if any, of the fine expected to be paid in cash. The cash outflow for the non-current portion of the Commercial risks provision is primarily expected within a period through 2020.
Other risks include, among other items: provisions for disputes with suppliers related to supply contracts or other matters that are not subject to legal proceedings, provisions for product liabilities arising from personal injuries including wrongful death and potential exemplary or punitive damages alleged to be the result of product defects, disputes with other parties relating to contracts or other matters not subject to legal proceedings and management's best estimate of the Group’s probable environmental obligations which also includes costs related to claims on environmental matters. The cash outflow for the non-current portion of the Other risks provision is primarily expected within a period through 2024.
21. Debt
Debt classified within current liabilities includes short-term borrowings from banks and other financing with an original maturity date falling within twelve months, as well as the current portion of long-term debt. Debt classified within non-current liabilities includes borrowings from banks and other financing with maturity dates greater than twelve months (long-term debt), net of the current portion.
The following table summarizes the Group's current and non-current Debt by maturity date (amounts include accrued interest):
At December 312017 2016
Due within
one year (current)
Due between one and
five years
Due beyond
five years
Total(non-
current)Total Debt
Due within
one year (current)
Due between one and
five years
Due beyond
five years
Total(non-
current)Total Debt
(€ million)
Notes € 2,054 € 5,071 € 2,501 € 7,572 € 9,626 € 2,565 € 5,763 € 4,023 € 9,786 € 12,351Borrowings from banks 4,132 2,278 502 2,780 6,912 4,025 4,592 786 5,378 9,403Asset-backed financing (Note 15) 357 — — — 357 410 — — — 410Other debt 702 347 27 374 1,076 937 688 259 947 1,884Total Debt € 7,245 € 7,696 € 3,030 € 10,726 € 17,971 € 7,937 € 11,043 € 5,068 € 16,111 € 24,048

195
Notes
The following table summarizes the outstanding notes at December 31, 2017 and 2016:
At December 31
Currency
Face value ofoutstanding
notes(million) Coupon % Maturity 2017 2016
Medium Term Note Programme: (€ million)Fiat Chrysler Finance Europe S.A.(1) EUR 850 7.000 March 23, 2017 € — € 850Fiat Chrysler Finance North America, Inc.(1) EUR 1,000 5.625 June 12, 2017 — 1,000Fiat Chrysler Finance Europe S.A.(2) CHF 450 4.000 November 22, 2017 — 419Fiat Chrysler Finance Europe S.A.(1) EUR 1,250 6.625 March 15, 2018 1,250 1,250Fiat Chrysler Finance Europe S.A.(1) EUR 600 7.375 July 9, 2018 600 600Fiat Chrysler Finance Europe S.A.(2) CHF 250 3.125 September 30, 2019 213 233Fiat Chrysler Finance Europe S.A.(1) EUR 1,250 6.750 October 14, 2019 1,250 1,250Fiat Chrysler Finance Europe S.A.(1) EUR 1,000 4.750 March 22, 2021 1,000 1,000Fiat Chrysler Finance Europe S.A.(1) EUR 1,350 4.750 July 15, 2022 1,350 1,350FCA NV(1) EUR 1,250 3.750 March 29, 2024 1,250 1,250Other(3) EUR 7 7 7
Total Medium Term Note Programme 6,920 9,209
Other Notes:FCA NV(1) U.S.$ 1,500 4.500 April 15, 2020 1,251 1,423FCA NV(1) U.S.$ 1,500 5.250 April 15, 2023 1,251 1,423
Total Other Notes 2,502 2,846Hedging effect, accrued interest and amortizedcost valuation 204 296Total Notes € 9,626 € 12,351
_________________________(1) Listing on the Irish Stock Exchange was obtained. (2) Listing on the SIX Swiss Exchange was obtained. (3) Medium Term Notes with amounts outstanding equal to or less than the equivalent of €50 million.
Notes Issued Through the Medium Term Note Programme
Certain notes issued by the Group are governed by the terms and conditions of the Medium Term Note (“MTN”) Programme (previously known as the Global Medium Term Note Programme, or “GMTN” Programme). A maximum of €20 billion may be used under this programme, of which notes of €6.9 billion were outstanding at December 31, 2017 (€9.2 billion at December 31, 2016). The MTN Programme is guaranteed by FCA NV. We may from time to time buy back notes in the market that have been issued. Such buybacks, if made, depend upon market conditions, the Group's financial situation and other factors which could affect such decisions.
Changes in notes issued under the MTN Programme during the year ended December 31, 2017 were due to the:
• repayment at maturity of a note in March 2017 with a principal amount of €850 million;
• repayment at maturity of a note in June 2017 with a principal amount of €1,000 million; and
• repayment at maturity of a note in November 2017 with a principal amount of CHF 450 million (€385 million).
Changes in notes issued under the MTN Programme during the year ended December 31, 2016 were due to the:
• issuance of a 3.75 percent note at par in March 2016 with a principal amount of €1,250 million, due in March 2024;
196
• repayment at maturity of a note in April 2016 with a principal amount of €1,000 million;
• repayment at maturity of a note in October 2016 with a principal amount of €1,000 million; and
• repayment at maturity of a note in November 2016 with a principal amount of CHF 400 million (€373 million).
The notes issued under the MTN Programme impose covenants on the issuer and, in certain cases, on FCA NV as guarantor, which include: (i) negative pledge clauses which require that, in case any security interest upon assets of the issuer and/or FCA NV is granted in connection with other notes or debt securities having the same ranking, such security should be equally and ratably extended to the outstanding notes; (ii) pari passu clauses, under which the notes rank and will rank pari passu with all other present and future unsubordinated and unsecured obligations of the issuer and/or FCA NV; (iii) periodic disclosure obligations; (iv) cross-default clauses which require immediate repayment of the notes under certain events of default on other financial instruments issued by FCA's main entities; and (v) other clauses that are generally applicable to securities of a similar type. A breach of these covenants may require the early repayment of the notes. As of December 31, 2017, FCA was in compliance with the covenants under the MTN Programme.
Other Notes
In 2015, FCA NV issued U.S.$1.5 billion (€1.4 billion) principal amount of 4.5 percent unsecured senior debt securities due April 15, 2020 (the “2020 Notes”) and U.S.$1.5 billion (€1.4 billion) principal amount of 5.25 percent unsecured senior debt securities due April 15, 2023 (the “2023 Notes”) at an issue price of 100 percent of their principal amount. The 2020 Notes and the 2023 Notes, collectively referred to as the “Notes”, rank pari passu in right of payment with respect to all of FCA NV's existing and future senior unsecured indebtedness and senior in right of payment to any of FCA NV's future subordinated indebtedness and existing indebtedness, which is by its terms subordinated in right of payment to the Notes. Interest on the 2020 Notes and the 2023 Notes is payable semi-annually in April and October.
The Notes impose covenants on FCA NV including: (i) negative pledge clauses which require that, in case any security interest upon assets of FCA NV is granted in connection with other notes or debt securities having the same ranking, such security should be equally and ratably extended to the outstanding Notes; (ii) pari passu clauses, under which the Notes rank and will rank pari passu with all other present and future unsubordinated and unsecured obligations of FCA NV; (iii) periodic disclosure obligations; (iv) cross-default clauses which require immediate repayment of the Notes under certain events of default on other financial instruments issued by FCA’s main entities; and (v) other clauses that are generally applicable to securities of a similar type. A breach of these covenants may require the early repayment of the Notes. As of December 31, 2017, FCA was in compliance with the covenants of the Notes.
Fiat Chrysler Finance US Inc.
On March 6, 2017, Fiat Chrysler Finance US Inc. (“FCF US”) was incorporated under the laws of Delaware and became an indirect, 100 percent owned subsidiary of the Company. If FCF US issues debt securities, they will be fully and unconditionally guaranteed by the Company. No other subsidiary of the Company will guarantee such indebtedness.
Borrowings from banks
FCA US Tranche B Term Loans
On February 24, 2017, FCA US prepaid the U.S.$1,826 million (€1,721 million) outstanding principal and accrued interest for its tranche B term loan maturing May 24, 2017 (the “Tranche B Term Loan due 2017”). The prepayment was made with cash on hand and did not result in a material loss on extinguishment.
At December 31, 2017, €836 million (€948 million at December 31, 2016), which included accrued interest, was outstanding under FCA US's Tranche B Term Loan maturing December 31, 2018 (the “Tranche B Term Loan due 2018”). On April 12, 2017, FCA US amended the credit agreement that governs the Tranche B Term Loan due 2018. The amendment reduced the applicable interest rate spreads by 0.50 percent per annum and reduced the LIBOR floor by 0.75 percent per annum, to 0.00 percent. In addition, the base rate floor was eliminated. As a result, the Tranche B Term Loan due 2018 bears interest, at FCA US's option, either at a base rate plus 1.0 percent per annum or at LIBOR plus 2.0 percent per annum. FCA US may prepay, refinance or re-price the Tranche B Term Loan due 2018 without premium or penalty. For the years ended December 31, 2017 and 2016, interest was accrued based on LIBOR.

197
On March 15, 2016, FCA US entered into amendments to the credit agreements that govern the Tranche B Term Loans to, among other items, eliminate covenants restricting the provision of guarantees and payment of dividends by FCA US for the benefit of the rest of the Group, to enable a unified financing platform and to provide free flow of capital within the Group. In conjunction with these amendments, FCA US made a U.S.$2.0 billion (€1.8 billion) voluntary prepayment of principal at par with cash on hand, of which U.S.$1,288 million (€1,159 million) was applied to the Tranche B Term Loan due 2017 and U.S.$712 million (€641 million) was applied to the Tranche B Term Loan due 2018. Accrued interest related to the portion of principal prepaid of the Tranche B Term Loans and related transaction fees were also paid.
The prepayments of principal were accounted for as debt extinguishments and, as a result, a non-cash charge of €10 million was recorded within Net financial expenses in the Consolidated Income Statement for the year ended December 31, 2016 which consisted of the write-off of the remaining unamortized debt issuance costs. The amendments to the remaining principal balance were analyzed on a lender-by-lender basis and accounted for as debt modifications in accordance with IAS 39 - Financial Instruments: Recognition and Measurement. As such, the debt issuance costs for each of the amendments were capitalized and are amortized over the respective remaining terms of the Tranche B Term Loans. For each of the Tranche B Term Loans, FCA US prepaid the scheduled quarterly principal payments, with the remaining balance applied to the principal balance due at maturity. Periodic interest payments, however, continue to be required.
The Tranche B Term Loan due 2018 is secured by a senior priority security interest in substantially all of FCA US’s assets and the assets of its U.S. subsidiary guarantors, subject to certain exceptions. The collateral includes 100 percent of the equity interests in FCA US's U.S. subsidiaries and 65 percent of the equity interests in certain of its non-U.S. subsidiaries held directly by FCA US and its U.S. subsidiary guarantors.
The credit agreement that governs the Tranche B Term Loan due 2018 includes a number of affirmative covenants, many of which are customary, including, but not limited to, the reporting of financial results and other developments, compliance with laws, payment of taxes, maintenance of insurance and similar requirements. The credit agreement also includes negative covenants, including but not limited to: (i) limitations on incurrence, repayment and prepayment of indebtedness, (ii) limitations on incurrence of liens, (iii) limitations on swap agreements and sale and leaseback transactions, (iv) limitations on fundamental changes, including certain asset sales and (v) restrictions on certain subsidiary distributions. In addition, the credit agreement requires FCA US to maintain a minimum ratio of “borrowing base” to “covered debt” (as defined), as well as a minimum liquidity of U.S.$3.0 billion (€2.5 billion). Furthermore, the credit agreement also contains a number of events of default related to: (i) failure to make payments when due; (ii) failure to comply with covenants, (iii) breaches of representations and warranties, (iv) certain changes of control, (v) cross–default with certain other debt and hedging agreements and (vi) the failure to pay or post bond for certain material judgments. As of December 31, 2017, FCA US was in compliance with the covenants of the credit agreement that governs the Tranche B Term Loan due 2018.
European Investment Bank Borrowings
FCA has financing agreements with the European Investment Bank (“EIB”) for a total of €1.1 billion outstanding at December 31, 2017 (€1.3 billion outstanding at December 31, 2016), which included the residual debt due under the following facilities:
• the facility for €250 million (maturing in December 2019) entered into in December 2016 to support the Group's investment plan (2017-2019) in research and development centers in Italy, which includes a number of key objectives such as greater fuel efficiency, a reduction in CO2 emissions by petrol and alternative fuel engines and the study of new hybrid architectures, as well as certain capital expenditures for facilities located in southern Italy;
• the facility for €600 million (maturing in July 2018), entered into in June 2015 (50 percent guaranteed by SACE) to support the Group's investment plan (2015-2017) for production and research and development sites in both northern and southern Italy, to develop efficient vehicle technologies for vehicle safety and new vehicle architectures;
• the facility for €400 million (maturing in November 2018), entered into in November 2013 (50 percent guaranteed by SACE) to support certain investments and research and development programs in Italy; and
198
• the facility for €500 million (maturing in June 2021), entered into in May 2011 (guaranteed by SACE and the Serbian Authorities) for an investment program relating to the modernization and expansion of production capacity of an automotive plant in Serbia.
Brazil
Our Brazilian subsidiaries have access to various local bank facilities in order to fund investments and operations. Total debt outstanding under those facilities amounted to a principal amount of €3.2 billion at December 31, 2017 (€4.0 billion at December 31, 2016). The loans primarily include subsidized loans granted by public financing institutions such as Banco Nacional do Desenvolvimento (“BNDES”), with the aim to support industrial projects in certain areas. This provided the Group the opportunity to fund large investments in Brazil with loans of sizeable amounts at attractive rates. At December 31, 2017, outstanding subsidized loans amounted to €2.1 billion (€2.6 billion at December 31, 2016), of which €1.3 billion (€1.6 billion at December 31, 2016) related to the construction of the plant in Pernambuco (Brazil), which has been supported by subsidized credit lines totaling Brazilian Real (“BRL”) 6.5 billion (€1.6 billion). Approximately €0.1 billion (€0.3 billion at December 31, 2016) of committed credit lines contracted to fund scheduled investments in the area were undrawn at December 31, 2017.
Revolving Credit Facilities
In March 2017, the Group amended its syndicated revolving credit facility originally signed in June 2015 (as amended, the “RCF”). The amendment increased the RCF from €5.0 billion to €6.25 billion and extended the RCF’s final maturity to March 2022. The RCF, which is available for general corporate purposes and for working capital needs of the Group, is structured in two tranches: €3.125 billion, with a 37-month tenor and two extension options of 1-year and of 11-months exercisable on the first and second anniversary of the amendment signing date, respectively, and €3.125 billion, with a 60-month tenor. The amendment was accounted for as a debt modification and, as a result, the remaining unamortized debt issuance costs related to the original €5.0 billion RCF and the new costs associated with the amendment will be amortized over the life of the amended RCF. At December 31, 2017, the €6.25 billion RCF was undrawn.
The covenants of the RCF include financial covenants as well as negative pledge, pari passu, cross-default and change of control clauses. The failure to comply with these covenants and, in certain cases if not suitably remedied, can lead to the requirement of early repayment of any outstanding amounts. As of December 31, 2017, FCA was in compliance with the covenants of the RCF.
At December 31, 2017, undrawn committed credit lines totaling €7.6 billion included the €6.25 billion RCF and approximately €1.3 billion of other revolving credit facilities. At December 31, 2016, undrawn committed credit lines totaling €6.2 billion included the original €5.0 billion RCF and approximately €1.2 billion of other revolving credit facilities.
Mexico Bank Loan
FCA Mexico, S.A. de C.V. (“FCA Mexico”), our principal operating subsidiary in Mexico, has a non-revolving loan agreement (“Mexico Bank Loan”) maturing on March 20, 2022 and bears interest at one-month LIBOR plus 3.35 percent per annum. At December 31, 2017, the Mexico Bank Loan had an outstanding balance of €0.4 billion (€0.5 billion at December 31, 2016). As of December 31, 2017, we may prepay all or any portion of the loan without premium or penalty. The Mexico Bank Loan requires FCA Mexico to maintain certain fixed and other assets as collateral, and comply with certain covenants, including, but not limited to, financial maintenance covenants, limitations on liens, incurrence of debt and asset sales. As of December 31, 2017, FCA Mexico was in compliance with the covenants under the Mexico Bank Loan.
Asset-backed financing
Asset-backed financing represents the amount of financing received through factoring transactions which do not meetIAS 39 derecognition requirements and are recognized as assets of the same amount of €357 million (€410 million atDecember 31, 2016) within Trade and other receivables in the Consolidated Statement of Financial Position (Note 15, Trade,other receivables and tax receivables).

199
Other debt
During the year ended December 31, 2017, FCA US's Canadian subsidiary made payments on the Canada Health Care Trust (“HCT”) Tranche B Note totaling €272 million, which included a scheduled payment of principal and accrued interest and the prepayment of the remaining scheduled payments due on the Canada HCT Tranche B Note. The prepayment, of €226 million, was accounted for as a debt extinguishment, and as a result, a gain on extinguishment of €9 million was recorded within Net financial expenses in the Consolidated Income Statement for the year ended December 31, 2017. This Canada HCT Note represented FCA US’s principal Canadian subsidiary’s remaining financial liability to the Canadian Health Care Trust arising from the settlement of its obligations for postretirement health care benefits for National Automobile, Aerospace, Transportation and General Workers Union of Canada “CAW” (now part of Unifor), which represented employees, retirees and dependents
At December 31, 2016, Other debt included the unsecured Canada HCT Tranche B Note totaling €278 million, including accrued interest. During the year ended December 31, 2016, FCA US's Canadian subsidiary made payments on the Canada HCT Notes totaling €148 million, which included accrued interest and the prepayment of all scheduled payments due on the Canada HCT Tranche C Note. The prepayment on the Canada HCT Tranche C Note made on July 15, 2016 resulted in a loss on extinguishment of debt of €8 million that was recorded within Net financial expenses in the Consolidated Income Statement for the year ended December 31, 2016.
As described in more detail in Note 26, Equity, FCA issued Mandatory Convertible Securities in December 2014 with an aggregate notional amount of U.S.$2,875 million (€2,293 million), whereby the obligation to pay coupons as required by the Mandatory Convertible Securities met the definition of a financial liability. The Mandatory Convertible Securities were converted into FCA common shares on December 15, 2016 and the financial liability of U.S.$226 million (€213 million) was paid in cash.
Other debt also included funds raised from financial services companies, primarily in Latin America, deposits from dealers in Brazil and the Group's payables for finance leases, which are summarized in the table below:
At December 312017 2016
Duewithin
one year
Duebetweenone and
threeyears
Duebetween
threeandfive
years
Duebeyond
fiveyears Total
Duewithin
one year
Duebetweenone and
threeyears
Duebetween
threeandfive
years
Duebeyond
fiveyears Total
(€ million)
Minimum future leasepayments € 90 € 134 € 19 € 74 € 317 € 138 € 246 € 131 € 188 € 703Interest expense (15) (15) (3) (3) (36) (22) (29) (7) (5) (63)Present value of minimumlease payments € 75 € 119 € 16 € 71 € 281 € 116 € 217 € 124 € 183 € 640
Debt secured by assets
At December 31, 2017, debt secured by assets of the Group (excluding FCA US) amounted to €743 million (€914 million at December 31, 2016), of which €140 million (€433 million at December 31, 2016) was due to creditors for assets acquired under finance leases and the remaining amount mainly related to subsidized financing in Latin America. The total carrying amount of assets acting as security for loans for the Group (excluding FCA US) amounted to €2,372 million at December 31, 2017 (€1,940 million at December 31, 2016) (Note 11, Property, plant and equipment).
At December 31, 2017, debt secured by assets of FCA US amounted to €1,441 million and included €836 million relating to the Tranche B Term Loan due 2018, €141 million due to creditors for assets acquired under finance leases and €464 million for other debt and financial commitments. At December 31, 2016, debt secured by assets of FCA US amounted to €3,446 million and included €2,678 million relating to the Tranche B Term Loans, €207 million due to creditors for assets acquired under finance leases and €561 million for other debt and financial commitments.

200
22. Other liabilities and Tax payables
Other liabilities consisted of the following:
At December 31
2017 2016
CurrentNon-
current Total CurrentNon-
current Total(€ million)
Payables for buy-back agreements € 2,234 € — € 2,234 € 2,081 € — € 2,081Indirect tax payables 799 19 818 667 968 1,635Accrued expenses and deferred income 1,573 2,260 3,833 1,320 2,428 3,748Payables to personnel 988 16 1,004 1,006 34 1,040Social security payables 313 6 319 312 7 319Amounts due to customers for contract work(Note 14) 190 — 190 236 — 236Other 1,838 199 2,037 2,187 166 2,353Total Other liabilities € 7,935 € 2,500 € 10,435 € 7,809 € 3,603 € 11,412
An analysis of Other liabilities (excluding Accrued expenses and deferred income) by due date was as follows:
At December 312017 2016
Totaldue withinone year
(Current)
Duebetweenone and
fiveyears
Duebeyond
fiveyears
Totaldue afterone year
(Non-Current) Total
Totaldue withinone year
(Current)
Duebetweenone and
fiveyears
Duebeyond
fiveyears
Totaldue afterone year
(Non-Current) Total
(€ million)Other liabilities (excludingAccrued expenses and deferredincome) € 6,362 € 227 € 13 € 240 € 6,602 € 6,489 € 1,159 € 16 € 1,175 € 7,664
Payables for buy-back agreements refers to buy-back agreements entered into by the Group and includes the price received for the product recognized as an advance at the date of the sale, and subsequently, the repurchase price and the remaining lease installments yet to be recognized.
Indirect tax payables include federal taxes on commercial transactions accrued by the Group's Brazilian subsidiaries for which, at December 31, 2016, the Group (as well as a number of important industrial groups that operate in Brazil) was awaiting a decision by the Brazilian Supreme Court regarding its claim alleging double taxation.
On March 15, 2017, the Brazilian Supreme Court ruled that state value added tax should be excluded from the base for calculating a federal tax on revenue. At June 30, 2017, the Group determined that the likelihood of economic outflow related to such indirect taxes was no longer probable and the total liability of €895 million that FCA had accrued but not paid for such taxes for the period from 2007 to 2014 was reversed. Due to the materiality of this item and its effect on our results, the amount is presented separately in the line Reversal of a Brazilian indirect tax liability in the Consolidated Income Statement for the year ended December 31, 2017, and is composed of €547 million, originally recognized as a reduction to Net revenues, and €348 million, originally recognized within Net financial expenses. The Brazilian Supreme Court issued summary written minutes of its ruling on September 29, 2017 and Trial Minutes on October 2, 2017. On October 19, 2017, the Brazilian government filed its appeal against the PIS/COFINS over ICMS decision. Due to the uncertainty of scope of the application of the Supreme Court ruling taking into account the government’s appeal and request for modulation, and due to Brazil’s current heightened political and economic uncertainty, management believes a risk of economic outflow is still greater than remote.

201
Deferred income includes revenues not yet recognized in relation to separately-priced extended warranties and service contracts. These revenues will be recognized in the Consolidated Income Statement over the contract period in proportion to the costs expected to be incurred based on historical information. Deferred income also includes the remaining portion of government grants that will be recognized as income in the Consolidated Income Statement over the periods necessary to match them with the related costs which they are intended to offset.
On January 20, 2017, the last installment of U.S.$175 million (€166 million) was paid on the obligation arising from the 2014 memorandum of understanding between FCA US and the International Union, United Automobile, Aerospace and Agricultural Implement Workers of America, which was included within Other current liabilities at December 31, 2016.
Tax payables
An analysis by due date for Tax payables was as follows:
At December 312017 2016
Totaldue withinone year
(Current)
Duebetweenone and
five years
Duebeyond
fiveyears
Total dueafter one
year (Non-Current) Total
Totaldue withinone year
(Current)
Duebetweenone and
five years
Duebeyond
fiveyears
Total dueafter one
year(Non-
Current) Total(€ million)
Tax payables € 309 € 32 € 42 € 74 € 383 € 162 € 25 € — € 25 € 187
23. Fair value measurement
Assets and liabilities that are measured at fair value on a recurring basis
The following table shows the fair value hierarchy for financial assets and liabilities that are measured at fair value on a recurring basis:
At December 312017 2016
Note Level 1 Level 2 Level 3 Total Level 1 Level 2 Level 3 Total(€ million)
Debt securities and equityinstruments measured at fair valuethrough other comprehensiveincome 13 € 3 € 24 € — € 27 € 159 € 18 € 12 € 189Debt securities and equityinstruments measured at fair valuethrough profit or loss 13 275 — 2 277 312 — — 312Collateral deposits 13 61 — — 61 68 — — 68Derivative financial assets 16 — 254 30 284 — 458 21 479Cash and cash equivalents 17 10,800 1,838 — 12,638 15,790 1,528 — 17,318Total Assets € 11,139 € 2,116 € 32 € 13,287 € 16,329 € 2,004 € 33 € 18,366Derivative financial liabilities 16 — 138 1 139 — 695 2 697Total Liabilities € — € 138 € 1 € 139 € — € 695 € 2 € 697
In 2017, there were no transfers between Levels in the fair value hierarchy. For assets and liabilities recognized in the financial statements at fair value on a recurring basis, the Group determines whether transfers have occurred between levels in the hierarchy by re-assessing categorization at the end of each reporting period.
The fair value of derivative financial assets and liabilities is measured by taking into consideration market parameters at the balance sheet date and using valuation techniques widely accepted in the financial business environment. In particular:

202
• the fair value of forward contracts and currency swaps is determined by taking the prevailing exchange rates and interest rates at the balance sheet date;
• the fair value of interest rate swaps and forward rate agreements is determined by taking the prevailing interest rates at the balance sheet date and using the discounted expected cash flow method;
• the fair value of combined interest rate and currency swaps is determined using the exchange and interest rates prevailing at the balance sheet date and the discounted expected cash flow method; and
• the fair value of swaps and options hedging commodity price risk is determined by using suitable valuation techniques and taking market parameters at the balance sheet date (in particular, underlying prices, interest rates and volatility rates).
The carrying value of Cash and cash equivalents (Note 17, Cash and cash equivalents) usually approximates fair value due to the short maturity of these instruments. The fair value of money market funds is also based on available market quotations. Where appropriate, the fair value of cash equivalents is determined with discounted expected cash flow techniques using observable market yields (categorized as Level 2).
The following table provides a reconciliation of the changes in items measured at fair value and categorized within Level 3:
SecuritiesDerivative financial
assets/(liabilities)(€ million)
At January 1, 2016 € 12 € (35)Gains/(Losses) recognized in Consolidated Income Statement — (31)Gains/(Losses) recognized in Other comprehensive income — 62Issues/Settlements — 23At December 31, 2016 12 19Gains/(Losses) recognized in Consolidated Income Statement (10) 27Gains/(Losses) recognized in Other comprehensive income — 18Issues/Settlements — (35)At December 31, 2017 € 2 € 29
The gains/(losses) included in the Consolidated Income Statements were recognized within Cost of revenues. Of the total gains/(losses) recognized in Other comprehensive income, €20 million was recognized within Cash flow reserves and €2 million was recognized within Currency translation differences.
Assets and liabilities not measured at fair value on recurring basis
The carrying value for current receivables and payables is a reasonable approximation of the fair value as the present value of future cash flows does not differ significantly from the carrying amount.

203
The following table provides the carrying amount and fair value for financial assets and liabilities not measured at fair value on a recurring basis:
At December 312017 2016
NoteCarryingamount
FairValue
Carryingamount
FairValue
(€ million)
Dealer financing € 2,295 € 2,295 € 2,115 € 2,115Retail financing 420 405 286 285Finance lease 4 4 6 6Other receivables from financing activities 421 421 171 171Total Receivables from financing activities 15 € 3,140 € 3,125 € 2,578 € 2,577
Asset backed financing € 357 € 357 € 410 € 410Notes 9,626 10,365 12,351 13,164Other debt 7,988 8,001 11,287 11,311Total Debt 21 € 17,971 € 18,723 € 24,048 € 24,885
The fair value of Receivables from financing activities, which are categorized within Level 3 of the fair value hierarchy, has been estimated with discounted cash flows models. The most significant inputs used for this measurement are market discount rates that reflect conditions applied in various reference markets on receivables with similar characteristics, adjusted in order to take into account the credit risk of the counterparties.
Notes that are traded in active markets for which close or last trade pricing is available are classified within Level 1 of the fair value hierarchy. Notes for which such prices are not available are valued at the last available price or based on quotes received from independent pricing services or from dealers who trade in such securities and are categorized as Level 2. At December 31, 2017, €10,358 million and €7 million of notes were classified within Level 1 and Level 2, respectively. At December 31, 2016, €13,157 million and €7 million of notes were classified within Level 1 and Level 2, respectively.
The fair value of Other debt included in Level 2 of the fair value hierarchy has been estimated using discounted cash flow models. The main inputs used are year-end market interest rates, adjusted for market expectations of the Group’s non-performance risk implied in quoted prices of traded securities issued by the Group and existing credit derivatives on Group liabilities. The fair value of Other debt that requires significant adjustments using unobservable inputs is categorized within Level 3 of the fair value hierarchy. At December 31, 2017, €6,796 million and €1,205 million of Other Debt was classified within Level 2 and Level 3, respectively. At December 31, 2016, €9,424 million and €1,887 million of Other Debt was classified within Level 2 and Level 3, respectively.
24. Related party transactions
Pursuant to IAS 24 - Related Party Disclosures, the related parties of the Group are entities and individuals capable of exercising control, joint control or significant influence over the Group and its subsidiaries. Related parties include companies belonging to Exor N.V. (the largest shareholder of FCA through its 29.18 percent common shares shareholding interest and 42.34 percent voting power at December 31, 2017), which include Ferrari N.V. and CNHI. Exor N.V. received 73,606,222 of FCA common shares in connection with the conversion of the Mandatory Convertible Securities into FCA common shares on December 16, 2016 (Note 26, Equity). Related parties also include associates, joint ventures and unconsolidated subsidiaries of the Group. In addition, members of the FCA Board of Directors, and executives with strategic responsibilities and certain members of their families are also considered related parties.
Transactions carried out by the Group with its related parties are on commercial terms that are normal in the respective markets, considering the characteristics of the goods or services involved, and primarily relate to:
• the purchase of engines and engine components for Maserati vehicles from Ferrari N.V.;

204
• the sale of automotive lighting and automotive components to Ferrari N.V.;
• transactions related to the display of FCA brand names on Ferrari N.V. Formula 1 cars;
• the sale of vehicles to the joint ventures Tofas and FCA Bank leasing and renting subsidiaries;
• the sale of engines, other components and production systems and the purchase of light commercial vehicles with the joint operation Sevel S.p.A.;
• the sale of engines, other components and production systems to companies of CNHI;
• the purchase of vehicles, the provision of services and the sale of goods with the joint operation Fiat India Automobiles Private Limited;
• the provision of services and the sale of goods to the GAC FCA JV;
• the provision of services (accounting, payroll, tax administration, information technology, purchasing and security) to companies of CNHI; and
• the purchase of light commercial vehicles and passenger cars from the joint venture Tofas.
The most significant financial transactions with related parties generated Receivables from financing activities of the Group’s financial services companies from joint ventures and Asset-backed financing relating to amounts due to FCA Bank for the sale of receivables, which do not qualify for derecognition under IAS 39 – Financial Instruments: Recognition and Measurement.
The amounts for significant transactions with related parties recognized in the Consolidated Income Statements were as follows:
Years ended December 31
2017 2016 2015
NetRevenue
s Cost of
revenues
Selling, general
and othercosts, net
NetFinancialexpenses/(income)
NetRevenue
sCost of
revenues
Selling,general
andothercosts,net
NetFinancialexpenses/(income)
NetRevenue
sCost of
revenues
Selling,general
andothercosts,net
NetFinancialexpenses
(€ million)
Tofas € 1,287 € 2,779 € 9 € — € 1,536 € 2,811 € 3 € — € 1,533 € 1,611 € — € —
Sevel S.p.A. 392 — 5 — 381 — 5 — 311 — 4 —
FCA Bank 1,715 26 (20) 36 1,571 18 (21) 39 1,447 14 9 30
GAC FCA JV 569 — (105) — 683 — (82) — 252 — — —
Fiat India AutomobilesLimited 25 1 — — 23 1 (1) (1) 15 4 — —
Other 35 2 (4) 2 36 5 (3) — 29 22 — —
Total joint arrangements 4,023 2,808 (115) 38 4,230 2,835 (99) 38 3,587 1,651 13 30
Total associates 73 52 (3) (1) 91 47 — — 143 14 6 —
CNHI 526 329 2 — 543 422 3 — 564 431 — —
Ferrari N.V. 82 320 1 — 81 246 — — n/a n/a n/a n/a
Directors and KeyManagement — — 114 — — — 143 — — — 132 —
Other 1 — 26 — — — 26 — — 1 17 —
Total CNHI, Ferrari,Directors and other 609 649 143 — 624 668 172 — 564 432 149 —
Total unconsolidatedsubsidiaries 61 8 3 1 57 7 8 1 79 13 8 (1)
Total transactions withrelated parties € 4,766 € 3,517 € 28 € 38 € 5,002 € 3,557 € 81 € 39 € 4,373 € 2,110 € 176 € 29
Total for the Group € 110,934 € 93,975 € 7,385 € 1,469 € 111,018 € 95,295 € 7,568 € 2,016 € 110,595 € 97,620 € 7,576 € 2,366

205
Assets and liabilities from significant transactions with related parties were as follows:
At December 31
2017 2016
Trade andother
receivablesTrade
payablesOther
liabilities
Asset-backed
financing Debt(1)
Tradeand other
receivablesTrade
payablesOther
liabilities
Asset-backed
financing Debt (1)
(€ million)
Tofas € 34 € 240 € 50 € — € — € 28 € 298 € 52 € — € —
Sevel S.p.A. 23 — 6 — 1 33 — 4 — 8FCA Bank 466 206 199 319 32 201 248 108 169 18GAC FCA JV 58 15 1 — — 121 2 4 — —
Fiat India AutomobilesLimited 7 13 5 — — 2 — — — —
Other 20 1 — — — 25 4 — — —
Total joint arrangements 608 475 261 319 33 410 552 168 169 26Total associates 36 32 13 — — 30 18 18 — —CNHI 47 86 11 — — 80 82 15 — 4Ferrari N.V. 23 75 — — — 25 75 — — —
Other 1 2 — — — — 2 — — —
Total CNHI, Ferrari N.V.and other 71 163 11 — — 105 159 15 — 4Total unconsolidatedsubsidiaries 83 8 1 — 28 84 9 1 — 25Total originating fromrelated parties € 798 € 678 € 286 € 319 € 61 € 629 € 738 € 202 € 169 € 55
Total for the Group € 8,553 € 21,939 € 10,435 € 357 € 17,614 € 7,854 € 22,655 € 11,412 € 410 € 23,638
_________________________1) This relates to Debt excluding Asset-backed financing, refer to Note, 21 Debt .
Commitments and Guarantees pledged in favor of related parties
As of December 31, 2017, the Group had a take or pay commitment with Tofas with future minimum expected obligations as follows:
(€ million)
2018 € 3402019 € 2762020 € 2692021 € 2502022 € 159
2023 and thereafter € —
Compensation to Directors and Key Management
The fees of the Directors of the Group for carrying out their respective functions, including those in other consolidated companies, were as follows:
Years ended December 312017 2016 2015
(€ thousand)
Directors(1) € 29,861 € 39,329 € 38,488Total Compensation € 29,861 € 39,329 € 38,488
206
___________________(1) This amount includes the notional compensation cost arising from long-term share-based compensation granted to the Chief Executive Officer and share-based compensation to non-executive Directors.
Refer to Note 18, Share-based compensation, for information related to the special recognition award granted to the Chief Executive Officer on April 16, 2015 and the PSU and RSU awards granted to certain key employees.
The aggregate compensation expense for remaining executives with strategic responsibilities was approximately €81 million for 2017 (€103 million in 2016 and €65 million in 2015), which, in addition to base compensation, includes:
• an amount of approximately €49 million in 2017 (approximately €73 million in 2016 and approximately €38 million in 2015) for share-based compensation expense;
• an amount of approximately €8 million in 2017 (approximately €8 million in 2016 and approximately €8 million in 2015) for short-term employee benefits; and
• an amount of €9 million in 2017 (€6 million in 2016 and €3 million in 2015) for pension and similar benefits.
25. Guarantees granted, commitments and contingent liabilities
Guarantees granted
At December 31, 2017, the Group had pledged guarantees on the debt or commitments of third parties totaling €5 million (€8 million at December 31, 2016), as well as guarantees of €4 million on related party debt (€2 million at
December 31, 2016).
SCUSA Private-label financing agreement
In February 2013, FCA US entered into a private-label financing agreement (the “SCUSA Agreement”) with Santander Consumer USA Inc. (“SCUSA”), an affiliate of Banco Santander, which launched on May 1, 2013. Under the SCUSA Agreement, SCUSA provides a wide range of wholesale and retail financing services to FCA US's dealers and consumers in accordance with its usual and customary lending standards, under the Chrysler Capital brand name.
The SCUSA Agreement has a ten-year term from February 2013, subject to early termination in certain circumstances, including the failure by a party to comply with certain of its ongoing obligations under the SCUSA Agreement. In accordance with the terms of the agreement, SCUSA provided an upfront, nonrefundable payment of €109 million (U.S.$150 million) in May 2013, which was recognized as deferred revenue and is amortized over ten years. At December 31, 2017, €67 million (U.S.$80 million) remained in deferred revenue.
From time to time, FCA US works with certain lenders to subsidize interest rates or cash payments at the inception of a financing arrangement to incentivize customers to purchase its vehicles, a practice known as “subvention.” FCA US has provided SCUSA with limited exclusivity rights to participate in specified minimum percentages of certain of its retail financing rate subvention programs. SCUSA has committed to certain revenue sharing arrangements, as well as to consider future revenue sharing opportunities. SCUSA bears the risk of loss on loans contemplated by the SCUSA Agreement. The parties share in any residual gains and losses in respect of consumer leases, subject to specific provisions in the SCUSA Agreement, including limitations on FCA US participation in gains and losses.

207
Other repurchase obligations
In accordance with the terms of other wholesale financing arrangements in Mexico, FCA Mexico is required to repurchase dealer inventory financed under these arrangements, upon certain triggering events and with certain exceptions, including in the event of an actual or constructive termination of a dealer’s franchise agreement. These obligations exclude certain vehicles including, but not limited to, vehicles that have been damaged or altered, that are missing equipment or that have excessive mileage or an original invoice date that is more than one year prior to the repurchase date. In December 2015, FCA Mexico entered into a ten-year private label financing agreement with FC Financial, S.A De C.V., Sofom, E.R., Grupo Financiaro Inbursa (“FC Financial”), a wholly owned subsidiary of Banco Inbursa, under which FC Financial provides a wide range of financial wholesale and retail financial services to FCA Mexico's dealers and retail customers under the FCA Financial Mexico brand name. The wholesale repurchase obligation under the new agreement will be limited to wholesale purchases in case of actual or constructive termination of a dealer's franchise agreement.
At December 31, 2017, the maximum potential amount of future payments required to be made in accordance with these wholesale financing arrangements was approximately €285 million (US$319 million) and was based on the aggregate repurchase value of eligible vehicles financed through such arrangements in the respective dealer’s stock. If vehicles are required to be repurchased through such arrangements, the total exposure would be reduced to the extent the vehicles can be resold to another dealer. The fair value of the guarantee was less than €0.1 million at December 31, 2017, which considers both the likelihood that the triggering events will occur and the estimated payment that would be made net of the estimated value of inventory that would be reacquired upon the occurrence of such events. These estimates are based on historical experience.
Arrangements with key suppliers
From time to time, in the ordinary course of our business, the Group enters into various arrangements with key third party suppliers in order to establish strategic and technological advantages. A limited number of these arrangements contain unconditional purchase obligations to purchase a fixed or minimum quantity of goods and/or services with fixed and determinable price provisions. Future minimum purchase obligations under these arrangements at December 31, 2017 were as follows:
(€ million)
2018 € 8172019 € 5832020 € 5152021 € 3252022 € 1982023 and thereafter € 53
Operating lease contracts
The Group has operating lease contracts for the right to use industrial buildings and equipment with an average term of 10-20 years and 3-5 years, respectively. The following table summarizes the total future minimum lease payments under non-cancellable lease contracts:
At December 31, 2017
Due within one year
Duebetweenone and
three years
Duebetween
three andfive years
Duebeyond
five years Total(€ million)
Future minimum lease payments under operating leaseagreements € 352 € 457 € 298 € 396 € 1,503
During 2017, the Group recognized lease payments expense of €341 million (€339 million in 2016 and €246 million in 2015).

208
Other commitments, arrangements and contractual rights
UAW Labor Agreement
In October 2015, FCA US and the UAW agreed to a new four-year national collective bargaining agreement, which will expire in September 2019. The provisions of the new agreement continue certain opportunities for success-based compensation upon meeting certain quality and financial performance metrics. The agreement closes the pay gap between “Traditional” and “In-progression” employees over an eight-year period and will continue to provide UAW-represented employees with a simplified adjusted profit sharing plan. The adjusted profit sharing plan was effective for the 2016 plan year and is directly aligned with NAFTA profitability. The agreement included lump-sum payments in lieu of further wage increases of primarily U.S.$4,000 for “Traditional” employees and U.S.$3,000 for “In-progression” employees totaling approximately U.S.$141 million (€127 million) that was paid to UAW members on November 6, 2015. These payments are being amortized ratably over the four-year labor agreement period.
Italian labor agreement
In April 2015, a new four-year compensation agreement was signed by FCA companies in Italy within the automobiles business. The new compensation agreement was subsequently included into the new labor agreement and was extended to all FCA companies in Italy on July 7, 2015.
The compensation arrangement was effective retrospectively from January 1, 2015 through December 31, 2018 and incentivizes all employees toward achievement of the productivity, quality and profitability targets established in the 2015-2018 period of the 2014-2018 business plan developed in May 2014 by adding two variable additional elements to base pay:
• an annual bonus calculated on the basis of production efficiencies achieved and the plant’s World Class Manufacturing audit status; and
• a component linked to achievement of the financial targets established in the 2015-2018 period of the 2014-2018 business plan (“Business Plan Bonus”) for the EMEA region, including the activities of the premium brands Alfa Romeo and Maserati. A portion of the Business Plan Bonus is a guaranteed amount based on employees' base salaries and is paid over four years in quarterly installments, while the remaining portion is to be paid in March 2019 to active employees as of December 31, 2018, with at least two years of service during 2015 through 2018.
A total of €124 million, €117 million and €115 million was recorded as an expense for the compensation agreement for the years ended December 31, 2017, 2016 and 2015, respectively.
Canada labor agreement
FCA entered into a new four-year labor agreement with Unifor in Canada that was ratified on October 16, 2016. The terms of this agreement provide a two percent wage increase in the first and fourth years of the agreement for employees hired prior to September 24, 2012 and will continue to close the pay gap for employees hired on or after September 24, 2012 by revising a ten-year progressive pay scale plan. The agreement includes a lump sum payment in lieu of further wage increases of 6,000 Canadian dollars (“CAD$”) per employee totaling approximately CAD$55 million (approximately €38 million) that was paid to Unifor members on November 4, 2016. These payments will be amortized ratably over the four-year labor agreement period. The new agreement expires September 2020.
Sevel S.p.A.
As part of the Sevel cooperation agreement with Peugeot-Citroen SA (“PSA”), the Group was party to a call agreement with PSA whereby, from July 1, 2017 to September 30, 2017, the Group would have the right to acquire the residual interest in the joint operation Sevel with effect from December 31, 2017. During the period specified in the agreement the Group did not exercise its right to acquire the residual interest in the joint operation Sevel and such right expired.

209
Contingent liabilities
In connection with significant asset divestitures carried out in prior years, the Group provided indemnities to purchasers with the maximum amount of potential liability under these contracts generally capped at a percentage of the purchase price. These liabilities refer principally to potential liabilities arising from possible breaches of representations and warranties provided in the contracts and, in certain instances, environmental or tax matters, generally for a limited period of time. Potential obligations with respect to these indemnities were approximately €170 million and a total of €50 million has been recognized within Provisions related to these obligations as of December 31, 2017 and 2016. The Group has provided certain other indemnifications that do not limit potential payment and as such, it was not possible to estimate the maximum amount of potential future payments that could result from claims made under these indemnities.
Takata airbag inflators
On November 3, 2015, NHTSA issued the Takata Consent Order regarding Takata airbag inflators manufactured using non-desiccated Phase Stabilized Ammonium Nitrate (“PSAN”) that were installed in original equipment manufacturers' vehicles. On May 4, 2016, NHTSA published an amendment to the original Takata Consent Order which expanded the scope of the original consent order to include 7.6 million additional units of non-desiccated PSAN airbag inflators, of which approximately 2 million inflator units were deferred and not yet subject to recall. In compliance with the amendment to the Takata Consent Order, on May 16, 2016, Takata submitted a Defect and Noncompliance Information Report (“DIR”) to NHTSA declaring the non-desiccated PSAN airbag inflators defective. As a result, FCA US announced a recall of vehicles, assembled in NAFTA, related to the May 16, 2016 DIR, which represented approximately 5.6 million inflator units. Considering the estimated cost of the recall and the estimated participation rate of the recalls taking into account the age of the vehicles involved, we recognized €414 million within Cost of revenues for the year ended December 31, 2016. The charges reflected our assumptions on participation rate based on the Group's historical experience and industry data.
On January 2, 2018, Takata submitted a DIR to NHTSA declaring certain non-desiccated PSAN inflators contained in certain vehicles to be defective. As a result of Takata’s DIR, on January 9, 2018, FCA US submitted a DIR to NHTSA indicating that approximately 0.4 million units of the approximately 2 million inflator units that were deferred are now subject to recall. In accordance with IAS 10, Subsequent Events, and using the same assumptions based on our historical experience and industry data for the estimated participation rates taking into account the age of the vehicles involved, we recognized an additional provision of approximately €29 million within Cost of revenues for the year ended December 31, 2017. The remaining 1.6 million inflator units remain deferred and not yet subject to recall. As such, no costs have been accrued. We do not anticipate the cost associated with any potential recall would be material to the Group.
In December 2017, FCA started to inform the authorities in LATAM that preventative safety campaigns will be launched for certain non-desiccated PSAN inflators manufactured by Takata. Considering the estimated cost of the preventative safety campaign and the estimated participation rates, which take into account the age of the vehicles involved, a provision of €73 million has been recognized at December 31, 2017.
If our actual experience differs from our historical experience or industry data, this could result in an adjustment to the Takata warranty provision in the future. We continue to assess the condition and performance of airbag inflators supplied by Takata. While there have not been any known issues relating to the unrecalled units, as additional information, data and analysis become available and we continue discussions with our regulators, the number of inflator units that may become subject to recalls could be expanded. Any liability for the estimated cost for future recalls would be recognized in the period in which a recall becomes probable.
Emissions Matters
We have received inquiries from several regulatory authorities as they examine the on-road tailpipe emissions of several automakers’ vehicles. We are, when jurisdictionally appropriate, cooperating with a number of governmental agencies and authorities.

210
In particular, in Europe, we have been working with the Italian Ministry of Transport (“MIT”) and the Dutch Vehicle Regulator (“RDW”), the authorities that certified FCA diesel vehicles for sale in the European Union, and the UK Driver and Vehicle Standards Agency (“DVSA”). We also initially responded to inquiries from the German authority, the Kraftfahrt-Bundesamt (“KBA”), regarding emissions test results for our vehicles reported by KBA, and we discussed the KBA reported test results, our emission control calibrations and the features of the vehicles in question. After these initial discussions, the MIT, which has sole authority for regulatory compliance of the vehicles it has certified, asserted its exclusive jurisdiction over the matters raised by the KBA, tested the vehicles, determined that the vehicles complied with applicable European regulations and informed the KBA of its determination. Thereafter, mediations have been held under European Commission (“EC”) rules, between the MIT and the German Ministry of Transport and Digital Infrastructure (“BMVI”), which oversees the KBA, in an effort to resolve their differences. The mediation was concluded with no action being taken with respect to FCA. In May 2017, the EC announced its intention to open an infringement procedure against Italy regarding Italy's alleged failure to respond to EC's concerns regarding certain FCA emission control calibrations. The MIT has responded to the EC's allegations by confirming that the vehicles' approval process was correctly performed, which was borne out in material Italy provided during the mediation process.
In addition, at the request of the French Consumer Protection Agency, the French public prosecutor has been investigating diesel vehicles of a number of automakers including FCA, regarding whether the sale of those vehicles violated French consumer protection laws.
The results of these inquiries cannot be predicted at this time; however, the intervention by a number of governmental agencies and authorities has required significant management time, which may divert attention from other key aspects of our business plan, or may lead to further enforcement actions as well as penalties or obligations to modify or recall vehicles, any of which may have a material adverse effect on our business, results of operations and reputation.
On January 12, 2017, the U.S. Environmental Protection Agency (“EPA”) and the California Air Resources Board issued Notices of Violation related to certain software-based features in the emissions control systems in approximately 100,000 2014-2016 model year light-duty Ram 1500 and Jeep Grand Cherokee diesel vehicles. On May 23, 2017, the Environmental and Natural Resources Division of the U.S. Department of Justice (“DOJ-ENRD”) filed a civil lawsuit against us in connection with the concerns raised by the EPA. The complaint alleges that software-based features were not disclosed to the EPA as required during the vehicle emissions certification process, resulting in violations of the Clean Air Act. The complaint also alleges that certain of the software features bypass, defeat or render inoperative the vehicles’ emission control systems, causing the vehicles to emit higher levels of oxides of nitrogen (NOx) during certain normal real world driving conditions than during federal emissions tests. A number of private lawsuits relating to the vehicles have been filed in U.S. state and federal courts principally on behalf of consumers asserting fraud, violation of consumer protection laws, and other civil claims, including a putative class action that is proceeding in U.S. federal court in the Northern District of California. A number of other governmental agencies and authorities, including the U.S. Department of Justice, the U.S. Securities and Exchange Commission and various states Attorneys General have commenced related investigations.
We have been working with the EPA and the CARB to clarify issues related to the Company’s emissions control systems technology and announced in May that we had developed updated emissions software calibrations for our model year 2017 light-duty Ram 1500 and Jeep Grand Cherokee diesel vehicles that we believe address the agencies’ concerns.
Following this, we continued to work with the agencies on vehicle testing and refinements to these calibrations. The 2017 model year updates include modified emissions software calibrations, with no required hardware changes, and we believe that the modifications do not negatively impact the fuel efficiency or performance of the vehicles. In July 2017, we received vehicle emissions certifications from CARB and the EPA permitting the production and sale of our 2017 model year light-duty Ram 1500 and Jeep Grand Cherokee diesel vehicles in all 50 states. We continue to work with the EPA and CARB to seek their permission to use these modified emissions software calibrations to update the emissions control systems in our 2014-2016 model year light-duty Ram 1500 and Jeep Grand Cherokee diesel vehicles.
We are unable to predict the outcome of these investigations and litigation at this stage and due to the range of possible outcomes, we are unable to reliably estimate a range of probable losses. It is possible that the resolution of these matters may adversely affect our reputation with consumers, which may negatively impact demand for our vehicles and could have a material adverse effect on our business, financial condition and results of operations.

211
National Training Center
In connection with an on-going government investigation into matters at the UAW-Chrysler National Training Center, the U.S. Department of Justice has brought charges against a number of individuals including former FCA US employees and individuals associated with the UAW for, among other things, tax fraud and conspiring to provide money or other things of value to a UAW officer and UAW employees while acting in the interests of FCA US, in violation of the Labor Management Relations (Taft-Hartley) Act. We continue to cooperate with this investigation. Several putative class action lawsuits have been filed against FCA US in U.S. federal court alleging harm to UAW workers as a result of these acts. At this early stage, we are unable to reliably evaluate the likelihood that a loss will be incurred or estimate a range of possible loss.
Sales Reporting
On July 18, 2016, we confirmed that the U.S. Securities and Exchange Commission had commenced an investigation into our reporting of vehicle unit sales to end customers in the U.S. and that inquiries into similar issues have been received from the U.S. Department of Justice. These vehicle unit sales reports relate to unit sales volumes primarily by dealers to consumers while we generally recognize revenues based on shipments to dealers and other customers and not on vehicle unit sales to consumers. We continue to cooperate with these investigations; however their outcome is uncertain and cannot be predicted at this time. At this stage, we are unable to reliably evaluate the likelihood that a loss will be incurred or estimate a range of possible loss.
We are also aware of 2 putative securities class action lawsuits pending against us in the U.S. District Court for the Eastern District of Michigan making allegations with regard to our reporting of vehicle unit sales to end consumers in the U.S. At this early stage, we are unable to reliably evaluate the likelihood that a loss will be incurred or estimate a range of possible loss.
Safety Recalls
On September 11, 2015, a putative securities class action complaint was filed in the U.S. District Court for the Southern District of New York against us alleging material misstatements regarding our compliance with regulatory requirements and that we failed to timely disclose certain expenses relating to our vehicle recall campaigns. On October 5, 2016, the district court dismissed the claims relating to the disclosure of vehicle recall campaign expenses but ruled that claims regarding the alleged misstatements regarding regulatory requirements would be allowed to proceed. On February 17, 2017, the plaintiffs amended their complaint to allege material misstatements regarding emissions compliance. On November 13, 2017, the Court denied our motion to dismiss the emissions-related claims. At this stage of the proceedings, we are unable to reliably evaluate the likelihood that a loss will be incurred or estimate a range of possible loss.
Rear Impact Litigation
On July 9, 2012, a lawsuit was filed against FCA US in the Superior Court of Decatur County, Georgia, U.S. (the “Court”), with respect to a March 2012 fatality in a rear-impact collision involving a 1999 Jeep Grand Cherokee. Plaintiffs alleged that the manufacturer had acted in a reckless and wanton fashion when it designed and sold the vehicle due to the placement of the fuel tank behind the rear axle and had breached a duty to warn of the alleged danger. On April 2, 2015, a jury found in favor of the plaintiffs and the trial court entered a judgment against FCA US in the amount of U.S.$148.5 million (€141 million). On July 24, 2015, the Court issued a remittitur reducing the judgment against FCA US to U.S.$40 million (€38 million).
FCA US believes the jury verdict was not supported by the evidence or the law and appealed the Court’s verdict. FCA US maintains that the 1999 Jeep Grand Cherokee is not defective, and its fuel system does not pose an unreasonable risk to motor vehicle safety. The vehicle met or exceeded all applicable Federal Motor Vehicle Safety Standards, including the standard governing fuel system integrity. Furthermore, FCA US submitted extensive data to NHTSA validating that the vehicle performs as well as, or better than, peer vehicles in impact studies, and nothing revealed in the trial altered this data. During the trial, however, FCA US was not allowed to introduce all the data previously provided to NHTSA, which demonstrated that the vehicle’s fuel system is not defective.

212
On November 15, 2016, the Georgia Court of Appeals affirmed the Court’s verdict and judgment of U.S.$40 million (€38 million). On December 23, 2016, FCA US filed a petition with the Georgia Supreme Court. Oral arguments were held on October 24, 2017. While a decision by the Georgia Supreme Court could affirm the judgment, FCA US is seeking an order from the Georgia Supreme Court to instead overturn the verdict, order a new trial, or further modify the amount of the judgment. We do not believe a loss, if any, will exceed the amount of the current judgment and believe it is more likely that a loss, if any, will be less than the current judgment and will be covered by our existing provisions.
26. Equity
Share capital
At December 31, 2017, the authorized share capital of FCA is forty million Euro (€40,000,000), divided into two billion (2,000,000,000) FCA common shares, nominal value of one Euro cent (€0.01) per share and two billion (2,000,000,000) special voting shares, nominal value of one Euro cent (€0.01) per share.
At December 31, 2017, fully paid-up share capital of FCA amounted to €19 million (€19 million at December 31, 2016) and consisted of 1,540,089,690 common shares and of 408,941,767 special voting shares, all with a par value of €0.01 each (1,527,965,719 common shares and 408,941,767 special voting shares, all with a par value of €0.01 each at December 31, 2016).
The following table summarizes the changes in the number of outstanding common shares and special voting shares of FCA during the year ended December 31, 2017:
Common Shares Special Voting Shares TotalBalance at January 1, 2017 1,527,965,719 408,941,767 1,936,907,486Shares issued to Executive Directors(Directors' Compensation) 2,795,500 — 2,795,500Shares issued to Non-ExecutiveDirectors (Directors' Compensation) 54,855 — 54,855
Shares issued to Key management 9,273,616 — 9,273,616Balance at December 31, 2017 1,540,089,690 408,941,767 1,949,031,457
On October 29, 2014, the Board of Directors of FCA resolved to authorize the issuance of up to a maximum of 90,000,000 common shares under the equity incentive plan and the long term incentive program, which had been adopted before the closing of the Merger and under which equity awards can be granted to eligible individuals. Any issuance of shares during the period from 2014 to 2018 are subject to the satisfaction of certain performance/retention requirements and any issuances to directors are subject to FCA shareholders' approval (refer to Note 18, Share-based compensation).
Mandatory Convertible Securities
On December 15, 2016, each U.S.$100 notional amount of the Mandatory Convertible Securities that had been issued in December 2014 was converted to 8.3077 of FCA's common shares based upon the average volume weighted average prices of FCA common shares on the New York Stock Exchange during the 20 consecutive trading day period beginning November 14, 2016 and ending on December 12, 2016 (inclusive), which resulted in the issuance of total of 238,846,375 FCA common shares.
Other reserves:
Other reserves comprised the following:
• a legal reserve of €11,594 million at December 31, 2017 (€10,866 million at December 31, 2016) that was determined in accordance to the Dutch law and mainly relates to development expenditures capitalized by subsidiaries and their earnings subject to certain restrictions on distributions to FCA;
• capital reserves of €5,817 million at December 31, 2017 (€5,766 million at December 31, 2016);

213
• retained earnings, that after the separation of the legal reserve was negative €333 million (negative €1,356 million at December 31, 2016); and
• profit attributable to owners of the parent of €3,491 million for the year ended December 31, 2017 (€1,803 million for the year ended December 31, 2016).
Other comprehensive income
Other comprehensive income was as follows:
Years ended December 312017 2016 2015
(€ million)
Items that will not be reclassified to the Consolidated Income Statement in subsequentperiods:
(Losses)/gains on re-measurement of defined benefit plans € (64) € 584 € 679Share of gains/(losses) on re-measurement of defined benefit plans for equity methodinvestees 2 (5) (2)Items relating to discontinued operations — — 4
Total Items that will not be reclassified to the Consolidated Income Statement (B1) (62) 579 681
Items that may be reclassified to the Consolidated Income Statement in subsequent periods:Gains/(losses) on cash flow hedging instruments arising during the period 66 (54) 63Gains/(losses) on cash flow hedging instruments reclassified to the ConsolidatedIncome Statement 81 (195) 123 Total Gains/(losses) on cash flow hedging instruments 147 (249) 186Gains on available-for-sale financial assets 14 15 11Exchange (losses)/gains on translating foreign operations (1,942) 458 1,002Share of Other comprehensive income/(loss) for equity method investees arising duringthe period (94) (97) (18)Share of Other comprehensive income/(loss) for equity method investees reclassified tothe Consolidated Income Statement (27) (25) 1 Total Share of Other comprehensive (loss)/income for equity method investees (121) (122) (17)Items relating to discontinued operations — — 21
Total Items that may be reclassified to the Consolidated Income Statement (B2) (1,902) 102 1,203
Total Other comprehensive income (B1)+(B2)=(B) (1,964) 681 1,884Tax effect (31) (192) (249)Tax effect - discontinued operations — — (4)
Total Other comprehensive income, net of tax € (1,995) € 489 € 1,631
Gains and losses arising from the re-measurement of defined benefit plans mainly include actuarial gains and losses arising during the period, the return on plan assets (net of interest income recognized in the Consolidated Income Statement) and any changes in the effect of the asset ceiling. These gains and losses are offset against the related defined benefit plan's net liabilities or assets (Note 19, Employee benefits liabilities).
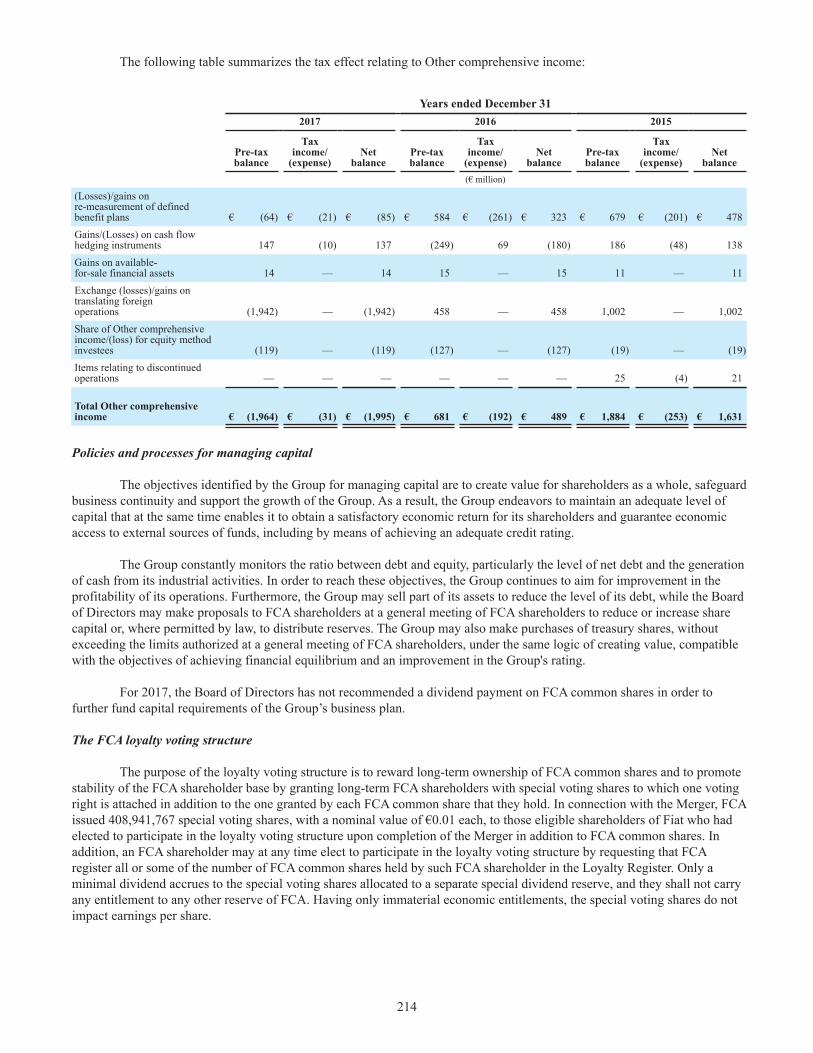
214
The following table summarizes the tax effect relating to Other comprehensive income:
Years ended December 312017 2016 2015
Pre-taxbalance
Taxincome/
(expense)Net
balancePre-taxbalance
Taxincome/
(expense)Net
balancePre-taxbalance
Taxincome/
(expense)Net
balance(€ million)
(Losses)/gains onre-measurement of definedbenefit plans € (64) € (21) € (85) € 584 € (261) € 323 € 679 € (201) € 478Gains/(Losses) on cash flowhedging instruments 147 (10) 137 (249) 69 (180) 186 (48) 138Gains on available-for-sale financial assets 14 — 14 15 — 15 11 — 11Exchange (losses)/gains ontranslating foreignoperations (1,942) — (1,942) 458 — 458 1,002 — 1,002Share of Other comprehensiveincome/(loss) for equity methodinvestees (119) — (119) (127) — (127) (19) — (19)Items relating to discontinuedoperations — — — — — — 25 (4) 21
Total Other comprehensiveincome € (1,964) € (31) € (1,995) € 681 € (192) € 489 € 1,884 € (253) € 1,631
Policies and processes for managing capital
The objectives identified by the Group for managing capital are to create value for shareholders as a whole, safeguard business continuity and support the growth of the Group. As a result, the Group endeavors to maintain an adequate level of capital that at the same time enables it to obtain a satisfactory economic return for its shareholders and guarantee economic access to external sources of funds, including by means of achieving an adequate credit rating.
The Group constantly monitors the ratio between debt and equity, particularly the level of net debt and the generation of cash from its industrial activities. In order to reach these objectives, the Group continues to aim for improvement in the profitability of its operations. Furthermore, the Group may sell part of its assets to reduce the level of its debt, while the Board of Directors may make proposals to FCA shareholders at a general meeting of FCA shareholders to reduce or increase share capital or, where permitted by law, to distribute reserves. The Group may also make purchases of treasury shares, without exceeding the limits authorized at a general meeting of FCA shareholders, under the same logic of creating value, compatible with the objectives of achieving financial equilibrium and an improvement in the Group's rating.
For 2017, the Board of Directors has not recommended a dividend payment on FCA common shares in order to further fund capital requirements of the Group’s business plan.
The FCA loyalty voting structure
The purpose of the loyalty voting structure is to reward long-term ownership of FCA common shares and to promote stability of the FCA shareholder base by granting long-term FCA shareholders with special voting shares to which one voting right is attached in addition to the one granted by each FCA common share that they hold. In connection with the Merger, FCA issued 408,941,767 special voting shares, with a nominal value of €0.01 each, to those eligible shareholders of Fiat who had elected to participate in the loyalty voting structure upon completion of the Merger in addition to FCA common shares. In addition, an FCA shareholder may at any time elect to participate in the loyalty voting structure by requesting that FCA register all or some of the number of FCA common shares held by such FCA shareholder in the Loyalty Register. Only a minimal dividend accrues to the special voting shares allocated to a separate special dividend reserve, and they shall not carry any entitlement to any other reserve of FCA. Having only immaterial economic entitlements, the special voting shares do not impact earnings per share.

215
27. Earnings per share
Basic earnings per share
The basic earnings per share for the years ended December 31, 2017, 2016 and 2015 was determined by dividing the Net profit attributable to the equity holders of the parent by the weighted average number of shares outstanding during each period. For the years ended December 31, 2017 and 2016, the weighted average number of shares outstanding included 238,846,375 shares from the conversion of the Mandatory Convertible Securities into FCA common shares in December 2016 (Note 26, Equity). For the year ended December 31, 2015, the weighted average number of shares outstanding was increased to include the minimum number of ordinary shares that would arise on conversion of the Mandatory Convertible Securities.
The following tables provide the amounts used in the calculation of basic earnings per share:
Years ended December 312017 2016 2015
Net profit attributable to owners of the parent million € 3,491 € 1,803 € 334Weighted average number of shares outstanding thousand 1,535,988 1,513,019 1,510,555Basic earnings per share € € 2.27 € 1.19 € 0.22
Years ended December 312017 2016 2015
Net profit from continuing operations attributable to owners of theparent million € 3,491 € 1,803 € 83Weighted average number of shares outstanding thousand 1,535,988 1,513,019 1,510,555Basic earnings per share from continuing operations € € 2.27 € 1.19 € 0.05
Years ended December 312017 2016 2015
Net profit from discontinued operations attributable to owners of theparent million € — € — € 251Weighted average number of shares outstanding thousand 1,535,988 1,513,019 1,510,555Basic earnings per share from discontinued operations € € — € — € 0.17
Diluted earnings per share
In order to calculate the diluted earnings per share, the weighted average number of shares outstanding was increased to take into consideration the theoretical effect of potential common shares that would be issued for the restricted and performance share units outstanding and unvested at December 31, 2017, 2016 and 2015 (Note 18, Share-based compensation), as determined using the treasury stock method.
For the year ended December 31, 2015, the weighted average number of shares outstanding was also increased to take into consideration the theoretical effect that would arise if the shares related to the Mandatory Convertible Securities (Note 26, Equity) were issued. Based on FCA's share price at December 31, 2015, the minimum number of shares would have been issued had the Mandatory Convertible Securities been converted and, as such, there was no difference between the basic and diluted earnings per share for the year ended December 31, 2015 in respect of the Mandatory Convertible Securities.

216
For the year ended December 31, 2017, the theoretical effect that would arise if some of the PSU NI awards granted in 2015 and 2016 and some of the RSU awards granted in 2017 (refer to Note 18 - Share-based compensation) were exercised was not taken into consideration in the calculation of diluted earnings per share as this would have had an anti-dilutive effect. There were no instruments excluded from the calculation of diluted earnings per share because of an anti-dilutive impact for the years ended December 31, 2016 and 2015.
The following tables provide the amounts used in the calculation of diluted earnings per share:
Years ended December 312017 2016 2015
Net profit attributable to owners of the parent million € 3,491 € 1,803 € 334Weighted average number of shares outstanding thousand 1,535,988 1,513,019 1,510,555Number of shares deployable for share-based compensation thousand 20,318 13,357 3,452Weighted average number of shares outstanding for diluted earnings per share thousand 1,556,306 1,526,376 1,514,007Diluted earnings per share € € 2.24 € 1.18 € 0.22
Years ended December 312017 2016 2015
Net profit from continuing operations attributable to owners of theparent million € 3,491 € 1,803 € 83Weighted average number of shares outstanding for diluted earnings per share thousand 1,556,306 1,526,376 1,514,007Diluted earnings per share from continuing operations € € 2.24 € 1.18 € 0.05
Years ended December 312017 2016 2015
Net profit from discontinued operations attributable to owners of theparent million € — € — € 251Weighted average number of shares outstanding for diluted earnings per share thousand 1,556,306 1,526,376 1,514,007Diluted earnings per share from discontinued operations € € — € — € 0.17
28. Segment reporting
Reportable segments reflect the operating segments of the Group that are regularly reviewed by the Chief Executive Officer (the “chief operating decision maker” as defined under IFRS 8 – Operating Segments) for making strategic decisions, allocating resources and assessing performance and that exceed the quantitative thresholds provided in IFRS 8 – Operating Segments, or whose information is considered useful for the users of the financial statements. The Group's reportable segments include four regional mass-market vehicle operating segments (NAFTA, LATAM, APAC and EMEA), the Maserati global luxury brand operating segment and a global Components operating segment, which are described as follows:
• NAFTA designs, engineers, develops, manufactures and distributes vehicles. NAFTA mainly earns its revenues from the sale of vehicles under the Chrysler, Jeep, Dodge, Ram, Fiat and Alfa Romeo brand names and from sales of the related parts and accessories in the United States, Canada, Mexico and Caribbean islands.
• LATAM designs, engineers, develops, manufactures and distributes vehicles. LATAM mainly earns its revenues from the sale of passenger cars and light commercial vehicles and related spare parts under the Fiat and Jeep brand names in South and Central America as well as from the distribution of the Chrysler, Dodge and Ram brand cars in the same region. In addition, the segment provides financial services to the dealer network in Brazil and to retail customers in Argentina.

217
• APAC mainly earns its revenues from the distribution and sale of cars and related spare parts under the Abarth, Alfa Romeo, Chrysler, Dodge, Fiat and Jeep brands mostly in China, Japan, Australia, South Korea and India. These activities are carried out through both subsidiaries and joint ventures. In addition, the segment provides financial services to the dealer network and retail customers in China.
• EMEA designs, engineers, develops, manufactures and distributes vehicles. EMEA mainly earns its revenues from the sale of passenger cars and light commercial vehicles under the Fiat, Alfa Romeo, Lancia, Abarth, Jeep and Fiat Professional brand names, the sale of the related spare parts in Europe, Middle East and Africa, and from the distribution of the Chrysler, Dodge and Ram brand vehicles in these areas. In addition, the segment provides financial services related to the sale of cars and light commercial vehicles in Europe, primarily through the FCA Bank joint venture and Fidis S.p.A., a fully owned captive finance company that is mainly involved in the factoring business.
• Maserati designs, engineers, develops, manufactures and distributes vehicles. Maserati earns its revenues from the sale of luxury vehicles under the Maserati brand.
• Components earns its revenues from the production and sale of lighting components, body control units, suspensions, shock absorbers, electronic systems, exhaust systems and plastic molding components. In addition, the segment earns revenues with its spare parts distribution activities carried out under the Magneti Marelli brand name, cast iron components for engines, gearboxes, transmissions and suspension systems and aluminum cylinder heads (Teksid), in addition to the design and production of industrial automation systems and related products for the automotive industry (Comau).
Transactions among the mass-market vehicle segments generally are presented on a “where-sold” basis, which reflects the profit/(loss) on the ultimate sale to third party customer within the segment. This presentation generally eliminates the effect of the legal entity transfer price within the segments. Revenues of the other segments, aside from the mass-market vehicle segments, are those directly generated by or attributable to the segment as the result of its usual business activities and include revenues from transactions with third parties as well as those arising from transactions with segments, recognized at normal market prices.
Other activities include the results of the activities and businesses that are not operating segments under IFRS 8 – Operating Segments. In addition, Unallocated items and eliminations include consolidation adjustments, eliminations, as well as costs related to the launch of the Alfa Romeo Giulia platform which were not allocated to the mass-market vehicle segments due to the limited number of shipments. Financial income and expenses and income taxes are not attributable to the performance of the segments as they do not fall under the scope of their operational responsibilities.
Adjusted Earnings Before Interest and Taxes (“Adjusted EBIT”) is the measure used by the chief operating decision maker to assess performance, allocate resources to the Group's operating segments and to view operating trends, perform analytical comparisons and benchmark performance between periods and among the segments. Adjusted EBIT excludes certain adjustments from Net profit from continuing operations including gains/(losses) on the disposal of investments, restructuring, impairments, asset write-offs and unusual income/(expenses) that are considered rare or discrete events that are infrequent in nature, and also excludes Net financial expenses and Tax expense/(benefit). See below for a reconciliation of Net profit from continuing operations, which is the most directly comparable measure included in our Consolidated Income Statement, to Adjusted EBIT. Operating assets are not included in the data reviewed by the chief operating decision maker, and as a result and as permitted by IFRS 8 – Operating Segments, the related information is not provided.

218
The following tables summarize selected financial information by segment for the years ended December 31, 2017, 2016 and 2015:
Mass-Market Vehicles
2017 NAFTA LATAM APAC EMEA Maserati Components Other
activities
Unallocated items &
eliminations FCA
(€ million)Revenues € 66,094 € 8,004 € 3,250 € 22,700 € 4,058 € 10,115 € 727 € (4,014) € 110,934
Revenues from transactions with othersegments (47) (15) (32) (140) (21) (3,323) (436) 4,014 —Revenues from third party customers € 66,047 € 7,989 € 3,218 € 22,560 € 4,037 € 6,792 € 291 € — € 110,934
Net profit from continuing operations € 3,510Tax expense € 2,651Net financial expenses € 1,469Adjustments:
Reversal of a Brazilian indirect tax liability(1) € — € — € — € — € — € — € — € — € (895)Impairment expense(2) € — € 77 € — € 142 € — € 10 € — € — € 229Recall campaigns - airbag inflators(3) € 29 € 73 € — € — € — € — € — € — € 102Restructuring costs/(reversal)(4) € (1) € 75 € — € — € — € 20 € — € 1 € 95
Resolution of certain Components legal matters € — € — € — € — € — € 43 € — € — € 43Deconsolidation of Venezuela(5) € — € 42 € — € — € — € — € — € — € 42NAFTA capacity realignment(6) € (38) € — € — € — € — € — € — € — € (38)
Tianjin (China) port explosions insurance recoveries(7) € — € — € (68) € — € — € — € — € — € (68)Gains on disposal of investments(8) € — € — € — € — € — € (27) € — € (49) € (76)Other € (1) € — € 1 € — € — € (11) € — € 1 € (10)
Adjusted EBIT € 5,227 € 151 € 172 € 735 € 560 € 536 € (189) € (138) € 7,054
Share of profit of equity method investees € — € — € 75 € 306 € — € 14 € 13 € 1 € 409_________________________1) As this liability related to the Group’s Brazilian operations in multiple segments, it was not attributed to the results of the related segments;2) Impairment expense in EMEA relates to changes in global product portfolio. Impairment expense in LATAM relates to product portfolio changes and the impairment of certain real estate assets in Venezuela, in the second quarter of 2017 due to the continued deterioration of the economic conditions; (3) Refer to Note 20, Provisions and Note 25, Guarantees granted, commitments and contingent liabilities.(4) Primarily related to workforce restructuring costs related to LATAM; (5) Refer to Note 3, Scope of consolidation; (6) Income related to adjustments to reserves for the NAFTA capacity realignment plan; (7) Insurance recoveries related to losses incurred in connection with the explosions at the Port of Tianjin (China) in August 2015 are excluded from Adjusted EBIT to the extent the insured loss to which the recovery relates was excluded from Adjusted EBIT. Insurance recoveries are included in Adjusted EBIT to the extent they relate to costs, increased incentives or business interruption losses that were included in Adjusted EBIT;(8) Refer to Note 3, Scope of consolidation.

219
Mass-Market Vehicles
2016 NAFTA LATAM APAC EMEA Maserati Components Other
activities
Unallocated items &
eliminations FCA
(€ million)Revenues € 69,094 € 6,197 € 3,662 € 21,860 € 3,479 € 9,659 € 779 € (3,712) € 111,018
Revenues from transactions with othersegments (40) (42) (24) (148) (10) (3,030) (418) 3,712 —Revenues from third party customers € 69,054 € 6,155 € 3,638 € 21,712 € 3,469 € 6,629 € 361 € — € 111,018
Net profit from continuing operations € 1,814Tax expense € 1,292Net financial expenses € 2,016Adjustments:
Recall campaigns - airbag inflators(1) € 414 € — € — € — € — € — € — € — € 414
Costs for recall, net of supplier recoveries - contested with supplier(2) € 132 € — € — € — € — € — € — € — € 132NAFTA capacity realignment(3) € 156 € — € — € — € — € — € — € — € 156
Tianjin (China) port explosions, net of insurance recoveries(4) € — € — € (55) € — € — € — € — € — € (55)Currency devaluation € — € 19 € — € — € — € — € — € — € 19Restructuring costs/(reversal)(5) € (10) € 68 € — € 5 € — € 25 € — € — € 88Impairment expense(6) € — € 52 € 109 € 7 € — € 49 € 8 € — € 225Gains on disposal of investments € — € — € — € — € — € (8) € (5) € — € (13)Other € (25) € 3 € (10) € — € — € — € — € — € (32)
Adjusted EBIT € 5,133 € 5 € 105 € 540 € 339 € 445 € (244) € (267) € 6,056
Share of profit of equity method investees € 2 € — € 30 € 272 € — € 6 € 2 € 1 € 313________________________(1) Refer to Note 20, Provisions and Note 25, Guarantees granted, commitments and contingent liabilities; (2) Refer to Note 20, Provisions; (3) Refer to Note 5, Research and development costs and Note 11, Property plant and equipment; (4) Insurance recoveries related to losses incurred in connection with the explosions at the Port of Tianjin (China) in August 2015 are excluded from Adjusted EBIT to the extent the insured loss to which the recovery relates was excluded from Adjusted EBIT. Insurance recoveries are included in Adjusted EBIT to the extent they relate to costs, increased incentives or business interruption losses that were included in Adjusted EBIT. Through December 31, 2016, no significant insurance recoveries related to Tianjin have been recognized in Adjusted EBIT; (5) Restructuring costs within LATAM and Components primarily relate to cost reduction initiatives to right-size to market volume in Brazil;(6) Refer to Note 5, Research and development costs. and Note 11, Property plant and equipment.

220
Mass-Market Vehicles
2015 NAFTA LATAM APAC EMEA Maserati Components Other
activities
Unallocated items &
eliminations FCA
(€ million)Revenues € 69,992 € 6,431 € 4,885 € 20,350 € 2,411 € 9,770 € 844 € (4,088) € 110,595
Revenues from transactions with othersegments (1) (194) (25) (304) (13) (3,095) (456) 4,088 —Revenues from third party customers € 69,991 € 6,237 € 4,860 € 20,046 € 2,398 € 6,675 € 388 € — € 110,595
Net profit from continuing operations € 93Tax expense € 166Net financial expenses € 2,366Adjustments:
Change in estimate for future recall campaign costs(1) € 761 € — € — € — € — € — € — € — € 761Tianjin (China) port explosions(2) € — € — € 142 € — € — € — € — € — € 142NAFTA capacity realignment(3) € 834 € — € — € — € — € — € — € — € 834Currency devaluations(4) € — € 163 € — € — € — € — € — € — € 163NHTSA Consent Order and amendment(5) € 144 € — € — € — € — € — € — € — € 144Impairment expense € — € 16 € 22 € 46 € 3 € 20 € — € 11 € 118Restructuring costs/(reversal) € (11) € 40 € — € — € — € 23 € 2 € (1) € 53Other € (97) € — € 41 € 1 € — € 8 € (1) € 2 € (46)
Adjusted EBIT € 4,450 € (87) € 52 € 213 € 105 € 395 € (150) € (184) € 4,794
Share of profit of equity method investees € 3 € — € (78) € 219 € — € (2) € (12) € — € 130
_________________________(1) Amount represents the change in estimate for estimated future recall campaign costs for the U.S. and Canada recognized within Cost of revenues - refer to Note 20, Provisions; (2) Amount relates to the write-down of inventory (€53 million) and incremental incentives (€89 million) for vehicles affected by the explosions at the Port of Tianjin in August 2015; (3) Amount represents costs from implementation of plan to realign existing NAFTA capacity - comprised of €422 million for asset impairments, €236 million for payment of supplemental unemployment benefits due to extended downtime at certain plants and €176 million for write off of capitalized development expenditures with no future benefit; (4) €80 million was due to adoption of SIMADI exchange rate at June 30, 2015 (refer to Note 3, Scope of consolidation, and €83 million was due to the devaluation of the Argentinian Peso resulting from changes in monetary policy; (5) Refer to Note 20, Provisions.
Information about geographical area
The following table summarizes the non-current assets (other than financial instruments, deferred tax assets and post-employment benefits assets) attributed to certain geographic areas:
At December 312017 2016
(€ million)
North America € 34,099 € 35,833Italy 12,458 12,558Brazil 5,137 6,310Poland 1,151 1,117Serbia 639 660Other countries 2,536 2,582Total Non-current assets (other than financial instruments, deferred tax assets and post-employment benefits assets) € 56,020 € 59,060
221
29. Explanatory notes to the Consolidated Statement of Cash Flows
Non-cash items
For the year ended December 31, 2017, Other non-cash items of €(199) million primarily €406 million related to the revaluation of investments accounted for by using the equity method, partially offset by €229 million of impairments and other amounts that were not individually material.
For the year ended December 31, 2016, Other non-cash items of €111 million primarily included €225 million of impairments, which were partially offset by other amounts that were not individually material.
For the year ended December 31, 2015, Other non-cash items of €812 million primarily included (i) €713 million non-cash charges for impairments which primarily related to asset impairments in connection with the realignment of the Group's manufacturing capacity in NAFTA to better meet market demand and (ii) €80 million charge recognized as a result of the adoption of the SIMADI exchange rate to re-measure the net monetary assets of the Group’s Venezuelan subsidiary in U.S. Dollar (as described in Note 3. Scope of consolidation) (reported, for the effect on cash and cash equivalents, within Translation exchange differences).
Operating activities
For the year ended December 31, 2017, the €1,666 million increase in inventories related to ramp-up of new models at year end, including the all-new Alfa Romeo Stelvio and the new Jeep Wrangler, as well as volume increases in LATAM and Maserati. The increase in trade payables of €1,086 million primarily related to increased production volumes in NAFTA and LATAM in the fourth quarter of 2017 as compared to the same period in 2016.
For the year ended December 31, 2016, the net increase of €1,519 million in provisions was mainly due to the increase in the warranty provision of €414 million in NAFTA for recall campaigns related to an industry wide recall for airbag inflators resulting from parts manufactured by Takata, an increase in accrued sales incentives primarily related to NAFTA and EMEA, as well as estimated net costs of €132 million associated with a recall for which costs are being contested with a supplier. In addition, the €471 million increase in inventories primarily related to the increased production of new vehicle models in EMEA and the €776 million increase in trade payables mainly related to increased production levels in EMEA, which was partially offset by reduced activity in LATAM and the effect of localized Jeep production in China. Furthermore, the change in other payables and receivables of €295 million primarily reflected the net payment of taxes and deferred expenses.
For the year ended December 31, 2015, the net increase of €3,206 million in provisions mainly related to an increase in the warranty provision, which included the change in estimate for future recall campaign costs in NAFTA, and higher accrued sales incentives primarily related to increased sales volumes in NAFTA. In addition, the €958 million increase in inventories reflected the increased consumer demand for our vehicles and inventory buildup in NAFTA due to production changeovers and the €1,571 million increase in trade payables mainly related to increased production levels in EMEA. Furthermore, the change in other payables and receivables of €580 million primarily reflected the net payment of taxes and deferred expenses.
Financing activities
For the year ended December 31, 2017, net cash used in financing activities was primarily the result of the (i) repayment of other long-term debt, net of proceeds, of €889 million, which included (a) the U.S.$1,826 million (€1,721 million) of cash used for the voluntary prepayment of the outstanding principal and accrued interest of FCA US's Tranche B Term Loan due 2017 and (b) the repayment of a note at maturity under the MTN Programme, one with a principal amount of €850 million, one with a principal amount of €1,000 million and one with a principal amount of CHF450 million (€385 million), as described in Note 21, Debt.

222
For the year ended December 31, 2016, net cash used in financing activities was primarily the result of the (i) repayment of other long-term debt for a total of €4,618 million, which included (a) the voluntary prepayments of principal of the FCA US Tranche B Term Loans of U.S.$2.0 billion (€1.8 billion) as described in Note 21, Debt, (b) the payment of the financial liability related to the Mandatory Convertible Securities of €213 million upon their conversion to FCA shares and (c) repayments at maturity of other long-term debt of €2,605 million primarily in Brazil, as well as (ii) the repayment at maturity of three notes issued under the MTN Programme, two of which were for an aggregate principal amount of €2,000 million and one for a principal amount of CHF 400 million (€373 million) as described in Note 21, Debt, which were partially offset by (iii) the issuance of a new note under the MTN Programme for a principal amount of €1,250 million and (iv) proceeds from other long-term debt for a total of €1,342 million, which included the proceeds from the €250 million loan entered into with the EIB in December 2016 as described in Note 21, Debt.
For the year ended December 31, 2015, net cash from financing activities was primarily the result of (i) the prepayment of the FCA US Secured Senior Notes and the repayment at maturity of two notes issued under the MTN Programme for a total of €7,241 million and (ii) the repayment of other long-term debt for a total of €4,412 million, which were partially offset by (iii) net proceeds of €866 million from the Ferrari IPO as described in Note 3, Scope of consolidation, (iv) proceeds from the issuance of the Notes by FCA for a total of €2,840 million as described in Note 21, Debt, (v) €3,061 million provided by other long-term borrowings and (vi) net proceeds from the €2.0 billion Ferrari Bridge Loan and Ferrari Term Loan, which are reflected within cash flows used in financing activities - discontinued operations in the Consolidated Statement of Cash Flows.
The following is a reconciliation of liabilities arising from financing activities for the year ended December 31, 2017:
(€ million)
Total Debt at January 1, 2017 € 24,048
Derivative (assets)/liabilities and collateral at January 1, 2017 150
Total Liabilities from financing activities at January 1, 2017 € 24,198
Cash flows € (4,470)
Foreign exchange effects € (1,311)
Fair value changes € (286)
Changes in scope of consolidation € (83)
Other changes € (283)
Total Liabilities from financing activities at December 31, 2017 € 17,765
Derivative (assets)/liabilities and collateral at December 31, 2017 (206)
Total Debt at December 31, 2017 € 17,971
Interest expense and taxes paid
During the year December 31, 2017, the Group paid interest of €1,190 million and received interest of €299 million. During the year ended December 31, 2016, the Group paid interest of €1,676 million and received interest of €370 million. During the year ended December 31, 2015, the Group, including Ferrari, paid interest of €2,087 million and received interest of €469 million. Amounts indicated are also inclusive of interest rate differentials paid or received on interest rate derivatives.
During the year ended December 31, 2017, the Group made income tax payments, net of refunds, totaling €533 million. During the year ended December 31, 2016, the Group made income tax payments, net of refunds, totaling €622 million. During the year ended December 31, 2015, the Group, including Ferrari, made income tax payments, net of refunds, totaling €664 million.

223
30. Qualitative and quantitative information on financial risks
The Group is exposed to the following financial risks connected with its operations:
• credit risk, principally arising from its normal commercial relations with final customers and dealers, and its financing activities;
• liquidity risk, with particular reference to the availability of funds and access to the credit market and to financial instruments in general;
• financial market risk (principally relating to exchange rates, interest rates and commodity prices), since the Group operates at an international level in different currencies and uses financial instruments which generate interest. The Group is also exposed to the risk of changes in the price of certain commodities and of certain listed shares.
These risks could significantly affect the Group’s financial position and results and for this reason, the Group systematically identifies and monitors these risks in order to detect potential negative effects in advance and take the necessary action to mitigate them, primarily through its operating and financing activities and if required, through the use of derivative financial instruments in accordance with established risk management policies.
Financial instruments held by the funds that manage pension plan assets are not included in this analysis (refer to Note 19, Employee benefits liabilities).
The following section provides qualitative and quantitative disclosures on the effect that these risks may have upon the Group. The quantitative data reported in the following does not have any predictive value, in particular the sensitivity analysis on finance market risks does not reflect the complexity of the market or the reaction which may result from any changes that are assumed to take place.
Credit risk
Credit risk is the risk of economic loss arising from the failure to collect a receivable. Credit risk encompasses the direct risk of default and the risk of a deterioration of the creditworthiness of the counterparty.
The Group’s credit risk differs in relation to the activities carried out. In particular, dealer financing and operating and financial lease activities that are carried out through the Group’s financial services companies are exposed both to the direct risk of default and the deterioration of the creditworthiness of the counterparty, while the sale of vehicles and spare parts is mostly exposed to the direct risk of default of the counterparty. These risks are however mitigated by the fact that collection exposure is spread across a large number of counterparties and customers.
Overall, the credit risk regarding the Group’s trade receivables and receivables from financing activities is concentrated in the European Union, Latin America and North American markets.
In order to test for impairment, significant receivables from corporate customers and receivables for which collectability is at risk are assessed individually, while receivables from end customers or small business customers are grouped into homogeneous risk categories. A receivable is considered impaired when there is objective evidence that the Group will be unable to collect all amounts due specified in the contractual terms. Objective evidence may be provided by the following factors: significant financial difficulties of the counterparty, the probability that the counterparty will be involved in an insolvency procedure or will default on its installment payments, the restructuring or renegotiation of open items with the counterparty, changes in the payment status of one or more debtors included in a specific risk category and other contractual breaches. The calculation of the amount of the impairment loss is based on the risk of default by the counterparty, which is determined by taking into account all the information available as to the customer’s solvency, the fair value of any guarantees received for the receivable and the Group’s historical experience.
The maximum credit risk to which the Group is potentially exposed at December 31, 2017 is represented by the carrying amounts of financial assets in the financial statements and the nominal value of the guarantees provided on liabilities and commitments to third parties as discussed in Note 25, Guarantees granted, commitments and contingent liabilities.

224
Dealers and final customers for which the Group provides financing are subject to specific assessments of their creditworthiness under a detailed scoring system; in addition to carrying out this screening process, the Group also obtains financial and non-financial guarantees for risks arising from credit granted. These guarantees are further strengthened where possible by reserve of title clauses on financed vehicle sales to the sales network made by Group financial service companies and on vehicles assigned under finance and operating lease agreements.
Receivables from financing activities amounting to €3,140 million at December 31, 2017 (€2,578 million at December 31, 2016) contained balances totaling €5 million (€4 million at December 31, 2016), which have been written down on an individual basis. Of the remainder, balances totaling €46 million are past due by up to one month (€34 million at December 31, 2016), while balances totaling €21 million are past due by more than one month (€19 million at December 31, 2016). In the event of installment payments, even if only one installment is overdue, the entire receivable balance is classified as overdue.
Trade receivables and other receivables amounting to €5,413 million at December 31, 2017 (€5,276 million at December 31, 2016) contain balances totaling €15 million (€9 million at December 31, 2016) which have been written down on an individual basis. Of the remainder, balances totaling €271 million are past due by up to one month (€228 million at December 31, 2016), while balances totaling €233 million are past due by more than one month (€228 million at December 31, 2016).
Even though our current securities and Cash and cash equivalents consist of balances spread across various primary national and international banking institutions and money market instruments that are measured at fair value, there was no exposure to sovereign debt securities at December 31, 2017 which might lead to significant risk of repayment.
Liquidity risk
Liquidity risk is the risk if the Group is unable to obtain the funds needed to carry out its operations and meet its obligations. Any actual or perceived limitations on the Group’s liquidity may affect the ability of counterparties to do business with the Group or may require additional amounts of cash and cash equivalents to be allocated as collateral for outstanding obligations.
The continuation of challenging economic conditions in the markets in which the Group operates and the uncertainties that characterize the financial markets, necessitate special attention to the management of liquidity risk. In that sense, measures taken to generate funds through operations and to maintain a conservative level of available liquidity are important factors for ensuring operational flexibility and addressing strategic challenges over the next few years.
The main factors that determine the Group’s liquidity situation are the funds generated by or used in operating and investing activities, the debt lending period and its renewal features or the liquidity of the funds employed and market terms and conditions.
The Group has adopted a series of policies and procedures whose purpose is to optimize the management of funds and to reduce liquidity risk as follows:
• centralizing the management of receipts and payments where it may be economical in the context of the local civil, currency and fiscal regulations of the countries in which the Group is present;
• maintaining a conservative level of available liquidity;
• diversifying the means by which funds are obtained and maintaining a continuous and active presence in the capital markets;
• obtaining adequate credit lines; and
• monitoring future liquidity on the basis of business planning.
The Group manages liquidity risk by monitoring cash flows and keeping an adequate level of funds at its disposal. The operating cash management and liquidity investment of the Group are centrally coordinated in the Group's treasury

225
companies, with the objective of ensuring effective and efficient management of the Group’s funds. These companies obtain funds in the financial markets various funding sources.
In 2016, in conjunction with the amendments to the credit agreements that govern the Tranche B Term Loans of FCA US entered into in March 2016, the covenants restricting the provision of guarantees and payment of dividends by FCA US for the benefit of the rest of the Group were eliminated and FCA US's cash management activities are no longer managed separately from the rest of the Group.
FCA has not provided any guarantee, commitment or similar obligation in relation to any of FCA US’s financial indebtedness, nor has it assumed any kind of obligation or commitment to fund FCA US. Certain notes issued by FCA and its subsidiaries (other than FCA US and its subsidiaries) include covenants which may be affected by circumstances related to FCA US as well as certain other relevant subsidiaries, including cross-default clauses which may accelerate repayments in the event that FCA US fails to pay certain of its debt obligations.
Details of the repayment structure of the Group’s financial assets and liabilities are provided in Note 15, Trade, other receivables and tax receivables, Note 22, Other liabilities and Tax payables and in Note 21, Debt. Details of the repayment structure of derivative financial instruments are provided in Note 16, Derivative financial assets and liabilities.
The Group believes that the Group's total available liquidity, in addition to the funds that will be generated from operating and financing activities, will enable the Group to satisfy the requirements of its investing activities and working capital needs, fulfill its obligations to repay its debt at the natural due dates and ensure an appropriate level of operating and strategic flexibility.
Financial market risks
Due to the nature of our business, the Group is exposed to a variety of market risks, including foreign currency exchange rate risk, commodity price risk and interest rate risk.
The Group’s exposure to foreign currency exchange rate risk arises both in connection with the geographical distribution of the Group’s industrial activities compared to the markets in which it sells its products, and in relation to the use of external borrowing denominated in foreign currencies.
The Group’s exposure to interest rate risk arises from the need to fund industrial and financial operating activities and the necessity to deploy surplus funds. Changes in market interest rates may have the effect of either increasing or decreasing the Group’s Net profit, thereby indirectly affecting the costs and returns of financing and investing transactions.
The Group’s exposure to commodity price risk arises from the risk of changes in the price of certain raw materials and energy used in production. Changes in the price of raw materials could have a significant effect on the Group’s results by indirectly affecting costs and product margins.
These risks could significantly affect the Group’s financial position and results and for this reason, these risks are systematically identified and monitored, in order to detect potential negative effects in advance and take the necessary actions to mitigate them, primarily through its operating and financing activities and if required, through the use of derivative financial instruments in accordance with its established risk management policies.
The Group’s policy permits derivatives to be used only for managing the exposure to fluctuations in foreign currency exchange rates and interest rates as well as commodities prices connected with future cash flows and assets and liabilities, and not for speculative purposes.
The Group utilizes derivative financial instruments designated as fair value hedges mainly to hedge:
• the foreign currency exchange rate risk on financial instruments denominated in foreign currency; and
• the interest rate risk on fixed rate loans and borrowings.
The instruments used for these hedges are mainly foreign currency forward contracts, interest rate swaps and combined interest rate and foreign currency financial instruments.

226
The Group uses derivative financial instruments as cash flow hedges for the purpose of pre-determining:
• the exchange rate at which forecasted transactions denominated in foreign currencies will be accounted for;
• the interest paid on borrowings, both to match the fixed interest received on loans (customer financing activity), and to achieve a targeted mix of floating versus fixed rate funding structured loans; and
• the price of certain commodities.
The foreign currency exchange rate exposure on forecasted commercial flows is hedged by foreign currency swaps and forward contracts. Interest rate exposures are usually hedged by interest rate swaps and, in limited cases, by forward rate agreements. Exposure to changes in the price of commodities is generally hedged by using commodity swaps and commodity options. In addition, in order to manage the Group’s foreign currency risk related to its investments in foreign operation, the Group enters into net investment hedges, in particular foreign currency swaps and forward contracts. Counterparties to these agreements are major financial institutions.
Information on the fair value of derivative financial instruments held at the balance sheet date is provided in Note 16, Derivative financial assets and liabilities.
Quantitative information on foreign currency exchange rate risk
The Group is exposed to risk resulting from changes in foreign currency exchange rates, which can affect its earnings and equity. In particular:
• where a Group company incurs costs in a currency different from that of its revenues, any change in exchange rates can affect the operating results of that company.
• the principal exchange rates to which the Group is exposed are:
EUR/U.S.$, relating to sales and purchases in U.S.$ made by Italian companies (primarily for Maserati and Alfa Romeo vehicles) and to sales and purchases in Euro made by FCA US;
U.S.$/CAD, primarily relating to FCA Canada's sales of U.S. produced vehicles, net of FCA US sales of Canadian produced vehicles;
CNY, in relation to sales in China originating from FCA US and from Italian companies (primarily for Maserati and Alfa Romeo vehicles);
GBP, AUD, MXN, CHF, and ARS in relation to sales in the UK, Australian, Mexican, Swiss and Argentinian markets;
PLN and TRY, relating to manufacturing costs incurred in Poland and Turkey;
JPY mainly in relation to purchase of parts from Japanese suppliers and sales of vehicles in Japan; and
U.S.$/BRL, EUR/BRL, relating to Brazilian manufacturing operations and the related import and export flows.
The Group’s policy is to use derivative financial instruments to hedge a percentage of certain exposures subject to foreign currency exchange rate risk for the upcoming 12 months (including such risk before or beyond that date where it is deemed appropriate in relation to the characteristics of the business) and to hedge the exposure resulting from firm commitments unless not deemed appropriate.
227
Group companies may have trade receivables or payables denominated in a currency different from their respective functional currency. In addition, in a limited number of cases, it may be convenient from an economic point of view, or it may be required under local market conditions, for Group companies to obtain financing or use funds in a currency different from their respective functional currency. Changes in exchange rates may result in exchange gains or losses arising from these situations. The Group’s policy is to hedge, whenever deemed appropriate, the exposure resulting from receivables, payables and securities denominated in foreign currencies different from the respective Group companies' functional currency.
Certain of the Group’s companies are located in countries which are outside of the Eurozone, in particular the U.S., Brazil, Canada, Poland, Serbia, Turkey, Mexico, Argentina, the Czech Republic, India, China, Australia and South Africa. As the Group's reporting currency is the Euro, the income statements of those entities that have a reporting currency other than the Euro are translated into Euro using the average exchange rate for the period. In addition, the monetary assets and liabilities of these consolidated companies are translated into Euro at the period-end foreign exchange rate. The effects of these changes in foreign exchange rates are recognized directly in the Cumulative translation adjustments reserve included in Other comprehensive income. Changes in exchange rates may lead to effects on the translated balances of revenues, costs and monetary assets and liabilities reported in Euro, even when corresponding items are unchanged in the respective local currency of these companies.
The Group monitors its principal exposure to conversion exchange risk and, in certain circumstances, enters into derivatives for the purpose of hedging the specific risk.
There have been no substantial changes in 2017 in the nature or structure of exposure to foreign currency exchange rate risk or in the Group’s hedging policies.
The potential loss in fair value of derivative financial instruments held for foreign currency exchange rate risk management (currency swaps/forwards, cross-currency interest rate and currency swaps) at December 31, 2017 resulting from a 10 percent change in the exchange rates would have been approximately €1,010 million (€1,453 million at December 31, 2016).
This analysis assumes that a hypothetical, unfavorable 10 percent change in exchange rates as at year-end is applied in the measurement of the fair value of derivative financial instruments. Receivables, payables and future trade flows whose hedging transactions have been analyzed were not included in this analysis. It is reasonable to assume that changes in market exchange rates will produce the opposite effect, of an equal or greater amount, on the underlying transactions that have been hedged.
Quantitative information on interest rate risk
The manufacturing companies and treasuries of the Group make use of external borrowings and invest in monetary and financial market instruments. In addition, Group companies sell receivables resulting from their trading activities on a continuing basis. Changes in market interest rates can affect the cost of the various forms of financing, including the sale of receivables, or the return on investments and the employment of funds, thus negatively impacting the net financial expenses incurred by the Group.
In addition, the financial services companies provide loans (mainly to customers and dealers), financing themselves using various forms of direct debt or asset-backed financing (e.g. factoring of receivables). Where the characteristics of the variability of the interest rate applied to loans granted differ from those of the variability of the cost of the financing obtained, changes in the current level of interest rates can affect the operating result of those companies and the Group as a whole.
In order to manage these risks, the Group uses interest rate derivative financial instruments, mainly interest rate swaps and forward rate agreements, when available in the market, with the objective of mitigating, under economically acceptable conditions, the potential variability of interest rates on the Group's Net profit.
In assessing the potential impact of changes in interest rates, the Group segregates fixed rate financial instruments (for which the impact is assessed in terms of fair value) from floating rate financial instruments (for which the impact is assessed in terms of cash flows).
228
The fixed rate financial instruments used by the Group consist principally of part of the portfolio of the financial services companies (principally customer financing and financial leases) and part of debt (including subsidized loans and notes).
The potential loss in fair value of fixed rate financial instruments (including the effect of interest rate derivative financial instruments) held at December 31, 2017, resulting from a hypothetical 10 percent change in market interest rates, would have been approximately €71 million (approximately €56 million at December 31, 2016).
Floating rate financial instruments consist principally of cash and cash equivalents, loans provided by the financial services companies to the sales network and part of debt. The effect of the sale of receivables is also considered in the sensitivity analysis as well as the effect of hedging derivative instruments.
A hypothetical 10 percent change in short-term interest rates at December 31, 2017, applied to floating rate financial assets and liabilities, operations for the sale of receivables and derivative financial instruments, would have resulted in increased net financial expenses before taxes, on an annual basis, of approximately €27 million (€30 million at December 31, 2016).
This analysis is based on the assumption that there is an unfavorable change of 10 percent proportionate to interest rate levels across homogeneous categories. A homogeneous category is defined on the basis of the currency in which the financial assets and liabilities are denominated. In addition, the sensitivity analysis applied to floating rate financial instruments assumes that cash and cash equivalents and other short-term financial assets and liabilities which expire during the projected 12-month period will be renewed or reinvested in similar instruments, bearing the hypothetical short-term interest rates.
Quantitative information on commodity price risk
The Group has entered into derivative contracts for certain commodities to hedge its exposure to commodity price risk associated with buying raw materials and energy used in its normal operations.
In connection with the commodity price derivative contracts outstanding at December 31, 2017, a hypothetical 10 percent change in the price of the commodities at that date would have caused a fair value loss of €51 million (€35 million at December 31, 2016). Future trade flows whose hedging transactions have been analyzed were not considered in this analysis. It is reasonable to assume that changes in commodity prices will produce the opposite effect, of an equal or greater amount, on the underlying transactions that have been hedged.
31. Subsequent events
The Group has evaluated subsequent events through February 20, 2018, which is the date the financial statements were authorized for issuance.
In January 2018, as a result of the distribution of the Company's entire interest in GEDI to holders of FCA common shares on July 2, 2017, the Compensation Committee of FCA approved a conversion factor of 1.003733 that was applied to outstanding awards under the LTI Plan to make equity award holders whole for the resulting diminution in the value of an FCA common share. There was no change to the total cost of these awards to be amortized over the remaining vesting period as a result of these adjustments.
On January 11, 2018, a special bonus payment was announced of $2,000 (approximately €1,670) to approximately 60,000 FCA hourly and salaried employees in the United States, excluding senior leadership, during the second quarter of 2018 for an estimated total cost including applicable social taxes, of approximately $130 million (€109 million).

229
Company Financial Statements
At December 31, 2017
Index to Company Financial Statements
Page
Income StatementStatement of Financial PositionNotes to the Company Financial StatementsOther InformationDisclosures pursuant to Decree Article 10 EU-Directive on Takeovers
230231232243245

230
FIAT CHRYSLER AUTOMOBILES N.V.INCOME STATEMENT
(in € million)
Years Ended December 31Note 2017 2016
Result from investments 1 € 3,877 € 2,237Other operating income 2 61 31Personnel costs 3 (12) (11)Other operating costs 4 (166) (162)Net financial expenses 5 (281) (301)Profit before taxes 3,479 1,794Income taxes 6 12 9Profit from continuing operations 3,491 1,803Profit from discontinued operations — —Profit € 3,491 € 1,803
The accompanying notes are an integral part of the Company Financial Statements.

231
FIAT CHRYSLER AUTOMOBILES N.V.STATEMENT OF FINANCIAL POSITION
(in € million)
At December 31Note 2017 2016
AssetsProperty, plant and equipment 7 € 27 € 27Investments in Group companies and other equity investments 8 27,323 25,238Other financial assets 9 3,228 3,670
Total Non-current assets 30,578 28,935Current financial assets 10 239 560Trade receivables 11 15 17Other current receivables 12 329 216Cash and cash equivalents 13 1 1
Total Current assets 584 794Total Assets € 31,162 € 29,729
Equity and LiabilitiesEquity 14Share capital € 19 € 19Capital reserves 5,817 5,766Legal reserves 11,825 12,936Retained profit/(loss) (333) (1,356)Profit for the year 3,491 1,803
Total Equity 20,819 19,168LiabilitiesProvisions for employee benefits and other provisions 15 39 39Non-current debt 16 3,742 4,079Other non-current liabilities 17 11 13
Total Non-current liabilities 3,792 4,131Provisions for employee benefits and other current provisions 18 2 2Trade payables 19 7 15Current debt 20 6,142 6,081Other financial liabilities 9 — 47Other debt 21 400 285
Total Current liabilities 6,551 6,430Total Equity and liabilities € 31,162 € 29,729
The accompanying notes are an integral part of the Company Financial Statements.
232
FIAT CHRYSLER AUTOMOBILES N.V.NOTES TO THE COMPANY FINANCIAL STATEMENTS
PRINCIPAL ACTIVITIES
The FCA merger
On January 29, 2014, the Board of Directors of Fiat SpA (“Fiat”) approved a proposed corporate reorganization resulting in the formation of Fiat Chrysler Automobiles N.V. (“FCA” or the “Company”) as a fully integrated global automaker. The Board determined that a redomiciliation into the Netherlands with a listing on the NYSE and an additional listing on the Mercato Telematico Azionario (“MTA”) would be the structure most suitable to Fiat's profile and its strategic and financial objectives. FCA's principal executive offices were established in London, United Kingdom.
FCA was incorporated as a public limited liability company (naamloze vennootschap) under the laws of the Netherlands on April 1, 2014, under the name Fiat Investments N.V.. On June 15, 2014, the Board of Directors of Fiat approved the merger plan of Fiat into Fiat Investments N.V., and, at the extraordinary general meeting held on August 1, 2014, the shareholders of Fiat approved the merger that was completed and became effective on October 12, 2014. The merger, which took the form of a reverse merger, resulted in Fiat Investments N.V. being the surviving entity which was then renamed Fiat Chrysler Automobiles N.V.. On October 13, 2014, FCA common shares commenced trading on the NYSE and on the MTA.
ACCOUNTING POLICIES
Basis of preparation
The 2017 Company Financial Statements represent the separate financial statements of the parent company, Fiat Chrysler Automobiles N.V., and have been prepared in accordance with the legal requirements of Title 9, Book 2 of the Dutch Civil Code. Section 362 (8), Book 2, Dutch Civil Code, allows companies that apply IFRS as adopted by the European Union in their consolidated financial statements to use the same measurement principles in their company financial statements. The accounting policies are described in a specific section, Significant accounting policies, of the Consolidated Financial Statements included in this Annual Report. However, as allowed by the law, investments in subsidiaries, joint ventures and associates are accounted for using the net equity value in the Company Financial Statements.
Format of the financial statements
Given the activities carried out by FCA, presentation of the Company Income Statement is based on the nature of revenues and expenses. The Consolidated Income Statement for FCA is classified according to function (also referred to as the “cost of sales” method), which is considered more representative of the format used for internal reporting and management purposes and is in line with international practice in the industry.
FCA financial statements are prepared in Euros, also the Company's functional currency, representing the currency in which the main transactions of the Company are denominated.
The Statements of Income and of Financial Position and Notes to the Financial Statements are presented in millions of Euros, except where otherwise stated.
As parent company, FCA has also prepared consolidated financial statements for FCA Group for the year ended December 31, 2017.
233
COMPOSITION AND PRINCIPAL CHANGES
1. Result from investments
The following table summarizes the Result from investments:
Years Ended December 312017 2016
(€ million)Share of the profit/(loss) of Group companies € 3,827 € 2,234Gains from disposal of investments 49 —Dividends from other companies 1 3Total Result from investments € 3,877 € 2,237
Result from investments primarily related to the Company’s share in the net profit or loss of subsidiaries and associates.
Gains from disposal of investments consisted of the gain realized on disposal of Italiana Editrice S.p.A., a subsidiary involved in the publishing business.
2. Other operating income
The following table summarizes Other operating income:
Years Ended December 312017 2016
(€ million)Revenues from services rendered to, and other income from, Group companies and other relatedparties € 31 € 31
Other revenues and income from third parties 30 —Total Other operating income € 61 € 31
Other revenues and income from third parties reflected the portion paid to FCA NV of the reimbursement from the final settlement of claims for the Tianjin (China) port explosions, which occurred in the third quarter of 2015 (refer to Note 28, Segment Reporting, within the Consolidated Financial Statements).
3. Personnel costs
Personnel costs during the year ended December 31, 2017, of €12 million (€11 million in 2016) primarily related to wages and salaries. The average number of employees in 2017 was 48 (51 in 2016).
4. Other operating costs
Other operating costs primarily includes costs for services rendered by Group companies (support and consulting in administration, IT systems, press activities, payroll, security and facility management), costs for legal, administrative, financial and IT services in addition to the compensation component from Share-based compensation plans representing the notional cost of the Long Term Incentive Plan awarded to the Chief Executive Officer and Executives (net of the portion already attributed to the relevant subsidiaries), which was recognized directly in the equity reserve, as reported in Note 18, Share-based compensation, within the Consolidated Financial Statements.
234
5. Net financial expenses
The following table summarizes Net financial expenses:
Years Ended December 312017 2016
(€ million)Financial income € 194 € 293Financial expense (457) (582)Currency exchange (losses)/gains (101) (29)Net gains/(losses) on derivative financial instruments 83 17Total Net financial expenses € (281) € (301)
Financial income relates to interest on loans extended to Fiat Chrysler Automobiles North America Holdings LLC (“FCA NAH LLC”), as included within Other financial assets and Current financial assets. The decrease in financial income related primarily to the lower average outstanding amounts of these loans during 2017 as compared to 2016, following the U.S. $1.5 billion loan repayment which occurred in September 2016.
Financial expense relates to interest payable on the intercompany debt included within Current debt, in addition to the interest on the unsecured senior debt securities of U.S. $3.0 billion issued in April 2015 and €1.25 billion issued in March 2016. The decrease in financial expense related to both the lower average debt and the reduction in the interest rates during 2017 as compared to 2016.
Currency exchange losses of €101 million for the year ended December 31, 2017 reflected the net impact of revaluation of the Euro against the U.S. Dollar on loans extended to FCA NAH LLC and the unsecured senior debt securities issued in April 2015, both denominated in U.S. Dollar, described above. These losses were partially offset by €83 million Net gains on derivative instruments.
6. Income taxes
Income taxes were a gain of €12 million in 2017 (gain of €9 million in 2016), primarily relating to compensation receivable for tax losses carried forward contributed to the Group's tax consolidation schemes in Italy and in the United Kingdom.
The Company reported losses for tax purposes as the result from investments resulting from the adoption of the equity method is tax neutral.
7. Property, plant and equipment
At December 31, 2017, the carrying amount of property, plant and equipment was €27 million (€27 million at December 31, 2016), consisting of the gross carrying amount of assets of €70 million (€68 million at December 31, 2016) and accumulated depreciation of €43 million (€41 million at December 31, 2016), of which €25 million related to the Company’s property in Turin (€25 million at December 31, 2016). No buildings were subject to liens, pledged as collateral or restricted in use.
Depreciation of property, plant and equipment is recognized in the Income statement within Other operating costs.

235
8. Investments in Group companies and other equity investments
The following table summarizes Investments in Group companies and other equity investments:
At December 31
2017 2016 Change
(€ million)Investments in Group companies € 27,300 € 25,087 € 2,213
Other equity investments 23 151 (128)
Total Investments in Group companies and other equity investments € 27,323 € 25,238 € 2,085
Investments in Group companies were subject to the following changes during 2017 and 2016:
2017 2016
(€ million)Balance at beginning of year € 25,087 € 22,033
Capital injection into joint ventures — 82
Transactions related to Ferrari reorganization — (52)
Net Acquisition/(Disposal) of subsidiaries from/to Group companies 383 43
Net contributions made to subsidiaries 125 1,471
Dividends received from subsidiaries (264) (1,293)
Share of the profit/(loss) of Group companies 3,827 2,234Cumulative translation adjustments and other OCI movements (2,031) 556Other 173 13
Balance at end of year € 27,300 € 25,087
The increase in Investments in Group companies in 2017 primarily related to the Share of the profit/(loss) of Group companies of €3,827 million, net acquisition of subsidiaries from Group companies of €383 million and net contributions made to subsidiaries of €125 million, partially offset by cumulative translation adjustments and other OCI movements of €2,031 million and dividends received from Fiat Chrysler UK LLP of €264 million.
The increase in Investments in Group companies in 2016 primarily related to the Share of the profit/(loss) of Group companies of €2,234 million and net contributions made to subsidiaries of €1,471 million, partially offset by dividends received from FCA North America Holdings LLC and Fiat Chrysler UK LLP of €1,293 million.
The €128 million decrease in Other equity investments related to the sale of 15,948,275 common shares in CNHI (carrying value of €132 million at December 31, 2016), which was partially offset by approximately €4 million relating to the fair value remeasurement of the residual equity investments.
9. Other financial assets
At December 31, 2017, Other financial assets amounted to €3,228 million (€3,670 million at December 31, 2016), primarily represented by U.S. $3.9 billion of intercompany loans extended to FCA NAH LLC.
The €442 million decrease in Other financial assets was fully attributable to foreign exchange differences due to the revaluation of the Euro against the U.S. Dollar.
In January 2015, a loan of U.S. $881.6 million, expiring December 2022, was extended to fund the acquisition of certain subsidiaries based in the US. The carrying amount of €735 million at December 31, 2017 (€836 million at December 31, 2016), related to the outstanding principal only, with no accrued interest receivable due.

236
In April 2015, a further U.S. $2,970 million was extended in two loans of $1,485 million, expiring in April 2020 and April 2023. The carrying amount of €2,476 million at December 31, 2017, related to the outstanding principal amount only, with no accrued interest receivable due (€2,850 million at December 31, 2016 that included a principal amount of €2,818 million and accrued interest of €32 million, separately reported within Current financial assets).
These loans were hedged into Euro by currency swaps with Fiat Chrysler Finance S.p.A. and Fiat Chrysler Finance Europe S.A., resulting in €0.4 million of intercompany derivative liabilities at December 31, 2017 included within Other financial liabilities (€47 million at December 31, 2016).
10. Current financial assets
At December 31, 2017, Current financial assets primarily related to a short-term intercompany deposit of €201 million with Fiat Chrysler Finance Europe S.A.
At December 31, 2016, Current financial assets primarily related to a short-term intercompany deposit of €500 million with Fiat Chrysler Finance Europe S.A. and accrued interest receivable on the intercompany loans to FCA NAH LLC of €32 million, as reported within Other financial assets.
11. Trade receivables
At December 31, 2017, trade receivables totaled €15 million, almost entirely related to Group companies.
The carrying amount of trade receivables is deemed to approximate their fair value. All trade receivables are due within one year and there are no overdue balances.
12. Other current receivables
At December 31, 2017, Other current receivables amounted to €329 million, a net increase of €113 million as compared to December 31, 2016, and consisted of the following:
At December 312017 2016 Change
(€ million)
Receivable from Group companies for consolidated Italian corporate tax € 153 € 112 € 41
VAT receivables 134 63 71Italian corporate tax receivables 19 18 1Other 23 23 —Total Other current receivables € 329 € 216 € 113
Receivables from Group companies for consolidated Italian corporate tax relates to taxes calculated on the taxable income contributed by Italian subsidiaries participating in the domestic tax consolidation program.
VAT receivables relate primarily to VAT credits for Italian subsidiaries participating in the VAT tax consolidation.
Italian corporate tax receivables include credits transferred to FCA N.V. by Italian subsidiaries participating in the domestic tax consolidation program in 2017 and prior years.
13. Cash and cash equivalents
At December 31, 2017, Cash and cash equivalents totaled €1 million (€1 million as at December 31, 2016) and is primarily represented by amounts held in Euro. The carrying amount of Cash and cash equivalents is deemed to be in line with their fair value.
Credit risk associated with Cash and cash equivalents is considered limited as the counterparties are leading national and international banks.

237
14. Equity
Changes in Shareholders' equity during 2017 were as follows:
(€ million)Share
CapitalCapital
Reserves
LegalReserves:
Cumulativetranslationadjustment
reserve /OCI
LegalReserves:
Other
Retainedprofit/(loss)
Profit/(loss) forthe year
Totalequity
At December 31, 2015 € 17 € 3,805 € 1,438 € 11,744 € (533) € 334 € 16,805Allocation of prior year result — — — — 334 (334) —Mandatory Convertible Securities 2 1,908 — (1,910) — — —Share-based compensation — 98 — — — — 98Net profit for the year — — — — — 1,803 1,803Current period change in OCI, net of taxes — — 632 — — — 632Legal Reserve — — — 1,032 (1,032) — —Other changes — (45) — — (125) — (170)At December 31, 2016 19 5,766 2,070 10,866 (1,356) 1,803 19,168Allocation of prior year result — — — — 1,803 (1,803) —Share-based compensation — 115 — — — — 115Net profit for the year — — — — — 3,491 3,491Current period change in OCI, net of taxes — — (1,839) — — — (1,839)Legal Reserve — — — 728 (728) — —Other changes — (64) — — (52) — (116)At December 31, 2017 € 19 € 5,817 € 231 € 11,594 € (333) € 3,491 € 20,819
Shareholders’ equity increased by €1,651 million in 2017, primarily due to profit for the year of €3,491 million, and movements in OCI of €1,839 million, relating primarily to foreign exchange differences.
Shareholders’ equity increased by €2,363 million in 2016, primarily due to profit for the year of €1,803 million and movements in OCI of €632 million, relating to foreign exchange differences and the remeasurement of defined benefit plans.
Share capital
At December 31, 2017, the fully paid-up share capital of FCA amounted to €19 million (€19 million at December 31, 2016) and consisted of 1,540,089,690 common shares and 408,941,767 special voting shares, all with a par value of €0.01 each (1,527,965,719 common shares and 408,941,767 special voting shares at December 31, 2016).
Capital reserves
At December 31, 2017, capital reserves amounting to €5,817 million (€5,766 million at December 31, 2016) consisted mainly of the effects of the Merger, resulting in a different par value of FCA common shares (€0.01 each) as compared to Fiat S.p.A. ordinary shares (€3.58 each) where the consequent difference between the share capital before and after the Merger was recognized as an increase to the capital reserves. In December 2016, capital reserves increased €1,908 million as a result of conversion of the equity component of the Mandatory Convertible Securities issued in 2014.
Legal reserves
Pursuant to Dutch law, limitations exist relating to the distribution of shareholders' equity up to at least the total amount of the legal reserve. By their nature, unrealized losses relating to OCI components reduce shareholders' equity and thereby distributable amounts.

238
At December 31, 2017, legal reserves amounted to €11,594 million (€10,866 million at December 31, 2016) and mainly related to development costs capitalized by subsidiaries of €9,697 million (€9,359 million at December 31, 2016), the earnings of subsidiaries subject to certain restrictions to distributions to the parent company of €1,893 million (€1,503 million at December 31, 2016), and the reserve in respect of special voting shares of €4 million (€4 million at December 31, 2016). Legal reserves also included unrealized currency translation gains and losses and other OCI components of €231 million (€2,070 million at December 31, 2016).
Dividends
In order to further fund the capital requirements of the Group’s five-year business plan, the Board of Directors has decided not to recommend a dividend on FCA common shares for 2017.
15. Provisions for employee benefits and other provisions
At December 31, 2017, provisions for employee benefits and other provisions totaled €39 million, in line with 2016. At December 31, 2017, provisions consisted primarily of unfunded post-employment benefits accruing to employees, former employees and Directors under supplemental company or individual agreements.
16. Non-current debt
At December 31, 2017, non-current debt totaled €3,742 million, representing a decrease of €337 million over December 31, 2016, and consisted of the following:
At December 31
2017 2016 Change
(€ million)Third-party debt:
- Unsecured senior debt securities € 3,726 € 4,063 € (337)
Total third-party debt € 3,726 € 4,063 € (337)
Intercompany debt:
- Intercompany financial payables € 16 € 16 € —
Total intercompany debt € 16 € 16 € —
Total Non-current debt € 3,742 € 4,079 € (337)
At December 31, 2017, Non-current debt of €3,742 million (€4,079 million at December 31, 2016), primarily related to the €1,250 million note issued in March 2016 and the U.S. $3.0 billion unsecured senior debt notes issued in April 2015. The decrease of €337 million as compared to December 31, 2016 was almost fully attributable to foreign exchange differences following the revaluation of the Euro against the U.S. Dollar.
As described in more detail in Note 21 - Debt, to the Consolidated Financial Statements, FCA issued a 3.75 percent note at par in March 2016 with a principal value of €1,250 million due March 2024, under the Global Medium Term Note (“GMTN”) Programme.
In April 2015, FCA issued €1.4 billion (U.S.$1.5 billion) principal amount of 4.5 percent unsecured senior debt securities due April 15, 2020 (the “Initial 2020 Notes”) and €1.4 billion (U.S.$1.5 billion) principal amount of 5.25 percent unsecured senior debt securities due April 15, 2023 (the “Initial 2023 Notes”) at par. The Initial 2020 Notes and the Initial 2023 Notes, collectively referred to as “the Initial Notes”, rank pari passu in right of payment with respect to all of FCA's existing and future senior unsecured indebtedness and senior in right of payment to any of FCA's future subordinated indebtedness and existing indebtedness, which is by its terms subordinated in right of payment to the Initial Notes.

239
On June 17, 2015, subject to the terms and conditions set forth in our prospectus, FCA commenced an offer to exchange up to €1.4 billion (U.S.$1.5 billion) aggregate principal amount of new 4.5 percent unsecured senior debt securities due 2020 (“2020 Notes”), for any and all of our outstanding Initial 2020 Notes issued on April 14, 2015, and up to €1.4 billion (U.S.$1.5 billion) aggregate principal amount of new 5.25 percent unsecured senior debt securities due 2023 (“2023 Notes”), for any and all of the outstanding Initial 2023 Notes issued on April 14, 2015. The 2020 Notes and the 2023 Notes, collectively referred to as “the Notes”, were identical in all material respects to the Initial Notes, except that the Notes did not contain restrictions on transfer. The exchange offer expired on July 23, 2015. Substantially all of the Initial Notes were tendered for the Notes.
17. Other non-current liabilities
At 31 December 2017, other non-current liabilities totaled €11 million:
At December 31
2017 2016 Change
(€ million)
Other non-current liabilities € 11 € 13 € (2)
Total Other non-current liabilities € 11 € 13 € (2)
Other non-current liabilities relate to non-current post-employment benefits, being the present value of future benefits payable to a former CEO and management personnel that have left the Company.
18. Provisions for employee benefits and other current provisions
Employee benefit provisions primarily reflect the best estimate for variable components of compensation:
At December 31
2017 2016 Change
(€ million)Provisions for employee benefits and other current provisions € 2 € 2 € —
Total Provisions for employee benefits and other current provisions € 2 € 2 € —
19. Trade payables
At December 31, 2017, trade payables totaled €7 million, a decrease of €8 million from December 31, 2016, and consisted of the following:
At December 31
2017 2016 Change
(€ million)Trade payables due to third parties € 3 € 8 € (5)Intercompany trade payables 4 7 (3)Total trade payables € 7 € 15 € (8)
Trade payables are due within one year and their carrying amount at the reporting date is deemed to approximate their fair value.

20. Current debt
At December 31, 2017, current debt totaled €6,142 million, a €61 million increase over December 31, 2016 and related to:
At December 312017 2016 Change
(€ million)Intercompany debt:- Current account with Fiat Chrysler Finance S.p.A. € 99 € 84 € 15- Current account with Fiat Chrysler Finance Europe S.A. 5,981 5,932 49Total intercompany debt € 6,080 € 6,016 € 64Third party debt:- Advances on factored receivables — — —- Accrued interest payable 62 65 (3)Total third party debt € 62 € 65 € (3)Total current debt € 6,142 € 6,081 € 61
Current intercompany debt of €6,080 million (€6,016 million at December 31, 2016) is denominated in Euro and the carrying amount is in line with fair value.
Current account with Fiat Chrysler Finance Europe S.A. represents the overdraft as part of the Group's centralized treasury management.
Accrued interest payable of €62 million relates to the unsecured senior debt securities referred to in Note 16, Non-current debt.
21. Other debt
At December 31, 2017, Other debt totaled €400 million, a net increase of €115 million over December 31, 2016, and included the following:
At December 312017 2016 Change
(€ million)Intercompany other debt: - Consolidated Italian corporate tax € 149 € 113 € 36 - Consolidated VAT 239 158 81
- Other 2 3 (1)
Total intercompany other debt € 390 € 274 € 116
Other debt and taxes payable:
- Distribution payable € — € — € —
- Taxes payable 1 2 (1)
- Accrued expenses 4 4 —
- Other payables 5 5 —
Total Other debt and taxes payable € 10 € 11 € (1)
Total Other debt € 400 € 285 € 115

241
At December 31, 2017, intercompany debt relating to consolidated VAT of €239 million (€158 million at December 31, 2016) consisted of VAT credits of Italian subsidiaries transferred to FCA as part of the consolidated VAT regime.
Intercompany debt relating to consolidated Italian corporate tax of €149 million (€113 million at December 31, 2016) consisted of compensation payable for tax losses and Italian corporate tax credits contributed by Italian subsidiaries participating in the domestic tax consolidation program for 2017, for which the Italian branch of FCA N.V. is the consolidating entity.
Other debt and taxes payable are all due within one year and their carrying amount is deemed to approximate their fair value.
22. Guarantees granted, commitments and contingent liabilities
Guarantees granted
At December 31, 2017, guarantees issued totaled €9,318 million (€11,823 million at December 31, 2016) wholly provided on behalf of Group companies. The decrease of €2,505 million as compared to 31 December 2016 related principally to the repayment of bonds from Fiat Chrysler Finance Europe S.A.
The main guarantees outstanding at 31 December 2017 were as follows:
• €5,845 million for bonds issued;
• €1,641 million for borrowings, of which €620 million in favor of the subsidiaries in Brazil mainly related to the construction of the new plant in Pernambuco and the remaining primarily to Fiat Chrysler Finance S.p.A; and
• €1,829 million for VAT reimbursements related to the VAT consolidation scheme in Italy.
In addition, in 2005, in relation to the advance received by FCA Partecipazioni S.p.A. on the consideration for the sale of the aviation business, FCA as the successor of Fiat S.p.A. is jointly and severally liable with the fully owned subsidiary FCA Partecipazioni S.p.A. to the purchaser, Avio Holding S.p.A., should FCA Partecipazioni S.p.A. fail to honor (following either an arbitration award or an out-of-court settlement) undertakings provided in relation to the sale and purchase agreement signed in 2003.
Other commitments, contractual rights and contingent liabilities
FCA has important commitments and rights derived from outstanding agreements in addition to contingent liabilities as described in the notes to the Consolidated Financial Statements at December 31, 2017, to which reference should be made.
23. Audit fees
The following table reports fees paid to the independent auditor Ernst & Young, or entities in their network, for audit and other services:
Years Ended December 31(€ thousand) 2017 2016Audit of the (consolidated and company) financial statements € 18,601 € 19,180Other audit 398 761Tax advice 100 241Total € 19,099 € 20,182
Audit fees of Ernst & Young Accountants LLP amounted €260 thousand. No other services were performed by Ernst and Young Accountants LLP.

242
24. Board remuneration
Detailed information on Board of Directors compensation (including their shares and share options) is included in the Remuneration of Directors section of this Annual Report.
25. Subsequent events
The Group has evaluated subsequent events through February 20, 2018, which is the date the financial statements were authorized for issuance, as described in Note 31, Subsequent Events, within the Consolidated Financial Statements.
February 20, 2018
The Board of Directors
John ElkannSergio MarchionneAndrea AgnelliTiberto Brandolini d’AddaGlenn EarleValerie A. MarsRuth J. SimmonsRonald L. ThompsonMichelangelo A. VolpiPatience WheatcroftErmenegildo Zegna

243
OTHER INFORMATION
Independent Auditor’s Report
The report of the Company’s independent auditor, Ernst & Young Accountants LLP, the Netherlands is set forth following this Annual Report.
Dividends
Dividends will be determined in accordance with the articles 23 of the Articles of Association of Fiat Chrysler Automobiles N.V. The relevant provisions of the Articles of Association read as follows:
1. The Company shall maintain a special capital reserve to be credited against the share premium exclusively for the purpose of facilitating any issuance or cancellation of special voting shares. The special voting shares shall not carry any entitlement to the balance of the special capital reserve. The Board of Directors shall be authorized to resolve upon (i) any distribution out of the special capital reserve to pay up special voting shares or (ii) re-allocation of amounts to credit or debit the special capital reserve against or in favor of the share premium reserve.
2. The Company shall maintain a separate dividend reserve for the special voting shares. The special voting shares shall not carry any entitlement to any other reserve of the Company. Any distribution out of the special voting rights dividend reserve or the partial or full release of such reserve will require a prior proposal from the Board of Directors and a subsequent resolution of the meeting of holders of special voting shares.
3. From the profits, shown in the annual accounts, as adopted, such amounts shall be reserved as the Board of Directors may determine.
4. The profits remaining thereafter shall first be applied to allocate and add to the special voting shares dividend reserve an amount equal to one percent (1%) of the aggregate nominal value of all outstanding special voting shares. The calculation of the amount to be allocated and added to the special voting shares dividend reserve shall occur on a time-proportionate basis. If special voting shares are issued during the financial year to which the allocation and addition pertains, then the amount to be allocated and added to the special voting shares dividend reserve in respect of these newly issued special voting shares shall be calculated as from the date on which such special voting shares were issued until the last day of the financial year concerned. The special voting shares shall not carry any other entitlement to the profits.
5. Any profits remaining thereafter shall be at the disposal of the general meeting of Shareholders for distribution of profits on the common shares only, subject to the provision of paragraph 8 of this article.
6. Subject to a prior proposal of the Board of Directors, the general meeting of Shareholders may declare and pay distribution of profits and other distributions in United States Dollars. Furthermore, subject to the approval of the general meeting of Shareholders and the Board of Directors having been designated as the body competent to pass a resolution for the issuance of shares in accordance with Article 6, the Board of Directors may decide that a distribution shall be made in the form of shares or that Shareholders shall be given the option to receive a distribution either in cash or in the form of shares.
7. The Company shall only have power to make distributions to Shareholders and other persons entitled to distributable profits to the extent the Company’s equity exceeds the sum of the paid in and called up part of the share capital and the reserves that must be maintained pursuant to Dutch law and the Company’s Articles of Association. No distribution of profits or other distributions may be made to the Company itself for shares that the Company holds in its own share capital.
8. The distribution of profits shall be made after the adoption of the annual accounts, from which it appears that the same is permitted.
9. The Board of Directors shall have power to declare one or more interim distributions of profits, provided that the requirements of paragraph 7 hereof are duly observed as evidenced by an interim statement of assets and
244
liabilities as referred to in Section 2:105 paragraph 4 of the Dutch Civil Code and provided further that the policy of the Company on additions to reserves and distributions of profits is duly observed. The provisions of paragraphs 2 and 3 hereof shall apply mutatis mutandis.
10. The Board of Directors may determine that distributions are made from the Company’s share premium reserve or from any other reserve, provided that payments from reserves may only be made to the Shareholders that are entitled to the relevant reserve upon the dissolution of the Company.
11. Distributions of profits and other distributions shall be made payable in the manner and at such date(s) - within four weeks after declaration thereof - and notice thereof shall be given, as the general meeting of Shareholders, or in the case of interim distributions of profits, the Board of Directors shall determine.
12. Distributions of profits and other distributions, which have not been collected within five years and one day after the same have become payable, shall become the property of the Company.
245
DISCLOSURES PURSUANT TO DECREE ARTICLE10 EU-DIRECTIVE ON TAKEOVERS
In accordance with the Dutch Besluit artikel 10 overnamerichtlijn (the Decree), the Company makes the following disclosures:
a. For information on the capital structure of the Company, the composition of the issued share capital and the existence of the two classes of shares, please refer to Note 14 to the Company Financial Statements in this Annual Report. For information on the rights attached to the common shares, please refer to the Articles of Association which can be found on the Company’s website. To summarize, the rights attached to common shares comprise pre-emptive rights upon issue of common shares, the entitlement to attend the general meeting of Shareholders and to speak and vote at that meeting and the entitlement to distributions of such amount of the Company’s profit as remains after allocation to reserves. For information on the rights attached to the special voting shares, please refer to the Articles of Association and the Terms and Conditions for the Special Voting Shares which can both be found on the Company’s website and more in particular to the paragraph “Loyalty Voting Structure” of this Annual Report in the chapter “Corporate Governance”. As at 31 December 2017, the issued share capital of the Company consisted of 1,540,089,690 common shares, representing 79 per cent. of the aggregate issued share capital and 408,941,767 special voting shares, representing 21 per cent. of the aggregate issued share capital.
b. The Company has imposed no limitations on the transfer of common shares. The Articles of Association provide in Article 13 for transfer restrictions for special voting shares.
c. For information on participations in the Company’s capital in respect of which pursuant to Sections 5:34, 5:35 and 5:43 of the Dutch Financial Supervision Acts (Wet op het financieel toezicht) notification requirements apply, please refer to the chapter “Major Shareholders” of this Annual Report. There you will find a list of Shareholders who are known to the Company to have holdings of 3% or more at the stated date.
d. No special control rights or other rights accrue to shares in the capital of the Company.
e. The Company does not operate an employee share participation scheme as mentioned in article 1 sub 1(e) of the Decree.
f. No restrictions apply to voting rights attached to shares in the capital of the Company, nor are there any deadlines for exercising voting rights. The Articles of Association allow the Company to cooperate in the issuance of registered depositary receipts for common shares, but only pursuant to a resolution to that effect of the Board of Directors. The Company is not aware of any depository receipts having been issued for shares in its capital.
g. The Company is not aware of the existence of any agreements with Shareholders which may result in restrictions on the transfer of shares or limitation of voting rights.
h. The rules governing the appointment and dismissal of members of the Board of Directors are stated in the Articles of Association of the Company. All members of the Board of Directors are appointed by the general meeting of Shareholders. The term of office of all members of the Board of Directors is for a period of approximately one year after appointment, such period expiring on the day the first Annual General Meeting of Shareholders is held in the following calendar year. The general meeting of Shareholders has the power to suspend or dismiss any member of the Board of Directors at any time. The rules governing an amendment of the Articles of Association are stated in the Articles of Association and require a resolution of the general meeting of Shareholders which can only be passed pursuant to a prior proposal of the Board of Directors.

246
i. The general powers of the Board of Directors are stated in the Articles of Association of the Company. For a period of five years from October 12, 2014, the Board of Directors has been irrevocably authorized to issue shares and rights to subscribe for shares up to the maximum aggregate amount of shares as provided for in the Company’s authorized share capital as set out in Article 4.1 of the Articles of Association, as amended from time to time. The Board of Directors has also been designated for the same period as the authorized body to limit or exclude the rights of pre-emption of shareholders in connection with the authority of the Board of Directors to issue common shares and grant rights to subscribe for common shares as referred to above. In the event of an issuance of special voting shares, shareholders have no right of pre-emptions. The Company has the authority to acquire fully paid-up shares in its own share capital, provided that such acquisition is made for no consideration. Further rules governing the acquisition of shares by the Company in its own share capital are set out in article 8 of the Articles of Association.
j. The Company is not a party to any significant agreements which will take effect, will be altered or will be terminated upon a change of control of the Company as a result of a public offer within the meaning of Section 5:70 of the Dutch Financial Supervision Acts (Wet op het financieel toezicht), provided that some of the loan agreements guaranteed by the Company and certain bonds guaranteed by the Company contain clauses that, as it is customary for such financial transactions, may require early repayment or termination in the event of a change of control of the guarantor or the borrower. In certain cases, that requirement may only be triggered if the change of control event coincides with other conditions, such as a rating downgrade.
k. Under the terms of the Company’s Equity Incentive Plan (EIP) and employment agreements entered into with certain executive officers, executives may be entitled to receive severance payments of up to two times annual cash compensation and accelerated vesting of awards under the EIP if, within 24 months of a Change of Control (as defined therein), the executive’s employment is involuntarily terminated by the Company (other than for Cause -as defined therein-) or is terminated by the participant for Good Reason (as defined).

247
The Companies of the FCA Group at December 31, 2017
NameRegisteredOffice Country Share capital Currency
% of Groupconsolidation
Interest heldby
% interestheld
% votingrights
Controlling companyParent Company
Fiat ChryslerAutomobiles N.V.
Amsterdam Netherlands 19,490,315 EUR -- -- -- --
Subsidiaries consolidated on a line-by-line basisMass-Market Vehicles
NAFTAAUTO TRANSPORTSERVICES LLC
Wilmington U.S.A. 100 USD 100.00 FCA US LLC 100.000
Autodie LLC Wilmington U.S.A. 10,000,000 USD 100.00 FCA US LLC 100.000Chrysler MexicoInvestment HoldingsCooperatie U.A.
Amsterdam Netherlands — EUR 100.00 FCAINVESTMENT HOLDINGSLLC
99.990
FCAMINORITYLLC
0.010
CPK Interior ProductsInc.
Windsor Canada 1,000 CAD 100.00 FCA CanadaInc.
100.000
Extended VehicleProtection LLC
Wilmington U.S.A. — USD 100.00 FCA US LLC 100.000
FCA AUBURN HILLSOWNER LLC
Wilmington U.S.A. 100 USD 100.00 FCA REALTYLLC
100.000
FCA Canada CashServices Inc.
Toronto Canada 1,000 CAD 100.00 FCA US LLC 100.000
FCA Canada Inc. Windsor Canada — CAD 100.00 FCAONTARIOHOLDINGSLimited
100.000
FCA Caribbean LLC Wilmington U.S.A. 100 USD 100.00 FCA US LLC 100.000FCA DEALERCAPITAL LLC
Wilmington U.S.A. — USD 100.00 FCA US LLC 100.000
FCAINTERNATIONALOPERATIONS LLC
Wilmington U.S.A. — USD 100.00 FCA US LLC 100.000
FCAINTERNATIONALSERVICES LLC
Wilmington U.S.A. — USD 100.00 FCA US LLC 100.000
FCA INVESTMENTHOLDINGS LLC
Wilmington U.S.A. 173,350,999 USD 100.00 FCA US LLC 100.000
FCA Mexico, S.A. deC.V.
Santa Fe Mexico 238,621,186 MXN 100.00 ChryslerMexicoInvestmentHoldingsCooperatieU.A.
99.997
FCAMINORITYLLC
0.003
FCA MID LLC Wilmington U.S.A. 2,700,000 USD 100.00 FCA US LLC 100.000FCA MINORITY LLC Wilmington U.S.A. — USD 100.00 FCA US LLC 100.000FCA ONTARIOHOLDINGS Limited
Toronto Canada 1,000 CAD 100.00 FCA US LLC 100.000
FCA REAL ESTATESERVICES LLC
Wilmington U.S.A. 100 USD 100.00 FCA US LLC 100.000
FCA REALTY LLC Wilmington U.S.A. 168,769,528 USD 100.00 FCA US LLC 100.000FCA Service ContractsLLC
Wilmington U.S.A. 100,000,000 USD 100.00 FCA US LLC 100.000
FCA TRANSPORTLLC
Wilmington U.S.A. — USD 100.00 FCA US LLC 100.000

248
NameRegisteredOffice Country Share capital Currency
% of Groupconsolidation
Interest heldby
% interestheld
% votingrights
FCA US InsuranceCompany
Plymouth U.S.A. 60,000 USD 100.00 FCA NorthAmericaHoldings LLC
100.000
FCA US LLC Wilmington U.S.A. 10 USD 100.00 FCA NorthAmericaHoldings LLC
100.000
LATAMBanco Fidis S.A. Betim Brazil 509,021,104 BRL 100.00 Fidis S.p.A. 75.000
FCA FIATCHRYSLERAUTOMOVEIS BRASILLTDA.
25.000
CG Venezuela UKHoldings Limited
SloughBerkshire
UnitedKingdom
100 GBP 100.00 FCA NorthAmericaHoldings LLC
100.000
CMA Componentes eModulos AutomotivosIndustria e ComercioAutomotivos Ltda
Nova Goiana Brazil 1,000 BRL 100.00 CMPComponentes eModulosPlasticosIndustria eComercioLtda.
99.900
FCA FiatChryslerParticipacoesBrasil Limitada
0.100
CMP Componentes eModulos PlasticosIndustria e ComercioLtda.
Contagem Brazil 121,358,092 BRL 100.00 FCA FIATCHRYSLERAUTOMOVEIS BRASILLTDA.
56.049
FCAPowertrainBrasil Industriae Comercio deMotores ltda
43.951
FCA AUTOMOBILESARGENTINA S.A.
Buenos Aires Argentina 476,464,366 ARS 100.00 FCA FIATCHRYSLERAUTOMOVEIS BRASILLTDA.
100.000
FCA Chile ImportadoraLimitada
Santiago Chile 41,800,000 CLP 100.00 FCA US LLC 99.990
FCAMINORITYLLC
0.010
FCA CompaniaFinanciera S.A.
Buenos Aires Argentina 526,027,891 ARS 100.00 Fidis S.p.A. 100.000
FCA FIAT CHRYSLERAUTOMOVEISBRASIL LTDA.
Betim Brazil 14,628,993,087 BRL 100.00 FCA FiatChryslerParticipacoesBrasil Limitada
75.118
FCA ItalyS.p.A.
24.882
FCA IMPORTADORAS.R.L.
Buenos Aires Argentina 29,335,170 ARS 100.00 FCAAUTOMOBILESARGENTINAS.A.
98.000
FCA ArgentinaS.A.
2.000
FCA Powertrain BrasilIndustria e Comercio deMotores Ltda
Campo Largo Brazil 197,792,500 BRL 100.00 FCA FiatChryslerParticipacoesBrasil Limitada
100.000

249
NameRegisteredOffice Country Share capital Currency
% of Groupconsolidation
Interest heldby
% interestheld
% votingrights
FCA Rental Locadorade Automoveis Ltda
BeloHorizonte
Brazil 60,769,200 BRL 100.00 FCA FiatChryslerParticipacoesBrasil Limitada
100.000
FCA S.A. de Ahorropara FinesDeterminados
Buenos Aires Argentina 109,535,149 ARS 100.00 FCAAUTOMOBILESARGENTINAS.A.
100.000
APACALFA ROMEO(SHANGHAI)AUTOMOBILESSALES CO. Ltd.
Shanghai People's Rep.ofChina
19,000,000 CNY 100.00 Fiat ChryslerAutomobilesN.V.
100.000
Chrysler Group (China)Sales Ltd.
Beijing People's Rep.ofChina
10,000,000 EUR 100.00 FCA (HongKong)AutomotiveLimited
100.000
FCA (Hong Kong)Automotive Limited
Hong Kong People's Rep.ofChina
10,000,000 EUR 100.00 FCA US LLC 100.000
FCA (SHANGHAI)AUTO PARTSTRADING CO., LTD.
Shanghai People's Rep.ofChina
19,000,000 CNY 100.00 Fiat ChryslerAutomobilesN.V.
100.000
FCA Asia PacificInvestment Co., Ltd.
Shanghai People's Rep.ofChina
4,500,000 CNY 100.00 FCA (HongKong)AutomotiveLimited
100.000
FCA Australia Pty. Ltd. PortMelbourne
Australia 143,629,774 AUD 100.00 CNI C.V 100.000
FCA AutomotiveFinance Co. Ltd.
Shanghai People's Rep.ofChina
750,000,000 CNY 100.00 Fidis S.p.A. 100.000
FCA Engineering IndiaPrivate Limited
Chennai India 99,990 INR 100.00 ChryslerNetherlandsDistributionB.V.
99.990
FCA DUTCHOPERATINGLLC
0.010
FCA INDIAAUTOMOBILESPrivate Limited
Mumbai India 4,819,900,000 INR 100.00 FCA ItalyS.p.A.
100.000
FCA JAPAN Ltd. Minato-Ku.Tokyo
Japan 104,789,875 JPY 100.00 CG EU NSCLIMITED
60.000
Fiat GroupAutomobilesJapan K.K.
40.000
FCA Korea Limited Seoul South Korea 32,639,200,000 KRW 100.00 FCA US LLC 100.000FCA PowertrainTechnologies ShanghaiR&D Co. Ltd.
Shanghai People's Rep.ofChina
10,000,000 EUR 100.00 FCA ITALYHOLDINGSS.p.A.
100.000
Fiat Group AutomobilesJapan K.K.
Minato-Ku.Tokyo
Japan 100,000,000 JPY 100.00 Fiat ChryslerAutomobilesN.V.
100.000
Mopar (Shanghai) AutoParts Trading Co. Ltd.
Shanghai People's Rep.ofChina
5,000,000 USD 100.00 FCA AsiaPacificInvestment Co.Ltd.
100.000
EMEAAbarth & C. S.p.A. Turin Italy 1,500,000 EUR 100.00 FCA Italy
S.p.A.100.000
Alfa Romeo S.p.A. Turin Italy 120,000 EUR 100.00 FCA ItalyS.p.A.
100.000
Alfa Romeo U.S.A.S.p.A.
Turin Italy 120,000 EUR 100.00 FCA ItalyS.p.A.
100.000
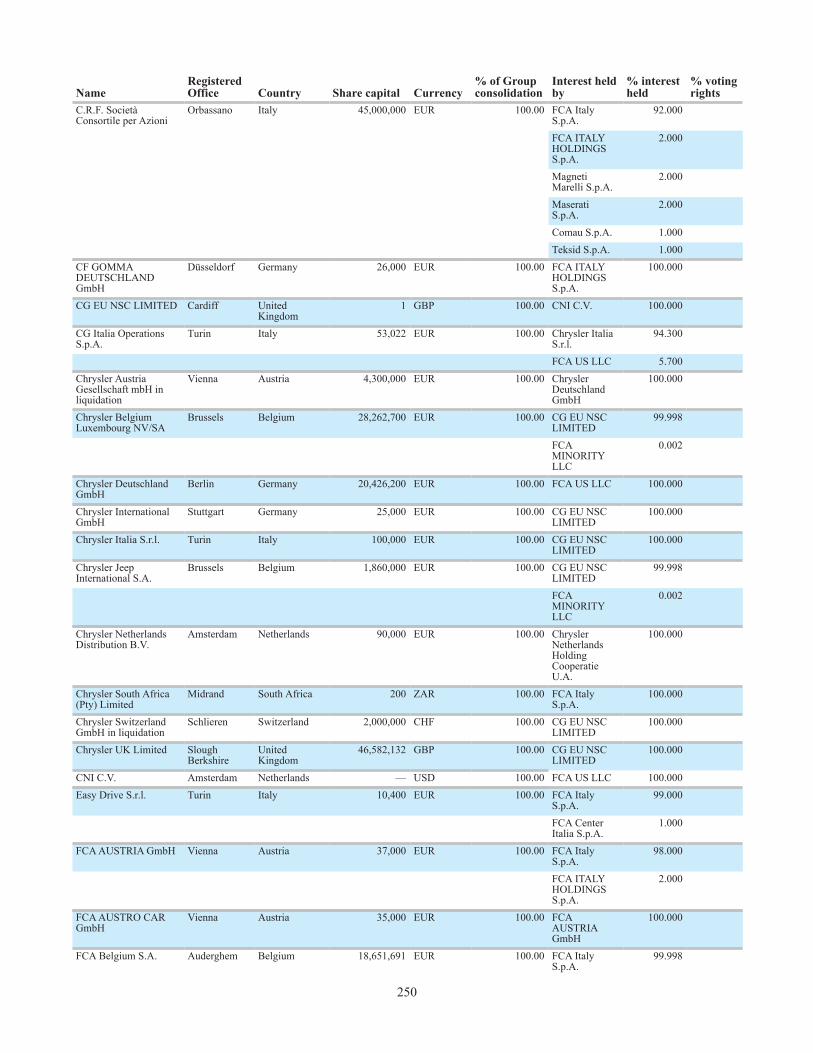
250
NameRegisteredOffice Country Share capital Currency
% of Groupconsolidation
Interest heldby
% interestheld
% votingrights
C.R.F. SocietàConsortile per Azioni
Orbassano Italy 45,000,000 EUR 100.00 FCA ItalyS.p.A.
92.000
FCA ITALYHOLDINGSS.p.A.
2.000
MagnetiMarelli S.p.A.
2.000
MaseratiS.p.A.
2.000
Comau S.p.A. 1.000Teksid S.p.A. 1.000
CF GOMMADEUTSCHLANDGmbH
Düsseldorf Germany 26,000 EUR 100.00 FCA ITALYHOLDINGSS.p.A.
100.000
CG EU NSC LIMITED Cardiff UnitedKingdom
1 GBP 100.00 CNI C.V. 100.000
CG Italia OperationsS.p.A.
Turin Italy 53,022 EUR 100.00 Chrysler ItaliaS.r.l.
94.300
FCA US LLC 5.700Chrysler AustriaGesellschaft mbH inliquidation
Vienna Austria 4,300,000 EUR 100.00 ChryslerDeutschlandGmbH
100.000
Chrysler BelgiumLuxembourg NV/SA
Brussels Belgium 28,262,700 EUR 100.00 CG EU NSCLIMITED
99.998
FCAMINORITYLLC
0.002
Chrysler DeutschlandGmbH
Berlin Germany 20,426,200 EUR 100.00 FCA US LLC 100.000
Chrysler InternationalGmbH
Stuttgart Germany 25,000 EUR 100.00 CG EU NSCLIMITED
100.000
Chrysler Italia S.r.l. Turin Italy 100,000 EUR 100.00 CG EU NSCLIMITED
100.000
Chrysler JeepInternational S.A.
Brussels Belgium 1,860,000 EUR 100.00 CG EU NSCLIMITED
99.998
FCAMINORITYLLC
0.002
Chrysler NetherlandsDistribution B.V.
Amsterdam Netherlands 90,000 EUR 100.00 ChryslerNetherlandsHoldingCooperatieU.A.
100.000
Chrysler South Africa(Pty) Limited
Midrand South Africa 200 ZAR 100.00 FCA ItalyS.p.A.
100.000
Chrysler SwitzerlandGmbH in liquidation
Schlieren Switzerland 2,000,000 CHF 100.00 CG EU NSCLIMITED
100.000
Chrysler UK Limited SloughBerkshire
UnitedKingdom
46,582,132 GBP 100.00 CG EU NSCLIMITED
100.000
CNI C.V. Amsterdam Netherlands — USD 100.00 FCA US LLC 100.000Easy Drive S.r.l. Turin Italy 10,400 EUR 100.00 FCA Italy
S.p.A.99.000
FCA CenterItalia S.p.A.
1.000
FCA AUSTRIA GmbH Vienna Austria 37,000 EUR 100.00 FCA ItalyS.p.A.
98.000
FCA ITALYHOLDINGSS.p.A.
2.000
FCA AUSTRO CARGmbH
Vienna Austria 35,000 EUR 100.00 FCAAUSTRIAGmbH
100.000
FCA Belgium S.A. Auderghem Belgium 18,651,691 EUR 100.00 FCA ItalyS.p.A.
99.998

251
NameRegisteredOffice Country Share capital Currency
% of Groupconsolidation
Interest heldby
% interestheld
% votingrights
FCASWITZERLAND S.A.
0.002
FCA Center ItaliaS.p.A.
Turin Italy 2,000,000 EUR 100.00 FCA ItalyS.p.A.
100.000
FCA CENTRAL ANDEASTERN EUROPEKFT.
Budapest Hungary 150,000,000 HUF 100.00 FCA ItalyS.p.A.
100.000
FCA Customer ServicesCentre S.r.l.
Turin Italy 2,500,000 EUR 100.00 FCA ItalyS.p.A.
100.000
FCA Denmark A/S Glostrup Denmark 55,000,000 DKK 100.00 FCA ItalyS.p.A.
100.000
FCA FINLAND Oy Vantaa Finland 50,000 EUR 100.00 FCA ItalyS.p.A.
100.000
FCA Fleet & TendersS.R.L.
Turin Italy 7,370,000 EUR 100.00 FCA ItalyS.p.A.
100.000
FCA France Trappes France 96,000,000 EUR 100.00 FCA ItalyS.p.A.
100.000
FCA GERMANY AG Frankfurt Germany 82,650,000 EUR 100.00 FCA ItalyS.p.A.
99.000
FCASWITZERLAND S.A.
1.000
FCA GREECE S.A. Argyroupoli Greece 62,783,499 EUR 100.00 FCA ItalyS.p.A.
100.000
FCA Group MarketingS.p.A.
Turin Italy 100,000,000 EUR 100.00 FCA ITALYHOLDINGSS.p.A.
100.000
FCA ITALYHOLDINGS S.p.A.
Turin Italy 1,089,071,587 EUR 100.00 FCA ItalyS.p.A.
100.000
FCA Italy S.p.A. Turin Italy 800,000,000 EUR 100.00 Fiat ChryslerAutomobilesN.V.
100.000
FCA Melfi S.r.l. Melfi Italy 276,640,000 EUR 100.00 FCA ItalyS.p.A.
100.000
FCA Middle East FZ-LLC
Dubai United ArabEmirates
300,000 AED 100.00 FCAINTERNATIONALOPERATIONSLLC
100.000
FCA Motor VillageAustria GmbH
Vienna Austria 37,000 EUR 100.00 FCAAUSTRIAGmbH
100.000
FCA MOTORVILLAGE BELGIUMS.A.
Auderghem Belgium 8,571,393 EUR 100.00 FCA BelgiumS.A.
99.988
FCA ItalyS.p.A.
0.012
FCA MOTORVILLAGE FRANCES.A.S
Trappes France 2,977,680 EUR 100.00 FCA France 99.997
FCA MOTORVILLAGE GERMANYGmbH
Frankfurt Germany 8,700,000 EUR 100.00 FCAGERMANYAG
100.000
FCA MOTORVILLAGEPORTUGAL S.A.
Amadora Portugal 50,000 EUR 100.00 FCAPORTUGAL,S.A.
100.000
FCA MOTORVILLAGE SPAIN, S.L.
Alcalá DeHenares
Spain 1,454,420 EUR 100.00 Fiat ChryslerAutomobilesSpain S.A.
100.000
FCA MOTORVILLAGESWITZERLAND S.A.
Meyrin Switzerland 13,000,000 CHF 100.00 FCASWITZERLAND S.A.
100.000
FCA Netherlands B.V. Lijnden Netherlands 5,672,250 EUR 100.00 FCA ItalyS.p.A.
100.000

252
NameRegisteredOffice Country Share capital Currency
% of Groupconsolidation
Interest heldby
% interestheld
% votingrights
FCA NORWAY AS Fornebu Norway 103,200 NOK 100.00 FCA ItalyS.p.A.
100.000
FCA POLAND SpólkaAkcyjna
Bielsko-Biala Poland 660,334,600 PLN 100.00 FCA ItalyS.p.A.
100.000
FCA PORTUGAL, S.A. Porto Salvo Portugal 1,000,000 EUR 100.00 FCA ItalyS.p.A.
100.000
FCA POWERTRAINPOLAND Sp. z o.o.
Bielsko-Biala Poland 269,037,000 PLN 100.00 FCA ITALYHOLDINGSS.p.A.
100.000
FCA Real EstateGermany GmbH
Frankfurt Germany 25,000 EUR 100.00 FCA MOTORVILLAGEGERMANYGmbH
100.000
FCA REAL ESTATESERVICES FRANCESAS
Trappes France 37,000 EUR 100.00 FCA RealEstate ServicesS.p.A.
100.000
FCA Real EstateServices S.p.A.
Turin Italy 150,679,554 EUR 100.00 FCA ItalyS.p.A.
100.000
FCA Russia AO Moscow Russia 574,665,000 RUB 100.00 FCA US LLC 99.999FCAMINORITYLLC
0.001
FCA SERBIA DOOKRAGUJEVAC
Kragujevac Serbia 30,707,843,314 RSD 66.67 FCA ItalyS.p.A.
66.670
FCA SWEDEN AB Kista Sweden 10,000,000 SEK 100.00 FCA ItalyS.p.A.
100.000
FCA SWITZERLANDS.A.
Schlieren Switzerland 21,400,000 CHF 100.00 FCA ItalyS.p.A.
100.000
FCAVERSICHERUNGSSERVICE GmbH
Heilbronn Germany 26,000 EUR 100.00 FCAGERMANYAG
51.000
Fiat ChryslerRimaco SA
49.000
Fiat ChryslerAutomobiles (FCA)Egypt Limited
New Cairo Egypt 240,000 EGP 100.00 FCA US LLC 99.000
FCAMINORITYLLC
1.000
Fiat ChryslerAutomobiles IrelandDAC
Dublin Ireland 5,078,952 EUR 100.00 FCA ItalyS.p.A.
100.000
FIAT CHRYSLERAUTOMOBILESMIDDLE EAST FZE
Dubai United ArabEmirates
1,000,000 AED 100.00 Fiat ChryslerAutomobilesN.V.
100.000
Fiat ChryslerAutomobiles MoroccoS.A.
Bouskoura Morocco 101,000,000 MAD 100.00 FCA ItalyS.p.A.
100.000
Fiat ChryslerAutomobiles Spain S.A.
Alcalá DeHenares
Spain 8,079,280 EUR 100.00 FCA ItalyS.p.A.
99.998
FCASWITZERLAND S.A.
0.002
FIAT CHRYSLERAUTOMOBILES UKLtd
SloughBerkshire
UnitedKingdom
44,600,000 GBP 100.00 FCA ItalyS.p.A.
100.000
FIAT CHRYSLERMOTOR VILLAGELtd.
SloughBerkshire
UnitedKingdom
1,500,000 GBP 100.00 FIATCHRYSLERAUTOMOBILES UK Ltd
100.000
Fiat Group AutomobilesSouth Africa(Proprietary) Ltd
Bryanston South Africa 640 ZAR 100.00 FCA ItalyS.p.A.
100.000
Fidis S.p.A. Turin Italy 250,000,000 EUR 100.00 FCA ItalyS.p.A.
100.000

253
NameRegisteredOffice Country Share capital Currency
% of Groupconsolidation
Interest heldby
% interestheld
% votingrights
i-FAST AutomotiveLogistics S.r.l.
Turin Italy 1,250,000 EUR 100.00 FCA ItalyS.p.A.
100.000
i-FAST ContainerLogistics S.p.A.
Turin Italy 2,500,000 EUR 100.00 FCA ItalyS.p.A.
100.000
Mecaner S.A. Urdùliz Spain 3,000,000 EUR 100.00 FCA ItalyS.p.A.
100.000
NEW BUSINESS 38S.p.A.
Pomiglianod'Arco
Italy 1,000,000 EUR 100.00 FCA RealEstate ServicesS.p.A.
100.000
Società diCommercializzazione eDistribuzione RicambiS.p.A. in liquidation
Turin Italy 100,000 EUR 100.00 FCA ItalyS.p.A.
100.000
VM Motori S.p.A. Cento Italy 21,008,000 EUR 100.00 FCA ITALYHOLDINGSS.p.A.
100.000
Luxury VehiclesMaserati
Maserati S.p.A. Modena Italy 40,000,000 EUR 100.00 Fiat ChryslerAutomobilesN.V.
100.000
Maserati (China) CarsTrading Co., Ltd.
Shanghai People's Rep.ofChina
10,000,000 USD 100.00 MaseratiS.p.A.
100.000
Maserati (Suisse) S.A. Schlieren Switzerland 1,000,000 CHF 100.00 MaseratiS.p.A.
100.000
Maserati Canada Inc. Vancouver Canada — CAD 100.00 MaseratiS.p.A.
100.000
Maserati DeutschlandGmbH
Wiesbaden Germany 500,000 EUR 100.00 MaseratiS.p.A.
100.000
Maserati GB Limited SloughBerkshire
UnitedKingdom
20,000 GBP 100.00 MaseratiS.p.A.
100.000
Maserati Japan KK Tokyo Japan 18,000,000 JPY 100.00 MaseratiS.p.A.
100.000
Maserati North AmericaInc.
Wilmington U.S.A. 1,000 USD 100.00 MaseratiS.p.A.
100.000
Maserati West Europesocieté par actionssimplifiée
Paris France 37,000 EUR 100.00 MaseratiS.p.A.
100.000
Tridente Real EstateS.r.l.
Modena Italy 11,570,000 EUR 100.00 MaseratiS.p.A.
100.000
ComponentsMagneti Marelli
Magneti Marelli S.p.A. Corbetta Italy 254,325,965 EUR 99.99 Fiat ChryslerAutomobilesN.V.
99.991 100.000
AdministracionMagneti MarelliSistemi SospensioniMexicana S.R.L. deC.V.
Mexico City Mexico 3,000 MXN 88.11 MagnetiMarelliPromatcorSistemiSospensioniMexicanaS.R.L. de C.V.
99.000
AutomotiveLighting RearLamps MexicoS. de r.l. deC.V.
1.000
AUTOMOTIVELIGHTING(THAILAND) CO.LTD
Bangkok Thailand 10,000,000 THB 99.96 AutomotiveLightingReutlingenGmbH
99.970
Automotive LightingBrotterode GmbH
Brotterode Germany 7,270,000 EUR 99.99 AutomotiveLightingReutlingenGmbH
100.000

254
NameRegisteredOffice Country Share capital Currency
% of Groupconsolidation
Interest heldby
% interestheld
% votingrights
Automotive LightingItalia S.p.A.
Venaria Reale Italy 12,000,000 EUR 99.99 AutomotiveLightingReutlingenGmbH
100.000
Automotive LightingLLC
Wilmington U.S.A. 25,001,000 USD 100.00 MagnetiMarelliHoldingU.S.A. LLC
100.000
Automotive Lightingo.o.o.
Rjiasan Russia 1,086,875,663 RUB 99.99 AutomotiveLightingReutlingenGmbH
100.000
Automotive LightingRear Lamps FranceS.a.s.
Saint Juliendu Sault
France 5,134,480 EUR 99.99 AutomotiveLighting ItaliaS.p.A.
100.000
Automotive LightingRear Lamps Mexico S.de r.l. de C.V.
El MarquesQueretaro
Mexico 50,000 MXN 100.00 MagnetiMarelliHoldingU.S.A. LLC
100.000
Automotive LightingReutlingen GmbH
Reutlingen Germany 1,330,000 EUR 99.99 MagnetiMarelli S.p.A.
100.000
Automotive LightingS.R.O.
Jihlava CzechRepublic
927,637,000 CZK 99.99 AutomotiveLightingReutlingenGmbH
100.000
Automotive LightingUK Limited
ChadwellHeath
UnitedKingdom
40,387,348 GBP 99.99 MagnetiMarelli S.p.A.
100.000
Changchun MagnetiMarelli AutomotiveLighting System Co.Ltd.
Changchun People's Rep.ofChina
190,000,000 CNY 60.00 AutomotiveLightingReutlingenGmbH
60.000
CHANGCHUNMAGNETI MARELLIPOWERTRAINCOMPONENTSCo.Ltd.
Changchun People's Rep.ofChina
5,600,000 EUR 51.00 MagnetiMarelli S.p.A.
51.000
Fiat CIEI S.p.A. inliquidation
Corbetta Italy 220,211 EUR 99.99 MagnetiMarelli S.p.A.
100.000
Hefei Magneti MarelliExhaust SystemsCo.Ltd.
Hefei People's Rep.ofChina
3,900,000 EUR 51.00 MagnetiMarelli S.p.A.
51.000
Industrias MagnetiMarelli Mexico S.A. deC.V.
Tepotzotlan Mexico 50,000 MXN 99.99 MagnetiMarelliSistemasElectronicosMexico S.A.
99.998
ServiciosAdministrativos Corp. IPASAS.A.
0.002
Magneti Marelli(China) Co. Ltd.
Shanghai People's Rep.ofChina
17,500,000 USD 99.99 MagnetiMarelli S.p.A.
100.000
Magneti Marelli AfterMarket Parts andServices S.p.A.
Corbetta Italy 7,000,000 EUR 99.99 MagnetiMarelli S.p.A.
100.000
Magneti MarelliAftermarket GmbH
Heilbronn Germany 100,000 EUR 99.99 MagnetiMarelli AfterMarket Partsand ServicesS.p.A.
100.000
Magneti MarelliAftermarket Sp. z o.o.
Katowice Poland 2,000,000 PLN 99.99 MagnetiMarelli AfterMarket Partsand ServicesS.p.A.
100.000
Magneti MarelliArgentina S.A.
Buenos Aires Argentina 465,205 ARS 99.99 MagnetiMarelli S.p.A.
95.000

255
NameRegisteredOffice Country Share capital Currency
% of Groupconsolidation
Interest heldby
% interestheld
% votingrights
MagnetiMarelli FranceS.a.s.
5.000
Magneti MarelliAutomotive Cluj S.r.l.
Cluj Napoca Romania 9,010,000 RON 99.99 MagnetiMarelli S.p.A.
100.000
Magneti MarelliAutomotiveComponents(Changsha) Co. Ltd
Changsha People's Rep.ofChina
5,400,000 USD 99.99 MagnetiMarelli S.p.A.
100.000
Magneti MarelliAutomotiveComponents(Guangzhou) Co.,Ltd.
Guangzhou People's Rep.ofChina
10,000,000 EUR 99.99 MagnetiMarelli S.p.A.
100.000
Magneti MarelliAutomotiveComponents (WUHU)Co. Ltd.
Wuhu People's Rep.ofChina
32,000,000 USD 99.99 MagnetiMarelli S.p.A.
100.000
Magneti MarelliAutomotive d.o.o.Kragujevac
Kragujevac Serbia 154,200,876 RSD 99.99 MagnetiMarelli S.p.A.
100.000
Magneti MarelliAutomotive Electronics(Guangzhou) Co.Limited
Guangzhou People's Rep.ofChina
16,100,000 USD 99.99 MagnetiMarelli S.p.A.
100.000
Magneti MarelliAutomotive Lighting(Foshan) Co. Ltd
Foshan People's Rep.ofChina
10,800,000 EUR 99.99 MagnetiMarelli S.p.A.
100.000
Magneti Marelli CofapFabricadora de PecasLtda
Santo Andre Brazil 585,411,633 BRL 99.99 MagnetiMarelli AfterMarket Partsand ServicesS.p.A.
100.000
Magneti MarelliComponentes PlasticosLtda
Itauna Brazil 6,402,500 BRL 99.99 PlasticComponentsand ModulesAutomotiveS.p.A.
100.000
Magneti MarelliConjuntos de EscapeS.A.
Buenos Aires Argentina 9,999,971 ARS 99.99 MagnetiMarelli S.p.A.
96.260
MagnetiMarelliArgentina S.A.
3.740
Magneti Marelli d.o.o.Kragujevac
Kragujevac Serbia 1,363,504,543 RSD 99.99 MagnetiMarelli S.p.A.
100.000
Magneti Marelli doBrasil Industria eComercio Ltda
Hortolandia Brazil 100,000 BRL 99.99 MagnetiMarelli S.p.A.
100.000
Magneti Marelli EspanaS.A.
Llinares delValles
Spain 781,101 EUR 99.99 MagnetiMarelli IbericaS.A.
100.000
Magneti Marelli FranceS.a.s.
Trappes France 19,066,824 EUR 99.99 MagnetiMarelli S.p.A.
100.000
Magneti Marelli GmbH Stuttgart Germany 200,000 EUR 99.99 MagnetiMarelli S.p.A.
100.000
Magneti MarelliHolding U.S.A. LLC
Wixom U.S.A. 10 USD 100.00 FCA NorthAmericaHoldings LLC
100.000
Magneti Marelli IbericaS.A.
Santpedor Spain 389,767 EUR 99.99 MagnetiMarelli S.p.A.
100.000
Magneti Marelli IndiaPrivate Ltd
Gurugram India 150,000,000 INR 99.99 MagnetiMarelli S.p.A.
100.000
Magneti MarelliInternational Trading(Shanghai) Co. LTD
Shanghai People's Rep.ofChina
200,000 USD 99.99 MagnetiMarelli S.p.A.
100.000
Magneti Marelli JapanK.K.
KohoKu-Ku-Yokohama-Kanagawa
Japan 360,000,000 JPY 99.99 MagnetiMarelli S.p.A.
100.000

256
NameRegisteredOffice Country Share capital Currency
% of Groupconsolidation
Interest heldby
% interestheld
% votingrights
Magneti Marelli MakoElektrik Sanayi VeTicaret Anonim Sirketi
Bursa Turkey 50,005 TRY 99.94 AutomotiveLightingReutlingenGmbH
99.842
PLASTIFORMPLASTIKSANAY veTICARET A.S.
0.052
SistemiComandiMeccaniciOtomotivSanayi VeTicaret A.S.
0.052
Magneti MarelliMotopropulsion FranceSAS
Argentan France 37,002 EUR 99.99 MagnetiMarelli S.p.A.
100.000
Magneti Marelli NorthAmerica Inc.
Wilmington U.S.A. 7,491,705 USD 99.99 MagnetiMarelli CofapFabricadora dePecas Ltda
100.000
Magneti Marelli ofTennessee LLC
Auburn Hills U.S.A. 1,300,000 USD 100.00 MagnetiMarelliHoldingU.S.A. LLC
100.000
Magneti Marelli PolandSp. z o.o.
Sosnowiec Poland 83,500,000 PLN 99.99 AutomotiveLightingReutlingenGmbH
100.000
Magneti MarelliPowertrain (Hefei) Co.Ltd
Hefei People's Rep.of China
70,000,000 CNY 99.99 MagnetiMarelli S.p.A
100.000
Magneti MarelliPowertrain IndiaPrivate Limited
Gurugram India 450,000,000 INR 51.00 MagnetiMarelli S.p.A.
51.000
Magneti MarelliPowertrain Mexico S.de r.l. de c.v.
Mexico City Mexico 3,000 MXN 99.99 MagnetiMarelli S.p.A.
99.967
AutomotiveLighting RearLamps MexicoS. de r.l. deC.V.
0.033
Magneti MarelliPowertrain Slovakias.r.o.
Kechnec SlovakRepublic
12,000,000 EUR 99.99 MagnetiMarelli S.p.A.
100.000
Magneti MarelliPowertrain U.S.A. LLC
Sanford U.S.A. 25,000,000 USD 100.00 MagnetiMarelliHoldingU.S.A. LLC
100.000
Magneti MarelliPromatcor SistemiSospensioni MexicanaS.R.L. de C.V.
Mexico City Mexico 3,000 MXN 87.99 SistemiSospensioniS.p.A.
88.000
Magneti MarelliRepuestos S.A.
Buenos Aires Argentina 75,262,000 ARS 99.99 MagnetiMarelli AfterMarket Partsand ServicesS.p.A.
81.943
MagnetiMarelli CofapFabricadora dePecas Ltda
18.057
Magneti MarelliSistemas AutomotivosIndustria e ComercioLtda
Contagem Brazil 1,090,694,874 BRL 99.99 MagnetiMarelli S.p.A.
72.808
AutomotiveLightingReutlingenGmbH
27.192
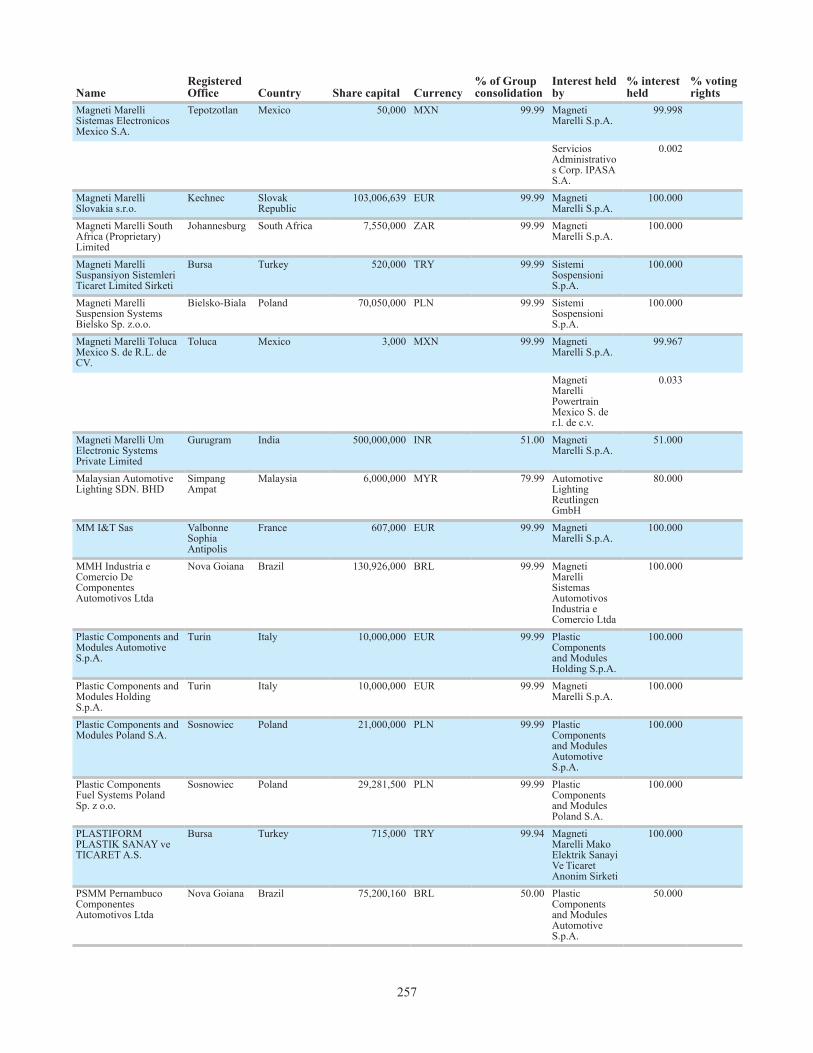
257
NameRegisteredOffice Country Share capital Currency
% of Groupconsolidation
Interest heldby
% interestheld
% votingrights
Magneti MarelliSistemas ElectronicosMexico S.A.
Tepotzotlan Mexico 50,000 MXN 99.99 MagnetiMarelli S.p.A.
99.998
ServiciosAdministrativos Corp. IPASAS.A.
0.002
Magneti MarelliSlovakia s.r.o.
Kechnec SlovakRepublic
103,006,639 EUR 99.99 MagnetiMarelli S.p.A.
100.000
Magneti Marelli SouthAfrica (Proprietary)Limited
Johannesburg South Africa 7,550,000 ZAR 99.99 MagnetiMarelli S.p.A.
100.000
Magneti MarelliSuspansiyon SistemleriTicaret Limited Sirketi
Bursa Turkey 520,000 TRY 99.99 SistemiSospensioniS.p.A.
100.000
Magneti MarelliSuspension SystemsBielsko Sp. z.o.o.
Bielsko-Biala Poland 70,050,000 PLN 99.99 SistemiSospensioniS.p.A.
100.000
Magneti Marelli TolucaMexico S. de R.L. deCV.
Toluca Mexico 3,000 MXN 99.99 MagnetiMarelli S.p.A.
99.967
MagnetiMarelliPowertrainMexico S. der.l. de c.v.
0.033
Magneti Marelli UmElectronic SystemsPrivate Limited
Gurugram India 500,000,000 INR 51.00 MagnetiMarelli S.p.A.
51.000
Malaysian AutomotiveLighting SDN. BHD
SimpangAmpat
Malaysia 6,000,000 MYR 79.99 AutomotiveLightingReutlingenGmbH
80.000
MM I&T Sas ValbonneSophiaAntipolis
France 607,000 EUR 99.99 MagnetiMarelli S.p.A.
100.000
MMH Industria eComercio DeComponentesAutomotivos Ltda
Nova Goiana Brazil 130,926,000 BRL 99.99 MagnetiMarelliSistemasAutomotivosIndustria eComercio Ltda
100.000
Plastic Components andModules AutomotiveS.p.A.
Turin Italy 10,000,000 EUR 99.99 PlasticComponentsand ModulesHolding S.p.A.
100.000
Plastic Components andModules HoldingS.p.A.
Turin Italy 10,000,000 EUR 99.99 MagnetiMarelli S.p.A.
100.000
Plastic Components andModules Poland S.A.
Sosnowiec Poland 21,000,000 PLN 99.99 PlasticComponentsand ModulesAutomotiveS.p.A.
100.000
Plastic ComponentsFuel Systems PolandSp. z o.o.
Sosnowiec Poland 29,281,500 PLN 99.99 PlasticComponentsand ModulesPoland S.A.
100.000
PLASTIFORMPLASTIK SANAY veTICARET A.S.
Bursa Turkey 715,000 TRY 99.94 MagnetiMarelli MakoElektrik SanayiVe TicaretAnonim Sirketi
100.000
PSMM PernambucoComponentesAutomotivos Ltda
Nova Goiana Brazil 75,200,160 BRL 50.00 PlasticComponentsand ModulesAutomotiveS.p.A.
50.000

258
NameRegisteredOffice Country Share capital Currency
% of Groupconsolidation
Interest heldby
% interestheld
% votingrights
ServiciosAdministrativos Corp.IPASA S.A.
Col.Chapultepec
Mexico 1,000 MXN 99.99 MagnetiMarelliSistemasElectronicosMexico S.A.
99.990
IndustriasMagnetiMarelli MexicoS.A. de C.V.
0.010
Sistemi ComandiMeccanici OtomotivSanayi Ve Ticaret A.S.
Bursa Turkey 90,000 TRY 99.89 MagnetiMarelli MakoElektrik SanayiVe TicaretAnonim Sirketi
99.956
Sistemi SospensioniS.p.A.
Corbetta Italy 37,622,179 EUR 99.99 MagnetiMarelli S.p.A.
100.000
Soffiaggio PolimeriS.r.l.
Leno Italy 45,900 EUR 84.99 PlasticComponentsand ModulesAutomotiveS.p.A.
85.000
Tecnologia deIluminacion AutomotrizS.A. de C.V.
Juarez Mexico 50,000 MXN 100.00 AutomotiveLighting LLC
99.998
AutomotiveLighting RearLamps MexicoS. de r.l. deC.V.
0.002
Ufima S.A.S. - Societeen liquidation
Trappes France 44,940 EUR 99.99 MagnetiMarelli S.p.A.
65.020
FCAPartecipazioniS.p.A.
34.980
TeksidTeksid S.p.A. Turin Italy 71,403,261 EUR 100.00 Fiat Chrysler
AutomobilesN.V.
100.000
Compania IndustrialFrontera S.A. de C.V.
Frontera Mexico 11,376,600 MXN 100.00 Teksid Hierrode MexicoS.A. de C.V.
99.999
Teksid Inc. 0.001Funfrap-FundicaoPortuguesa S.A.
Cacia Portugal 13,697,550 EUR 83.61 Teksid S.p.A. 83.607
Teksid Aluminum S.r.l. Carmagnola Italy 5,000,000 EUR 100.00 Fiat ChryslerAutomobilesN.V.
100.000
Teksid do Brasil Ltda Betim Brazil 714,696,013 BRL 100.00 Teksid S.p.A. 100.000Teksid Hierro deMexico S.A. de C.V.
Frontera Mexico 297,167,800 MXN 100.00 Teksid S.p.A. 100.000
Teksid Inc. FarmingtonHills
U.S.A. 100,000 USD 100.00 Teksid S.p.A. 100.000
Teksid Iron Poland Sp.z o.o.
Skoczow Poland 48,122,256 PLN 100.00 Teksid S.p.A. 100.000
ComauComau S.p.A. Grugliasco Italy 48,013,959 EUR 100.00 Fiat Chrysler
AutomobilesN.V.
100.000
COMAU (KUNSHAN)Automation Co. Ltd.
Kunshan People's Rep.ofChina
8,000,000 USD 100.00 Comau S.p.A. 100.000
Comau (Shanghai)Engineering Co. Ltd.
Shanghai People's Rep.ofChina
5,000,000 USD 100.00 Comau S.p.A. 100.000
Comau (Shanghai)International TradingCo. Ltd.
Shanghai People's Rep.ofChina
200,000 USD 100.00 Comau S.p.A. 100.000
Comau Argentina S.A. Buenos Aires Argentina 500,000 ARS 100.00 Comau S.p.A. 97.000

259
NameRegisteredOffice Country Share capital Currency
% of Groupconsolidation
Interest heldby
% interestheld
% votingrights
FCA ArgentinaS.A.
3.000
Comau AutomatizacionS.de R.L. C.V.
CuautitlanIzcalli
Mexico 62,204,118 MXN 100.00 Comau MexicoS.de R.L. deC.V.
100.000
Comau Canada Inc. Windsor Canada 100 CAD 100.00 Comau LLC 100.000Comau DeutschlandGmbH
Boblingen Germany 1,330,000 EUR 100.00 Comau S.p.A. 100.000
Comau do BrasilIndustria e ComercioLtda.
Betim Brazil 102,742,653 BRL 100.00 Comau S.p.A. 100.000
Comau France S.A.S. Trappes France 6,000,000 EUR 100.00 Comau S.p.A. 100.000Comau Iaisa S.de R.L.de C.V.
CuautitlanIzcalli
Mexico 17,181,062 MXN 100.00 Comau MexicoS.de R.L. deC.V.
100.000
Comau India PrivateLimited
Pune India 239,935,020 INR 100.00 Comau S.p.A. 99.990
ComauDeutschlandGmbH
0.010
Comau LLC Wilmington U.S.A. 100 USD 100.00 FCA NorthAmericaHoldings LLC
100.000
Comau Mexico S.deR.L. de C.V.
CuautitlanIzcalli
Mexico 99,349,172 MXN 100.00 Comau S.p.A. 100.000
Comau Poland Sp. zo.o.
Bielsko-Biala Poland 3,800,000 PLN 100.00 Comau S.p.A. 100.000
Comau Romania S.R.L. Oradea Romania 23,673,270 RON 100.00 Comau S.p.A. 100.000Comau Russia OOO Moscow Russia 4,770,225 RUB 100.00 Comau S.p.A. 99.000
ComauDeutschlandGmbH
1.000
Comau Service SystemsS.L.
Madrid Spain 250,000 EUR 100.00 Comau S.p.A. 100.000
Comau Trebol S.deR.L. de C.V.
Tepotzotlan Mexico 16,168,211 MXN 100.00 Comau MexicoS.de R.L. deC.V.
100.000
Comau U.K. Limited Rugby UnitedKingdom
2,502,500 GBP 100.00 Comau S.p.A. 100.000
Other Activities: Holding companies and Other companiesDeposito AvogadroS.p.A.
Turin Italy 5,100,000 EUR 100.00 FCAPartecipazioniS.p.A.
100.000
FCA Argentina S.A. Buenos Aires Argentina 5,292,117 ARS 100.00 FCA ServicesS.p.A.
90.961
FCA FiatChryslerParticipacoesBrasil Limitada
9.029
Fiat ChryslerRimacoArgentina S.A.
0.009
FCAAUTOMOBILESARGENTINAS.A.
0.001
FCA Fiat ChryslerParticipacoes BrasilLimitada
Nova Lima Brazil 11,174,292,755 BRL 100.00 Fiat ChryslerAutomobilesN.V.
55.037
FCA ItalyS.p.A.
44.578
FCA RealEstate ServicesS.p.A.
0.385

260
NameRegisteredOffice Country Share capital Currency
% of Groupconsolidation
Interest heldby
% interestheld
% votingrights
FCA Group PurchasingFrance S.a.r.l.
Trappes France 7,700 EUR 100.00 FCA GroupPurchasingS.r.l.
100.000
FCA Group PurchasingPoland Sp. z o.o.
Bielsko-Biala Poland 300,000 PLN 100.00 FCA GroupPurchasingS.r.l.
100.000
FCA Group PurchasingS.r.l.
Turin Italy 600,000 EUR 100.00 FCAPartecipazioniS.p.A.
100.000
FCA InformationTechnology, Excellenceand Methods S.p.A.
Turin Italy 500,000 EUR 100.00 FCA ServicesS.p.A.
99.000
FCA ItalyS.p.A.
1.000
FCA North AmericaHoldings LLC
Wilmington U.S.A. — USD 100.00 Fiat ChryslerAutomobilesN.V.
100.000
FCA PartecipazioniS.p.A.
Turin Italy 50,000,000 EUR 100.00 FCA ItalyS.p.A.
100.000
FCA Security Societaconsortile per azioni
Turin Italy 152,520 EUR 90.13 FCAPartecipazioniS.p.A.
64.152
FCA ItalyS.p.A
13.171
Fiat ChryslerAutomobilesN.V.
4.430
MagnetiMarelli S.p.A.
1.496
FCA ITALYHOLDINGSS.p.A.
1.081
FCA MelfiS.r.l.
0.656
Comau S.p.A. 0.621C.R.F. SocietàConsortile perAzioni
0.605
Teksid S.p.A. 0.570FCA ServicesS.p.A.
0.514
SistemiSospensioniS.p.A.
0.433
FCA Serviziper l'IndustriaS.c.p.A.
0.426
TeksidAluminumS.r.l.
0.425
Fiat ChryslerFinance S.p.A.
0.367
Fidis S.p.A. 0.256AutomotiveLighting ItaliaS.p.A.
0.201
FCA GroupMarketingS.p.A.
0.129
FCA GroupPurchasingS.r.l.
0.081
FCA RealEstate ServicesS.p.A.
0.081

261
NameRegisteredOffice Country Share capital Currency
% of Groupconsolidation
Interest heldby
% interestheld
% votingrights
Servizi eAttivitàDoganali perl'IndustriaS.p.A.
0.081
Sisport S.p.A. -Societàsportivadilettantistica
0.078
PlasticComponentsand ModulesAutomotiveS.p.A.
0.051
FCA CenterItalia S.p.A.
0.035
Abarth & C.S.p.A.
0.031
Fiat ChryslerRiskManagementS.p.A.
0.031
MaseratiS.p.A.
0.031
MagnetiMarelli AfterMarket Partsand ServicesS.p.A.
0.029
DepositoAvogadroS.p.A.
0.017
Easy DriveS.r.l.
0.017
FCA CustomerServicesCentre S.r.l.
0.017
FCA Fleet &Tenders S.R.L.
0.017
FCAInformationTechnology,Excellence andMethodsS.p.A.
0.017
i-FASTAutomotiveLogistics S.r.l.
0.016
i-FASTContainerLogisticsS.p.A.
0.016
FCA Services BelgiumN.V.
Brugge Belgium 62,000 EUR 100.00 FCA ServicesS.p.A.
99.960
Servizi eAttivitàDoganali perl'IndustriaS.p.A.
0.040
FCA Services d.o.o.Kragujevac
Kragujevac Serbia 15,047,880 RSD 100.00 FCA ServicesS.p.A.
100.000
FCA Services GermanyGmbH
Ulm Germany 200,000 EUR 100.00 FCA ServicesS.p.A.
100.000
FCA Services Hispano-Lusa S.A.
Madrid Spain 2,797,054 EUR 100.00 FCA ServicesS.p.A.
100.000
FCA Services PolskaSp. z o.o.
Bielsko-Biala Poland 3,600,000 PLN 100.00 FCA ServicesS.p.A.
100.000

262
NameRegisteredOffice Country Share capital Currency
% of Groupconsolidation
Interest heldby
% interestheld
% votingrights
FCA Services S.p.A. Turin Italy 3,600,000 EUR 100.00 FCAPartecipazioniS.p.A.
100.000
FCA Services SupportMalaysia SDN. BHD.
Kuala Lumpur Malaysia 2,000,000 MYR 100.00 FCA ServicesS.p.A.
100.000
FCA Services SupportMexico S.A. de C.V.
Mexico City Mexico 100 MXN 100.00 FCA ServicesS.p.A.
99.000
Servizi eAttivitàDoganali perl'IndustriaS.p.A.
1.000
FCA Services U.S.A.,Inc.
Wilmington U.S.A. 500,000 USD 100.00 FCA ServicesS.p.A.
100.000
FCA Servizi perl'Industria S.c.p.A.
Turin Italy 1,652,669 EUR 87.70 FCA ItalyS.p.A.
51.000
FCAPartecipazioniS.p.A.
11.500
Fiat ChryslerAutomobilesN.V.
5.000
FCA SecuritySocietàconsortile perazioni
3.000
Teksid S.p.A. 2.000Abarth & C.S.p.A.
1.500
C.R.F. SocietàConsortile perAzioni
1.500
Comau S.p.A. 1.500FCA GroupMarketingS.p.A.
1.500
FCAInformationTechnology,Excellence andMethodsS.p.A.
1.500
FCA ServicesS.p.A.
1.500
Fiat ChryslerFinance S.p.A.
1.500
Fidis S.p.A. 1.500MagnetiMarelli S.p.A.
1.500
MaseratiS.p.A.
1.500
DepositoAvogadroS.p.A.
0.500
Fiat ChryslerAutomobiles ServicesUK Limited
Basildon UnitedKingdom
18,750,000 GBP 100.00 FCAPartecipazioniS.p.A.
100.000
Fiat Chrysler FinancasBrasil Ltda.
Nova Lima Brazil 2,469,701 BRL 100.00 Fiat ChryslerFinance S.p.A.
99.994
FCA FiatChryslerParticipacoesBrasil Limitada
0.006
Fiat Chrysler FinanceCanada Ltd.
Calgary Canada 10,099,885 CAD 100.00 Fiat ChryslerAutomobilesN.V.
100.000

263
NameRegisteredOffice Country Share capital Currency
% of Groupconsolidation
Interest heldby
% interestheld
% votingrights
Fiat Chrysler Finance etServices S.A.S.
Trappes France 3,700,000 EUR 100.00 FCA ServicesS.p.A.
100.000
Fiat Chrysler FinanceEurope S.A.
Luxembourg Luxembourg 86,494,000 EUR 100.00 Fiat ChryslerAutomobilesN.V.
100.000
Fiat Chrysler FinanceNorth America Inc.
Wilmington U.S.A. 190,090,010 USD 100.00 FCA NorthAmericaHoldings LLC
100.000
Fiat Chrysler FinanceS.p.A.
Turin Italy 224,440,000 EUR 100.00 Fiat ChryslerAutomobilesN.V.
100.000
Fiat Chrysler FinanceUS Inc.
Wilmington U.S.A. 100 USD 100.00 FCA NorthAmericaHoldings LLC
100.000
Fiat Chrysler Polska Sp.z o.o.
Warsaw Poland 25,500,000 PLN 100.00 FCAPartecipazioniS.p.A.
100.000
Fiat Chrysler RimacoSA
Lugano Switzerland 350,000 CHF 100.00 FCAPartecipazioniS.p.A.
100.000
Fiat Chrysler RiskManagement S.p.A.
Turin Italy 120,000 EUR 100.00 FCAPartecipazioniS.p.A.
100.000
Fiat Chrysler UK LLP London UnitedKingdom
5,000,250,001 USD 100.00 Fiat ChryslerAutomobilesN.V.
99.995
Maserati NorthAmerica Inc.
0.005
Fiat U.S.A. Inc. New York U.S.A. 16,830,000 USD 100.00 Fiat ChryslerAutomobilesN.V.
100.000
Neptunia AssicurazioniMarittime S.A.
Lugano Switzerland 10,000,000 CHF 100.00 Fiat ChryslerRimaco SA
100.000
New Business 30 S.r.l. Turin Italy 100,000 EUR 100.00 FCAPartecipazioniS.p.A.
100.000
Sadi Polska-AgencjaCelna Sp. z o.o.
Bielsko-Biala Poland 500,000 PLN 100.00 Servizi eAttivitàDoganali perl'IndustriaS.p.A.
100.000
Servizi e AttivitàDoganali per l'IndustriaS.p.A.
Turin Italy 520,000 EUR 100.00 FCA ServicesS.p.A.
100.000
Sisport S.p.A. - Societàsportiva dilettantistica
Turin Italy 889,049 EUR 100.00 FCAPartecipazioniS.p.A.
100.000
Joint arrangementsMass-Market Vehicles
APACFiat India AutomobilesPrivate Limited
Ranjangaon India 24,451,596,600 INR 50.00 FCA ItalyS.p.A.
50.000
EMEASocietà Europea VeicoliLeggeri-Sevel S.p.A.
Atessa Italy 68,640,000 EUR 50.00 FCA ItalyS.p.A.
50.000
Jointly-controlled entities accounted for using the equity methodMass-Market Vehicles
NAFTAUnited States Councilfor AutomotiveResearch LLC
Southfield U.S.A. 100 USD 33.33 FCA US LLC 33.330
APAC

264
NameRegisteredOffice Country Share capital Currency
% of Groupconsolidation
Interest heldby
% interestheld
% votingrights
GAC FIAT ChryslerAutomobiles Co. Ltd.
Changsha People's Rep.ofChina
6,000,000,000 CNY 50.00 Fiat ChryslerAutomobilesN.V.
21.667
FCA AsiaPacificInvestment Co.Ltd.
18.333
FCA ItalyS.p.A.
10.000
GAC FIATCHRYSLERAUTOMOBILESSALES CO. Ltd.
Changsha People's Rep.ofChina
200,000,000 CNY 50.00 GAC FIATChryslerAutomobilesCo. Ltd.
100.000
EMEAFCA BANK S.p.A. Turin Italy 700,000,000 EUR 50.00 FCA Italy
S.p.A.50.000
FCA AUTOMOTIVESERVICES UK LTD.
SloughBerkshire
UnitedKingdom
50,250,000 GBP 50.00 FCA BANKS.p.A.
100.000
FCA Bank DeutschlandG.m.b.H.
Heilbronn Germany 39,600,000 EUR 50.00 FCA BANKS.p.A.
100.000
FCA Bank G.m.b.H. Vienna Austria 5,000,000 EUR 50.00 FCA BANKS.p.A.
50.000
Fidis S.p.A. 25.000FCA CAPITALBELGIUM S.A.
Auderghem Belgium 3,718,500 EUR 50.00 FCA BANKS.p.A.
99.999
FCA CAPITALDANMARK A/S
Glostrup Denmark 14,154,000 DKK 50.00 FCA BANKS.p.A.
100.000
FCA CAPITALESPANA E.F.C. S.A.
Alcalá DeHenares
Spain 26,671,557 EUR 50.00 FCA BANKS.p.A.
100.000
FCA CAPITALFRANCE S.A.
Trappes France 11,360,000 EUR 50.00 FCA BANKS.p.A.
99.999
FCA CAPITALHELLAS S.A.
Argyroupoli Greece 1,200,000 EUR 50.00 FCA BANKS.p.A.
100.000
FCA Capital NederlandB.V.
Lijnden Netherlands 3,085,800 EUR 50.00 FCA BANKS.p.A.
100.000
FCA CAPITALNORGE AS
Fornebu Norway 100,800 NOK 50.00 FCA CAPITALDANMARKA/S
100.000
FCA CAPITALPORTUGALINSTITUIÇÃOFINANCIERA DECRÉDITO SA
Porto Salvo Portugal 10,000,000 EUR 50.00 FCA BANKS.p.A.
100.000
FCA CAPITAL REDesignated ActivityCompany
Dublin Ireland 1,000,000 EUR 50.00 FCA BANKS.p.A.
100.000
FCA Capital SuisseS.A.
Schlieren Switzerland 24,100,000 CHF 50.00 FCA BANKS.p.A.
100.000
FCA CAPITALSVERIGE AB
Kista Sweden 50,000 SEK 50.00 FCA CAPITALDANMARKA/S
100.000
FCA DEALERSERVICES ESPANAS.A.
Alcalá DeHenares
Spain 25,145,299 EUR 50.00 FCA BANKS.p.A.
100.000
FCA DEALERSERVICESPORTUGAL S.A.
Porto Salvo Portugal 500,300 EUR 50.00 FCA BANKS.p.A.
100.000
FCA DEALERSERVICES UK LTD.
SloughBerkshire
UnitedKingdom
20,500,000 GBP 50.00 FCA BANKS.p.A.
100.000
FCA INSURANCEHELLAS S.A.
Argyroupoli Greece 60,000 EUR 49.99 FCA CAPITALHELLAS S.A.
99.975
FCA LEASINGFRANCE SNC
Trappes France 8,954,581 EUR 50.00 FCA CAPITALFRANCE S.A.
99.998
FCA Leasing GmbH Vienna Austria 40,000 EUR 50.00 FCA BANKS.p.A.
100.000

265
NameRegisteredOffice Country Share capital Currency
% of Groupconsolidation
Interest heldby
% interestheld
% votingrights
FCA Leasing PolskaSp. z o.o.
Warsaw Poland 24,384,000 PLN 50.00 FCA BANKS.p.A.
100.000
FCA-Group BankPolska S.A.
Warsaw Poland 125,000,000 PLN 50.00 FCA BANKS.p.A.
100.000
Ferrari FinancialServices GMBH
Pullach i.Isartal
Germany 1,777,600 EUR 25.00 FCA BANKS.p.A.
50.000
LEASYS FRANCES.A.S.
Trappes France 3,000,000 EUR 50.00 Leasys S.p.A. 100.000
Leasys S.p.A. Turin Italy 77,979,400 EUR 50.00 FCA BANKS.p.A.
100.000
LEASYS UK LTD. SloughBerkshire
UnitedKingdom
19,000,000 GBP 50.00 Leasys S.p.A. 100.000
FER MAS Oto TicaretA.S.
Istanbul Turkey 5,500,000 TRY 37.64 Tofas-TurkOtomobilFabrikasi A.S.
99.418
Koc Fiat Kredi TuketiciFinansmani A.S.
Istanbul Turkey 30,000,000 TRY 37.86 Tofas-TurkOtomobilFabrikasi A.S.
100.000
Tofas-Turk OtomobilFabrikasi A.S.
Levent Turkey 500,000,000 TRY 37.86 FCA ItalyS.p.A.
37.856
ComponentsMagneti Marelli
Hubei HuazhoungMagneti MarelliAutomotive LightingCo. Ltd
HubeiProvince
People's Rep.ofChina
138,846,000 CNY 50.00 AutomotiveLightingReutlingenGmbH
50.000
Magneti MarelliMotherson Auto SystemPrivate Limited
New Delhi India 1,500,000,000 INR 50.00 MagnetiMarelli S.p.A.
37.333 —
MagnetiMarelliMothersonIndia HoldingB.V.
25.333 100.000
Magneti MarelliMotherson IndiaHolding B.V.
Lijnden Netherlands 2,114,074 EUR 50.00 MagnetiMarelli S.p.A.
50.000
Magneti MarelliMotherson ShockAbsorbers (India)Private Limited
Pune India 2,269,000,000 INR 50.00 MagnetiMarelli S.p.A.
50.000
Magneti Marelli SKHExhaust SystemsPrivate Limited
Gurugram India 274,190,000 INR 50.00 MagnetiMarelli S.p.A.
50.000
Magneti Marelli TalbrosChassis Systems Pvt.Ltd.
Faridabad India 235,600,000 INR 50.00 SistemiSospensioniS.p.A.
50.000
SAIC MAGNETIMARELLI PowertrainCo. Ltd
Shanghai People's Rep.ofChina
23,000,000 EUR 50.00 MagnetiMarelli S.p.A.
50.000
SKH Magneti MarelliExhaust SystemsPrivate Limited
Gurugram India 95,450,000 INR 46.62 MagnetiMarelli S.p.A.
46.621 50.000
Zhejiang WanxiangMagneti Marelli ShockAbsorbers Co. Ltd.
Zhenjiang-Jangsu
People's Rep.ofChina
100,000,000 CNY 50.00 MagnetiMarelli S.p.A.
50.000
TeksidHua Dong TeksidAutomotive FoundryCo. Ltd.
Zhenjiang-Jangsu
People's Rep.ofChina
385,363,500 CNY 50.00 Teksid S.p.A. 50.000
Subsidiaries accounted for using the equity methodMass-Market Vehicles
EMEA

266
NameRegisteredOffice Country Share capital Currency
% of Groupconsolidation
Interest heldby
% interestheld
% votingrights
AC Austro CarHandelsgesellschaftm.b.h. & Co. OHG
Vienna Austria — EUR 100.00 FCA AUSTROCAR GmbH
100.000
ALFA ROMEO LLC. Auburn Hills U.S.A. — USD 100.00 FCA NorthAmericaHoldings LLC
100.000
Chrysler France S.A.S. Trappes France 460,000 EUR 100.00 CG EU NSCLIMITED
100.000
Chrysler Jeep TicaretA.S.
Istanbul Turkey 5,357,000 TRY 100.00 CG EU NSCLIMITED
99.960
FCA US LLC 0.040Chrysler Polska Sp.zo.o.
Warsaw Poland 30,356,000 PLN 100.00 CG EU NSCLIMITED
100.000
Fiat Automobiles S.p.A.in liquidation
Turin Italy 120,000 EUR 100.00 FCA ItalyS.p.A.
100.000
FIAT CHRYSLERAUTOMOBILES CRs.r.o.
Prague CzechRepublic
1,000,000 CZK 100.00 FCA ItalyS.p.A.
100.000
FIAT CHRYSLERAUTOMOBILES SRs.r.o.
Bratislava SlovakRepublic
33,194 EUR 100.00 FCA ItalyS.p.A.
100.000
Fiat Professional S.p.A.in liquidation
Turin Italy 120,000 EUR 100.00 FCA ItalyS.p.A.
100.000
GESTIN POLSKA Sp.z o.o.
Bielsko-Biala Poland 500,000 PLN 100.00 FCA POLANDSpólkaAkcyjna
100.000
Italcar SA Casablanca Morocco 4,000,000 MAD 99.90 Fiat ChryslerAutomobilesMorocco S.A.
99.900
Lancia AutomobilesS.p.A. in liquidation
Turin Italy 120,000 EUR 100.00 FCA ItalyS.p.A.
100.000
NEW BUSINESS 37S.p.A.
Turin Italy 50,000 EUR 100.00 FCA RealEstate ServicesS.p.A.
100.000
Sirio Polska Sp. z o.o. Bielsko-Biala Poland 1,350,000 PLN 100.00 FCA POLANDSpólkaAkcyjna
100.000
ComponentsMagneti Marelli
Cofap Fabricadora dePecas Ltda
Santo Andre Brazil 75,720,716 BRL 68.34 MagnetiMarelli doBrasil Industriae ComercioLtda
68.350
ComauCOMAU(THAILAND) CO.LTD
Bangkok Thailand 10,000,000 THB 100.00 Comau S.p.A. 99.997
COMAU Czech s.r.o. Ostrava CzechRepublic
5,400,000 CZK 100.00 Comau S.p.A. 100.000
Comau Do BrasilFacilities Ltda.
Santo Andre Brazil 10,000,000 BRL 100.00 Comau doBrasil Industriae ComercioLtda.
100.000
Comau Robot veSistemleri A.S
Bursa Turkey 1,210,000 TRY 100.00 Comau S.p.A. 100.000
IUVO SRL Pontedera Italy 61,224 EUR 26.01 SYNEXOS.R.L.
51.000
SYNEXO S.R.L. Grugliasco Italy 10,000 EUR 51.00 Comau S.p.A. 51.000
Other Activities:Holding companies and Other companiesFiat (Beijing) BusinessCo., Ltd.
Beijing People's Rep.ofChina
3,000,000 USD 100.00 FCAPartecipazioniS.p.A.
100.000

267
NameRegisteredOffice Country Share capital Currency
% of Groupconsolidation
Interest heldby
% interestheld
% votingrights
Fiat Chrysler RimacoArgentina S.A.
Buenos Aires Argentina 150,000 ARS 99.96 Fiat ChryslerRimaco SA
99.960
Fiat Chrysler RimacoBrasil Corretagens deSeguros Ltda.
BeloHorizonte
Brazil 365,525 BRL 100.00 Fiat ChryslerRimaco SA
99.998
Subsidiaries valued at costMass-Market Vehicles
NAFTAFCA Co-Issuer Inc. Wilmington U.S.A. 100 USD 100.00 FCA US LLC 100.000FCA DUTCHOPERATING LLC
Wilmington U.S.A. — USD 100.00 CNI C.V. 100.000
FCA Foundation BinghamFarms
U.S.A. — USD 100.00 FCA US LLC 100.000
FCA INTERMEDIATEMEXICO LLC
Wilmington U.S.A. 1 USD 100.00 ChryslerMexicoInvestmentHoldingsCooperatieU.A.
100.000
Fundacion Chrysler,I.A.P.
Santa Fe Mexico — MXN 100.00 FCA Mexico,S.A. de C.V.
100.000
FUNDACION FCA,A.C.
Mexico Mexico 2 MXN 100.00 FCA Mexico,S.A. de C.V.
50.000
FCAMINORITYLLC
50.000
EMEAAssociazione Tecnicadell`AutomobileConsulting & Solutionss.r.l. in liquidation
Orbassano Italy 49,000 EUR 100.00 FCA ITALYHOLDINGSS.p.A.
100.000
Chrysler NetherlandsHolding CooperatieU.A.
Amsterdam Netherlands — EUR 100.00 CNI C.V. 99.000
FCA DUTCHOPERATINGLLC
1.000
Chrysler UK PensionTrustees Limited
SloughBerkshire
UnitedKingdom
1 GBP 100.00 Chrysler UKLimited
100.000
CODEFIS Societàconsortile per azioni
Turin Italy 120,000 EUR 51.00 FCA ItalyS.p.A.
51.000
Consorzio ATA -FORMAZIONE
Pomiglianod'Arco
Italy 18,319 EUR 100.00 C.R.F. SocietàConsortile perAzioni
90.998
FCA RealEstate ServicesS.p.A.
9.002
CONSORZIO FCACNHI ENERGY
Turin Italy 7,000 EUR 57.14 Comau S.p.A. 14.286
FCA ItalyS.p.A.
14.286
PlasticComponentsand ModulesAutomotiveS.p.A.
14.286
Teksid S.p.A. 14.286Consorzio ServiziBalocco
Turin Italy 10,100 EUR 86.11 FCA ItalyS.p.A.
80.663
MaseratiS.p.A.
2.901
Abarth & C.S.p.A.
1.554

268
NameRegisteredOffice Country Share capital Currency
% of Groupconsolidation
Interest heldby
% interestheld
% votingrights
FCA RealEstate ServicesS.p.A.
0.990
FAS FREE ZONE Ltd.Kragujevac
Kragujevac Serbia 2,281,603 RSD 66.67 FCA SERBIADOOKRAGUJEVAC
100.000
FCA Russia S.r.l. Turin Italy 253,565 EUR 100.00 FCA ItalyS.p.A.
100.000
Fiat Motor Sales Ltd SloughBerkshire
UnitedKingdom
1,500,000 GBP 100.00 FIATCHRYSLERAUTOMOBILES UK Ltd
100.000
OOO “CABEKO” NizhniyNovgorod
Russia 181,869,062 RUB 100.00 FCA RussiaS.r.l.
99.591
FCA ItalyS.p.A.
0.409
VM North America Inc. Auburn Hills U.S.A. 1,000 USD 100.00 FCA ItalyS.p.A.
100.000
ComponentsMagneti Marelli
SBH EXTRUSAO DOBRASIL LTDA.
Betim Brazil 15,478,371 BRL 99.99 PlasticComponentsand ModulesAutomotiveS.p.A.
100.000
ComauConsorzio Fermag inliquidation
Bareggio Italy 144,608 EUR 68.00 Comau S.p.A. 68.000
Other Activities:Holding companies and Other companiesFCA Newco LLC Wilmington U.S.A. 1 USD 100.00 Maserati North
America Inc.100.000
Fiat Chrysler FinanceNetherlands B.V.
Amsterdam Netherlands 1 EUR 100.00 Fiat ChryslerAutomobilesN.V.
100.000
Fiat CommonInvestment FundLimited
London UnitedKingdom
2 GBP 100.00 Fiat ChryslerAutomobilesServices UKLimited
100.000
Fiat Oriente S.A.E. inliquidation
Cairo Egypt 50,000 EGP 100.00 FCAPartecipazioniS.p.A.
100.000
Isvor Fiat India PrivateLtd. in liquidation
New Delhi India 1,750,000 INR 100.00 FCAPartecipazioniS.p.A.
100.000
New Business 29 S.c.r.l. Turin Italy 50,000 EUR 100.00 FCAPartecipazioniS.p.A.
80.000
Fiat ChryslerAutomobilesN.V.
20.000
New Business 31 S.p.A. Turin Italy 120,000 EUR 100.00 FCAPartecipazioniS.p.A.
100.000
New Business 35 s.r.l. Turin Italy 50,000 EUR 100.00 FCAPartecipazioniS.p.A.
100.000
New Business 36 s.r.l. Turin Italy 50,000 EUR 100.00 FCAPartecipazioniS.p.A.
100.000
Associated companies accounted for using the equity methodMass-Market Vehicles
APAC
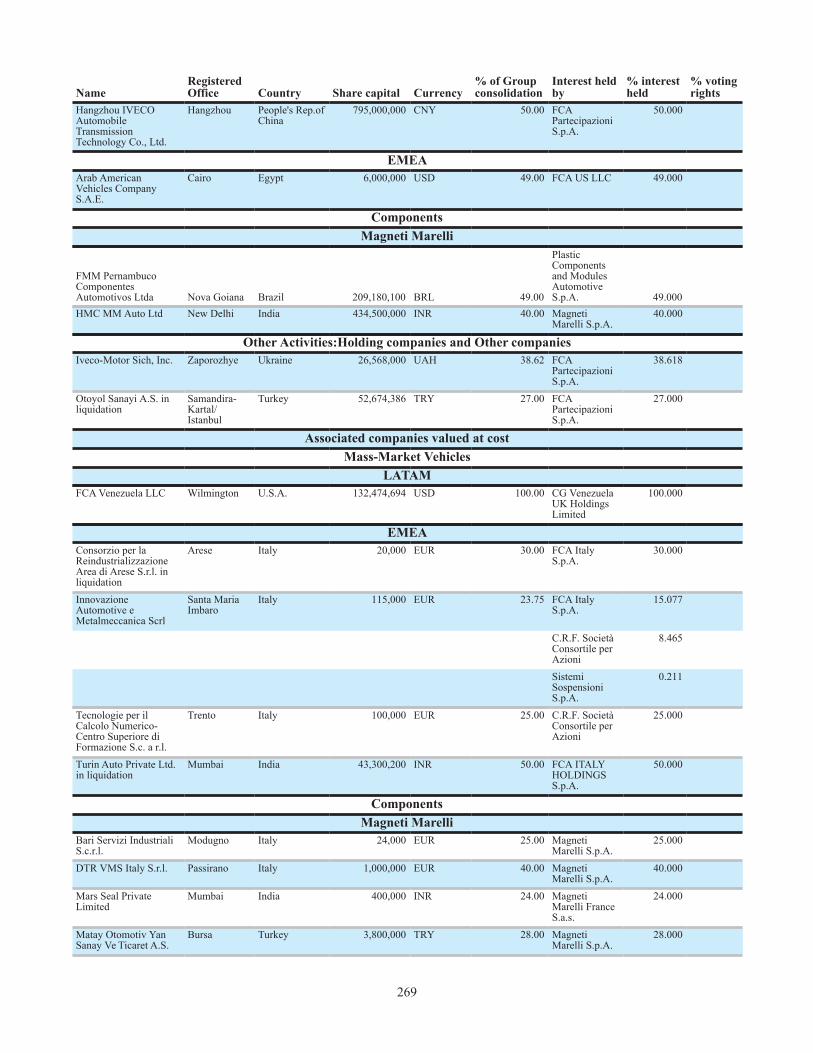
269
NameRegisteredOffice Country Share capital Currency
% of Groupconsolidation
Interest heldby
% interestheld
% votingrights
Hangzhou IVECOAutomobileTransmissionTechnology Co., Ltd.
Hangzhou People's Rep.ofChina
795,000,000 CNY 50.00 FCAPartecipazioniS.p.A.
50.000
EMEAArab AmericanVehicles CompanyS.A.E.
Cairo Egypt 6,000,000 USD 49.00 FCA US LLC 49.000
ComponentsMagneti Marelli
FMM PernambucoComponentesAutomotivos Ltda Nova Goiana Brazil 209,180,100 BRL 49.00
PlasticComponentsand ModulesAutomotiveS.p.A. 49.000
HMC MM Auto Ltd New Delhi India 434,500,000 INR 40.00 MagnetiMarelli S.p.A.
40.000
Other Activities:Holding companies and Other companiesIveco-Motor Sich, Inc. Zaporozhye Ukraine 26,568,000 UAH 38.62 FCA
PartecipazioniS.p.A.
38.618
Otoyol Sanayi A.S. inliquidation
Samandira-Kartal/Istanbul
Turkey 52,674,386 TRY 27.00 FCAPartecipazioniS.p.A.
27.000
Associated companies valued at costMass-Market Vehicles
LATAMFCA Venezuela LLC Wilmington U.S.A. 132,474,694 USD 100.00 CG Venezuela
UK HoldingsLimited
100.000
EMEAConsorzio per laReindustrializzazioneArea di Arese S.r.l. inliquidation
Arese Italy 20,000 EUR 30.00 FCA ItalyS.p.A.
30.000
InnovazioneAutomotive eMetalmeccanica Scrl
Santa MariaImbaro
Italy 115,000 EUR 23.75 FCA ItalyS.p.A.
15.077
C.R.F. SocietàConsortile perAzioni
8.465
SistemiSospensioniS.p.A.
0.211
Tecnologie per ilCalcolo Numerico-Centro Superiore diFormazione S.c. a r.l.
Trento Italy 100,000 EUR 25.00 C.R.F. SocietàConsortile perAzioni
25.000
Turin Auto Private Ltd.in liquidation
Mumbai India 43,300,200 INR 50.00 FCA ITALYHOLDINGSS.p.A.
50.000
ComponentsMagneti Marelli
Bari Servizi IndustrialiS.c.r.l.
Modugno Italy 24,000 EUR 25.00 MagnetiMarelli S.p.A.
25.000
DTR VMS Italy S.r.l. Passirano Italy 1,000,000 EUR 40.00 MagnetiMarelli S.p.A.
40.000
Mars Seal PrivateLimited
Mumbai India 400,000 INR 24.00 MagnetiMarelli FranceS.a.s.
24.000
Matay Otomotiv YanSanay Ve Ticaret A.S.
Bursa Turkey 3,800,000 TRY 28.00 MagnetiMarelli S.p.A.
28.000
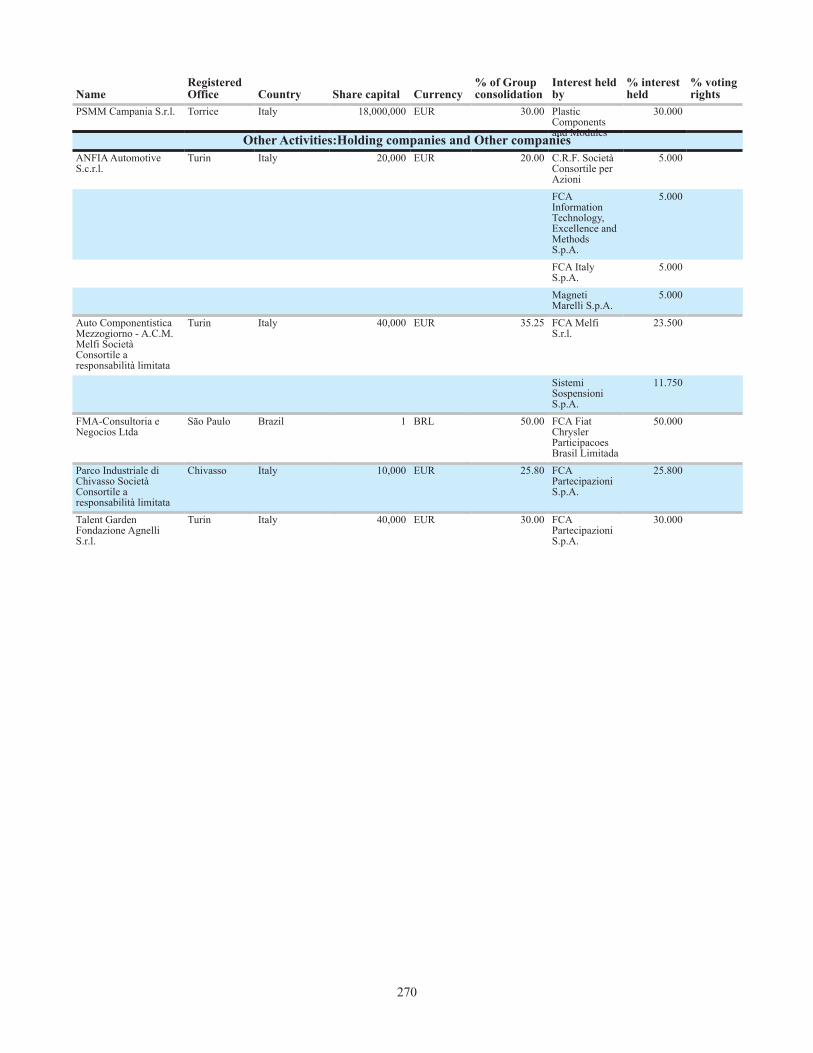
270
NameRegisteredOffice Country Share capital Currency
% of Groupconsolidation
Interest heldby
% interestheld
% votingrights
PSMM Campania S.r.l. Torrice Italy 18,000,000 EUR 30.00 PlasticComponentsand Modules
30.000
Other Activities:Holding companies and Other companiesANFIA AutomotiveS.c.r.l.
Turin Italy 20,000 EUR 20.00 C.R.F. SocietàConsortile perAzioni
5.000
FCAInformationTechnology,Excellence andMethodsS.p.A.
5.000
FCA ItalyS.p.A.
5.000
MagnetiMarelli S.p.A.
5.000
Auto ComponentisticaMezzogiorno - A.C.M.Melfi SocietàConsortile aresponsabilità limitata
Turin Italy 40,000 EUR 35.25 FCA MelfiS.r.l.
23.500
SistemiSospensioniS.p.A.
11.750
FMA-Consultoria eNegocios Ltda
São Paulo Brazil 1 BRL 50.00 FCA FiatChryslerParticipacoesBrasil Limitada
50.000
Parco Industriale diChivasso SocietàConsortile aresponsabilità limitata
Chivasso Italy 10,000 EUR 25.80 FCAPartecipazioniS.p.A.
25.800
Talent GardenFondazione AgnelliS.r.l.
Turin Italy 40,000 EUR 30.00 FCAPartecipazioniS.p.A.
30.000

271
Independent auditor’s reportTo: the shareholders and audit committee of Fiat Chrysler Automobiles N.V.
Report on the audit of the financial statements 2017 included in the annual reportOur opinion
We have audited the financial statements 2017 of Fiat Chrysler Automobiles N.V. (the Company), incorporated in Amsterdam, the Netherlands. The financial statements include the consolidated financial statements and the company financial statements (collectively referred to as the Financial statements).
In our opinion:
• The accompanying consolidated financial statements give a true and fair view of the financial position of Fiat Chrysler Automobiles N.V. as at December 31, 2017 and of its result and its cash flows for 2017 in accordance with International Financial Reporting Standards as adopted by the European Union (EU-IFRS) and with Part 9 of Book 2 of the Dutch Civil Code
• The accompanying company financial statements give a true and fair view of the financial position of Fiat Chrysler Automobiles N.V. as at December 31, 2017 and of its result for 2017 in accordance with Part 9 of Book 2 of the Dutch Civil Code
The consolidated financial statements comprise:
• The consolidated statement of financial position as at December 31, 2017
• The following statements for 2017: consolidated income statement, the consolidated statements of comprehensive income, cash flows and changes in equity
• The notes comprising a summary of the significant accounting policies and other explanatory information
The company financial statements comprise:
• The company balance sheet as at December 31, 2017
• The company income statement for 2017
• The notes comprising a summary of the accounting policies and other explanatory information
Basis for our opinion
We conducted our audit in accordance with Dutch law, including the Dutch Standards on Auditing. Our responsibilities under those standards are further described in the “Our responsibilities for the audit of the financial statements” section of our report.
We are independent of Fiat Chrysler Automobiles N.V. in accordance with the EU Regulation on specific requirements regarding statutory audit of public-interest entities, the Wet toezicht accountantsorganisaties (Wta, Audit firms supervision act), the Verordening inzake de onafhankelijkheid van accountants bij assurance-opdrachten (ViO, Code of Ethics for Professional Accountants, a regulation with respect to independence) and other relevant independence regulations in the Netherlands. Furthermore we have complied with the Verordening gedrags- en beroepsregels accountants (VGBA, Dutch Code of Ethics).
We believe the audit evidence we have obtained is sufficient and appropriate to provide a basis for our opinion.
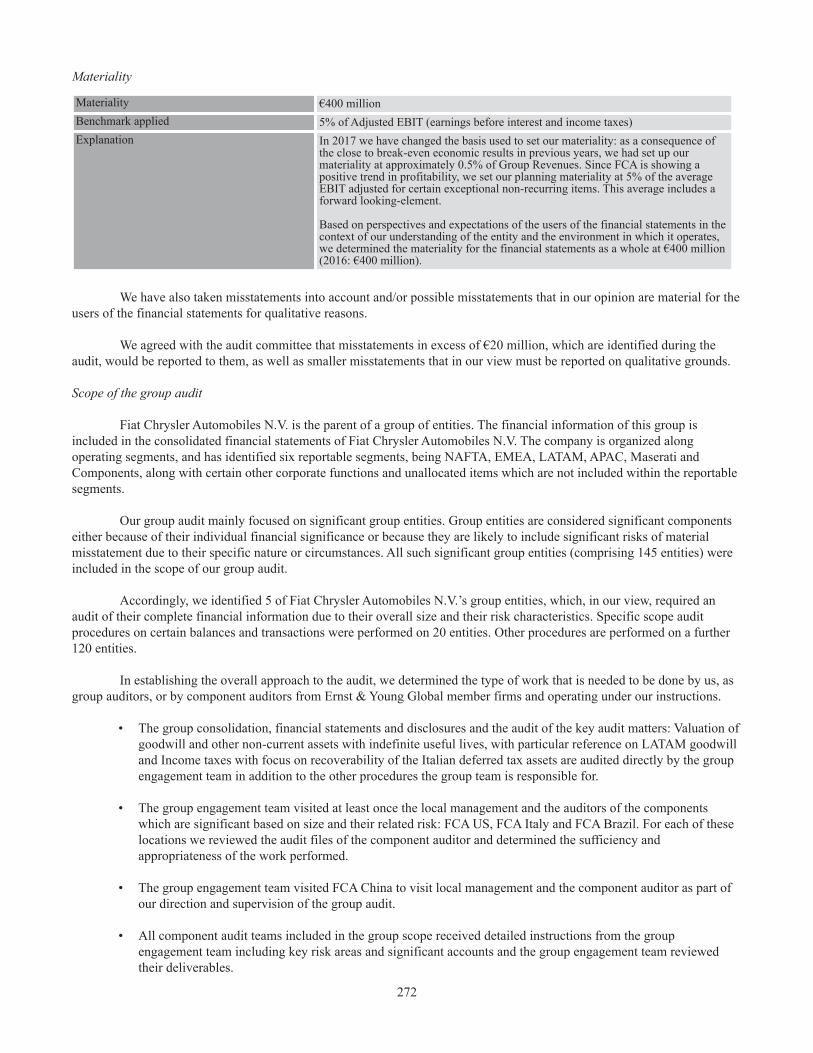
272
Materiality
Materiality €400 millionBenchmark applied 5% of Adjusted EBIT (earnings before interest and income taxes)Explanation In 2017 we have changed the basis used to set our materiality: as a consequence of
the close to break-even economic results in previous years, we had set up our materiality at approximately 0.5% of Group Revenues. Since FCA is showing a positive trend in profitability, we set our planning materiality at 5% of the average EBIT adjusted for certain exceptional non-recurring items. This average includes a forward looking-element.
Based on perspectives and expectations of the users of the financial statements in the context of our understanding of the entity and the environment in which it operates, we determined the materiality for the financial statements as a whole at €400 million (2016: €400 million).
We have also taken misstatements into account and/or possible misstatements that in our opinion are material for the users of the financial statements for qualitative reasons.
We agreed with the audit committee that misstatements in excess of €20 million, which are identified during the audit, would be reported to them, as well as smaller misstatements that in our view must be reported on qualitative grounds.
Scope of the group audit
Fiat Chrysler Automobiles N.V. is the parent of a group of entities. The financial information of this group is included in the consolidated financial statements of Fiat Chrysler Automobiles N.V. The company is organized along operating segments, and has identified six reportable segments, being NAFTA, EMEA, LATAM, APAC, Maserati and Components, along with certain other corporate functions and unallocated items which are not included within the reportable segments.
Our group audit mainly focused on significant group entities. Group entities are considered significant components either because of their individual financial significance or because they are likely to include significant risks of material misstatement due to their specific nature or circumstances. All such significant group entities (comprising 145 entities) were included in the scope of our group audit.
Accordingly, we identified 5 of Fiat Chrysler Automobiles N.V.’s group entities, which, in our view, required an audit of their complete financial information due to their overall size and their risk characteristics. Specific scope audit procedures on certain balances and transactions were performed on 20 entities. Other procedures are performed on a further 120 entities.
In establishing the overall approach to the audit, we determined the type of work that is needed to be done by us, as group auditors, or by component auditors from Ernst & Young Global member firms and operating under our instructions.
• The group consolidation, financial statements and disclosures and the audit of the key audit matters: Valuation of goodwill and other non-current assets with indefinite useful lives, with particular reference on LATAM goodwill and Income taxes with focus on recoverability of the Italian deferred tax assets are audited directly by the group engagement team in addition to the other procedures the group team is responsible for.
• The group engagement team visited at least once the local management and the auditors of the components which are significant based on size and their related risk: FCA US, FCA Italy and FCA Brazil. For each of these locations we reviewed the audit files of the component auditor and determined the sufficiency and appropriateness of the work performed.
• The group engagement team visited FCA China to visit local management and the component auditor as part of our direction and supervision of the group audit.
• All component audit teams included in the group scope received detailed instructions from the group engagement team including key risk areas and significant accounts and the group engagement team reviewed their deliverables.

273
In total these procedures represent 81% of the group’s total assets and 84% of revenues.
Location percentage of coverage:
Full scope Specific scope Other procedures
By performing the procedures mentioned above at group components, together with additional procedures at group level, we have been able to obtain sufficient and appropriate audit evidence about the group’s financial information to provide an opinion about the consolidated financial statements.
Our key audit matters
Key audit matters are those matters that, in our professional judgment, were of most significance in our audit of the financial statements. We have communicated the key audit matters to the audit committee. The key audit matters are not a comprehensive reflection of all matters discussed.
These matters were addressed in the context of our audit of the financial statements as a whole and in forming our opinion thereon, and we do not provide a separate opinion on these matters. The key audit matters in 2017 are consistent with those reported in the prior year.

274
Risk Our audit approachKey observations communicated to theAudit Committee
Valuation of goodwill and other non-current assets with indefinite useful lives, with particular reference on LATAM goodwillAt December 31, 2017 the recorded amount of goodwill and other non-current assets with indefinite useful lives was €10,396 million and €2,994 million respectively. These amounts have primarily been allocated to the Company’s four cash generating units (‘CGU’) that align with the mass market operating segments (NAFTA, APAC, LATAM and EMEA) as set out in note 9.
The Company’s assessment of the recoverable amount of each CGU involves judgement about the future performance of the business and the discount rates applied to future cash flow forecasts.
Considering the level of judgement and complexity of the assumptions applied in estimating the recoverable amount we have determined that this area constitutes a significant risk.
We designed and performed the following audit procedures to be responsive to this risk:
• We obtained an understanding of the impairment assessment processes and evaluated the design and tested the effectiveness of controls in this area relevant to our audit.
• We validated that the CGUs identified continue to be appropriate in the current year and tested the allocation of asset and liabilities to the carrying value of each CGU.
• We evaluated whether the impairment methodology applied by the Company is in line with the requirements per IAS 36, Impairment of Assets
• We obtained an understanding of the work performed by the management specialists used for the valuation.
• We performed procedures to assess the reasonableness of cash flow forecasts including comparisons to industry forecasts and sector data.
In addition, we:
• reconciled the cash flow forecasts for each CGU to the Group’s business plan for the period 2018-2022 and 2018-2026 for LATAM
• evaluated the appropriateness of the use of these forecasts in light of the historical accuracy of the Company’s forecasts
• The discount rates and long term growth rates applied within the model were assessed by EY valuation specialists who independently performed their own calculations and also performed sensitivity analyses of key assumptions for each CGU to determine which changes could materially impact the valuation of recoverable.
Finally, we reviewed the adequacy of the disclosures made by the company in this area, in particular focusing on whether any reasonable possible changes in key assumptions will lead to an impairment of goodwill.
Based on the results of our work, we agreewith the Company’s conclusion that noimpairment of goodwill is required in thecurrent year. With respect to LATAM, giventhe importance of the assumptions inrelation to the continuation of certain taxbenefits, we agree with the continueddisclosure of this assumption in theconsolidated financial statements.

275
Risk Our audit approachKey observations communicated to theAudit Committee
Income taxes - recoverability of the Brazilian and Italian deferred tax assetsAt December 31, 2017, the Company had deferred tax assets on deductible temporary differences of €5,858 million which were recognized and €940 million which were not recognized. At the same date the Company also had deferred tax assets in respect of tax losses carried forward of €978 million which were recognized and €3,740 million which were not recognized. The recognized and unrecognized amounts related to Brazil are €148 million and €1,139 million respectively. The recognized and unrecognized amounts related to Italy are €898 million and €2,358 million respectively. The recognition and recoverability of the deferred tax assets in Brazil and Italy were significant to our audit because the amounts are material and the assessment of the amounts of deferred tax assets to be recognized involves judgements and estimates in relation to future taxable profits and hence the capacity to utilize available tax assets in both these tax jurisdictions. The disclosures in relation to income taxes are included in note 7.
We designed the following audit procedures to be responsive to this risk:
• We obtained an understanding of the income taxes process, and evaluated the design and tested the effectiveness of controls in this area relevant to our audit.
• We evaluated the forecast periods selected in determining the likelihood of the Group generating suitable future profits to support the recognition of the deferred tax assets.
• We have evaluated the company’s assumptions and sensitivities in relation to the likelihood of generating sufficient future taxable income, taking into account local tax regulations.
• We evaluated the historical accuracy of forecasting taxable profits for these tax jurisdictions, the integrity of the forecast models and consistency of the projections with both other forecasts made by the Company and with findings from other areas of our audit.
• We evaluated the appropriateness of the write down in the second quarter of the year of certain Brazilian deferred tax assets previously recognized.
• We considered the appropriateness of the Company’s disclosures in respect of deferred tax.
We involved EY tax specialists to assist both the Group and component audit teams in performing these procedures.
Based on the procedures performed, weconcluded that the deferred tax assetbalances for Brazil and Italy, at December31, 2017, are materially correct.

276
Risk Our audit approachKey observations communicated to theAudit Committee
Provision for NAFTA product warranty and recall campaignsAt December 31, 2017 the provisions for product warranties and recall campaigns amounted to €6,725 million with the most significant amounts related to the NAFTA segment.
The company establishes provisions for product warranty obligations, including the estimated cost of service and recall actions in the NAFTA region, at the time the vehicle is sold.
The estimated future costs of these actions are principally based on assumptions regarding the lifetime warranty costs of each vehicle line and each model year of that vehicle line, as well as historical claims experience for the vehicles. Estimates of the future costs of these actions are inevitably imprecise due to numerous uncertainties, especially related to the NAFTA region’s warranty and campaign provisions, including the enactment of new laws and regulations, the number of vehicles affected by a service or recall action and the nature of the corrective action that may result in adjustments to the established reserves. Costs associated with these actions are recorded in Cost of Sales in the Consolidated Income Statements.
Due to the size and the uncertainty and potential volatility of these estimated future costs and other factors, such as new laws and regulations, changes in assumptions used could materially affect the result of the company’s operations.
The disclosures on warranty provisions are included in note 20.
We designed the following audit procedures to be responsive to this risk:
• We obtained an understanding of the warranty process, evaluated the design of, and performed tests of controls in this area.
• We involved EY actuaries to evaluate the appropriateness of the Company’s methodology, evaluate and test the basis for the assumptions developed and used in the determination of the warranty provisions, and to perform sensitivity analyses to evaluate the judgments made by management.
• EY actuaries determined their own independent range for the provision for the NAFTA product warranty and recall campaigns amount.
• We performed other substantive audit procedures to validate the data applied in the model including warranty payments made in the year and third party confirmations in respect of the completeness and accuracy of current year claims
Finally, we reviewed the adequacy of the disclosures made by the Company in this area.
Based on the results of our procedures,including our assessment that theCompany’s provision was within the rangeof possible outcomes independentlydetermined by EY actuaries, we are satisfiedthat the NAFTA product warranty and recallcampaigns provision is appropriate atDecember 31, 2017.
Report on other information included in the annual report In addition to the financial statements and our auditor’s report thereon, the annual report contains other information that consists of:
• The board report
• Other information pursuant to Part 9 of Book 2 of the Dutch Civil Code
Based on the following procedures performed, we conclude that the other information:
• Is consistent with the financial statements and does not contain material misstatements
• Contains the information as required by Part 9 of Book 2 of the Dutch Civil Code

277
We have read the other information. Based on our knowledge and understanding obtained through our audit of the financial statements or otherwise, we have considered whether the other information contains material misstatements. By performing these procedures, we comply with the requirements of Part 9 of Book 2 of the Dutch Civil Code and the Dutch Standard 720. The scope of the procedures performed is less than the scope of those performed in our audit of the financial statements.
Management is responsible for the preparation of the other information, including the board report in accordance with Part 9 of Book 2 of the Dutch Civil Code and other information pursuant to Part 9 of Book 2 of the Dutch Civil Code.
Report on other legal and regulatory requirementsEngagement
We were initially engaged by the audit committee of Fiat Chrysler Automobiles N.V. on October 28, 2014 to perform the audit of its 2014 financial statements and have continued as its statutory auditor since then.
No prohibited non-audit services
We have not provided prohibited non-audit services as referred to in Article 5(1) of the EU Regulation on specific requirements regarding statutory audit of public-interest entities.
Description of responsibilities for the financial statementsResponsibilities of management and the audit committee for the financial statements
Management is responsible for the preparation and fair presentation of the financial statements in accordance with EU-IFRS and Part 9 of Book 2 of the Dutch Civil Code. Furthermore, management is responsible for such internal control as management determines is necessary to enable the preparation of the financial statements that are free from material misstatement, whether due to fraud or error.
As part of the preparation of the financial statements, management is responsible for assessing the company’s ability to continue as a going concern. Based on the financial reporting frameworks mentioned, management should prepare the financial statements using the going concern basis of accounting unless management either intends to liquidate the company or to cease operations, or has no realistic alternative but to do so. Management should disclose events and circumstances that may cast significant doubt on the company’s ability to continue as a going concern in the financial statements.
The audit committee is responsible for overseeing the company’s financial reporting process.
Our responsibilities for the audit of the financial statements
Our objective is to plan and perform the audit assignment in a manner that allows us to obtain sufficient and appropriate audit evidence for our opinion.
Our audit has been performed with a high, but not absolute, level of assurance, which means we may not have detected all material errors and fraud.
Misstatements can arise from fraud or error and are considered material if, individually or in the aggregate, they could reasonably be expected to influence the economic decisions of users taken on the basis of these financial statements. The materiality affects the nature, timing and extent of our audit procedures and the evaluation of the effect of identified misstatements on our opinion.
We have exercised professional judgment and have maintained professional skepticism throughout the audit, in accordance with Dutch Standards on Auditing, ethical requirements and independence requirements. Our audit included e.g.:

278
• Identifying and assessing the risks of material misstatement of the financial statements, whether due to fraud or error, designing and performing audit procedures responsive to those risks, and obtaining audit evidence that is sufficient and appropriate to provide a basis for our opinion. The risk of not detecting a material misstatement resulting from fraud is higher than for one resulting from error, as fraud may involve collusion, forgery, intentional omissions, misrepresentations, or the override of internal control
• Obtaining an understanding of internal control relevant to the audit in order to design audit procedures that are appropriate in the circumstances, but not for the purpose of expressing an opinion on the effectiveness of the company’s internal control
• Evaluating the appropriateness of accounting policies used and the reasonableness of accounting estimates and related disclosures made by management
• Concluding on the appropriateness of management’s use of the going concern basis of accounting, and based on the audit evidence obtained, whether a material uncertainty exists related to events or conditions that may cast significant doubt on the company’s ability to continue as a going concern. If we conclude that a material uncertainty exists, we are required to draw attention in our auditor’s report to the related disclosures in the financial statements or, if such disclosures are inadequate, to modify our opinion. Our conclusions are based on the audit evidence obtained up to the date of our auditor’s report. However, future events or conditions may cause a company to cease to continue as a going concern
• Evaluating the overall presentation, structure and content of the financial statements, including the disclosures
• Evaluating whether the financial statements represent the underlying transactions and events in a manner that achieves fair presentation
Because we are ultimately responsible for the opinion, we are also responsible for directing, supervising and performing the group audit. In this respect we have determined the nature and extent of the audit procedures to be carried out for group entities. Decisive were the size and/or the risk profile of the group entities or operations. On this basis, we selected group entities for which an audit or review had to be carried out on the complete set of financial information or specific items.
We communicate with the audit committee regarding, among other matters, the planned scope and timing of the audit and significant audit findings, including any significant findings in internal control that we identify during our audit. In this respect we also submit an additional report to the audit committee in accordance with Article 11 of the EU Regulation on specific requirements regarding statutory audit of public-interest entities. The information included in this additional report is consistent with our audit opinion in this auditor’s report.
We provide the audit committee with a statement that we have complied with relevant ethical requirements regarding independence, and to communicate with them all relationships and other matters that may reasonably be thought to bear on our independence, and where applicable, related safeguards.
From the matters communicated with the audit committee, we determine those matters that were of most significance in the audit of the financial statements of the current period and are therefore the key audit matters. We describe these matters in our auditor’s report unless law or regulation precludes public disclosure about the matter or when, in extremely rare circumstances, not communicating the matter is in the public interest.
Rotterdam, February 20, 2018
Ernst & Young Accountants LLP
/s/ P.W.J. Laan