Embed Size (px)
Citation preview

Overview of OCT Angiography
Michael H. Chen, OD
Patty J. Sha, OD
________________________________________________________________________________________________
INTRODUCTION
Optical coherence tomography (OCT) has revolutionized eye care by providing a fast, noninvasive method to
visualize ocular structures in vivo since its development in 1991. It has since become one of the most
important ophthalmic diagnostic tools, with an expanding number of applications that aid eye care providers
in diagnosing and monitoring eye disease.
Recently, there has been great excitement in the development of a new OCT imaging technique called OCT
angiography (OCTA). OCTA isolates microvascular circulation from OCT image data by specialized acquisition
and processing techniques. This allows for visualization of blood flow in the retina without the need for
intravenous injection of a contrast dye. Until now, clinical visualization of retinal vasculature has been limited
to indocyanine green angiography (ICGA) and fluorescein angiography (FA), both of which require contrast dye
injections. Despite their great clinical utility, these procedures are not without drawbacks. They are invasive,
time consuming, and require a skilled photographer. The injected dye can sometimes cause adverse reactions
Author’s Bio
Dr. Chen graduated from UC Berkeley School of Optometry. He currently resides
in the San Francisco Bay Area, and works in a private practice in Santa Clara, CA. He also serves as a clinical research consultant to Carl Zeiss Meditec for advanced
product and prototype development, and has worked extensively in the area of OCT angiography.
Dr. Chen is a member of the American Optometric Association, the California
Optometric Association, and American Academy of Optometry. He is also an active member of his local optometric society. In his free time, he enjoys
spending time with friends and family, watching movies, and recording music.
Author’s Bio
Patricia Sha, OD earned her Bachelor of Science in Biochemistry and Cell Biology from the University of California, San Diego. Dr. Sha earned her Doctor of Optometry degree from the University of California, Berkeley, School of Optometry, where she was a part of the Beta Sigma Kappa Optometric Honor Society.
After graduation Dr. Sha became an Optometric Consultant at Carl Zeiss Meditec, Inc. As a consultant, Dr. Sha works as a research coordinator on new medical devices relied
upon by the optometric community. Dr. Sha also practices private eye care in the Bay Area, CA. Dr. Sha maintains an active role in the optometry community and is a part of
the American Academy of Optometry, American Optometric Association, California Optometric Association, and the Santa Clara County Optometric Society, where she acts
as the Legislative Events Liaison. Dr. Sha has a continued commitment to furthering the field of optometry in both her research and in private practice.
including nausea, vomiting, and in rare occasions, anaphylaxis possibly leading to death1. Additionally,
indocyanine green dye is contraindicated in pregnant patients, or patients with kidney disease2. With the
introduction of OCTA, clinicians now have a fast, noninvasive method to visualize retinal microvascular
perfusion.
TECHNOLOGY
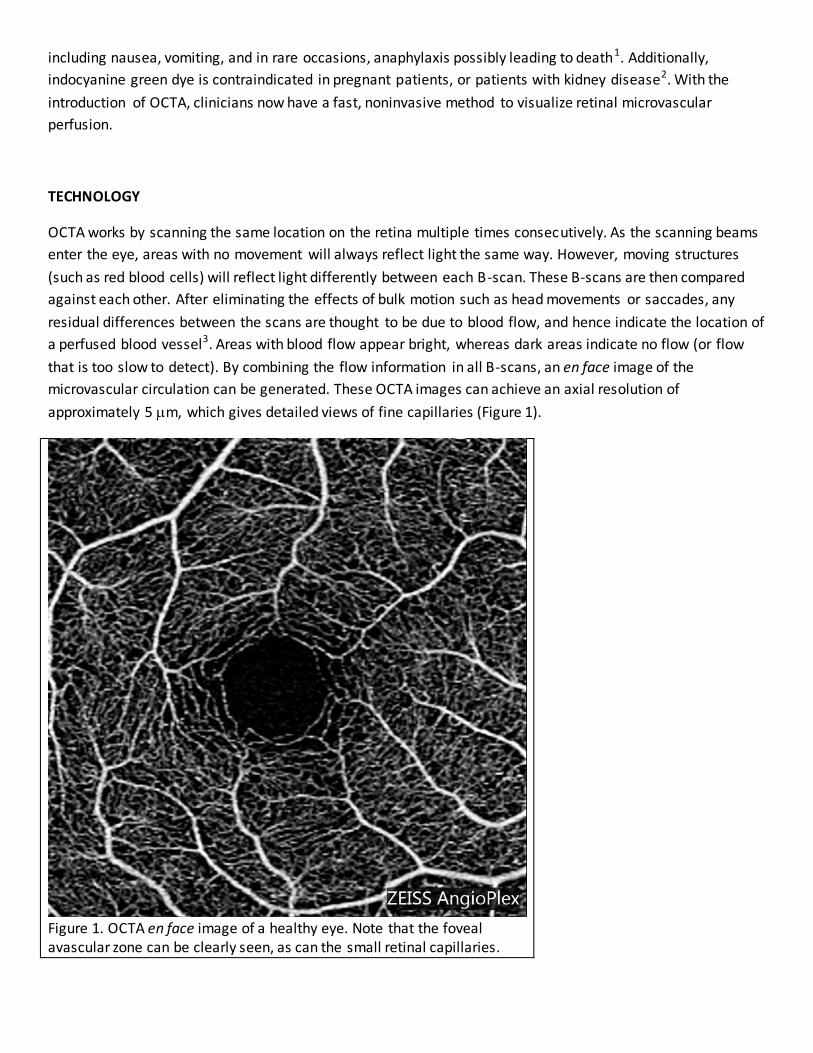
OCTA works by scanning the same location on the retina multiple times consecutively. As the scanning beams
enter the eye, areas with no movement will always reflect light the same way. However, moving structures
(such as red blood cells) will reflect light differently between each B-scan. These B-scans are then compared
against each other. After eliminating the effects of bulk motion such as head movements or saccades, any
residual differences between the scans are thought to be due to blood flow, and hence indicate the location of
a perfused blood vessel3. Areas with blood flow appear bright, whereas dark areas indicate no flow (or flow
that is too slow to detect). By combining the flow information in all B-scans, an en face image of the
microvascular circulation can be generated. These OCTA images can achieve an axial resolution of
approximately 5 m, which gives detailed views of fine capillaries (Figure 1).
Figure 1. OCTA en face image of a healthy eye. Note that the foveal avascular zone can be clearly seen, as can the small retinal capillaries.

Currently, there are several different OCTA processing methods being used by different companies. These
include phase-based techniques (Doppler shift or variance), magnitude-based techniques (speckle variance or
decorrelation), or a combination of both4-6. Each method utilizes a different part of the OCT signal to obtain
flow information, but the goal of visualizing vasculature is the same, and the resulting images are similar. At
the time of this article, Carl Zeiss Meditec and Optovue have received FDA clearance for their OCTA devices.
Other companies are also actively developing their OCTA systems, and some have released products outside
the US.
CLINICAL APPLICATIONS
One of the greatest advantages of OCTA is its ability to provide 3-dimensional, depth-encoded information.
Because it is an OCT-based scan, the data obtained consists of multiple B-scans which are combined into a
cube. By segmenting the cube into different layers or slabs, OCTA is able to isolate blood flow information at a
specific retinal depth. Figure 2 shows OCTA en face images of a healthy retina at various depths. The
superficial capillary plexus (SCP) can clearly be seen to have a different vessel pattern than the deep capillary
plexus (DCP) and choriocapillaris, consistent with histological studies 7,8. This is the first imaging modality that
allows noninvasive, in vivo visualization of individual capillary networks in the retina. In comparison, FA images
are 2-dimensional, which means signals from all layers in the eye are projected in the same plane, thereby
losing depth information.
Figure 2. A) Superficial capillary plexus. B) Deep capillary plexus. C) Choriocapillaris.
This unique capability of OCTA gives rise to new opportunities for studying the retina and understanding the
pathophysiology of diseases. For instance, paracentral acute middle maculopathy (PAMM) is a condition
characterized by intermediate and deep capillary plexus infarction, and has been hypothesized to affect

patients with various retinal vascular diseases such as retinal vein occlusion and sickle cell disease 9. A few
papers have recently demonstrated with OCTA that the SCP and DCP are affected asymmetrically in PAMM,
with more ischemia observed in the DCP (Figure 3), providing angiographic evidence of this condition10,11.
Segmenting OCTA data also aids in highlighting vasculature in a specific area of interest. For example,
neovascularization can develop in the setting of various diseases, and generally occurs at specific retinal
depths depending on the disease. In wet age-related macular degeneration, OCTA segmentation can help
isolate the choroidal neovascular membrane (CNVM) at the level of the RPE (Figure 4). In diseases such as
retinal vein occlusions and proliferative diabetic retinopathy, neovascularization typically occurs in the
preretinal space. By segmenting above the inner limiting membrane, OCTA allows visualization of the
abnormal blood vessels independently from normal retinal vessels. Figure 5 shows FA and OCTA imaging of a
branch retinal vein occlusion (BRVO) with neovascularization elsewhere (NVE). OCTA shows good agreement
with FA in visualizing areas of ischemia. In addition, OCTA is able to isolate the NVE lesion by segmenting the
preretinal space (Figure 5D), and the fine vessel details are not affected by dye leakage as in the FA image
(Figure 5B). Isolating the lesion of interest enables clinicians to view only the information pertinent to the
disease, potentially allowing a more detailed assessment of microvascular pathologies. It may also allow for
easier comparison between visits to monitor for change.
Figure 3. OCTA of a patient with sickle cell maculopathy. Note that while the SCP is relatively preserved (A),
the DCP shows areas of ischemia temporal to the fovea (B).

Figure 4. A) FA image of a large, mature fibrovascular scar from type 1 CNV. Because of the extensive scarring
of the macula, there is hypofluorescence centrally. B) OCTA image overlaid on FA. In this case, OCTA is able to image the CNV lesion in greater detail than FA, with the mature trunks of the CNV lesion clearly visible. C) The
sub-RPE space was segmented to isolate the CNV lesion.

Figure 5. A) Early-phase FA of a BRVO. B) Mid-phase FA. C) OCTA en face image of the retina, with corresponding B-scan. D) OCTA en face image segmenting the preretinal space, with corresponding B-scan.
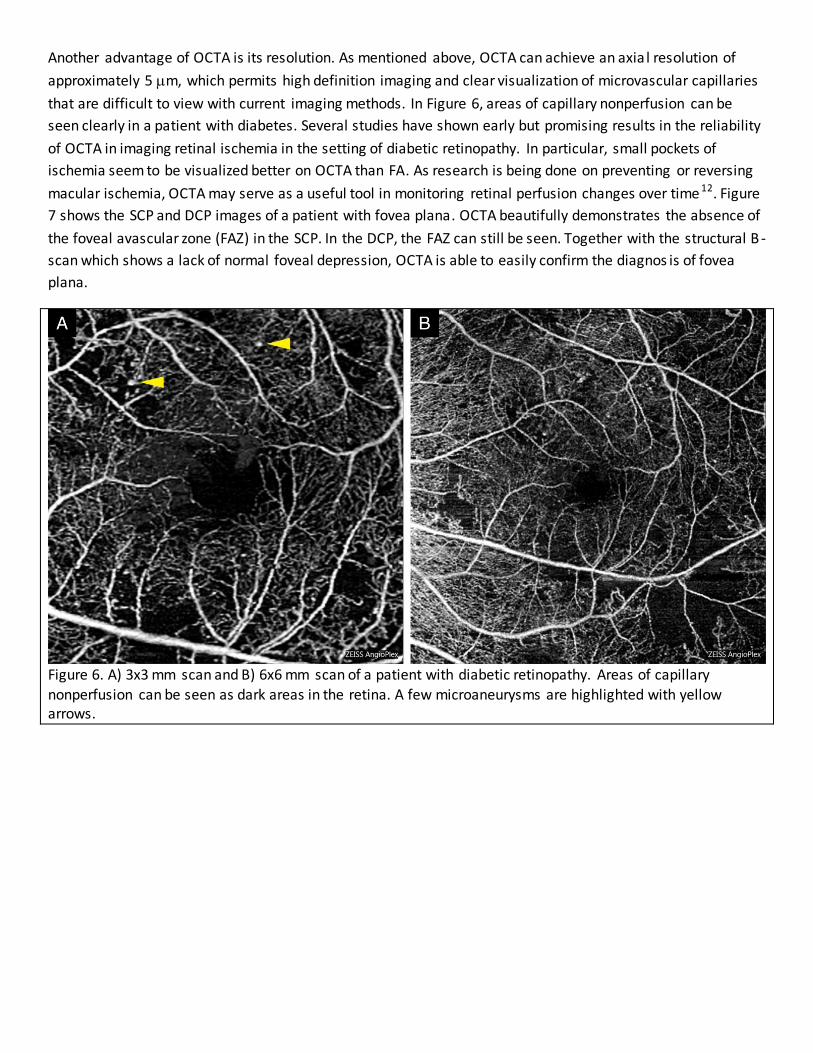
Another advantage of OCTA is its resolution. As mentioned above, OCTA can achieve an axia l resolution of
approximately 5 m, which permits high definition imaging and clear visualization of microvascular capillaries
that are difficult to view with current imaging methods. In Figure 6, areas of capillary nonperfusion can be
seen clearly in a patient with diabetes. Several studies have shown early but promising results in the reliability
of OCTA in imaging retinal ischemia in the setting of diabetic retinopathy. In particular, small pockets of
ischemia seem to be visualized better on OCTA than FA. As research is being done on preventing or reversing
macular ischemia, OCTA may serve as a useful tool in monitoring retinal perfusion changes over time 12. Figure
7 shows the SCP and DCP images of a patient with fovea plana. OCTA beautifully demonstrates the absence of
the foveal avascular zone (FAZ) in the SCP. In the DCP, the FAZ can still be seen. Together with the structural B -
scan which shows a lack of normal foveal depression, OCTA is able to easily confirm the diagnos is of fovea
plana.
Figure 6. A) 3x3 mm scan and B) 6x6 mm scan of a patient with diabetic retinopathy. Areas of capillary
nonperfusion can be seen as dark areas in the retina. A few microaneurysms are highlighted with yellow arrows.
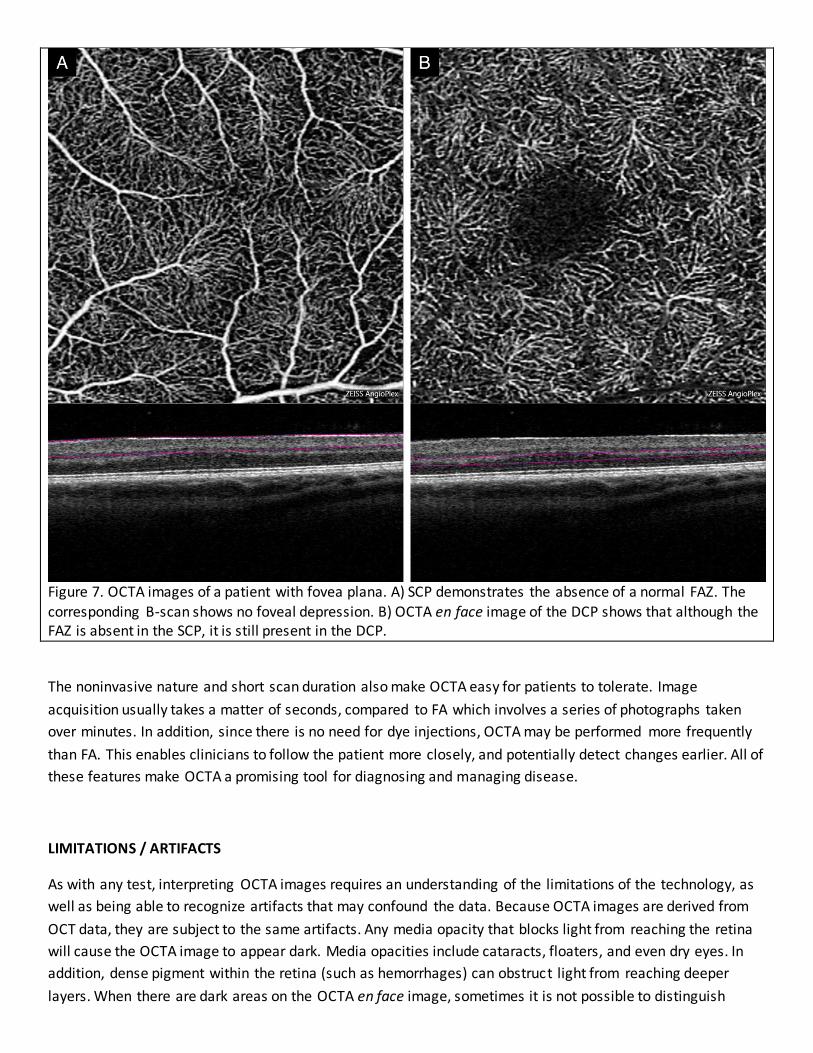
Figure 7. OCTA images of a patient with fovea plana. A) SCP demonstrates the absence of a normal FAZ. The corresponding B-scan shows no foveal depression. B) OCTA en face image of the DCP shows that although the FAZ is absent in the SCP, it is still present in the DCP.
The noninvasive nature and short scan duration also make OCTA easy for patients to tolerate. Image
acquisition usually takes a matter of seconds, compared to FA which involves a series of photographs taken
over minutes. In addition, since there is no need for dye injections, OCTA may be performed more frequently
than FA. This enables clinicians to follow the patient more closely, and potentially detect changes earlier. All of
these features make OCTA a promising tool for diagnosing and managing disease.
LIMITATIONS / ARTIFACTS
As with any test, interpreting OCTA images requires an understanding of the limitations of the technology, as
well as being able to recognize artifacts that may confound the data. Because OCTA images are derived from
OCT data, they are subject to the same artifacts. Any media opacity that blocks light from reaching the retina
will cause the OCTA image to appear dark. Media opacities include cataracts, floaters, and even dry eyes. In
addition, dense pigment within the retina (such as hemorrhages) can obstruct light from reaching deeper
layers. When there are dark areas on the OCTA en face image, sometimes it is not possible to distinguish

between media opacities and true capillary nonperfusion based on the OCTA image alone. In these cases, it is
important to reference the structural B-scans and structural en face image. Media opacities can be seen on
the B-scan as a dark shadow, whereas capillary nonperfusion will not affect the brightness of the B-scan. In
Figure 8A, there is a dark area nasal to the fovea on the OCTA en face image, which corresponds to a dark area
on the structural en face image, as well as the B-scan in the corresponding location (Figures 8B, 8C). This
confirms that the dark area on the angiogram is the result of a floater, not capillary nonperfusion.
Projection artifacts are the result of fluctuating shadows cast by blood flow in a more superficial layer of the
retina onto deeper layers. These artifacts are detected as flow signals, and will have the same vessel pattern
as the inner layer. Projection artifacts typically occur in reflective retinal layers, which appear bright on the
structural B-scan, most strongly in the RPE13. When evaluating deeper retinal layers for abnormal vasculature,
it is important to rule out projection artifacts to avoid false positives. Currently, OCTA software have post-
processing methods to reduce or eliminate these artifacts. In Figure 9, the SCP and DCP of a healthy eye are
shown (Figures 9A, 9B). The DCP slab shows some projection artifacts from the SCP, which appear as vessels
that replicate the pattern of the SCP. The same slab with projection artifacts removed is shown in Figure 9C.
Figure 10 shows a subretinal, type 2 CNV. Because the CNV lesion is close to the level of the RPE, projection
artifacts from both the SCP and DCP can be seen (Figure 10A). After removing the artifacts, the CNV lesion is
clearly isolated.
Figure 8. A) OCTA en face image with a dark area caused by a floater (yellow dashed circle). B) The structural en face image shows the same artifact in the same location. C) B-scan through the area shows are dark shadow through all layers of the retina, suggesting that this is a vitreal floater.
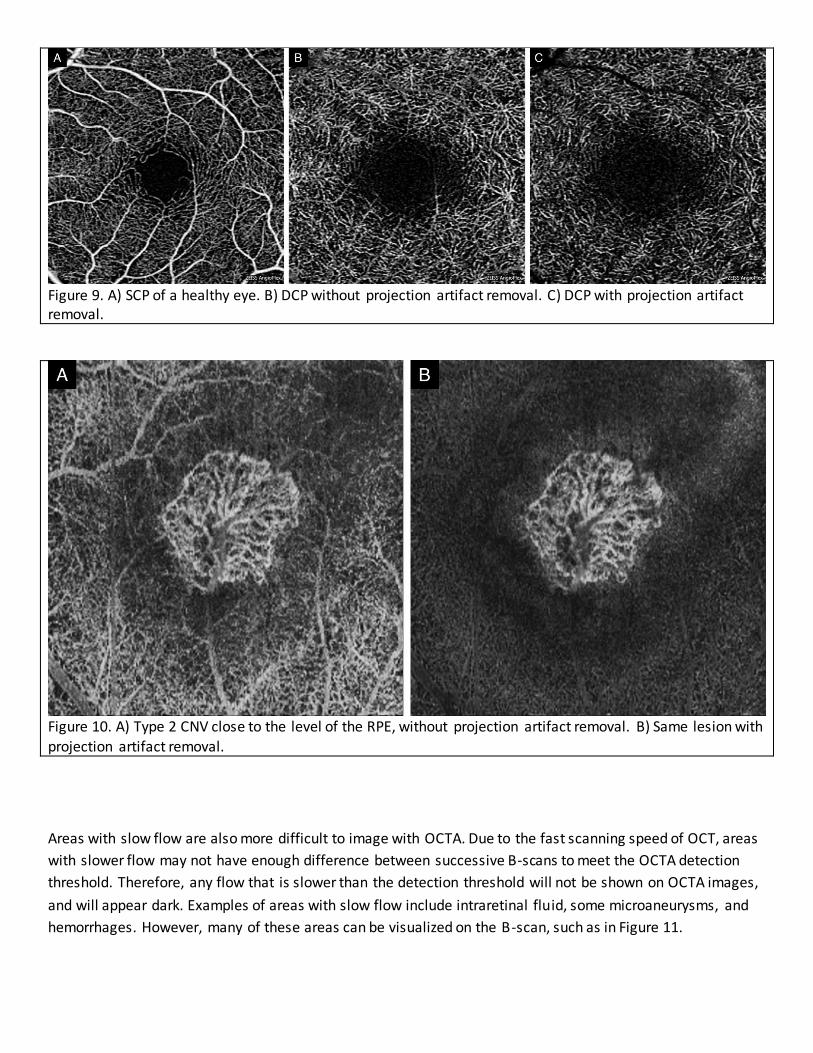
Figure 9. A) SCP of a healthy eye. B) DCP without projection artifact removal. C) DCP with projection artifact removal.
Figure 10. A) Type 2 CNV close to the level of the RPE, without projection artifact removal. B) Same lesion with
projection artifact removal.
Areas with slow flow are also more difficult to image with OCTA. Due to the fast scanning speed of OCT, areas
with slower flow may not have enough difference between successive B-scans to meet the OCTA detection
threshold. Therefore, any flow that is slower than the detection threshold will not be shown on OCTA images,
and will appear dark. Examples of areas with slow flow include intraretinal fluid, some microaneurysms, and
hemorrhages. However, many of these areas can be visualized on the B-scan, such as in Figure 11.

Finally, segmentation errors can be a source of artifacts. The appearance of the OCTA en face image is dictated
by its corresponding slab, whose upper and lower boundaries are defined by segmentation lines. Therefore,
any errors in segmentation will cause the en face angiogram to be displayed incorrectly. Figure 12 is an
example of a patient with multifocal choroiditis. In Figure 12A, there appears to be an area within the
Figure 11. A) OCTA en face image of the retina of a patient with diabetic macular edema. Retinal ischemia around the FAZ can be seen, but
intraretinal fluid and leakage are not visible. B) B-scan shows intraretinal fluid at the macula.

inflammatory lesion that looks suspicious for choroidal neovascularization. However, a closer look at the B -
scan reveals an error in segmentation in that same area. After the segmentation is corrected, the bright a rea
on the angiogram is no longer present (Figure 12B). Checking segmentation is important when evaluating
OCTA images, and gives the clinician more confidence in the angiogram’s findings.
Figure 12. A) Choriocapillaris with segmentation error. B) Choriocapillaris without segmentation error.
OCTA vs. FA
Because they both have the word “angiography” as part of their names, it is natural for clinicians to draw
comparisons between the two imaging modalities, and even explore the possibility of replacing FA with OCTA.
It is important to note that while both OCTA and FA aim to image blood flow, they are different technologies,
and will therefore image vascular features differently. Although OCTA generally shows good agreement with
FA, it does not, at least presently, serve as a replacement for FA.
As mentioned above, OCTA is not able to image leakage. In addition, staining, pooling, and vessel filling time
are also not features of OCTA. However, this also means that vasculature below an area of fluid, which would
otherwise be obscured by dye leakage with FA, can be seen on OCTA4. Since they each have their strengths
and weaknesses, determining which test is indicated for the patient should be based on clinical need. Most
likely, OCTA will serve as a complementary test to FA, giving clinicians additional information for assessing
retinal vasculature.
CONCLUSION
Although OCTA is a technology that is still in its infancy, it has already shown to have great potential for the
future. The ability to provide depth-encoded information at very high resolution makes it a valuable tool for
both clinicians and researchers. Its noninvasive nature also makes it readily accessible to optometrists to
utilize.
Future developments in OCTA technology will further optimize its clinical utility. Automatic quantification of
vessel density may be useful in monitoring diseases such as diabetes and glaucoma14,15; wider fields of view
and improved resolution will allow clinicians to utilize OCTA in more situations; there is also much research
currently ongoing to explore the potential new applications of this imaging method. OCTA i s a promising new
technology which is generating great interest, and is likely to become more popular in clinical practice over the
next few years.
REFERENCES
1. Bennett, Timothy J., et al. "Fundamentals of fluorescein angiography." Curr Concepts Ophthalmology 9.3 (2001): 43-49.
2. de Carlo, Talisa E., et al. "A review of optical coherence tomography angiography (OCTA)." International Journal of Retina and Vitreous 1.1 (2015): 1.
3. Choi, WooJhon, et al. "Choriocapillaris and choroidal microvasculature imaging with ultrahigh speed OCT angiography." PloS one 8.12 (2013): e81499.
4. Puliafito Carmen, et al. OCT Angiography: The Next ‘Big Thing’ in Retinal Imaging . Vindico Medical Education. 2015 April.
5. Zhang, Anqi, et al. "Methods and algorithms for optical coherence tomography-based angiography: a review and comparison." Journal of Biomedical Optics 20.10 (2015): 100901-100901.
6. Kogachi, K, and A. Kashani. "Optical Coherence Tomography Angiography: A Primer on This Promising New Technology for Evaluating Retinal Vasculature." New Retina MD 2 (2015): 6-8.
7. Henkind, P. "Radial peripapillary capillaries of the retina. I. Anatomy: human and comparative." The British Journal of Ophthalmology 51.2 (1967): 115.
8. Matsunaga, Douglas, et al. "OCT angiography in healthy human subjects." Ophthalmic Surgery, Lasers
and Imaging Retina 45.6 (2014): 510-515. 9. Minvielle, Wilfried, et al. "Macular microangiopathy in sickle cell disease using optical coherence
tomography angiography." American Journal of Ophthalmology (2015). 10. Ilginis, Tomas, Pearse A. Keane, and Adnan Tufail. "Paracentral acute middle maculopathy in sickle cell
disease." JAMA Ophthalmology 133.5 (2015): 614-616. 11. Nemiroff, Julia, et al. "Assessing Deep Retinal Capillary Ischemia in Paracentral Acute Middle
Maculopathy by Optical Coherence Tomography Angiography." American Journal of Ophthalmology 162 (2016): 121-132.

12. Bradley, Patrick D., et al. "The Evaluation of Diabetic Macular Ischemia Using Optical Coherence Tomography AngiographyOCTA in Diabetic Retinopathy." Investigative Ophthalmology & Visual Science 57.2 (2016): 626-631.
13. Spaide, Richard F., James G. Fujimoto, and Nadia K. Waheed. "Image artifacts in optical coherence tomography angiography." Retina 35.11 (2015): 2163-2180.
14. Jia, Yali, et al. "Quantitative OCT angiography of optic nerve head blood flow." Biomedical Optics Express 3.12 (2012): 3127-3137.
15. Hwang, Thomas S., et al. "Automated Quantification of Capillary Nonperfusion Using Optical Coherence Tomography Angiography in Diabetic Retinopathy." JAMA Ophthalmology (2016): 1-7.
Image permissions: Images are courtesy of East Bay Retina Consultants, Inc. and Carl Zeiss Meditec, Inc. and
have been permitted to be used in this article.

CE@Home Online June Name__________________ Lisence_____________________
1. The following are methods to generate OCTA
images except:
A. Speckle variance
B. Doppler Shift
C. Autofluorescence
D. Decorrelation
2. What is the approximate axial resolution of OCTA?
A. 0.5 m
B. 5 m
C. 50 m
D. 500 m
3. OCT angiography is able to image all of the
following clinical features except:
A. Choroidal neovascular membranes (CNVM)
B. Retinal capillary nonperfusion
C. Neovascularization elsewhere (NVE)
D. Intraretinal fluid
4. Projection artifacts in a given layer of the retina…
A. … result from fluctuating shadows cast by
vessels in a more superficial layer.
B. … result from fluctuating shadows cast by
vessels in a deeper layer.
C. … originate from the highly-reflective RPE.
5. With the introduction of OCTA, FA is no longer
needed because all features on FA can be clearly
visualized with OCTA.
A. True
B. False
6. Why are microaneurysms not imaged well on
OCTA?
A. There is no blood flow within
microaneurysms because they are not
blood vessels.
B. Microaneurysms occur too deep in the
retina for the OCT scanning light to reach.
C. The flow speed within some
microaneurysms is slower than the
detection threshold of OCTA.
D. Dense pigment within microaneurysms
usually cast shadows in the retina, which
block l ight signals and result in a dark area
on the OCTA image.
7. Artifacts on OCTA images can originate
from all of the following EXCEPT:
A. Floaters
B. Contact lens wear
C. Dry eye
D. Segmentation errors
8. What is a possible reason a CNV lesion is
not visualized on OCTA?
A. Blood flow within the CNV is too
fast for OCTA to image.
B. Leakage from the CNV obscures the
vessel details, preventing OCTA
from adequately imaging the
lesion.
C. The blood vessel walls of CNV
lesions are too thick, preventing
the OCT scanning light to pass
through, thereby blocking flow
signal.
D. The segmentation lines are
incorrectly defined, and pass
through an area that does not
contain the CNV.
9. Which slab on the OCTA is best suited for
visualization of diabetic neovascularization?
A. Above the ILM
B. ILM to OPL
C. OPL to RPE
D. RPE to choroid
10. Which of the following clinical features
can be visualized on both FA and OCTA?
A. Neovascularization of the disc
(NVD)
B. Subretinal fluid in central serous
chorioretinopathy
C. Diabetic macular edema
D. Isolated ischemia of the DCP in sickle cell maculopathy

Please fill out this form completely. Mail or fax (along with payment) to:
Mail:
COA – Education Coordinator
2415 K Street
Sacramento, CA 95816
Fax: 916-448-1423
RECEIVING YOUR TRANSCRIPT
Name: ___________________________________
License Number: ___________________________
Phone Number: ____________________________
□ Please check here if you would like to receive your transcript via MAIL.
Mailing Address:
_________________________________________
_________________________________________
_________________________________________
□ Please check here if you would like to receive your transcript via E-MAIL.
E-mail Address
_________________________________________
PAYMENT INFORMATION
□ COA Member - $15
□ Non-Member - $35
□ Check or Money Order enclosed (payable to the California Optometric Association)
□ Credit Card: □ VISA □ MC □ AMEX
Card Number: _____________________________________ Expiration Date: ______________
CCV#: ___________ (VISA & MC – 3 digit # on back; AMEX – 4 digit # on front)

Name on Card: ____________________________________
Authorized Signature: ______________________________ _
FOR OFFICE USE ONLY
Date Received Invoice Batch ID Number