Embed Size (px)
Citation preview

1
Making buildings better 1 1
Overview of Life Cycle Cost
& Carbon Techniques
28 November 2014
Peter Tse
BSRIA Principal Design Consultant
Making buildings better 2
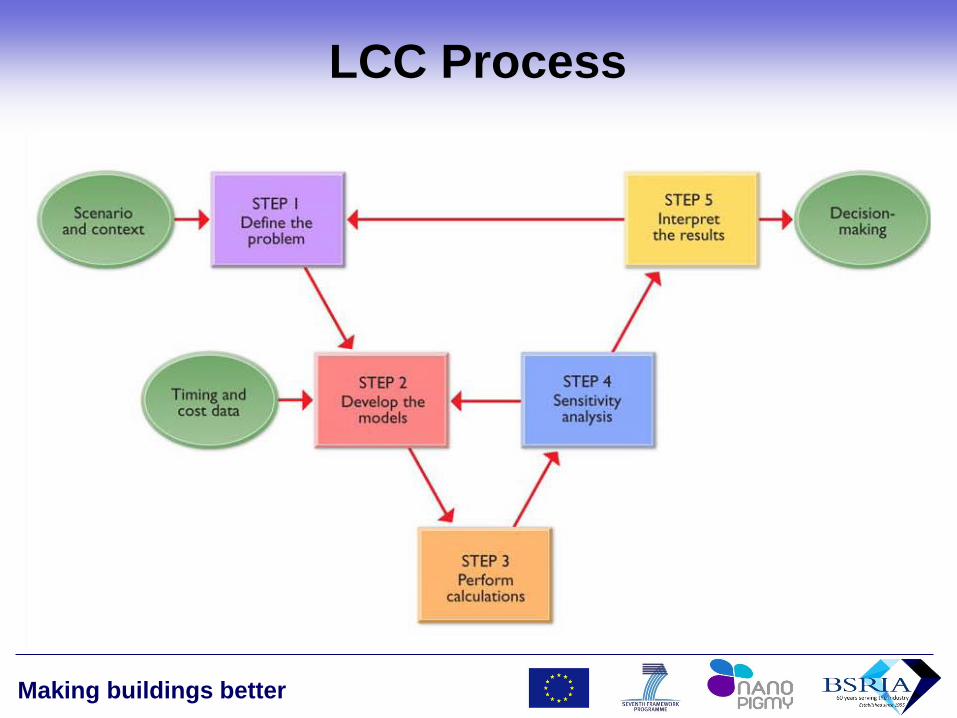
LCC Process
Making buildings better 3
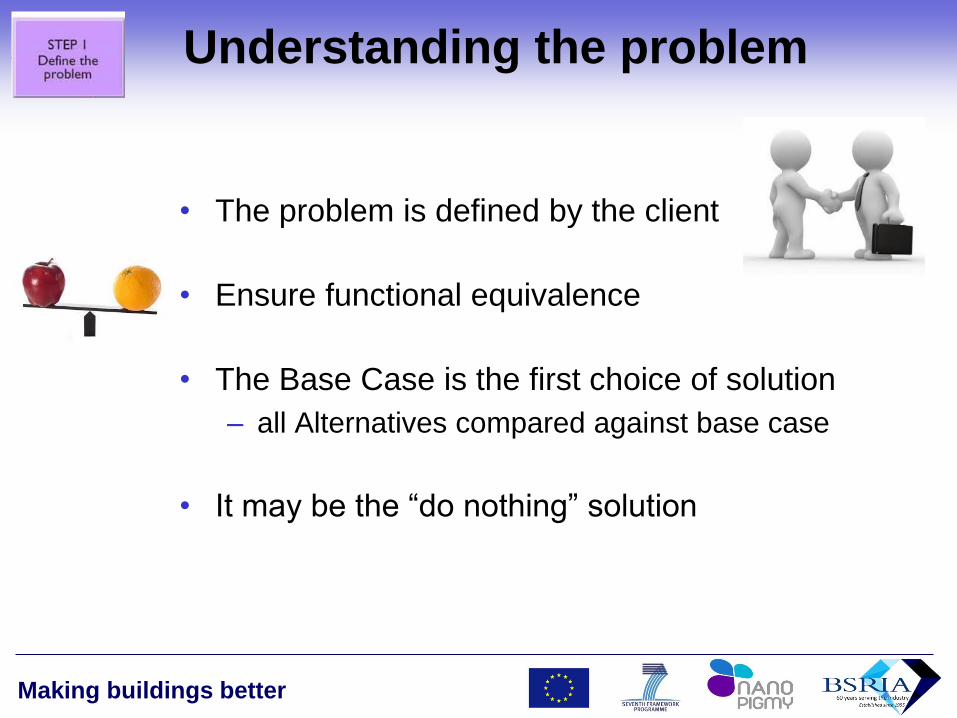
Understanding the problem
• The problem is defined by the client
• Ensure functional equivalence
• The Base Case is the first choice of solution
– all Alternatives compared against base case
• It may be the “do nothing” solution

Making buildings better 4
Cost & Time Data
Sources
025
5075
100
125150
0 5 10 15 20 25 30 Year
£k Boiler A
Boiler B
Cost data Timing data
Initial installation &
replacement
Spons, Rules of Thumb, BCIS,
Contractor estimates
Published - CIBSE/HAPM/BLP,
refined with ISO factors, Estate
records
Energy Consumption calcs + DECC
statistics, Suppliers
Recurring
Maintenance &
management
BMI database, Maintenance
contracts, Estate records
Recurring

Making buildings better 5
Net Present Value
025
5075
100
125150
0 5 10 15 20 25 30 Year
£k Boiler A
Boiler B
• Discount Rate – Value associated with time
• Varies depending on organisation

Making buildings better 6
50.0
75.0
100.0
125.0
150.0
175.0
200.0
1990
1992
1994
1996
1998
2000
2002
2004
2006
2008
2010
2012
Pri
ce in
dex
(re
al, 2
005=
100)
Time
Fuel price index numbers relative to the GDP deflator
Coal andsmokelessfuels
Gas
Electricity
Heating oils
Energy cost is one of the biggest uncertainties in
LCC
‘Quarterly energy prices’ - DECC publication giving energy prices to domestic and industrial consumers
http://www.decc.gov.uk/assets/decc/statistics/source/prices/qep213.xls

Making buildings better 7
Discount Rate Sensitivity
£2,000
£4,000
£6,000
£8,000
£10,000
£12,000
£14,000
£16,000
£20,000
0 5 10 15 20 25 30
Year
3.50%
5.00%
7.00%
10.00%
£18,000
Effect of different discount rates & timings on a £20,000 cost
Making buildings better 8
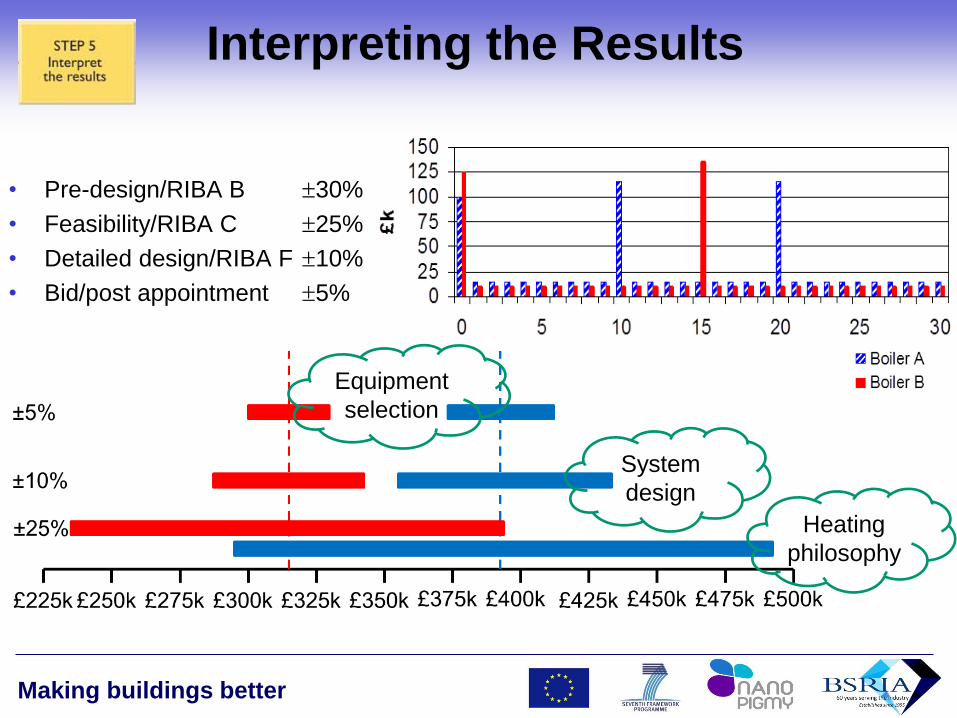
Interpreting the Results
• Pre-design/RIBA B 30%
• Feasibility/RIBA C 25%
• Detailed design/RIBA F 10%
• Bid/post appointment 5%
Heating
philosophy
System
design
Equipment
selection

Making buildings better 9
OPERATIONAL CO2
+
EMBODIED CO2
Carbon Footprint
Making buildings better 10
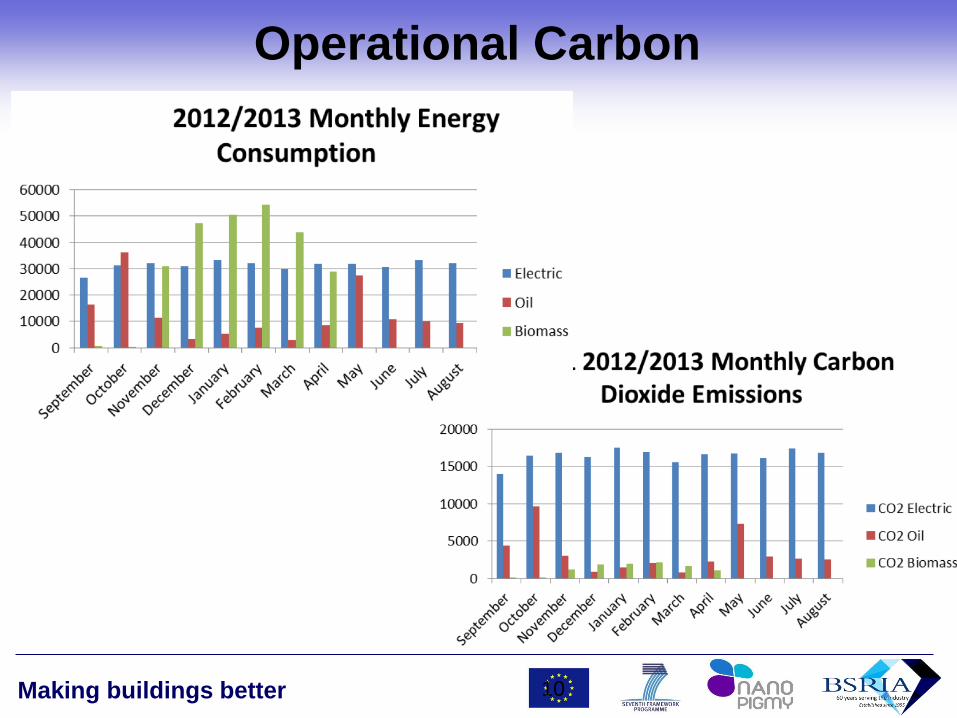
Operational Carbon
10
Making buildings better 11
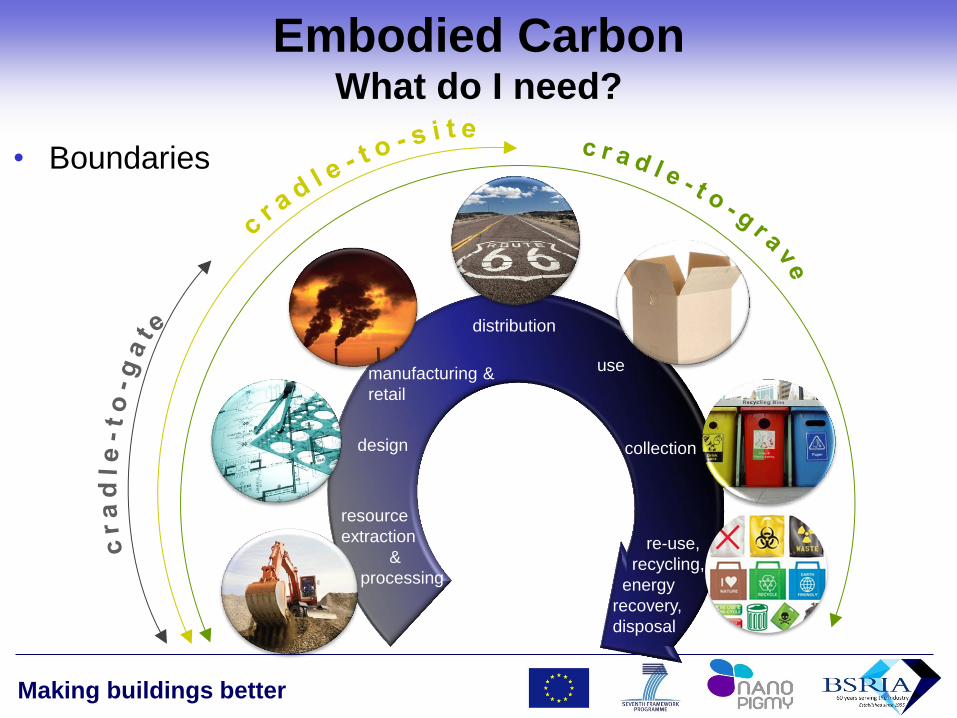
resource
extraction
&
processing
design
manufacturing &
retail
distribution
collection
re-use,
recycling,
energy
recovery,
disposal
use
Embodied Carbon What do I need?
• Boundaries
Making buildings better 12
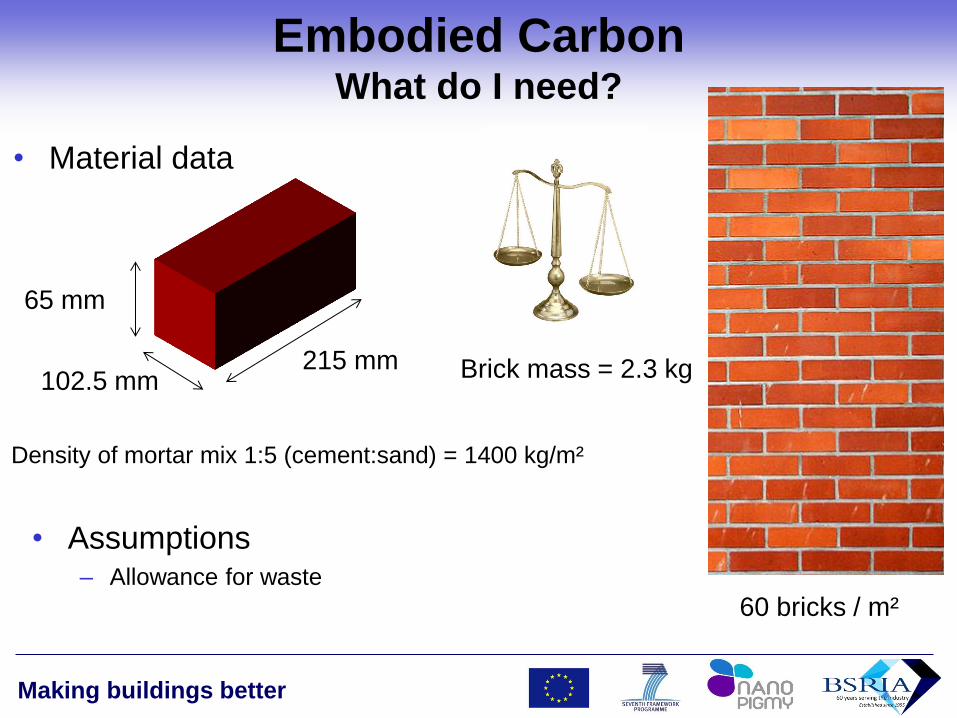
Embodied Carbon What do I need?
• Material data
215 mm 102.5 mm
65 mm
Brick mass = 2.3 kg
60 bricks / m²
Density of mortar mix 1:5 (cement:sand) = 1400 kg/m²
• Assumptions – Allowance for waste

Making buildings better 13
Embodied Carbon What do I need?
• Select Embodied Data
Bricks:
EC = 0.55 kgCO2e per brick
Mortar:
EC = 0.156 kgCO2e/kg
Transport:
EC = 0.15 kgCO2e/tkm

Making buildings better 14
Make a Decision
15
Making buildings better 15 15
Thank you for listening
Peter Tse
Tel: +44 (0) 1344 465651| Mob: +44 (0) 7957 473856
www.bsria.co.uk